Embed Size (px)
Citation preview
1
Q1 FY 22INVESTOR PRESENTATION
29th July 2021
2
Q1 FY 22 – FINANCIAL HIGHLIGHTS
Source: Unaudited Financial Statements
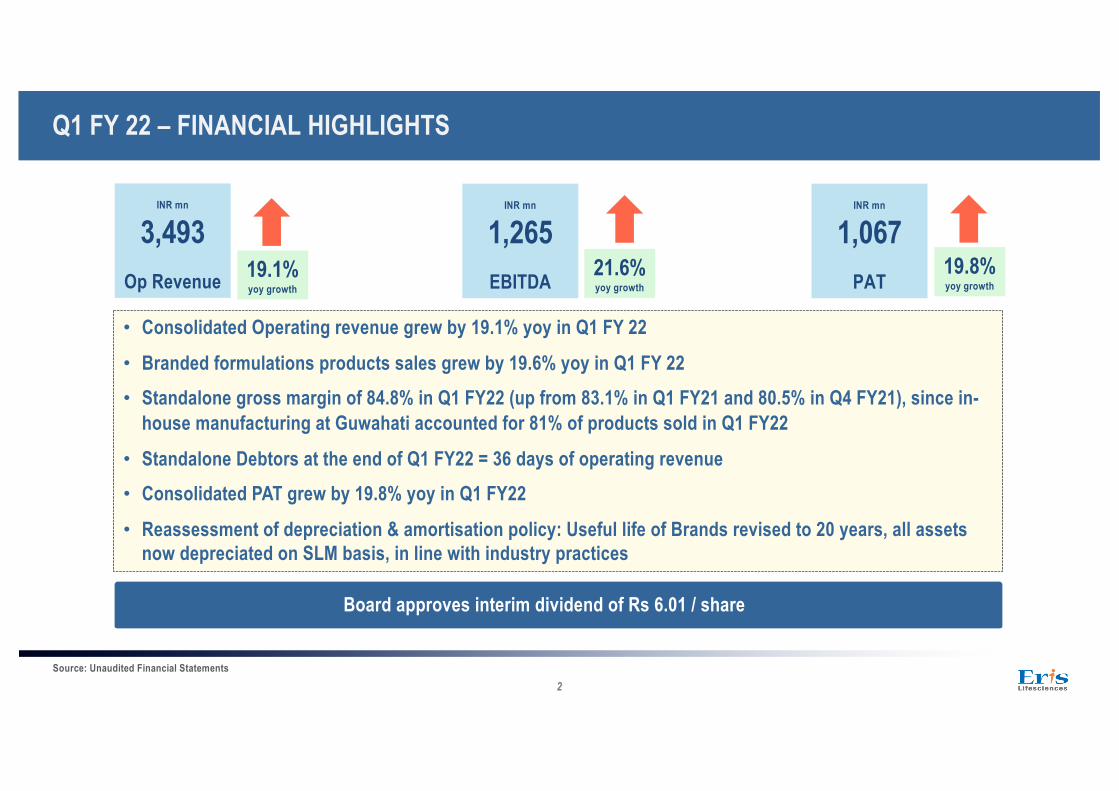
• Consolidated Operating revenue grew by 19.1% yoy in Q1 FY 22
• Branded formulations products sales grew by 19.6% yoy in Q1 FY 22• Standalone gross margin of 84.8% in Q1 FY22 (up from 83.1% in Q1 FY21 and 80.5% in Q4 FY21), since in-
house manufacturing at Guwahati accounted for 81% of products sold in Q1 FY22
• Standalone Debtors at the end of Q1 FY22 = 36 days of operating revenue • Consolidated PAT grew by 19.8% yoy in Q1 FY22
• Reassessment of depreciation & amortisation policy: Useful life of Brands revised to 20 years, all assets now depreciated on SLM basis, in line with industry practices
19.1%yoy growth
INR mn
3,493Op Revenue
INR mn
1,265EBITDA 21.6%
yoy growth
INR mn
1,067PAT
19.8%yoy growth
Board approves interim dividend of Rs 6.01 / share
3
TOP-10 COMPANIES BY GROWTH (MAT JUN 21) - IPM EXCLUDING COVID DRUGS*
Source: AIOCD Pharmatrac June 21*excluding Favipiravir and Remdesivir , 1 Acute contribution based on MAT Jun 21 SalesGraph represents the 10 fastest growing peers for MAT Jun 21 from the IPM Top-25 companies (Excluding Himalaya)
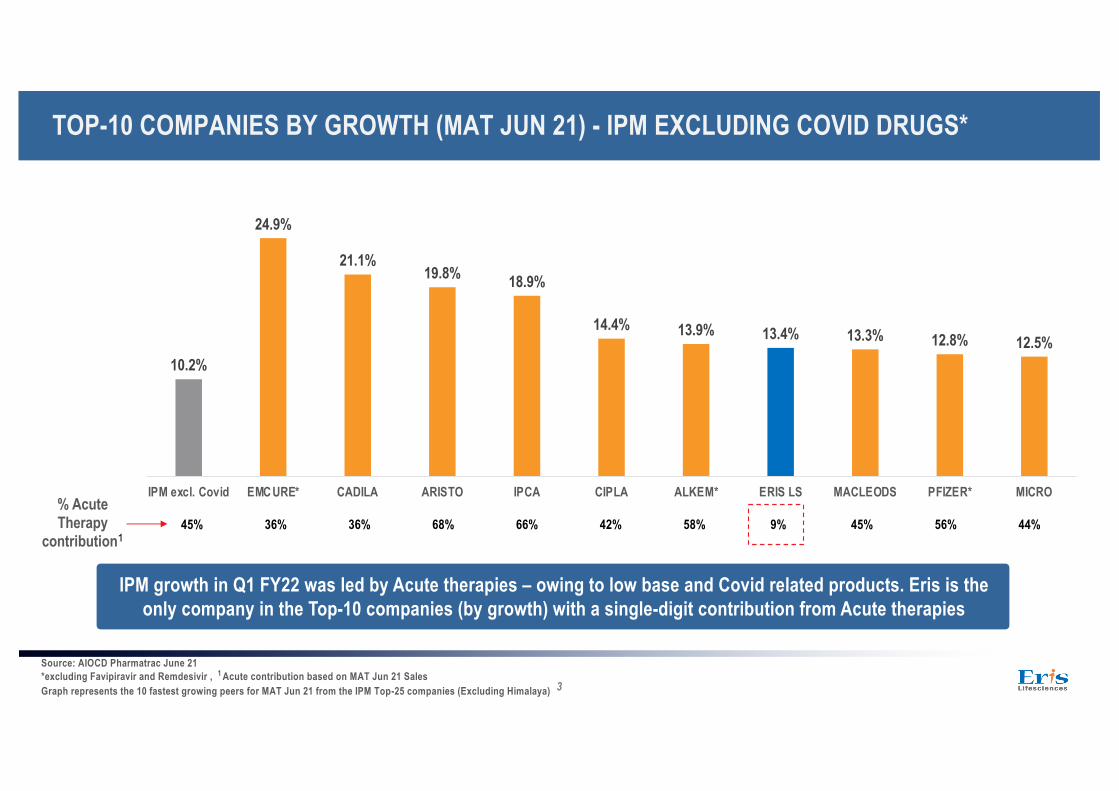
IPM growth in Q1 FY22 was led by Acute therapies – owing to low base and Covid related products. Eris is the only company in the Top-10 companies (by growth) with a single-digit contribution from Acute therapies
10.2%
24.9%
21.1%19.8% 18.9%
14.4% 13.9% 13.4% 13.3% 12.8% 12.5%
IPM excl. Covid EMCURE* CADILA ARISTO IPCA CIPLA ALKEM* ERIS LS MACLEODS PFIZER* MICRO% Acute Therapy
contribution145% 36% 36% 68% 66% 42% 58% 9% 45% 56% 44%
4
Q1 FY 22 – BUSINESS HIGHLIGHTS – ERIS OUTPERFORMS IN CORE THERAPIES
Source: AIOCD Jun’21*Acute therapies growth exclude Covid molecules (Remdesivir and Favipiravir)Graphs represent yoy growth
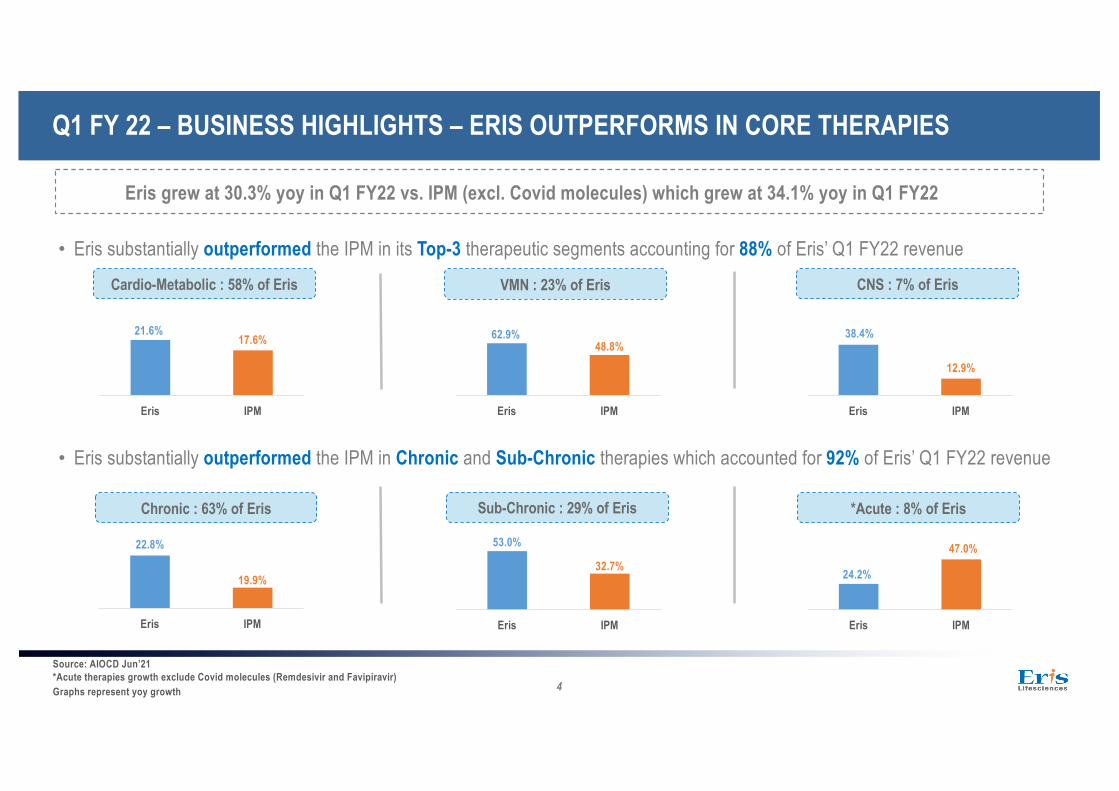
Eris grew at 30.3% yoy in Q1 FY22 vs. IPM (excl. Covid molecules) which grew at 34.1% yoy in Q1 FY22
24.2%
47.0%
Eris IPM
53.0%
32.7%
Eris IPM
Chronic : 63% of Eris Sub-Chronic : 29% of Eris *Acute : 8% of Eris
22.8%
19.9%
Eris IPM
• Eris substantially outperformed the IPM in its Top-3 therapeutic segments accounting for 88% of Eris’ Q1 FY22 revenue
• Eris substantially outperformed the IPM in Chronic and Sub-Chronic therapies which accounted for 92% of Eris’ Q1 FY22 revenue
21.6%17.6%
Eris IPM
62.9%48.8%
Eris IPM
Cardio-Metabolic : 58% of Eris CNS : 7% of Eris
38.4%
12.9%
Eris IPM
VMN : 23% of Eris
5
Q1 FY 22 – NEW PRODUCT LAUNCHES
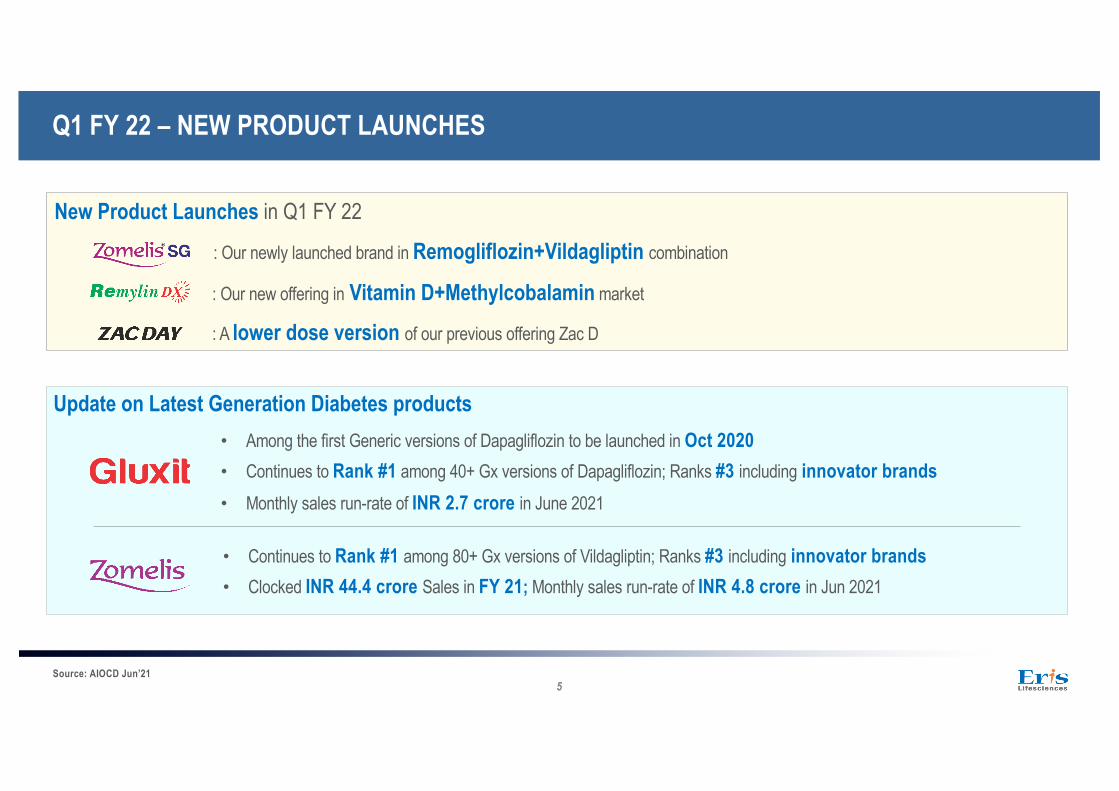
New Product Launches in Q1 FY 22
: Our newly launched brand in Remogliflozin+Vildagliptin combination
: Our new offering in Vitamin D+Methylcobalamin market
: A lower dose version of our previous offering Zac D
Source: AIOCD Jun’21
Update on Latest Generation Diabetes products• Among the first Generic versions of Dapagliflozin to be launched in Oct 2020• Continues to Rank #1 among 40+ Gx versions of Dapagliflozin; Ranks #3 including innovator brands• Monthly sales run-rate of INR 2.7 crore in June 2021
• Continues to Rank #1 among 80+ Gx versions of Vildagliptin; Ranks #3 including innovator brands• Clocked INR 44.4 crore Sales in FY 21; Monthly sales run-rate of INR 4.8 crore in Jun 2021
6
Source: SMSRC MAT Jun 2021* Rank in Represented Market
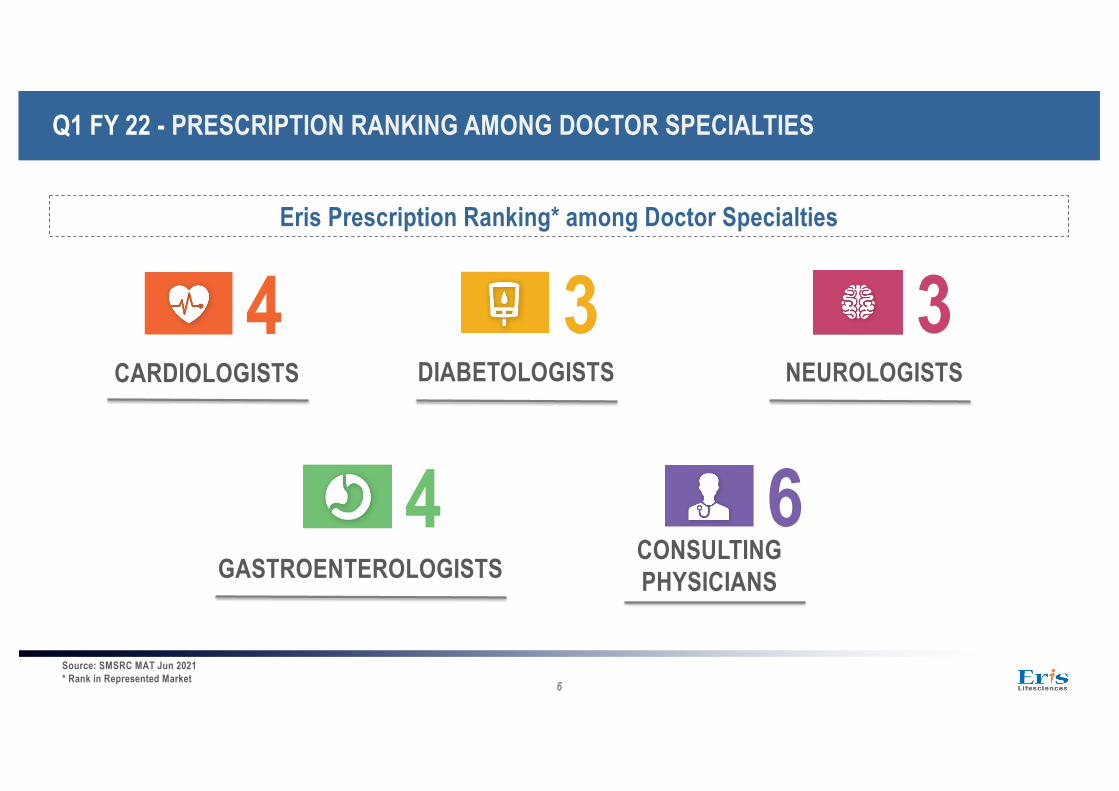
6CONSULTING PHYSICIANS
3DIABETOLOGISTS
4CARDIOLOGISTS
4GASTROENTEROLOGISTS
3NEUROLOGISTS
Eris Prescription Ranking* among Doctor Specialties
Q1 FY 22 - PRESCRIPTION RANKING AMONG DOCTOR SPECIALTIES
7
Q1 FY 22 - POWER BRANDS CONTINUE TO HAVE LEADING PRESENCE IN CORE THERAPIES
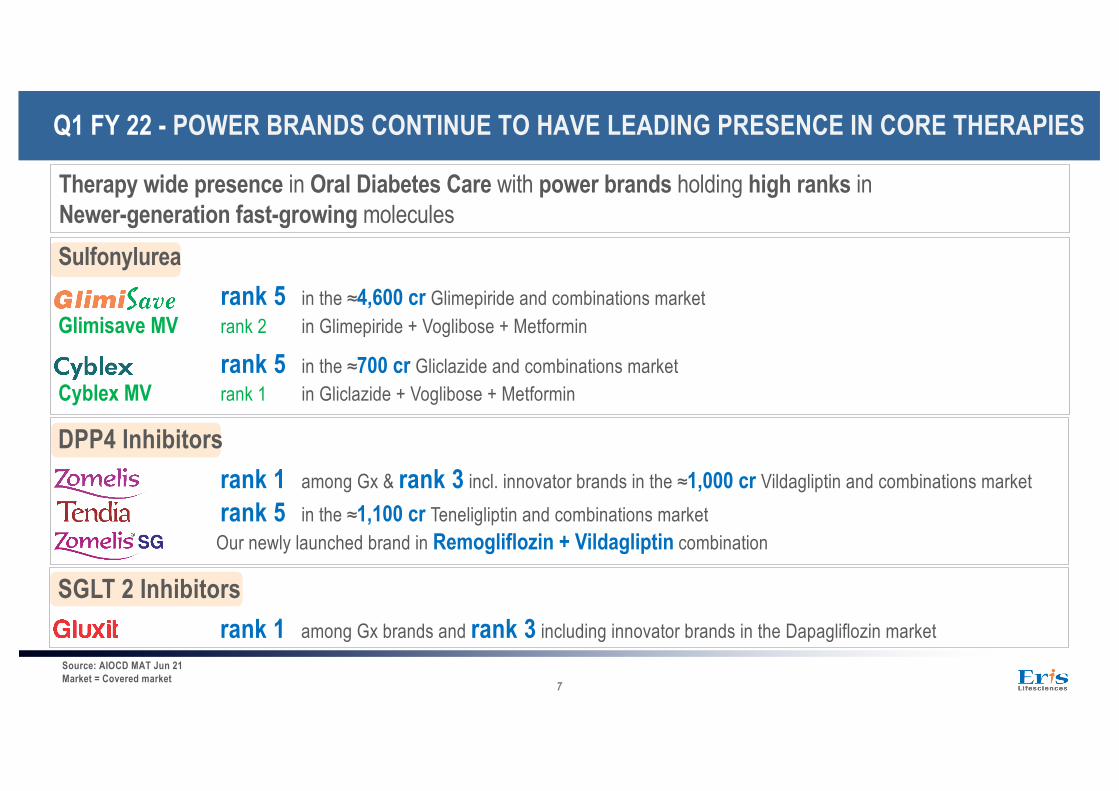
Therapy wide presence in Oral Diabetes Care with power brands holding high ranks in Newer-generation fast-growing moleculesSulfonylurea
rank 5 in the ≈4,600 cr Glimepiride and combinations market Glimisave MV rank 2 in Glimepiride + Voglibose + Metformin
rank 5 in the ≈700 cr Gliclazide and combinations market Cyblex MV rank 1 in Gliclazide + Voglibose + Metformin
DPP4 Inhibitorsrank 1 among Gx & rank 3 incl. innovator brands in the ≈1,000 cr Vildagliptin and combinations market rank 5 in the ≈1,100 cr Teneligliptin and combinations market Our newly launched brand in Remogliflozin + Vildagliptin combination
Source: AIOCD MAT Jun 21Market = Covered market
SGLT 2 Inhibitorsrank 1 among Gx brands and rank 3 including innovator brands in the Dapagliflozin market
8
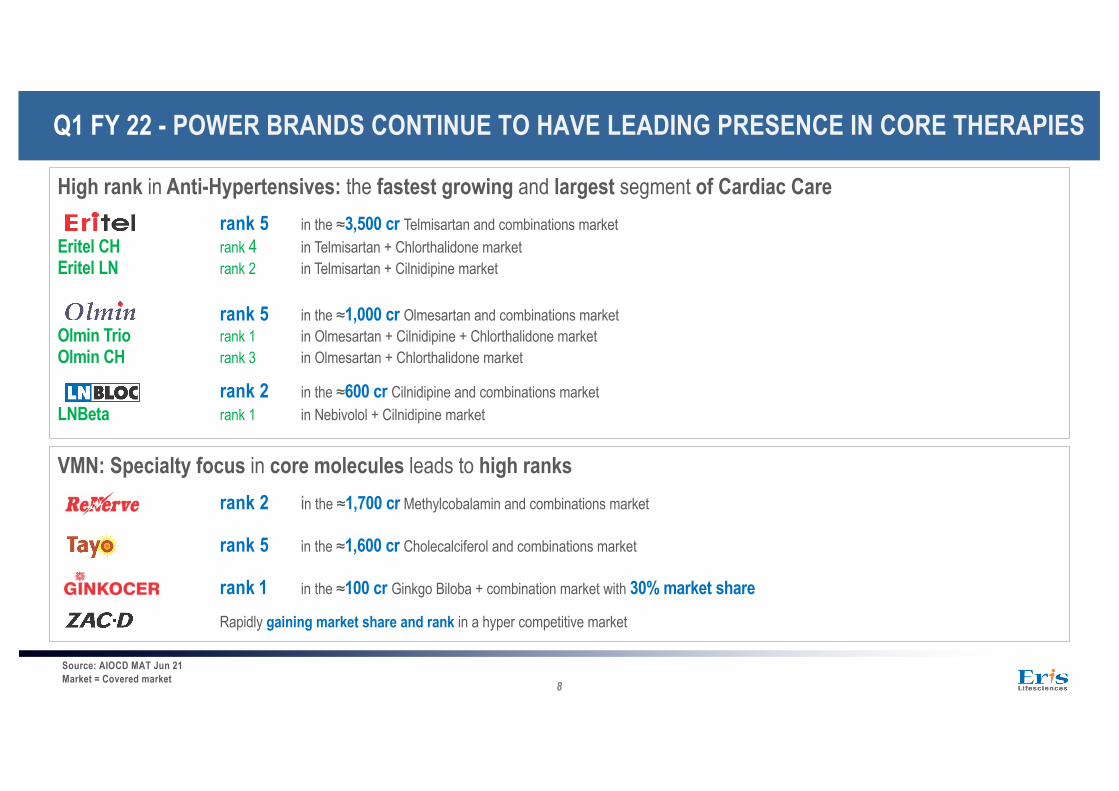
High rank in Anti-Hypertensives: the fastest growing and largest segment of Cardiac Carerank 5 in the ≈3,500 cr Telmisartan and combinations market
Eritel CH rank 4 in Telmisartan + Chlorthalidone market Eritel LN rank 2 in Telmisartan + Cilnidipine market
rank 5 in the ≈1,000 cr Olmesartan and combinations market Olmin Trio rank 1 in Olmesartan + Cilnidipine + Chlorthalidone market Olmin CH rank 3 in Olmesartan + Chlorthalidone market
rank 2 in the ≈600 cr Cilnidipine and combinations market LNBeta rank 1 in Nebivolol + Cilnidipine market
VMN: Specialty focus in core molecules leads to high ranksrank 2 in the ≈1,700 cr Methylcobalamin and combinations market
rank 5 in the ≈1,600 cr Cholecalciferol and combinations market
rank 1 in the ≈100 cr Ginkgo Biloba + combination market with 30% market share
Rapidly gaining market share and rank in a hyper competitive market
Source: AIOCD MAT Jun 21Market = Covered market
Q1 FY 22 - POWER BRANDS CONTINUE TO HAVE LEADING PRESENCE IN CORE THERAPIES
9
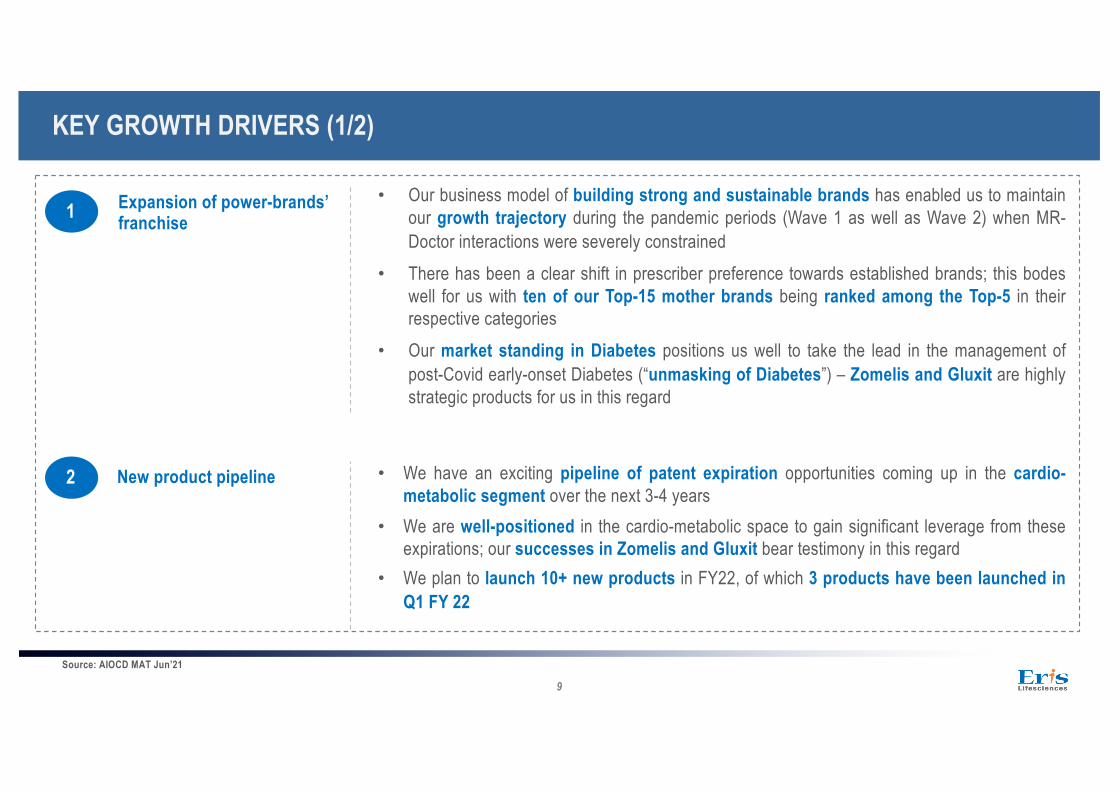
KEY GROWTH DRIVERS (1/2)
Source: AIOCD MAT Jun’21
• Our business model of building strong and sustainable brands has enabled us to maintainour growth trajectory during the pandemic periods (Wave 1 as well as Wave 2) when MR-Doctor interactions were severely constrained
• There has been a clear shift in prescriber preference towards established brands; this bodeswell for us with ten of our Top-15 mother brands being ranked among the Top-5 in theirrespective categories
• Our market standing in Diabetes positions us well to take the lead in the management ofpost-Covid early-onset Diabetes (“unmasking of Diabetes”) – Zomelis and Gluxit are highlystrategic products for us in this regard
1 Expansion of power-brands’ franchise
• We have an exciting pipeline of patent expiration opportunities coming up in the cardio-metabolic segment over the next 3-4 years
• We are well-positioned in the cardio-metabolic space to gain significant leverage from theseexpirations; our successes in Zomelis and Gluxit bear testimony in this regard
• We plan to launch 10+ new products in FY22, of which 3 products have been launched inQ1 FY 22
2 New product pipeline
10
KEY GROWTH DRIVERS (2/2)
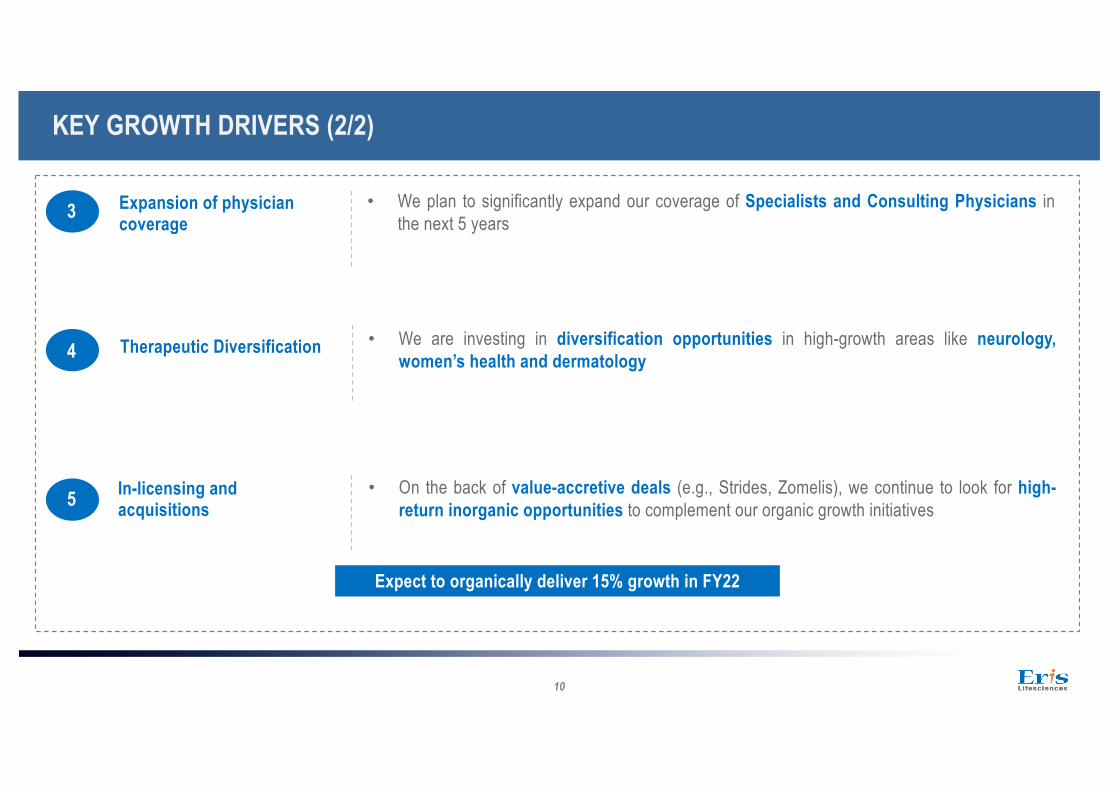
• We plan to significantly expand our coverage of Specialists and Consulting Physicians inthe next 5 years3 Expansion of physician
coverage
4 Therapeutic Diversification • We are investing in diversification opportunities in high-growth areas like neurology,women’s health and dermatology
5 In-licensing and acquisitions
• On the back of value-accretive deals (e.g., Strides, Zomelis), we continue to look for high-return inorganic opportunities to complement our organic growth initiatives
Expect to organically deliver 15% growth in FY22
11
LONG TERM MANUFACTURING STRATEGY – CAPACITY EXPANSION
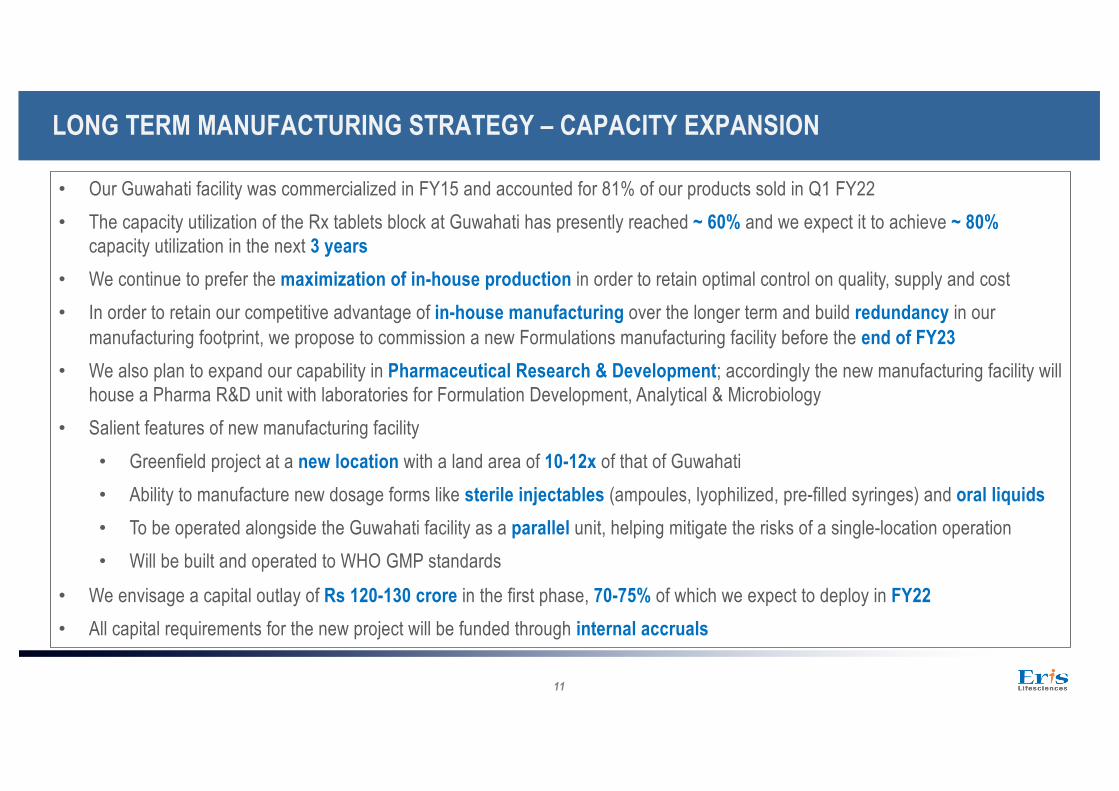
• Our Guwahati facility was commercialized in FY15 and accounted for 81% of our products sold in Q1 FY22• The capacity utilization of the Rx tablets block at Guwahati has presently reached ~ 60% and we expect it to achieve ~ 80%
capacity utilization in the next 3 years• We continue to prefer the maximization of in-house production in order to retain optimal control on quality, supply and cost• In order to retain our competitive advantage of in-house manufacturing over the longer term and build redundancy in our
manufacturing footprint, we propose to commission a new Formulations manufacturing facility before the end of FY23 • We also plan to expand our capability in Pharmaceutical Research & Development; accordingly the new manufacturing facility will
house a Pharma R&D unit with laboratories for Formulation Development, Analytical & Microbiology• Salient features of new manufacturing facility
• Greenfield project at a new location with a land area of 10-12x of that of Guwahati• Ability to manufacture new dosage forms like sterile injectables (ampoules, lyophilized, pre-filled syringes) and oral liquids• To be operated alongside the Guwahati facility as a parallel unit, helping mitigate the risks of a single-location operation• Will be built and operated to WHO GMP standards
• We envisage a capital outlay of Rs 120-130 crore in the first phase, 70-75% of which we expect to deploy in FY22• All capital requirements for the new project will be funded through internal accruals

12
Source: Unaudited Financial StatementsStandalone Sale of Products include intercompany sales from standalone to subsidiaries.
Q1 FY 22 - STANDALONE INCOME STATEMENT
• Operating Revenue grew by 17.1% yoy in Q1 FY22
• Standalone gross margin of 84.8% in Q1 FY22 (up from 83.1% in Q1 FY21 and 80.5% in Q4 FY21) following a significant uptick in Guwahati sourcing (81% of products sold in Q1 FY22)
• Other expenses as % of revenue increased by 97 bps led by partial normalization of promotion activities compared to Q1 FY21
• EBIDTA margin for the quarter expanded by 176 bps yoy to 40.0%
• Useful life of Brands revised to 20 years from 50 years; all assets to be depreciated on SLM basis. As a result, depreciation for Q1 FY 22 is up by 24.0%
• Taxes are 9% of PBT as the Guwahati facility contributed to 81% of total revenue in Q1 of FY22
• Net Profit margin for the quarter expanded by 152 bps yoy to 34.8%
StandaloneINR Millions Q1 FY22 Q1 FY21 Q1 FY 22
YOY Gr %
Sale of Products 3,003 2,561 17.3%Other Operating Income 60 54 11.0%Revenue from Operations 3,063 2,615 17.1%
Gross Profit 2,598 2,174 19.5%Gross Profit Margin 84.8% 83.1%
Employee Cost 582 524 11.2%as % of Revenue 19.0% 20.0%
Other Expenses 791 649 21.7%as % of Revenue 25.8% 24.8%
EBITDA 1,225 1,000 22.5%EBITDA Margin 40.0% 38.3%
Depreciation 112 91 24.0%
Finance Cost 5 2 112.4%
Other Income 64 14 357.2%
PBT 1,173 922 27.3%PBT Margin 38.3% 35.2%
Taxes 106 50 110.5%
Net Profit 1,067 871 22.5%Net Profit Margin 34.8% 33.3%
13
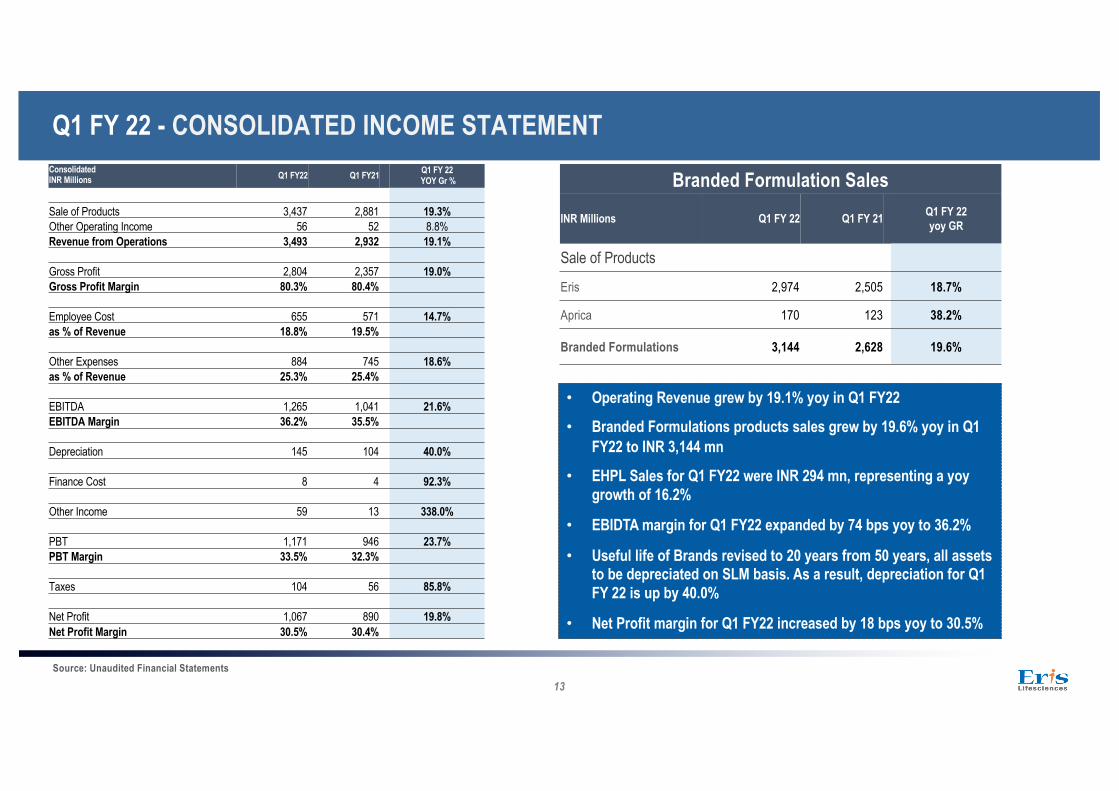
Branded Formulation Sales
INR Millions Q1 FY 22 Q1 FY 21 Q1 FY 22yoy GR
Sale of Products
Eris 2,974 2,505 18.7%
Aprica 170 123 38.2%
Branded Formulations 3,144 2,628 19.6%
• Operating Revenue grew by 19.1% yoy in Q1 FY22
• Branded Formulations products sales grew by 19.6% yoy in Q1 FY22 to INR 3,144 mn
• EHPL Sales for Q1 FY22 were INR 294 mn, representing a yoy growth of 16.2%
• EBIDTA margin for Q1 FY22 expanded by 74 bps yoy to 36.2%
• Useful life of Brands revised to 20 years from 50 years, all assets to be depreciated on SLM basis. As a result, depreciation for Q1 FY 22 is up by 40.0%
• Net Profit margin for Q1 FY22 increased by 18 bps yoy to 30.5%
ConsolidatedINR Millions Q1 FY22 Q1 FY21 Q1 FY 22
YOY Gr %
Sale of Products 3,437 2,881 19.3%Other Operating Income 56 52 8.8%Revenue from Operations 3,493 2,932 19.1%
Gross Profit 2,804 2,357 19.0%Gross Profit Margin 80.3% 80.4%
Employee Cost 655 571 14.7%as % of Revenue 18.8% 19.5%
Other Expenses 884 745 18.6%as % of Revenue 25.3% 25.4%
EBITDA 1,265 1,041 21.6%EBITDA Margin 36.2% 35.5%
Depreciation 145 104 40.0%
Finance Cost 8 4 92.3%
Other Income 59 13 338.0%
PBT 1,171 946 23.7%PBT Margin 33.5% 32.3%
Taxes 104 56 85.8%
Net Profit 1,067 890 19.8%Net Profit Margin 30.5% 30.4%
Source: Unaudited Financial Statements
Q1 FY 22 - CONSOLIDATED INCOME STATEMENT

14
SHAREHOLDER PROFILEShareholding of Promoters and Top 15 Institutional Investors
Name of ShareholderAs on
30-Jun-21As on
31-Mar-21As on
31-Dec-20
696* 605* 580*
Promoters 52.69% 54.13% 54.23%
1 ChrysCapital (Emerald Investment Limited) 5.51% 5.51% 5.51%
2 UTI Mutual Fund 5.09% 4.38% 3.65%
3 Aditya Birla Sun Life Mutual Fund 1.78% 1.88% 2.38%
4 Vanguard 1.67% 1.11% 0.00%
5 Franklin Templeton Mutual Fund 1.38% 1.38% 1.38%
6 Fundsmith Emerging Equities Trust 1.09% 1.09% 1.09%
7 L and T Mutual Fund 0.90% 0.90% 0.76%
8 Kuwait Investment Authority Fund 225 0.87% 0.87% 1.11%
9 Kotak Mutual Fund 0.61% 0.61% 0.83%
10 Steinberg India Fund 0.54% 0.44% 0.44%
11 Government Pension Fund Global- Norges Bank 0.52% 0.36% 0.06%
12 Tata Mutual Fund 0.51% 0.68% 0.94%
13 Malabar Select Fund 0.45% 0.45% 0.14%
14 Ellipsis Partners LLC 0.36% 0.36% 0.36%
15 Shinsei UTI JV 0.28% 0.24% 0.20%
Promoter, 52.69%
Public, 23.23%
DIIs,10.05%
FPIs, 13.49%
Others, 0.54%
Promoter Pub lic DIIs FPIs Others
*Closing share price as per NSE

15
SAFE HARBOR STATEMENT
This presentation contains forward-looking statements and information that involve risks, uncertainties and assumptions. Forward-looking statements are all statements that concern plans, objectives, goals, strategies, future events or performance and theunderlying assumptions and statements, other than those based on historical facts, including, but not limited to, those that areidentified by the use of words such as “anticipates”, “believes”, “estimates”, “expects”, “intends”, “plans”, “predicts”, “projects” and similar expressions. Risks and uncertainties that could affect us include, without limitation:• General economic and business conditions in the markets in which we operate;• The ability to successfully implement our strategy, our research and development efforts, growth & expansion plans and technological changes;• Changes in the value of the Rupee and other currency changes;• Changes in the Indian and international interest rates;• Allocations of funds by the Governments in the healthcare sector• Changes in the laws and regulations that apply to our customers, suppliers, and the pharmaceutical industry;• Increasing competition in and the conditions of our customers, suppliers and the pharmaceutical industry; and• Changes in the political conditions in India and in other global economies.Should one or more of such risks and uncertainties materialize, or should any underlying assumption prove incorrect, actual outcomes may vary materially from those indicated in the applicable forward-looking statements.Any forward-looking statement or information contained in this presentation speaks only as of the date of the statement. We are not required to update any such statement or information to either reflect events or circumstances that occur after the date the statement or information is made or to account for unanticipated events, unless it is required by Law.