Embed Size (px)
Citation preview

Interim Report29 April 2004 1
Interim Report1 January 2004 – 31 March 2004

Interim Report29 April 2004 2
Contents
• Q1 2004 Report− President and CEO Veli-Matti Mattila
• Key Figures and Financial Position− CFO Tuija Soanjärvi

Q1 2004 Report
President and CEO Veli-Matti Mattila
Interim Report29 April 2004 4
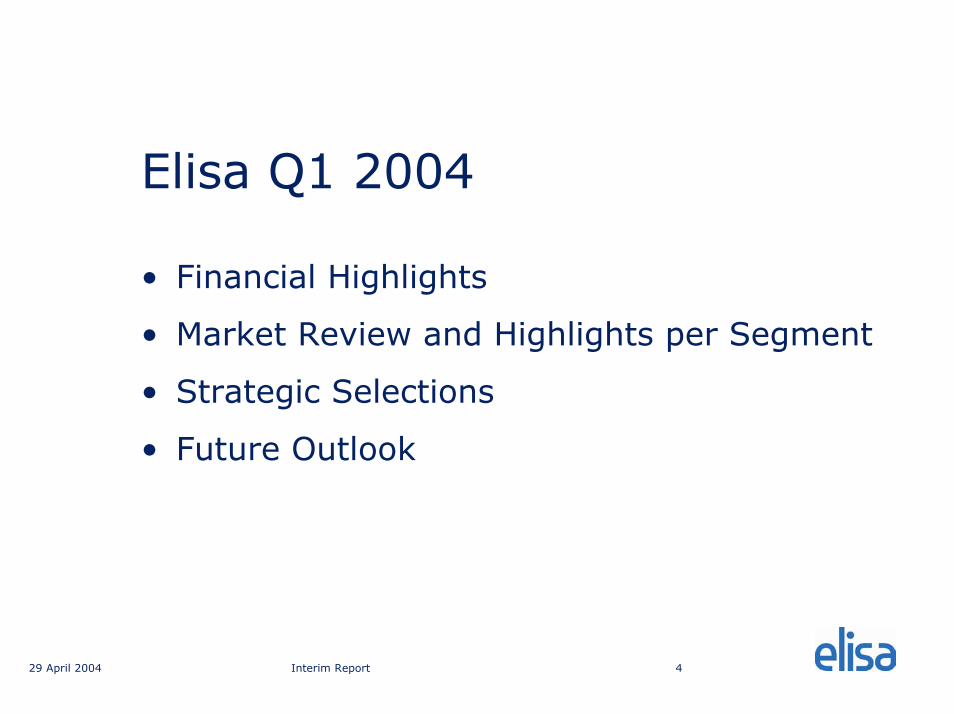
Elisa Q1 2004
• Financial Highlights
• Market Review and Highlights per Segment
• Strategic Selections
• Future Outlook

Interim Report29 April 2004 5
Favourable Profitability Development• Improving profitability
− Lower cost structure begins to work
• More competition in mobile subscriptions
• Development towards One Elisa as planned

Interim Report29 April 2004 6
Lower Revenue, Improved Result• Revenue EUR 333m (371, excluding Germany
339)
• EBITDA EUR 119m (85, excl. Germany 86)
• EBIT EUR 59m (7, excl. Germany 17)
• Pre-tax profit EUR 51m (-5, excl. Germany 6)− Core businesses’ profitability improved− Profitability will improve further

Interim Report29 April 2004 7
EBITDA margin 36%
0
20
40
60
80
100
120
140
Q1/02 Q2/02 Q3/02 Q4/02 Q1/03 Q2/03 Q3/04 Q4/03 Q1/04
EU
R m
illio
n
0
5
10
15
20
25
30
35
40
%
EBITDA EBITDA margin

Interim Report29 April 2004 8
Pre-tax Profit EUR 51m
-20
-10
0
10
20
30
40
50
60
Q1/02 Q2/02 Q3/02 Q4/02 Q1/03 Q2/03 Q3/04 Q4/03 Q1/04
EU
R m
illio
n
-4
-2
0
2
4
6
8
10
12
14
16
%
Pre-tax profit Pre-tax profit margin

Interim Report29 April 2004 9
Stronger Financial Position
• Cash flow EUR 19m (-10)
• Net debt EUR 587m (767)
• Operative CAPEX 7% of revenue
• Equity ratio 44% (38)

Interim Report29 April 2004 10
Demanding Market for Mobile Business• Growth in usage
• Price erosion due to competition
• Increased Churn
• New low-priced subscriptions in the market− Elisa launched new Kolumbus subscription

Interim Report29 April 2004 11
Growth in Mobile’s Revenue and Result• Revenue EUR 179m (174)
• EBITDA EUR 66m (43), 37% of revenue (25)
• EBIT EUR 37m (8)
• Number of subscriptions decreased by 2% to 1,319,000− Stable position in full service segment

Interim Report29 April 2004 12
Fixed Network Market Stable
• Strong demand in broadband channels continued
• Number of analogue lines decreased
• Successful sales in corporate segment

Interim Report29 April 2004 13
Fixed Network Profitability Improved• Revenue EUR 164m (172)
• EBITDA EUR 52m (45), 32% of revenue (26)
• EBIT EUR 25m (17)
• Broadband channels up by 81% to 148,300 (81,900)

Interim Report29 April 2004 14
Strategic Selections
• Finland as the main market− Yomi will merge into Elisa
• Carefully selected international markets− Vodafone cooperation:
−SAP, Philips and Novartis customer agreements−Products: Vodafone Mobile Connect Card
− Projects in the Nordic countries:−Letter of Intent: Elisa as the main supplier of Nordea
in Finland− Sale of the Germany-based business

Interim Report29 April 2004 15
Strategic SelectionsYomi to Merge into Elisa
• Merger plan− Stronger and more competitive entity− Clear ownership structure− Yomi’s telecom operations are core business of Elisa− Yomi’s IT business is non-core business for Elisa. Elisa
will develop this IT business as a financial investment
• No EPS effect in 2004

Interim Report29 April 2004 16
Strategic SelectionsSale of the Germany-based Business
• Sale agreement− Sale price EUR 70m− EUR 30m cash, EUR 40m in 2006 – 2008
• Financial consequences− One-off write down and tax credit in 2003− Transaction has no effect on result in 2004− Improving profitability− Stronger balance sheet

Interim Report29 April 2004 17
Operational Priorities
1. Customer orientation– New security solutions– New marketing director appointed to management team
2. Simplification of structure– One umbrella brand - Elisa– New organisation and operational model in January
3. Significant profitability improvement− projects according to schedule– Outsourcing of the network installation business in
Tampere

Interim Report29 April 2004 18
Outlook for 2004
• Comparable revenue slightly down from 2003− New interconnection tariffs− Price erosion
• Operative result will improve significantly
• Q2-Q4 profitability clearly lower than Q1− Market activities− Price competition

Key Figures and Financial Position
CFO Tuija Soanjärvi

Interim Report29 April 2004 20
Structural Change
• New segment reporting− Overlaps removed− Some businesses grouped differently− Previously reported business area figures not comparable
• Improved transparency
• Germany-based business not consolidated in Group figures

Interim Report29 April 2004 21
Elisa’s Q1 2004 P&LElisa Excl. GermanyEURm Q1/04 Q1/03 Q1/03
Revenue 333 371 339Other operating income 7 4 2EBITDA 119 85 86EBITDA margin 36 % 23 % 25 %Depreciation -49 -65 -58Goodwill depreciation -11 -14 -11Write-downs - - -EBIT 59 7 17EBIT margin 18 % 2 % 5 %Share of assoc. comp. result 0 -1 -1Net financial items -7 -11 -10Pre Tax Profit 51 -5 6
Income from other operations include sales profits and received settlement total EUR 5m. EBITDA includes EUR 5m non-recurring reduction in GSM network leases.

Interim Report29 April 2004 22
Progress by Quarters
ElisaEURm Q1/04 Q4/03* Q3/03 Q2/03 Q1/03
Revenue 333 391 385 391 371Other operating income 7 13 8 9 4EBITDA 119 118 107 97 85EBITDA margin 36 % 30 % 28 % 25 % 23 %Depreciation -49 -70 -67 -66 -65Goodwill depreciation -11 -15 -14 -14 -14EBIT 59 33 26 17 7EBIT margin 18 % 9 % 7 % 4 % 2 %Share of assoc. comp. result 0 -1 1 0 -1Net financial items -7 -10 -10 -10 -11Pre Tax Profit 51 23 17 7 -5
* Without one-off items

Interim Report29 April 2004 23
New Segment Reporting
Group staff costs to fixed
line operations
As reportedRevenue Q1/2004 Q1/2003 Q1 2003Mobile 179 174 175Fixed network 164 172 170Germany - 32 32Other companies 23 24 33Internal sales -33 -31 -39Total 333 371 371
EBITDA Q1/2004 Q1/2003 Q1 2003Mobile 66 43 42Fixed network 52 45 52Germany - -1 -1Other companies 3 -1 -1Group functions -2 -2 -7Total 119 85 85
EBIT Q1/2004 Q1/2003 Q1 2003
Mobile 37 8 5Fixed network 25 17 24Germany - -10 -10Other companies 1 -3 -3Group functions -4 -4 -9Total 59 7 7
Smaller internal
sales

Interim Report29 April 2004 24
Operative CAPEX 7% of Revenue
48 49 46
76
30 39 4255
23
20 214
5
98 3
8
19
5
4
15
2
12
224
0
10
20
30
40
50
60
70
80
90
100
Q1/02 Q2/02 Q3/02 Q4/02 Q1/03 Q2/03 Q3/03 Q4/03 Q1/04
EU
R m
illio
n
Investments in sharesGSM network buy-backsInvestment in fixed assets

Interim Report29 April 2004 25
Net Debt Decreased
825850
817757 767 742
722654
587
0
100
200
300
400
500
600
700
800
900
EU
R m
illio
n
Q1/02 Q2/02 Q3/02 Q4/02 Q1/03 Q2/03 Q3/03 Q4/03 Q1/04
Interim Report29 April 2004 26
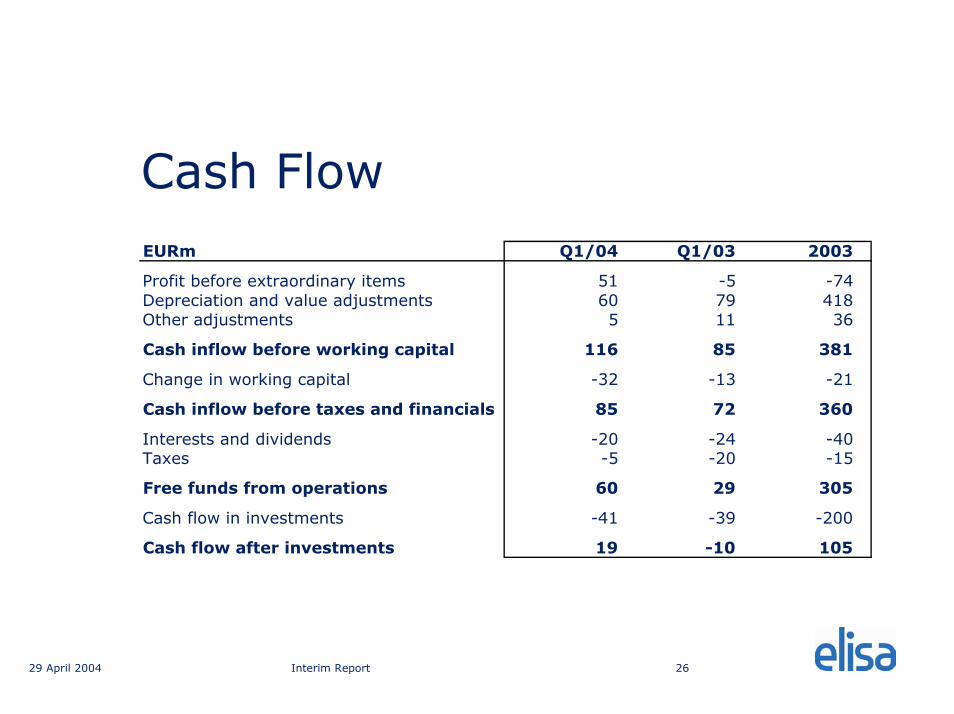
Cash FlowEURm Q1/04 Q1/03 2003
Profit before extraordinary items 51 -5 -74Depreciation and value adjustments 60 79 418Other adjustments 5 11 36
Cash inflow before working capital 116 85 381
Change in working capital -32 -13 -21
Cash inflow before taxes and financials 85 72 360
Interests and dividends -20 -24 -40Taxes -5 -20 -15
Free funds from operations 60 29 305
Cash flow in investments -41 -39 -200
Cash flow after investments 19 -10 105

Interim Report29 April 2004 27
Good Financial Position
• Gearing 67% (below 100%)
• Equity Ratio 44% (above 40%)
• Net Debt/EBITDA* 1.4x (below 2x)
• EBITDA/financial expenses* 11.0x (above 8x)
*Calculated from last four quarters

ElisaInterim Report
1 January 2004 – 31 March 2004

Interim Report29 April 2004 29
Mobile Business Key Figures
Mobile business, EURm Q1/04 Q1/03 % 2003Revenue 179 174 3 % 762Clean EBITDA 66 42 56 % 215Clean EBITDA-% 37 % 24 % 28 %CAPEX 26 16 61 % 103CAPEX excl. network buy-backs 7 7 -6 % 75Oper CAPEX / sales 4 % 4 % 10 %No. of Subscriptions in Finland * 1 319 007 1 348 183 -2 % 1 374 146ARPU, EUR ** 38,6 38,5 0 % 41,6Churn ** 47,4 % 14,4 % 18,6 %Minutes of use, million * 596 531 12 % 2 310Minutes of use / subs / month ** 150 136 10 % 146No. of SMS, million * 121 109 11 % 453No. of SMS / subs / month ** 31 28 11 % 29Value added services / revenue 13 % 13 % 12 %
* Network operator** Service operator

Interim Report29 April 2004 30
Elisa’s Key Figures (1/2)Elisa Group Q1/04 Q4/03 Q3/03 Q2/03 Q1/03 Q4/02 Q3/02 Q2/02 Q1/02EURmRevenue 333 391 385 391 371 385 388 406 384EBITDA 119 96 107 97 85 118 51 86 78EBITDA-% 36 % 25 % 28 % 25 % 23 % 31 % 13 % 21 % 20 %Clean EBITDA 119 118 107 97 85 88 84 86 86Clean EBITDA-% 36 % 30 % 28 % 25 % 23 % 23 % 22 % 21 % 22 %EBIT 59 -83 26 17 7 39 -43 -32 -13Clean EBIT 59 33 26 17 7 10 6 6 12Clean EBIT-% 18 % 8 % 7 % 4 % 2 % 3 % 2 % 1 % 3 %Pre-Tax Profit 51 -93 17 7 -5 26 -56 -49 -25Clean Pre-Tax Profit 51 23 17 7 -5 -3 -7 -11 0
Financial positionNet debt 587 654 722 742 767 757 817 850 825Equity ratio 44 % 40 % 40 % 40 % 38 % 38 % 35 % 38 % 38 %Net debt / EBITDA 1,5 1,7 1,9 2 2,2 2,2 2,4 2,45 2,7Net interest coverage 10,5 9,6 10 8,9 8,1 7 6,7 7,2 6,8Gearing 76 % 87 % 88 % 91 % 97 % 95 % 105 % 102 % 94,1 %
Investmentsin fixed assets 23 55 42 39 30 76 46 49 48Operative CAPEX/Sales 7 % 14 % 11 % 10 % 8 % 20 % 12 % 12 % 13 %in network buy-backs 19 8 3 8 9 5 4 21 20in shares 1 4 22 2 1 5 5 2 4Total 43 67 67 49 40 86 55 72 72CAPEX/Sales 13 % 17 % 17 % 13 % 11 % 22 % 14 % 18 % 19 %

Interim Report29 April 2004 31
Elisa’s Key Figures (2/2)
Segments Q1/04 Q4/03 Q3/03 Q2/03 Q1/03 Q4/02 Q3/02 Q2/02 Q1/02MobileRevenue 179 203 195 190 175 185 188 192 174ARPU, EUR 38,6 43,7 42,5 41,7 38,5 41,3 43,0 43,5 41,4Churn, % 47,4 22,9 24,2 13,4 14,4 21,2 14,0 12,7 18,2Subscriptions 1 319 007 1 374 146 1 374 847 1 356 881 1 348 183 1 342 417 1 301 621 1 289 016 1 348 710Clean EBITDA 66 66 58 49 42 37 50 55 52Clean EBITDA-% 37 % 33 % 30 % 26 % 24 % 20 % 27 % 29 % 30 %Leasing adjusted EBITDA - 70 64 56 49 43 57 66 63Leasing adj. EBITDA-% - 34 % 33 % 29 % 28 % 23 % 30 % 34 % 36 %
Fixed networkRevenue 164 169 163 175 170 174 177 181 203Subscriptions, total 1 194 480 1 186 584 1 182 402 1 181 008 1 184 222 1 184 938 1 141 658 1 142 755 1 147 000Broadband subscriptions 148 270 127 388 107 875 93 677 81 781 71 855 58 974 43 865 36 000ISDN channels 190 921 200 455 211 510 222 153 229 252 237 263 249 667 260 015 269 000Cable TV subscriptions 186 097 183 469 179 858 176 506 172 400 169 900 143 700 139 000 136 000Analogue and other subs 669 192 675 272 683 159 688 672 700 789 705 920 689 317 699 875 706 000Clean EBITDA 52 52 50 50 52 56 57 52 52EBITDA-% 32 % 31 % 31 % 29 % 31 % 32 % 32 % 29 % 26 %
Q1/04 segment figures are not comparable with previous quarters

Interim Report29 April 2004 32
Q1/04 Key Figures per SegmentSegmentsEUR million 1-3/04 1-3/03 1-3/04 1-3/03 1-3/04 1-3/03Mobile 179 174 66 43 45 17Group bookings -8 -9Total 179 174 66 43 37 8Fixed network 164 172 52 45 26 18Group bookings -1 -1Total 164 172 52 45 25 17Germany - 32 - -1 - -9Group bookings - -1Total - 32 - -1 - -10Other companiesComptel 13 12 3 1 3 0Other companies 10 12 0 -2 -2 -3Total 23 24 3 -1 1 -3Group functions -2 -2 -4 -4Group total 333 371 119 85 59 7
0Excluding one-offitems 1-3/04 1-3/03 1-3/04 1-3/03 1-3/04 1-3/03Mobile 179 174 66 43 37 8Fixed network 164 172 52 45 25 17Germany 32 -1 -10Others 23 24 1 -3 -3 -8Intra segment sale -33 -31Group total 333 371 119 85 59 7
Revenue EBITDA EBIT
Revenue Clean EBITDA Clean EBIT

Interim Report29 April 2004 33
Cash Flow by QuartersCONSOLIDATED CASH FLOW STATEMENT Q1/2004 Q4/2003 Q3/2003 Q2/2003 Q1/2003Cash inflow from operating activitiesProfit before extraordinary items 51 -94 17 8 -5Adjustments:
Depreciation and value adjustments 60 179 80 80 79Other financial income and expenses 7 10 9 10 11Sales profits from the disposal of fixed assets 0 -2 -1 0 0Sales profits from business operations -2 -1 0 0 0Other adjustments 0 2 -1 0 0
Cash inflow before working capital 116 94 104 98 85
Change in working capital -32 20 -8 -20 -13Cash inflow before taxes and financials 85 114 96 78 72
Received dividends and interests and interest paid -20 -4 -4 -8 -24Taxes paid -5 21 -7 -9 -20Free funds from operations 60 131 85 60 29
Cash flow in investmentsInvestments in fixed assets -42 -63 -45 -47 -39Disposal of fixed assets 1 4 0 0 1Investments in shares and other investments -1 -4 -21 -2 -1Disposal of shares and other investments 0 2 14 0Disposal of business operations 2 1 0 0 0Cash flow in investments -41 -62 -64 -36 -39
Cash flow after investments 19 70 21 25 -10
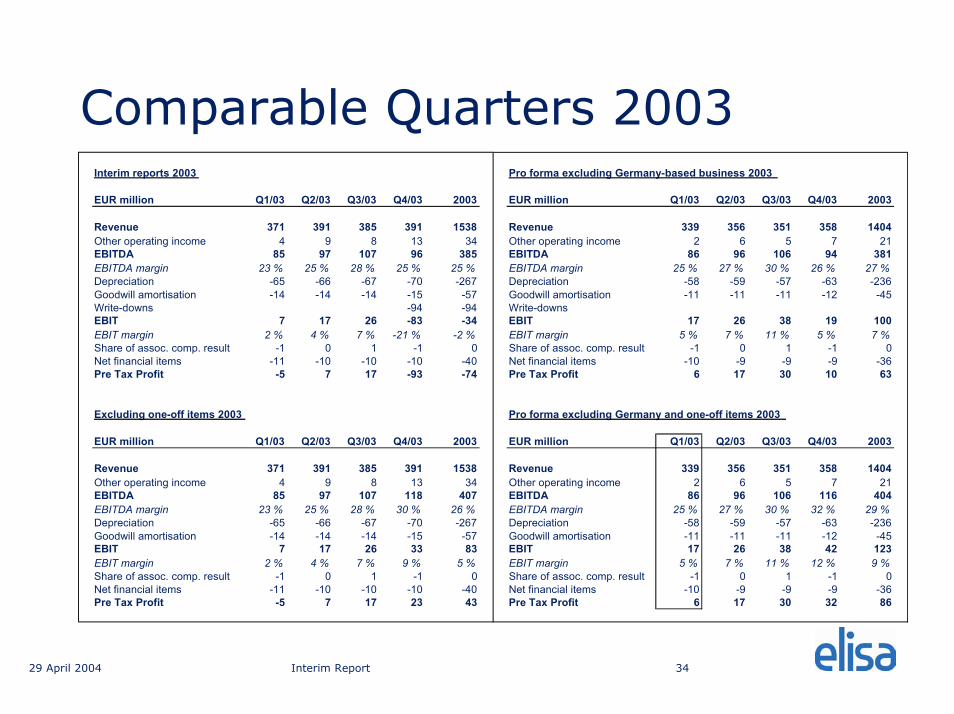
Interim Report29 April 2004 34
Comparable Quarters 2003Interim reports 2003 Pro forma excluding Germany-based business 2003
EUR million Q1/03 Q2/03 Q3/03 Q4/03 2003 EUR million Q1/03 Q2/03 Q3/03 Q4/03 2003
Revenue 371 391 385 391 1538 Revenue 339 356 351 358 1404Other operating income 4 9 8 13 34 Other operating income 2 6 5 7 21EBITDA 85 97 107 96 385 EBITDA 86 96 106 94 381EBITDA margin 23 % 25 % 28 % 25 % 25 % EBITDA margin 25 % 27 % 30 % 26 % 27 %Depreciation -65 -66 -67 -70 -267 Depreciation -58 -59 -57 -63 -236Goodwill amortisation -14 -14 -14 -15 -57 Goodwill amortisation -11 -11 -11 -12 -45Write-downs -94 -94 Write-downsEBIT 7 17 26 -83 -34 EBIT 17 26 38 19 100EBIT margin 2 % 4 % 7 % -21 % -2 % EBIT margin 5 % 7 % 11 % 5 % 7 %Share of assoc. comp. result -1 0 1 -1 0 Share of assoc. comp. result -1 0 1 -1 0Net financial items -11 -10 -10 -10 -40 Net financial items -10 -9 -9 -9 -36Pre Tax Profit -5 7 17 -93 -74 Pre Tax Profit 6 17 30 10 63
Excluding one-off items 2003 Pro forma excluding Germany and one-off items 2003
EUR million Q1/03 Q2/03 Q3/03 Q4/03 2003 EUR million Q1/03 Q2/03 Q3/03 Q4/03 2003
Revenue 371 391 385 391 1538 Revenue 339 356 351 358 1404Other operating income 4 9 8 13 34 Other operating income 2 6 5 7 21EBITDA 85 97 107 118 407 EBITDA 86 96 106 116 404EBITDA margin 23 % 25 % 28 % 30 % 26 % EBITDA margin 25 % 27 % 30 % 32 % 29 %Depreciation -65 -66 -67 -70 -267 Depreciation -58 -59 -57 -63 -236Goodwill amortisation -14 -14 -14 -15 -57 Goodwill amortisation -11 -11 -11 -12 -45EBIT 7 17 26 33 83 EBIT 17 26 38 42 123EBIT margin 2 % 4 % 7 % 9 % 5 % EBIT margin 5 % 7 % 11 % 12 % 9 %Share of assoc. comp. result -1 0 1 -1 0 Share of assoc. comp. result -1 0 1 -1 0Net financial items -11 -10 -10 -10 -40 Net financial items -10 -9 -9 -9 -36Pre Tax Profit -5 7 17 23 43 Pre Tax Profit 6 17 30 32 86