Embed Size (px)
Citation preview
28 February 2015
ATTACHMENT 1
APPENDIX 7
Contents Appendix Financial Activity Statement 1 Investment Summary 2 Notes to and Forming Part of the 3 Financial Activity Statement
Appendix 1
Feb_15 Appendix 1 - Financial Activity Statement-FAS Current Period
NotesRevised Budget
YTD Revised Budget
YTDActual
YTDVariance $
YTDVariance
%
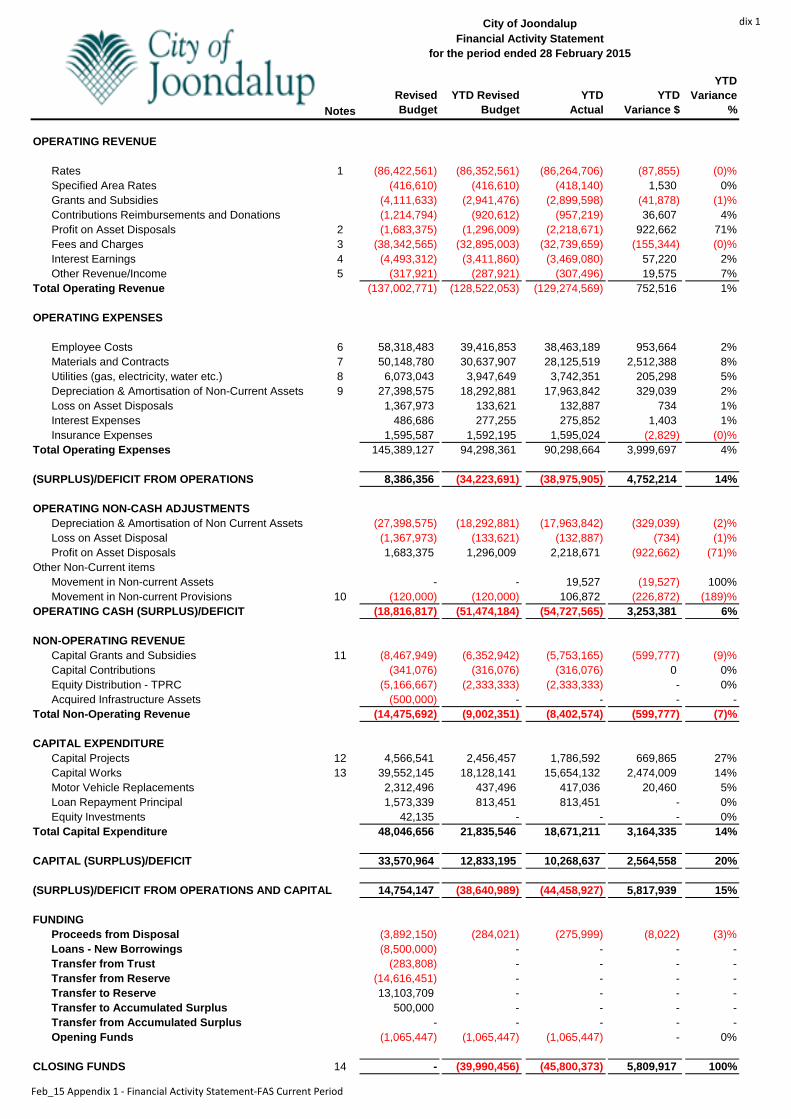
OPERATING REVENUE
Rates 1 (86,422,561) (86,352,561) (86,264,706) (87,855) (0)%Specified Area Rates (416,610) (416,610) (418,140) 1,530 0%Grants and Subsidies (4,111,633) (2,941,476) (2,899,598) (41,878) (1)%Contributions Reimbursements and Donations (1,214,794) (920,612) (957,219) 36,607 4%Profit on Asset Disposals 2 (1,683,375) (1,296,009) (2,218,671) 922,662 71%Fees and Charges 3 (38,342,565) (32,895,003) (32,739,659) (155,344) (0)%Interest Earnings 4 (4,493,312) (3,411,860) (3,469,080) 57,220 2%Other Revenue/Income 5 (317,921) (287,921) (307,496) 19,575 7%
Total Operating Revenue (137,002,771) (128,522,053) (129,274,569) 752,516 1%
OPERATING EXPENSES
Employee Costs 6 58,318,483 39,416,853 38,463,189 953,664 2%Materials and Contracts 7 50,148,780 30,637,907 28,125,519 2,512,388 8%Utilities (gas, electricity, water etc.) 8 6,073,043 3,947,649 3,742,351 205,298 5%Depreciation & Amortisation of Non-Current Assets 9 27,398,575 18,292,881 17,963,842 329,039 2%Loss on Asset Disposals 1,367,973 133,621 132,887 734 1%Interest Expenses 486,686 277,255 275,852 1,403 1%Insurance Expenses 1,595,587 1,592,195 1,595,024 (2,829) (0)%
Total Operating Expenses 145,389,127 94,298,361 90,298,664 3,999,697 4%
(SURPLUS)/DEFICIT FROM OPERATIONS 8,386,356 (34,223,691) (38,975,905) 4,752,214 14%
OPERATING NON-CASH ADJUSTMENTSDepreciation & Amortisation of Non Current Assets (27,398,575) (18,292,881) (17,963,842) (329,039) (2)%Loss on Asset Disposal (1,367,973) (133,621) (132,887) (734) (1)%Profit on Asset Disposals 1,683,375 1,296,009 2,218,671 (922,662) (71)%
Other Non-Current itemsMovement in Non-current Assets - - 19,527 (19,527) 100%Movement in Non-current Provisions 10 (120,000) (120,000) 106,872 (226,872) (189)%
OPERATING CASH (SURPLUS)/DEFICIT (18,816,817) (51,474,184) (54,727,565) 3,253,381 6%
NON-OPERATING REVENUECapital Grants and Subsidies 11 (8,467,949) (6,352,942) (5,753,165) (599,777) (9)%Capital Contributions (341,076) (316,076) (316,076) 0 0%Equity Distribution - TPRC (5,166,667) (2,333,333) (2,333,333) - 0%Acquired Infrastructure Assets (500,000) - - - -
Total Non-Operating Revenue (14,475,692) (9,002,351) (8,402,574) (599,777) (7)%
CAPITAL EXPENDITURECapital Projects 12 4,566,541 2,456,457 1,786,592 669,865 27%Capital Works 13 39,552,145 18,128,141 15,654,132 2,474,009 14%Motor Vehicle Replacements 2,312,496 437,496 417,036 20,460 5%Loan Repayment Principal 1,573,339 813,451 813,451 - 0%Equity Investments 42,135 - - - 0%
Total Capital Expenditure 48,046,656 21,835,546 18,671,211 3,164,335 14%
CAPITAL (SURPLUS)/DEFICIT 33,570,964 12,833,195 10,268,637 2,564,558 20%
(SURPLUS)/DEFICIT FROM OPERATIONS AND CAPITAL 14,754,147 (38,640,989) (44,458,927) 5,817,939 15%
FUNDINGProceeds from Disposal (3,892,150) (284,021) (275,999) (8,022) (3)%Loans - New Borrowings (8,500,000) - - - -Transfer from Trust (283,808) - - - -Transfer from Reserve (14,616,451) - - - -Transfer to Reserve 13,103,709 - - - -Transfer to Accumulated Surplus 500,000 - - - -Transfer from Accumulated Surplus - - - - -Opening Funds (1,065,447) (1,065,447) (1,065,447) - 0%
CLOSING FUNDS 14 - (39,990,456) (45,800,373) 5,809,917 100%
City of JoondalupFinancial Activity Statement
for the period ended 28 February 2015
Appendix 2
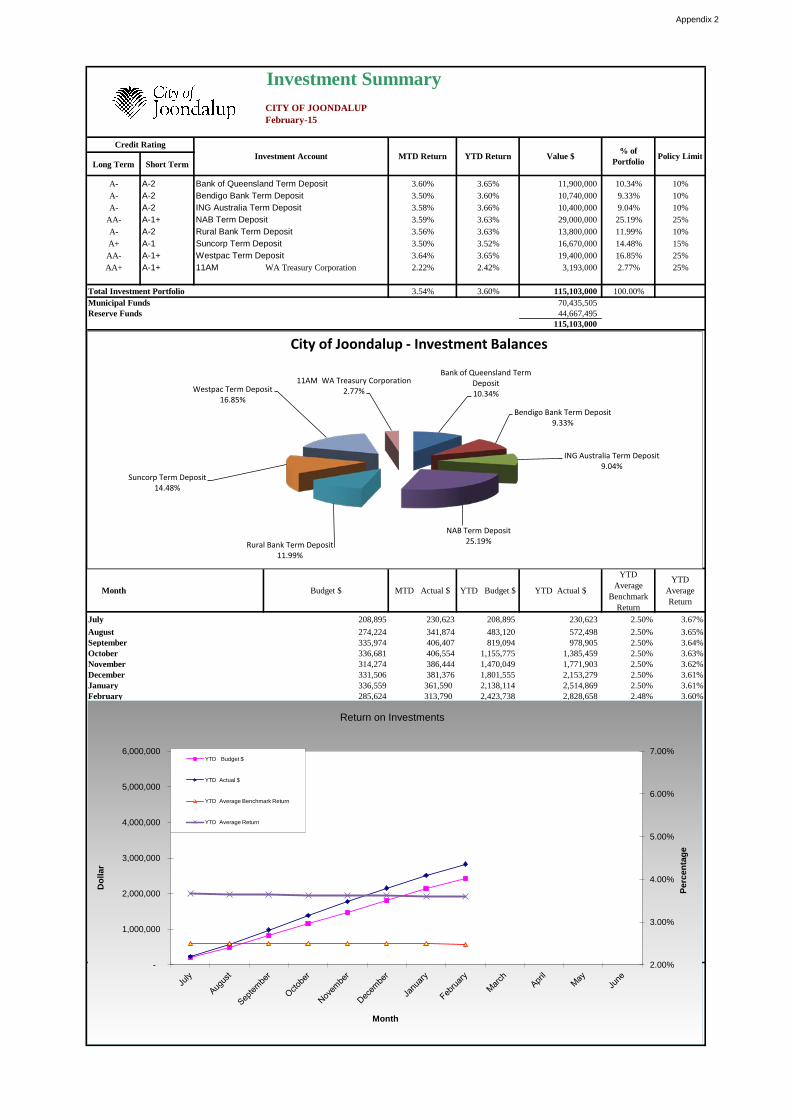
Investment SummaryCITY OF JOONDALUPFebruary-15
Long Term Short Term
A- A-2 Bank of Queensland Term Deposit 3.60% 3.65% 11,900,000 10.34% 10%A- A-2 Bendigo Bank Term Deposit 3.50% 3.60% 10,740,000 9.33% 10%A- A-2 ING Australia Term Deposit 3.58% 3.66% 10,400,000 9.04% 10%
AA- A-1+ NAB Term Deposit 3.59% 3.63% 29,000,000 25.19% 25%A- A-2 Rural Bank Term Deposit 3.56% 3.63% 13,800,000 11.99% 10%A+ A-1 Suncorp Term Deposit 3.50% 3.52% 16,670,000 14.48% 15%AA- A-1+ Westpac Term Deposit 3.64% 3.65% 19,400,000 16.85% 25%AA+ A-1+ 11AM WA Treasury Corporation 2.22% 2.42% 3,193,000 2.77% 25%
3.54% 3.60% 115,103,000 100.00%70,435,505 44,667,495
115,103,000
Month Budget $ MTD Actual $ YTD Budget $ YTD Actual $
YTD Average
Benchmark Return
YTD Average Return
July 208,895 230,623 208,895 230,623 2.50% 3.67%August 274,224 341,874 483,120 572,498 2.50% 3.65%September 335,974 406,407 819,094 978,905 2.50% 3.64%October 336,681 406,554 1,155,775 1,385,459 2.50% 3.63%November 314,274 386,444 1,470,049 1,771,903 2.50% 3.62%December 331,506 381,376 1,801,555 2,153,279 2.50% 3.61%January 336,559 361,590 2,138,114 2,514,869 2.50% 3.61%February 285,624 313,790 2,423,738 2,828,658 2.48% 3.60%MarchAprilMayJune
Investment Account MTD Return YTD Return Value $ % of Portfolio Policy Limit
Total Investment PortfolioMunicipal FundsReserve Funds
Credit Rating
Bank of Queensland Term Deposit 10.34%
Bendigo Bank Term Deposit 9.33%
ING Australia Term Deposit 9.04%
NAB Term Deposit 25.19% Rural Bank Term Deposit
11.99%
Suncorp Term Deposit 14.48%
Westpac Term Deposit 16.85%
11AM WA Treasury Corporation 2.77%
City of Joondalup - Investment Balances
2.00%
3.00%
4.00%
5.00%
6.00%
7.00%
-
1,000,000
2,000,000
3,000,000
4,000,000
5,000,000
6,000,000
Perc
enta
ge
Dol
lar
Month
Return on Investments
YTD Budget $
YTD Actual $
YTD Average Benchmark Return
YTD Average Return
Appendix 3
NOTES TO AND FORMING PART OF THE FINANCIAL ACTIVITY STATEMENT FOR THE PERIOD ENDED ON 28 FEBRUARY 2015 1. Rates
The variance is due a few successful appeals against earlier valuations resulting in partial refunds of rates previously levied.
2 Profit on Asset Disposals
This variance is predominantly due to gains on the disposal of Tamala Park Regional Council (TPRC) land parcels $921,940 which were not included in the budget.
3 Fees and Charges
YTD Revised Budget
YTD Actual Variance
a) Licenses and Registrations $667,424 $701,833 $34,409 b) Sports and Recreation Fees $5,566,627 $5,248,768 ($317,859) c) Fines and Penalties $865,550 $899,860 $34,310 d) Building and Development Fees $1,476,941 $1,418,146 ($58,795) e) Parking Fees $1,401,733 $1,426,983 $25,250 f) Hire and Rentals $459,233 $536,610 $77,377 g) Refuse Charges $20,023,218 $20,056,680 $33,462 Other variances $2,434,277 $2,450,779 $16,502 $32,895,003 $32,739,659 ($155,344)
a) Higher than budgeted income arose for Dog Registration Fees $19,576 and Food
Business Administration Fees $15,629. b) Leisure Centre net revenue is ($338,121) below budget mainly due to unfavourable
variances for Admission Fees ($117,936), Membership Fees ($32,829) and Term Programme Activities ($27,673) in addition to an unfavourable timing variance for the Learn to Swim program ($171,318). This is partly offset by a favourable variance of $28,532 for the Hire of City Facilities.
c) The volume of Parking Infringements issued was higher than estimated in the budget
resulting in a favourable variance of $59,981. This is partly offset by unfavourable variances for Suburban Parking ($14,839) and Poundage Fees ($10,761).
d) Unfavourable variances arose for Development Application fees ($82,670) and
Building Licenses ($18,769) due to lower activity than forecast. These are partly offset by a favourable variance of $40,521 for Other Building and Development charges.
e) Higher than budgeted revenue arose for Off-street Parking fees $33,591 and Private
Property Agreements $7,204, partly offset by lower than forecast On-street Parking fees of ($15,544).
f) This includes a favourable timing variance of $74,453 for Property Rental income.
Appendix 3
g) This variance represents additional domestic refuse removal charges arising mainly
from new residential developments in the district. 4. Interest Earnings
Interest earned on investments exceeded budget by $37,005 mainly due to the volume of investment funds being higher than budgeted. In addition higher interest of $20,215 was collected in respect of the late payment of rates, instalment options and pensioner deferred rates.
5. Other Revenue
Favourable variances arose for Discounts Received $11,047, Rebates Received $5,229 and Adshell Advertising revenue $2,998.
6. Employee Costs
YTD Revised Budget
YTD Actual Variance
a) Salaries and Wages $36,933,651 $35,976,000 $957,651 b) Other Employment Costs $2,483,202 $2,487,189 ($3,987) $39,416,853 $38,463,189 $953,664
a) A favourable variance of $710,801 arose mainly due to vacant positions across the
City. This is in addition to the favourable adjustment of $246,850 in the Provision for Employee Entitlements.
b) This includes favourable variances for Staff Training $78,210, Capital Labour Recoveries $14,268 and Study Assistance $21,542 which are offset by an unfavourable variance for Agency Employees ($127,375) mainly used to cover staff vacancies.
Appendix 3
7. Materials and Contracts
YTD Revised Budget
YTD Actual Variance
a) External Service Expenses $13,055,377 $12,296,930 $758,447 b) Professional Fees and Costs $1,293,300 $1,141,690 $151,610 c) Materials $1,172,326 $1,023,463 $148,863 d) Administration $693,262 $651,453 $41,809 e) Waste Management Services $6,446,726 $5,517,912 $928,814 f) Computing $1,135,881 $976,571 $159,310 g) Public Relations, Advertising and
Promotion $683,039 $567,627 $115,412
h) Charges and Recoveries ($213,465) ($260,986) $47,521 i) Accommodation and Property $1,170,069 $1,141,315 $28,754 j) Telephone and Communications $441,534 $405,869 $35,665 Other Materials and Contracts $4,759,858 $4,663,675 $96,183 $30,637,907 $28,125,519 $2,512,388
a) This favourable variance is driven primarily by lower expenditure of $765,895 for External Contractors and Services, mainly comprising timing variances, This includes Parks $372,976, Building maintenance $251,645, Landscaping and Conservation $34,867, Engineering maintenance $54,056 and Graffiti Removal $40,267. This variance also includes Domestic and Bulk Tipping Fees that are ($87,257) higher than budget. In addition, a favourable timing variance arose for Economic, Environmental and Community Development Program Activities $56,535. The remainder of the variance is spread across several areas.
b) Favourable variances arose for Consultancy expenditure $77,312, mainly due to the rescheduling of projects, Fines Enforcement Lodgement Fees $23,300, Innovation Precinct $25,000, Legal Expenses Recoverable $17,821 and Licence Fees $11,202. These are partly offset by an unfavourable variance of ($13,644) for Other Legal Expenses. The balance of the variance is spread across a number of areas.
c) Favourable timing variances arose for the cost of Materials used by External
Contractors of $173,398. This is partly offset by an unfavourable timing variance for material for Building Minor Works ($20,534).
d) This favourable variance includes $30,141 for Printing and $12,102 for Photography
and Video Production mainly due to the timing of various festivals and events in 2015. In addition, a favourable variance arose for Stationery $12,340 offset by unfavourable timing variances for Corporate Membership Expenses ($7,221) and Conferences ($6,302).
e) The variance is mainly due to Recycling Processing costs at the Materials Recovery
Facility which are $604,288 below budget. The facility has now closed however final invoices are still to be received. In addition, waste collection costs are below budget for Bulk $223,462, Domestic $46,909, Recycling $30,620 and Weekend Greens $23,535.
Appendix 3
f) Favourable variances arose for Computer Software Licences $51,958, Computer
Software Maintenance $72,814 and Data Communication Links $24,582 predominantly due to invoices that are yet to be received.
g) This comprises favourable variances arising mainly from the timing of various events,
including Advertising – General $25,138, Promotions $27,560, Signage $23,810 and Bar Stocks $18,241 which are spread across a number of areas.
h) Favourable variances arose for Capital Overhead Recoveries $26,698 and Fleet and
Plant recovery from capital jobs of $20,823. i) A favourable variance of $62,167 arose for Rental and Outgoings mainly due to the
timing of rental invoices for the Works Operation Centre that are yet to be processed. This is partly offset by an unfavourable variance for Refuse Removal charges ($33,368) that are over budget predominantly due to higher volumes of waste collected from the City’s Works Operation Centre.
j) This includes favourable timing variances for Office Telephones $22,802, Postage
$10,010 and Mobile Phones $4,379. The remainder of the variance is spread across a number of areas.
8. Utilities
Electricity costs are $199,528 below budget. This includes a favourable variance of $228,346 for Street Lighting predominantly due to the removal of the Carbon Tax partly offset by an unfavourable variance of ($54,745) for Parks. Favourable variances also arose for gas $5,451 and water $320.
9 Depreciation and Amortisation of Non-Current Assets
This favourable variance includes $351,975 for Computer and Communications Hardware of which $330,707 has arisen from a review of depreciation calculations. This is offset by additional depreciation for newly acquired Mobile and Other Plant equipment.
10. Non-Current Provisions
This variance is due to the year to date movement in the non-current long service leave liability being lower than estimated.
11. Capital Grants and Subsidies
YTD Revised Budget
YTD Actual Variance
a) Road Preservation and Resurfacing $3,902,183 $3,409,172 ($493,011) b) Black Spot $148,724 $97,426 ($51,298) c) Parks Equipment program $82,413 $26,946 ($55,467) Other Grants $2,219,622 $2,219,621 ($1) $6,352,942 $5,753,165 ($599,777)
Appendix 3
a) This includes unfavourable timing variances for the Roads to Recovery grant
($336,859) and the second 40 % payment of the Metropolitan Regional Road Grant ($306,209) that are expected to be received in the following month. These are partly offset by a favourable variance in respect of the Federal Local Road Grant $150,057, the phasing of which will be corrected in the following months.
b) This unfavourable timing variance arose for Joondalup Drive ($16,321) and Hepburn Avenue (5,542) intersection modifications which are awaiting final documentation from Main Roads WA contractors and Marmion Avenue and Warwick Road ($4,254) as well as Hepburn Avenue and Gibson Avenue ($25,181) which are awaiting final invoices. Final acquittals for all four projects are forecast to be lodged in March 2015.
c) This unfavourable variance arose for Iluka District Open Space Spotlighting Upgrade
as the project was completed under budget resulting in a lower grant claim. 12. Capital Projects
YTD Revised Budget
YTD Actual
Variance
a) Ocean Reef Marina Development $831,956 $597,363 $234,593 b) Joondalup Performing Arts & Cultural
Facility (JPACF) $359,991 $48,127 $311,864
c) Public Art $124,340 $30,340 $94,000 d) Information Technology Projects $688,254 $635,567 $52,687 Other Projects $451,916 $475,195 ($23,279) $2,456,457 $1,786,592 $669,865 a) Tasks associated with the preparation of the Public Environmental Review,
Metropolitan Region Scheme Amendment and Local Structure Plan continued throughout the period. In addition, preparation for the first design review workshop has commenced. The year to date variance reflects timing differences.
b) Work has commenced on the grant application process for the Federal Government’s
National Stronger Regions Fund. Outcomes of ongoing assessments will determine further expenditure in the coming months.
c) This favourable variance arose for the Public Art water feature in Central Walk as
progress payments are behind budget phasing. d) This is mainly due to a favourable timing variance for the Infrastructure Asset
Management System implementation project $45,351, this is progressing behind budget.
Appendix 3
13. Capital Works
YTD Revised Budget
YTD Actual Variance
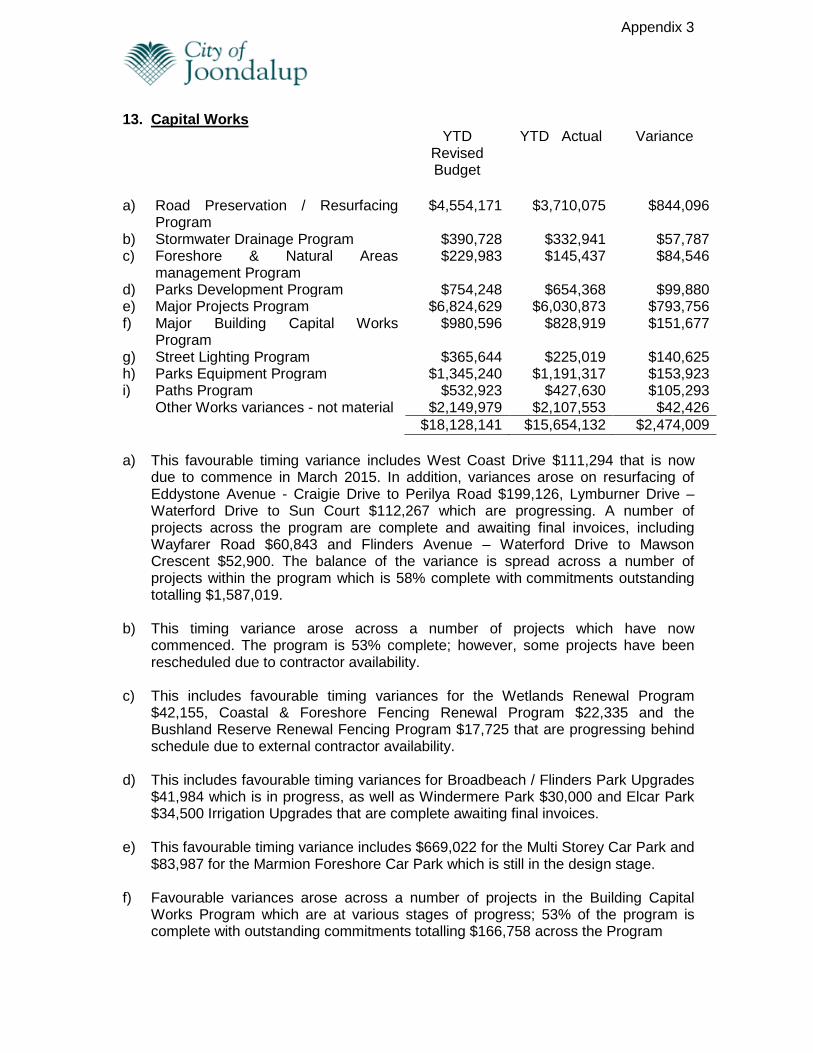
a) Road Preservation / Resurfacing
Program $4,554,171 $3,710,075 $844,096
b) Stormwater Drainage Program $390,728 $332,941 $57,787 c) Foreshore & Natural Areas
management Program $229,983 $145,437 $84,546
d) Parks Development Program $754,248 $654,368 $99,880 e) Major Projects Program $6,824,629 $6,030,873 $793,756 f) Major Building Capital Works
Program $980,596 $828,919 $151,677
g) Street Lighting Program $365,644 $225,019 $140,625 h) Parks Equipment Program $1,345,240 $1,191,317 $153,923 i) Paths Program $532,923 $427,630 $105,293 Other Works variances - not material $2,149,979 $2,107,553 $42,426 $18,128,141 $15,654,132 $2,474,009 a) This favourable timing variance includes West Coast Drive $111,294 that is now
due to commence in March 2015. In addition, variances arose on resurfacing of Eddystone Avenue - Craigie Drive to Perilya Road $199,126, Lymburner Drive – Waterford Drive to Sun Court $112,267 which are progressing. A number of projects across the program are complete and awaiting final invoices, including Wayfarer Road $60,843 and Flinders Avenue – Waterford Drive to Mawson Crescent $52,900. The balance of the variance is spread across a number of projects within the program which is 58% complete with commitments outstanding totalling $1,587,019.
b) This timing variance arose across a number of projects which have now
commenced. The program is 53% complete; however, some projects have been rescheduled due to contractor availability.
c) This includes favourable timing variances for the Wetlands Renewal Program
$42,155, Coastal & Foreshore Fencing Renewal Program $22,335 and the Bushland Reserve Renewal Fencing Program $17,725 that are progressing behind schedule due to external contractor availability.
d) This includes favourable timing variances for Broadbeach / Flinders Park Upgrades $41,984 which is in progress, as well as Windermere Park $30,000 and Elcar Park $34,500 Irrigation Upgrades that are complete awaiting final invoices.
e) This favourable timing variance includes $669,022 for the Multi Storey Car Park and
$83,987 for the Marmion Foreshore Car Park which is still in the design stage.
f) Favourable variances arose across a number of projects in the Building Capital Works Program which are at various stages of progress; 53% of the program is complete with outstanding commitments totalling $166,758 across the Program
Appendix 3
g) Favourable variances arose for Joondalup City Centre Lighting $95,943 which has
been referred to a consultant for review and design and Warrigal Park to Karrajong Park new lighting $40,000 which is in the quotation phase.
h) Favourable variances arose for Central Park – Boardwalk replacement $78,924
which is experiencing supply delays and is now forecast for installation in April, as well as Seacrest Park Floodlighting $95,394 and the Floodlight and Pole Replacement Program $92,465 which are progressing behind budget phasing. These are offset by an unfavourable timing variance of ($98,181) for Broadbeach Park New playground equipment which is being aligned with the construction works under the Parks Development Program.
i) The favourable variance is mainly due to Trailwood Drive principal shared path $150,807, for which work done by Main Roads Contractors needs to be completed first. Construction of the path is forecast to commence in March. This is offset by unfavourable timing variances for Bonneville Way ($16,000) and Yellagonga Trail Path Link – Walkability Plan ($11,013) which are complete earlier than budget estimates.
Appendix 3
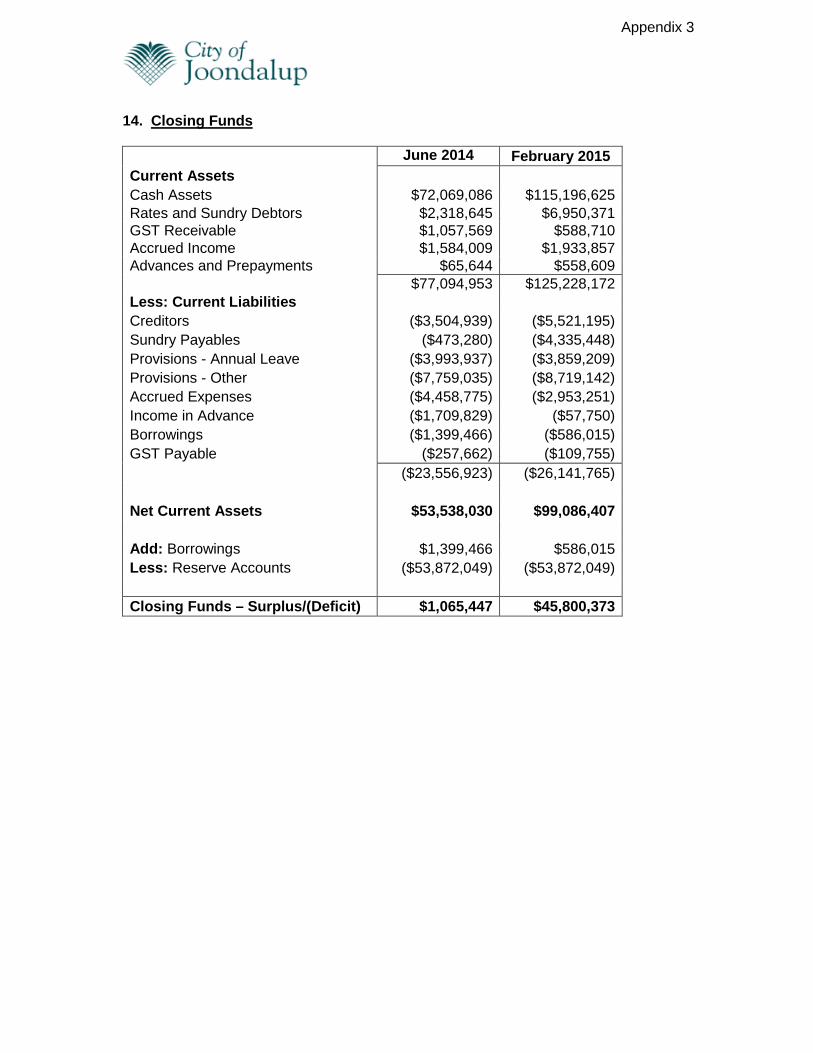
14. Closing Funds
June 2014 February 2015 Current Assets Cash Assets $72,069,086 $115,196,625 Rates and Sundry Debtors $2,318,645 $6,950,371 GST Receivable $1,057,569 $588,710 Accrued Income $1,584,009 $1,933,857 Advances and Prepayments $65,644 $558,609 $77,094,953 $125,228,172 Less: Current Liabilities Creditors ($3,504,939) ($5,521,195) Sundry Payables ($473,280) ($4,335,448) Provisions - Annual Leave ($3,993,937) ($3,859,209) Provisions - Other ($7,759,035) ($8,719,142) Accrued Expenses ($4,458,775) ($2,953,251) Income in Advance ($1,709,829) ($57,750) Borrowings ($1,399,466) ($586,015) GST Payable ($257,662) ($109,755) ($23,556,923) ($26,141,765) Net Current Assets $53,538,030 $99,086,407 Add: Borrowings $1,399,466 $586,015 Less: Reserve Accounts ($53,872,049) ($53,872,049) Closing Funds – Surplus/(Deficit) $1,065,447 $45,800,373