Embed Size (px)
Citation preview

Please refer to the disclaimer towards the end of the document.
Institutional Equities
Initi
atin
g C
over
age
Reuters: VMAR.BO; Bloomberg: VMART IN
V-Mart Retail
Shopping Time! V-Mart Retail (VRL) is one of the few retail companies having a right business model with best product mix, appropriate location/store size and control over costs. Its positioning as a one-stop family shop in Tier-II & Tier-III cities provides an early- mover advantage with strong scalability in these high-potential markets. Following low-cost structure, VRL enjoys highest operating margin of 9.4% as against 5.7%/2.1%/ 2.3%/2.8% in case of Shoppers Stop (SSL)/Trent (TL)/Pantaloon Fashion Retail (PFRL)/ Arvind’s Megamart, respectively, in FY14. Healthy operating cash flow of Rs926mn is expected to meet its entire capex requirement of Rs900mn to set up 75 stores over FY14-FY17E. Despite strong revenue CAGR of 38.8%/32.2%/34.3% over the past 3/5/6 years, respectively, and better return ratios/cash flow, VRL trades at 14.8x/8.0x FY17E P/E and EV/EBITDA, respectively, at a 32%-40% discount to other retailers like SSL/TL/Future Retail which trade at 22x-31x P/E and 7x-17x EV/EBITDA. Strong revenue/net profit CAGRs of 29.2%/34.4%, respectively, coupled with a flat net D/E ratio of 0.04x and a 685bps improvement in RoCE at 21.5% over FY14-FY17E would lead to a strong re-rating. We have assigned Buy rating to VRL with a TP of Rs790 based on 27.0x/14.4x, FY16E-FY17E average P/E and EV/EBITDA, respectively. Efficient control over costs including lease rentals: VRL is one of the most efficient players in Indian retail Industry with a lean cost structure. As most of VRL’s stores are located in Tier-II and Tier-III cities, its lease rentals are lower at Rs28/sqft/month. VRL’s lease rentals, at 4.3% of sales, are much lower compared to 8.3%/9.4%/15.1% of TL/SSL/PFRL, respectively, on a standalone basis. Similarly, its employee costs at 6.7% are lower compared to 7.5%/8.3%/9.0% and other expenses at 7.0% compared to 12.7%/25.2%/12.3% of SSL/TL/PFRL, respectively. Despite the focus on small cities, its revenue/sqft is higher at Rs8,878 compared to Rs8,668/Rs8,306 in case of SSL/PFRL, respectively. On account of its low-cost structure, VRL enjoys highest operating margin of 9.4% compared to 5.7%/2.1%/2.3%/2.8% of SSL/TL/PFRL/Arvind’s Megamart, respectively. Healthy operating cash flow, lean D/E ratio to support growth and return ratios: VRL is focusing on improving inventory turnover and supply chain. We expect VRL to improve its inventory days from 150 to 145 and reduce its working capital cycle from 18.1% to 17.0% over FY14-FY17E. Because of high working capital requirement, operating cash flow was negative for two out of six years, with cumulative operating cash flow of only Rs157mn over FY08-FY14. However, with a lean working capital requirement coupled with healthy revenue growth, VRL would have cumulative operating cash flow of Rs926mn, which may meet entire capex need of Rs900mn to set up 75 stores over FY14-FY17E. This will maintain net D/E ratio flat at 0.04x and improve RoCE 685bps from 14.7% to 21.5% over FY14-FY17E. Ready to leap frog with the right business model: VRL is among the very few retail companies which have a right business model, best product mix, appropriate location/store size and control over costs. With strong execution capability, VRL is expected to set up 25 stores every year compared to the past three years’ average of 17. We expect VRL to grow its retail business at a 20.0% CAGR at 1.25mn sqft by setting up 75 stores on a base of 89 over FY14-FY17E. This is likely to result in strong 29.2%/34.4% revenue/net profit CAGR over FY14-FY17E at Rs12,389mn/Rs612mn, respectively.
BUY
Sector: Retail
CMP: Rs505
Target Price: Rs790
Upside: 56%
Jignesh Kamani, CFA [email protected] +91-22-3926 8239
Ruchita Maheshwari [email protected] +91-22-3926 8023
Key Data
Current Shares O/S (mn) 18.0
Mkt Cap (Rsbn/US$mn) 9.1/146.6
52 Wk H / L (Rs) 637/205
Daily Vol. (3M NSE Avg.) 24,057
Share holding (%) 4QFY14 1QFY15 2QFY15
Promoter 58.8 58.7 58.6
FII 24.6 24.6 24.7
DII 6.4 6.3 6.3
Corporate 6.9 6.0 6.3
General Public 3.3 4.4 4.2
One-Year Indexed Stock Performance
Price Performance (%)
1 M 6 M 1 Yr
V-Mart Retail (4.2) 64.9 130.8
Nifty Index 0.04 9.0 31.1
Source: Bloomberg
Y/E March (Rsmn) FY12 FY13 FY14 FY15E FY16E FY17E
Net sales 2,819 3,835 5,750 7,445 9,621 12,389 Growth (%) 31.2 36.0 49.9 29.5 29.2 28.8 EBITDA 283 392 538 667 882 1,148 EBITDA margin (%) 10.0 10.2 9.4 9.0 9.2 9.3 Adj. net profit 105 176 252 333 439 612 EPS (Rs) 14.3 9.8 14.0 18.5 24.4 34.1 EPS growth (%) 67.4 (31.3) 42.9 32.0 31.9 39.5 RoCE (%) 17.0 15.5 14.7 15.8 18.3 21.5 RoIC (%) 17.4 19.7 19.0 17.8 19.6 21.5 RoE (%) 21.4 17.5 15.9 18.0 19.9 22.7 P/E (x) 35.3 51.4 36.0 27.2 20.7 14.8 EV/sales (x) 1.4 2.3 1.6 1.2 1.0 0.7 EV/EBITDA (x) 14.5 22.6 17.0 13.9 10.5 8.0
Source: Company, Nirmal Bang Institutional Equities Research
60
90
120
150
180
210
240
270
300
Dec-13 Feb-14 Apr-14 Jun-14 Aug-14 Oct-14 Dec-14
V-MART RETAIL NSE CNX NIFTY INDEX
9 December 2014

Institutional Equities
V-Mart Retail
Valuation
VRL stock was listed on the bourses on 20 February 2013 and, therefore, its historical valuation charts are not relevant. It was listed at a price of Rs216, valuing the stock at 15.4x/7.3x FY14 P/E and EV/EBITDA, respectively. VRL increased its revenue by 38.8%/32.2%/34.3% CAGR and EBITDA by 40.5%/45.7%/34.4% CAGR over the past three/five/six years, respectively. Following better performance, VRL got re-rated from June 2013. Its one-year forward P/E ratio moved up from 8x in June 2013 to 22.5x currently and the one-year forward EV/EBITDA ratio rose from 4.0x to 11.5x over the same period. Since its listing at Rs216, the stock price is up 134%in 22 months. We believe that a significant re-rating can happen from the current level also.
We believe VRL stock at 14.8x/8.0x FY17E P/E and EV/EBITDA trades at a 32%-40% discount to other retailers like SSL/TL/FRL (Future Retail) which trade at 22x-31x P/E and 7x-17x EV/EBITDA. Compared to 14.8x FY17E P/E of VRL, SSL trades at 30.6x, TL trades at 21.7x and FRL trades at 23.7x. Compared to 8.0x FY17E EV/EBITDA of VRL, SSL trades at 11.9x, TL trades at 16.9x, and FRL trades at 7.3x.
VRL is one of the most efficient players in Indian retail Industry with a lean cost structure. Its lease rentals, at 4.3% of sales, are much lower compared to 8.3%/9.4%/15.1% of TL/SSL/PFRL, respectively, on a standalone basis. Similarly, employee costs at 6.7% are lower compared to 7.5%/8.3%/9.0% and other costs at 7.0% compared to 12.7%/25.2%/12.3% of SSL/TL/PFRL, respectively. Despite the focus on small cities, its revenue/sqft is higher at Rs8,878 compared to Rs8,668/Rs8,306 of SSL/PFRL, respectively. On account of its low-cost structure, VRL enjoys highest operating margin of 9.4% compared to 5.7%/2.1%/2.3%/2.8% of SSL/TL/ PFRL/Arvind’s Megamart, respectively.
VRL is among very few retail companies that have come up with a right business model and registers a healthy growth along with strong cash flow/return ratios and profitability. Its positioning as a one-stop family shop in Tier-II and Tier-III cities provides an early-mover advantage with strong scalability in these high-potential markets which are witnessing a rapid shift in consumers’ preference towards branded products. With strong execution capability, VRL plans to set up 25 stores every year compared to the past three years’ average of 17. With aggressive focus on improving inventory turnover and supply chain, working capital requirement is expected to reduce from 18.1% to 17.0% over FY14-FY17E, thereby generating a healthy operating cash flow of Rs926mn which will meet its entire capex requirement of Rs900mn to set up 75 stores (for ~Rs840mn) and modernise some of the existing stores (Rs60mn) over FY14-FY17E. Unlike the past, where because of high working capital requirement the operating cash flow was negative for two out of six years, and with cumulative operating cash flow of only Rs157mn over FY08-FY14, VRL is expected to report positive operating cash flow every year. In addition, lean net D/E ratio of 0.04x in FY14 will support aggressive growth in the long run without any need for equity dilution.
VRL witnessed a few one-offs in 2QFY15 which exerted pressure on its operating profit. As a result, we expect operating profit to grow by a mere 24.0% in FY15E as against the three-year CAGR of 40.5%. However, following healthy growth in operating profit, net profit is expected to post a 35.6% CAGR over FY15E-FY17E compared to 32.0% in FY15E. Healthy growth in net profit along with a 685bps improvement in RoCE likely over FY14-FY17E are expected to result in a strong re-rating of VRL.
Following the strength in VRL’s business model and its strong financial franchise, we expect it to trade at a premium to retail peers like SSL, TL, and PFRL. Sector average P/E of retail companies like SSL, TL and PFRL is 34.8x average FY16-FY17E earnings and 25.3x FY17E. We have valued VRL at a 20% discount to the sector average at 27x FY16-FY17E P/E. Once VRL is able to show strong execution skills, we expect its stock to command a premium compared to the sector’s valuation.
Strong revenue/net profit CAGR of 29.2%/34.4% coupled with a flat net D/E ratio of 0.04x and a 685bps improvement in RoCE at 21.5% likely over FY14-FY17E are expected to result in a strong re-rating of VRL. We have assigned Buy rating to VRL with a target price of Rs790 based on 27.0x/14.4x FY16E-FY17E average P/E and EV/EBITDA, respectively

Institutional Equities
V-Mart Retail
Exhibit 1: Comparative valuation
Mkt.
CMP Net sales EBITDA PAT EV/Sales EV/EBITDA
cap. (Rsmn) (Rsmn) (Rsmn) (x) (x)
Comparison (Rsbn) (Rs) FY14 FY15E FY16E FY17E FY14 FY15E FY16E FY17E FY14 FY15E FY16E FY17E FY14 FY15E FY16E FY17E FY14 FY15E FY16E FY17E
V-Mart 9.1 505 5,750 7,445 9,621 12,389 538 667 882 1,148 252 333 439 612 1.6 1.2 1.0 0.7 16.9 13.8 10.5 8.0
Shoppers’ Stop 41.0 494 36,594 44,933 52,518 59,634 256 1,935 2,777 3,961 (83) 223 678 1,342 1.3 1.1 0.9 0.8 184.6 24.4 17.0 11.9
Trent 49.9 1,519 22,723 23,752 28,013 34,905 171 1,258 2,144 3,068 (186) 675 1,512 2,312 2.3 2.2 1.9 1.5 303.4 41.3 24.2 16.9
Future Retail 35.2 88 NA 105,500 118,433 131,220 NA 9,858 11,397 13,048 NA 80 831 1,886 NA 0.9 0.8 0.7 NA 9.6 8.3 7.3
Bata India* 82.3 1,280 20,652 22,785 26,300 32,061 3,220 3,490 4,195 5,400 1,976 2,143 2,597 3,328 3.9 3.5 3.0 2.4 24.8 22.6 18.5 14.0
Note: * CY financials
Source: Bloomberg, Nirmal Bang Institutional Equities Research
P/E (x) RoE (%) RoCE (%) EBITDA (%) CAGR (FY14-FY17E) (%)
Comparison FY14 FY15E FY16E FY17E FY14 FY15E FY16E FY17E FY14 FY15E FY16E FY17E FY14 FY15E FY16E FY17E Sales EBITDA PAT
V-Mart 35.9 27.2 20.5 14.8 15.9 18.0 19.9 22.7 14.7 15.8 18.3 21.5 9.4 9.0 9.2 9.3 29.2 28.7 34.4
Shoppers’ Stop - 186.7 60.7 30.6 (24.2) 4.4 12.3 20.8 (7.2) 1.8 5.6 9.1 0.7 4.3 5.3 6.6 17.7 149.1 -
Trent - 74.3 32.9 21.7 (1.7) 5.6 11.2 14.9 (0.9) 3.8 7.1 9.2 0.8 5.3 7.7 8.8 15.4 161.8 -
Future Retail - - 38.9 23.7 NA 0.1 2.2 3.6 (7.5) 3.4 4.3 6.0 NA 9.3 9.6 9.9 - - -
Bata India* 41.7 38.4 31.7 24.7 25.7 23.5 24.1 25.8 25.3 23.5 24.1 25.8 15.6 15.3 16.0 16.8 15.8 18.8 19.0
Note: * CY financials
Source: Bloomberg, Nirmal Bang Institutional Equities Research
Exhibit 2: One-year forward EV/EBITDA Exhibit 3: EV/EBITDA
Source: Bloomberg, Nirmal Bang Institutional Equities Research Source: Bloomberg, Nirmal Bang Institutional Equities Research
Exhibit 4: One-year forward P/E Exhibit 5: P/E
Source: Bloomberg, Nirmal Bang Institutional Equities Research Source: Bloomberg, Nirmal Bang Institutional Equities Research
2
3
4
5
6
7
8
9
10
11
12
Ma
r-1
3
Ap
r-1
3
Ma
y-1
3
Jun
-13
Jul-1
3
Au
g-1
3
Se
p-1
3
Oct
-13
No
v-1
3
De
c-1
3
Jan
-14
Fe
b-1
4
Ma
r-1
4
Ap
r-1
4
Ma
y-1
4
Jun
-14
Jul-1
4
Au
g-1
4
Se
p-1
4
Oct
-14
No
v-1
4
De
c-1
4
(Rsbn)
14x
6x
12x
8x
10x
0
2
4
6
8
10
12
14
Ma
r-1
3
Ap
r-1
3
Ma
y-1
3
Jun
-13
Jul-1
3
Au
g-1
3
Se
p-1
3
Oct
-13
No
v-1
3
De
c-1
3
Jan
-14
Fe
b-1
4
Ma
r-1
4
Ap
r-1
4
Ma
y-1
4
Jun
-14
Jul-1
4
Au
g-1
4
Se
p-1
4
Oct
-14
No
v-1
4
De
c-1
4
(x)
Median 7.1
100
150
200
250
300
350
400
450
500
550
600
Ma
r-1
3
Ap
r-1
3
Ma
y-1
3
Jun
-13
Jul-1
3
Au
g-1
3
Se
p-1
3
Oct
-13
No
v-1
3
De
c-1
3
Jan
-14
Fe
b-1
4
Ma
r-1
4
Ap
r-1
4
Ma
y-1
4
Jun
-14
Jul-1
4
Au
g-1
4
Se
p-1
4
Oct
-14
No
v-1
4
De
c-1
4
(Rs)
14x
23x
26x
20x
11x
17x
6
8
10
12
14
16
18
20
22
24
26
28
Ma
r-1
3
Ap
r-1
3
Ma
y-1
3
Jun
-13
Jul-1
3
Au
g-1
3
Se
p-1
3
Oct
-13
No
v-1
3
De
c-1
3
Jan
-14
Fe
b-1
4
Ma
r-1
4
Ap
r-1
4
Ma
y-1
4
Jun
-14
Jul-1
4
Au
g-1
4
Se
p-1
4
Oct
-14
No
v-1
4
De
c-1
4
(x)
Median 14.0

Institutional Equities
V-Mart Retail
Exhibit 6: One-year forward P/BV Exhibit 7: P/BV
Source: Bloomberg, Nirmal Bang Institutional Equities Research Source: Bloomberg, Nirmal Bang Institutional Equities Research
Exhibit 8: Comparative EV/EBITDA Exhibit 9: Comparative EV/sales
Source: Bloomberg, Nirmal Bang Institutional Equities Research Source: Bloomberg, Nirmal Bang Institutional Equities Research
(50)
50
150
250
350
450
550
650
Ma
r-1
3
Ap
r-1
3
Ma
y-1
3
Jun
-13
Jul-1
3
Au
g-1
3
Se
p-1
3
Oct
-13
No
v-1
3
De
c-1
3
Jan
-14
Fe
b-1
4
Ma
r-1
4
Ap
r-1
4
Ma
y-1
4
Jun
-14
Jul-1
4
Au
g-1
4
Se
p-1
4
Oct
-14
No
v-1
4
De
c-1
4
(Rs)
4x
1x
2x
5x
3x
0
1
2
3
4
5
Ma
r-1
3
Ap
r-1
3
Ma
y-1
3
Jun
-13
Jul-1
3
Au
g-1
3
Se
p-1
3
Oct
-13
No
v-1
3
De
c-1
3
Jan
-14
Fe
b-1
4
Ma
r-1
4
Ap
r-1
4
Ma
y-1
4
Jun
-14
Jul-1
4
Au
g-1
4
Se
p-1
4
Oct
-14
No
v-1
4
De
c-1
4
(x)
Median 2.2
0
5
10
15
20
25
30
35
40
45
50
Dec
-09
Mar
-10
Jun-
10
Sep
-10
Dec
-10
Mar
-11
Jun-
11
Sep
-11
Dec
-11
Mar
-12
Jun-
12
Sep
-12
Dec
-12
Mar
-13
Jun-
13
Sep
-13
Dec
-13
Mar
-14
Jun-
14
Sep
-14
Dec
-14
(x)
SS-EV/EBITDA V-Mart-EV/EBITDA
0.0
0.5
1.0
1.5
2.0
2.5
Dec
-09
Mar
-10
Jun-
10
Sep
-10
Dec
-10
Mar
-11
Jun-
11
Sep
-11
Dec
-11
Mar
-12
Jun-
12
Sep
-12
Dec
-12
Mar
-13
Jun-
13
Sep
-13
Dec
-13
Mar
-14
Jun-
14
Sep
-14
Dec
-14
(x)
Trent-EV/Sales SS-EV/Sales V-Mart-EV/Sales

Institutional Equities
V-Mart Retail
Investment Arguments
Efficient control over costs, including lease rentals, compared to Indian peers
We believe VRL is one of most efficient players in Indian retail Industry. Its cost structure, whether it is lease rentals, employee costs or other costs, is one of the lowest in the industry. As most of VRL’s stores are located in Tier-II and Tier-III cities, its lease rentals are lower at Rs28/sqft/month compared to Indian peers who generally operate in metro and Tier-I cities. VRL’s lease rentals are at 4.3% of sales, compared to 8.3% of TL, 9.4% of SSL and 15.1% of PFRL on a standalone basis. Besides the location advantage, VRL has signed long-term lease agreements for 9-12 years with escalation costs of 10%-12% every three years. Similarly, its employee costs at 6.7% of sales are lower than 7.5%/8.3%/9.0% of SSL/TL/PFRL respectively and, other costs at 7.0% are also lower compared to 12.7%/25.2%/12.3% of SSL/TL/PFRL respectively.
Despite the focus on Tier-II and III cities, its revenue/sqft is higher at Rs8,878 compared to Rs8,668 of SSL and Rs8,306 of PFRL. As VRL is focusing on volume with low ticket-size items, its gross margin at 29.8% is lower than 37.7%/46.6%/42.7% of SSL/TL/PFRL, respectively.
If we compare VRL with its peers, VRL has lowest gross margin of 30% whereas gross margins of SSL, TL and PFRL are in the range of 37%-46%. Despite a lower gross margin, VRL has higher EBITDA margin of more than 9% compared to peers.
With low-cost operations, other expenses at 7.0% of sales for VRL are much lower than 12.7%/25.2%/12.3%
of SSL/TL/PFRL, respectively. Of the 12.7% other expenses of SSL, 9% is on account of building repairs against 2%-3% of VRL. While out of 25.2% other expenses of TL, 17% is because of retail business fee as against nil in case of VRL. Lower lease rentals, employee costs and lower other expenses help VRL in reporting higher EBITDA margin.
On account of its low-cost structure, even in a challenging environment of FY14, VRL enjoyed highest operating margin of 9.4% compared to 5.7%/2.1%/2.3%/2.8% of SSL/TL/PFRL/Arvind’s Megamart, respectively.
Exhibit 10: Lean lease rentals of VRL Exhibit 11: Lease rentals as a percentage of sales
Source: Company, Industry, Nirmal Bang Institutional Equities Research Source: Company, Industry, Nirmal Bang Institutional Equities Research
Exhibit 12: Lowest cost strucure of VRL
Standalone FY12 FY13 FY14
VRL SSL TL PFRL VRL SSL TL PFRL VRL SSL TL PFRL
Gross margin (%) 29.1 37.3 45.7 NA 29.7 37.6 47.7 39.7 29.7 37.7 46.6 42.7
Employee costs (%) 6.0 6.6 8.3 NA 6.5 7.1 7.8 7.3 6.7 7.5 8.3 9.0
Lease rentals (%) 4.9 9.3 6.8 NA 4.4 9.6 6.8 12.7 4.3 9.4 8.3 15.1
A&P spending (%) 1.8 2.6 6.2 NA 2.1 2.9 3.0 3.3 2.4 2.5 2.7 4.0
Others costs (%) 6.3 11.5 26.0 NA 6.5 12.4 25.0 6.4 7.0 12.7 25.2 12.3
EBITDA (%) 10.0 7.4 (1.6) NA 10.2 5.6 5.0 10.1 9.4 5.7 2.1 2.3
Source: Company, Industry, Nirmal Bang Institutional Equities Research
30
2628 28 28
32 34
37
42
(13.6)
10.8
(0.1)(1.8)
16.2
3.9 11.1
11.7
(14)(12)(10)(8)(6)(4)(2)0 2 4 6 8 10 12 14 16
0
5
10
15
20
25
30
35
40
45
FY09 FY10 FY11 FY12 FY13 FY14 FY15E FY16E FY17E
Monthly lease rent (Rs/sqft) Growth (%)
(Rs/sqft) (%)
6.6 6.9
5.5 4.9
4.4 4.3
9.4 10.3 9.8
9.2 9.3 9.6 9.4
3.2
5.6 5.7
5.9 6.8
6.8
8.3
12.7
15.1
0
2
4
6
8
10
12
14
16
FY08 FY09 FY10 FY11 FY12 FY13 FY14
(%)
VRL SSL TL PFRL

Institutional Equities
V-Mart Retail
Exhibit 13: Higher revenue/sqft Exhibit 14: EBITDA margin of VRL and its peers
Source: Company, Industry, Nirmal Bang Institutional Equities Research Source: Company, Industry, Nirmal Bang Institutional Equities Research
Cluster-based approach to improve inventory turnover
In view of the key risk involved with managing inventory in a dynamic environment, one of the most effective measures undertaken by businesses is to manage inventory at the store level and not allow it to escalate and affect the business.
VRL follows a cluster-based approach in setting up a store i.e. opening of a new store within a radius of 100km-150km from its existing store. As changing fashion trends can lead to inventory erosion, the cluster-based approach helps VRL in inter-store stock movement and easy stock rotation from its stores. Being entirely focused on Tier-II and Tier-III cities, VRL easily rotates out-of fashion stock within the vicinity of nearby stores as semi-urban areas tend to catch up with the changing fashion trend at a lower pace compared to the Tier-I cities. This is the main reason for retailers in metro cities and Tier-I cities as they face difficulty in rotating their stocks leads to high inventory risk. Utter Pradesh (UP) and Bihar are the main clusters for VRL contributing 66% to its total store count. Out of total 106 stores, VRL has 50 stores in UP alone followed by 20 stores in Bihar and yet there is scope to expand into existing clusters. To cite an example, VRL set up its latest 105th store in Hussainganj, UP and 106th store in Kishanganj, Bihar.
Cluster-based approach yielded enhanced brand with a strong regional recall, better understanding of regional fashion trends, higher inventory churn, less dead stock, maximised regional advertisement spending and better human resource management.
Reduction in inventory because of shoplifting, theft by employees, organised retail crime, administrative errors, write-off of dead stock and supplier fraud are all known as shrinkage. It is accounted under ‘cost of goods sold’. VRL has a team of auditors which undertakes audit at the store level at regular intervals and provides feedback regarding store operations, cost management, inventory management etc.VRL had a policy of measuring physical inventory once every year and twice in 18 months in the past. Generally, the company indulges in stock-taking in the second or fourth quarter. This led the shrinkage ratio to move up in those quarters when actual stock-taking took place. However, now that it is measuring inventory every quarter, the fluctuations in shrinkage ratio will be at a bare minimum. VRL’s stringent policy on inventory quality led to a rise in shrinkage, as a percentage of sales, in recent years. Shrinkage ratio increased to 4.1% in 4QFY14 as against 2.1% in 4QFY13 and 1.5%/0.9% in 1QFY15/2QFY15, up 50bps/10bps YoY, respectively. As VRL recently competed its auditing exercise, we expect that going forward the shrinkage ratio will reduce.
Most of the players like SSL follow a consignment-based approach when the product inventory lies in the books of brand owners and not in the books of the retail chain, resulting in lower inventory days for retailers. However, VRL does full buyout of inventory and, therefore, take ownership of full inventory. As a result, currently, VRL is not the lowest working capital player, with PFRL at 6%, SSL at 14% followed by VRL at 18%, mainly because of high closing inventory days, at 150 in FY14. VRL assigned its warehouse management to a Singapore-based logistics company, APL Logistics, which indicates VRL’s seriousness in maintaining tight inventory management, the operational benefit of it will be visible from 2HFY15 onwards. Because of stringent controls, the company has been able to reduce its inventory days from 198 in FY10 to 150 in FY14. Consequently, the overall working capital cycle declined from 29.2% of sales in FY10 to 18.1% of sales in FY14.
5,605 5,424
4,388
6,069
6,768
7,904
8,878
9,704 9,373
8,408
9,404 9,385 9,227
8,668
7,560
8,306
4,000
5,000
6,000
7,000
8,000
9,000
10,000
FY08 FY09 FY10 FY11 FY12 FY13 FY14
(Rs/sqft)
VRL SSL (standalone) PFRL (standalone)
9.3
5.7
8.29.0
10.0 10.2
9.4
5.1
3.3
7.99.0 7.4
5.6 5.7
3.2
1.3
5.8 4.9
(1.6)
5.0
2.1
(2)
0
2
4
6
8
10
FY08 FY09 FY10 FY11 FY12 FY13 FY14
(%)
VRL SSL TRL PFRL

Institutional Equities
V-Mart Retail
VRL, in association with APL Logistics, is working in areas like planning, procurement, warehouse management, replenishment and distribution to improve its supply chain. The company has adopted an integrated pro-active and reactive approach to manage its supply chain in which the supply schedule is based on forecasted demand after taking into account factors like average daily sales of all stores, projected sales, festivals and seasons, lead time for replenishment, buffer stock and re-order level. The kind of supply chain formulated by the company helps in adapting to the changing patterns in customer behaviour. To further ensure a better control over supply chain management, the company has its own two distribution centres in NCR (national capital region). As per policy, the company centrally procures apparel and non-apparel products for quality check and then distributes them to all locations. All FMCG products are sold directly from the vendor to the VRL’s outlets. The merchandise and procurement planning, supply chain management and distribution network enables VRL to have a shorter business cycle, thereby resulting in efficient working capital management. We expect VRL to improve its inventory turnover further to 145 days in FY17E from 150 days in FY14 and reduce its working capital cycle from 18.1% of sales in FY14 to 17.0% of sales in FY17E.
Exhibit 15: Working capital needs as a percentage of sales Exhibit 16: Improvement in working capital efficiency
Source: Company, Industry, Nirmal Bang Institutional Equities Research Source: Company, Nirmal Bang Institutional Equities Research
Note: Inventory is as on end of date
Exhibit 17: Shrinkage ratio Exhibit 18: Ex-cash WC as % of sales for VRL and peers
Source: Company, Industry, Nirmal Bang Institutional Equities Research Source: Company, Industry, Nirmal Bang Institutional Equities Research
Note: Unlike VRL, a few retailers follow the consignment model and, therefore, their inventory days are on the lower side.
Healthy operating cash flow, lean D/E ratio to support growth and return ratios
VRL increased its revenue at a strong pace of 38.8%/32.2%/34.3% CAGRs over the past three/five/six years, respectively, at Rs5,750mn in FY14 on the back of continuous store addition and healthy same-store sales growth. Following a healthy revenue CAGR of 29.2%, we expect EBITDA to post a 28.7% CAGR over FY14-FY17E.
Because of stringent controls, VRL has been able to reduce its inventory days from 198 in FY10 to 150 in FY14. Consequently, overall working capital cycle declined from 29.2% of sales in FY10 to 18.1% of sales in FY14. We expect VRL to improve its inventory turnover further to 145 days in FY17 from 150 days in FY14, thereby leading to a decline in the working capital cycle - from 18.1% in FY14 to 17.0% in FY17E.
On account of high working capital cycle, operating cash flow was negative for two years out of the past six years, with cumulative operating cash flow of only Rs157mn in FY08-FY14.
219
417 421532 573
768
1,040
1,313
1,651
2,107
22.4
29.3 29.2
24.8
20.320.0
18.117.6
17.2 17.0
16
18
20
22
24
26
28
30
0
200
400
600
800
1,000
1,200
1,400
1,600
1,800
2,000
2,200
FY08 FY09 FY10 FY11 FY12 FY13 FY14 FY15E FY16E FY17E
(%)(Rsmn)
Working capital ex-cash WC as % sales (RHS)
142 157154
126
110 111 105 103 101 101
195 190198
169158
150 150 147 145 145
54
3344 43 48
39 44 44 44 44
0
20
40
60
80
100
120
140
160
180
200
FY08 FY09 FY10 FY11 FY12 FY13 FY14 FY15E FY16E FY17E
(days)
Working capital days Inventory days Credotir days
1.51.7
0.4
2.1
1.00.8 0.8
4.1
1.5
0.9
0.0
0.9 0.8 0.8
1.61.4
1.6 1.51.2
1.0
0.0
0.5
1.0
1.5
2.0
2.5
3.0
3.5
4.0
4.5
1Q
FY
13
2Q
FY
13
3Q
FY
13
4Q
FY
13
1Q
FY
14
2Q
FY
14
3Q
FY
14
4Q
FY
14
1Q
FY
15
2Q
FY
15
FY
08
FY
09
FY
10
FY
11
FY
12
FY
13
FY
14
FY
15
E
FY
16
E
FY
17
E
(%)
22.4
29.3 29.224.8
20.3 20.0 18.1
14.46.8 6.6
14.7 14.4 14.5 13.7
22.6
59.855.4
67.6
59.5
43.3
32.8
7.0 6.2
0
10
20
30
40
50
60
70
80
FY08 FY09 FY10 FY11 FY12 FY13 FY14
VRL SSL TRL PFRL
(%)

Institutional Equities
V-Mart Retail
However, with lower working capital coupled with healthy revenue growth, VRL is expected to have positive operating cash flow in all years in FY14-FY17 with cumulative operating cash flow of Rs926mn, which will meet its entire capex requirement of Rs900mn to set up 75 stores (for ~Rs840mn) and modernisation of some of the existing outlets over FY14-FY17E. Therefore, despite aggressive growth, net D/E ratio is expected to remain flat at 0.04x.
VRL had raised Rs842.3mn through an initial public offer (IPO) of equity shares in February 2013. It spent Rs727.04mn to meet the objectives of the IPO and the balance sum stands at Rs187.03mn, including reserves. The company opens new store with a total area of around 8,000 sqft and incurs capex of about Rs1,400-Rs1,450/sqft. For setting up 25 new stores, the capex is estimated at Rs290mn in FY15E. VRL set up 23 stores in FY14 with a capex of Rs291mn. The funds for setting up a new store will be met from IPO proceeds, internal accruals and by availing debt, if required. The net D/E ratio improved from 1.5x in FY08 to 0.04x in FY14. The management has given guidance of keeping the D/E ratio below 0.75x going forward. With sufficient funds (IPO proceeds and internal accruals), the company does not require any additional debt in FY15 to add 25 stores. However, with the addition of new stores in the coming years, the company has to fund a part of its capex requirement through debt.
We expect VRL to incur capex of Rs900mn to set up 75 stores (for ~Rs840mn) and modernise some of the existing outlets over FY14-FY17E. In addition, it will need cumulative additional working capital of Rs1,068mn over FY14-FY17E. It has cash and liquid investments of Rs366mn in FY14 and is expected to generate healthy operating cash flow of Rs926mn (Rs838mn excluding dividend) over FY14-FY17E and, therefore, will require additional debt of a mere Rs62mn. Hence, despite aggressive store addition, net D/E ratio is expected to remain flat at 0.04x in FY17E.
VRL’s RoCE is suppressed currently on account of Rs342mn deployed in liquid investments out of Rs842mn raised from the IPO. We expect these liquid investments to be utilised for meeting future capex. As a result, capital employed is expected to grow by a mere 15.6% against EBIT CAGR of 30.2% over FY14-FY17E. This is expected to result in a 685bps improvement in RoCE - from 14.7% to 21.5% over FY14-FY17E - leading to a strong re-rating of VRL.
Exhibit 19: Healthy operating cash flow Exhibit 20: Continues to maintain lean net D/E ratio
Source: Company, Industry, Nirmal Bang Institutional Equities Research Source: Company, Industry, Nirmal Bang Institutional Equities Research
Exhibit 21: Healthy return ratios Exhibit 22: EBIT versus growth in capital employed
Source: Company, Industry, Nirmal Bang Institutional Equities Research Source: Company, Industry, Nirmal Bang Institutional Equities Research
(85)
(155)
60
(3)
120
61 74
211
310
405
(200)
(100)
0
100
200
300
400
FY08 FY09 FY10 FY11 FY12 FY13 FY14 FY15E FY16E FY17E
(Rsmn)
Net cash from operations
184
270 271
363381
(214)
70
183204
131
1.5
0.8 0.7 0.8
0.7
(0.1)
0.0 0.1 0.1 0.0
(0.2)
0.0
0.2
0.4
0.6
0.8
1.0
1.2
1.4
1.6
(250)
(200)
(150)
(100)
(50)
0
50
100
150
200
250
300
350
400
FY08 FY09 FY10 FY11 FY12 FY13 FY14 FY15E FY16E FY17E
(x)(Rsmn)
Net debt D/E (RHS)
6.27.7
12.9
17.0
15.514.7
15.8
18.3
21.5
4.46.4
15.4
21.4
17.5
15.9
18.0
19.9
22.7
4
6
8
10
12
14
16
18
20
22
FY09 FY10 FY11 FY12 FY13 FY14 FY15E FY16E FY17E
RoCE RoE RoIC
(%)
53.1
89.2
54.1
40.9 35.9
22.7
35.0 33.2
3.3
23.9
15.3
93.9
17.0 16.7
10.3 15.7
0
10
20
30
40
50
60
70
80
90
100
FY10 FY11 FY12 FY13 FY14 FY15E FY16E FY17E
(%)
EBIT growth Capital employed growth

Institutional Equities
V-Mart Retail
Ready to leapfrog with right business model
There are a very few retail companies which have a right business model, best product mix, appropriate location/store size and control over costs. There are many companies which are struggling to have a right business model. To cite an example, Arvind launched its retail store MegaMart as a discount store in FY09, but it is still struggling with the business model. The number of MegaMart stores is down from 216 in FY12 to 186 in 1HFY15. In order to make it viable, Arvind is in the process of re-positioning MegaMart from a discount store to a value retailing outlet. Similarly, TL is repositioning its Westside stores as value-offering stores. In contrast to these, over the past decade, VRL came up with a right business model with the right product mix, right location with right size and that too with a control over operating costs. As its business model is well established, VRL needs to channelise its efforts to scale it up to a new level, at a time when its competitors are struggling for a right business model, and channelise its efforts to fine tune its business model.
VRL developed strong execution capability in setting up stores in different cities. The success of strong execution is backed by the strategically developed back-end operations like supply chain, product sourcing from more than 1,500 vendors (non FMCG), ERP (Enterprise Resource Planning) and other related works which created a backbone for the company in aggressively setting up new outlets. The company’s philosophy is to open cluster-based stores within a 100km-150km area. This strategy helped VRL in developing strong back-end operations because the company can develop strong relationships with its suppliers, as most of its stores are present in the nearby area.
The company’s ERP-backed supply chain management system comprises planning, merchandising, sourcing, standardisation, vendor management, logistics, quality control, pilferage control, replacement and replenishment. As an efficient supply chain system is the backbone of retail operations, the company has been able to strike an optimum balance between adequate level of inventory while ensuring availability of products at all stores as per customer needs as well as reducing operational costs.
Strong low-cost procurement network comprising more than 1,500 vendors
VRL has more than 1,500 dedicated vendors and suppliers (~2,500 including FMCG vendors) for supply of apparel, general fashion merchandise goods and raw materials. The company sources hosiery and hosiery-based apparel from Tirupur, cotton apparel from Ahmedabad, denim from Delhi, kids-wear from Kolkata, knitting from Ludhiana, the latest fashion trends from Mumbai and plastics products from Daman among other places in India. VRL directly and indirectly procures products from overseas markets such as China and South East Asia. While apparel and accessories are procured centrally to be warehoused at NCR for quality control purpose, FMCG products are procured from distributors of major FMCG companies. In addition, the company also engages job work entities to manufacture apparel, as per the laid-out requirements. Such job work arrangement gives a significant advantage to VRL in terms of quality of products and pricing.
The strong execution is attributed to the fact that in the past three years, VRL doubled its store count by adding 50 store outlets. With strong execution capability and supply chain, the company is aiming to set up 25 new stores every year from the earlier average of 17 stores per year in the past three years. We expect VRL to grow its retail business at a 20.0% CAGR over FY14-FY17E at 1.25mn sqft by setting up 75 stores on a base of 89 stores in FY14.
Exhibit 23: Number of stores and growth rate Exhibit 24: Total retail space (‘000 sqft) and growth rate
Source: Company, Nirmal Bang Institutional Equities Research Source: Company, Nirmal Bang Institutional Equities Research
22
37 40 45 55
69
89
111
133
155
68.2
8.1 12.522.2
25.5 29.0
24.7 19.8 16.5
0
10
20
30
40
50
60
70
80
-
20
40
60
80
100
120
140
160
180
FY08 FY09 FY10 FY11 FY12 FY13 FY14 FY15E FY16E FY17E
(%)
Total stores Growth (RHS)
211 315 333 365
456 558
726
902
1,078
1,254
48.7
5.79.9
24.8 22.430.1
24.219.5
16.3
0
10
20
30
40
50
60
-
200
400
600
800
1,000
1,200
1,400
FY08 FY09 FY10 FY11 FY12 FY13 FY14 FY15E FY16E FY17E
('000 sq.ft.)
Total retail space Growth (RHS)
(%)

Institutional Equities
V-Mart Retail
Healthy same-store sales growth
Most shops in small towns work for a limited number of hours and generally close in the afternoon, and also have weekly off. VRL stores, on the other hand, are open 13 hours a day, seven days of the week, 365 days of the year. Acceptance of debit and credit cards, and shopping vouchers are the other benefits offered. Over the past six years (FY08-FY14), the company has been able to grow its income per store at a CAGR of 8.6% to Rs73mn. However, SSG (same store sales growth) has been more than 10% in the past two years. The company achieved SSG (stores operating for more than one year) of 14.0% in FY13 and 11.5% in FY14. The key reason for the dip in SSG in FY14 was the change in strategy. The company noticed that customers were ready to pay a higher price if offered high-quality goods. Based on this, its strategy witnessed a shift toward high-value items. This is visible from the increase in average ticket size by 17.8% in FY14. This shift led to an initial dip in volume, which is expected to bear fruit in terms of an uptick going forward. As it gains more popularity, this growth is expected to continue in the future as well. As modern shopping outlet is a new concept in small towns, barring FY15, VRL is expected to grow in SSG terms at 10% over the next three years.
Exhibit 25: Same-store sales growth Exhibit 26: Average ticket size
Source: Company, Nirmal Bang Institutional Equities Research Source: Company, Nirmal Bang Institutional Equities Research
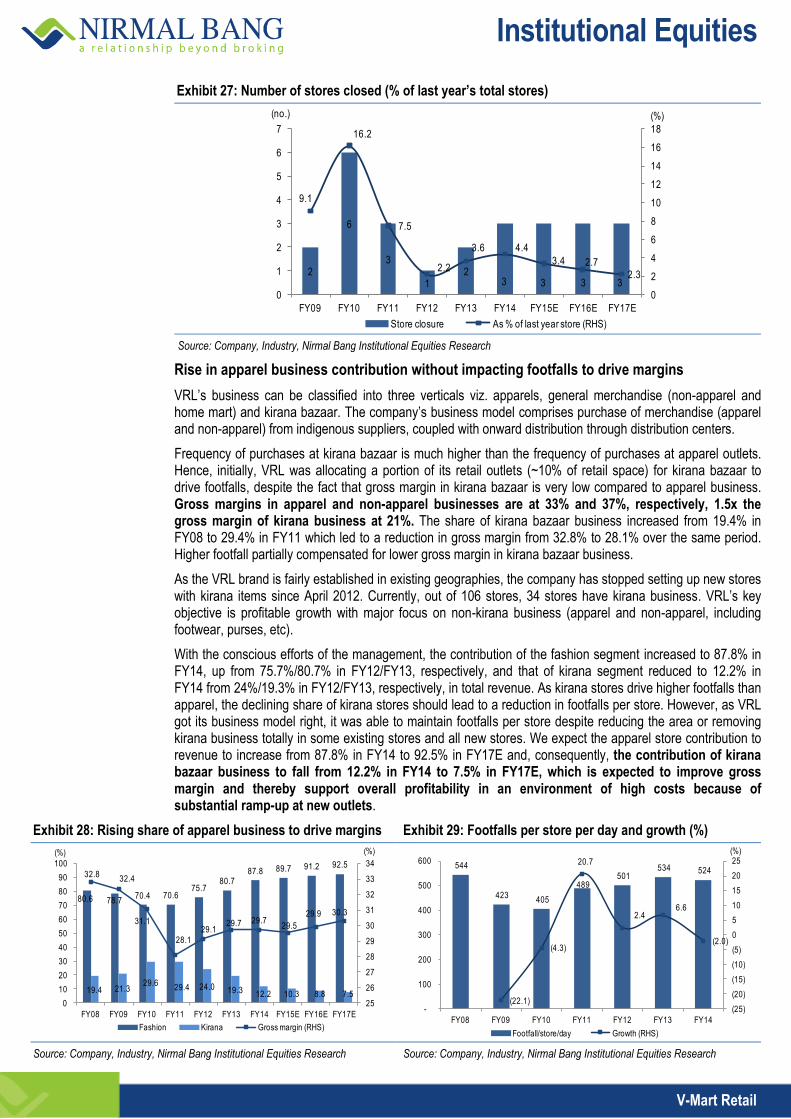
Lower number of store closure to reduce capex
VRL has been expanding its store network at a consistent pace. Its store strength grew from 22 in FY08 to 89 in FY14 with total retail space increasing from 0.211mn sqft to 0.726mn sqft. VRL currently has a strong presence in Uttar Pradesh, Uttarakhand, Bihar and Jharakhand with total 80 stores. It also has a significant presence in the northern states of Delhi, Punjab, Haryana and Rajasthan with a tota1 12 stores. VRL plans to continue its expansion into other nearby territories besides growing in the states where it already has a presence. The capex requirement for a store is Rs1,400-Rs1,450 per sqft in Tier-II and Tier-III cities as
against Rs4,000/sqft in Tier-I cities, where most of VRL’s peers are present.
The company’s key focus area is store performance and it has set stringent benchmarks for continuation of new stores. In case any store does not perform, corrective measures are taken to restructure the operations like cost control, improvement in product mix etc. It takes only two months to break-even for a new store at a variable level. Generally, a store matures in five years and after that the management modifies its interior decor to improve SSG. If any store is not profitable for more than 18 months, it is shut. VRL has shut 16 stores in all, out of which 3 stores were in FY14. Out of three stores that were shut in FY14, only one was shut because of subdued profitability. The remaining two stores were more than nine years old and came for lease rental renewal, but because of high rentals demanded by landowners these two stores were shut.
In the past three years, VRL closed only six stores - a mere 10% of 50 stores set up and 6.7% of total 89 stores in FY14. An established retailer, Bata India (BIL), closed 170 stores in the past three years, which is 42% of 409 stores set up and 11% of store count of 1,498 stores in CY13. It indicates VRL’s ability to keep store closure under check.
With a lower number of store closure and low requirement of capex per sqft, there is a reduction in capex burden on the balance sheet. The company plans to add 25 new stores each year over the next three years and we expect new stores to drive future revenue growth.
10.2
7.0
14.0
11.5
6.0
10.0 10.0
8.0
12.612.0
8.08.8
0.5
0
2
4
6
8
10
12
14
FY
11
FY
12
FY
13
FY
14
FY
15
E
FY
16
E
FY
17
E
1Q
FY
14
2Q
FY
14
3Q
FY
14
4Q
FY
14
1Q
FY
15
2Q
FY
15
(%)
467 485
382 400436
489
576
3.7
(21.2)
4.6
9.2
12.1
17.8
(24)
(20)
(16)
(12)
(8)
(4)
0
4
8
12
16
20
0
100
200
300
400
500
600
FY08 FY09 FY10 FY11 FY12 FY13 FY14
(%)(Rs)
Average ticket size Growth (RHS)
Institutional Equities
V-Mart Retail
Exhibit 27: Number of stores closed (% of last year’s total stores)
Source: Company, Industry, Nirmal Bang Institutional Equities Research
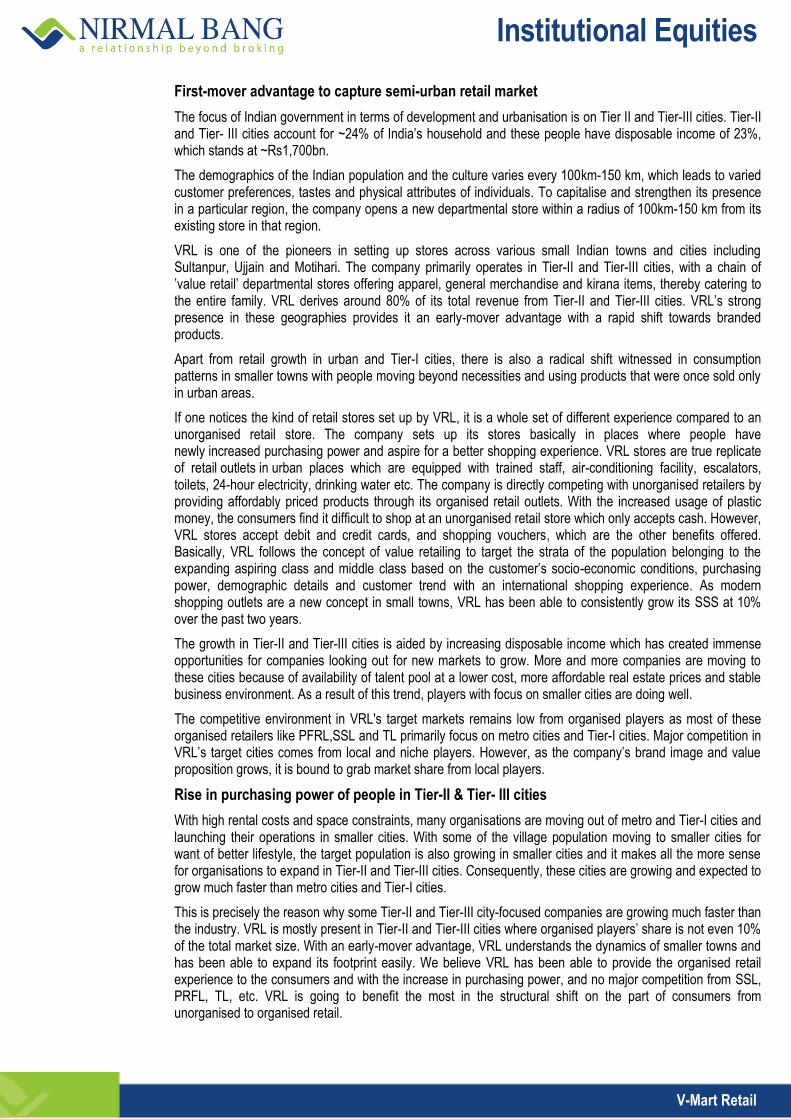
Rise in apparel business contribution without impacting footfalls to drive margins
VRL’s business can be classified into three verticals viz. apparels, general merchandise (non-apparel and home mart) and kirana bazaar. The company’s business model comprises purchase of merchandise (apparel and non-apparel) from indigenous suppliers, coupled with onward distribution through distribution centers.
Frequency of purchases at kirana bazaar is much higher than the frequency of purchases at apparel outlets. Hence, initially, VRL was allocating a portion of its retail outlets (~10% of retail space) for kirana bazaar to drive footfalls, despite the fact that gross margin in kirana bazaar is very low compared to apparel business. Gross margins in apparel and non-apparel businesses are at 33% and 37%, respectively, 1.5x the gross margin of kirana business at 21%. The share of kirana bazaar business increased from 19.4% in FY08 to 29.4% in FY11 which led to a reduction in gross margin from 32.8% to 28.1% over the same period. Higher footfall partially compensated for lower gross margin in kirana bazaar business.
As the VRL brand is fairly established in existing geographies, the company has stopped setting up new stores with kirana items since April 2012. Currently, out of 106 stores, 34 stores have kirana business. VRL’s key objective is profitable growth with major focus on non-kirana business (apparel and non-apparel, including footwear, purses, etc).
With the conscious efforts of the management, the contribution of the fashion segment increased to 87.8% in FY14, up from 75.7%/80.7% in FY12/FY13, respectively, and that of kirana segment reduced to 12.2% in FY14 from 24%/19.3% in FY12/FY13, respectively, in total revenue. As kirana stores drive higher footfalls than apparel, the declining share of kirana stores should lead to a reduction in footfalls per store. However, as VRL got its business model right, it was able to maintain footfalls per store despite reducing the area or removing kirana business totally in some existing stores and all new stores. We expect the apparel store contribution to revenue to increase from 87.8% in FY14 to 92.5% in FY17E and, consequently, the contribution of kirana bazaar business to fall from 12.2% in FY14 to 7.5% in FY17E, which is expected to improve gross margin and thereby support overall profitability in an environment of high costs because of substantial ramp-up at new outlets.
Exhibit 28: Rising share of apparel business to drive margins Exhibit 29: Footfalls per store per day and growth (%)
Source: Company, Industry, Nirmal Bang Institutional Equities Research Source: Company, Industry, Nirmal Bang Institutional Equities Research
2
6
3
12
3 3 3 3
9.1
16.2
7.5
2.2
3.6 4.4
3.4 2.7 2.3
0
2
4
6
8
10
12
14
16
18
0
1
2
3
4
5
6
7
FY09 FY10 FY11 FY12 FY13 FY14 FY15E FY16E FY17E
(%)(no.)
Store closure As % of last year store (RHS)
80.6 78.770.4 70.6
75.780.7
87.8 89.7 91.2 92.5
19.4 21.329.6
29.4 24.0 19.3 12.2 10.3 8.8 7.5
32.832.4
31.1
28.1
29.129.7 29.7
29.5
29.9 30.3
25
26
27
28
29
30
31
32
33
34
0
10
20
30
40
50
60
70
80
90
100
FY08 FY09 FY10 FY11 FY12 FY13 FY14 FY15E FY16E FY17E
(%)
Fashion Kirana Gross margin (RHS)
(%)
544
423 405
489 501
534 524
(22.1)
(4.3)
20.7
2.4 6.6
(2.0)
(25)
(20)
(15)
(10)
(5)
0
5
10
15
20
25
-
100
200
300
400
500
600
FY08 FY09 FY10 FY11 FY12 FY13 FY14
(%)
Footfall/store/day Growth (RHS)
Institutional Equities
V-Mart Retail
First-mover advantage to capture semi-urban retail market
The focus of Indian government in terms of development and urbanisation is on Tier II and Tier-III cities. Tier-II and Tier- III cities account for ~24% of India’s household and these people have disposable income of 23%, which stands at ~Rs1,700bn.
The demographics of the Indian population and the culture varies every 100km-150 km, which leads to varied customer preferences, tastes and physical attributes of individuals. To capitalise and strengthen its presence in a particular region, the company opens a new departmental store within a radius of 100km-150 km from its existing store in that region.
VRL is one of the pioneers in setting up stores across various small Indian towns and cities including Sultanpur, Ujjain and Motihari. The company primarily operates in Tier-II and Tier-III cities, with a chain of ’value retail’ departmental stores offering apparel, general merchandise and kirana items, thereby catering to the entire family. VRL derives around 80% of its total revenue from Tier-II and Tier-III cities. VRL’s strong presence in these geographies provides it an early-mover advantage with a rapid shift towards branded products.
Apart from retail growth in urban and Tier-I cities, there is also a radical shift witnessed in consumption patterns in smaller towns with people moving beyond necessities and using products that were once sold only in urban areas.
If one notices the kind of retail stores set up by VRL, it is a whole set of different experience compared to an unorganised retail store. The company sets up its stores basically in places where people have newly increased purchasing power and aspire for a better shopping experience. VRL stores are true replicate of retail outlets in urban places which are equipped with trained staff, air-conditioning facility, escalators, toilets, 24-hour electricity, drinking water etc. The company is directly competing with unorganised retailers by providing affordably priced products through its organised retail outlets. With the increased usage of plastic money, the consumers find it difficult to shop at an unorganised retail store which only accepts cash. However, VRL stores accept debit and credit cards, and shopping vouchers, which are the other benefits offered. Basically, VRL follows the concept of value retailing to target the strata of the population belonging to the expanding aspiring class and middle class based on the customer’s socio-economic conditions, purchasing power, demographic details and customer trend with an international shopping experience. As modern shopping outlets are a new concept in small towns, VRL has been able to consistently grow its SSS at 10% over the past two years.
The growth in Tier-II and Tier-III cities is aided by increasing disposable income which has created immense opportunities for companies looking out for new markets to grow. More and more companies are moving to these cities because of availability of talent pool at a lower cost, more affordable real estate prices and stable business environment. As a result of this trend, players with focus on smaller cities are doing well.
The competitive environment in VRL's target markets remains low from organised players as most of these organised retailers like PFRL,SSL and TL primarily focus on metro cities and Tier-I cities. Major competition in VRL’s target cities comes from local and niche players. However, as the company’s brand image and value proposition grows, it is bound to grab market share from local players.
Rise in purchasing power of people in Tier-II & Tier- III cities
With high rental costs and space constraints, many organisations are moving out of metro and Tier-I cities and launching their operations in smaller cities. With some of the village population moving to smaller cities for want of better lifestyle, the target population is also growing in smaller cities and it makes all the more sense for organisations to expand in Tier-II and Tier-III cities. Consequently, these cities are growing and expected to grow much faster than metro cities and Tier-I cities.
This is precisely the reason why some Tier-II and Tier-III city-focused companies are growing much faster than the industry. VRL is mostly present in Tier-II and Tier-III cities where organised players’ share is not even 10% of the total market size. With an early-mover advantage, VRL understands the dynamics of smaller towns and has been able to expand its footprint easily. We believe VRL has been able to provide the organised retail experience to the consumers and with the increase in purchasing power, and no major competition from SSL, PRFL, TL, etc. VRL is going to benefit the most in the structural shift on the part of consumers from unorganised to organised retail.

Institutional Equities
V-Mart Retail
Healthy GDP growth in Uttar Pradesh/Bihar
Out of 106 stores, VRL set up 50 stores in Uttar Pradesh (UP) and 20 stores in Bihar which are the key markets for VRL. In FY13 and FY14, GDP growth rate of UP stood at 5.9%/5.1%, respectively, and of Bihar at 10.7%/9.9%, respectively, higher than GDP growth rate of India at 4.5%/4.7%, respectively, for the same period. The strong GDP growth rate is attributed to the fact that these states have reduced their dependence on agriculture growth and the reversal in industrial growth. The company is continuously increasing its number of stores in these two states which have emerged as key markets for the company. These two states contribute more than 70% to the company’s revenue.
VRL made a smart move by garnering market share from the unorganised segment in UP and Bihar as these two states have emerged as high GDP growth rate reckoners for India’s GDP growth. With inflation under control, new investments in projects, removal of policy bottlenecks, faster government approvals, implementation of policies and timely action, India’s GDP growth rate has shown improvement in 1QFY15/2QFY15 at 5.7%/5.3%, respectively, compared to 1QFY14/2QFY14 rates of 4.7%/5.2%, respectively.
The company has already set up strong foot in UP/Bihar following the healthy growth in these states. VRL is set to benefit the most on the back of higher disposable income, increase in fashion consciousness and most importantly the shift in consumers’ preference from unorganised to organised retail.
Exhibit 30: Continous rise in personal disposable income Exhibit 31: Healthy GDP growth in UP/Bihar to benefit VRL
Source: Company, Industry, Nirmal Bang Institutional Equities Research Source: Company, Industry, Nirmal Bang Institutional Equities Research
Indian retail industry
Consumerism in India is witnessing an unprecedented growth driven by favourable demographics, young and working population, rising income levels, urbanisation and growing brand orientation. This, in turn, is reflected in India’s retail market, which in CY13 was estimated at US$520bn and is expected to post a CAGR of 13% at around US$950bn by CY18, as per global management consultancy firm Ernst & Young LLP and Retailers Association of India. Organised retail penetration, currently estimated at 7.5%, is expected to clock a 19%-20% annual growth to touch 10% by CY18. Penetration in Tier-II and Tier- III cities and improvement in business model and operations coupled with consumers’ shift from unorganised to organised retail segment are expected to play an integral role in driving this growth. Further, the liberalisation of foreign direct investment (FDI) policy is expected to propel the foray of global retailers, which will further fuel the growth of organised retail business in India.
Tier-II and Tier-III cities such as Jaipur, Nagpur, Ludhiana, Vadodara, Aurangabad, Kochi etc are emerging as the new ’hot spots’ of consumption. Organised retailers are increasingly setting up stores in these smaller cities. There is rising focus on profitable growth in the sector. Most retailers seem to be focusing on transformation of existing operations rather than introducing new formats. Moreover, retailers are expecting existing formats to deliver a like-to-like growth of around 10% this year.
Favourable demographics, increasing urbanisation, nuclear families, rising affluence amid consumers, growing preference for branded products and higher aspirations are other factors which will drive retail consumption in India. Both organised and unorganised retail are bound not only to co-exist, but also achieve rapid and sustained growth in the coming years.
In a nutshell, leading retailers seem to driving dual themes of expansion and internal improvement for sustainable growth. Further, retailers expect the customer sentiment to improve, which will provide further impetus to growth of the organised sector.
10 10
6
1010
1314
12
21
1515
20
12
0
5
10
15
20
25
0
10,000
20,000
30,000
40,000
50,000
60,000
70,000
80,000
90,000
20
00
-01
20
01
-02
20
02
-03
20
03
-04
20
04
-05
20
05
-06
20
06
-07
20
07
-08
20
08
-09
20
09
-10
20
10
-11
20
11
-12
20
12
-13
(Rsbn) (%)
9.3
6.7
8.6 8.9
6.7
4.54.7
5.6
14.5
5.3
15.0
10.3 10.7 9.9
7.37.0
6.6 7.9
5.6
5.95.1
0
2
4
6
8
10
12
14
16
FY08 FY09 FY10 FY11 FY12 FY13 FY14
(%)
India Bihar UP

Institutional Equities
V-Mart Retail
Organised retail market in India burgeoning and is expected to post a CAGR of 19%-20% over the next five years, says Ernst & Young LLP and Retailers Association of India
The Indian retail sector is set to grow rapidly with a gradual shift toward organised retailing formats. Organised retail penetration is expected to increase from 7.5% in 2013 to 10% in 2018 at a robust CAGR of 19%-20% during the same period. This will be driven by a combination of demand, supply and regulatory factors, which are expected to be the growth engines of the Indian consumer and retail market.
The government, through reforms in FDI in the retail sector, seems to be repositioning the sector on the global map for investment
India categorises retail trading into single-brand retail trading (SBRT) and multi-brand retail trading (MBRT). Currently, FDI under SBRT is permitted to the extent of 100% and FDI under MBRT is permitted to the extent of 51% with select conditions and government approval.
While the FDI policy for SBRT has received a favourable response, FDI policy for MBRT has been slow to gain traction among international retailers. Given this, the government seems to be working toward relaxing some aspects of its FDI policy, which could propel more international retailers to invest in the country.
The chief financial officers (CFOs) in the Indian retail sector prefer: (a) Allowing FDI in online retail, (b) Clarity on provisions regarding sourcing, (c) Revisit and clarity on investment in back-end process, and (d) Limiting the role of the state. All this are some of the changes which could lift the momentum of FDI in the retail sector.
Limited competition from FDI-backed outlets
The government has allowed FDI up to 51% in multi-brand retail outlets. However, it has not permitted such stores to be set up in cities having a population of less than 1mn. Towns selected by VRL for its retail outlets such as Azamgarh, Jaunpur and Begusarai etc have population of less than 1mn. Hence, the company will not face the threat of FDI-backed outlets. The large-format retail stores such as Big Bazaar or Star Bazaar, in order to break-even, require a population of more than 1mn. Therefore, we believe VRL will not face competition from such stores in most of the cities.
Once Goods & Services Tax (GST) is implemented, it will simplify supply chain and bring down prices/costs
GST is an all-inclusive value added tax (VAT) on goods and services ranging from production to the end-point of consumption. If we talk about retail industry, rent is one of the main costs and it attracts service tax at 10%. Currently, the retailers cannot set off these costs like other industries. Under GST, taxes on services will be available for set-off against taxes on goods. Therefore, the retailers will be positively impacted. The lack of uniformity in state VAT laws as well as compliance measures result in additional burden on retailers.
GST, originally proposed to be introduced with effect from April 2010, is yet to be rolled out. Difference in opinion among states, insistence of states on commitment of the Central government to compensate for possible revenue losses, coverage of specific products, procedural delays together with consensus on the Constitutional Amendment Bill are some of the key factors delaying the introduction of GST in India.
Financial analysis
Revenue expected to post a 29.2% CAGR over FY14-FY17E
VRL increased its revenue at a strong pace of 38.8%/32.2%/34.3% CAGR over the past three/five/six years, respectively, at Rs5,750mn in FY14. The strong revenue growth is attributed to the fact that VRL has been expanding its store network at a consistent pace and also increased its SSG. VRL increased its retail space by 25.7%/18.2%/22.8% CAGR over the past three/five/six years, respectively. Its store strength increased 2.0x/2.4x/4.0x in the past three/five/six years, respectively, at 89 in FY14. Its fashion segment posted a 49.5% CAGR over FY10-FY14, while kirana business grew 13.2% CAGR during the same period.
As its business model has been well established, VRL needs to channelise its efforts to scale it up to new level, at time when its competitors are struggling to arrive at a right business model and channelise efforts to fine tune their business model. With strong execution capability and supply chain, the company is targeting to set up 25 new stores every year from an average 17 stores per year in the past three years. We expect VRL to grow its retail space at a 20.0% CAGR over FY14-FY17E at 1.25mn sqft by opening 75 stores on a base of 89 stores in FY14. In addition, VRL will have SSG at 10% over the same period. As a result, revenue is expected to post a 29.2% CAGR at Rs12,389mn over FY14-FY17E.

Institutional Equities
V-Mart Retail
Exhibit 32: Sales to post a CAGR of 29.2% over FY14-FY17E Exhibit 33: Continunous improving sales/sqft/year
Source: Company, Nirmal Bang Institutional Equities Research Source: Company, Nirmal Bang Institutional Equities Research
Gross margin to improve, but EBITDA margin to remain at constant level
VRL grew its EBITDA by 40.5%/45.7%/34.4% over the past three/five/six years, respectively, at Rs538mn in FY14 and PAT rose by 59.0%/89.0%/38.8% CAGR, respectively, at Rs252mn over the same period. However, temporary hiccups were primarily witnessed in FY09 and FY10 because of aggressive expansion coupled with unexpected demand deterioration. Revenue per sqft declined 3.2%/19.1% in FY09/FY10, respectively. Following higher employee costs and higher overheads, EBITDA declined 10.4% despite a growth in net revenue by 45.2% in FY09. With corrective measures, the company was able to improve operating margin from 5.7% in FY09 to 8.2%/9.0% in FY10/FY11, respectively, despite sales growth of a mere 1.3% in FY10 because of shutdown of six stores as against an average of two stores, which was the highest in the company’s history. However, the company continues to grow at a rapid pace after the blip in FY09 and FY10.
Gross margin in apparel and non-apparel businesses is higher at 33% and 37% respectively, 1.5x the gross margin of kirana business at 21%. Share of kirana business increased from 19.4% in FY08 to 29.4% in FY11, which led to reduction in gross margin from 32.8% to 28.1% over the same period. Higher footfalls partially compensated lower gross margin in kirana business. As the VRL brand is fairly established in existing geographies, VRL has stopped setting up new stores with kirana items since April 2012. Currently, out of 106 stores, 34 stores have kirana business. VRL’s key objective is profitable growth with major focus on non-kirana business (apparel and non-apparel, including footwear, purses, etc).
With the conscious efforts of the management, the contribution of fashion segment increased to 87.8% in FY14 from 75.7%/80.7% in FY12/FY13, respectively, and that of kirana segment reduced to 12.2% in FY14 from 24.0%/19.3% in FY12/FY13, respectively, in total revenue. As kirana stores drive higher footfalls than apparel, the declining share of kirana business should lead to reduction in footfall per store. However, as VRL got its business model right, it was able to maintain footfall per store despite reducing area or removing kirana business entirely in some existing and all new stores. We expect apparel business contribution to increase from 87.8% in FY14 to 92.5% in FY17E and consecutively, the contribution of kirana business to fall from 12.3% in FY14 to 7.5% in FY17E, which is expected to improve gross margin by 50bps at 30.3% over FY14-FY17E.
Although the management aims to improve the operating margin to 10% by FY17, despite improvement in gross margin, we expect EBITDA margin to remain at a constant level of 9.4% over FY14-FY17E because of the increase in initial cost of operations arising from the ramp-up (setting up of 25 retail stores every year) which is expected to nullify the benefit arising from gross margin improvement. With a healthy revenue growth of 29.2% and stable margins, EBITDA is expected to post a 28.7% CAGR at Rs1,148mn over FY14-FY17E.
We expect VRL to improve its inventory turnover further to 145 days in FY17 from 150 days in FY14, leading to a decline in the working capital cycle from 18.1% in FY14 to 17.0% in FY17E. On account of high working capital cycle, operating cash flow was negative for two years out of the past six years, with cumulative operating cash flow of only Rs157mn from FY08-FY14. However, with lower working capital coupled with healthy revenue growth rate, VRL will have positive operating cash flow for all years in FY14-FY17E with cumulative operating cash flow of Rs926mn, thereby meeting its entire capex requirement of Rs900mn to set up 75 stores over FY14-FY17E. In addition, it has cash and liquid investments worth Rs366mn in FY14, and therefore it will require additional debt of a mere Rs62mn for new store addition. Hence, despite aggressive growth, net D/E ratio will remain flat at 0.04x over FY04-FY17E. Following control over interest costs, net profit is likely to grow at a faster pace of 34.4% CAGR compared to EBITDA growth of 28.7% CAGR over FY14-FY17E.
1,424 1,442 2,148
2,819 3,835
5,750 7,445
9,621
12,389 45.2
1.3
49.0
31.2
36.0
49.9
29.5
29.2 28.8
0
5
10
15
20
25
30
35
40
45
50
0
2,000
4,000
6,000
8,000
10,000
12,000
14,000
FY09 FY10 FY11 FY12 FY13 FY14 FY15E FY16E FY17E
Net Revenue Growth %
(Rsmn) (%)
5,605 5,424
4,388
6,069 6,768
7,904
8,878 9,695
10,483
11,605
(3.2)
(19.1)
38.3
11.5 16.8
12.3 9.2 8.1
10.7
(20)
(10)
0
10
20
30
40
0
2,000
4,000
6,000
8,000
10,000
12,000
FY08 FY09 FY10 FY11 FY12 FY13 FY14 FY15E FY16E FY17E
Average Sales/sq.ft./year (Rs) Growth %
(Rs) (%)

Institutional Equities
V-Mart Retail
Aggressive 35.6% PAT CAGR likely over FY15E-FY17E
VRL witnessed a few one-offs in 2QFY15 which exerted pressure on its operating profit. Due to delayed monsoon in northern states like UP and Bihar, accounting for more than 70% of VRL’s sales, revenue got impacted for the quarter because of subdued consumer sentiment. As a result, SSG grew by a mere 1% in 2QFY15. Also, the relocation of a store in Bhopal impacted quarterly revenue, while floods in Jammu & Kashmir led to inventory loss of Rs10.8mn. Following these one-off events, operating profit declined 31.5% in 2QFY15. As a result, we expect operating profit to grow by a mere 24.0% in FY15E against a three-year CAGR of 40.5%. We expect normalcy in operations in Jammu& Kashmir and Bhopal, while SSG in UP and Bihar is improving, thereby leading to a healthy 31.1% CAGR in EBITDA over FY15E-FY17E compared to 24.0% in FY15E. Following a healthy growth in operating profit, net profit is expected to post a 35.6% CAGR over FY15E-FY17E compared to 32.0% in FY15E. Healthy growth in net profit along with a 685bps improvement in RoCE over FY14E-FY17E is expected to result in a strong re-rating of VRL.
Exhibit 34: Gross margin to improve by 20bps annually Exhibit 35: EBITDA margin to remain constant
Source: Company, Industry, Nirmal Bang Institutional Equities Research Source: Company, Industry, Nirmal Bang Institutional Equities Research
Key risks
E-retailing
There is a rising trend among Indian buyers to buy online because of higher discounts. Substantial increase in e-retailing can provide a challenge to VRL’s business model and its growth prospects. In small towns, consumers like to scan the entire market before making purchases to ensure that they buy quality products at low prices. Hence they take time to adopt e-commerce. In addition, low Internet penetration in India, especially among VRL’s target customers (i.e. customers residing in Tier-II & III cities with annual income in the range of Rs0.1mn to Rs1mn), and poor logistics network should act as hindrance for the growth of e-retailing in areas where VRL operates.
Competition and low entry barriers
The company faces competition not just from organised players like PFRL and TL, but also local niche players. The industry has low entry barriers. Its not tough to open retail stores. However, understanding customer needs, low-cost sourcing, managing supply chain, managing inventory and learning curve should act as a source of competitive advantage for a retail company like VRL.
Inability to understand and adjust with fashion trends
The company is in the business of apparel and general merchandise where customers’ demands change with fashion trends. In case the management fails to understand and adjust its inventory based on fashion trends, the company may be left with unsold inventory. Therefore, it is important to monitor the company’s inventory holding days. VRL reduced its inventory holding to 150 days in FY14 from 198 days in FY10 and is expected to cut them further to 145 days in FY17E, thereby reducing the impact of fashion trend.
Increase in lease rentals
As of now, the rentals for the company are at 4.3% of total revenue. Any adverse rise in rental costs may hurt VRL’s profitability and our estimates.
340488 470
631839
1,170
1,716
2,197
2,877
3,75434.7
34.3
32.6
29.4 29.830.5
29.829.5
29.930.3
26
27
28
29
30
31
32
33
34
35
36
0
500
1,000
1,500
2,000
2,500
3,000
3,500
4,000
FY08 FY09 FY10 FY11 FY12 FY13 FY14 FY15E FY16E FY17EGross Profit Gross Margin
(%)(Rsmn)
91
82
11
9
19
4
28
3
39
2
53
8
66
7
88
2
1,1
48
35
10
23
63
10
5
17
6
25
2
33
3
43
9
61
2
9.3
5.7
8.2
9.0
10.0 10.2
9.49.0 9.2 9.3
3.6
0.7
1.6
2.9
3.7
4.6 4.4 4.5 4.64.9
0
2
4
6
8
10
0
200
400
600
800
1,000
1,200
FY08 FY09 FY10 FY11 FY12 FY13 FY14 FY15E FY16E FY17E
EBITDA PAT EBITDA margin PAT margin
(Rsmn) (%)

Institutional Equities
V-Mart Retail
Increase in working capital requirement
The retail industry is a highly capital -intensive business with high inventory. If the company is not able to cope with the ever-changing consumer preferences, it may lead to pile-up of stocks, which in turn will impact the working capital cycle. This may hurt cash flow and future expansion of the company.
Key highlights of visit to VRL stores to understand the functioning, customer preference and footfalls
1) Store: Lakhimpur, District: Kheri, State: UP: Population 0.12mn in 2011
This store was set up around April 2013.
Store size is about 9,000 sqft (spread over two floors). The surrounding area and the lanes which we visited didn’t have a store like this.
Merchandise is available at all price points and for all age groups, ranging from as low as Rs80 to Rs800. Bandicoats is a premium offering which costs around Rs1,000-Rs1,200.
Kirana items are not sold at this store.
Store managers are typically not from the same area. They are trained and then sent to a specific place to manage the store.
30-35 staff members are present and so for every rack, typically there is a sales person to manage it.
Footfalls are higher on weekends, and for a local guy working at a VRL store in such areas is a matter of pride. Recruiting staff doesn’t seem much of a problem and we could find male as well as female salespersons.
Store managers were not as polished as one finds in a retail outlet in a city, but as the demands in the area are pretty basic they are good enough to pull the stores through.
We visited the surrounding areas and found that VRL store may be one of the luxury stores in the village/town.
2) Store: Sitapur, District: Sitarpur, State: UP, Population 0.15mn in 2011
This store seemed to be in a much vibrant area (market place) and Sitapur also was a bigger village/town than Lakhimpur.
The store had much higher number of footfalls and was bigger at ~10,000 sqft.
The store manager has been in the retail industry for the past 11 years and had also worked with Reid & Taylor, Siyarams in Mumbai. He was very knowledgeable and understood the dynamics of retail business.
Sitapur store registers daily sales of about Rs0.25mn-Rs0.3mn, which translates to almost Rs10mn/month.
Footfalls are good throughout the week and are lower on Sundays as nearby areas are agricultural areas and in addition, Sitapur court is also nearby. As the court is shut on Sundays and people don’t travel much from the surrounding areas, the footfalls are less on Sundays.
The store is open from 10am–10pm and if there are higher footfalls late in the night, then the store is kept open, which, according to us, is the biggest plus point of VRL which drives better revenue per sqft.
Because of the power shortage situation, all the stores have back-up generator sets to ensure uninterrupted power supply.
The store had an area for kirana bazaar and as per the store manager, kirana helps in driving up footfalls and so he makes efforts to convert the same into apparel sales. However, kirana business comes at a risk of lower margin and inventory losses and ,therefore, typically a survey is conducted of the area and if it is found that kirana helps in driving footfalls then it is retained. However, VRL is not keen on doing this. Another problem, we believe, is that people here have a habit of buying a lower size SKU product, but modern retail provides a bigger size product, which puts further inventory risk for such stores.
At the store-level, apart from what is displayed, the inventory is negligible. If it places an order for anything, it typically takes around 25 days for receipt of the same.
If a particular SKU has been sold out faster and in the store is in need of the same, then it communicates with the adjoining area store as well.

Institutional Equities
V-Mart Retail
The store manager himself can also suggest to the head office (HO) if certain changes can be done to the store to improve customer experience.
The layout of the all the stores is decided by the HO.
Prices of products once displayed do not change, but discount level changes as per the age of inventory.
Recruitment of personnel is not a problem as the store gets resumes on a daily basis and now that VRL has good footprint in UP, it is well known as a brand and people want to come and work with the company. Internal references obviously help as well.
The company has also started police verification of employees they hire, which ensures the background of employees
Real estate acquisition is a bit tricky because now that people know VRL as a brand and when they approach someone for a particular piece of land, the quotation is always higher than what company expects.
In all the stores, inventory aging is followed, and there are products on discount ranging from 0%-80%. Discount is simply a function of the aging of inventory.
The merchandise to be displayed is all decided by the HO and distributed from the centralised warehouse.
We could see the difference in merchandise when we compared the stores at Sitapur and Lakhimpur.
Sales personnel are given a minimum wage of Rs8,000/month and a store manager is paid around Rs25,000/month
3) Store: Indira Nagar, Lucknow, State: UP, Population 2.2mn in 2011
The store was spread around 7,500-8,000 sqft and as it is located in the city it had higher rentals. Rent negotiations are done by the HO and the rent is paid through RTGS.
Right across the street there was a store called One India Mart which had a similar model as VRL and the store manager candidly admitted that it has given them a slight hit.
This store, being of a smaller size, was a bit cluttered, but that is not much of a problem. The staff seems well trained across all the stores we visited and apart from the Lakhimpur store, all others had kirana section.
4) Store: Chowk, Lucknow
This store was bigger than the one we visited at Indira Nagar and was in a market lane. Besides the store, there was a Vishal Mega Mart store as well.
This store was two-year old and did sales of Rs10mn/month and even in the month of Shraad, when Hindus don’t shop much, the store witnesses monthly sales of around Rs8mn because of better religious diversity.
In stores where there’s a higher ceiling and air-conditioning through vents, lighting seemed a bit of a problem. We met the store’s visual merchandiser and communicated the same to him.
Kirana items occupied a reasonable part of the store and the store manager takes care to put the products which have earlier expiry date at the front and fresh stock at the back to minimise inventory losses.
We had a look at Vishal Mega Mart store, which had similar merchandise and aggressive pricing as well, but it was totally mismanaged with very few sales personnel and the shop appeared much cluttered - as if everything was shoved in and in terms of cleanliness as well the store was not up to the mark.
In fact, the manager at VRL store stated that when people visit Vishal Mega Mart store and then come to the VRL store, it benefits VRL more.

Institutional Equities
V-Mart Retail
Company background
Incorporated in 2002, VRL is a medium-sized hypermarket format retail chain based in New Delhi. It is a multi-brand family store, which offers apparel, general merchandise and kirana bazaar. VRL has established stores in metro cities, Tier-I, Tier-II and Tier-III cities, which are primarily located as standalone stores in high-street areas and shopping hubs. The company follows the concept of value retailing to target the strata of population belonging to the expanding aspiring class and middle class and is based on customer's socio-economic conditions, purchasing power, demographic details and customer trends. VRL currently has 106 stores across 88 cities including metro cities and 12 states with a total area of 863,000 sqft. VRL operates all of its stores on its own and has not gone for any franchise arrangement.
Out of the current 106 stores, 34 stores also have kirana bazaars, through which it sells branded packaged food and non-food items like personal care products. It doesn't sell perishable goods like fruits and vegetables. In FY14, apparel accounted for 87.8% of the company's sales, while 12.2% came from kirana business. With the company not including kirana bazaar in its new stores, the share of kirana business will automatically continue to drop.
Exhibit 36: Store details
State Number of stores
Uttar Pradesh 50
Bihar 20
Gujarat 7
Jharkhand 7
Madhya Pradesh 4
Punjab 4
Rajasthan 4
Uttarakhand 4
Delhi 3
Haryana 1
Jammu & Kashmir 1
Chandigarh 1
Total number of stores 106
Source: Company, Industry, Nirmal Bang Institutional Equities Research
Exhibit 37: Store strength across metro cities and Tier-I, Tier-II and Tier-III cities
Source: Company, industry, Nirmal Bang Institutional Equities Research
Exhibit 38: Key milestones
Source: Company, Industry, Nirmal Bang Institutional Equities Research
9 10 9 8 10
13 10
14 15
6
12 12 13 16
20
29 29 31
7
15 19
24
29
36
47 50
52
-
10
20
30
40
50
60
FY08 FY09 FY10 FY11 FY12 FY13 FY14 1QFY15 2QFY15
Metro & Tier-I Tier-II Tier-III
2003: Opens maiden store at
Ahmedabad, Gujarat
2006: Crosses 100,000sqft
space
2008: Crosses turnover of Rs1,000mn.
PE investment by Aditya Birla Group
February 2013: VRL initial public
offer
2002: Incorporated as
Varin Commercial Pvt Ltd

Institutional Equities
V-Mart Retail
Exhibit 39: Store cost metrics
Details (%)
Gross margin 30.00
Employee costs 4.25
Lease rent 4.25
Power and fuel costs 3.25
Advertisement costs 2.25
Other costs 1.00
Store-level EBITDA (%) 15.00
Corporate overheads 5.00
Corporate EBITDA (%) 10.00
Source: Company, Industry, Nirmal Bang Institutional Equities Research
Management Team
Lalit Agarwal (Chairman & Managing Director) holds Bachelor’s Degree in Commerce from Bombay University, and Diploma in Financial Management from Narsee Monjee Institute of Management Studies, Mumbai. He has more than 16 years of rich experience in the retail industry. He spearheads the company and is responsible for formulating and implementing the business plans.
Hemant Agarwal (Director) holds Bachelor’s Degree in Commerce from Utkal University, Cuttack. He has been instrumental in developing a strong vendor base, thereby strengthening the procurement of apparel merchandise. He is also responsible for managing the growth and development of VRL’s private labels, business operations of existing stores and continued expansion in western and central India.
Madan Agarwal (Director) holds Bachelor’s Degree in Arts from City College, Calcutta University. He is the mentor and a guiding force behind the company’s growth. He has more than three decades of experience in the retail industry. He provides insights on cost control, overseas procurement of general merchandise and the kirana bazaar business vertical.
Krishna Kumar Gupta (Director) is an associate member of The Indian Institute of Bankers. He also holds post graduate diploma in bank management from National Institute of Bank Management and previously worked as an executive in Central Bank of India and handled various portfolios such as credit, recovery, development and human resources development. He also holds Pacific Rim Bankers Programme Certification from University of Washington’s business school plus diploma certifications in sales and marketing management, business management, export and import management, financial management and international business management from National Institute of Labour Education and Management.
Aakash Moondhra (Director) holds Bachelor’s Degree in Commerce from Delhi University and Master’s Degree in Business Administration from Southern Methodist University, Texas. He is a member of The Institute of Chartered Accountants of India and The Institute of Company Secretaries of India. He has held various positions in Nokia India and Baring Private Equity Partners (India), heading the retail vertical, Bharti Retail, Bharti Airtel and AT&T Corporation. He currently works as chief financial officer at Jasper Infotech (www.snapdeal.com).
Kamal Kumar Gupta (Director) is a member of The Institute of Chartered Accountants of India. He is a partner at M/s. Salapuria & Partners and is currently a director in Data Alarm Overseas.
Deepak Sharma (CFO) holds Bachelors degree in science from Delhi University. He is a member of The Institute of Chartered Accountants of India (ICAI) and has also completed certificate course on valuation of ICAI and QMS Lead Auditor Training organised by Federation of Indian Chambers of Commerce and Industry or FICCI. He has nearly two decades of work experience. He is responsible for the finance and accounting function in addition to all statutory and internal compliances to ensure the adequacy and efficacy of internal controls, systems and processes.

Institutional Equities
V-Mart Retail
Financials
Exhibit 40: Income statement
Y/E March (Rsmn) FY12 FY13 FY14 FY15E FY16E FY17E
Net sales 2,819 3,835 5,750 7,445 9,621 12,389
Growth (%) 31.2 36.0 49.9 29.5 29.2 28.8
Raw-material costs 1,979 2,664 4,034 5,249 6,744 8,635
Staff costs 171 250 383 491 672 866
Lease rent costs 139 169 249 328 443 582
Other expenses 247 360 546 711 880 1,158
Total expenditure 2,536 3,443 5,211 6,778 8,739 11,241
EBITDA 283 392 538 667 882 1,148
Growth (%) 45.6 38.8 37.3 24.0 32.1 30.2
EBITDA margin (%) 10.0 10.2 9.4 9.0 9.2 9.3
Other income 1 2 7 22 10 12
Extraordinariy items 6
Interest costs 67 57 58 65 61 39
Gross profit 216 343 488 625 830 1,121
Growth (%) 49.8 58.7 42.2 28.1 32.9 35.0
Depreciation 58 76 109 141 171 201
Profit before tax 158 267 379 484 660 920
Growth (%) 64.8 69.1 42.0 27.8 36.3 39.5
Tax 53 86 127 162 221 308
Effective tax rate (%) 33.5 32.3 33.4 33.5 33.5 33.5
Net profit 105 181 252 322 439 612
Growth (%) 67.4 72.2 39.5 27.7 36.3 39.5
Adjusted net profit 105 176 252 333 439 612
Growth (%) 67.4 68.1 42.9 32.0 31.9 39.5
Source: Company, Nirmal Bang Institutional Equities Research
Exhibit 42: Balance sheet
Y/E March (Rsmn) FY12 FY13 FY14 FY15E FY16E FY17E
Equity 73 180 180 180 180 180
Reserves 469 1,297 1,522 1,819 2,226 2,807
Net worth 542 1,477 1,702 1,998 2,406 2,986
Short-term loans 378 330 433 493 343 193
Long-term loans 22 20 2 2 2 2
Total loans 400 350 435 495 345 195
Deferred tax liability (6) (7) (22) 4 39 88
Liabilities 936 1,820 2,115 2,498 2,790 3,269
Gross block 550 766 1,096 1,406 1,706 2,006
Depreciation 215 291 396 537 708 908
Net block 336 475 700 869 998 1,098
Capital work-in-progress 8 13 10 - - -
Long-term Investments - 406 342 212 62 -
Inventories 869 1,107 1,677 2,143 2,716 3,478
Debtors 1 - - - - -
Cash 19 158 23 99 78 64
Other current assets 94 131 162 225 291 375
Total current assets 983 1,396 1,862 2,468 3,086 3,917
Creditors 337 372 641 828 1,068 1,374
Other current liabilities 54 98 158 223 289 372
Total current liabilities 391 471 799 1,052 1,357 1,746
Net current assets 592 925 1,063 1,416 1,729 2,171
Total assets 935 1,820 2,115 2,498 2,790 3,269
Source: Company, Nirmal Bang Institutional Equities Research
Exhibit 41: Cash flow
Y/E March (Rsmn) FY12 FY13 FY14 FY15E FY16E FY17E
EBIT 224 316 429 527 711 947
(Inc.)/dec. in working capital (41) (195) (272) (277) (334) (457)
Cash flow from operations 184 121 157 250 377 490
Other income 1 2 7 22 10 12
Depreciation 58 76 109 141 171 201
Deferred liabilities (3) (1) (14) 26 35 49
Interest paid (-) (67) (57) (58) (65) (61) (39)
Tax paid (-) (53) (86) (127) (162) (221) (308)
Dividend paid (-) (3) (15) (26) (25) (31) (31)
Extraordinary Items - 6 - - - -
Net cash from operations 117 46 48 186 279 373
Capital expenditure (-) (136) (221) (331) (300) (300) (300)
Net cash after capex (19) (175) (283) (114) (21) 73
Inc./(dec.) in short term borrowings 30 (48) 103 60 (150) (150)
Inc./(dec.) in long term borrowings (8) (2) (18) - - -
Inc./(dec.) in borrowings 22 (50) 85 60 (150) (150)
(Inc.)/dec. in investments - (406) 64 130 150 62
Equity issue/(buyback) (0) 770 (0) 0 - -
Cash from financial activities 22 314 149 190 - (88)
Others 1 (1) - - - -
Opening cash 15 19 158 23 99 78
Closing cash 19 158 23 99 78 64
Change in cash 4 138 (134) 76 (21) (14)
Source: Company, Nirmal Bang Institutional Equities Research
Exhibit 43: Key ratios
Y/E March FY12 FY13 FY14 FY15E FY16E FY17E
Per share (Rs)
EPS 14.3 9.8 14.0 18.5 24.4 34.1
Book value 74 82 95 111 134 166
Valuation (x)
P/E 35.3 51.4 36.0 27.2 20.7 14.8
P/sales 1.3 2.4 1.6 1.2 0.9 0.7
P/BV 6.8 6.1 5.3 4.5 3.8 3.0
EV/EBITDA 14.5 22.6 17.0 13.9 10.5 8.0
EV/sales 1.4 2.3 1.6 1.2 1.0 0.7
Return ratios (%)
RoIC 17.4 19.7 19.0 17.8 19.6 21.5
RoCE 17.0 15.5 14.7 15.8 18.3 21.5
RoE 21.4 17.5 15.9 18.0 19.9 22.7
Margins (%)
EBITDA margin 10.0 10.2 9.4 9.0 9.2 9.3
PBIT margin 8.0 8.2 7.5 7.1 7.4 7.6
PBT margin 5.6 7.0 6.6 6.5 6.9 7.4
PAT margin 3.7 4.6 4.4 4.5 4.6 4.9
Turnover ratio
Asset turnover ratio (x) 3.0 2.1 2.7 3.0 3.4 3.8
Avg. inventory period (days) 158 150 150 147 145 145
Avg. collection period (days) 0 - - - - -
Avg. payment period (days) 48 39 44 44 44 44
Solvency ratios (x)
Debt-equity 0.7 0.2 0.3 0.2 0.1 0.1
Interest Coverage 3.3 5.5 7.4 8.1 11.7 24.2
Growth (%)
Sales 31.2 36.0 49.9 29.5 29.2 28.8
EBITDA 45.6 38.8 37.3 24.0 32.1 30.2
PAT 67.4 68.1 42.9 32.0 31.9 39.5
Source: Company, Nirmal Bang Institutional Equities Research
Institutional Equities
V-Mart Retail
Disclaimer
Stock Ratings Absolute Returns
BUY > 15%
ACCUMULATE -5% to15%
SELL < -5%
This report is published by Nirmal Bang’s Institutional Equities Research desk. Nirmal Bang has other business units with independent research teams separated by Chinese walls, and therefore may, at times, have different or contrary views on stocks and markets. This report is for the personal information of the authorised recipient and is not for public distribution. This should not be reproduced or redistributed to any other person or in any form. This report is for the general information for the clients of Nirmal Bang Equities Pvt. Ltd., a division of Nirmal Bang, and should not be construed as an offer or solicitation of an offer to buy/sell any securities.
We have exercised due diligence in checking the correctness and authenticity of the information contained herein, so far as it relates to current and historical information, but do not guarantee its accuracy or completeness. The opinions expressed are our current opinions as of the date appearing in the material and may be subject to change from time to time without notice.
Nirmal Bang or any persons connected with it do not accept any liability arising from the use of this document or the information contained therein. The recipients of this material should rely on their own judgment and take their own professional advice before acting on this information. Nirmal Bang or any of its connected persons including its directors or subsidiaries or associates or employees or agents shall not be in any way responsible for any loss or damage that may arise to any person/s from any inadvertent error in the information contained, views and opinions expressed in this publication. Nirmal Bang Equities Private Limited (hereinafter referred to as “NBEPL”)is a registered Member of National Stock Exchange of India Limited, Bombay Stock Exchange Limited. NBEPL is in the process of making an application with SEBI for registering as a Research Entity in terms of SEBI (Research Analyst) Regulations, 2014.
NBEPL or its associates including its relatives/analyst do not hold any financial interest/beneficial ownership of more than 1% in the company covered by Analyst (in case any financial interest is held kindly disclose)
NBEPL or its associates/analyst has not received any compensation from the company covered by Analyst during the past twelve months. NBEPL /analyst has not served as an officer, director or employee of company covered by Analyst and has not been engaged in market making activity of the company covered by Analyst.
The views expressed are based solely on information available publicly and believed to be true. Investors are advised to independently evaluate the market conditions/risks involved before making any investment decision .
+
(2) Research analyst or research entity that employs a rating system must clearly define the meaning of each such rating including the time horizon and benchmarks on which a rating is based.
(3) If a research report contains either a rating or price target for subject company’s securities and the research analyst or research entity has assigned a rating or price target to the securities for at least one year, such research report shall also provide the graph of daily closing price of such securities for the period assigned or for a three-year period, whichever is shorter.

Institutional Equities
‘Access our reports on Bloomberg Type NBIE <GO>’
Team Details:
Name Email Id Direct Line
Rahul Arora CEO [email protected] -
Girish Pai Head of Research [email protected] +91 22 3926 8017 / 18
Dealing
Ravi Jagtiani Dealing Desk [email protected] +91 22 3926 8230, +91 22 6636 8833
Pradeep Kasat Dealing Desk [email protected] +91 22 3926 8100/8101, +91 22 6636 8831
Michael Pillai Dealing Desk [email protected] +91 22 3926 8102/8103, +91 22 6636 8830
Umesh Bharadia Dealing Desk [email protected] +91-22-39268226
Nirmal Bang Equities Pvt. Ltd.
Correspondence Address
B-2, 301/302, Marathon Innova,
Nr. Peninsula Corporate Park
Lower Parel (W), Mumbai-400013.
Board No. : 91 22 3926 8000/1
Fax. : 022 3926 8010