Embed Size (px)
Citation preview

Anand Rathi Shares and Stock Brokers Limited (hereinafter “ARSSBL”) is a full service brokerage and equities research firm and the views expressed therein are solely of ARSSBL and not of the companies which have been covered in the Research Report. This report is intended for the sole use of the Recipient. Disclosures and analyst certifications are present in Appendix. Anand Rathi Research India Equities
Girish Solanki+9122 6626 6712
India I Equities India I Equities Industrials
Initiating Coverage
Key financials (YE Mar) FY13 FY14 FY15e FY16e FY17e
Sales (` m) 16,584 16,189 20,260 24,461 28,432
Net profit (`m) 263 116 316 648 1,053
EPS (`) 3.7 1.6 4.1 8.4 13.6
Growth (%) 8.2 (56.0) 172.7 104.8 62.6
PE (x) 24.3 55.3 20.3 9.9 6.1
EV/EBITDA (x) 6.4 7.5 6.0 4.5 3.5
P/B (x) 2.5 2.3 2.1 1.8 1.4
RoE (%) 10.9 4.3 10.9 19.4 25.8
RoCE (%) 20.9 17.3 20.7 26.2 31.3
Dividend yield (%) 0.2 0.3 0.5 1.1 1.6
Net gearing (%) 1.8 1.9 1.7 1.4 1.1
Source: Company, Anand Rathi Research
Rating: Buy Target Price: `128
Share Price:`83
Key data KEII IN / KEIN.BO52-week high/low `89 / `17Sensex/Nifty 28666 / 87073-m average volume US$0.8m Market cap `6.4bn / US$103mShares outstanding 77m
Shareholding pattern (%) Mar‘15 Dec ‘14 Sep‘14
Promoters 49.4 49.4 49.4- of which, Pledged Free Float 50.6 50.6 50.6 - Foreign Institutions 1.2 1.6 1 - Domestic Institutions 0.2 0.1 0.1 - Public 49.2 48.7 49.4
Relative price performance
KEII
Sensex15
30
45
60
75
90
Apr-1
4
Jun-
14
Aug-
14
Oct
-14
Dec
-14
Feb-
15
Apr-1
5
Source: Bloomberg
17 April 2015
KEI Industries
Multiple growth levers kicking in; initiating, with a Buy
We initiate coverage on KEI Industries with a Buy and a target price of `128. We are upbeat about the company given the greater demand for its products (reflected in its `17bn order-book). With its better product-mix (due to high-margin EHV), higher exports and retail sales, we expect robust 18%/82% revenue/PAT CAGRs over FY15-17. Operating leverage and the better product-mix could improve margins by 180bps, in our view. With no major capex until FY17, FCF generation would strengthen the balance sheet, resulting in higher return ratios.
Growth driven by a diversified product-mix. KEI is one of only three companies in the high-margin EHV business. On completion of pre-qualification, we expect its EHV business to grow to `2.5bn by FY17, from ~`0.6bn in FY15e. This segment has a higher, ~15-18%, margin, and its order book is `2bn. We expect its turnkey EPC business (15% margin) to grow from `2.1bn (net revenue) in FY15e to `4.4bn in FY17.
More exports, retail sales would help revenue, margin growth. KEI has chalked out a brand-building strategy (to spend ~`70m on ad campaigns in FY16). Retail sales now account for 27% of sales, and we expect them to rise to 33% by FY17, following vigorous dealer addition (from 600 to 1,000). We expect exports (7% of sales in FY15e) to climb to 10% by FY17. These segments are low working-capital intensive.
Operating leverage to drive margins. Better utilisation, coupled with higher revenue from retail, exports and EHV, could result in the EBITDA margin rising 179bps over FY15-17. We expect an EBITDA CAGR of 29% over FY15-17.
With no major capex, balance sheet to be strong. Given its rising profitability, we expect an FY17 RoCE of 31.3% (20.7% in FY15e). We estimate working-capital days to drop to 77 in FY17 from 89 in FY15. The minor capex in cables plus the routine capex of `300m/yr would be funded internally; hence, we expect the debt-equity ratio to fall to 1.1x by FY17.
Valuation. We expect an 82% PAT CAGR over FY15-17, supported by rising revenue and better margins. We value the stock at an average of PE, EV/EBITDA and P/BV; hence, we derive a target of `128. It currently quotes at a PE of 6.1x FY17e EPS. Risks. Demand deterioration in infrastructure and higher interest rates.

17 April 2015 KEI Industries – Multiple growth levers kicking in; initiating, with a Buy
Anand Rathi Research 2
Quick Glance – Financials and ValuationsFig 1 – Income statement (` m) Year-end: Mar FY13 FY14 FY15e FY16e FY17e
Net revenues 16,584 16,189 20,260 24,461 28,432 Revenue growth (%) -3.71 -2.38 25.14 20.74 16.24- Oper. expenses 14,878 14,659 18,328 21,898 25,212 EBITDA 1,705 1,530 1,932 2,562 3,220 EBITDA margin (%) 10.28 9.45 9.54 10.47 11.33 - Interest expenses 1,094 1,115 1,227 1,320 1,361 - Depreciation 204 210 251 297 313 + Other income 24 13 18 22 26 - Tax 85 46 156 319 519 Effective tax rate (%) 38.9 46.8 33.0 33.0 33.0Reported PAT 263 116 316 648 1,053 +/- Extraordinary items Adjusted PAT 263 116 316 648 1,053 PAT growth (%) 8.2 (56.0) 172.7 104.8 62.6 Adj. FDEPS (`/sh) 3.4 1.5 4.1 8.4 13.6 Adj. FDEPS growth (%) 8.2 (56.0) 172.7 104.8 62.6 Source: Company, Anand Rathi Research
Fig 3 – Cash-flow statement (` m) Year-end: Mar FY13 FY14 FY15e FY16e FY17ePAT 263 116 316 648 1,053 + Non-cash items 287 264 251 297 313 Cash profit 550 380 567 945 1,366 - Incr./(decr.) in WC 194 682 439 571 593 Operating cash-flow 357 (302) 128 374 773 - Capex 136 238 150 300 300 Free cash-flow 220 (540) (22) 74 473 - Dividend 16 18 36 81 118 + Equity raised 59 49 49 0 0 + Debt raised (140) 370 150 50 (300)- Investments 0 0 0 0 0 - Misc. items 11 (28) 44 0 0 Net cash-flow 113 (111) 96 43 55 Opening cash 44 156 46 142 185 Closing cash 156 46 142 185 240 Source: Company, Anand Rathi Research
Fig 5 – PE band
KEII
2.0
4.0
6.0
8.0
10.0
0
10
20
30
40
50
60
70
80
90
Apr-0
8
Oct
-08
Apr-0
9
Oct
-09
Apr-1
0
Oct
-10
Apr-1
1
Oct
-11
Apr-1
2
Oct
-12
Apr-1
3
Oct
-13
Apr-1
4
Oct
-14
Apr-1
5
(`)
Source: Bloomberg, Anand Rathi Research
Fig 2 – Balance sheet (` m) Year-end: Mar FY13 FY14 FY15e FY16e FY17e
Share capital 140 147 154 154 154 Reserves & surplus 2,415 2,539 2,861 3,428 4,363 Net worth 2,556 2,731 3,016 3,582 4,518 Total debt 4,736 5,106 5,256 5,306 5,006 Minority interest 0 0 0 0 0 Def. tax liab. (net) 106 160 160 160 160 Capital employed 7,397 7,998 8,433 9,049 9,685 Net fixed assets 3,115 3,143 3,042 3,045 3,032 Investments 31 31 31 31 31 - of which, Liquid Net working capital 4,096 4,778 5,217 5,788 6,382 Cash and bank balance 156 46 142 185 240 Capital deployed 7,397 7,998 8,433 9,049 9,685 Net debt/ equity (x) 1.8 1.9 1.7 1.4 1.1 WC turn (days) 87 99 89 81 77Book value (`/sh) 33 35 39 46 58 Source: Company, Anand Rathi Research
Fig 4 – Ratio analysis @ `83 Year-end: Mar FY13 FY14 FY15e FY16e FY17e
P/E (x) 24.3 55.3 20.3 9.9 6.1 Cash P/E (x) 12.5 18.8 11.3 6.8 4.7 EV/EBITDA (x) 6.4 7.5 6.0 4.5 3.5 EV/sales (x) 0.7 0.7 0.6 0.5 0.4 P/B (x) 2.5 2.3 2.1 1.8 1.4 RoE (%) 10.9 4.3 10.9 19.4 25.8RoCE (%) 20.9 17.3 20.7 26.2 31.3 Dividend yield (%) 0.2 0.3 0.5 1.1 1.6 Dividend payout (%) 5.3 13.3 9.8 10.7 9.5 Debt to equity (x) 1.9 1.9 1.7 1.5 1.1 Debtor days 98.1 94.5 90.0 88.0 87.0 Inventory days 82.6 93.5 89.0 87.0 86.0 Payables days 109.2 106.5 110.0 111.0 112.0 Working capital days 86.8 98.7 88.8 81.0 77.0 Fixed asset T/O (x) 5.3 5.2 6.7 8.0 9.4 Source: Company, Anand Rathi Research
Fig 6 – Segment-wise revenue break-up (FY15e)
Cables, 71.4 %
House wiring, 14.7 %
EPC, 8.4 %
Stainless steel & wires, 4.6 % Other, 0.9 %
Source: Company, Anand Rathi Research

17 April 2015 KEI Industries – Multiple growth levers kicking in; initiating, with a Buy
Anand Rathi Research 3
Growth led by diversified product-mix The diversified product-mix, comprising extra-high-voltage cables (up
to and incl. 220 kV), high and medium-voltage cables, low-tension cables, control and instrumentation cables, specialty and rubber cables, stainless steel wires and winding, flexible and housing wires, makes KEI the leader in the domestic cable and wire sector.
Its recent entry into the EPC segment by executing power-transmission projects (66kV to 400kV sub-stations) on a turnkey basis has enabled the company to gain a competitive edge.
Being the third-largest producer of EHV cables (in technical collaboration with the Switzerland-based Brugg Kabel AG), KEI has established its position by providing end-users with designs, services, etc.
Strong demand outlook for India’s wire and cable sector
Wires and cables form an integral part of all industrial capex. Based on some estimates, ~3—3.5% of capex cost is on cables and wires; in power distribution, however, this goes as high as 10—12%. The size of the cable sector is estimated at ~`230bn, growing 12—15%.
The wire and cable sector in India comprises about a quarter of the total transmission and distribution segment. Demand for wires is expected to register a 13% CAGR over the next 7—8 years owing to the government’s investment in power and infrastructure, coupled with dynamic industrialisation and rapid urbanisation.
Major expansion in steel, cement, oil & gas, energy, automobiles, highways, ports, airports, SEZs, housing, IT parks, hotels, shopping malls and BPOs would increase demand for cables.
The government’s plan to spend $1trn on infrastructure in the next five years would help growth in this sector.
Fig 7 – Capacity, plant-wise (km) Bhiwadi Silvassa Chopanki
EHV 600
HT power cables 3,000 2,000
LT power cables 9,000 6,000 7,000
Control cables 16,000 12,000 3,000
Instrumentation cables 10,000 1,000
Rubber cables 3,000
Total cable (km) 41,000 19,000 12,600
House wires/ Winding wires (km) 40,000 24,0000
Stainless steel wire (tonnes) 4,800
Source: Company
Diversified product-mix, now including EPC
Some of the largest operators are Polycab, Finolex Cables, Havells,
V-Guard, Uniflex Cables and RPG Cables (now with KEC)

17 April 2015 KEI Industries – Multiple growth levers kicking in; initiating, with a Buy
Anand Rathi Research 4
Wide array of products
The diversified product range covers a wide variety of cables, catering to the requirements of both the industrial and household sectors. KEI manufactures all kind of power cables—extra-high-voltage cables up to and including 220kV, high- and medium-voltage cables, low-tension cables, control and instrumentation cables, specialty and rubber cables, winding, flexibles and house wire, and stainless-steel wire.
Its manufacturing plants are located at Bhiwadi, Chopanki and Silvasa. Products are used in different sectors (power, oil refineries, Railways, automobiles, cement, steel, fertilisers, textiles and real estate, among others). Supported by growth in these sectors, cables are likely to benefit, hence leading to growth in the company.
In FY14, low-tension power/ rubber cables, high-tension power cables, housing, winding and flexible wires and stainless-steel wire contributed 56.7%, 15.7%, 16.8% and 5.7%, respectively, to revenue. We expect these figures to record a 15% CAGR over FY15-17, with margins coming at around 10—11%. The company now operates at around a 75% capacity utilisation, which is likely to go up to 93% in FY17.
Fig 8 – Product Basket Products Application Control Cables Used for electrical distribution systems such as generating stations,
industrial application and indoor and outdoor projects. Rubber Cables Rubber cables are used in mines, ships, aircraft, earth-moving equipment,
etc. Power Cables Used in underground as well as overhead transmission of power in power
plants, industries, projects etc. Instrumental cables Used to transmit power from the main control room to the machines. Housing wires These have application in electrification of residential, commercial and
industrial establishments Winding wires These are used for submersible pumps and electrical motors Flexible wires Used in electrical panel wiring, consumer electrical goods, etc. Stainless steel wires Wide application in graded house fasteners, weaving, knitting and other
industrial applications Source: Company
EPC to bolster KEI’s growth prospects
The engineering, procurement and construction (EPC) sector is projected to be a multi-billion-dollar industry due to the vast infrastructure opportunities arising. The company had marked its presence in EPC from FY08. The main services offered by it in EPC constitute execution of power transmission projects (of 66kV to 400kV sub-stations) on a turnkey basis, EPC of EHV and HV cable systems, electrical balance-of-plant for power plants and electrical industrial projects.
In-house manufacturing of EHV/ HV cables gives KEI an added advantage since these cables comprise almost 30% of an EPC project value. Its EPC clients comprise L&T, Siemens, ABB and Areva, etc. It has collaborations with Woosun Electric (Korea) for power projects and with Cobra Engineers (Spain) for sub-station execution.
The EPC segment has registered a 73% CAGR over FY11-15e and we expect a 45% CAGR over FY15-17 with margins of around 15%. The company has been servicing both the government and private sectors at average gestation periods of about a year. Of its present order book of `17bn, around `8.5bn arises from EPC contracts.
Its clients include Tata Power, the Indian Railways, NTPC,
Hindalco, Punj Lloyd, BPC, HPC, Indian Oil, Essar Oil,
ONGC, GAIL, BHEL, Reliance Energy, etc.
Consumption of cables in turnkey EPC power projects accounts for
nearly 30% of project cost
17 April 2015 KEI Industries – Multiple growth levers kicking in; initiating, with a Buy
Anand Rathi Research 5
Fig 9 – Strong sales growth in the EPC business
-
500
1,000
1,500
2,000
2,500
3,000
3,500
4,000
4,500
FY12
FY13
FY14
FY15
e
FY16
e
FY17
e
(`m)
(100)
(50)
-
50
100
150
200
250
300
350
(%)
EPC Growth (RHS) Source: Company, Anand Rathi Research
Leading in EHV cables
KEI is the third company in India to commercially produce EHV cables (ranging from 66kV to 220kV). In Nov’10 it commenced production at Chopanki in Rajasthan. In the past, demand for EHV cables was met largely through imports; however, technological collaboration with the Switzerland-based Brugg Kabel AG has enabled KEI to make its presence in EHV cables felt faster.
Brugg has over 100 years’ experience and the ability to manufacture cables up to 550kV. It supports KEI by providing designs, process back-up –services sought by end-users such as transmission companies, mega power plants, metropolises, industries such as steel, cement, refineries, petrochemicals, large realty projects such as IT parks, large residential complexes, etc. At present KEI has more than `2bn of orders pending for EHV cables. The normal execution time for the cable orders is 6—8 months.
In FY15, EHV cables would have contributed 2.7% to revenue. By FY17 we expect this to increase to 8.2%. We expect revenue from EHV to register a 104% CAGR from `0.6bn to `2.5bn. The boom in infrastructure, power, transmission and distribution would be huge positives for growth in this segment.
One of the leaders in the EHV sub-segment, KEI is expected to gain substantial market share in
the next 2-3 years
Fig 10 – Strong sales growth in EHV
0200
400600
8001,000
1,2001,400
1,6001,800
2,000
FY13
FY14
FY15
e
FY16
e
FY17
e
(`m)
(100)
(50)
-
50
100
150
200
250
300
(%)
EHV cable Growth (RHS)
Source: Company, Anand Rathi Research
Fig 11 – Strong order-book position (FY15e)
EHV8%
EPC50%
Cable42%
Source: Company

17 April 2015 KEI Industries – Multiple growth levers kicking in; initiating, with a Buy
Anand Rathi Research 6
Fig 12 – Strong sales growth in cables
0
5,000
10,000
15,000
20,000
25,000
FY09
FY10
FY11
FY12
FY13
FY14
FY15
e
FY16
e
FY17
e
(`m)
(20)
(10)
-
10
20
30
40
50
(%)
Cable revenue Growth % (RHS)
Source: Company, Anand Rathi Research
Fig 13 – Sales growth in housing wire
0
500
1,000
1,500
2,000
2,500
3,000
3,500
4,000
4,500
5,000
FY09
FY10
FY11
FY12
FY13
FY14
FY15
e
FY16
e
FY17
e
(`m)
(40)(30)(20)(10)-10203040506070(%)
Winding, flexibles & house wiring Growth (RHS)
Source: Company, Anand Rathi Research

17 April 2015 KEI Industries – Multiple growth levers kicking in; initiating, with a Buy
Anand Rathi Research 7
Strong retail and export operations
KEI is positioned as a dominant domestic cable manufacturer, with strong brand equity and a wide distribution network. Its retail segment, comprising wires for domestic use, is expected to widen in the years to come. At present, retail contributes around 27% to its revenue, and we expect this to rise to 33% by FY17 and to over 35% in the next three years.
With operations in more than 45 countries, KEI’s exports have recorded a 24% CAGR over FY13-15e. During FY14, exports had almost doubled; now, with the company’s keener focus on exports, we expect this to register a 40% CAGR over FY15-17.
Expanding retail presence KEI’s retail division, comprising household wires as well as LT and HT cables, is moving up the value chain, backed by the company’s strong brand equity and wide distribution network in India and abroad. Its brand has helped it to position itself as a specialist cable manufacturer. It has a distribution network of about 600 dealers (up from 500 in FY14) and plans to add 200 every year. At present, it is very strong in the north and west, and plans to strengthen its operations in the east and south.
At present its distribution network covers most of India (metros, tier-I and tier-II cities). It is vigorously marketing through brand promotion and communication channels. It has decided to spend `70m in FY16 toward advertising in TV and print. KEI has been vigorously promoting its brand through various ad campaigns and outdoor advertising. These have led to increased house wire sales. To increase sales through its retail distribution network, it appointed a retail business head in FY15, with over 20 years’ experience in the cable and wire retail business.
Retail brings in ~27% of revenue. On account of slightly better margins of around 11%, the
company’s focus on this has risen
House wire sales have risen at a 30% CAGR over FY09-15e, due to the number of dealers added and
vigorous brand building
Fig 14 – Wide distribution network
North45%
East10%
West25%
South20%
Source: Company, Anand Rathi Research
Fig 15 – Retail sales growth
0
2,000
4,000
6,000
8,000
10,000
12,000
FY15
e
FY16
e
FY17
e
(`m)
27
28
29
30
31
32
33
(%)
Retail % of sales (RHS) Source: Company, Anand Rathi Research

17 April 2015 KEI Industries – Multiple growth levers kicking in; initiating, with a Buy
Anand Rathi Research 8
Robust export growth
Cable exports have grown robustly in the past few years. KEI, being a strong and established player in the cable sector at home, has also garnered a decent share of the export market. It exports to more than 45 countries and is poised to benefit from the coming potential. It has been setting up offices all over the country to capture further orders to best utilise the increased manufacturing capacities. It has also set up offices in Singapore, Nigeria and Kazakhstan besides offices in Dubai/ Abu Dhabi. Also, it operates in Korea and Australia through agents.
It sells a wide range of cables: EHV (66kV to 220kV), MV (11kV to 66kV) and LV (<11kV). Also, it has participated in international exhibitions to establish fresh connections in order to expand operations in overseas markets. Competitive prices and its ability to offer customised solutions have helped its export business dramatically in the past two years.
During FY14, its exports doubled from `0.97bn to `1.97bn, with the proportion of exports to revenue also doubling -- from 6% to 12%. In FY15, however, this slipped to 7% due to disturbances in its target market. With management’s strong focus on exports, we expect this percentage to climb to 9.6% by FY17, registering a 40% CAGR over FY15-17. With more exports, profitability and working capital are likely to improve.
Fig 16 – Healthy export growth (%)
-
5,000
10,000
15,000
20,000
25,000
30,000
FY09
FY10
FY11
FY12
FY13
FY14
FY15
e
FY16
e
FY17
e
(`m)
-24681012141618
Domestic Export % of sales (RHS) Source: Company, Anand Rathi Research
Wide range of cables, and exports to over 45 countries

17 April 2015 KEI Industries – Multiple growth levers kicking in; initiating, with a Buy
Anand Rathi Research 9
Operating leverage to drive margins Over the last few years the company has been operating at sub-optimal levels. In FY15 its cables and wire division operated at ~75% utilisation. Hence, we expect substantial fixed-cost absorption to have occurred and, with no major capex further, we expect the plants to touch 93% utilisation in FY17. The present capacity can generate `28bn in revenue. The revenue visibility on account of its strong order book is ~`17bn and leads us to believe that operating leverage would kick in.
Fig 17 – Higher capacity utilisation leading to higher margin
10
20
30
40
50
60
70
80
90
100
FY07
FY08
FY09
FY10
FY11
FY12
FY13
FY14
FY15
e
FY16
e
FY17
e
(%)
2
4
6
8
10
12
14
16(%)
Utilisation OPM (RHS) Source: Company, Anand Rathi Research
Greater utilisation, coupled with higher revenue from retail, exports and EHV, would result in a 179-bp better EBITDA margin over FY15-17. We expect an EBITDA CAGR at 29% over FY15-17.
Fig 18 – Price trends in copper and aluminium (LME)
0
2,000
4,000
6,000
8,000
10,000
12,000
Apr-0
5
Oct
-05
Apr-0
6
Oct
-06
Apr-0
7
Oct
-07
Apr-0
8
Oct
-08
Apr-0
9
Oct
-09
Apr-1
0
Oct
-10
Apr-1
1
Oct
-11
Apr-1
2
Oct
-12
Apr-1
3
Oct
-13
Apr-1
4
Oct
-14
Apr-1
5
(US$/mt)
Copper Aluminium
Source: Bloomberg
Fig 19 – Contribution/ tonne of cable and wire
0
1,000
2,000
3,000
4,000
5,000
6,000
FY07
FY08
FY09
FY10
FY11
FY12
FY13
FY14
FY15
FY16
e
FY17
e
(`m)
20,000
25,000
30,000
35,000
40,000
45,000
50,000
55,000
60,000
65,000(`/mton)
Cable and wire Contribution Contribution/tone (RHS)
Source: Company, Anand Rathi Research
17 April 2015 KEI Industries – Multiple growth levers kicking in; initiating, with a Buy
Anand Rathi Research 10
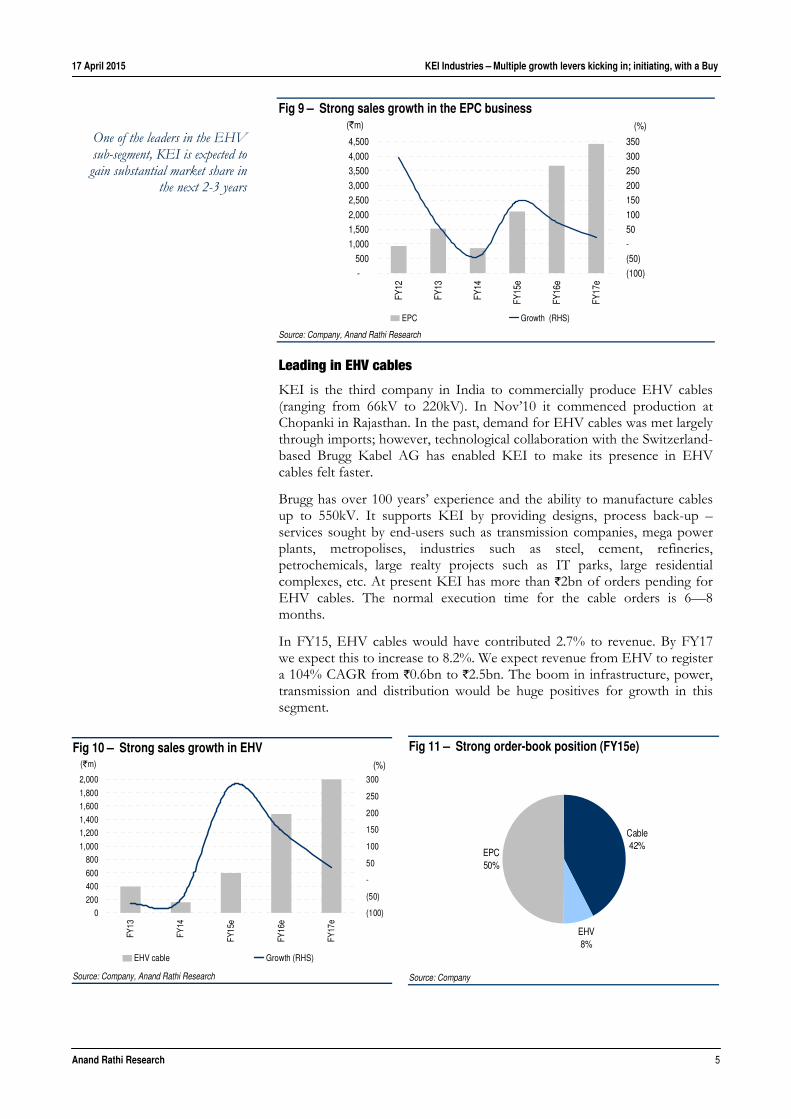
Healthy balance sheet Over FY16-17, the company is likely to generate operating cash-flows of about `1.14bn, in our view; of this, ~`600m would be used for routine capex plus minor capex in cables; hence, the debt-equity ratio is expected to fall to 1.1x by FY17. We expect debt of ~`5bn in FY17. We expect the interest cost (as percent of sales) to fall in FY17 to 4.8%, from 6% in FY15e, a 127-bp improvement. This, coupled with the improved margin due to greater revenue would help toward the steeply improved profitability. The PAT margin would more than double, to 3.7% in FY17, from 1.6% in FY15e.
We expect the FY17 RoCE to be 31.3% (from 20.7% in FY15e).
Both the export and retail businesses, which are expected to grow faster than the overall business, are less working-capital intensive. Because of this, we expect working-capital days to come at 77 in FY17, from 89 in FY15.
Fig 20 – Greater share of exports and retail to reduce working capital
0
9
18
27
36
45
FY15
e
FY16
e
FY17
e
(%)
72
76
80
84
88
92
(days)
Exports Retail WC days (RHS) Source: Anand Rathi Research
Fig 21 – Better return ratios to reduce debt
-
5
10
15
20
25
30
35
FY09
FY10
FY11
FY12
FY13
FY14
FY15
e
FY16
e
FY17
e
(%)
0.0
0.5
1.0
1.5
2.0
2.5
(%)
ROCE Debt to equity (RHS)
Source: Company, Anand Rathi Research
Fig 22 – Lower interest cost as % of sales to expand NPM
-
1
2
3
4
5
6
7
FY10
FY11
FY12
FY13
FY14
FY15
e
FY16
e
FY17
e(%)
NPM Interest / sales Source: Company, Anand Rathi Research NPM = PAT margin

17 April 2015 KEI Industries – Multiple growth levers kicking in; initiating, with a Buy
Anand Rathi Research 11
Financials We expect KEI’s revenue to record an 18% CAGR over FY15-17,
fuelled by strong growth in EHV cables, EPC, retail and export businesses, which bring in ~44% of revenue.
We expect profit to register a strong 82% CAGR, powered by strong revenue, a 179-bp margin expansion and declining interest costs (as percent of sales) over FY15-17.
We expect the balance sheet to be strengthened as minimal capex and an improving working-capital cycle would help generate sufficient free-cash flows and improve theRoE and RoCE substantially over FY15-17. This would also help in reducing the debt-equity ratio through repayment of debt.
Strong, 18%, revenue CAGR over FY15-17
On account of the government’s greater emphasis on infrastructure, demand for cables in India could shoot up. We expect an 18% revenue CAGR over FY15-17 to `28.45bn, driven by strong growth in the EHV cables and EPC businesses. The cable division, comprising LT power cables, HT power cables and EHV cables, registered a 9% CAGR over FY09-15e and is likely to report a 17% CAGR over FY15-17, in our view.
Fig 23 – Revenue growth trend
0
5,000
10,000
15,000
20,000
25,000
30,000
FY09
FY10
FY11
FY12
FY13
FY14
FY15
e
FY16
e
FY17
e
(`m)
(10)
-
10
20
30
40
50
60
(%)
Sales Sales growth % (RHS) Source: Company, Anand Rathi Research
Fig 24 – Revenue break-up (` m) FY 13 FY14 FY15e FY16e FY17e
Cables 12,948 12,718 14,873 17,164 20,203
% growth (1.8) 16.9 15.4 17.7
% of sales 71.4 72.5 68.1 65.4 66.2
Winding, flexi & house wires 2,665 2,941 3,751 4,243 4,642
% growth 10.4 27.5 13.1 9.4
% of sales 14.7 16.8 17.2 16.2 15.2
Turnkey projects 1,524 857 2,110 3,673 4,421
% growth (43.8) 146.1 74.1 20.4
% of sales 8.4 4.9 9.7 14.0 14.5
Stainless steel wires 831 1,003 1,083 1,162 1,221
% growth 20.8 7.9 7.3 5.1
% of sales 4.6 5.7 5.0 4.4 4.0
Traded goods (SS wires) 155 15 19 23 28
Source: Company, Anand Rathi Research
We expect the EPC business to report a 45% CAGR over FY15-
17. With an order book of ~`17bn, we expect it to boost
growth
We expect winding and house wires/stainless-steel wires to record 11%/6% CAGRs over the same
period

17 April 2015 KEI Industries – Multiple growth levers kicking in; initiating, with a Buy
Anand Rathi Research 12
EBITDA margin to step up
In the past, the company had been generating healthy EBITDA margins of around 10-14% (FY05-08). In FY09, however, the margin slipped to ~3% because of volatile raw-material prices (copper and aluminum). But, with raw-material prices stabilising, margins have begun to steady. At present, the gross margin is about 26% and we expect this to improve to 28% by FY17. The EBITDA margin has improved by 617bps over FY09-15e. With the company’s strong focus on EHV, EPC and retail, we expect the margin to come at around 11.3% by FY17, up 179bps over FY15.
Net profit to register an 82% CAGR over FY15-17
We expect the company to register an 82% CAGR over FY15-17 in net profit to `1.05bn, aided by strong revenue growth, healthy operating profit margins and a better leverage position. At present, the retail segment constitutes about 27% of the business; with the retail-business expansion, profitability could improve since this is a slightly higher-margin business. Exports, ~7% of sales in FY15, are expected to rise to 10% in FY17. The increasing focus on EPC, retail, EHV cables and exports would help improve profit margins to ~3.7%, from 1.6% in FY15.
Fig 25 – Gross margin improvement . . .
0
1,000
2,000
3,000
4,000
5,000
6,000
7,000
8,000
9,000
FY09
FY10
FY11
FY12
FY13
FY14
FY15
e
FY16
e
FY17
e
(`m)
17
19
21
23
25
27
29
31(%)
Gross profit Gross margin (RHS) Source: Company, Anand Rathi Research
Fig 26 – . . . to drive EBITDA margin up
0
500
1,000
1,500
2,000
2,500
3,000
3,500
FY09
FY10
FY11
FY12
FY13
FY14
FY15
e
FY16
e
FY17
e
(`m)
-
2
4
6
8
10
12
(%)
EBITDA EBITDA margin (RHS)
Source: Company, Anand Rathi Research
Fig 27 – Higher margin and lower interest cost . . .
4
5
6
7
8
9
10
11
12
FY10
FY11
FY12
FY13
FY14
FY15
e
FY16
e
FY17
e
(%)
Interest / sales EBITDA margin Source: Company, Anand Rathi Research
Fig 28 – . . . to drive strong growth in PAT
0
200
400
600
800
1,000
1,200
FY11
FY12
FY13
FY14
FY15
e
FY16
e
FY17
e
(`m)
(100)
(50)
-
50
100
150
200
(%)
PAT Growth (RHS) Source: Company, Anand Rathi Research

17 April 2015 KEI Industries – Multiple growth levers kicking in; initiating, with a Buy
Anand Rathi Research 13
Improving return ratios
With strong PAT growth and better margins in the next three years, we expect substantially improved return ratios. We estimate the RoE and RoCE would improve from 11% and 20.7% in FY15, respectively, to 25.8% and 31.3% in FY17. The subdued sales growth in FY14 had cut into the return ratios; but, with the robust revenue and margin growth over FY15-17, the return ratios are trending upward.
Fig 29 – Climbing return ratios
-
5
10
15
20
25
30
35
FY09
FY10
FY11
FY12
FY13
FY14
FY15
e
FY16
e
FY17
e
(%)
ROE ROCE Source: Company, Anand Rathi Research
Minimal capex and lower debt lead to a strong balance sheet
The company has minimal capex plans (just ~`0.6bn) for the next two years, to be funded through internal accruals. It has already started to pay off its term debt, and we expect the debt-equity ratio to fall to 1.1x in FY17, from 1.7x in FY15e. With minimal capex, we expect KEI to generate free-cash flows over the next two years. The fixed-asset turnover is likely to come at 9.4x in FY17, from 6.7x in FY15e, in our view. As we expect the institutional business to contribute less over FY15-17, working capital days required would drop to 77 in FY17 from 89 in FY15e.
Better return ratios in the next three years
Minimal capex plans would lead to FCF generation and lower the
debt-equity ratio over the next two years
Fig 30 – Lower capex to keep debt in check
1,0001,5002,0002,5003,0003,5004,0004,5005,0005,5006,000
FY10
FY11
FY12
FY13
FY14
FY15
e
FY16
e
FY17
e
(`m)
100
150
200
250
300
350
400
450
500(%)
DEBT Capex (RHS)
Source: Company, Anand Rathi Research
Fig 31 – FCF to increase from FY15
(800)
(600)
(400)
(200)
0
200
400
600
800
1,000
FY10
FY11
FY12
FY13
FY14
FY15
e
FY16
e
FY17
e
(`m)
(1,000)
(800)
(600)
(400)
(200)
-
200
400
600(%)
CFO FCF (RHS) Source: Company, Anand Rathi Research
17 April 2015 KEI Industries – Multiple growth levers kicking in; initiating, with a Buy
Anand Rathi Research 14
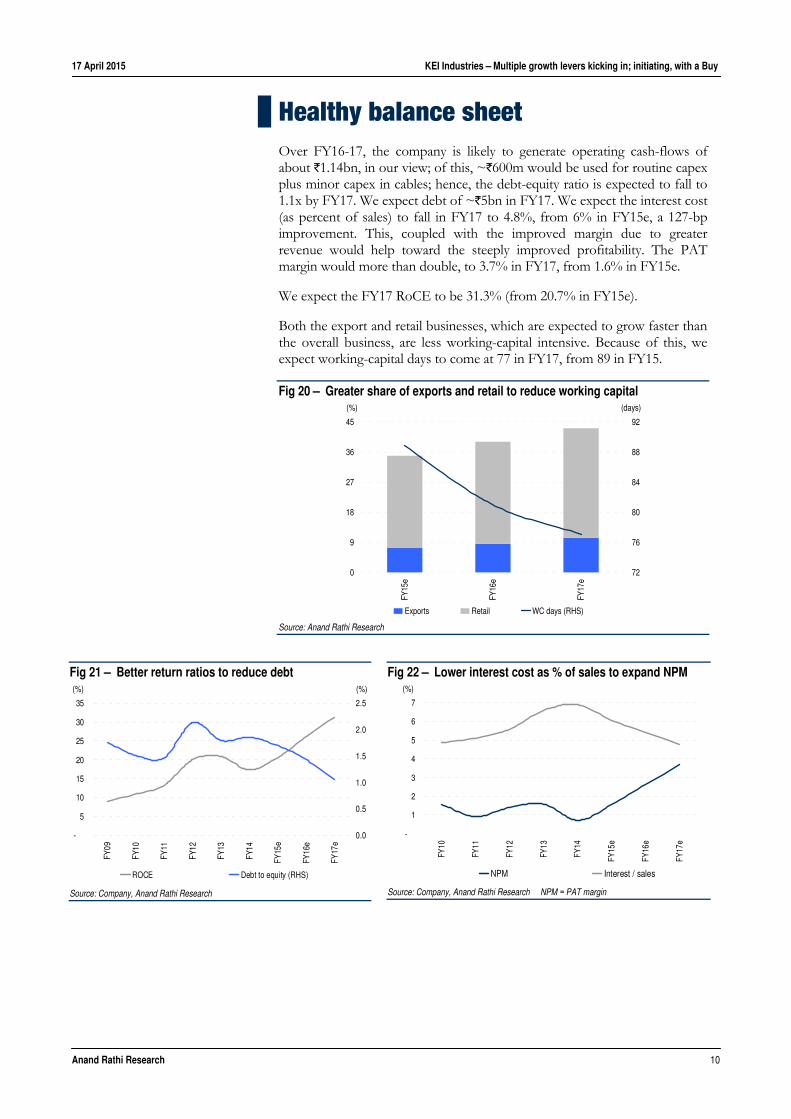
Fig 32 – Income statement (` m) Y/E March FY13 FY14 FY15e FY16e FY17e
Revenues 16,584 16,189 20,260 24,461 28,432 Growth in revenues (%) (3.7) (2.4) 25.1 20.7 16.2 Raw materials 12,119 12,043 14,954 17,838 20,236 % of Sales 73.1 74.4 73.8 72.9 71.2 Personnel expenses 461 516 729 954 1,166 % of Sales 2.8 3.2 3.6 3.9 4.1 Selling and other expenses 2,298 2,100 2,644 3,106 3,810 % of Sales 13.9 13.0 13.1 12.7 13.4 EBITDA 1,705 1,530 1,932 2,562 3,220 EBITDA Margin (%) 10.3 9.5 9.5 10.5 11.3 Depreciation 204 210 251 297 313 PBIT 1,501 1,321 1,681 2,265 2,907 Interest expenses 1,094 1,115 1,227 1,320 1,361 PBIT from operations 407 205 454 945 1,546 Other non operating income 24 13 18 22 26 PBT before extra-ordinary items 431 218 472 967 1,572 Extra-ordinary income/ (expenses) - - - - -PBT 431 218 472 967 1,572 Provision for tax 167 102 156 319 519 Effective tax rate 38.9 46.8 33.0 33.0 33.0 PAT 263 116 316 648 1,053 Minority Interest - - - - -PAT after minority interest 263 116 316 648 1,053 Adjusted PAT 263 116 316 648 1,053 Growth in PAT (%) 8.2 (56.0) 172.7 104.8 62.6 PAT margin (%) 1.6 0.7 1.6 2.6 3.7
Source: Company, Anand Rathi Research
Fig 33 – Balance sheet (` m) Y/E March FY13 FY14 FY15e FY16e FY17e
Equity Share Capital 140 147 154 154 154 Share Warrants - 44 - - -Reserves 2,415 2,539 2,861 3,428 4,363 Shareholders' fund 2,556 2,731 3,016 3,582 4,518 Minority Interest - - - - -Debt 4,736 5,106 5,256 5,306 5,006 Deferred Tax Liability 106 160 160 160 160 Total Capital Employed 7,397 7,998 8,433 9,049 9,685 Gross Block 4,124 4,357 4,507 4,807 5,107 Accumulated depreciation 1,036 1,216 1,467 1,764 2,077 Net Block 3,089 3,141 3,040 3,043 3,030 Capital WIP 26 2 2 2 2 Total Fixed Assets 3,115 3,143 3,042 3,045 3,032 Investments 31 31 31 31 31 Inventories 3,582 4,031 4,531 5,292 6,023 Debtors 4,212 4,286 5,458 6,420 7,374 Cash and bank balances 156 46 142 185 240 Loans and Advances 413 391 391 391 391 Other current / non current assets 338 549 549 549 549 Total current assets 8,701 9,304 11,072 12,837 14,578 Current liabilities and provisions 4,449 4,480 5,713 6,864 7,956 Net current assets 4,252 4,824 5,359 5,973 6,622 Misc. Expenditure - - - - -Total Assets 7,397 7,998 8,433 9,049 9,685
Source: Company, Anand Rathi research

17 April 2015 KEI Industries – Multiple growth levers kicking in; initiating, with a Buy
Anand Rathi Research 15
Fig 34 – Cash flow statement (` m) Y/E March FY13 FY14 FY15e FY16e FY17e Cash flow from operating activities Profit before tax 431 218 472 967 1,572 Depreciation 204 210 251 297 313 Interest expenses 1,094 1,115 1,227 1,320 1,361 Operating profit before working capital change 1,729 1,543 1,950 2,584 3,246 Working capital adjustment 194 682 439 571 593 Gross cash generated from operations 1,535 861 1,511 2,013 2,652 Direct taxes paid 167 102 156 319 519 Cash generated from operations 1,368 759 1,355 1,694 2,134 Cash flow from investing activities Capex 136 238 150 300 300 Investment - 0 - - -Cash generated from investment activities (136) (238) (150) (300) (300) Cash flow from financing activities Proceeds from share capital and premium 59 49 49 - -Borrowings/ (Repayments) (140) 370 150 50 (300)Interest paid (1,094) (1,115) (1,227) (1,320) (1,361)Dividend paid (16) (18) (36) (81) (118)Cash generated from financing activities (1,190) (714) (1,064) (1,352) (1,778)Others (71) (83) 44 0 0 Net cash increase/ (decrease) 112 (110) 96 43 55
Source: Company, Anand Rathi Research
Fig 35 – Ratios Y/E March FY13 FY14 FY15e FY16e FY17e Margins (%) EBITDA margin 10.3 9.5 9.5 10.5 11.3 PBIT margin 2.5 1.3 2.2 3.9 5.4 PBT margin 2.6 1.3 2.3 4.0 5.5 PAT margin 1.6 0.7 1.6 2.6 3.7 Growth (%) Revenue growth (3.7) (2.4) 25.1 20.7 16.2 EBITDA growth 13.6 (10.2) 0.3 0.3 0.3 Net Profit growth 8.2 (56.0) 172.7 104.8 62.6 Return Ratios (%) RoCE 20.9 17.3 20.7 26.2 31.3 RoIC 12.9 8.9 13.7 17.3 20.8 RoE 10.9 4.3 10.9 19.4 25.8Turnover Asset-turnover ratio (x) 5.4 5.2 6.7 8.0 9.4 Working-capital cycle (days) 86.8 98.7 88.8 81.0 77.0 Average collection period (days) 98.1 94.5 90.0 88.0 87.0 Average payment period (days) 109.2 106.5 110.0 111.0 112.0 Inventory holding (days) 82.6 93.5 89.0 87.0 86.0 Per share (`) EPS 3.4 1.5 4.1 8.4 13.6 CEPS 6.7 4.4 7.3 12.2 17.7 Book Value 33.1 35.4 39.0 46.4 58.5 Solvency ratios Debt/ Equity 1.9 1.9 1.7 1.5 1.1 Interest coverage 1.4 1.2 1.4 1.7 2.2 Net Debt/ EBITDA 2.7 3.3 2.6 2.0 1.5 Valuation parameters (x) P/E 24.3 55.3 20.3 9.9 6.1 P/BV 2.5 2.3 2.1 1.8 1.4 EV/ EBITDA 6.4 7.5 6.0 4.5 3.5 EV/ Sales 0.7 0.7 0.6 0.5 0.4 M-Cap/ Sales 0.4 0.4 0.3 0.3 0.2
Source: Company, Anand Rathi Research

17 April 2015 KEI Industries – Multiple growth levers kicking in; initiating, with a Buy
Anand Rathi Research 16
Valuation We have attempted to arrive at a fair valuation by comparing it with its peer set. In these, brand equity offers advantages regarding realisations, margins, asset turnover, capital ratios, etc.
The peer set reports a high RoE and stable EBITDA margins. Aligning with the average of its peer set on parameters such as fixed-asset turnover, earnings and book value, we arrive at a fair price of `128. It is noteworthy that the company is set to report a 25.8% RoE and a 31% RoCE for FY17. Based on this, the justifiable EV/EBITDA parameter would be 5x. These become relevant as the company would be deleveraging quite sharply in coming years.
Considering that KEI could report an EBITDA margin of over 11%, we have ascribed an EV/EBITDA multiple of 5, a P/E of 10 and a P/B of 1.75 (considering its cash-flow-generating ability and high RoCE).
Fig 36 – Valuation FY17e (` m) Parameter Ascribed Multiple (x) Justifiable Price (`)
Revenue 28,432
EBITDA 3,220 EV/EBITDA 5 147
PAT 1,053 PE 10 136
Net worth 4,518 PB 1.8 102
Net debt 4,766
RoE (%) 25.8
Average target price 128
Source: Anand Rathi Research
Accordingly, we arrive at targets of `147 and `102. Averaging these, we get a target price of `128.
Fig 37 – PB band
KEII
0.2
0.6
1.0
1.4
1.8
0
10
20
30
40
50
60
70
80
90
100
Apr-0
8
Oct
-08
Apr-0
9
Oct
-09
Apr-1
0
Oct
-10
Apr-1
1
Oct
-11
Apr-1
2
Oct
-12
Apr-1
3
Oct
-13
Apr-1
4
Oct
-14
Apr-1
5
(`)
Source: Bloomberg, Anand Rathi Research

17 April 2015 KEI Industries – Multiple growth levers kicking in; initiating, with a Buy
Anand Rathi Research 17
Fig 38 – Peer comparison Company V-Guard Havells Finolex Cables KEIPE (X)
FY15e 43.2 42.4 19.6 20.3
FY16e 28.6 33.2 16.1 9.9
FY17e 22.4 26.2 12.6 6.1
PB (X)
FY15e 8.2 9.6 3.3 2.1
FY16e 6.7 8.2 2.8 1.8
FY17e 5.3 6.8 2.3 1.4
EV/EBITDA
FY15e 22.5 20.4 11.8 6.0
FY16e 16.5 17.2 9.4 4.5
FY17e 13.1 13.7 7.0 3.5
EBIDTA (%)
FY15e 7.8 9.3 11.5 9.5
FY16e 8.8 9.9 12.8 10.5
FY17e 9.1 10.8 14.6 11.3
RoE (%)
FY15e 20.6 24.0 18.4 10.9
FY16e 25.7 26.7 19.0 19.4
FY17e 26.3 28.3 20.3 25.8
RoCE (%)
FY15e 27.7 27.9 21.1 20.7
FY16e 33.5 30.1 22.2 26.2
FY17e 35.4 33.7 24.0 31.3
Debt Equity (x)
FY15e 0.2 0.4 0.1 1.7
FY16e 0.2 0.3 0.1 1.4
FY17e 0.1 0.2 0.0 1.1
Share of C&W (%)
FY14 31 26 85 89
Source: Anand Rathi Research
At the current price of `83, the stock trades at 6x FY17e P/E and 3.5x EV/EBITDA. We believe that the strong return-ratios, improving free-cash flows and constant payouts would drive growth. We reckon that the improving debt-equity ratio to 1.1x by FY17 would call for a re-rating. On the above analysis, we recommend a Buy on KEI, with a target price of `128, which gives us a 54% potential return.
Risks
Volatile raw material prices. Raw material (copper and aluminium) constitute around 74% of its expenditure. The inability to pass on the increase in raw material prices could cut into margins.
Higher interest rate. KEI is highly leveraged, with debt to equity of over 1x. Any upward movement in interest rates would hit it hard.

17 April 2015 KEI Industries – Multiple growth levers kicking in; initiating, with a Buy
Anand Rathi Research 18
Company Background & Management New Delhi-based KEI Industries was established in 1968 as a partnership firm, Krishna Electrical Industries. It primarily manufactures house-wiring rubber cables. With 400 products it is now established in EHV, MV and LV cables, addressing demand of more than 800 customers in different sectors: power, oil refineries, railways, automobiles, cement, steel, fertilisers, textiles, real estate, etc. It has also made a foray into engineering, procurement and construction (EPC) and was ranked one of the top-three cable-manufacturing companies in India
Its plants are located in Bhiwadi and Chopanki (Rajasthan) and Silvassa (D & NH). It has over 800 employees, 310 workers and 2,000 contract labourers across the country, with installed capacity of 600km of EHV cables, 5,000km of HT cables, 67,000km of LT cables, 280,000km of winding and house wires and 4,800 tonnes of stainless steel wire.
Fig 39 – Business model Source: Company
Its product basket comprises extra-high voltage cables up to and including 220kV, high and medium voltage cables, low tension cables, control and instrumentation cables, specialty and rubber cables, winding, flexibles and house wires, OVC/poly-wrapped winding wire, and stainless steel wire. It is also involved in engineering, procurement and construction, etc.
The company has a strong sales and distribution network in all metros, tier-I and tier-II cities with a strong order book of ~`17bn. Besides its dominance in its home market, it exports to about 45 countries. Its entry into the EHV segment was aided by technological collaboration with Switzerland-based Brugg Kabel AG, which has over 100 years’ experience manufacturing cables up to 550kV. This has enabled it faster entry into the EHV-cable market with designs which are sought by end-users.
Fig 40 – Management and Board of Directors Name Position Profile Mr Anil Gupta Chairman & MD M.Com from Delhi University and expert in Indian electrical cable. Rich
experience of 25 years at the helm of the KEI Group. Responsible for managing and implementing key policies relating to marketing, production, quality control and product development
Mr K.G. Somani Non- executive and independent director
Practicing chartered accountant and Fellow of The Institute of Chartered Accountants of India. Former president of The Institute of Chartered Accountants of India
Mr Rajeev Gupta ED (Finance) & CFO
B.Com (Hons.) and chartered accountant. About 20 years’ experience in finance. Heads the Finance and Accounts Department and designated as Executive Director (Finance) and CFO
Source: Company
KEI
Power cable
Housing wire
EPC segment
LT
66kv
Stainless steel wire
HT & EHV Above 66kv

Appendix Analyst Certification The views expressed in this Research Report accurately reflect the personal views of the analyst(s) about the subject securities or issuers and no part of the compensation of the research analyst(s) was, is, or will be directly or indirectly related to the specific recommendations or views expressed by the research analyst(s) in this report. The research analysts are bound by stringent internal regulations and also legal and statutory requirements of the Securities and Exchange Board of India (hereinafter “SEBI”) and the analysts’ compensation are completely delinked from all the other companies and/or entities of Anand Rathi, and have no bearing whatsoever on any recommendation that they have given in the Research Report.
Anand Rathi Ratings Definitions
Analysts’ ratings and the corresponding expected returns take into account our definitions of Large Caps (>US$1bn) and Mid/Small Caps (<US$1bn) as described in the Ratings Table below:
Ratings Guide Buy Hold Sell Large Caps (>US$1bn) >15% 5-15% <5% Mid/Small Caps (<US$1bn) >25% 5-25% <5%
Anand Rathi Research Ratings Distribution (as of 17 April 2015) Buy Hold Sell Anand Rathi Research stock coverage (196) 60% 27% 13%
% who are investment banking clients 4% 0% 0%
Research Disclaimer and Disclosure inter-alia as required under Securities and Exchange Board of India (Research Analysts) Regulations, 2014
Anand Rathi Share and Stock Brokers Ltd. (hereinafter refer as ARSSBL) (Research Entity) is a subsidiary of Anand Rathi Financial Services Ltd. ARSSBL is a corporate trading and clearing member of Bombay Stock Exchange Ltd, National Stock Exchange of India Ltd. (NSEIL), Multi Stock Exchange of India Ltd (MCX-SX), United Stock Exchange and also depository participant with National Securities Depository Ltd (NSDL) and Central Depository Services Ltd. ARSSBL is engaged in the business of Stock Broking, Depository Participant and Mutual Fund distributor.
The research analysts, strategists, or research associates principally responsible for the preparation of Anand Rathi research have received compensation based upon various factors, including quality of research, investor client feedback, stock picking, competitive factors and firm revenues.
General Disclaimer: This Research Report (hereinafter called “Report”) is meant solely for use by the recipient and is not for circulation. This Report does not constitute a personal recommendation or take into account the particular investment objectives, financial situations, or needs of individual clients. The recommendations, if any, made herein are expression of views and/or opinions and should not be deemed or construed to be neither advice for the purpose of purchase or sale of any security, derivatives or any other security through ARSSBL nor any solicitation or offering of any investment /trading opportunity on behalf of the issuer(s) of the respective security (ies) referred to herein. These information / opinions / views are not meant to serve as a professional investment guide for the readers. No action is solicited based upon the information provided herein. Recipients of this Report should rely on information/data arising out of their own investigations. Readers are advised to seek independent professional advice and arrive at an informed trading/investment decision before executing any trades or making any investments. This Report has been prepared on the basis of publicly available information, internally developed data and other sources believed by ARSSBL to be reliable. ARSSBL or its directors, employees, affiliates or representatives do not assume any responsibility for, or warrant the accuracy, completeness, adequacy and reliability of such information / opinions / views. While due care has been taken to ensure that the disclosures and opinions given are fair and reasonable, none of the directors, employees, affiliates or representatives of ARSSBL shall be liable for any direct, indirect, special, incidental, consequential, punitive or exemplary damages, including lost profits arising in any way whatsoever from the information / opinions / views contained in this Report. The price and value of the investments referred to in this Report and the income from them may go down as well as up, and investors may realize losses on any investments. Past performance is not a guide for future performance. ARSSBL does not provide tax advice to its clients, and all investors are strongly advised to consult with their tax advisers regarding taxation aspects of any potential investment.
Opinions expressed are our current opinions as of the date appearing on this Research only. We do not undertake to advise you as to any change of our views expressed in this Report. Research Report may differ between ARSSBL’s RAs and/ or ARSSBL’s associate companies on account of differences in research methodology, personal judgment and difference in time horizons for which recommendations are made. User should keep this risk in mind and not hold ARSSBL, its employees and associates responsible for any losses, damages of any type whatsoever.

ARSSBL and its associates or employees may; (a) from time to time, have long or short positions in, and buy or sell the investments in/ security of company (ies) mentioned herein or (b) be engaged in any other transaction involving such investments/ securities of company (ies) discussed herein or act as advisor or lender / borrower to such company (ies) these and other activities of ARSSBL and its associates or employees may not be construed as potential conflict of interest with respect to any recommendation and related information and opinions. Without limiting any of the foregoing, in no event shall ARSSBL and its associates or employees or any third party involved in, or related to computing or compiling the information have any liability for any damages of any kind.
Details of Associates of ARSSBL and Brief History of Disciplinary action by regulatory authorities & its associates are available on our website i. e. www.rathi.com
Disclaimers in respect of jurisdiction: This report is not directed to, or intended for distribution to or use by, any person or entity who is a citizen or resident of or located in any locality, state, country or other jurisdiction where such distribution, publication, availability or use would be contrary to law or regulation or which would subject ARSSBL to any registration or licensing requirement within such jurisdiction(s). No action has been or will be taken by ARSSBL in any jurisdiction (other than India), where any action for such purpose(s) is required. Accordingly, this Report shall not be possessed, circulated and/or distributed in any such country or jurisdiction unless such action is in compliance with all applicable laws and regulations of such country or jurisdiction. ARSSBL requires such recipient to inform himself about and to observe any restrictions at his own expense, without any liability to ARSSBL. Any dispute arising out of this Report shall be subject to the exclusive jurisdiction of the Courts in India.
Statements on ownership and material conflicts of interest, compensation - ARSSBL and Associates
Answers to the Best of the knowledge and belief of ARSSBL/ its Associates/ Research Analyst who is preparing this report
ARSSBL/its Associates/ Research Analyst/ his Relative have any financial interest in the subject company? Nature of Interest (if applicable) No
ARSSBL/its Associates/ Research Analyst/ his Relative have actual/beneficial ownership of one per cent or more securities of the subject company No
ARSSBL/its Associates/ Research Analyst/ his Relative have any other material conflict of interest at the time of publication of the research report or at the time of public appearance?
No
ARSSBL/its Associates/ Research Analyst/ his Relative have received any compensation from the subject company in the past twelve months No
ARSSBL/its Associates/ Research Analyst/ his Relative have managed or co-managed public offering of securities for the subject company in the past twelve months
No
ARSSBL/its Associates/ Research Analyst/ his Relative have received any compensation for investment banking or merchant banking or brokerage services from the subject company in the past twelve months
No
ARSSBL/its Associates/ Research Analyst/ his Relative have received any compensation for products or services other than investment banking or merchant banking or brokerage services from the subject company in the past twelve months
No
ARSSBL/its Associates/ Research Analyst/ his Relative have received any compensation or other benefits from the subject company or third party in connection with the research report Other Disclosures pertaining to distribution of research in the United States of America
This material was produced by ARSSBL, solely for information purposes and for the use of the recipient. It is not to be reproduced under anycircumstances and is not to be copied or made available to any person other than the recipient. It is distributed in the United States of America by Enclave Capital LLC (19 West 44th Street, Suite 1700, New York, NY 10036) and elsewhere in the world by ARSSBL or an authorized affiliate ofARSSBL (such entities and any other entity, directly or indirectly, controlled by ARSSBL, the “Affiliates”). This document does not constitute an offer of,or an invitation by or on behalf of ARSSBL or its Affiliates or any other company to any person, to buy or sell any security. The information contained herein has been obtained from published information and other sources, which ARSSBL or its Affiliates consider to be reliable. None of ARSSBL or itsAffiliates accepts any liability or responsibility whatsoever for the accuracy or completeness of any such information. All estimates, expressions of opinion and other subjective judgments contained herein are made as of the date of this document. Emerging securities markets may be subject torisks significantly higher than more established markets. In particular, the political and economic environment, company practices and market pricesand volumes may be subject to significant variations. The ability to assess such risks may also be limited due to significantly lower information quantityand quality. By accepting this document, you agree to be bound by all the foregoing provisions.
1. ARSSBL or its Affiliates may or may not have been beneficial owners of the securities mentioned in this report.
2. ARSSBL or its affiliates may have or not managed or co-managed a public offering of the securities mentioned in the report in the past 12 months.
3. ARSSBL or its affiliates may have or not received compensation for investment banking services from the issuer of these securities in the past 12months and do not expect to receive compensation for investment banking services from the issuer of these securities within the next three months.
4. However, one or more of ARSSBL or its Affiliates may, from time to time, have a long or short position in any of the securities mentioned herein and may buy or sell those securities or options thereon, either on their own account or on behalf of their clients.
5. As of the publication of this report, ARSSBL does not make a market in the subject securities.
6. ARSSBL or its Affiliates may or may not, to the extent permitted by law, act upon or use the above material or the conclusions stated above, or theresearch or analysis on which they are based before the material is published to recipients and from time to time, provide investment banking, investment management or other services for or solicit to seek to obtain investment banking, or other securities business from, any entity referred to inthis report.
Enclave Capital LLC is distributing this document in the United States of America. ARSSBL accepts responsibility for its contents. Any US customer wishing to effect transactions in any securities referred to herein or options thereon should do so only by contacting a representative of Enclave CapitalLLC.
© 2014. This report is strictly confidential and is being furnished to you solely for your information. All material presented in this report, unlessspecifically indicated otherwise, is under copyright to ARSSBL. None of the material, its content, or any copy of such material or content, may be altered in any way, transmitted, copied or reproduced (in whole or in part) or redistributed in any form to any other party, without the prior expresswritten permission of ARSSBL. All trademarks, service marks and logos used in this report are trademarks or service marks or registered trademarks or service marks of ARSSBL or its affiliates, unless specifically mentioned otherwise.
Additional information on recommended securities/instruments is available on request.
ARSSBL registered address: 4th Floor, Silver Metropolis, Jaicoach Compound, Opposite Bimbisar Nagar, Goregaon (East), Mumbai - 400 063. Tel No: +91 22 4001 3700 | Fax No: +91 22 4001 3770 | CIN: U67120MH1991PLC064106.
No