Embed Size (px)
Citation preview

279
CHAPTER 5
DISCUSSION OF THE RESEARCH RESULTS
5.1 INTRODUCTION
This chapter presents the discussion and analysis of the research results
reported in chapter 4. Where applicable, the results are also examined in
association with the theoretical research propositions, formulated in chapter
2, the literature review.
Section 5.2 presents the discussion of results as related to part A of the
research questionnaire. This part dealt with the general classification of the
respondents. Section 5.3 presents the discussion of the results for part 8
of the questionnaire. Part 8 examined the general orientation of personnel
employed in public sector work departments to project management.
The discussion of the results of part C of the questionnaire is presented in
section 5.4. Part C focused on the process-related issues of formulating
and implementing a strategy for formalized project management. The
results of the content-related issues, which were incorporated into part D
of the research questionnaire, are discussed in section 5.5.
Section 5.6 presents the discussion of the results of the last portion of the
questionnaire. In this portion, an attempt was made to theoretically assess
the chances of successfully implementing formalized project management
in public sector work departments. Finally, section 5. 7 gives the chapter
summary.
Digitised by the University of Pretoria, Library Services, 2012

280
5.2 PART A: CLASSIFICATION OF RESEARCH POPULATION
5.2.1 Number of respondents
As noted in subsection 4.2.1, 172 questionnaires were returned out of an
estimated research population size of 240. While 172 questionnaires were
returned, only an average of 167 could finally be used. The difference is
attributed to a number of questionnaires that had to be discarded during
the data capturing process. This was necessary because in some cases,
questionnaires were completed by individuals who, based on the research
population criteria, had to be excluded from participating in this research
and in other cases, complete blank questionnaires were returned. These
discarded questionnaires typically represent variations of a and f3 errors
described in section 3.6. The 70 percent response rate after this correction
is still high and the correction should not affect the overall represen
tativeness of the research results.
5.2.2 Analysis of respondents
The results of the breakdown of the total number of respondents in the
different managerial levels were reported in table 4.2. Middle management
(group B) represented the single largest proportion at 58 percent, then
lower or functional management (group C) at 27 percent and finally, top
management (group A) constituted 15 percent. Ideally, the proportion of
lower management should be greater in order to better reflect the typical
hierarchical structures found in organizations.
The breakdown of the total number of respondents in the different
application groups was reported in table 4.3. Group I (where formal project
management is applied) represented 43 percent of the respondents, group
II (where informal project management is applied) - 37 percent, and group
Digitised by the University of Pretoria, Library Services, 2012

281
Ill (where no project management is applied) - only 20 percent.
Given the high proportion of respondents who indicated that formal project
management was already being applied in their departments and a focus
point of this research, namely to develop an implementation strategy for
formalized project management in public sector work departments
generally, this result was unexpectedly high. However, it may be argued
that the results of the research could still be of use to departments where
informal or no project management is currently being applied (in this case
57 percent of respondents work in such departments). Furthermore, a
close examination of the results for group I may provide valuable insights
into the practical experiences of respondents gained during the actual
implementation of formalized project management in their respective
departments.
5.2.3 Number of years worked in a public sector work department
As a whole (hereafter referred to as 110VeraW), the average number of years
that respondents had worked in a public sector work department was 12.
The breakdown of the average number of years in the different managerial
groups (see table 4.4) was 16 for top management (group A), 13 for middle
management (group B), and 6 for lower management (group C).
Statistically, groups A and B are similar but different to group C.
In the case of the breakdown in the different application groups (see table
4.5), the average number of years was very similar for all three groups. For
group I (formal project management) it was 12 years, while for both group
II (informal project management) and group Ill (no project management),
it was 11 years.
Digitised by the University of Pretoria, Library Services, 2012

282
5.2.4 Professional status of respondents
Overall, the breakdown of respondents in the different professional groups
were: architects (24%), engineers (32%), quantity surveyors (23%) and 110thersn (21 %). The 110thers .. category included personnel, such as land
surveyors, town and regional planners, valuers and works supervisors.
The professional status of respondents in the different managerial groups
showed some variation from the overall breakdown as reported above (see
table 4. 6). Deviations of more than 5 percent which are noteworthy are
group A- engineers ( + 18%), quantity surveyors (-6%), and 110thers .. (-13%);
group C - architects (-6%) and 110thersn ( + 11 %).
In the case of the breakdown in the different application groups (see table
4.7), the professional status of respondents in each group again did not
reflect the overall pattern reported above. Deviations of more than 5
percent which are noteworthy are group I - 110thersn ( + 1 0%); group II -
architects ( + 7%); group Ill - architects (-9%), engineers ( + 11 %), quantity
surveyors ( + 13%) and 110thers 11 ( -15%).
5.2.5 Highest formal qualification
Overall, the breakdown of the highest formal qualification of respondents
was degrees (69%), diplomas (20%) and 110ther .. (11 %). The personnel in
the 110ther .. category generally held senior certificates.
The highest formal qualification of respondents in the different managerial
groups showed some variation from the overall breakdown reported above
(see table 4.8). Deviations of more than 5 percent which are noteworthy are
group A - degrees ( + 6%) and 110ther 11 ( -11 %) ; group C - degrees (-6%) and
110thers 11 ( +9%). Moreover, it should be noted that all respondents in group
Digitised by the University of Pretoria, Library Services, 2012

283
A either held a degree or diploma, while in groups B and C, 90 percent
and 80 percent of the respondents, respectively, were similarly qualified.
In the case of the breakdown in the different application groups (see table
4.9), the highest formal qualifications of respondents in each group again
did not reflect the overall breakdown reported above. Deviations of more
than 5 percent which are noteworthy are group Ill - degrees ( + 16%) and
diplomas (-11 %).
5.3 PART 8: GENERAL ORIENTATION TO PROJECT MANAGEMENT
5.3.1 Current application of project management
Overall, 65 percent of the respondents confirmed that project management
was currently being applied in their departments. The confirmation
percentages in the different managerial groups (see table 4.1 0) were group
A - 75%, group B - 61% and group C - 67%.
5.3.2 Extent of current application of project management
The overall breakdown of the total number of respondents in the different
application groups was previously reported in subsection 4.3.1. There 80
percent of respondents indicated that project management was either
formally or informally applied. The division in the different managerial
groups, reported in table 4.11, showed minor variations from the overall
pattern. For group A, the corresponding figure was 83%, for group B- 81%
and for group C - 77%.
Digitised by the University of Pretoria, Library Services, 2012
284
5.3.3 General attitude towards project management
Overall, 53 percent of the respondents perceived that their department held
a positive, 41 percent a neutral and only 6 percent a negative attitude
towards project management. The division in the different managerial
groups, reported in table 4.12, showed some variation from the overall
pattern. Deviations of more than 5 percent which are noteworthy are group
A- positive (+10%) and neutral (-12%); group C- positive (+6%).
In the case of the breakdown in the different application groups (see table
4.13), group I was statistically, significantly different to groups II and Ill. In
this group (note it is the group where formal project management is
currently being applied), 75 percent of the respondents perceived their
department's attitude as positive, 22 percent as neutral and only 3 percent
as negative. In group II (where informal project management is currently
being applied), 36 percent of the respondents perceived their department's
attitude towards project management as positive, 61 percent as neutral and
3 percent as negative. Of particular interest is group Ill (where no project
management is currently being applied), where 32 percent of the
respondents perceived their department's attitude as positive, 49 percent
as neutral but 19 percent (the highest of the three application groups) as
negative. Statistically, groups II and Ill are similar but different to group I.
Focusing on the respondents' own attitude towards project management,
overall, 83 percent held a positive, 14 percent a neutral and only 3 percent
a negative attitude. The division in the different managerial groups,
reported in table 4.14, showed minor variations from the overall pattern.
Deviations of more than 5 percent which are noteworthy are group A- posi
tive (+8%), neutral (-14%) and negative (+6%). In the case of the break
down in the different application groups (see table 4.15), there were also
minor variations from the overall pattern. Deviations of more than 5 percent
Digitised by the University of Pretoria, Library Services, 2012

285
which are noteworthy are group I - positive ( + 7%) and neutral ( -8%); group
Ill - positive (-8%).
5.3.4 General knowledge of project management
Overall, 35 percent of the respondents felt they had a good knowledge
about project management concepts and philosophy, 50 percent an
average knowledge and 15 percent a limited knowledge. The division in the
different managerial groups, reported in table 4.16, showed some variation
from the overall pattern. Deviations of more than 5 percent which are
noteworthy are group A- good ( + 15%), average (-8%) and limited (-7%);
group C- average (-6%) and limited ( + 1 0%). In the case of the breakdown
in the different application groups (see table 4.17), there were also some
variations from the overall pattern. Deviations of more than 5 percent which
are noteworthy are group I- good ( +8%) and limited (-7%); group II- good
(-8%) and average ( + 7%); group Ill -average (-7%) and limited ( +9%).
With regard to knowledge about project management techniques, overall,
23 percent of the respondents felt they had a good knowledge, 38 percent
an average knowledge and 39 percent a limited knowledge. The division
in the different managerial groups, reported in table 4.18, showed some
variation from the overall pattern. Deviations of more than 5 percent which
are noteworthy are group A- average ( + 14%) and limited (-17%); group B
- average (-6%). In the case of the breakdown in the different application
groups (see table 4.19), there were also some variations from the overall
pattern. Deviations of more than 5 percent which are noteworthy are group
1 - good (+6%) and limited (-5%); group II - good (-10%) and average
(+8%); group Ill- average (-13%) and limited (+11%).
Digitised by the University of Pretoria, Library Services, 2012

286
5.4 PART C: MANAGEMENT OF CHANGE
5.4.1 Chances of successfully implementing project management with
no changes in current operations
Overall, 21 percent of the respondents believed that the chances of
successfully implementing project management, with no changes in the
way it currently operated, were small (less than a 25% chance of success),
28 percent believed the chances were limited (25% but less than a 50%
chance of success), 39 percent believed the chances were reasonable
(50% but less than a 75% chance of success), and 12 percent believed the
chances were good (greater than a 75% chance of success).
The division in the different managerial groups, reported in table 4.20,
showed some variation from the overall pattern. Deviations of more than 5
percent which are noteworthy are group A- limited (-7%) and reasonable
( + 11 %) ; group 8 - limited ( + 6%); group C - limited ( -8%) and good ( + 6%).
In the case of the breakdown in the different application groups (see table
4.21 ), there were also some variations from the overall pattern. Deviations
of more than 5 percent which are noteworthy are group I - small (-7%),
limited (-7%), reasonable (+6%) and good (+8%); group Ill-small (+15%),
limited ( + 17%), reasonable (-23%) and good (-9%). Statistically, groups I
and II are similar but significantly different to group Ill. This means that
group Ill (where no project management is being applied) believe that the
chances of successfully implementing project management are significantly
different (in this case, smaller) to groups I and II.
5.4.2 Past performance of the departments
Overall, 35 percent of the respondents believed that the past performance
of their department was good in meeting its objectives, 56 percent believed
Digitised by the University of Pretoria, Library Services, 2012

287
it was average and only 9 percent believed it was poor. The division in the
different managerial groups, reported in table 4.22, showed some variation
from the overall pattern. Deviations of more than 5 percent which are
noteworthy are group A - good (-6%), average ( + 15%) and poor (-9%);
group B - average (-6%). In the case of the breakdown in the different
application groups (see table 4.23), there were also some variations from
the overall pattern. Deviations of more than 5 percent which are noteworthy
are group I - good ( + 1 0%) and average ( -9%); group Ill - good ( -11 %) and
average (+8%).
With regard to the past performance of the department in utilizing its
resources efficiently, overall, 24 percent of the respondents believed it was
good, 58 percent believed it was average, and 18 percent believed it was
poor. The division in the different managerial groups, reported in table
4.24, showed some variation from the overall pattern. Deviations of more
than 5 percent which are noteworthy are group A- good (-7%), average
( + 13%) and poor ( -6%); group C - poor ( + 6%). In the case of the
breakdown in the different application groups (see table 4.25), there were
also some variations from the overall pattern. Deviations of more than 5
percent which are noteworthy are group Ill - average (-8%) and poor
(+ 7%).
In summary, 91 percent of the respondents overall, believed that the past
performance of their departments in meeting their objectives was average
or good, while 82 percent believed that the past performance of their
departments in utilizing their resources efficiently was average or good.
With reference to research proposition 74 (see subsection 2.4.8.2), it may
thus be concluded that the past performance of the departments are
perceived to be effective. The first part of that proposition can thus
generally be confirmed.
Digitised by the University of Pretoria, Library Services, 2012

288
5.4.3 Disrupting forces in the departments
Overall, 81 percent of the respondents confirmed that there were disrupting
forces which restrained their department from obtaining optimal perfor
mance. The confirmation percentages in the different managerial groups
(see table 4.26) were group A- 88%, group 8- 82% and group C -75%. In
the case of the breakdown in the different application groups (see table
4.27), the confirmation percentages in the different application groups were
as follows: group I - 85%, group II - 81% and group Ill - 76%.
With reference to research proposition 62 (see subsection 2.4.3), it may
thus be concluded that there are disrupting forces present which restrain
the departments from obtaining optimal performance.
5.4.4 Adjustments necessary inside the departments
Overall, 84 percent of the respondents confirmed that adjustments inside
the department were necessary in order to maintain or improve on their
performance. The confirmation percentages in the different managerial
groups (see table 4.28) were group A- 78%, group 8 - 85% and group C -
83%. In the case of the breakdown in the different application groups (see
table 4.29), the confirmation percentages in the different application groups
were group I - 81%, group II - 83% and group Ill - 87%.
With reference to research proposition 62 (see subsection 2.4.3), it may
thus be concluded that adjustments inside the departments are necessary
in order to maintain or improve on their performances.
Digitised by the University of Pretoria, Library Services, 2012

289
5.4.5 Origin of the force providing the greatest stimulus for change
Overall, 55 percent of the respondents believed that the origin of forces
providing the greatest stimulus for change were external while 45 percent
believed it was internal. The division in the different managerial groups,
reported in table 4.30, differed from the overall pattern. Deviations of more
than 5 percent which are noteworthy are group A - external (-7%) and
internal ( + 7%). Groups Band C thus conform to the overall pattern where
the origin of the greatest force was external but group A (top management)
believed the origin of the force to be internal.
In the case of the breakdown in the different application groups (see table
4.31 ), there were only minor variations from the overall pattern but no
deviations of more than 5 percent are noted. All three groups believed that
the origin of greatest force providing the stimulus for change was external.
With reference to research proposition 62 (see subsection 2.4.3), it may
thus be concluded that the origin of the force providing the greatest
stimulus for change is external (note that for group A - top management it
was internal). The proposition can thus generally be confirmed.
5.4.6 General attitude of the departments towards change
Overall, 56 percent of the respondents believed that their department
generally resisted changes while 44 percent believed that their department
embraced changes. The division in the different managerial groups,
reported in table 4.32, differed from the overall pattern. Deviations of more
than 5 percent which are noteworthy are group A - embraced ( + 15%) and
resisted (-15%). Groups Band C thus conform to the overall pattern where
changes were generally resisted but group A (top management) believed
that changes were generally embraced.
Digitised by the University of Pretoria, Library Services, 2012

290
In the case of the breakdown in the different application groups (see table
4.33), there were also some variations from the overall pattern. Deviations
of more than 5 percent which are noteworthy are group I - embraced
(+15%) and resisted (-15%). Groups II and Ill thus conform to the overall
pattern where changes are generally resisted but group I (where formal
project management is applied) believed that changes are generally
embraced.
With regard to the general attitude of the departments towards the initiation
of changes, overall 56 percent of the respondents believed changes were
infrequently initiated, while 44 percent believed they were frequently
initiated. The division in the different managerial groups, reported in table
4.34, showed some variation from the overall pattern. Deviations of more
than 5 percent which are noteworthy are group A - frequently ( + 1 0%) and
infrequently (-1 0%). Groups B and C thus conform to the overall pattern
where changes generally are infrequently initiated but group A (top
management), believed that changes are frequently initiated.
In the case of the breakdown in the different application groups (see table
4.35), there were also some variations from the overall pattern. Deviations
of more than 5 percent which are noteworthy are group Ill - frequently (-
14%) and infrequently ( + 14%). All three groups believed that generally,
changes are infrequently initiated.
In summary, it may thus be concluded that departments acting on changes
generally resist and infrequently initiate changes. Note that for group A (top
management) and group I (where formal project management is applied)
changes are generally embraced. With reference to research proposition
63 (see subsection 2.4.3), it may thus be concluded (with these two
exceptions noted) that the departments generally reflect resistance to
change. The proposition can thus generally be confirmed.
Digitised by the University of Pretoria, Library Services, 2012

291
5.4.7 Contribution of implementing project management
Overall, 78 percent of the respondents confirmed that they believed
implementing project management would contribute to a solution to deal
with the disrupting forces which affect their departments. The confirmation
percentages in the different managerial groups (see table 4.36) were group
A- 83%, group B - 76% and group C - 81%. In the case of the breakdown
in the different application groups (see table 4.37), the confirmation
percentages were group I - 76%, group II - 82% and group Ill - 77%.
With reference to research proposition 61 (see subsection 2.4.2), it may
thus be concluded that implementing project management in public sector
work departments through a managed organizational change process may
contribute to dealing with the disrupting forces which restrict them from
obtaining optimal performance. The proposition can thus generally be
confirmed.
5.4.8 Number of changes needed to implement project management
Overall, 29 percent of the respondents believed that many changes would
be needed in order to implement project management effectively and
efficiently in their department, 69 percent believed that some changes were
needed, while only 2 percent believed that no changes would be needed.
The division in the different managerial groups, reported in table 4.38,
differed from the overall pattern. Deviations of more than 5 percent which
are noteworthy are group A- many changes (-8%) and no changes ( +6%).
In the case of the breakdown in the different application groups (see table
4.39), there were also some variations from the overall pattern. Deviations
of more than 5 percent which are noteworthy are group I - many changes
( -7%) and some changes ( + 6%); group Ill - many changes ( + 16%) and
Digitised by the University of Pretoria, Library Services, 2012

292
some changes ( + 14%). Statistically, groups I and II as well as groups II
and Ill are similar. Groups I and Ill are significantly different to each other.
This means that for group I (where formal project management is being
applied), the number of changes needed to implement project
management are significantly different (in this case, less) to those for group
Ill where no project management is applied.
In summary, it may thus be concluded that some changes would be
needed in order to implement project management. Note that for group I,
the number of changes needed are significantly less than for group Ill
where no project management is applied. This result is relevant for
propositions 7 4 and 75. These propositions will be discussed in
subsections 5.4.17 and 5.4.20.
5.4.9 Criteria for the selection of change strategies
Overall, 63 percent of the respondents confirmed that they believed that
substantial time was needed to implement project management. The
confirmation percentages in the different managerial groups (see table
4.40) were group A - 40%, group B - 70% and group C - 60%. Group A
(top management) thus rather believed that implementing project
management would not require substantial time. Statistically, groups A and
C as well as groups B and C are similar. Groups A and B are significantly
different to each other. This means that for group A, the time needed to
implement project management is significantly different (in this case, less)
than for group B. In the case of the breakdown in the different application
groups (see table 4.41 ), the confirmation percentages were group I- 63%,
group II - 66% and group Ill -59%.
Overall, 53 percent of the respondents confirmed that they did not believe
that extensive changes were needed to implement project management.
Digitised by the University of Pretoria, Library Services, 2012

293
The confirmation percentages in the different managerial groups (see table
4.42) were group A - 70%, group 8 - 48% and group C - 55%. Group 8
(middle management) thus rather believed that extensive changes would
be needed to implement project management. In the case of the
breakdown in the different application groups (see table 4.43), the
confirmation percentages (statistically significant) were group I - 64%,
group II - 45% and group Ill - 39%. Groups II and Ill thus rather believed
that extensive changes would be needed in order to implement project
management.
Overall, 55 percent of the respondents confirmed that the general attitude
of personnel employed within their departments to implementing project
management was favourable. The confirmation percentages in the different
managerial groups (see table 4.44) were group A- 70%, group 8 -53%
and group C - 52%. In the case of the breakdown in the different
application groups (see table 4.45), the confirmation percentages were
group I-57%, group II- 49% and group Ill- 50%. Groups II and Ill thus did
not show a clear indication whether personnel within their departments
would either be favourably or unfavourably disposed to implementing
project management.
Overall, 55 percent of the respondents rejected the notion that an outside
consultant would be the best to manage the implementation of project
management. The rejection percentages in the different managerial groups
(see table 4.46) were group A - 64%, group 8 - 56% and group C - 49%.
Group C (lower management) thus did not show a clear indication of its
preference in the use of an outside consultant or not. In the case of the
breakdown in the different application groups (see table 4.47), the
confirmation percentages were group I- 59%, group II- 58% and group Ill-
35%. Group Ill thus rather believed that an outside consultant would be
best to manage the implementation of project management.
Digitised by the University of Pretoria, Library Services, 2012

294
In summary, it may thus be concluded that (1) substantial time was needed
to implement project management (note that for group A the time needed
was significantly less) (2) extensive changes would not be needed (note
that for group B extensive changes were indicated and for groups II and
Ill extensive changes, statistically significant, were indicated) (3) the general
attitude of personnel was favourable (note that groups II and Ill did not give
a clear indication of personnel favourableness) and (4) an outside
consultant would not be the best person to manage the implementation of
project management (note that for group Ill an outside consultant was the
preferred choice).
Given the obtained research results, research proposition 66 (see sub
section 2.4.5.1) can thus not be confirmed. The proposition should rather
be reformulated to reflect the position as follows: (1) time required - long
(2) extensiveness of change - small (3) favourableness of change target -
favourable and (4) suitability of change agent - manager from within the
department to manage the implementation.
5.4.1 0 Objects of change for implementing project management
Overall, the rank order for the objects of change for implementing project
management with the greatest priority was (1) procedures (organizational
processes) (2) functions (individual task behaviour) (3) direction (strategic
direction) and (4) attitudes (organizational culture). The division in the
different managerial groups, reported in table 4.48, differed slightly from the
overall pattern. Deviations which are noteworthy are group C - ranked
attitudes in (3) and direction in (4). A plausible explanation for their rank
order is that lower management typically do not concern themselves with
the strategic direction of the organization. In the case of the breakdown in
the different application groups (see table 4.49), there were also some
variations from the overall pattern. Deviations which are noteworthy are
Digitised by the University of Pretoria, Library Services, 2012

295
group I -ranked attitudes as (3) direction as (4); groups II and Ill - ranked
direction as (2) and functions as (3). A plausible explanation for this higher
rank order of strategic direction is that in these groups formal project
management is not yet applied and it would require a strategic decision to
do so.
Given the obtained research results, research proposition 64 (see
subsection 2.4.4.1) can thus not be confirmed. The proposition should
rather be reformulated to reflect the rank order as follows: (1) procedures
(organizational processes) (2) functions (individual task behaviour) (3)
direction (strategic direction) and (4) attitudes (organizational culture).
5.4.11 Methods of change for implementing project management
Overall, the rank order for the methods of change for implementing project
management which were the most appropriate was (1) structural (2)
human-oriented (3) managerial and (4) technological. The division in the
different managerial groups, reported in table 4.50, differed from the overall
pattern. Deviations which are noteworthy are group A- ranked the positions
as: (1) human-oriented (2) structural (3) technological and (4) managerial.
In the case of the breakdown in the different application groups (see table
4.51 ), there were also some variations from the overall pattern. Deviations
which are noteworthy are group I - ranked technological methods in (3)
and managerial methods in (4); group Ill- ranked human-oriented methods
in (1) and structural methods in (2).
With reference to research proposition 65 (see subsection 2.4.4.2), it may
thus be concluded that the rank order of methods which are most appro
priate for implementing project management in public sector work
departments is (1) structural (2) human-oriented (3) managerial and (4)
technological. The proposition can thus generally be confirmed.
Digitised by the University of Pretoria, Library Services, 2012

296
5.4.12 Change policies for implementing project management
Overall, 57 percent of the respondents confirmed that a change policy for
implementing project management show allow for gradual implementation.
The confirmation percentages in the different managerial groups (see table
4.52) were group A - 61%, group B - 58% and group C - 52%. In the case
of the breakdown in the different application groups (see table 4.53), the
confirmation percentages were group I- 50%, group II- 65% and group Ill-
55%. Group I thus did not show a clear indication whether a change policy
for project management should allow for either gradual of immediate
implementation.
With reference to research proposition 70 (see subsection 2.4.7.1 ), it may
thus be concluded that a change policy for implementing project manage
ment should allow for gradual implementation. The proposition can thus
generally be confirmed.
5.4.13 Change strategies for implementing project management
Overall, the rank order for the change strategies for implementing project
management which were the most appropriate was (1) informational (2)
facilitative (3) attitudinal and (4) political. The division in the different
managerial groups, reported in table 4.54, showed no variation from the
overall pattern. In the case of the breakdown in the different application
groups (see table 4.55), there were some differences to the overall pattern.
Deviations which are noteworthy are groups I and Ill - both ranked
facilitative strategies as (1) and informational strategies as (2).
Given the obtained research results, research proposition 67 (see
subsection 2.4.5.2) can thus not be confirmed. The proposition should
rather be reformulated to reflect the rank order as follows: (1) informational
Digitised by the University of Pretoria, Library Services, 2012

297
(2) facilitative (3) attitudinal and (4) political.
5.4.14 Critical activities for implementing project management
Overall, the rank order for the most critical activities for implementing
project management was (1) implementing (2) supporting (institution
alization) and (3) feasibility. The division in the different managerial groups,
reported in table 4.56, differed from the overall pattern. Deviations which
are noteworthy are group B - ranked supporting as (1) feasibility as (2) and
implementing as (3); group C - ranked feasibility as (2) and supporting as
(3). In the case of the breakdown in the different application groups (see
table 4.57), there were some variations from the overall pattern. Deviations
which are noteworthy are group I - ranked supporting as (1) feasibility as
(2) and implementing as (3); group II - ranked supporting as (1) imple
menting as (2) and feasibility as (3); group Ill- ranked feasibility as (2) and
supporting as (3).
Given the obtained research results, research proposition 71 (see
subsection 2.4.7.2) can thus not be confirmed. The proposition should
rather be reformulated to reflect the rank order as (1) implementing (2)
supporting and (3) feasibility.
5.4.15 Participants for implementing project management
Overall, the rank order for the best person suited to fulfil the role of change
manager when implementing project management was (1) top-level
management (2) middle management (3) project management and (4)
lower or functional management. The division in the different managerial
groups, reported in table 4.58, differed from the overall pattern. Deviations
which are noteworthy are group A - ranked both project and lower
management as (3); group B - ranked lower management as (3) and
Digitised by the University of Pretoria, Library Services, 2012

298
project management as (4). In the case of the breakdown in the different
application groups (see table 4.59), there were also some variations from
the overall pattern. Deviations which are noteworthy are group 1 - ranked
lower management as (3) and project management as (4); groups II and
Ill -ranked middle management as (1) and top-level management as (2).
Overall, the rank order for the best person suited to fulfil the role of change
agent when implementing project management was (1) middle manage
ment (2) project management (3) lower or functional management and (4)
top-level management. The division in the different managerial groups,
reported in table 4.60, differed from the overall pattern. Deviations which
are noteworthy are group A- ranked lower management as (2) and project
management as (3). In the case of the breakdown in the different
application groups (see table 4.61 ), there were also some variations from
the overall pattern. Deviations which are noteworthy are group I - ranked
top-level management as (2) project management as (3) and lower
management as (4); group Ill - ranked project management as (1) and
middle management as (2).
Overall, the rank order for the best person suited to fulfil the role of the
change target when implementing project management was (1) lower or
functional management (2) project management (3) middle management
and (4) top-level management. The division in the different managerial
groups, reported in table 4.62, differed from the overall pattern. Deviations
which are noteworthy are group C-ranked project management as (1) and
both middle and lower management as (2). In the case of the breakdown
in the different application groups (see table 4.63), there were also some
variations from the overall pattern. Deviations which are noteworthy are
groups I and II -ranked project management as (1) and lower management
as (2); group Ill- ranked middle management as (1) lower management as
(2) top-level management as (3) and project management as (4).
Digitised by the University of Pretoria, Library Services, 2012

299
With reference to research proposition 68 (see subsection 2.4.6), it may
thus be concluded that the persons best suited for implementing project
management are the change manager- top-level management; the change
agent - middle management; and the change target - lower or functional
management. The proposition can thus generally be confirmed.
5.4.16 Source of resistance to implementing project management
Overall, the rank order for the greatest source (or barrier to) of resistance
when implementing project management was (1) understanding (2) acting
and (3) acceptance. The division in the different managerial groups,
reported in table 4.64, differed from the overall pattern. Deviations which
are noteworthy are group C - ranked acting as (1) and understanding as
(2). In the case of the breakdown in the different application groups (see
table 4.65), there were some variations from the overall pattern. Deviations
which are noteworthy are group Ill -ranked acting as (1) acceptance as (2)
and understanding as (3).
Given the obtained research results, research proposition 69 (see
subsection 2.4.6.2) can thus not be confirmed. The proposition should
rather be reformulated to reflect the rank order as follows: (1)
understanding (2) acting and (3) acceptance.
5.4.17 .. Easy fit .. for project management in departments
Overall, 66 percent of the respondents confirmed that they believed that
project management would easily fit into 11the way things were donell in
their department and also 11the way people thought and acted 11• The
confirmation percentages in the different managerial groups (see table
4.66) were group A- 83%, group B- 61% and group C - 69%. In the case
of the breakdown in the different application groups (see table 4.67), the
Digitised by the University of Pretoria, Library Services, 2012

300
confirmation percentages were group I- 77%, group II- 60% and group Ill-
48%. Group Ill thus did not believe that project management would easily
fit into 11the way things were donell in their department and also with 11the
way people thought and acted 11•
With reference to research proposition 75 (see subsection 2.4.8.3), it may
thus be concluded that implementing project management in public sector
work departments would easily fit in with 11the way things were don ell in the
departments and also with 11the way people thought and acted 11• Note the
exception of group Ill (where no project management is applied), where
they believe the opposite to be true.
This research proposition was formulated based on the Pearce and
Robinson (1985) model, which required both an indication of the number
of changes needed (see subsection 5.4.8) and the potential compatibility
of the changes with the existing organizational culture. Previously it was
reported that some changes would be needed in order to implement
project management and, based on the result discussed above, these
changes are compatible with the existing culture. Consequently, the
departments are in the ~~synergistic position~~ (according to the model)
where emphasis should be placed on reinforcing the existing culture.
Given the obtained research results, research proposition 75 can thus not
be confirmed. The proposition should rather be reformulated to reflect the
position as follows: few changes would be necessary to implement
formalized project management and the changes that are needed are
compatible with the existing organizational culture. The departments are
thus in the synergistic position and should focus on reinforcing the existing
organizational culture.
Digitised by the University of Pretoria, Library Services, 2012

301
5.4.18 Change of organizational structure
Overall, 67 percent of the respondents confirmed that they believed that the
organizational structure had to be changed in order to implement project
management. The confirmation percentages in the different managerial
groups (see table 4.68) were group A- 52%, group B - 73% and group C -
62%. In the case of the breakdown in the different application groups (see
table 4.69), the confirmation percentages in the different application groups
were group I - 61%, group II - 73% and group Ill - 76%.
With reference to research proposition 73 (see subsection 2.4.8.1 ), it may
thus be concluded that the organizational structures in public sector work
departments need to be changed in order to implement project
management. The proposition can thus generally be confirmed.
5.4.19 Means to ensure continued application of project management
Overall, the rank order for the best means to ensure the continued
application of project management was (1) management support (organiza
tional leadership) (2) personnel attitudes (organizational culture) and (3)
structure (structural adjustments). The division in the different managerial
groups, reported in table 4. 70, differed from the overall pattern. Deviations
which are noteworthy are group A - ranked personnel attitudes as (1) and
management support as (2). In the case of the breakdown in the different
application groups (see table 4.71 ), there were also some variations from
the overall pattern. Deviations which are noteworthy are group II - ranked
personnel attitudes as (1) and management support as (2); group Ill
ranked structure as (2) and personnel attitudes as (3).
Given the obtained research results, research proposition 72 (see
subsection 2.4.8) can thus not be confirmed. The proposition should rather
Digitised by the University of Pretoria, Library Services, 2012

302
be reformulated to reflect the rank order as follows: (1) management
support (organizational leadership) (2) personnel attitudes (organizational
culture) and (3) structure (structural adjustments).
5.4.20 Managerial assignment position for implementing project
management
Overall, the rank order for the most effective managerial assignment
position for implementing project management was (1) internal manage
ment only (2) combination of internal and new outside management and
(3) new outside management only. The division in the different managerial
groups, reported in table 4. 72, showed no variations from the overall
pattern. In the case of the breakdown in the different application groups
(see table 4.73), there were also no variations from the overall pattern.
With reference to research proposition 74 (see subsection 2.4.8.2), it may
thus be concluded that the most effective managerial assignment position
for implementing project management would be the use of internal
managers from within the department only.
This research proposition was formulated based on the Pearce and
Robinson (1985) model, which required both an indication of the number
of changes needed (see subsection 5.4.8) and the assessment of past
performance (see subsection 5.4.2). Previously it was reported that some
changes would be needed in order to implement project management and
that the past performance of the departments was perceived to be effective.
Based on these results, the departments are in the 11Stability situation 11
(according to the model) where the major emphasis should be on the
existing managers via internal promotions and transfers. The result for this
question, namely that internal managers were seen as the most effective
managers for implementing project management, thus confirms the
Digitised by the University of Pretoria, Library Services, 2012

303
respondents' selection as also indicated in the model.
Given the obtained research results, research proposition 7 4 can thus not
be confirmed. The proposition should rather be reformulated to reflect the
position as follows: few changes would be necessary to implement
formalized project management and the past performance of the
departments is perceived to be effective. The departments are thus in the
stability situation and the main emphasis should be on using internal
managers from within the department to implement project management.
5.4.21 Summary of research propositions 61 to 75
A summary of the results for part C of the questionnaire in association with
research propositions is presented in table 5.1.
Digitised by the University of Pretoria, Library Services, 2012

304
Table 5.1: Summary of research propositions 61 to 75
PROPOSITION· •·· CONFIRMED REFORMULATED REFORMULATION .. ·
61: 5.4.7 YES
62: 5.4.3 YES* * Note exception for Group A : 5.4.4 : 5.4.5 . .· .. .... ·.
63: 5.4.6 YES* * Note exceptions for Groups A and Ill
64: 5.4.10 NO YES ... Rank order of objects of change: {1) procedures (organizational processes) (2) functions (individual task behaviour) {3) direction (strategic direction) (4) attitudes (organizational culture)
65: 5.4.11 .... YES·.·.· .• ···• .
66: 5.4.9 NO YES · .... Criteria for change strategies: (1) time required - long {2) extensiveness of change - small {3) change target - favourable {4) change agent- manager from within
.· the department
67: 5.4.13 NO YES Rank order of change strategies: {1) informational {2) facilitative {3) attitudinal (4) political
68: 5.4.15 YES ..
69: 5.4.16 NO YES Rank order of sources of resistance: {1) understanding {2) acting {3) acceptance
.
70: 5.4.12 YES
71: 5.4.14 NO YES Rank order of critical activities: {1) implementing {2) supporting {3) feasibility
72: 5.4.19 NO YES Rank order of institutionalizing means: {1) management support (leadership) {2) personnel (organizational culture) (3) structure (structural adjustments)
73: 5.4.18 YES .·
74: 5.4.2 NO YES Managerial assignment position: : 5.4.8 The departments are in the "stability" : 5.4.20 situation and the main major emphasis
should beon using managers within the department to implement project management
75: 5.4.8 NO YES Managing organizational culture: : 5.4.17 ·. The departments are in the "synergistic"
position and focus should be on reinforcing the existing culture
Digitised by the University of Pretoria, Library Services, 2012

305
5.5 PART D: FORCE FIELD ANALYSIS OF PROJECT MANAGEMENT
5.5.1 Criteria for the interpretation of the average values
To gain some insight into the relative importance of the different factors,
table 5.2 provides simplistic interpretation criteria which may be used to
interpret the various average values obtained for each factor. In general, if
all the respondents (1 00%) indicated that the factor was considered very
important, the average (X) for the factor would be equal to 1.000. Similarly,
if all the respondents indicated that the factor was considered important,
the average would be equal to 2.000, 3.000 for desirable and 4.000 for not
important. Note that each average indicated in table 5.2 reflects the 11bese
possible position in terms of these importance categories. For example, an
average of 1.1 00 suggests that 90 percent of the respondents believe the
factor to be very important while the remaining percentage of the
respondents (1 0%) believe the factor to be only important. If the remaining
respondents were evenly distributed among the other possible categories
of important, desirable and not important, the average would be equal to
1.200. This value, which is greater than 1 .1 00, thus suggests a 111ess
favourable11 position.
The results for the force field analysis of project management are
discussed in subsections 5.5.2 to 5.5.9. Subsection 5.5.1 0 provides a
summary of the significant and important contributors (or restrainers) for
the implementation of formalized project management in public sector work
departments. The rank orders for the factors which respondents believed
either contributed the most or had the most restraining influence on the
implementation of formalized project management are highlighted in
summarized tables. Factors considered significant, with average values of
1.500 or lower, are shaded in these tables. Based on the simple
interpretation criteria in table 5.2, at least 50 percent of the respondents
Digitised by the University of Pretoria, Library Services, 2012

306
believe these factors to be very important (or very restraining) while the
remainder believe them to be important (or restraining). These factors may
be regarded as significant contributors (or restrainers) in the implemen
tation of formalized project management in public sector work departments.
Table 5.2: Interpretation criteria
AVERAGE %VERY "· % ,-.NOT ()() IMPORTANT . :· IMPORTANT : .. DESIRABLE IMPORTANT
1.000 100 0 0 0
1.100 90 10 0 0 1.200 80 20 0 0 1.300 70 30 0 0 1.400 60 40 0 0 1.500 50 50 0 0 1.600 40 60 0 0 1.700 30 70 0 0 1.800 20 80 0 0 1.900 10 90 0 0
2.000 0 100 0 0
2.100 0 90 10 0 2.200 0 80 20 0 2.300 0 70 30 0 2.400 0 60 40 0 2.500 0 50 50 0 2.600 0 40 60 0 2.700 0 30 70 0 2.800 0 20 80 0 2.900 0 10 90 0
3.000 0 0 100 0
3.100 0 0 90 10 3.200 0 0 80 20 3.300 0 0 70 30 3.400 0 0 60 40 3.500 0 0 50 50 3.600 0 0 40 60
3.700 0 0 30 70 3.800 0 0 20 80
3.900 0 0 10 90
4.000 0 0 0 100
Factors with averages above 1.500 up to 2.000, indicated with an asterisk
(*), are only regarded as important contributors or restrainers. Based on
the interpretation criteria of table 5.2, either more than 50 percent of the
respondents believe these factors to be important and the remainder
Digitised by the University of Pretoria, Library Services, 2012

307
believe them to be very important (values above 1.500 but below 2.000) or
100 percent believe the factors to be important (as in the case of a value
of 2.000).
5.5.2 Contributing philosophical factors in project management
implementation
The rank order of philosophical factors (see tables 4. 7 4 and 4. 75) which
respondents believed contributed the most to the implementation of project
management are summarized in table 5.3. From table 4.84 it should be
noted that the four 11new11 hypothetical variables (or factors) obtained
through factor analysis are not readily interpretable and are thus not
discussed further.
Table 5.3: Philosophical factors
. .. ·· .·· .....
RANK. ... _ OVERALL GROUP .. .GRoup·_·_ GRoup··· <GROUP GROUP GROUP -•· ORDER .:. A B c •• :1 II Ill
•· (1}
_· P9 pg P4 . _. ·._·pg P9 P1 P4
(2} P1 P13 P1;P9 P1 P4 pg P1;P9; .
P10
{3) P4 P4 •. •·p1o .-·- _:P4 .- ...
P1 P4 P13 . ·._ ... , ..
{4) P13 P1;P7; P13 .. P6 P6 P13* P3*;P6* P10
. {5) P6;P10 P6* P6* P10* P10 P6* P5*;P7*; P12*
* Average greater than 1.500 up to 2.000
Overall, the following research propositions (RP) can thus be confirmed as
significant (or when important - indicated with an *) philosophical contri
butors to the implementation of project management: RP:39 (P9) (top-level
management commitment and support for project management concept);
RP: 1 (P1) (routine involvement in project-type activities); RP:B (P4) (realistic
project objectives); RP:58 (P13) (integrative planning and control); RP:9
Digitised by the University of Pretoria, Library Services, 2012

308
(P6) (key project management elements) and RP:36 (P1 0) (training and
education in project management concepts, methods and techniques).
In the different managerial groups, other research propositions which may
be confirmed are group A - RP:41 (P7) (project-oriented information and
control system). In the different application groups, other research
propositions which may be confirmed are group Ill- RP:6 (P3*) (application
of the systems approach to management), RP:47 (P5*) (clear definition of
project success), RP:41 (P7*) (project-oriented information system) and
RP:55 (P12*) (possible advantages of project management).
5.5.3 Contributing situational factors in project management
implementation
The rank order of situational factors (see tables 4. 76 and 4. 77) which
respondents believed contributed the most to the implementation of project
management are summarized in table 5.4. From table 4.85 it should be
noted that the three "new" hypothetical variables (or factors) obtained
through factor analysis are again not readily interpretable and are thus not
discussed further.
Table 5.4: Situational factors
RANK OVERALL .. GROUP GROUP GROUP GROUP GROUP GROUP ORDER .· A 8 c I II Ill
(1) S1 S1 S1 S1 ·. S1 S1 .Sl• ..
(2) Sa* S6 Sa* sa sa Sa* Sa* ·. .·.
{3) S6* Sa* S6* S7* S7 S6* S7*
{4) S7* S7* S7* S4* S6* S4* S6*
(5) S4* S4* S4* S6* S4* S7* S4*
* Average greater than 1.500 up to 2.000
Overall, the following research propositions (RP) can thus be confirmed as
Digitised by the University of Pretoria, Library Services, 2012

309
significant (or when important- indicated with an *)situational contributors
to the implementation of project management: RP:53 (S1) (effective control
of projects during execution); RP:54 (S8*) (ability to increase the strength
of the driving forces of project success); RP:57 (S6*) (coordinating and
integrating large projects with interdisciplinary and independent activities);
RP:59 (S7*) (ability to deal with complex tasks in both slow and fast
changing external environments); and RP:43 (S4*) (sensitivity to
environmental influences). In the different managerial and application
groups, there are no other research propositions which may additionally be
confirmed.
5.5.4 Contributing organizational factors in project management
implementation
The rank order of organizational factors (see tables 4. 78 and 4. 79) which
respondents believed contributed the most to the implementation of project
management are summarized in table 5.5. From table 4.86 it should be
noted that the two 11new 11 hypothetical variables (or factors) obtained
through factor analysis, are again not readily interpretable and are thus not
discussed further.
Table 5.5: Organizational factors
RANK OVERALL GROUP GROUP GROUP .·· GROUP GROUP GROUP ORDER A B c I II Ill .
{1) 07* 07* 07* 01* 07* 07* 07*
. (2) ·. 02* 02* 07* 02* 01* 02*
(3) 01* 04* 02* 04* 02* 01 *
(4) 01* 01 * 04* 04*
(5) 06*
* Average greater than 1.500 up to 2.000
Overall, the following research propositions (RP) can thus be confirmed as
Digitised by the University of Pretoria, Library Services, 2012

310
significant (or when important - indicated with an *) organizational
contributors to the implementation of project management: RP:37 (07*)
(effective transitional management); RP:26 (02*) (a dynamic organizational
structure); and RP:4 (01 *) (an adaptable organizational form). In the
different managerial groups, other research propositions which may be
confirmed are group B- RP:33 (06*) (a matrix organizational structure). In
the different application groups, there are no other research propositions
which may additionally be confirmed.
5.5.5 Contributing job-dimensional factors in project management
implementation
The rank order of job-dimensional factors (see tables 4.80 and 4.81) which
respondents believed contributed the most to the implementation of project
management are summarized in table 5.6. From table 4.87 it should be
noted that the three "new" hypothetical variables (or factors) obtained
through factor analysis, are again not readily interpretable and are thus not
discussed further.
Table 5.6: Job-dimensional factors
·.
RANK ·:.: OVERALL GROUP.·· GROUP GROUP·.:·· GROUP GROUP GROUP ORDER .: A B .. ::· 1·.:·· I II Ill
J1 .. :<:·>··· ·. ·:·:
(1) . J9 .· J8;J9 jg .::: :·
J9 J8;J9 JB
(2) .·· ......... : JB J4·:·· .::. JB J1 I·:· J1 J1 J1 : .. .·
(3) .... 1·:·:·······:: .. >Jt:: .:. J3*;J6* I . J9 . JB ·· .. >···· ·.::·· JB J3* J6;J9
.. ··. (4) ····:::: . .<.:· J3*;J6* J1* J3*;J6* J3*;J6* J3;J6 J4* J3 .··
(5) :. J4* J2* J4* J4* > ·.·> ~4 J6* J2* ....
* Average greater than 1.500 up to 2.000
Overall, the following research propositions (RP) can thus be confirmed as
significant (or when important - indicated with an *) job-dimensional
contributors to the implementation of project management: RP:52 (J9)
Digitised by the University of Pretoria, Library Services, 2012

311
(communication and information sharing between participants); RP:51 (J8)
(commitment, cooperation between participants); RP: 10 (J1) (variety of
project manager roles to be performed); RP: 11 (J3*) (principal
responsibility of project manager for project end-item); RP: 19 (J6*)
(cohesive project team established) and RP: 12 (J4*) (interface role of
project manager). In the different managerial groups, other research
propositions which may be confirmed are group A - RP:24 (J2*) (project
manager held accountable for success/failure of project). In the different
application groups, other research propositions which may be confirmed
are group Ill - RP:24 (J2*) (project manager held accountable for
success/failure of project).
5.5.6 Contributing human-oriented factors in project management
implementation
The rank order of human-oriented factors (see tables 4.82 and 4.83) which
respondents believed contributed the most to the implementation of project
management are summarized in table 5. 7. From table 4.88 it should be
noted that the two 11new 11 hypothetical variables (or factors) obtained
through factor analysis, are again not readily interpretable and are thus not
discussed further.
Table 5. 7: Human-oriented factors
:"
RANK OVERALL GROUP GROUP GROUP GROUP GROUP GROUP ORDER A B c •• II Ill ·. >: · .. ·
·: .·.: ... ··.
(1) H1 H1;H2 H1 Ht ·: .· H1 H1 H1 .·.·. ·.
(2) H2 H3 H2 H3 H2 H3 H2
(3) H3 H5* H3 H2 H3 H2* H3
(4) H5* H5* H5* H5* H5* H5*
(5) H6* H6* H6* H6* H6*
* Average greater than 1.500 up to 2.000
Digitised by the University of Pretoria, Library Services, 2012

312
Overall, the following research propositions (RP) can thus be confirmed as
significant (or when important - indicated with an *) human-oriented
contributors to the implementation of project management: RP:7 (H1)
(managerial proficiency of project manager); RP: 14 (H2) (desired personal
characteristics of project manager); RP: 15 (H3) (behavioural, business and
technical skills of project manager); RP:17 (H5*) (leadership through
participation and delegation); and RP: 42 (H6*) (participant's satisfaction
through all project stages). In the different managerial and application
groups, there are no other research propositions which may additionally be
confirmed.
5.5. 7 Other contributing factors in project management implementation
From an open-ended question in the questionnaire, which was placed after
the structured questions which dealt with contributing factors in project
management implementation, other factors indicated were project
manager's integrity, the use of computer programs, mature instruction (not
manipulation), attitude of humility, earning respect, showing initiative,
providing incentives, setting objectives, belief in excellence in the work
place, logical and realistic thinking, commitment to superior product
quality, emphasis on planning not doing, participation through delegation
of work, cost controls and integration of diverse professional skills. From
these extracts it can be seen that the emphasis of these other factors
identified was placed on factors within the job-dimensional and human
oriented categories.
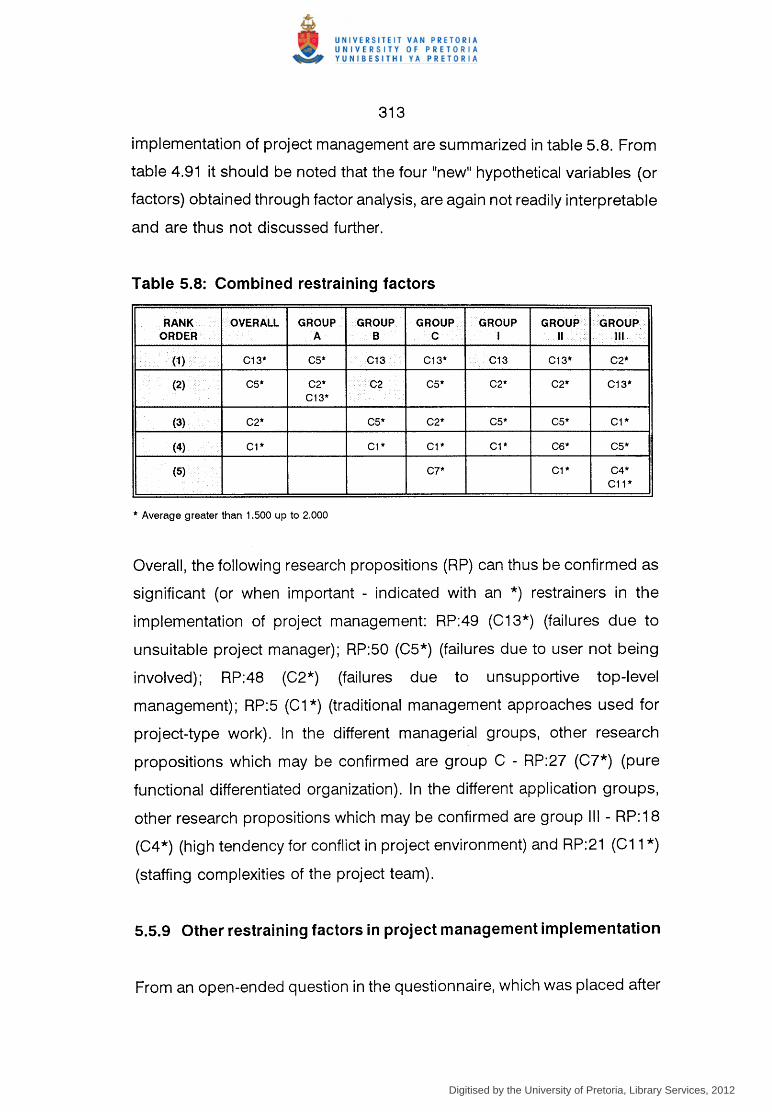
5.5.8 Combined restraining factors in project management
implementation
The rank order of combined restraining factors (see tables 4.89 and 4.90)
which respondents believed would be the most constraining in the
Digitised by the University of Pretoria, Library Services, 2012
313
implementation of project management are summarized in table 5.8. From
table 4.91 it should be noted that the four 11new11 hypothetical variables (or
factors) obtained through factor analysis, are again not readily interpretable
and are thus not discussed further.
Table 5.8: Combined restraining factors
RANK I OVERALL GROUP GROUP GROUP GROUP GROUP GROUP.·. ORDER A B c I
II ··. ··••·• Ill
(1) .· C13* C5* C13 C13* C13 C13* C2*
(2) C5* C2* C2 C5* C2* C2* C13* . C13*
(3) C2* C5* C2* C5* C5* C1*
(4) C1* C1* C1* C1 * C6* C5*
(5) . C7* C1* C4* C11 *
* Average greater than 1.500 up to 2.000
Overall, the following research propositions (RP) can thus be confirmed as
significant (or when important - indicated with an *) restrainers in the
implementation of project management: RP:49 (C13*) (failures due to
unsuitable project manager); RP:50 (C5*) (failures due to user not being
involved); RP:48 (C2*) (failures due to unsupportive top-level
management); RP:5 (C1 *) (traditional management approaches used for
project-type work). In the different managerial groups, other research
propositions which may be confirmed are group C - RP:27 (C7*) (pure
functional differentiated organization). In the different application groups,
other research propositions which may be confirmed are group Ill- RP:18
(C4*) (high tendency for conflict in project environment) and RP:21 (C11 *)
(staffing complexities of the project team).
5.5.9 Other restraining factors in project management implementation
From an open-ended question in the questionnaire, which was placed after
Digitised by the University of Pretoria, Library Services, 2012

314
the structured questions which dealt with restraining factors in project
management implementation, other factors indicated were communication 11blockages 11
, people insensitivity, lack of patience and foresight, politicians,
changing priorities within the departments, 11the minister's last speech said
... 11
, limiting financial and fiscal policies, too many chiefs, too many
managers on a project, training of project managers and proof of project
management skills. From these extracts it can be seen that the emphasis
of these other factors identified was placed on factors within the situational,
job-dimensional and human-oriented categories.
5.5.1 0 Summary of research propositions 1 to 60
A summary of the results for part D of the questionnaire in association with
research propositions is presented in tables 5.9, 5.1 0 and 5.11.
Digitised by the University of Pretoria, Library Services, 2012

315
Table 5.9: Summary of research propositions 1 to 20
.
PROPOSITION CONFIRMED CONFIRMED COMMENTS SIGNIFICANT <: IMPORTANT .
1: 5.5.2 YES* *All groups
2 NO NO
3 NO NO
4: 5.5.4 NO I YES* *All groups
5:5.5.8 NO .. YES* *All groups
6: 5.5.2 NO YES* * Only for group Ill
7:5.5.6 YES* *All groups
8: 5.5.2 YES* *All groups
9:5.5.2 YES* . *All groups
10: 5.5.5 YES* *All groups
11: 5.5.5 NO YES* *All groups
12: 5.5.5 NO YES* .. *All groups
13 NO NO
14: 5.5.6 YES* *All groups
15: 5.5.6 YES* .. *All groups
16 NO NO
17: 5.5.6 NO YES* *All groups
18: 5.5.8 NO YES* * Only group Ill
19: 5.5.5 NO YES* *All groups
20 NO NO
Digitised by the University of Pretoria, Library Services, 2012

316
Table 5.10: Summary of research propositions 21 to 40
PROPOSITION .... CONFIRMED CONFIRMED COMMENTS
~ SIGNIFICANT ·:.• IMPORTANT ...
21: 5.5.8 NO YES* * Only group Ill
22 NO NO
23 NO NO .
24: 5.5.5 NO YES* * Only for groups A
~ ~.::_• and Ill
25 NO NO
26: 5.5.4 NO ·. YES* . *All groups
27: 5.5.8 NO YES* * Only for group C
28 NO NO
29 NO NO
30 NO NO
31 NO NO
32 NO NO
33: 5.5.4 NO YES* ···.·
.. * Only for group B
34 NO NO
35 NO NO
36: 5.5.2 YES* .. *All groups
37: 5.5.4 NO YES* *All groups
38 NO NO
39: 5.5.2 YES* ····.·
*All groups
40 NO NO
Digitised by the University of Pretoria, Library Services, 2012

317
Table 5.11: Summary of research propositions 41 to 60
PROPOSITION CONFIRMED CONFIRMED COMMENTS SIGNIFICANT IMPORTANT
41: 5.5.2 YES* YES** * Only for group A ** Only for group Ill
42: 5.5.6 NO YES* ·. *All groups
43: 5.5.3 NO YES* *All groups
44 NO NO
45 NO NO
46 NO NO
47: 5.5.2 NO YES* * Only for group Ill
48: 5.5.8 NO .· YES* *All groups
49: 5.5.8 NO YES* *All groups
50: 5.5.8 NO YES* *All groups
51: 5.5.5 YES* *All groups
52: 5.5.5 YES* •. *All groups
53: 5.5.3 YES* .. *All groups
54: 5.5.3 NO YES* *All groups
55: 5.5.2 NO YES* * Only for group Ill
56 NO NO
57: 5.5.3 NO YES* *All groups
58: 5.5.2 YES* *All groups
59: 5.5.3 NO YES* *All groups
60 NO NO
5.6 THEORETICAL CHANCES OF SUCCESSFULLY IMPLEMENTING
PROJECT MANAGEMENT
On the basis of the indication of relative importance for each of the
contributing and restraining factors (see section 5.5), respondents were
asked to theoretically assess the chances of successfully implementing
project management in their departments. Overall, 7 percent of the
respondents believed that the chances of successfully implementing project
management were small (less than a 25% chance of success), 22 percent
Digitised by the University of Pretoria, Library Services, 2012

318
believed the chances were limited (25% but less than a 50% chance of
success), 51 percent believed the chances were reasonable (50% but less
than a 75% chance of success), and 20 percent believed the chances were
good (greater than a 75% chance of success).
The division in the different managerial groups, reported in table 4.92,
differed from the overall pattern. Deviations of more than 5 percent which
are noteworthy are group A- limited (-9%), reasonable (+6%) and good
(+6%); group C- reasonable (-6%). In the case of the breakdown in the
different application groups (see table 4.93), there were also some
variations from the overall pattern. Deviations of more than 5 percent which
are noteworthy are group I - limited (-8%) and good ( + 14%); group II -
reasonable ( + 9%) and good ( -14 %) ; group II I - limited ( + 11 %) and good
(-11 %). Statistically, groups II and Ill are similar but significantly different to
group I. This means that group I (where formal project management is
being applied) believe that the chances of successfully implementing
project management are significantly different (in this case, higher) than
those of groups II and Ill.
Should the results above be compared to those of a similar question earlier
in the questionnaire (where respondents were asked to assess the chances
of successfully implementing project management but - with the express
condition that no changes were made in the current operations of their
departments), the respondents now generally believed that the chances of
success were higher (see table 5.12). The higher chance of success thus
reflects a theoretical position where the factors which respondents
indicated as success-driving forces are 11present 11 (or 11Strengthened 11) and
the success-restraining forces are 11absent 11 (or ~~weakened"). The importance
of these factors may thus be linked to this higher theoretical chance of
successful implementation of project management.
Digitised by the University of Pretoria, Library Services, 2012

319
Table 5.12: Percentage comparison of chances of success
CHANCES OVERALL GROUP GROUP GROUP GROUP GROUP GROUP OF A B c I II Ill
SUCCESS
0-24o/. ·. -14% -13% -12% -15% -8% -13% -27%
25.;49% -6% -8% -11% +4% -8% -1% -13%
5~74% +12% +7% +16% +5% +2% +17% +34%
75-99% .. +8% +14% +7% +6% +14% -3% +6%
Overall, 71 percent (this figure was previously 51%) of the respondents
believed that the chances of successfully implementing project
management, given that the results of the force field analysis were taken
into consideration, were above 50 percent. In the case of the breakdown
in the different managerial groups, the corresponding figures are group A-
83% (was 72%), group B- 68% (was 45%) and group C- 69% (was 58%).
In the case of the breakdown in the different application groups, the
corresponding figures are group I - 80% (was 64%), group II - 66% (was
52%) and group Ill -58% (was 13%).
The correlation coefficients ·between the question dealing with the
indication of chances of successful implementation of project management
and each of the success-driving and success-restraining factors were
reported in tables 4.94 to 4.99. Significant negative correlations between
the results for this question and the contributing factors are RP3 (factor P2)
(division of project into distinct life cycle phases), RP12 (factor J4)
(interface role of project manager), RP13 (factor J5) (influence of project
manager to supplement the lack of formal authority) and RP17 (factor H5)
(leading project team primarily through participation and delegation). Note
that because of the data capturing method used, negative correlations
reflect situations where high numerical values were obtained for one
variable (in this case, when the chances of successful implementation are
good) while low numerical values were obtained for the other variable (in
Digitised by the University of Pretoria, Library Services, 2012

320
this case, when the importance of the contributing factor is considered
high). While both RP3 and RP13 show significant correlations with the
chances of successful implementation, they were not confirmed earlier (see
subsection 5.5.1 0) as important contributors to the implementation of
project management.
Significant positive correlations between the results for this question and
the restraining factors are RP56 (factor C3) (possible disadvantages of
project management) and RP18 (factor C4) (the high tendency for conflict
in project environments). Note again that because of the data capturing
method used, positive correlations reflect situations where low numerical
values were obtained for one variable (in this case, when the chances of
successful implementation are small) and low numerical values were
obtained for the other variable (in this case, when the restraining impact of
the factor is considered high). While RP56 shows significant correlation
with the chances of successful implementation, it was not confirmed (see
subsection 5.5.1 0) as an important restrainer to the implementation of
project management.
5.7 CHAPTER SUMMARY
Chapter 5 presented the discussion and analysis of the research results.
Where applicable, the results were examined in association with the
theoretical research propositions which were formulated in the literature
review in chapter 2.
Following the introduction in section 5.1, the results for part A of the
research questionnaire were discussed in section 5.2. This part described
the characteristics of the respondents in terms of the number of years they
had worked in a public sector work department, the professional status of
the respondents and, finally, their level of education.
Digitised by the University of Pretoria, Library Services, 2012

321
The discussion of the results for part B of the questionnaire was presented
in section 5.3. In this section the respondents' general orientation to project
management was discussed. Apart from determining the extent to which
project management was currently being applied in public sector work
departments, the general attitude of the respondents to and knowledge of
project management were also described.
The discussion of the results for part C of the questionnaire was presented
in section 5.4. This part focused on the process-related issues of
formulating and implementing a strategy for formalized project
management. Specifically, the results of the application of the general
change management model of Conner and Lake (1988) were discussed in
association with the theoretical propositions formulated in section 2.4.
The results for the content-related issues, contained in part D of the
research questionnaire, were discussed in section 5.5. In this section, the
outcome of the force field analysis of success-driving and success
restraining factors in project management implementation were discussed
and in this case, in association with the theoretical propositions formulated
in section 2.3.
Section 5.6 provided the discussion of the results for the last portion of the
questionnaire. In this part, an attempt was made to theoretically assess the
chances of successfully implementing formalized project management in
public sector work departments. The assessment is based on the express
condition that the implementation strategy utilized would reflect the results
of the force field analysis of project management and then be implemented
through a managed organizational change process.
Chapter 6 presents the final conclusions and recommendations of the
research.
Digitised by the University of Pretoria, Library Services, 2012