Embed Size (px)
DESCRIPTION
reqts
Citation preview

Institute of Mathematical Statistics is collaborating with JSTOR to digitize, preserve and extend access to Statistical Science.
http://www.jstor.org
Network-Based Marketing: Identifying Likely Adopters via Consumer Networks Author(s): Shawndra Hill, Foster Provost and Chris Volinsky Source: Statistical Science, Vol. 21, No. 2, A Special Issue on Statistical Challenges and
Opportunities in Electronic Commerce Research (May, 2006), pp. 256-276Published by: Institute of Mathematical StatisticsStable URL: http://www.jstor.org/stable/27645754Accessed: 10-03-2015 09:28 UTC
Your use of the JSTOR archive indicates your acceptance of the Terms & Conditions of Use, available at http://www.jstor.org/page/ info/about/policies/terms.jsp
JSTOR is a not-for-profit service that helps scholars, researchers, and students discover, use, and build upon a wide range of content in a trusted digital archive. We use information technology and tools to increase productivity and facilitate new forms of scholarship. For more information about JSTOR, please contact [email protected].
This content downloaded from 202.92.130.58 on Tue, 10 Mar 2015 09:28:56 UTCAll use subject to JSTOR Terms and Conditions
Statistical Science 2006, Vol. 21, No. 2. 256-276 DOI: 10.1214/088342306000000222 ? Institute of Mathematical Statistics, 2006
Network-Based Marketing: Identifying
Likely Adopters via Consumer
Networks Shawndra Hill, Foster Provost and Chris Volinsky
Abstract. Network-based marketing refers to a collection of marketing
techniques that take advantage of links between consumers to increase sales.
We concentrate on the consumer networks formed using direct interactions
(e.g., communications) between consumers. We survey the diverse literature
on such marketing with an emphasis on the statistical methods used and the
data to which these methods have been applied. We also provide a discus
sion of challenges and opportunities for this burgeoning research topic. Our
survey highlights a gap in the literature. Because of inadequate data, prior studies have not been able to provide direct, statistical support for the hypoth esis that network linkage can directly affect product/service adoption. Using a new data set that represents the adoption of a new telecommunications ser
vice, we show very strong support for the hypothesis. Specifically, we show
three main results: (1) "Network neighbors"?those consumers linked to a
prior customer?adopt the service at a rate 3-5 times greater than baseline
groups selected by the best practices of the firm's marketing team. In ad
dition, analyzing the network allows the firm to acquire new customers who
otherwise would have fallen through the cracks, because they would not have
been identified based on traditional attributes. (2) Statistical models, built
with a very large amount of geographic, demographic and prior purchase
data, are significantly and substantially improved by including network in
formation. (3) More detailed network information allows the ranking of the
network neighbors so as to permit the selection of small sets of individuals
with very high probabilities of adoption.
Key words and phrases: Viral marketing, word of mouth, targeted market
ing, network analysis, classification, statistical relational learning.
1. INTRODUCTION
Network-based marketing seeks to increase brand
recognition and profit by taking advantage of a so
Shawndra Hill is a Doctoral Candidate and Foster Provost
is Associate Professor, Department of Information,
Operations and Management Sciences, Leonard N. Stem
School of Business, New York University, New York, New
York 10012-1126, USA (e-mail:
[email protected]; [email protected]). Chris
Volinsky is Director, Statistics Research Department, AT&T
Labs Research, Shannon Laboratory, Florham Park, New
Jersey 07932, USA (e-mail: [email protected]).
cial network among consumers. Instances of network
based marketing have been called word-of-mouth mar
keting, diffusion of innovation, buzz marketing and
viral marketing (we do not consider multilevel market
ing, which has become known as "network" market
ing). Awareness or adoption spreads from consumer to
consumer. For example, friends or acquaintances may tell each other about a product or service, increasing awareness and possibly exercising explicit advocacy. Firms may use their websites to facilitate consumer
to-consumer advocacy via product recommendations
(Kautz, Selman and Shah, 1997) or via on-line cus
tomer feedback mechanisms (Dellarocas, 2003). Con
256
This content downloaded from 202.92.130.58 on Tue, 10 Mar 2015 09:28:56 UTCAll use subject to JSTOR Terms and Conditions
NETWORK-BASED MARKETING 257
sumer networks may also provide leverage to the ad
vertising or marketing strategy of the firm. For exam
ple, in this paper we show how analysis of a consumer
network improves targeted marketing. This paper makes two contributions. First we sur
vey the burgeoning methodological research literature
on network-based marketing, in particular on statisti
cal analyses for network-based marketing. We review
the research questions posed, and the data and analytic
techniques used. We also discuss challenges and op
portunities for research in this area. The review allows
us to postulate necessary data requirements for study
ing the effectiveness of network-based marketing and
to highlight the lack of current research that satisfies
those requirements. Specifically, research must have
access both to direct links between consumers and to
direct information on the consumers' product adoption. Because of inadequate data, prior studies have not been
able to provide direct, statistical support (Van den Bulte
and Lilien, 2001) for the hypothesis that network link
age can directly affect product/service adoption. The second contribution is to provide empirical sup
port that network-based marketing indeed can im
prove on traditional marketing techniques. We intro
duce telecommunications data that present a natural
testbed for network-based marketing models, in which
communication linkages as well as product adoption rates can be observed. For these data, we show three
main results: (1) "Network neighbors"?those con
sumers linked to a prior customer?adopt the service at
a rate 3-5 times greater than baseline groups selected
by the best practices of the firm's marketing team. In
addition, analyzing the network allows the firm to ac
quire new customers who otherwise would have fallen
through the cracks, because they would not have been
identified based on traditional attributes. (2) Statistical
models, built with a very large amount of geographic,
demographic and prior purchase data, are significantly and substantially improved by including network in
formation. (3) More sophisticated network information
allows the ranking of the network neighbors so as to
permit the selection of small sets of individuals with
very high probabilities of adoption.
2. NETWORK-BASED MARKETING
There are three, possibly complementary, modes of
network-based marketing.
Explicit advocacy: Individuals become vocal advo
cates for the product or service, recommending it to
their friends or acquaintances. Particular individuals
such as Oprah, with her monthly book club reading list,
may represent "hubs" of advocacy in the consumer re
lationship network. The success of The Da Vinci Code,
by Dan Brown, may be due to its initial marketing: 10,000 books were delivered free to readers thought to
be influential enough (e.g., individuals, booksellers) to
stimulate the traffic in paid-for editions (Paumgarten,
2003). When firms give explicit incentives to con
sumers to spread information about a product via word
of mouth, it has been called viral marketing, although that term could be used to describe any network-based
marketing where the pattern of awareness or adoption
spreads from consumer to consumer.
Implicit advocacy: Even if individuals do not speak about a product, they may advocate implicitly through their actions?especially through their own adoption of the product. Designer labeling has a long tradi
tion of using consumers as implicit advocates. Firms
commonly capitalize on influential individuals (such as
athletes) to advocate products simply by conspicuous
adoption. More recently, firms have tried to induce the
same effect by convincing particularly "cool" members
of smaller social groups to adopt products (Gladwell,
1997; Hightower, Brady and Baker, 2002). Network targeting'. The third mode of network-based
marketing is for the firm to market to prior purchasers' social-network neighbors, possibly without any advo
cacy at all by customers. For network targeting, the
firm must have some means to identify these social
neighbors. These three modes may be used in combination.
A well-cited example of viral marketing combines net
work targeting and implicit advocacy: The Hotmail
free e-mail service appended to the bottom of every
outgoing e-mail message the hyperlinked advertise
ment, "Get your free e-mail at Hotmail," thereby
targeting the social neighbors of every current user
(Montgomery, 2001), while taking advantage of the
user's implicit advocacy. Hotmail saw an exponen
tially increasing customer base. Started in July 1996, in the first month alone Hotmail acquired 20,000 cus
tomers. By September 1996 the firm had acquired over
100,000 accounts, and by early 1997 it had over 1 mil
lion subscribers.
Traditional marketing methods do not appeal to
some segments of consumers. Some consumers ap
parently value the appearance of being on the cutting
edge or "in the know," and therefore derive satisfac
tion from promoting new, exciting products. The firm
BzzAgents (Walker, 2004) has managed to entice vol
untary (unpaid) marketing of new products. Further
This content downloaded from 202.92.130.58 on Tue, 10 Mar 2015 09:28:56 UTCAll use subject to JSTOR Terms and Conditions

258 S. HILL, F. PROVOST AND C. VOLINSKY
more, although more and more information has be
come available on products, parsing such information
is costly to the consumer. Explicit advocacy, such as
word-of-mouth advocacy, can be a useful way to filter
out noise.
A key assumption of network-based marketing
through explicit advocacy is that consumers propagate
"positive" information about products after they either
have been made aware of the product by traditional
marketing vehicles or have experienced the product themselves. Under this assumption, a particular subset
of consumers may have greater value to firms because
they have a higher propensity to propagate product in
formation (Gladwell, 2002), based on a combination
of their being particularly influential and their having more friends (Richardson and Domingos, 2002). Firms
should want to find these influencers and to promote useful behavior.
3. LITERATURE REVIEW
Many quantitative statistical methods used in em
pirical marketing research assume that consumers act
independently. Typically, many explanatory attributes
are collected on each actor and used in multivari
ate modeling such as regression or tree induction. In
contrast, network-based marketing assumes interde
pendency among consumer preferences. When inter
dependencies exist, it may be beneficial to account for
their effects in targeting models. Traditionally in statis
tical research, interdependencies are modeled as part of
a covariance structure, either within a particular obser
vational unit (as in the case of repeated measures ex
periments) or between observational units. Studies of
network-based marketing instead attempt to measure
these interdependencies through implicit links, such as
matching on geographic or demographic attributes, or
through explicit links, such as direct observation of
communications between actors. In this section, we re
view the different types of data and the range of statis
tical methods that have been used to analyze them, and
we discuss the extent to which these methods naturally accommodate networked data.
Work in network-based marketing spans the fields
of statistics, economics, computer science, sociology,
psychology and marketing. In this section, we orga nize prominent work in network-based marketing by six types of statistical research: (1) econometric mod
eling, (2) network classification modeling, (3) surveys,
(4) designed experiments with convenience samples,
(5) diffusion theory and (6) collaborative filtering and
recommender systems. In each case, we provide an
overview of the approach and a discussion of a promi nent example. This (brief) survey is not exhaustive. In
the final subsection, we discuss some of the statistical
challenges inherent in incorporating this network struc
ture.
3.1 Econometric Models
Econometrics is the application of statistical meth
ods to the empirical estimation of economic relation
ships. In marketing this often means the estimation of
two simultaneous equations: one for the marketing or
ganization or firm and one for the market. Regression and time-series analysis are found at the core of econo
metric modeling, and econometric models are often
used to assess the impact of a target marketing cam
paign over time.
Econometric models have been used to study the im
pact of interdependent preferences on rice consump tion (Case, 1991), automobile purchases (Yang and
Allenby, 2003) and elections (Linden, Smith and York,
2003). For each of the aforementioned studies, geogra
phy is used in part as a proxy for interdependence be
tween consumers, as opposed to direct, explicit com
munication. However, different methods are used in
the analysis. Most recently, Yang and Allenby (2003)
suggested that traditional random effects models are
not sufficient to measure the interdependencies of con
sumer networks. They developed a Bayesian hierar
chical mixture model where interdependence is built
into the covariance structure through an autoregressive
process. This framework allows testing of the presence of interdependence through a single parameter. It also
can incorporate the effects of multiple networks, each
with its own estimated dependence structure. In their
application, they use geography and demography to
create a "network" of consumers in which links are
created between consumers who exhibit geographic or
demographic similarity. The authors showed that the
geographically defined network of consumers is more
useful than the demographic network for explaining consumer behavior as it relates to purchasing Japanese cars. Although they do not have data on direct commu
nication between consumers, the framework presented
by Yang and Allenby (2003) could be extended to ex
plicit network data where links are created between
consumers through their explicit communication as op
posed to demographic or geographic similarity. A drawback of this approach is that the interde
pendence matrix has size n2, where n is the number
of consumers; consumer networks are extremely large
This content downloaded from 202.92.130.58 on Tue, 10 Mar 2015 09:28:56 UTCAll use subject to JSTOR Terms and Conditions

NETWORK-BASED MARKETING 259
and prohibit parameter estimation using this method.
Sparse matrix techniques or clever clustering of the ob
servations would be a natural extension.
3.2 Network Classification Models
Network classification models use knowledge of the
links between entities in a network to estimate a quan
tity of interest for those entities. Typically, in such a
model an entity is influenced most by those directly connected to it, but is also affected to a lesser ex
tent by those further away. Some network classifica
tion models use an entire network to make predictions about a particular entity on the network; Macskassy and Provost (2004) provided a brief survey. However,
most methods have been applied to small data sets and
have not been applied to consumer data. Much research
in network classification has grown out of the pioneer
ing work by Kleinberg (1999) on hubs and authorities
on the Internet, and out of Google's PageRank algo rithm (Brin and Page, 1998), which (to oversimplify) identifies the most influential members of a network
by how many influential others "point" to them. Al
though neither study uses statistical models, both are
related to well-understood notions of degree centrality and distance centrality from the field of social-network
analysis.
One paper that models a consumer network for max
imizing profit is by Richardson and Domingos (2002), in which a social network of customers is modeled as
a Markov random field. The probability that a given customer will buy a given product is a function of the
states of her neighbors, attributes of the product and
whether or not the customer was marketed to. In this
framework it is possible to assign a "network value"
to every customer by estimating the overall benefit of
marketing to that customer, including the impact that
the marketing action will have on the rest of the net
work (e.g., through word of mouth). The authors tested
their model on a database of movie reviews from an In
ternet site and found that their proposed methodology
outperforms non-network methods for estimating cus
tomer value. Their network formulation uses implicit links (customers are linked when a customer reads a
review by another customer and subsequently reviews
the item herself) and implicit purchase information
(they assume a review of an item implies a purchase and vice versa).
3.3 Surveys
Most research in this area does not have informa
tion on whether consumers actually talk to each other.
To address this shortcoming, some studies use survey
sampling to collect comprehensive data on consumers'
word-of-mouth behavior. By sampling individuals and
contacting them, researchers can collect data that are
difficult (or impossible) to obtain directly by observing network-based marketing phenomena (Bowman and
Narayandas, 2001). The strength of these studies lies
in the data, including the richness and flexibility of the
answers that can be collected from the responders. For
instance, researchers can acquire data about how cus
tomers found out about a product and how many oth
ers they told about the product. An advantage is that
researchers can design their sampling scheme to con
trol for any known confounding factors and can devise
fully balanced experimental designs that test their hy
potheses. Since the purpose of models built from sur
vey data is description, simple statistical methods like
logistic regression or analysis of variance (ANOVA)
typically are used.
Bowman and Narayandas (2001) surveyed more
than 1700 purchasers of 60 different products who pre
viously had contacted the manufacturer ofthat product. The purchasers were asked specific questions about
their interaction with the manufacturer and its impact on subsequent word-of-mouth behavior. The authors
were able to capture whether the customers told oth
ers of their experience and if so, how many people
they told. The authors found that self-reported "loyal" customers were more likely to talk to others about the
products when they were dissatisfied, but interestingly not more likely when they were satisfied. Although studies like this collect some direct data on consumers'
word-of-mouth behavior, the researchers do not know
which of the consumers' contacts later purchased the
product. Therefore, they cannot address whether word
of-mouth actually affects individual sales.
3.4 Designed Experiments with Convenience
Samples
Designed experiments enable researchers to study network-based marketing in a controlled setting. Al
though the subjects typically comprise a convenience
sample (such as those undergraduates who answer an
ad in the school newspaper), the design of the experi ment can be completely randomized. This is unlike the
studies that rely on secondary data sources or data from
the Web. Typically ANOVA is used to draw conclu
sions.
Frenzen and Nakamoto (1993) studied the factors
that influence individuals' decisions to disseminate in
formation through a market via word-of-mouth. The
This content downloaded from 202.92.130.58 on Tue, 10 Mar 2015 09:28:56 UTCAll use subject to JSTOR Terms and Conditions

260 S. HILL, F. PROVOST AND C. VOLINSKY
subjects were presented with several scenarios that rep resented different products and marketing strategies, and were asked whether they would tell trusted and
nontrusted acquaintances about the product/sale. They studied the effect of the cost/value manipulations on
the consumers' willingness to share information ac
tively with others, as a function of the strength of
the social tie. In this study, the authors did not allow
the subjects to construct their explicit consumer net
work; instead, they asked the participants to hypoth esize about their networks. The experiments used the
data from a convenience sample to generalize over
a complete consumer network. The authors also em
ployed simulations in their study. They found that the
stronger the moral hazard (the risk of problematic be
havior) presented by the information, the stronger the
ties must be to foster information propagation. Gen
erally, the authors showed that network structure and
information characteristics interact when individuals
form their information transmission decisions.
3.5 Diffusion Models
Diffusion theory provides tools, both quantitative and qualitative, to assess the likely rate of diffusion
of a technology or product. Qualitatively, researchers
have identified numerous factors that facilitate or hin
der technology adoption (Fichman, 2004), as well as
social factors that influence product adoption (Rogers,
2003). Quantitative diffusion research involves empir ical testing of predictions from diffusion models, often
informed by economic theory. The most notable and most influential diffusion
model was proposed by Bass (1969). The Bass model
of product diffusion predicts the number of users who
will adopt an innovation at a given time t. It hypoth esizes that the rate of adoption is a function solely of the current proportion of the population who have
adopted. Specifically, let F(t) be the cumulative pro
portion of adopters in the population. The diffusion
equation, in its simplest form, models F(t) as a func
tion of p, the intrinsic adoption rate, and q, a mea
sure of social contagion. When q > p, this equation describes an 5-shaped curve, where adoption is slow
at first, takes off exponentially and tails off at the end.
This model can effectively model word-of-mouth prod uct diffusion at the aggregate, societal level.
In general, the empirical studies that test and ex
tend accepted theories of product diffusion rely on
aggregate-level data for both the customer attributes
and the overall adoption of the product (Ueda, 1990;
Tout, Evans and Yakan, 2005); they typically do not
incorporate individual adoption. Models of product diffusion assume that network-based marketing is ef
fective. Since understanding when diffusion occurs
and the extent to which it is effective is important for marketers, these methods may benefit from using individual-level data. Data on explicit networks would
enable the extension of existing diffusion models, as
well as the comparison of results using individual- ver
sus aggregate-level data.
In his first study, Bass tested his model empirically
against data for 11 consumer durables. The model
yielded good predictions of the sales peak and the
timing of the peak when applied to historical data.
Bass used linear regression to estimate the parame ters for future sales predictions, measuring the good ness of fit (R2 value) of the model for 11 consumer
durable products. The success of the forecasts suggests that the model may be useful in providing long-range
forecasting for product sales or adoption. There has
been considerable follow-up work on diffusion since
this groundbreaking work. Mahajan, M?ller and Kerin
(1984) review this work. Recent work on product diffu
sion explores the extent to which the Internet (Fildes,
2003) as well as globalization (Kumar and Krishnan,
2002) play a role in product diffusion.
3.6 Collaborative Filtering and Recommender
Systems
Recommender systems make personalized recom
mendations to individual consumers based on de
mographic content and link data (Adomavicius and
Tuzhilin, 2005). Collaborative filtering methods focus
on the links between consumers; however, the links are
not direct. They associate consumers with each other
based on shared purchases or similar ratings of shared
products.
Collaborative filtering is related to explicit consumer
network-based marketing because both target market
ing tasks benefit from learning from data stored in mul
tiple tables (Getoor, 2005). For example, Getoor and
Sahami (1999), Huang, Chung and Chen (2004) and
Newton and Greiner (2004) established the connection
between the recommendation problem and statistical
relational learning through the application of proba bilistic relational models (PRM's) (Getoor, Friedman,
Koller and Pfeffer, 2001 ). However, neither group used
explicit links between customers for learning. Recom
mendation systems may well benefit from information
about explicit consumer interaction as an additional,
perhaps quite important, aspect of similarity.
This content downloaded from 202.92.130.58 on Tue, 10 Mar 2015 09:28:56 UTCAll use subject to JSTOR Terms and Conditions

NETWORK-BASED MARKETING 261
3.7 Research Opportunities and Statistical
Challenges
We see that there is a burgeoning body of work
that addresses consumers' interactions and their effects
on purchasing. To our knowledge the foregoing types
represent the main statistical approaches taken in re
search on network-based marketing. In each approach, there are assumptions made in the data collection or in
the analysis that restrict them from providing strong and direct support for the hypothesis that network
based marketing indeed can improve on traditional
techniques. Surveys and convenience samples can suf
fer from small and possibly biased samples. Collab
orative filtering models have large samples, but do
not measure direct links between individuals. Models
in network classification and econometrics historically have used proxies like geography instead of data on
direct communications, and almost all studies have no
accurate, specific data on which (and what) customers
purchase.
To paint a complete picture of network influence for
a particular product, the ideal data set would have the
following properties: (1) large and unbiased sample,
(2) comprehensive covariate information on subjects,
(3) measurement of direct communication between
subjects and (4) accurate information on subjects' pur chases. The data set we present in the next section
has all of these properties and we will demonstrate
its value for statistical research into network influence.
The question of how to analyze such data brings up
many statistical issues:
Data-set size. Network-based marketing data sets
often arise from Internet or telecommunications ap
plications and can be quite large. When observations
number in the millions (or hundreds of millions), the
data become unwieldy for the typical data analyst and
often cannot be handled in memory by standard statis
tical analysis software. Even if the data can be loaded,
their size renders the interactive style of analysis com
mon with tools like R or Splus painfully slow. In Inter
net or telecommunications studies, there often are two
massive sources of data: all actors (web sites, commu
nicators), along with their descriptive attributes, and
the transactions among these actors. One solution is
to compress the transaction information into attributes
to be included in the actors' attribute set. It has been
shown that file squashing (DuMouchel, Volinsky et al.,
1999), which attempts to combine the best features of
preprocessed data with random sampling, can be use
ful for customer attrition prediction. DuMouchel et al.
claimed that squashing can be useful when dealing with up to billions of records. However, there may be
a loss of important information which can be captured
only by complex network structure.
More sophisticated network information derived
from transactional data can also be incorporated into
the matrix of customer information by deriving net
work attributes such as degree distribution and time
spent on the network (which we demonstrate below).
Similarly, other types of data such as geographical data
or temporal data, which otherwise would need to be
handled by some sophisticated methodology, can be
folded into the analysis by creating new covariates.
It remains an open question whether clever data en
gineering can extract all useful information to create
a set of covariates for traditional analysis. For exam
ple, knowledge of communication with specific sets of
individuals can be incorporated, and may provide sub
stantial benefit (Perlich and Provost, 2006). Once the data are combined, the remaining data set
still may be quite large. While much data mining re
search is focused on scaling up the statistical toolbox to
today's massive data sets, random sampling remains an
effective way to reduce data to a manageable size while
maintaining the relationships we are trying to discover, if we assume the network information is fully encoded
in the derived variables. The amount of sampling nec
essary will depend on the computing environment and
the complexity of the model, but most modern systems can handle data sets of tens or hundreds of thousands
of observations. When sampling, care must be taken to
stratify by any attributes that are of particular interest
or to oversample those attributes that have extremely skewed distributions.
Low incidence of response. In applications where the
response is a consumer's purchase or reaction to a mar
keting event, it is common to have a very low response
rate, which can result in poor fit and reduced ability to
detect significant effects for standard techniques like
logistic regression. If there are not many independent
attributes, one solution is Poisson regression, which is
well suited for rare events. Poisson regression requires
forming buckets of observations based on the indepen dent attributes and modeling the aggregate response in these buckets as a Poisson random variable. This
requires discretization of any continuous independent attributes, which may not be desirable. Also, if there
are even a moderate number of independent attributes, the buckets will be too sparse to allow Poisson mod
eling. Other solutions that have been proposed include
oversampling positive responses and/or undersampling
This content downloaded from 202.92.130.58 on Tue, 10 Mar 2015 09:28:56 UTCAll use subject to JSTOR Terms and Conditions

262 S. HILL, F. PROVOST AND C. VOLINSKY
negative responses. Weiss (2004) gave an overview of
the literature on these and related techniques, show
ing that there is mixed evidence as to their effective
ness. Other studies of note include the following. Weiss
and Provost (2003) showed that, given a fixed sample
size, the optimal class proportion in training data varies
by domain and by ultimate objective (but can be de
termined); generally speaking, to produce probability estimates or rankings, a 50:50 distribution is a good de
fault. However, Weiss and Provost's results are only for
tree induction, Japkowicz and Stephen (2002) experi mented with neural networks and support-vector ma
chines, in addition to tree induction, showing (among other things) that support-vector machines are insen
sitive to class imbalance. However, they considered
primarily noise-free data. Other techniques to deal
with unbalanced response attributes include ensemble
(Chan and Stolfo, 1998; Mease, Wyner and Buja, 2006) and multiphase rule induction (Clearwater and Stern,
1991 ; Joshi, Kumar and Agarwal, 2001). This is an area
in need of more systematic empirical and theoretical
study.
Separating word-of-mouth from homophily. Unless
there is information about the content of communi
cations, one cannot conclude that there was word-of
mouth transmission of information about the product. Social theory tells us that people who communi
cate with each other are more likely to be simi
lar to each other, a concept called homophily (Blau,
1977; McPherson, Smith-Lovin and Cook, 2001). Ho
mophily is exhibited for a wide variety of relation
ships and dimensions of similarity. Therefore, linked
consumers probably are like-minded, and like-minded
consumers tend to buy the same products. One way to
address this issue in the analysis is to account for con
sumer similarity using propensity scores (Rosenbaum
and Rubin, 1984). Propensity scores were developed in the context of nonrandomized clinical trials and at
tempt to adjust for the fact that the statistical profile of
patients who received treatment may be different than
the profile of those who did not, and that these differ
ences could mask or enhance the apparent effect of the
treatment. Let T represent the treatment, X represent the independent attributes excluding the treatment and
Y represent the response. Then the propensity score
PS(x) = P(T = 1|X
= x). By matching propensity
scores in the treatment and control groups using typical indicators of homophily like demographic data, we can
account (partially) for the possible confoundedness of
other independent attributes.
Incorporating extended network structure. Data with
network structure lend themselves to a robust set of
network-centric analyses. One simple method (em
ployed in our analysis) is to create attributes from
the network data and plug them into a traditional
analysis. Another approach is to let each actor be in
fluenced by her neighborhood modeled as a Markov
random field. Domingos and Richardson (2001) used
this technique to assign every node a "network value."
A node with high network value (1) has a high prob
ability of purchase, (2) is likely to give the product a high rating, (3) is influential on its neighbors' rat
ings and (4) has neighbors like itself. Hoff, Raftery and
Handcock (2002) defined a Markov-chain Monte Carlo
method to estimate latent positions of the actors for
small social-network data sets. This embeds the actors
in an unobserved "social space," which could be more
useful than the actual transactions themselves for pre
dicting sales. The field of statistical relational learning
(Getoor, 2005) has recently produced a wide variety of
methods that could be applicable. Often these models
allow influence to propagate through the network.
Missing data. Missing data in network transactions
are common?often only part of a network is observ
able. For instance, firms typically have transactional
data on their customers only or may have one class
of communication (e-mail) but not another (cellular
phone). One attempt to account for these missing edges is to use network structure to assign a probability of
a missing edge everywhere an edge is not present.
Thresholding this probability creates pseudo-edges, which can be added to the network, perhaps with a
lesser weight (Agarwal and Pregibon, 2004). This is
closely related to the link prediction problem, which
tries to predict where the next links will be (Liben Nowell and Kleinberg, 2003). One extension of the
PRM framework models link structure through the use
of reference uncertainty and existence uncertainty. The
extension includes a unified generative model for both
content and relational structure, where interactions be
tween the attributes and link structure are modeled
(Getoor, Friedman, Koller and Taskar, 2003).
4. DATA SET AND PRIMARY HYPOTHESIS
This section details our data set, derived primar
ily from a direct-mail marketing campaign to po tential customers of a new communications service
(later we augment the primary data with a large set
of consumer-specific attributes). The firm's market
ing team identified and marketed to a list of prospects
This content downloaded from 202.92.130.58 on Tue, 10 Mar 2015 09:28:56 UTCAll use subject to JSTOR Terms and Conditions

NETWORK-BASED MARKETING 263
using its standard methods. We investigate whether
network-related effects or evidence of "viral" informa
tion spread are present in this group. As we will de
scribe, the firm also marketed to a group we identified
using the network data, which allows us to test our hy
potheses further. We are not permitted to disclose cer
tain details, including specifics about the service being offered and the exact size of the data set.
4.1 Initial Data Details
In late 2004, a telecommunications firm undertook a
large direct-mail marketing campaign to potential cus
tomers of a new communications service. This service
involved new technology and, because of this, it was
believed that marketing would be most successful to
those consumers who were thought to be "high tech."
In keeping with standard practice, the marketing team collected attributes on a large set of prospects? consumers whom they believed to be potential adopters of the service. The marketing team used demographic
data, customer relationship data, and various other data
sources to create profitability and behavioral models
to identify prospective targets?consumers who would
receive a targeted mailing. The data the marketing team provided us with did not contain the underly
ing customer attributes (e.g., demographics), but in
stead included values for derived attributes that de
fined 21 marketing segments (Table 1) that were used
for campaign management and post hoc analyses. The
sample included millions of consumers. The team be
lieved that the different segments would have varying
response rates and it was important to separate the seg ments in this way to learn the most from the campaign.
An important derived variable was loyalty, a three
level score based on previous relationships with the
firm, including previous orders of this and other ser
vices. Roughly, loyalty level 3 comprises customers
with moderate-to-long tenure and/or those who have
subscribed to a number of services in the past. Loyalty level 2 comprises those customers with which the firm
has had some limited prior experiences. Loyalty level 1
comprises consumers who did not have service with the
firm at the time of mailing; little (if any) information is
available on them. Previous analyses have shown that
loyalty and tenure attributes have substantial impact on
response to campaigns. Other important attributes were based on demo
graphics and other customer characteristics. The at
tribute Intl is an indicator of whether the prospect had
previously ordered any international services; Techl
(hi, med or low) and Tech2 (1-10, where l=high
tech) are scores derived from demographics and other
Table 1
Descriptive statistics for the marketing segments (see Section 4.1 for details)
Segment Loyalty Intl Techl Tech2 Early Adopt Offer % of list %NN
1 3 Y Hi 1-7 Med-Hi PI 1.6 0.63 2 3 Y Med 1-7 Med-Hi PI 2.4 1.26
3 2 Y Hi 1-4 Hi PI 1.7 0.08 4 2 Y Med 1-4 Hi PI 1.7 0.10
5 1 Y Hi 1-4 Hi PI 0.1 0.22 6 1 Y Med 1-4 Hi PI 0.1 0.25
7 3 N Hi 1-7 Med-Hi P2 10.9 0.50 8 3 N Med 1-7 Med-Hi P2 13.1 0.83
9 2 N Hi 1-4 Hi P2 17.5 0.04 10 2 N Med 1-4 Hi P2 11.0 0.07
11 1 N Hi 1-4 Hi P2 5.3 0.14 12 1 N Med 1-4 Hi P2 7.7 0.25
13 3 N Hi 1-7 Med-Hi P2 2.0 0.63 14 1,2 N Hi 1-4 Hi P2 2.0 0.15
15 1 Y ? ? ? P3 2.0 1.01 16 IN? ? ? P2 1.6 0.46
17 3 N Hi 1-7 Med-Hi P2+ 2.0 0.70 18 1,2 N Hi 1-4 Hi P2+ 2.0 0.15
19 1,2,3 Y Hi 1-7 Med-Hi P3 1.8 0.67
20 2 N Hi, Med 1-4 Hi LI 6.0 0.05 21 2 N Hi, Med 1-4 Hi L2 6.0 0.05
This content downloaded from 202.92.130.58 on Tue, 10 Mar 2015 09:28:56 UTCAll use subject to JSTOR Terms and Conditions

264 S. HILL, F PROVOST AND C. VOLINSKY
attributes that estimate the interest and ability of the
customer to use a high-tech service; Early Adopt is
a proprietary score that estimates the likelihood of
the customer to use a new product, based on previ ous behavior. We also show the Offer, indicating that
different segments received different marketing mes
sages: P1-P3 indicate different postcards that were
sent, LI and L2 indicate different letters, and a "+"
indicates that a "call blast" accompanied the mailing. In defining the segments, those groups with high loy
alty values were permitted lower values from the tech
nology and early adoption models. Segments 15 and 16
were provided by an external vendor; there were insuf
ficient data on these prospects to fit our Tech and Early
Adopt models, as indicated by a "?" in Table 1.
4.2 Primary Hypothesis and Network Neighbors
The research goal we consider here is whether re
laxing the assumption of independence between con
sumers can improve demonstrably the estimation of
response likelihood. Thus, our first hypothesis is that
someone who has direct communication with a current
subscriber is more likely herself to adopt the service.
It should be noted that the firm knows only of com
munications initiated by one of its customers through a
service of the firm, so the network data are incomplete
(considerably), especially for the lower loyalty groups. Data on communications events include anonymous
identifiers for the transactors, a time stamp and the
transaction duration. For the purposes of this research,
all data are rendered anonymous so that individual
identities are protected. In pursuit of our hypothesis, we constructed an at
tribute called network neighbor (or NN)?a flag that
indicates whether the targeted consumer had commu
nicated with a current user of the service in a time pe
riod prior to the marketing campaign. Overall, 0.3% of
the targets are network neighbors. In Table 1, the per
centage of network neighbors (%NN) is broken down
by segment. In addition, the marketing team invited us to create
our own segment, which they also would target. Our
"segment 22" consisted of network neighbors that were
not already on the current list of targets. To make sure
our list contained viable prospects, the marketing team
calculated the derived technology and early adopter scores for the consumers on our list. They filtered
based on these scores, but they relaxed the thresholds
used to limit their original list. For instance, someone
with loyalty = 1 needed a Tech2 score less than 4 to
merit inclusion on the initial list; this threshold was
relaxed for our list to Tech2 less than 7. In this way, the marketing team allowed prospects who missed in
clusion on the first cut to make it into segment 22 if
they were network neighbors. However, the market
ing team still avoided targeting customers who they believed had very small probabilities of a purchase. For those network neighbors who did not score high
enough to warrant inclusion in segment 22, we still
tracked their purchase records to see if any of them sub
scribed to the service in the absence of the marketing
campaign; see below. Overall, the profile of the candi
dates in our segment 22 was considered to be subpar in terms of demographics, affinity and technological
capability. Notably, for our final conclusions, these tar
gets are potential customers the firm would have other
wise ignored. The size of segment 22 was about 1.2%
of the marketing list.
To summarize, the above process divides the pros
pect universe along two dimensions: (1) targets?those consumers identified by the marketing models as being
worthy of solicitation?and (2) network neighbors? those who had direct communication with a subscriber.
Table 2 shows the relative size for each combination
(using the non-network-neighbor targets as the refer
ence set). Note the non-NN nontargets, who neither
are network neighbors nor are they deemed to be good
prospects. This group is the majority of the prospect
space and includes consumers that the firm has very lit
tle information about, because they are low-usage com
municators or do not subscribe to any services with the
firm.
4.3 Modeling with Consumer-Specific Data
To determine whether relaxing the independence as
sumption (using the network data) improves model
ing, we fit models using a wide range of demographic and consumer-specific independent attributes (many of which are known or believed to affect the esti
mated likelihood of purchase). Overall, we collected
the values for over 150 attributes to assess their ef
fect on sales likelihood and their interactions with the
network-neighbor variable. These values included the
following:
Loyalty data: We obtained finer-grained loyalty in
formation than the simple categorization described
above, including past spending, types of service,
how often the customer responded to prior mailings, a loyalty score generated by a proprietary model and
information about length of tenure.
This content downloaded from 202.92.130.58 on Tue, 10 Mar 2015 09:28:56 UTCAll use subject to JSTOR Terms and Conditions

NETWORK-BASED MARKETING
Table 2
Data categories
Target = Y
NN = Y NN targets
Segments 1-22
Relative size = 0.015
Prospects identified by marketing models and who also
are network neighbors. Those in segment 22 have re
duced thresholds on the marketing model scores.
NN = N Non-NN targets
Segments 1-21
Relative size = 1
Prospects identified by marketing models but who are
not network neighbors.
Target = N
NN non target s
Relative size =0.10
Consumers who were network neighbors, but were not
marketed to because they scored poorly on marketing
models.
Non-NN nontargets
Relative size > 8
Consumers who were not network neighbors and also
were not considered to be good prospects by the mar
keting model.
Notes. The data for our study are broken down into targets and network neighbors. The "relative size" value shows the number of prospects
who show up in each group, relative to the non-NN target group.
Geographie data: Geographie data were necessary for the direct mail campaign. These data include city,
state, zip code, area code and metropolitan city code.
Demographic data: These include information such
as gender, education level, credit score, head of
household, number of children in the household, age of members in the household, occupation and home
ownership. Some of this information was inferred at
the census tract level from the geographic data.
Network attributes: As mentioned earlier, we ob
served communications of current subscribers with
other consumers. In addition to the simple network
neighbor flag described earlier, we derived more
sophisticated attributes from prospects' communica
tion patterns. We will return to these in Section 5.6.
4.4 Data Limitations
We encountered missing values for customers across
all loyalty levels. The amount of missing information is
directly related to the level of experience we have had
with the customer just prior to the direct mailing. For
example, geography data are available for all targets across all three loyalty levels. On the other hand, as the
number of services and tenure with the firm decline, so does the amount of information (e.g., transactions) available for each target. Given the difference in in
formation as loyalty varies, we grouped customers by
loyalty level and treated the levels separately in our
analyses. This stratification leaves three groups that
are mostly internally consistent with respect to miss
ing values.
The overall response rate is very low. As discussed
above, this presents challenges inherent with a heav
ily skewed response variable. For example, an analysis that stratifies over many different attributes may have
several strata with no sales at all, rendering these strata
mostly useless. The data set is large, which helps to
ameliorate this problem, but in turn presents logistical
problems with many sophisticated statistical analyses. In this paper, we restrict ourselves to relatively straight forward analyses.
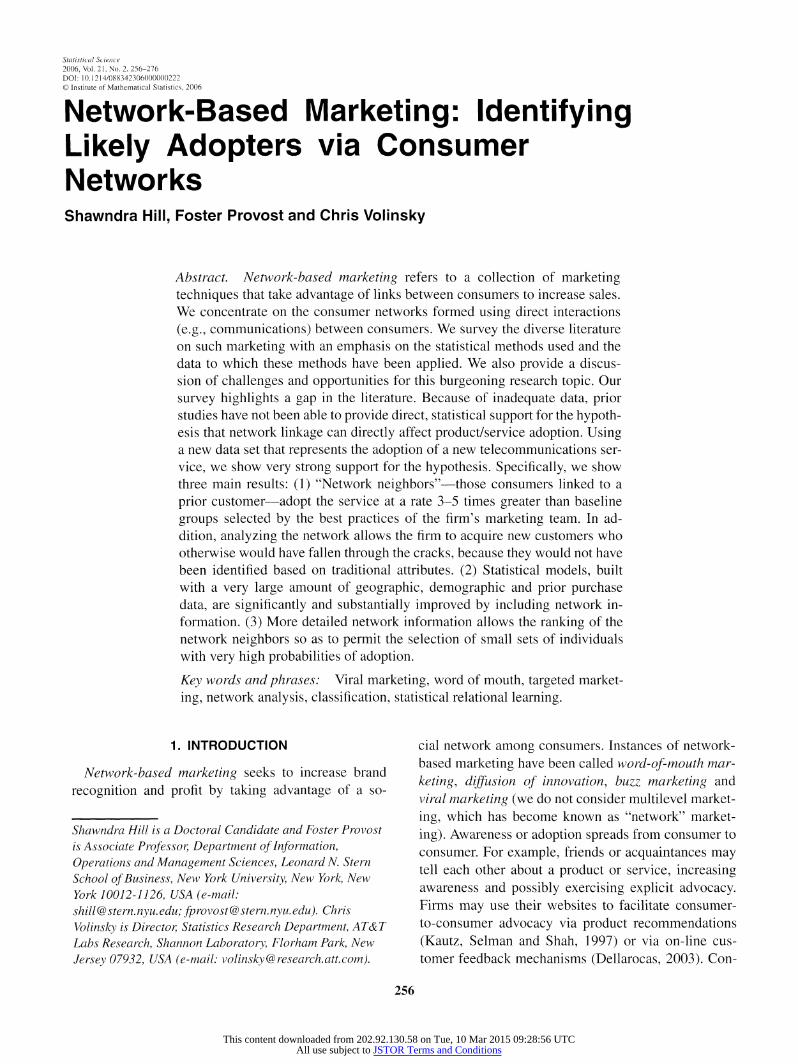
4.5 Loyalty Distribution
A look at the distribution of the loyalty groups across
the four categories (Figure 1) of prospects shows that
the firm targeted customers in the higher loyalty groups
relatively heavily. The network-neighbor target group
appears to skew toward the less loyal prospects; this
is due to the fact that segment 22, which makes up a
large part of the network-neighbor population, com
prises predominantly low-loyalty consumers.
5. ANALYSIS
Next we will show direct, statistical evidence that
consumers who have communicated with prior cus
tomers are more likely to become customers. We show
this in several ways, including using our own best
efforts to build competing targeting models and con
ducting thorough assessments of predictive ability on
out-of-sample data. Then we consider more sophisti cated network attributes and show that targeting can be
improved further.
This content downloaded from 202.92.130.58 on Tue, 10 Mar 2015 09:28:56 UTCAll use subject to JSTOR Terms and Conditions
266 S. HILL, F. PROVOST AND C. VOLINSKY
Tm&tff tTaqjjr* H
-?*?#t
i*rr
'*' ? -";:- '"'.'.'
V,;i.m. -Vf/
-r-ffl
<M?m >'&'?S-Tj^:
FlG. 1. Loyalty distribution by customer category. The three bars show the relative sizes of the three loyalty groups for our four data
categories. The network neighbors (NN) show a much larger proportion of low-loyalty consumers than the non-NN group.
5.1 Network-Based Marketing Improves Response
Segmentation provides an ideal setting to test the sig nificance and magnitude of any improvement in model
ing by including network-neighbor information, while
stratifying by many attributes known to be important, such as loyalty and tenure. The response variable is
the take rate for the targets in the two months following the direct mailing. The take rate is the proportion of the
targeted consumers who adopted the service within a
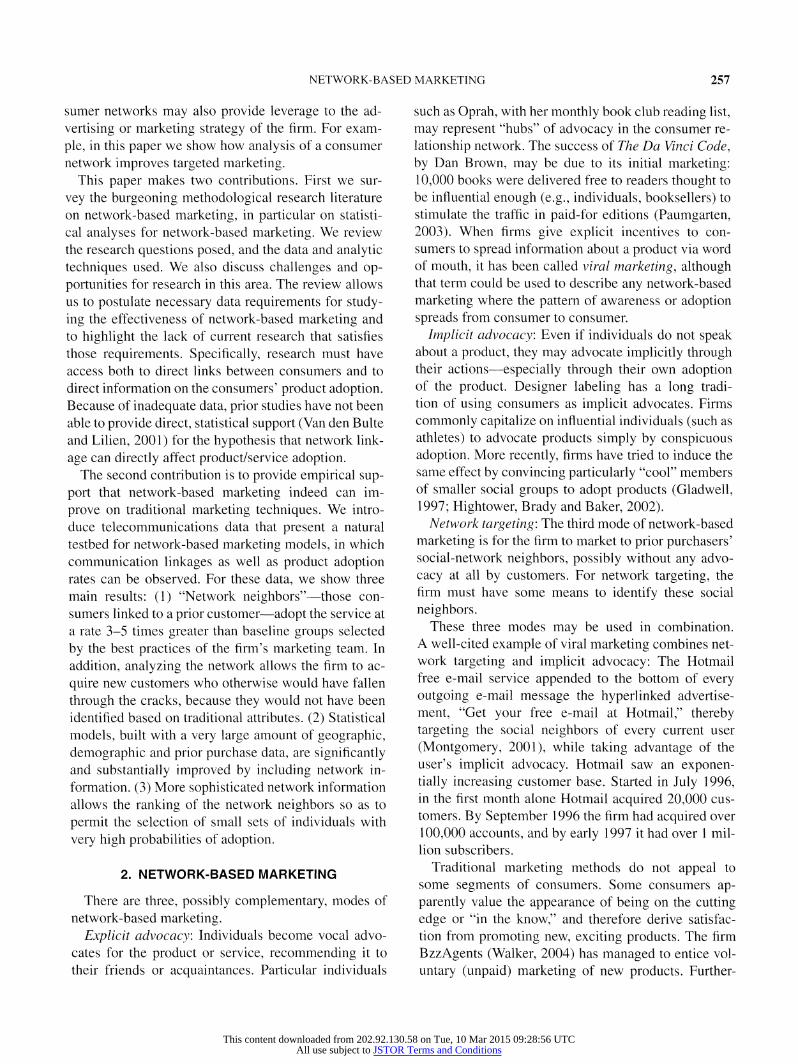
specified period following the offer. For each segment, we performed a simple logistic regression for the inde
pendent network-neighbor attribute versus the depen dent sales response. In Figure 2, we graphically present
parameter estimates (equivalent to log-odds ratios) for
the network attribute along with 95% confidence inter
vals for 20 of the 21 segments (segment 5 had only a
small number of network-neighbor prospects and zero
o
I w
O o? 3 -
Segments (ordered by log odds)
FIG. 2. Results of logistic regression. Parameter estimates plot
ted as log-odds ratios with 95% confidence intervals. The number
plotted at the value of the parameter estimate refers back to seg
ment numbers from Table 1.
network-neighbor sales, and therefore had an infinite
log odds). Figure 2 shows that in all 20 segments the
network-neighbor effect is positive (the parameter esti
mate is greater than zero), demonstrating an increased
take rate for the network-neighbor group within each
segment. For 17 of these segments, the log-odds ratio
is significantly different from the null hypothesis value
of 0 (p < 0.05), indicating that being a network neigh bor significantly affected sales in those segments.
While odds ratios allow for tests of significance of
an independent variable, they are not as directly inter
pretable as comparisons of take rates of the network
neighbor and non-network-neighbor groups in a given
segment. The take rates for the network neighbors are plotted versus the non-network neighbors in Fig ure 3, where the size of the point is proportional to
the log size of the segment. All segments have higher take rates in the network-neighbor subgroup, except for
the one segment that had no network-neighbor sales
(the smallest sample size). Over the entire data set, the
network-neighbors' take rates were greater by a fac
tor of 3.4. This value is plotted in Figure 3 as a dotted
line with slope = 3.4. The right-hand plot of Figure 3
shows the relationship between each segment's take
rate and its lift ratio, defined as the take rate for NN
divided by the take rate for non-NN. The plot shows
that the benefit of being a network neighbor is greater for those segments with lower overall take rates.
As Figure 3 shows, some of the segments had much
higher take rates than others. To assess statistical sig nificance of the network-neighbor effect after account
ing for this segment effect, we ran a logistic regression across all segments, including the main effects for the
This content downloaded from 202.92.130.58 on Tue, 10 Mar 2015 09:28:56 UTCAll use subject to JSTOR Terms and Conditions

NETWORK-BASED MARKETING 267
~ M -A
1 2 3
Jake Rate (%} for Noti ^Network, Take Rate for Non-Network
FIG. 3. Take rates for marketing segments. Left: For each segment, comparison of the take rate of the non-network neighbors with that of the network neighbors. The size of the glyph is proportional to the log size of the segment. There is one outlier not plotted, with a take rate
of 11% for the network neighbors and 0.3% for the non-network neighbors. Reference lines are plotted at x = y and at the overall take-rate
ratio of 3.4. Right: Plot of the take rate for the non-network group versus lift ratio for the network neighbors.
network-neighbor attribute, dummy attributes for each
segment and the interaction terms between the two.
Two of the interaction terms had to be deleted: one
from segment 22, which only had network-neighbor
cases, and one from the segment with no sales from
the network neighbors. We ran a full logistic regression and used stepwise variable selection.
Table 3
Coefficients and confidence intervals for the final segment model
Attribute Coeff (ci.) Significance2
Network neighbor (NN) Segment = 1
Segment = 2
Segment = 4
Segment = 5
Segment = 6
Segment = 7
Segment = 8
Segment = 17
Segment = 19 NN x Segment = 1 NN x Segment == 2 NN x Segment = 4 NN x Segment = 6 NN x Segment = 7 NN x Segment = 8 NN x Segment = 17 NN x Segment = 19
2.0(1.7,2.3)
1.7(0.9,2.5)
1.8(1.2,2.4)
2.1(1.3,3.0)
1.9(0.4, 3.3)
1.9(1.2, 2.5)
1.4(1.0, 1.9)
1.3(0.9, 1.7)
1.5(0.7,2.2)
2.2(1.6,2.9)
-1.1 (-2.1, 0.0)
-0.9 (-1.7, -0.2)
-1.8 (-4.0, 0.4)
-1.5 (-2.6, -0.6)
-1.2 (-1.7, -0.6)
-0.8 (-1.3, -0.4)
-1.6 (-2.8, -0.5)
-1.1 (-1.9, -0.3)
Significance of the attributes in the logistic regression model is shown at the 0.05 (*) and 0.01 (**) levels.
The results of the logistic regression reiterate the sig nificance of being a network neighbor. The final model
can be found in Table 3. The coefficient of 2.0 for the
network-neighbor attribute in the final model is an esti
mate of the log odds, which we exponentiate to get an
odds ratio of 7.49, with a 95% confidence interval of
(5.64, 9.94). More than half of the segment effects and
most of the interactions between the network-neighbor attribute and those segment effects are significant. The
interpretation of these interactions is important. Note
that the magnitudes of the interaction coefficients are
negative and very close in magnitude to the coefficients
of the main effects of the segments themselves. There
fore, although the segments themselves are significant, in the presence of the network attribute the segments' effect is mostly negated by the interaction effect. Since
the segments represent known important attributes like
loyalty, tenure and demographics, this is evidence that
being a network neighbor is at least as important in this
context.
In Table 4 we present an analysis of deviance table, an analog to analysis of variance used for nested lo
gistic regressions (McCullagh and Neider, 1983). The table confirms the significance of the main effects and
of the interactions. Each level of the nested model is
significant when a chi-squared approximation is used
for the differences of the d?viances. The fact that so
many interactions are significant demonstrates that the
network-neighbor effect varies for different segments of the prospect population.
This content downloaded from 202.92.130.58 on Tue, 10 Mar 2015 09:28:56 UTCAll use subject to JSTOR Terms and Conditions

S. HILL, F. PROVOST AND C. VOLINSKY
Tab
Analysis of deviance table fo.
Variable Deviance
Intercept 11200
Segment 10869
Segment + NN 10733 Segment + NN + interactions 10687
Significance of the group of attributes at each :
E4
the network-neighbor study
DF Change in deviance Significance^1
9 63 1 370
8 41
is shown at the 0.05 (*) and 0.01 (**) levels.
5.2 Segment 22
The segment data enable us to compare take rates
of network and non-network targets for the segments that contained both types of targets. However, many of
the network-neighbor targets fall into the network-only
segment 22. Segment 22 comprises prospects that the
original marketing models deemed not to be good can
didates for targeting. As we can see from the distribu
tion in Figure 1, this segment for the most part contains
consumers who had no prior relationship with the firm.
We compare the take rates for segment 22 with the
take rates for the combined group, including all of seg ments 1-21, in the leftmost three bars of Figure 4.
The network-neighbor segment 22 is (not surprisingly) not as successful as the NN groups in segments 1-21, since the targets in segments 1-21 were selected based
on characteristics that made them favorable for mar
keting. Interestingly, we see that the segment 22 net
work neighbors outperform the non-NN targets from
segments 1-21. These segment 22 network neighbors, identified primarily on the basis of their network ac
tivity, were more likely by almost 3 to 1 to purchase than the more "favorable" prospects who were not net
work neighbors. Since those in segment 22 either were
1.35%
0.83%
%%$ 0.28%| Wmn W0\ Q.11%
II W/^n mz-y\ ?mm? Network
' Network ' Non-Network ' Network Neighbors Neighbors Neighbors Neighbors
Segs1-21 Seg 22 Segs1-21 Non-Targets
FlG. 4. Take rates for marketing segments. Take rates for the
network neighbors and non-network neighbors in segments 1-21
compared with the all-network-neighbor segment 22 and with the
nontarget network neighbors. All take rates are relative to the
non-network-neighbor group (segments 1-21).
not identified by marketing analysts or were deemed to
be unworthy prospects, they represent customers who
would have "fallen through the cracks" in the tradi
tional marketing process.
5.3 Improving a Multivariate Targeting Model
Now we will assess whether the NN attribute can im
prove a multivariate targeting model by incorporating all that we know or can find out (over 150 different at
tributes) about the targets, including geography, demo
graphics and other company-specific attributes, from
internal and external sources (see Section 3.2). As discussed in Section 3.7, we tried to address
(as well as possible) an important causal question that
arises: Is this network-neighbor effect due to word of
mouth or simply due to homophily? The observed ef
fect may not be indicating viral propagation, but in
stead may simply demonstrate a very effective way to find like-minded people. This theoretical distinction
may not matter much to the firm for this particular type of marketing process, but is important to make, for ex
ample, before designing future campaigns that try to
take advantage of word-of-mouth behavior.
Although we cannot control for unobserved similar
ities, we can be as careful as possible in our analysis to ensure that the statistical profile of the NN prospects is the same as the profile for the non-NN cases. Since
our data set contains many more non-NN cases than
NN cases, we match each NN case with a single non
NN case that is as close as possible to it by calculating
propensity scores using all of the explanatory attributes
considered (as described in Section 3.7). At the end of
this matching process, the NN group is as close as is
reasonably possible in statistical properties to the non
NN group. Due to heterogeneity of data sources across the three
loyalty groups, we used the propensity scores to create
a matched data set for each group. For each (individu
ally), we fitted a full logistic regression including in
teractions and selected a final model using stepwise
This content downloaded from 202.92.130.58 on Tue, 10 Mar 2015 09:28:56 UTCAll use subject to JSTOR Terms and Conditions

NETWORK-BASED MARKETING
Table 5
Results of multivariate model
Loyalty
1
Significant attributes
Beta hat for NN
(95% CI) Take rate
NN
Discount calling plan (-)(I) Level of Int'l Comm.(I)
# of devices in house (-)
Revenue band
Tenure with firm (-)
International communicator
Belonged to loyalty program
Referral plan
Type of previous service
Credit score
Number of adults in house
0.68 (0.46, 0.91) 0.9%
NN
Discount calling plan (-)
Tenure with firm
Referral plan
High Tech model score (I) Region of country indicator
Belonged to loyalty program
Chumer (-)
College grad Tenure at residence (-)
Any children in house (-)
Child < 18 at home (-)
0.99 (0.49,1.49)
0.4%
NN
Previous responder to
mailing
High Tech Msg Letter (vs. postcard) Recent responder to mailing User of incentive credit card
Any children in house (-)
0.84 (0.52,1.16)
0.3%
Notes. Significant attributes from logistic regressions across loyalty levels (p < 0.05). Bold indicates significance at 0.01
the effect of the variable was negative; (1) indicates a significant interaction with the NN variable.
level; (-) indicates
variable selection. All attributes were checked for out
liers, transformations and collinearity with other at
tributes, and we removed or combined the attributes
that accounted for any significant correlations.
Table 5 shows the results of the logistic regres
sions, which show the attributes that were found to be
significant, those that were negatively correlated with
take rate, and those that had interactions with the NN
attribute. Each of the three models found the network
neighbor attribute to be significant along with several
others. The significant attributes tended to be attributes
regarding the prospects' previous relationships with the
firm, such as previous international services, tenure
with firm, churn identifiers and revenue spent with
the firm. These attributes are typically correlated with
demographic attributes, which explains the lack of sig nificance of many of the demographic attributes con
sidered. Interestingly, tenure with firm is significant in
loyalty groups 1 and 2, but with different signs. In the
most loyal group, tenure is negatively correlated, but
in the mid-level loyalty group it is positive. This unex
pected result may be due to differing compositions of
the two groups; those consumers with long tenure in
the most loyal group might be people who just never
change services, while long tenure in the other group
might be an indicator that they are gaining more trust
in the company. In loyalty group 1, there is limited in
formation about previous services with the firm. For
those customers, knowing whether the customer has
responded to any previous marketing campaigns has a
significant effect.
Table 5 also shows parameter estimates for NN and
the take rates in the three loyalty groups. The take rates
are highest in the group with the most loyalty but, in
terestingly, this group gets the least lift (smallest para meter estimate) from the NN attribute. So the impact of network-neighbor is stronger for those market seg
ments with lower loyalty, where actual take rates are
weakest.
5.4 Consumers Not Targeted
As discussed above, only a select subset of our
network-neighbor list was subject to marketing, based
on relaxed thresholds on eligibility criteria. The re
mainder of the list, the nontarget network neighbors, made up the majority. Potential customers were omit
ted for various reasons: they were not believed to
have high-tech capacity; they were on a do-not-contact
list; address information was unreliable, and so on.
Nonetheless, we were able to identify whether they
purchased the product in the follow-up time period. The take rate for this group was 0.11%, and is shown
relative to the target groups as the rightmost bar in Fig ure 4. Although they were not even marketed to, their
take rate is almost half that for the non-NN targets? chosen as some of the best prospects by the market
ing team. This group comprises consumers without
This content downloaded from 202.92.130.58 on Tue, 10 Mar 2015 09:28:56 UTCAll use subject to JSTOR Terms and Conditions

270 S. HILL, F. PROVOST AND C. VOLINSKY
any known favorable characteristics that would have
put them on the list of prospects. The fact that they are network neighbors alone supports a relatively high take rate, even in the absence of direct marketing.
This lends some support to an explanation of word-of
mouth propagation rather than homophily.
Finally, we will briefly discuss the remainder of the
consumer space?the non-NN nontarget group. Unfor
tunately, it is very difficult to estimate a take rate in this
category, which could be considered a baseline rate for
all of the other take rates. To do this, we would need to
estimate the size of the space of all prospects. This in
cludes all of the prospects the firm knows about, as well
as customers of the firm's competitors and consumers
who might purchase this product that do not have cur
rent telecommunications service with any provider. It
has been established that the size of the communica
tions market is difficult to estimate (Poole, 2004); our
best estimates of this baseline take rate put it at well
below 0.01%, at least an order of magnitude less than
even the nontarget network neighbors. On the other hand, a by-product of our study is that
we can upper-bound the effect of the mass market
ing campaigns in general by comparing the target-NN
group and the nontarget-NN group. The difference in
take rates between the targeted network neighbors and
the nontargeted network neighbors is about 10 to 1.
This difference cannot all be attributed to the marketing
effect, since the targeted group was specifically chosen
to be better prospects and it is likely that more of them
would have signed up for the service even in the total
absence of marketing. However, it does seem reason
able to call this factor of 10 an upper bound on the
effect of the marketing.
5.5 Out-of-Sample Ranking Performance
These results suggest that we can give fine-grained estimations as to which customers are more or less
likely to respond to an offer. Such estimations can be
quite valuable: the consumer pool is immense and a
campaign will have a limited budget. Therefore, be
ing able to pick a better list of "top-/:" prospects will
lead directly to increased profit (assuming targeting costs are not much higher for higher ranked prospects). In this section, we show that combining the network
neighbor attribute with the traditional attributes im
proves the ability to rank customers accurately. For each consumer, we create a record that com
prises all of the traditional attributes (trad atts), includ
ing loyalty, demographic and geographic attributes, as
well as network-neighbor status. Note that in different
business scenarios, different types and amounts of data
are available. For example, for low-loyalty customers,
very few descriptive attributes are known. We report results here using all attributes; the findings are quali
tatively similar for every different subset of attributes
we have tried (namely, segment, loyalty, geography,
demographic). The response variable is the same as
above and we used the same logistic regression mod
els. We measure the predictive ranking ability in the bi
nary response variable by an increase in the Wilcoxon
Mann-Whitney statistic, equivalent to the area under
the ROC curve (AUC). The ROC curve represents the
trade off between false negative and false positive rates
for each predicted possible probability score cutoff re
sulting from the logistic regression model. Specifically, the AUC is the probability that a randomly chosen (as
yet unseen) taker will be ranked higher than a randomly chosen nontaker; AUC = 1.0 means the classes are per
fectly separated and AUC = 0.5 means the list is ran
domly shuffled. All reported AUC values are averages obtained using 10-fold cross-validation.
Table 6 shows the AUC values for the three loy
alty groups, quantifying the expected benefit from the
improved logistic regression models. There is an in
crease in AUC for each group, with the largest increase
belonging to loyalty level 1, for which the least infor
mation is available; note that here the ranking ability without the network information is not much better
than random.
To visualize this improvement, Figure 5(a) shows cu
mulative response ("lift") curves when using the model
on loyalty group 3. The lower curve depicts the per formance of the model using all traditional attributes, and the upper curve includes the traditional marketing attributes and the network-neighbor attribute. In Fig ure 5(b), one can see the marked improvement that
Table 6
ROC analysis: AUC values that result from the application of
logistic regression models
Loyalty trad atts trad atts + NN
1 0.54 0.60
2 0.64 0.67
3 0.60 0.64
Note. The logistic regression models were built using all available
attributes with (trad atts + NN) and without (trad atts) the network
neighbor attribute. We see an increase in AUC across all loyalty
groups when the NN attribute is included in the model.
This content downloaded from 202.92.130.58 on Tue, 10 Mar 2015 09:28:56 UTCAll use subject to JSTOR Terms and Conditions

NETWORK-BASED MARKETING 271
E 3 O
0 0.2 0.4 0.6 0.8 1
Cumulative % of Consumers Targeted (Ranked by Predicted Sales)
(a)
2.5
1.5
0.5
- trad atts j
-trad atts + NNi
0 0.2 0.4 0.6 0.8 1
Cumulative % of Consumers Targeted (Ranked by Predicted Sales)
(b)
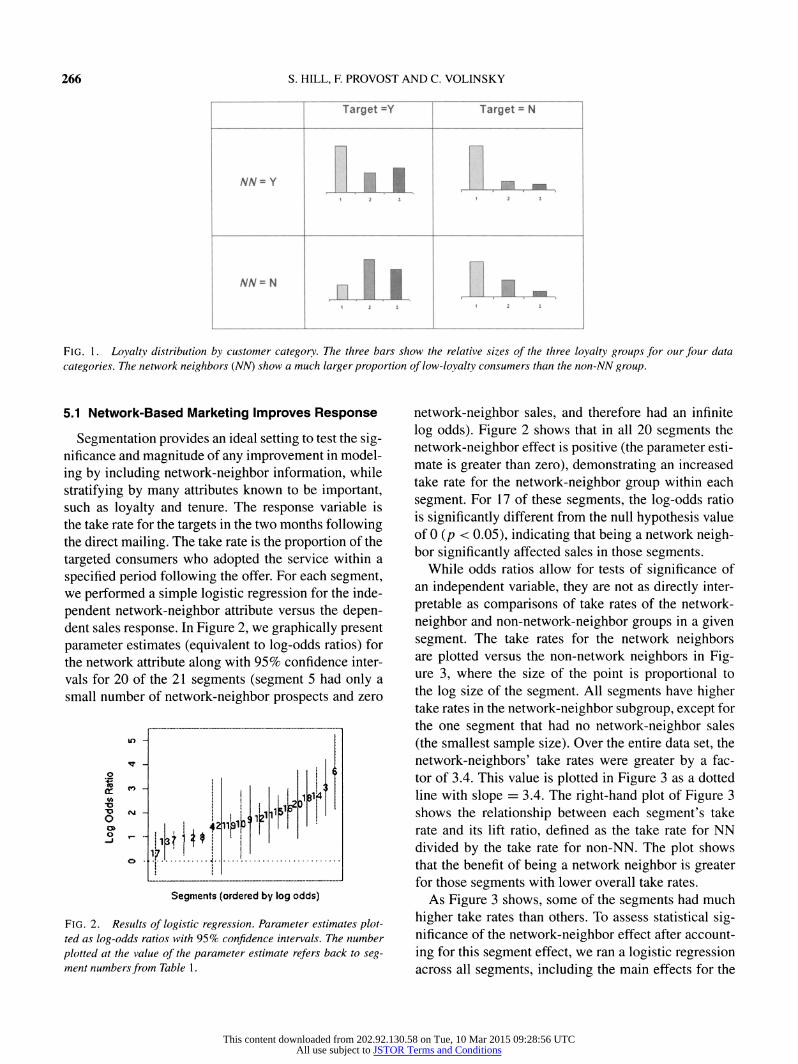
FIG. 5. (a) Lift curves. Power of the segmentation curves for models built with all attributes with (trad atts) and without (trad atts + AW)
network-neighbor attribute. The model with the NN attribute outperforms the model without it. For example, if the firm sent out 50% of the
mailing, they would get 70% of the positive responses with the NN compared to receiving only 63% of the responses without it. (b) Top-k
analysis. Consumers are ranked by the probability scores from the logistic regression model. The model that includes the NN attribute
outperforms the model without. For example, for the top 20% of targets, the take rate is 1.51% without the NN attribute and 1.72% with the
NN attribute.
would be obtained from sending to the top-/: prospects on the list. For example, for the top 20% of the list,
without the NN attribute, the take rate is 1.51%; with
the NN attribute, it is 1.72%. The NN attribute does not
improve the ranking for the top 10% of the list.
5.6 Improving Performance By Adding More
Sophisticated Network Attributes
Knowing whether a consumer is a network neigh bor is one of the simplest indicators of consumer-to
consumer interaction that can be extracted from the
network data. We now investigate whether augment
ing the model with more sophisticated social-network
information can add additional value. In this section, we focus on the social network that comprises (only) the current customers of this service (which here we
will call "the network"), along with the periphery of prospects who have communicated with those on
the network (the network neighbors). We investigate whether we can improve targeting by using more so
phisticated measures of social relationship with the
network of existing customers.
Table 7 summarizes a set of additional social
network attributes that we add to the logistic regres sion. The terminology we use is borrowed to some
degree from the fields of social-network analysis and
graph theory. Social-network analysis (SNA) involves
measuring relationships (including information trans
mission) between people on a network. The nodes in
the network represent people and the links between
them represent relationships between the nodes. The
SNA measures help quantify intuitive social notions, such as connectedness, influence, centrality, social im
portance and so on. Graph theory helps to understand
problems better by representing them as interconnected
nodes, and provides vocabulary and methods for oper
ating mathematically. Three of the attributes that we introduce can be de
rived from a prospect's local neighborhood (the set of
immediate communication partners on the network; re
call that these all are current customers). Degree mea
Table 7
Network attribute descriptions
Attribute Description
Degree
Transactions
Seconds of communication
Connected to influencer
Connected component size
Max similarity
Number of unique customers communicated with before the mailing Number of transactions to/from customers before the mailing Number of seconds communicated with customers before mailing Is an influencer in prospect's local neighborhood? Size of the connected component prospect belongs to
Max overlap in local neighborhood with any existing neighboring customer
This content downloaded from 202.92.130.58 on Tue, 10 Mar 2015 09:28:56 UTCAll use subject to JSTOR Terms and Conditions

272 S. HILL, F. PROVOST AND C. VOLINSKY
sures the number of direct connections a node has.
Within the local neighborhood, we also count the num
ber of Transactions, and the length of those transac
tions (Seconds of communication). The network is made up of many disjoint subgraphs.
Given a graph G = (V, E), where V is a set of ver
tices (nodes) and ? is a set of links between them, the connected components of G are the sets of ver
tices such that all vertices in each set are mutually con
nected (reachable by some path) and no two vertices
in different sets are connected. The size of the con
nected component may be an indicator for awareness
of and positive views about the product. If a prospect is linked to a large set of "friends" all of whom have
adopted the service, she may be more likely to adopt herself. Connected component size is the size of the
largest connected component (in the network) to which
the prospect is connected.
We also move beyond a prospect's local neigh borhood. Observing the local neighborhoods of a
prospect's local neighbors, we can define a measure
of social similarity. We define social similarity as the
size of the overlap in the immediate network neighbor hoods of two consumers. Max similarity is the max
imum social similarity between the prospect and any
neighbors of the prospect. Finally, the firm also can
observe the prior dynamics of its customers. In partic ular, the firm can observe which customers communi
cated before and/or after their adoption as well as the
date customers signed up. Using this information, we
define influencers as those subscribers who signed up for the service and, subsequently, we see one of their
network neighbors sign up for the service. Connected
to influencer is an indicator of whether the prospect is
connected to one of these influencers. We appreciate that we do not actually know if there was true influ
ence.
We use all of the aforementioned attributes and show
AUC values for these predictive models in Table 8. We
find that some of these network attributes have con
siderable predictive power individually and have even
more value when combined. This is indicated by AUCs
of 0.68 for both transactions and seconds of commu
nication. We do not find high AUCs individually for
connected component size, similarity or connected to
influencer. Ultimately, we find that the logistic regres sion model built with the network attributes results in
an AUC of 0.71 compared to an AUC of 0.66 without
the network attributes?using only the traditional mar
keting attributes described in previous sections. (Re call that this represents the ability to rank the network
Table 8
ROC analysis
Attribute(s) AUC
Transactions 0.68
Seconds of communication 0.68
Degree 0.59
Connected to influencer 0.53
Connected component size 0.55
Similarity 0.55 All network 0.71
All traditional (loyalty, demographic, geographic) 0.66
All traditional + all network 0.71
Note. AUC values result from logistic regression models built on
each of the constructed network attributes individually, as well as
in combination. Results are presented for loyalty-level 3 customers.
neighbors, who already have especially high take rates
as a group, as we have shown.)
Interestingly, when we combine the traditional at
tributes with the network attributes, there is no ad
ditional gain in AUC, even though many of these
attributes were shown to be significant in the broader
analysis above. The similarities represented implicitly or explicitly in the network attributes seem to account
for all useful information captured by traditional de
mographics and other marketing attributes. That tra
ditional demographics and other marketing attributes
do not add value is not only of theoretical interest, but
practical as well?for example, in cases such as this
where demographic data must be purchased. Our result is further confirmed by the lift and take
rate curves displayed in Figure 6(a) and (b), respec
tively. One can achieve substantially higher take rates
using the new network attributes as compared to using the traditional attributes. For example, we find that for
the top 20% of the targeted list, without the network
attributes, the take rate is 2.2%; with the network at
tributes, it is 3.1%. Likewise, at the top 10% of the list, the take rate with the network attributes is 4.4% com
pared to 2.9% without them.
6. LIMITATIONS
We believe our study to be the first to combine data on direct customer communication with data on prod uct adoption to show the effect of network-based mar
keting statistically. However, there are limitations in our study that are important to point out.
There are several types of missing, incomplete or
unreliable data which could influence our results. We
have records of all of the communication (using the
This content downloaded from 202.92.130.58 on Tue, 10 Mar 2015 09:28:56 UTCAll use subject to JSTOR Terms and Conditions
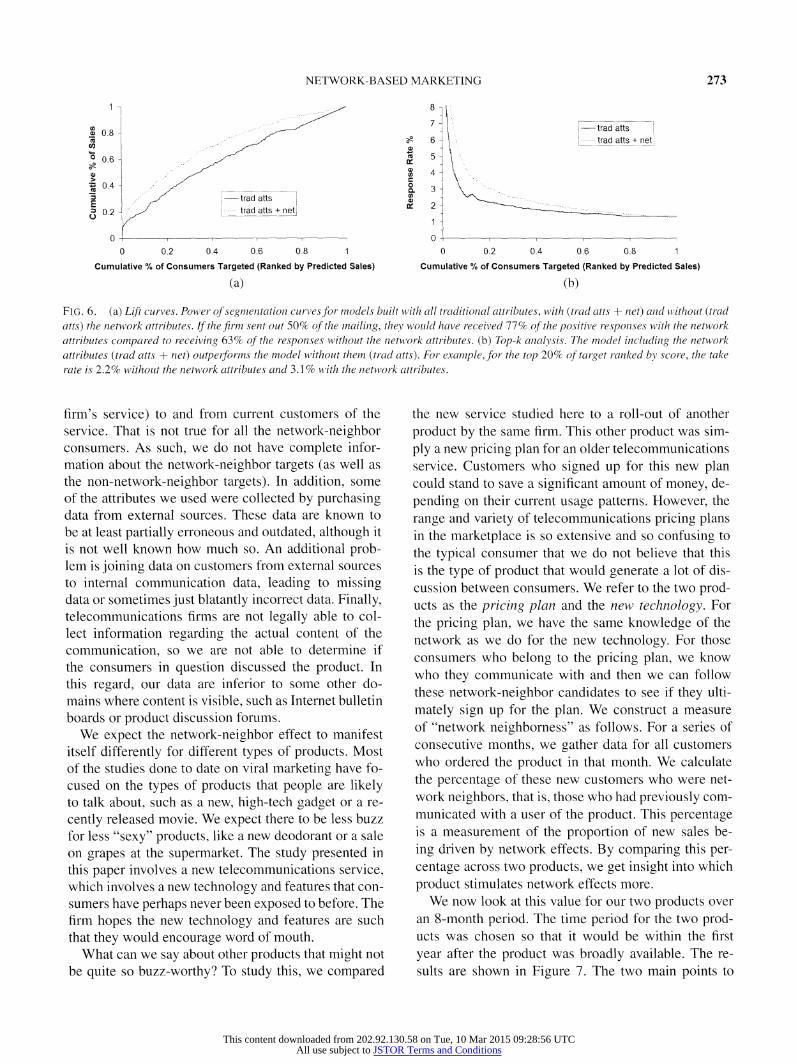
NETWORK-BASED MARKETING 273
o 0.8
CO ? 0.6
0.4
0.2
- trad atts
trad atts + net;
0 0.2 0.4 0.6 0.8 1
Cumulative % of Consumers Targeted (Ranked by Predicted Sales)
(a)
7 6 -
5 -
4
3 -
2
1
0 0.2 0.4 0.6 0.8 1
Cumulative % of Consumers Targeted (Ranked by Predicted Sales)
(b)
FIG. 6. (a) Lift curves. Power of segmentation cundes for models built with all traditional attributes, with (trad atts + net) and without (trad
atts) the network attributes. If the firm sent out 50% of the mailing, they would have received 11% of the positive responses with the network
attributes compared to receiving 63% of the responses without the network attributes, (b) Top-k analysis. The model including the network
attributes (trad atts + net) outperforms the model without them (trad atts). For example, for the top 20% of target ranked by score, the take
rate is 2.2% without the network attributes and 3.1 % with the network attributes.
firm's service) to and from current customers of the
service. That is not true for all the network-neighbor consumers. As such, we do not have complete infor
mation about the network-neighbor targets (as well as
the non-network-neighbor targets). In addition, some
of the attributes we used were collected by purchasing data from external sources. These data are known to
be at least partially erroneous and outdated, although it
is not well known how much so. An additional prob lem is joining data on customers from external sources
to internal communication data, leading to missing data or sometimes just blatantly incorrect data. Finally, telecommunications firms are not legally able to col
lect information regarding the actual content of the
communication, so we are not able to determine if
the consumers in question discussed the product. In
this regard, our data are inferior to some other do
mains where content is visible, such as Internet bulletin
boards or product discussion forums.
We expect the network-neighbor effect to manifest
itself differently for different types of products. Most
of the studies done to date on viral marketing have fo
cused on the types of products that people are likely to talk about, such as a new, high-tech gadget or a re
cently released movie. We expect there to be less buzz
for less "sexy" products, like a new deodorant or a sale
on grapes at the supermarket. The study presented in
this paper involves a new telecommunications service, which involves a new technology and features that con
sumers have perhaps never been exposed to before. The
firm hopes the new technology and features are such
that they would encourage word of mouth.
What can we say about other products that might not
be quite so buzz-worthy? To study this, we compared
the new service studied here to a roll-out of another
product by the same firm. This other product was sim
ply a new pricing plan for an older telecommunications
service. Customers who signed up for this new plan could stand to save a significant amount of money, de
pending on their current usage patterns. However, the
range and variety of telecommunications pricing plans in the marketplace is so extensive and so confusing to
the typical consumer that we do not believe that this
is the type of product that would generate a lot of dis
cussion between consumers. We refer to the two prod ucts as the pricing plan and the new technology. For
the pricing plan, we have the same knowledge of the
network as we do for the new technology. For those
consumers who belong to the pricing plan, we know
who they communicate with and then we can follow
these network-neighbor candidates to see if they ulti
mately sign up for the plan. We construct a measure
of "network neighborness" as follows. For a series of
consecutive months, we gather data for all customers
who ordered the product in that month. We calculate
the percentage of these new customers who were net
work neighbors, that is, those who had previously com
municated with a user of the product. This percentage is a measurement of the proportion of new sales be
ing driven by network effects. By comparing this per
centage across two products, we get insight into which
product stimulates network effects more.
We now look at this value for our two products over
an 8-month period. The time period for the two prod ucts was chosen so that it would be within the first
year after the product was broadly available. The re
sults are shown in Figure 7. The two main points to
This content downloaded from 202.92.130.58 on Tue, 10 Mar 2015 09:28:56 UTCAll use subject to JSTOR Terms and Conditions

274 S. HILL, F. PROVOST AND C. VOLINSKY
N?w5?rvke Pitting P?ar)
s\
Month
Fi G. 7. Network-neighborness plot for new service versus pricing
plan.
take away are that the new service has a higher per cent of purchasers who are network neighbors and also
an increasing one (except for the dip in month 5). In
contrast the pricing plan has a flat network-neighbor
percentage, never increasing above 3%.
Interestingly, the dip in the plot for the new service
corresponds exactly to the month of the direct market
ing discussed earlier. Before the campaign, we can see
that the network-neighbor effect was increasing, that
more and more of the purchasers in a given month
were network neighbors. During the mass marketing
campaign, we exposed many non-network neighbors to the service and many of them ended up purchasing
it, temporarily dropping the network-neighbor percent
age. After the campaign, we see the network-neighbor
percentage starting to increase again. This network-neighborness measure should not be
confused with the success of the product, as the pric
ing plan was quite successful from a sales perspective, but it does suggest that the pricing plan is a product that has less of a network-based spread of information.
This difference might be due to the new service creat
ing more word-of-mouth or perhaps we are seeing the
effects of homophily. People who interact with each
other are more likely to be similar in their propensity for purchasing the new service than in their propensity for purchasing a particular pricing plan. Again, the ef
fects of word of mouth versus homophily are difficult
to discern without knowing the content of the commu
nication.
7. DISCUSSION
One of the main concerns for any firm is when, how
and to whom they should market their products. Firms
make marketing decisions based on how much they know about their customers and potential customers.
They may choose to mass market when they do not
know much. With more information, they may market
directly based on some observed characteristics. We
provide strong evidence that whether and how well a
consumer is linked to existing customers is a powerful characteristic on which to base direct marketing deci
sions. Our results indicate that a firm can benefit from
the use of social networks to predict the likelihood of
purchasing. Taking the network data into account im
proves significantly and substantially on both the firm's
own marketing "best practices" and our best efforts to
collect and model with traditional data.
The sort of directed network-based marketing that
we study here has applicability beyond traditional
telecommunciations companies. For example, eBay
recently purchased Internet-telephony upstart Skype for $2.6 billion; they now also will have large-scale,
explicit data on who talks to whom. With gmail,
Google's e-mail service, Google now has access to
explicit networks of consumer interrelationships and
already is using gmail for marketing; directed network
based marketing might be a next step. Various systems have emerged recently that provide explicit linkages between acquaintances (e.g., MySpace, Friendster,
Facebook), which could be fruitful fields for network
based marketing. As more consumers create interlinked
blogs, another data source arises. More generally, these
results suggest that such linkage data potentially could
be a sort of data considered for acquisition by many
types of firms, as purchase data now are being col
lected routinely by many types of retail firms through
loyalty cards. Even academic departments could bene
fit from such data; for example, the enrollment in spe cialized classes could be bolstered by "marketing" to
those linked to existing students. Such links exist (e.g., via e-mail). It remains to design tactics for using them
that are acceptable to all.
It is tempting to argue that we have shown that cus
tomers discuss the product and that discussion helps to
improve take rates. However, word of mouth is not the
only possible explanation for our result. As discussed
in detail above, it may be that the network is a powerful source of information on consumer homophily, which
is in accord with social theories (Blau, 1977; McPher
son, Smith-Lovin and Cook, 2001). We have tried to
control for homophily by using a propensity-matched
sample to produce our logistic regression model. How
ever, it may well be that direct communications be
tween people is a better indicator of deep similarity
This content downloaded from 202.92.130.58 on Tue, 10 Mar 2015 09:28:56 UTCAll use subject to JSTOR Terms and Conditions

NETWORK-BASED MARKETING 275
than any demographic or geographic attributes. Either
cause, homophily or word of mouth, is interesting both
theoretically and practically.
ACKNOWLEDGMENTS
We would like to thank DeDe Paul and Deepak Agar wal of AT&T, as well as Chris Dellarocas of the Uni
versity of Maryland, for useful discussions and helpful
suggestions. We would also like to thank three anony mous reviewers who offered insightful comments on
previous drafts.
REFERENCES
Adomavicius, G. and Tuzhilin, A. (2005). Toward the next
generation of recommender systems: A survey of the state-of
the-art and possible extensions. IEEE Trans. Knowledge and
Data Engineering 17 734-749.
Agarwal, D. and Pregibon, D. (2004). Enhancing communi
ties of interest using Bayesian stochastic blockmodels. In Proc.
Fourth SIAM International Conference on Data Mining. SIAM,
Philadelphia.
Bass, F. M. (1969). A new product growth for model consumer
durables. Management Sei. 15 215-227.
BLAU, P. M. (1977). Inequality and Heterogeneity: A Primitive
Theory of Social Structure. Free Press, New York.
Bowman, D. and Narayandas, D. (2001). Managing customer
initiated contacts with manufacturers: The impact on share of
category requirements and word-of-mouth behavior. /. Market
ing Research-38 281 -297'.
Brin, S. and Page, L. (1998). The anatomy of a large-scale hy
pertextual Web search engine. Computer Networks and ISDN
Systems 30 107-117.
Case, A.C. (1991). Spatial patterns in household demand. Econo
metrica 59 953-965.
Chan, E. and Stolfo, S. (1998). Toward scalable learning with
non-uniform class and cost distributions: A case study in credit
card fraud detection. In Proc. Fourth International Conference on Knowledge Discovery and Data Mining 164-168. AAAI
Press, Menlo Park, CA.
Clearwater, S. H. and Stern, E. G. (1991). A rule-learning
program in high-energy physics event classification. Computer
Physics Communications 67 159-182.
DELLAROCAS, C (2003). The digitization of word of mouth:
Promise and challenges of online feedback mechanisms. Man
agement Sei. 49 1407-1424.
Domingos, P. and Richardson, M. (2001 ). Mining the network
value of customers. In Proc. Seventh ACM SIGKDD Interna
tional Conference on Knowledge Discovery and Data Mining
57-66. ACM Press, New York.
DuMouchel, W., Volinsky, C, Johnson, T., Cortes, C.
and Pregibon, D. (1999). Squashing flat files flatter. In Proc.
Fifth ACM SIGKDD International Conference on Knowledge
Discovery and Data Mining 6-15. ACM Press, New York.
FlCHMAN, R. G. (2004). Going beyond the dominant paradigm
for information technology innovation research: Emerging con
cepts and methods. J. Assoc. Information Systems 5 314-355.
FiLDES, R. (2003). Review of New-Product Diffusion Models, by V. Mahajan, E. M?ller and Y. Wind, eds. Internat. J. Forecasting
19 327-328.
Frenzen, J. and Nakamoto, K. (1993). Structure, cooperation, and the flow of market information. J. Consumer Research 20
360-375.
GETOOR, L. (2005). Tutorial on statistical relational learning. In
ductive Logic Programming, 15th International Conference. Lecture Notes in Comput. Sei. 3625 415. Springer, Berlin.
Getoor, L., Friedman, N., Koller, D. and Pfeffer, A.
(2001). Learning probabilistic relational models. In Relational
Data Mining (S. Dzeroski and N. Lavrac, eds.) 307-338.
Springer, Berlin.
Getoor, L., Friedman, N., Koller, D. and Taskar, B.
(2003). Learning probabilistic models of link structure. J. Mach.
Learn. Res. 3 679-707. MR1983942
Getoor, L. and Sahami, M. (1999). Using probabilistic relation
models for collaborative filtering. In Proc. WEBKDD 1999, San
Diego, CA.
Gladwell, M. (1997). The coolhunt. The New Yorker March 17,
78-88.
GLADWELL, M. (2002). The Tipping Point: How Little Things Can
Make a Big Difference. Back Bay Books, Boston.
Hightower, R., Brady, M. K. and Baker, T. L. (2002). Inves
tigating the role of the physical environment in hedonic service
consumption: An exploratory study of sporting events. J. Busi
ness Research 55 691-101.
Hoff, R D., Raftery, A. E. and Handcock, M. S. (2002). La
tent space approaches to social network analysis. /. Amer. Sta
tist Assoc. 97 1090-1098. MR 1951262
Huang, Z., Chung, W. and Chen, H. C. (2004). A graph model
for E-commerce recommender systems. J. Amer. Soc. Informa
tion Science and Technology 55 259-274.
Japkowicz, N. and Stephen, S. (2002). The class imbal
ance problem: A systematic study. Intelligent Data Analysis 6
429-449.
Joshi, M., Kumar, V. and Agarwal, R. (2001). Evaluating
boosting algorithms to classify rare classes: Comparison and
improvements. In Proc. IEEE International Conference on Data
Mining 257-264. IEEE Press, Piscataway, NJ.
Kautz, H., Selman, B. and Shah, M. (1997). Referral web:
Combining social networks and collaborative filtering. Comm.
ACM 40(3) 63-65. Klein BERG, J. (1999). Authoritative sources in a hyperlinked en
vironment. J. ACM 46 604-632. MR 1747649
Kumar, V. and Krishnan, T. V. (2002). Multinational diffusion
models: An alternative framework. Marketing Sei. 21 318-330.
LlBEN-NowELL, D. and KLEINBERG, J. (2003). The link pre
diction problem for social networks. In Proc. Twelfth Interna
tional Conference on Information and Knowledge Management
556-559. ACM Press, New York.
Linden, G., Smith, B. and York, J. (2003). Amazon.com
recommendations?Item-to-item collaborative filtering. IEEE
Internet Computing 7 76-80.
Macskassy, S. and Provost, F. (2004). Classification in net
worked data: A toolkit and a univariate case study. CeDER
Working Paper #CeDER-04-08, Stern School of Business, New
York University.
Mahajan, V., M?ller, E. and Kerin, R. (1984). Introduction
strategy for new products with positive and negative word-of
mouth. Management Sei. 30 1389-1404.
This content downloaded from 202.92.130.58 on Tue, 10 Mar 2015 09:28:56 UTCAll use subject to JSTOR Terms and Conditions

276 S. HILL, F. PROVOST AND C. VOLINSKY
McCULLAGH, P. and Nelder, J. A. (1983). Generalized Linear
Models. Chapman and Hall, New York. MR0727836
McPHERSON, M., Smith-Lovin, L. and COOK, J. (2001). Birds
of a feather: Homophily in social networks. Annual Review of
Sociology 27 415-444.
Mease, D., Wyner, A. and Buja, A. (2006). Boosted classifi
cation trees and class probability/quantile estimation. J. Mach.
Learn. Res. To appear.
Montgomery, A. L. (2001). Applying quantitative marketing
techniques to the Internet. Interfaces 31(2) 90-108.
Newton, J. and Greiner, R. (2004). Hierarchical probabilistic relational models for collaborative filtering. In Proc. Workshop on Statistical Relational Learning, 21st International Confer ence on Machine Learning. Banff, Alberta, Canada.
PAUMGARTEN, N. (2003). No. 1 fan dept. acknowledged. The New
Yorker May 5.
Perlich, C. and Provost, F. (2006). Distribution-based aggre
gation for relational learning with identifier attributes. Machine
Learning 62 65-105.
POOLE, D. (2004). Estimating the size of the telephone universe.
A Bayesian Mark-recapture approach. In Proc. Tenth ACM
SIGKDD International Conference on Knowledge Discovery
and Data Mining 659-664. ACM Press, New York.
Richardson, M. and Domingos, P. (2002). Mining knowledge
sharing sites for viral marketing. In Proc. Eighth ACM SIGKDD
International Conference on Knowledge Discovery and Data
Mining 61-70. ACM Press, New York.
ROGERS, E. M. (2003). Diffusion of Innovations, 5th ed. Free
Press, New York.
Rosenbaum, P. R. and Rubin, D. B. (1984). Reducing bias in
observational studies using subclassification on the propensity score. J. Amer. Statist. Assoc. 79 516-524.
Tout, K., Evans, D. J. and Yakan, A. (2005). Collaborative fil
tering: Special case in predictive analysis. Internat. J. Computer Mathematics 82 1-11. MR2159280
Ueda, T. (1990). A study of a competitive Bass model which takes
into account competition among firms. J. Operations Research
Society of Japan 33 319-334.
Van den Bulte, C. and Lilien, G. L. (2001). Medical innova
tion revisited: Social contagion versus marketing effort. Ameri
can J. Sociology 106 1409-1435.
Walker, R. (2004). The hidden (in plain sight) persuaders. The
New York Times Magazine Dec. 5, 69-75.
Weiss, G. and Provost, F (2003). Learning when training data
are costly: The effect of class distribution on tree induction.
J. Artificial Intelligence Research 19 315-354.
WEISS, G. M. (2004). Mining with rarity: A unifying framework.
ACM SIGKDD Explorations Newsletter 6 7-19.
Yang, S. and Allenby, G. M. (2003). Modeling interdependent consumer preferences. /. Marketing Research 40 282-294.
This content downloaded from 202.92.130.58 on Tue, 10 Mar 2015 09:28:56 UTCAll use subject to JSTOR Terms and Conditions


