Embed Size (px)
Citation preview
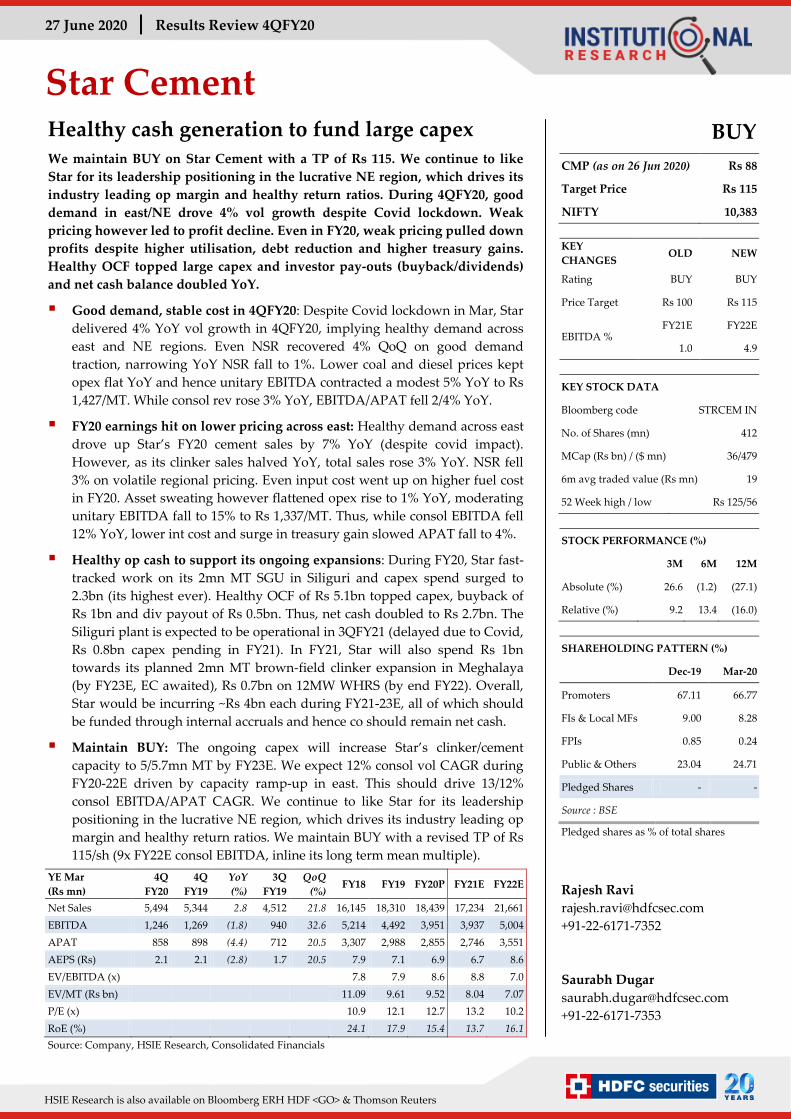
27 June 2020 Results Review 4QFY20
Star Cement
HSIE Research is also available on Bloomberg ERH HDF <GO> & Thomson Reuters
Healthy cash generation to fund large capex
We maintain BUY on Star Cement with a TP of Rs 115. We continue to like
Star for its leadership positioning in the lucrative NE region, which drives its
industry leading op margin and healthy return ratios. During 4QFY20, good
demand in east/NE drove 4% vol growth despite Covid lockdown. Weak
pricing however led to profit decline. Even in FY20, weak pricing pulled down
profits despite higher utilisation, debt reduction and higher treasury gains.
Healthy OCF topped large capex and investor pay-outs (buyback/dividends)
and net cash balance doubled YoY.
Good demand, stable cost in 4QFY20: Despite Covid lockdown in Mar, Star
delivered 4% YoY vol growth in 4QFY20, implying healthy demand across
east and NE regions. Even NSR recovered 4% QoQ on good demand
traction, narrowing YoY NSR fall to 1%. Lower coal and diesel prices kept
opex flat YoY and hence unitary EBITDA contracted a modest 5% YoY to Rs
1,427/MT. While consol rev rose 3% YoY, EBITDA/APAT fell 2/4% YoY.
FY20 earnings hit on lower pricing across east: Healthy demand across east
drove up Star’s FY20 cement sales by 7% YoY (despite covid impact).
However, as its clinker sales halved YoY, total sales rose 3% YoY. NSR fell
3% on volatile regional pricing. Even input cost went up on higher fuel cost
in FY20. Asset sweating however flattened opex rise to 1% YoY, moderating
unitary EBITDA fall to 15% to Rs 1,337/MT. Thus, while consol EBITDA fell
12% YoY, lower int cost and surge in treasury gain slowed APAT fall to 4%.
Healthy op cash to support its ongoing expansions: During FY20, Star fast-
tracked work on its 2mn MT SGU in Siliguri and capex spend surged to
2.3bn (its highest ever). Healthy OCF of Rs 5.1bn topped capex, buyback of
Rs 1bn and div payout of Rs 0.5bn. Thus, net cash doubled to Rs 2.7bn. The
Siliguri plant is expected to be operational in 3QFY21 (delayed due to Covid,
Rs 0.8bn capex pending in FY21). In FY21, Star will also spend Rs 1bn
towards its planned 2mn MT brown-field clinker expansion in Meghalaya
(by FY23E, EC awaited), Rs 0.7bn on 12MW WHRS (by end FY22). Overall,
Star would be incurring ~Rs 4bn each during FY21-23E, all of which should
be funded through internal accruals and hence co should remain net cash.
Maintain BUY: The ongoing capex will increase Star’s clinker/cement
capacity to 5/5.7mn MT by FY23E. We expect 12% consol vol CAGR during
FY20-22E driven by capacity ramp-up in east. This should drive 13/12%
consol EBITDA/APAT CAGR. We continue to like Star for its leadership
positioning in the lucrative NE region, which drives its industry leading op
margin and healthy return ratios. We maintain BUY with a revised TP of Rs
115/sh (9x FY22E consol EBITDA, inline its long term mean multiple).
YE Mar
(Rs mn)
4Q
FY20
4Q
FY19
YoY
(%)
3Q
FY19
QoQ
(%) FY18 FY19 FY20P FY21E FY22E
Net Sales 5,494 5,344 2.8 4,512 21.8 16,145 18,310 18,439 17,234 21,661
EBITDA 1,246 1,269 (1.8) 940 32.6 5,214 4,492 3,951 3,937 5,004
APAT 858 898 (4.4) 712 20.5 3,307 2,988 2,855 2,746 3,551
AEPS (Rs) 2.1 2.1 (2.8) 1.7 20.5 7.9 7.1 6.9 6.7 8.6
EV/EBITDA (x)
7.8 7.9 8.6 8.8 7.0
EV/MT (Rs bn)
11.09 9.61 9.52 8.04 7.07
P/E (x)
10.9 12.1 12.7 13.2 10.2
RoE (%)
24.1 17.9 15.4 13.7 16.1
Source: Company, HSIE Research, Consolidated Financials
BUY
CMP (as on 26 Jun 2020) Rs 88
Target Price Rs 115
NIFTY 10,383
KEY
CHANGES OLD NEW
Rating BUY BUY
Price Target Rs 100 Rs 115
EBITDA % FY21E FY22E
1.0 4.9
KEY STOCK DATA
Bloomberg code STRCEM IN
No. of Shares (mn) 412
MCap (Rs bn) / ($ mn) 36/479
6m avg traded value (Rs mn) 19
52 Week high / low Rs 125/56
STOCK PERFORMANCE (%)
3M 6M 12M
Absolute (%) 26.6 (1.2) (27.1)
Relative (%) 9.2 13.4 (16.0)
SHAREHOLDING PATTERN (%)
Dec-19 Mar-20
Promoters 67.11 66.77
FIs & Local MFs 9.00 8.28
FPIs 0.85 0.24
Public & Others 23.04 24.71
Pledged Shares - -
Source : BSE
Pledged shares as % of total shares
Rajesh Ravi
+91-22-6171-7352
Saurabh Dugar
+91-22-6171-7353
Page | 2
Star Cement: Results Review 4QFY20
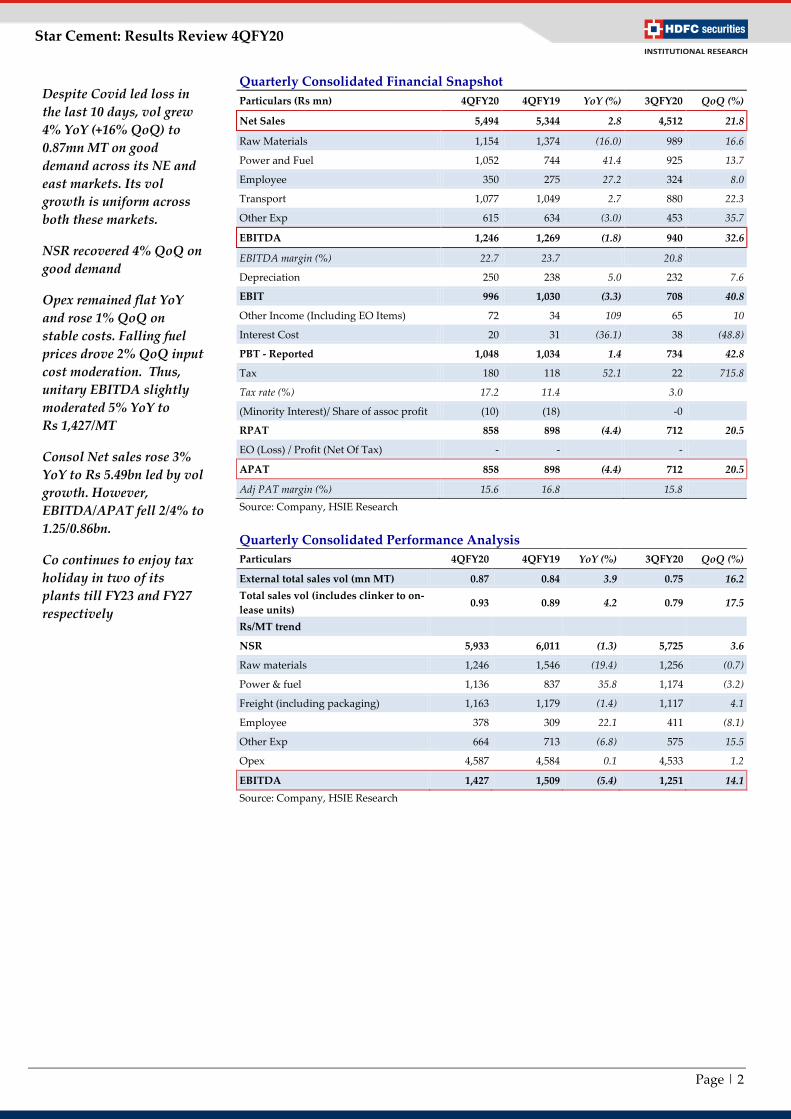
Quarterly Consolidated Financial Snapshot
Particulars (Rs mn) 4QFY20 4QFY19 YoY (%) 3QFY20 QoQ (%)
Net Sales 5,494 5,344 2.8 4,512 21.8
Raw Materials 1,154 1,374 (16.0) 989 16.6
Power and Fuel 1,052 744 41.4 925 13.7
Employee 350 275 27.2 324 8.0
Transport 1,077 1,049 2.7 880 22.3
Other Exp 615 634 (3.0) 453 35.7
EBITDA 1,246 1,269 (1.8) 940 32.6
EBITDA margin (%) 22.7 23.7 20.8
Depreciation 250 238 5.0 232 7.6
EBIT 996 1,030 (3.3) 708 40.8
Other Income (Including EO Items) 72 34 109 65 10
Interest Cost 20 31 (36.1) 38 (48.8)
PBT - Reported 1,048 1,034 1.4 734 42.8
Tax 180 118 52.1 22 715.8
Tax rate (%) 17.2 11.4 3.0
(Minority Interest)/ Share of assoc profit (10) (18) -0
RPAT 858 898 (4.4) 712 20.5
EO (Loss) / Profit (Net Of Tax) - - -
APAT 858 898 (4.4) 712 20.5
Adj PAT margin (%) 15.6 16.8 15.8
Source: Company, HSIE Research
Quarterly Consolidated Performance Analysis
Particulars 4QFY20 4QFY19 YoY (%) 3QFY20 QoQ (%)
External total sales vol (mn MT) 0.87 0.84 3.9 0.75 16.2
Total sales vol (includes clinker to on-
lease units) 0.93 0.89 4.2 0.79 17.5
Rs/MT trend
NSR 5,933 6,011 (1.3) 5,725 3.6
Raw materials 1,246 1,546 (19.4) 1,256 (0.7)
Power & fuel 1,136 837 35.8 1,174 (3.2)
Freight (including packaging) 1,163 1,179 (1.4) 1,117 4.1
Employee 378 309 22.1 411 (8.1)
Other Exp 664 713 (6.8) 575 15.5
Opex 4,587 4,584 0.1 4,533 1.2
EBITDA 1,427 1,509 (5.4) 1,251 14.1
Source: Company, HSIE Research
Despite Covid led loss in
the last 10 days, vol grew
4% YoY (+16% QoQ) to
0.87mn MT on good
demand across its NE and
east markets. Its vol
growth is uniform across
both these markets.
NSR recovered 4% QoQ on
good demand
Opex remained flat YoY
and rose 1% QoQ on
stable costs. Falling fuel
prices drove 2% QoQ input
cost moderation. Thus,
unitary EBITDA slightly
moderated 5% YoY to
Rs 1,427/MT
Consol Net sales rose 3%
YoY to Rs 5.49bn led by vol
growth. However,
EBITDA/APAT fell 2/4% to
1.25/0.86bn.
Co continues to enjoy tax
holiday in two of its
plants till FY23 and FY27
respectively
Page | 3
Star Cement: Results Review 4QFY20
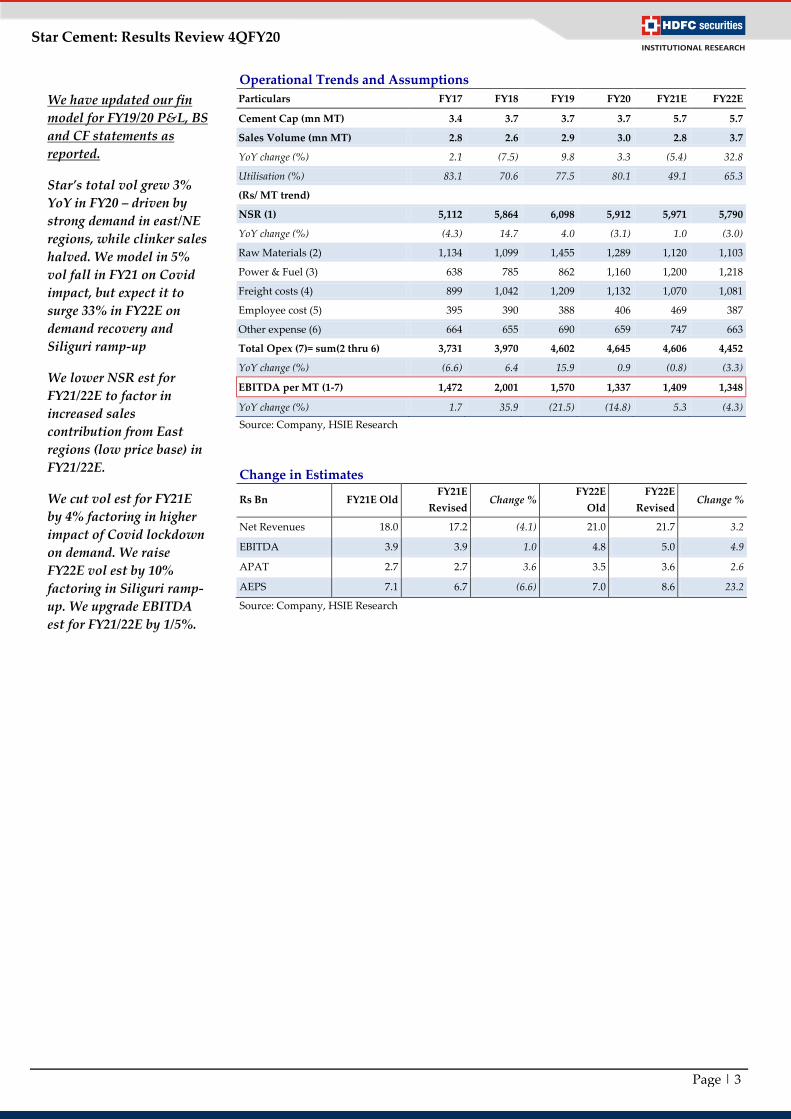
Operational Trends and Assumptions
Particulars FY17 FY18 FY19 FY20 FY21E FY22E
Cement Cap (mn MT) 3.4 3.7 3.7 3.7 5.7 5.7
Sales Volume (mn MT) 2.8 2.6 2.9 3.0 2.8 3.7
YoY change (%) 2.1 (7.5) 9.8 3.3 (5.4) 32.8
Utilisation (%) 83.1 70.6 77.5 80.1 49.1 65.3
(Rs/ MT trend)
NSR (1) 5,112 5,864 6,098 5,912 5,971 5,790
YoY change (%) (4.3) 14.7 4.0 (3.1) 1.0 (3.0)
Raw Materials (2) 1,134 1,099 1,455 1,289 1,120 1,103
Power & Fuel (3) 638 785 862 1,160 1,200 1,218
Freight costs (4) 899 1,042 1,209 1,132 1,070 1,081
Employee cost (5) 395 390 388 406 469 387
Other expense (6) 664 655 690 659 747 663
Total Opex (7)= sum(2 thru 6) 3,731 3,970 4,602 4,645 4,606 4,452
YoY change (%) (6.6) 6.4 15.9 0.9 (0.8) (3.3)
EBITDA per MT (1-7) 1,472 2,001 1,570 1,337 1,409 1,348
YoY change (%) 1.7 35.9 (21.5) (14.8) 5.3 (4.3)
Source: Company, HSIE Research
Change in Estimates
Rs Bn FY21E Old FY21E
Revised Change %
FY22E
Old
FY22E
Revised Change %
Net Revenues 18.0 17.2 (4.1) 21.0 21.7 3.2
EBITDA 3.9 3.9 1.0 4.8 5.0 4.9
APAT 2.7 2.7 3.6 3.5 3.6 2.6
AEPS 7.1 6.7 (6.6) 7.0 8.6 23.2
Source: Company, HSIE Research
We have updated our fin
model for FY19/20 P&L, BS
and CF statements as
reported.
Star’s total vol grew 3%
YoY in FY20 – driven by
strong demand in east/NE
regions, while clinker sales
halved. We model in 5%
vol fall in FY21 on Covid
impact, but expect it to
surge 33% in FY22E on
demand recovery and
Siliguri ramp-up
We lower NSR est for
FY21/22E to factor in
increased sales
contribution from East
regions (low price base) in
FY21/22E.
We cut vol est for FY21E
by 4% factoring in higher
impact of Covid lockdown
on demand. We raise
FY22E vol est by 10%
factoring in Siliguri ramp-
up. We upgrade EBITDA
est for FY21/22E by 1/5%.
Page | 4
Star Cement: Results Review 4QFY20
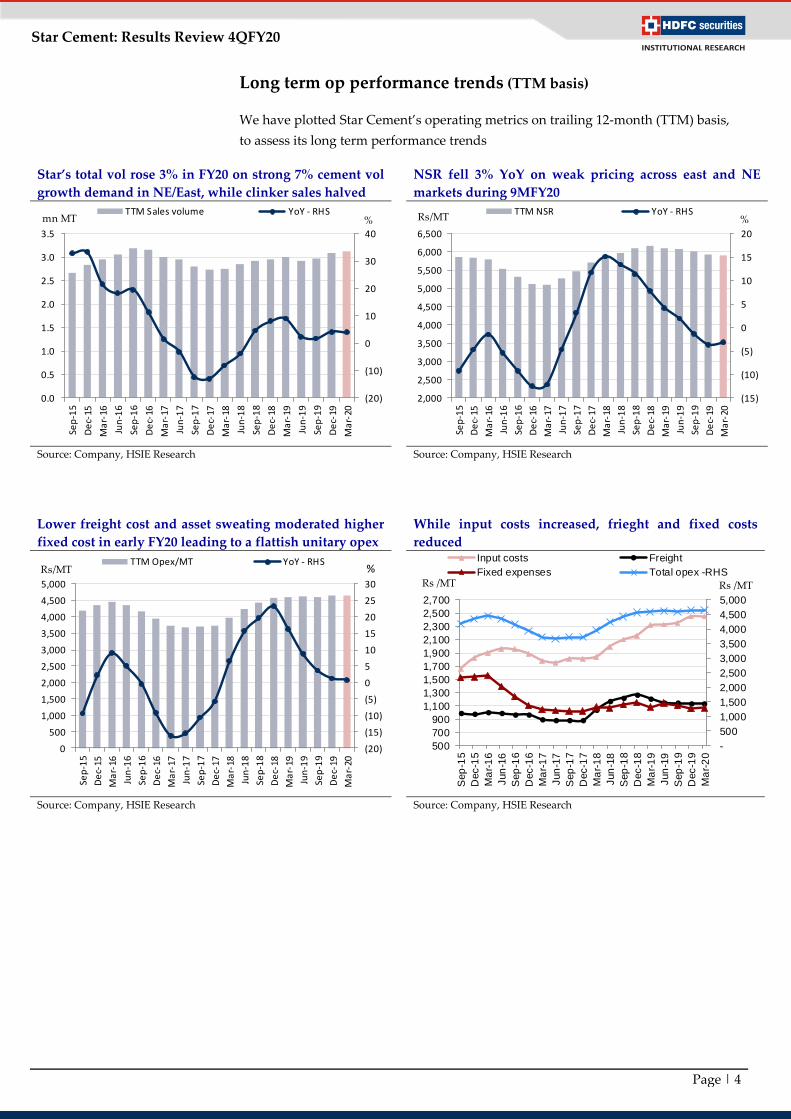
Long term op performance trends (TTM basis)
We have plotted Star Cement’s operating metrics on trailing 12-month (TTM) basis,
to assess its long term performance trends
Star’s total vol rose 3% in FY20 on strong 7% cement vol
growth demand in NE/East, while clinker sales halved
NSR fell 3% YoY on weak pricing across east and NE
markets during 9MFY20
Source: Company, HSIE Research
Source: Company, HSIE Research
Lower freight cost and asset sweating moderated higher
fixed cost in early FY20 leading to a flattish unitary opex
While input costs increased, frieght and fixed costs
reduced
Source: Company, HSIE Research Source: Company, HSIE Research
(20)
(10)
0
10
20
30
40
0.0
0.5
1.0
1.5
2.0
2.5
3.0
3.5
Sep
-15
De
c-15
Ma
r-16
Jun
-16
Sep
-16
De
c-16
Ma
r-17
Jun
-17
Sep
-17
De
c-17
Ma
r-18
Jun
-18
Sep
-18
De
c-18
Ma
r-19
Jun
-19
Sep
-19
De
c-19
Ma
r-20
TTM Sales volume YoY - RHSmn MT %
(15)
(10)
(5)
0
5
10
15
20
2,000
2,500
3,000
3,500
4,000
4,500
5,000
5,500
6,000
6,500
Sep
-15
De
c-15
Ma
r-16
Jun
-16
Sep
-16
De
c-16
Ma
r-17
Jun
-17
Sep
-17
De
c-17
Ma
r-18
Jun
-18
Sep
-18
De
c-18
Ma
r-19
Jun
-19
Sep
-19
De
c-19
Ma
r-20
TTM NSR YoY - RHSRs/MT %
(20)
(15)
(10)
(5)
0
5
10
15
20
25
30
0
500
1,000
1,500
2,000
2,500
3,000
3,500
4,000
4,500
5,000
Sep
-15
De
c-15
Ma
r-16
Jun
-16
Sep
-16
De
c-16
Ma
r-17
Jun
-17
Sep
-17
De
c-17
Ma
r-18
Jun
-18
Sep
-18
De
c-18
Ma
r-19
Jun
-19
Sep
-19
De
c-19
Ma
r-20
TTM Opex/MT YoY - RHSRs/MT %
-
500
1,000
1,500
2,000
2,500
3,000
3,500
4,000
4,500
5,000
500
700
900
1,100
1,300
1,500
1,700
1,900
2,100
2,300
2,500
2,700
Sep
-15
Dec-1
5
Ma
r-1
6
Jun
-16
Sep
-16
Dec-1
6
Ma
r-1
7
Jun
-17
Sep
-17
Dec-1
7
Ma
r-1
8
Jun
-18
Sep
-18
Dec-1
8
Ma
r-1
9
Jun
-19
Sep
-19
Dec-1
9
Ma
r-2
0
Input costs Freight
Fixed expenses Total opex -RHSRs /MT Rs /MT
Page | 5
Star Cement: Results Review 4QFY20
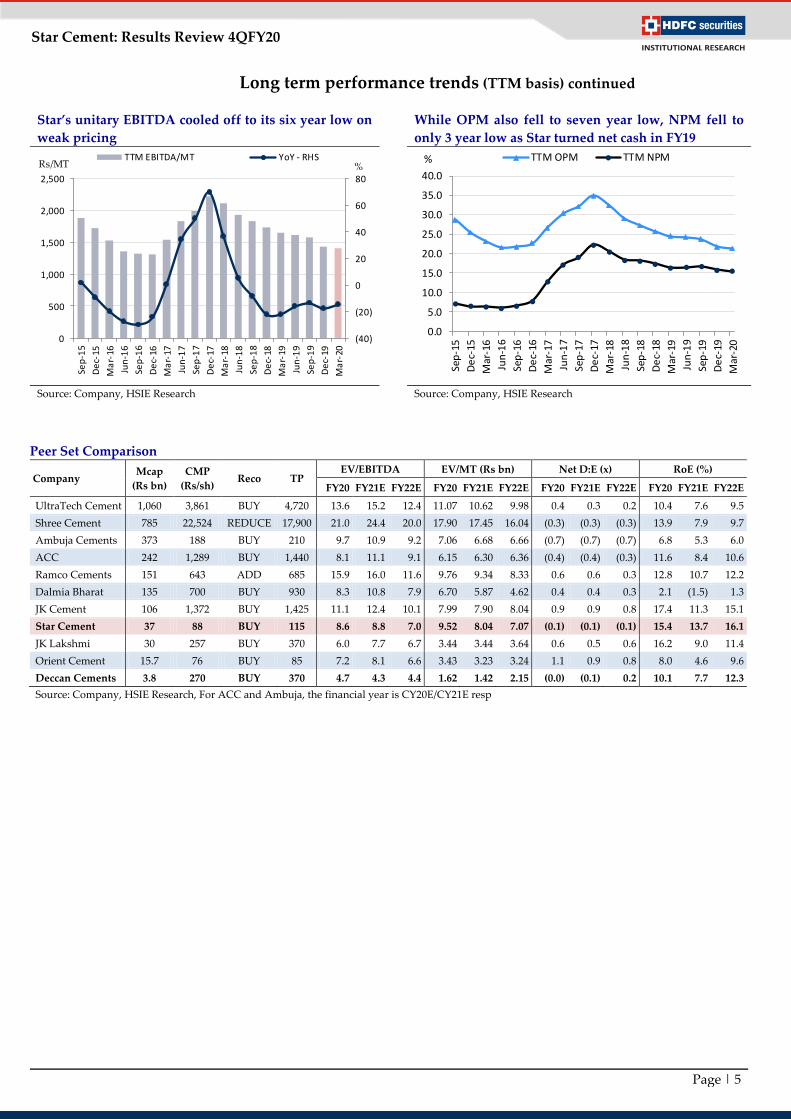
Long term performance trends (TTM basis) continued
Star’s unitary EBITDA cooled off to its six year low on
weak pricing
While OPM also fell to seven year low, NPM fell to
only 3 year low as Star turned net cash in FY19
Source: Company, HSIE Research Source: Company, HSIE Research
Peer Set Comparison
Company Mcap
(Rs bn)
CMP
(Rs/sh) Reco TP
EV/EBITDA EV/MT (Rs bn) Net D:E (x) RoE (%)
FY20 FY21E FY22E FY20 FY21E FY22E FY20 FY21E FY22E FY20 FY21E FY22E
UltraTech Cement 1,060 3,861 BUY 4,720 13.6 15.2 12.4 11.07 10.62 9.98 0.4 0.3 0.2 10.4 7.6 9.5
Shree Cement 785 22,524 REDUCE 17,900 21.0 24.4 20.0 17.90 17.45 16.04 (0.3) (0.3) (0.3) 13.9 7.9 9.7
Ambuja Cements 373 188 BUY 210 9.7 10.9 9.2 7.06 6.68 6.66 (0.7) (0.7) (0.7) 6.8 5.3 6.0
ACC 242 1,289 BUY 1,440 8.1 11.1 9.1 6.15 6.30 6.36 (0.4) (0.4) (0.3) 11.6 8.4 10.6
Ramco Cements 151 643 ADD 685 15.9 16.0 11.6 9.76 9.34 8.33 0.6 0.6 0.3 12.8 10.7 12.2
Dalmia Bharat 135 700 BUY 930 8.3 10.8 7.9 6.70 5.87 4.62 0.4 0.4 0.3 2.1 (1.5) 1.3
JK Cement 106 1,372 BUY 1,425 11.1 12.4 10.1 7.99 7.90 8.04 0.9 0.9 0.8 17.4 11.3 15.1
Star Cement 37 88 BUY 115 8.6 8.8 7.0 9.52 8.04 7.07 (0.1) (0.1) (0.1) 15.4 13.7 16.1
JK Lakshmi 30 257 BUY 370 6.0 7.7 6.7 3.44 3.44 3.64 0.6 0.5 0.6 16.2 9.0 11.4
Orient Cement 15.7 76 BUY 85 7.2 8.1 6.6 3.43 3.23 3.24 1.1 0.9 0.8 8.0 4.6 9.6
Deccan Cements 3.8 270 BUY 370 4.7 4.3 4.4 1.62 1.42 2.15 (0.0) (0.1) 0.2 10.1 7.7 12.3
Source: Company, HSIE Research, For ACC and Ambuja, the financial year is CY20E/CY21E resp
(40)
(20)
0
20
40
60
80
0
500
1,000
1,500
2,000
2,500
Sep
-15
De
c-15
Ma
r-16
Jun
-16
Sep
-16
De
c-16
Ma
r-17
Jun
-17
Sep
-17
De
c-17
Ma
r-18
Jun
-18
Sep
-18
De
c-18
Ma
r-19
Jun
-19
Sep
-19
De
c-19
Ma
r-20
TTM EBITDA/MT YoY - RHSRs/MT %
0.0
5.0
10.0
15.0
20.0
25.0
30.0
35.0
40.0
Sep
-15
De
c-15
Mar
-16
Jun
-16
Sep
-16
De
c-16
Mar
-17
Jun
-17
Sep
-17
De
c-17
Mar
-18
Jun
-18
Sep
-18
De
c-18
Mar
-19
Jun
-19
Sep
-19
De
c-19
Mar
-20
TTM OPM TTM NPM%
Page | 6
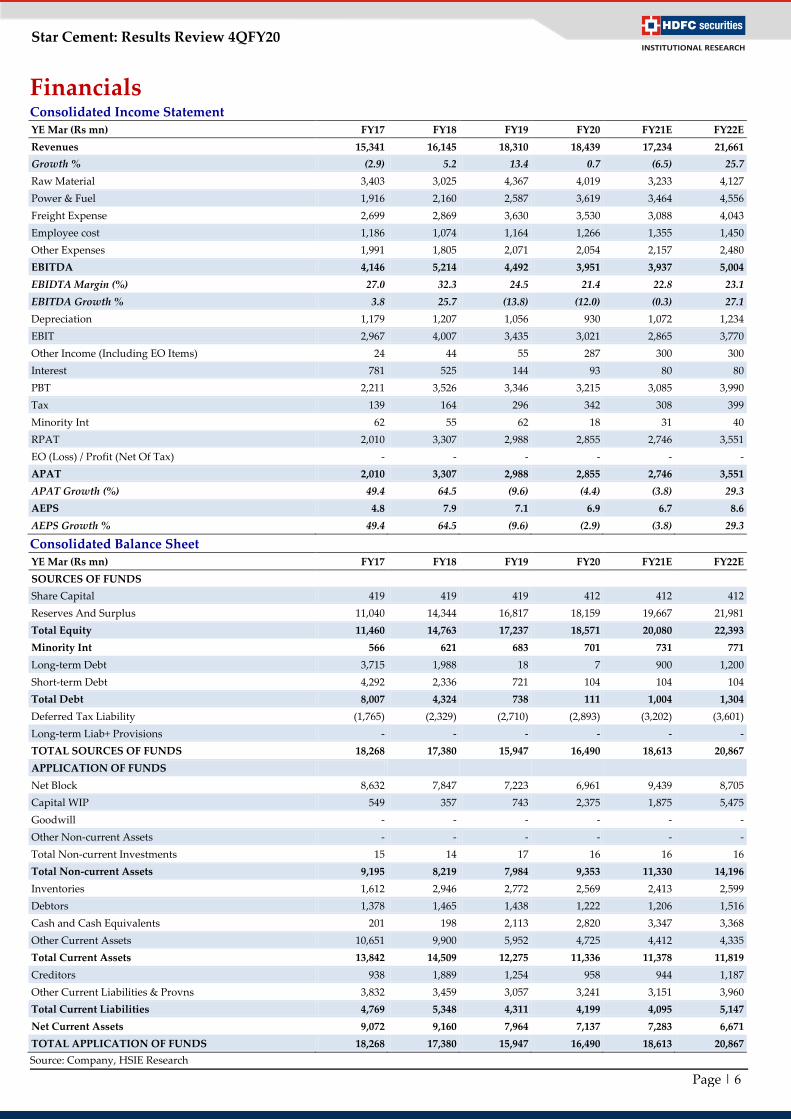
Star Cement: Results Review 4QFY20
Financials Consolidated Income Statement YE Mar (Rs mn) FY17 FY18 FY19 FY20 FY21E FY22E
Revenues 15,341 16,145 18,310 18,439 17,234 21,661
Growth % (2.9) 5.2 13.4 0.7 (6.5) 25.7
Raw Material 3,403 3,025 4,367 4,019 3,233 4,127
Power & Fuel 1,916 2,160 2,587 3,619 3,464 4,556
Freight Expense 2,699 2,869 3,630 3,530 3,088 4,043
Employee cost 1,186 1,074 1,164 1,266 1,355 1,450
Other Expenses 1,991 1,805 2,071 2,054 2,157 2,480
EBITDA 4,146 5,214 4,492 3,951 3,937 5,004
EBIDTA Margin (%) 27.0 32.3 24.5 21.4 22.8 23.1
EBITDA Growth % 3.8 25.7 (13.8) (12.0) (0.3) 27.1
Depreciation 1,179 1,207 1,056 930 1,072 1,234
EBIT 2,967 4,007 3,435 3,021 2,865 3,770
Other Income (Including EO Items) 24 44 55 287 300 300
Interest 781 525 144 93 80 80
PBT 2,211 3,526 3,346 3,215 3,085 3,990
Tax 139 164 296 342 308 399
Minority Int 62 55 62 18 31 40
RPAT 2,010 3,307 2,988 2,855 2,746 3,551
EO (Loss) / Profit (Net Of Tax) - - - - - -
APAT 2,010 3,307 2,988 2,855 2,746 3,551
APAT Growth (%) 49.4 64.5 (9.6) (4.4) (3.8) 29.3
AEPS 4.8 7.9 7.1 6.9 6.7 8.6
AEPS Growth % 49.4 64.5 (9.6) (2.9) (3.8) 29.3
Consolidated Balance Sheet
YE Mar (Rs mn) FY17 FY18 FY19 FY20 FY21E FY22E
SOURCES OF FUNDS
Share Capital 419 419 419 412 412 412
Reserves And Surplus 11,040 14,344 16,817 18,159 19,667 21,981
Total Equity 11,460 14,763 17,237 18,571 20,080 22,393
Minority Int 566 621 683 701 731 771
Long-term Debt 3,715 1,988 18 7 900 1,200
Short-term Debt 4,292 2,336 721 104 104 104
Total Debt 8,007 4,324 738 111 1,004 1,304
Deferred Tax Liability (1,765) (2,329) (2,710) (2,893) (3,202) (3,601)
Long-term Liab+ Provisions - - - - - -
TOTAL SOURCES OF FUNDS 18,268 17,380 15,947 16,490 18,613 20,867
APPLICATION OF FUNDS
Net Block 8,632 7,847 7,223 6,961 9,439 8,705
Capital WIP 549 357 743 2,375 1,875 5,475
Goodwill - - - - - -
Other Non-current Assets - - - - - -
Total Non-current Investments 15 14 17 16 16 16
Total Non-current Assets 9,195 8,219 7,984 9,353 11,330 14,196
Inventories 1,612 2,946 2,772 2,569 2,413 2,599
Debtors 1,378 1,465 1,438 1,222 1,206 1,516
Cash and Cash Equivalents 201 198 2,113 2,820 3,347 3,368
Other Current Assets 10,651 9,900 5,952 4,725 4,412 4,335
Total Current Assets 13,842 14,509 12,275 11,336 11,378 11,819
Creditors 938 1,889 1,254 958 944 1,187
Other Current Liabilities & Provns 3,832 3,459 3,057 3,241 3,151 3,960
Total Current Liabilities 4,769 5,348 4,311 4,199 4,095 5,147
Net Current Assets 9,072 9,160 7,964 7,137 7,283 6,671
TOTAL APPLICATION OF FUNDS 18,268 17,380 15,947 16,490 18,613 20,867
Source: Company, HSIE Research
Page | 7
Star Cement: Results Review 4QFY20
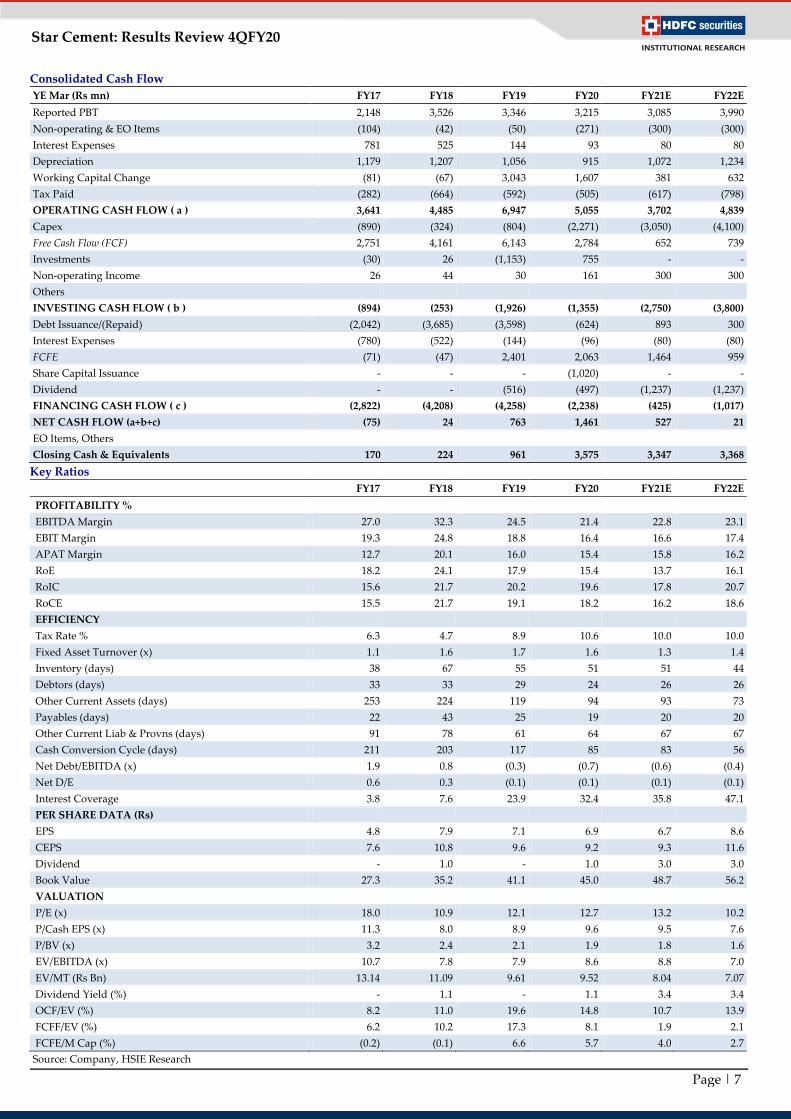
Consolidated Cash Flow
YE Mar (Rs mn) FY17 FY18 FY19 FY20 FY21E FY22E
Reported PBT 2,148 3,526 3,346 3,215 3,085 3,990
Non-operating & EO Items (104) (42) (50) (271) (300) (300)
Interest Expenses 781 525 144 93 80 80
Depreciation 1,179 1,207 1,056 915 1,072 1,234
Working Capital Change (81) (67) 3,043 1,607 381 632
Tax Paid (282) (664) (592) (505) (617) (798)
OPERATING CASH FLOW ( a ) 3,641 4,485 6,947 5,055 3,702 4,839
Capex (890) (324) (804) (2,271) (3,050) (4,100)
Free Cash Flow (FCF) 2,751 4,161 6,143 2,784 652 739
Investments (30) 26 (1,153) 755 - -
Non-operating Income 26 44 30 161 300 300
Others
INVESTING CASH FLOW ( b ) (894) (253) (1,926) (1,355) (2,750) (3,800)
Debt Issuance/(Repaid) (2,042) (3,685) (3,598) (624) 893 300
Interest Expenses (780) (522) (144) (96) (80) (80)
FCFE (71) (47) 2,401 2,063 1,464 959
Share Capital Issuance - - - (1,020) - -
Dividend - - (516) (497) (1,237) (1,237)
FINANCING CASH FLOW ( c ) (2,822) (4,208) (4,258) (2,238) (425) (1,017)
NET CASH FLOW (a+b+c) (75) 24 763 1,461 527 21
EO Items, Others
Closing Cash & Equivalents 170 224 961 3,575 3,347 3,368
Key Ratios
FY17 FY18 FY19 FY20 FY21E FY22E
PROFITABILITY %
EBITDA Margin 27.0 32.3 24.5 21.4 22.8 23.1
EBIT Margin 19.3 24.8 18.8 16.4 16.6 17.4
APAT Margin 12.7 20.1 16.0 15.4 15.8 16.2
RoE 18.2 24.1 17.9 15.4 13.7 16.1
RoIC 15.6 21.7 20.2 19.6 17.8 20.7
RoCE 15.5 21.7 19.1 18.2 16.2 18.6
EFFICIENCY
Tax Rate % 6.3 4.7 8.9 10.6 10.0 10.0
Fixed Asset Turnover (x) 1.1 1.6 1.7 1.6 1.3 1.4
Inventory (days) 38 67 55 51 51 44
Debtors (days) 33 33 29 24 26 26
Other Current Assets (days) 253 224 119 94 93 73
Payables (days) 22 43 25 19 20 20
Other Current Liab & Provns (days) 91 78 61 64 67 67
Cash Conversion Cycle (days) 211 203 117 85 83 56
Net Debt/EBITDA (x) 1.9 0.8 (0.3) (0.7) (0.6) (0.4)
Net D/E 0.6 0.3 (0.1) (0.1) (0.1) (0.1)
Interest Coverage 3.8 7.6 23.9 32.4 35.8 47.1
PER SHARE DATA (Rs)
EPS 4.8 7.9 7.1 6.9 6.7 8.6
CEPS 7.6 10.8 9.6 9.2 9.3 11.6
Dividend - 1.0 - 1.0 3.0 3.0
Book Value 27.3 35.2 41.1 45.0 48.7 56.2
VALUATION
P/E (x) 18.0 10.9 12.1 12.7 13.2 10.2
P/Cash EPS (x) 11.3 8.0 8.9 9.6 9.5 7.6
P/BV (x) 3.2 2.4 2.1 1.9 1.8 1.6
EV/EBITDA (x) 10.7 7.8 7.9 8.6 8.8 7.0
EV/MT (Rs Bn) 13.14 11.09 9.61 9.52 8.04 7.07
Dividend Yield (%) - 1.1 - 1.1 3.4 3.4
OCF/EV (%) 8.2 11.0 19.6 14.8 10.7 13.9
FCFF/EV (%) 6.2 10.2 17.3 8.1 1.9 2.1
FCFE/M Cap (%) (0.2) (0.1) 6.6 5.7 4.0 2.7
Source: Company, HSIE Research
Page | 8
Star Cement: Results Review 4QFY20
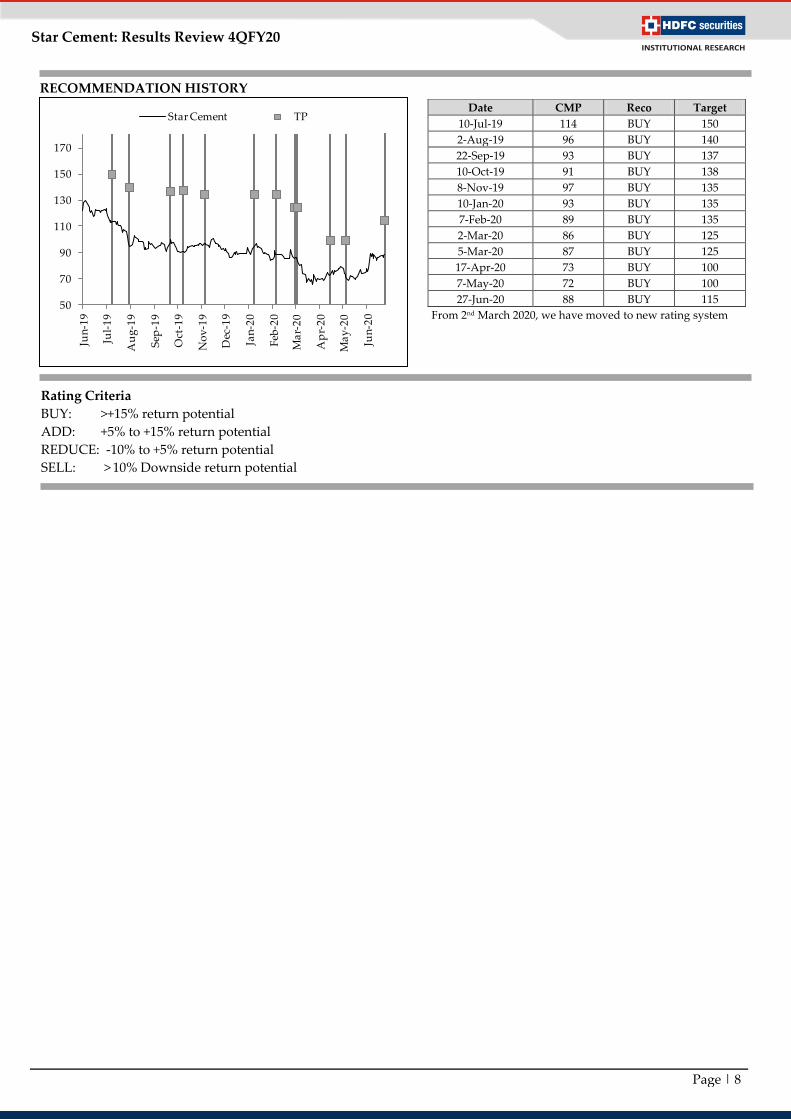
Rating Criteria
BUY: >+15% return potential
ADD: +5% to +15% return potential
REDUCE: -10% to +5% return potential
SELL: > 10% Downside return potential
Date CMP Reco Target
10-Jul-19 114 BUY 150
2-Aug-19 96 BUY 140
22-Sep-19 93 BUY 137
10-Oct-19 91 BUY 138
8-Nov-19 97 BUY 135
10-Jan-20 93 BUY 135
7-Feb-20 89 BUY 135
2-Mar-20 86 BUY 125
5-Mar-20 87 BUY 125
17-Apr-20 73 BUY 100
7-May-20 72 BUY 100
27-Jun-20 88 BUY 115
From 2nd March 2020, we have moved to new rating system
RECOMMENDATION HISTORY
50
70
90
110
130
150
170
Jun
-19
Jul-
19
Au
g-1
9
Sep
-19
Oct
-19
No
v-1
9
Dec
-19
Jan
-20
Feb
-20
Ma
r-2
0
Ap
r-2
0
Ma
y-2
0
Jun
-20
Star Cement TP
Page | 9
Star Cement: Results Review 4QFY20
Disclosure:
We, Rajesh Ravi, MBA & Saurabh Dugar, MBA, authors and the names subscribed to this report, hereby certify that all of the views expressed in this research
report accurately reflect our views about the subject issuer(s) or securities. HSL has no material adverse disciplinary history as on the date of publication of this
report. We also certify that no part of our compensation was, is, or will be directly or indirectly related to the specific recommendation(s) or view(s) in this
report.
Research Analyst or his/her relative or HDFC Securities Ltd. does not have any financial interest in the subject company. Also Research Analyst or his relative
or HDFC Securities Ltd. or its Associate may have beneficial ownership of 1% or more in the subject company at the end of the month immediately preceding
the date of publication of the Research Report. Further Research Analyst or his relative or HDFC Securities Ltd. or its associate does not have any material
conflict of interest.
Any holding in stock –No
HDFC Securities Limited (HSL) is a SEBI Registered Research Analyst having registration no. INH000002475.
Disclaimer:
This report has been prepared by HDFC Securities Ltd and is solely for information of the recipient only. The report must not be used as a singular basis of any
investment decision. The views herein are of a general nature and do not consider the risk appetite or the particular circumstances of an individual investor;
readers are requested to take professional advice before investing. Nothing in this document should be construed as investment advice. Each recipient of this
document should make such investigations as they deem necessary to arrive at an independent evaluation of an investment in securities of the companies
referred to in this document (including merits and risks) and should consult their own advisors to determine merits and risks of such investment. The
information and opinions contained herein have been compiled or arrived at, based upon information obtained in good faith from sources believed to be
reliable. Such information has not been independently verified and no guaranty, representation of warranty, express or implied, is made as to its accuracy,
completeness or correctness. All such information and opinions are subject to change without notice. Descriptions of any company or companies or their
securities mentioned herein are not intended to be complete. HSL is not obliged to update this report for such changes. HSL has the right to make changes and
modifications at any time.
This report is not directed to, or intended for display, downloading, printing, reproducing or for distribution to or use by, any person or entity who is a citizen
or resident or located in any locality, state, country or other jurisdiction where such distribution, publication, reproduction, availability or use would be
contrary to law or regulation or what would subject HSL or its affiliates to any registration or licensing requirement within such jurisdiction.
If this report is inadvertently sent or has reached any person in such country, especially, United States of America, the same should be ignored and brought to
the attention of the sender. This document may not be reproduced, distributed or published in whole or in part, directly or indirectly, for any purposes or in
any manner.
Foreign currencies denominated securities, wherever mentioned, are subject to exchange rate fluctuations, which could have an adverse effect on their value or
price, or the income derived from them. In addition, investors in securities such as ADRs, the values of which are influenced by foreign currencies effectively
assume currency risk. It should not be considered to be taken as an offer to sell or a solicitation to buy any security.
This document is not, and should not, be construed as an offer or solicitation of an offer, to buy or sell any securities or other financial instruments. This report
should not be construed as an invitation or solicitation to do business with HSL. HSL may from time to time solicit from, or perform broking, or other services
for, any company mentioned in this mail and/or its attachments.
HSL and its affiliated company(ies), their directors and employees may; (a) from time to time, have a long or short position in, and buy or sell the securities of
the company(ies) mentioned herein or (b) be engaged in any other transaction involving such securities and earn brokerage or other compensation or act as a
market maker in the financial instruments of the company(ies) discussed herein or act as an advisor or lender/borrower to such company(ies) or may have any
other potential conflict of interests with respect to any recommendation and other related information and opinions.
HSL, its directors, analysts or employees do not take any responsibility, financial or otherwise, of the losses or the damages sustained due to the investments
made or any action taken on basis of this report, including but not restricted to, fluctuation in the prices of shares and bonds, changes in the currency rates,
diminution in the NAVs, reduction in the dividend or income, etc.
HSL and other group companies, its directors, associates, employees may have various positions in any of the stocks, securities and financial instruments dealt
in the report, or may make sell or purchase or other deals in these securities from time to time or may deal in other securities of the companies / organizations
described in this report.
HSL or its associates might have managed or co-managed public offering of securities for the subject company or might have been mandated by the subject
company for any other assignment in the past twelve months.
HSL or its associates might have received any compensation from the companies mentioned in the report during the period preceding twelve months from the
date of this report for services in respect of managing or co-managing public offerings, corporate finance, investment banking or merchant banking, brokerage
services or other advisory service in a merger or specific transaction in the normal course of business.
HSL or its analysts did not receive any compensation or other benefits from the companies mentioned in the report or third party in connection with
preparation of the research report. Accordingly, neither HSL nor Research Analysts have any material conflict of interest at the time of publication of this
report. Compensation of our Research Analysts is not based on any specific merchant banking, investment banking or brokerage service transactions. HSL may
have issued other reports that are inconsistent with and reach different conclusion from the information presented in this report.
Research entity has not been engaged in market making activity for the subject company. Research analyst has not served as an officer, director or employee of
the subject company. We have not received any compensation/benefits from the subject company or third party in connection with the Research Report.
HDFC securities Limited, I Think Techno Campus, Building - B, "Alpha", Office Floor 8, Near Kanjurmarg Station, Opp. Crompton Greaves, Kanjurmarg
(East), Mumbai 400 042 Phone: (022) 3075 3400 Fax: (022) 2496 5066 Compliance Officer: Binkle R. Oza Email: [email protected] Phone: (022)
3045 3600
HDFC Securities Limited, SEBI Reg. No.: NSE, BSE, MSEI, MCX: INZ000186937; AMFI Reg. No. ARN: 13549; PFRDA Reg. No. POP: 11092018; IRDA
Corporate Agent License No.: CA0062; SEBI Research Analyst Reg. No.: INH000002475; SEBI Investment Adviser Reg. No.: INA000011538; CIN -
U67120MH2000PLC152193
HDFC securities
Institutional Equities
Unit No. 1602, 16th Floor, Tower A, Peninsula Business Park,
Senapati Bapat Marg, Lower Parel, Mumbai - 400 013
Board: +91-22-6171-7330 www.hdfcsec.com