Embed Size (px)
Citation preview

Paper 265-2012
Making Your SAS® Data JMP® Through Hoops Mira Shapiro, Analytic Designers LLC, Bethesda, MD
ABSTRACT
Longtime SAS users can benefit by adding JMP to their repertoire. JMP provides an easy-to-use and robust
environment for data exploration, graphics and analytics without the need for programming expertise. This paper
will provide an introduction to JMP 9 with an emphasis on features that SAS users will find useful.
During this presentation, users will learn how to read their SAS data, import Excel spreadsheets, transform their
data, explore distributions, create reports and create sophisticated graphics all in the JMP environment. Users will
be introduced to the tools within the JMP 9 environment that provide a pathway to quickly learn h ow to use the
product and some of its unique features.
INTRODUCTION
Anyone embarking on a data exploration and reporting project, even an experienced SAS user, can benefit from
adding JMP to their analytics toolkit. JMP’s graphical and drill -down approach makes data analysis an accessible
and enjoyable process.
This paper will show the step-by-step basics of how to use JMP, and how the graphical exploration process
facilitates data transformation, description, modeling, graphing and reporting. As this is a high level overview of
JMP, it only scratches the surface of the available functionality. The intention is to give novice users a place to start
and some insight into JMP’s menu system.
All examples in this paper use the JMP 9-provided sample data set entitled “Lipid Data”. Since all JMP 9 users will
have access to the data set via the JMP Help tab, the examples can be used as an introductory tutorial. All
examples in this paper are created using JMP 9 in a Windows environment.
GETTING STARTED
If you have a shortcut set up on your desktop, click on the icon and JMP will open. Alternatively you
may navigate through the StartAll Programs menu to access your JMP application.
DEFAULT JMP WELCOME SCREEN
When you open JMP for the first time you will see the JMP Home Window-JMP displayed with the Tip of the Day-
JMP window displayed in the foreground. The user may customize this view. However, the user may revert back to
the default settings by going to ViewCustomizeRevert to Factory Defaults.
Reporting and Information VisualizationSAS Global Forum 2012

Making Your SAS® Data JMP® Through Hoops, continued
2
If you are using JMP for the first time, it is extremely helpful to go through the beginner’s tutorial by clicking on the
Enter Beginner’s Tutorial button that is displayed at the bottom of the Tip of the Day-JMP window. There is an
option to Show Tips. It is recommended that beginning users leave that box checked. New users can learn a great
deal about JMP by scrolling through the tips. If you close the Tip of the Day-JMP window, you can reopen it by
going to the Menu Bar and going to HelpTip of the Day.
Start Tutorial Show tips
List of f iles that
the user recently
opened w ith JMP
Reporting and Information VisualizationSAS Global Forum 2012

Making Your SAS® Data JMP® Through Hoops, continued
3
Finding Your Way Around: JMP Starter and JMP Home Window
There are multiple ways to use JMP menus to access and explore JMP’s functionality. Those users who have a
general idea of what operations they would like to perform might choose the JMP Home Window. With a Menu Bar
with all of the JMP functionality organized behind eight tabs, the JMP user can quickly navigate to their desired
operation under each of the categories. In addition, icons below the standard categories will take the user directly
to their desired operation. Placing the cursor over the icon will reveal the icon’s meaning and use.
For those users who prefer a description of the operations available within JMP, the JMP Starter is recommended.
Shown below are the File and Model categories. The Category description at the top and the description of each of
the operations provide a great deal of information to assist the user in selecting the appropriate operation. The
menu bar and menu icons are still visible when using the JMP Starter.
menu bar and menu
icons
Category description
Reporting and Information VisualizationSAS Global Forum 2012

Making Your SAS® Data JMP® Through Hoops, continued
4
The JMP Starter, Model category gives clear descriptions of each of the operations. The Basic, Multivariate and
several of the other categories include a variety of modeling options.
For the examples in this paper we will be navigating to the operations through use of the JMP Home Window and
Menu Bar. All of the operations can also be accessed through the JMP Starter.
POPULATING YOUR JMP DATA TABLE
JMP provides the capability to open many types of data through the JMP Home WindowFileOpen. The file
types include JMP, Excel, SAS, CSV, text and many others.
Reporting and Information VisualizationSAS Global Forum 2012

Making Your SAS® Data JMP® Through Hoops, continued
5
You can connect your local or remote SAS Metadata Server through the JMP Home WindowSASServer
Connections. This functionality is also included in the Mac version of JMP and, with a properly configured network,
will allow Mac users to access the organization’s SAS Metadata Servers.
Reporting and Information VisualizationSAS Global Forum 2012
Making Your SAS® Data JMP® Through Hoops, continued
6
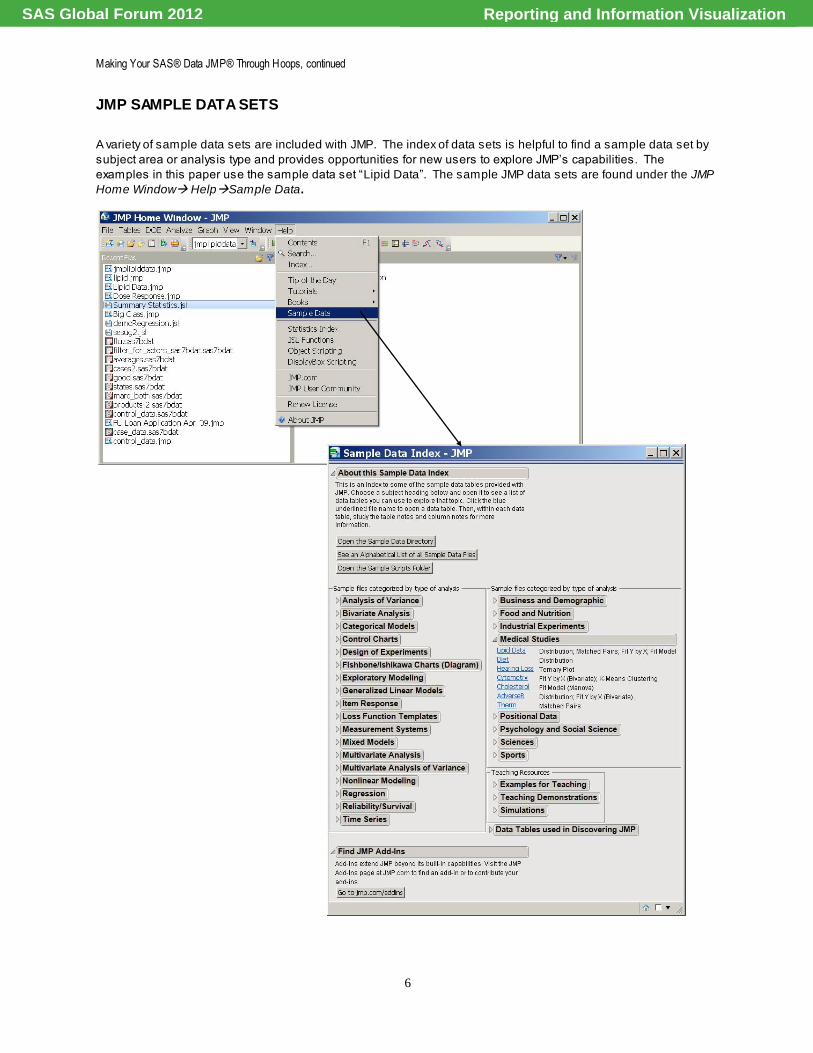
JMP SAMPLE DATA SETS
A variety of sample data sets are included with JMP. The index of data sets is helpful to find a sample data set by
subject area or analysis type and provides opportunities for new users to explore JMP’s capabilities. The
examples in this paper use the sample data set “Lipid Data”. The sample JMP data sets are found under the JMP
Home Window HelpSample Data.
Reporting and Information VisualizationSAS Global Forum 2012

Making Your SAS® Data JMP® Through Hoops, continued
7
MANIPULATING YOUR DATA: ADDING A NEW COLUMN
Inserting a new column or multiple columns to the data table can be accomplished through ColsNew Column...
or, in the case of multiple columns, ColsAdd Multiple Columns…
Reporting and Information VisualizationSAS Global Forum 2012

Making Your SAS® Data JMP® Through Hoops, continued
8
Clicking on Column Properties allows for selection of a formula, naming the column, and associating range
checks, labels and performing other operations and associating them with the newly created column. In this
example a new column called Smoking_Ever is created by applying a formula to the Smoking History column.
Smoking_Ever is coded as 0 if the value of Smoking History is no, and as 1 if Smoking History is either quit,
cigarettes or pipes.
Added Column Smoking_Ever
Reporting and Information VisualizationSAS Global Forum 2012

Making Your SAS® Data JMP® Through Hoops, continued
9
EXPLORING YOUR DATA: ANALYZE-->DISTRIBUTION
One of the first steps in any analysis is to explore the distributions for each variable. Once your JMP Data Table is
open, the menu bar provides multiple ways to explore your data. One way to quickly evaluate any of the variables in
the data table is to use the AnalyzeDistribution approach. In this example the variables Gender, Age, Heart
History and Smoking_Ever are dragged and dropped into the Y, Columns role. Note the icon in front of each
variable indicating the variable type. The variable type dictates which types of statistics are calculated for a
particular variable.
Reporting and Information VisualizationSAS Global Forum 2012

Making Your SAS® Data JMP® Through Hoops, continued
10
Clicking the OK button displays the results in a new window. There are several important features of the results
window to notice:
Dynamic Linking: In this example, the female section of the gender graph was selected and became shaded a
darker green. JMP then shaded the portions of the other graphs associated with females and highlighted the roles
for female participants as well. As other graphs and results are produced and displayed, specific areas will also
be highlighted in the same way.
Hot Spot: At the upper-left corner of many of the JMP frames, there is a red triangle called a hot spot. This
indicates that there are more options, operations or information associated with this area.
If the hot spot next to Distribution is clicked, options are presented to change the way in which the graphs are
scaled, to save an Adobe SWF file, and to select multiple options for saving and re-running the analysis. If the hot
spot is clicked for a particular variable’s results, options are displayed for adding additional statistics for the
variable, for adding details and for changing the associated histogram. In this example for Gender, the Vertical
option was unchecked, resulting in a horizontal histogram display; the color was changed from green to blue; and
Show Counts was checked to add counts to the histogram bars.
Reporting and Information VisualizationSAS Global Forum 2012

Making Your SAS® Data JMP® Through Hoops, continued
11
GRAPHING: GRAPH-->GRAPH BUILDER
JMP is designed around the concept of the visual display of information, so it is not surprising that there are
numerous ways to produce graphs and a multitude of options . Selecting Graph on the menu bar in the data table
window displays the list of possible graph types available. One way to quickly create a graph is through the Graph
Builder tool. When you select Graph Builder, a drag-and-drop window is displayed. Notice the Hot Spot next to
Graph Builder, indicating that there are additional options to explore for Graph Builder. In this example, in order to
build a graph, Age was dragged to the Y axis, Triglycerides and LDL were dragged to the X axis , and Gender was
dragged to the Group Y area; and then the Done button was clicked. There are many ways that graphs created by
Graph Builder can be changed and embellished, including changing the title created by JMP.
Reporting and Information VisualizationSAS Global Forum 2012

Making Your SAS® Data JMP® Through Hoops, continued
12
MODELING: A MULTITUDE OF CHOICES
Now that we have opened a JMP Data Table, created a new variable, explored variable distributions , and created a
graph, we are ready to explore creating models. In JMP there are multiple ways to create models, from the simple
to extremely complex. The goal in this section of the paper is not to evaluate the statistics or results created by the
modeling process, but to point out some of the JMP model building tools . Here we will take a closer look at
AnalyzeFit Y by X, AnalyzeFit Model, and AnalyzeModeling.
Reporting and Information VisualizationSAS Global Forum 2012

Making Your SAS® Data JMP® Through Hoops, continued
13
ANALYZEFIT Y BY X
The JMP application Fit Y by X produces a model relating a single response and a single factor. The type of
model is dictated by the type of variables chosen for each role. The table at the bottom of the Fit Y by X window
indicates which data type combinations yield a Bivariate, Oneway, Logistic, and Contingency analysis. In this
example we have chosen Height as the Y Response and Gender as the X Factor. As expected from looking at the
table, a continuous Y variable by a categorical X variable yields an Oneway analysis. Clicking on the red triangular
hot spot reveals the options available for this Oneway analysis. We have chosen to display the quantile plot and T-
test results, providing more information to access the relationship between Gender and Height.
Reporting and Information VisualizationSAS Global Forum 2012

Making Your SAS® Data JMP® Through Hoops, continued
14
ANALYZEFIT MODEL
The Fit Model portion of JMP allows for complex model building. Though exploring all of the options available in the
Fit Model portion of JMP is beyond the scope of this introductory paper, here are displays of some of the menus
and options available for creating models via this path. The Personality (model type) pull-down menu gives a
variety of model choices. When the variables are chosen and moved into the role panel , JMP selects the
Personality. Depending on the types of variables that are chosen, options to change this specification are
available. The Macros button provides the user with the ability to select a design for their model. By selecting the
red triangular hot spot, the user is provided with additional options , including creating a SAS job from the model
specifications.
Reporting and Information VisualizationSAS Global Forum 2012

Making Your SAS® Data JMP® Through Hoops, continued
15
Example: Nominal Logistic Regression
In order to use our new ly created variable Smoking_Ever as the Y-variable role in a Nominal Logistic Regression w e changed
the variable type to character. We chose for the Age and Gender as the Model Effects and then clicked the Run button.
The results of the Nominal Logistic Regression are then displayed:
Reporting and Information VisualizationSAS Global Forum 2012

Making Your SAS® Data JMP® Through Hoops, continued
16
AnalyzeModeling
The AnalyzeModeling path in JMP provides for the creation of Nonlinear, Time Series, Partition and a variety of
other model types. The Partition model tool is particularly valuable in that it provides the capability to create
decision trees. Once the model is created, the model can be exported and used in Base SAS.
Example: Partition (Decision Tree)
We cast HeartDisease as the Y-Response variable and Coffee, Age and, Gender as X –Factors in our model and click OK.
The f irst split is on Gender. Since Partition (Decision Tree Models) is a recursive process, you may split the tree again or perform
other functions such as “prune” to perfect your model, and the diagram and results w ill be updated in JMP.
Reporting and Information VisualizationSAS Global Forum 2012

Making Your SAS® Data JMP® Through Hoops, continued
17
Once you have perfected your model, you may export the model to SAS to use w ith your SAS Datasets. In order to export the
model, click on the red Hot Spot next to Partition for HeartDisease and move your cursor dow n to Save Columns. JMP w ill then
create the Data Step code that can then be implemented in SAS.
REPORTING IS EASY: USING YOUR OUTPUT IN REPORTS
Most often the results of an analysis need to be included in a document, on a server, or on the web. There are two
simple ways that JMP results and graphics can be inserted into documents.
Go to the output window of interest, and mouse over the blue line underneath the title to reveal the tool bar.
Reporting and Information VisualizationSAS Global Forum 2012

Making Your SAS® Data JMP® Through Hoops, continued
18
One available option is to go to FileSave As.., save the file in the format that is best for your target location, and
then insert the file into your final document.
Another approach is to copy the output and Paste Special into your target document. The easiest way to
accomplish this is to go to EditCopy, and the contents of the output window will be saved to the clipboard. Open
the document where you would like to place the output. In this example, we are inserting the output into this
Microsoft Word document. Select FilePaste Paste Special… and select the Picture (Enhanced Metafile). The
image will be placed in your document ready for resizing and placement.
Reporting and Information VisualizationSAS Global Forum 2012

Making Your SAS® Data JMP® Through Hoops, continued
19
The results from the Oneway analysis were added to this document using the Copy/Past Special approach. A
border was added to the results using the PictureFormatPicture Border option.
CONCLUSION
This paper provides a brief introduction and overview of JMP and its capabilities. The reader is provided with a
roadmap through some of the many JMP menu options , with the goal of shortening the learning curve. All of the
examples in the paper use the “Lipid Data” included as a sample data set with JMP 9, so that the reader can
recreate the examples and use the screenshots to navigate through the JMP menu structure.
JMP is a tool that will enhance any analytics professional’s ability to quickly explore, analyze and report on their
data with a point-and-click graphical approach requiring no programming effort. JMP’s scripting language (JSL)
and the ability to connect to SAS provide programming options for experienced users.
REFERENCES
Saving Graphs, Tables and Reports in JMP, JMP® Blog, Monday, February 22. 2010
http://blogs.sas.com/jmp/index.php?/archives/286-Saving-Graphs,-Tables-and-Reports-in-JMP.html
http://jmp.com/support/ and the JMP 9.02 Help Facility
Mastering JMP®: An Overview of Data Exploration and the JMP® Scripting Language, Course Notes, SAS Institute Inc.
Contact Information
Mira Shapiro
Analytic Designers LLC, Bethesda, MD
E-mail: [email protected]
SAS and all other SAS Institute Inc. product or service names are registered trademarks or trademarks of SAS Institute Inc. in the
USA and other countries. ® indicates USA registration.
Other brand and product names are trademarks of their respective companies.
Reporting and Information VisualizationSAS Global Forum 2012