Embed Size (px)
Citation preview

Junos® OS
Chassis Cluster User Guide for SRX SeriesDevices
Published
2022-03-15

Juniper Networks, Inc.1133 Innovation WaySunnyvale, California 94089USA408-745-2000www.juniper.net
Juniper Networks, the Juniper Networks logo, Juniper, and Junos are registered trademarks of Juniper Networks, Inc.in the United States and other countries. All other trademarks, service marks, registered marks, or registered servicemarks are the property of their respective owners.
Juniper Networks assumes no responsibility for any inaccuracies in this document. Juniper Networks reserves the rightto change, modify, transfer, or otherwise revise this publication without notice.
Junos® OS Chassis Cluster User Guide for SRX Series DevicesCopyright © 2022 Juniper Networks, Inc. All rights reserved.
The information in this document is current as of the date on the title page.
YEAR 2000 NOTICE
Juniper Networks hardware and software products are Year 2000 compliant. Junos OS has no known time-relatedlimitations through the year 2038. However, the NTP application is known to have some difficulty in the year 2036.
END USER LICENSE AGREEMENT
The Juniper Networks product that is the subject of this technical documentation consists of (or is intended for usewith) Juniper Networks software. Use of such software is subject to the terms and conditions of the End User LicenseAgreement ("EULA") posted at https://support.juniper.net/support/eula/. By downloading, installing or using suchsoftware, you agree to the terms and conditions of that EULA.
ii

Table of Contents
About This Guide | xix
1 Overview
Chassis Cluster Overview | 2
Chassis Cluster Overview | 2
Chassis Cluster Limitations | 5
Chassis Cluster Features Supported on SRX Series Devices | 8
2 Setting Up a Chassis Cluster
SRX Series Chassis Cluster Configuration Overview | 13
Understanding SRX Series Chassis Cluster Slot Numbering and Physical Port and LogicalInterface Naming | 18
Preparing Your Equipment for Chassis Cluster Formation | 31
Connecting SRX Series Devices to Create a Chassis Cluster | 35
Example: Setting the Node ID and Cluster ID for Security Devices in a Chassis Cluster | 43
Requirements | 44
Overview | 44
Configuration | 45
Verification | 46
Chassis Cluster Management Interfaces | 47
Understanding Management Interface on an Active Chassis Cluster | 47
Example: Configuring the Chassis Cluster Management Interface | 48
Requirements | 48
Overview | 48
Configuration | 49
Verification | 55
Chassis Cluster Fabric Interfaces | 56
iii

Understanding Chassis Cluster Fabric Interfaces | 57
Example: Configuring the Chassis Cluster Fabric Interfaces | 62
Requirements | 63
Overview | 63
Configuration | 63
Verification | 65
Verifying Chassis Cluster Data Plane Interfaces | 66
Viewing Chassis Cluster Data Plane Statistics | 66
Clearing Chassis Cluster Data Plane Statistics | 67
Chassis Cluster Control Plane Interfaces | 69
Chassis Cluster Control Plane and Control Links | 69
Example: Configure Chassis Cluster Control Ports for Control Link | 73
Requirements | 74
Overview | 74
Configuration | 74
Clear Chassis Cluster Control Plane Statistics | 78
SCB Chassis Cluster Control Links | 78
Change from Chassis Cluster to Standalone Mode | 80
Example: Configure Control Ports Using the SCB Control Link | 80
Requirements | 80
Overview | 80
Configuration | 81
Verification | 82
Transition from SPC to SCB with a Single Control Link | 84
Requirements | 84
Overview | 85
Configuration | 85
Transition from SCB to SPC with a Single Control Link | 88
Requirements | 89
Configuration | 89
iv

Chassis Cluster Redundancy Groups | 93
Understanding Chassis Cluster Redundancy Groups | 93
Example: Configuring Chassis Cluster Redundancy Groups | 97
Requirements | 98
Overview | 98
Configuration | 98
Verification | 100
Chassis Cluster Redundant Ethernet Interfaces | 101
Understanding Chassis Cluster Redundant Ethernet Interfaces | 102
Example: Configuring Chassis Cluster Redundant Ethernet Interfaces | 105
Requirements | 105
Overview | 105
Configuration | 106
Verification | 111
Example: Configuring Chassis Cluster Redundant Ethernet Interfaces on SRX4600 | 113
Requirements | 113
Overview | 113
Configuration | 113
Verification | 118
Configuring Chassis Clustering on SRX Series Devices | 121
Example: Configure Chassis Clustering on SRX Series Devices | 122
Requirements | 122
Overview | 123
Configuration | 125
Verification | 134
Viewing a Chassis Cluster Configuration | 139
Viewing Chassis Cluster Statistics | 140
Clearing Chassis Cluster Statistics | 142
Understanding Automatic Chassis Cluster Synchronization Between Primary and SecondaryNodes | 143
Verifying Chassis Cluster Configuration Synchronization Status | 144
v

Example: Enabling Eight-Queue Class of Service on Redundant Ethernet Interfaces onSRX Series Devices in a Chassis Cluster | 145
Requirements | 146
Overview | 146
Configuration | 148
Verification | 156
Conditional Route Advertisement over Redundant Ethernet Interfaces on SRX SeriesDevices in a Chassis Cluster | 157
Understanding Conditional Route Advertising in a Chassis Cluster | 157
Example: Configuring Conditional Route Advertising in a Chassis Cluster | 158
Requirements | 158
Overview | 158
Configuration | 160
3 Configuring Redundancy and Failover in a Chassis Cluster
Chassis Cluster Dual Control Links | 164
Chassis Cluster Dual Control Links Overview | 164
Dual Control Link Connections for SRX Series Devices in a Chassis Cluster | 166
Upgrade the Second Routing Engine When Using Chassis Cluster Dual Control Links onSRX5600 and SRX5800 Devices | 168
Example: Configure Chassis Cluster Control Ports for Dual Control Links | 170
Requirements | 170
Overview | 170
Configuration | 171
Verification | 172
Resiliency with SCB Dual Control Links | 173
Example: Configure a Chassis Cluster Using SCB Dual Control Links | 176
Requirements | 176
Overview | 176
Configuration | 178
Verification | 179
vi

Transition from SPC Dual Control Links to SCB Dual Control Links | 182
Requirements | 182
Overview | 183
Transition Procedure: SPC to SCB with Dual Control Links | 184
Transition from SCB to SPC with Dual Control Links | 188
Requirements | 189
Configuration | 189
Chassis Cluster Dual Fabric Links | 193
Understanding Chassis Cluster Dual Fabric Links | 193
Example: Configuring the Chassis Cluster Dual Fabric Links with Matching Slots and Ports | 194
Requirements | 194
Overview | 194
Configuration | 195
Verification | 197
Example: Configuring Chassis Cluster Dual Fabric Links with Different Slots and Ports | 198
Requirements | 198
Overview | 198
Configuration | 199
Verification | 200
Monitoring of Global-Level Objects in a Chassis Cluster | 201
Monitoring Chassis Cluster Interfaces | 206
Understanding Chassis Cluster Redundancy Group Interface Monitoring | 206
Example: Configuring Chassis Cluster Redundancy Group Interface Monitoring | 207
Requirements | 208
Overview | 208
Configuration | 209
Verification | 214
Monitoring IP Addresses on a Chassis Cluster | 247
IP Monitoring Overview | 248
Understanding Chassis Cluster Redundancy Group IP Address Monitoring | 251
Example: Configuring Chassis Cluster Redundancy Group IP Address Monitoring | 253
vii

Requirements | 253
Overview | 254
Configuration | 254
Verification | 257
Example: Configuring IP Monitoring on SRX5000 Line Devices for IOC2 and IOC3 | 258
Requirements | 258
Overview | 258
Configuration | 259
Verification | 266
Configuring Cluster Failover Parameters | 268
Understanding Chassis Cluster Control Link Heartbeats, Failure, and Recovery | 268
Example: Configuring Chassis Cluster Control Link Recovery | 271
Requirements | 271
Overview | 271
Configuration | 272
Understanding Chassis Cluster Resiliency | 273
Chassis Cluster Redundancy Group Failover | 274
Understanding Chassis Cluster Redundancy Group Failover | 275
Understanding Chassis Cluster Redundancy Group Manual Failover | 280
Initiating a Chassis Cluster Manual Redundancy Group Failover | 281
Example: Configuring a Chassis Cluster with a Dampening Time Between Back-to-BackRedundancy Group Failovers | 284
Requirements | 284
Overview | 284
Configuration | 284
Understanding SNMP Failover Traps for Chassis Cluster Redundancy Group Failover | 285
Verifying Chassis Cluster Failover Status | 286
Clearing Chassis Cluster Failover Status | 288
4 Chassis Cluster Operations
Aggregated Ethernet Interfaces in a Chassis Cluster | 290
viii

Understanding Link Aggregation Groups in a Chassis Cluster | 290
Example: Configuring Link Aggregation Groups in a Chassis Cluster | 292
Requirements | 293
Overview | 293
Configuration | 294
Verification | 296
Understanding Link Aggregation Group Failover in a Chassis Cluster | 297
Understanding LACP on Chassis Clusters | 299
Example: Configuring LACP on Chassis Clusters | 302
Requirements | 302
Overview | 303
Configuration | 303
Verification | 310
Example: Configuring Chassis Cluster Minimum Links | 313
Requirements | 313
Overview | 313
Configuration | 314
Verification | 314
Example: Configuring Chassis Cluster Redundant Ethernet Interface Link Aggregation Groups onan SRX5000 Line Device with IOC2 or IOC3 | 316
Requirements | 316
Overview | 316
Configuration | 317
Verification | 320
Understanding VRRP on SRX Series Devices | 321
VRRP failover-delay Overview | 325
Example: Configuring VRRP/VRRPv3 on Chassis Cluster Redundant Ethernet Interfaces | 327
Requirements | 328
Overview | 328
Configuration VRRP | 329
Verification | 337
ix

Example: Configuring VRRP for IPv6 | 340
Requirements | 340
Overview | 340
Configuring VRRP | 341
Verification | 348
NTP Time Synchronization on Chassis Cluster | 352
NTP Time Synchronization on SRX Series Devices | 353
Example: Simplifying Network Management by Synchronizing the Primary and Backup Nodeswith NTP | 353
Requirements | 354
Overview | 354
Configuration | 355
Verification | 357
Active/Passive Chassis Cluster Deployments | 360
Understanding Active/Passive Chassis Cluster Deployment | 361
Example: Configuring an Active/Passive Chassis Cluster on SRX5800 Devices | 362
Requirements | 362
Overview | 362
Configuration | 366
Verification | 373
Example: Configuring an Active/Passive Chassis Cluster Pair (SRX1500) | 381
Requirements | 381
Overview | 382
Configuration | 386
Verification | 392
Example: Configuring an Active/Passive Chassis Cluster Pair (J-Web) | 398
Understanding Active/Passive Chassis Cluster Deployment with an IPsec Tunnel | 401
Example: Configuring an Active/Passive Chassis Cluster Pair with an IPsec Tunnel | 402
Requirements | 402
Overview | 404
Configuration | 410
Verification | 419
x

Example: Configuring an Active/Passive Chassis Cluster Pair with an IPsec Tunnel (J-Web) | 425
Multicast Routing and Asymmetric Routing on Chassis Cluster | 428
Understanding Multicast Routing on a Chassis Cluster | 428
Understanding Asymmetric Routing on a Chassis Cluster | 430
Example: Configuring an Asymmetric Chassis Cluster Pair | 432
Requirements | 433
Overview | 434
Configuration | 437
Verification | 444
Ethernet Switching on Chassis Cluster | 449
Layer 2 Ethernet Switching Capability in a Chassis Cluster Mode | 450
Example: Configuring Switch Fabric Interfaces to Enable Switching in Chassis Cluster Mode on aSecurity Device | 451
Requirements | 451
Overview | 452
Configuration | 452
Example: Configure IRB and VLAN with Members Across Two Nodes on a Security Device usingTagged | 455
Requirements | 455
Overview | 455
Configuration | 456
Example: Configure IRB and VLAN with Members Across Two Nodes on a Security Device usingUntagged Traffic | 465
Requirements | 465
Overview | 465
Configuration | 466
Example: Configuring VLAN with Members Across Two Nodes on a Security Device | 475
Requirements | 475
Overview | 475
Configuration | 475
Verification | 478
Media Access Control Security (MACsec) on Chassis Cluster | 480
xi

Understanding Media Access Control Security (MACsec) | 481
Configuring Media Access Control Security (MACsec) | 484
Configuration Considerations When Configuring MACsec on Chassis Cluster Setup | 484
Configuring MACsec Using Static Connectivity Association Key Security Mode | 486
Configuring Static CAK on the Chassis Cluster Control Port | 491
Configuring Static CAK on the Chassis Cluster Fabric Port | 492
Configuring Static CAK on the Control Port of SRX4600 Device in Chassis Cluster | 493
Verifying MACSEC Configuration | 494
Understanding SCTP Behavior in Chassis Cluster | 500
Example: Encrypting Messages Between Two Nodes in a Chassis Cluster | 500
5 Upgrading or Disabling a Chassis Cluster
Upgrading Individual Devices in a Chassis Cluster Separately | 504
Upgrading Devices in a Chassis Cluster Using ICU | 504
Upgrading Both Devices in a Chassis Cluster Using ICU | 505
Upgrading ICU Using a Build Available Locally on a Primary Node in a Chassis Cluster | 506
Upgrading ICU Using a Build Available on an FTP Server | 507
Terminating an Upgrade in a Chassis Cluster During an ICU | 507
Upgrading a Chassis Cluster Using In-Service Software Upgrade | 509
Understanding ISSU for a Chassis Cluster | 509
ISSU System Requirements | 512
Upgrading Both Devices in a Chassis Cluster Using ISSU | 514
Rolling Back Devices in a Chassis Cluster After an ISSU | 516
Enabling an Automatic Chassis Cluster Node Failback After an ISSU | 516
Log Error Messages used for Troubleshooting ISSU-Related Problems | 517
Chassisd Process Errors | 517
Understanding Common Error Handling for ISSU | 518
ISSU Support-Related Errors | 522
Initial Validation Checks Failure | 522
Installation-Related Errors | 524
xii

Redundancy Group Failover Errors | 525
Kernel State Synchronization Errors | 526
Managing Chassis Cluster ISSU-Related Problems | 526
Viewing ISSU Progress | 527
Stopping ISSU Process if it Halts During an Upgrade | 528
Recovering the Node in Case of a Failed ISSU | 529
Disabling a Chassis Cluster | 531
6 Troubleshooting
Troubleshooting a Control Link Failure in an SRX Chassis Cluster | 534
Troubleshooting a Fabric Link Failure in an SRX Chassis Cluster | 536
Troubleshooting a Redundancy Group that Does Not Fail Over in an SRX ChassisCluster | 539
Troubleshooting an SRX Chassis Cluster with One Node in the Primary State and theOther Node in the Disabled State | 544
Troubleshooting an SRX Chassis Cluster with One Node in the Primary State and theOther Node in the Lost State | 548
Troubleshooting an SRX Chassis Cluster with One Node in the Hold State and the OtherNode in the Lost State | 551
Troubleshooting Chassis Cluster Management Issues | 555
Unable to Manage an SRX Series Chassis Cluster Using the Management Port or RevenuePorts | 555
Unable to Manage the Secondary Node of a Chassis Cluster Using J-Web | 567
Unable to Manage an SRX Series Chassis Cluster Using fxp0 When the Destination in theBackup Router is 0/0 | 569
Unable to Upgrade a Chassis Cluster Using In-Service Software Upgrade | 575
Configuring backup-router Command on Chassis Cluster | 577
Unable to Upgrade a Chassis Cluster Using In-Service Software Upgrade | 578
Data Collection for Customer Support | 580
7 Configuration Statements
xiii

aggregated-devices | 585
apply-groups (Chassis Cluster) | 587
arp-detect | 589
arp-throttle | 591
authentication-key | 593
authentication-type | 595
cak | 597
ckn | 599
cluster (Chassis) | 601
configuration-synchronize (Chassis Cluster) | 605
connectivity-association | 607
connectivity-association (MACsec Interfaces) | 609
control-link-recovery | 611
control-ports | 612
exclude-protocol | 614
fabric-options | 616
gigether-options (Chassis Cluster) | 619
global-threshold | 621
global-weight | 623
gratuitous-arp-count | 625
heartbeat-interval | 627
heartbeat-threshold | 629
hold-down-interval | 631
include-sci | 632
interface (Chassis Cluster) | 634
xiv

interfaces (MACsec) | 636
interface-monitor | 638
internal (Security IPsec) | 640
ip-monitoring | 642
key-server-priority (MACsec) | 645
lacp (Interfaces) | 647
link-protection (Chassis Cluster) | 649
macsec | 651
mka | 654
network-management | 655
no-encryption (MACsec) | 657
node (Chassis Cluster Redundancy Group) | 659
ntp | 661
ntp threshold | 669
offset | 671
preempt (Chassis Cluster) | 674
pre-shared-key | 676
priority (Protocols VRRP) | 678
redundancy-group (Chassis Cluster) | 680
redundant-ether-options | 683
redundant-parent (Interfaces) | 686
redundant-pseudo-interface-options | 688
replay-protect | 689
replay-window-size | 692
resource-watch | 694
xv

reth-count (Chassis Cluster) | 697
retry-count (Chassis Cluster) | 699
retry-interval (Chassis Cluster) | 701
route-active-on | 702
scb-control-ports | 704
security-mode | 706
traceoptions (Chassis Cluster) | 708
transmit-interval (MACsec) | 710
use-active-child-mac-on-reth | 713
use-actual-mac-on-physical-interfaces | 714
virtual-address | 715
vrrp-group | 717
weight | 721
8 Operational Commands
clear chassis cluster control-plane statistics | 726
clear chassis cluster data-plane statistics | 727
clear chassis cluster failover-count | 729
clear chassis cluster ip-monitoring failure-count | 731
clear chassis cluster ip-monitoring failure-count ip-address | 733
clear chassis cluster statistics | 735
request chassis cb | 736
request chassis cluster configuration-synchronize | 739
request chassis cluster failover node | 740
request chassis cluster failover redundancy-group | 742
request chassis cluster failover reset | 744
xvi

request chassis fpc | 746
request chassis fpc-control-port | 748
request chassis cluster in-service-upgrade abort (ISSU) | 751
request chassis primary-ha-control-port-transition | 753
request security internal-security-association refresh | 755
request system scripts add | 757
request system reboot (SRX Series) | 762
request system software in-service-upgrade (Maintenance) | 764
request system software rollback (SRX Series) | 770
set chassis cluster disable reboot | 771
set chassis cluster cluster-id node node-number reboot | 773
show chassis cluster control-plane statistics | 776
show chassis cluster data-plane interfaces | 779
show chassis cluster data-plane statistics | 781
show chassis cluster ethernet-switching interfaces | 785
show chassis cluster ethernet-switching status | 787
show chassis cluster information | 790
show chassis cluster information configuration-synchronization | 797
show chassis cluster information issu | 800
show chassis cluster interfaces | 802
show chassis cluster ip-monitoring status redundancy-group | 812
show chassis cluster statistics | 816
show chassis cluster status | 823
show chassis environment (Security) | 828
show chassis environment cb | 836
xvii

show chassis ethernet-switch | 840
show chassis fabric plane | 847
show chassis fabric plane-location | 856
show chassis fabric summary | 859
show chassis hardware (View) | 862
show chassis routing-engine (View) | 883
show chassis reswatch | 890
show chassis temperature-thresholds | 892
show configuration chassis cluster traceoptions | 895
show interfaces (SRX Series) | 897
set date ntp | 947
show system ntp threshold | 949
show security macsec connections | 951
show security macsec statistics (SRX Series Devices) | 954
show security mka statistics | 960
show security mka sessions (SRX Series Device | 963
show security internal-security-association | 966
show system license (View) | 968
show vrrp | 973
9Chassis Cluster Support on SRX100, SRX210, SRX220, SRX240, SRX650and SRX1400 Devices
Chassis Cluster Support on SRX100, SRX210, SRX220, SRX240, SRX650, and SRX1400Devices | 990
xviii

About This Guide
Use this guide to configure and operate the SRX Series devices in chassis cluster mode, where a pair ofdevices are connected and configured to operate as a single node, providing device, interface, andservice level redundancy.
xix

1CHAPTER
Overview
Chassis Cluster Overview | 2
Chassis Cluster Features Supported on SRX Series Devices | 8

Chassis Cluster Overview
IN THIS SECTION
Chassis Cluster Overview | 2
Chassis Cluster Limitations | 5
A chassis cluster provides high availability on SRX Series devices where two devices operate as a singledevice. Chassis cluster includes the synchronization of configuration files and the dynamic runtimesession states between the SRX Series devices, which are part of chassis cluster setup.
Chassis Cluster Overview
IN THIS SECTION
Benefits of Chassis Cluster | 3
Chassis Cluster Functionality | 3
Chassis Cluster Modes | 3
How Chassis Clustering Works? | 4
IPv6 Clustering Support | 4
The Junos OS provides high availability on SRX Series device by using chassis clustering. SRX SeriesServices Gateways can be configured to operate in cluster mode, where a pair of devices can beconnected together and configured to operate like a single node, providing device, interface, and servicelevel redundancy.
For SRX Series devices, which act as stateful firewalls, it is important to preserve the state of the trafficbetween two devices. In a chassis cluster setup, in the event of failure, session persistence is required sothat the established sessions are not dropped even if the failed device was forwarding traffic.
When configured as a chassis cluster, the two nodes back up each other, with one node acting as theprimary device and the other as the secondary device, ensuring stateful failover of processes and
2

services in the event of system or hardware failure. If the primary device fails, the secondary devicetakes over the processing of traffic. The cluster nodes are connected together with two links calledcontrol link and fabric link and devices in a chassis cluster synchronize the configuration, kernel, and PFEsession states across the cluster to facilitate high availability, failover of stateful services, and loadbalancing.
There is no seperate license required to enable chassis cluster. However, some Junos OS softwarefeatures require a license to activate the feature. For more information, see Understanding ChassisCluster Licensing Requirements, Installing Licenses on the SRX Series Devices in a Chassis Cluster andVerifying Licenses on an SRX Series Device in a Chassis Cluster. Please refer to the Juniper LicensingGuide for general information about License Management. Please refer to the product Data Sheets atSRX Series Services Gateways for details, or contact your Juniper Account Team or Juniper Partner.
Benefits of Chassis Cluster
• Prevents single device failure that results in a loss of connectivity.
• Provides high availability between devices when connecting branch and remote site links to largercorporate offices. By leveraging the chassis cluster feature, enterprises can ensure connectivity in theevent of device or link failure.
Chassis Cluster Functionality
Chassis cluster functionality includes:
• Resilient system architecture, with a single active control plane for the entire cluster and multiplePacket Forwarding Engines. This architecture presents a single device view of the cluster.
• Synchronization of configuration and dynamic runtime states between nodes within a cluster.
• Monitoring of physical interfaces, and failover if the failure parameters cross a configured threshold.
Chassis Cluster Modes
A chassis cluster can be configured in an active/active or active/passive mode.
• Active/passive mode: In active/passive mode, transit traffic passes through the primary node whilethe backup node is used only in the event of a failure. When a failure occurs, the backup devicebecomes primary and takes over all forwarding tasks.
• Active/active mode: In active/active mode, has transit traffic passing through both nodes of thecluster all of the time.
3

How Chassis Clustering Works?
The control ports on the respective nodes are connected to form a control plane that synchronizesconfiguration and kernel state to facilitate the high availability of interfaces and services.
The data plane on the respective nodes is connected over the fabric ports to form a unified data plane.
When creating a chassis cluster, the control ports on the respective nodes are connected to form acontrol plane that synchronizes the configuration and kernel state to facilitate the high availability ofinterfaces and services.
Similarly, the data plane on the respective nodes is connected over the fabric ports to form a unifieddata plane.
The fabric link allows for the management of cross-node flow processing and for the management ofsession redundancy.
The control plane software operates in active or backup mode. When configured as a chassis cluster, thetwo nodes back up each other, with one node acting as the primary device and the other as thesecondary device, ensuring stateful failover of processes and services in the event of system orhardware failure. If the primary device fails, the secondary device takes over processing of traffic.
The data plane software operates in active/active mode. In a chassis cluster, session information isupdated as traffic traverses either device, and this information is transmitted between the nodes overthe fabric link to guarantee that established sessions are not dropped when a failover occurs. In active/active mode, it is possible for traffic to ingress the cluster on one node and egress from the other node.When a device joins a cluster, it becomes a node of that cluster. With the exception of unique nodesettings and management IP addresses, nodes in a cluster share the same configuration.
At any given instant, a cluster can be in one of the following states: hold, primary, secondary-hold,secondary, ineligible, and disabled. A state transition can be triggered because of any event, such asinterface monitoring, SPU monitoring, failures, and manual failovers.
IPv6 Clustering Support
SRX Series devices running IP version 6 (IPv6) can be deployed in active/active (failover) chassis clusterconfigurations in addition to the existing support of active/passive (failover) chassis clusterconfigurations. An interface can be configured with an IPv4 address, IPv6 address, or both. Addressbook entries can include any combination of IPv4 addresses, IPv6 addresses, and Domain Name System(DNS) names.
Chassis cluster supports Generic Routing Encapsulation (GRE) tunnels used to route encapsulated IPv4/IPv6 traffic by means of an internal interface, gr-0/0/0. This interface is created by Junos OS at systembootup and is used only for processing GRE tunnels. See the Interfaces User Guide for Security Devices.
4

Chassis Cluster Limitations
The SRX Series devices have the following chassis cluster limitations:
Chassis Cluster
• Group VPN is not supported.
• On all SRX Series devices in a chassis cluster, flow monitoring for version 5 and version 8 issupported. However, flow monitoring for version 9 is not supported.
• When an SRX Series device is operating in chassis cluster mode and encounter any IA-chip accessissue in an SPC or a I/O Card (IOC), a minor FPC alarm is activated to trigger redundancy groupfailover.
• On SRX5400, SRX5600, and SRX5800 devices, screen statistics data can be gathered on the primarydevice only.
• On SRX4600, SRX5400, SRX5600, and SRX5800 devices, in large chassis cluster configurations, ifmore than 1000 logical interfaces are used, the cluster heartbeat timers are recommended to beincreased from the default wait time before triggering failover. In a full-capacity implementation, werecommend increasing the wait to 8 seconds by modifying heartbeat-threshold and heartbeat-intervalvalues in the [edit chassis cluster] hierarchy.
The product of the heartbeat-threshold and heartbeat-interval values defines the time before failover.The default values (heartbeat-threshold of 3 beats and heartbeat-interval of 1000 milliseconds) produce await time of 3 seconds.
To change the wait time, modify the option values so that the product equals the desired setting. Forexample, setting the heartbeat-threshold to 8 and maintaining the default value for the heartbeat-interval(1000 milliseconds) yields a wait time of 8 seconds. Likewise, setting the heartbeat-threshold to 4 andthe heartbeat-interval to 2000 milliseconds also yields a wait time of 8 seconds.
• On SRX5400, SRX5600, and SRX5800 devices, eight-queue configurations are not reflected on thechassis cluster interface.
Flow and Processing
• If you use packet capture on reth interfaces, two files are created, one for ingress packets and theother for egress packets based on the reth interface name. These files can be merged outside of thedevice using tools such as Wireshark or Mergecap.
• If you use port mirroring on reth interfaces, the reth interface cannot be configured as the outputinterface. You must use a physical interface as the output interface. If you configure the rethinterface as an output interface using the set forwarding-options port-mirroring family inet outputcommand, the following error message is displayed.
5

Port-mirroring configuration error.Interface type in reth1.0 is not valid for port-mirroring or next-hop-group config
• When an SRX Series device is operating in chassis cluster mode and encounter any IA-chip (IA-chip ispart of Juniper SPC1 and IOC1. It has direct impact on SPC1/IOC1 control plane) access issue in anSPC or a I/O Card (IOC), a minor FPC alarm is activated to trigger redundancy group failover.
• On SRX Series devices in a chassis cluster, when two logical systems are configured, the scaling limitcrosses 13,000, which is very close to the standard scaling limit of 15,000, and a convergence time of5 minutes results. This issue occurs because multicast route learning takes more time when thenumber of routes is increased.
• On SRX4600, SRX5400, SRX5600, and SRX5800 devices in a chassis cluster, if the primary noderunning the LACP process (lacpd) undergoes a graceful or ungraceful restart, the lacpd on the newprimary node might take a few seconds to start or reset interfaces and state machines to recoverunexpected synchronous results. Also, during failover, when the system is processing traffic packetsor internal high-priority packets (deleting sessions or reestablishing tasks), medium-priority LACPpackets from the peer (switch) are pushed off in the waiting queues, causing further delay.
Flowd monitoring is supported on SRX300, SRX320, SRX340, SRX345, SRX380, SRX550M, andSRX1500 devices.
Installation and Upgrade
• For SRX300, SRX320, SRX340, SRX345, SRX380, and SRX550M devices, the reboot parameter is notavailable, because the devices in a cluster are automatically rebooted following an in-band clusterupgrade (ICU).
Interfaces
• On the lsq-0/0/0 interface, Link services MLPPP, MLFR, and CRTP are not supported.
• On the lt-0/0/0 interface, CoS for RPM is not supported.
• The 3G dialer interface is not supported.
• Queuing on the ae interface is not supported.
Layer 2 Switching
• On SRX Series device failover, access points on the Layer 2 switch reboot and all wireless clients loseconnectivity for 4 to 6 minutes.
MIBs
• The Chassis Cluster MIB is not supported.
Monitoring
6

• The maximum number of monitoring IPs that can be configured per cluster is 64 for SRX300,SRX320, SRX340, SRX345, SRX380, SRX550M, and SRX1500 devices.
• On SRX300, SRX320, SRX340, SRX345, SRX380, SRX550M, and SRX1500 devices, logs cannot besent to NSM when logging is configured in the stream mode. Logs cannot be sent because thesecurity log does not support configuration of the source IP address for the fxp0 interface and thesecurity log destination in stream mode cannot be routed through the fxp0 interface. This impliesthat you cannot configure the security log server in the same subnet as the fxp0 interface and routethe log server through the fxp0 interface.
IPv6
• Redundancy group IP address monitoring is not supported for IPv6 destinations.
GPRS
• On SRX5400, SRX5600, and SRX5800 devices, an APN or an IMSI filter must be limited to 600 foreach GTP profile. The number of filters is directly proportional to the number of IMSI prefix entries.For example, if one APN is configured with two IMSI prefix entries, then the number of filters is two.
MIBs
• The Chassis Cluster MIB is not supported.
Nonstop Active Routing (NSR)
• NSR can preserve interface and kernel information and saves routing protocol information by runningthe routing protocol process (RPD) on the backup Routing Engine. However, most SRX platforms donot support NSR yet. So on the secondary node, there is no existing RPD daemon. After RG0 failoverhappens, the new RG0 master will have a new RPD and need to re-negotiate with peer device. OnlySRX5000 platforms with version 17.4R2 or higher can support NSR.
Starting with Junos OS Release 12.1X45-D10 and later, sampling features such as flow monitoring,packet capture, and port mirroring are supported on reth interfaces.
SEE ALSO
Preparing Your Equipment for Chassis Cluster Formation | 31
Release History Table
Release Description
12.1X45 Starting with Junos OS Release 12.1X45-D10 and later, sampling features such as flow monitoring,packet capture, and port mirroring are supported on reth interfaces.
7

RELATED DOCUMENTATION
SRX Series Chassis Cluster Configuration Overview | 13
Understanding SRX Series Chassis Cluster Slot Numbering and Physical Port and Logical InterfaceNaming | 18
Example: Configure Chassis Clustering on SRX Series Devices | 122
Chassis Cluster Features Supported on SRX SeriesDevices
IN THIS SECTION
Supported Features on Standalone and Chassis Cluster | 8
To determine if a feature is supported by a specific platform or Junos OS release, refer to FeatureExplorer.
Supported Features on Standalone and Chassis Cluster
All features are supported in both chassis cluster and standalone mode on the same platform, exceptwhat is indicated in the below table.
Table 1 on page 8 lists the features that are not supported in standalone or chassis cluster.
Table 1: Features Not Supported in Standalone or Chassis Cluster
Category Features Standalone Chassis cluster
Ethernet LinkAggregation
LACP (port priority) Layer 3Mode
LACP (port priority) Layer 2Mode
Yes
Not supported in Active/Backup andActive/Active modes.
8

Table 1: Features Not Supported in Standalone or Chassis Cluster (Continued)
Category Features Standalone Chassis cluster
Diagnostics Tools J-Flow
Ping MPLS
Yes Yes
Not supported in Active/Active andActive/Active Failover mode. Butstate is synched to backup node.
Ethernet Interfaces Promiscuous mode on Ethernetinterface
Yes
Chassis Management Chassis cluster SPC insert
IEEE 802.3af/ 802.3at support
Yes Yes
Not supported in Active/Backup,Active/Backup Failover, Active/Active, Active/Active Failover.
Class of Service Simple filters Yes
Table 1: Features Not Supported in Standalone or Chassis Cluster (Continued)
Flow-Based and Packet-Based Processing-
End-to-end packet debugging
Express Path support
Host bound fragmented traffic
Packet-based processing
Selective stateless packet-based services
Yes
GPRS GPRS (transparent mode and route mode) Yes
Multicast VPN Basic multicast features in C-instance
Multicast VPN membership discovery with BGP
P2MP LSP support
P2MP OAM to P2MP LSP ping
Reliable multicast VPN routing information exchange
Yes
9

GTPv2 IMSI prefix and APN filtering
Message-length filtering
Message-rate limiting
Message-type filtering
Packet sanity check
Policy-based inspection
Restart GTPv2 path
Sequence-number and GTP-U validation
Stateful inspection
Traffic logging
Tunnel cleanup
Yes
IDP Cryptographic key handling
DSCP marking
IDP class-of-service action
IDP inline tap mode
IDP SSL inspection
Jumbo frames
Performance and capacity tuning for IDP
Yes
Layer 2 Mode Q-in-Q tunneling Yes
SNMP v1,v2,v3 Yes
Stateless Firewall Filters Stateless firewall filters(ACLs) Yes
Transparent Mode Bridge domain Yes
10

UTM Antivirus–Express
Antivirus–Full
Stateful active/active cluster mode
Web filtering–Websense redirect
Yes
Not supported inActive/Backup Failoverand Active/ActiveFailover modes.
User Interfaces J-Web user interface
Junos XML protocol
Session and Resource Control (SRC) application
Yes
Upgrading and Rebooting ISSU No Yes
RELATED DOCUMENTATION
Chassis Cluster Overview | 2
11

2CHAPTER
Setting Up a Chassis Cluster
SRX Series Chassis Cluster Configuration Overview | 13
Understanding SRX Series Chassis Cluster Slot Numbering and Physical Port andLogical Interface Naming | 18
Preparing Your Equipment for Chassis Cluster Formation | 31
Connecting SRX Series Devices to Create a Chassis Cluster | 35
Example: Setting the Node ID and Cluster ID for Security Devices in a ChassisCluster | 43
Chassis Cluster Management Interfaces | 47
Chassis Cluster Fabric Interfaces | 56
Chassis Cluster Control Plane Interfaces | 69
Chassis Cluster Redundancy Groups | 93
Chassis Cluster Redundant Ethernet Interfaces | 101
Configuring Chassis Clustering on SRX Series Devices | 121
Example: Enabling Eight-Queue Class of Service on Redundant Ethernet Interfaceson SRX Series Devices in a Chassis Cluster | 145
Conditional Route Advertisement over Redundant Ethernet Interfaces on SRXSeries Devices in a Chassis Cluster | 157

SRX Series Chassis Cluster Configuration Overview
Following are the prerequisites for configuring a chassis cluster:
• On SRX300, SRX320, SRX340, SRX345, SRX380, and SRX550M any existing configurationsassociated with interfaces that transform to the fxp0 management port and the control port shouldbe removed. For more information, see "Understanding SRX Series Chassis Cluster Slot Numberingand Physical Port and Logical Interface Naming" on page 18.
• Confirm that hardware and software are the same on both devices.
• Confirm that license keys are the same on both devices.
• For SRX300, SRX320, SRX340, SRX345, SRX380, and SRX550M chassis clusters, the placement andtype of GPIMs, XGPIMs, XPIMs, and Mini-PIMs (as applicable) must match in the two devices.
• For SRX5000 line chassis clusters, the placement and type of SPCs must match in the two devices.
13

Figure 1 on page 14 shows a chassis cluster flow diagram for SRX300, SRX320, SRX340, SRX345,SRX380, SRX550M, SRX1500, and SRX4600 devices.
Figure 1: Chassis Cluster Flow Diagram (SRX300, SRX320, SRX340, SRX345, SRX380, SRX550M,SRX1500, and SRX4600 Devices)
14

Figure 2: Chassis Cluster Flow Diagram (SRX5800, SRX5600, SRX5400 Devices)
This section provides an overview of the basic steps to create an SRX Series chassis cluster. To create anSRX Series chassis cluster:
1. Prepare the SRX Series devices to be used in the chassis cluster. For more information, see"Preparing Your Equipment for Chassis Cluster Formation" on page 31.
15

2. Physically connect a pair of the same kind of supported SRX Series devices together. For moreinformation, see "Connecting SRX Series Devices to Create a Chassis Cluster" on page 35.
a. Create the fabric link between two nodes in a cluster by connecting any pair of Ethernetinterfaces. For most SRX Series devices, the only requirement is that both interfaces be GigabitEthernet interfaces (or 10-Gigabit Ethernet interfaces).
When using dual fabric link functionality, connect the two pairs of Ethernet interfaces that youwill use on each device. See "Understanding Chassis Cluster Dual Fabric Links" on page 193.
b. Configure the control ports (SRX5000 line only). See "Example: Configuring Chassis ClusterControl Ports" on page 73.
3. Connect the first device to be initialized in the cluster to the console port. This is the node (node 0)that forms the cluster and use CLI operational mode commands to enable clustering:
a. Identify the cluster by giving it the cluster ID.
b. Identify the node by giving it its own node ID and then reboot the system.
See "Example: Setting the Node ID and Cluster ID for Security Devices in a Chassis Cluster " on page43. For connection instructions, see the Getting Started Guide for your device
4. Connect to the console port on the other device (node 1) and use CLI operational mode commandsto enable clustering:
a. Identify the cluster that the device is joining by setting the same cluster ID you set on the firstnode.
b. Identify the node by giving it its own node ID and then reboot the system.
5. Configure the management interfaces on the cluster. See "Example: Configuring the Chassis ClusterManagement Interface" on page 48.
6. Configure the cluster with the CLI. See the following topics:
a. Example: Configuring the Number of Redundant Ethernet Interfaces in a Chassis Cluster
b. "Example: Configuring the Chassis Cluster Fabric Interfaces" on page 62
c. "Example: Configuring Chassis Cluster Redundancy Groups" on page 97
d. "Example: Configuring Chassis Cluster Interface Monitoring" on page 207
e. "Example: Configuring Chassis Clustering on an SRX Series Devices" on page 122
7. (Optional) Initiate manual failover. See "Initiating a Chassis Cluster Manual Redundancy GroupFailover" on page 281.
8. (Optional) Configure conditional route advertisement over redundant Ethernet interfaces. See"Understanding Conditional Route Advertising in a Chassis Cluster" on page 157.
9. Verify the configuration. See "Viewing a Chassis Cluster Configuration" on page 139.
16

If two nodes are connected in cluster, one node is elected as primary mode and its Routing Engine isrunning as primary. The Routing Engine in secondary node running as client. All FPCs in the cluster,regardless in primary node or secondary node, connect to the primary Routing Engine. The FPCs onsecondary node connect to primary Routing Engine through the HA control link. If the cluster has twoprimaries, IOC receives a message from a different primary and reboot itself to recover from this errorstate.
To prevent the IOC card from rebooting, secondary node has to be powered off before connecting intothe cluster.
To preserve the traffic on primary while connecting the secondary node into cluster, it is recommendedto configure cluster mode on node 1 and power down before connecting it to the cluster to avoid anyimpact to the primary. The reason here is that control networks are different for a HA cluster or a singlenode system. When the control ports are connected, these two join the same network and theyexchange messages.
This section provides an overview of the basic steps to restore the backup node after a failure whenthere is a running primary node:
1. Connect to the console port on the other device (node 1) and use CLI operational mode commandsto enable clustering:
a. Identify the cluster that the device is joining by setting the same cluster ID you set on the firstnode.
b. Identify the node by giving it its own node ID and then reboot the system.
See "Example: Setting the Node ID and Cluster ID for Security Devices in a Chassis Cluster " on page43. For connection instructions, see the Getting Started Guide for your device
2. Power off the secondary node.
3. Connect the HA control ports between two nodes.
4. Power on the secondary node.
5. The cluster is re-formed and the session is synced to the secondary node.
• When using dual fabric link functionality, connect the two pairs of Ethernet interfaces that you willuse on each device. See "Understanding Chassis Cluster Dual Fabric Links" on page 193.
• When using dual control link functionality (SRX5600 and SRX5800 devices only), connect the twopairs of control ports that you will use on each device.
See "Dual Control Link Connections for SRX Series Devices in a Chassis Cluster" on page 166.
For SRX5600 and SRX5800 devices, control ports must be on corresponding slots in the two devices.Table 2 on page 18 shows the slot numbering offsets:
17

Table 2: Slot Numbering Offsets
Device Offset
SRX5800 12 (for example, fpc3 and fpc15)
SRX5600 6 (for example, fpc3 and fpc9)
SRX5400 3 (for example, fpc3 and fpc6)
SRX4600 7 (for example, fpc1 and fpc8)
• On SRX3400 and SRX3600 devices, the control ports are dedicated Gigabit Ethernet ports.
• On SRX4600 devices, the control ports and fabric ports are dedicated 10-Gigabit Ethernet ports.
RELATED DOCUMENTATION
Chassis Cluster Overview | 2
Understanding SRX Series Chassis Cluster SlotNumbering and Physical Port and Logical InterfaceNaming
IN THIS SECTION
Chassis Cluster Slot Numbering and Physical Port and Logical Interface Naming for SRX300, SRX320,SRX340, SRX345, SRX380, SRX550M, and SRX1500 Devices | 19
Chassis Cluster Slot Numbering and Physical Port and Logical Interface Naming for SRX4600 Devices | 24
Chassis Cluster Slot Numbering and Physical Port and Logical Interface Naming for SRX4100 and SRX4200Devices | 26
18

Chassis Cluster Slot Numbering and Physical Port and Logical Interface Naming for SRX5800, SRX5600, andSRX5400 Devices | 28
FPC Slot Numbering in SRX Series Device Cards | 30
See the hardware documentation for your particular model (SRX Series Services Gateways) for detailsabout SRX Series devices. See Interfaces User Guide for Security Devices for a full discussion ofinterface naming conventions.
After the devices are connected as a cluster, the slot numbering on the SRX acting as node 1 changesand thus the interface numbering will change. The slot number for each slot in both nodes is determinedusing the following formula:
cluster slot number = (node ID * maximum slots per node) + local slot number
In chassis cluster mode, the interfaces on the SRX acting as node 1 are renumbered internally.
This topic describes the slot numbering and physical port and logical interface naming conventions forSRX Series devices in a chassis cluster and includes following sections:
Chassis Cluster Slot Numbering and Physical Port and Logical InterfaceNaming for SRX300, SRX320, SRX340, SRX345, SRX380, SRX550M, andSRX1500 Devices
For SRX340 and SRX345 devices, the fxp0 interface is a dedicated port. For SRX300 and SRX320devices, after you enable chassis clustering and reboot the system, the built-in interface namedge-0/0/0 is repurposed as the management interface and is automatically renamed fxp0.
For SRX300, SRX320, SRX340, SRX345, and SRX380 devices, after you enable chassis clustering andreboot the system, the build-in interface named ge-0/0/1 is repurposed as the control interface and isautomatically renamed fxp1.
For SRX550M devices, control interfaces are dedicated Gigabit Ethernet ports.
SRX1500 devices have 16 GE interfaces and 4 XE ports.
Table 3 on page 20 shows the slot numbering, as well as the physical port and logical interfacenumbering, for both of the SRX Series devices that become node 0 and node 1 of the chassis clusterafter the cluster is formed.
19

Table 3: Chassis Cluster Slot Numbering and Physical Port and Logical Interface Naming
Model Chassis MaximumSlots PerNode
SlotNumbering ina Cluster
ManagementPhysicalPort/LogicalInterface
ControlPhysicalPort/LogicalInterface
FabricPhysicalPort/LogicalInterface
SRX1500 Node 0 1 0 fxp0 DedicatedControl port
Any Ethernetport
em0 fab0
Node 1 7 fxp0 DedicatedControl port
Any Ethernetport
em0 fab1
SRX340,SRX345, andSRX380
Node 0 5 (PIM slots) 0—4 fxp0 ge-0/0/1 Any Ethernetport
fxp0 fxp1 fab0
Node 1 5—9 fxp0 ge-5/0/1 Any Ethernetport
fxp0 fxp1 fab1
SRX320 Node 0 3 (PIM slots) 0—2 ge-0/0/0 ge-0/0/1 Any Ethernetport
fxp0 fxp1 fab0
Node 1 3—5 ge-3/0/0 ge-3/0/1 Any Ethernetport
fxp0 fxp1 fab1
20
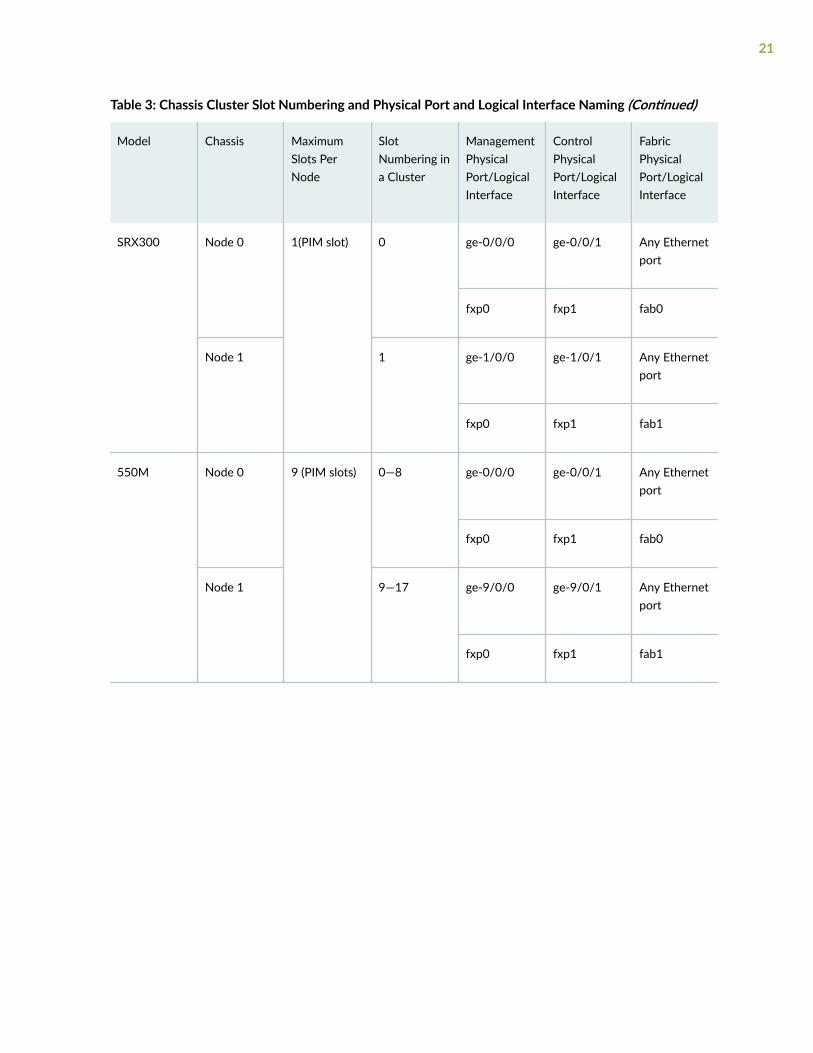
Table 3: Chassis Cluster Slot Numbering and Physical Port and Logical Interface Naming (Continued)
Model Chassis MaximumSlots PerNode
SlotNumbering ina Cluster
ManagementPhysicalPort/LogicalInterface
ControlPhysicalPort/LogicalInterface
FabricPhysicalPort/LogicalInterface
SRX300 Node 0 1(PIM slot) 0 ge-0/0/0 ge-0/0/1 Any Ethernetport
fxp0 fxp1 fab0
Node 1 1 ge-1/0/0 ge-1/0/1 Any Ethernetport
fxp0 fxp1 fab1
550M Node 0 9 (PIM slots) 0—8 ge-0/0/0 ge-0/0/1 Any Ethernetport
fxp0 fxp1 fab0
Node 1 9—17 ge-9/0/0 ge-9/0/1 Any Ethernetport
fxp0 fxp1 fab1
21

After you enable chassis clustering, the two chassis joined together cease to exist as individuals and nowrepresent a single system. As a single system, the cluster now has twice as many slots. (See Figure 3 onpage 22, Figure 4 on page 22, Figure 5 on page 22, Figure 6 on page 23, and Figure 9 on page 23.)
Figure 3: Slot Numbering in SRX300 Chassis Cluster
Figure 4: Slot Numbering in SRX320 Chassis Cluster
Figure 5: Slot Numbering in SRX340 Chassis Cluster
22

Figure 6: Slot Numbering in SRX345 Chassis Cluster
Figure 7: Slot Numbering in SRX380 Chassis Cluster
Figure 8: Slot Numbering for SRX550M Devices
Figure 9: Slot Numbering in SRX1500 Chassis Cluster
23

Chassis Cluster Slot Numbering and Physical Port and Logical InterfaceNaming for SRX4600 Devices
The SRX4600 devices use dedicated HA control and fabric ports.
Table 4 on page 24 and Table 5 on page 24 show the slot numbering, as well as the physical port andlogical interface numbering, for both of the SRX Series devices that become node 0 and node 1 of thechassis cluster after the cluster is formed.
Table 4: Chassis Cluster Slot Numbering, and Physical Port and Logical Interface Naming for SRX4600Devices
Model ChassisCluster
Maximum SlotsPerNode
SlotNumbering in aCluster
ManagementPhysical Port/Logical Interface
Control PhysicalPort/LogicalInterface
Fabric PhysicalPort/LogicalInterface
SRX4600
Node 0 1 0-6 fxp0 Dual (redundant)MACsec-enabledHA control ports(10GbE) arexe-0/0/0 andxe-0/0/1
It uses 1-GigabitEthernet SFP ascontrol port.
Dual (redundant)MACsec-enabledHA fabric ports(10GbE)
Dual Fabric portswith macsecenabled arexe-0/0/2 andxe-0/0/3
Node 1 7-13
Table 5: Chassis Cluster Interface Renumbering for SRX4600
Device Renumbering Constant Node 0 Interface Name Node 1 Interface Name
SRX4600 7 xe-1/0/0 xe-8/0/0
Table 6: Chassis Cluster Fabric Interface Details for SRX4600
Interfaces Used as FabricPort?
Supports Z-ModeTraffic?
Supports MACsec?
Dedicated fabric ports Yes Yes Yes
24

Table 6: Chassis Cluster Fabric Interface Details for SRX4600 (Continued)
Interfaces Used as FabricPort?
Supports Z-ModeTraffic?
Supports MACsec?
8X10-Gigabit Ethernet Interface SFPPports
No No No
4X40-Gigabit Ethernet Interface QSFP28ports
Yes Yes No
4x10-Gigabit Ethernet Interface SFPPports
No No No
2X100-Gigabit Ethernet Interface QSFP28slots
No No No
Mix and match of fabric ports are not supported. That is, you cannot use one 10-Gigabit Ethernetinterface and one 40-Gigabit Ethernet interface for fabric links configuration. Dedicated fabric linksupports only 10-Gigabit Ethernet Interface.
Figure 10 on page 25 shows the slot numbering for both of the SRX Series devices that become node 0and node 1 of the chassis cluster after the cluster is formed.
Figure 10: Slot Numbering in SRX4600 Chassis Cluster
25

Chassis Cluster Slot Numbering and Physical Port and Logical InterfaceNaming for SRX4100 and SRX4200 Devices
The SRX4100 and SRX4200 devices use two 1-Gigabit Ethernet/10-Gigabit Ethernet ports, labeled asCTL and FAB as control port and fabric port respectively.
Supported fabric interface types for SRX4100 and SRX4200 devices are 10-Gigabit Ethernet (xe) (10-Gigabit Ethernet Interface SFP+ slots).
Table 7 on page 26 shows the slot numbering, as well as the physical port and logical interfacenumbering, for both of the SRX Series devices that become node 0 and node 1 of the chassis clusterafter the cluster is formed
Table 7: Chassis Cluster Slot Numbering, and Physical Port and Logical Interface Naming for SRX4100and SRX4200 Devices
Model ChassisCluster
Maximum SlotsPerNode
SlotNumbering in aCluster
ManagementPhysical Port/Logical Interface
Control PhysicalPort/LogicalInterface
Fabric PhysicalPort/LogicalInterface
SRX4100
Node 0 1 0 fxp0 Dedicated controlport, em0
Dedicated fabricport, any Ethernetport (for dual fabric-link), fab0
Node 1 7 Dedicated fabricport, and anyEthernet port (fordual fabric-link),fab1
SRX4200
Node 0 1 0 fxp0 Dedicated controlport,em0
Dedicated fabricport, and anyEthernet port (fordual fabric-link),fab0
26

Table 7: Chassis Cluster Slot Numbering, and Physical Port and Logical Interface Naming for SRX4100and SRX4200 Devices (Continued)
Model ChassisCluster
Maximum SlotsPerNode
SlotNumbering in aCluster
ManagementPhysical Port/Logical Interface
Control PhysicalPort/LogicalInterface
Fabric PhysicalPort/LogicalInterface
Node 1 7 Dedicated fabricport, and anyEthernet port (fordual fabric-link),fab1
Figure 11 on page 27 and Figure 12 on page 27 shows the slot numbering for both of the SRX Seriesdevices that become node 0 and node 1 of the chassis cluster after the cluster is formed.
Figure 11: Slot Numbering in SRX4100 Chassis Cluster
Figure 12: Slot Numbering in SRX4200 Chassis Cluster
The node 1 renumbers its interfaces by adding the total number of system FPCs to the original FPCnumber of the interface. For example, see Table 8 on page 28 for interface renumbering on the SRXSeries devices (SRX4100 and SRX4200).
27

Table 8: Chassis Cluster Interface Renumbering for SRX4100 and SRX4200
Device Renumbering Constant Node 0 Interface Name Node 1 Interface Name
SRX4100 7 xe-0/0/0 xe-7/0/0
SRX4200 7 xe-0/0/1 xe-7/0/1
On SRX4100 and SRX4200 devices, when the system comes up as chassis cluster, the xe-0/0/8 andxe-7/0/8 interfaces are automatically set as fabric interfaces links. You can set up another pair of fabricinterfaces using any pair of 10-Gigabit interfaces to serve as the fabric between nodes. Note that, theautomatically created fabric interfaces cannot be deleted. However, you can delete the second pair offabric interfaces (manually configured interfaces).
Chassis Cluster Slot Numbering and Physical Port and Logical InterfaceNaming for SRX5800, SRX5600, and SRX5400 Devices
For chassis clustering, all SRX Series devices have a built-in management interface named fxp0. For mostSRX Series devices, the fxp0 interface is a dedicated port.
For the SRX5000 line, control interfaces are configured on SPCs.
Table 9 on page 28 shows the slot numbering, as well as the physical port and logical interfacenumbering, for both of the SRX Series devices that become node 0 and node 1 of the chassis clusterafter the cluster is formed.
Table 9: Chassis Cluster Slot Numbering, and Physical Port and Logical Interface Naming for SRX5000Line Devices
Model ChassisCluster
Maximum SlotsPerNode
SlotNumbering in aCluster
ManagementPhysical Port/Logical Interface
Control PhysicalPort/LogicalInterface
Fabric PhysicalPort/LogicalInterface
SRX5800
Node 0 12 (FPCslots)
0—11 Dedicated GigabitEthernet port
Control port on anSPC
Any Ethernet port
fxp0 em0 fab0
28

Table 9: Chassis Cluster Slot Numbering, and Physical Port and Logical Interface Naming for SRX5000Line Devices (Continued)
Model ChassisCluster
Maximum SlotsPerNode
SlotNumbering in aCluster
ManagementPhysical Port/Logical Interface
Control PhysicalPort/LogicalInterface
Fabric PhysicalPort/LogicalInterface
Node 1 12—23 Dedicated GigabitEthernet port
Control port on anSPC
Any Ethernet port
fxp0 em0 fab1
SRX5600
Node 0 6 (FPCslots)
0—5 Dedicated GigabitEthernet port
Control port on anSPC
Any Ethernet port
fxp0 em0 fab0
Node 1 6—11 Dedicated GigabitEthernet port
Control port on anSPC
Any Ethernet port
fxp0 em0 fab1
SRX5400
Node 0 3 (FPCslots)
0—2 Dedicated GigabitEthernet port
Control port on anSPC
Any Ethernet port
fxp0 em0 fab0
Node 1 3—5 Dedicated GigabitEthernet port
Control port on anSPC
Any Ethernet port
fxp0 em0 fab1
29

After you enable chassis clustering, the two chassis joined together cease to exist as individuals and nowrepresent a single system. As a single system, the cluster now has twice as many slots. (See Figure 13 onpage 30.)
Figure 13: Slot Numbering in SRX5800 Chassis Cluster
FPC Slot Numbering in SRX Series Device Cards
SRX5600 and SRX5800 devices have Flex I/O Cards (Flex IOCs) that have two slots to accept thefollowing port modules:
• SRX-IOC-4XGE-XFP 4-Port XFP
• SRX-IOC-16GE-TX 16-Port RJ-45
• SRX-IOC-16GE-SFP 16-Port SFP
You can use these port modules to add from 4 to 16 Ethernet ports to your SRX Series device. Portnumbering for these modules is
slot/port module/port
30

where slot is the number of the slot in the device in which the Flex IOC is installed; port module is 0 forthe upper slot in the Flex IOC or 1 for the lower slot when the card is vertical, as in an SRX5800 device;and port is the number of the port on the port module. When the card is horizontal, as in an SRX5400 orSRX5600 device, port module is 0 for the left-hand slot or 1 for the right-hand slot.
SRX5400 devices support only SRX5K-MPC cards. The SRX5K-MPC cards also have two slots to acceptthe following port modules:
• SRX-MIC-10XG-SFPP 10-port-SFP+ (xe)
• SRX-MIC-20GE-SFP 20-port SFP (ge)
• SRX-MIC-1X100G-CFP 1-port CFP (et)
• SRX-MIC-2X40G-QSFP 2-port QSFP (et)
See the hardware guide for your specific SRX Series model (SRX Series Services Gateways).
RELATED DOCUMENTATION
Example: Configure Chassis Clustering on SRX Series Devices | 122
Preparing Your Equipment for Chassis ClusterFormation
To form a chassis cluster, a pair of the same kind of supported SRX Series devices is combined to act as asingle system that enforces the same overall security. SRX Series devices must meet the followingrequirements to be included in a chassis clusters.
To form a chassis cluster, a pair of the same kind of supported SRX Series devices is combined to act as asingle system that enforces the same overall security.
• The network node redundancy is achieved by grouping a pair of the same kind of supported SRXSeries devices into a cluster.
• SRX Series devices must be the same model.
• Junos OS requirements: Both the devices must be running the same Junos OS version
• Licensing requirements: Licenses are unique to each device and cannot be shared between thedevices. Both devices (which are going to form chassis cluster) must have the identical features andlicense keys enabled or installed them. If both devices do not have an identical set of licenses, then
31

after a failover, that particular licensed feature might not work or the configuration might notsynchronize in chassis cluster formation.
• All services processing cards (SPCs), network processing cards (NPCs), and input/output cards (IOCs)on applicable SRX Series devices must have the same slot placement and must be of same type.Example:
• For SRX5400, SRX5600 and SRX5800 chassis clusters, the placement and the type of servicesprocessing cards (SPC, SPC2, SRX5K-SPC3), and input/output cards (IOC1, IOC2, IOC3, IOC4)must match in two devices. Only SCB4 is not supported on SRX5400. All other components aresupported on SRX5400.
• For SRX3400 and SRX3600 chassis clusters, the placement and the type of SPCs, input/outputcards (IOCs, NPIOCs), and network processing cards (NPCs) must match in two devices.
You can use the show chassis hardware command to identify the type of the card.
Following example shows the placement and the type of cards used in a chassis cluster setup:
user@host> show chassis hardwarenode0:--------------------------------------------------------------------------Hardware inventory:Item Version Part number Serial number DescriptionChassis JN1267B0FAGA SRX5800Midplane REV 42 760-063937 ACRL3065 Enhanced SRX5800 BackplaneFPM Board REV 05 760-061272 CAHE4860 Front Panel DisplayPDM Rev 01 740-063049 QCS2209509D Power Distribution ModulePEM 0 Rev 04 740-034724 QCS171002016 PS 4.1kW; 200-240V AC inPEM 1 Rev 11 740-027760 QCS1825N07S PS 4.1kW; 200-240V AC inRouting Engine 0 REV 01 750-095568 CALK8884 SRX5k RE-2000x6Routing Engine 1 REV 01 750-095568 CADZ9076 SRX5k RE-2000x6CB 0 REV 26 750-031391 CALV3002 SRX5k SCB4CB 1 REV 26 750-031391 CALV3009 SRX5k SCB4FPC 2 REV 28 750-073435 CALS4630 SPC3 CPU BUILTIN BUILTIN SRX5k vCPP Broadwell PIC 0 BUILTIN BUILTIN SPU Cp-Flow PIC 1 BUILTIN BUILTIN SPU FlowFPC 3 REV 17 750-044175 CABE7777 SRX5k SPC II CPU BUILTIN BUILTIN SRX5k DPC PPC PIC 0 BUILTIN BUILTIN SPU Flow PIC 1 BUILTIN BUILTIN SPU Flow PIC 2 BUILTIN BUILTIN SPU Flow PIC 3 BUILTIN BUILTIN SPU Flow
32
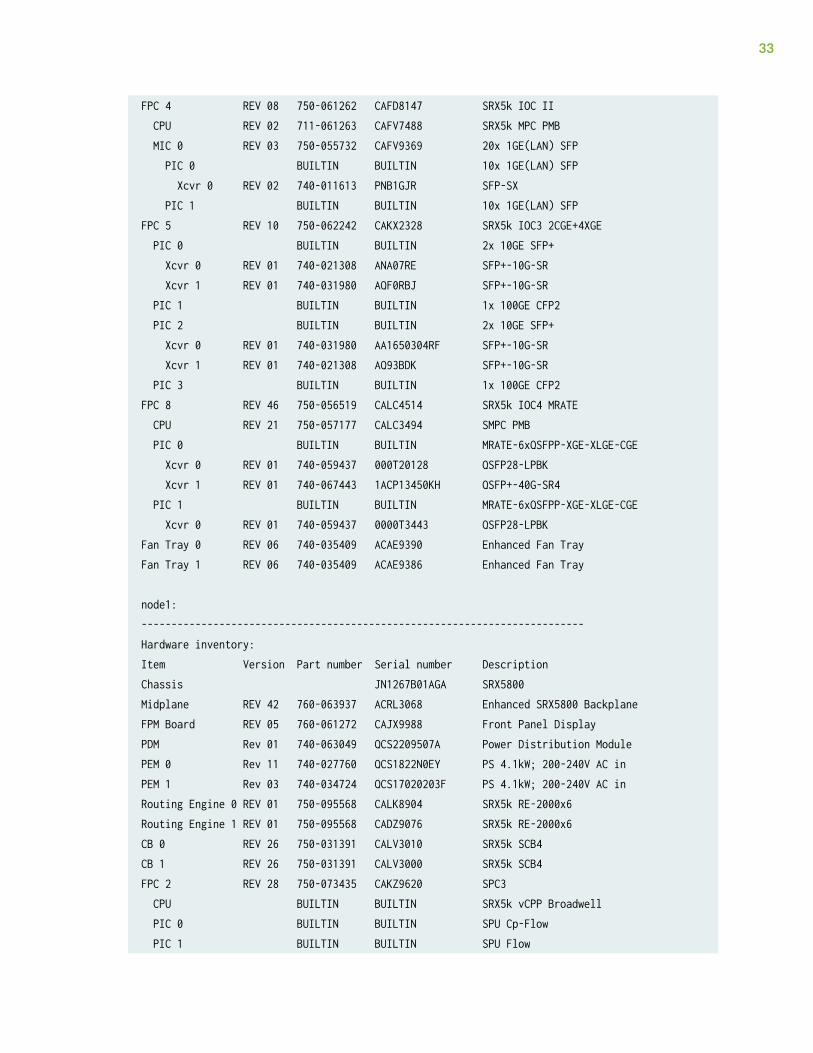
FPC 4 REV 08 750-061262 CAFD8147 SRX5k IOC II CPU REV 02 711-061263 CAFV7488 SRX5k MPC PMB MIC 0 REV 03 750-055732 CAFV9369 20x 1GE(LAN) SFP PIC 0 BUILTIN BUILTIN 10x 1GE(LAN) SFP Xcvr 0 REV 02 740-011613 PNB1GJR SFP-SX PIC 1 BUILTIN BUILTIN 10x 1GE(LAN) SFPFPC 5 REV 10 750-062242 CAKX2328 SRX5k IOC3 2CGE+4XGE PIC 0 BUILTIN BUILTIN 2x 10GE SFP+ Xcvr 0 REV 01 740-021308 ANA07RE SFP+-10G-SR Xcvr 1 REV 01 740-031980 AQF0RBJ SFP+-10G-SR PIC 1 BUILTIN BUILTIN 1x 100GE CFP2 PIC 2 BUILTIN BUILTIN 2x 10GE SFP+ Xcvr 0 REV 01 740-031980 AA1650304RF SFP+-10G-SR Xcvr 1 REV 01 740-021308 AQ93BDK SFP+-10G-SR PIC 3 BUILTIN BUILTIN 1x 100GE CFP2FPC 8 REV 46 750-056519 CALC4514 SRX5k IOC4 MRATE CPU REV 21 750-057177 CALC3494 SMPC PMB PIC 0 BUILTIN BUILTIN MRATE-6xQSFPP-XGE-XLGE-CGE Xcvr 0 REV 01 740-059437 000T20128 QSFP28-LPBK Xcvr 1 REV 01 740-067443 1ACP13450KH QSFP+-40G-SR4 PIC 1 BUILTIN BUILTIN MRATE-6xQSFPP-XGE-XLGE-CGE Xcvr 0 REV 01 740-059437 0000T3443 QSFP28-LPBKFan Tray 0 REV 06 740-035409 ACAE9390 Enhanced Fan TrayFan Tray 1 REV 06 740-035409 ACAE9386 Enhanced Fan Tray
node1:--------------------------------------------------------------------------Hardware inventory:Item Version Part number Serial number DescriptionChassis JN1267B01AGA SRX5800Midplane REV 42 760-063937 ACRL3068 Enhanced SRX5800 BackplaneFPM Board REV 05 760-061272 CAJX9988 Front Panel DisplayPDM Rev 01 740-063049 QCS2209507A Power Distribution ModulePEM 0 Rev 11 740-027760 QCS1822N0EY PS 4.1kW; 200-240V AC inPEM 1 Rev 03 740-034724 QCS17020203F PS 4.1kW; 200-240V AC inRouting Engine 0 REV 01 750-095568 CALK8904 SRX5k RE-2000x6Routing Engine 1 REV 01 750-095568 CADZ9076 SRX5k RE-2000x6CB 0 REV 26 750-031391 CALV3010 SRX5k SCB4CB 1 REV 26 750-031391 CALV3000 SRX5k SCB4FPC 2 REV 28 750-073435 CAKZ9620 SPC3 CPU BUILTIN BUILTIN SRX5k vCPP Broadwell PIC 0 BUILTIN BUILTIN SPU Cp-Flow PIC 1 BUILTIN BUILTIN SPU Flow
33

FPC 3 REV 18 750-054877 CACH4082 SRX5k SPC II CPU BUILTIN BUILTIN SRX5k DPC PPC PIC 0 BUILTIN BUILTIN SPU Flow PIC 1 BUILTIN BUILTIN SPU Flow PIC 2 BUILTIN BUILTIN SPU Flow PIC 3 BUILTIN BUILTIN SPU FlowFPC 4 REV 08 750-061262 CAFD8165 SRX5k IOC II CPU REV 02 711-061263 CAFV7507 SRX5k MPC PMB MIC 0 REV 03 750-055732 CAFV6603 20x 1GE(LAN) SFP PIC 0 BUILTIN BUILTIN 10x 1GE(LAN) SFP Xcvr 0 REV 01 740-011613 AM0805S8M4N SFP-SX PIC 1 BUILTIN BUILTIN 10x 1GE(LAN) SFPFPC 5 REV 03 750-062242 CAFZ2748 SRX5k IOC3 2CGE+4XGE PIC 0 BUILTIN BUILTIN 2x 10GE SFP+ Xcvr 0 REV 01 740-021308 11T511100788 SFP+-10G-SR Xcvr 1 REV 01 740-031980 AS92WJ0 SFP+-10G-SR PIC 1 BUILTIN BUILTIN 1x 100GE CFP2 PIC 2 BUILTIN BUILTIN 2x 10GE SFP+ Xcvr 0 REV 01 740-031980 AA1650304EZ SFP+-10G-SR Xcvr 1 REV 01 740-031980 ANS0EAR SFP+-10G-SR PIC 3 BUILTIN BUILTIN 1x 100GE CFP2FPC 8 REV 46 750-056519 CALC4526 SRX5k IOC4 MRATE CPU REV 21 750-057177 CALF5727 SMPC PMB PIC 0 BUILTIN BUILTIN MRATE-6xQSFPP-XGE-XLGE-CGE Xcvr 1 REV 01 740-067443 1ACP13450L9 QSFP+-40G-SR4 PIC 1 BUILTIN BUILTIN MRATE-6xQSFPP-XGE-XLGE-CGEFan Tray 0 REV 06 740-035409 ACAE9298 Enhanced Fan TrayFan Tray 1 REV 06 740-035409 ACAE9314 Enhanced Fan Tray
• SRX1500—Has dedicated slots for each kind of card that cannot be interchanged.
• SRX4600—Has dedicated slots for each kind of card that cannot be interchanged.
• SRX300, SRX320, SRX340, SRX345, SRX380, and SRX550M—Although the devices must be of thesame type, they can contain different Physical Interface Modules (PIMs).
• The control ports on the respective nodes are connected to form a control plane that synchronizesthe configuration and kernel state to facilitate the high availability of interfaces and services.
• The data plane on the respective nodes is connected over the fabric ports to form a unified dataplane. The fabric link allows for the management of cross-node flow processing and for themanagement of session redundancy.
34

RELATED DOCUMENTATION
Chassis Cluster Overview | 2
Understanding Chassis Cluster Fabric Interfaces | 57
Connecting SRX Series Devices to Create a ChassisCluster
An SRX Series chassis cluster is created by physically connecting two identical cluster-supported SRXSeries devices together using a pair of the same type of Ethernet connections. The connection is madefor both a control link and a fabric (data) link between the two devices.
Control links in a chassis cluster are made using specific ports.
The interface value changes with the cluster offset value. Based on the cluster index, the interface isnamed as type-fpc/pic/port. For example, ge-1/0/1 , where 1 is cluster index and the FPC number. Youmust use the following ports to form the control link on the following SRX Series devices:
• For SRX300 devices, connect the ge-0/0/1 on node 0 to the ge-1/0/1 on node 1.
• For SRX320 devices, connect the ge-0/0/1 on node 0 to the ge-3/0/1 on node 1.
• For SRX340, SRX345, and SRX380 devices, connect the ge-0/0/1 on node 0 to the ge-5/0/1 onnode 1.
• For SRX550M devices, connect the ge-0/0/1 on node 0 to the ge-9/0/1 on node 1.
• For SRX1500 devices, connect the HA control port on node 0 to the HA control port on node 1
To establish a fabric link:
• For SRX300 and SRX320 devices, connect any interface except ge-0/0/0 and ge-0/0/1.
• For SRX340 and SRX345 devices, connect any interface except fxp0 and ge-0/0/1.
35

Figure 14 on page 36, Figure 15 on page 36, Figure 16 on page 36, Figure 17 on page 37, Figure 19on page 37 and Figure 20 on page 37 show pairs of SRX Series devices with the fabric links andcontrol links connected.
Figure 14: Connecting SRX300 Devices in a Chassis Cluster
Figure 15: Connecting SRX320 Devices in a Chassis Cluster
Figure 16: Connecting SRX340 Devices in a Chassis Cluster
36

Figure 17: Connecting SRX345 Devices in a Chassis Cluster
Figure 18: Connecting SRX380 Devices in a Chassis Cluster
Figure 19: Connecting SRX550M Devices in a Chassis Cluster
Figure 20: Connecting SRX1500 Devices in a Chassis Cluster
37

For SRX1500 devices, the connection that serves as the control link must be between the built-incontrol ports on each device.
You can connect two control links (SRX4600, SRX5000 and SRX3000 lines only) and two fabric linksbetween the two devices in the cluster to reduce the chance of control link and fabric link failure. See"Understanding Chassis Cluster Dual Control Links" on page 164 and "Understanding Chassis ClusterDual Fabric Links" on page 193.
38

Figure 21 on page 39, Figure 22 on page 39 and Figure 23 on page 40 show pairs of SRX Seriesdevices with the fabric links and control links connected.
Figure 21: Connecting SRX4600 Devices in a Chassis Cluster
Figure 22: Connecting SRX4100 Devices in a Chassis Cluster
39

Figure 23: Connecting SRX4200 Devices in a Chassis Cluster
40

Figure 24 on page 41, Figure 25 on page 41, and Figure 26 on page 42 show pairs of SRX Seriesdevices with the fabric links and control links connected.
Figure 24: Connecting SRX5800 Devices in a Chassis Cluster
Figure 25: Connecting SRX5600 Devices in a Chassis Cluster
41

SRX5000 line devices do not have built-in ports, so the control link for these gateways must be thecontrol ports on their Services Processing Cards (SPCs) with a slot numbering offset of 3 for SRX5400,offset of 6 for SRX5600 devices and 12 for SRX5800 devices.
When you connect a single control link on SRX5000 line devices, the control link ports are a one-to-onemapping with the Routing Engine slot. If your Routing Engine is in slot 0, you must use control port 0 tolink the Routing Engines.
When a SPC is the control plane as well as hosting the control port, this creates a single point of failure.If the SPC goes down on the primary node, the node is automatically rebooted to avoid split brain.
Figure 26: Connecting SRX5400 Devices in a Chassis Cluster
Dual control links are not supported on an SRX5400 device due to the limited number of slots.
RELATED DOCUMENTATION
SRX Series Chassis Cluster Configuration Overview | 13
Example: Setting the Node ID and Cluster ID for Security Devices in a Chassis Cluster | 43
Example: Configuring the Chassis Cluster Management Interface | 48
Example: Configuring the Number of Redundant Ethernet Interfaces in a Chassis Cluster
42

Example: Setting the Node ID and Cluster ID forSecurity Devices in a Chassis Cluster
IN THIS SECTION
Requirements | 44
Overview | 44
Configuration | 45
Verification | 46
When a device joins a cluster, it becomes a node of that cluster. With the exception of unique nodesettings and management IP addresses, nodes in a cluster share the same configuration.
• A cluster is identified by a cluster ID (cluster-id) specified as a number from 1 through 255. Setting acluster ID to 0 is equivalent to disabling a cluster. A cluster ID greater than 15 can only be set whenthe fabric and control link interfaces are connected back-to-back or connected on separate VLANs.
To use extended cluster IDs without back-to-back connectivity, control and fabric link traffic for eachSRX cluster must be separated using unique VLAN IDs.
Example: Extended Cluster ID
The following message is displayed when you try to set a cluster ID greater than 15, and when fabricand control link interfaces are not connected back-to-back or are not connected on separate VLANs:
{primary:node1}user@host> set chassis cluster cluster-id 254 node 1 rebootFor cluster-ids greater than 15 and when deploying more than one cluster in a single Layer 2 BROADCAST domain, it is mandatory that fabric and control links are either connected back-to-back or are connected on separate private VLANS.
• A cluster node is identified by a node ID (node) specified as a number from 0 through 1.
This example shows how to set the chassis cluster node ID and chassis cluster ID , which you mustconfigure after connecting two devices together. A chassis cluster ID identifies the cluster to which thedevices belong, and a chassis cluster node ID identifies a unique node within the cluster. After wiring the
43

two devices together, you use CLI operational mode commands to enable chassis clustering by assigninga cluster ID and node ID on each chassis in the cluster. The cluster ID is the same on both nodes.
Requirements
Before you begin, ensure that you can connect to each device through the console port.
Ensure that the devices are running the same version of the Junos operating system (Junos OS) and thesecurity devices are of same model.
The factory-default configuration of an SRX Series device includes the configuration of the interfaces onthe device. Therefore, before enabling chassis clustering on the device, you must remove any existingconfiguration associated with those interfaces that will be transformed into the control and fabricinterfaces. See "Understanding SRX Series Chassis Cluster Slot Numbering and Physical Port and LogicalInterface Naming" on page 18 for more information.
Overview
The system uses the chassis cluster ID and chassis cluster node ID to apply the correct configuration foreach node (for example, when you use the apply-groups command to configure the chassis clustermanagement interface). The chassis cluster ID and node ID statements are written to the EPROM, andthe statements take effect when the system is rebooted.
In this example, you configure a chassis cluster ID of 1. You also configure a chassis cluster node ID of 0for the first node, which allows redundancy groups to be primary on this node when priority settings forboth nodes are the same, and a chassis cluster node ID of 1 for the other node.
Chassis cluster supports automatic synchronization of configurations. When a secondary node joins aprimary node and a chassis cluster is formed, the primary node configuration is automatically copied andapplied to the secondary node. See "Understanding Automatic Chassis Cluster Synchronization BetweenPrimary and Secondary Nodes" on page 143.
44

Configuration
IN THIS SECTION
Procedure | 45
Procedure
Step-by-Step Procedure
To specify the chassis cluster node ID and cluster ID, you need to set two devices to cluster mode andreboot the devices. You must enter the following operational mode commands on both devices:
1. Connect to the first device through the console port.
user@host> set chassis cluster cluster-id 1 node 0 rebootSuccessfully enabled chassis cluster. Going to reboot now.
2. Connect to the second device through the console port.
user@host> set chassis cluster cluster-id 1 node 1 rebootSuccessfully enabled chassis cluster. Going to reboot now.
For SRX5400, SRX5600 and SRX5800 devices, you must configure the control ports before thecluster is formed.
To do this, you connect to the console port on the primary device, give it a node ID, and identify thecluster it will belong to, and then reboot the system. You then connect the console port to the otherdevice, give it a node ID, and assign it the same cluster ID you gave to the first node, and then rebootthe system. In both instances, you can cause the system to boot automatically by including the rebootparameter in the CLI command line. (For further explanation of primary and secondary nodes, see"Understanding Chassis Cluster Redundancy Groups" on page 93.)
45

Verification
IN THIS SECTION
Verifying Chassis Cluster Status | 46
Verifying Chassis Cluster Status
Purpose
Verify the status of a chassis cluster.
Action
From operational mode, enter the show chassis cluster status command.
{primary:node0}[edit]user@host> show chassis cluster status Cluster ID: 1Node Priority Status Preempt Manual failover
Redundancy group: 0 , Failover count: 1 node0 100 primary no no node1 1 secondary no no
Redundancy group: 1 , Failover count: 1 node0 0 primary no no node1 0 secondary no no
Meaning
The sample output shows that devices in the chassis cluster are communicating properly, with onedevice functioning as the primary node and the other as the secondary node.
46

RELATED DOCUMENTATION
SRX Series Chassis Cluster Configuration Overview | 13
Example: Configuring the Chassis Cluster Management Interface | 48
Example: Configuring the Number of Redundant Ethernet Interfaces in a Chassis Cluster
Chassis Cluster Management Interfaces
IN THIS SECTION
Understanding Management Interface on an Active Chassis Cluster | 47
Example: Configuring the Chassis Cluster Management Interface | 48
On SRX Series devices in a chassis cluster, management interfaces allow out-of-band network accessand network management to each node in the cluster. For more information, see the following topics:
Understanding Management Interface on an Active Chassis Cluster
Most of SRX Series devices contain an fxp0 interface. The fxp0 interfaces function like standardmanagement interfaces on SRX Series devices and allow network access to each node in the cluster.
Management interfaces are the primary interfaces for accessing the device remotely. Typically, amanagement interface is not connected to the in-band network, but is connected instead to the device'sinternal network. Through a management interface you can access the device over the network usingutilities such as ssh and telnet and configure the device from anywhere, regardless of its physicallocation. SNMP can use the management interface to gather statistics from the device. A managementinterface enables authorized users and management systems connect to the device over the network.
Some SRX Series devices have a dedicated management port on the front panel. For other types ofplatforms, you can configure a management interface on one of the network interfaces. This interfacecan be dedicated to management or shared with other traffic. Before users can access the managementinterface, you must configure it. Information required to set up the management interface includes its IPaddress and prefix. In many types of Junos OS devices (or recommended configurations), it is notpossible to route traffic between the management interface and the other ports. Therefore, you mustselect an IP address in a separate (logical) network, with a separate prefix (netmask).
47
For most SRX Series chassis clusters, the fxp0 interface is a dedicated port. SRX340 and SRX345devices contain an fxp0 interface. SRX300 and SRX320 devices do not have a dedicated port for fxp0.The fxp0 interface is repurposed from a built-in interface. The fxp0 interface is created when the systemreboots the devices after you designate one node as the primary device and the other as the secondarydevice.
We recommend giving each node in a chassis cluster a unique IP address for the fxp0 interface of eachnode. This practice allows independent node management.
Example: Configuring the Chassis Cluster Management Interface
IN THIS SECTION
Requirements | 48
Overview | 48
Configuration | 49
Verification | 55
This example shows how to provide network management access to a chassis cluster.
Requirements
Before you begin, set the chassis cluster node ID and cluster ID. See "Example: Setting the ChassisCluster Node ID and Cluster ID" on page 43.
Overview
You must assign a unique IP address to each node in the cluster to provide network management access.This configuration is not replicated across the two nodes.
If you try to access the nodes in a cluster over the network before you configure the fxp0 interface, youwill lose access to the cluster.
In this example, you configure the following information for IPv4:
• Node 0 name—node0-router
• IP address assigned to node 0—10.1.1.1/24
• Node 1 name—node1-router
48

• IP address assigned to node 1—10.1.1.2/24
In this example, you configure the following information for IPv6:
• Node 0 name—node0-router
• IP address assigned to node 0—2001:db8:1::2/32
• Node 1 name—node1-router
• IP address assigned to node 1—2001:db8:1::3/32
Configuration
IN THIS SECTION
Configuring the Chassis Cluster Management Interface with IPv4 Addresses | 49
Verifying the Chassis Cluster Management Interface Configuration (IPv4 Addresses) | 51
Configuring the Chassis Cluster Management Interface with IPv6 Addresses | 53
Configuring the Chassis Cluster Management Interface with IPv4 Addresses
CLI Quick Configuration
To quickly configure this example, copy the following commands, paste them into a text file, remove anyline breaks, change any details necessary to match your network configuration, copy and paste thecommands into the CLI at the [edit] hierarchy level, and then enter commit from configuration mode.
To configure a chassis cluster management interface for IPv4:
{primary:node0}[edit]user@host# set groups node0 system host-name node0-routerset groups node0 interfaces fxp0 unit 0 family inet address 10.1.1.1/24set groups node1 system host-name node1-router set groups node1 interfaces fxp0 unit 0 family inet address 10.1.1.2/24set apply-groups “${node}”
49

Step-by-Step Procedure
To configure a chassis cluster management interface for IPv4:
1. Configure the name of node 0 and assign an IP address.
{primary:node0}[edit]user@host# set groups node0 system host-name node0-routeruser@host# set groups node0 interfaces fxp0 unit 0 family inet address 10.1.1.1/24
2. Configure the name of node 1 and assign an IP address.
{primary:node0}[edit]user@host# set groups node1 system host-name node1-router user@host# set groups node1 interfaces fxp0 unit 0 family inet address 10.1.1.2/24
3. Apply the groups configuration to the nodes.
{primary:node0}[edit]user@host# set apply-groups “${node}”
4. If you are done configuring the device, commit the configuration.
{primary:node0}[edit]user@host# commit
Results
From configuration mode, confirm your configuration by entering the show groups and show apply-groupscommands. If the output does not display the intended configuration, repeat the configurationinstructions in this example to correct it.
{primary:node0}[edit]user@host# show groupsnode0 { system { host-name node0-router; }
50

interfaces { fxp0 { unit 0 { family inet { address 10.1.1.1/24; } } } }}node1 { system { host-name node1-router; } interfaces { fxp0 { unit 0 { family inet { address 10.1.1.2/24; } } } }}
{primary:node0}[edit]user@host# show apply-groups## Last changed: 2010-09-16 11:08:29 UTCapply-groups "${node}";
If you are done configuring the device, enter commit from configuration mode.
Verifying the Chassis Cluster Management Interface Configuration (IPv4 Addresses)
Purpose
Verify the chassis cluster management interface configuration.
51

Action
To verify the configuration is working properly, enter the show interfaces terse, show configuration groupsnode node0 interfaces and show configuration groups node node1 interfaces commands.
{primary:node0} [edit]user@host> show interfaces terse | match fxp0
fxp0 up upfxp0.0 up up inet 10.1.1.1/24
{primary:node0} [edit]user@host> show configuration groups node0 interfaces
fxp0 { unit 0 { family inet { address 10.1.1.1/24; } }}
{primary:node0} [edit]user@host> show configuration groups node1 interfaces
fxp0 { unit 0 { family inet { address 10.1.1.2/24; } }}
Meaning
The output displays the management interface information with their status.
52

Configuring the Chassis Cluster Management Interface with IPv6 Addresses
CLI Quick Configuration
To quickly configure this example, copy the following commands, paste them into a text file, remove anyline breaks, change any details necessary to match your network configuration, copy and paste thecommands into the CLI at the [edit] hierarchy level, and then enter commit from configuration mode.
To configure a chassis cluster management interface for IPv6:
{primary:node0}[edit]user@host# set groups node0 system host-name node0-router set groups node0 interfaces fxp0 unit 0 family inet6 address 2001:db8:1::2/32set groups node1 system host-name node1-router set groups node1 interfaces fxp0 unit 0 family inet6 address 2001:db8:1::3/32
Step-by-Step Procedure
To configure a chassis cluster management interface for IPv6:
1. Configure the name of node 0 and assign an IP address.
{primary:node0}[edit]user@host# set groups node0 system host-name node0-routeruser@host# set groups node0 interfaces fxp0 unit 0 family inet6 address 2001:db8:1::2/32
2. Configure the name of node 1 and assign an IP address.
{primary:node0}[edit]user@host# set groups node1 system host-name node1-routeruser@host# set groups node1 interfaces fxp0 unit 0 family inet6 address 2001:db8:1::3/32
3. If you are done configuring the device, commit the configuration.
{primary:node0}[edit]user@host# commit
53

Results
From configuration mode, confirm your configuration by entering the show groups and show apply-groupscommands. If the output does not display the intended configuration, repeat the configurationinstructions in this example to correct it.
{primary:node0}[edit]user@host# show groupsnode0 { system { host-name node0-router; } interfaces { fxp0 { unit 0 { family inet6 { address 2001:db8:1::2/32; } } } }}node1 { system { host-name node1-router; } interfaces { fxp0 { unit 0 { family inet6 { address 2001:db8:1::3/32; } } } }}
{primary:node0}[edit]user@host# show apply-groups
54

## Last changed: 2010-09-16 11:08:29 UTCapply-groups "${node}";
If you are done configuring the device, enter commit from configuration mode.
Verification
IN THIS SECTION
Verifying the Chassis Cluster Management Interface Configuration (IPV6 Addresses) | 55
Verifying the Chassis Cluster Management Interface Configuration (IPV6 Addresses)
Purpose
Verify the chassis cluster management interface configuration.
Action
To verify the configuration is working properly, enter the show interfaces terse and show configuration groupsnode0 interfaces commands.
{primary:node0} [edit]user@host> show interfaces terse | match fxp0
fxp0 up upfxp0.0 up up inet 2001:db8:1::2/32
{primary:node0} [edit]user@host> show configuration groups node0 interfaces
fxp0 { unit 0 { family inet { address 2001:db8:1::2/32; }
55

}}
{primary:node0} [edit]user@host> show configuration groups node1 interfaces
fxp0 { unit 0 { family inet { address 2001:db8:1::3/32; } }}
Meaning
The output displays the management interface information with their status.
SEE ALSO
Example: Configure Chassis Clustering on SRX Series Devices | 122
RELATED DOCUMENTATION
Chassis Cluster Fabric Interfaces | 56
Chassis Cluster Control Plane Interfaces | 69
Chassis Cluster Fabric Interfaces
IN THIS SECTION
Understanding Chassis Cluster Fabric Interfaces | 57
Example: Configuring the Chassis Cluster Fabric Interfaces | 62
56

Verifying Chassis Cluster Data Plane Interfaces | 66
Viewing Chassis Cluster Data Plane Statistics | 66
Clearing Chassis Cluster Data Plane Statistics | 67
SRX Series devices in a chassis cluster use the fabric (fab) interface for session synchronization andforward traffic between the two chassis. The fabric link is a physical connection between two Ethernetinterfaces on the same LAN. Both interfaces must be the same media type. For more information, seethe following topics:
Understanding Chassis Cluster Fabric Interfaces
IN THIS SECTION
Supported Fabric Interface Types for SRX Series Devices (SRX300 Series, SRX550M, SRX1500,SRX4100/SRX4200, SRX4600, and SRX5000 Series) | 58
Jumbo Frame Support | 59
Understanding Fabric Interfaces on SRX5000 Line Devices for IOC2 and IOC3 | 59
Understanding Session RTOs | 60
Understanding Data Forwarding | 61
Understanding Fabric Data Link Failure and Recovery | 61
The fabric is a physical connection between two nodes of a cluster and is formed by connecting a pair ofEthernet interfaces back-to-back (one from each node).
Unlike for the control link, whose interfaces are determined by the system, you specify the physicalinterfaces to be used for the fabric data link in the configuration.
The fabric is the data link between the nodes and is used to forward traffic between the chassis. Trafficarriving on a node that needs to be processed on the other is forwarded over the fabric data link.Similarly, traffic processed on a node that needs to exit through an interface on the other node isforwarded over the fabric.
57
The data link is referred to as the fabric interface. It is used by the cluster's Packet Forwarding Enginesto transmit transit traffic and to synchronize the data plane software’s dynamic runtime state. The fabricprovides for synchronization of session state objects created by operations such as authentication,Network Address Translation (NAT), Application Layer Gateways (ALGs), and IP Security (IPsec) sessions.
When the system creates the fabric interface, the software assigns it an internally derived IP address tobe used for packet transmission.
CAUTION: After fabric interfaces have been configured on a chassis cluster, removingthe fabric configuration on either node will cause the redundancy group 0 (RG0)secondary node to move to a disabled state. (Resetting a device to the factory defaultconfiguration removes the fabric configuration and thereby causes the RG0 secondarynode to move to a disabled state.) After the fabric configuration is committed, do notreset either device to the factory default configuration.
Supported Fabric Interface Types for SRX Series Devices (SRX300 Series, SRX550M,SRX1500, SRX4100/SRX4200, SRX4600, and SRX5000 Series)
For SRX Series chassis clusters, the fabric link can be any pair of Ethernet interfaces spanning thecluster; the fabric link can be any pair of Gigabit Ethernet interface. Examples:
• For SRX300, SRX320, SRX340, SRX550M, and SRX345 devices, the fabric link can be any pair ofGigabit Ethernet interfaces. For SRX380 devices, the fabric link can be any pair of Gigabit Ethernetinterfaces or any pair of 10-Gigabit Ethernet interface.
• For SRX Series chassis clusters made up of SRX550M devices, SFP interfaces on Mini-PIMs cannotbe used as the fabric link.
• For SRX1500, the fabric link can be any pair of Ethernet interfaces spanning the cluster; the fabriclink can be any pair of Gigabit Ethernet interface or any pair of 10-Gigabit Ethernet interface.
• Supported fabric interface types for SRX4100 and SRX4200 devices are 10-Gigabit Ethernet (xe) (10-Gigabit Ethernet Interface SFP+ slots).
• Supported fabric interface types for SRX4600 devices are 40-Gigabit Ethernet (et) (40-GigabitEthernet Interface QSFP slots) and 10-Gigabit Ethernet (xe).
• Supported fabric interface types supported for SRX5000 line devices are:
• Fast Ethernet
• Gigabit Ethernet
• 10-Gigabit Ethernet
58

• 40-Gigabit Ethernet
• 100-Gigabit Ethernet
Starting in Junos OS Release 12.1X46-D10 and Junos OS Release 17.3R1, 100-Gigabit Ethernetinterface is supported on SRX5000 line devices.
Starting in Junos OS Release 19.3R1, the SRX5K-IOC4-10G and SRX5K-IOC4-MRAT aresupported along with SRX5K-SPC3 on the SRX5000 series devices. SRX5K-IOC4-10G MPICsupports MACsec.
For details about port and interface usage for management, control, and fabric links, see "UnderstandingSRX Series Chassis Cluster Slot Numbering and Physical Port and Logical Interface Naming" on page 18.
Jumbo Frame Support
The fabric data link does not support fragmentation. To accommodate this state, jumbo frame support isenabled by default on the link with an maximum transmission unit (MTU) size of 9014 bytes (9000 bytesof payload + 14 bytes for the Ethernet header) on SRX Series devices. To ensure the traffic that transitsthe data link does not exceed this size, we recommend that no other interfaces exceed the fabric datalink's MTU size.
Understanding Fabric Interfaces on SRX5000 Line Devices for IOC2 and IOC3
Starting with Junos OS Release 15.1X49-D10, the SRX5K-MPC3-100G10G (IOC3) and the SRX5K-MPC3-40G10G (IOC3) are introduced.
The SRX5K-MPC (IOC2) is a Modular Port Concentrator (MPC) that is supported on the SRX5400,SRX5600, and SRX5800. This interface card accepts Modular Interface Cards (MICs), which addEthernet ports to your services gateway to provide the physical connections to various network mediatypes. The MPCs and MICs support fabric links for chassis clusters. The SRX5K-MPC provides 10-Gigabit Ethernet (with 10x10GE MIC), 40-Gigabit Ethernet, 100-Gigabit Ethernet, and 20x1GE Ethernetports as fabric ports. On SRX5400 devices, only SRX5K-MPCs (IOC2) are supported.
The SRX5K-MPC3-100G10G (IOC3) and the SRX5K-MPC3-40G10G (IOC3) are Modular PortConcentrators (MPCs) that are supported on the SRX5400, SRX5600, and SRX5800. These interfacecards accept Modular Interface Cards (MICs), which add Ethernet ports to your services gateway toprovide the physical connections to various network media types. The MPCs and MICs support fabriclinks for chassis clusters.
The two types of IOC3 Modular Port Concentrators (MPCs), which have different built-in MICs, are the24x10GE + 6x40GE MPC and the 2x100GE + 4x10GE MPC.
Due to power and thermal constraints, all four PICs on the 24x10GE + 6x40GE cannot be powered on.A maximum of two PICs can be powered on at the same time.
59

Use the set chassis fpc <slot> pic <pic> power off command to choose the PICs you want to power on.
On SRX5400, SRX5600, and SRX5800 devices in a chassis cluster, when the PICs containing fabric linkson the SRX5K-MPC3-40G10G (IOC3) are powered off to turn on alternate PICs, always ensure that:
• The new fabric links are configured on the new PICs that are turned on. At least one fabric link mustbe present and online to ensure minimal RTO loss.
• The chassis cluster is in active-passive mode to ensure minimal RTO loss, once alternate links arebrought online.
• If no alternate fabric links are configured on the PICs that are turned on, RTO synchronouscommunication between the two nodes stops and the chassis cluster session state will not back up,because the fabric link is missing. You can view the CLI output for this scenario indicating a badchassis cluster state by using the show chassis cluster interfaces command.
Understanding Session RTOs
The data plane software, which operates in active/active mode, manages flow processing and sessionstate redundancy and processes transit traffic. All packets belonging to a particular session areprocessed on the same node to ensure that the same security treatment is applied to them. The systemidentifies the node on which a session is active and forwards its packets to that node for processing.(After a packet is processed, the Packet Forwarding Engine transmits the packet to the node on which itsegress interface exists if that node is not the local one.)
To provide for session (or flow) redundancy, the data plane software synchronizes its state by sendingspecial payload packets called runtime objects (RTOs) from one node to the other across the fabric datalink. By transmitting information about a session between the nodes, RTOs ensure the consistency andstability of sessions if a failover were to occur, and thus they enable the system to continue to processtraffic belonging to existing sessions. To ensure that session information is always synchronized betweenthe two nodes, the data plane software gives RTOs transmission priority over transit traffic.
The data plane software creates RTOs for UDP and TCP sessions and tracks state changes. It alsosynchronizes traffic for IPv4 pass-through protocols such as Generic Routing Encapsulation (GRE) andIPsec.
RTOs for synchronizing a session include:
• Session creation RTOs on the first packet
• Session deletion and age-out RTOs
• Change-related RTOs, including:
• TCP state changes
• Timeout synchronization request and response messages
60

• RTOs for creating and deleting temporary openings in the firewall (pinholes) and child sessionpinholes
Understanding Data Forwarding
For Junos OS, flow processing occurs on a single node on which the session for that flow wasestablished and is active. This approach ensures that the same security measures are applied to allpackets belonging to a session.
A chassis cluster can receive traffic on an interface on one node and send it out to an interface on theother node. (In active/active mode, the ingress interface for traffic might exist on one node and itsegress interface on the other.)
This traversal is required in the following situations:
• When packets are processed on one node, but need to be forwarded out an egress interface on theother node
• When packets arrive on an interface on one node, but must be processed on the other node
If the ingress and egress interfaces for a packet are on one node, but the packet must be processedon the other node because its session was established there, it must traverse the data link twice. Thiscan be the case for some complex media sessions, such as voice-over-IP (VoIP) sessions.
Understanding Fabric Data Link Failure and Recovery
Intrusion Detection and Prevention (IDP) services do not support failover. For this reason, IDP servicesare not applied for sessions that were present prior to the failover. IDP services are applied for newsessions created on the new primary node.
The fabric data link is vital to the chassis cluster. If the link is unavailable, traffic forwarding and RTOsynchronization are affected, which can result in loss of traffic and unpredictable system behavior.
To eliminate this possibility, Junos OS uses fabric monitoring to check whether the fabric link, or the twofabric links in the case of a dual fabric link configuration, are alive by periodically transmitting probesover the fabric links. If Junos OS detects fabric faults, RG1+ status of the secondary node changes toineligible. It determines that a fabric fault has occurred if a fabric probe is not received but the fabricinterface is active. To recover from this state, both the fabric links need to come back to online state andshould start exchanging probes. As soon as this happens, all the FPCs on the previously ineligible nodewill be reset. They then come to online state and rejoin the cluster.
If you make any changes to the configuration while the secondary node is disabled, execute the commitcommand to synchronize the configuration after you reboot the node. If you did not make configurationchanges, the configuration file remains synchronized with that of the primary node.
61

Starting with Junos OS Release 12.1X47-D10 and Junos OS Release 17.3R1, the fabric monitoringfeature is enabled by default on SRX5800, SRX5600, and SRX5400 devices.
Starting with Junos OS Release 12.1X47-D10 and Junos OS Release 17.3R1, recovery of the fabric linkand synchronization take place automatically.
When both the primary and secondary nodes are healthy (that is, there are no failures) and the fabriclink goes down, RG1+ redundancy group(s) on the secondary node becomes ineligible. When one of thenodes is unhealthy (that is, there is a failure), RG1+ redundancy group(s) on this node (either the primaryor secondary node) becomes ineligible. When both nodes are unhealthy and the fabric link goes down,RG1+ redundancy group(s) on the secondary node becomes ineligible. When the fabric link comes up,the node on which RG1+ became ineligible performs a cold synchronization on all Services ProcessingUnits and transitions to active standby.
• If RG0 is primary on an unhealthy node, then RG0 will fail over from an unhealthy to a healthy node.For example, if node 0 is primary for RG0+ and node 0 becomes unhealthy, then RG1+ on node 0 willtransition to ineligible after 66 seconds of a fabric link failure and RG0+ fails over to node 1, which isthe healthy node.
• Only RG1+ transitions to an ineligible state. RG0 continues to be in either a primary or secondarystate.
Use the show chassis cluster interfaces CLI command to verify the status of the fabric link.
SEE ALSO
Understanding SRX Series Chassis Cluster Slot Numbering and Physical Port and Logical InterfaceNaming | 18
Understanding Chassis Cluster Dual Fabric Links | 193
Example: Configuring the Chassis Cluster Fabric Interfaces
IN THIS SECTION
Requirements | 63
Overview | 63
Configuration | 63
Verification | 65
62

This example shows how to configure the chassis cluster fabric. The fabric is the back-to-back dataconnection between the nodes in a cluster. Traffic on one node that needs to be processed on the othernode or to exit through an interface on the other node passes over the fabric. Session state informationalso passes over the fabric.
Requirements
Before you begin, set the chassis cluster ID and chassis cluster node ID. See "Example: Setting the NodeID and Cluster ID for Security Devices in a Chassis Cluster " on page 43.
Overview
In most SRX Series devices in a chassis cluster, you can configure any pair of Gigabit Ethernet interfacesor any pair of 10-Gigabit interfaces to serve as the fabric between nodes.
You cannot configure filters, policies, or services on the fabric interface. Fragmentation is not supportedon the fabric link. The maximum MTU size for fabric interfaces is 9014 bytes and the maximum MTUsize for other interfaces is 8900 bytes. Jumbo frame support on the member links is enabled by default.
This example illustrates how to configure the fabric link.
Only the same type of interfaces can be configured as fabric children, and you must configure an equalnumber of child links for fab0 and fab1.
If you are connecting each of the fabric links through a switch, you must enable the jumbo frame featureon the corresponding switch ports. If both of the fabric links are connected through the same switch, theRTO-and-probes pair must be in one virtual LAN (VLAN) and the data pair must be in another VLAN.Here too, the jumbo frame feature must be enabled on the corresponding switch ports.
Configuration
IN THIS SECTION
Procedure | 64
63

Procedure
CLI Quick Configuration
To quickly configure this example, copy the following commands, paste them into a text file, remove anyline breaks, change any details necessary to match your network configuration, copy and paste thecommands into the CLI at the [edit] hierarchy level, and then enter commit from configuration mode.
{primary:node0}[edit]set interfaces fab0 fabric-options member-interfaces ge-0/0/1 set interfaces fab1 fabric-options member-interfaces ge-7/0/1
Step-by-Step Procedure
To configure the chassis cluster fabric:
• Specify the fabric interfaces.
{primary:node0}[edit]user@host# set interfaces fab0 fabric-options member-interfaces ge-0/0/1{primary:node0}[edit]user@host# set interfaces fab1 fabric-options member-interfaces ge-7/0/1
Results
From configuration mode, confirm your configuration by entering the show interfaces command. If theoutput does not display the intended configuration, repeat the configuration instructions in this exampleto correct it.
For brevity, this show command output includes only the configuration that is relevant to this example.Any other configuration on the system has been replaced with ellipses (...).
{primary:node0}[edit]user@host# show interfaces...fab0 { fabric-options { member-interfaces { ge-0/0/1; }
64

}} fab1 { fabric-options { member-interfaces { ge-7/0/1; } } }
If you are done configuring the device, enter commit from configuration mode.
Verification
IN THIS SECTION
Verifying the Chassis Cluster Fabric | 65
Verifying the Chassis Cluster Fabric
Purpose
Verify the chassis cluster fabric.
Action
From operational mode, enter the show interfaces terse | match fab command.
{primary:node0}user@host> show interfaces terse | match fabge-0/0/1.0 up up aenet --> fab0.0ge-7/0/1.0 up up aenet --> fab1.0fab0 up upfab0.0 up up inet 30.17.0.200/24fab1 up upfab1.0 up up inet 30.18.0.200/24
65

Verifying Chassis Cluster Data Plane Interfaces
IN THIS SECTION
Purpose | 66
Action | 66
Purpose
Display chassis cluster data plane interface status.
Action
From the CLI, enter the show chassis cluster data-plane interfaces command:
{primary:node1}user@host> show chassis cluster data-plane interfacesfab0: Name Status ge-2/1/9 up ge-2/2/5 up fab1: Name Status ge-8/1/9 up ge-8/2/5 up
Viewing Chassis Cluster Data Plane Statistics
IN THIS SECTION
Purpose | 67
Action | 67
66

Purpose
Display chassis cluster data plane statistics.
Action
From the CLI, enter the show chassis cluster data-plane statistics command:
{primary:node1}user@host> show chassis cluster data-plane statistics
Services Synchronized: Service name RTOs sent RTOs received Translation context 0 0 Incoming NAT 0 0 Resource manager 0 0 Session create 0 0 Session close 0 0 Session change 0 0 Gate create 0 0 Session ageout refresh requests 0 0 Session ageout refresh replies 0 0 IPSec VPN 0 0 Firewall user authentication 0 0 MGCP ALG 0 0 H323 ALG 0 0 SIP ALG 0 0 SCCP ALG 0 0 PPTP ALG 0 0 RTSP ALG 0 0
Clearing Chassis Cluster Data Plane Statistics
To clear displayed chassis cluster data plane statistics, enter the clear chassis cluster data-plane statisticscommand from the CLI:
{primary:node1}user@host> clear chassis cluster data-plane statistics
67

Cleared data-plane statistics
SEE ALSO
Configuring Chassis Clustering on SRX Series Devices | 121
Release History Table
Release Description
19.3R1 Starting in Junos OS Release 19.3R1, the SRX5K-IOC4-10G and SRX5K-IOC4-MRAT aresupported along with SRX5K-SPC3 on the SRX5000 series devices. SRX5K-IOC4-10G MPICsupports MACsec.
15.1X49-D10 Starting with Junos OS Release 15.1X49-D10, the SRX5K-MPC3-100G10G (IOC3) and theSRX5K-MPC3-40G10G (IOC3) are introduced.
12.1X47 Starting with Junos OS Release 12.1X47-D10 and Junos OS Release 17.3R1, the fabric monitoringfeature is enabled by default on SRX5800, SRX5600, and SRX5400 devices.
12.1X47 Starting with Junos OS Release 12.1X47-D10 and Junos OS Release 17.3R1, recovery of the fabriclink and synchronization take place automatically.
12.1X46 Starting in Junos OS Release 12.1X46-D10 and Junos OS Release 17.3R1, 100-Gigabit Ethernetinterface is supported on SRX5000 line devices.
RELATED DOCUMENTATION
SRX Series Chassis Cluster Configuration Overview | 13
Example: Configure Chassis Clustering on SRX Series Devices | 122
68

Chassis Cluster Control Plane Interfaces
IN THIS SECTION
Chassis Cluster Control Plane and Control Links | 69
Example: Configure Chassis Cluster Control Ports for Control Link | 73
Clear Chassis Cluster Control Plane Statistics | 78
SCB Chassis Cluster Control Links | 78
Change from Chassis Cluster to Standalone Mode | 80
Example: Configure Control Ports Using the SCB Control Link | 80
Transition from SPC to SCB with a Single Control Link | 84
Transition from SCB to SPC with a Single Control Link | 88
You can use control plane interfaces to synchronize the kernel state between Routing Engines on SRXSeries devices in a chassis cluster. Control plane interfaces provide the link between the two nodes inthe cluster.
Control planes use this link to:
• Communicate node discovery.
• Maintains session state for a cluster.
• Access the configuration file.
• Detect liveliness signals across the nodes.
Chassis Cluster Control Plane and Control Links
IN THIS SECTION
Chassis Cluster Control Links | 70
69

The control plane software, which operates in active or backup mode, is an integral part of Junos OSthat is active on the primary node of a cluster. It achieves redundancy by communicating state,configuration, and other information to the inactive Routing Engine on the secondary node. If theprimary Routing Engine fails, the secondary Routing Engine is ready to assume control.
The control plane software:
• Runs on the Routing Engine.
• Oversees the entire chassis cluster system, including interfaces on both nodes.
• Manages system and data plane resources, including the Packet Forwarding Engine (PFE) on eachnode.
• Synchronizes the configuration over the control link.
• Establishes and maintains sessions, including authentication, authorization, and accounting (AAA)functions.
• Manages application-specific signaling protocols.
• Establishes and maintains management sessions, such as Telnet connections.
• Handles asymmetric routing.
• Manages routing state, Address Resolution Protocol (ARP) processing, and Dynamic HostConfiguration Protocol (DHCP) processing.
Information from the control plane software follows two paths:
• On the primary node (where the Routing Engine is active), control information flows from theRouting Engine to the local Packet Forwarding Engine.
• Control information flows across the control link to the secondary node's Routing Engine and PacketForwarding Engine.
The control plane software running on the primary Routing Engine maintains state for the entire cluster.Only those processes running on the same node as the control plane software can update stateinformation. The primary Routing Engine synchronizes state for the secondary node and also processesall host traffic.
Chassis Cluster Control Links
The control interfaces provide the control link between the two nodes in the cluster and are used forrouting updates and for control plane signal traffic, such as heartbeat and threshold information thattriggers node failover. The control link also synchronizes the configuration between the nodes. When
70

you submit configuration statements to the cluster, the control link synchronizes the configurationautomatically.
The control link relies on a proprietary protocol to transmit session state, configuration, and livelinessstate across the nodes.
Starting in Junos OS Release 19.3R1, the SRX5K-RE3-128G device is supported along with the SRX5K-SPC3 device on the SRX5000 series devices. The control interfaces ixlv0 and igb0 are used to configurethe SRX5K-RE3-128G device.Control links control the communication between the control plane, dataplane, and heartbeat messages.
Single Control Link in a Chassis Cluster
For a single control link in a chassis cluster, you must use the same control port for the control linkconnection and for configuration on both nodes.
For example, if you configure port 0 as a control port on node 0, you must configure port 0 as a controlport on node 1. You must connect the ports with a cable.
Dual Control Link in a Chassis Cluster
You must connect dual control links in a chassis cluster directly. Cross connections—that is, connectingport 0 on one node to port 1 on the other node and vice versa—do not work.
For dual control links, you must make these connections:
• Connect control port 0 on node 0 to control port 0 on node 1.
• Connect control port 1 on node 0 to control port 1 on node 1.
Encryption on Chassis Cluster Control Link
Chassis cluster control links support an optional encrypted security feature that you can configure andactivate.
NOTE: Note that Juniper Networks security documentation uses chassis cluster when referringto high availability (HA) control links. You will still see the abbreviation ha used in place of chassiscluster in commands.
The control link access prevents hackers from logging in to the system without authentication throughthe control link, with Telnet access disabled. Using the internal IPsec key for internal communicationbetween devices, the configuration information that passes through the chassis cluster link from theprimary node to the secondary node is encrypted. Without the IPsec key, an attacker cannot gainprivilege access or observe traffic.
71

To enable this feature, run the set security ipsec internal security-association manual encryption ike-ha-link-encryption enable configuration command.
You must reboot both the nodes to activate this configuration.
Encryption on chassis cluster control link using IPsec is supported on SRX4600 line devices, SRX5000line devices, and vSRX platforms.
When the chassis cluster is running with the IPsec key configured already, then you can make anychanges to the key without rebooting the device. In this case, you will have to change the key only onone node.
When IPsec key encryption is configured, for any configuration changes under internal securityassociation (SA) hierarchy, you must reboot both the nodes. To verify the configured Internet KeyExchange (IKE) chassis cluster link encryption algorithm, view the output of show security internal-security-association.
Table 10 on page 72 lists the supported control ports on the SRX Series devices.Table 10: Supported Control Ports on SRX Series Devices
SRX Series Devices Description
SRX5400, SRX5600, and SRX5800 By default, all control ports are disabled. Each ServicesProcessing Card (SPC) in a device has two controlports, and each device can have multiple SPCs pluggedin to it. To set up the control link in a chassis cluster,you connect and configure the control ports that youuse on each device (fpc<n> and fpc<n>), and theninitialize the device in cluster mode.
SRX4600 Dedicated chassis cluster control ports and fabric portsare available.
No control link configuration is needed for SRX4600devices; however, you need to configure fabric linkports explicitly for chassis cluster deployments. If youwant to configure 1-Gigabit Ethernet interfaces for thecontrol ports, you must explicitly set the speed usingthe operational CLI command statement set chassiscluster control-port speed 1g. See speed (ChassisCluster).
72

Table 10: Supported Control Ports on SRX Series Devices (Continued)
SRX Series Devices Description
SRX4100 and SRX4200 Dedicated chassis cluster control ports are available.Control link configuration is not required. For moreinformation about all SRX4100 ports and SRX4200ports, including dedicated control links ports and fabriclink ports, see Understanding SRX Series ChassisCluster Slot Numbering and Physical Port and LogicalInterface Naming.
When devices are not in cluster mode, dedicatedchassis cluster ports cannot be used as revenue portsor traffic ports.
SRX1500 Devices use the dedicated control port.
SRX300, SRX320, SRX340, SRX345, SRX380, andSRX550M
Control link uses the ge-0/0/1 interface.
For details about port usage and interface usage for management links, control links, and fabric links, seeUnderstanding SRX Series Chassis Cluster Slot Numbering and Physical Port and Logical InterfaceNaming.
Example: Configure Chassis Cluster Control Ports for Control Link
IN THIS SECTION
Requirements | 74
Overview | 74
Configuration | 74
This example shows how to configure chassis cluster control ports on these devices: SRX5400,SRX5600, and SRX5800. You need to configure the control ports that you will use on each device to setup the control link.
73
Requirements
Before you begin:
• Understand chassis cluster control links. See "Understanding Chassis Cluster Control Plane andControl Links" on page 69.
• Physically connect the control ports on the devices. See "Connecting SRX Series Devices to Create aChassis Cluster" on page 35.
Overview
Control link traffic passes through the switches in the Services Processing Cards (SPCs) and reaches theother node. On SRX Series devices, chassis cluster ports are located at the SPCs in the chassis cluster.By default, all control ports on SRX5400 devices, SRX5600 devices, and SRX5800 devices are disabled.To set up the control links, you connect the control ports, configure the control ports, and set up thechassis cluster.
This example configures control ports with the following Flexible PIC Concentrators (FPCs) and ports asthe control link:
• FPC 4, port 0
• FPC 10, port 0
Configuration
IN THIS SECTION
Procedure | 74
Verify the Chassis Cluster Status | 76
Verify Chassis Cluster Control Plane Statistics | 76
Procedure
CLI Quick Configuration
To quickly configure this section of the example, copy the following commands, paste them into a textfile, remove any line breaks, change any details necessary to match your network configuration, copy
74

and paste the commands into the CLI at the [edit] hierarchy level, and then enter commit in configurationmode.
{primary:node0}[edit]set chassis cluster control-ports fpc 4 port 0set chassis cluster control-ports fpc 10 port 0 {primary:node1}[edit]set chassis cluster control-ports fpc 4 port 0set chassis cluster control-ports fpc 10 port 0
Step-by-Step Procedure
To configure control ports as the control link for the chassis cluster:
Specify the control ports.
{primary:node0}[edit]user@host# set chassis cluster control-ports fpc 4 port 0{primary:node0}[edit]user@host# set chassis cluster control-ports fpc 10 port 0{primary:node1}[edit]user@host# set chassis cluster control-ports fpc 4 port 0{primary:node1}[edit]user@host# set chassis cluster control-ports fpc 10 port 0
Results
In configuration mode, confirm your configuration by entering the show chassis cluster command. If theoutput does not display the intended configuration, repeat the configuration instructions in this exampleto correct it.
For brevity, this show command output includes only the configuration that is relevant to this example.Any other configuration on the system has been replaced with ellipses (...).
user@host# show chassis cluster...control-ports { fpc 4 port 0;
75

fpc 10 port 0; }...
After you configure the device, enter commit in configuration mode.
Verify the Chassis Cluster Status
Purpose
Verify the chassis cluster status.
Action
In operational mode, enter the show chassis cluster status command.
{primary:node0}user@host> show chassis cluster statusCluster ID: 1Node Priority Status Preempt Manual failover
Redundancy group: 0 , Failover count: 1 node0 100 primary no no node1 1 secondary no no
Redundancy group: 1 , Failover count: 1 node0 0 primary no no node1 0 secondary no no
Meaning
Use the show chassis cluster status command to confirm that the devices in the chassis cluster arecommunicating with each other. The preceding output shows that chassis cluster is functioning properly,as one device is the primary node and the other is the secondary node.
Verify Chassis Cluster Control Plane Statistics
Purpose
Display chassis cluster control plane statistics.
76

Action
At the CLI, enter the show chassis cluster control-plane statistics command:
{primary:node1}user@host> show chassis cluster control-plane statistics
Control link statistics: Control link 0: Heartbeat packets sent: 124 Heartbeat packets received: 125Fabric link statistics: Child link 0 Probes sent: 124 Probes received: 125
{primary:node1}user@host> show chassis cluster control-plane statistics
Control link statistics: Control link 0: Heartbeat packets sent: 258698 Heartbeat packets received: 258693 Control link 1: Heartbeat packets sent: 258698 Heartbeat packets received: 258693Fabric link statistics: Child link 0 Probes sent: 258690 Probes received: 258690 Child link 1 Probes sent: 258505 Probes received: 258505
SEE ALSO
Configuring Chassis Clustering on SRX Series Devices | 121
77
SEE ALSO
Connecting SRX Series Devices to Create a Chassis Cluster | 35
Chassis Cluster Dual Control Links | 164
Clear Chassis Cluster Control Plane Statistics
To clear displayed chassis cluster control plane statistics, enter the clear chassis cluster control-planestatistics command at the CLI:
{primary:node1}user@host> clear chassis cluster control-plane statistics
Cleared control-plane statistics
SCB Chassis Cluster Control Links
For SRX series devices SRX5400, SRX5600, and SRX5800, you can connect the control links in a chassiscluster using the Switch Control Board (SCB) chassis cluster control ports.
Increase the resiliency of the chassis cluster by separating chassis cluster control links from ServicesProcessing Card (SPC).
The SCB chassis cluster control link path is independent of SPCs. The SPC failures do not affect thechassis cluster control link.
The supported 10-Gigabit (Gb) SFPP connections on the SCB external 10-Gigabit Ethernet (10GbE)ports are as follows:
• SCB2 chassis cluster port: SFPP-10GE-LR, SFPP-10GE-SR, SFPP-10GE-LRM
78
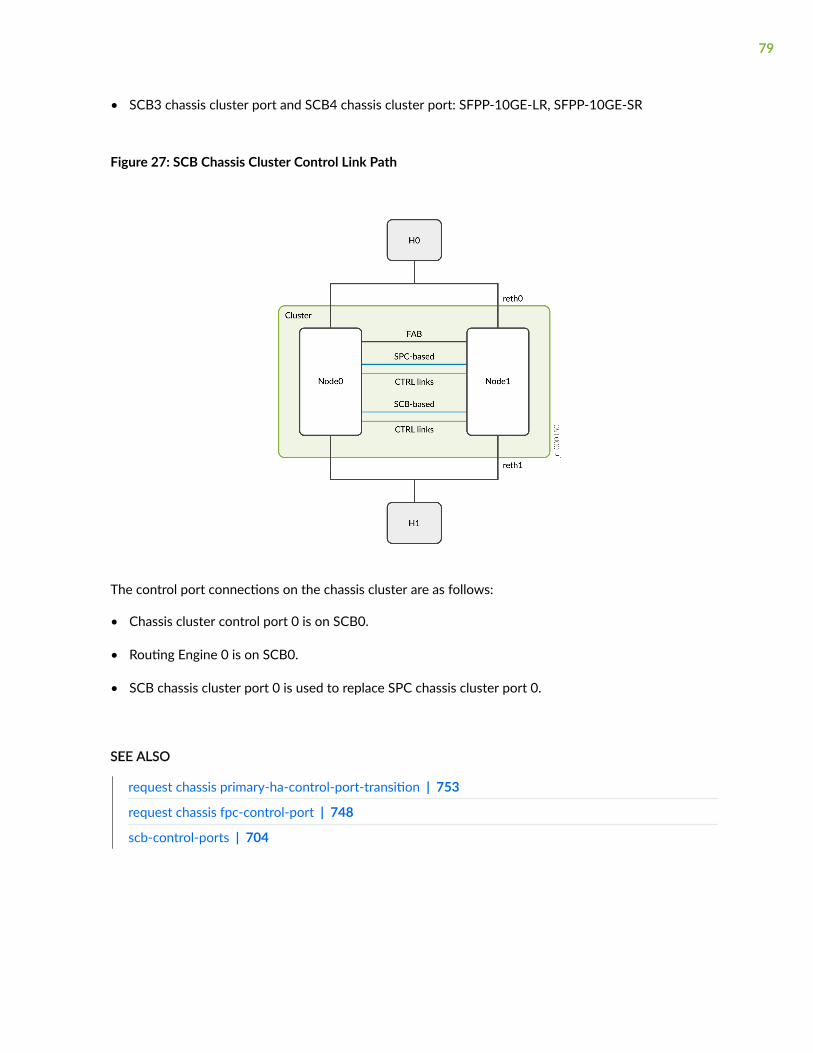
• SCB3 chassis cluster port and SCB4 chassis cluster port: SFPP-10GE-LR, SFPP-10GE-SR
Figure 27: SCB Chassis Cluster Control Link Path
The control port connections on the chassis cluster are as follows:
• Chassis cluster control port 0 is on SCB0.
• Routing Engine 0 is on SCB0.
• SCB chassis cluster port 0 is used to replace SPC chassis cluster port 0.
SEE ALSO
request chassis primary-ha-control-port-transition | 753
request chassis fpc-control-port | 748
scb-control-ports | 704
79

Change from Chassis Cluster to Standalone Mode
Change from cluster mode to standalone mode when using single primary control link.1. Disable the chassis cluster and reboot the devices to enter the standalone mode.
user@host> set chassis cluster disable reboot
2. Enable the chassis cluster and reboot the devices to enter the chassis cluster mode.
Example: Configure Control Ports Using the SCB Control Link
IN THIS SECTION
Requirements | 80
Overview | 80
Configuration | 81
Verification | 82
This example shows how to configure a chassis cluster with two standalone nodes using a single SCBcontrol link.
Requirements
Before you begin:
• Understand chassis cluster control links. See "Understanding Chassis Cluster Control Plane andControl Links" on page 69.
Overview
Configure the control ports that you will use on each device to set up the control link.
You must not configure the following control links at the same time:
• SPC and SCB primary control links
• SPC and SCB secondary control links
80

Configuration
IN THIS SECTION
Procedure | 81
Procedure
To configure a chassis cluster using a single SCB control link:
1. Connect an SCB control link cable between the SCB0 chassis cluster control ports on node 0 andnode 1.
2. Configure an SCB control port (primary control link) on node 0 and node 1.
user@host# set chassis cluster scb-control-ports 0
3. Reboot node 0.
user@host> set chassis cluster cluster-id 2 node 0 reboot
4. Reboot node 1.
user@host> set chassis cluster cluster-id 2 node 1 reboot
Results
In configuration mode, confirm your configuration by entering the show chassis cluster command. If theoutput does not display the intended configuration, repeat the configuration instructions in this exampleto correct it.
For brevity, this show command output includes only the configuration that is relevant to this example.
user@host# show chassis clusterscb-control-ports {
81

0;}
After you configure the device, enter commit from configuration mode.
Verification
IN THIS SECTION
Verify the Chassis Cluster Status | 82
Verify the Chassis Cluster Status
Purpose
You can verify the chassis cluster status and run the show chassis fpc pic-status command to ensurethat the FPCs are online.
Action
In operational mode, enter the show chassis cluster status command.
{primary:node0}user@host> show chassis cluster statusMonitor Failure codes: CS Cold Sync monitoring FL Fabric Connection monitoring GR GRES monitoring HW Hardware monitoring IF Interface monitoring IP IP monitoring LB Loopback monitoring MB Mbuf monitoring NH Nexthop monitoring NP NPC monitoring SP SPU monitoring SM Schedule monitoring CF Config Sync monitoring RE Relinquish monitoring IS IRQ storm
Cluster ID: 2Node Priority Status Preempt Manual Monitor-failures
Redundancy group: 0 , Failover count: 1node0 254 primary no no None
82

node1 1 secondary no no None
Redundancy group: 1 , Failover count: 1node0 200 primary no no Nonenode1 199 secondary no no None
In operational mode, enter the show chassis fpc pic-status command.
{primary:node0}user@host> show chassis fpc pic-statusnode0:--------------------------------------------------------------------------Slot 2 Online SPC3 PIC 0 Online SPU Cp-Flow PIC 1 Online SPU FlowSlot 3 Online SRX5k IOC4 10G PIC 0 Online 20x10GE SFPP- np-cache/services-offload PIC 1 Online 20x10GE SFPP- np-cache/services-offload
node1:--------------------------------------------------------------------------Slot 2 Online SPC3 PIC 0 Online SPU Cp-Flow PIC 1 Online SPU FlowSlot 3 Online SRX5k IOC4 10G PIC 0 Online 20x10GE SFPP- np-cache/services-offload PIC 1 Online 20x10GE SFPP- np-cache/services-offload
In operational mode, enter the show chassis cluster control-plane statistics command to view the statisticsof the control link used by chassis cluster traffic.
{primary:node0}user@host> show chassis cluster control-plane statisticsControl link statistics: Control link 0: Heartbeat packets sent: 459759 Heartbeat packets received: 459107 Heartbeat packet errors: 0 Node 0 SCB HA port TX FCS Errors: 0 Node 0 SCB HA port RX FCS Errors: 0 Node 1 SCB HA port TX FCS Errors: 0
83

Node 1 SCB HA port RX FCS Errors: 0 Control link 1: Heartbeat packets sent: 0 Heartbeat packets received: 0 Heartbeat packet errors: 0 Node 0 SCB HA port TX FCS Errors: NA Node 0 SCB HA port RX FCS Errors: NA Node 1 SCB HA port TX FCS Errors: NA Node 1 SCB HA port RX FCS Errors: NAFabric link statistics: Child link 0 Probes sent: 1835526 Probes received: 1834285 Child link 1 Probes sent: 0 Probes received: 0
Meaning
Use the show chassis cluster control-plane statistics command to view the control link statistics and fabriclink statistics exchanging heartbeats.
Transition from SPC to SCB with a Single Control Link
IN THIS SECTION
Requirements | 84
Overview | 85
Configuration | 85
This example provides steps for the chassis cluster control link transition from a single SPC control linkto a single SCB control link concurrently.
Requirements
Before you begin:
84

• Understand chassis cluster control links. See "Understanding Chassis Cluster Control Plane andControl Links" on page 69.
Overview
After completing the control link transition, ensure that you disconnect the SPC control link cables thatexisted before the control link transition. You must disconnect the secondary SCB control cable whenyou configure only the primary control link.
Configuration
IN THIS SECTION
Procedure | 85
Procedure
To transition from SPC to SCB control links concurrently:
1. During a single control link transition, heartbeats may be missing for a short time. The secondarynode may detect the missing heartbeats and go into an ineligible state. To prevent the secondarynode from entering an ineligible state, configure it to extend the control link heartbeat timeoutfrom 3 seconds (the default) to 16 seconds.
user@host# set chassis cluster heartbeat-interval 2000 heartbeat-threshold 8
2. Disable the SCB 0 chassis cluster control port on the primary node using the operational command.
{primary:node0}user@host> test chassis ethernet-switch shell-cmd "port xe0 enable=0"
3. Verify the SCB 0 chassis cluster control port status on the primary node.
{primary:node0}user@host> test chassis ethernet-switch shell-cmd ps | grep xe0xe0 !ena 10G FD SW No Forward TX RX None FA XGMII 16356
85

4. Enable the SCB 0 chassis cluster control port on the secondary node.
{secondary:node1}user@host> test chassis ethernet-switch shell-cmd "port xe0 enable=1"
5. Verify the SCB 0 chassis cluster control port status on the secondary node.
{secondary:node1}user@host> test chassis ethernet-switch shell-cmd ps | grep xe0xe0 down 10G FD SW No Forward TX RX None FA XGMII 16356
6. Connect the SCB primary control link cable.
7. Transition from the SPC control link to the SCB control link on the primary node by disabling SPCchassis cluster port 0 on the primary node and enabling SCB chassis cluster port 0 on the primarynode. Here the SPC slot number is the one on which the SPC chassis cluster control port isconfigured.
{primary:node0}user@host> request chassis primary-ha-control-port-transition from-fpc-to-scb fpc 4fpc 4 HA control port 0 disabled & scb 0 HA control port enabled
8. Delete the SPC primary control link configuration.
{primary:node0}[edit]user@host# delete chassis cluster control-ports
9. Configure the SCB primary control link.
{primary:node0}[edit]user@host# set chassis cluster scb-control-ports 0user@host# commitnode0:configuration check succeedsnode1:commit complete
86

node0:commit complete
10. Verify that the control link is up, using the show chassis cluster interfaces command.
{primary:node0}user@host> show chassis cluster interfacesControl link status: Up
Control interfaces: Index Interface Monitored-Status Internal-SA Security 0 ixlv0 Up Disabled Disabled 1 igb0 Down Disabled Disabled
Fabric link status: Up
Fabric interfaces: Name Child-interface Status Security (Physical/Monitored) fab0 xe-3/0/7 Up / Up Disabled fab0 fab1 xe-15/0/7 Up / Up Disabled fab1
Redundant-ethernet Information: Name Status Redundancy-group reth0 Down Not configured reth1 Down Not configured
Redundant-pseudo-interface Information: Name Status Redundancy-group lo0 Up 0
{primary:node0}user@host> show chassis fpc pic-statusnode0:--------------------------------------------------------------------------Slot 0 Online SPC3 PIC 0 Online SPU Cp-Flow PIC 1 Online SPU Flow
87

Slot 2 Online SRX5k SPC II PIC 0 Online SPU Flow PIC 1 Online SPU Flow PIC 2 Online SPU Flow PIC 3 Online SPU FlowSlot 3 Online SRX5k IOC4 10G PIC 0 Online 20x10GE SFPP- np-cache/services-offload PIC 1 Online 20x10GE SFPP- np-cache/services-offload
node1:--------------------------------------------------------------------------Slot 0 Online SPC3 PIC 0 Online SPU Cp-Flow PIC 1 Online SPU FlowSlot 2 Online SRX5k SPC II PIC 0 Online SPU Flow PIC 1 Online SPU Flow PIC 2 Online SPU Flow PIC 3 Online SPU FlowSlot 3 Online SRX5k IOC4 10G PIC 0 Online 20x10GE SFPP- np-cache/services-offload PIC 1 Online 20x10GE SFPP- np-cache/services-offload
11. Delete the control link heartbeat timeout.
user@host# delete chassis cluster heartbeat-interval 2000 heartbeat-threshold 8
12. Disconnect the SPC primary control link cable.
Transition from SCB to SPC with a Single Control Link
IN THIS SECTION
Requirements | 89
Configuration | 89
88

This example shows how to configure a control link transition from an SCB control link to an SPC controllink.
Requirements
Before you begin:
• Understand chassis cluster control links. See "Understanding Chassis Cluster Control Plane andControl Links" on page 69.
Configuration
IN THIS SECTION
Procedure | 89
Procedure
To transition from an SCB control link to an SPC control link concurrently:
1. During a single SCB control link transition, heartbeats may be missing for a short time. Thesecondary node may detect the missing heartbeats and enter an ineligible state. To prevent thesecondary node from entering an ineligible state, configure it to extend the control link heartbeattimeout from 3 seconds (the default) to 16 seconds.
user@host# set chassis cluster heartbeat-interval 2000 heartbeat-threshold 8
2. Disable SPC chassis cluster control port 0 on the primary node. fpc 4 is the local slot number onwhich the chassis cluster control port will be configured later.
{primary:node0}user@host> request chassis fpc-control-port disable fpc 4 port 0fpc 4 HA port 0 disabled
89

3. Enable SPC chassis cluster control port 0 on the secondary node. fpc 4 is the local slot number onwhich the chassis cluster control port will be configured later.
{secondary:node1}user@host> request chassis fpc-control-port enable fpc 4 port 0fpc 4 HA port 0 enabled
4. Connect the SPC primary control link cable.
5. Transition from the SCB control link to the SPC control link by disabling SCB chassis cluster controlport 0 on the primary node and enabling SPC chassis cluster port 0 on the primary node. Here theSPC slot number is the one on which the SPC chassis cluster control port will be configured.
{primary:node0}user@host> request chassis primary-ha-control-port-transition from-scb-to-fpc fpc 4scb 0 HA control port disabled & fpc 4 HA control port 0 enabled
6. Delete the primary SCB control link configuration.
{primary:node0}[edit]user@host# delete chassis cluster scb-control-ports
7. Configure the primary SPC control link.
{primary:node0}[edit]user@host# set chassis cluster control-ports fpc 4 port 0user@host# set chassis cluster control-ports fpc 10 port 0user@host# commitnode0:configuration check succeedsnode1:commit completenode0:commit complete
90

8. Verify if the control link is up, using the show chassis cluster interfaces command.
{primary:node0}user@host> show chassis cluster interfacesControl link status: Up
Control interfaces: Index Interface Monitored-Status Internal-SA Security 0 ixlv0 Up Disabled Disabled 1 igb0 Down Disabled Disabled
Fabric link status: Up
Fabric interfaces: Name Child-interface Status Security (Physical/Monitored) fab0 xe-3/0/7 Up / Up Disabled fab0 fab1 xe-15/0/7 Up / Up Disabled fab1
Redundant-ethernet Information: Name Status Redundancy-group reth0 Down Not configured reth1 Down Not configured
Redundant-pseudo-interface Information: Name Status Redundancy-group lo0 Up 0
{primary:node0}user@host> show chassis fpc pic-statusnode0:--------------------------------------------------------------------------Slot 0 Online SPC3 PIC 0 Online SPU Cp-Flow PIC 1 Online SPU FlowSlot 2 Online SRX5k SPC II PIC 0 Online SPU Flow PIC 1 Online SPU Flow PIC 2 Online SPU Flow
91

PIC 3 Online SPU FlowSlot 3 Online SRX5k IOC4 10G PIC 0 Online 20x10GE SFPP- np-cache/services-offload PIC 1 Online 20x10GE SFPP- np-cache/services-offload
node1:--------------------------------------------------------------------------Slot 0 Online SPC3 PIC 0 Online SPU Cp-Flow PIC 1 Online SPU FlowSlot 2 Online SRX5k SPC II PIC 0 Online SPU Flow PIC 1 Online SPU Flow PIC 2 Online SPU Flow PIC 3 Online SPU FlowSlot 3 Online SRX5k IOC4 10G PIC 0 Online 20x10GE SFPP- np-cache/services-offload PIC 1 Online 20x10GE SFPP- np-cache/services-offload
9. Delete the control link heartbeat timeout.
user@host# delete chassis cluster heartbeat-interval 2000 heartbeat-threshold 8
10. Disconnect the SCB primary control link cable.
Release History Table
Release Description
19.3R1 Starting in Junos OS Release 19.3R1, the SRX5K-RE3-128G is supported along with SRX5K-SPC3 onthe SRX5000 series devices. The control interfaces ixlv0 and igb0 are used to configure SRX5K-RE3-128G.Control links control the communication between the control, and data plane and theheartbeat messages.
RELATED DOCUMENTATION
Understanding SRX Series Chassis Cluster Slot Numbering and Physical Port and Logical InterfaceNaming | 18
Example: Configure Chassis Clustering on SRX Series Devices | 122
92

Chassis Cluster Redundancy Groups
IN THIS SECTION
Understanding Chassis Cluster Redundancy Groups | 93
Example: Configuring Chassis Cluster Redundancy Groups | 97
A redundancy group (RG) includes and manages a collection of objects on both nodes of a cluster. An RGis primary on one node and backup on the other node at any given time. For more information, see thefollowing topics:
Understanding Chassis Cluster Redundancy Groups
IN THIS SECTION
Understanding Chassis Cluster Redundancy Group 0: Routing Engines | 94
Understanding Chassis Cluster Redundancy Groups 1 Through 128 | 95
Chassis clustering provides high availability of interfaces and services through redundancy groups andprimacy within groups.
A redundancy group is an abstract construct that includes and manages a collection of objects. Aredundancy group contains objects on both nodes. A redundancy group is primary on one node andbackup on the other at any time. When a redundancy group is said to be primary on a node, its objectson that node are active.
Redundancy groups are independent units of failover. Each redundancy group fails over from one nodeto the other independent of other redundancy groups. When a redundancy group fails over, all itsobjects fail over together.
Three things determine the primacy of a redundancy group: the priority configured for the node, thenode ID (in case of tied priorities), and the order in which the node comes up. If a lower priority nodecomes up first, then it will assume the primacy for a redundancy group (and will stay as primary if
93

preempt is not enabled). If preempt is added to a redundancy group configuration, the device with thehigher priority in the group can initiate a failover to become primary. By default, preemption is disabled.For more information on preemption, see "preempt (Chassis Cluster)" on page 674.
A chassis cluster can include many redundancy groups, some of which might be primary on one nodeand some of which might be primary on the other. Alternatively, all redundancy groups can be primaryon a single node. One redundancy group's primacy does not affect another redundancy group's primacy.You can create up to 128 redundancy groups.
The maximum number of redundancy groups is equal to the number of redundant Ethernet interfacesthat you configure.
You can configure redundancy groups to suit your deployment. You configure a redundancy group to beprimary on one node and backup on the other node. You specify the node on which the group is primaryby setting priorities for both nodes within a redundancy group configuration. The node with the higherpriority takes precedence, and the redundancy group's objects on it are active.
If a redundancy group is configured so that both nodes have the same priority, the node with the lowestnode ID number always takes precedence, and the redundancy group is primary on it. In a two-nodecluster, node 0 always takes precedence in a priority tie.
Understanding Chassis Cluster Redundancy Group 0: Routing Engines
When you initialize a device in chassis cluster mode, the system creates a redundancy group referred toas redundancy group 0. Redundancy group 0 manages the primacy and failover between the RoutingEngines on each node of the cluster. As is the case for all redundancy groups, redundancy group 0 canbe primary on only one node at a time. The node on which redundancy group 0 is primary determineswhich Routing Engine is active in the cluster. A node is considered the primary node of the cluster if itsRouting Engine is the active one.
The redundancy group 0 configuration specifies the priority for each node. The following priorityscheme determines redundancy group 0 primacy. Note that the three-second value is the interval if thedefault heartbeat-threshold and heartbeat-interval values are used.
• The node that comes up first (at least three seconds prior to the other node) is the primary node.
• If both nodes come up at the same time (or within three seconds of each other):
• The node with the higher configured priority is the primary node.
• If there is a tie (either because the same value was configured or because default settings wereused), the node with the lower node ID (node 0) is the primary node.
The previous priority scheme applies to redundancy groups x (redundancy groups numbered 1 through128) as well, provided preempt is not configured. (See "Example: Configuring Chassis ClusterRedundancy Groups" on page 97.)
94

You cannot enable preemption for redundancy group 0. If you want to change the primary node forredundancy group 0, you must do a manual failover.
Be cautious and judicious in your use of redundancy group 0 manual failovers. A redundancy group 0failover implies a Routing Engine failover, in which case all processes running on the primary node arekilled and then spawned on the new primary Routing Engine. This failover could result in loss of state,such as routing state, and degrade performance by introducing system churn.
Understanding Chassis Cluster Redundancy Groups 1 Through 128
You can configure one or more redundancy groups numbered 1 through 128, referred to as redundancygroup x. The maximum number of redundancy groups is equal to the number of redundant Ethernetinterfaces that you configure (see "Maximum Number of Redundant Ethernet Interfaces Allowed(SRX4100, SRX4200, SRX4600, SRX5400, SRX5600, SRX5800, SRX300, SRX320, SRX340, SRX345,SRX 380, SRX550M and SRX1500)" on page 102). Each redundancy group x acts as an independent unitof failover and is primary on only one node at a time.
Each redundancy group x contains one or more redundant Ethernet interfaces. A redundant Ethernetinterface is a pseudo interface that contains at minimum a pair of physical Gigabit Ethernet interfaces ora pair of Fast Ethernet interfaces. If a redundancy group is active on node 0, then the child links of all theassociated redundant Ethernet interfaces on node 0 are active. If the redundancy group fails over tonode 1, then the child links of all redundant Ethernet interfaces on node 1 become active.
The following priority scheme determines redundancy group x primacy, provided preempt is notconfigured. If preempt is configured, the node with the higher priority is the primary node. Note that thethree-second value is the interval if the default heartbeat-threshold and heartbeat-interval values are used.
• The node that comes up first (at least three seconds prior to the other node) is the primary node.
• If both nodes come up at the same time (or within three seconds of each other):
• The node with the higher configured priority is the primary node.
• If there is a tie (either because the same value was configured or because default settings wereused), the node with the lower node ID (node 0) is the primary node.
On SRX Series chassis clusters, you can configure multiple redundancy groups to load-share trafficacross the cluster. For example, you can configure some redundancy groups x to be primary on one nodeand some redundancy groups x to be primary on the other node. You can also configure a redundancygroup x in a one-to-one relationship with a single redundant Ethernet interface to control whichinterface traffic flows through.
The traffic for a redundancy group is processed on the node where the redundancy group is active.Because more than one redundancy group can be configured, it is possible that the traffic from someredundancy groups is processed on one node while the traffic for other redundancy groups is processedon the other node (depending on where the redundancy group is active). Multiple redundancy groups
95

make it possible for traffic to arrive over an ingress interface of one redundancy group and over anegress interface that belongs to another redundancy group. In this situation, the ingress and egressinterfaces might not be active on the same node. When this happens, the traffic is forwarded over thefabric link to the appropriate node.
When you configure a redundancy group x, you must specify a priority for each node to determine thenode on which the redundancy group x is primary. The node with the higher priority is selected asprimary. The primacy of a redundancy group x can fail over from one node to the other. When aredundancy group x fails over to the other node, its redundant Ethernet interfaces on that node areactive and their interfaces are passing traffic.
Table 11 on page 96 gives an example of redundancy group x in an SRX Series chassis cluster andindicates the node on which the group is primary. It shows the redundant Ethernet interfaces and theirinterfaces configured for redundancy group x.
Some devices have both Gigabit Ethernet ports and Fast Ethernet ports.
Table 11: Example of Redundancy Groups in a Chassis Cluster
Group Primary Priority Objects Interface (Node 0) Interface(Node 1)
Redundancygroup 0
Node 0 Node 0:254
Routing Engine onnode 0
— —
Node 1: 2 Routing Engine onnode 1
— —
Redundancygroup 1
Node 0 Node 0:254
Redundant Ethernetinterface 0
ge-1/0/0 ge-5/0/0
Node 1: 2 Redundant Ethernetinterface 1
ge-1/3/0 ge-5/3/0
Redundancygroup 2
Node 1 Node 0: 2 Redundant Ethernetinterface 2
ge-2/0/0 ge-6/0/0
Node 1:254
Redundant Ethernetinterface 3
ge-2/3/0 ge-6/3/0
96

Table 11: Example of Redundancy Groups in a Chassis Cluster (Continued)
Group Primary Priority Objects Interface (Node 0) Interface(Node 1)
Redundancygroup 3
Node 0 Node 0:254
Redundant Ethernetinterface 4
ge-3/0/0 ge-7/0/0
Node 1: 2 Redundant Ethernetinterface 5
ge-3/3/0 ge-7/3/0
As the example for a chassis cluster in Table 11 on page 96 shows:
• The Routing Engine on node 0 is active because redundancy group 0 is primary on node 0. (TheRouting Engine on node 1 is passive, serving as backup.)
• Redundancy group 1 is primary on node 0. Interfaces ge-1/0/0 and ge-1/3/0 belonging to redundantEthernet interface 0 and redundant Ethernet interface 1 are active and handling traffic.
• Redundancy group 2 is primary on node 1. Interfaces ge-6/0/0 and ge-6/3/0 belonging to redundantEthernet interface 2 and redundant Ethernet interface 3 are active and handling traffic.
• Redundancy group 3 is primary on node 0. Interfaces ge-3/0/0 and ge-3/3/0 belonging to redundantEthernet interface 4 and redundant Ethernet interface 5 are active and handling traffic.
Example: Configuring Chassis Cluster Redundancy Groups
IN THIS SECTION
Requirements | 98
Overview | 98
Configuration | 98
Verification | 100
This example shows how to configure a chassis cluster redundancy group.
97

Requirements
Before you begin:
1. Set the chassis cluster node ID and cluster ID. See "Example: Setting the Chassis Cluster Node ID andCluster ID" on page 43.
2. Configure the chassis cluster management interface. See "Example: Configuring the Chassis ClusterManagement Interface" on page 48.
3. Configure the chassis cluster fabric. See "Example: Configuring the Chassis Cluster Fabric Interfaces"on page 62.
Overview
A chassis cluster redundancy group is an abstract entity that includes and manages a collection ofobjects. Each redundancy group acts as an independent unit of failover and is primary on only one nodeat a time.
In this example, you create two chassis cluster redundancy groups, 0 and 1:
• 0—Node 0 is assigned a priority of 100, and node 1 is assigned a priority of 1.
• 1—Node 0 is assigned a priority of 100, and node 1 is assigned a priority of 1.
The preempt option is enabled, and the number of gratuitous ARP requests that an interface can send tonotify other network devices of its presence after the redundancy group it belongs to has failed over is4.
Configuration
IN THIS SECTION
Procedure | 99
98

Procedure
CLI Quick Configuration
To quickly configure this example, copy the following commands, paste them into a text file, remove anyline breaks, change any details necessary to match your network configuration, copy and paste thecommands into the CLI at the [edit] hierarchy level, and then enter commit from configuration mode.
[edit]set chassis cluster redundancy-group 0 node 0 priority 100 set chassis cluster redundancy-group 0 node 1 priority 1 set chassis cluster redundancy-group 1 node 0 priority 100 set chassis cluster redundancy-group 1 node 1 priority 1 set chassis cluster redundancy-group 1 preemptset chassis cluster redundancy-group 1 gratuitous-arp-count 4
Step-by-Step Procedure
To configure a chassis cluster redundancy group:
1. Specify a redundancy group's priority for primacy on each node of the cluster. The higher numbertakes precedence.
{primary:node0}[edit]user@host# set chassis cluster redundancy-group 0 node 0 priority 100 user@host# set chassis cluster redundancy-group 0 node 1 priority 1 user@host# set chassis cluster redundancy-group 1 node 0 priority 100 user@host# set chassis cluster redundancy-group 1 node 1 priority 1
2. Configure the node with the higher priority to preempt the device with the lower priority andbecome primary for the redundancy group.
{primary:node0}[edit]user@host# set chassis cluster redundancy-group 1 preempt
You cannot enable preemption for redundancy group 0. If you want to change the primary node forredundancy group 0, you must do a manual failover.
99

3. Specify the number of gratuitous ARP requests that an interface can send to notify other networkdevices of its presence after the redundancy group it belongs to has failed over.
{primary:node0}[edit]user@host# set chassis cluster redundancy-group 1 gratuitous-arp-count 4
Results
From configuration mode, confirm your configuration by entering the show chassis cluster statusredundancy-group commands. If the output does not display the intended configuration, repeat theconfiguration instructions in this example to correct it.
{primary:node0}[edit]user@host# show chassis clusterchassis { cluster { redundancy-group 0 { node 0 priority 100; node 1 priority 1; } redundancy-group 1 { node 0 priority 100; node 1 priority 1; preempt; gratuitous-arp-count 4; } }}
If you are done configuring the device, enter commit from configuration mode.
Verification
IN THIS SECTION
Verifying Chassis Cluster Redundancy Group Status | 101
100
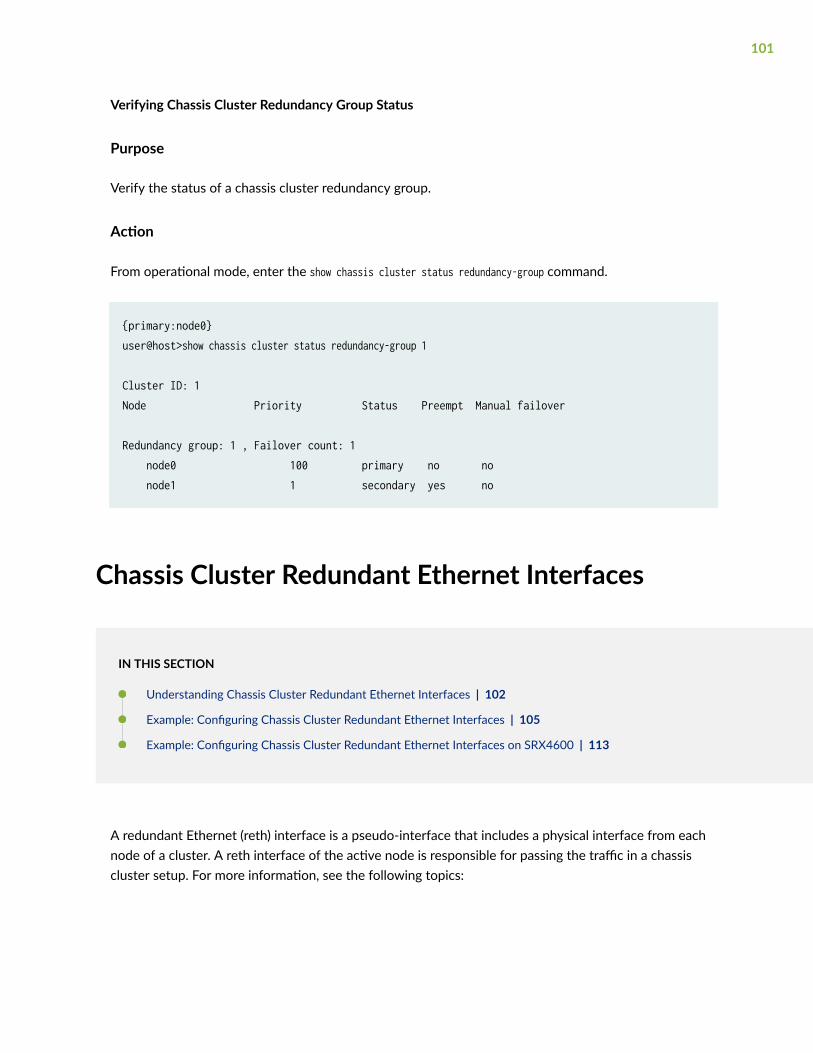
Verifying Chassis Cluster Redundancy Group Status
Purpose
Verify the status of a chassis cluster redundancy group.
Action
From operational mode, enter the show chassis cluster status redundancy-group command.
{primary:node0}user@host>show chassis cluster status redundancy-group 1
Cluster ID: 1Node Priority Status Preempt Manual failover
Redundancy group: 1 , Failover count: 1 node0 100 primary no no node1 1 secondary yes no
Chassis Cluster Redundant Ethernet Interfaces
IN THIS SECTION
Understanding Chassis Cluster Redundant Ethernet Interfaces | 102
Example: Configuring Chassis Cluster Redundant Ethernet Interfaces | 105
Example: Configuring Chassis Cluster Redundant Ethernet Interfaces on SRX4600 | 113
A redundant Ethernet (reth) interface is a pseudo-interface that includes a physical interface from eachnode of a cluster. A reth interface of the active node is responsible for passing the traffic in a chassiscluster setup. For more information, see the following topics:
101

Understanding Chassis Cluster Redundant Ethernet Interfaces
A redundant Ethernet interface is a pseudointerface that includes at minimum one physical interfacefrom each node of the cluster.
For SRX300, SRX320, SRX340, SRX345, SRX380, SRX550M, SRX1500, SRX4100, and SRX4200devices, the total number of logical interfaces that you can configure across all the redundant Ethernet(reth) interfaces in a chassis cluster deployment is 1024.
For SRX5800, SRX5600, SRX5400, and SRX4600 devices, the total number of logical interfaces that youcan configure across all the redundant Ethernet (reth) interfaces in a chassis cluster deployment is 4096.
For SRX550M devices, the total number of logical interfaces that you can configure across all theredundant Ethernet (reth) interfaces in a chassis cluster deployment is 1024.
Starting with Junos OS Release 12.1X45-D10 and later, sampling features such as flow monitoring,packet capture, and port mirroring are supported on reth interfaces.
A redundant Ethernet interface must contain, at minimum, a pair of Fast Ethernet interfaces or a pair ofGigabit Ethernet interfaces that are referred to as child interfaces of the redundant Ethernet interface(the redundant parent). If two or more child interfaces from each node are assigned to the redundantEthernet interface, a redundant Ethernet interface link aggregation group can be formed. A singleredundant Ethernet interface might include a Fast Ethernet interface from node 0 and a Fast Ethernetinterface from node 1 or a Gigabit Ethernet interface from node 0 and a Gigabit Ethernet interface fromnode 1.
On SRX5600, and SRX5800 devices, interfaces such as 10-Gigabit Ethernet (xe), 40-Gigabit Ethernet,and 100-Gigabit Ethernet can be redundant Ethernet (reth) interfaces.
SRX4100 and SRX4200 devices support 10-Gigabit Ethernet (xe) interfaces as redundant Ethernet (reth)interfaces.
A redundant Ethernet interface is referred to as a reth in configuration commands.
A redundant Ethernet interface's child interface is associated with the redundant Ethernet interface aspart of the child interface configuration. The redundant Ethernet interface child interface inherits mostof its configuration from its parent.
The maximum number of redundant Ethernet interfaces that you can configure varies, depending on thedevice type you are using, as shown in Table 12 on page 103. The number of redundant Ethernetinterfaces configured determines the number of redundancy groups that can be configured in the SRXdevices.
102

Table 12: Maximum Number of Redundant Ethernet Interfaces Allowed (SRX4100, SRX4200,SRX4600, SRX5400, SRX5600, SRX5800, SRX300, SRX320, SRX340, SRX345, SRX 380, SRX550Mand SRX1500)
Device Maximum Number of reth Interfaces
SRX4600 128
SRX4100, SRX4200 128
SRX5400, SRX5600, SRX5800 128
SRX300, SRX320, SRX340, SRX345,SRX380 128
SRX550M 58
SRX1500 128
You can enable promiscuous mode on redundant Ethernet interfaces. When promiscuous mode isenabled on a Layer 3 Ethernet interface, all packets received on the interface are sent to the centralpoint or Services Processing Unit (SPU), regardless of the destination MAC address of the packet. If youenable promiscuous mode on a redundant Ethernet interface, promiscuous mode is then enabled on anychild physical interfaces.
To enable promiscuous mode on a redundant Ethernet interface, use the promiscuous-mode statement atthe [edit interfaces] hierarchy.
A redundant Ethernet interface inherits its failover properties from the redundancy group x that itbelongs to. A redundant Ethernet interface remains active as long as its primary child interface isavailable or active. For example, if reth0 is associated with redundancy group 1 and redundancy group 1is active on node 0, then reth0 is up as long as the node 0 child of reth0 is up.
Point-to-Point Protocol over Ethernet (PPPoE) over redundant Ethernet (reth) interface is supported onSRX300, SRX320, SRX340, SRX345, SRX380, SRX550M and SRX1500 devices in chassis cluster mode.This feature allows an existing PPPoE session to continue without starting a new PPP0E session in theevent of a failover.
On SRX300, SRX320, SRX340, SRX345, SRX380, and SRX550M devices, the number of child interfacesis restricted to 16 on the reth interface (eight per node).
When using SRX Series devices in chassis cluster mode, it is not recommended to configure any localinterfaces (or combination of local interfaces) along with redundant Ethernet interfaces.
103

For example:
The following configuration of chassis cluster with redundant Ethernet interfaces in which interfaces areconfigured as local interfaces:
ge-2/0/2 { unit 0 { family inet { address 10.1.1.1/24; } }}
The following configuration of chassis cluster redundant Ethernet interfaces, in which interfaces areconfigured as part of redundant Ethernet interfaces, is supported:
interfaces { ge-2/0/2 { gigether-options { redundant-parent reth2; } } reth2 { redundant-ether-options { redundancy-group 1; } unit 0 { family inet { address 10.1.1.1/24; } } }}
You can enable promiscuous mode on redundant Ethernet interfaces. When promiscuous mode isenabled on a Layer 3 Ethernet interface, all packets received on the interface are sent to the centralpoint or Services Processing Unit (SPU), regardless of the destination MAC address of the packet. If youenable promiscuous mode on a redundant Ethernet interface, promiscuous mode is then enabled on anychild physical interfaces.
To enable promiscuous mode on a redundant Ethernet interface, use the promiscuous-mode statement atthe [edit interfaces] hierarchy.
104

SEE ALSO
Understanding Link Aggregation Groups in a Chassis Cluster | 290
Example: Configuring Chassis Cluster Redundant Ethernet Interfaces
IN THIS SECTION
Requirements | 105
Overview | 105
Configuration | 106
Verification | 111
This example shows how to configure chassis cluster redundant Ethernet interfaces. A redundantEthernet interface is a pseudointerface that contains two or more physical interfaces, with at least onefrom each node of the cluster.
Requirements
Before you begin:
• Understand how to set the chassis cluster node ID and cluster ID. See "Example: Setting the ChassisCluster Node ID and Cluster ID" on page 43.
• Set the number of redundant Ethernet interfaces.
• Understand how to set the chassis cluster fabric. See "Example: Configuring the Chassis ClusterFabric Interfaces" on page 62.
• Understand how to set the chassis cluster node redundancy groups. See "Example: ConfiguringChassis Cluster Redundancy Groups" on page 97.
Overview
After physical interfaces have been assigned to the redundant Ethernet interface, you set theconfiguration that pertains to them at the level of the redundant Ethernet interface, and each of thechild interfaces inherits the configuration.
If multiple child interfaces are present, then the speed of all the child interfaces must be the same.
105

A redundant Ethernet interface is referred to as a reth in configuration commands.
You can enable promiscuous mode on redundant Ethernet interfaces. When promiscuous mode isenabled on a Layer 3 Ethernet interface, all packets received on the interface are sent to the centralpoint or Services Processing Unit regardless of the destination MAC address of the packet. If you enablepromiscuous mode on a redundant Ethernet interface, promiscuous mode is then enabled on any childphysical interfaces.
To enable promiscuous mode on a redundant Ethernet interface, use the promiscuous-mode statementat the [edit interfaces] hierarchy.
Configuration
IN THIS SECTION
Configuring Chassis Cluster Redundant Ethernet Interfaces for IPv4 Addresses | 106
Configuring Chassis Cluster Redundant Ethernet Interfaces for IPv6 Addresses | 108
Results | 109
Configuring Chassis Cluster Redundant Ethernet Interfaces for IPv4 Addresses
CLI Quick Configuration
To quickly configure this example, copy the following commands, paste them into a text file, remove anyline breaks, change any details necessary to match your network configuration, copy and paste thecommands into the CLI at the [edit] hierarchy level, and then enter commit from configuration mode.
{primary:node0}[edit]set interfaces ge-0/0/0 gigether-options redundant-parent reth1set interfaces ge-7/0/0 gigether-options redundant-parent reth1 set interfaces fe-1/0/0 fast-ether-options redundant-parent reth2 set interfaces fe-8/0/0 fast-ether-options redundant-parent reth2 set interfaces reth1 redundant-ether-options redundancy-group 1 set interfaces reth1 unit 0 family inet mtu 1500 set interfaces reth1 unit 0 family inet address 10.1.1.3/24 set security zones security-zone Trust interfaces reth1.0
106

Step-by-Step Procedure
To configure redundant Ethernet interfaces for IPv4:
1. Bind redundant child physical interfaces to reth1.
{primary:node0}[edit]user@host# set interfaces ge-0/0/0 gigether-options redundant-parent reth1user@host# set interfaces ge-7/0/0 gigether-options redundant-parent reth1
2. Bind redundant child physical interfaces to reth2.
{primary:node0}[edit]user@host# set interfaces fe-1/0/0 fast-ether-options redundant-parent reth2user@host# set interfaces fe-8/0/0 fast-ether-options redundant-parent reth2
3. Add reth1 to redundancy group 1.
{primary:node0}[edit]user@host# set interfaces reth1 redundant-ether-options redundancy-group 1
4. Set the MTU size.
{primary:node0}[edit]user@host# set interfaces reth1 unit 0 family inet mtu 1500
The maximum transmission unit (MTU) set on the reth interface can be different from the MTU onthe child interface.
5. Assign an IP address to reth1.
{primary:node0}[edit]user@host# set interfaces reth1 unit 0 family inet address 10.1.1.3/24
107
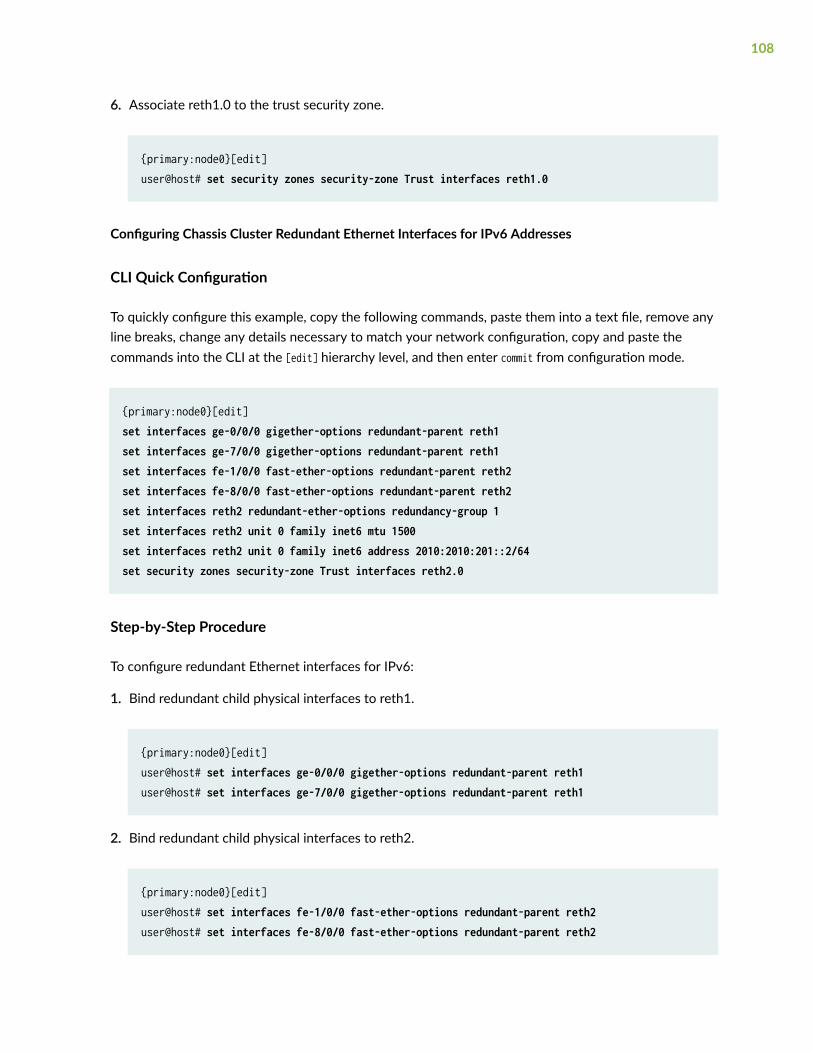
6. Associate reth1.0 to the trust security zone.
{primary:node0}[edit]user@host# set security zones security-zone Trust interfaces reth1.0
Configuring Chassis Cluster Redundant Ethernet Interfaces for IPv6 Addresses
CLI Quick Configuration
To quickly configure this example, copy the following commands, paste them into a text file, remove anyline breaks, change any details necessary to match your network configuration, copy and paste thecommands into the CLI at the [edit] hierarchy level, and then enter commit from configuration mode.
{primary:node0}[edit]set interfaces ge-0/0/0 gigether-options redundant-parent reth1set interfaces ge-7/0/0 gigether-options redundant-parent reth1 set interfaces fe-1/0/0 fast-ether-options redundant-parent reth2 set interfaces fe-8/0/0 fast-ether-options redundant-parent reth2 set interfaces reth2 redundant-ether-options redundancy-group 1 set interfaces reth2 unit 0 family inet6 mtu 1500 set interfaces reth2 unit 0 family inet6 address 2010:2010:201::2/64 set security zones security-zone Trust interfaces reth2.0
Step-by-Step Procedure
To configure redundant Ethernet interfaces for IPv6:
1. Bind redundant child physical interfaces to reth1.
{primary:node0}[edit]user@host# set interfaces ge-0/0/0 gigether-options redundant-parent reth1user@host# set interfaces ge-7/0/0 gigether-options redundant-parent reth1
2. Bind redundant child physical interfaces to reth2.
{primary:node0}[edit]user@host# set interfaces fe-1/0/0 fast-ether-options redundant-parent reth2user@host# set interfaces fe-8/0/0 fast-ether-options redundant-parent reth2
108

3. Add reth2 to redundancy group 1.
{primary:node0}[edit]user@host# set interfaces reth2 redundant-ether-options redundancy-group 1
4. Set the MTU size.
{primary:node0}[edit]user@host# set interfaces reth2 unit 0 family inet6 mtu 1500
5. Assign an IP address to reth2.
{primary:node0}[edit]user@host# set interfaces reth2 unit 0 family inet6 address 2010:2010:201::2/64
6. Associate reth2.0 to the trust security zone.
{primary:node0}[edit]user@host# set security zones security-zone Trust interfaces reth2.0
Step-by-Step Procedure
To set the number of redundant Ethernet interfaces for a chassis cluster:
1. Specify the number of redundant Ethernet interfaces:
{primary:node0}[edit]
user@host# set chassis cluster reth-count 2
Results
From configuration mode, confirm your configuration by entering the show interfaces command. If theoutput does not display the intended configuration, repeat the configuration instructions in this exampleto correct it.
109

For brevity, this show command output includes only the configuration that is relevant to this example.Any other configuration on the system has been replaced with ellipses (...).
{primary:node0}[edit]user@host# show interfaces interfaces { ... fe-1/0/0 { fastether-options { redundant-parent reth2; } } fe-8/0/0 { fastether-options { redundant-parent reth2; } } ge-0/0/0 { gigether-options { redundant-parent reth1; } } ge-7/0/0 { gigether-options { redundant-parent reth1; } } reth1 { redundant-ether-options { redundancy-group 1; } unit 0 { family inet { mtu 1500; address 10.1.1.3/24; } } } reth2 { redundant-ether-options { redundancy-group 1; }
110

unit 0 { family inet6 { mtu 1500; address 2010:2010:201::2/64; } } } ...}
If you are done configuring the device, enter commit from configuration mode.
Verification
IN THIS SECTION
Verifying Chassis Cluster Redundant Ethernet Interfaces | 111
Verifying Chassis Cluster Control Links | 112
Confirm that the configuration is working properly.
Verifying Chassis Cluster Redundant Ethernet Interfaces
Purpose
Verify the configuration of the chassis cluster redundant Ethernet interfaces.
Action
From operational mode, enter the show interfaces terse | match reth1 command:
{primary:node0}user@host> show interfaces terse | match reth1
ge-0/0/0.0 up up aenet --> reth1.0ge-7/0/0.0 up up aenet --> reth1.0reth1 up upreth1.0 up up inet 10.1.1.3/24
111
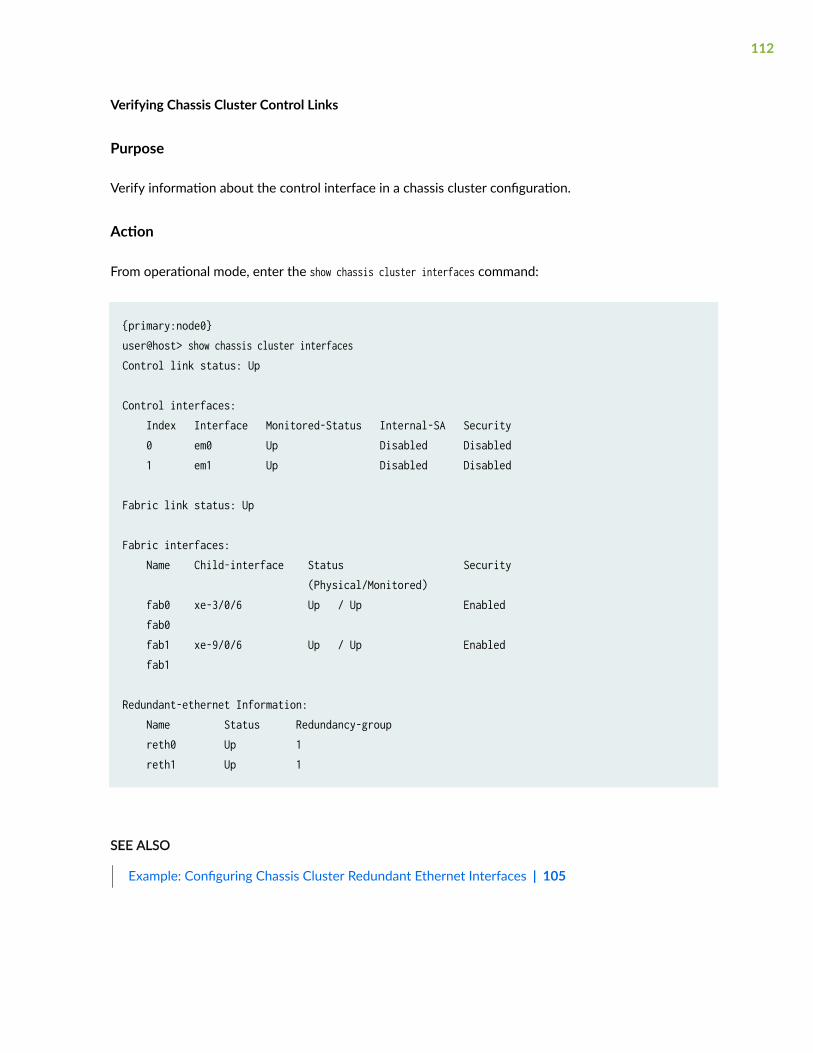
Verifying Chassis Cluster Control Links
Purpose
Verify information about the control interface in a chassis cluster configuration.
Action
From operational mode, enter the show chassis cluster interfaces command:
{primary:node0}user@host> show chassis cluster interfacesControl link status: Up
Control interfaces: Index Interface Monitored-Status Internal-SA Security 0 em0 Up Disabled Disabled 1 em1 Up Disabled Disabled
Fabric link status: Up
Fabric interfaces: Name Child-interface Status Security (Physical/Monitored) fab0 xe-3/0/6 Up / Up Enabled fab0 fab1 xe-9/0/6 Up / Up Enabled fab1
Redundant-ethernet Information: Name Status Redundancy-group reth0 Up 1 reth1 Up 1
SEE ALSO
Example: Configuring Chassis Cluster Redundant Ethernet Interfaces | 105
112

Example: Configuring Chassis Cluster Redundant Ethernet Interfaces onSRX4600
IN THIS SECTION
Requirements | 113
Overview | 113
Configuration | 113
Verification | 118
This example shows how to configure child links or physical links on SRX4600 device in chassis clustermode.
Requirements
Before you begin:
• Understand how to set the chassis cluster node ID and cluster ID. See "Example: Setting the ChassisCluster Node ID and Cluster ID" on page 43.
• Understand how to set the chassis cluster node redundancy groups. See "Example: ConfiguringChassis Cluster Redundancy Groups" on page 97.
Overview
You can configure up to eight number of child links for a reth bundle on SRX4600 devices per chassis.
Configuration
IN THIS SECTION
CLI Quick Configuration | 114
Configuring redundant Ethernet interfaces | 114
Results | 116
113

CLI Quick Configuration
To quickly configure this example, copy the following commands, paste them into a text file, remove anyline breaks, change any details necessary to match your network configuration, copy and paste thecommands into the CLI at the [edit] hierarchy level, and then enter commit from configuration mode.
{primary:node0}[edit]set interfaces xe-1/0/0:0 gigether-options redundant-parent reth0set interfaces xe-1/0/0:1 gigether-options redundant-parent reth0set interfaces xe-1/0/0:2 gigether-options redundant-parent reth0set interfaces xe-1/0/0:3 gigether-options redundant-parent reth0set interfaces xe-1/0/1:0 gigether-options redundant-parent reth0set interfaces xe-1/0/1:1 gigether-options redundant-parent reth0set interfaces xe-1/0/1:2 gigether-options redundant-parent reth0set interfaces xe-1/0/1:3 gigether-options redundant-parent reth0set interfaces xe-1/1/0 gigether-options redundant-parent reth1set interfaces xe-1/1/1 gigether-options redundant-parent reth1set interfaces reth0 redundant-ether-options redundancy-group 1set interfaces reth0 unit 0 family inet address 192.0.2.1/24set interfaces reth1 redundant-ether-options redundancy-group 1set interfaces reth1 redundant-ether-options lacp activeset interfaces reth1 unit 0 family inet address 198.51.100.1/24set security zones security-zone Trust-zone interfaces reth0.0set security zones security-zone Untrust-zone interfaces reth1.0set chassis cluster reth-count 10
Configuring redundant Ethernet interfaces
Step-by-Step Procedure
To configure redundant Ethernet interfaces:
1. Bind eight redundant child physical interfaces to reth0.
{primary:node0}[edit]user@host# set interfaces xe-1/0/0:0 gigether-options redundant-parent reth0user@host# set interfaces xe-1/0/0:1 gigether-options redundant-parent reth0user@host# set interfaces xe-1/0/0:2 gigether-options redundant-parent reth0user@host# set interfaces xe-1/0/0:3 gigether-options redundant-parent reth0user@host# set interfaces xe-1/0/1:0 gigether-options redundant-parent reth0user@host# set interfaces xe-1/0/1:1 gigether-options redundant-parent reth0
114

user@host# set interfaces xe-1/0/1:2 gigether-options redundant-parent reth0user@host# set interfaces xe-1/0/1:3 gigether-options redundant-parent reth0
2. Bind redundant child physical interfaces to reth1.
{primary:node0}[edit]user@host# set interfaces xe-1/1/0 gigether-options redundant-parent reth1user@host# set interfaces xe-1/1/1 gigether-options redundant-parent reth1
3. Specify the number of redundant Ethernet interfaces:
{primary:node0}[edit]
user@host# set chassis cluster reth-count 10
4. Add reth0 to redundancy group 1.
{primary:node0}[edit]user@host# set interfaces reth0 redundant-ether-options redundancy-group 1
5. Assign an IP address to reth0.
{primary:node0}[edit]user@host# set interfaces reth0 unit 0 family inet address 192.0.2.1/24
6. Add reth1 to redundancy group1.
{primary:node0}[edit]user@host# set interfaces reth1 redundant-ether-options redundancy-group 1user@host# set interfaces reth1 redundant-ether-options lacp active
7. Assign an IP address to reth1.
{primary:node0}[edit]user@host# set interfaces reth1 unit 0 family inet address 198.51.100.1/24
115

8. Associate reth0.0 to the trust security zone.
{primary:node0}[edit]user@host# set security zones security-zone Trust-zone interfaces reth0.0
9. Associate reth1.0 to untrust security zone.
{primary:node0}[edit]user@host# set security zones security-zone Untrust-zone interfaces reth1.0
Results
From configuration mode, confirm your configuration by entering the show interfaces command. If theoutput does not display the intended configuration, repeat the configuration instructions in this exampleto correct it.
For brevity, this show command output includes only the configuration that is relevant to this example.Any other configuration on the system has been replaced with ellipses (...).
{primary:node0}[edit]user@host# show interfaces xe-1/0/0:0 { gigether-options { redundant-parent reth0; }}xe-1/0/0:1 { gigether-options { redundant-parent reth0; }}xe-1/0/0:2 { gigether-options { redundant-parent reth0; }}xe-1/0/0:3 { gigether-options { redundant-parent reth0; }
116

}xe-1/0/1:0 { gigether-options { redundant-parent reth0; }}xe-1/0/1:1 { gigether-options { redundant-parent reth0; }}xe-1/0/1:2 { gigether-options { redundant-parent reth0; }}xe-1/0/1:3 { gigether-options { redundant-parent reth0; }}xe-1/1/0 { gigether-options { redundant-parent reth1; }}xe-1/1/1 { gigether-options { redundant-parent reth1; }}reth0 { redundant-ether-options { redundancy-group 1; } unit 0 { family inet { address 192.0.2.1/24; } }}reth1 { redundant-ether-options {
117

redundancy-group 1; lacp { active; } } unit 0 { family inet { address 198.51.100.1/24; } }}
If you are done configuring the device, enter commit from configuration mode.
Verification
IN THIS SECTION
Verify Chassis Cluster Redundant Ethernet Interfaces | 118
Verifying Chassis Cluster Control Links | 119
Confirm that the configuration is working properly.
Verify Chassis Cluster Redundant Ethernet Interfaces
Purpose
Verify the configuration of the chassis cluster redundant Ethernet interfaces on SRX4600 device.
Action
From operational mode, enter the show interfaces terse | match reth0 command:
{primary:node0}user@host> show interfaces terse | match reth0
xe-1/0/0:0.0 up down aenet --> reth0.0xe-1/0/0:1.0 up down aenet --> reth0.0
118

xe-1/0/0:2.0 up down aenet --> reth0.0xe-1/0/0:3.0 up down aenet --> reth0.0xe-1/0/1:0.0 up down aenet --> reth0.0xe-1/0/1:1.0 up down aenet --> reth0.0xe-1/0/1:2.0 up down aenet --> reth0.0xe-1/0/1:3.0 up down aenet --> reth0.0reth0 up downreth0.0 up down inet 192.0.2.1/24
Meaning
You can view the maximum number of configured child link interfaces of a reth bundle from four to eightin one chassis.
Verifying Chassis Cluster Control Links
Purpose
Verify information about the control interface in a chassis cluster configuration.
Action
From operational mode, enter the show chassis cluster interfaces command:
{primary:node0}user@host> show chassis cluster interfaces
Control link status: Down
Control interfaces: Index Interface Monitored-Status Internal-SA Security 0 em0 Down Disabled Disabled 1 em1 Down Disabled Disabled
Fabric link status: Down
Fabric interfaces: Name Child-interface Status Security (Physical/Monitored) fab0 xe-0/0/2 Up / Down Disabled fab0
119

Redundant-ethernet Information: Name Status Redundancy-group reth0 Down 1 reth1 Up 1 reth2 Down Not configured reth3 Down Not configured reth4 Down Not configured reth5 Down Not configured reth6 Down Not configured reth7 Down Not configured reth8 Down Not configured reth9 Down Not configured
Redundant-pseudo-interface Information: Name Status Redundancy-group lo0 Up 0
Release History Table
Release Description
12.1X45-D10 Starting with Junos OS Release 12.1X45-D10 and later, sampling features such as flow monitoring,packet capture, and port mirroring are supported on reth interfaces.
RELATED DOCUMENTATION
Example: Configure Chassis Clustering on SRX Series Devices | 122
Example: Enabling Eight-Queue Class of Service on Redundant Ethernet Interfaces on SRX SeriesDevices in a Chassis Cluster | 145
120

Configuring Chassis Clustering on SRX SeriesDevices
IN THIS SECTION
Example: Configure Chassis Clustering on SRX Series Devices | 122
Viewing a Chassis Cluster Configuration | 139
Viewing Chassis Cluster Statistics | 140
Clearing Chassis Cluster Statistics | 142
Understanding Automatic Chassis Cluster Synchronization Between Primary and Secondary Nodes | 143
Verifying Chassis Cluster Configuration Synchronization Status | 144
SRX Series Services gateways can be configured to operate in cluster mode, where a pair of devices canbe connected together and configured to operate like a single device to provide high availability. Whenconfigured as a chassis cluster, the two nodes back up each other, with one node acting as the primarydevice and the other as the secondary device, ensuring stateful failover of processes and services in theevent of system or hardware failure. If the primary device fails, the secondary device takes overprocessing of traffic.
For SRX300, SRX320, SRX340, SRX345, and SRX380 devices, connect ge-0/0/1 on node 0 to ge-0/0/1on node 1. The factory-default configuration does not include HA configuration. To enable HA, if thephysical interfaces used by HA have some configurations, these configurations need to be removed.Table 13 on page 121 lists the physical interfaces used by HA on SRX300, SRX320, SRX340, SRX345,and SRX380.
Table 13: Mapping Between HA Interface and Physical Interface on SRX300, SRX320, SRX340,SRX345, and SRX380
Device fxp0 Interface (HA MGT) fxp1 Interface (HA Control) Fab Interface
SRX300 ge-0/0/0 ge-0/0/1 User defined
SRX320 ge-0/0/0 ge-0/0/1 User defined
121

Table 13: Mapping Between HA Interface and Physical Interface on SRX300, SRX320, SRX340,SRX345, and SRX380 (Continued)
Device fxp0 Interface (HA MGT) fxp1 Interface (HA Control) Fab Interface
SRX340 dedicated ge-0/0/1 User defined
SRX345 dedicated ge-0/0/1 User defined
SRX380 dedicated ge-0/0/1 User defined
For more information, see the following topics:
Example: Configure Chassis Clustering on SRX Series Devices
IN THIS SECTION
Requirements | 122
Overview | 123
Configuration | 125
Verification | 134
This example shows how to set up chassis clustering on an SRX Series device (using SRX1500 asexample).
Requirements
Before you begin:
• Physically connect the two devices and ensure that they are the same models. For example, on theSRX1500 Services Gateway, connect the dedicated control ports on node 0 and node 1.
• Set the two devices to cluster mode and reboot the devices. You must enter the followingoperational mode commands on both devices, for example:
122

• On node 0:
user@host> set chassis cluster cluster-id 1 node 0 reboot
• On node 1:
user@host> set chassis cluster cluster-id 1 node 1 reboot
The cluster-id is the same on both devices, but the node ID must be different because one device isnode 0 and the other device is node 1. The range for the cluster-id is 0 through 255 and setting it to0 is equivalent to disabling cluster mode.
• After clustering occurs for the devices, continuing with the SRX1500 Services Gateway example, thege-0/0/0 interface on node 1 changes to ge-7/0/0.
After clustering occurs,
• For SRX300 devices, the ge-0/0/1 interface on node 1 changes to ge-1/0/1.
• For SRX320 devices, the ge-0/0/1 interface on node 1 changes to ge-3/0/1.
• For SRX340 and SRX345 devices, the ge-0/0/1 interface on node 1 changes to ge-5/0/1.
After the reboot, the following interfaces are assigned and repurposed to form a cluster:
• For SRX300 and SRX320 devices, ge-0/0/0 becomes fxp0 and is used for individual managementof the chassis cluster.
• SRX340 and SRX345 devices contain a dedicated port fxp0.
• For all SRX300, SRX320, SRX340, SRX345, and SRX380 devices, ge-0/0/1 becomes fxp1 and isused as the control link within the chassis cluster.
• The other interfaces are also renamed on the secondary device.
See "Understanding SRX Series Chassis Cluster Slot Numbering and Physical Port and LogicalInterface Naming" on page 18 for complete mapping of the SRX Series devices.
From this point forward, configuration of the cluster is synchronized between the node members andthe two separate devices function as one device.
Overview
This example shows how to set up chassis clustering on an SRX Series device using the SRX1500 deviceas example.
123

The node 1 renumbers its interfaces by adding the total number of system FPCs to the original FPCnumber of the interface. See Table 14 on page 124 for interface renumbering on the SRX Series device.
Table 14: SRX Series Services Gateways Interface Renumbering
SRX Series Services Gateway Renumbering Constant Node 0 Interface Name Node 1 Interface Name
SRX300 1 ge-0/0/0 ge-1/0/0
SRX320 3 ge-0/0/0 ge-3/0/0
SRX340
SRX345
SRX380
5 ge-0/0/0 ge-5/0/0
SRX550M 9 ge-0/0/0 ge-9/0/0
SRX1500 7 ge-0/0/0 ge-7/0/0
After clustering is enabled, the system creates fxp0, fxp1, and em0 interfaces. Depending on the device,the fxp0, fxp1, and em0 interfaces that are mapped to a physical interface are not user defined.However, the fab interface is user defined.
124

Figure 28 on page 125 shows the topology used in this example.
Figure 28: SRX Series Devices (SRX1500) In Chassis Cluster
Configuration
IN THIS SECTION
Procedure | 125
Procedure
CLI Quick Configuration
To quickly configure a chassis cluster on an SRX1500 Services Gateway, copy the following commandsand paste them into the CLI:
125

On {primary:node0}
[edit]set groups node0 system host-name srx1500-1set groups node0 interfaces fxp0 unit 0 family inet address 192.16.35.46/24set groups node1 system host-name srx1500-2set groups node1 interfaces fxp0 unit 0 family inet address 192.16.35.47/24set groups node0 system backup-router <backup next-hop from fxp0> destination <management network/mask>set groups node1 system backup-router <backup next-hop from fxp0> destination <management network/mask>set apply-groups "${node}"set interfaces fab0 fabric-options member-interfaces ge-0/0/1set interfaces fab1 fabric-options member-interfaces ge-7/0/1set chassis cluster redundancy-group 0 node 0 priority 100set chassis cluster redundancy-group 0 node 1 priority 1set chassis cluster redundancy-group 1 node 0 priority 100set chassis cluster redundancy-group 1 node 1 priority 1set chassis cluster redundancy-group 1 interface-monitor ge-0/0/5 weight 255set chassis cluster redundancy-group 1 interface-monitor ge-0/0/4 weight 255set chassis cluster redundancy-group 1 interface-monitor ge-7/0/5 weight 255set chassis cluster redundancy-group 1 interface-monitor ge-7/0/4 weight 255set chassis cluster reth-count 2set interfaces ge-0/0/5 gigether-options redundant-parent reth1set interfaces ge-7/0/5 gigether-options redundant-parent reth1set interfaces reth1 redundant-ether-options redundancy-group 1set interfaces reth1 unit 0 family inet address 203.0.113.233/24set interfaces ge-0/0/4 gigether-options redundant-parent reth0set interfaces ge-7/0/4 gigether-options redundant-parent reth0set interfaces reth0 redundant-ether-options redundancy-group 1set interfaces reth0 unit 0 family inet address 198.51.100.1/24set security zones security-zone Untrust interfaces reth1.0set security zones security-zone Trust interfaces reth0.0
If you are configuring SRX300, SRX320, SRX340, SRX345, SRX380 and SRX550M devices, see Table 15on page 127 for command and interface settings for your device and substitute these commands intoyour CLI.
126

Table 15: SRX Series Services Gateways Interface Settings
Command SRX300 SRX320 SRX340
SRX345
SRX380
SRX550M
set interfaces fab0fabric-options member-interfaces
ge-0/0/2 ge-0/0/2 ge-0/0/2 ge-0/0/2
set interfaces fab1fabric-options member-interfaces
ge-1/0/2 ge-3/0/2 ge-5/0/2 ge-9/0/2
set chassis clusterredundancy-group 1interface-monitor
ge-0/0/3 weight 255 ge-0/0/3 weight 255 ge-0/0/3 weight 255 ge-1/0/0 weight 255
set chassis clusterredundancy-group 1interface-monitor
ge-0/0/4 weight 255 ge-0/0/4 weight 255 ge-0/0/4 weight 255 ge-10/0/0 weight255
set chassis clusterredundancy-group 1interface-monitor
ge-1/0/3 weight 255 ge-3/0/3 weight 255 ge-5/0/3 weight 255 ge-1/0/1 weight 255
set chassis clusterredundancy-group 1interface-monitor
ge-1/0/4 weight 255 ge-3/0/4 weight 255 ge-5/0/4 weight 255 ge-10/0/1 weight255
set interfaces ge-0/0/3 gigether-options redundant-parent reth0
ge-0/0/3 gigether-options redundant-parent reth0
ge-0/0/3 gigether-options redundant-parent reth0
ge-1/0/0 gigether-options redundant-parent reth1
127

Table 15: SRX Series Services Gateways Interface Settings (Continued)
Command SRX300 SRX320 SRX340
SRX345
SRX380
SRX550M
set interfaces ge-0/0/4 gigether-options redundant-parent reth1
ge-0/0/4 gigether-options redundant-parent reth1
ge-0/0/4 gigether-options redundant-parent reth1
ge-10/0/0 gigether-options redundant-parent reth1
set interfaces ge-1/0/3 gigether-options redundant-parent reth0
ge-3/0/3 gigether-options redundant-parent reth0
ge-5/0/3 gigether-options redundant-parent reth0
ge-1/0/1 gigether-options redundant-parent reth0
set interfaces ge-1/0/4 gigether-options redundant-parent reth1
ge-3/0/4 gigether-options redundant-parent reth1
ge-5/0/4 gigether-options redundant-parent reth1
ge-10/0/1 gigether-options redundant-parent reth0
Step-by-Step Procedure
The following example requires you to navigate various levels in the configuration hierarchy. Forinstructions on how to do that, see Using the CLI Editor in Configuration Mode in the CLI User Guide.
To configure a chassis cluster on an SRX Series device:
Perform Steps 1 through 5 on the primary device (node 0). They are automatically copied over to thesecondary device (node 1) when you execute a commit command. The configurations are synchronizedbecause the control link and fab link interfaces are activated. To verify the configurations, use the showinterface terse command and review the output.
1. Set up hostnames and management IP addresses for each device using configuration groups. Theseconfigurations are specific to each device and are unique to its specific node.
user@host# set groups node0 system host-name srx1500-1user@host# set groups node0 interfaces fxp0 unit 0 family inet address 192.16.35.46/24user@host# set groups node1 system host-name srx1500-2user@host# set groups node1 interfaces fxp0 unit 0 family inet address 192.16.35.47/24
128

Set the default route and backup router for each node.
user@host# set groups node0 system backup-router <backup next-hop from fxp0> destination <management network/mask>user@host# set groups node1 system backup-router <backup next-hop from fxp0> destination <management network/mask>
Set the apply-group command so that the individual configurations for each node set by the previouscommands are applied only to that node.
user@host# set apply-groups "${node}"
2. Define the interfaces used for the fab connection (data plane links for RTO sync) by using physicalports ge-0/0/1 from each node. These interfaces must be connected back-to-back, or through aLayer 2 infrastructure.
user@host# set interfaces fab0 fabric-options member-interfaces ge-0/0/1user@host# set interfaces fab1 fabric-options member-interfaces ge-7/0/1
3. Set up redundancy group 0 for the Routing Engine failover properties, and set up redundancy group1 (all interfaces are in one redundancy group in this example) to define the failover properties for theredundant Ethernet interfaces.
user@host# set chassis cluster redundancy-group 0 node 0 priority 100user@host# set chassis cluster redundancy-group 0 node 1 priority 1user@host# set chassis cluster redundancy-group 1 node 0 priority 100user@host# set chassis cluster redundancy-group 1 node 1 priority 1
4. Set up interface monitoring to monitor the health of the interfaces and trigger redundancy groupfailover.
We do not recommend Interface monitoring for redundancy group 0 because it causes the controlplane to switch from one node to another node in case interface flap occurs.
user@host# set chassis cluster redundancy-group 1 interface-monitor ge-0/0/5 weight 255user@host# set chassis cluster redundancy-group 1 interface-monitor ge-0/0/4 weight 255user@host# set chassis cluster redundancy-group 1 interface-monitor ge-7/0/5 weight 255user@host# set chassis cluster redundancy-group 1 interface-monitor ge-7/0/4 weight 255
129

Interface failover only occurs after the weight reaches 0.
5. Set up the redundant Ethernet (reth) interfaces and assign the redundant interface to a zone.
user@host# set chassis cluster reth-count 2user@host# set interfaces ge-0/0/5 gigether-options redundant-parent reth1user@host# set interfaces ge-7/0/5 gigether-options redundant-parent reth1user@host# set interfaces reth1 redundant-ether-options redundancy-group 1user@host# set interfaces reth1 unit 0 family inet address 203.0.113.233/24user@host# set interfaces ge-0/0/4 gigether-options redundant-parent reth0user@host# set interfaces ge-7/0/4 gigether-options redundant-parent reth0user@host# set interfaces reth0 redundant-ether-options redundancy-group 1user@host# set interfaces reth0 unit 0 family inet address 198.51.100.1/24user@host# set security zones security-zone Untrust interfaces reth1.0user@host# set security zones security-zone Trust interfaces reth0.0
Results
From operational mode, confirm your configuration by entering the show configuration command. If theoutput does not display the intended configuration, repeat the configuration instructions in this exampleto correct it.
For brevity, this show command output includes only the configuration that is relevant to this example.Any other configuration on the system has been replaced with ellipses (...).
> show configurationversion x.xx.x;groups { node0 { system { host-name SRX1500-1; backup-router 10.100.22.1 destination 66.129.243.0/24; } interfaces { fxp0 { unit 0 { family inet { address 192.16.35.46/24; } } }
130

} } node1 { system { host-name SRX1500-2; backup-router 10.100.21.1 destination 66.129.243.0/24; } interfaces { fxp0 { unit 0 { family inet { address 192.16.35.47/24; } } } } }}apply-groups "${node}";chassis { cluster { reth-count 2; redundancy-group 0 { node 0 priority 100; node 1 priority 1; } redundancy-group 1 { node 0 priority 100; node 1 priority 1; interface-monitor { ge–0/0/5 weight 255; ge–0/0/4 weight 255; ge–7/0/5 weight 255; ge–7/0/4 weight 255; } } }}interfaces { ge–0/0/5 { gigether–options { redundant–parent reth1; } }
131
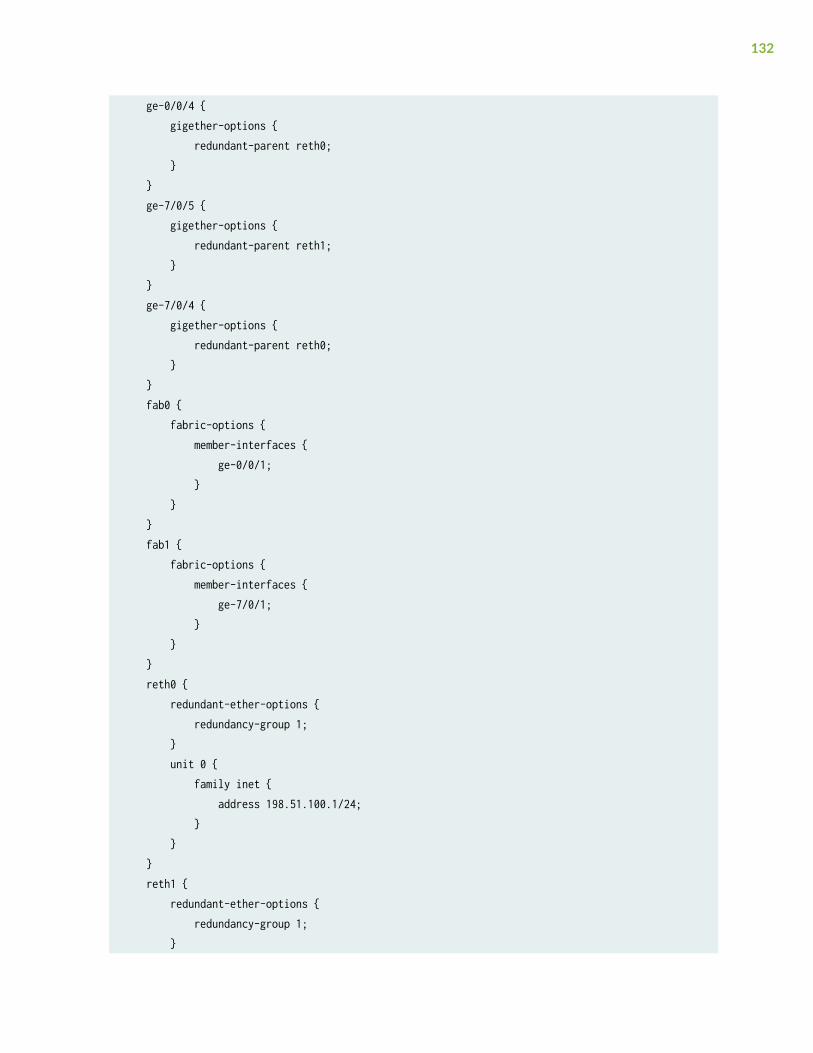
ge–0/0/4 { gigether–options { redundant–parent reth0; } } ge–7/0/5 { gigether–options { redundant–parent reth1; } } ge–7/0/4 { gigether–options { redundant–parent reth0; } } fab0 { fabric–options { member–interfaces { ge–0/0/1; } } } fab1 { fabric–options { member–interfaces { ge–7/0/1; } } } reth0 { redundant–ether–options { redundancy–group 1; } unit 0 { family inet { address 198.51.100.1/24; } } } reth1 { redundant–ether–options { redundancy–group 1; }
132

unit 0 { family inet { address 203.0.113.233/24; } } }}...security { zones { security–zone Untrust { interfaces { reth1.0; } } security–zone Trust { interfaces { reth0.0; } } } policies { from–zone Trust to–zone Untrust { policy 1 { match { source–address any; destination–address any; application any; } then { permit; } } } }}
If you are done configuring the device, enter commit from configuration mode.
133

Verification
IN THIS SECTION
Verifying Chassis Cluster Status | 134
Verifying Chassis Cluster Interfaces | 135
Verifying Chassis Cluster Statistics | 135
Verifying Chassis Cluster Control Plane Statistics | 136
Verifying Chassis Cluster Data Plane Statistics | 137
Verifying Chassis Cluster Redundancy Group Status | 138
Troubleshooting with Logs | 138
Confirm that the configuration is working properly.
Verifying Chassis Cluster Status
Purpose
Verify the chassis cluster status, failover status, and redundancy group information.
Action
From operational mode, enter the show chassis cluster status command.
{primary:node0}user@host# show chassis cluster statusCluster ID: 1Node Priority Status Preempt Manual failover
Redundancy group: 0 , Failover count: 1 node0 100 primary no no node1 1 secondary no no
Redundancy group: 1 , Failover count: 1 node0 0 primary no no node1 0 secondary no no
134

Verifying Chassis Cluster Interfaces
Purpose
Verify information about chassis cluster interfaces.
Action
From operational mode, enter the show chassis cluster interfaces command.
{primary:node0}user@host> show chassis cluster interfacesControl link name: em0
Redundant-ethernet Information: Name Status Redundancy-group reth0 Up 1 reth1 Up 1
Interface Monitoring: Interface Weight Status Redundancy-group ge-7/0/5 255 Up 1 ge-7/0/4 255 Up 1 ge-0/0/5 255 Up 1 ge-0/0/4 255 Up 1
Verifying Chassis Cluster Statistics
Purpose
Verify information about the statistics of the different objects being synchronized, the fabric and controlinterface hellos, and the status of the monitored interfaces in the cluster.
Action
From operational mode, enter the show chassis cluster statistics command.
{primary:node0}user@host> show chassis cluster statistics
135

Control link statistics: Control link 0: Heartbeat packets sent: 2276 Heartbeat packets received: 2280 Heartbeat packets errors: 0Fabric link statistics: Child link 0 Probes sent: 2272 Probes received: 597Services Synchronized: Service name RTOs sent RTOs received Translation context 0 0 Incoming NAT 0 0 Resource manager 6 0 Session create 161 0 Session close 148 0 Session change 0 0 Gate create 0 0 Session ageout refresh requests 0 0 Session ageout refresh replies 0 0 IPSec VPN 0 0 Firewall user authentication 0 0 MGCP ALG 0 0 H323 ALG 0 0 SIP ALG 0 0 SCCP ALG 0 0 PPTP ALG 0 0 RPC ALG 0 0 RTSP ALG 0 0 RAS ALG 0 0 MAC address learning 0 0 GPRS GTP 0 0
Verifying Chassis Cluster Control Plane Statistics
Purpose
Verify information about chassis cluster control plane statistics (heartbeats sent and received) and thefabric link statistics (probes sent and received).
136

Action
From operational mode, enter the show chassis cluster control-plane statistics command.
{primary:node0}user@host> show chassis cluster control-plane statistics
Control link statistics: Control link 0: Heartbeat packets sent: 2294 Heartbeat packets received: 2298 Heartbeat packets errors: 0Fabric link statistics: Child link 0 Probes sent: 2290 Probes received: 615
Verifying Chassis Cluster Data Plane Statistics
Purpose
Verify information about the number of RTOs sent and received for services.
Action
From operational mode, enter the show chassis cluster data-plane statistics command.
{primary:node0}user@host> show chassis cluster data-plane statistics
Services Synchronized: Service name RTOs sent RTOs received Translation context 0 0 Incoming NAT 0 0 Resource manager 6 0 Session create 161 0 Session close 148 0 Session change 0 0 Gate create 0 0 Session ageout refresh requests 0 0
137

Session ageout refresh replies 0 0 IPSec VPN 0 0 Firewall user authentication 0 0 MGCP ALG 0 0 H323 ALG 0 0 SIP ALG 0 0 SCCP ALG 0 0 PPTP ALG 0 0 RPC ALG 0 0 RTSP ALG 0 0 RAS ALG 0 0 MAC address learning 0 0 GPRS GTP 0 0
Verifying Chassis Cluster Redundancy Group Status
Purpose
Verify the state and priority of both nodes in a cluster and information about whether the primary nodehas been preempted or whether there has been a manual failover.
Action
From operational mode, enter the chassis cluster status redundancy-group command.
{primary:node0}user@host> show chassis cluster status redundancy-group 1Cluster ID: 1 Node Priority Status Preempt Manual failover
Redundancy group: 1, Failover count: 1 node0 100 primary no no node1 50 secondary no no
Troubleshooting with Logs
Purpose
Use these logs to identify any chassis cluster issues. You should run these logs on both nodes.
138

Action
From operational mode, enter these show log commands.
user@host> show log jsrpduser@host> show log chassisduser@host> show log messagesuser@host> show log dcduser@host> show traceoptions
SEE ALSO
Understanding SRX Series Chassis Cluster Slot Numbering and Physical Port and Logical InterfaceNaming | 18
Viewing a Chassis Cluster Configuration
IN THIS SECTION
Purpose | 139
Action | 139
Purpose
Display chassis cluster verification options.
Action
From the CLI, enter the show chassis cluster ? command:
{primary:node1}user@host> show chassis cluster ?Possible completions: interfaces Display chassis-cluster interfaces
139

statistics Display chassis-cluster traffic statistics status Display chassis-cluster status
Viewing Chassis Cluster Statistics
IN THIS SECTION
Purpose | 140
Action | 140
Purpose
Display information about chassis cluster services and interfaces.
Action
From the CLI, enter the show chassis cluster statistics command:
{primary:node1}user@host> show chassis cluster statistics
Control link statistics: Control link 0: Heartbeat packets sent: 798 Heartbeat packets received: 784Fabric link statistics: Child link 0 Probes sent: 793 Probes received: 0Services Synchronized: Service name RTOs sent RTOs received Translation context 0 0 Incoming NAT 0 0 Resource manager 0 0 Session create 0 0
140

Session close 0 0 Session change 0 0 Gate create 0 0 Session ageout refresh requests 0 0 Session ageout refresh replies 0 0 IPSec VPN 0 0 Firewall user authentication 0 0 MGCP ALG 0 0 H323 ALG 0 0 SIP ALG 0 0 SCCP ALG 0 0 PPTP ALG 0 0 RTSP ALG 0 0
{primary:node1}user@host> show chassis cluster statistics
Control link statistics: Control link 0: Heartbeat packets sent: 258689 Heartbeat packets received: 258684 Control link 1: Heartbeat packets sent: 258689 Heartbeat packets received: 258684Fabric link statistics: Child link 0 Probes sent: 258681 Probes received: 258681 Child link 1 Probes sent: 258501 Probes received: 258501Services Synchronized: Service name RTOs sent RTOs received Translation context 0 0 Incoming NAT 0 0 Resource manager 0 0 Session create 1 0 Session close 1 0 Session change 0 0 Gate create 0 0 Session ageout refresh requests 0 0
141

Session ageout refresh replies 0 0 IPSec VPN 0 0 Firewall user authentication 0 0 MGCP ALG 0 0 H323 ALG 0 0 SIP ALG 0 0 SCCP ALG 0 0 PPTP ALG 0 0 RPC ALG 0 0 RTSP ALG 0 0 RAS ALG 0 0 MAC address learning 0 0 GPRS GTP 0 0
{primary:node1}user@host> show chassis cluster statistics
Control link statistics: Control link 0: Heartbeat packets sent: 82371 Heartbeat packets received: 82321 Control link 1: Heartbeat packets sent: 0 Heartbeat packets received: 0
Clearing Chassis Cluster Statistics
To clear displayed information about chassis cluster services and interfaces, enter the clear chassiscluster statistics command from the CLI:
{primary:node1}user@host> clear chassis cluster statistics
Cleared control-plane statisticsCleared data-plane statistics
142

Understanding Automatic Chassis Cluster Synchronization BetweenPrimary and Secondary Nodes
When you set up an SRX Series chassis cluster, the SRX Series devices must be identical, including theirconfiguration. The chassis cluster synchronization feature automatically synchronizes the configurationfrom the primary node to the secondary node when the secondary joins the primary as a cluster. Byeliminating the manual work needed to ensure the same configurations on each node in the cluster, thisfeature reduces expenses.
If you want to disable automatic chassis cluster synchronization between the primary and secondarynodes, you can do so by entering the set chassis cluster configuration-synchronize no-secondary-bootup-autocommand in configuration mode.
At any time, to reenable automatic chassis cluster synchronization, use the delete chassis clusterconfiguration-synchronize no-secondary-bootup-auto command in configuration mode.
To see whether the automatic chassis cluster synchronization is enabled or not, and to see the status ofthe synchronization, enter the show chassis cluster information configuration-synchronization operationalcommand.
Either the entire configuration from the primary node is applied successfully to the secondary node, orthe secondary node retains its original configuration. There is no partial synchronization.
If you create a cluster with cluster IDs greater than 16, and then decide to roll back to a previous releaseimage that does not support extended cluster IDs, the system comes up as standalone.
If you have a cluster set up and running with an earlier release of Junos OS, you can upgrade to JunosOS Release 12.1X45-D10 and re-create a cluster with cluster IDs greater than 16. However, if for anyreason you decide to revert to the previous version of Junos OS that did not support extended clusterIDs, the system comes up with standalone devices after you reboot. However, if the cluster ID set is lessthan 16 and you roll back to a previous release, the system will come back with the previous setup.
SEE ALSO
NTP Time Synchronization on SRX Series Devices | 353
143

Verifying Chassis Cluster Configuration Synchronization Status
IN THIS SECTION
Purpose | 144
Action | 144
Purpose
Display the configuration synchronization status of a chassis "Understanding Automatic Chassis ClusterSynchronization Between Primary and Secondary Nodes" on page 143cluster.
Action
From the CLI, enter the show chassis cluster information configuration-synchronization command:
{primary:node0}user@host> show chassis cluster information configuration-synchronization
node0:--------------------------------------------------------------------------
Configuration Synchronization: Status: Activation status: Enabled Last sync operation: Auto-Sync Last sync result: Not needed Last sync mgd messages:
Events: Mar 5 01:48:53.662 : Auto-Sync: Not needed.
node1:--------------------------------------------------------------------------
Configuration Synchronization: Status:
144

Activation status: Enabled Last sync operation: Auto-Sync Last sync result: Succeeded Last sync mgd messages: mgd: rcp: /config/juniper.conf: No such file or directory mgd: commit complete
Events: Mar 5 01:48:55.339 : Auto-Sync: In progress. Attempt: 1 Mar 5 01:49:40.664 : Auto-Sync: Succeeded. Attempt: 1
SEE ALSO
show chassis cluster information configuration-synchronization | 797
RELATED DOCUMENTATION
Preparing Your Equipment for Chassis Cluster Formation | 31
Connecting SRX Series Devices to Create a Chassis Cluster | 35
SRX Series Chassis Cluster Configuration Overview | 13
Example: Enabling Eight-Queue Class of Service onRedundant Ethernet Interfaces on SRX SeriesDevices in a Chassis Cluster
IN THIS SECTION
Requirements | 146
Overview | 146
Configuration | 148
Verification | 156
145
This example shows how to enable eight-queue CoS on redundant Ethernet interfaces on SRX Seriesdevices in a chassis cluster. This example is applicable to SRX5800, SRX5600, SRX5400, SRX4200, andSRX4100. The eight-queue CoS is also supported on redundant Ethernet interfaces for branch SRXdevices in a chassis cluster. The SRX Series for the branch support eight queues, but only four queuesare enabled by default.
Requirements
This example uses the following hardware and software components:
• Two SRX5600 Service Gateways in a chassis cluster
• Junos OS Release 11.4R4 or later for SRX Series Services Gateways
Before you begin:
• Understand chassis cluster configuration. See "Example: Configuring an Active/Passive ChassisCluster on SRX5800 Devices" on page 362.
• Understand chassis cluster redundant interface configuration. See "Example: Configuring ChassisCluster Redundant Ethernet Interfaces" on page 105.
Overview
IN THIS SECTION
Topology | 147
The SRX Series devices support eight queues, but only four queues are enabled by default. Use the setchassis fpc x pic y max-queues-per-interface 8 command to enable eight queues explicitly at the chassislevel. The values of x and y depends on the location of the IOC and the PIC number where the interfaceis located on the device on which CoS needs to be implemented. To find the IOC location use the showchassis fpc pic-status or show chassis hardware commands.
You must restart the chassis control for the configuration to take effect.
On SRX Series devices, eight QoS queues are supported per ae interface.
146

Figure 29 on page 147 shows how to configure eight-queue CoS on redundant Ethernet interfaces onSRX Series devices in a chassis cluster.
Topology
Figure 29: Eight-Queue CoS on Redundant Ethernet Interfaces
147

Configuration
IN THIS SECTION
Procedure | 148
Procedure
CLI Quick Configuration
To quickly configure this example, copy the following commands, paste them into a text file, remove anyline breaks, change any details necessary to match your network configuration, copy and paste thecommands into the CLI at the [edit] hierarchy level, and then enter commit from configuration mode.
set chassis fpc 5 pic 1 max-queues-per-interface 8set chassis fpc 5 pic 1 max-queues-per-interface 8 set chassis cluster reth-count 2 set chassis cluster control-ports fpc 4 port 0 set chassis cluster control-ports fpc 10 port 0 set chassis cluster redundancy-group 0 node 0 priority 254 set chassis cluster redundancy-group 0 node 1 priority 1 set chassis cluster redundancy-group 1 node 0 priority 200 set chassis cluster redundancy-group 1 node 1 priority 100 set interfaces ge-5/1/14 gigether-options redundant-parent reth0 set interfaces ge-5/1/15 gigether-options redundant-parent reth1 set interfaces ge-11/1/14 gigether-options redundant-parent reth0 set interfaces ge-11/1/15 gigether-options redundant-parent reth1 set interfaces reth0 vlan-tagging set interfaces reth0 redundant-ether-options redundancy-group 1 set interfaces reth0 unit 0 vlan-id 1350 set interfaces reth0 unit 0 family inet address 192.0.2.1/24 set interfaces reth1 hierarchical-scheduler set interfaces reth1 vlan-tagging set interfaces reth1 redundant-ether-options redundancy-group 2 set interfaces reth1 unit 0 vlan-id 1351 set interfaces reth1 unit 0 family inet address 192.0.2.2/24 set interfaces reth1 unit 1 vlan-id 1352 set interfaces reth1 unit 1 family inet address 192.0.2.3/24
148

set interfaces reth1 unit 2 vlan-id 1353 set interfaces reth1 unit 2 family inet address 192.0.2.4/24 set interfaces reth1 unit 3 vlan-id 1354 set interfaces reth1 unit 3 family inet address 192.0.2.5/24 set class-of-service classifiers inet-precedence inet_prec_4 forwarding-class q0 loss-priority low code-points 000 set class-of-service classifiers inet-precedence inet_prec_4 forwarding-class q2 loss-priority low code-points 010 set class-of-service classifiers inet-precedence inet_prec_4 forwarding-class q3 loss-priority low code-points 011 set class-of-service classifiers inet-precedence inet_prec_4 forwarding-class q1 loss-priority low code-points 001 set class-of-service classifiers inet-precedence inet_prec_4 forwarding-class q4 loss-priority low code-points 100 set class-of-service classifiers inet-precedence inet_prec_4 forwarding-class q5 loss-priority low code-points 101 set class-of-service classifiers inet-precedence inet_prec_4 forwarding-class q6 loss-priority low code-points 110 set class-of-service classifiers inet-precedence inet_prec_4 forwarding-class q7 loss-priority low code-points 111 set class-of-service forwarding-classes queue 0 q0 set class-of-service forwarding-classes queue 1 q1 set class-of-service forwarding-classes queue 2 q2 set class-of-service forwarding-classes queue 3 q3 set class-of-service forwarding-classes queue 4 q4 set class-of-service forwarding-classes queue 5 q5 set class-of-service forwarding-classes queue 6 q6 set class-of-service forwarding-classes queue 7 q7 set class-of-service traffic-control-profiles 1 scheduler-map sched_map set class-of-service traffic-control-profiles 1 shaping-rate 200m set class-of-service interfaces reth0 unit 0 classifiers inet-precedence inet_prec_4 set class-of-service interfaces reth1 unit 0 output-traffic-control-profile 1 set class-of-service scheduler-maps sched_map forwarding-class q0 scheduler S0 set class-of-service scheduler-maps sched_map forwarding-class q1 scheduler S1 set class-of-service scheduler-maps sched_map forwarding-class q2 scheduler S2 set class-of-service scheduler-maps sched_map forwarding-class q3 scheduler S3 set class-of-service scheduler-maps sched_map forwarding-class q4 scheduler S4 set class-of-service scheduler-maps sched_map forwarding-class q5 scheduler S5 set class-of-service scheduler-maps sched_map forwarding-class q6 scheduler S6 set class-of-service scheduler-maps sched_map forwarding-class q7 scheduler S7 set class-of-service schedulers S0 transmit-rate percent 20 set class-of-service schedulers S1 transmit-rate percent 5 set class-of-service schedulers S2 transmit-rate percent 5
149

set class-of-service schedulers S3 transmit-rate percent 10 set class-of-service schedulers S4 transmit-rate percent 10 set class-of-service schedulers S5 transmit-rate percent 10 set class-of-service schedulers S6 transmit-rate percent 10 set class-of-service schedulers S7 transmit-rate percent 30
Step-by-Step Procedure
The following example requires you to navigate various levels in the configuration hierarchy. Forinstructions on how to do that, see Using the CLI Editor in Configuration Mode in the CLI User Guide.
To enable eight-queue CoS on redundant Ethernet interfaces:
1. Configure a maximum of eight queues on the interfaces on Node 0 and Node 1.
[edit chassis]user@host# set fpc 5 pic 1 max-queues-per-interface 8
In addition to configuring eight queues at the [edit chassis] hierarchy level, the configuration at the[edit class-of-service] hierarchy level must support eight queues per interface.
2. Specify the number of redundant Ethernet interfaces.
[edit chassis cluster]user@host# set reth-count 2
3. Configure the control ports.
[edit chassis cluster]user@host# set control-ports fpc 4 port 0user@host# set control-ports fpc 10 port 0
4. Configure redundancy groups.
[edit chassis cluster]user@host# set redundancy-group 0 node 0 priority 254user@host# set redundancy-group 0 node 1 priority 1user@host# set redundancy-group 1 node 0 priority 200user@host# set redundancy-group 1 node 1 priority 100
150

5. Configure the redundant Ethernet interfaces.
[edit interfaces]user@host# set ge-5/1/14 gigether-options redundant-parent reth0user@host# set ge-11/1/14 gigether-options redundant-parent reth0user@host# set ge-5/1/15 gigether-options redundant-parent reth1user@host# set ge-11/1/15 gigether-options redundant-parent reth1user@host# set reth0 redundant-ether-options redundancy-group 1user@host# set reth0 vlan-tagginguser@host# set reth0 unit 0 vlan-id 1350user@host# set reth0 unit 0 family inet address 192.0.2.1/24user@host# set reth1 hierarchical-scheduleruser@host# set reth1 vlan-tagginguser@host# set reth1 redundant-ether-options redundancy-group 2user@host# set reth1 unit 0 vlan-id 1351user@host# set reth1 unit 0 family inet address 192.0.2.2/24user@host# set reth1 unit 1 vlan-id 1352user@host# set reth1 unit 1 family inet address 192.0.2.3/24user@host# set reth1 unit 2 vlan-id 1353user@host# set reth1 unit 2 family inet address 192.0.2.4/24user@host# set reth1 unit 3 vlan-id 1354user@host# set reth1 unit 3 family inet address 192.0.2.5/24
6. Define a classifier and apply it to a logical interface.
[edit class-of-service]user@host# set classifiers inet-precedence inet_prec_4 forwarding-class q0 loss-priority low code-points 000user@host# set classifiers inet-precedence inet_prec_4 forwarding-class q2 loss-priority low code-points 010user@host# set classifiers inet-precedence inet_prec_4 forwarding-class q3 loss-priority low code-points 011user@host# set classifiers inet-precedence inet_prec_4 forwarding-class q1 loss-priority low code-points 001user@host# set classifiers inet-precedence inet_prec_4 forwarding-class q4 loss-priority low code-points 100user@host# set classifiers inet-precedence inet_prec_4 forwarding-class q5 loss-priority low code-points 101user@host# set classifiers inet-precedence inet_prec_4 forwarding-class q6 loss-priority low code-points 110
151

user@host# set classifiers inet-precedence inet_prec_4 forwarding-class q7 loss-priority low code-points 111
7. Map forwarding classes to CoS queues.
[edit class-of-service]user@host# set forwarding-classes queue 0 q0user@host# set forwarding-classes queue 1 q1user@host# set forwarding-classes queue 2 q2user@host# set forwarding-classes queue 3 q3user@host# set forwarding-classes queue 4 q4user@host# set forwarding-classes queue 5 q5user@host# set forwarding-classes queue 6 q6user@host# set forwarding-classes queue 7 q7
8. Configure traffic control profiles.
[edit class-of-service]user@host# set traffic-control-profiles 1 scheduler-map sched_mapuser@host# set traffic-control-profiles 1 shaping-rate 200m
9. Define packet flow through the CoS elements.
[edit class-of-service]user@host# set interfaces reth0 unit 0 classifiers inet-precedence inet_prec_4
10. Apply a traffic scheduling profile to the interface.
[edit class-of-service]user@host# set interfaces reth1 unit 0 output-traffic-control-profile 1
11. Configure the CoS schedulers.
[edit class-of-service]user@host# set scheduler-maps sched_map forwarding-class q0 scheduler S0user@host# set scheduler-maps sched_map forwarding-class q1 scheduler S1user@host# set scheduler-maps sched_map forwarding-class q2 scheduler S2user@host# set scheduler-maps sched_map forwarding-class q3 scheduler S3
152

user@host# set scheduler-maps sched_map forwarding-class q4 scheduler S4user@host# set scheduler-maps sched_map forwarding-class q5 scheduler S5user@host# set scheduler-maps sched_map forwarding-class q6 scheduler S6user@host# set scheduler-maps sched_map forwarding-class q7 scheduler S7user@host# set schedulers S0 transmit-rate percent 20user@host# set schedulers S1 transmit-rate percent 5user@host# set schedulers S2 transmit-rate percent 5user@host# set schedulers S3 transmit-rate percent 10user@host# set schedulers S4 transmit-rate percent 10user@host# set schedulers S5 transmit-rate percent 10user@host# set schedulers S6 transmit-rate percent 10user@host# set schedulers S7 transmit-rate percent 30
Results
From configuration mode, confirm your configuration by entering the show class-of-service command. Ifthe output does not display the intended configuration, repeat the configuration instructions in thisexample to correct it.
For brevity, this show command output includes only the configuration that is relevant to this example.Any other configuration on the system has been replaced with ellipses (...).
[edit]user@host# show class-of-serviceclassifiers { inet-precedence inet_prec_4 { forwarding-class q0 { loss-priority low code-points 000; } forwarding-class q2 { loss-priority low code-points 010; } forwarding-class q3 { loss-priority low code-points 011; } forwarding-class q1 { loss-priority low code-points 001; } forwarding-class q4 { loss-priority low code-points 100; } forwarding-class q5 {
153

loss-priority low code-points 101; } forwarding-class q6 { loss-priority low code-points 110; } forwarding-class q7 { loss-priority low code-points 111; } }}forwarding-classes { queue 0 q0; queue 1 q1; queue 2 q2; queue 3 q3; queue 4 q4; queue 5 q5; queue 6 q6; queue 7 q7;}traffic-control-profiles { 1 { scheduler-map sched_map; shaping-rate 200m; }}interfaces { reth0 { unit 0 { classifiers { inet-precedence inet_prec_4; } } } reth1 { unit 0 { output-traffic-control-profile 1; } }}scheduler-maps { sched_map { forwarding-class q0 scheduler S0;
154

forwarding-class q1 scheduler S1; forwarding-class q2 scheduler S2; forwarding-class q3 scheduler S3; forwarding-class q4 scheduler S4; forwarding-class q5 scheduler S5; forwarding-class q6 scheduler S6; forwarding-class q7 scheduler S7; }}schedulers { S0 { transmit-rate percent 20; } S1 { transmit-rate percent 5; } S2 { transmit-rate percent 5; } S3 { transmit-rate percent 10; } S4 { transmit-rate percent 10; } S5 { transmit-rate percent 10; } S6 { transmit-rate percent 10; } S7 { transmit-rate percent 30; }}
If you are done configuring the device, enter commit from configuration mode.
To restart chassis control, enter restart chassis-control command from operational mode.
When you execute the restart chassis-control command all the FRU cards on the box are reset, thusimpacting traffic. Changing the number of queues must be executed during a scheduled downtime. Ittakes 5-10 minutes for the cards to come online after the restart chassis-control command is executed.
155
Verification
IN THIS SECTION
Verifying the Eight-Queue COS Configuration | 156
Verifying the Eight-Queue COS Configuration
Purpose
Verify that eight-queue CoS is enabled properly.
Action
From the operational mode, enter the following commands:
• show interfaces ge-5/1/14 extensive
• show interfaces queue ge-5/1/14
• show class-of-service forwarding-class
• show class-of-service interface ge-5/1/14
RELATED DOCUMENTATION
SRX Series Chassis Cluster Configuration Overview | 13
Chassis Cluster Redundant Ethernet Interfaces | 101
156

Conditional Route Advertisement over RedundantEthernet Interfaces on SRX Series Devices in aChassis Cluster
IN THIS SECTION
Understanding Conditional Route Advertising in a Chassis Cluster | 157
Example: Configuring Conditional Route Advertising in a Chassis Cluster | 158
Conditional route advertising allows you to add criteria on route advertisements before they areinstalled in the route table or advertised to peers and neighbors. The goal of conditional routeadvertisement in a chassis cluster is to ensure that incoming traffic from the upstream network arriveson the node that is on the currently active redundant Ethernet interface. For more information, see thefollowing topics:
Understanding Conditional Route Advertising in a Chassis Cluster
Route advertisement over redundant Ethernet interfaces in a chassis cluster is complicated by the factthat the active node in the cluster can change dynamically. Conditional route advertisement enables youto advertise routes in such a way that incoming traffic from the core network is attracted to the BorderGateway Protocol (BGP) interface that exists on the same node as the currently active redundantEthernet interface. In this way, traffic is processed by the active node and does not traverse the fabricinterface between nodes. You do this by manipulating the BGP attribute at the time routes areadvertised by BGP.
The goal of conditional route advertisement in a chassis cluster is to ensure that incoming traffic fromthe upstream network arrives on the node that is on the currently active redundant Ethernet interface.To understand how this works, keep in mind that in a chassis cluster, each node has its own set ofinterfaces.
SEE ALSO
Example: Configuring Conditional Route Advertising in a Chassis Cluster | 158
157

Viewing a Chassis Cluster Configuration | 139
Viewing Chassis Cluster Statistics | 140
Example: Configuring Conditional Route Advertising in a Chassis Cluster
IN THIS SECTION
Requirements | 158
Overview | 158
Configuration | 160
This example shows how to configure conditional route advertising in a chassis cluster to ensure thatincoming traffic from the upstream network arrives on the node that is on the currently activeredundant Ethernet interface.
Requirements
Before you begin, understand conditional route advertising in a chassis cluster. See "UnderstandingConditional Route Advertising in a Chassis Cluster" on page 157.
Overview
As illustrated in Figure 30 on page 159, routing prefixes learned from the redundant Ethernet interfacethrough the IGP are advertised toward the network core using BGP. Two BGP sessions are maintained,one from interface ge-0/0/0 and one from ge-1/0/0 for BGP multihoming. All routing prefixes areadvertised on both sessions. Thus, for a route advertised by BGP, learned over a redundant Ethernet
158
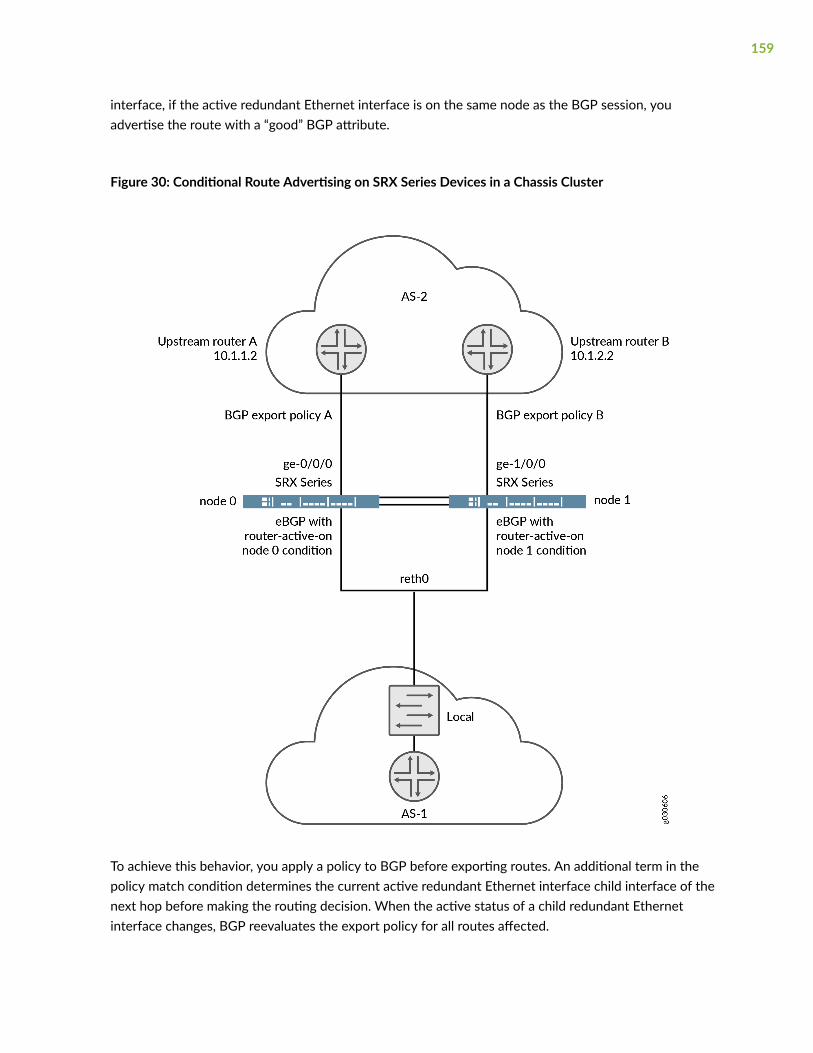
interface, if the active redundant Ethernet interface is on the same node as the BGP session, youadvertise the route with a “good” BGP attribute.
Figure 30: Conditional Route Advertising on SRX Series Devices in a Chassis Cluster
To achieve this behavior, you apply a policy to BGP before exporting routes. An additional term in thepolicy match condition determines the current active redundant Ethernet interface child interface of thenext hop before making the routing decision. When the active status of a child redundant Ethernetinterface changes, BGP reevaluates the export policy for all routes affected.
159

The condition statement in this configuration works as follows. The command states that any routesevaluated against this condition will pass only if:
• The routes have a redundant Ethernet interface as their next-hop interface.
• The current child interface of the redundant Ethernet interface is active at node 0 (as specified by theroute-active-on node0 keyword).
{primary:node0}[edit]user@host# set policy-options condition reth-nh-active-on-0 route-active-on node0
Note that a route might have multiple equal-cost next hops, and those next hops might be redundantEthernet interfaces, regular interfaces, or a combination of both. The route still satisfies the requirementthat it has a redundant Ethernet interface as its next hop.
If you use the BGP export policy set for node 0 in the previous example command, only OSPF routesthat satisfy the following requirements will be advertised through the session:
• The OSPF routes have a redundant Ethernet interface as their next hop.
• The current child interface of the redundant Ethernet interface is currently active at node 0.
You must also create and apply a separate policy statement for the other BGP session by using this sameprocess.
In addition to the BGP MED attribute, you can define additional BGP attributes, such as origin-code, as-path, and community.
Configuration
IN THIS SECTION
Procedure | 161
160

Procedure
CLI Quick Configuration
To quickly configure this example, copy the following commands, paste them into a text file, remove anyline breaks, change any details necessary to match your network configuration, copy and paste thecommands into the CLI at the [edit] hierarchy level, and then enter commit from configuration mode.
{primary:node0}[edit]set policy-options policy-statement reth-nh-active-on-0 term ospf-on-0 from protocol ospf set policy-options policy-statement reth-nh-active-on-0 term ospf-on-0 from condition reth-nh-active-on-0 set policy-options policy-statement reth-nh-active-on-0 term ospf-on-0 then metric 10 set policy-options policy-statement reth-nh-active-on-0 term ospf-on-0 then accept set policy-options condition reth-nh-active-on-0 route-active-on node0
Step-by-Step Procedure
To configure conditional route advertising:
• Create the export policies with the created condition using the condition statement.
{primary:node0}[edit]user@host# set policy-options policy-statement reth-nh-active-on-0 term ospf-on-0 from protocol ospf {primary:node0}[edit]user@host# set policy-options policy-statement reth-nh-active-on-0 term ospf-on-0 from condition reth-nh-active-on-0 {primary:node0}[edit]user@host# set policy-options policy-statement reth-nh-active-on-0 term ospf-on-0 then metric 10{primary:node0}[edit]user@host# set policy-options policy-statement reth-nh-active-on-0 term ospf-on-0 then accept {primary:node0}[edit]user@host# set policy-options condition reth-nh-active-on-0 route-active-on node0
161

Results
From configuration mode, confirm your configuration by entering the show policy-options command. If theoutput does not display the intended configuration, repeat the configuration instructions in this exampleto correct it.
{primary:node0}[edit] user@host# show policy-options policy-statement reth-nh-active-on-0 { term ospf-on-0 { from { protocol ospf; condition reth-nh-active-on-0; } then { metric 10; accept; } }} condition reth-nh-active-on-0 route-active-on node0;
If you are done configuring the device, enter commit from configuration mode.
SEE ALSO
Understanding Conditional Route Advertising in a Chassis Cluster | 157
Viewing a Chassis Cluster Configuration | 139
Viewing Chassis Cluster Statistics | 140
162

3CHAPTER
Configuring Redundancy and Failoverin a Chassis Cluster
Chassis Cluster Dual Control Links | 164
Chassis Cluster Dual Fabric Links | 193
Monitoring of Global-Level Objects in a Chassis Cluster | 201
Monitoring Chassis Cluster Interfaces | 206
Monitoring IP Addresses on a Chassis Cluster | 247
Configuring Cluster Failover Parameters | 268
Understanding Chassis Cluster Resiliency | 273
Chassis Cluster Redundancy Group Failover | 274

Chassis Cluster Dual Control Links
IN THIS SECTION
Chassis Cluster Dual Control Links Overview | 164
Dual Control Link Connections for SRX Series Devices in a Chassis Cluster | 166
Upgrade the Second Routing Engine When Using Chassis Cluster Dual Control Links on SRX5600 andSRX5800 Devices | 168
Example: Configure Chassis Cluster Control Ports for Dual Control Links | 170
Resiliency with SCB Dual Control Links | 173
Example: Configure a Chassis Cluster Using SCB Dual Control Links | 176
Transition from SPC Dual Control Links to SCB Dual Control Links | 182
Transition from SCB to SPC with Dual Control Links | 188
Dual control links provide a redundant link for controlling network traffic.
Chassis Cluster Dual Control Links Overview
IN THIS SECTION
Benefit of Dual Control Links | 165
Dual Control Link Functionality Requirements | 165
A control link connects two SRX Series devices and sends chassis cluster control data, includingheartbeats and configuration synchronization, between them. The link is a single point of failure: If thecontrol link goes down, the secondary SRX Series is disabled from the cluster.
Dual control links prevent downtime due to a single point of failure. Two control link interfaces connecteach device in a cluster. Dual control links provide a redundant link for controlling traffic. Unlike dualfabric links, only one control link is used at any one time.
164

The SRX4600, SRX5600, and SRX5800 Services Gateways support dual control links.
We do not support dual control link functionality on these Services Gateways: SRX4100, SRX4200, orSRX5400.
Starting with Junos OS Release 20.4R1, you can enable or disable the control links on SRX1500 ServicesGateways using operational mode CLI commands and configuration mode CLI commands, described in asubsequent paragraph. This CLI feature enables you to control the status of cluster nodes during acluster upgrade.
Previously, if you wanted to disable the control link and fabric link, you had to unplug the cablesmanually.
The CLI commands work as follows:
• In configuration mode
• To disable the control link, run the set chassis cluster control-interface <node0/node1> disable on node0 or node 1.
If you disable the links using the configuration command, the links remain disabled even aftersystem reboot.
• To enable the control link, run the delete chassis cluster control-interface <node0/node1> disable onboth nodes.
• In operational mode
• To disable the control link from the local node, run the request chassis cluster control-interface<node0/node1> disable command.
If you disable the control link using the operational mode CLI command, the link will be enabledafter system reboot.
• To enable the control link on a local node, run the request chassis cluster control-interface <node0/node1> enable command.
Benefit of Dual Control Links
Dual control links prevent the possibility of a single point of failure by providing a redundant link forcontrol traffic.
Dual Control Link Functionality Requirements
For the SRX5600 and SRX5800 Services Gateways, dual control link functionality requires that a secondRouting Engine and a second Switch Control Board (SCB) be installed on each device in the cluster. The
165

purpose of the second Routing Engine is to initialize the switch on the primary SCB. The second SCBhouses the second Routing Engine.
For the SRX5000 Services Gateways only, the second Routing Engine must be running Junos OS Release10.0 or later.
This second Routing Engine does not provide backup functionality. It does not need to be upgraded,even when you upgrade the software on the primary Routing Engine on the same node. Note thefollowing conditions:
• You can run CLI commands and enter configuration mode only on the primary Routing Engine.
• You set the chassis ID and cluster ID only on the primary Routing Engine.
• If you want to be able to check that the second Routing Engine boots up, or if you want to upgrade asoftware image, you need a console connection to the second Routing Engine.
As long as the first Routing Engine is installed (even if it reboots or fails), the second Routing Enginecannot take over the chassis primary role; that is, it cannot control any of the hardware on the chassis.
A redundancy group 0 failover implies a Routing Engine failover. In the case of a Routing Engine failover,all processes running on the primary node are killed and then spawned on the new primary RoutingEngine. This failover could result in loss of state, such as routing state, and degrade performance byintroducing system churn.
For SRX3000 Services Gateways, dual control link functionality requires that an SRX Clustering Module(SCM) be installed on each device in the cluster. Although the SCM fits in the Routing Engine slot, it isnot a Routing Engine. The SRX3000 devices do not support a second Routing Engine. The purpose ofthe SCM is only to initialize the second control link.
SEE ALSO
Chassis Cluster Control Plane Interfaces | 69
Dual Control Link Connections for SRX Series Devices in a ChassisCluster
You can connect two control links between SRX5600 devices and SRX5800 devices, effectively reducingthe chance of control link failure.
166

NOTE: Junos OS does not support dual control links on SRX5400 devices, due to the limitednumber of slots.
For SRX5600 devices and SRX5800 devices, connect two pairs of the same type of Ethernet ports. Foreach device, you can use ports on the same Services Processing Card (SPC), but we recommend that youconnect the control ports to two different SPCs to provide high availability. Figure 31 on page 167shows a pair of SRX5800 devices with dual control links connected. In this example, control port 0 andcontrol port 1 are connected on different SPCs.
Figure 31: Dual Control Link Connections (SRX5800 Devices)
For SRX5600 devices and SRX5800 devices, you must connect control port 0 on one node to controlport 0 on the other node. You must also connect control port 1 on one node to control port 1 on theother node. If you connect control port 0 to control port 1, the nodes cannot receive heartbeat packetsacross the control links.
SEE ALSO
Connecting SRX Series Devices to Create a Chassis Cluster | 35
Understanding SRX Series Chassis Cluster Slot Numbering and Physical Port and Logical InterfaceNaming | 18
scb-control-ports | 704
request chassis fpc-control-port | 748
request chassis primary-ha-control-port-transition | 753
167

Upgrade the Second Routing Engine When Using Chassis Cluster DualControl Links on SRX5600 and SRX5800 Devices
You must use a second Routing Engine for each SRX5600 device and SRX5800 device in a cluster if youare using dual control links. The second Routing Engine does not provide backup functionality; itspurpose is only to initialize the switch on the Switch Control Board (SCB). The second Routing Enginemust be running Junos OS Release 12.1X47-D35, 12.3X48-D30, 15.1X49-D40, or later. For moreinformation, see knowledge base article KB30371.
On SRX5600 devices and SRX5800 devices, you can use the show chassis hardware command to see theserial number and the hardware version details of the second Routing Engine. To use this functionality,ensure that the second Routing Engine is running either Junos OS Release 15.1X49-D70 or Junos OSRelease 17.3R1.
Junos OS does not support dual control link functionality on the SRX5400 Services Gateways, due tolimited slots.
Because you cannot run the CLI or enter configuration mode on the second Routing Engine, you cannotupgrade the Junos OS image with the usual upgrade commands. Instead, use the primary Routing Engineto create a bootable USB storage device, which you can then use to install a software image on thesecond Routing Engine.
To upgrade the software image on the second Routing Engine:
1. Use FTP to copy the installation media into the /var/tmp directory of the primary Routing Engine.
2. Insert a USB storage device into the USB port on the primary Routing Engine.
3. In the UNIX shell, navigate to the /var/tmp directory:
start shellcd /var/tmp
4. Log in as root or superuser:
su [enter]password: [enter SU password]
5. Issue the following command:
dd if=installMedia of=/dev/externalDrive bs=1m
where
168

• externalDrive—Refers to the removable media name. For example, the removable media name onan SRX5000 line device is da0 for both Routing Engines.
• installMedia—Refers to the installation media downloaded into the /var/tmp directory. Forexample, junos-install-media-usb-srx5000-x86-64-21.4R1.7.img.gz.
Copy the install-media image to the primary Routing Engine in step 1 onto the USB storage device:
dd if=junos-install-media-usb-srx5000-x86-64-21.4R1.7.img.gz of=/dev/da0 bs=1m
6. Log out as root or superuser:
exit
7. After the software image is written to the USB storage device, remove the device and insert it intothe USB port on the second Routing Engine.
8. Move the console connection from the primary Routing Engine to the second Routing Engine, if youdo not already have a connection.
9. Reboot the second Routing Engine. Issue the following command (for Junos OS Release 15.1X49-D65 and earlier):
# reboot
Starting with Junos OS Release 15.1X49-D70, issue the following command:
login : root
root % reboot
• When the following system output appears, press y:
WARNING: The installation will erase the contents of your disks.Do you wish to continue (y/n)?
• When the following system output appears, remove the USB storage device and press Enter:
Eject the installation media and hit [Enter] to reboot?
169

Example: Configure Chassis Cluster Control Ports for Dual Control Links
IN THIS SECTION
Requirements | 170
Overview | 170
Configuration | 171
Verification | 172
This example shows how to configure chassis cluster control ports for use as dual control links onSRX5600 devices and SRX5800 devices. You need to configure the control ports that you will use oneach device to set up the control links.
Junos OS does not support dual control links on SRX5400 devices, due to the limited number of slots.
Requirements
Before you begin:
• Understand chassis cluster control links. See "Understanding Chassis Cluster Control Plane andControl Links" on page 69.
• Physically connect the control ports on the devices. See "Connecting SRX Series Devices to Create aChassis Cluster" on page 35.
Overview
By default, all control ports on SRX5600 devices and SRX5800 devices are disabled. After connectingthe control ports, configuring the control ports, and establishing the chassis cluster, the control links areset up.
This example configures control ports with the following FPCs and ports as the dual control links:
• FPC 4, port 0
• FPC 10, port 0
• FPC 6, port 1
• FPC 12, port 1
170

Configuration
IN THIS SECTION
Procedure | 171
Procedure
CLI Quick Configuration
To quickly configure this section of the example, copy the following commands, paste them into a textfile, remove any line breaks, change any details necessary to match your network configuration, copyand paste the commands into the CLI at the [edit] hierarchy level, and then enter commit fromconfiguration mode.
{primary:node0}[edit]set chassis cluster control-ports fpc 4 port 0 set chassis cluster control-ports fpc 10 port 0 set chassis cluster control-ports fpc 6 port 1 set chassis cluster control-ports fpc 12 port 1
Step-by-Step Procedure
To configure control ports for use as dual control links for the chassis cluster:
Specify the control ports.
{primary:node0}[edit]user@host# set chassis cluster control-ports fpc 4 port 0{primary:node0}[edit]user@host# set chassis cluster control-ports fpc 10 port 0{primary:node0}[edit]user@host# set chassis cluster control-ports fpc 6 port 1{primary:node0}[edit]user@host# set chassis cluster control-ports fpc 12 port 1
171

Results
In configuration mode, confirm your configuration by entering the show chassis cluster command. If theoutput does not display the intended configuration, repeat the configuration instructions in this exampleto correct it.
For brevity, this show command output includes only the configuration that is relevant to this example.Any other configuration on the system has been replaced with ellipses (...).
{primary:node0}[edit]user@host# show chassis cluster...control-ports { fpc 4 port 0; fpc 6 port 1; fpc 10 port 0; fpc 12 port 1; }...
If you are finished configuring the device, enter commit from configuration mode.
Verification
IN THIS SECTION
Verification of the Chassis Cluster Status | 172
Verification of the Chassis Cluster Status
Purpose
Verify the chassis cluster status.
172

Action
In operational mode, enter the show chassis cluster status command.
{primary:node0}user@host> show chassis cluster statusCluster ID: 1Node Priority Status Preempt Manual failover
Redundancy group: 0 , Failover count: 1 node0 100 primary no no node1 1 secondary no no
Redundancy group: 1 , Failover count: 1 node0 0 primary no no node1 0 secondary no no
Meaning
Use the show chassis cluster status command to confirm that the devices in the chassis cluster arecommunicating with each other. The output shows that the chassis cluster is functioning properly, asone device is the primary node and the other is the secondary node.
Resiliency with SCB Dual Control Links
On SRX5600 devices and SRX5800 devices, a Switch Control Board (SCB) card adds 10-GigabitEthernet (GbE) Small form-factor pluggables ports (SFPP) ports to provide redundancy. In a chassiscluster setup, you can configure these Ethernet ports as chassis cluster control ports to provide dualcontrol links.
Dual control links help prevent a single point of failure by offering a redundant link for control traffic.
For SRX5600 devices and SRX5800 devices operating in chassis cluster, you can configure 10 GigabitEthernet ports on the SCB front panels to operate as chassis cluster control ports using Long Reach (LR),Short Reach (SR), and Long Reach Multimode (LRM) interfaces.
You can use the following 10GbE SFPP ports as chassis cluster control ports:
173

Table 16: SCB External 10GbE Ports
SCB SFPP Ports
SCB2 SFPP-10GbE-LR
SFPP-10GbE-SR
SFPP-10GbE-LRM
SCB3 and SCB4 SFPP-10GbE-LR
SFPP-10GbE-SR
For SRX Series devices operating in chassis cluster, you can configure Ethernet ports on the SCB frontpanels to operate as chassis cluster control ports.
NOTE: SRX5400 Services Gateways do not support dual control links, due to limited slots. Thesedevices supports only chassis cluster control port 0.
Benefits of SCB Dual Control Links:
• Increase the resiliency of the chassis cluster.
• Maintain reliability of the chassis cluster in the event of an SPC failure.
174

Figure 32 on page 175 shows a chassis cluster using SCB dual control links. The term HA used in theFigure 32 on page 175 and Table 17 on page 175 is referred to as chassis cluster.
Figure 32: SCB Dual Control Links in a Chassis Cluster
The control port connections on the chassis cluster are as follows:
Table 17: Control Port Connections
Control Link on Primary Node Control Link on Secondary Node
SCB0 is Control Board 0. HA port 0 is on SCB0. SCB1 is Control Board 1. HA port 1 is on SCB1.
Routing Engine 0 is on SCB0. Routing Engine 1 is on SCB1.
The Ethernet port on SCB0 is used as HA port 0. The Ethernet port on SCB1 is used as HA port 1.
The control packets pass through the SCB control links instead of the SPC control links.
175

SEE ALSO
request chassis primary-ha-control-port-transition | 753
request chassis fpc-control-port | 748
scb-control-ports | 704
Example: Configure a Chassis Cluster Using SCB Dual Control Links
IN THIS SECTION
Requirements | 176
Overview | 176
Configuration | 178
Verification | 179
This example shows how to configure SCB dual control links on a chassis cluster.
In standalone mode, you must configure SCB dual control links and reboot the nodes to activate thechanges.
Requirements
Before you begin:
• Understand chassis cluster control links. See "Understanding Chassis Cluster Control Plane andControl Links" on page 69.
• To support dual control links on SCB ports, upgrade both primary Routing Engine (RE0) andsecondary Routing Engine (RE1) software to Junos OS 21.4R1 or later. For more information, see "Upgrading the Second Routing Engine" on page 168 and Install Software on SRX.
Overview
To configure dual control links in a chassis cluster, you connect primary and secondary control linksbetween the SCB chassis cluster control ports as shown in Figure 32 on page 175.
SCB control links have below properties:
176

1. For RE0, SCB0 chassis cluster control port is automatically enabled when system boots in chassiscluster mode.
SCB0 chassis cluster control port is automatically disabled when system boots in standalone mode.
2. For RE1, SCB1 chassis cluster control port is automatically enabled after reboot, irrespective ofwhether the device is in chassis cluster mode or standalone mode.
3. To temporary disable SCB contol link in chassis cluster mode, disable the SCB0 control port on RE0:
user@host> test chassis ethernet-switch shell-cmd "port xe0 enable=0"
To disable secondary SCB control link, disable the SCB 1 control port on RE1:
user@host> test chassis ethernet-switch shell-cmd "port xe0 enable=0"
4. To permanently disable primary SCB control link, delete the SCB control port configurations, add FPCcontrol link configurations, and commit in chassis cluster mode:
5. To change from cluster mode to standalone mode when using dual SCB control links:
a. Disable SCB1 HA control ports on both nodes through RE1:
user@host> test chassis ethernet-switch shell-cmd "port xe0 enable=0"
user@host> test chassis ethernet-switch shell-cmd ps | grep xe0
xe0 !ena 10G FD SW No Forward TX RX None FA XGMII 16356
b. Reboot the RE0 to set as standalone mode:
user@host> set chassis cluster disable reboot
177

c. To enter the cluster mode again, enable the cluster mode on RE0 and reboot and then enableSCB1 HA control ports on both nodes through RE1 console:
user@host> test chassis ethernet-switch shell-cmd "port xe0 enable=1"
user@host> test chassis ethernet-switch shell-cmd ps | grep xe0
xe0 up 10G FD SW No Forward TX RX None FA XGMII 16356
d. Check the chassis cluster status.
Configuration
IN THIS SECTION
Procedure | 178
Procedure
To configure SCB dual control links for the chassis cluster:
1. Connect the primary SCB control link cable.
2. Configure a chassis cluster that uses SCB0 control port for primary control link and SCB1 control portfor secondary SCB control link on both nodes.
[edit]user@host# set chassis cluster scb-control-ports 0user@host# set chassis cluster scb-control-ports 1
3. Configure the chassis cluster. The example configuration is for node 0. For node 1, make sure toconfigure the same cluster ID.
[edit]user@host> set chassis cluster cluster-id 1 node 0
4. Reboot both nodes to activate cluster mode.
178

5. Connect the secondary SCB control link cable.
Verification
IN THIS SECTION
Verification of the Chassis Cluster Status | 179
Verification of the Chassis Cluster Status
Purpose
Verify the chassis cluster status.
Action
In operational mode, enter the show chassis cluster status command.
{primary:node0}user@host> show chassis cluster statusMonitor Failure codes: CS Cold Sync monitoring FL Fabric Connection monitoring GR GRES monitoring HW Hardware monitoring IF Interface monitoring IP IP monitoring LB Loopback monitoring MB Mbuf monitoring NH Nexthop monitoring NP NPC monitoring SP SPU monitoring SM Schedule monitoring CF Config Sync monitoring RE Relinquish monitoring IS IRQ storm
Cluster ID: 1Node Priority Status Preempt Manual Monitor-failures
Redundancy group: 0 , Failover count: 1node0 254 primary no no Nonenode1 1 secondary no no None
Redundancy group: 1 , Failover count: 1
179

node0 200 primary no no Nonenode1 199 secondary no no None
In operational mode, enter the show chassis cluster interfaces command.
user@host> show chassis cluster interfacesControl link status: Up
Control interfaces: Index Interface Monitored-Status Internal-SA Security 0 ixlv0 Up Disabled Disabled 1 igb0 Up Disabled Disabled
Fabric link status: Up
Fabric interfaces: Name Child-interface Status Security (Physical/Monitored) fab0 xe-3/0/7 Up / Up Disabled fab0 fab1 xe-15/0/7 Up / Up Disabled fab1
Redundant-ethernet Information: Name Status Redundancy-group reth0 Down Not configured reth1 Down Not configured
Redundant-pseudo-interface Information: Name Status Redundancy-group lo0 Up 0
In operational mode, enter the show chassis cluster information detail command.
user@host> show chassis cluster information detailnode0:--------------------------------------------------------------------------Redundancy mode: Configured mode: active-active
180

Operational mode: active-activeCluster configuration: Heartbeat interval: 2000 ms Heartbeat threshold: 8 Control link recovery: Disabled Fabric link down timeout: 352 secNode health information: Local node health: Healthy Remote node health: Healthy
Redundancy group: 0, Threshold: 255, Monitoring failures: none Events: May 6 17:38:01.665 : hold->secondary, reason: Hold timer expired
Redundancy group: 1, Threshold: 255, Monitoring failures: none Events: May 6 17:38:01.666 : hold->secondary, reason: Hold timer expiredControl link statistics: Control link 0: Heartbeat packets sent: 205193 Heartbeat packets received: 205171 Heartbeat packet errors: 0 Node 0 SCB HA port TX FCS Errors: 0 Node 0 SCB HA port RX FCS Errors: 0 Node 1 SCB HA port TX FCS Errors: 0 Node 1 SCB HA port RX FCS Errors: 0 Duplicate heartbeat packets received: 361 Control link 1: Heartbeat packets sent: 707 Heartbeat packets received: 697 Heartbeat packet errors: 0 Node 0 SCB HA port TX FCS Errors: NA Node 0 SCB HA port RX FCS Errors: NA Node 1 SCB HA port TX FCS Errors: NA Node 1 SCB HA port RX FCS Errors: NA Duplicate heartbeat packets received: 329
In operational mode, enter the show chassis cluster fpc pic-status command.
user@host> show chassis cluster fpc pic-statusnode0:
181

--------------------------------------------------------------------------Slot 2 Online SPC3 PIC 0 Online SPU Cp-Flow PIC 1 Online SPU FlowSlot 3 Online SRX5k IOC4 10G PIC 0 Online 20x10GE SFPP- np-cache/services-offload PIC 1 Online 20x10GE SFPP- np-cache/services-offload
node1:--------------------------------------------------------------------------Slot 2 Online SPC3 PIC 0 Online SPU Cp-Flow PIC 1 Online SPU FlowSlot 3 Online SRX5k IOC4 10G PIC 0 Online 20x10GE SFPP- np-cache/services-offload PIC 1 Online 20x10GE SFPP- np-cache/services-offload
Meaning
Use the show chassis cluster command to confirm that the devices in the chassis cluster arecommunicating with each other and functioning properly.
Transition from SPC Dual Control Links to SCB Dual Control Links
IN THIS SECTION
Requirements | 182
Overview | 183
Transition Procedure: SPC to SCB with Dual Control Links | 184
This example shows how to transition SPC dual control links to SCB dual control links. This procedureminimizes traffic disruption and prevents control plane loops during the control link transition.
Requirements
Before you begin:
182

• Understand chassis cluster control links. See "Understanding Chassis Cluster Control Plane andControl Links" on page 69.
• Learn how to physically connect both SPC control ports and SCB control ports. In this procedure, youmust remove cables from and attach cables to both SPC and SCB cards. See "Connecting SRX SeriesDevices to Create a Chassis Cluster" on page 35.
Overview
In this example, you begin with a working chassis cluster that uses SPC dual control links. The goal is totransition the system to use SCB control links seamlessly. To prevent the formation of a control planeloop, the system must not actively forward over the two different control links at the same time.
Two combinations of simultaneous SPC and SCB control link connections ensure loop-free operation. Aspart of your transition strategy, you must decide on one of the following control link combinations:
• SPC as the primary control link with SCB as the secondary control link
• SCB as the primary control link with SPC as the secondary control link
The transition modes support both the combinations of simultaneous SPC and SCB control links toensure that only one type of control links is forwarding. If both SPC and SCB control links are active atthe same time, a loop can form.
Either supported option (SPC or SCB) works as well as the other. This example illustrates the firstoption. During the control link transition, the primary SPC control link remains active while you add asecondary SCB control link. Again, this state is transitory. After the transition, you have a chassis clusterwith both the primary and secondary control links connected to the SCB port.
183

Control Links illustrates the process for transitioning from SPC control links to SCB control links.
Figure 33: Control Links Transition Stages
The starting state of the chassis cluster before transition is displayed on the top. Two SPC control portsare used to form the cluster. In the middle, the transition state has one SPC control port and one SCBcontrol port simultaneously connected. After transition, the ending state of the chassis cluster isdisplayed to the bottom. The chassis cluster operates with two SCB control links after removing theoriginal SPC control links.
Transition Procedure: SPC to SCB with Dual Control Links
IN THIS SECTION
Procedure | 185
184

Procedure
To transition from SPC to SCB dual control links on the primary node (node 0):
1. Select the preferred transition approach. Refer to "Transition Options" on page 183. In thisexample, select the primary SPC link with a secondary SCB link as shown in Control Links.
2. Delete the SPC secondary control link configuration. This configuration change deletes both endsof the secondary SPC control links in the chassis cluster.
{primary:node0}[edit]user@host# delete chassis cluster control-ports fpc 2 port 1user@host# delete chassis cluster control-ports fpc 14 port 1user@host# commit
3. Disconnect the SPC secondary control link cable before proceeding.
4. Configure the SCB secondary control link and commit. The same SCB1 control port is used at bothends of the cluster. This single configuration statement applies to both node 0 and node 1.
{primary:node0}[edit]user@host# set chassis cluster scb-control-ports 1user@host# commit
5. Connect the SCB secondary control link cable. At this time, the chassis cluster is in a transitionalstate.
6. Before continuing the transition, you verify that the chassis cluster is operational and that the dualcontrol links are in a healthy state. Use the show chassis cluster interfaces command.
{primary:node0}user@host> show chassis cluster interfacesControl link status: Up
Control interfaces: Index Interface Monitored-Status Internal-SA Security 0 ixlv0 Up Disabled Disabled 1 igb0 Up Disabled Disabled
Fabric link status: Up
185

Fabric interfaces: Name Child-interface Status Security (Physical/Monitored) fab0 xe-3/0/7 Up / Up Disabled fab0 fab1 xe-15/0/7 Up / Up Disabled fab1
Redundant-ethernet Information: Name Status Redundancy-group reth0 Down Not configured reth1 Down Not configured
Redundant-pseudo-interface Information: Name Status Redundancy-group lo0 Up 0
In the preceding output, the ixlv0 and igb0 interfaces are used to send cluster control traffic andkeepalive traffic.
{primary:node0}user@host> show chassis fpc pic-statusnode0:--------------------------------------------------------------------------Slot 2 Online SPC3 PIC 0 Online SPU Cp-Flow PIC 1 Online SPU FlowSlot 3 Online SRX5k IOC4 10G PIC 0 Online 20x10GE SFPP- np-cache/services-offload PIC 1 Online 20x10GE SFPP- np-cache/services-offload
node1:--------------------------------------------------------------------------Slot 2 Online SPC3 PIC 0 Online SPU Cp-Flow PIC 1 Online SPU FlowSlot 3 Online SRX5k IOC4 10G PIC 0 Online 20x10GE SFPP- np-cache/services-offload PIC 1 Online 20x10GE SFPP- np-cache/services-offload
The chassis cluster control link reports up status. The remote node's cards (SPC and PIC) arereported as Online. The outputs confirm that the chassis cluster remains operational.
186

7. Delete the SPC primary control link. The command deletes any remaining SPC control ports on bothnodes.
user@host# delete chassis cluster control-portsuser@host# commit
8. Disconnect the SPC primary control link cable before proceeding.
9. Configure the SCB primary control link.
user@host# set chassis cluster scb-control-ports 0user@host# commit
10. Connect the SCB primary control link cable.
11. Verify that the chassis cluster remains operational, using the show chassis cluster interfacescommand.
{primary:node0}user@host> show chassis cluster interfacesControl link status: Up
Control interfaces: Index Interface Monitored-Status Internal-SA Security 0 ixlv0 Up Disabled Disabled 1 igb0 Up Disabled Disabled
Fabric link status: Up
Fabric interfaces: Name Child-interface Status Security (Physical/Monitored) fab0 xe-3/0/7 Up / Up Disabled fab0 fab1 xe-15/0/7 Up / Up Disabled fab1
Redundant-ethernet Information: Name Status Redundancy-group
187

reth0 Down Not configured reth1 Down Not configured
Redundant-pseudo-interface Information: Name Status Redundancy-group lo0 Up 0
{primary:node0}user@host> show chassis fpc pic-statusnode0:--------------------------------------------------------------------------Slot 2 Online SPC3 PIC 0 Online SPU Cp-Flow PIC 1 Online SPU FlowSlot 3 Online SRX5k IOC4 10G PIC 0 Online 20x10GE SFPP- np-cache/services-offload PIC 1 Online 20x10GE SFPP- np-cache/services-offload
node1:--------------------------------------------------------------------------Slot 2 Online SPC3 PIC 0 Online SPU Cp-Flow PIC 1 Online SPU FlowSlot 3 Online SRX5k IOC4 10G PIC 0 Online 20x10GE SFPP- np-cache/services-offload PIC 1 Online 20x10GE SFPP- np-cache/services-offload
The chassis cluster control link reports an up status and the remote node's cards SPC and PIC arereported as Online.
Transition from SCB to SPC with Dual Control Links
IN THIS SECTION
Requirements | 189
Configuration | 189
188

This example provides steps for a control link transition from an SCB to an SPC dual control linkconcurrently.
Requirements
Before you begin:
• Understand chassis cluster control links. See "Understanding Chassis Cluster Control Plane andControl Links" on page 69.
• Physically connect the control ports on the devices. See "Connecting SRX Series Devices to Create aChassis Cluster" on page 35.
Configuration
IN THIS SECTION
Procedure | 189
Procedure
To transition from SCB to SPC control links concurrently:
1. Delete the SCB secondary control link configuration.
{primary:node0}[edit]user@host# delete chassis cluster scb-control-ports 1user@host# commit
2. Disconnect the SCB secondary control link cable.
3. Connect the SPC secondary control link cable.
4. Configure the SPC secondary control link, and commit.
{primary:node0}[edit]user@host# set chassis cluster control-ports fpc 2 port 1user@host# set chassis cluster control-ports fpc 14 port 1user@host# commit
189

5. Verify that both the primary and secondary control interfaces are up on both nodes.
In operational mode, enter the show chassis cluster interfaces command to confirm that the chassiscluster is functioning properly.
{primary:node0}user@host> show chassis cluster interfacesControl link status: Up
Control interfaces: Index Interface Monitored-Status Internal-SA Security 0 ixlv0 Up Disabled Disabled 1 igb0 Up Disabled Disabled
Fabric link status: Up
Fabric interfaces: Name Child-interface Status Security (Physical/Monitored) fab0 xe-3/0/7 Up / Up Disabled fab0 fab1 xe-15/0/7 Up / Up Disabled fab1
Redundant-ethernet Information: Name Status Redundancy-group reth0 Down Not configured reth1 Down Not configured
Redundant-pseudo-interface Information: Name Status Redundancy-group lo0 Up 0
{primary:node0}user@host> show chassis fpc pic-statusnode0:--------------------------------------------------------------------------Slot 2 Online SPC3 PIC 0 Online SPU Cp-Flow PIC 1 Online SPU FlowSlot 3 Online SRX5k IOC4 10G
190

PIC 0 Online 20x10GE SFPP- np-cache/services-offload PIC 1 Online 20x10GE SFPP- np-cache/services-offload
node1:--------------------------------------------------------------------------Slot 2 Online SPC3 PIC 0 Online SPU Cp-Flow PIC 1 Online SPU FlowSlot 3 Online SRX5k IOC4 10G PIC 0 Online 20x10GE SFPP- np-cache/services-offload PIC 1 Online 20x10GE SFPP- np-cache/services-offload
6. Delete the SCB primary control link.
user@host# delete chassis cluster scb-control-ports 0user@host# commit
7. Disconnect the SCB primary control link cable.
8. Connect the SPC primary control link cable.
9. Configure the SPC primary control link.
{primary:node0}[edit]user@host# set chassis cluster control-ports fpc 2 port 0user@host# set chassis cluster control-ports fpc 14 port 0user@host# commit
10. Verify that both the primary and secondary control interfaces are up on both nodes, using the showchassis cluster interfaces command.
{primary:node0}user@host> show chassis cluster interfacesControl link status: Up
Control interfaces: Index Interface Monitored-Status Internal-SA Security 0 ixlv0 Up Disabled Disabled 1 igb0 Up Disabled Disabled
191

Fabric link status: Up
Fabric interfaces: Name Child-interface Status Security (Physical/Monitored) fab0 xe-3/0/7 Up / Up Disabled fab0 fab1 xe-15/0/7 Up / Up Disabled fab1
Redundant-ethernet Information: Name Status Redundancy-group reth0 Down Not configured reth1 Down Not configured
Redundant-pseudo-interface Information: Name Status Redundancy-group lo0 Up 0
{primary:node0}user@host> show chassis fpc pic-statusnode0:--------------------------------------------------------------------------Slot 2 Online SPC3 PIC 0 Online SPU Cp-Flow PIC 1 Online SPU FlowSlot 3 Online SRX5k IOC4 10G PIC 0 Online 20x10GE SFPP- np-cache/services-offload PIC 1 Online 20x10GE SFPP- np-cache/services-offload
node1:--------------------------------------------------------------------------Slot 2 Online SPC3 PIC 0 Online SPU Cp-Flow PIC 1 Online SPU FlowSlot 3 Online SRX5k IOC4 10G PIC 0 Online 20x10GE SFPP- np-cache/services-offload PIC 1 Online 20x10GE SFPP- np-cache/services-offload
192

RELATED DOCUMENTATION
Connecting SRX Series Devices to Create a Chassis Cluster | 35
SRX Series Chassis Cluster Configuration Overview | 13
Chassis Cluster Dual Fabric Links
IN THIS SECTION
Understanding Chassis Cluster Dual Fabric Links | 193
Example: Configuring the Chassis Cluster Dual Fabric Links with Matching Slots and Ports | 194
Example: Configuring Chassis Cluster Dual Fabric Links with Different Slots and Ports | 198
Dual fabric links remove single point of failure in a chassis cluster setup. If one fabric link fails and oneremains functional, all sessions are maintained between the two nodes and the chassis cluster status ispreserved. for more information, see the following topics:
Understanding Chassis Cluster Dual Fabric Links
You can connect two fabric links between each device in a cluster, which provides a redundant fabriclink between the members of a cluster. Having two fabric links helps to avoid a possible single point offailure.
When you use dual fabric links, the RTOs and probes are sent on one link and the fabric-forwarded andflow-forwarded packets are sent on the other link. If one fabric link fails, the other fabric link handles theRTOs and probes, as well as the data forwarding. The system selects the physical interface with thelowest slot, PIC, or port number on each node for the RTOs and probes.
For all SRX Series devices, you can connect two fabric links between two devices, effectively reducingthe chance of a fabric link failure.
In most SRX Series devices in a chassis cluster, you can configure any pair of Gigabit Ethernet interfacesor any pair of 10-Gigabit interfaces to serve as the fabric between nodes.
For dual fabric links, both of the child interface types should be the same type. For example, both shouldbe Gigabit Ethernet interfaces or 10-Gigabit interfaces.
193
SRX300, SRX320, SRX340, and SRX345 devices support Gigabit Ethernet interfaces only.
SRX380 devices support any of Gigabit Ethernet and 10-Gigabit Ethernet interfaces.
SEE ALSO
Understanding Chassis Cluster Fabric Interfaces | 57
Example: Configuring the Chassis Cluster Dual Fabric Links withMatching Slots and Ports
IN THIS SECTION
Requirements | 194
Overview | 194
Configuration | 195
Verification | 197
This example shows how to configure the chassis cluster fabric with dual fabric links with matching slotsand ports. The fabric is the back-to-back data connection between the nodes in a cluster. Traffic on onenode that needs to be processed on the other node or to exit through an interface on the other nodepasses over the fabric. Session state information also passes over the fabric.
Requirements
Before you begin, set the chassis cluster ID and chassis cluster node ID. See "Example: Setting theChassis Cluster Node ID and Cluster ID" on page 43.
Overview
In most SRX Series devices in a chassis cluster, you can configure any pair of Gigabit Ethernet interfacesor any pair of 10-Gigabit interfaces to serve as the fabric between nodes.
You cannot configure filters, policies, or services on the fabric interface. Fragmentation is not supportedon the fabric link. The MTU size is 8984 bytes. We recommend that no interface in the cluster exceedthis MTU size. Jumbo frame support on the member links is enabled by default.
194

This example illustrates how to configure the fabric link with dual fabric links with matching slots andports on each node.
A typical configuration is where the dual fabric links are formed with matching slots/ports on each node.That is, ge-3/0/0 on node 0 and ge-10/0/0 on node 1 match, as do ge-0/0/0 on node 0 and ge-7/0/0 on node 1(the FPC slot offset is 7).
Only the same type of interfaces can be configured as fabric children, and you must configure an equalnumber of child links for fab0 and fab1.
If you are connecting each of the fabric links through a switch, you must enable the jumbo frame featureon the corresponding switch ports. If both of the fabric links are connected through the same switch, theRTO-and-probes pair must be in one virtual LAN (VLAN) and the data pair must be in another VLAN.Here, too, the jumbo frame feature must be enabled on the corresponding switch ports.
Configuration
IN THIS SECTION
Procedure | 195
Procedure
CLI Quick Configuration
To quickly configure this example, copy the following commands, paste them into a text file, remove anyline breaks, change any details necessary to match your network configuration, copy and paste thecommands into the CLI at the [edit] hierarchy level, and then enter commit from configuration mode.
{primary:node0}[edit]set interfaces fab0 fabric-options member-interfaces ge-0/0/0 set interfaces fab0 fabric-options member-interfaces ge-3/0/0 set interfaces fab1 fabric-options member-interfaces ge-7/0/0 set interfaces fab1 fabric-options member-interfaces ge-10/0/0
Step-by-Step Procedure
To configure the chassis cluster fabric with dual fabric links with matching slots and ports on each node:
195

• Specify the fabric interfaces.
{primary:node0}[edit]user@host# set interfaces fab0 fabric-options member-interfaces ge-0/0/0user@host# set interfaces fab0 fabric-options member-interfaces ge-3/0/0user@host# set interfaces fab1 fabric-options member-interfaces ge-7/0/0user@host# set interfaces fab1 fabric-options member-interfaces ge-10/0/0
Results
From configuration mode, confirm your configuration by entering the show interfaces command. If theoutput does not display the intended configuration, repeat the configuration instructions in this exampleto correct it.
For brevity, this show command output includes only the configuration that is relevant to this example.Any other configuration on the system has been replaced with ellipses (...).
{primary:node0}[edit]user@host# show interfaces...fab0 { fabric-options { member-interfaces { ge-0/0/0; ge-3/0/0; } }} fab1 { fabric-options { member-interfaces { ge-7/0/0; ge-10/0/0; } } }
If you are done configuring the device, enter commit from configuration mode.
196

Verification
IN THIS SECTION
Verifying the Chassis Cluster Fabric | 197
Verifying the Chassis Cluster Fabric
Purpose
Verify the chassis cluster fabric.
Action
From operational mode, enter the show interfaces terse | match fab command.
{primary:node0}user@host> show interfaces terse | match fabge-0/0/0.0 up up aenet --> fab0.0ge-3/0/0.0 up up aenet --> fab0.0ge-7/0/0.0 up up aenet --> fab1.0ge-10/0/0.0 up up aenet --> fab1.0fab0 up upfab0.0 up up inet 10.17.0.200/24fab1 up upfab1.0 up up inet 10.18.0.200/24
SEE ALSO
Understanding SRX Series Chassis Cluster Slot Numbering and Physical Port and Logical InterfaceNaming | 18
197

Example: Configuring Chassis Cluster Dual Fabric Links with DifferentSlots and Ports
IN THIS SECTION
Requirements | 198
Overview | 198
Configuration | 199
Verification | 200
This example shows how to configure the chassis cluster fabric with dual fabric links with different slotsand ports. The fabric is the back-to-back data connection between the nodes in a cluster. Traffic on onenode that needs to be processed on the other node or to exit through an interface on the other nodepasses over the fabric. Session state information also passes over the fabric.
Requirements
Before you begin, set the chassis cluster ID and chassis cluster node ID. See "Example: Setting theChassis Cluster Node ID and Cluster ID" on page 43.
Overview
In most SRX Series devices in a chassis cluster, you can configure any pair of Gigabit Ethernet interfacesor any pair of 10-Gigabit interfaces to serve as the fabric between nodes.
You cannot configure filters, policies, or services on the fabric interface. Fragmentation is not supportedon the fabric link.
The maximum transmission unit (MTU) size supported is 8984 We recommend that no interface in thecluster exceed this MTU size. Jumbo frame support on the member links is enabled by default.
This example illustrates how to configure the fabric link with dual fabric links with different slots andports on each node.
Make sure you physically connect the RTO-and-probes link to the RTO-and-probes link on the othernode. Likewise, make sure you physically connect the data link to the data link on the other node.
That is, physically connect the following two pairs:
• The node 0 RTO-and-probes link ge-2/1/9 to the node 1 RTO-and-probes link ge-11/0/0
198
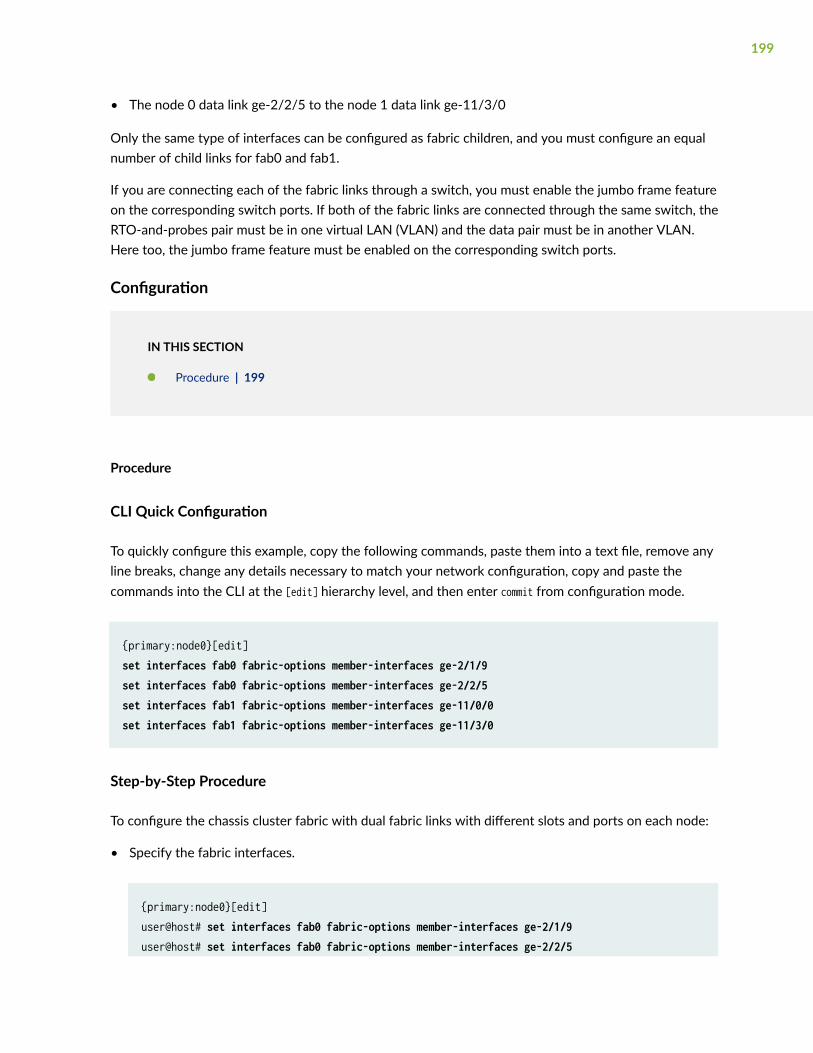
• The node 0 data link ge-2/2/5 to the node 1 data link ge-11/3/0
Only the same type of interfaces can be configured as fabric children, and you must configure an equalnumber of child links for fab0 and fab1.
If you are connecting each of the fabric links through a switch, you must enable the jumbo frame featureon the corresponding switch ports. If both of the fabric links are connected through the same switch, theRTO-and-probes pair must be in one virtual LAN (VLAN) and the data pair must be in another VLAN.Here too, the jumbo frame feature must be enabled on the corresponding switch ports.
Configuration
IN THIS SECTION
Procedure | 199
Procedure
CLI Quick Configuration
To quickly configure this example, copy the following commands, paste them into a text file, remove anyline breaks, change any details necessary to match your network configuration, copy and paste thecommands into the CLI at the [edit] hierarchy level, and then enter commit from configuration mode.
{primary:node0}[edit]set interfaces fab0 fabric-options member-interfaces ge-2/1/9 set interfaces fab0 fabric-options member-interfaces ge-2/2/5 set interfaces fab1 fabric-options member-interfaces ge-11/0/0 set interfaces fab1 fabric-options member-interfaces ge-11/3/0
Step-by-Step Procedure
To configure the chassis cluster fabric with dual fabric links with different slots and ports on each node:
• Specify the fabric interfaces.
{primary:node0}[edit]user@host# set interfaces fab0 fabric-options member-interfaces ge-2/1/9user@host# set interfaces fab0 fabric-options member-interfaces ge-2/2/5
199

user@host# set interfaces fab1 fabric-options member-interfaces ge-11/0/0user@host# set interfaces fab1 fabric-options member-interfaces ge-11/3/0
Results
From configuration mode, confirm your configuration by entering the show interfaces command. If theoutput does not display the intended configuration, repeat the configuration instructions in this exampleto correct it.
For brevity, this show command output includes only the configuration that is relevant to this example.Any other configuration on the system has been replaced with ellipses (...).
{primary:node0}[edit]user@host# show interfaces...fab0 { fabric-options { member-interfaces { ge-2/1/9; ge-2/2/5; } }} fab1 { fabric-options { member-interfaces { ge-11/0/0; ge-11/3/0; } } }
If you are done configuring the device, enter commit from configuration mode.
Verification
IN THIS SECTION
Verifying the Chassis Cluster Fabric | 201
200

Verifying the Chassis Cluster Fabric
Purpose
Verify the chassis cluster fabric.
Action
From operational mode, enter the show interfaces terse | match fab command.
{primary:node0}user@host> show interfaces terse | match fabge-2/1/9.0 up up aenet --> fab0.0ge-2/2/5.0 up up aenet --> fab0.0ge-11/0/0.0 up up aenet --> fab1.0ge-11/3/0.0 up up aenet --> fab1.0fab0 up upfab0.0 up up inet 30.17.0.200/24fab1 up upfab1.0 up up inet 30.18.0.200/24
RELATED DOCUMENTATION
Connecting SRX Series Devices to Create a Chassis Cluster | 35
SRX Series Chassis Cluster Configuration Overview | 13
Monitoring of Global-Level Objects in a ChassisCluster
IN THIS SECTION
Understanding SPU Monitoring | 202
Understanding flowd Monitoring | 203
201

Understanding Cold-Sync Monitoring | 204
There are various types of objects to monitor as you work with devices configured as chassis clusters,including global-level objects and objects that are specific to redundancy groups. This section describesthe monitoring of global-level objects.
The SRX5000 lines have one or more Services Processing Units (SPUs) that run on a Services ProcessingCard (SPC). All flow-based services run on the SPU. Other SRX Series devices have a flow-basedforwarding process, flowd, which forwards packets through the device.
Understanding SPU Monitoring
SPU monitoring tracks the health of the SPUs and of the central point (CP). The chassis manager on eachSPC monitors the SPUs and the central point, and also maintains the heartbeat with the Routing Enginechassisd. In this hierarchical monitoring system, chassisd is the center for hardware failure detection.SPU monitoring is enabled by default.
SPU monitoring is supported on SRX4600 and SRX5000 line devices.
Persistent SPU and central point failure on a node is deemed a catastrophic Packet Forwarding Engine(PFE) failure. In this case, the node's PFE is disabled in the cluster by reducing the priorities ofredundancy groups x to 0.
• A central point failure triggers failover to the secondary node. The failed node's PFE, which includesall SPCs and all I/O cards (IOCs), is automatically restarted. If the secondary central point has failedas well, the cluster is unable to come up because there is no primary device. Only the data plane(redundancy group x) is failed over.
• A single, failed SPU causes failover of redundancy group x to the secondary node. All IOCs and SPCson the failed node are restarted and redundancy group x is failed over to the secondary node.Failover to the secondary node is automatic without the need for user intervention. When the failed(former) primary node has its failing component restored, failback is determined by the preemptconfiguration for the redundancy group x. The interval for dead SPU detection is 30 seconds.
On SRX5400, SRX5600, and SRX5800 SPCs, the Routing Engine monitors the health of the chassismanager. The chassis manager sends a heartbeat message to the Routing Engine chassisd every second.When the Routing Engine chassisd detects a heartbeat loss, it initiates a power cycle for the entire SPC.If multiple recoveries fail within a certain timeframe, the Routing Engine powers off the SPC to preventit from affecting the entire system.
202

This event triggers an alarm, indicating that a new field-replaceable unit (FRU) is needed.
The following list describes the limitations for inserting an SPC on SRX5400, SRX5600, and SRX5800devices in chassis cluster mode:
• The chassis cluster must be in active/passive mode before and during the SPC insert procedure.
• A different number of SPCs cannot be inserted in two different nodes.
• A new SPC must be inserted in a slot that is higher than the central point slot.
The existing combo central point cannot be changed to a full central point after the new SPC isinserted.
• During an SPC insert procedure, the IKE and IPsec configurations cannot be modified.
An SPC is not hot-insertable. Before inserting an SPC, the device must be taken offline. Afterinserting an SPC, the device must be rebooted.
• Users cannot specify the SPU and the IKE instance to anchor a tunnel.
• After a new SPC is inserted, the existing tunnels cannot use the processing power of the new SPCand redistribute it to the new SPC.
Understanding flowd Monitoring
Flowd monitoring tracks the health of the flowd process. Flowd monitoring is enabled by default.
Persistent flowd failure on a node is deemed a catastrophic Packet Forwarding Engine (PFE) failure. Inthis case, the node's PFE is disabled in the cluster by reducing the priorities of redundancy groups x to 0.
A failed flowd process causes failover of redundancy group x to the secondary node. Failover to thesecondary node is automatic without the need for user intervention. When the failed (former) primarynode has its failing component restored, failback is determined by the preempt configuration for theredundancy group x.
During SPC and flowd monitoring failures on a local node, the data plane redundancy group RG1+ failsover to the other node that is in a good state. However, the control plane RG0 does not fail over andremains primary on the same node as it was before the failure.
203

Understanding Cold-Sync Monitoring
The process of synchronizing the data plane runtime objects (RTOs) on the startup of the SPUs or flowdis called cold sync. When all the RTOs are synchronized, the cold-sync process is complete, and the SPUor flowd on the node is ready to take over for the primary node, if needed. The process of monitoringthe cold-sync state of all the SPUs or flowd on a node is called cold-sync monitoring. Keep in mind thatwhen preempt is enabled, cold-sync monitoring prevents the node from taking over the primary roleuntil the cold-sync process is completed for the SPUs or flowd on the node. Cold-sync monitoring isenabled by default.
When the node is rebooted, or when the SPUs or flowd come back up from failure, the priority for allthe redundancy groups 1+ is 0. When an SPU or flowd comes up, it tries to start the cold-sync processwith its mirror SPU or flowd on the other node.
If this is the only node in the cluster, the priorities for all the redundancy groups 1+ stay at 0 until a newnode joins the cluster. Although the priority is at 0, the device can still receive and send traffic over itsinterfaces. A priority of 0 implies that it cannot fail over in case of a failure. When a new node joins thecluster, all the SPUs or flowd, as they come up, will start the cold-sync process with the mirror SPUs orflowd of the existing node.
When the SPU or flowd of a node that is already up detects the cold-sync request from the SPU orflowd of the peer node, it posts a message to the system indicating that the cold-sync process iscomplete. The SPUs or flowd of the newly joined node posts a similar message. However, they post thismessage only after all the RTOs are learned and cold-sync is complete. On receipt of completionmessages from all the SPUs or flowd, the priority for redundancy groups 1+ moves to the configuredpriority on each node if there are no other failures of monitored components, such as interfaces. Thisaction ensures that the existing primary node for redundancy 1+ groups always moves to the configuredpriority first. The node joining the cluster later moves to its configured priorities only after all its SPUs orflowd have completed their cold-sync process. This action in turn guarantees that the newly added nodeis ready with all the RTOs before it takes over the primary role.
Understanding Cold-Sync Monitoring with SPU Replacement or Expansion
If your SRX5600 or SRX5800 Services Gateway is part of a chassis cluster, when you replace a ServicesProcessing Card (SPC) with a SPC2 or an SPC3 on the device, you must fail over all redundancy groupsto one node.
For SRX5400 devices, SPC2 and SPC3 are supported.
The following events take place during this scenario:
• When the SPC2 is installed on a node (for example, on node 1, the secondary node), node 1 is shutdown so the SPC2 can be installed.
204

• Once node 1 is powered up and rejoins the cluster, the number of SPUs on node 1 will be higherthan the number of SPUs on node 0, the primary node. Now, one node (node 0) still has an old SPCwhile the other node has the new SPC2; SPC2s have four SPUs per card, and the older SPCs havetwo SPUs per card.
The cold-sync process is based on node 0 total SPU number. Once those SPUs in node 1corresponding to node 0 SPUs have completed the cold-sync, the node 1 will declare cold-synccompleted. Since the additional SPUs in node 1 do not have the corresponding node 0 SPUs, there isnothing to be synchronized and failover from node 0 to node 1 does not cause any issue.
SPU monitoring functionality monitors all SPUs and reports if there are any SPU failure.
For example assume that both nodes originally have 2 existing SPCs and you have replaced bothSPCs with SPC2 on node 1. Now we have 4 SPUs in node 0 and 8 SPUs in node 1. The SPUmonitoring function monitors the 4 SPUs on node 0 and 8 SPUs on node 1. If any of those 8 SPUsfailed in node 1, the SPU monitoring will still report to the Juniper Services Redundancy Protocol(jsrpd) process that there is an SPU failure. The jsrpd process controls chassis clustering.
• Once node 1 is ready to failover, you can initiate all redundancy group failover manually to node 1.Node 0 will be shut down to replace its SPC with the SPC2. After the replacement, node 0 and node1 will have exactly the same hardware setup.
Once node 0 is powered up and rejoins the cluster, the system will operate as a normal chassis cluster.
Starting from Junos OS Release 15.1X49-D120, when the cold-sync process is still in progress on SRXSeries device in chassis cluster, and if the control link is down, a delay (of 30 seconds) is expected beforethe node takes transition from the secondary state to the primary state.
RELATED DOCUMENTATION
Understanding Chassis Cluster Redundancy Group Interface Monitoring | 206
Example: Configuring Chassis Cluster Redundancy Group Interface Monitoring | 207
Understanding Chassis Cluster Redundancy Group IP Address Monitoring | 251
Example: Configuring Chassis Cluster Redundancy Group IP Address Monitoring | 253
205

Monitoring Chassis Cluster Interfaces
IN THIS SECTION
Understanding Chassis Cluster Redundancy Group Interface Monitoring | 206
Example: Configuring Chassis Cluster Redundancy Group Interface Monitoring | 207
Interface monitoring monitors the state of an interface by checking if the interface is in an up or downstate. When one or more monitored interfaces fail, the redundancy group fails over to the other node inthe cluster. For more information, see the following topics:
Understanding Chassis Cluster Redundancy Group Interface Monitoring
IN THIS SECTION
Benefits of Monitoring Chassis Cluster Redundancy Group Interfaces | 207
For a redundancy group to automatically failover to another node, its interfaces must be monitored.When you configure a redundancy group, you can specify a set of interfaces that the redundancy groupis to monitor for status (or “health”) to determine whether the interface is up or down. A monitoredinterface can be a child interface of any of its redundant Ethernet interfaces. When you configure aninterface for a redundancy group to monitor, you give it a weight.
Every redundancy group has a threshold tolerance value initially set to 255. When an interfacemonitored by a redundancy group becomes unavailable, its weight is subtracted from the redundancygroup's threshold. When a redundancy group's threshold reaches 0, it fails over to the other node. Forexample, if redundancy group 1 was primary on node 0, on the threshold-crossing event, redundancygroup 1 becomes primary on node 1. In this case, all the child interfaces of redundancy group 1'sredundant Ethernet interfaces begin handling traffic.
To check the interface weight, use the following commands:
• show chassis cluster information
206

• show chassis cluster interfaces
We do not recommend configuring data plane modules such as interface monitoring and IP monitoringon redundancy group 0 (RG0) for SRX Series devices in a chassis cluster.
Be cautious and judicious in your use of redundancy group 0 manual failovers. A redundancy group 0failover implies a Routing Engine (RE) failover, in which case all processes running on the primary nodeare killed and then spawned on the new primary Routing Engine (RE). This failover could result in loss ofstate, such as routing state, and degrade performance by introducing system churn.
A redundancy group failover occurs because the cumulative weight of the redundancy group'smonitored interfaces has brought its threshold value to 0. When the monitored interfaces of aredundancy group on both nodes reach their thresholds at the same time, the redundancy group isprimary on the node with the lower node ID, in this case node 0.
• If you want to dampen the failovers occurring because of interface monitoring failures, use the hold-down-interval statement.
• If a failover occurs on redundancy group 0 (RG0), the interface monitoring on the RG0 secondary isdisabled for 30 seconds. This prevents failover of other redundancy groups along with RG0 failover.
Benefits of Monitoring Chassis Cluster Redundancy Group Interfaces
• Helps to determine the status of a specific interface in a chassis cluster setup by a specificredundancy group.
• Enables automatic failover of an interface to another node if the interface is down.
SEE ALSO
Understanding Chassis Cluster Redundancy Groups | 93
Example: Configuring Chassis Cluster Redundancy Group InterfaceMonitoring
IN THIS SECTION
Requirements | 208
Overview | 208
207

Configuration | 209
Verification | 214
This example shows how to specify that an interface be monitored by a specific redundancy group forautomatic failover to another node. You assign a weight to the interface to be monitored also showshow to verify the process of the remaining threshold of a monitoring interface by configuring twointerfaces from each node and mapping them to redundancy groups.
Requirements
Before you begin, create a redundancy group. See "Example: Configuring Chassis Cluster RedundancyGroups" on page 97.
Overview
IN THIS SECTION
Topology | 209
To retrieve the remaining redundancy group threshold after a monitoring interface is down, you canconfigure your system to monitor the health of the interfaces belonging to a redundancy group. Whenyou assign a weight to an interface to be monitored, the system monitors the interface for availability. Ifa physical interface fails, the weight is deducted from the corresponding redundancy group's threshold.Every redundancy group has a threshold of 255. If the threshold hits 0, a failover is triggered, even if theredundancy group is in manual failover mode and the preempt option is not enabled.
In this example, you check the process of the remaining threshold of a monitoring interface byconfiguring two interfaces from each node and mapping them to redundancy group 1 (RG1), each withdifferent weights. You use 130 and 140 for node 0 interfaces and 150 and 120 for node 1 interfaces.You configure one interface from each node and map the interfaces to redundancy group 2 (RG2), eachwith default weight of 255.
Figure 34 on page 209 illustrates the network topology used in this example.
208

Topology
Figure 34: SRX Series Chassis Cluster Interface Monitoring Topology Example
Configuration
IN THIS SECTION
CLI Quick Configuration | 209
Procedure | 210
CLI Quick Configuration
To quickly configure this example, copy the following commands, paste them into a text file, remove anyline breaks, change any details necessary to match your network configuration, copy and paste thecommands into the CLI at the edit hierarchy level, and then enter commit from configuration mode.
set chassis cluster reth-count 3set chassis cluster redundancy-group 0 node 0 priority 254set chassis cluster redundancy-group 0 node 1 priority 1set chassis cluster redundancy-group 1 node 0 priority 200set chassis cluster redundancy-group 1 node 1 priority 100
209

set chassis cluster redundancy-group 1 interface-monitor ge-0/0/1 weight 130set chassis cluster redundancy-group 1 interface-monitor ge-0/0/2 weight 140set chassis cluster redundancy-group 1 interface-monitor ge-8/0/1 weight 150set chassis cluster redundancy-group 1 interface-monitor ge-8/0/2 weight 120set chassis cluster redundancy-group 2 node 0 priority 200set chassis cluster redundancy-group 2 node 1 priority 100set chassis cluster redundancy-group 2 interface-monitor ge-0/0/3 weight 255set chassis cluster redundancy-group 2 interface-monitor ge-8/0/3 weight 255set interfaces ge-0/0/1 gigether-options redundant-parent reth0set interfaces ge-0/0/2 gigether-options redundant-parent reth1set interfaces ge-0/0/3 gigether-options redundant-parent reth2set interfaces ge-8/0/1 gigether-options redundant-parent reth0set interfaces ge-8/0/2 gigether-options redundant-parent reth1set interfaces ge-8/0/3 gigether-options redundant-parent reth2set interfaces reth0 redundant-ether-options redundancy-group 1set interfaces reth0 unit 0 family inet address 10.1.1.1/24set interfaces reth1 redundant-ether-options redundancy-group 1set interfaces reth1 unit 0 family inet address 10.2.2.2/24set interfaces reth2 redundant-ether-options redundancy-group 2set interfaces reth2 unit 0 family inet address 10.3.3.3/24
Procedure
Step-by-Step Procedure
The following example requires you to navigate various levels in the configuration hierarchy. Forinstructions on how to do that, see Using the CLI Editor in Configuration Mode in the Junos OS CLI UserGuide.
To configure chassis cluster interface monitoring:
1. Specify the number of redundant Ethernet interfaces.
[edit chassis cluster]user@host# set reth-count 3
210

2. Set up redundancy group 0 for the Routing Engine failover properties, and set up RG1 and RG2 (allinterfaces are in one redundancy group in this example) to define the failover properties for theredundant Ethernet interfaces.
[edit chassis cluster]user@host# set redundancy-group 0 node 0 priority 254user@host# set redundancy-group 0 node 1 priority 1user@host# set redundancy-group 1 node 0 priority 200user@host# set redundancy-group 1 node 1 priority 100user@host# set redundancy-group 2 node 0 priority 200user@host# set redundancy-group 2 node 1 priority 100
3. Set up interface monitoring to monitor the health of the interfaces and trigger redundancy groupfailover.
We do not recommend interface monitoring for RG0, because it causes the control plane to switchfrom one node to another node in case interface flap occurs.
[edit chassis cluster]user@host# set redundancy-group 1 interface-monitor ge-0/0/1 weight 130user@host# set redundancy-group 1 interface-monitor ge-0/0/2 weight 140user@host# set redundancy-group 1 interface-monitor ge-8/0/1 weight 150user@host# set redundancy-group 1 interface-monitor ge-0/0/2 weight 120user@host# set redundancy-group 2 interface-monitor ge-0/0/3 weight 255user@host# set redundancy-group 2 interface-monitor ge-8/0/3 weight 255
Interface failover only occurs after the weight reaches zero.
4. Set up the redundant Ethernet (reth) interfaces and assign them to a zone.
[edit interfaces]user@host# set ge-0/0/1 gigether-options redundant-parent reth0user@host# set ge-0/0/2 gigether-options redundant-parent reth1user@host# set ge-0/0/3 gigether-options redundant-parent reth2user@host# set ge-8/0/1 gigether-options redundant-parent reth0user@host# set ge-8/0/2 gigether-options redundant-parent reth1user@host# set ge-8/0/3 gigether-options redundant-parent reth2user@host# set reth0 redundant-ether-options redundancy-group 1user@host# set reth0 unit 0 family inet address 10.1.1.1/24user@host# set reth1 redundant-ether-options redundancy-group 1user@host# set reth1 unit 0 family inet address 10.2.2.2/24
211

user@host# set reth2 redundant-ether-options redundancy-group 2user@host# set reth2 unit 0 family inet address 10.3.3.3/24
Results
From configuration mode, confirm your configuration by entering the show chassis and show interfacescommands. If the output does not display the intended configuration, repeat the configurationinstructions in this example to correct it.
[edit]user@host# show chassis cluster { reth-count 3; redundancy-group 0 { node 0 priority 254; node 1 priority 1; } redundancy-group 1 { node 0 priority 200; node 1 priority 100; interface-monitor { ge-0/0/1 weight 130; ge-0/0/2 weight 140; ge-8/0/1 weight 150; ge-8/0/2 weight 120; } } redundancy-group 2 { node 0 priority 200; node 1 priority 100; interface-monitor { ge-0/0/3 weight 255; ge-8/0/3 weight 255; } } }[edit]user@host# show interfacesge-0/0/1 { gigether-options { redundant-parent reth0;
212

}}ge-0/0/2 { gigether-options { redundant-parent reth1; }}ge-0/0/3 { gigether-options { redundant-parent reth2; }}ge-8/0/1 { gigether-options { redundant-parent reth0; }}ge-8/0/2 { gigether-options { redundant-parent reth1; }}ge-8/0/3 { gigether-options { redundant-parent reth2; }}reth0 { redundant-ether-options { redundancy-group 1; } unit 0 { family inet { address 10.1.1.1/24; } }}reth1 { redundant-ether-options { redundancy-group 1; } unit 0 { family inet {
213

address 10.2.2.2/24; } }}reth2 { redundant-ether-options { redundancy-group 2; } unit 0 { family inet { address 10.3.3.3/24; } }}
If you are done configuring the device, enter commit from configuration mode.
Verification
IN THIS SECTION
Verifying Chassis Cluster Status | 215
Verifying Chassis Cluster Interfaces | 216
Verifying Chassis Cluster Information | 218
Verifying Interface ge-0/0/1 Status After Disabling Interface ge-0/0/1 of RG1 in Node 0 with a Weightof 130 | 220
Verifying Chassis Cluster Status After Disabling Interface ge-0/0/1 of RG1 in Node 0 with a Weight of130 | 220
Verifying Chassis Cluster Interfaces After Disabling Interface ge-0/0/1 of RG1 in Node 0 with a Weightof 130 | 222
Verifying Chassis Cluster Information After Disabling Interface ge-0/0/1 of RG1 in Node 0 with aWeight of 130 | 223
Verifying Interface ge-0/0/2 Is Disabled | 225
Verifying Chassis Cluster Status After Disabling Interface ge-0/0/2 | 226
Verifying Chassis Cluster Interfaces After Disabling Interface ge-0/0/2 | 227
Verifying Chassis Cluster Information After Disabling Interface ge-0/0/2 | 228
Verifying Interface Status After Disabling ge-0/0/3 | 230
Verifying Chassis Cluster Status After Disabling Interface ge-0/0/3 | 231
214
Verifying Chassis Cluster Interfaces After Disabling Interface ge-0/0/3 | 232
Verifying Chassis Cluster Information After Disabling Interface ge-0/0/3 | 233
Verifying That Interface ge-0/0/2 Is Enabled | 235
Verifying Chassis Cluster Status After Enabling Interface ge-0/0/2 | 236
Verifying Chassis Cluster Interfaces After Enabling Interface ge-0/0/2 | 237
Verifying Chassis Cluster Information After Enabling Interface ge-0/0/2 | 238
Verifying Chassis Cluster RG2 Preempt | 240
Verifying Chassis Cluster Status After Preempting RG2 | 241
Verifying That Interface ge-0/0/3 Is Enabled | 242
Verifying Chassis Cluster Status After Enabling Interface ge-0/0/3 | 243
Verifying Chassis Cluster Interfaces After Enabling Interface ge-0/0/3 | 244
Verifying Chassis Cluster Information After Enabling Interface ge-0/0/3 | 245
The following sections walk you through the process of verifying and (in some cases) troubleshootingthe interface status. The process shows you how to check the status of each interface in the redundancygroup, check them again after they have been disabled, and looks for details about each interface, untilyou have circled through all interfaces in the redundancy group.
In this example, you verify the process of the remaining threshold of a monitoring interface byconfiguring two interfaces from each node and mapping them to RG1, each with different weights. Youuse 130 and 140 for node 0 interfaces and 150 and 120 for node 1 interfaces. You configure oneinterface from each node and map the interfaces to RG2, each with the default weight of 255.
Verifying Chassis Cluster Status
Purpose
Verify the chassis cluster status, failover status, and redundancy group information.
Action
From operational mode, enter the show chassis cluster status command.
{primary:node0}user@host> show chassis cluster statusMonitor Failure codes:
215

CS Cold Sync monitoring FL Fabric Connection monitoring GR GRES monitoring HW Hardware monitoring IF Interface monitoring IP IP monitoring LB Loopback monitoring MB Mbuf monitoring NH Nexthop monitoring NP NPC monitoring SP SPU monitoring SM Schedule monitoring CF Config Sync monitoring Cluster ID: 2Node Priority Status Preempt Manual Monitor-failures Redundancy group: 0 , Failover count: 1node0 254 primary no no Nonenode1 1 secondary no no None Redundancy group: 1 , Failover count: 1node0 200 primary no no Nonenode1 100 secondary no no None Redundancy group: 2 , Failover count: 1node0 200 primary no no Nonenode1 100 secondary no no None
Meaning
Use the show chassis cluster status command to confirm that devices in the chassis cluster arecommunicating properly, with one device functioning as the primary node and the other as thesecondary node.
Verifying Chassis Cluster Interfaces
Purpose
Verify information about the statistics of the different objects being synchronized, the fabric and controlinterface hellos, and the status of the monitoring interfaces in the cluster.
216

Action
From operational mode, enter the show chassis cluster interfaces command.
{primary:node0}user@host> show chassis cluster interfacesControl link status: Up Control interfaces: Index Interface Monitored-Status Internal-SA 0 em0 Up Disabled 1 em1 Down Disabled Fabric link status: Up Fabric interfaces: Name Child-interface Status (Physical/Monitored) fab0 ge-0/0/0 Up / Up fab0 fab1 ge-8/0/0 Up / Up fab1 Redundant-ethernet Information: Name Status Redundancy-group reth0 Up 1 reth1 Up 1 reth2 Up 2 Redundant-pseudo-interface Information: Name Status Redundancy-group lo0 Up 0 Interface Monitoring: Interface Weight Status Redundancy-group ge-8/0/2 120 Up 1 ge-8/0/1 150 Up 1 ge-0/0/2 140 Up 1 ge-0/0/1 130 Up 1 ge-8/0/3 255 Up 2 ge-0/0/3 255 Up 2
217
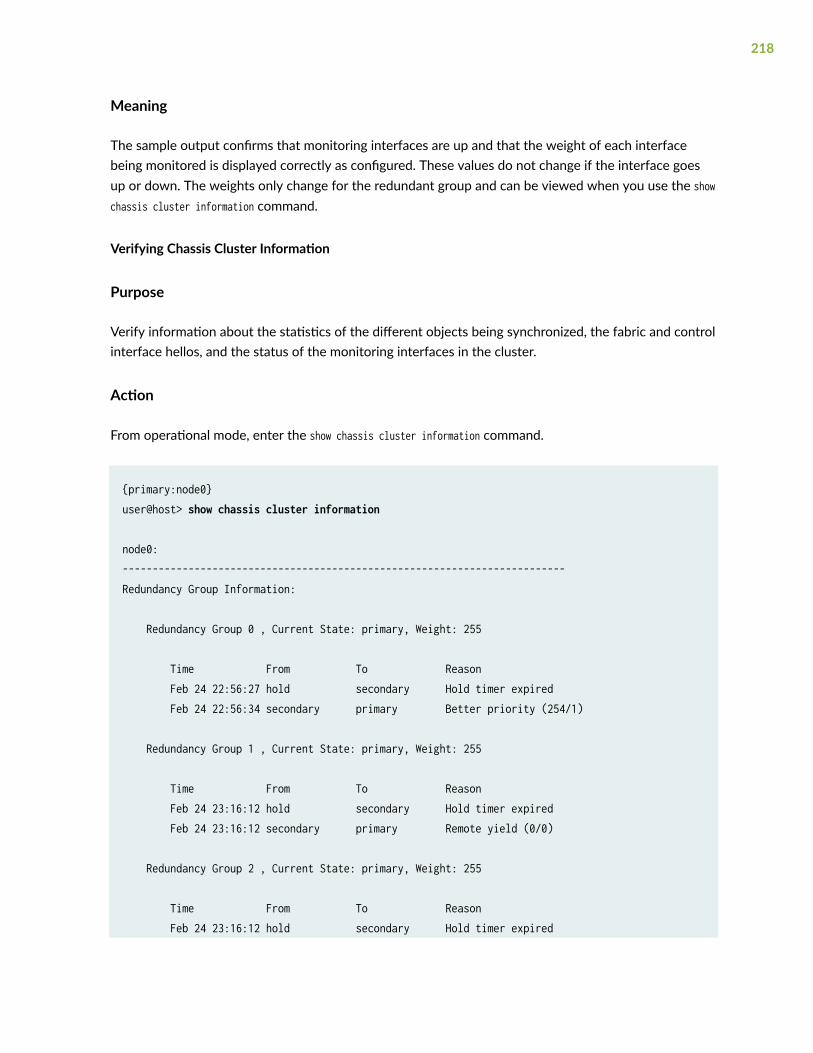
Meaning
The sample output confirms that monitoring interfaces are up and that the weight of each interfacebeing monitored is displayed correctly as configured. These values do not change if the interface goesup or down. The weights only change for the redundant group and can be viewed when you use the showchassis cluster information command.
Verifying Chassis Cluster Information
Purpose
Verify information about the statistics of the different objects being synchronized, the fabric and controlinterface hellos, and the status of the monitoring interfaces in the cluster.
Action
From operational mode, enter the show chassis cluster information command.
{primary:node0}user@host> show chassis cluster information
node0:--------------------------------------------------------------------------Redundancy Group Information: Redundancy Group 0 , Current State: primary, Weight: 255 Time From To Reason Feb 24 22:56:27 hold secondary Hold timer expired Feb 24 22:56:34 secondary primary Better priority (254/1) Redundancy Group 1 , Current State: primary, Weight: 255 Time From To Reason Feb 24 23:16:12 hold secondary Hold timer expired Feb 24 23:16:12 secondary primary Remote yield (0/0) Redundancy Group 2 , Current State: primary, Weight: 255 Time From To Reason Feb 24 23:16:12 hold secondary Hold timer expired
218
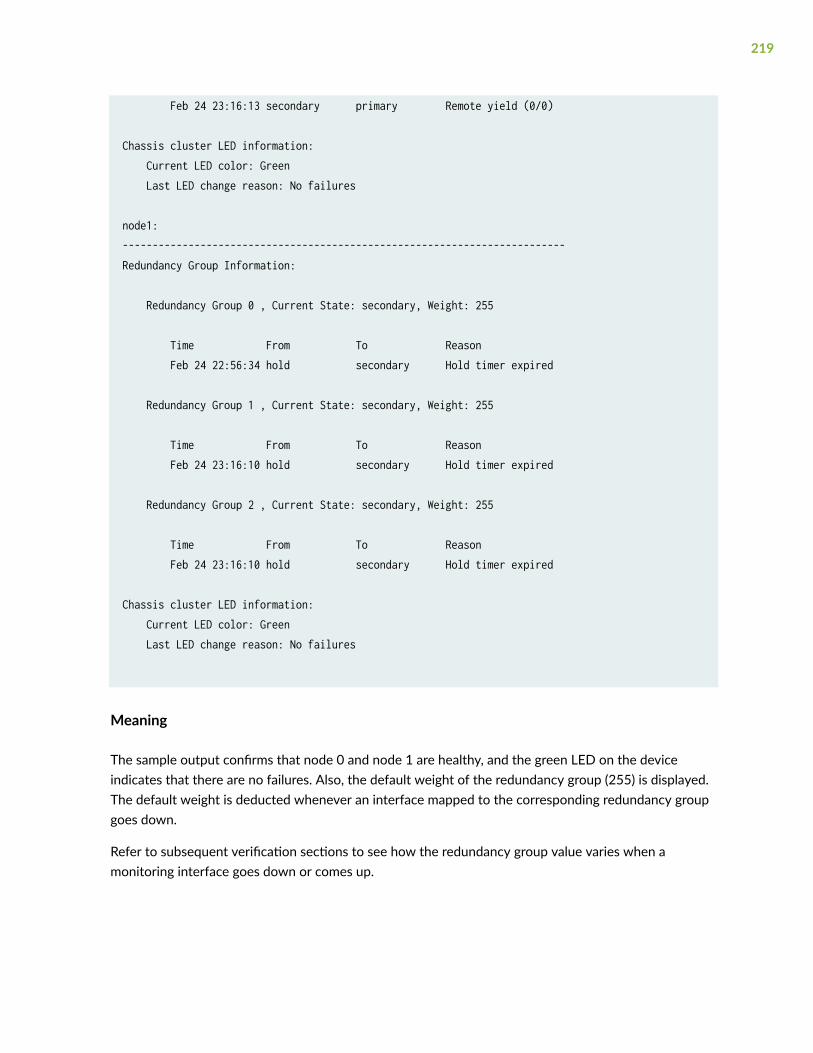
Feb 24 23:16:13 secondary primary Remote yield (0/0) Chassis cluster LED information: Current LED color: Green Last LED change reason: No failures node1:--------------------------------------------------------------------------Redundancy Group Information: Redundancy Group 0 , Current State: secondary, Weight: 255 Time From To Reason Feb 24 22:56:34 hold secondary Hold timer expired Redundancy Group 1 , Current State: secondary, Weight: 255 Time From To Reason Feb 24 23:16:10 hold secondary Hold timer expired Redundancy Group 2 , Current State: secondary, Weight: 255 Time From To Reason Feb 24 23:16:10 hold secondary Hold timer expired Chassis cluster LED information: Current LED color: Green Last LED change reason: No failures
Meaning
The sample output confirms that node 0 and node 1 are healthy, and the green LED on the deviceindicates that there are no failures. Also, the default weight of the redundancy group (255) is displayed.The default weight is deducted whenever an interface mapped to the corresponding redundancy groupgoes down.
Refer to subsequent verification sections to see how the redundancy group value varies when amonitoring interface goes down or comes up.
219

Verifying Interface ge-0/0/1 Status After Disabling Interface ge-0/0/1 of RG1 in Node 0 with a Weightof 130
Purpose
Verify that the interface ge-0/0/1 is disabled on node 0.
Action
From configuration mode, enter the set interface ge-0/0/1 disable command.
{primary:node0}user@host# set interface ge-0/0/1 disableuser@host# commit
node0:configuration check succeedsnode1:commit completenode0:commit complete {primary:node0}user@host# show interfaces ge-0/0/1disable;gigether-options { redundant-parent reth0;}
Meaning
The sample output confirms that interface ge-0/0/1 is disabled.
Verifying Chassis Cluster Status After Disabling Interface ge-0/0/1 of RG1 in Node 0 with a Weight of130
Purpose
Verify the chassis cluster status, failover status, and redundancy group information.
220

Action
From operational mode, enter the show chassis cluster status command.
{primary:node0}user@host> show chassis cluster statusMonitor Failure codes: CS Cold Sync monitoring FL Fabric Connection monitoring GR GRES monitoring HW Hardware monitoring IF Interface monitoring IP IP monitoring LB Loopback monitoring MB Mbuf monitoring NH Nexthop monitoring NP NPC monitoring SP SPU monitoring SM Schedule monitoring CF Config Sync monitoring Cluster ID: 2Node Priority Status Preempt Manual Monitor-failures Redundancy group: 0 , Failover count: 1node0 254 primary no no Nonenode1 1 secondary no no None Redundancy group: 1 , Failover count: 1node0 200 primary no no Nonenode1 100 secondary no no None Redundancy group: 2 , Failover count: 1node0 200 primary no no Nonenode1 100 secondary no no None
Meaning
Use the show chassis cluster status command to confirm that devices in the chassis cluster arecommunicating properly, with one device functioning as the primary node and the other as thesecondary node.
221

Verifying Chassis Cluster Interfaces After Disabling Interface ge-0/0/1 of RG1 in Node 0 with a Weightof 130
Purpose
Verify information about the statistics of the different objects being synchronized, the fabric and controlinterface hellos, and the status of the monitoring interfaces in the cluster.
Action
From operational mode, enter the show chassis cluster interfaces command.
{primary:node0}user@host> show chassis cluster interfacesControl link status: Up Control interfaces: Index Interface Monitored-Status Internal-SA 0 em0 Up Disabled 1 em1 Down Disabled Fabric link status: Up Fabric interfaces: Name Child-interface Status (Physical/Monitored) fab0 ge-0/0/0 Up / Up fab0 fab1 ge-8/0/0 Up / Up fab1 Redundant-ethernet Information: Name Status Redundancy-group reth0 Down 1 reth1 Up 1 reth2 Up 2 Redundant-pseudo-interface Information: Name Status Redundancy-group lo0 Up 0 Interface Monitoring:
222

Interface Weight Status Redundancy-group ge-8/0/2 120 Up 1 ge-8/0/1 150 Up 1 ge-0/0/2 140 Up 1 ge-0/0/1 130 Down 1 ge-8/0/3 255 Up 2 ge-0/0/3 255 Up 2
Meaning
The sample output confirms that monitoring interface ge-0/0/1 is down.
Verifying Chassis Cluster Information After Disabling Interface ge-0/0/1 of RG1 in Node 0 with aWeight of 130
Purpose
Verify information about the statistics of the different objects being synchronized, the fabric and controlinterface hellos, and the status of the monitoring interfaces in the cluster.
Action
From operational mode, enter the show chassis cluster information command.
{primary:node0}user@host> show chassis cluster information
node0:--------------------------------------------------------------------------Redundancy Group Information: Redundancy Group 0 , Current State: primary, Weight: 255 Time From To Reason Feb 24 22:56:27 hold secondary Hold timer expired Feb 24 22:56:34 secondary primary Better priority (254/1) Redundancy Group 1 , Current State: primary, Weight: 125 Time From To Reason Feb 24 23:16:12 hold secondary Hold timer expired
223

Feb 24 23:16:12 secondary primary Remote yield (0/0) Redundancy Group 2 , Current State: primary, Weight: 255 Time From To Reason Feb 24 23:16:12 hold secondary Hold timer expired Feb 24 23:16:13 secondary primary Remote yield (0/0) Chassis cluster LED information: Current LED color: Green Last LED change reason: No failures Failure Information: Interface Monitoring Failure Information: Redundancy Group 1, Monitoring status: Unhealthy Interface Status ge-0/0/1 Down node1:--------------------------------------------------------------------------Redundancy Group Information: Redundancy Group 0 , Current State: secondary, Weight: 255 Time From To Reason Feb 24 22:56:34 hold secondary Hold timer expired Redundancy Group 1 , Current State: secondary, Weight: 255 Time From To Reason Feb 24 23:16:10 hold secondary Hold timer expired Redundancy Group 2 , Current State: secondary, Weight: 255 Time From To Reason Feb 24 23:16:10 hold secondary Hold timer expired Chassis cluster LED information: Current LED color: Amber Last LED change reason: Monitored objects are down
224

Meaning
The sample output confirms that in node 0, the RG1 weight is reduced to 125 (that is, 255 minus 130)because monitoring interface ge-0/0/1 (weight of 130) went down. The monitoring status is unhealthy,the device LED is amber, and the interface status of ge-0/0/1 is down.
If interface ge-0/0/1 is brought back up, the weight of RG1 in node 0 becomes 255. Conversely, ifinterface ge-0/0/2 is also disabled, the weight of RG1 in node 0 becomes 0 or less (in this example, 125minus 140 = -15) and triggers failover, as indicated in the next verification section.
Verifying Interface ge-0/0/2 Is Disabled
Purpose
Verify that interface ge-0/0/2 is disabled on node 0.
Action
From configuration mode, enter the set interface ge-0/0/2 disable command.
{primary:node0}user@host# set interface ge-0/0/2 disableuser@host# commit
node0:configuration check succeedsnode1:commit completenode0:commit complete {primary:node0}user@host# show interfaces ge-0/0/2disable;gigether-options { redundant-parent reth1;}
Meaning
The sample output confirms that interface ge-0/0/2 is disabled.
225

Verifying Chassis Cluster Status After Disabling Interface ge-0/0/2
Purpose
Verify the chassis cluster status, failover status, and redundancy group information.
Action
From operational mode, enter the show chassis cluster status command.
{primary:node0}user@host> show chassis cluster statusMonitor Failure codes: CS Cold Sync monitoring FL Fabric Connection monitoring GR GRES monitoring HW Hardware monitoring IF Interface monitoring IP IP monitoring LB Loopback monitoring MB Mbuf monitoring NH Nexthop monitoring NP NPC monitoring SP SPU monitoring SM Schedule monitoring CF Config Sync monitoring Cluster ID: 2Node Priority Status Preempt Manual Monitor-failures Redundancy group: 0 , Failover count: 1node0 254 primary no no Nonenode1 1 secondary no no None Redundancy group: 1 , Failover count: 2node0 0 secondary no no IFnode1 100 primary no no None Redundancy group: 2 , Failover count: 1node0 200 primary no no Nonenode1 100 secondary no no None
Meaning
Use the show chassis cluster status command to confirm that devices in the chassis cluster arecommunicating properly, with one device functioning as the primary node and the other as the
226

secondary node. On RG1, you see interface failure, because both interfaces mapped to RG1 on node 0failed during interface monitoring.
Verifying Chassis Cluster Interfaces After Disabling Interface ge-0/0/2
Purpose
Verify information about chassis cluster interfaces.
Action
From operational mode, enter the show chassis cluster interfaces command.
{primary:node0}user@host> show chassis cluster interfacesControl link status: Up Control interfaces: Index Interface Monitored-Status Internal-SA 0 em0 Up Disabled 1 em1 Down Disabled Fabric link status: Up Fabric interfaces: Name Child-interface Status (Physical/Monitored) fab0 ge-0/0/0 Up / Up fab0 fab1 ge-8/0/0 Up / Up fab1 Redundant-ethernet Information: Name Status Redundancy-group reth0 Up 1 reth1 Up 1 reth2 Up 2 Redundant-pseudo-interface Information: Name Status Redundancy-group lo0 Up 0
227

Interface Monitoring: Interface Weight Status Redundancy-group ge-8/0/2 120 Up 1 ge-8/0/1 150 Up 1 ge-0/0/2 140 Down 1 ge-0/0/1 130 Down 1 ge-8/0/3 255 Up 2 ge-0/0/3 255 Up 2
Meaning
The sample output confirms that monitoring interfaces ge-0/0/1 and ge-0/0/2 are down.
Verifying Chassis Cluster Information After Disabling Interface ge-0/0/2
Purpose
Verify information about the statistics of the different objects being synchronized, the fabric and controlinterface hellos, and the status of the monitoring interfaces in the cluster.
Action
From operational mode, enter the show chassis cluster information command.
{primary:node0}user@host> show chassis cluster information
node0:--------------------------------------------------------------------------Redundancy Group Information: Redundancy Group 0 , Current State: primary, Weight: 255 Time From To Reason Feb 24 22:56:27 hold secondary Hold timer expired Feb 24 22:56:34 secondary primary Better priority (254/1) Redundancy Group 1 , Current State: secondary, Weight: -15 Time From To Reason Feb 24 23:16:12 hold secondary Hold timer expired
228

Feb 24 23:16:12 secondary primary Remote yield (0/0) Feb 24 23:31:36 primary secondary-hold Monitor failed: IF Feb 24 23:31:37 secondary-hold secondary Ready to become secondary Redundancy Group 2 , Current State: primary, Weight: 255 Time From To Reason Feb 24 23:16:12 hold secondary Hold timer expired Feb 24 23:16:13 secondary primary Remote yield (0/0) Chassis cluster LED information: Current LED color: Amber Last LED change reason: Monitored objects are down Failure Information: Interface Monitoring Failure Information: Redundancy Group 1, Monitoring status: Failed Interface Status ge-0/0/2 Down ge-0/0/1 Down node1:--------------------------------------------------------------------------Redundancy Group Information: Redundancy Group 0 , Current State: secondary, Weight: 255 Time From To Reason Feb 24 22:56:34 hold secondary Hold timer expired Redundancy Group 1 , Current State: primary, Weight: 255 Time From To Reason Feb 24 23:16:10 hold secondary Hold timer expired Feb 24 23:31:36 secondary primary Remote is in secondary hold Redundancy Group 2 , Current State: secondary, Weight: 255 Time From To Reason Feb 24 23:16:10 hold secondary Hold timer expired Chassis cluster LED information:
229

Current LED color: Amber Last LED change reason: Monitored objects are down
Meaning
The sample output confirms that in node 0, monitoring interfaces ge-0/0/1 and ge-0/0/2 are down. Theweight of RG1 on node 0 reached zero value, which triggered RG1 failover during use of the show chassiscluster status command.
For RG2, the default weight of 255 is set for redundant Ethernet interface 2 (reth2). When interfacemonitoring is required, we recommend that you use the default weight when you do not have backuplinks like those in RG1. That is, if interface ge-0/0/3 is disabled, it immediately triggers failover becausethe weight becomes 0 (255 minus 225), as indicated in the next verification section.
Verifying Interface Status After Disabling ge-0/0/3
Purpose
Verify that interface ge-0/0/3 is disabled on node 0.
Action
From configuration mode, enter the set interface ge-0/0/3 disable command.
{primary:node0}user@host# set interface ge-0/0/3 disableuser@host# commit
node0:configuration check succeedsnode1:commit completenode0:commit complete {primary:node0}user@host# show interfaces ge-0/0/3disable;gigether-options {
230

redundant-parent reth2;}
Meaning
The sample output confirms that interface ge-0/0/3 is disabled.
Verifying Chassis Cluster Status After Disabling Interface ge-0/0/3
Purpose
Verify the chassis cluster status, failover status, and redundancy group information.
Action
From operational mode, enter the show chassis cluster status command.
{primary:node0}user@host> show chassis cluster statusMonitor Failure codes: CS Cold Sync monitoring FL Fabric Connection monitoring GR GRES monitoring HW Hardware monitoring IF Interface monitoring IP IP monitoring LB Loopback monitoring MB Mbuf monitoring NH Nexthop monitoring NP NPC monitoring SP SPU monitoring SM Schedule monitoring CF Config Sync monitoring Cluster ID: 2Node Priority Status Preempt Manual Monitor-failures Redundancy group: 0 , Failover count: 1node0 254 primary no no Nonenode1 1 secondary no no None Redundancy group: 1 , Failover count: 2node0 0 secondary no no IFnode1 100 primary no no None Redundancy group: 2 , Failover count: 2
231

node0 0 secondary no no IFnode1 100 primary no no None
Meaning
Use the show chassis cluster status command to confirm that devices in the chassis cluster arecommunicating properly, with one device functioning as the primary node and the other as thesecondary node.
Verifying Chassis Cluster Interfaces After Disabling Interface ge-0/0/3
Purpose
Verify information about chassis cluster interfaces.
Action
From operational mode, enter the show chassis cluster interfaces command.
{primary:node0}user@host> show chassis cluster interfacesControl link status: Up Control interfaces: Index Interface Monitored-Status Internal-SA 0 em0 Up Disabled 1 em1 Down Disabled Fabric link status: Up Fabric interfaces: Name Child-interface Status (Physical/Monitored) fab0 ge-0/0/0 Up / Up fab0 fab1 ge-8/0/0 Up / Up fab1 Redundant-ethernet Information: Name Status Redundancy-group reth0 Up 1
232

reth1 Up 1 reth2 Up 2 Redundant-pseudo-interface Information: Name Status Redundancy-group lo0 Up 0 Interface Monitoring: Interface Weight Status Redundancy-group ge-8/0/2 120 Up 1 ge-8/0/1 150 Up 1 ge-0/0/2 140 Down 1 ge-0/0/1 130 Down 1 ge-8/0/3 255 Up 2 ge-0/0/3 255 Down 2
Meaning
The sample output confirms that monitoring interfaces ge-0/0/1, ge-0/0/2, and ge-0/0/3 are down.
Verifying Chassis Cluster Information After Disabling Interface ge-0/0/3
Purpose
Verify information about the statistics of the different objects being synchronized, the fabric and controlinterface hellos, and the status of the monitoring interfaces in the cluster.
Action
From operational mode, enter the show chassis cluster information command.
{primary:node0}user@host> show chassis cluster information
node0:--------------------------------------------------------------------------Redundancy Group Information: Redundancy Group 0 , Current State: primary, Weight: 255 Time From To Reason
233

Feb 24 22:56:27 hold secondary Hold timer expired Feb 24 22:56:34 secondary primary Better priority (254/1) Redundancy Group 1 , Current State: secondary, Weight: -15 Time From To Reason Feb 24 23:16:12 hold secondary Hold timer expired Feb 24 23:16:12 secondary primary Remote yield (0/0) Feb 24 23:31:36 primary secondary-hold Monitor failed: IF Feb 24 23:31:37 secondary-hold secondary Ready to become secondary Redundancy Group 2 , Current State: secondary, Weight: 0 Time From To Reason Feb 24 23:16:12 hold secondary Hold timer expired Feb 24 23:16:13 secondary primary Remote yield (0/0) Feb 24 23:35:57 primary secondary-hold Monitor failed: IF Feb 24 23:35:58 secondary-hold secondary Ready to become secondary Chassis cluster LED information: Current LED color: Amber Last LED change reason: Monitored objects are down Failure Information: Interface Monitoring Failure Information: Redundancy Group 1, Monitoring status: Failed Interface Status ge-0/0/2 Down ge-0/0/1 Down Redundancy Group 2, Monitoring status: Failed Interface Status ge-0/0/3 Down node1:--------------------------------------------------------------------------Redundancy Group Information: Redundancy Group 0 , Current State: secondary, Weight: 255 Time From To Reason Feb 24 22:56:34 hold secondary Hold timer expired
234
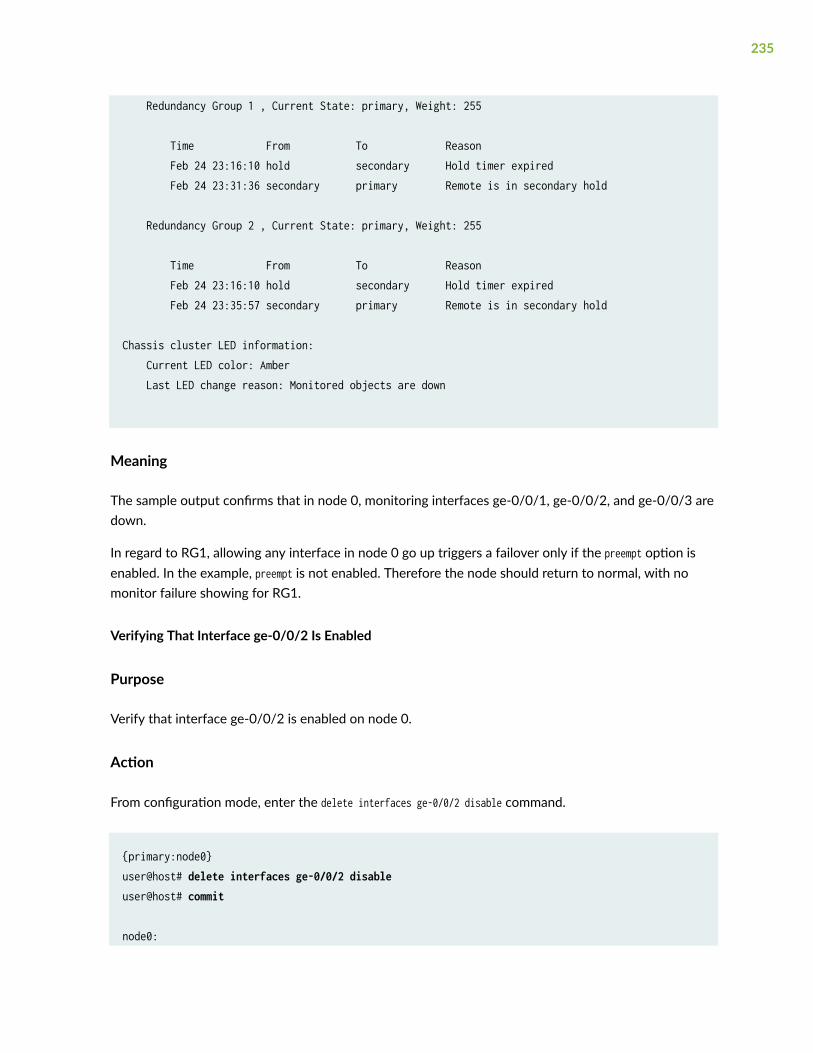
Redundancy Group 1 , Current State: primary, Weight: 255 Time From To Reason Feb 24 23:16:10 hold secondary Hold timer expired Feb 24 23:31:36 secondary primary Remote is in secondary hold Redundancy Group 2 , Current State: primary, Weight: 255 Time From To Reason Feb 24 23:16:10 hold secondary Hold timer expired Feb 24 23:35:57 secondary primary Remote is in secondary hold Chassis cluster LED information: Current LED color: Amber Last LED change reason: Monitored objects are down
Meaning
The sample output confirms that in node 0, monitoring interfaces ge-0/0/1, ge-0/0/2, and ge-0/0/3 aredown.
In regard to RG1, allowing any interface in node 0 go up triggers a failover only if the preempt option isenabled. In the example, preempt is not enabled. Therefore the node should return to normal, with nomonitor failure showing for RG1.
Verifying That Interface ge-0/0/2 Is Enabled
Purpose
Verify that interface ge-0/0/2 is enabled on node 0.
Action
From configuration mode, enter the delete interfaces ge-0/0/2 disable command.
{primary:node0}user@host# delete interfaces ge-0/0/2 disableuser@host# commit
node0:
235

configuration check succeedsnode1:commit completenode0:commit complete
Meaning
The sample output confirms that interface ge-0/0/2 disable is deleted.
Verifying Chassis Cluster Status After Enabling Interface ge-0/0/2
Purpose
Verify the chassis cluster status, failover status, and redundancy group information.
Action
From operational mode, enter the show chassis cluster status command.
{primary:node0}user@host> show chassis cluster statusMonitor Failure codes: CS Cold Sync monitoring FL Fabric Connection monitoring GR GRES monitoring HW Hardware monitoring IF Interface monitoring IP IP monitoring LB Loopback monitoring MB Mbuf monitoring NH Nexthop monitoring NP NPC monitoring SP SPU monitoring SM Schedule monitoring CF Config Sync monitoring Cluster ID: 2Node Priority Status Preempt Manual Monitor-failures Redundancy group: 0 , Failover count: 1node0 254 primary no no Nonenode1 1 secondary no no None Redundancy group: 1 , Failover count: 2node0 200 secondary no no None
236

node1 100 primary no no None Redundancy group: 2 , Failover count: 2node0 0 secondary no no IFnode1 100 primary no no None
Meaning
Use the show chassis cluster status command to confirm that devices in the chassis cluster arecommunicating properly, with as one device functioning as the primary node and the other as thesecondary node.
Verifying Chassis Cluster Interfaces After Enabling Interface ge-0/0/2
Purpose
Verify information about chassis cluster interfaces.
Action
From operational mode, enter the show chassis cluster interfaces command.
{primary:node0}user@host> show chassis cluster interfacesControl link status: Up Control interfaces: Index Interface Monitored-Status Internal-SA 0 em0 Up Disabled 1 em1 Down Disabled Fabric link status: Up Fabric interfaces: Name Child-interface Status (Physical/Monitored) fab0 ge-0/0/0 Up / Up fab0 fab1 ge-8/0/0 Up / Up fab1
237

Redundant-ethernet Information: Name Status Redundancy-group reth0 Up 1 reth1 Up 1 reth2 Up 2 Redundant-pseudo-interface Information: Name Status Redundancy-group lo0 Up 0 Interface Monitoring: Interface Weight Status Redundancy-group ge-8/0/2 120 Up 1 ge-8/0/1 150 Up 1 ge-0/0/2 140 Up 1 ge-0/0/1 130 Down 1 ge-8/0/3 255 Up 2 ge-0/0/3 255 Down 2
Meaning
The sample output confirms that monitoring interfaces ge-0/0/1 and ge-0/0/3 are down. Monitoringinterface ge-0/0/2 is up after the disable has been deleted.
Verifying Chassis Cluster Information After Enabling Interface ge-0/0/2
Purpose
Verify information about the statistics of the different objects being synchronized, the fabric and controlinterface hellos, and the status of the monitoring interfaces in the cluster.
Action
From operational mode, enter the show chassis cluster information command.
{primary:node0}user@host> show chassis cluster information
node0:--------------------------------------------------------------------------Redundancy Group Information:
238

Redundancy Group 0 , Current State: primary, Weight: 255 Time From To Reason Feb 24 22:56:27 hold secondary Hold timer expired Feb 24 22:56:34 secondary primary Better priority (254/1) Redundancy Group 1 , Current State: secondary, Weight: 125 Time From To Reason Feb 24 23:16:12 hold secondary Hold timer expired Feb 24 23:16:12 secondary primary Remote yield (0/0) Feb 24 23:31:36 primary secondary-hold Monitor failed: IF Feb 24 23:31:37 secondary-hold secondary Ready to become secondary Redundancy Group 2 , Current State: secondary, Weight: 0 Time From To Reason Feb 24 23:16:12 hold secondary Hold timer expired Feb 24 23:16:13 secondary primary Remote yield (0/0) Feb 24 23:35:57 primary secondary-hold Monitor failed: IF Feb 24 23:35:58 secondary-hold secondary Ready to become secondary Chassis cluster LED information: Current LED color: Amber Last LED change reason: Monitored objects are down Failure Information: Interface Monitoring Failure Information: Redundancy Group 1, Monitoring status: Unhealthy Interface Status ge-0/0/1 Down Redundancy Group 2, Monitoring status: Failed Interface Status ge-0/0/3 Down node1:--------------------------------------------------------------------------Redundancy Group Information: Redundancy Group 0 , Current State: secondary, Weight: 255
239
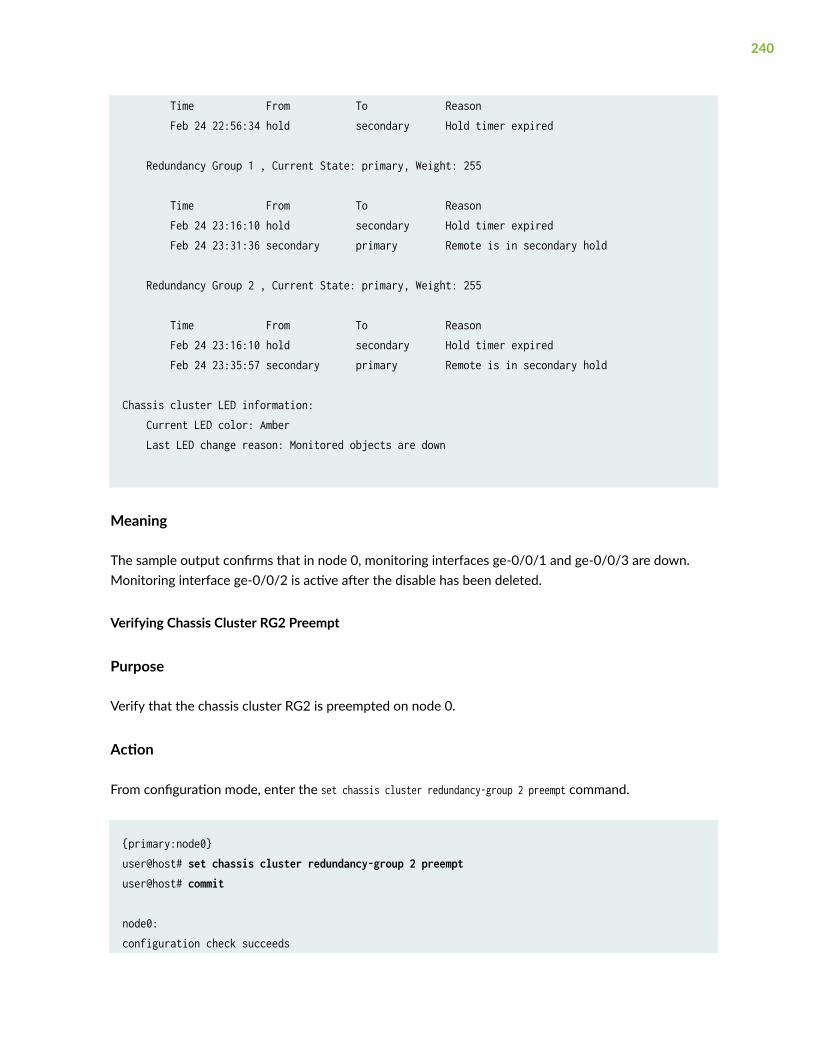
Time From To Reason Feb 24 22:56:34 hold secondary Hold timer expired Redundancy Group 1 , Current State: primary, Weight: 255 Time From To Reason Feb 24 23:16:10 hold secondary Hold timer expired Feb 24 23:31:36 secondary primary Remote is in secondary hold Redundancy Group 2 , Current State: primary, Weight: 255 Time From To Reason Feb 24 23:16:10 hold secondary Hold timer expired Feb 24 23:35:57 secondary primary Remote is in secondary hold Chassis cluster LED information: Current LED color: Amber Last LED change reason: Monitored objects are down
Meaning
The sample output confirms that in node 0, monitoring interfaces ge-0/0/1 and ge-0/0/3 are down.Monitoring interface ge-0/0/2 is active after the disable has been deleted.
Verifying Chassis Cluster RG2 Preempt
Purpose
Verify that the chassis cluster RG2 is preempted on node 0.
Action
From configuration mode, enter the set chassis cluster redundancy-group 2 preempt command.
{primary:node0}user@host# set chassis cluster redundancy-group 2 preemptuser@host# commit
node0:configuration check succeeds
240

node1:commit completenode0:commit complete
Meaning
The sample output confirms that chassis cluster RG2 preempted on node 0.
In the next section, you check that RG2 fails over back to node 0 when preempt is enabled when thedisabled node 0 interface is brought online.
Verifying Chassis Cluster Status After Preempting RG2
Purpose
Verify the chassis cluster status, failover status, and redundancy group information.
Action
From operational mode, enter the show chassis cluster status command.
{primary:node0}user@host> show chassis cluster statusMonitor Failure codes: CS Cold Sync monitoring FL Fabric Connection monitoring GR GRES monitoring HW Hardware monitoring IF Interface monitoring IP IP monitoring LB Loopback monitoring MB Mbuf monitoring NH Nexthop monitoring NP NPC monitoring SP SPU monitoring SM Schedule monitoring CF Config Sync monitoring Cluster ID: 2Node Priority Status Preempt Manual Monitor-failures Redundancy group: 0 , Failover count: 1node0 254 primary no no Nonenode1 1 secondary no no None
241
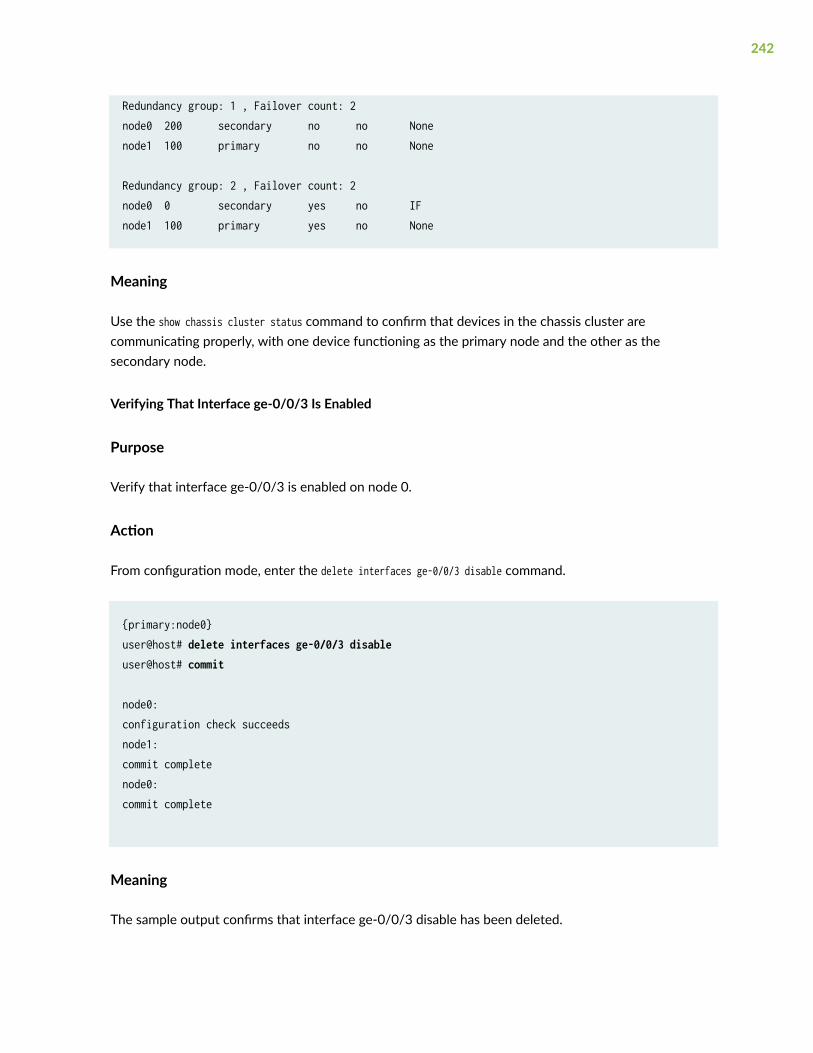
Redundancy group: 1 , Failover count: 2node0 200 secondary no no Nonenode1 100 primary no no None Redundancy group: 2 , Failover count: 2node0 0 secondary yes no IFnode1 100 primary yes no None
Meaning
Use the show chassis cluster status command to confirm that devices in the chassis cluster arecommunicating properly, with one device functioning as the primary node and the other as thesecondary node.
Verifying That Interface ge-0/0/3 Is Enabled
Purpose
Verify that interface ge-0/0/3 is enabled on node 0.
Action
From configuration mode, enter the delete interfaces ge-0/0/3 disable command.
{primary:node0}user@host# delete interfaces ge-0/0/3 disableuser@host# commit
node0:configuration check succeedsnode1:commit completenode0:commit complete
Meaning
The sample output confirms that interface ge-0/0/3 disable has been deleted.
242

Verifying Chassis Cluster Status After Enabling Interface ge-0/0/3
Purpose
Verify the chassis cluster status, failover status, and redundancy group information.
Action
From operational mode, enter the show chassis cluster status command.
{primary:node0}user@host> show chassis cluster statusMonitor Failure codes: CS Cold Sync monitoring FL Fabric Connection monitoring GR GRES monitoring HW Hardware monitoring IF Interface monitoring IP IP monitoring LB Loopback monitoring MB Mbuf monitoring NH Nexthop monitoring NP NPC monitoring SP SPU monitoring SM Schedule monitoring CF Config Sync monitoring Cluster ID: 2Node Priority Status Preempt Manual Monitor-failures Redundancy group: 0 , Failover count: 1node0 254 primary no no Nonenode1 1 secondary no no None Redundancy group: 1 , Failover count: 2node0 200 secondary no no Nonenode1 100 primary no no None Redundancy group: 2 , Failover count: 3node0 200 primary yes no Nonenode1 100 secondary yes no None
Meaning
Use the show chassis cluster status command to confirm that devices in the chassis cluster arecommunicating properly, with one device functioning as the primary node and the other as thesecondary node.
243
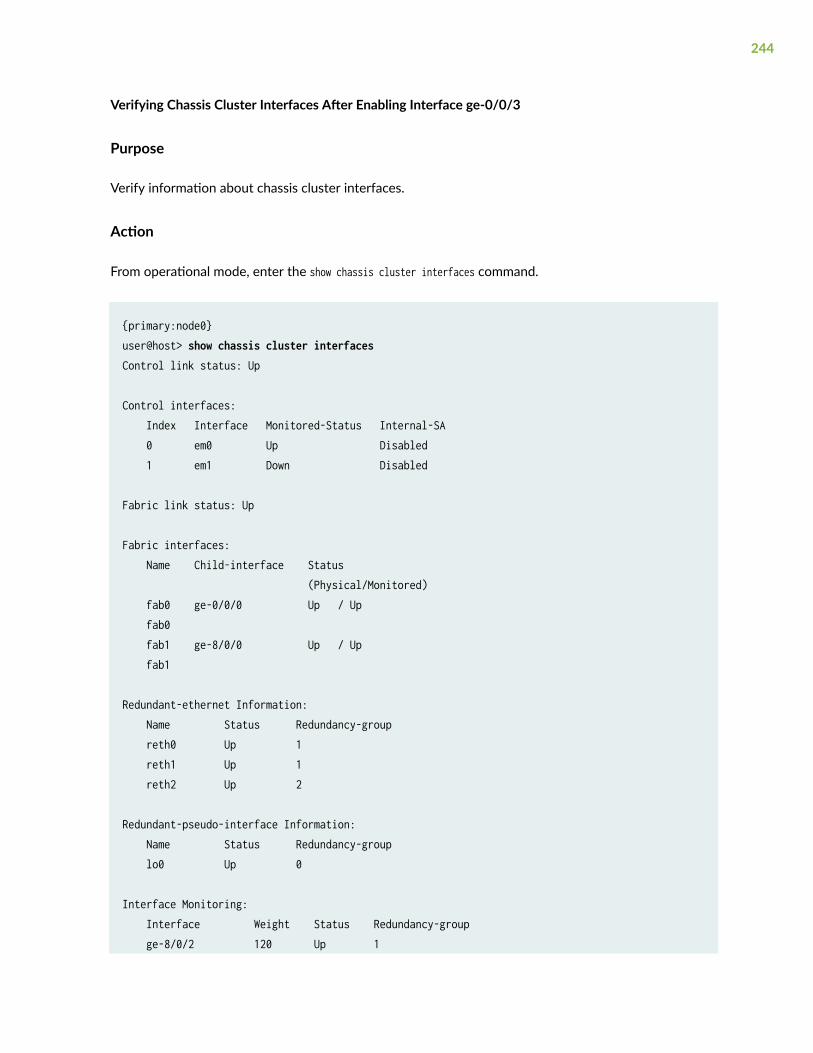
Verifying Chassis Cluster Interfaces After Enabling Interface ge-0/0/3
Purpose
Verify information about chassis cluster interfaces.
Action
From operational mode, enter the show chassis cluster interfaces command.
{primary:node0}user@host> show chassis cluster interfacesControl link status: Up Control interfaces: Index Interface Monitored-Status Internal-SA 0 em0 Up Disabled 1 em1 Down Disabled Fabric link status: Up Fabric interfaces: Name Child-interface Status (Physical/Monitored) fab0 ge-0/0/0 Up / Up fab0 fab1 ge-8/0/0 Up / Up fab1 Redundant-ethernet Information: Name Status Redundancy-group reth0 Up 1 reth1 Up 1 reth2 Up 2 Redundant-pseudo-interface Information: Name Status Redundancy-group lo0 Up 0 Interface Monitoring: Interface Weight Status Redundancy-group ge-8/0/2 120 Up 1
244

ge-8/0/1 150 Up 1 ge-0/0/2 140 Up 1 ge-0/0/1 130 Down 1 ge-8/0/3 255 Up 2 ge-0/0/3 255 Up 2
Meaning
The sample output confirms that monitoring interface ge-0/0/1 is down. Monitoring interfacesge-0/0/2, and ge-0/0/3 are up after deleting the disable.
Verifying Chassis Cluster Information After Enabling Interface ge-0/0/3
Purpose
Verify information about the statistics of the different objects being synchronized, the fabric and controlinterface hellos, and the status of the monitoring interfaces in the cluster.
Action
From operational mode, enter the show chassis cluster information command.
{primary:node0}user@host> show chassis cluster information
node0:--------------------------------------------------------------------------Redundancy Group Information: Redundancy Group 0 , Current State: primary, Weight: 255 Time From To Reason Feb 24 22:56:27 hold secondary Hold timer expired Feb 24 22:56:34 secondary primary Better priority (254/1) Redundancy Group 1 , Current State: secondary, Weight: 125 Time From To Reason Feb 24 23:16:12 hold secondary Hold timer expired Feb 24 23:16:12 secondary primary Remote yield (0/0) Feb 24 23:31:36 primary secondary-hold Monitor failed: IF
245

Feb 24 23:31:37 secondary-hold secondary Ready to become secondary Redundancy Group 2 , Current State: primary, Weight: 255 Time From To Reason Feb 24 23:16:12 hold secondary Hold timer expired Feb 24 23:16:13 secondary primary Remote yield (0/0) Feb 24 23:35:57 primary secondary-hold Monitor failed: IF Feb 24 23:35:58 secondary-hold secondary Ready to become secondary Feb 24 23:45:45 secondary primary Remote is in secondary hold Chassis cluster LED information: Current LED color: Green Last LED change reason: No failures Failure Information: Interface Monitoring Failure Information: Redundancy Group 1, Monitoring status: Unhealthy Interface Status ge-0/0/1 Down node1:--------------------------------------------------------------------------Redundancy Group Information: Redundancy Group 0 , Current State: secondary, Weight: 255 Time From To Reason Feb 24 22:56:34 hold secondary Hold timer expired Redundancy Group 1 , Current State: primary, Weight: 255 Time From To Reason Feb 24 23:16:10 hold secondary Hold timer expired Feb 24 23:31:36 secondary primary Remote is in secondary hold Redundancy Group 2 , Current State: secondary, Weight: 255 Time From To Reason Feb 24 23:16:10 hold secondary Hold timer expired Feb 24 23:35:57 secondary primary Remote is in secondary hold Feb 24 23:45:45 primary secondary-hold Preempt (100/200)
246

Feb 24 23:45:46 secondary-hold secondary Ready to become secondary Chassis cluster LED information: Current LED color: Amber Last LED change reason: Monitored objects are down
Meaning
The sample output confirms that in node 0, monitoring interface ge-0/0/1 is down. RG2 on node 0 stateis back to primary state (because of the preempt enable) with a healthy weight of 255 when interfacege-0/0/3 is back up.
SEE ALSO
Example: Configuring Chassis Cluster Redundancy Groups | 97
RELATED DOCUMENTATION
Monitoring IP Addresses on a Chassis Cluster | 247
Configuring Cluster Failover Parameters | 268
Chassis Cluster Redundancy Group Failover | 274
Monitoring IP Addresses on a Chassis Cluster
IN THIS SECTION
IP Monitoring Overview | 248
Understanding Chassis Cluster Redundancy Group IP Address Monitoring | 251
Example: Configuring Chassis Cluster Redundancy Group IP Address Monitoring | 253
Example: Configuring IP Monitoring on SRX5000 Line Devices for IOC2 and IOC3 | 258
247

Redundancy group IP address monitoring checks end-to-end connectivity and allows a redundancygroup to fail over if reth interface fails to reach a configured IP address. Redundancy groups on bothdevices in a cluster can be configured to monitor specific IP addresses to determine whether anupstream device in the network is reachable. For more information, see the following topics:
IP Monitoring Overview
IN THIS SECTION
Benefits of Monitoring IP Addresses in a Chassis Cluster | 250
IP monitoring checks the end-to-end connectivity of configured IP addresses and allows a redundancygroup to automatically fail over when the monitored IP address is not reachable through the redundantEthernet (reth) interface. Both the primary and secondary nodes in the chassis cluster monitor specific IPaddresses to determine whether an upstream device in the network is reachable.
IP monitoring allows for failover based upon end to-end reachability of a configured monitored IPaddress. On SRX Series devices, the reachability test is done by sending a ping to the monitored IPaddress from both the primary node and the secondary node through the reth interface and checking ifa response is returned. The monitored IP address can be on a directly connected host in the samesubnet as the reth interface or on a remote device reachable through a next-hop router.
The reachability states of the monitored IP address are reachable, unreachable, and unknown. The statusis “unknown” if Packet Forwarding Engines are not yet up and running. The status changes to either"reachable" or "unreachable," depending on the corresponding message from the Packet ForwardingEngine.
We do not recommend configuring chassis cluster IP monitoring on Redundancy Group 0 (RG0) for SRXSeries devices.
Table 18 on page 249 provides details of different combinations of monitored results from both theprimary and secondary nodes, and the corresponding actions by the Juniper Services RedundancyProtocol (jsrpd) process.
248

Table 18: IP Monitoring Results and Failover Action
Primary Node Monitored Status Secondary Node Monitored Status Failover Action
Reachable Reachable No action
Unreachable Reachable Failover
Reachable Unreachable No action
Unreachable Unreachable No action
• You can configure up to 64 IP addresses for IP monitoring on SRX5000 line devices.
• On SRX Branch Series devices, when the reth interface has more than one physical interfaceconfigured, IP monitoring for redundant groups is not supported. The SRX uses the lowest interfacein the bundle for tracking on the secondary node. If the peer forwards the reply on any other portexcept the one it received it on, the SRX drops it.
• The minimum interval of IP monitoring is 1 second and the maximum is 30 seconds. Default intervalis 1 second.
• The minimum threshold of IP monitoring is 5 requests and the maximum is 15 requests. If the IPmonitoring request does not receive a response for consecutive requests (exceeding the thresholdvalue), IP monitoring reports that the monitored IP is unreachable. Default value for the threshold is5.
• Reth interface not associated with Redundancy Group (RG) in IP monitoring CLI configuration issupported.
Table 19 on page 249 provides details on multiple interface combinations of IOC2 and IOC3 withmaximum MAC numbers.
Table 19: Maximum MACs Supported for IP Monitoring on IOC2 and IOC3
Cards Interfaces Maximum MACs Supported forIP Monitoring
IOC2 (SRX5K-MPC) 10XGE 10
249

Table 19: Maximum MACs Supported for IP Monitoring on IOC2 and IOC3 (Continued)
Cards Interfaces Maximum MACs Supported forIP Monitoring
20GE 20
2X40GE 2
1X100GE 1
IOC3 (SRX5K-MPC3-40G10G or SRX5K-MPC3-100G10G)
24x10GE 24
6x40GE 6
2x100GE + 4x10GE 6
Note the following limitations for IP monitoring support on SRX5000 line IOC2 and IOC3:
• IP monitoring is supported through the reth or the RLAG interface. If your configuration does notspecify either of these interfaces, the route lookup returns a non-reth/RLAG interface, which resultsin a failure report.
• Equal-cost multipath (ECMP) routing is not supported in IP monitoring.
Benefits of Monitoring IP Addresses in a Chassis Cluster
• Helps determine the status of a specific IP address in a Chassis Cluster setup as unknown, reachableor unreachable.
• Initiates failover based upon end to-end reachability of a configured monitored IP address. If themonitored IP address becomes unreachable, the redundancy group can fail over to its backup tomaintain service.
SEE ALSO
SRX5400, SRX5600, and SRX5800 Services Gateway Card Overview
Chassis Cluster Redundancy Groups | 93
250

Understanding Chassis Cluster Redundancy Group IP Address Monitoring
Redundancy group IP address monitoring checks end-to-end connectivity and allows a redundancygroup to fail over because of the inability of a redundant Ethernet interface (known as a reth) to reach aconfigured IP address. Redundancy groups on both devices in a cluster can be configured to monitorspecific IP addresses to determine whether an upstream device in the network is reachable. Theredundancy group can be configured such that if the monitored IP address becomes unreachable, theredundancy group will fail over to its backup to maintain service. The primary difference between thismonitoring feature and interface monitoring is that IP address monitoring allows for failover when theinterface is still up but the network device it is connected to is not reachable for some reason. It may bepossible under those circumstances for the other node in the cluster to route traffic around the problem.
If you want to dampen the failovers occurring because of IP address monitoring failures, use the hold-down-interval statement.
IP address monitoring configuration allows you to set not only the address to monitor and its failoverweight but also a global IP address monitoring threshold and weight. Only after the IP addressmonitoring global-threshold is reached because of cumulative monitored address reachability failure willthe IP address monitoring global-weight value be deducted from the redundant group’s failoverthreshold. Thus, multiple addresses can be monitored simultaneously as well as monitored to reflecttheir importance to maintaining traffic flow. Also, the threshold value of an IP address that isunreachable and then becomes reachable again will be restored to the monitoring threshold. This willnot, however, cause a failback unless the preempt option has been enabled.
When configured, the IP address monitoring failover value (global-weight) is considered along withinterface monitoring—if set—and built-in failover monitoring, including SPU monitoring, cold-syncmonitoring, and NPC monitoring (on supported platforms). The main IP addresses that should bemonitored are router gateway addresses to ensure that valid traffic coming into the services gatewaycan be forwarded to the appropriate network router.
Starting in Junos OS Release 12.1X46-D35 and Junos OS Release 17.3R1, for all SRX Series devices, thereth interface supports proxy ARP.
One Services Processing Unit (SPU) or Packet Forwarding Engine (PFE) per node is designated to sendInternet Control Message Protocol (ICMP) ping packets for the monitored IP addresses on the cluster.The primary PFE sends ping packets using Address Resolution Protocol (ARP) requests resolved by theRouting Engine (RE). The source for these pings is the redundant Ethernet interface MAC and IPaddresses. The secondary PFE resolves ARP requests for the monitored IP address itself. The source forthese pings is the physical child MAC address and a secondary IP address configured on the redundantEthernet interface. For the ping reply to be received on the secondary interface, the I/O card (IOC),central PFE processor, or Flex IOC adds both the physical child MAC address and the redundantEthernet interface MAC address to its MAC table. The secondary PFE responds with the physical childMAC address to ARP requests sent to the secondary IP address configured on the redundant Ethernetinterface.
251

NOTE: IP address monitoring is not supported on SRX5000 line devices if the redundantEthernet interface is configured for a VPN routing and forwarding (VRF) instance.
The default interval to check the reachability of a monitored IP address is once per second. The intervalcan be adjusted using the retry-interval command. The default number of permitted consecutive failedping attempts is 5. The number of allowed consecutive failed ping attempts can be adjusted using theretry-count command. After failing to reach a monitored IP address for the configured number ofconsecutive attempts, the IP address is determined to be unreachable and its failover value is deductedfrom the redundancy group's global-threshold.
On SRX5600 and SRX5800 devices, only two of the 10 ports on each PIC of 40-port 1-Gigabit EthernetI/O cards (IOCs) can simultaneously enable IP address monitoring. Because there are four PICs per IOC,this permits a total of eight ports per IOC to be monitored. If more than two ports per PIC on 40-port 1-Gigabit Ethernet IOCs are configured for IP address monitoring, the commit will succeed but a log entrywill be generated, and the accuracy and stability of IP address monitoring cannot be ensured. Thislimitation does not apply to any other IOCs or devices.
Once the IP address is determined to be unreachable, its weight is deducted from the global-threshold.If the recalculated global-threshold value is not 0, the IP address is marked unreachable, but the global-weight is not deducted from the redundancy group’s threshold. If the redundancy group IP monitoringglobal-threshold reaches 0 and there are unreachable IP addresses, the redundancy group willcontinuously fail over and fail back between the nodes until either an unreachable IP address becomesreachable or a configuration change removes unreachable IP addresses from monitoring. Note that bothdefault and configured hold-down-interval failover dampening is still in effect.
Every redundancy group x has a threshold tolerance value initially set to 255. When an IP addressmonitored by redundancy group x becomes unavailable, its weight is subtracted from the redundancygroup x's threshold. When redundancy group x's threshold reaches 0, it fails over to the other node. Forexample, if redundancy group 1 was primary on node 0, on the threshold-crossing event, redundancygroup 1 becomes primary on node 1. In this case, all the child interfaces of redundancy group 1'sredundant Ethernet interfaces begin handling traffic.
A redundancy group x failover occurs because the cumulative weight of the redundancy group x'smonitored IP addresses and other monitoring has brought its threshold value to 0. When the monitoredIP addresses of redundancy group x on both nodes reach their thresholds at the same time, redundancygroup x is primary on the node with the lower node ID, which is typically node 0.
Upstream device failure detection for the chassis cluster feature is supported on SRX Series devices.
Starting in Junos OS Release 15.1X49-D60 and Junos OS Release 17.3R1, configuring AddressResolution Protocol (ARP) request throttling is supported on SRX5000 line devices. This feature allowsyou to bypass the previously hard-coded ARP request throttling time default (10 seconds per SPU foreach IP address) and set the time to a greater value (10 through 100 seconds). Setting the throttling time
252

to a greater value reduces the high utilization of the Routing Engine, allowing it to work more efficiently.You can configure the ARP request throttling time using the set forwarding-options next-hop arp-throttle<seconds> command.
Monitoring can be accomplished only if the IP address is reachable on a redundant Ethernet interface(known as a reth in CLI commands and interface listings), and IP addresses cannot be monitored over atunnel. For an IP address to be monitored through a redundant Ethernet interface on a secondary clusternode, the interface must have a secondary IP address configured. IP address monitoring cannot be usedon a chassis cluster running in transparent mode. The maximum number of monitoring IP addresses thatcan be configured per cluster is 64 for the SRX5000 line of devices, SRX1500, SRX4000 line of devices.
Redundancy group IP address monitoring is not supported for IPv6 destinations.
Example: Configuring Chassis Cluster Redundancy Group IP AddressMonitoring
IN THIS SECTION
Requirements | 253
Overview | 254
Configuration | 254
Verification | 257
This example shows how to configure redundancy group IP address monitoring for an SRX Series devicein a chassis cluster.
Requirements
Before you begin:
• Set the chassis cluster node ID and cluster ID. See "Example: Setting the Node ID and Cluster ID forSecurity Devices in a Chassis Cluster " on page 43
• Configure the chassis cluster management interface. See "Example: Configuring the Chassis ClusterManagement Interface" on page 48.
• Configure the chassis cluster fabric. See "Example: Configuring the Chassis Cluster Fabric Interfaces"on page 62.
253

Overview
You can configure redundancy groups to monitor upstream resources by pinging specific IP addressesthat are reachable through redundant Ethernet interfaces on either node in a cluster. You can alsoconfigure global threshold, weight, retry interval, and retry count parameters for a redundancy group.When a monitored IP address becomes unreachable, the weight of that monitored IP address isdeducted from the redundancy group IP address monitoring global threshold. When the global thresholdreaches 0, the global weight is deducted from the redundancy group threshold. The retry intervaldetermines the ping interval for each IP address monitored by the redundancy group. The pings are sentas soon as the configuration is committed. The retry count sets the number of allowed consecutive pingfailures for each IP address monitored by the redundancy group.
In this example, you configure the following settings for redundancy group 1:
• IP address to monitor—10.1.1.10
• IP address monitoring global-weight—100
• IP address monitoring global-threshold—200
The threshold applies cumulatively to all IP addresses monitored by the redundancy group.
• IP address retry-interval—3 seconds
• IP address retry-count—10
• Weight—100
• Redundant Ethernet interface—reth1.0
• Secondary IP address—10.1.1.101
Configuration
IN THIS SECTION
Procedure | 255
254

Procedure
CLI Quick Configuration
To quickly configure this example, copy the following commands, paste them into a text file, remove anyline breaks, change any details necessary to match your network configuration, copy and paste thecommands into the CLI at the [edit] hierarchy level, and then enter commit from configuration mode.
{primary:node0}[edit]user@host#set chassis cluster redundancy-group 1 ip-monitoring global-weight 100set chassis cluster redundancy-group 1 ip-monitoring global-threshold 200 set chassis cluster redundancy-group 1 ip-monitoring retry-interval 3set chassis cluster redundancy-group 1 ip-monitoring retry-count 10 set chassis cluster redundancy-group 1 ip-monitoring family inet 10.1.1.10 weight 100 interface reth1.0 secondary-ip-address 10.1.1.101
Step-by-Step Procedure
To configure redundancy group IP address monitoring:
1. Specify a global monitoring weight.
{primary:node0}[edit]user@host# set chassis cluster redundancy-group 1 ip-monitoring global-weight 100
2. Specify the global monitoring threshold.
{primary:node0}[edit]user@host# set chassis cluster redundancy-group 1 ip-monitoring global-threshold 200
3. Specify the retry interval.
{primary:node0}[edit]user@host# set chassis cluster redundancy-group 1 ip-monitoring retry-interval 3
255

4. Specify the retry count.
{primary:node0}[edit]user@host# set chassis cluster redundancy-group 1 ip-monitoring retry-count 10
5. Specify the IP address to be monitored, weight, redundant Ethernet interface, and secondary IPaddress.
{primary:node0}[edit]user@host# set chassis cluster redundancy-group 1 ip-monitoring family inet 10.1.1.10 weight 100 interface reth1.0 secondary-ip-address 10.1.1.101
Results
From configuration mode, confirm your configuration by entering the show chassis cluster redundancy-group1 command. If the output does not display the intended configuration, repeat the configurationinstructions in this example to correct it.
For brevity, this show command output includes only the configuration that is relevant to this example.Any other configuration on the system has been replaced with ellipses (...).
{primary:node0}[edit]user@host# show chassis cluster redundancy-group 1ip-monitoring { global-weight 100; global-threshold 200; family { inet { 10.1.1.10 { weight 100; interface reth1.0 secondary-ip-address 10.1.1.101; } } }}
If you are done configuring the device, enter commit from configuration mode.
256

Verification
IN THIS SECTION
Verifying the Status of Monitored IP Addresses for a Redundancy Group | 257
Verifying the Status of Monitored IP Addresses for a Redundancy Group
Purpose
Verify the status of monitored IP addresses for a redundancy group.
Action
From operational mode, enter the show chassis cluster ip-monitoring status command. For informationabout a specific group, enter the show chassis cluster ip-monitoring status redundancy-group command.
{primary:node0}user@host> show chassis cluster ip-monitoring statusnode0:--------------------------------------------------------------------------
Redundancy group: 1Global threshold: 200Current threshold: -120
IP address Status Failure count Reason Weight10.1.1.10 reachable 0 n/a 10010.1.1.101 reachable 0 n/a 100
node1:--------------------------------------------------------------------------
Redundancy group: 1Global threshold: 200Current threshold: -120
IP address Status Failure count Reason Weight
257

10.1.1.10 reachable 0 n/a 10010.1.1.101 reachable 0 n/a 100
Example: Configuring IP Monitoring on SRX5000 Line Devices for IOC2and IOC3
IN THIS SECTION
Requirements | 258
Overview | 258
Configuration | 259
Verification | 266
This example shows how to monitor IP address on an SRX5000 line device with chassis cluster enabled.
Requirements
This example uses the following hardware and software:
• Two SRX5400 Services Gateways with MIC (SRX-MIC-10XG-SFPP [IOC2]), and one Ethernet switch
• Junos OS Release 15.1X49-D30
The procedure mentioned in this example is also applicable to IOC3.
Before you begin:
• Physically connect the two SRX5400 devices (back-to-back for the fabric and control ports).
• Configure the two devices to operate in a chassis cluster.
Overview
IN THIS SECTION
Topology | 259
258

IP address monitoring checks end-to-end reachability of the configured IP address and allows aredundancy group to automatically fail over when it is not reachable through the child link of redundantEthernet (reth) interface. Redundancy groups on both devices, or nodes, in a cluster can be configured tomonitor specific IP addresses to determine whether an upstream device in the network is reachable.
Topology
In this example, two SRX5400 devices in a chassis cluster are connected to an Ethernet switch. Theexample shows how the redundancy groups can be configured to monitor key upstream resourcesreachable through redundant Ethernet interfaces on either node in a cluster.
You set the system to send pings every second, with 10 losses required to declare unreachability to peer.You also set up a secondary IP address to allow testing from the secondary node.
In this example, you configure the following settings for redundancy group 1:
• IP address to be monitored—192.0.2.2, 198.51.100.2, 203.0.113.2
• IP monitoring global-weight—255
• IP monitoring global-threshold—240
• IP monitoring retry-interval—3 seconds
• IP monitoring retry-count—10
• Weight for monitored IP address—80
• Secondary IP addresses— 192.0.2.12, 198.51.100.12, 203.0.113.12
Configuration
IN THIS SECTION
CLI Quick Configuration | 260
Configuring IP Monitoring on a 10x10GE SFP+ MIC | 261
259

CLI Quick Configuration
To quickly configure this example, copy the following commands, paste them into a text file, remove anyline breaks, change any details to match your network configuration, copy and paste the commands intothe CLI at the [edit] hierarchy level, and then enter commit from configuration mode.
set chassis cluster reth-count 10set chassis cluster control-ports fpc 3 port 0 set chassis cluster control-ports fpc 0 port 0 set chassis cluster redundancy-group 0 node 0 priority 254 set chassis cluster redundancy-group 0 node 1 priority 1 set chassis cluster redundancy-group 1 node 0 priority 200 set chassis cluster redundancy-group 1 node 1 priority 199 set chassis cluster redundancy-group 1 ip-monitoring global-weight 255set chassis cluster redundancy-group 1 ip-monitoring global-threshold 240 set chassis cluster redundancy-group 1 ip-monitoring retry-interval 3 set chassis cluster redundancy-group 1 ip-monitoring retry-count 10 set chassis cluster redundancy-group 1 ip-monitoring family inet 192.0.2.2 weight 80 set chassis cluster redundancy-group 1 ip-monitoring family inet 192.0.2.2 interface reth0.0 secondary-ip-address 192.0.2.12set chassis cluster redundancy-group 1 ip-monitoring family inet 198.51.100.2 weight 80 set chassis cluster redundancy-group 1 ip-monitoring family inet 198.51.100.2 interface reth1.0 secondary-ip-address 198.51.100.12set chassis cluster redundancy-group 1 ip-monitoring family inet 203.0.113.2 weight 80 set chassis cluster redundancy-group 1 ip-monitoring family inet 203.0.113.2 interface reth2.0 secondary-ip-address 203.0.113.12set interfaces xe-1/2/1 gigether-options redundant-parent reth0 set interfaces xe-1/2/2 gigether-options redundant-parent reth2 set interfaces xe-1/2/3 gigether-options redundant-parent reth1 set interfaces xe-4/2/1 gigether-options redundant-parent reth0 set interfaces xe-4/2/2 gigether-options redundant-parent reth2 set interfaces xe-4/2/3 gigether-options redundant-parent reth1 set interfaces fab0 fabric-options member-interfaces xe-1/2/0 set interfaces fab1 fabric-options member-interfaces xe-4/2/0 set interfaces reth0 redundant-ether-options redundancy-group 1 set interfaces reth0 unit 0 family inet address 192.0.2.1/24 set interfaces reth1 redundant-ether-options redundancy-group 1 set interfaces reth1 unit 0 family inet address 198.51.100.1/24 set interfaces reth2 redundant-ether-options redundancy-group 1 set interfaces reth2 unit 0 family inet address 203.0.113.1/24set security zones security-zone HOST host-inbound-traffic system-services any-service
260

set security zones security-zone HOST host-inbound-traffic protocols all set security zones security-zone HOST interfaces all
Configuring IP Monitoring on a 10x10GE SFP+ MIC
Step-by-Step Procedure
To configure IP monitoring on a 10x10GE SFP+ MIC:
1. Specify the number of redundant Ethernet interfaces.
{primary:node0}[edit]user@host# set chassis cluster reth-count 10
2. Configure the control ports.
{primary:node0}[edit]user@host# set chassis cluster control-ports fpc 3 port 0 user@host# set chassis cluster control-ports fpc 0 port 0
3. Configure fabric interfaces.
{primary:node0}[edit]user@host# set interfaces fab0 fabric-options member-interfaces xe-1/2/0 user@host# set interfaces fab1 fabric-options member-interfaces xe-4/2/0
4. Specify a redundancy group's priority for primacy on each node of the cluster. The higher numbertakes precedence.
{primary:node0}[edit]user@host# set chassis cluster redundancy-group 0 node 0 priority 254user@host# set chassis cluster redundancy-group 0 node 1 priority 1user@host# set chassis cluster redundancy-group 1 node 0 priority 200user@host# set chassis cluster redundancy-group 1 node 1 priority 199
261
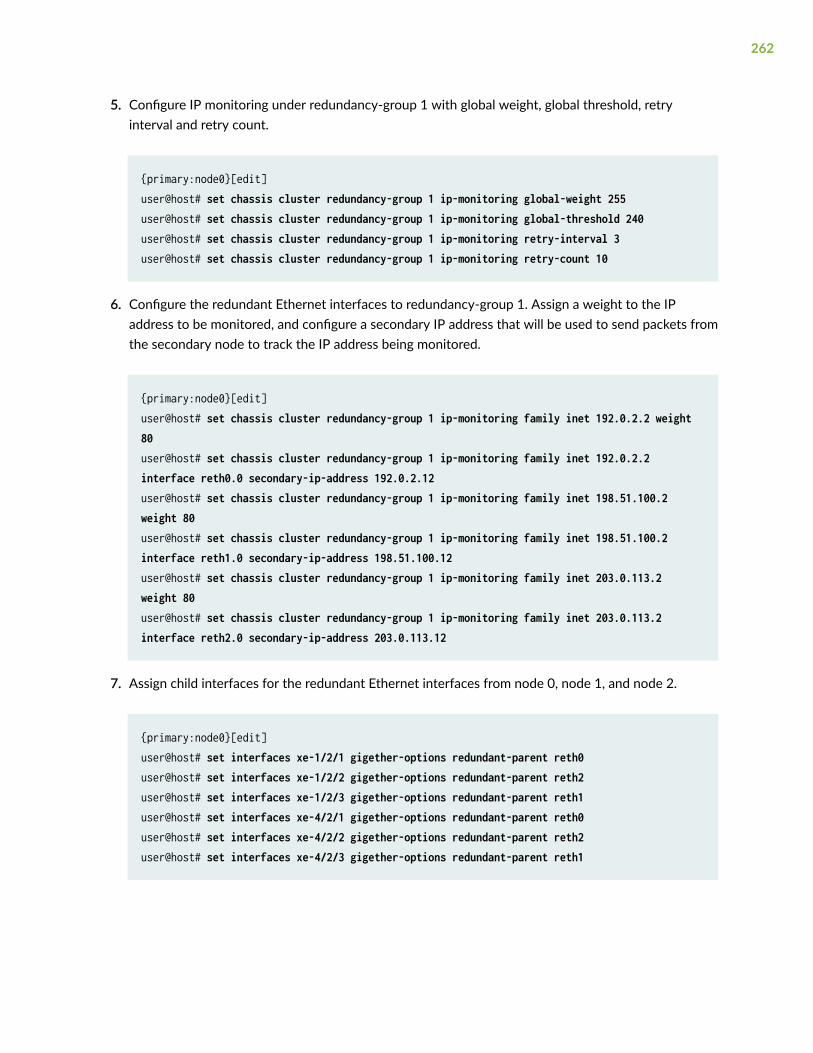
5. Configure IP monitoring under redundancy-group 1 with global weight, global threshold, retryinterval and retry count.
{primary:node0}[edit]user@host# set chassis cluster redundancy-group 1 ip-monitoring global-weight 255 user@host# set chassis cluster redundancy-group 1 ip-monitoring global-threshold 240user@host# set chassis cluster redundancy-group 1 ip-monitoring retry-interval 3user@host# set chassis cluster redundancy-group 1 ip-monitoring retry-count 10
6. Configure the redundant Ethernet interfaces to redundancy-group 1. Assign a weight to the IPaddress to be monitored, and configure a secondary IP address that will be used to send packets fromthe secondary node to track the IP address being monitored.
{primary:node0}[edit]user@host# set chassis cluster redundancy-group 1 ip-monitoring family inet 192.0.2.2 weight 80user@host# set chassis cluster redundancy-group 1 ip-monitoring family inet 192.0.2.2 interface reth0.0 secondary-ip-address 192.0.2.12user@host# set chassis cluster redundancy-group 1 ip-monitoring family inet 198.51.100.2 weight 80user@host# set chassis cluster redundancy-group 1 ip-monitoring family inet 198.51.100.2 interface reth1.0 secondary-ip-address 198.51.100.12user@host# set chassis cluster redundancy-group 1 ip-monitoring family inet 203.0.113.2 weight 80user@host# set chassis cluster redundancy-group 1 ip-monitoring family inet 203.0.113.2 interface reth2.0 secondary-ip-address 203.0.113.12
7. Assign child interfaces for the redundant Ethernet interfaces from node 0, node 1, and node 2.
{primary:node0}[edit]user@host# set interfaces xe-1/2/1 gigether-options redundant-parent reth0 user@host# set interfaces xe-1/2/2 gigether-options redundant-parent reth2 user@host# set interfaces xe-1/2/3 gigether-options redundant-parent reth1user@host# set interfaces xe-4/2/1 gigether-options redundant-parent reth0 user@host# set interfaces xe-4/2/2 gigether-options redundant-parent reth2user@host# set interfaces xe-4/2/3 gigether-options redundant-parent reth1
262

8. Configure the redundant Ethernet interfaces to redundancy-group 1.
{primary:node0}[edit]user@host# set interfaces reth0 redundant-ether-options redundancy-group 1user@host# set interfaces reth0 unit 0 family inet address 192.0.2.1/24user@host# set interfaces reth1 redundant-ether-options redundancy-group 1 user@host# set interfaces reth1 unit 0 family inet address 198.51.100.1/24user@host# set interfaces reth2 redundant-ether-options redundancy-group 1user@host# set interfaces reth2 unit 0 family inet address 203.0.113.1/24
9. Create security zone and assign interfaces to zone.
user@host# set security zones security-zone HOST host-inbound-traffic system-services any-serviceuser@host# set security zones security-zone HOST host-inbound-traffic protocols alluser@host# set security zones security-zone HOST interfaces all
Results
From configuration mode, confirm your configuration by entering the show security chassis cluster andshow interfaces commands. If the output does not display the intended configuration, repeat theconfiguration instructions in this example to correct it.
chassis { cluster { reth-count 10; redundancy-group 0 { node 0 priority 254; node 1 priority 1; } redundancy-group 1 { node 0 priority 200; node 1 priority 199; ip-monitoring { global-weight 255; global-threshold 240; retry-interval 3; retry-count 10; family {
263

inet { 192.0.2.2 { weight 80; interface reth0.0 secondary-ip-address 192.0.2.12; } 198.51.100.2 { weight 80; interface reth1.0 secondary-ip-address 198.51.100.12; } 203.0.113.2 { weight 80; interface reth2.0 secondary-ip-address 203.0.113.12; } } } } } }}interfaces { xe-1/2/1 { gigether-options { redundant-parent reth0; } } xe-1/2/2 { gigether-options { redundant-parent reth2; } } xe-1/2/3 { gigether-options { redundant-parent reth1; } } xe-4/2/1 { gigether-options { redundant-parent reth0; } } xe-4/2/2 { gigether-options {
264

redundant-parent reth2; } } xe-4/2/3 { gigether-options { redundant-parent reth1; } } fab0 { fabric-options { member-interfaces { xe-1/2/0; } } } fab1 { fabric-options { member-interfaces { xe-4/2/0; } } } reth0 { redundant-ether-options { redundancy-group 1; } unit 0 { family inet { address 192.0.2.1/24; } } } reth1 { redundant-ether-options { redundancy-group 1; } unit 0 { family inet { address 198.51.100.1/24; } } } reth2 {
265
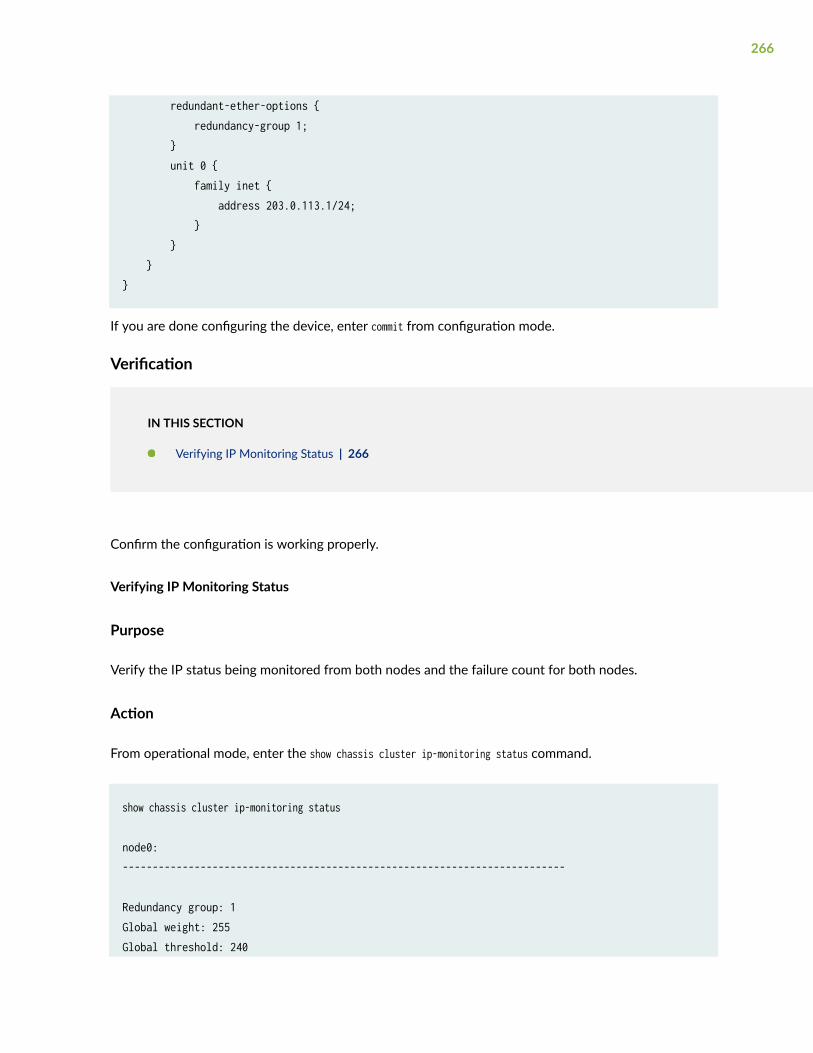
redundant-ether-options { redundancy-group 1; } unit 0 { family inet { address 203.0.113.1/24; } } }}
If you are done configuring the device, enter commit from configuration mode.
Verification
IN THIS SECTION
Verifying IP Monitoring Status | 266
Confirm the configuration is working properly.
Verifying IP Monitoring Status
Purpose
Verify the IP status being monitored from both nodes and the failure count for both nodes.
Action
From operational mode, enter the show chassis cluster ip-monitoring status command.
show chassis cluster ip-monitoring status
node0:--------------------------------------------------------------------------
Redundancy group: 1Global weight: 255Global threshold: 240
266

Current threshold: 240
IP address Status Failure count Weight Reason203.0.113.2 reachable 1 80 n/a198.51.100.2 reachable 1 80 n/a192.0.2.2 reachable 1 80 n/a
node1:--------------------------------------------------------------------------
Redundancy group: 1Global weight: 255Global threshold: 240Current threshold: 240
IP address Status Failure count Weight Reason203.0.113.2 reachable 2 80 n/a198.51.100.2 reachable 1 80 n/a192.0.2.2 reachable 2 80 n/a
Meaning
All the monitored IP addresses are reachable.
Release History Table
Release Description
15.1X49-D60 Starting in Junos OS Release 15.1X49-D60 and Junos OS Release 17.3R1, configuring AddressResolution Protocol (ARP) request throttling is supported on SRX5000 line devices.
12.1X46-D35 Starting in Junos OS Release 12.1X46-D35 and Junos OS Release 17.3R1, for all SRX Seriesdevices, the reth interface supports proxy ARP.
RELATED DOCUMENTATION
Chassis Cluster Redundancy Groups | 93
Example: Configuring an Active/Passive Chassis Cluster on SRX5800 Devices | 362
Monitoring Chassis Cluster Interfaces | 206
267

Configuring Cluster Failover Parameters
IN THIS SECTION
Understanding Chassis Cluster Control Link Heartbeats, Failure, and Recovery | 268
Example: Configuring Chassis Cluster Control Link Recovery | 271
SRX Series devices in a chassis cluster uses heartbeat transmissions to determine the “health” of thecontrol link. If the number of missed heartbeats has reached the configured threshold, the systemassesses whether a failure condition exists. For more information, see the following topics:
Understanding Chassis Cluster Control Link Heartbeats, Failure, andRecovery
IN THIS SECTION
Understanding Chassis Cluster Control Link Heartbeats | 268
Understanding Chassis Cluster Control Link Failure and Recovery | 269
Understanding Chassis Cluster Control Link Heartbeats
You specify the heartbeat threshold and heartbeat interval when you configure the chassis cluster.
The system monitors the control link's status by default.
For dual control links, which are supported on SRX5600 and SRX5800 lines, the Juniper ServicesRedundancy Protocol process (jsrpd) sends and receives the control heartbeat messages on both controllinks. As long as heartbeats are received on one of the control links, Junos OS considers the other nodeto be alive.
The product of the heartbeat-threshold option and the heartbeat-interval option defines the wait timebefore failover is triggered. The default values of these options produce a wait time of 3 seconds. A
268

heartbeat-threshold of 5 and a heartbeat-interval of 1000 milliseconds would yield a wait time of 5seconds. Setting the heartbeat-threshold to 4 and the heartbeat-interval to 1250 milliseconds wouldalso yield a wait time of 5 seconds.
In a chassis cluster environment, if more than 1000 logical interfaces are used, the cluster heartbeattimers are recommended to be increased from the default of 3 seconds. At maximum capacity on anSRX4600, SRX5400, SRX5600 or an SRX5800 device, we recommend that you increase the configuredtime before failover to at least 5 seconds. In a large chassis cluster configuration on an SRX3400 orSRX3600 device, we recommend increasing the wait to 8 seconds.
Understanding Chassis Cluster Control Link Failure and Recovery
If the control link fails, Junos OS changes the operating state of the secondary node to ineligible for a180-second countdown. If the fabric link also fails during the 180 seconds, Junos OS changes thesecondary node to primary; otherwise, after 180 seconds the secondary node state changes to disabled.
When the control link is down, a system log message is generated.
A control link failure is defined as not receiving heartbeats over the control link while heartbeats are stillbeing received over the fabric link.
In the event of a legitimate control link failure, redundancy group 0 remains primary on the node onwhich it is currently primary, inactive redundancy groups x on the primary node become active, and thesecondary node enters a disabled state.
When the secondary node is disabled, you can still log in to the management port and run diagnostics.
To determine if a legitimate control link failure has occurred, the system relies on redundant livelinesssignals sent across both the control link and the fabric link.
The system periodically transmits probes over the fabric link and heartbeat signals over the control link.Probes and heartbeat signals share a common sequence number that maps them to a unique time event.Junos OS identifies a legitimate control link failure if the following two conditions exist:
• The threshold number of heartbeats were lost.
• At least one probe with a sequence number corresponding to that of a missing heartbeat signal wasreceived on the fabric link.
If the control link fails, the 180-second countdown begins and the secondary node state is ineligible. Ifthe fabric link fails before the 180-second countdown reaches zero, the secondary node becomesprimary because the loss of both links is interpreted by the system to indicate that the other node isdead. Because concurrent loss of both control and fabric links means that the nodes are no longersynchronizing states nor comparing priorities, both nodes might thus temporarily become primary, whichis not a stable operating state. However, once the control link is reestablished, the node with the higher
269

priority value automatically becomes primary, the other node becomes secondary, and the clusterreturns to normal operation.
When a legitimate control link failure occurs, the following conditions apply:
• Redundancy group 0 remains primary on the node on which it is currently primary (and thus itsRouting Engine remains active), and all redundancy groups x on the node become primary.
If the system cannot determine which Routing Engine is primary, the node with the higher priorityvalue for redundancy group 0 is primary and its Routing Engine is active. (You configure the priorityfor each node when you configure the redundancy-group statement for redundancy group 0.)
• The system disables the secondary node.
To recover a device from the disabled mode, you must reboot the device. When you reboot thedisabled node, the node synchronizes its dynamic state with the primary node.
If you make any changes to the configuration while the secondary node is disabled, execute the commitcommand to synchronize the configuration after you reboot the node. If you did not make configurationchanges, the configuration file remains synchronized with that of the primary node.
You cannot enable preemption for redundancy group 0. If you want to change the primary node forredundancy group 0, you must do a manual failover.
When you use dual control links (supported on SRX5600 and SRX5800 devices), note the followingconditions:
• Host inbound or outbound traffic can be impacted for up to 3 seconds during a control link failure.For example, consider a case where redundancy group 0 is primary on node 0 and there is a Telnetsession to the Routing Engine through a network interface port on node 1. If the currently activecontrol link fails, the Telnet session will lose packets for 3 seconds, until this failure is detected.
• A control link failure that occurs while the commit process is running across two nodes might lead tocommit failure. In this situation, run the commit command again after 3 seconds.
For SRX5600 and SRX5800 devices, dual control links require a second Routing Engine on each node ofthe chassis cluster.
You can specify that control link recovery be done automatically by the system by setting the control-link-recovery statement. In this case, once the system determines that the control link is healthy, it issuesan automatic reboot on the disabled node. When the disabled node reboots, the node joins the clusteragain.
270

Example: Configuring Chassis Cluster Control Link Recovery
IN THIS SECTION
Requirements | 271
Overview | 271
Configuration | 272
This example shows how to enable control link recovery, which allows the system to automatically takeover after the control link recovers from a failure.
Requirements
Before you begin:
• Understand chassis cluster control links. See "Understanding Chassis Cluster Control Plane andControl Links" on page 69.
• Understand chassis cluster dual control links. See "Understanding Chassis Cluster Dual Control Links"on page 164.
• Connect dual control links in a chassis cluster. See "Dual Control Link Connections for SRX SeriesDevices in a Chassis Cluster" on page 166.
Overview
You can enable the system to perform control link recovery automatically. After the control link recovers,the system takes the following actions:
• It checks whether it receives at least three consecutive heartbeats on the control link or, in the caseof dual control links (SRX5600 and SRX5800 devices only), on either control link. This is to ensurethat the control link is not flapping and is healthy.
• After it determines that the control link is healthy, the system issues an automatic reboot on thenode that was disabled when the control link failed. When the disabled node reboots, it can rejointhe cluster. There is no need for any manual intervention.
In this example, you enable chassis cluster control link recovery.
271

Configuration
IN THIS SECTION
Procedure | 272
Procedure
Step-by-Step Procedure
To enable chassis cluster control-link-recovery:
1. Enable control link recovery.
{primary:node0}[edit]user@host# set chassis cluster control-link-recovery
2. If you are done configuring the device, commit the configuration.
{primary:node0}[edit]user@host# commit
RELATED DOCUMENTATION
Chassis Cluster Dual Control Links | 164
Example: Configure Chassis Cluster Control Ports for Dual Control Links | 170
272

Understanding Chassis Cluster Resiliency
IN THIS SECTION
Layer 1 for Detecting Hardware Faults and Software Failures | 273
Layer 2 for Probing Critical Paths | 273
Layer 3 for Detecting Control Link and Fabric Link Failure | 274
Benefits | 274
Junos OS uses a layered model to provide resiliency on SRX series devices that are in a chassis clustersetup. In the event of a software or hardware component failure, the layered model ensures that thesystem performance is not impacted.
Layer 1 for Detecting Hardware Faults and Software Failures
Layer 1 identifies and detects the components that are causing the software failures and impacting thesystem performance. An alarm, syslog, or an SNMP trap is triggered to provide notifications about thefailures.
Layer 2 for Probing Critical Paths
Layer 2 probes the system’s critical paths to detect hardware and software failures that are not detectedby Layer 1.
Heartbeat communications validate the state of the paths between the two endpoints of the path. If anycomponent in the path fails, communication is lost and the system health status is communicated usingheartbeat messages sent from one end of the path to the other end.
273

Layer 3 for Detecting Control Link and Fabric Link Failure
Layer 3 determines the system health information from Layer 1 and Layer 2, shares the health statusbetween two nodes over the control links and fabric links, and makes the failover decision based on thehealth status of the two nodes and the heartbeat status of the control links and fabric links. An alarm,syslog, or an SNMP trap is triggered to provide notifications about the failures.
Layer 3 addresses the following software issues:
• em0 flapping
• Control path hardware or software component fails
• Fabric link is down and control link is alive
• Control link is down and fabric link is alive
• Both the control link and fabric link are down
Benefits
• Improve the failover time and stability.
• Identify the exact location of the fault or failure.
RELATED DOCUMENTATION
cluster (Chassis) | 601
Chassis Cluster Redundancy Group Failover
IN THIS SECTION
Understanding Chassis Cluster Redundancy Group Failover | 275
Understanding Chassis Cluster Redundancy Group Manual Failover | 280
274

Initiating a Chassis Cluster Manual Redundancy Group Failover | 281
Example: Configuring a Chassis Cluster with a Dampening Time Between Back-to-Back Redundancy GroupFailovers | 284
Understanding SNMP Failover Traps for Chassis Cluster Redundancy Group Failover | 285
Verifying Chassis Cluster Failover Status | 286
Clearing Chassis Cluster Failover Status | 288
A redundancy group (RG) includes and manages a collection of objects on both nodes of a cluster toprovide high-availability. Each redundancy group acts as an independent unit of failover and is primaryon only one node at a time. For more information, see the following topics:
Understanding Chassis Cluster Redundancy Group Failover
IN THIS SECTION
Preemptive Failover Delay Timer | 276
Chassis cluster employs a number of highly efficient failover mechanisms that promote high availabilityto increase your system's overall reliability and productivity.
A redundancy group is a collection of objects that fail over as a group. Each redundancy group monitorsa set of objects (physical interfaces), and each monitored object is assigned a weight. Each redundancygroup has an initial threshold of 255. When a monitored object fails, the weight of the object issubtracted from the threshold value of the redundancy group. When the threshold value reaches zero,the redundancy group fails over to the other node. As a result, all the objects associated with theredundancy group fail over as well. Graceful restart of the routing protocols enables the SRX Seriesdevice to minimize traffic disruption during a failover.
Back-to-back failovers of a redundancy group in a short interval can cause the cluster to exhibitunpredictable behavior. To prevent such unpredictable behavior, configure a dampening time betweenfailovers. On failover, the previous primary node of a redundancy group moves to the secondary-holdstate and stays in the secondary-hold state until the hold-down interval expires. After the hold-downinterval expires, the previous primary node moves to the secondary state.
275

Configuring the hold-down interval prevents back-to-back failovers from occurring within the durationof hold-down interval.
The hold-down interval affects manual failovers, as well as automatic failovers associated withmonitoring failures.
The default dampening time for a redundancy group 0 is 300 seconds (5 minutes) and is configurable toup to 1800 seconds with the hold-down-interval statement. For some configurations, such as those with alarge number of routes or logical interfaces, the default interval or the user-configured interval might notbe sufficient. In such cases, the system automatically extends the dampening time in increments of 60seconds until the system is ready for failover.
Redundancy groups x (redundancy groups numbered 1 through 128) have a default dampening time of 1second, with a range from 0 through 1800 seconds.
On SRX Series devices, chassis cluster failover performance is optimized to scale with more logicalinterfaces. Previously, during redundancy group failover, gratuitous arp (GARP) is sent by the JuniperServices Redundancy Protocol (jsrpd) process running in the Routing Engine on each logical interface tosteer the traffic to the appropriate node. With logical interface scaling, the Routing Engine becomes thecheckpoint and GARP is directly sent from the Services Processing Unit (SPU).
Preemptive Failover Delay Timer
A redundancy group is in the primary state (active) on one node and in the secondary state (backup) onthe other node at any given time.
You can enable the preemptive behavior on both nodes in a redundancy group and assign a priorityvalue for each node in the redundancy group. The node in the redundancy group with the higherconfigured priority is initially designated as the primary in the group, and the other node is initiallydesignated as the secondary in the redundancy group.
When a redundancy group swaps the state of its nodes between primary and secondary, there is apossibility that a subsequent state swap of its nodes can happen again soon after the first state swap.This rapid change in states results in flapping of the primary and secondary systems.
Starting with Junos OS Release 17.4R1, a failover delay timer is introduced on SRX Series devices in achassis cluster to limit the flapping of redundancy group state between the secondary and the primarynodes in a preemptive failover.
To prevent the flapping, you can configure the following parameters:
• Preemptive delay –The preemptive delay time is the amount of time a redundancy group in asecondary state waits when the primary state is down in a preemptive failover before switching tothe primary state. This delay timer delays the immediate failover for a configured period of time––between 1 and 21,600 seconds.
276

• Preemptive limit–The preemptive limit restricts the number of preemptive failovers (between 1 to50) during a configured preemptive period, when preemption is enabled for a redundancy group.
• Preemptive period–Time period (1 to 1440 seconds) during which the preemptive limit is applied,that is, number of configured preemptive failovers are applied when preempt is enabled for aredundancy group.
Consider the following scenario where you have configured a preemptive period as 300 seconds andpreemptive limit as 50.
When the preemptive limit is configured as 50, the count starts at 0 and increments with a firstpreemptive failover; this process continues until the count reaches the configured preemptive limit, thatis 50, before the preemptive period expires. When the preemptive limit (50) is exceeded, you mustmanually reset the preempt count to allow preemptive failovers to occur again.
When you have configured the preemptive period as 300 seconds, and if the time difference betweenthe first preemptive failover and the current failover has already exceeded 300 seconds, and thepreemptive limit (50) is not yet reached, then the preemptive period will be reset. After resetting, thelast failover is considered as the first preemptive failover of the new preemptive period and the processstarts all over again.
The preemptive delay can be configured independent of the failover limit. Configuring the preemptivedelay timer does not change the existing preemptive behavior.
This enhancement enables the administrator to introduce a failover delay, which can reduce the numberof failovers and result in a more stable network state due to the reduction in active /standby flappingwithin the redundancy group.
Understanding Transition from Primary State to Secondary State with Preemptive Delay
Consider the following example, where a redundancy group, that is primary on the node 0 is ready forpreemptive transition to the secondary state during a failover. Priority is assigned to each node and thepreemptive option is also enabled for the nodes.
277

Figure 35 on page 278 illustrates the sequence of steps in transition from the primary state to thesecondary state when a preemptive delay timer is configured.
Figure 35: Transition from Primary State to Secondary State with Preemptive Delay
1. The node in the primary state is ready for preemptive transition to secondary state if the preemptiveoption is configured, and the node in secondary state has the priority over the node in primary state.If the preemptive delay is configured, the node in the primary state transitions to primary-preempt-hold state . If preemptive delay is not configured, then instant transition to the secondary statehappens.
2. The node is in primary-preempt-hold state waiting for the preemptive delay timer to expire. Thepreemptive delay timer is checked and transition is held until the timer expires. The primary nodestays in the primary-preempt-hold state until the timer expires, before transitioning to the secondarystate.
3. The node transitions from primary-preempt-hold state into secondary-hold state and then to thesecondary state.
278

4. The node stays in the secondary-hold state for the default time (1 second) or the configured time (aminimum of 300 seconds), and then the node transitions to the secondary state.
If your chassis cluster setup experiences an abnormal number of flaps, you must check your link andmonitoring timers to make sure they are set correctly. Be careful when while setting timers in highlatency networks to avoid getting false positives.
Configuring Preemptive Delay Timer
This topic explains how to configure the delay timer on SRX Series devices in a chassis cluster. Back-to-back redundancy group failovers that occur too quickly can cause a chassis cluster to exhibitunpredictable behavior. Configuring the delay timer and failover rate limit delays immediate failover fora configured period of time.
To configure the preemptive delay timer and failover rate limit between redundancy group failovers:
1. Enable preemptive failover for a redundancy group.
You can set the delay timer between 1 and 21,600 seconds. Default value is 1 second.
{primary:node1}[edit chassis cluster redundancy-group number preempt]user@host# set delay interval
2. Set up a limit for preemptive failover.
You can set maximum number of preemptive failovers between 1 to 50 and time period during whichthe limit is applied between 1 to 1440 seconds.
{primary:node1}[edit chassis cluster redundancy-group number preempt]user@host# set limit limit period period
In the following example, you are setting the preemptive delay timer to 300 seconds, and thepreemptive limit to 10 for a premptive period of 600 seconds. That is, this configuration delaysimmediate failover for 300 seconds, and it limits a maximum of 10 preemptive failovers in a duration of600 seconds.
{primary:node1}[edit chassis cluster redundancy-group 1 preempt]user@host# set delay 300 limit 10 period 600
You can use the clear chassis clusters preempt-count command to clear the preempt failover counter for allredundancy groups. When a preempt limit is configured, the counter starts with a first preemptive
279

failover and the count is reduced; this process continues until the count reaches zero before the timerexpires. You can use this command to clear the preempt failover counter and reset it to start again.
SEE ALSO
Chassis Cluster Redundancy Groups | 93
Understanding Chassis Cluster Redundancy Group Manual Failover
You can initiate a redundancy group x (redundancy groups numbered 1 through 128) failover manually.A manual failover applies until a failback event occurs.
For example, suppose that you manually do a redundancy group 1 failover from node 0 to node 1. Thenan interface that redundancy group 1 is monitoring fails, dropping the threshold value of the newprimary redundancy group to zero. This event is considered a failback event, and the system returnscontrol to the original redundancy group.
You can also initiate a redundancy group 0 failover manually if you want to change the primary node forredundancy group 0. You cannot enable preemption for redundancy group 0.
If preempt is added to a redundancy group configuration, the device with the higher priority in the groupcan initiate a failover to become primary. By default, preemption is disabled. For more information onpreemeption, see "preempt (Chassis Cluster)" on page 674.
When you do a manual failover for redundancy group 0, the node in the primary state transitions to thesecondary-hold state. The node stays in the secondary-hold state for the default or configured time (aminimum of 300 seconds) and then transitions to the secondary state.
State transitions in cases where one node is in the secondary-hold state and the other node reboots, orthe control link connection or fabric link connection is lost to that node, are described as follows:
• Reboot case—The node in the secondary-hold state transitions to the primary state; the other nodegoes dead (inactive).
• Control link failure case—The node in the secondary-hold state transitions to the ineligible state andthen to a disabled state; the other node transitions to the primary state.
• Fabric link failure case—The node in the secondary-hold state transitions directly to the ineligiblestate.
Starting with Junos OS Release 12.1X46-D20 and Junos OS Release 17.3R1, fabric monitoring isenabled by default. With this enabling, the node transitions directly to the ineligible state in case offabric link failures.
280

Starting with Junos OS Release 12.1X47-D10 and Junos OS Release 17.3R1, fabric monitoring isenabled by default. With this enabling, the node transitions directly to the ineligible state in case offabric link failures.
Keep in mind that during an in-service software upgrade (ISSU), the transitions described here cannothappen. Instead, the other (primary) node transitions directly to the secondary state because JuniperNetworks releases earlier than 10.0 do not interpret the secondary-hold state. While you start an ISSU,if one of the nodes has one or more redundancy groups in the secondary-hold state, you must wait forthem to move to the secondary state before you can do manual failovers to make all the redundancygroups be primary on one node.
Be cautious and judicious in your use of redundancy group 0 manual failovers. A redundancy group 0failover implies a Routing Engine failover, in which case all processes running on the primary node arekilled and then spawned on the new primary Routing Engine. This failover could result in loss of state,such as routing state, and degrade performance by introducing system churn.
In some Junos OS releases, for redundancy groups x, it is possible to do a manual failover on a node thathas 0 priority. We recommend that you use the show chassis cluster status command to check theredundancy group node priorities before doing the manual failover. However, from Junos OS Releases12.1X44-D25, 12.1X45-D20, 12.1X46-D10, and 12.1X47-D10 and later, the readiness checkmechanism for manual failover is enhanced to be more restrictive, so that you cannot set manualfailover to a node in a redundancy group that has 0 priority. This enhancement prevents traffic frombeing dropped unexpectedly due to a failover attempt to a 0 priority node, which is not ready to accepttraffic.
Initiating a Chassis Cluster Manual Redundancy Group Failover
Before you begin, complete the following tasks:
• "Example: Configuring Chassis Cluster Redundancy Groups" on page 97
• "Example: Configuring Chassis Cluster Redundant Ethernet Interfaces" on page 105
You can initiate a failover manually with the request command. A manual failover bumps up the priority ofthe redundancy group for that member to 255.
Be cautious and judicious in your use of redundancy group 0 manual failovers. A redundancy group 0failover implies a Routing Engine (RE) failover, in which case all processes running on the primary nodeare killed and then spawned on the new primary Routing Engine (RE). This failover could result in loss ofstate, such as routing state, and degrade performance by introducing system churn.
Unplugging the power cord and holding the power button to initiate a chassis cluster redundancy groupfailover might result in unpredictable behavior.
281
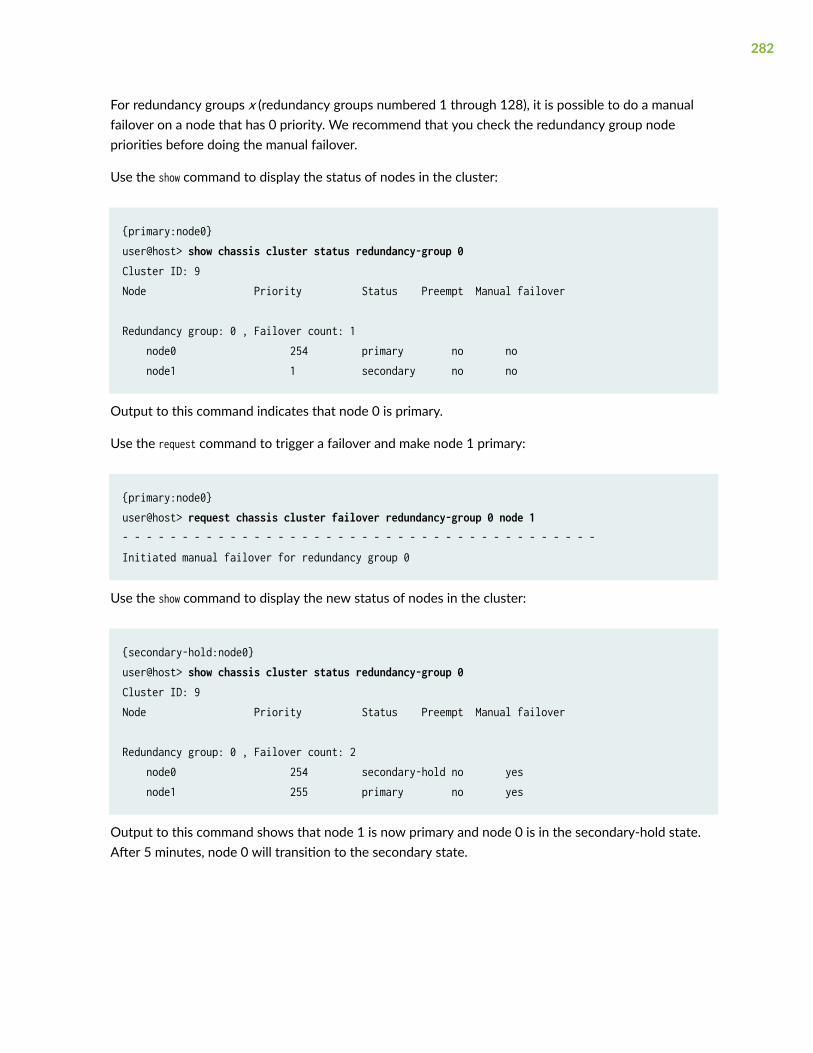
For redundancy groups x (redundancy groups numbered 1 through 128), it is possible to do a manualfailover on a node that has 0 priority. We recommend that you check the redundancy group nodepriorities before doing the manual failover.
Use the show command to display the status of nodes in the cluster:
{primary:node0} user@host> show chassis cluster status redundancy-group 0Cluster ID: 9Node Priority Status Preempt Manual failover
Redundancy group: 0 , Failover count: 1 node0 254 primary no no node1 1 secondary no no
Output to this command indicates that node 0 is primary.
Use the request command to trigger a failover and make node 1 primary:
{primary:node0} user@host> request chassis cluster failover redundancy-group 0 node 1- - - - - - - - - - - - - - - - - - - - - - - - - - - - - - - - - - - - - - - -Initiated manual failover for redundancy group 0
Use the show command to display the new status of nodes in the cluster:
{secondary-hold:node0}user@host> show chassis cluster status redundancy-group 0Cluster ID: 9Node Priority Status Preempt Manual failover
Redundancy group: 0 , Failover count: 2 node0 254 secondary-hold no yes node1 255 primary no yes
Output to this command shows that node 1 is now primary and node 0 is in the secondary-hold state.After 5 minutes, node 0 will transition to the secondary state.
282
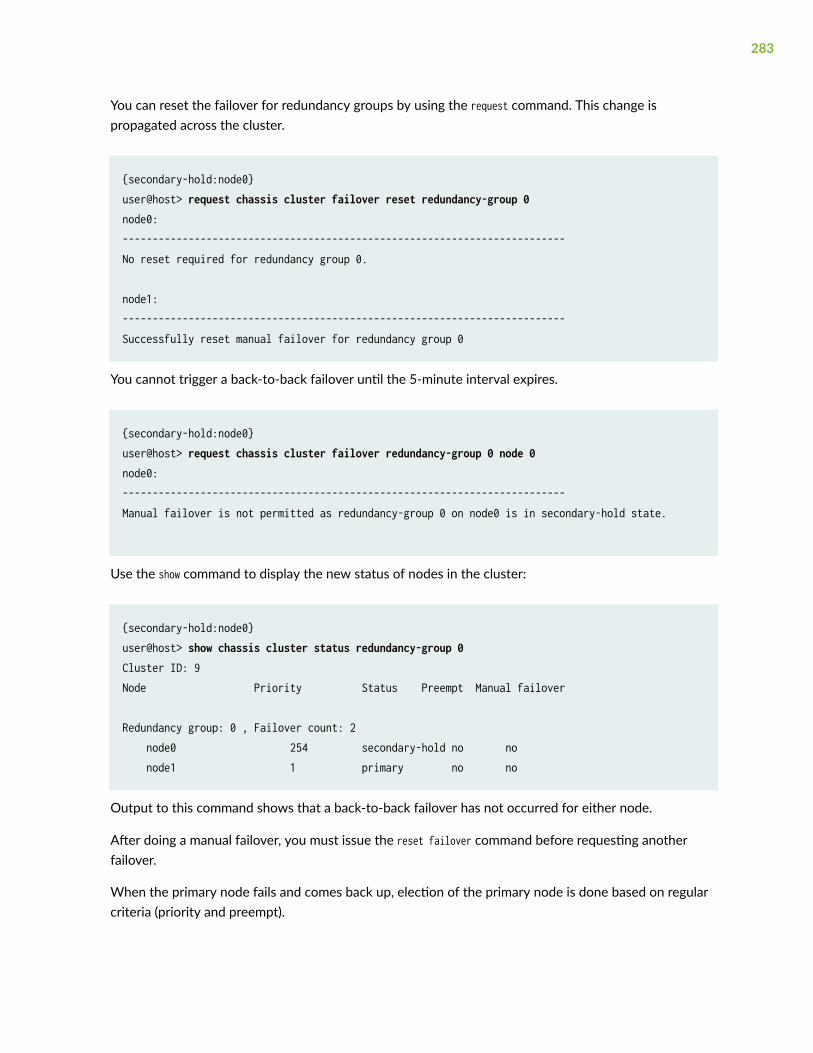
You can reset the failover for redundancy groups by using the request command. This change ispropagated across the cluster.
{secondary-hold:node0} user@host> request chassis cluster failover reset redundancy-group 0 node0:--------------------------------------------------------------------------No reset required for redundancy group 0.
node1:--------------------------------------------------------------------------Successfully reset manual failover for redundancy group 0
You cannot trigger a back-to-back failover until the 5-minute interval expires.
{secondary-hold:node0} user@host> request chassis cluster failover redundancy-group 0 node 0node0:--------------------------------------------------------------------------Manual failover is not permitted as redundancy-group 0 on node0 is in secondary-hold state.
Use the show command to display the new status of nodes in the cluster:
{secondary-hold:node0}user@host> show chassis cluster status redundancy-group 0Cluster ID: 9Node Priority Status Preempt Manual failover
Redundancy group: 0 , Failover count: 2 node0 254 secondary-hold no no node1 1 primary no no
Output to this command shows that a back-to-back failover has not occurred for either node.
After doing a manual failover, you must issue the reset failover command before requesting anotherfailover.
When the primary node fails and comes back up, election of the primary node is done based on regularcriteria (priority and preempt).
283

Example: Configuring a Chassis Cluster with a Dampening Time BetweenBack-to-Back Redundancy Group Failovers
IN THIS SECTION
Requirements | 284
Overview | 284
Configuration | 284
This example shows how to configure the dampening time between back-to-back redundancy groupfailovers for a chassis cluster. Back-to-back redundancy group failovers that occur too quickly can causea chassis cluster to exhibit unpredictable behavior.
Requirements
Before you begin:
• Understand redundancy group failover. See "Understanding Chassis Cluster Redundancy GroupFailover " on page 275.
• Understand redundancy group manual failover. See "Understanding Chassis Cluster RedundancyGroup Manual Failover" on page 280.
Overview
The dampening time is the minimum interval allowed between back-to-back failovers for a redundancygroup. This interval affects manual failovers and automatic failovers caused by interface monitoringfailures.
In this example, you set the minimum interval allowed between back-to-back failovers to 420 secondsfor redundancy group 0.
Configuration
IN THIS SECTION
Procedure | 285
284

Procedure
Step-by-Step Procedure
To configure the dampening time between back-to-back redundancy group failovers:
1. Set the dampening time for the redundancy group.
{primary:node0}[edit]user@host# set chassis cluster redundancy-group 0 hold-down-interval 420
2. If you are done configuring the device, commit the configuration.
{primary:node0}[edit]user@host# commit
Understanding SNMP Failover Traps for Chassis Cluster RedundancyGroup Failover
Chassis clustering supports SNMP traps, which are triggered whenever there is a redundancy groupfailover.
The trap message can help you troubleshoot failovers. It contains the following information:
• The cluster ID and node ID
• The reason for the failover
• The redundancy group that is involved in the failover
• The redundancy group’s previous state and current state
These are the different states that a cluster can be in at any given instant: hold, primary, secondary-hold,secondary, ineligible, and disabled. Traps are generated for the following state transitions (only atransition from a hold state does not trigger a trap):
• primary <–> secondary
• primary –> secondary-hold
• secondary-hold –> secondary
285

• secondary –> ineligible
• ineligible –> disabled
• ineligible –> primary
• secondary –> disabled
A transition can be triggered because of any event, such as interface monitoring, SPU monitoring,failures, and manual failovers.
The trap is forwarded over the control link if the outgoing interface is on a node different from the nodeon the Routing Engine that generates the trap.
You can specify that a trace log be generated by setting the traceoptions flag snmp statement.
Verifying Chassis Cluster Failover Status
IN THIS SECTION
Purpose | 286
Action | 286
Purpose
Display the failover status of a chassis cluster.
Action
From the CLI, enter the show chassis cluster status command:
{primary:node1}user@host> show chassis cluster statusCluster ID: 3 Node name Priority Status Preempt Manual failover
Redundancy-group: 0, Failover count: 1 node0 254 primary no no
286

node1 2 secondary no no
Redundancy-group: 1, Failover count: 1 node0 254 primary no no node1 1 secondary no no
{primary:node1}user@host> show chassis cluster statusCluster ID: 15Node Priority Status Preempt Manual failover
Redundancy group: 0 , Failover count: 5 node0 200 primary no no node1 0 lost n/a n/a
Redundancy group: 1 , Failover count: 41 node0 101 primary no no node1 0 lost n/a n/a
{primary:node1}user@host> show chassis cluster statusCluster ID: 15Node Priority Status Preempt Manual failover
Redundancy group: 0 , Failover count: 5 node0 200 primary no no node1 0 unavailable n/a n/a
Redundancy group: 1 , Failover count: 41 node0 101 primary no no node1 0 unavailable n/a n/a
287

Clearing Chassis Cluster Failover Status
To clear the failover status of a chassis cluster, enter the clear chassis cluster failover-count commandfrom the CLI:
{primary:node1}user@host> clear chassis cluster failover-countCleared failover-count for all redundancy-groups
Release History Table
Release Description
17.4R1 Starting with Junos OS Release 17.4R1, a failover delay timer is introduced on SRX Series devicesin a chassis cluster to limit the flapping of redundancy group state between the secondary and theprimary nodes in a preemptive failover.
12.1X47-D10 Starting with Junos OS Release 12.1X47-D10 and Junos OS Release 17.3R1, fabric monitoring isenabled by default. With this enabling, the node transitions directly to the ineligible state in case offabric link failures.
12.1X46-D20 Starting with Junos OS Release 12.1X46-D20 and Junos OS Release 17.3R1, fabric monitoring isenabled by default. With this enabling, the node transitions directly to the ineligible state in case offabric link failures.
RELATED DOCUMENTATION
Monitoring of Global-Level Objects in a Chassis Cluster | 201
Monitoring Chassis Cluster Interfaces | 206
Monitoring IP Addresses on a Chassis Cluster | 247
288

4CHAPTER
Chassis Cluster Operations
Aggregated Ethernet Interfaces in a Chassis Cluster | 290
NTP Time Synchronization on Chassis Cluster | 352
Active/Passive Chassis Cluster Deployments | 360
Multicast Routing and Asymmetric Routing on Chassis Cluster | 428
Ethernet Switching on Chassis Cluster | 449
Media Access Control Security (MACsec) on Chassis Cluster | 480
Understanding SCTP Behavior in Chassis Cluster | 500
Example: Encrypting Messages Between Two Nodes in a Chassis Cluster | 500

Aggregated Ethernet Interfaces in a Chassis Cluster
IN THIS SECTION
Understanding Link Aggregation Groups in a Chassis Cluster | 290
Example: Configuring Link Aggregation Groups in a Chassis Cluster | 292
Understanding Link Aggregation Group Failover in a Chassis Cluster | 297
Understanding LACP on Chassis Clusters | 299
Example: Configuring LACP on Chassis Clusters | 302
Example: Configuring Chassis Cluster Minimum Links | 313
Example: Configuring Chassis Cluster Redundant Ethernet Interface Link Aggregation Groups on an SRX5000Line Device with IOC2 or IOC3 | 316
Understanding VRRP on SRX Series Devices | 321
VRRP failover-delay Overview | 325
Example: Configuring VRRP/VRRPv3 on Chassis Cluster Redundant Ethernet Interfaces | 327
Example: Configuring VRRP for IPv6 | 340
IEEE 802.3ad link aggregation enables you to group Ethernet interfaces to form a single link layerinterface, also known as a link aggregation group (LAG) or bundle. Reth LAG interfaces combinecharacteristics of reth interfaces and LAG interfaces. For more information, see the following topics:
Understanding Link Aggregation Groups in a Chassis Cluster
Support for Ethernet link aggregation groups (LAGs) based on IEEE 802.3ad makes it possible toaggregate physical interfaces on a standalone device. LAGs on standalone devices provide increasedinterface bandwidth and link availability. Aggregation of links in a chassis cluster allows a redundantEthernet interface to add more than two physical child interfaces thereby creating a redundant Ethernetinterface LAG. For SRX4600 and SRX5000 line of devices, a redundant Ethernet interface LAG can haveup to eight links per redundant Ethernet interface per node (for a total of 16 links per redundantEthernet interface). For SRX300 Series, SRX550M, SRX1500, and SRX4100/SRX4200 devices, aredundant Ethernet interface LAG can have up to maximum four links per redundant Ethernet interfaceper node (for a total of 8 links per redundant Ethernet interface).
290

The aggregated links in a redundant Ethernet interface LAG provide the same bandwidth andredundancy benefits of a LAG on a standalone device with the added advantage of chassis clusterredundancy. A redundant Ethernet interface LAG has two types of simultaneous redundancy. Theaggregated links within the redundant Ethernet interface on each node are redundant; if one link in theprimary aggregate fails, its traffic load is taken up by the remaining links. If enough child links on theprimary node fail, the redundant Ethernet interface LAG can be configured so that all traffic on theentire redundant Ethernet interface fails over to the aggregate link on the other node. You can alsoconfigure interface monitoring for LACP-enabled redundancy group reth child links for added protection.
Aggregated Ethernet interfaces, known as local LAGs, are also supported on either node of a chassiscluster but cannot be added to redundant Ethernet interfaces. Local LAGs are indicated in the systeminterfaces list using an ae- prefix. Likewise any child interface of an existing local LAG cannot be addedto a redundant Ethernet interface and vice versa. Note that it is necessary for the switch (or switches)used to connect the nodes in the cluster to have a LAG link configured and 802.3ad enabled for eachLAG on both nodes so that the aggregate links are recognized as such and correctly pass traffic. Thetotal maximum number of combined individual node LAG interfaces (ae) and redundant Ethernet (reth)interfaces per cluster is 128.
The redundant Ethernet interface LAG child links from each node in the chassis cluster must beconnected to a different LAG at the peer devices. If a single peer switch is used to terminate theredundant Ethernet interface LAG, two separate LAGs must be used in the switch.
Links from different PICs or IOCs and using different cable types (for example, copper and fiber-optic)can be added to the same redundant Ethernet interface LAG but the speed of the interfaces must be thesame and all interfaces must be in full duplex mode. We recommend, however, that for purposes ofreducing traffic processing overhead, interfaces from the same PIC or IOC be used whenever feasible.Regardless, all interfaces configured in a redundant Ethernet interface LAG share the same virtual MACaddress.
SRX Series devices interface-monitoring feature allows monitoring of redundant Ethernet/aggregatedEthernet interfaces.
Redundant Ethernet interface configuration also includes a minimum-links setting that allows you to seta minimum number of physical child links on the primary node in a given redundant Ethernet interfacethat must be working for the interface to be up. The default minimum-links value is 1. Note that theminimum-links setting only monitors child links on the primary node. Redundant Ethernet interfaces donot use physical interfaces on the backup node for either ingress or egress traffic.
Note the following support details:
• Quality of service (QoS) is supported in a redundant Ethernet interface LAG. Guaranteed bandwidthis, however, duplicated across all links. If a link is lost, there is a corresponding loss of guaranteedbandwidth.
• Layer 2 transparent mode and Layer 2 security features are supported in redundant Ethernetinterface LAGs.
291

• Link Aggregation Control Protocol (LACP) is supported in chassis cluster deployments, whereaggregated Ethernet interfaces and redundant Ethernet interfaces are supported simultaneously.
• Chassis cluster management, control, and fabric interfaces cannot be configured as redundantEthernet interface LAGs or added to a redundant Ethernet interface LAG.
• Network processor (NP) bundling can coexist with redundant Ethernet interface LAGs on the samecluster. However, assigning an interface simultaneously to a redundant Ethernet interface LAG and anetwork processor bundle is not supported.
IOC2 cards do not have network processors but IOC1 cards do have them.
• Single flow throughput is limited to the speed of a single physical link regardless of the speed of theaggregate interface.
On SRX300, SRX320, SRX340, SRX345, SRX380, and SRX550M devices, the speed mode and link modeconfiguration is available for member interfaces of a reth interface.
For more information about Ethernet interface link aggregation and LACP, see the “AggregatedEthernet” information in the Interfaces User Guide for Security Devices.
SEE ALSO
Understanding Link Aggregation Control Protocol
Example: Configuring Link Aggregation Groups in a Chassis Cluster
IN THIS SECTION
Requirements | 293
Overview | 293
Configuration | 294
Verification | 296
This example shows how to configure a redundant Ethernet interface link aggregation group for achassis cluster. Chassis cluster configuration supports more than one child interface per node in aredundant Ethernet interface. When at least two physical child interface links from each node are
292

included in a redundant Ethernet interface configuration, the interfaces are combined within theredundant Ethernet interface to form a redundant Ethernet interface link aggregation group.
Requirements
Before you begin:
• Configure chassis cluster redundant interfaces. See "Example: Configuring Chassis Cluster RedundantEthernet Interfaces" on page 105.
• Understand chassis cluster redundant Ethernet interface link aggregation groups. See "UnderstandingLink Aggregation Groups in a Chassis Cluster" on page 290.
Overview
For aggregation to take place, the switch used to connect the nodes in the cluster must enable IEEE802.3ad link aggregation for the redundant Ethernet interface physical child links on each node. Becausemost switches support IEEE 802.3ad and are also LACP capable, we recommend that you enable LACPon SRX Series devices. In cases where LACP is not available on the switch, you must not enable LACP onSRX Series devices.
In this example, you assign six Ethernet interfaces to reth1 to form the Ethernet interface linkaggregation group:
• ge-1/0/1—reth1
• ge-1/0/2—reth1
• ge-1/0/3—reth1
• ge-12/0/1—reth1
• ge-12/0/2—reth1
• ge-12/0/3—reth1
A maximum of eight physical interfaces per node in a cluster, for a total of 16 child interfaces, can beassigned to a single redundant Ethernet interface when a redundant Ethernet interface LAG is beingconfigured.
Junos OS supports LACP and LAG on a redundant Ethernet interface, which is called RLAG.
293

Configuration
IN THIS SECTION
Procedure | 294
Procedure
CLI Quick Configuration
To quickly configure this example, copy the following commands, paste them into a text file, remove anyline breaks, change any details necessary to match your network configuration, copy and paste thecommands into the CLI at the [edit] hierarchy level, and then enter commit from configuration mode.
{primary:node0}[edit]
set interfaces ge-1/0/1 gigether-options redundant-parent reth1set interfaces ge-1/0/2 gigether-options redundant-parent reth1set interfaces ge-1/0/3 gigether-options redundant-parent reth1 set interfaces ge-12/0/1 gigether-options redundant-parent reth1set interfaces ge-12/0/2 gigether-options redundant-parent reth1 set interfaces ge-12/0/3 gigether-options redundant-parent reth1
Step-by-Step Procedure
To configure a redundant Ethernet interface link aggregation group:
• Assign Ethernet interfaces to reth1.
{primary:node0}[edit]user@host# set interfaces ge-1/0/1 gigether-options redundant-parent reth1user@host# set interfaces ge-1/0/2 gigether-options redundant-parent reth1user@host# set interfaces ge-1/0/3 gigether-options redundant-parent reth1user@host# set interfaces ge-12/0/1 gigether-options redundant-parent reth1user@host# set interfaces ge-12/0/2 gigether-options redundant-parent reth1 user@host# set interfaces ge-12/0/3 gigether-options redundant-parent reth1
294

Results
From configuration mode, confirm your configuration by entering the show interfaces reth1 command. Ifthe output does not display the intended configuration, repeat the configuration instructions in thisexample to correct it.
For brevity, this show command output includes only the configuration that is relevant to this example.Any other configuration on the system has been replaced with ellipses (...).
user@host# show interfaces reth1...ge-1/0/1 { gigether-options { redundant-parent reth1; }}ge-1/0/2 { gigether-options { redundant-parent reth1; }}ge-1/0/3 { gigether-options { redundant-parent reth1; }}ge-12/0/1 { gigether-options { redundant-parent reth1; }}ge-12/0/2 { gigether-options { redundant-parent reth1; }}ge-12/0/3 { gigether-options { redundant-parent reth1; }}...
295

If you are done configuring the device, enter commit from configuration mode.
Verification
IN THIS SECTION
Verifying the Redundant Ethernet Interface LAG Configuration | 296
Verifying the Redundant Ethernet Interface LAG Configuration
Purpose
Verify the redundant Ethernet interface LAG configuration.
Action
From operational mode, enter the show interfaces terse | match reth command.
{primary:node0}user@host> show interfaces terse | match rethge-1/0/1.0 up down aenet --> reth1.0ge-1/0/2.0 up down aenet --> reth1.0ge-1/0/3.0 up down aenet --> reth1.0ge-12/0/1.0 up down aenet --> reth1.0ge-12/0/2.0 up down aenet --> reth1.0ge-12/0/3.0 up down aenet --> reth1.0reth0 up downreth0.0 up down inet 10.10.37.214/24reth1 up downreth1.0 up down inet
SEE ALSO
Example: Configuring Aggregated Ethernet Device with LAG and LACP (CLI Procedure)
296

Understanding Link Aggregation Group Failover in a Chassis Cluster
IN THIS SECTION
Scenario 1: Monitored Interface Weight Is 255 | 298
Scenario 2: Monitored Interface Weight Is 75 | 298
Scenario 3: Monitored Interface Weight Is 100 | 299
To control failover of redundant Ethernet (reth) interfaces, it is important to configure the weights ofinterface monitoring according to the minimum-links setting. This configuration requires that the weightsbe equally distributed among the monitored links such that when the number of active physicalinterface links falls below the minimum-links setting, the computed weight for that redundancy group fallsto zero or below zero. This triggers a failover of the redundant Ethernet interfaces link aggregationgroup (LAG) once the number of physical links falls below the minimum-links value.
Consider a reth0 interface LAG with four underlying physical links and the minimum-links value set as 2. Inthis case, a failover is triggered only when the number of active physical links is less than 2.
• Interface-monitor and minimum-links values are used to monitor LAG link status and correctly calculatefailover weight.
• The minimum-links value is used to keep the redundant Ethernet link status. However, to trigger afailover, interface-monitor must be set.
• When the physical link is Up and LACP is Down, a failover of the redundant ethernet interfaces linkaggregation group (LAG) is triggered.
Configure the underlying interface attached to the redundant Ethernet LAG.
{primary:node0}[edit]user@host# set interfaces ge-0/0/4 gigether-options redundant-parent reth0user@host# set interfaces ge-0/0/5 gigether-options redundant-parent reth0user@host# set interfaces ge-0/0/6 gigether-options redundant-parent reth0user@host# set interfaces ge-0/0/7 gigether-options redundant-parent reth0
297

Specify the minimum number of links for the redundant Ethernet interface as 2.
{primary:node0}[edit]user@host# set interfaces reth0 redundant-ether-options minimum-links 2
Set up interface monitoring to monitor the health of the interfaces and trigger redundancy groupfailover.
The following scenarios provide examples of how to monitor redundant Ethernet LAG failover:
Scenario 1: Monitored Interface Weight Is 255
Specify the monitored interface weight as 255 for each underlying interface.
{primary:node0}[edit]user@host# set chassis cluster redundancy-group 1 interface-monitor ge-0/0/4 weight 255user@host# set chassis cluster redundancy-group 1 interface-monitor ge-0/0/5 weight 255user@host# set chassis cluster redundancy-group 1 interface-monitor ge-0/0/6 weight 255user@host# set chassis cluster redundancy-group 1 interface-monitor ge-0/0/7 weight 255
In this case, although there are three active physical links and the redundant Ethernet LAG could havehandled the traffic because of minimum-links configured, one physical link is still down, which triggers afailover based on the computed weight.
Scenario 2: Monitored Interface Weight Is 75
Specify the monitored interface weight as 75 for each underlying interface.
{primary:node0}[edit]user@host# set chassis cluster redundancy-group 1 interface-monitor ge-0/0/4 weight 75user@host# set chassis cluster redundancy-group 1 interface-monitor ge-0/0/5 weight 75user@host# set chassis cluster redundancy-group 1 interface-monitor ge-0/0/6 weight 75user@host# set chassis cluster redundancy-group 1 interface-monitor ge-0/0/7 weight 75
In this case, when three physical links are down, the redundant Ethernet interface will go down due tominimum-links configured. However, the failover will not happen, which in turn will result in traffic outage.
298

Scenario 3: Monitored Interface Weight Is 100
Specify the monitored interface weight as 100 for each underlying interface.
{primary:node0}[edit]user@host# set chassis cluster redundancy-group 1 interface-monitor ge-0/0/4 weight 100user@host# set chassis cluster redundancy-group 1 interface-monitor ge-0/0/5 weight 100user@host# set chassis cluster redundancy-group 1 interface-monitor ge-0/0/6 weight 100user@host# set chassis cluster redundancy-group 1 interface-monitor ge-0/0/7 weight 100
In this case, when the three physical links are down, the redundant Ethernet interface will go downbecause of the minimum-links value. However, at the same time a failover would be triggered because ofinterface monitoring computed weights, ensuring that there is no traffic disruption.
Of all the three scenarios, scenario 3 illustrates the most ideal way to manage redundant Ethernet LAGfailover.
Understanding LACP on Chassis Clusters
IN THIS SECTION
Chassis Cluster Redundant Ethernet Interface Link Aggregation Groups | 300
Sub-LAGs | 301
Supporting Hitless Failover | 301
Managing Link Aggregation Control PDUs | 301
You can combine multiple physical Ethernet ports to form a logical point-to-point link, known as a linkaggregation group (LAG) or bundle, such that a media access control (MAC) client can treat the LAG as ifit were a single link.
LAGs can be established across nodes in a chassis cluster to provide increased interface bandwidth andlink availability.
The Link Aggregation Control Protocol (LACP) provides additional functionality for LAGs. LACP issupported in standalone deployments, where aggregated Ethernet interfaces are supported, and inchassis cluster deployments, where aggregated Ethernet interfaces and redundant Ethernet interfacesare supported simultaneously.
299

You configure LACP on a redundant Ethernet interface by setting the LACP mode for the parent linkwith the lacp statement. The LACP mode can be off (the default), active, or passive.
This topic contains the following sections:
Chassis Cluster Redundant Ethernet Interface Link Aggregation Groups
A redundant Ethernet interface has active and standby links located on two nodes in a chassis cluster.All active links are located on one node, and all standby links are located on the other node. You canconfigure up to eight active links and eight standby links per node.
When at least two physical child interface links from each node are included in a redundant Ethernetinterface configuration, the interfaces are combined within the redundant Ethernet interface to form aredundant Ethernet interface LAG.
Having multiple active redundant Ethernet interface links reduces the possibility of failover. Forexample, when an active link is out of service, all traffic on this link is distributed to other activeredundant Ethernet interface links, instead of triggering a redundant Ethernet active/standby failover.
Aggregated Ethernet interfaces, known as local LAGs, are also supported on either node of a chassiscluster but cannot be added to redundant Ethernet interfaces. Likewise, any child interface of an existinglocal LAG cannot be added to a redundant Ethernet interface, and vice versa. The total maximumnumber of combined individual node LAG interfaces (ae) and redundant Ethernet (reth) interfaces percluster is 128.
However, aggregated Ethernet interfaces and redundant Ethernet interfaces can coexist, because thefunctionality of a redundant Ethernet interface relies on the Junos OS aggregated Ethernet framework.
For more information, see "Understanding Chassis Cluster Redundant Ethernet Interface LinkAggregation Groups" on page 290.
Minimum Links
Redundant Ethernet interface configuration includes a minimum-links setting that allows you to set aminimum number of physical child links in a redundant Ethernet interface LAG that must be working onthe primary node for the interface to be up. The default minimum-links value is 1. When the number ofphysical links on the primary node in a redundant Ethernet interface falls below the minimum-links value,the interface might be down even if some links are still working. For more information, see "Example:Configuring Chassis Cluster Minimum Links" on page 313.
300

Sub-LAGs
LACP maintains a point-to-point LAG. Any port connected to the third point is denied. However, aredundant Ethernet interface does connect to two different systems or two remote aggregated Ethernetinterfaces by design.
To support LACP on redundant Ethernet interface active and standby links, a redundant Ethernetinterface is created automatically to consist of two distinct sub-LAGs, where all active links form anactive sub-LAG and all standby links form a standby sub-LAG.
In this model, LACP selection logic is applied and limited to one sub-LAG at a time. In this way, tworedundant Ethernet interface sub-LAGs are maintained simultaneously while all the LACP advantagesare preserved for each sub-LAG.
It is necessary for the switches used to connect the nodes in the cluster to have a LAG link configuredand 802.3ad enabled for each LAG on both nodes so that the aggregate links are recognized as such andcorrectly pass traffic.
The redundant Ethernet interface LAG child links from each node in the chassis cluster must beconnected to a different LAG at the peer devices. If a single peer switch is used to terminate theredundant Ethernet interface LAG, two separate LAGs must be used in the switch.
Supporting Hitless Failover
With LACP, the redundant Ethernet interface supports hitless failover between the active and standbylinks in normal operation. The term hitless means that the redundant Ethernet interface state remains upduring a failover.
The lacpd process manages both the active and standby links of the redundant Ethernet interfaces. Aredundant Ethernet interface state remains up when the number of active up links is equal to or morethan the number of minimum links configured. Therefore, to support hitless failover, the LACP state onthe redundant Ethernet interface standby links must be collected and distributed before failover occurs.
Managing Link Aggregation Control PDUs
The protocol data units (PDUs) contain information about the state of the link. By default, aggregatedand redundant Ethernet links do not exchange link aggregation control PDUs.
You can configure PDUs exchange in the following ways:
• Configure Ethernet links to actively transmit link aggregation control PDUs
• Configure Ethernet links to passively transmit PDUs, sending out link aggregation control PDUs onlywhen they are received from the remote end of the same link
301

The local end of a child link is known as the actor and the remote end of the link is known as the partner.That is, the actor sends link aggregation control PDUs to its protocol partner that convey what the actorknows about its own state and that of the partner’s state.
You configure the interval at which the interfaces on the remote side of the link transmit linkaggregation control PDUs by configuring the periodic statement on the interfaces on the local side. It isthe configuration on the local side that specifies the behavior of the remote side. That is, the remoteside transmits link aggregation control PDUs at the specified interval. The interval can be fast (everysecond) or slow (every 30 seconds).
For more information, see "Example: Configuring LACP on Chassis Clusters" on page 302.
By default, the actor and partner transmit link aggregation control PDUs every second. You canconfigure different periodic rates on active and passive interfaces. When you configure the active andpassive interfaces at different rates, the transmitter honors the receiver’s rate.
Example: Configuring LACP on Chassis Clusters
IN THIS SECTION
Requirements | 302
Overview | 303
Configuration | 303
Verification | 310
This example shows how to configure LACP on chassis clusters.
Requirements
Before you begin:
Complete the tasks such as enabling the chassis cluster, configuring interfaces and redundancy groups.See "SRX Series Chassis Cluster Configuration Overview" on page 13 and "Example: Configuring ChassisCluster Redundant Ethernet Interfaces" on page 105 for more details.
302

Overview
You can combine multiple physical Ethernet ports to form a logical point-to-point link, known as a linkaggregation group (LAG) or bundle. You configure LACP on a redundant Ethernet interface of SRX seriesdevice in chassis cluster.
In this example, you set the LACP mode for the reth1 interface to active and set the link aggregationcontrol PDU transmit interval to slow, which is every 30 seconds.
When you enable LACP, the local and remote sides of the aggregated Ethernet links exchange protocoldata units (PDUs), which contain information about the state of the link. You can configure Ethernetlinks to actively transmit PDUs, or you can configure the links to passively transmit them (sending outLACP PDUs only when they receive them from another link). One side of the link must be configured asactive for the link to be up.
Figure 36 on page 303 shows the topology used in this example.
Figure 36: Topology for LAGs Connecting SRX Series Devices in Chassis Cluster to an EX Series Switch
In the Figure 36 on page 303, SRX550 devices are used to configure the interfaces on node0 and node1.For more information on EX Series switch configuration, see Configuring Aggregated Ethernet LACP (CLIProcedure).
Configuration
IN THIS SECTION
Configuring LACP on Chassis Cluster | 304
303

Configuring LACP on EX Series Switch | 306
Configuring LACP on Chassis Cluster
Step-by-Step Procedure
To configure LACP on chassis clusters:
1. Specify the number of redundant Ethernet interfaces.
[edit chassis cluster]user@host# set reth-count 2
2. Specify a redundancy group's priority for primacy on each node of the cluster. The higher numbertakes precedence.
[edit chassis cluster]user@host# set redundancy-group 1 node 0 priority 200 user@host# set redundancy-group 1 node 1 priority 100
3. Create security zone and assign interfaces to zone.
[edit security zones]user@host# set security-zone trust host-inbound-traffic system-services alluser@host# set security-zone trust interfaces reth1.0
4. Bind redundant child physical interfaces to reth1.
[edit interfaces]user@host# set ge-0/0/4 gigether-options redundant-parent reth1user@host# set ge-0/0/5 gigether-options redundant-parent reth1user@host# set ge-9/0/4 gigether-options redundant-parent reth1user@host# set ge-9/0/5 gigether-options redundant-parent reth1
304

5. Add reth1 to redundancy group 1.
[edit interfaces]user@host# set reth1 redundant-ether-options redundancy-group 1
6. Set the LACP on reth1.
[edit interfaces]user@host# set reth1 redundant-ether-options lacp activeuser@host# set reth1 redundant-ether-options lacp periodic slow
7. Assign an IP address to reth1.
[edit interfaces]user@host# set reth1 unit 0 family inet address 192.168.2.1/24
8. Configure LACP on aggregated Ethernet interfaces (ae1).
9. Configure LACP on aggregated Ethernet interfaces (ae2).
10. If you are done configuring the device, commit the configuration.
[edit interfaces]user@host# commit
Results
From configuration mode, confirm your configuration by entering the show chassis, show security zones, andshow interfaces commands. If the output does not display the intended configuration, repeat theconfiguration instructions in this example to correct it.
[edit]user@host#show chassiscluster { reth-count 2; redundancy-group 1 { node 0 priority 200; node 1 priority 100;
305

}}[edit]user@host#show security zonessecurity-zone trust { host-inbound-traffic { system-services { all; } } interfaces { reth1.0; }}[edit]user@host#show interfacesreth1 { redundant-ether-options { redundancy-group 1; lacp { active; periodic slow; } } unit 0 { family inet { address 192.168.2.1/24; } }}
Configuring LACP on EX Series Switch
Step-by-Step Procedure
Configure LACP on EX Series switch.
1. Set the number of aggregated Ethernet interfaces.
[edit chassis]user@host# set aggregated-devices ethernet device-count 3
306

2. Associate physical interfaces with aggregated Ethernet interfaces.
[edit interfaces]user@host# set ge-0/0/1 gigether-options 802.3ad ae1user@host# set ge-0/0/2 gigether-options 802.3ad ae1user@host# set ge-0/0/3 gigether-options 802.3ad ae2user@host# set ge-0/0/4 gigether-options 802.3ad ae2
3. Configure LACP on aggregated Ethernet interfaces (ae1).
[edit interfaces]user@host# set interfaces ae1 unit 0 family ethernet-switching interface-mode access
user@host# set interfaces ae1 unit 0 family ethernet-switching vlan members RETH0_VLAN
4. Configure LACP on aggregated Ethernet interfaces (ae2).
[edit interfaces]
user@host# set interfaces ae2 unit 0 family ethernet-switching interface-mode access
user@host# set interfaces ae2 unit 0 family ethernet-switching vlan members RETH0_VLAN
5. Configure VLAN.
user@host#set vlans RETH0_VLAN vlan-id 10user@host# set vlans RETH0_VLAN l3-interface vlan.10user@host# set interfaces vlan unit 10 family inet address 192.168.2.254/24
307

Results
From configuration mode, confirm your configuration by entering the show chassis and show interfacescommands. If the output does not display the intended configuration, repeat the configurationinstructions in this example to correct it.
[edit]user@host# show chassisaggregated-devices { ethernet { device-count 3; }}user@host# show vlansRETH0_VLAN { vlan-id 10; l3-interface vlan.10;}user@host> show vlans RETH0_VLANRouting instance VLAN name Tag Interfacesdefault-switch RETH0_VLAN 10 ae1.0* ae2.0*user@host> show ethernet-switching interface ae1Routing Instance Name : default-switchLogical Interface flags (DL - disable learning, AD - packet action drop, LH - MAC limit hit, DN - interface down, MMAS - Mac-move action shutdown, SCTL - shutdown by Storm-control )Logical Vlan TAG MAC STP Logical Tagginginterface members limit state interface flagsae1.0 131072 untagged RETH0_VLAN 10 131072 Forwarding untaggeduser@host> show ethernet-switching interface ae2Routing Instance Name : default-switchLogical Interface flags (DL - disable learning, AD - packet action drop, LH - MAC limit hit, DN - interface down, MMAS - Mac-move action shutdown, SCTL - shutdown by Storm-control )
Logical Vlan TAG MAC STP Logical Tagginginterface members limit state interface flags
308

ae2.0 131072 untagged RETH0_VLAN 10 131072 Forwarding untaggeduser@host# show interfacesge-0/0/1 { ether-options { 802.3ad ae1; }}ge-0/0/2 { ether-options { 802.3ad ae1; }}ge-0/0/3 { ether-options { 802.3ad ae2; }}ge-0/0/4 { ether-options { 802.3ad ae2; }}ae1 { aggregated-ether-options { lacp { active; periodic slow; } } unit 0 { family ethernet-switching { interface-mode access; vlan { members RETH0_VLAN; } } }}ae2 { aggregated-ether-options { lacp { active;
309

periodic slow; } } unit 0 { family ethernet-switching { interface-mode access; vlan { members RETH0_VLAN; } } }}vlan { unit 10 { family inet { address 192.168.2.254/24 { } } }
}
Verification
IN THIS SECTION
Verifying LACP on Redundant Ethernet Interfaces | 310
Verifying LACP on Redundant Ethernet Interfaces
Purpose
Display LACP status information for redundant Ethernet interfaces.
310

Action
From operational mode, enter the show chassis cluster status command.
{primary:node0}[edit]user@host> show chassis cluster statusMonitor Failure codes: CS Cold Sync monitoring FL Fabric Connection monitoring GR GRES monitoring HW Hardware monitoring IF Interface monitoring IP IP monitoring LB Loopback monitoring MB Mbuf monitoring NH Nexthop monitoring NP NPC monitoring SP SPU monitoring SM Schedule monitoring CF Config Sync monitoring RE Relinquish monitoring IS IRQ storm Cluster ID: 1Node Priority Status Preempt Manual Monitor-failures
Redundancy group: 0 , Failover count: 1node0 1 primary no no None node1 1 secondary no no None
Redundancy group: 1 , Failover count: 1node0 200 primary no no None node1 100 secondary no no None
{primary:node0}[edit]user@host> show chassis cluster interfacesControl link status: Up
Control interfaces: Index Interface Monitored-Status Internal-SA Security 0 fxp1 Up Disabled Disabled
Fabric link status: Up
Fabric interfaces: Name Child-interface Status Security (Physical/Monitored) fab0 ge-0/0/2 Up / Up Enabled
311

fab0 fab1 ge-9/0/2 Up / Up Enabled fab1
Redundant-ethernet Information: Name Status Redundancy-group reth0 Down Not configured reth1 Up 1 Redundant-pseudo-interface Information: Name Status Redundancy-group lo0 Up 0
From operational mode, enter the show lacp interfaces reth1 command.
{primary:node0}[edit]user@host> show lacp interfaces reth1Aggregated interface: reth1 LACP state: Role Exp Def Dist Col Syn Aggr Timeout Activity ge-0/0/4 Actor No No Yes Yes Yes Yes Slow Active ge-0/0/4 Partner No No Yes Yes Yes Yes Slow Active ge-0/0/5 Actor No No Yes Yes Yes Yes Slow Active ge-0/0/5 Partner No No Yes Yes Yes Yes Slow Active ge-9/0/4 Actor No No Yes Yes Yes Yes Slow Active ge-9/0/4 Partner No No Yes Yes Yes Yes Slow Active ge-9/0/5 Actor No No Yes Yes Yes Yes Slow Active ge-9/0/5 Partner No No Yes Yes Yes Yes Slow Active LACP protocol: Receive State Transmit State Mux State ge-0/0/4 Current Slow periodic Collecting distributing ge-0/0/5 Current Slow periodic Collecting distributing ge-9/0/4 Current Slow periodic Collecting distributing ge-9/0/5 Current Slow periodic Collecting distributing
The output shows redundant Ethernet interface information, such as the following:
• The LACP state—Indicates whether the link in the bundle is an actor (local or near-end of the link) ora partner (remote or far-end of the link).
• The LACP mode—Indicates whether both ends of the aggregated Ethernet interface are enabled(active or passive)—at least one end of the bundle must be active.
• The periodic link aggregation control PDU transmit rate.
312

• The LACP protocol state—Indicates the link is up if it is collecting and distributing packets.
Example: Configuring Chassis Cluster Minimum Links
IN THIS SECTION
Requirements | 313
Overview | 313
Configuration | 314
Verification | 314
This example shows how to specify a minimum number of physical links assigned to a redundantEthernet interface on the primary node that must be working for the interface to be up.
Requirements
Before you begin:
• Configure redundant Ethernet interfaces. See "Example: Configuring Chassis Cluster RedundantEthernet Interfaces" on page 105.
• Understand redundant Ethernet interface link aggregation groups. See "Example: Configuring LinkAggregation Groups in a Chassis Cluster" on page 292.
Overview
When a redundant Ethernet interface has more than two child links, you can set a minimum number ofphysical links assigned to the interface on the primary node that must be working for the interface to beup. When the number of physical links on the primary node falls below the minimum-links value, theinterface will be down even if some links are still working.
In this example, you specify that three child links on the primary node and bound to reth1 (minimum-links value) be working to prevent the interface from going down. For example, in a redundant Ethernetinterface LAG configuration in which six interfaces are assigned to reth1, setting the minimum-linksvalue to 3 means that all reth1 child links on the primary node must be working to prevent theinterface’s status from changing to down.
313

Although it is possible to set a minimum-links value for a redundant Ethernet interface with only twochild interfaces (one on each node), we do not recommend it.
Configuration
IN THIS SECTION
Procedure | 314
Procedure
Step-by-Step Procedure
To specify the minimum number of links:
1. Specify the minimum number of links for the redundant Ethernet interface.
{primary:node0}[edit]user@host# set interfaces reth1 redundant-ether-options minimum-links 3
2. If you are done configuring the device, commit the configuration.
{primary:node0}[edit]user@host# commit
Verification
IN THIS SECTION
Verifying the Chassis Cluster Minimum Links Configuration | 315
314

Verifying the Chassis Cluster Minimum Links Configuration
Purpose
To verify the configuration is working properly, enter the show interface reth1 command.
Action
From operational mode, enter the show show interfaces reth1 command.
{primary:node0}[edit]user@host> show interfaces reth1Physical interface: reth1, Enabled, Physical link is Down Interface index: 129, SNMP ifIndex: 548 Link-level type: Ethernet, MTU: 1514, Speed: Unspecified, BPDU Error: None, MAC-REWRITE Error: None, Loopback: Disabled, Source filtering: Disabled, Flow control: Disabled, Minimum links needed: 3, Minimum bandwidth needed: 0 Device flags : Present Running Interface flags: Hardware-Down SNMP-Traps Internal: 0x0 Current address: 00:10:db:ff:10:01, Hardware address: 00:10:db:ff:10:01 Last flapped : 2010-09-15 15:54:53 UTC (1w0d 22:07 ago) Input rate : 0 bps (0 pps) Output rate : 0 bps (0 pps)
Logical interface reth1.0 (Index 68) (SNMP ifIndex 550) Flags: Hardware-Down Device-Down SNMP-Traps 0x0 Encapsulation: ENET2 Statistics Packets pps Bytes bps Bundle: Input : 0 0 0 0 Output: 0 0 0 0 Security: Zone: untrust Allowed host-inbound traffic : bootp bfd bgp dns dvmrp igmp ldp msdp nhrp ospf pgm pim rip router-discovery rsvp sap vrrp dhcp finger ftp tftp ident-reset http https ike netconf ping reverse-telnet reverse-ssh rlogin rpm rsh snmp snmp-trap ssh telnet traceroute xnm-clear-text xnm-ssl lsping ntp sip Protocol inet, MTU: 1500 Flags: Sendbcast-pkt-to-re
315

Example: Configuring Chassis Cluster Redundant Ethernet Interface LinkAggregation Groups on an SRX5000 Line Device with IOC2 or IOC3
IN THIS SECTION
Requirements | 316
Overview | 316
Configuration | 317
Verification | 320
Support for Ethernet link aggregation groups (LAGs) based on IEEE 802.3ad makes it possible toaggregate physical interfaces on a standalone device. LAGs on standalone devices provide increasedinterface bandwidth and link availability. Aggregation of links in a chassis cluster allows a redundantEthernet interface to add more than two physical child interfaces, thereby creating a redundant Ethernetinterface LAG.
Requirements
This example uses the following software and hardware components:
• Junos OS Release 15.1X49-D40 or later for SRX Series devices.
• SRX5800 with IOC2 or IOC3 with Express Path enabled on IOC2 and IOC3. For details, see Example:Configuring SRX5K-MPC3-100G10G (IOC3) and SRX5K-MPC3-40G10G (IOC3) on an SRX5000 LineDevice to Support Express Path.
Overview
This example shows how to configure a redundant Ethernet interface link aggregation group andconfigure LACP on chassis clusters on an SRX Series device using the ports from either IOC2 or IOC3 inExpress Path mode. Note that configuring child interfaces by mixing links from both IOC2 and IOC3 isnot supported.
The following member links are used in this example:
• xe-1/0/0
• xe-3/0/0
• xe-14/0/0
316

• xe-16/0/0
Configuration
IN THIS SECTION
CLI Quick Configuration | 317
Procedure | 317
CLI Quick Configuration
To quickly configure this example, copy the following commands, paste them into a text file, remove anyline breaks, change any details necessary to match your network configuration, delete, and then copyand paste the commands into the CLI at the [edit] hierarchy level, and then enter commit fromconfiguration mode.
set chassis cluster reth-count 5 set interfaces reth0 redundant-ether-options redundancy-group 1set interfaces reth0 redundant-ether-options lacp active set interfaces reth0 redundant-ether-options lacp periodic fastset interfaces reth0 redundant-ether-options minimum-links 1set interfaces reth0 unit 0 family inet address 192.0.2.1/24set interfaces xe-1/0/0 gigether-options redundant-parent reth0 set interfaces xe-3/0/0 gigether-options redundant-parent reth0 set interfaces xe-14/0/0 gigether-options redundant-parent reth0set interfaces xe-16/0/0 gigether-options redundant-parent reth0
Procedure
Step-by-Step Procedure
To configure LAG Interfaces:
1. Specify the number of aggregated Ethernet interfaces to be created.
[edit chassis]user@host# set chassis cluster reth-count 5
317

2. Bind redundant child physical interfaces to reth0.
[edit interfaces]user@host# set xe-1/0/0 gigether-options redundant-parent reth0 user@host# set xe-3/0/0 gigether-options redundant-parent reth0 user@host# set xe-14/0/0 gigether-options redundant-parent reth0user@host# set xe-16/0/0 gigether-options redundant-parent reth0
3. Add reth0 to redundancy group 1.
user@host#set reth0 redundant-ether-options redundancy-group 1
4. Assign an IP address to reth0.
[edit interfaces]user@host# set reth0 unit 0 family inet address 192.0.2.1/24
5. Set the LACP on reth0.
[edit interfaces]user@host# set reth0 redundant-ether-options lacp active user@host# set reth0 redundant-ether-options lacp periodic fastuser@host# set reth0 redundant-ether-options minimum-links 1
Results
From configuration mode, confirm your configuration by entering the show interfaces command. If theoutput does not display the intended configuration, repeat the configuration instructions in this exampleto correct it.
[edit]user@host# show interfacesxe-1/0/0 { gigether-options { redundant-parent reth0; }}xe-3/0/0 {
318

gigether-options { redundant-parent reth0; }}xe-14/0/0 { gigether-options { redundant-parent reth0; }}xe-16/0/0 { gigether-options { redundant-parent reth0; }}reth0 { redundant-ether-options { lacp { active; periodic fast; } minimum-links 1; } unit 0 { family inet { address 192.0.2.1/24; } }}ae1 { aggregated-ether-options { lacp { active; } } unit 0 { family inet { address 192.0.2.2/24; }
319

}}
[edit] user@host# show chassischassis cluster { reth-count 5;}
If you are done configuring the device, enter commit from configuration mode.
Verification
IN THIS SECTION
Verifying LACP on Redundant Ethernet Interfaces | 320
Verifying LACP on Redundant Ethernet Interfaces
Purpose
Display LACP status information for redundant Ethernet interfaces.
Action
From operational mode, enter the show lacp interfaces command to check that LACP has been enabled asactive on one end.
user@host> show lacp interfaces
Aggregated interface: reth0 LACP state: Role Exp Def Dist Col Syn Aggr Timeout Activity xe-16/0/0 Actor No No Yes Yes Yes Yes Fast Active xe-16/0/0 Partner No No Yes Yes Yes Yes Fast Active xe-14/0/0 Actor No No Yes Yes Yes Yes Fast Active xe-14/0/0 Partner No No Yes Yes Yes Yes Fast Active xe-1/0/0 Actor No No Yes Yes Yes Yes Fast Active
320

xe-1/0/0 Partner No No Yes Yes Yes Yes Fast Active xe-3/0/0 Actor No No Yes Yes Yes Yes Fast Active xe-3/0/0 Partner No No Yes Yes Yes Yes Fast Active LACP protocol: Receive State Transmit State Mux State xe-16/0/0 Current Fast periodic Collecting distributing xe-14/0/0 Current Fast periodic Collecting distributing xe-1/0/0 Current Slow periodic Collecting distributing xe-3/0/0 Current Slow periodic Collecting distributing
The output indicates that LACP has been set up correctly and is active at one end.
Understanding VRRP on SRX Series Devices
IN THIS SECTION
Overview of VRRP on SRX Series Devices | 321
Benefits of VRRP | 322
Sample VRRP Topology | 323
SRX Series Devices Support for VRRPv3 | 324
Limitations of VRRPv3 Features | 324
SRX Series devices support the Virtual Router Redundancy Protocol (VRRP) and VRRP for IPv6. Thistopic covers:
Overview of VRRP on SRX Series Devices
Configuring end hosts on your network with static default routes minimizes configuration effort andcomplexity and reduces processing overhead on the end hosts. When hosts are configured with staticroutes, the failure of the default gateway normally results in a catastrophic event, isolating all hosts thatare unable to detect available alternate paths to their gateway. Using Virtual Router RedundancyProtocol (VRRP) enables you to dynamically provide alternative gateways for end hosts if the primarygateway fails.
You can configure the Virtual Router Redundancy Protocol (VRRP) or VRRP for IPv6 on Gigabit Ethernetinterfaces, 10-Gigabit Ethernet interfaces, and logical interfaces on SRX Series devices. VRRP enableshosts on a LAN to make use of redundant devices on that LAN without requiring more than the static
321

configuration of a single default route on the hosts. Devices configured with VRRP share the IP addresscorresponding to the default route configured on the hosts. At any time, one of the VRRP configureddevices is the primary (active) and the others are backups. If the primary device fails, then one of thebackup devices becomes the new primary, providing a virtual default device and enabling traffic on theLAN to be routed without relying on a single device. Using VRRP, a backup SRX Series device can takeover a failed default device within a few seconds. This is done with minimum loss of VRRP traffic andwithout any interaction with the hosts. Virtual Router Redundancy Protocol is not supported onmanagement interfaces.
VRRP for IPv6 provides a much faster switchover to an alternate default device than IPv6 NeighborDiscovery (ND) procedures. VRRP for IPv6 does not support the authentication-type or authentication-keystatements.
Devices running VRRP dynamically elect primary and backup devices. You can also force assignment ofprimary and backup devices using priorities from 1 through 255, with 255 being the highest priority. InVRRP operation, the default primary device sends advertisements to the backup device at a regularintervals. The default interval is 1 second. If the backup device do not receive an advertisement for a setperiod, then the backup device with the highest priority takes over as primary and begins forwardingpackets.
The backup devices do not attempt to preempt the primary device unless it has higher priority. Thiseliminates service disruption unless a more preferred path becomes available. It is possible toadministratively prohibit all preemption attempts, with the exception of a VRRP device becomingprimary device of any device associated with addresses it owns.
VRRP does not support session synchronization between members. If the primary device fails, thebackup device with the highest priority takes over as primary and will begin forwarding packets. Anyexisting sessions will be dropped on the backup device as out-of-state.
Priority 255 cannot be set for routed VLAN interfaces (RVIs).
VRRP is defined in RFC 3768, Virtual Router Redundancy Protocol.
Benefits of VRRP
• VRRP provides dynamic failover of IP addresses from one device to another in the event of failure.
• You can implement VRRP to provide a highly available default path to a gateway without needing toconfigure dynamic routing or router discovery protocols on end hosts.
322

Sample VRRP Topology
Figure 37 on page 323 illustrates a basic VRRP topology with SRX Series devices. In this example,Devices A and B are running VRRP and share the virtual IP address 192.0.2.1. The default gateway foreach of the clients is 192.0.2.1.
Figure 37: Basic VRRP on SRX Series Switches
The following illustrates basic VRRP behavior using Figure 37 on page 323 for reference:
1. When any of the servers wants to send traffic out of the LAN, it sends the traffic to the defaultgateway address of 192.0.2.1. This is a virtual IP address (VIP) owned by VRRP group 100. BecauseDevice A is the primary of the group, the VIP is associated with the “real” address 192.0.2.251 onDevice A, and traffic from the servers is actually sent to this address. (Device A is the primarybecause it has been configured with a higher priority value.)
2. If there is a failure on Device A that prevents it from forwarding traffic to or from the servers—forexample, if the interface connected to the LAN fails—Device B becomes the primary and assumesownership of the VIP. The servers continue to send traffic to the VIP, but because the VIP is nowassociated with the “real” address 192.0.2.252 on Device B (because of change of primary), the trafficis sent to Device B instead of Device A.
3. If the problem that caused the failure on Device A is corrected, Device A becomes the primary againand reasserts ownership of the VIP. In this case, the servers resume sending traffic to Device A.
Notice that no configuration changes are required on the servers for them to switch between sendingtraffic to Device A and Device B. When the VIP moves between 192.0.2.251 and 192.0.2.252, thechange is detected by normal TCP-IP behavior and no configuration or intervention is required on theservers.
323

SRX Series Devices Support for VRRPv3
The advantage of using VRRPv3 is that VRRPv3 supports both IPv4 and IPv6 address families, whereasVRRP supports only IPv4 addresses.
Enable VRRPv3 in your network only if VRRPv3 can be enabled on all the devices configured with VRRPin your network because VRRPv3 (IPv4) does not interoperate with the previous versions of VRRP. Forexample, if VRRP IPv4 advertisement packets are received by a device on which VRRPv3 is enabled,then the device transitions itself to the backup state to avoid creating multiple primaries in the network.
You can enable VRRPv3 by configuring the version-3 statement at the [edit protocols vrrp] hierarchylevel (for IPv4 or IPv6 networks). Configure the same protocol version on all VRRP devices on the LAN.
Limitations of VRRPv3 Features
Below are some VRRPv3 features limitations.
VRRPv3 Authentication
When VRRPv3 (for IPv4) is enabled, it does not allow authentication.
• The authentication-type and authentication-key statements cannot be configured for any VRRP groups.
• You must use non-VRRP authentication.
VRRPv3 Advertisement Intervals
VRRPv3 (for IPv4 and IPv6) advertisement intervals must be set with the fast-interval statement at the[edit interfaces interface-name unit 0 family inet address ip-address vrrp-group group-name] hierarchylevel.
• Do not use the advertise-interval statement (for IPv4).
• Do not use the inet6-advertise-interval statement (for IPv6).
SEE ALSO
Junos OS High Availability Configuration Guide
show vrrp | 973
324

VRRP failover-delay Overview
IN THIS SECTION
When failover-delay Is Not Configured | 325
When failover-delay Is Configured | 326
Failover is a backup operational mode in which the functions of a network device are assumed by asecondary device when the primary device becomes unavailable because of a failure or a scheduleddown time. Failover is typically an integral part of mission-critical systems that must be constantlyavailable on the network.
VRRP does not support session synchronization between members. If the primary device fails, thebackup device with the highest priority takes over as primary and will begin forwarding packets. Anyexisting sessions will be dropped on the backup device as out-of-state.
A fast failover requires a short delay. Thus, failover-delay configures the failover delay time, inmilliseconds, for VRRP and VRRP for IPv6 operations. Junos OS supports a range of 50 through 100000milliseconds for delay in failover time.
The VRRP process (vrrpd) running on the Routing Engine communicates a VRRP primary role change tothe Packet Forwarding Engine for every VRRP session. Each VRRP group can trigger suchcommunication to update the Packet Forwarding Engine with its own state or the state inherited forman active VRRP group. To avoid overloading the Packet Forwarding Engine with such messages, you canconfigure a failover-delay to specify the delay between subsequent Routing Engine to PacketForwarding Engine communications.
The Routing Engine communicates a VRRP primary role change to the Packet Forwarding Engine tofacilitate necessary state change on the Packet Forwarding Engine, such as reprogramming of PacketForwarding Engine hardware filters, VRRP sessions and so on. The following sections elaborate theRouting Engine to Packet Forwarding Engine communication in two scenarios:
When failover-delay Is Not Configured
Without failover-delay configured, the sequence of events for VRRP sessions operated from the RoutingEngine is as follows:
1. When the first VRRP group detected by the Routing Engine changes state, and the new state isprimary, the Routing Engine generates appropriate VRRP announcement messages. The PacketForwarding Engine is informed about the state change, so that hardware filters for that group are
325

reprogrammed without delay. The new primary then sends gratuitous ARP message to the VRRPgroups.
2. The delay in failover timer starts. By default, failover-delay timer is:
• 500 miliseconds—when the configured VRRP announcement interval is less than 1 second.
• 2 seconds—when the configured VRRP announcement interval is 1 second or more, and the totalnumber of VRRP groups on the router is 255.
• 10 seconds—when the configured VRRP announcement interval is 1 second or more, and thenumber of VRRP groups on the router is more than 255.
3. The Routing Engine performs one-by-one state change for subsequent VRRP groups. Every timethere is a state change, and the new state for a particular VRRP group is primary, the Routing Enginegenerates appropriate VRRP announcement messages. However, communication toward the PacketForwarding Engine is suppressed until the failover-delay timer expires.
4. After failover-delay timer expires, the Routing Engine sends message to the Packet ForwardingEngine about all VRRP groups that managed to change the state. As a consequence, hardware filtersfor those groups are reprogrammed, and for those groups whose new state is primary, gratuitousARP messages are sent.
This process repeats until state transition for all VRRP groups is complete.
Thus, without configuring failover-delay, the full state transition (including states on the Routing Engineand the Packet Forwarding Engine) for the first VRRP group is performed immediately, while statetransition on the Packet Forwarding Engine for remaining VRRP groups is delayed by at least 0.5-10seconds, depending on the configured VRRP announcement timers and the number of VRRP groups.During this intermediate state, receiving traffic for VRRP groups for state changes that were not yetcompleted on the Packet Forwarding Engine might be dropped at the Packet Forwarding Engine leveldue to deferred reconfiguration of hardware filters.
When failover-delay Is Configured
When failover-delay is configured, the sequence of events for VRRP sessions operated from the RoutingEngine is modified as follows:
1. The Routing Engine detects that some VRRP groups require a state change.
2. The failover-delay starts for the period configured. The allowed failover-delay timer range is 50through 100000 miliseconds.
3. The Routing Engine performs one-by-one state change for the VRRP groups. Every time there is astate change, and the new state for a particular VRRP group is primary, the Routing Engine generates
326

appropriate VRRP announcement messages. However, communication toward the Packet ForwardingEngine is suppressed until the failover-delay timer expires.
4. After failover-delay timer expires, the Routing Enigne sends message to the Packet ForwardingEngine about all VRRP groups that managed to change the state. As a consequence, hardware filtersfor those groups are reprogrammed, and for those groups whose new state is primary, gratuitousARP messages are sent.
This process repeats until state transition for all VRRP groups is complete.
Thus, when failover-delay is configured even the Packet Forwarding Engine state for the first VRRPgroup is deferred. However, the network operator has the advantage of configuring a failover-delayvalue that best suits the need of the network deployment to ensure minimal outage during VRRP statechange.
failover-delay influences only VRRP sessions operated by the VRRP process (vrrpd) running on theRouting Engine. For VRRP sessions distributed to the Packet Forwarding Engine, failover-delayconfiguration has no effect.
SEE ALSO
failover-delay
Example: Configuring VRRP/VRRPv3 on Chassis Cluster RedundantEthernet Interfaces
IN THIS SECTION
Requirements | 328
Overview | 328
Configuration VRRP | 329
Verification | 337
When Virtual Router Redundancy Protocol (VRRP) is configured, the VRRP groups multiple devices intoa virtual device. At any time, one of the devices configured with VRRP is the primary (active) and the
327

other devices are backups. If the primary fails, one of the backup devices becomes the new primarydevice.
This example describes how to configure VRRP on redundant interface:
Requirements
This example uses the following hardware and software components:
• Junos OS Release 18.1 R1 or later for SRX Series Services Gateways.
• Two SRX Series devices connected in a chassis cluster.
• One SRX Series device connected as standalone device.
Overview
IN THIS SECTION
Topology | 329
You configure VRRP by configuring VRRP groups on redundant interfaces on a chassis cluster devicesand on Gigabit Ethernet interface on standalone device. A redundant interface of chassis cluster devicesand Gigabit Ethernet interface of standalone device can be a member of one or more VRRP groups.Within a VRRP group, the primary redundant interface of chassis cluster devices and the backup GigabitEthernet interface of standalone device must be configured.
To configure VRRP group, you must configure group identifier, and virtual IP address to the redundantinterfaces and Gigabit Ethernet interfaces that are members of VRRP group. The virtual IP address mustbe the same for all the interfaces in the VRRP group. Then you configure the priority to the redundantinterfaces and Gigabit Ethernet interfaces to become the primary interface.
You can force assignment of primary and backup redundant interfaces and Gigabit Ethernet interfacesusing priorities from 1 through 255, where 255 is the highest priority.
328

Topology
Figure 38 on page 329 shows the topology used in this example.
Figure 38: VRRP on Redundant interface
Configuration VRRP
IN THIS SECTION
Configuring VRRPv3, VRRP Groups, and Priority on Chassis Cluster Redundant EthernetInterfaces | 329
Configuring VRRP Groups on Standalone Device | 334
Configuring VRRPv3, VRRP Groups, and Priority on Chassis Cluster Redundant Ethernet Interfaces
CLI Quick Configuration
To quickly configure this example, copy the following commands, paste them into a text file, remove anyline breaks, change any details necessary to match your network configuration, copy and paste thecommands into the CLI at the [edit] hierarchy level, and then enter commit from configuration mode.
set protocols vrrp traceoptions file vrrp.logset protocols vrrp traceoptions file size 10000000set protocols vrrp traceoptions flag all
329
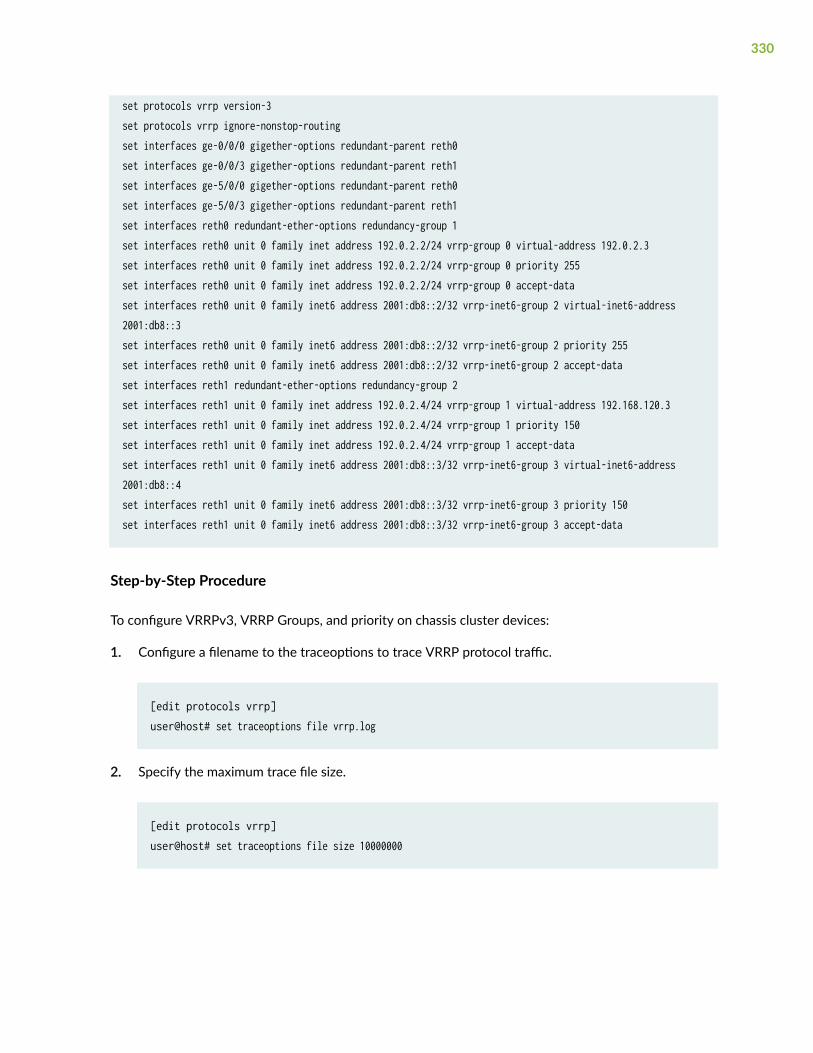
set protocols vrrp version-3set protocols vrrp ignore-nonstop-routingset interfaces ge-0/0/0 gigether-options redundant-parent reth0set interfaces ge-0/0/3 gigether-options redundant-parent reth1set interfaces ge-5/0/0 gigether-options redundant-parent reth0set interfaces ge-5/0/3 gigether-options redundant-parent reth1set interfaces reth0 redundant-ether-options redundancy-group 1set interfaces reth0 unit 0 family inet address 192.0.2.2/24 vrrp-group 0 virtual-address 192.0.2.3set interfaces reth0 unit 0 family inet address 192.0.2.2/24 vrrp-group 0 priority 255set interfaces reth0 unit 0 family inet address 192.0.2.2/24 vrrp-group 0 accept-dataset interfaces reth0 unit 0 family inet6 address 2001:db8::2/32 vrrp-inet6-group 2 virtual-inet6-address 2001:db8::3set interfaces reth0 unit 0 family inet6 address 2001:db8::2/32 vrrp-inet6-group 2 priority 255set interfaces reth0 unit 0 family inet6 address 2001:db8::2/32 vrrp-inet6-group 2 accept-dataset interfaces reth1 redundant-ether-options redundancy-group 2set interfaces reth1 unit 0 family inet address 192.0.2.4/24 vrrp-group 1 virtual-address 192.168.120.3set interfaces reth1 unit 0 family inet address 192.0.2.4/24 vrrp-group 1 priority 150set interfaces reth1 unit 0 family inet address 192.0.2.4/24 vrrp-group 1 accept-dataset interfaces reth1 unit 0 family inet6 address 2001:db8::3/32 vrrp-inet6-group 3 virtual-inet6-address 2001:db8::4set interfaces reth1 unit 0 family inet6 address 2001:db8::3/32 vrrp-inet6-group 3 priority 150set interfaces reth1 unit 0 family inet6 address 2001:db8::3/32 vrrp-inet6-group 3 accept-data
Step-by-Step Procedure
To configure VRRPv3, VRRP Groups, and priority on chassis cluster devices:
1. Configure a filename to the traceoptions to trace VRRP protocol traffic.
[edit protocols vrrp]user@host# set traceoptions file vrrp.log
2. Specify the maximum trace file size.
[edit protocols vrrp]user@host# set traceoptions file size 10000000
330

3. Enable vrrp traceoptions.
[edit protocols vrrp]user@host# set traceoptions flag all
4. Set vrrp version to 3.
[edit protocols vrrp]user@host# set version-3
5. Configure this command to support graceful Routing Engine switchover (GRES) for VRRP and fornonstop active routing when there is VRRP reth failover. Using vrrp, a secondary node can takeover a failed primary node within a few seconds and this is done with minimum VRRP traffic andwithout any interaction with the hosts
[edit protocols vrrp]user@host#set ignore-nonstop-routing
6. Set up the redundant Ethernet (reth) interfaces and assign the redundant interface to a zone.
[edit interfaces]user@host# set ge-0/0/0 gigether-options redundant-parent reth0user@host# set ge-0/0/3 gigether-options redundant-parent reth1user@host# set ge-5/0/0 gigether-options redundant-parent reth0user@host# set ge-5/0/3 gigether-options redundant-parent reth1user@host# set reth0 redundant-ether-options redundancy-group 1user@host# set reth1 redundant-ether-options redundancy-group 2
7. Configure the family inet address and virtual address for the redundant interface 0 unit 0.
[edit interfaces]user@host# set reth0 unit 0 family inet address 192.0.2.2/24 vrrp-group 0 virtual-address 192.168.110.3user@host# set reth0 unit 0 family inet6 address 2001:db8::2/32 vrrp-inet6-group 2 virtual-inet6-address 2001:db8::3
331

8. Configure the family inet address and virtual address for the redundant interface 1 unit 0.
[edit interfaces]user@host# set reth1 unit 0 family inet address 192.0.2.4/24 vrrp-group 1 virtual-address 192.168.120.3user@host# set reth1 unit 0 family inet6 address 2001:db8::3/32 vrrp-inet6-group 3 virtual-inet6-address 2001:db8::4
9. Set the priority of the redundant interface 0 unit 0 to 255.
[edit interfaces]user@host# set reth0 unit 0 family inet address 192.0.2.2/24 vrrp-group 0 priority 255user@host# set reth0 unit 0 family inet6 address 2001:db8::2/32 vrrp-inet6-group 2 priority 255
10. Set the priority of the redundant interface 1 unit 0 to 150.
[edit interfaces]user@host# set reth1 unit 0 family inet address 192.0.2.4/24 vrrp-group 1 priority 150user@host# set reth1 unit 0 family inet6 address 2001:db8::3/32 vrrp-inet6-group 3 priority 150
11. Configure the redundant interface 0 unit 0 to accept all packets sent to the virtual IP address.
[edit interfaces]user@host# set reth0 unit 0 family inet address 192.0.2.2/24 vrrp-group 0 accept-datauser@host# set reth0 unit 0 family inet6 address 2001:db8::2/32 vrrp-inet6-group 2 accept-data
12. Configure the redundant interface 1 unit 0 to accept all packets sent to the virtual IP address.
[edit interfaces]user@host# set reth1 unit 0 family inet address 192.0.2.4/24 vrrp-group 1 accept-datauser@host# set reth1 unit 0 family inet6 address 2001:db8::3/32 vrrp-inet6-group 3 accept-data
332

Results
From configuration mode, confirm your configuration by entering the show interfaces reth0 and showinterfaces reth1 commands. If the output does not display the intended configuration, repeat theconfiguration instructions in this example to correct it.
[edit]user@host# show interfaces reth0redundant-ether-options { redundancy-group 1; } unit 0 { family inet { address 192.0.2.2/24 { vrrp-group 0 { virtual-address 192.0.2.3; priority 255; accept-data; } } } family inet6 { address 2001:db8::2/32 { vrrp-inet6-group 2 { virtual-inet6-address 2001:db8::3; priority 255; accept-data; } } } }
[edit]user@host# show interfaces reth1redundant-ether-options { redundancy-group 2; } unit 0 { family inet { address 192.0.2.4/24 { vrrp-group 1 {
333

virtual-address 192.0.2.5; priority 150; accept-data; } } } family inet6 { address 2001:db8::3/32 { vrrp-inet6-group 3 { virtual-inet6-address 2001:db8::4; priority 150; accept-data; } } } }
If you are done configuring the device, enter commit from configuration mode.
Configuring VRRP Groups on Standalone Device
CLI Quick Configuration
To quickly configure this example, copy the following commands, paste them into a text file, remove anyline breaks, change any details necessary to match your network configuration, copy and paste thecommands into the CLI at the [edit] hierarchy level, and then enter commit from configuration mode.
set protocols vrrp version-3set interfaces xe-5/0/5 unit 0 family inet address 192.0.2.1/24 vrrp-group 0 virtual-address 192.0.2.3set interfaces xe-5/0/5 unit 0 family inet address 192.0.2.1/24 vrrp-group 0 priority 50set interfaces xe-5/0/5 unit 0 family inet address 192.0.2.1/24 vrrp-group 0 accept-dataset interfaces xe-5/0/5 unit 0 family inet6 address 2001:db8::1/32 vrrp-inet6-group 2 virtual-inet6-address 2001:db8::3set interfaces xe-5/0/5 unit 0 family inet6 address 2001:db8::1/32 vrrp-inet6-group 2 priority 50
334

set interfaces xe-5/0/5 unit 0 family inet6 address 2001:db8::1/32 vrrp-inet6-group 2 accept-dataset interfaces xe-5/0/6 unit 0 family inet address 192.0.2.1/24 vrrp-group 1 virtual-address 192.0.2.5set interfaces xe-5/0/6 unit 0 family inet address 192.0.2.1/24 vrrp-group 1 priority 50set interfaces xe-5/0/6 unit 0 family inet address 192.0.2.1/24 vrrp-group 1 accept-dataset interfaces xe-5/0/6 unit 0 family inet6 address 2001:db8::5/32 vrrp-inet6-group 3 virtual-inet6-address 2001:db8::4set interfaces xe-5/0/6 unit 0 family inet6 address 2001:db8::5/32 vrrp-inet6-group 3 priority 50set interfaces xe-5/0/6 unit 0 family inet6 address 2001:db8::5/32 vrrp-inet6-group 3 accept-data
Step-by-Step Procedure
To configure VRRP groups on standalone device:
1. Set vrrp version to 3.
[edit protocols vrrp]user@host# set version-3
2. Configure the family inet address and virtual address for the Gigabit Ethernet interface unit 0.
[edit interfaces]user@host# set xe-5/0/5 unit 0 family inet address 192.0.2.1/24 vrrp-group 0 virtual-address 192.0.2.3user@host# set xe-5/0/5 unit 0 family inet6 address 2001:db8::1/32 vrrp-inet6-group 2 virtual-inet6-address 2001:db8::3user@host# set xe-5/0/6 unit 0 family inet address 192.0.2.1/24 vrrp-group 1 virtual-address 192.0.2.5user@host# set xe-5/0/6 unit 0 family inet6 address 2001:db8::5/32 vrrp-inet6-group 3 virtual-inet6-address 2001:db8::4
3. Set the priority of the Gigabit Ethernet interface unit 0 to 50.
[edit interfaces]user@host# set xe-5/0/5 unit 0 family inet address 192.0.2.1/24 vrrp-group 0 priority 50user@host# set xe-5/0/5 unit 0 family inet6 address 2001:db8::1/32 vrrp-inet6-group 2 priority 50user@host# set xe-5/0/6 unit 0 family inet address 192.0.2.1/24 vrrp-group 1 priority 50user@host# set xe-5/0/6 unit 0 family inet6 address 2001:db8::5/32 vrrp-inet6-group 3 priority 50
335

4. Configure the Gigabit Ethernet interface unit 0 to accept all packets sent to the virtual IP address.
[edit interfaces]user@host# set xe-5/0/5 unit 0 family inet address 192.0.2.1/24 vrrp-group 0 accept-datauser@host# set xe-5/0/5 unit 0 family inet6 address 2001:db8::1/32 vrrp-inet6-group 2 accept-datauser@host# set xe-5/0/6 unit 0 family inet address 192.0.2.1/24 vrrp-group 1 accept-datauser@host# set xe-5/0/6 unit 0 family inet6 address 2001:db8::5/32 vrrp-inet6-group 3 accept-data
Results
From configuration mode, confirm your configuration by entering the show interfaces xe-5/0/5 and showinterfaces xe-5/0/6 commands. If the output does not display the intended configuration, repeat theconfiguration instructions in this example to correct it.
[edit]user@host# show interfaces xe-5/0/5unit 0 { family inet { address 192.0.2.1/24 { vrrp-group 0 { virtual-address 192.0.2.3; priority 50; accept-data; } } } family inet6 { address 2001:db8::1/32 { vrrp-inet6-group 2 { virtual-inet6-address 2001:db8::3; priority 50; accept-data; } } } }
[edit]user@host# show interfaces xe-5/0/6
336

unit 0 { family inet { address 192.0.2.1/24 { vrrp-group 1 { virtual-address 192.0.2.5; priority 50; accept-data; } } } family inet6 { address 2001:db8::5/32 { vrrp-inet6-group 3 { virtual-inet6-address 2001:db8::4; priority 50; accept-data; } } } }
If you are done configuring the device, enter commit from configuration mode.
Verification
IN THIS SECTION
Verifying the VRRP on Chassis Cluster Devices | 337
Verifying the VRRP on standalone device | 338
Confirm that the configuration is working properly.
Verifying the VRRP on Chassis Cluster Devices
Purpose
Verify that VRRP on chassis cluster devices has been configured properly.
337

Action
From operational mode, enter the show vrrp brief command to display the status of VRRP on chassiscluster devices.
user@host> show vrrp briefInterface State Group VR state VR Mode Timer Type Address reth0.0 up 0 master Active A 0.149 lcl 192.0.2.3 vip 192.0.2.3 reth0.0 up 2 master Active A 0.155 lcl 2001:db8::2 vip 2001:db8:5eff:fe00:202 vip 2001:db8::2 reth1.0 up 1 master Active A 0.445 lcl 192.0.2.4 vip 192.0.2.4 reth1.0 up 3 master Active A 0.414 lcl 2001:db8::4 vip 2001:db8:5eff:fe00:203 vip 2001:db8::4
Meaning
The sample output shows that the four VRRP groups are active and that the redundant interfaces hasassumed the correct primary roles. The lcl address is the physical address of the interface and the vipaddress is the virtual address shared by redundant interfaces. The Timer value (A 0.149, A 0.155, A0.445, and A 0.414) indicates the remaining time (in seconds) in which the redundant interfaces expectsto receive a VRRP advertisement from the Gigabit Ethernet interfaces. If an advertisement for group 0,1, 2, and 3 does not arrive before the timer expires, Chassis cluster devices asserts itself as the primary.
Verifying the VRRP on standalone device
Purpose
Verify that VRRP has been configured properly on a standalone device.
Action
From operational mode, enter the show vrrp brief command to display the status of VRRP on standalonedevice.
user@host> show vrrp briefInterface State Group VR state VR Mode Timer Type Address
338

xe-5/0/5.0 up 0 backup Active D 3.093 lcl 192.0.2.2.1 vip 192.0.2.2 mas 192.0.2.2.2 xe-5/0/5.0 up 2 backup Active D 3.502 lcl 2001:db8::2:1 vip 2001:db8:200:5eff:fe00:202 vip 2001:db8::2 mas 2001:db8:210:dbff:feff:1000 xe-5/0/6.0 up 1 backup Active D 3.499 lcl 192.0.2.5.1 vip 192.0.2.5 mas 192.0.2.5.2 xe-5/0/6.0 up 3 backup Active D 3.282 lcl 2001:db8::5 vip 2001:db8:200:5eff:fe00:203 vip 2001:db8::4 mas 2001:db8:210:dbff:feff:1001
Meaning
The sample output shows that the four VRRP groups are active and that the Gigabit Ethernet interfaceshas assumed the correct backup roles. The lcl address is the physical address of the interface and the vipaddress is the virtual address shared by Gigabit Ethernet interfaces. The Timer value (D 3.093, D 3.502,D 3.499, and D 3.282) indicates the remaining time (in seconds) in which the Gigabit Ethernet interfacesexpects to receive a VRRP advertisement from the redundant interfaces. If an advertisement for group0, 1, 2, and 3 does not arrive before the timer expires, then the standalone device continues to be abackup device.
SEE ALSO
authentication-type | 595
authentication-key | 593
show vrrp | 973
339
Example: Configuring VRRP for IPv6
IN THIS SECTION
Requirements | 340
Overview | 340
Configuring VRRP | 341
Verification | 348
This example shows how to configure VRRP properties for IPv6.
Requirements
This example uses the following hardware and software components:
• Three routers
• Junos OS Release 11.3 or later
• This example has been recently updated and revalidated on Junos OS Release 21.1R1.
• For details on VRRP support for specific platform and Junos OS release combinations, see FeatureExplorer.
Overview
This example uses a VRRP group, which has a virtual address for IPv6. Devices on the LAN use thisvirtual address as their default gateway. If the primary router fails, the backup router takes over for it.
340

Configuring VRRP
IN THIS SECTION
Configuring Router A | 342
Configuring Router B | 345
Configuring Router C | 348
341

Configuring Router A
CLI Quick Configuration
To quickly configure this example, copy the following commands, paste into a text file, remove any linebreaks, change any details necessary to match your network configuration, and then copy and paste thecommands into the CLI at the [edit] hierarchy level.
set interfaces ge-0/0/1 unit 0 family inet6 address 2001:db8:1:1::1/64 vrrp-inet6-group 1 virtual-inet6-address 2001:db8:1:1::254set interfaces ge-0/0/1 unit 0 family inet6 address 2001:db8:1:1::1/64 vrrp-inet6-group 1 priority 110set interfaces ge-0/0/1 unit 0 family inet6 address 2001:db8:1:1::1/64 vrrp-inet6-group 1 accept-dataset interfaces ge-0/0/1 unit 0 family inet6 address 2001:db8:1:1::1/64 vrrp-inet6-group 1 track interface ge-0/0/2 priority-cost 20set interfaces ge-0/0/2 unit 0 family inet6 address 2001:db8:1:3::1/64set protocols router-advertisement interface ge-0/0/1.0 virtual-router-onlyset protocols router-advertisement interface ge-0/0/1.0 prefix 2001:db8:1:1::/64set routing-options rib inet6.0 static route 0::0/0 next-hop 2001:db8:1:3::2
Step-by-Step Procedure
To configure this example:
1. Configure the interfaces.
[edit]user@routerA# set interfaces ge-0/0/1 unit 0 family inet6 address 2001:db8:1:1::1/64user@routerA# set interfaces ge-0/0/2 unit 0 family inet6 address 2001:db8:1:3::1/64
2. Configure the IPv6 VRRP group identifier and the virtual IP address.
[edit interfaces ge-0/0/1 unit 0 family inet6 address 2001:db8:1:1::1/64]user@routerA# set vrrp-inet6-group 1 virtual-inet6-address 2001:db8:1:1::254
342

3. Configure the priority for RouterA higher than RouterB to become the primary virtual router. RouterBis using the default priority of 100.
[edit interfaces ge-0/0/1 unit 0 family inet6 address 2001:db8:1:1::1/64]user@routerA# set vrrp-inet6-group 1 priority 110
4. Configure track interface to track whether the interface connected to the Internet is up, down, or notpresent to change the priority of the VRRP group.
[edit interfaces ge-0/0/1 unit 0 family inet6 address 2001:db8:1:1::1/64]user@routerA# set vrrp-inet6-group 1 track interface ge-0/0/2 priority-cost 20
5. Configure accept-data to enable the primary router to accept all packets destined for the virtual IPaddress.
[edit interfaces ge-0/0/1 unit 0 family inet6 address 2001:db8:1:1::1/64]user@routerA# set vrrp-inet6-group 1 accept-data
6. Configure a static route for traffic to the Internet.
[edit]user@routerA# set routing-options rib inet6.0 static route 0::0/0 next-hop 2001:db8:1:3::2
7. For VRRP for iPv6, you must configure the interface on which VRRP is configured to send IPv6 routeradvertisements for the VRRP group. When an interface receives an IPv6 router solicitation message,it sends an IPv6 router advertisement to all VRRP groups configured on it.
[edit protocols router-advertisement interface ge-0/0/1.0]user@routerA# set prefix 2001:db8:1:1::/64
8. Configure router advertisements to be sent only for VRRP IPv6 groups configured on the interface ifthe groups are in the primary state.
[edit protocols router-advertisement interface ge-0/0/1.0]user@routerA# set virtual-router-only
343

Results
From configuration mode, confirm your configuration by entering the show interfaces, show protocols router-advertisement and show routing-options commands. If the output does not display the intendedconfiguration, repeat the instructions in this example to correct the configuration.
[edit]user@routerA# show interfacesge-0/0/1 { unit 0 { family inet6 { address 2001:db8:1:1::1/64 { vrrp-inet6-group 1 { virtual-inet6-address 2001:db8:1:1::254; priority 110; accept-data; track { interface ge-0/0/2 { priority-cost 20; } } } } } }}ge-0/0/2 { unit 0 { family inet6 { address 2001:db8:1:3::1/64; } }}
[edit]user@routerA# show protocols router-advertisementinterface ge-0/0/1.0 { virtual-router-only;
344
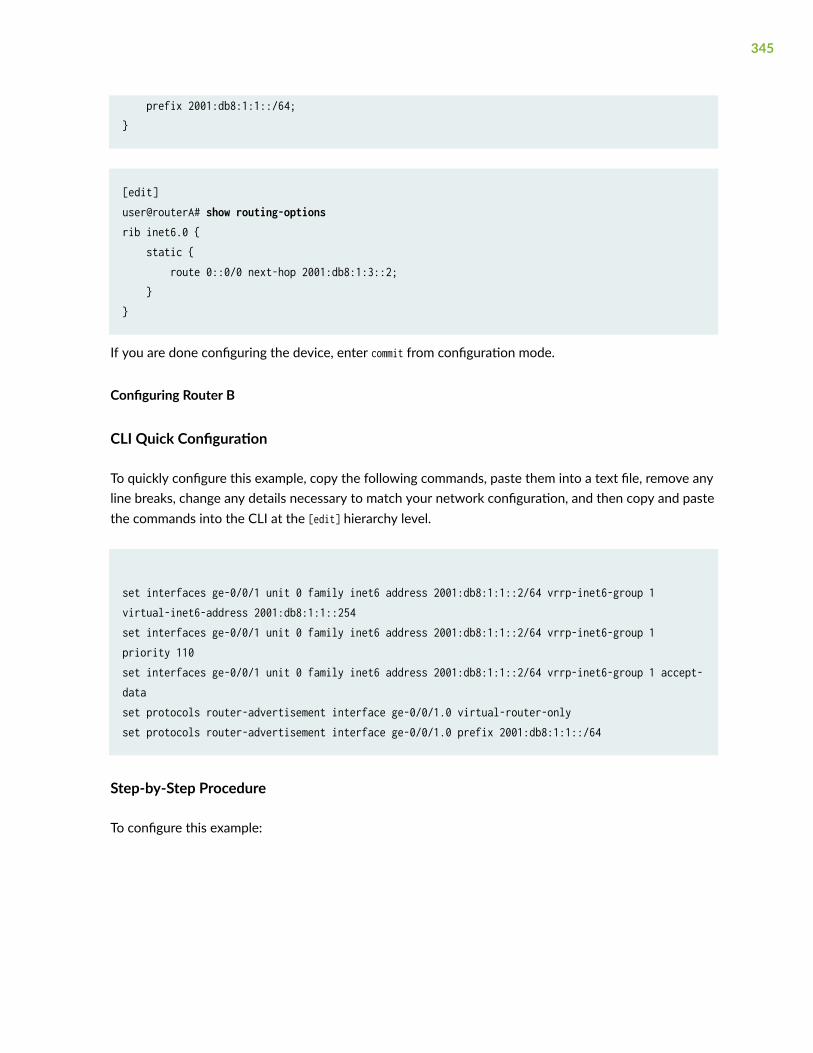
prefix 2001:db8:1:1::/64;}
[edit]user@routerA# show routing-optionsrib inet6.0 { static { route 0::0/0 next-hop 2001:db8:1:3::2; }}
If you are done configuring the device, enter commit from configuration mode.
Configuring Router B
CLI Quick Configuration
To quickly configure this example, copy the following commands, paste them into a text file, remove anyline breaks, change any details necessary to match your network configuration, and then copy and pastethe commands into the CLI at the [edit] hierarchy level.
set interfaces ge-0/0/1 unit 0 family inet6 address 2001:db8:1:1::2/64 vrrp-inet6-group 1 virtual-inet6-address 2001:db8:1:1::254set interfaces ge-0/0/1 unit 0 family inet6 address 2001:db8:1:1::2/64 vrrp-inet6-group 1 priority 110set interfaces ge-0/0/1 unit 0 family inet6 address 2001:db8:1:1::2/64 vrrp-inet6-group 1 accept-dataset protocols router-advertisement interface ge-0/0/1.0 virtual-router-onlyset protocols router-advertisement interface ge-0/0/1.0 prefix 2001:db8:1:1::/64
Step-by-Step Procedure
To configure this example:
345

1. Configure the interfaces.
[edit]user@routerB# set interfaces ge-0/0/1 unit 0 family inet6 address 2001:db8:1:1::2/64user@routerB# set interfaces ge-0/0/2 unit 0 family inet6 address 2001:db8:1:4::1/64
2. Configure the IPv6 VRRP group identifier and the virtual IP address.
[edit interfaces ge-0/0/1 unit 0 family inet6 address 2001:db8:1:1::2/64]user@routerB# set vrrp-inet6-group 1 virtual-inet6-address 2001:db8:1:1::254
3. Configure accept-data to enable the backup router to accept all packets destined for the virtual IPaddress in the event the backup router becomes primary.
[edit interfaces ge-0/0/1 unit 0 family inet6 address 2001:db8:1:1::2/64]user@routerB# set vrrp-inet6-group 1 accept-data
4. Configure a static route for traffic to the Internet.
[edit]user@routerB# set routing-options rib inet6.0 static route 0::0/0 next-hop 2001:db8:1:4::2
5. Configure the interface on which VRRP is configured to send IPv6 router advertisements for theVRRP group. When an interface receives an IPv6 router solicitation message, it sends an IPv6 routeradvertisement to all VRRP groups configured on it.
[edit protocols router-advertisement interface ge-0/0/1.0]user@routerB# set prefix 2001:db8:1:1::/64
6. Configure router advertisements to be sent only for VRRP IPv6 groups configured on the interface ifthe groups are in the primary state.
[edit protocols router-advertisement interface ge-0/0/1.0]user@routerB# set virtual-router-only
346

Results
From configuration mode, confirm your configuration by entering the show interfaces, show protocols router-advertisement and show routing-options commands. If the output does not display the intendedconfiguration, repeat the instructions in this example to correct the configuration.
[edit]user@routerB# show interfacesge-0/0/1 { unit 0 { family inet6 { address 2001:db8:1:1::2/64 { vrrp-inet6-group 1 { virtual-inet6-address 2001:db8:1:1::254; accept-data; } } } }}ge-0/0/2 { unit 0 { family inet6 { address 2001:db8:1:4::1/64; } }}
[edit]user@routerB# show protocols router-advertisementinterface ge-0/0/1.0 { virtual-router-only; prefix 2001:db8:1:1::/64;}
[edit]user@routerB# show routing-optionsrib inet6.0 { static {
347
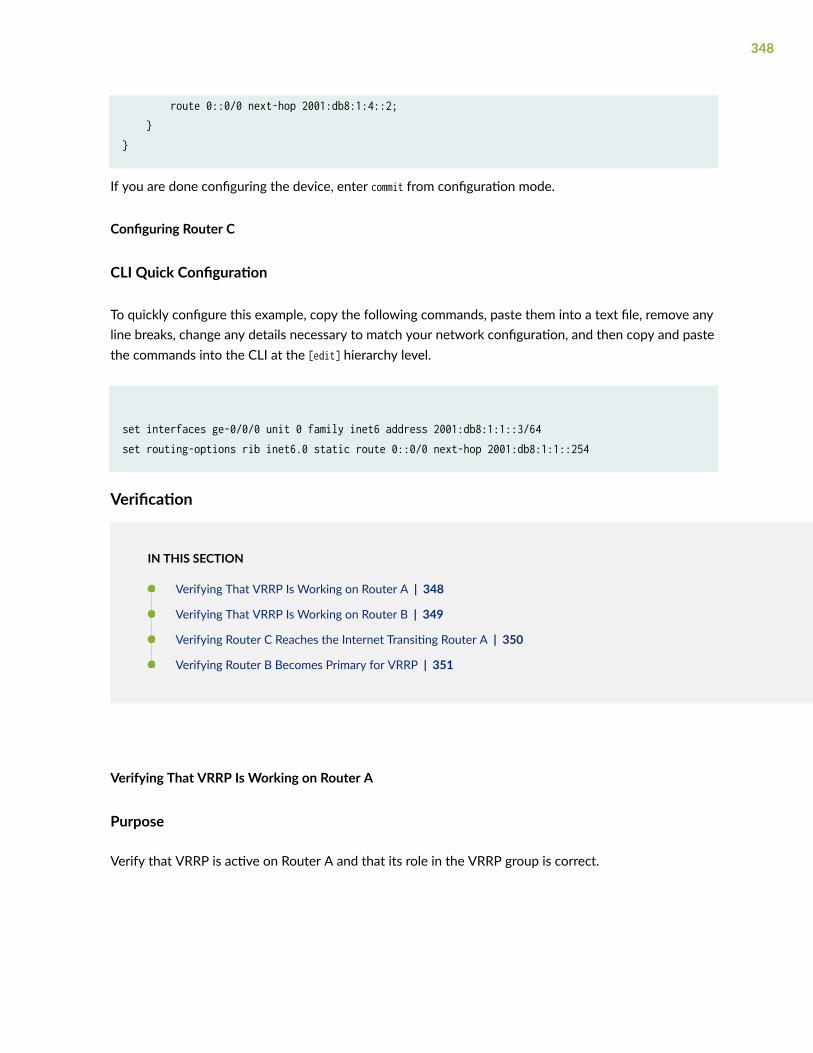
route 0::0/0 next-hop 2001:db8:1:4::2; }}
If you are done configuring the device, enter commit from configuration mode.
Configuring Router C
CLI Quick Configuration
To quickly configure this example, copy the following commands, paste them into a text file, remove anyline breaks, change any details necessary to match your network configuration, and then copy and pastethe commands into the CLI at the [edit] hierarchy level.
set interfaces ge-0/0/0 unit 0 family inet6 address 2001:db8:1:1::3/64set routing-options rib inet6.0 static route 0::0/0 next-hop 2001:db8:1:1::254
Verification
IN THIS SECTION
Verifying That VRRP Is Working on Router A | 348
Verifying That VRRP Is Working on Router B | 349
Verifying Router C Reaches the Internet Transiting Router A | 350
Verifying Router B Becomes Primary for VRRP | 351
Verifying That VRRP Is Working on Router A
Purpose
Verify that VRRP is active on Router A and that its role in the VRRP group is correct.
348

Action
Use the following commands to verify that VRRP is active on Router A, that the router is primary forgroup 1 and the interface connected to the Internet is being tracked.
user@routerA> show vrrpInterface State Group VR state VR Mode Timer Type Addressge-0/0/1.0 up 1 master Active A 0.690 lcl 2001:db8:1:1::1 vip fe80::200:5eff:fe00:201 vip 2001:db8:1:1::254
user@routerA> show vrrp trackTrack Int State Speed VRRP Int Group VR State Current prioge-0/0/2.0 up 1g ge-0/0/1.0 1 master 110
Meaning
The show vrrp command displays fundamental information about the VRRP configuration. This outputshows that the VRRP group is active and that this router has assumed the primary role. The lcl addressis the physical address of the interface and the vip address is the virtual address shared by both routers.The Timer value (A 0.690) indicates the remaining time (in seconds) in which this router expects to receivea VRRP advertisement from the other router.
Verifying That VRRP Is Working on Router B
Purpose
Verify that VRRP is active on Router B and that its role in the VRRP group is correct.
Action
Use the following command to verify that VRRP is active on Router B and that the router is backup forgroup 1.
user@routerB> show vrrpInterface State Group VR state VR Mode Timer Type Addressge-0/0/1.0 up 1 backup Active D 2.947 lcl 2001:db8:1:1::2 vip fe80::200:5eff:fe00:201
349

vip 2001:db8:1:1::254 mas fe80::5668:a0ff:fe99:2d7d
Meaning
The show vrrp command displays fundamental information about the VRRP configuration. This outputshows that the VRRP group is active and that this router has assumed the backup role. The lcl address isthe physical address of the interface and the vip address is the virtual address shared by both routers.The Timer value (D 2.947) indicates the remaining time (in seconds) in which this router expects to receivea VRRP advertisement from the other router.
Verifying Router C Reaches the Internet Transiting Router A
Purpose
Verify connectivity to the Internet from Router C.
Action
Use the following commands to verify that Router C can reach the Internet.
user@routerC> ping 2001:db8:16:255::1 count 2PING6(56=40+8+8 bytes) 2001:db8:1:1::3 --> 2001:db8:16:255::116 bytes from 2001:db8:16:255::1, icmp_seq=0 hlim=63 time=12.810 ms16 bytes from 2001:db8:16:255::1, icmp_seq=1 hlim=63 time=30.139 ms
--- 2001:db8:16:255::1 ping6 statistics ---2 packets transmitted, 2 packets received, 0% packet lossround-trip min/avg/max/std-dev = 12.810/21.474/30.139/8.664 ms
user@routerC> traceroute 2001:db8:16:255::1traceroute6 to 2001:db8:16:255::1 (2001:db8:16:255::1) from 2001:db8:1:1::3, 64 hops max, 12 byte packets 1 2001:db8:1:1::1 (2001:db8:1:1::1) 9.891 ms 32.353 ms 7.859 ms 2 2001:db8:16:255::1 (2001:db8:16:255::1) 257.483 ms 19.877 ms 7.451 ms
350

Meaning
The ping command shows reachabilty to the Internet and the traceroute command shows that Router A isbeing transited.
Verifying Router B Becomes Primary for VRRP
Purpose
Verify that Router B becomes primary for VRRP when the interface between Router A and the Internetgoes down.
Action
Use the following commands to verify that Router B is primary and that Router C can reach the Internettransiting Router B.
user@routerA> show vrrp track detailTracked interface: ge-0/0/2.0 State: down, Speed: 1g Incurred priority cost: 20 Tracking VRRP interface: ge-0/0/1.0, Group: 1 VR State: backup Current priority: 90, Configured priority: 110 Priority hold-time: disabled
user@routerB> show vrrpInterface State Group VR state VR Mode Timer Type Addressge-0/0/1.0 up 1 master Active A 0.119 lcl 2001:db8:1:1::2 vip fe80::200:5eff:fe00:201 vip 2001:db8:1:1::254
user@routerC> traceroute 2001:db8:16:255::1traceroute6 to 2001:db8:16:255::1 (2001:db8:16:255::1) from 2001:db8:1:1::3, 64 hops max, 12 byte packets 1 2001:db8:1:1::2 (2001:db8:1:1::2) 52.945 ms 344.383 ms 29.540 ms 2 2001:db8:16:255::1 (2001:db8:16:255::1) 46.168 ms 24.744 ms 23.867 ms
351

Meaning
The show vrrp track detail command shows the tracked interface is down on Router A, that the priorityhas dropped to 90, and that Router A is now the backup. The show vrrp command shows that Router B isnow the primary for VRRP and the traceroute command shows that Router B is now being transited.
SEE ALSO
Understanding VRRP
Configuring VRRP
Configuring VRRP Route Tracking
RELATED DOCUMENTATION
Chassis Cluster Redundant Ethernet Interfaces | 101
Configuring Chassis Clustering on SRX Series Devices | 121
NTP Time Synchronization on Chassis Cluster
IN THIS SECTION
NTP Time Synchronization on SRX Series Devices | 353
Example: Simplifying Network Management by Synchronizing the Primary and Backup Nodes withNTP | 353
Network Time Protocol (NTP) is used to synchronize the time between the Packet Forwarding Engineand the Routing Engine in a standalone device and between two devices in a chassis cluster. For moreinformation, see the following topics:
352

NTP Time Synchronization on SRX Series Devices
In both standalone and chassis cluster modes, the primary Routing Engine runs the NTP process to getthe time from the external NTP server. Although the secondary Routing Engine runs the NTP process inan attempt to get the time from the external NTP server, this attempt fails because of network issues.For this reason, the secondary Routing Engine uses NTP to get the time from the primary RoutingEngine.
Use NTP to:
• Send the time from the primary Routing Engine to the secondary Routing Engine through the chassiscluster control link.
• Get the time from an external NTP server to the primary or a standalone Routing Engine.
• Get the time from the Routing Engine NTP process to the Packet Forwarding Engine.
Starting with Junos OS Release 15.1X49-D70 and Junos OS Release 17.3R1, configuring the NTP timeadjustment threshold is supported on SRX300, SRX320, SRX340, SRX345, SRX1500, SRX4100,SRX4200, SRX5400, SRX5600, and SRX5800 devices and vSRX instances. This feature allows you toconfigure and enforce the NTP adjustment threshold for the NTP service and helps in improve thesecurity and flexibility of the NTP service protocol.
SEE ALSO
NTP Overview
ntp threshold | 669
show system ntp threshold | 949
set date ntp | 947
Example: Simplifying Network Management by Synchronizing thePrimary and Backup Nodes with NTP
IN THIS SECTION
Requirements | 354
Overview | 354
353

Configuration | 355
Verification | 357
This example shows how to simplify management by synchronizing the time between two SRX Seriesdevices operating in a chassis cluster. Using a Network Time Protocol (NTP) server, the primary node cansynchronize time with the secondary node. NTP is used to synchronize the time between the PacketForwarding Engine and the Routing Engine in a standalone device and between two devices in a chassiscluster. You need to synchronize the system clocks on both nodes of the SRX Series devices in a chassiscluster in order to manage the following items:
• Real-time objects (RTO)
• Licenses
• Software updates
• Node failovers
• Analyzing system logs (syslogs)
Requirements
This example uses the following hardware and software components:
• SRX Series devices operating in a chassis cluster
• Junos OS Release 12.1X47-D10 or later
Before you begin:
• Understand the basics of the Network Time Protocol. See NTP Overview.
Overview
IN THIS SECTION
Topology | 355
When SRX Series devices are operating in chassis cluster mode, the secondary node cannot access theexternal NTP server through the revenue port. Junos OS Release 12.1X47 or later supports
354

synchronization of secondary node time with the primary node through the control link by configuringthe NTP server on the primary node.
Topology
Figure 39 on page 355 shows the time synchronization from the peer node using the control link.
Figure 39: Synchronizing Time From Peer Node Through Control Link
In the primary node, the NTP server is reachable. The NTP process on the primary node can synchronizethe time from the NTP server, and the secondary node can synchronize the time with the primary nodefrom the control link.
Configuration
IN THIS SECTION
CLI Quick Configuration | 355
Synchronizing Time from the NTP server | 356
Results | 356
CLI Quick Configuration
To quickly configure this example, and synchronize the time from the NTP server, copy the followingcommands, paste them into a text file, remove any line breaks, change any details necessary to match
355

your network configuration, copy and paste the commands into the CLI at the [edit] hierarchy level, andthen enter commit from configuration mode.
set system ntp server 1.1.1.121
Synchronizing Time from the NTP server
Step-by-Step Procedure
In this example, you configure the primary node to get its time from an NTP server at IP address1.1.1.121. To synchronize the time from the NTP server:
1. Configure the NTP server.
{primary:node0}[edit][edit system]user@host# set ntp server 1.1.1.121
2. Commit the configuration.
user@host#commit
Results
From configuration mode, confirm your configuration by entering the show system ntp command. If theoutput does not display the intended configuration, repeat the configuration instructions in this exampleto correct it.
{primary:node0}[edit]user@host# show system ntpserver 1.1.1.121
If you are done configuring the device, enter commit from configuration mode.
356

Verification
IN THIS SECTION
Verifying the NTP Configuration on the Primary Node | 357
Verifying the NTP Configuration on the Secondary Node | 359
Confirm that the configuration is working properly.
Verifying the NTP Configuration on the Primary Node
Purpose
Verify that the configuration is working properly.
Action
From operational mode, enter the show ntp associations command:
user@host> show ntp associations remote refid st t when poll reach delay offset jitter==============================================================================*1-1-1-121-dynami 10.208.0.50 4 - 63 64 65 4.909 -12.067 2.014
From operational mode, enter the show ntp status command:
user@host> show ntp statusstatus=0664 leap_none, sync_ntp, 6 events, event_peer/strat_chg,version="ntpd 4.2.0-a Fri Mar 21 00:50:30 PDT 2014 (1)",processor="i386", system="JUNOS12.1I20140320_srx_12q1_x47.1-637245",leap=00, stratum=5, precision=-20, rootdelay=209.819,rootdispersion=513.087, peer=14596, refid=1.1.1.121,reftime=d6dbb2f9.b3f41ff7 Tue, Mar 25 2014 15:47:05.702, poll=6,clock=d6dbb47a.72918b20 Tue, Mar 25 2014 15:53:30.447, state=4,offset=-6.066, frequency=-55.135, jitter=4.343, stability=0.042
357

Meaning
The output on the primary and secondary node shows the NTP association as follows:
• remote—Address or name of the remote NTP peer.
• refid—Reference identifier of the remote peer. If the reference identifier is not known, this fieldshows a value of 0.0.0.0.
• st—Stratum of the remote peer.
• t—Type of peer: b (broadcast), l (local), m (multicast), or u (unicast).
• when—When the last packet from the peer was received.
• poll—Polling interval, in seconds.
• reach—Reachability register, in octal.
• delay—Current estimated delay of the peer, in milliseconds.
• offset—Current estimated offset of the peer, in milliseconds.
• jitter—Magnitude of jitter, in milliseconds.
The output on the primary and secondary node shows the NTP status as follows:
• status—System status word, a code representing the status items listed.
• x events—Number of events that have occurred since the last code change. An event is often thereceipt of an NTP polling message.
• version—A detailed description of the version of NTP being used.
• processor—Current hardware platform and version of the processor.
• system—Detailed description of the name and version of the operating system in use.
• leap—Number of leap seconds in use.
• stratum—Stratum of the peer server. Anything greater than 1 is a secondary reference source, and thenumber roughly represents the number of hops away from the stratum 1 server. Stratum 1 is aprimary reference, such as an atomic clock.
• precision—Precision of the peer clock, how precisely the frequency and time can be maintained withthis particular timekeeping system.
• rootdelay—Total roundtrip delay to the primary reference source, in seconds.
358

• rootdispersion—Maximum error relative to the primary reference source, in seconds.
• peer—Identification number of the peer in use.
• refid—Reference identifier of the remote peer. If the reference identifier is not known, this fieldshows a value of 0.0.0.0.
• reftime—Local time, in timestamp format, when the local clock was last updated. If the local clock hasnever been synchronized, the value is zero.
• poll—NTP broadcast message polling interval, in seconds.
• clock—Current time on the local router clock.
• state—Current mode of NTP operation, where 1 is symmetric active, 2 is symmetric passive, 3 isclient, 4 is server, and 5 is broadcast.
• offset—Current estimated offset of the peer, in milliseconds. Indicates the time difference betweenthe reference clock and the local clock.
• frequency—Frequency of the clock.
• jitter—Magnitude of jitter, in milliseconds.
• stability—Measurement of how well this clock can maintain a constant frequency.
Verifying the NTP Configuration on the Secondary Node
Purpose
Verify that the configuration is working properly.
Action
From operational mode, enter the show ntp associations command:
user@host> show ntp associationsremote refid st t when poll reach delay offset jitter============================================================================== 1-1-1-121-dynami .INIT. 16 - - 1024 0 0.000 0.000 4000.00
*129.96.0.1 1.1.1.121 5 u 32 64 377 0.417 0.760 1.204
359

From operational mode, enter the show ntp status command:
user@host> show ntp statusstatus=0664 leap_none, sync_ntp, 6 events, event_peer/strat_chg,version="ntpd 4.2.0-a Thu Mar 13 01:53:03 PDT 2014 (1)",processor="i386", system="JUNOS12.1I20140312_srx_12q1_x47.2-635305",leap=00, stratum=12, precision=-20, rootdelay=2.408,rootdispersion=892.758, peer=51948, refid=1.1.1.121,reftime=d6d646bb.853d2f42 Fri, Mar 21 2014 13:03:55.520, poll=6,clock=d6d647bc.e8f28b2f Fri, Mar 21 2014 13:08:12.909, state=4,offset=-1.126, frequency=-62.564, jitter=0.617, stability=0.002
Release History Table
Release Description
15.1X49-D70 Starting with Junos OS Release 15.1X49-D70 and Junos OS Release 17.3R1, configuring the NTPtime adjustment threshold is supported on SRX300, SRX320, SRX340, SRX345, SRX1500,SRX4100, SRX4200, SRX5400, SRX5600, and SRX5800 devices and vSRX instances. This featureallows you to configure and enforce the NTP adjustment threshold for the NTP service and helps inimprove the security and flexibility of the NTP service protocol.
RELATED DOCUMENTATION
Time Management Routing Guide for Administration Devices
Verifying Chassis Cluster Configuration Synchronization Status | 144
Active/Passive Chassis Cluster Deployments
IN THIS SECTION
Understanding Active/Passive Chassis Cluster Deployment | 361
Example: Configuring an Active/Passive Chassis Cluster on SRX5800 Devices | 362
Example: Configuring an Active/Passive Chassis Cluster Pair (SRX1500) | 381
Example: Configuring an Active/Passive Chassis Cluster Pair (J-Web) | 398
360

Understanding Active/Passive Chassis Cluster Deployment with an IPsec Tunnel | 401
Example: Configuring an Active/Passive Chassis Cluster Pair with an IPsec Tunnel | 402
Example: Configuring an Active/Passive Chassis Cluster Pair with an IPsec Tunnel (J-Web) | 425
Understanding Active/Passive Chassis Cluster Deployment
In this case, a single device in the cluster is used to route all traffic while the other device is used only inthe event of a failure (see Figure 40 on page 361). When a failure occurs, the backup device becomesprimary and controls all forwarding.
Figure 40: Active/Passive Chassis Cluster Scenario
An active/passive chassis cluster can be achieved by using redundant Ethernet interfaces (reths) that areall assigned to the same redundancy group. If any of the interfaces in an active group in a node fails, thegroup is declared inactive and all the interfaces in the group fail over to the other node.
This configuration minimizes the traffic over the fabric link because only one node in the clusterforwards traffic at any given time.
361

SEE ALSO
Chassis Cluster Overview | 2
Example: Configuring an Active/Passive Chassis Cluster on SRX5800Devices
IN THIS SECTION
Requirements | 362
Overview | 362
Configuration | 366
Verification | 373
This example shows how to set up basic active/passive chassis clustering on an SRX5800 devices.
Requirements
Before you begin:
• You need two SRX5800 Services Gateways with identical hardware configurations, and optionallyone MX240 edge router, and one EX8208 Ethernet Switch for sending end to end data traffic.
• Physically connect the two devices (back-to-back for the fabric and control ports) and ensure thatthey are the same models.
• Before the cluster is formed, you must configure control ports for each device, as well as assign acluster ID and node ID to each device, and then reboot. When the system boots, both the nodescome up as a cluster.
Control port configuration is required for SRX5400, SRX5600, and SRX5800 devices.
Now the devices are a pair. From this point forward, configuration of the cluster is synchronizedbetween the node members, and the two separate devices function as one device.
Overview
This example shows how to set up basic active/passive chassis clustering on an SRX Series device. Thebasic active/passive example is the most common type of chassis cluster.
362

The basic active/passive chassis cluster consists of two devices:
• One device actively provides routing, firewall, NAT, VPN, and security services, along withmaintaining control of the chassis cluster.
• The other device passively maintains its state for cluster failover capabilities in case the active devicebecomes inactive.
This active/passive mode example for the SRX5800 Services Gateway does not describe in detailmiscellaneous configurations such as how to configure NAT, security policies, or VPNs. They areessentially the same as they would be for standalone configurations. However, if you are performingproxy ARP in chassis cluster configurations, you must apply the proxy ARP configurations to the rethinterfaces rather than the member interfaces because the RETH interfaces hold the logicalconfigurations. See https://www.juniper.net/documentation/us/en/software/junos/nat/topics/topic-map/security-nat-configuration-overview.html#id-configuring-proxy-arp-for-nat-cli-procedure. You canalso configure separate logical interface configurations using VLANs and trunked interfaces in theSRX5800 Services Gateway. These configurations are similar to the standalone implementations usingVLANs and trunked interfaces.
363

Figure 41 on page 365 shows the topology used in this example.
364

Figure 41: Basic Active/Passive Chassis Clustering on an SRX Series Device Topology Example
365

Configuration
IN THIS SECTION
Configuring the Control Ports and Enabling Cluster Mode | 366
Configuring the Control Ports and Enabling Cluster Mode
CLI Quick Configuration
To quickly configure this example, copy the following commands, paste them into a text file, remove anyline breaks, change any details necessary to match your network configuration, copy and paste thecommands into the CLI at the [edit] hierarchy level, and then enter commit from configuration mode.
On {primary:node0}
[edit]set groups re0 system host-name hostAset groups re0 system backup-router 10.204.191.254set groups re0 system backup-router destination 10.0.0.0/8set groups re0 system backup-router destination 172.0.0.0/8 set groups re0 system backup-router destination 192.0.0.0/8set groups re0 interfaces fxp0 unit 0 family inet address 10.204.149.140/18set apply-groups re0set groups re0 system host-name hostBset groups re0 system backup-router 10.204.191.254set groups re0 system backup-router destination 10.0.0.0/8set groups re0 system backup-router destination 172.0.0.0/8set groups re0 system backup-router destination 192.0.0.0/8set groups re0 interfaces fxp0 unit 0 family inet address 10.204.149.142/18set apply-groups re0set groups node0 system host-name hostAset groups node0 system backup-router 10.204.191.254set groups node0 system backup-router destination 10.0.0.0/8set groups node0 system backup-router destination 172.0.0.0/8set groups node0 system backup-router destination 192.0.0.0/8set groups node0 interfaces fxp0 unit 0 family inet address 10.204.149.140/18set groups node1 system host-name hostBset groups node1 system backup-router 10.204.191.254
366

set groups node1 system backup-router destination 10.0.0.0/8set groups node1 system backup-router destination 172.0.0.0/8set groups node1 system backup-router destination 192.0.0.0/8set groups node1 interfaces fxp0 unit 0 family inet address 10.204.149.142/18set chassis cluster control-ports fpc 1 port 0set chassis cluster control-ports fpc 13 port 0set chassis cluster cluster-id 1 node 0 rebootset chassis cluster cluster-id 1 node 1 rebootdelete apply-groups re0set apply-groups “${node}”set chassis cluster reth-count 2set chassis cluster redundancy-group 0 node 0 priority 254set chassis cluster redundancy-group 0 node 1 priority 1set chassis cluster redundancy-group 1 node 0 priority 254set chassis cluster redundancy-group 1 node 1 priority 1set interfaces fab0 fabric-options member-interfaces ge-3/2/8set interfaces fab1 fabric-options member-interfaces ge-15/2/8
(Optional) To quickly configure an EX8208 Core Switch, copy the following commands, paste them into atext file, remove any line breaks, change any details necessary to match your network configuration,copy and paste the commands into the CLI at the [edit] hierarchy level, and then enter commit fromconfiguration mode.
On {primary:node0}
[edit]set interfaces xe-1/0/0 unit 0 family ethernet-switching port-mode access vlan members SRX5800set interfaces xe-2/0/0 unit 0 family ethernet-switching port-mode access vlan members SRX5800set interfaces vlan unit 50 family inet address 2.2.2.254/24set vlans SRX5800 vlan-id 50set vlans SRX5800 l3-interface vlan.50set routing-options static route 0.0.0.0/0 next-hop 2.2.2.1/24
(Optional)To quickly configure an MX240 edge router, copy the following commands, paste them into atext file, remove any line breaks, change any details necessary to match your network configuration,copy and paste the commands into the CLI at the [edit] hierarchy level, and then enter commit fromconfiguration mode.
On {primary:node0}
[edit]set interfaces xe-1/0/0 encapsulation ethernet-bridge unit 0 family ethernet-switching
367

set interfaces xe-2/0/0 encapsulation ethernet-bridge unit 0 family ethernet-switchingset interfaces irb unit 0 family inet address 1.1.1.254/24set routing-options static route 2.0.0.0/8 next-hop 1.1.1.1set routing-options static route 0.0.0.0/0 next-hop (upstream router)set vlans SRX5800 vlan-id X (could be set to “none”)set vlans SRX5800 domain-type bridge routing-interface irb.0set vlans SRX5800 domain-type bridge interface xe-1/0/0set vlans SRX5800 domain-type bridge interface xe-2/0/0
Step-by-Step Procedure
The following example requires you to navigate various levels in the configuration hierarchy.
To configure a chassis cluster on an SRX Series device:
In cluster mode, the configuration is synchronized over the control link between the nodes when youexecute a commit command. All commands are applied to both nodes regardless of from which device thecommand is configured.
1. Configure both the standalone devices with backup router destination configuration to provide themanagement access on the backup node after the device is up in cluster mode. The access to theprimary node is enabled through the routing on the primary node.
user@hostA# set groups re0 system host-name hostAuser@hostA# set groups re0 system backup-router 10.204.191.254user@hostA# set groups re0 system backup-router destination 10.0.0.0/8user@hostA# set groups re0 system backup-router destination 172.0.0.0/8user@hostA# set groups re0 system backup-router destination 192.0.0.0/8user@hostA# set groups re0 interfaces fxp0 unit 0 family inet address 10.204.149.140/18user@hostA# set apply-groups re0
user@hostB# set groups re0 system host-name hostBuser@hostB# set groups re0 system backup-router 10.204.191.254user@hostB# set groups re0 system backup-router destination 10.0.0.0/8user@hostB# set groups re0 system backup-router destination 172.0.0.0/8user@hostB# set groups re0 system backup-router destination 192.0.0.0/8user@hostB# set groups re0 interfaces fxp0 unit 0 family inet address 10.204.149.142/18user@hostB# set apply-groups re0
2. Because the SRX5000 series Services Gateway chassis cluster configuration is contained within asingle common configuration, to assign some elements of the configuration to a specific member
368

only, you must use the Junos OS node-specific configuration method called groups. The set apply-groups ${node} command uses the node variable to define how the groups are applied to the nodes;each node recognizes its number and accepts the configuration accordingly. You must alsoconfigure out-of-band management on the fxp0 interface of the SRX5000 series Services Gatewayusing separate IP addresses for the individual control planes of the cluster.
Configuring the backup router destination address as x.x.x.0/0 is not allowed.
user@hostA# set groups node0 system host-name hostAuser@hostA# set groups node0 system backup-router 10.204.191.254user@hostA# set groups node0 system backup-router destination 10.0.0.0/8user@hostA# set groups node0 system backup-router destination 172.0.0.0/8user@hostA# set groups node0 system backup-router destination 192.0.0.0/8user@hostA# set groups node0 interfaces fxp0 unit 0 family inet address 10.204.149.140/18
user@hostB# set groups node1 system host-name hostBuser@hostB# set groups node1 system backup-router 10.204.191.254user@hostB# set groups node1 system backup-router destination 10.0.0.0/8user@hostB# set groups node1 system backup-router destination 172.0.0.0/8user@hostB# set groups node1 system backup-router destination 192.0.0.0/8user@hostB# set groups node1 interfaces fxp0 unit 0 family inet address 10.204.149.142/18
The above groups node0 and node1 configuration is committed, but not applied. Once the device isup in cluster, these commands are applied using set apply-groups “${node}”.
3. Configure the control port for each device, and commit the configuration.
Ensure to have the physical control link connection between the SPC cards on both the nodes asper the configuration.
The control ports are derived based on the SPC location in the chassis and offset value is based onthe platform. In the below example the SPC is present in revenue slot 1 and because offset ofSRX5800 is 12, the control ports are 1, 13. You can view the Offset value for particular platformusing “jwhoami -c” command in shell mode.You must enter the following commands on both devices.For example:
• On node 0:
user@hostA# set chassis cluster control-ports fpc 1 port 0user@hostA# set chassis cluster control-ports fpc 13 port 0user@hostA# commit
369

• On node 1:
user@hostB# set chassis cluster control-ports fpc 1 port 0user@hostB# set chassis cluster control-ports fpc 13 port 0user@hostB# commit
4. Set the two devices to cluster mode. A reboot is required to enter into cluster mode after thecluster ID and node ID are set. You can cause the system to boot automatically by including thereboot parameter in the CLI command line. You must enter the operational mode commands on bothdevices. For example:
• On node 0:
user@hostA> set chassis cluster cluster-id 1 node 0 reboot
• On node 1:
user@hostB> set chassis cluster cluster-id 1 node 1 reboot
The cluster ID must be the same on both devices in a cluster, but the node ID must be differentbecause one device is node 0 and the other device is node 1. The range for the cluster ID is 1through 255. Setting a cluster ID to 0 is equivalent to disabling a cluster. But it is recommended touse set chassis cluster disable to break the nodes from cluster.
5. Use the following commands to configure the node 0, which is primary. The node 1 is unreachabletill the node configuration is committed. The node 0 will automatically sync the configurationthrough the control port to node 1 and it is not required to explicitly configure node 1.
user@hostA# delete apply-groups re0user@hostA# set apply-groups “${node}”
6. Configure redundancy groups for chassis clustering. Each node has interfaces in a redundancygroup where interfaces are active in active redundancy groups (multiple active interfaces can existin one redundancy group). Redundancy group 0 controls the control plane and redundancy group1+ controls the data plane and includes the data plane ports. For this active/passive mode example,only one chassis cluster member is active at a time so you need to define redundancy groups 0 and1 only. Besides redundancy groups, you must also define:
• Redundant Ethernet groups—Configure how many redundant Ethernet interfaces (member links)will be active on the device so that the system can allocate the appropriate resources for it.
370

• Priority for control plane and data plane—Define which device has priority (for chassis cluster,high priority is preferred) for the control plane, and which device is preferred to be active for thedata plane.
• In active/passive or active/active mode, the control plane (redundancy group 0) can be activeon a chassis different from the data plane (redundancy group 1+ and groups) chassis.However, for this example we recommend having both the control and data plane active onthe same chassis member. When traffic passes through the fabric link to go to anothermember node, latency is introduced (z line mode traffic).
• On SRX Series devices (SRX5000 line), the IPsec VPN is not supported in active/activechassis cluster configuration (that is, when there are multiple RG1+ redundancy groups).
user@hostA# set chassis cluster reth-count 2user@hostA# set chassis cluster redundancy-group 1 node 0 priority 254user@hostA# set chassis cluster redundancy-group 1 node 1 priority 1user@hostA# set chassis cluster redundancy-group 0 node 0 priority 254user@hostA# set chassis cluster redundancy-group 0 node 1 priority 1
7. Configure the fabric (data) ports of the cluster that are used to pass RTOs in active/passive mode.For this example, use one of the revenue ports. Define two fabric interfaces, one on each chassis, toconnect together.
Configure the data interfaces on the platform so that in the event of a data plane failover, the otherchassis cluster member can take over the connection seamlessly. Seamless transition to a newactive node will occur with data plane failover. In case of control plane failover, all the daemons arerestarted on the new node thus enabling a graceful restart to avoid losing neighborship with peers(ospf, bgp). This promotes a seamless transition to the new node without any packet loss.
You must define the following items:
• Define the membership information of the member interfaces to the reth interface.
• Define which redundancy group the reth interface is a member of. For this active/passiveexample, it is always 1.
• Define reth interface information such as the IP address of the interface.
{primary:node0}[edit]user@hostA# set interfaces fab0 fabric-options member-interfaces ge-3/2/8user@hostA# set interfaces fab1 fabric-options member-interfaces ge-15/2/8
371

8. (Optional) Configure the chassis cluster behavior in case of a failure. For the SRX5800 ServicesGateway, the failover threshold is set at 255. You can alter the weights to determine the impact onthe chassis failover. You must also configure control link recovery. The recovery automaticallycauses the secondary node to reboot should the control link fail, and then come back online. Enterthese commands on node 0.
{primary:node0}[edit]user@hostA# set chassis cluster redundancy-group 1 interface-monitor xe-6/0/0 weight 255user@hostA# set chassis cluster redundancy-group 1 interface-monitor xe-6/1/0 weight 255user@hostA# set chassis cluster redundancy-group 1 interface-monitor xe-18/0/0 weight 255user@hostA# set chassis cluster redundancy-group 1 interface-monitor xe-18/1/0 weight 255user@hostA# set chassis cluster control-link-recovery
This step completes the chassis cluster configuration part of the active/passive mode example forthe SRX5800 Services Gateway. The rest of this procedure describes how to configure the zone,virtual router, routing, EX8208 Core Switch, and MX240 Edge Router to complete the deploymentscenario.
9. (Optional) Configure and connect the reth interfaces to the appropriate zones and virtual routers.For this example, leave the reth0 and reth1 interfaces in the default virtual router inet.0, whichdoes not require any additional configuration.
{primary:node0}[edit]user@hostA# set security zones security-zone untrust interfaces reth0.0user@hostA# set security zones security-zone trust interfaces reth1.0
10. (Optional) For this active/passive mode example, because of the simple network architecture, usestatic routes to define how to route to the other network devices.
{primary:node0}[edit]user@hostA# set routing-options static route 0.0.0.0/0 next-hop 1.1.1.254user@hostA# set routing-options static route 2.0.0.0/8 next-hop 2.2.2.254
11. (Optional) For the EX8208 Ethernet Switch, the following commands provide only an outline of theapplicable configuration as it pertains to this active/passive mode example for the SRX5800Services Gateway; most notably the VLANs, routing, and interface configuration.
{primary:node0}[edit]user@hostA# set interfaces xe-1/0/0 unit 0 family ethernet-switching port-mode access vlan members SRX5800
372
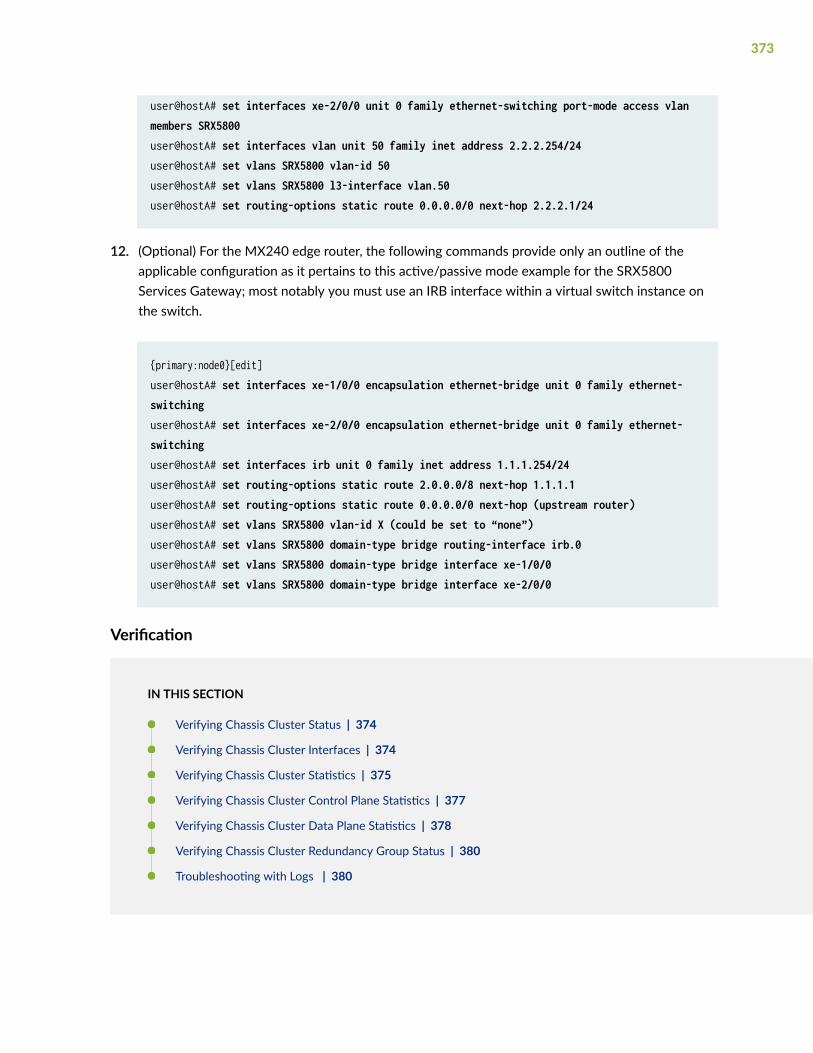
user@hostA# set interfaces xe-2/0/0 unit 0 family ethernet-switching port-mode access vlan members SRX5800user@hostA# set interfaces vlan unit 50 family inet address 2.2.2.254/24user@hostA# set vlans SRX5800 vlan-id 50user@hostA# set vlans SRX5800 l3-interface vlan.50user@hostA# set routing-options static route 0.0.0.0/0 next-hop 2.2.2.1/24
12. (Optional) For the MX240 edge router, the following commands provide only an outline of theapplicable configuration as it pertains to this active/passive mode example for the SRX5800Services Gateway; most notably you must use an IRB interface within a virtual switch instance onthe switch.
{primary:node0}[edit]user@hostA# set interfaces xe-1/0/0 encapsulation ethernet-bridge unit 0 family ethernet-switchinguser@hostA# set interfaces xe-2/0/0 encapsulation ethernet-bridge unit 0 family ethernet-switchinguser@hostA# set interfaces irb unit 0 family inet address 1.1.1.254/24user@hostA# set routing-options static route 2.0.0.0/8 next-hop 1.1.1.1user@hostA# set routing-options static route 0.0.0.0/0 next-hop (upstream router)user@hostA# set vlans SRX5800 vlan-id X (could be set to “none”)user@hostA# set vlans SRX5800 domain-type bridge routing-interface irb.0user@hostA# set vlans SRX5800 domain-type bridge interface xe-1/0/0user@hostA# set vlans SRX5800 domain-type bridge interface xe-2/0/0
Verification
IN THIS SECTION
Verifying Chassis Cluster Status | 374
Verifying Chassis Cluster Interfaces | 374
Verifying Chassis Cluster Statistics | 375
Verifying Chassis Cluster Control Plane Statistics | 377
Verifying Chassis Cluster Data Plane Statistics | 378
Verifying Chassis Cluster Redundancy Group Status | 380
Troubleshooting with Logs | 380
373

Confirm that the configuration is working properly.
Verifying Chassis Cluster Status
Purpose
Verify the chassis cluster status, failover status, and redundancy group information.
Action
From operational mode, enter the show chassis cluster status command.
{primary:node0}show chassis cluster statusMonitor Failure codes: CS Cold Sync monitoring FL Fabric Connection monitoring GR GRES monitoring HW Hardware monitoring IF Interface monitoring IP IP monitoring LB Loopback monitoring MB Mbuf monitoring NH Nexthop monitoring NP NPC monitoring SP SPU monitoring SM Schedule monitoring CF Config Sync monitoring RE Relinquish monitoring
Cluster ID: 1Node Priority Status Preempt Manual Monitor-failures
Redundancy group: 0 , Failover count: 1node0 254 primary no no Nonenode1 1 secondary no no None
Redundancy group: 1 , Failover count: 1node0 254 primary no no Nonenode1 1 secondary no no None
Verifying Chassis Cluster Interfaces
Purpose
Verify information about chassis cluster interfaces.
374

Action
From operational mode, enter the show chassis cluster interfaces command.
{primary:node0}user@host> show chassis cluster interfacesControl link status: Up
Control interfaces: Index Interface Monitored-Status Internal-SA 0 em0 Up Disabled 1 em1 Down Disabled
Fabric link status: Up
Fabric interfaces: Name Child-interface Status (Physical/Monitored) fab0 ge-3/2/8 Up / Up fab0 fab1 ge-15/2/8 Up / Up fab1
Redundant-ethernet Information: Name Status Redundancy-group reth0 Down Not configured reth1 Down Not configured
Redundant-pseudo-interface Information: Name Status Redundancy-group lo0 Up 0
Verifying Chassis Cluster Statistics
Purpose
Verify information about chassis cluster services and control link statistics (heartbeats sent andreceived), fabric link statistics (probes sent and received), and the number of RTOs sent and received forservices.
375

Action
From operational mode, enter the show chassis cluster statistics command.
{primary:node0}user@host> show chassis cluster statistics
Control link statistics: Control link 0: Heartbeat packets sent: 16275 Heartbeat packets received: 16072 Heartbeat packet errors: 0 Control link 1: Heartbeat packets sent: 0 Heartbeat packets received: 0 Heartbeat packet errors: 0Fabric link statistics: Child link 0 Probes sent: 30690 Probes received: 9390 Child link 1 Probes sent: 0 Probes received: 0Services Synchronized: Service name RTOs sent RTOs received Translation context 0 0 Incoming NAT 0 0 Resource manager 0 0 DS-LITE create 0 0 Session create 0 0 IPv6 session create 0 0 Session close 0 0 IPv6 session close 0 0 Session change 0 0 IPv6 session change 0 0 ALG Support Library 0 0 Gate create 0 0 Session ageout refresh requests 0 0 IPv6 session ageout refresh requests 0 0 Session ageout refresh replies 0 0 IPv6 session ageout refresh replies 0 0 IPSec VPN 0 0
376

Firewall user authentication 0 0 MGCP ALG 0 0 H323 ALG 0 0 SIP ALG 0 0 SCCP ALG 0 0 PPTP ALG 0 0 JSF PPTP ALG 0 0 RPC ALG 0 0 RTSP ALG 0 0 RAS ALG 0 0 MAC address learning 0 0 GPRS GTP 0 0 GPRS SCTP 0 0 GPRS FRAMEWORK 0 0 JSF RTSP ALG 0 0 JSF SUNRPC MAP 0 0 JSF MSRPC MAP 0 0 DS-LITE delete 0 0 JSF SLB 0 0 APPID 0 0 JSF MGCP MAP 0 0 JSF H323 ALG 0 0 JSF RAS ALG 0 0 JSF SCCP MAP 0 0 JSF SIP MAP 0 0 PST_NAT_CREATE 0 0 PST_NAT_CLOSE 0 0 PST_NAT_UPDATE 0 0 JSF TCP STACK 0 0 JSF IKE ALG 0 0
Verifying Chassis Cluster Control Plane Statistics
Purpose
Verify information about chassis cluster control plane statistics (heartbeats sent and received) and thefabric link statistics (probes sent and received).
377

Action
From operational mode, enter the show chassis cluster control-plane statistics command.
{primary:node0}user@host> show chassis cluster control-plane statisticsControl link statistics: Control link 0: Heartbeat packets sent: 16315 Heartbeat packets received: 16113 Heartbeat packet errors: 0 Control link 1: Heartbeat packets sent: 0 Heartbeat packets received: 0 Heartbeat packet errors: 0Fabric link statistics: Child link 0 Probes sent: 30772 Probes received: 9472 Child link 1 Probes sent: 0 Probes received: 0
Verifying Chassis Cluster Data Plane Statistics
Purpose
Verify information about the number of RTOs sent and received for services.
Action
From operational mode, enter the show chassis cluster data-plane statistics command.
{primary:node0}user@host> show chassis cluster data-plane statisticsServices Synchronized: Service name RTOs sent RTOs received Translation context 0 0 Incoming NAT 0 0 Resource manager 0 0
378

DS-LITE create 0 0 Session create 0 0 IPv6 session create 0 0 Session close 0 0 IPv6 session close 0 0 Session change 0 0 IPv6 session change 0 0 ALG Support Library 0 0 Gate create 0 0 Session ageout refresh requests 0 0 IPv6 session ageout refresh requests 0 0 Session ageout refresh replies 0 0 IPv6 session ageout refresh replies 0 0 IPSec VPN 0 0 Firewall user authentication 0 0 MGCP ALG 0 0 H323 ALG 0 0 SIP ALG 0 0 SCCP ALG 0 0 PPTP ALG 0 0 JSF PPTP ALG 0 0 RPC ALG 0 0 RTSP ALG 0 0 RAS ALG 0 0 MAC address learning 0 0 GPRS GTP 0 0 GPRS SCTP 0 0 GPRS FRAMEWORK 0 0 JSF RTSP ALG 0 0 JSF SUNRPC MAP 0 0 JSF MSRPC MAP 0 0 DS-LITE delete 0 0 JSF SLB 0 0 APPID 0 0 JSF MGCP MAP 0 0 JSF H323 ALG 0 0 JSF RAS ALG 0 0 JSF SCCP MAP 0 0 JSF SIP MAP 0 0 PST_NAT_CREATE 0 0 PST_NAT_CLOSE 0 0 PST_NAT_UPDATE 0 0
379

JSF TCP STACK 0 0 JSF IKE ALG 0 0
Verifying Chassis Cluster Redundancy Group Status
Purpose
Verify the state and priority of both nodes in a cluster and information about whether the primary nodehas been preempted or whether there has been a manual failover.
Action
From operational mode, enter the chassis cluster status redundancy-group command.
{primary:node0}user@host> show chassis cluster status redundancy-group 1Monitor Failure codes: CS Cold Sync monitoring FL Fabric Connection monitoring GR GRES monitoring HW Hardware monitoring IF Interface monitoring IP IP monitoring LB Loopback monitoring MB Mbuf monitoring NH Nexthop monitoring NP NPC monitoring SP SPU monitoring SM Schedule monitoring CF Config Sync monitoring RE Relinquish monitoring
Cluster ID: 1Node Priority Status Preempt Manual Monitor-failures
Redundancy group: 1 , Failover count: 1node0 254 primary no no Nonenode1 1 secondary no no None
Troubleshooting with Logs
Purpose
Use these logs to identify any chassis cluster issues. You must run these logs on both nodes.
380

Action
From operational mode, enter these show log commands.
user@host> show log jsrpduser@host> show log chassisduser@host> show log messagesuser@host> show log dcduser@host> show traceoptions
SEE ALSO
Preparing Your Equipment for Chassis Cluster Formation | 31
Connecting SRX Series Devices to Create a Chassis Cluster | 35
Example: Configuring an Active/Passive Chassis Cluster Pair (SRX1500)
IN THIS SECTION
Requirements | 381
Overview | 382
Configuration | 386
Verification | 392
This example shows how to configure active/passive chassis clustering for SRX1500 device.
Requirements
Before you begin:
1. Physically connect a pair of devices together, ensuring that they are the same models.
2. Create a fabric link by connecting a Gigabit Ethernet interface on one device to another GigabitEthernet interface on the other device.
381

3. Create a control link by connecting the control port of the two SRX1500 devices.
4. Connect to one of the devices using the console port. (This is the node that forms the cluster.) andset the cluster ID and node number.
user@host> set chassis cluster cluster-id 1 node 0 reboot
5. Connect to the other device using the console port and set the cluster ID and node number.
user@host> set chassis cluster cluster-id 1 node 1 reboot
Overview
In this example, a single device in the cluster is used to route all traffic, and the other device is used onlyin the event of a failure. (See Figure 42 on page 382.) When a failure occurs, the backup device becomesprimary and controls all forwarding.
Figure 42: Active/Passive Chassis Cluster Topology
You can create an active/passive chassis cluster by configuring redundant Ethernet interfaces (reths) thatare all assigned to the same redundancy group. This configuration minimizes the traffic over the fabriclink because only one node in the cluster forwards traffic at any given time.
382

In this example, you configure group (applying the configuration with the apply-groups command) andchassis cluster information. Then you configure security zones and security policies. See Table 20 onpage 383 through Table 23 on page 385.
Table 20: Group and Chassis Cluster Configuration Parameters
Feature Name Configuration Parameters
Groups node0 • Hostname: srx1500-A
• Interface: fxp0
• Unit 0
• 192.0.2.110/24
node1 • Hostname: srx1500-B
• Interface: fxp0
• Unit 0
• 192.0.2.111/24
Table 21: Chassis Cluster Configuration Parameters
Feature Name Configuration Parameters
Fabric links fab0 Interface: ge-0/0/1
fab1 Interface: ge-7/0/1
Heartbeat interval – 1000
Heartbeat threshold – 3
383

Table 21: Chassis Cluster Configuration Parameters (Continued)
Feature Name Configuration Parameters
Redundancy group 0 • Priority:
• Node 0: 254
• Node 1: 1
1 • Priority:
• Node 0: 254
• Node 1: 1
Interface monitoring
• ge-0/0/4
• ge-7/0/4
• ge-0/0/5
• ge-7/0/5
Number of redundant Ethernet interfaces – 2
Interfaces ge-0/0/4 Redundant parent: reth0
ge-7/0/4 Redundant parent: reth0
ge-0/0/5 Redundant parent: reth1
ge-7/0/5 Redundant parent: reth1
reth0 Redundancy group: 1
384

Table 21: Chassis Cluster Configuration Parameters (Continued)
Feature Name Configuration Parameters
• Unit 0
• 198.51.100.1/24
reth1 Redundancy group: 1
• Unit 0
• 203.0.113.233/24
Table 22: Security Zone Configuration Parameters
Name Configuration Parameters
trust The reth1.0 interface is bound to this zone.
untrust The reth0.0 interface is bound to this zone.
Table 23: Security Policy Configuration Parameters
Purpose Name Configuration Parameters
This security policy permits traffic from the trust zone to the untrustzone.
ANY • Match criteria:
• source-address any
• destination-address any
• application any
• Action: permit
385

Configuration
IN THIS SECTION
Procedure | 386
Procedure
CLI Quick Configuration
To quickly configure this example, copy the following commands, paste them into a text file, remove anyline breaks, change any details necessary to match your network configuration, copy and paste thecommands into the CLI at the [edit] hierarchy level, and then enter commit from configuration mode.
[edit]set groups node0 system host-name srx1500-Aset groups node0 interfaces fxp0 unit 0 family inet address 192.0.2.110/24 set groups node1 system host-name srx1500-B set groups node1 interfaces fxp0 unit 0 family inet address 192.0.2.111/24 set apply-groups “${node}”set interfaces fab0 fabric-options member-interfaces ge-0/0/1 set interfaces fab1 fabric-options member-interfaces ge-7/0/1 set chassis cluster heartbeat-interval 1000 set chassis cluster heartbeat-threshold 3 set chassis cluster redundancy-group 0 node 0 priority 100 set chassis cluster redundancy-group 0 node 1 priority 1 set chassis cluster redundancy-group 1 node 0 priority 100 set chassis cluster redundancy-group 1 node 1 priority 1 set chassis cluster redundancy-group 1 interface-monitor ge-0/0/4 weight 255 set chassis cluster redundancy-group 1 interface-monitor ge-7/0/4 weight 255 set chassis cluster redundancy-group 1 interface-monitor ge-0/0/5 weight 255 set chassis cluster redundancy-group 1 interface-monitor ge-7/0/5 weight 255 set chassis cluster reth-count 2 set interfaces ge-0/0/5 gigether-options redundant-parent reth1 set interfaces ge-7/0/5 gigether-options redundant-parent reth1 set interfaces ge-0/0/4 gigether-options redundant-parent reth0 set interfaces ge-7/0/4 gigether-options redundant-parent reth0 set interfaces reth0 redundant-ether-options redundancy-group 1 set interfaces reth0 unit 0 family inet address 198.51.100.1/24
386

set interfaces reth1 redundant-ether-options redundancy-group 1 set interfaces reth1 unit 0 family inet address 203.0.113.233/24 set security zones security-zone untrust interfaces reth1.0 set security zones security-zone trust interfaces reth0.0 set security policies from-zone trust to-zone untrust policy ANY match source-address any set security policies from-zone trust to-zone untrust policy ANY match destination-address any set security policies from-zone trust to-zone untrust policy ANY match application any set security policies from-zone trust to-zone untrust policy ANY then permit
Step-by-Step Procedure
To configure an active/passive chassis cluster:
1. Configure the management interface.
{primary:node0}[edit]user@host# set groups node0 system host-name srx1500-Auser@host# set groups node0 interfaces fxp0 unit 0 family inet address 192.0.2.110/24user@host# set groups node1 system host-name srx1500-Buser@host# set groups node1 interfaces fxp0 unit 0 family inet address 192.0.2.111/24user@host# set apply-groups “${node}”
2. Configure the fabric interface.
{primary:node0}[edit]user@host# set interfaces fab0 fabric-options member-interfaces ge-0/0/1 user@host# set interfaces fab1 fabric-options member-interfaces ge-7/0/1
3. Configure heartbeat settings.
{primary:node0}[edit]user@host# set chassis cluster heartbeat-interval 1000user@host# set chassis cluster heartbeat-threshold 3
4. Configure redundancy groups.
{primary:node0}[edit]user@host# set chassis cluster redundancy-group 0 node 0 priority 100user@host# set chassis cluster redundancy-group 0 node 1 priority 1
387

user@host# set chassis cluster redundancy-group 1 node 0 priority 100user@host# set chassis cluster redundancy-group 1 node 1 priority 1user@host# set chassis cluster redundancy-group 1 interface-monitor ge-0/0/4 weight 255 user@host# set chassis cluster redundancy-group 1 interface-monitor ge-7/0/4 weight 255 user@host# set chassis cluster redundancy-group 1 interface-monitor ge-0/0/5 weight 255 user@host# set chassis cluster redundancy-group 1 interface-monitor ge-7/0/5 weight 255
5. Configure redundant Ethernet interfaces.
{primary:node0}[edit]user@host# set chassis cluster reth-count 2user@host# set interfaces ge-0/0/5 gigether-options redundant-parent reth1 user@host# set interfaces ge-7/0/5 gigether-options redundant-parent reth1 user@host# set interfaces ge-0/0/4 gigether-options redundant-parent reth0 user@host# set interfaces ge-7/0/4 gigether-options redundant-parent reth0 user@host# set interfaces reth0 redundant-ether-options redundancy-group 1user@host# set interfaces reth0 unit 0 family inet address 198.51.100.1/24user@host# set interfaces reth1 redundant-ether-options redundancy-group 1user@host# set interfaces reth1 unit 0 family inet address 203.0.113.233/24
6. Configure security zones.
{primary:node0}[edit]user@host# set security zones security-zone untrust interfaces reth1.0user@host# set security zones security-zone trust interfaces reth0.0
7. Configure security policies.
{primary:node0}[edit]user@host# set security policies from-zone trust to-zone untrust policy ANY match source-address anyuser@host# set security policies from-zone trust to-zone untrust policy ANY match destination-address anyuser@host# set security policies from-zone trust to-zone untrust policy ANY match application anyuser@host# set security policies from-zone trust to-zone untrust policy ANY then permit
388

Results
From configuration mode, confirm your configuration by entering the show configuration command. If theoutput does not display the intended configuration, repeat the configuration instructions in this exampleto correct it.
For brevity, this show command output includes only the configuration that is relevant to this example.Any other configuration on the system has been replaced with ellipses (...).
user@host> show configurationversion x.xx.x; groups { node0 { system { host-name srx1500-A; } interfaces { fxp0 { unit 0 { family inet { address 192.0.2.110/24; } } } } } node1 { system { host-name srx1500-B; interfaces { fxp0 { unit 0 { family inet { address 192.0.2.110/24; } } } } } } apply-groups "${node}"; chassis {
389

cluster { reth-count 2; heartbeat-interval 1000; heartbeat-threshold 3; redundancy-group 0 { node 0 priority 100; node 1 priority 1; } redundancy-group 1 { node 0 priority 100; node 1 priority 1; interface-monitor { ge–0/0/4 weight 255; ge–7/0/4 weight 255; ge–0/0/5 weight 255; ge–7/0/5 weight 255; } } } } interfaces { ge–0/0/4 { gigether–options { redundant–parent reth0; } } ge–7/0/4{ gigether–options { redundant–parent reth0; } } ge–0/0/5 { gigether–options { redundant–parent reth1; } } ge–7/0/5 { gigether–options { redundant–parent reth1; } } fab0 { fabric–options {
390

member–interfaces { ge–0/0/1; } } } fab1 { fabric–options { member–interfaces { ge–7/0/1; } } } reth0 { redundant–ether–options { redundancy–group 1; } unit 0 { family inet { address 198.51.100.1/24; } } } reth1 { redundant–ether–options { redundancy–group 1; } unit 0 { family inet { address 203.0.113.233/24; } } } }...security { zones { security–zone untrust { interfaces { reth1.0; } } security–zone trust { interfaces {
391

reth0.0; } } } policies { from-zone trust to-zone untrust { policy ANY { match { source-address any; destination-address any; application any; } then { permit; } } } }}
If you are done configuring the device, enter commit from configuration mode.
Verification
IN THIS SECTION
Verifying Chassis Cluster Status | 393
Verifying Chassis Cluster Interfaces | 393
Verifying Chassis Cluster Statistics | 394
Verifying Chassis Cluster Control Plane Statistics | 395
Verifying Chassis Cluster Data Plane Statistics | 396
Verifying Chassis Cluster Redundancy Group Status | 397
Troubleshooting with Logs | 397
Confirm that the configuration is working properly.
392

Verifying Chassis Cluster Status
Purpose
Verify the chassis cluster status, failover status, and redundancy group information.
Action
From operational mode, enter the show chassis cluster status command.
{primary:node0}user@host> show chassis cluster statusCluster ID: 1Node Priority Status Preempt Manual failover
Redundancy group: 0 , Failover count: 1 node0 100 primary no no node1 1 secondary no no
Redundancy group: 1 , Failover count: 1 node0 100 primary no no node1 1 secondary no no
Verifying Chassis Cluster Interfaces
Purpose
Verify information about chassis cluster interfaces.
Action
From operational mode, enter the show chassis cluster interfaces command.
{primary:node0}user@host> show chassis cluster interfaces
Control link status: Up
Control interfaces: Index Interface Monitored-Status Security
393

0 em0 Up Disabled 1 em1 Down Disabled
Fabric link status: Up
Fabric interfaces: Name Child-interface Status Security fab0 ge-0/0/1 Up Disabled fab0 fab1 ge-7/0/1 Up Disabled fab1
Redundant-ethernet Information: Name Status Redundancy-group reth0 Up 1 reth1 Up 1
Redundant-pseudo-interface Information: Name Status Redundancy-group lo0 Up 1
Interface Monitoring: Interface Weight Status Redundancy-group ge-0/0/4 255 Up 1 ge-7/0/4 255 Up 1 ge-0/0/5 255 Up 1 ge-7/0/5 255 Up 1
Verifying Chassis Cluster Statistics
Purpose
Verify information about the statistics of the different objects being synchronized, the fabric and controlinterface hellos, and the status of the monitored interfaces in the cluster.
Action
From operational mode, enter the show chassis cluster statistics command.
{primary:node0}user@host> show chassis cluster statistics
394

Control link statistics: Control link 0: Heartbeat packets sent: 2276 Heartbeat packets received: 2280 Heartbeat packets errors: 0Fabric link statistics: Child link 0 Probes sent: 2272 Probes received: 597Services Synchronized: Service name RTOs sent RTOs received Translation context 0 0 Incoming NAT 0 0 Resource manager 6 0 Session create 161 0 Session close 148 0 Session change 0 0 Gate create 0 0 Session ageout refresh requests 0 0 Session ageout refresh replies 0 0 IPSec VPN 0 0 Firewall user authentication 0 0 MGCP ALG 0 0 H323 ALG 0 0 SIP ALG 0 0 SCCP ALG 0 0 PPTP ALG 0 0 RPC ALG 0 0 RTSP ALG 0 0 RAS ALG 0 0 MAC address learning 0 0 GPRS GTP 0 0
Verifying Chassis Cluster Control Plane Statistics
Purpose
Verify information about chassis cluster control plane statistics (heartbeats sent and received) and thefabric link statistics (probes sent and received).
395

Action
From operational mode, enter the show chassis cluster control-plane statistics command.
{primary:node0}user@host> show chassis cluster control-plane statistics
Control link statistics: Control link 0: Heartbeat packets sent: 258689 Heartbeat packets received: 258684 Heartbeat packets errors: 0Fabric link statistics: Child link 0 Probes sent: 258681 Probes received: 258681
Verifying Chassis Cluster Data Plane Statistics
Purpose
Verify information about the number of RTOs sent and received for services.
Action
From operational mode, enter the show chassis cluster data-plane statistics command.
{primary:node0}user@host> show chassis cluster data-plane statistics
Services Synchronized: Service name RTOs sent RTOs received Translation context 0 0 Incoming NAT 0 0 Resource manager 6 0 Session create 161 0 Session close 148 0 Session change 0 0 Gate create 0 0 Session ageout refresh requests 0 0
396

Session ageout refresh replies 0 0 IPSec VPN 0 0 Firewall user authentication 0 0 MGCP ALG 0 0 H323 ALG 0 0 SIP ALG 0 0 SCCP ALG 0 0 PPTP ALG 0 0 RPC ALG 0 0 RTSP ALG 0 0 RAS ALG 0 0 MAC address learning 0 0 GPRS GTP 0 0
Verifying Chassis Cluster Redundancy Group Status
Purpose
Verify the state and priority of both nodes in a cluster and information about whether the primary nodehas been preempted or whether there has been a manual failover.
Action
From operational mode, enter the chassis cluster status redundancy-group command.
{primary:node0}user@host> show chassis cluster status redundancy-group 1Cluster ID: 1 Node Priority Status Preempt Manual failover
Redundancy-Group: 1, Failover count: 1 node0 100 primary no no node1 1 secondary no no
Troubleshooting with Logs
Purpose
Use these logs to identify any chassis cluster issues. You must run these logs on both nodes.
397

Action
From operational mode, enter these show commands.
user@host> show log jsrpduser@host> show log chassisduser@host> show log messagesuser@host> show log dcduser@host> show traceoptions
SEE ALSO
Example: Setting the Node ID and Cluster ID for Security Devices in a Chassis Cluster | 43
Chassis Cluster Management Interfaces | 47
Chassis Cluster Fabric Interfaces | 56
Chassis Cluster Control Plane Interfaces | 69
Chassis Cluster Redundancy Groups | 93
Chassis Cluster Redundant Ethernet Interfaces | 101
Example: Configuring an Active/Passive Chassis Cluster Pair (J-Web)
1. Enable clustering. See Step 1 in "Example: Configuring an Active/Passive Chassis Cluster Pair (CLI)"on page 381.
2. Configure the management interface. See Step 2 in "Example: Configuring an Active/Passive ChassisCluster Pair (CLI)" on page 381.
3. Configure the fabric interface. See Step 3 in "Example: Configuring an Active/Passive Chassis ClusterPair (CLI)" on page 381.
4. Configure the redundancy groups.
• Select Configure>Chassis Cluster.
• Enter the following information, and then click Apply:
a. Redundant ether-Interface Count: 2
b. Heartbeat Interval: 1000
398

c. Heartbeat Threshold: 3
d. Nodes: 0
e. Group Number: 0
f. Priorities: 100
• Enter the following information, and then click Apply:
a. Nodes: 0
b. Group Number: 1
c. Priorities: 1
• Enter the following information, and then click Apply:
a. Nodes: 1
b. Group Number: 0
c. Priorities: 100
5. Configure the redundant Ethernet interfaces.
• Select Configure>Chassis Cluster.
• Select ge-0/0/4.
• Enter reth1 in the Redundant Parent box.
• Click Apply.
• Select ge-7/0/4.
• Enter reth1 in the Redundant Parent box.
a.
• Click Apply.
• Select ge-0/0/5.
• Enter reth0 in the Redundant Parent box.
a.
• Click Apply.
• Select ge-7/0/5.
399

• Enter reth0 in the Redundant Parent box.
a.
• Click Apply.
• See Step 5 in "Example: Configuring an Active/Passive Chassis Cluster Pair (CLI)" on page 381 forthe last four configuration settings.
6. Configure the security zones. See Step 6 in "Example: Configuring an Active/Passive Chassis ClusterPair (CLI)" on page 381.
7. Configure the security policies. See Step 7 in "Example: Configuring an Active/Passive ChassisCluster Pair (CLI)" on page 381.
8. Click OK to check your configuration and save it as a candidate configuration, then click CommitOptions>Commit.
SEE ALSO
Understanding Active/Passive Chassis Cluster Deployment | 361
Example: Configuring an Active/Passive Chassis Cluster Pair (SRX1500) | 381
400

Understanding Active/Passive Chassis Cluster Deployment with an IPsecTunnel
In this case, a single device in the cluster terminates in an IPsec tunnel and is used to process all trafficwhile the other device is used only in the event of a failure (see Figure 43 on page 401). When a failureoccurs, the backup device becomes primary and controls all forwarding.
Figure 43: Active/Passive Chassis Cluster with IPsec Tunnel Scenario (SRX Series Devices)
An active/passive chassis cluster can be achieved by using redundant Ethernet interfaces (reths) that areall assigned to the same redundancy group. If any of the interfaces in an active group in a node fails, thegroup is declared inactive and all the interfaces in the group fail over to the other node.
This configuration provides a way for a site-to-site IPsec tunnel to terminate in an active/passive clusterwhere a redundant Ethernet interface is used as the tunnel endpoint. In the event of a failure, theredundant Ethernet interface in the backup SRX Series device becomes active, forcing the tunnel tochange endpoints to terminate in the new active SRX Series device. Because tunnel keys and sessioninformation are synchronized between the members of the chassis cluster, a failover does not requirethe tunnel to be renegotiated and all established sessions are maintained.
401

In case of RG0 (routing engine) failure, the routing protocols need to re-establish on the new Primarynode. If VPN monitoring or Dead-peer-detection is configured, and its timer expires before the routingreconverges on new RG0 Primary, then VPN tunnel will be brought down and renegotiated.
Dynamic tunnels cannot load-balance across different SPCs.
SEE ALSO
IPsec VPN Overview
Example: Configuring an Active/Passive Chassis Cluster Pair with anIPsec Tunnel
IN THIS SECTION
Requirements | 402
Overview | 404
Configuration | 410
Verification | 419
This example shows how to configure active/passive chassis clustering with an IPsec tunnel for SRXSeries devices.
Requirements
Before you begin:
• Get two SRX5000 models with identical hardware configurations, one SRX1500 device, and four EXSeries Ethernet switches.
• Physically connect the two devices (back-to-back for the fabric and control ports) and ensure thatthey are the same models. You can configure both the fabric and control ports on the SRX5000 line.
• Set the two devices to cluster mode and reboot the devices. You must enter the followingoperational mode commands on both devices, for example:
402

• On node 0:
user@host> set chassis cluster cluster-id 1 node 0 reboot
• On node 1:
user@host> set chassis cluster cluster-id 1 node 1 reboot
The cluster ID is the same on both devices, but the node ID must be different because one device isnode 0 and the other device is node 1. The range for the cluster ID is 1 through 255. Setting a clusterID to 0 is equivalent to disabling a cluster.
Cluster ID greater than 15 can only be set when the fabric and control link interfaces are connectedback-to-back.
• Get two SRX5000 models with identical hardware configurations, one SRX1500 edge router, andfour EX Series Ethernet switches.
• Physically connect the two devices (back-to-back for the fabric and control ports) and ensure thatthey are the same models. You can configure both the fabric and control ports on the SRX5000 line.
From this point forward, configuration of the cluster is synchronized between the node members andthe two separate devices function as one device. Member-specific configurations (such as the IP addressof the management port of each member) are entered using configuration groups.
403

Overview
In this example, a single device in the cluster terminates in an IPsec tunnel and is used to process alltraffic, and the other device is used only in the event of a failure. (See Figure 44 on page 404.) When afailure occurs, the backup device becomes primary and controls all forwarding.
Figure 44: Active/Passive Chassis Cluster with IPsec Tunnel Topology (SRX Series Devices)
In this example, you configure group (applying the configuration with the apply-groups command) andchassis cluster information. Then you configure IKE, IPsec, static route, security zone, and security policyparameters. See Table 24 on page 405 through Table 30 on page 409.
404

Table 24: Group and Chassis Cluster Configuration Parameters
Feature Name Configuration Parameters
Groups node0 • Hostname: SRX5800-1
• Interface: fxp0
• Unit 0
• 172.19.100.50/24
node1 • Hostname: SRX5800-2
• Interface: fxp0
• Unit 0
• 172.19.100.51/24
Table 25: Chassis Cluster Configuration Parameters
Feature Name Configuration Parameters
Fabric links fab0 Interface: xe-5/3/0
fab1 Interface: xe-17/3/0
Number of redundant Ethernet interfaces – 2
Heartbeat interval – 1000
Heartbeat threshold – 3
Redundancy group 0 • Priority:
• Node 0: 254
• Node 1: 1
405
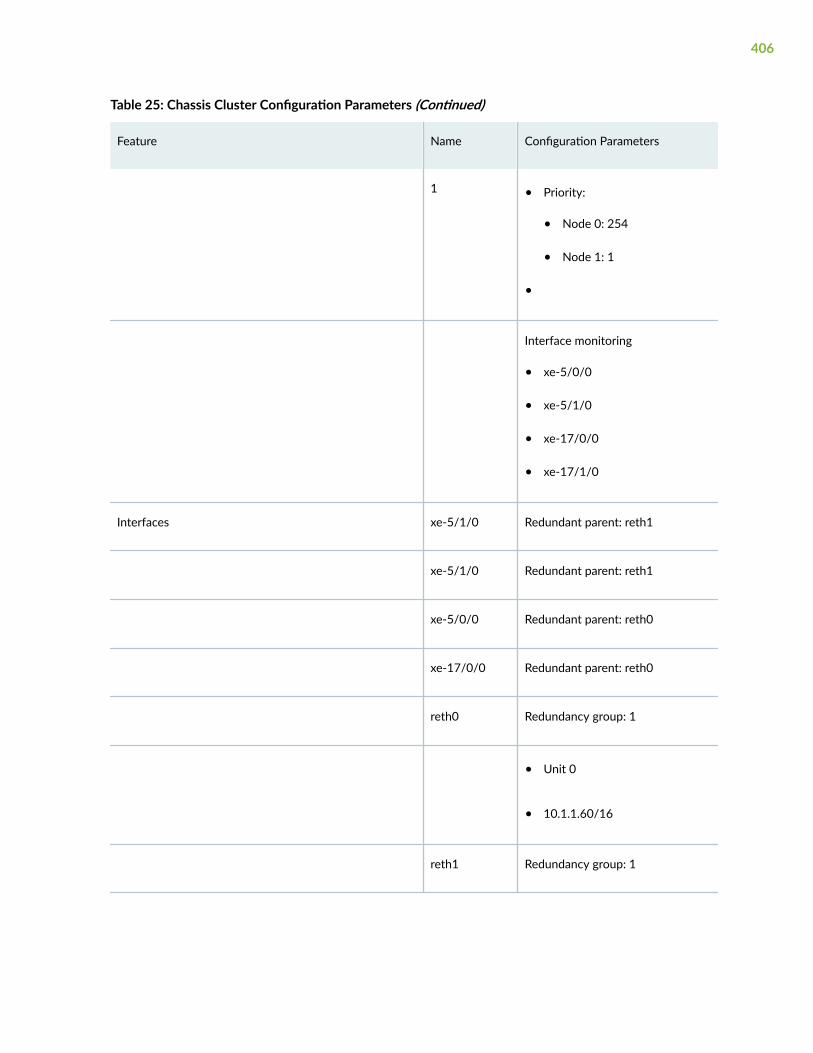
Table 25: Chassis Cluster Configuration Parameters (Continued)
Feature Name Configuration Parameters
1 • Priority:
• Node 0: 254
• Node 1: 1
•
Interface monitoring
• xe-5/0/0
• xe-5/1/0
• xe-17/0/0
• xe-17/1/0
Interfaces xe-5/1/0 Redundant parent: reth1
xe-5/1/0 Redundant parent: reth1
xe-5/0/0 Redundant parent: reth0
xe-17/0/0 Redundant parent: reth0
reth0 Redundancy group: 1
• Unit 0
• 10.1.1.60/16
reth1 Redundancy group: 1
406

Table 25: Chassis Cluster Configuration Parameters (Continued)
Feature Name Configuration Parameters
• Multipoint
• Unit 0
• 10.10.1.1/30
st0
• Unit 0
• 10.10.1.1/30
Table 26: IKE Configuration Parameters
Feature Name Configuration Parameters
Proposal proposal-setstandard
-
Policy preShared • Mode: main
• Proposal reference: proposal-set standard
• IKE Phase 1 policy authentication method: pre-shared-key ascii-text
Gateway SRX1500-1 • IKE policy reference: perShared
• External interface: reth0.0
• Gateway address: 10.1.1.90
NOTE: In SRX chassis clustering, only reth and lo0 interfaces are supported forthe IKE external interface configuration. Other interface types can beconfigured, but IPsec VPN might not work. If a lo0 logical interface is used as anIKE gateway external interface, it cannot be configured with RG0.
407

Table 27: IPsec Configuration Parameters
Feature Name Configuration Parameters
Proposal proposal-set standard –
Policy std –
VPN SRX1500-1 • IKE gateway reference: SRX1500-1
• IPsec policy reference: std
• Bind to interface: st0.0
• VPN monitoring: vpn-monitor optimized
• Tunnels established: establish-tunnels immediately
NOTE: The manual VPN name and the site-to-site gateway name cannot bethe same.
Table 28: Static Route Configuration Parameters
Name Configuration Parameters
0.0.0.0/0 Next hop: 10.2.1.1
10.3.0.0/16 Next hop: 10.10.1.2
Table 29: Security Zone Configuration Parameters
Name Configuration Parameters
trust • All system services are allowed.
• All protocols are allowed.
• The reth0.0 interface is bound to this zone.
408
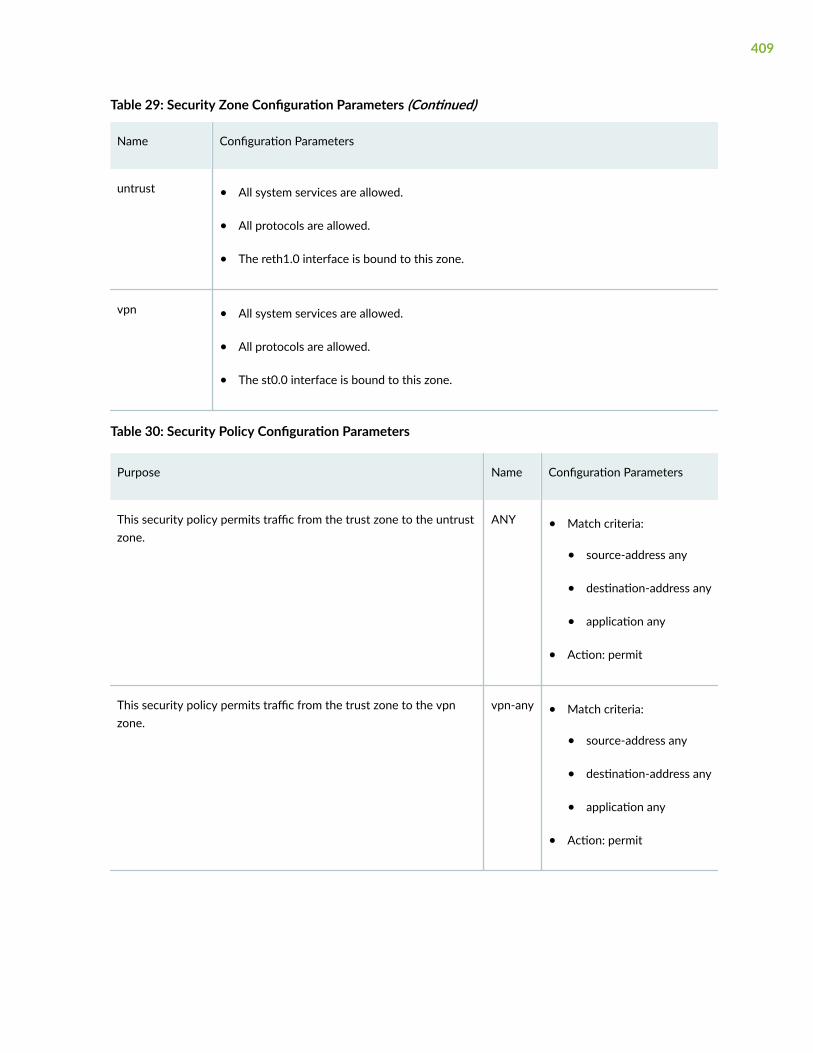
Table 29: Security Zone Configuration Parameters (Continued)
Name Configuration Parameters
untrust • All system services are allowed.
• All protocols are allowed.
• The reth1.0 interface is bound to this zone.
vpn • All system services are allowed.
• All protocols are allowed.
• The st0.0 interface is bound to this zone.
Table 30: Security Policy Configuration Parameters
Purpose Name Configuration Parameters
This security policy permits traffic from the trust zone to the untrustzone.
ANY • Match criteria:
• source-address any
• destination-address any
• application any
• Action: permit
This security policy permits traffic from the trust zone to the vpnzone.
vpn-any • Match criteria:
• source-address any
• destination-address any
• application any
• Action: permit
409

Configuration
IN THIS SECTION
Procedure | 410
Procedure
CLI Quick Configuration
To quickly configure this example, copy the following commands, paste them into a text file, remove anyline breaks, change any details necessary to match your network configuration, copy and paste thecommands into the CLI at the [edit] hierarchy level, and then enter commit from configuration mode.
{primary:node0}[edit]set chassis cluster control-ports fpc 2 port 0set chassis cluster control-ports fpc 14 port 0set groups node0 system host-name SRX5800-1set groups node0 interfaces fxp0 unit 0 family inet address 172.19.100.50/24set groups node1 system host-name SRX5800-2set groups node1 interfaces fxp0 unit 0 family inet address 172.19.100.51/24set apply-groups “${node}”set interfaces fab0 fabric-options member-interfaces xe-5/3/0set interfaces fab1 fabric-options member-interfaces xe-17/3/0set chassis cluster reth-count 2set chassis cluster heartbeat-interval 1000set chassis cluster heartbeat-threshold 3set chassis cluster node 0set chassis cluster node 1set chassis cluster redundancy-group 0 node 0 priority 254set chassis cluster redundancy-group 0 node 1 priority 1set chassis cluster redundancy-group 1 node 0 priority 254set chassis cluster redundancy-group 1 node 1 priority 1set chassis cluster redundancy-group 1 preemptset chassis cluster redundancy-group 1 interface-monitor xe-5/0/0 weight 255set chassis cluster redundancy-group 1 interface-monitor xe-5/1/0 weight 255set chassis cluster redundancy-group 1 interface-monitor xe-17/0/0 weight 255set chassis cluster redundancy-group 1 interface-monitor xe-17/1/0 weight 255set interfaces xe-5/1/0 gigether-options redundant-parent reth1
410

set interfaces xe-17/1/0 gigether-options redundant-parent reth1set interfaces xe-5/0/0 gigether-options redundant-parent reth0set interfaces xe-17/0/0 gigether-options redundant-parent reth0set interfaces reth0 redundant-ether-options redundancy-group 1set interfaces reth0 unit 0 family inet address 10.1.1.60/16set interfaces reth1 redundant-ether-options redundancy-group 1set interfaces reth1 unit 0 family inet address 10.2.1.60/16set interfaces st0 unit 0 multipoint family inet address 10.10.1.1/30set security ike policy preShared mode mainset security ike policy preShared proposal-set standardset security ike policy preShared pre-shared-key ascii-text "$ABC123"## Encrypted passwordset security ike gateway SRX1500-1 ike-policy preSharedset security ike gateway SRX1500-1 address 10.1.1.90set security ike gateway SRX1500-1 external-interface reth0.0set security ipsec policy std proposal-set standardset security ipsec vpn SRX1500-1 bind-interface st0.0set security ipsec vpn SRX1500-1 vpn-monitor optimizedset security ipsec vpn SRX1500-1 ike gateway SRX1500-1set security ipsec vpn SRX1500-1 ike ipsec-policy stdset security ipsec vpn SRX1500-1 establish-tunnels immediatelyset routing-options static route 0.0.0.0/0 next-hop 10.2.1.1set routing-options static route 10.3.0.0/16 next-hop 10.10.1.2set security zones security-zone untrust host-inbound-traffic system-services allset security zones security-zone untrust host-inbound-traffic protocols allset security zones security-zone untrust interfaces reth1.0set security zones security-zone trust host-inbound-traffic system-services allset security zones security-zone trust host-inbound-traffic protocols allset security zones security-zone trust interfaces reth0.0set security zones security-zone vpn host-inbound-traffic system-services all 144set security zones security-zone vpn host-inbound-traffic protocols allset security zones security-zone vpn interfaces st0.0set security policies from-zone trust to-zone untrust policy ANY match source-address anyset security policies from-zone trust to-zone untrust policy ANY match destination-address anyset security policies from-zone trust to-zone untrust policy ANY match application anyset security policies from-zone trust to-zone vpn policy vpn-any then permit
Step-by-Step Procedure
To configure an active/passive chassis cluster pair with an IPsec tunnel:
411

1. Configure control ports.
{primary:node0}[edit]user@host# set chassis cluster control-ports fpc 2 port 0user@host# set chassis cluster control-ports fpc 14 port 0
2. Configure the management interface.
{primary:node0}[edit]user@host# set groups node0 system host-name SRX5800-1user@host# set groups node0 interfaces fxp0 unit 0 family inet address 172.19.100.50/24user@host#set groups node1 system host-name SRX5800-2user@host# set groups node1 interfaces fxp0 unit 0 family inet address 172.19.100.51/24user@host# set apply-groups “${node}”
3. Configure the fabric interface.
{primary:node0}[edit]user@host# set interfaces fab0 fabric-options member-interfaces xe-5/3/0user@host# set interfaces fab1 fabric-options member-interfaces xe-17/3/0
4. Configure redundancy groups.
{primary:node0}[edit]user@host# set chassis cluster reth-count 2user@host# set chassis cluster heartbeat-interval 1000user@host# set chassis cluster heartbeat-threshold 3user@host# set chassis cluster node 0user@host# set chassis cluster node 1user@host# set chassis cluster redundancy-group 0 node 0 priority 254user@host# set chassis cluster redundancy-group 0 node 1 priority 1user@host# set chassis cluster redundancy-group 1 node 0 priority 254user@host# set chassis cluster redundancy-group 1 node 1 priority 1user@host# set chassis cluster redundancy-group 1 preemptuser@host# set chassis cluster redundancy-group 1 interface-monitor xe-5/0/0 weight 255user@host# set chassis cluster redundancy-group 1 interface-monitor xe-5/1/0 weight 255user@host# set chassis cluster redundancy-group 1 interface-monitor xe-17/0/0 weight 255user@host# set chassis cluster redundancy-group 1 interface-monitor xe-17/1/0 weight 255
412

5. Configure redundant Ethernet interfaces.
{primary:node0}[edit]user@host# set interfaces xe-5/1/0 gigether-options redundant-parent reth1user@host# set interfaces xe-17/1/0 gigether-options redundant-parent reth1user@host# set interfaces xe-5/0/0 gigether-options redundant-parent reth0user@host# set interfaces xe-17/0/0 gigether-options redundant-parent reth0user@host# set interfaces reth0 redundant-ether-options redundancy-group 1user@host# set interfaces reth0 unit 0 family inet address 10.1.1.60/16user@host# set interfaces reth1 redundant-ether-options redundancy-group 1user@host# set interfaces reth1 unit 0 family inet address 10.2.1.60/16
6. Configure IPsec parameters.
{primary:node0}[edit]user@host# set interfaces st0 unit 0 multipoint family inet address 10.10.1.1/30user@host# set security ike policy preShared mode mainuser@host# set security ike policy preShared proposal-set standarduser@host# set security ike policy preShared pre-shared-key ascii-text "$ABC123"## Encrypted passworduser@host# set security ike gateway SRX1500-1 ike-policy preShareduser@host# set security ike gateway SRX1500-1 address 10.1.1.90user@host# set security ike gateway SRX1500-1 external-interface reth0.0user@host# set security ipsec policy std proposal-set standarduser@host# set security ipsec vpn SRX1500-1 bind-interface st0.0user@host# set security ipsec vpn SRX1500-1 vpn-monitor optimizeduser@host# set security ipsec vpn SRX1500-1 ike gateway SRX1500-1user@host# set security ipsec vpn SRX1500-1 ike ipsec-policy stduser@host# set security ipsec vpn SRX1500-1 establish-tunnels immediately
7. Configure static routes.
{primary:node0}[edit]user@host# set routing-options static route 0.0.0.0/0 next-hop 10.2.1.1user@host# set routing-options static route 10.3.0.0/16 next-hop 10.10.1.2
413

8. Configure security zones.
{primary:node0}[edit]user@host# set security zones security-zone untrust host-inbound-traffic system-services alluser@host# set security zones security-zone untrust host-inbound-traffic protocols alluser@host# set security zones security-zone untrust interfaces reth1.0user@host# set security zones security-zone trust host-inbound-traffic system-services alluser@host# set security zones security-zone trust host-inbound-traffic protocols alluser@host# set security zones security-zone trust interfaces reth0.0user@host# set security zones security-zone vpn host-inbound-traffic system-services alluser@host# set security zones security-zone vpn host-inbound-traffic protocols alluser@host# set security zones security-zone vpn interfaces st0.0
9. Configure security policies.
{primary:node0}[edit]user@host# set security policies from-zone trust to-zone untrust policy ANY match source-address anyuser@host# set security policies from-zone trust to-zone untrust policy ANY match destination-address anyuser@host# set security policies from-zone trust to-zone untrust policy ANY match application anyuser@host# set security policies from-zone trust to-zone vpn policy vpn-any then permit
Results
From operational mode, confirm your configuration by entering the show configuration command. If theoutput does not display the intended configuration, repeat the configuration instructions in this exampleto correct it.
For brevity, this show command output includes only the configuration that is relevant to this example.Any other configuration on the system has been replaced with ellipses (...).
user@host> show configurationversion x.xx.x;groups { node0 { system { host-name SRX58001; }
414

interfaces { fxp0 { unit 0 { family inet { address 172.19.100.50/24; } } } } } node1 { system { host-name SRX58002; } interfaces { fxp0 { unit 0 { family inet { address 172.19.100.51/24; } } } } }}apply-groups "${node}";system { root-authentication { encrypted-password "$ABC123"; }}chassis { cluster { reth-count 2; heartbeat-interval 1000; heartbeat-threshold 3; control-ports { fpc 2 port 0; fpc 14 port 0; } redundancy-group 0 { node 0 priority 254; node 1 priority 1;
415

} redundancy-group 1 { node 0 priority 254; node 1 priority 1; preempt; interface-monitor { xe–6/0/0 weight 255; xe–6/1/0 weight 255; xe–18/0/0 weight 255; xe–18/1/0 weight 255; } } }}interfaces { xe–5/0/0 { gigether–options { redundant–parent reth0; } } xe–5/1/0 { gigether–options { redundant–parent reth1; } } xe–17/0/0 { gigether–options { redundant–parent reth0; } } xe–17/1/0 { gigether–options { redundant–parent reth1; } } fab0 { fabric–options { member–interfaces { xe–5/3/0; } } } fab1 {
416

fabric–options { member–interfaces { xe–17/3/0; } } } reth0 { redundant–ether–options { redundancy–group 1; } unit 0 { family inet { address 10.1.1.60/16; } } } reth1 { redundant–ether–options { redundancy–group 1; } unit 0 { family inet { address 10.2.1.60/16; } } } st0 { unit 0 { multipoint; family inet { address 5.4.3.2/32; } } }}routing–options { static { route 0.0.0.0/0 { next–hop 10.2.1.1; } route 10.3.0.0/16 { next–hop 10.10.1.2; }
417

}}security { zones { security–zone trust { host–inbound–traffic { system–services { all; } } interfaces { reth0.0; } } security–zone untrust host-inbound-traffic { system-services { all; } } protocols { all; } interfaces { reth1.0; } }
security-zone vpn { host-inbound-traffic { system-services { all; } } protocols { all; } interfaces { st0.0; }
} }
418

policies { from–zone trust to–zone untrust { policy ANY { match { source–address any; destination–address any; application any; } then { permit; } } } from–zone trust to–zone vpn { policy vpn { match { source–address any; destination–address any; application any; } then { permit; } } } }}
If you are done configuring the device, enter commit from configuration mode.
Verification
IN THIS SECTION
Verifying Chassis Cluster Status | 420
Verifying Chassis Cluster Interfaces | 420
Verifying Chassis Cluster Statistics | 421
Verifying Chassis Cluster Control Plane Statistics | 422
Verifying Chassis Cluster Data Plane Statistics | 423
419

Verifying Chassis Cluster Redundancy Group Status | 424
Troubleshooting with Logs | 424
Confirm that the configuration is working properly.
Verifying Chassis Cluster Status
Purpose
Verify the chassis cluster status, failover status, and redundancy group information.
Action
From operational mode, enter the show chassis cluster status command.
{primary:node0}show chassis cluster statusCluster ID: 1Node Priority Status Preempt Manual failover
Redundancy group: 0 , Failover count: 1 node0 1 primary no no node1 254 secondary no no
Redundancy group: 1 , Failover count: 1 node0 1 primary yes no node1 254 secondary yes no
Verifying Chassis Cluster Interfaces
Purpose
Verify the chassis cluster interfaces.
420

Action
From operational mode, enter the show chassis cluster interfaces command.
{primary:node0}user@host> show chassis cluster interfacesControl link name: fxp1
Redundant-ethernet Information: Name Status Redundancy-group reth0 Up 1 reth1 Up 1
Interface Monitoring: Interface Weight Status Redundancy-group xe-5/0/0 255 Up 1 xe-5/1/0 255 Up 1 xe-17/0/0 255 Up 1 xe-17/1/0 255 Up 1
Verifying Chassis Cluster Statistics
Purpose
Verify information about chassis cluster services and control link statistics (heartbeats sent andreceived), fabric link statistics (probes sent and received), and the number of RTOs sent and received forservices.
Action
From operational mode, enter the show chassis cluster statistics command.
{primary:node0}user@host> show chassis cluster statistics
Control link statistics: Control link 0: Heartbeat packets sent: 258689 Heartbeat packets received: 258684 Heartbeat packets errors: 0
421

Fabric link statistics: Child link 0 Probes sent: 258681 Probes received: 258681Services Synchronized: Service name RTOs sent RTOs received Translation context 0 0 Incoming NAT 0 0 Resource manager 6 0 Session create 161 0 Session close 148 0 Session change 0 0 Gate create 0 0 Session ageout refresh requests 0 0 Session ageout refresh replies 0 0 IPSec VPN 0 0 Firewall user authentication 0 0 MGCP ALG 0 0 H323 ALG 0 0 SIP ALG 0 0 SCCP ALG 0 0 PPTP ALG 0 0 RPC ALG 0 0 RTSP ALG 0 0 RAS ALG 0 0 MAC address learning 0 0 GPRS GTP 0 0
Verifying Chassis Cluster Control Plane Statistics
Purpose
Verify information about chassis cluster control plane statistics (heartbeats sent and received) and thefabric link statistics (probes sent and received).
422

Action
From operational mode, enter the show chassis cluster control-panel statistics command.
{primary:node0}user@host> show chassis cluster control-plane statistics
Control link statistics: Control link 0: Heartbeat packets sent: 258689 Heartbeat packets received: 258684 Heartbeat packets errors: 0Fabric link statistics: Child link 0 Probes sent: 258681 Probes received: 258681
Verifying Chassis Cluster Data Plane Statistics
Purpose
Verify information about the number of RTOs sent and received for services.
Action
From operational mode, enter the show chassis cluster data-plane statistics command.
{primary:node0}user@host> show chassis cluster data-plane statistics
Services Synchronized: Service name RTOs sent RTOs received Translation context 0 0 Incoming NAT 0 0 Resource manager 6 0 Session create 161 0 Session close 148 0 Session change 0 0 Gate create 0 0 Session ageout refresh requests 0 0
423

Session ageout refresh replies 0 0 IPSec VPN 0 0 Firewall user authentication 0 0 MGCP ALG 0 0 H323 ALG 0 0 SIP ALG 0 0 SCCP ALG 0 0 PPTP ALG 0 0 RPC ALG 0 0 RTSP ALG 0 0 RAS ALG 0 0 MAC address learning 0 0 GPRS GTP 0 0
Verifying Chassis Cluster Redundancy Group Status
Purpose
Verify the state and priority of both nodes in a cluster and information about whether the primary nodehas been preempted or whether there has been a manual failover.
Action
From operational mode, enter the chassis cluster status redundancy-group command.
{primary:node0}user@host> show chassis cluster status redundancy-group 1Cluster ID: 1 Node Priority Status Preempt Manual failover
Redundancy-Group: 1, Failover count: 1 node0 0 primary yes no node1 254 secondary yes no
Troubleshooting with Logs
Purpose
Use these logs to identify any chassis cluster issues. You must run these logs on both nodes.
424

Action
From operational mode, enter these show commands.
user@host> show log jsrpduser@host> show log chassisduser@host> show log messagesuser@host> show log dcduser@host> show traceoptions
Example: Configuring an Active/Passive Chassis Cluster Pair with anIPsec Tunnel (J-Web)
1. Enable clusters. See Step 1 in "Example: Configuring an Active/Passive Chassis Cluster Pair with anIPsec Tunnel" on page 402.
2. Configure the management interface. See Step 2 in "Example: Configuring an Active/PassiveChassis Cluster Pair with an IPsec Tunnel" on page 402.
3. Configure the fabric interface. See Step 3 in "Example: Configuring an Active/Passive ChassisCluster Pair with an IPsec Tunnel" on page 402.
4. Configure the redundancy groups.
• Select Configure>System Properties>Chassis Cluster.
• Enter the following information, and then click Apply:
a. Redundant ether-Interfaces Count: 2
b. Heartbeat Interval: 1000
c. Heartbeat Threshold: 3
d. Nodes: 0
e. Group Number: 0
f. Priorities: 254
• Enter the following information, and then click Apply:
a. Nodes: 0
425

b. Group Number: 1
c. Priorities: 254
• Enter the following information, and then click Apply:
a. Nodes: 1
b. Group Number: 0
c. Priorities: 1
• Enter the following information, and then click Apply:
a. Nodes: 1
b. Group Number: 1
c. Priorities: 1
d. Preempt: Select the check box.
e. Interface Monitor—Interface: xe-5/0/0
f. Interface Monitor—Weight: 255
g. Interface Monitor—Interface: xe-5/1/0
h. Interface Monitor—Weight: 255
i. Interface Monitor—Interface: xe-17/0/0
j. Interface Monitor—Weight: 255
k. Interface Monitor—Interface: xe-17/1/0
l. Interface Monitor—Weight: 255
5. Configure the redundant Ethernet interfaces.
• Select Configure>System Properties>Chassis Cluster.
• Select xe-5/1/0.
• Enter reth1 in the Redundant Parent box.
• Click Apply.
• Select xe-17/1/0.
• Enter reth1 in the Redundant Parent box.
426
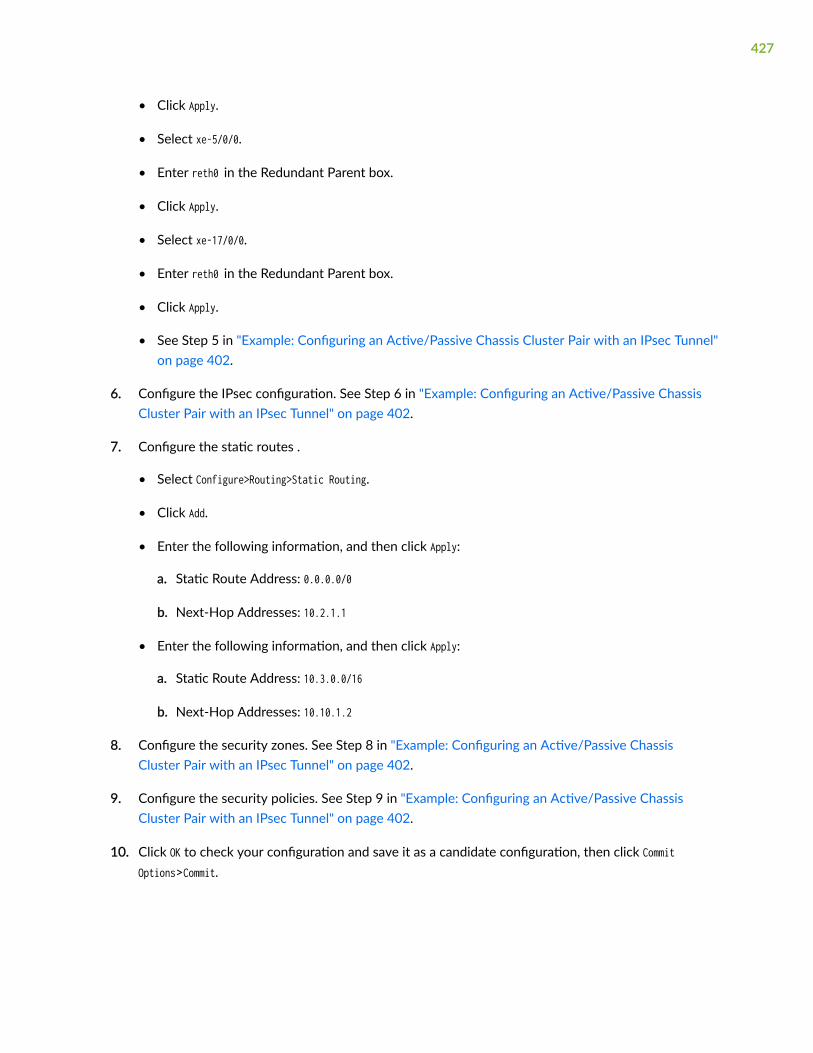
• Click Apply.
• Select xe-5/0/0.
• Enter reth0 in the Redundant Parent box.
• Click Apply.
• Select xe-17/0/0.
• Enter reth0 in the Redundant Parent box.
• Click Apply.
• See Step 5 in "Example: Configuring an Active/Passive Chassis Cluster Pair with an IPsec Tunnel"on page 402.
6. Configure the IPsec configuration. See Step 6 in "Example: Configuring an Active/Passive ChassisCluster Pair with an IPsec Tunnel" on page 402.
7. Configure the static routes .
• Select Configure>Routing>Static Routing.
• Click Add.
• Enter the following information, and then click Apply:
a. Static Route Address: 0.0.0.0/0
b. Next-Hop Addresses: 10.2.1.1
• Enter the following information, and then click Apply:
a. Static Route Address: 10.3.0.0/16
b. Next-Hop Addresses: 10.10.1.2
8. Configure the security zones. See Step 8 in "Example: Configuring an Active/Passive ChassisCluster Pair with an IPsec Tunnel" on page 402.
9. Configure the security policies. See Step 9 in "Example: Configuring an Active/Passive ChassisCluster Pair with an IPsec Tunnel" on page 402.
10. Click OK to check your configuration and save it as a candidate configuration, then click CommitOptions>Commit.
427

RELATED DOCUMENTATION
SRX Series Chassis Cluster Configuration Overview | 13
Configuring Chassis Clustering on SRX Series Devices | 121
Multicast Routing and Asymmetric Routing onChassis Cluster
IN THIS SECTION
Understanding Multicast Routing on a Chassis Cluster | 428
Understanding Asymmetric Routing on a Chassis Cluster | 430
Example: Configuring an Asymmetric Chassis Cluster Pair | 432
Multicast routing support in a chassis cluster allows different multicast protocols to send traffic acrossinterfaces to multiple recipients. Asymmetric routing is the situation where packets from source host todestination host but follow a different path than packets from destination host to source host. For moreinformation, see the following topics:
Understanding Multicast Routing on a Chassis Cluster
IN THIS SECTION
Understanding PIM Data Forwarding | 429
Understanding Multicast and PIM Session Synchronization | 429
Multicast routing support across nodes in a chassis cluster allows multicast protocols, such as ProtocolIndependent Multicast (PIM) versions 1 and 2, Internet Group Management Protocol (IGMP), SessionAnnouncement Protocol (SAP), and Distance Vector Multicast Routing Protocol (DVMRP), to send traffic
428

across interfaces in the cluster. Note, however, that the multicast protocols should not be enabled onthe chassis management interface (fxp0) or on the fabric interfaces (fab0 and fab1). Multicast sessions aresynched across the cluster and maintained during redundant group failovers. During failover, as withother types of traffic, there might be some multicast packet loss.
Multicast data forwarding in a chassis cluster uses the incoming interface to determine whether or notthe session remains active. Packets are forwarded to the peer node if a leaf session’s outgoing interfaceis on the peer instead of on the incoming interface’s node. Multicast routing on a chassis clustersupports tunnels for both incoming and outgoing interfaces.
Multicast traffic has an upstream (toward source) and downstream (toward subscribers) direction intraffic flows. The devices replicate (fanout) a single multicast packet to multiple networks that containsubscribers. In the chassis cluster environment, multicast packet fanouts can be active on either nodes.
If the incoming interface is active on the current node and backup on the peer node, then the session isactive on the current node and backup on the peer node.
Multicast configuration on a chassis cluster is the same as multicast configuration on a standalonedevice. See the Multicast Protocols User Guide for more information.
Understanding PIM Data Forwarding
Protocol Independent Multicast (PIM) is used between devices to track the multicast packets to beforwarded to each other.
A PIM session encapsulates multicast data into a PIM unicast packet. A PIM session creates thefollowing sessions:
• Control session
• Data session
The data session saves the control session ID. The control session and the data session are closedindependently. The incoming interface is used to determine whether the PIM session is active or not. Ifthe outgoing interface is active on the peer node, packets are transferred to the peer node fortransmission.
Understanding Multicast and PIM Session Synchronization
Synchronizing multicast and PIM sessions helps to prevent packet loss due to failover because thesessions do not need to be set up again when there is a failover.
In PIM sessions, the control session is synchronized to the backup node, and then the data session issynchronized.
429

In multicast sessions, the template session is synchronized to the peer node, then all the leaf sessionsare synchronized, and finally the template session is synchronized again.
SEE ALSO
Chassis Cluster Overview | 2
Understanding Asymmetric Routing on a Chassis Cluster
IN THIS SECTION
Understanding Failures in the Trust Zone Redundant Ethernet Interface | 431
Understanding Failures in the Untrust Zone Interfaces | 432
You can use SRX Series devices in chassis clusters asymmetric routing scenarios (see Figure 45 on page431). Traffic received by a node is matched against that node’s session table. The result of this lookupdetermines whether or not that the node processes the packet or forwards it to the other node over thefabric link. Sessions are anchored on the egress node for the first packet that created the session. Iftraffic is received on the node in which the session is not anchored, those packets are forwarded overthe fabric link to the node where the session is anchored.
430

The anchor node for the session can change if there are changes in routing during the session.
Figure 45: Asymmetric Routing Chassis Cluster Scenario
In this scenario, two Internet connections are used, with one being preferred. The connection to thetrust zone is done by using a redundant Ethernet interface to provide LAN redundancy for the devices inthe trust zone. This scenario describes two failover cases in which sessions originate in the trust zonewith a destination of the Internet (untrust zone).
Understanding Failures in the Trust Zone Redundant Ethernet Interface
Under normal operating conditions, traffic flows from the trust zone interface ge-0/0/1, belonging toreth0.0, to the Internet. Because the primary Internet connection is on node 0, sessions are created innode 0 and synced to node 1. However, sessions are only active on node 0.
A failure in interface ge-0/0/1 triggers a failover of the redundancy group, causing interface ge-7/0/1 innode 1 to become active. After the failover, traffic arrives at node 1. After session lookup, the traffic issent to node 0 because the session is active on this node. Node 0 then processes the traffic andforwards it to the Internet. The return traffic follows a similar process. The traffic arrives at node 0 andgets processed for security purposes—for example, antispam scanning, antivirus scanning, andapplication of security policies—on node 0 because the session is anchored to node 0. The packet isthen sent to node 1 through the fabric interface for egress processing and eventual transmission out ofnode 1 through interface ge-7/0/1.
431

Understanding Failures in the Untrust Zone Interfaces
In this case, sessions are migrated from node to node. Under normal operating conditions, traffic isprocessed by only node 0. A failure of interface ge-0/0/0 on node 0 causes a change in the routingtable, so that it now points to interface ge-7/0/0 in node 1. After the failure, sessions in node 0 becomeinactive, and the passive sessions in node 1 become active. Traffic arriving from the trust zone is stillreceived on interface ge-0/0/1, but is forwarded to node 1 for processing. After traffic is processed innode 1, it is forwarded to the Internet through interface ge-7/0/0.
In this chassis cluster configuration, redundancy group 1 is used to control the redundant Ethernetinterface connected to the trust zone. As configured in this scenario, redundancy group 1 fails over onlyif interface ge-0/0/1 or ge-7/0/1 fails, but not if the interfaces connected to the Internet fail. Optionally,the configuration could be modified to permit redundancy group 1 to monitor all interfaces connectedto the Internet and fail over if an Internet link were to fail. So, for example, the configuration can allowredundancy group 1 to monitor ge-0/0/0 and make ge-7/0/1 active for reth0 if the ge-0/0/0 Internetlink fails. (This option is not described in the following configuration examples.)
SEE ALSO
Chassis Cluster Overview | 2
Example: Configuring an Asymmetric Chassis Cluster Pair
IN THIS SECTION
Requirements | 433
Overview | 434
Configuration | 437
Verification | 444
This example shows how to configure a chassis cluster to allow asymmetric routing. Configuringasymmetric routing for a chassis cluster allows traffic received on either device to be processedseamlessly.
432

Requirements
Before you begin:
1. Physically connect a pair of devices together, ensuring that they are the same models. This exampleuses a pair of SRX1500 devices.
a. To create the fabric link, connect a Gigabit Ethernet interface on one device to another GigabitEthernet interface on the other device.
b. To create the control link, connect the control port of the two SRX1500 devices.
2. Connect to one of the devices using the console port. (This is the node that forms the cluster.)
a. Set the cluster ID and node number.
user@host> set chassis cluster cluster-id 1 node 0 reboot
3. Connect to the other device using the console port.
a. Set the cluster ID and node number.
user@host> set chassis cluster cluster-id 1 node 1 reboot
433

Overview
In this example, a chassis cluster provides asymmetric routing. As illustrated in Figure 46 on page 434,two Internet connections are used, with one being preferred. The connection to the trust zone isprovided by a redundant Ethernet interface to provide LAN redundancy for the devices in the trust zone.
Figure 46: Asymmetric Routing Chassis Cluster Topology
In this example, you configure group (applying the configuration with the apply-groups command) andchassis cluster information. Then you configure security zones and security policies. See Table 31 onpage 434 through Table 34 on page 437.
Table 31: Group and Chassis Cluster Configuration Parameters
Feature Name Configuration Parameters
Groups node0 • Hostname: srxseries-1
• Interface: fxp0
• Unit 0
• 192.168.100.50/24
434

Table 31: Group and Chassis Cluster Configuration Parameters (Continued)
Feature Name Configuration Parameters
node1 • Hostname: srxseries-2
• Interface: fxp0
• Unit 0
• 192.168.100.51/24
Table 32: Chassis Cluster Configuration Parameters
Feature Name Configuration Parameters
Fabric links fab0 Interface: ge-0/0/7
fab1 Interface: ge-7/0/7
Heartbeat interval – 1000
Heartbeat threshold – 3
Redundancy group 1 • Priority:
• Node 0: 100
• Node 1: 1
Interface monitoring
• ge-0/0/3
• ge-7/0/3
Number of redundant Ethernet interfaces – 1
435

Table 32: Chassis Cluster Configuration Parameters (Continued)
Feature Name Configuration Parameters
Interfaces ge-0/0/1 • Unit 0
• 10.4.0.202/24
ge-7/0/1 • Unit 0
• 10.2.1.233/24
ge-0/0/3 •
Redundant parent: reth0
ge-7/0/3 •
Redundant parent: reth0
reth0 • Unit 0
• 10.16.8.1/24
Table 33: Security Zone Configuration Parameters
Name Configuration Parameters
trust The reth0.0 interface is bound to this zone.
untrust The ge-0/0/1 and ge-7/0/1 interfaces are bound to this zone.
436

Table 34: Security Policy Configuration Parameters
Purpose Name Configuration Parameters
This security policy permits traffic from the trust zone to the untrustzone.
ANY • Match criteria:
• source-address any
• destination-address any
• application any
• Action: permit
Configuration
IN THIS SECTION
Procedure | 437
Procedure
CLI Quick Configuration
To quickly configure this example, copy the following commands, paste them into a text file, remove anyline breaks, change any details necessary to match your network configuration, copy and paste thecommands into the CLI at the [edit] hierarchy level, and then enter commit from configuration mode.
{primary:node0}[edit]set groups node0 system host-name srxseries-1set groups node0 interfaces fxp0 unit 0 family inet address 192.168.100.50/24set groups node1 system host-name srxseries-2set groups node1 interfaces fxp0 unit 0 family inet address 192.168.100.51/24set apply-groups “${node}”set interfaces fab0 fabric-options member-interfaces ge-0/0/7set interfaces fab1 fabric-options member-interfaces ge-7/0/7set chassis cluster reth-count 1set chassis cluster heartbeat-interval 1000
437

set chassis cluster heartbeat-threshold 3set chassis cluster redundancy-group 1 node 0 priority 100set chassis cluster redundancy-group 1 node 1 priority 1set chassis cluster redundancy-group 1 interface-monitor ge-0/0/3 weight 255set chassis cluster redundancy-group 1 interface-monitor ge-7/0/3 weight 255set interfaces ge-0/0/1 unit 0 family inet address 1.4.0.202/24set interfaces ge-0/0/3 gigether-options redundant-parent reth0set interfaces ge-7/0/1 unit 0 family inet address 10.2.1.233/24set interfaces ge-7/0/3 gigether-options redundant-parent reth0set interfaces reth0 unit 0 family inet address 10.16.8.1/24set routing-options static route 0.0.0.0/0 qualified-next-hop 10.4.0.1 metric 10set routing-options static route 0.0.0.0/0 qualified-next-hop 10.2.1.1 metric 100set security zones security-zone untrust interfaces ge-0/0/1.0set security zones security-zone untrust interfaces ge-7/0/1.0set security zones security-zone trust interfaces reth0.0set security policies from-zone trust to-zone untrust policy ANY match source-address anyset security policies from-zone trust to-zone untrust policy ANY match destination-address anyset security policies from-zone trust to-zone untrust policy ANY match application anyset security policies from-zone trust to-zone untrust policy ANY then permit
Step-by-Step Procedure
To configure an asymmetric chassis cluster pair:
1. Configure the management interface.
{primary:node0}[edit]user@host# set groups node0 system host-name srxseries-1user@host# set groups node0 interfaces fxp0 unit 0 family inet address 192.168.100.50/24user@host# set groups node1 system host-name srxseries-2user@host#set groups node1 interfaces fxp0 unit 0 family inet address 192.168.100.51/24user@host# set apply-groups “${node}”
2. Configure the fabric interface.
{primary:node0}[edit]user@host# set interfaces fab0 fabric-options member-interfaces ge-0/0/7user@host# set interfaces fab1 fabric-options member-interfaces ge-7/0/7
438

3. Configure the number of redundant Ethernet interfaces.
{primary:node0}[edit]user@host# set chassis cluster reth-count 1
4. Configure the redundancy groups.
{primary:node0}[edit]user@host# set chassis cluster heartbeat-interval 1000user@host# set chassis cluster heartbeat-threshold 3user@host# set chassis cluster node 0user@host# set chassis cluster node 1user@host# set chassis cluster redundancy-group 1 node 0 priority 100user@host# set chassis cluster redundancy-group 1 node 1 priority 1user@host# set chassis cluster redundancy-group 1 interface-monitor ge-0/0/3 weight 255user@host# set chassis cluster redundancy-group 1 interface-monitor ge-7/0/3 weight 255
5. Configure the redundant Ethernet interfaces.
{primary:node0}[edit]user@host# set interfaces ge-0/0/1 unit 0 family inet address 1.4.0.202/24user@host# set interfaces ge-0/0/3 gigether-options redundant-parent reth0user@host# set interfaces ge-7/0/1 unit 0 family inet address 10.2.1.233/24user@host# set interfaces ge-7/0/3 gigether-options redundant-parent reth0user@host# set interfaces reth0 unit 0 family inet address 10.16.8.1/24
6. Configure the static routes (one to each ISP, with preferred route through ge-0/0/1).
{primary:node0}[edit]user@host# set routing-options static route 0.0.0.0/0 qualified-next-hop 10.4.0.1 metric 10user@host# set routing-options static route 0.0.0.0/0 qualified-next-hop 10.2.1.1 metric 100
7. Configure the security zones.
{primary:node0}[edit]user@host# set security zones security-zone untrust interfaces ge-0/0/1.0
439

user@host# set security zones security-zone untrust interfaces ge-7/0/1.0user@host# set security zones security-zone trust interfaces reth0.0
8. Configure the security policies.
{primary:node0}[edit]user@host# set security policies from-zone trust to-zone untrust policy ANY match source-address anyuser@host# set security policies from-zone trust to-zone untrust policy ANY match destination-address anyuser@host# set security policies from-zone trust to-zone untrust policy ANY match application anyuser@host# set security policies from-zone trust to-zone untrust policy ANY then permit
Results
From operational mode, confirm your configuration by entering the show configuration command. If theoutput does not display the intended configuration, repeat the configuration instructions in this exampleto correct it.
For brevity, this show command output includes only the configuration that is relevant to this example.Any other configuration on the system has been replaced with ellipses (...).
user@host> show configurationversion x.xx.x; groups { node0 { system { host-name srxseries-1; } interfaces { fxp0 { unit 0 { family inet { address 192.168.100.50/24; } } } } } node1 {
440

system { host-name srxseries-2; interfaces { fxp0 { unit 0 { family inet { address 192.168.100.51/24; } } } } } } apply-groups "${node}"; chassis { cluster { reth-count 1; heartbeat-interval 1000; heartbeat-threshold 3; redundancy-group 1 { node 0 priority 100; node 1 priority 1; interface-monitor { ge-0/0/3 weight 255; ge-7/0/3 weight 255; } } } } interfaces { ge-0/0/3 { gigether–options { redundant–parent reth0; } } ge-7/0/3 { gigether–options { redundant–parent reth0; } } ge–0/0/1 { unit 0 { family inet {
441

address 10.4.0.202/24; } } } ge–7/0/1 { unit 0 { family inet { address 10.2.1.233/24; } } } fab0 { fabric–options { member–interfaces { ge–0/0/7; } } } fab1 { fabric–options { member–interfaces { ge–7/0/7; } } } reth0 { gigether–options { redundancy–group 1; } unit 0 { family inet { address 10.16.8.1/24; } } } }...routing-options { static { route 0.0.0.0/0 { next-hop 10.4.0.1; metric 10; }
442

}}routing-options { static { route 0.0.0.0/0 { next-hop 10.2.1.1; metric 100; } }}security { zones { security–zone untrust { interfaces { ge-0/0/1.0; ge-7/0/1.0; } } security–zone trust { interfaces { reth0.0; } } } policies { from-zone trust to-zone untrust { policy ANY { match { source-address any; destination-address any; application any; } then { permit; } } } }}
If you are done configuring the device, enter commit from configuration mode.
443

Verification
IN THIS SECTION
Verifying Chassis Cluster Status | 444
Verifying Chassis Cluster Interfaces | 445
Verifying Chassis Cluster Statistics | 445
Verifying Chassis Cluster Control Plane Statistics | 446
Verifying Chassis Cluster Data Plane Statistics | 447
Verifying Chassis Cluster Redundancy Group Status | 448
Troubleshooting with Logs | 448
Confirm that the configuration is working properly.
Verifying Chassis Cluster Status
Purpose
Verify the chassis cluster status, failover status, and redundancy group information.
Action
From operational mode, enter the show chassis cluster status command.
{primary:node0}user@host> show chassis cluster statusCluster ID: 1Node Priority Status Preempt Manual failover
Redundancy group: 1 , Failover count: 1 node0 100 primary no no node1 1 secondary no no
444

Verifying Chassis Cluster Interfaces
Purpose
Verify information about chassis cluster interfaces.
Action
From operational mode, enter the show chassis cluster interfaces command.
{primary:node0}user@host> show chassis cluster interfacesControl link name: fxp1
Redundant-ethernet Information: Name Status Redundancy-group reth0 Up 1 Interface Monitoring: Interface Weight Status Redundancy-group ge-0/0/3 255 Up 1 ge-7/0/3 255 Up 1
Verifying Chassis Cluster Statistics
Purpose
Verify information about the statistics of the different objects being synchronized, the fabric and controlinterface hellos, and the status of the monitored interfaces in the cluster.
Action
From operational mode, enter the show chassis cluster statistics command.
{primary:node0}user@host> show chassis cluster statistics
Control link statistics: Control link 0:
445

Heartbeat packets sent: 228 Heartbeat packets received: 2370 Heartbeat packets errors: 0Fabric link statistics: Child link 0 Probes sent: 2272 Probes received: 597Services Synchronized: Service name RTOs sent RTOs received Translation context 0 0 Incoming NAT 0 0 Resource manager 6 0 Session create 160 0 Session close 147 0 Session change 0 0 Gate create 0 0 Session ageout refresh requests 0 0 Session ageout refresh replies 0 0 IPSec VPN 0 0 Firewall user authentication 0 0 MGCP ALG 0 0 H323 ALG 0 0 SIP ALG 0 0 SCCP ALG 0 0 PPTP ALG 0 0 RPC ALG 0 0 RTSP ALG 0 0 RAS ALG 0 0 MAC address learning 0 0 GPRS GTP 0 0
Verifying Chassis Cluster Control Plane Statistics
Purpose
Verify information about chassis cluster control plane statistics (heartbeats sent and received) and thefabric link statistics (probes sent and received).
446

Action
From operational mode, enter the show chassis cluster control-plane statistics command.
{primary:node0}user@host> show chassis cluster control-plane statistics
Control link statistics: Control link 0: Heartbeat packets sent: 258689 Heartbeat packets received: 258684 Heartbeat packets errors: 0Fabric link statistics: Child link 0 Probes sent: 258681 Probes received: 258681
Verifying Chassis Cluster Data Plane Statistics
Purpose
Verify information about the number of RTOs sent and received for services.
Action
From operational mode, enter the show chassis cluster data-plane statistics command.
{primary:node0}user@host> show chassis cluster data-plane statistics
Services Synchronized: Service name RTOs sent RTOs received Translation context 0 0 Incoming NAT 0 0 Resource manager 6 0 Session create 160 0 Session close 147 0 Session change 0 0 Gate create 0 0 Session ageout refresh requests 0 0
447

Session ageout refresh replies 0 0 IPSec VPN 0 0 Firewall user authentication 0 0 MGCP ALG 0 0 H323 ALG 0 0 SIP ALG 0 0 SCCP ALG 0 0 PPTP ALG 0 0 RPC ALG 0 0 RTSP ALG 0 0 RAS ALG 0 0 MAC address learning 0 0 GPRS GTP 0 0
Verifying Chassis Cluster Redundancy Group Status
Purpose
Verify the state and priority of both nodes in a cluster and information about whether the primary nodehas been preempted or whether there has been a manual failover.
Action
From operational mode, enter the chassis cluster status redundancy-group command.
{primary:node0}user@host> show chassis cluster status redundancy-group 1Cluster ID: 1 Node Priority Status Preempt Manual failover
Redundancy-Group: 1, Failover count: 1 node0 100 primary no no node1 1 secondary no no
Troubleshooting with Logs
Purpose
Use these logs to identify any chassis cluster issues. You must run these logs on both nodes.
448

Action
From operational mode, enter these show commands.
user@host> show log jsrpduser@host> show log chassisduser@host> show log messagesuser@host> show log dcduser@host> show traceoptions
RELATED DOCUMENTATION
Chassis Cluster Overview | 2
Configuring Chassis Clustering on SRX Series Devices | 121
Ethernet Switching on Chassis Cluster
IN THIS SECTION
Layer 2 Ethernet Switching Capability in a Chassis Cluster Mode | 450
Example: Configuring Switch Fabric Interfaces to Enable Switching in Chassis Cluster Mode on a SecurityDevice | 451
Example: Configure IRB and VLAN with Members Across Two Nodes on a Security Device using Tagged | 455
Example: Configure IRB and VLAN with Members Across Two Nodes on a Security Device using UntaggedTraffic | 465
Example: Configuring VLAN with Members Across Two Nodes on a Security Device | 475
You can configure a chassis cluster to act as a Layer 2 Ethernet switch. For more information, see thefollowing topics:.
449

Layer 2 Ethernet Switching Capability in a Chassis Cluster Mode
IN THIS SECTION
Understanding Layer 2 Ethernet Switching Capability in a Chassis Cluster on SRX Series Devices | 450
Understanding Chassis Cluster Failover and New Primary Election | 450
Benefits of Ethernet Switching on Chassis Cluster | 451
Understanding Layer 2 Ethernet Switching Capability in a Chassis Cluster on SRXSeries Devices
Ethernet ports support various Layer 2 features such as spanning-tree protocols (STPs), IEEE 802.1x,Link Layer Discovery Protocol (LLDP), and Multiple VLAN Registration Protocol (MVRP). With theextension of Layer 2 switching capability to devices in a chassis cluster, you can use Ethernet switchingfeatures on both nodes of a chassis cluster.
To ensure that Layer 2 switching works seamlessly across chassis cluster nodes, a dedicated physical linkconnecting the nodes is required. This type of link is called a switching fabric interface. Its purpose is tocarry Layer 2 traffic between nodes.
• Configuring a LAG with family ethernet-switching is not supported.
• Configuring a Reth with family ethernet-switching is not supported. This is only supported inTransparent mode.
• If a switching fabric interface (swfab) is not configured on both nodes, and if you try to configureEthernet switching related features on the nodes, then the behavior of the nodes might beunpredictable.
Understanding Chassis Cluster Failover and New Primary Election
When chassis cluster failover occurs, a new primary node is elected and the Ethernet switching process(eswd) runs in a different node. During failover, the chassis control subsystem is restarted. Also duringfailover, traffic outage occurs until the PICs are up and the VLAN entries are reprogrammed. Afterfailover, all Layer 2 protocols reconverge because Layer 2 protocol states are not maintained in thesecondary node.
The Q-in-Q feature in chassis cluster mode is not supported because of chip limitation for swfabinterface configuration in Broadcom chipsets.
450

Benefits of Ethernet Switching on Chassis Cluster
• Enables Ethernet switching functionality on both nodes of a chassis cluster and provides the optionto configure the Ethernet ports on either node for family Ethernet switching.
• Enables configuring a Layer 2 VLAN domain with member ports from both nodes and the Layer 2switching protocols on both devices.
SEE ALSO
Ethernet Switching and Layer 2 Transparent Mode Overview
Understanding Mixed Mode (Transparent and Route Mode) on Security Devices
Example: Configuring Switch Fabric Interfaces to Enable Switching inChassis Cluster Mode on a Security Device
IN THIS SECTION
Requirements | 451
Overview | 452
Configuration | 452
This example shows how to configure switching fabric interfaces to enable switching in chassis clustermode.
Requirements
• The physical link used as the switch fabric member must be directly connected to the device.
• Switching fabric interfaces must be configured on ports that support switching features. See EthernetPorts Switching Overview for Security Devices for information about the ports on which switchingfeatures are supported.
The physical link used as the switch fabric member must be directly connected to the device. Switchingsupported ports must be used for switching fabric interfaces. See Ethernet Ports Switching Overview forSecurity Devices for switching supported ports.
451

Before you begin, See "Example: Configuring the Chassis Cluster Fabric Interfaces" on page 62.
Overview
In this example, pseudointerfaces swfab0 and swfab1 are created for Layer 2 fabric functionality. Youalso configure dedicated Ethernet ports on each node to be associated with the swfab interfaces.
Configuration
IN THIS SECTION
Verification | 453
Procedure
CLI Quick Configuration
To quickly configure this section of the example, copy the following commands, paste them into a textfile, remove any line breaks, change any details necessary to match your network configuration, copyand paste the commands into the CLI at the [edit] hierarchy level, and then enter commit fromconfiguration mode.
set interfaces swfab0 fabric-options member-interfaces ge-0/0/3set interfaces swfab1 fabric-options member-interfaces ge-9/0/3
Step-by-Step Procedure
To configure swfab interfaces:
1. Configure swfab0 and swfab1 and associate these switch fabric interfaces to enable switching acrossthe nodes. Note that swfab0 corresponds to node 0 and swfab1 corresponds to node 1.
{primary:node0} [edit]user@host# set interfaces swfab0 fabric-options member-interfaces ge-0/0/3user@host# set interfaces swfab1 fabric-options member-interfaces ge-9/0/3
452

2. If you are done configuring the device, commit the configuration.
{primary:node0} [edit]user@host# commit
Results
From configuration mode, confirm your configuration by entering the show interfaces swfab0 command. Ifthe output does not display the intended configuration, repeat the configuration instructions in thisexample to correct the configuration.
[edit]user@host# show interfaces swfab0fabric-options{ member-interfaces { ge-0/0/3; } }
Verification
IN THIS SECTION
Verifying Switching Fabric Ports | 453
To confirm that the configuration is working properly, perform these tasks:
Verifying Switching Fabric Ports
Purpose
Verify that you are able to configure multiple ports as members of switching fabric ports.
453

Action
From configuration mode, enter the show interfaces swfab0 command to view the configured interfacesfor each port.
user@host# show interfaces swfab0fabric-options{ member-interfaces { ge-0/0/3;}}
From operational mode, enter the show chassis cluster ethernet-switching interfaces command to view theappropriate member interfaces.
user@host> show chassis cluster ethernet-switching interfacesswfab0:
Name Status ge-0/0/3 up swfab1:
Name Status ge-9/0/3 up
SEE ALSO
SRX Series Chassis Cluster Configuration Overview | 13
454

Example: Configure IRB and VLAN with Members Across Two Nodes on aSecurity Device using Tagged
IN THIS SECTION
Requirements | 455
Overview | 455
Configuration | 456
NOTE: Our content testing team has validated and updated this example.
Requirements
This example uses the following hardware and software components:
• configure a switching fabric interface on both nodes to configure Ethernet switching-related featureson the nodes. See "Example: Configuring Switch Fabric Interfaces to Enable Switching in ChassisCluster Mode on a Security Device" on page 451
• SRX550 security device
• interface-mode is supported in 15.1X49 release.
• port-mode is supported in 12.1 and 12.3X48 releases.
Overview
IN THIS SECTION
Topology | 456
This example shows the configuration of a VLAN with members across node 0 and node 1.
455

Topology
Figure 47 on page 456 shows the Layer 2 Ethernet switching across chassis cluster nodes using taggedtraffic.
Figure 47: Layer 2 Ethernet Switching Across Chassis Cluster using Tagged Traffic
Configuration
IN THIS SECTION
Verification | 461
Procedure
CLI Quick Configuration
To quickly configure this section of the example, copy the following commands, paste them into a textfile, remove any line breaks, change any details necessary to match your network configuration, copyand paste the commands into the CLI at the [edit] hierarchy level, and then enter commit fromconfiguration mode.
set security zones security-zone trust host-inbound-traffic system-services allset security zones security-zone trust interfaces irb.100set security zones security-zone trust interfaces irb.200set interfaces ge-0/0/4 unit 0 family ethernet-switching interface-mode trunk
456

set interfaces ge-0/0/4 unit 0 family ethernet-switching vlan members v100set interfaces ge-0/0/5 unit 0 family ethernet-switching interface-mode trunkset interfaces ge-0/0/5 unit 0 family ethernet-switching vlan members v200set interfaces ge-9/0/4 unit 0 family ethernet-switching interface-mode trunkset interfaces ge-9/0/4 unit 0 family ethernet-switching vlan members v100set interfaces ge-9/0/5 unit 0 family ethernet-switching interface-mode trunkset interfaces ge-9/0/5 unit 0 family ethernet-switching vlan members v200set interfaces fab0 fabric-options member-interfaces ge-0/0/2set interfaces fab1 fabric-options member-interfaces ge-9/0/2set interfaces irb unit 100 family inet address 10.1.100.254/24set interfaces irb unit 200 family inet address 10.1.200.254/24set interfaces swfab0 fabric-options member-interfaces ge-0/0/3set interfaces swfab1 fabric-options member-interfaces ge-9/0/3set vlans v100 vlan-id 100set vlans v100 l3-interface irb.100set vlans v200 vlan-id 200set vlans v200 l3-interface irb.200
Step-by-Step Procedure
To configure IRB and a VLAN:
1. Configure security zones.
{primary:node0} [edit security zones]user@host# set security-zone trust host-inbound-traffic system-services alluser@host# set security-zone trust interfaces irb.100user@host# set security-zone trust interfaces irb.200
2. Configure Ethernet switching on the node0 interfaces.
{primary:node0} [edit interfaces]user@host# set ge-0/0/4 unit 0 family ethernet-switching interface-mode trunkuser@host# set ge-0/0/4 unit 0 family ethernet-switching vlan members v100user@host# set ge-0/0/5 unit 0 family ethernet-switching interface-mode trunkuser@host# set ge-0/0/5 unit 0 family ethernet-switching vlan members v200user@host# set ge-9/0/4 unit 0 family ethernet-switching interface-mode trunkuser@host# set ge-9/0/4 unit 0 family ethernet-switching vlan members v100user@host# set ge-9/0/5 unit 0 family ethernet-switching interface-mode trunkuser@host# set ge-9/0/5 unit 0 family ethernet-switching vlan members v200
457

3. Define the interfaces used for the fab connection (data plane links for RTOsync) by using physicalports from each node. These interfaces must be connected back-to-back, or through a Layer 2infrastructure.
{primary:node0} [edit interfaces]user@host# set fab0 fabric-options member-interfaces ge-0/0/2user@host# set fab1 fabric-options member-interfaces ge-9/0/2
4. configure a switching fabric interface on both nodes to configure Ethernet switching-related featureson the nodes.
{primary:node0} [edit interfaces]user@host# set swfab0 fabric-options member-interfaces ge-0/0/3user@host# set swfab1 fabric-options member-interfaces ge-9/0/3
5. Configure the irb interface.
{primary:node0} [edit interfaces]user@host# set irb unit 100 family inet address 10.1.100.254/24user@host# set irb unit 200 family inet address 10.1.200.254/24
6. Create and associate a VLAN interface with the VLAN.
{primary:node0} [edit vlans]user@host# set v100 vlan-id 100user@host# set v100 l3-interface irb.100user@host# set v200 vlan-id 200user@host# set v200 l3-interface irb.200
7. If you are done configuring the device, commit the configuration.
[edit]user@host# commit
458

Results
From configuration mode, confirm your configuration by entering the show security, show interfaces, andshow vlans commands. If the output does not display the intended configuration, repeat the configurationinstructions in this example to correct the configuration.
[edit]user@host# show security zones { security-zone trust { host-inbound-traffic { system-services { all; } } interfaces { irb.100; irb.200; } }}
[edit]user@host# show interfacesge-0/0/4 { unit 0 { family ethernet-switching { interface-mode trunk; vlan { members v100; } } }}ge-0/0/5 { unit 0 { family ethernet-switching { interface-mode trunk; vlan { members v200; }
459
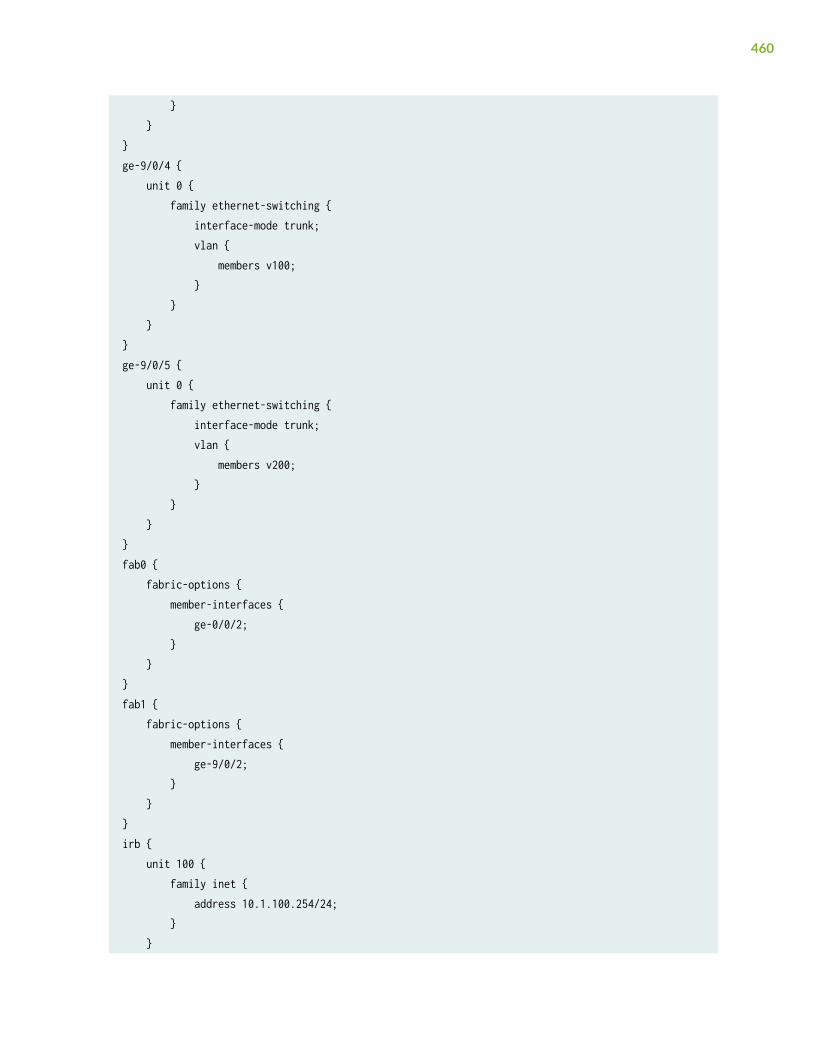
} }}ge-9/0/4 { unit 0 { family ethernet-switching { interface-mode trunk; vlan { members v100; } } }}ge-9/0/5 { unit 0 { family ethernet-switching { interface-mode trunk; vlan { members v200; } } }}fab0 { fabric-options { member-interfaces { ge-0/0/2; } }}fab1 { fabric-options { member-interfaces { ge-9/0/2; } }}irb { unit 100 { family inet { address 10.1.100.254/24; } }
460

unit 200 { family inet { address 10.1.200.254/24; } }}swfab0 { fabric-options { member-interfaces { ge-0/0/3; } }}swfab1 { fabric-options { member-interfaces { ge-9/0/3; } }}
[edit]user@host# show vlansv100 { vlan-id 100; l3-interface irb.100;}v200 { vlan-id 200; l3-interface irb.200;}
Verification
IN THIS SECTION
Verifying Tagged VLAN With IRB | 462
461

Verifying Tagged VLAN With IRB
Purpose
Verify that the configuration for tagged VLAN with IRB is working properly.
Action
From operational mode, enter the show chassis cluster interfaces command.
user@host> show chassis cluster interfacesControl link status: Up
Control interfaces: Index Interface Monitored-Status Internal-SA Security 0 fxp1 Up Disabled Disabled
Fabric link status: Up
Fabric interfaces: Name Child-interface Status Security (Physical/Monitored) fab0 ge-0/0/2 Up / Up Enabled fab0 fab1 ge-9/0/2 Up / Up Enabled fab1 Redundant-pseudo-interface Information: Name Status Redundancy-group lo0 Up 0
From operational mode, enter the show ethernet-switching table command.
user@host> show ethernet-switching tableMAC flags (S - static MAC, D - dynamic MAC, L - locally learned, P - Persistent static, C - Control MAC SE - statistics enabled, NM - non configured MAC, R - remote PE MAC, O - ovsdb MAC)
Ethernet switching table : 4 entries, 4 learnedRouting instance : default-switch
462

Vlan MAC MAC Age Logical NH RTR name address flags interface Index ID v100 08:81:f4:8a:eb:52 D - ge-9/0/4.0 0 0 v100 08:81:f4:8a:eb:54 D - ge-0/0/4.0 0 0 v200 08:81:f4:8a:eb:53 D - ge-9/0/5.0 0 0 v200 08:81:f4:8a:eb:55 D - ge-0/0/5.0 0 0
From operational mode, enter the show arp command.
user@host> show arpMAC Address Address Name Interface Flags08:81:f4:8a:eb:54 10.1.100.1 10.1.100.1 irb.100 none08:81:f4:8a:eb:52 10.1.100.2 10.1.100.2 irb.100 none08:81:f4:8a:eb:55 10.1.200.1 10.1.200.1 irb.200 none08:81:f4:8a:eb:53 10.1.200.2 10.1.200.2 irb.200 noneec:3e:f7:c6:81:b0 30.17.0.2 30.17.0.2 fab0.0 permanentf0:4b:3a:09:cb:30 30.18.0.1 30.18.0.1 fab1.0 permanentec:3e:f7:c6:80:81 130.16.0.1 130.16.0.1 fxp1.0 noneTotal entries: 7
From operational mode, enter the show ethernet-switching interface command to view the informationabout Ethernet switching interfaces.
user@host> show ethernet-switching interfaceRouting Instance Name : default-switchLogical Interface flags (DL - disable learning, AD - packet action drop, LH - MAC limit hit, DN - interface down, MMAS - Mac-move action shutdown, AS - Autostate-exclude enabled, SCTL - shutdown by Storm-control, MI - MAC+IP limit hit)
Logical Vlan TAG MAC MAC+IP STP Logical Tagginginterface members limit limit state interface flagsge-0/0/5.0 16383 8192 tagged v200 200 1024 1024 Forwarding tagged Routing Instance Name : default-switchLogical Interface flags (DL - disable learning, AD - packet action drop,
463

LH - MAC limit hit, DN - interface down, MMAS - Mac-move action shutdown, AS - Autostate-exclude enabled, SCTL - shutdown by Storm-control, MI - MAC+IP limit hit) Logical Vlan TAG MAC MAC+IP STP Logical Tagginginterface members limit limit state interface flagsge-0/0/4.0 16383 8192 tagged v100 100 1024 1024 Forwarding tagged Routing Instance Name : default-switchLogical Interface flags (DL - disable learning, AD - packet action drop, LH - MAC limit hit, DN - interface down, MMAS - Mac-move action shutdown, AS - Autostate-exclude enabled, SCTL - shutdown by Storm-control, MI - MAC+IP limit hit)
Logical Vlan TAG MAC MAC+IP STP Logical Tagginginterface members limit limit state interface flagsge-9/0/4.0 16383 8192 tagged v100 100 1024 1024 Forwarding tagged Routing Instance Name : default-switchLogical Interface flags (DL - disable learning, AD - packet action drop, LH - MAC limit hit, DN - interface down, MMAS - Mac-move action shutdown, AS - Autostate-exclude enabled, SCTL - shutdown by Storm-control, MI - MAC+IP limit hit)
Logical Vlan TAG MAC MAC+IP STP Logical Tagginginterface members limit limit state interface flagsge-9/0/5.0 16383 8192 tagged v200 200 1024 1024 Forwarding tagged
Meaning
The output shows the VLANs are configured and working fine.
464

Example: Configure IRB and VLAN with Members Across Two Nodes on aSecurity Device using Untagged Traffic
IN THIS SECTION
Requirements | 465
Overview | 465
Configuration | 466
NOTE: Our content testing team has validated and updated this example.
Requirements
This example uses the following hardware and software components:
• configure a switching fabric interface on both nodes to configure Ethernet switching-related featureson the nodes. See "Example: Configuring Switch Fabric Interfaces to Enable Switching in ChassisCluster Mode on a Security Device" on page 451
• SRX550 security device
• interface-mode is supported in 15.1X49 release.
• port-mode is supported in 12.1 and 12.3X48 releases.
Overview
IN THIS SECTION
Topology | 466
This example shows the configuration of a VLAN with members across node 0 and node 1.
465

Topology
Figure 48 on page 466 shows the Layer 2 Ethernet switching across chassis cluster nodes usinguntagged traffic.
Figure 48: Layer2 Ethernet Switching Across Chassis Cluster Nodes using Untagged Traffic
Configuration
IN THIS SECTION
Verification | 471
Procedure
CLI Quick Configuration
To quickly configure this section of the example, copy the following commands, paste them into a textfile, remove any line breaks, change any details necessary to match your network configuration, copyand paste the commands into the CLI at the [edit] hierarchy level, and then enter commit fromconfiguration mode.
set security zones security-zone trust host-inbound-traffic system-services allset security zones security-zone trust interfaces irb.100set security zones security-zone trust interfaces irb.200set interfaces ge-0/0/4 unit 0 family ethernet-switching interface-mode access
466
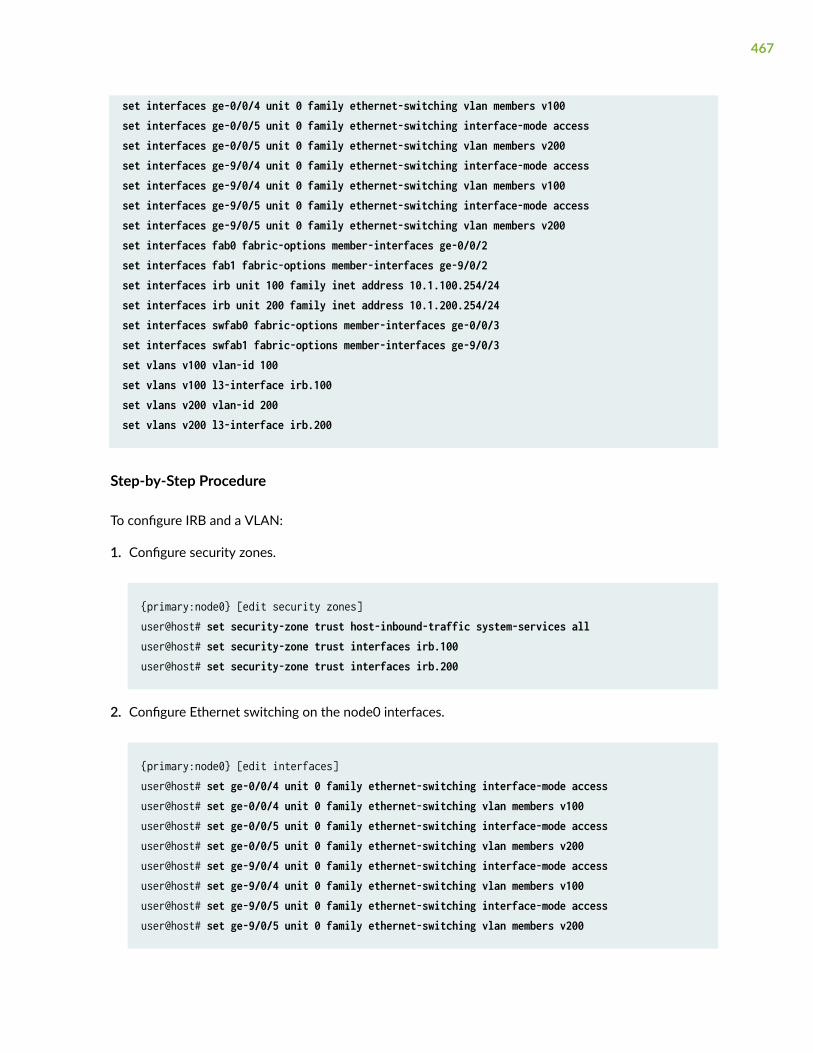
set interfaces ge-0/0/4 unit 0 family ethernet-switching vlan members v100set interfaces ge-0/0/5 unit 0 family ethernet-switching interface-mode accessset interfaces ge-0/0/5 unit 0 family ethernet-switching vlan members v200set interfaces ge-9/0/4 unit 0 family ethernet-switching interface-mode accessset interfaces ge-9/0/4 unit 0 family ethernet-switching vlan members v100set interfaces ge-9/0/5 unit 0 family ethernet-switching interface-mode accessset interfaces ge-9/0/5 unit 0 family ethernet-switching vlan members v200set interfaces fab0 fabric-options member-interfaces ge-0/0/2set interfaces fab1 fabric-options member-interfaces ge-9/0/2set interfaces irb unit 100 family inet address 10.1.100.254/24set interfaces irb unit 200 family inet address 10.1.200.254/24set interfaces swfab0 fabric-options member-interfaces ge-0/0/3set interfaces swfab1 fabric-options member-interfaces ge-9/0/3set vlans v100 vlan-id 100set vlans v100 l3-interface irb.100set vlans v200 vlan-id 200set vlans v200 l3-interface irb.200
Step-by-Step Procedure
To configure IRB and a VLAN:
1. Configure security zones.
{primary:node0} [edit security zones]user@host# set security-zone trust host-inbound-traffic system-services alluser@host# set security-zone trust interfaces irb.100user@host# set security-zone trust interfaces irb.200
2. Configure Ethernet switching on the node0 interfaces.
{primary:node0} [edit interfaces]user@host# set ge-0/0/4 unit 0 family ethernet-switching interface-mode accessuser@host# set ge-0/0/4 unit 0 family ethernet-switching vlan members v100user@host# set ge-0/0/5 unit 0 family ethernet-switching interface-mode accessuser@host# set ge-0/0/5 unit 0 family ethernet-switching vlan members v200user@host# set ge-9/0/4 unit 0 family ethernet-switching interface-mode accessuser@host# set ge-9/0/4 unit 0 family ethernet-switching vlan members v100user@host# set ge-9/0/5 unit 0 family ethernet-switching interface-mode accessuser@host# set ge-9/0/5 unit 0 family ethernet-switching vlan members v200
467

3. Define the interfaces used for the fab connections (data plane links for RTOsync) by using physicalports from each node. These interfaces must be connected back-to-back, or through a Layer 2infrastructure.
{primary:node0} [edit interfaces]user@host# set fab0 fabric-options member-interfaces ge-0/0/2user@host# set fab1 fabric-options member-interfaces ge-9/0/2
4. configure a switching fabric interface on both nodes to configure Ethernet switching-related featureson the nodes.
{primary:node0} [edit interfaces]user@host# set swfab0 fabric-options member-interfaces ge-0/0/3user@host# set swfab1 fabric-options member-interfaces ge-9/0/3
5. Configure the irb interface.
{primary:node0} [edit interfaces]user@host# set irb unit 100 family inet address 10.1.100.254/24user@host# set irb unit 200 family inet address 10.1.200.254/24
6. Create and associate a VLAN interface with the VLAN.
{primary:node0} [edit vlans]user@host# set v100 vlan-id 100user@host# set v100 l3-interface irb.100user@host# set v200 vlan-id 200user@host# set v200 l3-interface irb.200
7. If you are done configuring the device, commit the configuration.
[edit]user@host# commit
468

Results
From configuration mode, confirm your configuration by entering the show security, show interfaces, andshow vlans commands. If the output does not display the intended configuration, repeat the configurationinstructions in this example to correct the configuration.
[edit]user@host# show security zones { security-zone trust { host-inbound-traffic { system-services { all; } } interfaces { irb.100; irb.200; } }}
[edit]user@host# show interfacesge-0/0/4 { unit 0 { family ethernet-switching { interface-mode access; vlan { members v100; } } }}ge-0/0/5 { unit 0 { family ethernet-switching { interface-mode access; vlan { members v200; }
469

} }}ge-9/0/4 { unit 0 { family ethernet-switching { interface-mode access; vlan { members v100; } } }}ge-9/0/5 { unit 0 { family ethernet-switching { interface-mode access; vlan { members v200; } } }}fab0 { fabric-options { member-interfaces { ge-0/0/2; } }}fab1 { fabric-options { member-interfaces { ge-9/0/2; } }}irb { unit 100 { family inet { address 10.1.100.254/24; } }
470

unit 200 { family inet { address 10.1.200.254/24; } }}swfab0 { fabric-options { member-interfaces { ge-0/0/3; } }}swfab1 { fabric-options { member-interfaces { ge-9/0/3; } }}
[edit]user@host# show vlansv100 { vlan-id 100; l3-interface irb.100;}v200 { vlan-id 200; l3-interface irb.200;}
Verification
IN THIS SECTION
Verifying Untagged VLAN With IRB | 472
471

Verifying Untagged VLAN With IRB
Purpose
Verify that the configuration of untagged VLAN with IRB is working properly.
Action
From operational mode, enter the show chassis cluster interfaces command.
user@host> show chassis cluster interfacesControl link status: Up
Control interfaces: Index Interface Monitored-Status Internal-SA Security 0 fxp1 Up Disabled Disabled
Fabric link status: Up
Fabric interfaces: Name Child-interface Status Security (Physical/Monitored) fab0 ge-0/0/2 Up / Up Enabled fab0 fab1 ge-9/0/2 Up / Up Enabled fab1 Redundant-pseudo-interface Information: Name Status Redundancy-group lo0 Up 0
From operational mode, enter the show ethernet-switching table command.
user@host> show ethernet-switching tableMAC flags (S - static MAC, D - dynamic MAC, L - locally learned, P - Persistent static, C - Control MAC SE - statistics enabled, NM - non configured MAC, R - remote PE MAC, O - ovsdb MAC)
Ethernet switching table : 4 entries, 4 learnedRouting instance : default-switch
472

Vlan MAC MAC Age Logical NH RTR name address flags interface Index ID v100 08:81:f4:8a:eb:52 D - ge-9/0/4.0 0 0 v100 08:81:f4:8a:eb:54 D - ge-0/0/4.0 0 0 v200 08:81:f4:8a:eb:53 D - ge-9/0/5.0 0 0 v200 08:81:f4:8a:eb:55 D - ge-0/0/5.0 0 0
From operational mode, enter the show arp command.
user@host> show arpMAC Address Address Name Interface Flags08:81:f4:8a:eb:54 10.1.100.1 10.1.100.1 irb.100 none08:81:f4:8a:eb:52 10.1.100.2 10.1.100.2 irb.100 none08:81:f4:8a:eb:55 10.1.200.1 10.1.200.1 irb.200 none08:81:f4:8a:eb:53 10.1.200.2 10.1.200.2 irb.200 noneec:3e:f7:c6:81:b0 30.17.0.2 30.17.0.2 fab0.0 permanentf0:4b:3a:09:cb:30 30.18.0.1 30.18.0.1 fab1.0 permanentec:3e:f7:c6:80:81 130.16.0.1 130.16.0.1 fxp1.0 noneTotal entries: 7
From operational mode, enter the show ethernet-switching interface command to view the informationabout Ethernet switching interfaces.
user@host> show ethernet-switching interfaceRouting Instance Name : default-switchLogical Interface flags (DL - disable learning, AD - packet action drop, LH - MAC limit hit, DN - interface down, MMAS - Mac-move action shutdown, AS - Autostate-exclude enabled, SCTL - shutdown by Storm-control, MI - MAC+IP limit hit)
Logical Vlan TAG MAC MAC+IP STP Logical Tagginginterface members limit limit state interface flagsge-0/0/5.0 16383 8192 untagged v200 200 1024 1024 Forwarding untagged Routing Instance Name : default-switchLogical Interface flags (DL - disable learning, AD - packet action drop,
473
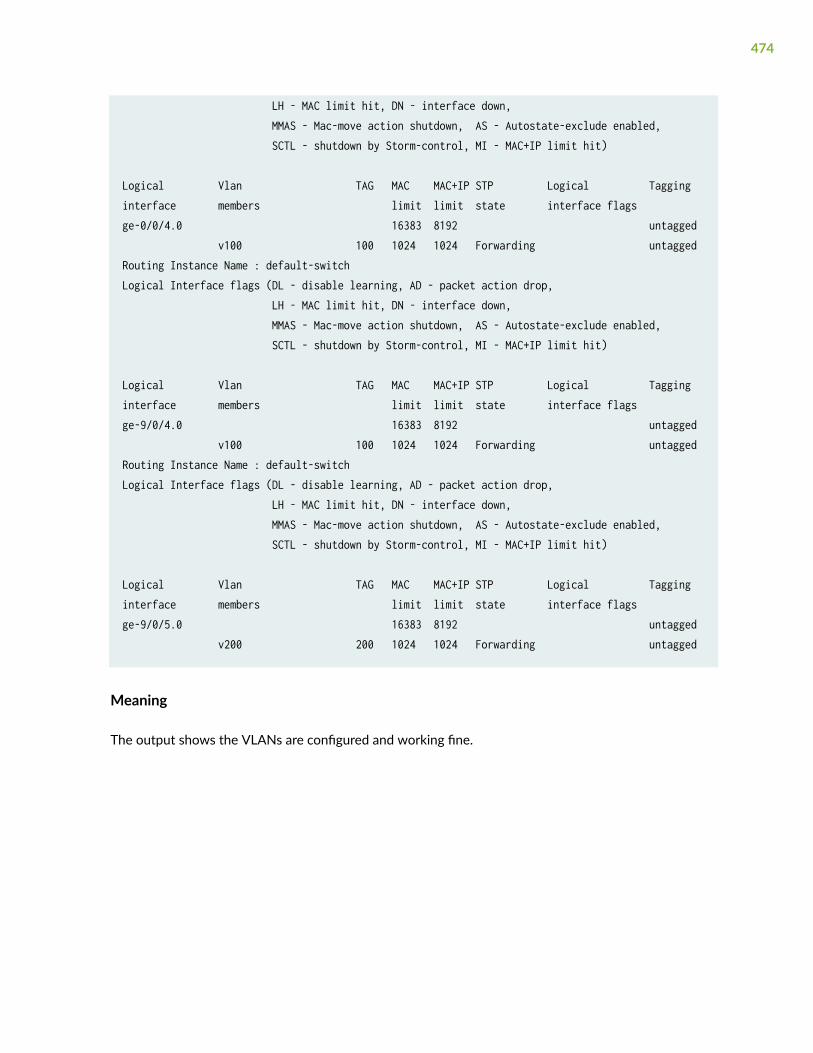
LH - MAC limit hit, DN - interface down, MMAS - Mac-move action shutdown, AS - Autostate-exclude enabled, SCTL - shutdown by Storm-control, MI - MAC+IP limit hit) Logical Vlan TAG MAC MAC+IP STP Logical Tagginginterface members limit limit state interface flagsge-0/0/4.0 16383 8192 untagged v100 100 1024 1024 Forwarding untagged Routing Instance Name : default-switchLogical Interface flags (DL - disable learning, AD - packet action drop, LH - MAC limit hit, DN - interface down, MMAS - Mac-move action shutdown, AS - Autostate-exclude enabled, SCTL - shutdown by Storm-control, MI - MAC+IP limit hit)
Logical Vlan TAG MAC MAC+IP STP Logical Tagginginterface members limit limit state interface flagsge-9/0/4.0 16383 8192 untagged v100 100 1024 1024 Forwarding untagged Routing Instance Name : default-switchLogical Interface flags (DL - disable learning, AD - packet action drop, LH - MAC limit hit, DN - interface down, MMAS - Mac-move action shutdown, AS - Autostate-exclude enabled, SCTL - shutdown by Storm-control, MI - MAC+IP limit hit)
Logical Vlan TAG MAC MAC+IP STP Logical Tagginginterface members limit limit state interface flagsge-9/0/5.0 16383 8192 untagged v200 200 1024 1024 Forwarding untagged
Meaning
The output shows the VLANs are configured and working fine.
474

Example: Configuring VLAN with Members Across Two Nodes on aSecurity Device
IN THIS SECTION
Requirements | 475
Overview | 475
Configuration | 475
Verification | 478
Requirements
This example uses the following hardware and software components:
• configure a switching fabric interface on both nodes to configure Ethernet switching-related featureson the nodes. See "Example: Configuring Switch Fabric Interfaces to Enable Switching in ChassisCluster Mode on a Security Device" on page 451
• SRX240 security device
• Junos OS 12.3X48-D90
• interface-mode is supported in 15.1X49 release.
• port-mode is supported in 12.1 and 12.3X48 releases.
Overview
This example shows the configuration of a VLAN with members across node 0 and node 1.
Configuration
IN THIS SECTION
Procedure | 476
475

Procedure
CLI Quick Configuration
To quickly configure this section of the example, copy the following commands, paste them into a textfile, remove any line breaks, change any details necessary to match your network configuration, copyand paste the commands into the CLI at the [edit] hierarchy level, and then enter commit fromconfiguration mode.
set interfaces ge-0/0/3 unit 0 family ethernet-switching port-mode accessset interfaces ge-0/0/3 unit 0 family ethernet-switching vlan members vlan100 set interfaces ge0/0/4 unit 0 family ethernrt-switching port-mode accessset interfaces ge-0/0/4 unit 0 family ethernet-switching vlan members vlan100set interfaces ge-7/0/5 unit 0 family ethernet-switching port-mode trunkset interfaces ge-7/0/5 unit 0 family ethernet-switching vlan members vlan100set interfaces vlan unit 100 family inet address 11.1.1.1/24set vlans vlan100 vlan-id 100set vlans vlan100 l3-interface vlan.100
Step-by-Step Procedure
To configure VLAN:
1. Configure Ethernet switching on the node0 interface.
{primary:node0} [edit]user@host# set interfaces ge-0/0/3 unit 0 family ethernet-switching port-mode accessuser@host# set interfaces ge0/0/4 unit 0 family ethernet-switching port-mode access
2. Configure Ethernet switching on the node1 interface.
{primary:node0} [edit]user@host# set interfaces ge-7/0/5 unit 0 family ethernet-switching port-mode trunk
3. Create VLAN vlan100 with vlan-id 100.
{primary:node0} [edit]user@host# set vlans vlan100 vlan-id 100
476

4. Add interfaces from both nodes to the VLAN.
{primary:node0} [edit]user@host# set interfaces ge-0/0/3 unit 0 family ethernet-switching vlan members vlan100user@host# set interfaces ge-0/0/4 unit 0 family ethernet-switching vlan members vlan100user@host# set interfaces ge-7/0/5 unit 0 family ethernet-switching vlan members vlan100
5. Create a VLAN interface.
user@host# set interfaces vlan unit 100 family inet address 11.1.1.1/24
6. Associate an VLAN interface with the VLAN.
user@host# set vlans vlan100 l3-interface vlan.100
7. If you are done configuring the device, commit the configuration.
[edit]user@host# commit
Results
From configuration mode, confirm your configuration by entering the show vlans and show interfacescommands. If the output does not display the intended configuration, repeat the configurationinstructions in this example to correct the configuration.
[edit]user@host# show vlans vlan100 { vlan-id 100; l3-interface vlan.100; } [edit]user@host# show interfaces ge-0/0/3 { unit 0 { family ethernet-switching { port-mode access;
477

vlan { members vlan100; } } }}ge-0/0/4 { unit 0 { family ethernet-switching { port-mode access; vlan { members vlan100; } } }}ge-7/0/5 { unit 0 { family ethernet-switching { port-mode trunk; vlan { members vlan100; } } }}
Verification
IN THIS SECTION
Verifying VLAN | 478
Verifying VLAN
Purpose
Verify that the configuration of VLAN is working properly.
478

Action
From operational mode, enter the show interfaces terse ge-0/0/3 command to view the node 0 interface.
user@host> show interfaces terse ge-0/0/3Interface Admin Link Proto Local Remotege-0/0/3 up upge-0/0/3.0 up up eth-switch
From operational mode, enter the show interfaces terse ge-0/0/4 command to view the node 0 interface.
user@host> show interfaces terse ge-0/0/4Interface Admin Link Proto Local Remotege-0/0/4 up upge-0/0/4.0 up up eth-switch
From operational mode, enter the show interfaces terse ge-7/0/5 command to view the node1 interface.
user@host> show interfaces terse ge-7/0/5Interface Admin Link Proto Local Remotege-7/0/5 up upge-7/0/5.0 up up eth-switch
From operational mode, enter the show vlans command to view the VLAN interface.
user@host> show vlansRouting instance VLAN name Tag Interfacesdefault-switch default 1 default-switch vlan100 100 ge-0/0/3.0* ge-0/0/4.0* ge-7/0/5.0*
From operational mode, enter the show ethernet-switching interface command to view the informationabout Ethernet switching interfaces.
Routing Instance Name : default-switchLogical Interface flags (DL - disable learning, AD - packet action drop, LH - MAC limit hit, DN - interface down, MMAS - Mac-move action shutdown, AS - Autostate-exclude enabled,
479

SCTL - shutdown by Storm-control )
Logical Vlan TAG MAC STP Logical Tagginginterface members limit state interface flagsge-0/0/3.0 16383 DN untagged vlan100 100 1024 Discarding untaggedge-0/0/4.0 16383 DN untagged vlan100 100 1024 Discarding untaggedge-7/0/5.0 16383 DN tagged vlan100 100 1024 Discarding tagged
Meaning
The output shows the VLANs are configured and working fine.
SEE ALSO
Example: Configuring an IRB Interface
RELATED DOCUMENTATION
Configuring Chassis Clustering on SRX Series Devices | 121
Media Access Control Security (MACsec) on ChassisCluster
IN THIS SECTION
Understanding Media Access Control Security (MACsec) | 481
Configuring Media Access Control Security (MACsec) | 484
480

Media Access Control Security (MACsec) is an industry-standard security technology that providessecure communication for all traffic on Ethernet links. for more information, see the following topics:
Understanding Media Access Control Security (MACsec)
IN THIS SECTION
How MACsec Works | 481
Understanding Connectivity Associations and Secure Channels | 482
Understanding Static Connectivity Association Key Security Mode | 482
MACsec Considerations | 483
Media Access Control Security (MACsec) is an industry-standard security technology that providessecure communication for all traffic on Ethernet links. MACsec provides point-to-point security onEthernet links between directly connected nodes and is capable of identifying and preventing mostsecurity threats, including denial of service, intrusion, man-in-the-middle, masquerading, passivewiretapping, and playback attacks.
MACsec allows you to secure an Ethernet link for almost all traffic, including frames from the Link LayerDiscovery Protocol (LLDP), Link Aggregation Control Protocol (LACP), Dynamic Host ConfigurationProtocol (DHCP), Address Resolution Protocol (ARP), and other protocols that are not typically securedon an Ethernet link because of limitations with other security solutions. MACsec can be used incombination with other security protocols such as IP Security (IPsec) and Secure Sockets Layer (SSL) toprovide end-to-end network security.
Starting in Junos OS Release 15.1X49-D60, Media Access Control Security(MACsec) is supported oncontrol and fabric ports of SRX340 and SRX345 devices in chassis cluster mode.
Starting in Junos OS Release 17.4R1, MACsec is supported on HA control and fabric ports of SRX4600devices in chassis cluster mode..
This topic contains the following sections:
How MACsec Works
To determine if a feature is supported by a specific platform or Junos OS release, refer Feature Explorer.
481

MACsec provides industry-standard security through the use of secured point-to-point Ethernet links.The point-to-point links are secured after matching security keys. When you enable MACsec using staticconnectivity association key (CAK) security mode, user-configured pre-shared keys are exchanged andverified between the interfaces at each end of the point-to-point Ethernet link.
Once MACsec is enabled on a point-to-point Ethernet link, all traffic traversing the link is MACsec-secured through the use of data integrity checks and, if configured, encryption.
The data integrity checks verify the integrity of the data. MACsec appends an 8-byte header and a 16-byte tail to all Ethernet frames traversing the MACsec-secured point-to-point Ethernet link, and theheader and tail are checked by the receiving interface to ensure that the data was not compromisedwhile traversing the link. If the data integrity check detects anything irregular about the traffic, thetraffic is dropped.
MACsec can also be used to encrypt all traffic on the Ethernet link. The encryption used by MACsecensures that the data in the Ethernet frame cannot be viewed by anybody monitoring traffic on the link.
Encryption is enabled for all traffic entering or leaving the interface when MACsec is enabled usingstatic CAK security mode, by default.
MACsec is configured on point-to-point Ethernet links between MACsec-capable interfaces. If you wantto enable MACsec on multiple Ethernet links, you must configure MACsec individually on each point-to-point Ethernet link.
Understanding Connectivity Associations and Secure Channels
MACsec is configured in connectivity associations. MACsec is enabled when a connectivity associationis assigned to an interface.
When you enable MACsec using static CAK or dynamic security mode, you have to create and configurea connectivity association. Two secure channels—one secure channel for inbound traffic and anothersecure channel for outbound traffic—are automatically created. The automatically-created securechannels do not have any user-configurable parameters; all configuration is done in the connectivityassociation outside of the secure channels.
Understanding Static Connectivity Association Key Security Mode
When you enable MACsec using static connectivity association key (CAK) security mode, two securitykeys—a connectivity association key (CAK) that secures control plane traffic and a randomly-generatedsecure association key (SAK) that secures data plane traffic—are used to secure the point-to-pointEthernet link. Both keys are regularly exchanged between both devices on each end of the point-to-point Ethernet link to ensure link security.
You initially establish a MACsec-secured link using a pre-shared key when you are using static CAKsecurity mode to enable MACsec. A pre-shared key includes a connectivity association name (CKN) and
482

it’s own connectivity association key (CAK). The CKN and CAK are configured by the user in theconnectivity association and must match on both ends of the link to initially enable MACsec.
Once matching pre-shared keys are successfully exchanged, the MACsec Key Agreement (MKA)protocol is enabled. The MKA protocol is responsible for maintaining MACsec on the link, and decideswhich switch on the point-to-point link becomes the key server. The key server then creates an SAK thatis shared with the switch at the other end of the point-to-point link only, and that SAK is used to secureall data traffic traversing the link. The key server will continue to periodically create and share arandomly-created SAK over the point-to-point link for as long as MACsec is enabled.
You enable MACsec using static CAK security mode by configuring a connectivity association on bothends of the link. All configuration is done within the connectivity association but outside of the securechannel. Two secure channels—one for inbound traffic and one for outbound traffic—are automaticallycreated when using static CAK security mode. The automatically-created secure channels do not haveany user-configurable parameters that cannot already be configured in the connectivity association.
We recommend enabling MACsec using static CAK security mode. Static CAK security mode ensuressecurity by frequently refreshing to a new random security key and by only sharing the security keybetween the two devices on the MACsec-secured point-to-point link. Additionally, some optionalMACsec features—replay protection, SCI tagging, and the ability to exclude traffic from MACsec—areonly available when you enable MACsec using static CAK security mode.
Starting with Junos OS Release 15.1X49-D60 and Junos OS Release 17.3R1, for SRX devices supportingMACsec on HA control and fabric links, if the command restart 802.1x-protocol-daemon is run on theprimary node, the chassis cluster control and fabric links will flap causing the cluster nodes to enter intosplit brain mode.
MACsec Considerations
All types of Spanning Tree Protocol frames cannot currently be encrypted using MACsec.
The connectivity association can be defined anywhere, either global or node specific or any otherconfiguration group as long as it is visible to the MACsec interface configuration.
For MACsec configurations, identical configurations must exist on both the ends. That is, each nodeshould contain the same configuration as the other node. If the other node is not configured orimproperly configured with MACsec on the other side, the port is disabled and stops forwarding thetraffic.
Prior to 15.1X49-D100, SRX340 and SRX345 devices did not support MACsec for host-to-host orswitch-to-host connections.
SRX4600 devices currently do not support MACsec for host-to-host connections. Macsec is supportedonly on dedicated fab ports and is not supported if any ther traffic port is used as fab.
483

On SRX340 and SRX345 devices, fabric interfaces must be configured such that the Media AccessControl Security (MACsec) configurations are local to the nodes. Otherwise, the fabric link will not bereachable
Configuring Media Access Control Security (MACsec)
IN THIS SECTION
Configuration Considerations When Configuring MACsec on Chassis Cluster Setup | 484
Configuring MACsec Using Static Connectivity Association Key Security Mode | 486
Configuring Static CAK on the Chassis Cluster Control Port | 491
Configuring Static CAK on the Chassis Cluster Fabric Port | 492
Configuring Static CAK on the Control Port of SRX4600 Device in Chassis Cluster | 493
Verifying MACSEC Configuration | 494
Starting in Junos OS Release 15.1X49-D60, Media Access Control Security(MACsec) is supported oncontrol and fabric ports of SRX340 and SRX345 devices in chassis cluster mode.
Starting in Junos OS Release 17.4R1, MACsec is supported on control and fabric ports of SRX4600devices in chassis cluster mode.
This topic shows how to configure MACsec on control and fabric ports of supported SRX Series devicein chassis cluster to secure point-to-point Ethernet links between the peer devices in a cluster. Eachpoint-to-point Ethernet link that you want to secure using MACsec must be configured independently.You can enable MACsec encryption on device-to-device links using static connectivity association key(CAK) security mode.
The configuration steps for both processes are provided in this document.
Configuration Considerations When Configuring MACsec on Chassis Cluster Setup
Before you begin, follow these steps to configure MACsec on control ports:
1. If the chassis cluster is already up, disable it by using the set chassis cluster disable command andreboot both nodes.
2. Configure MACsec on the control port with its attributes as described in the following sections"Configuring Static CAK on the Chassis Cluster Control Port" on page 491. Both nodes must beconfigured independently with identical configurations.
484

3. Enable the chassis cluster by using set chassis cluster cluster-id id on both of the nodes. Reboot bothnodes.
Control port states affect the integrity of a chassis cluster. Consider the following when configuringMACsec on control ports:
• Any new MACsec chassis cluster port configurations or modifications to existing MACsec chassiscluster port configurations will require the chassis cluster to be disabled and displays a warningmessage Modifying cluster control port CA will break chassis cluster. Once disabled, you can apply thepreceding configurations and enable the chassis cluster.
• By default, chassis clusters synchronize all configurations. Correspondingly, you must monitor thatsynchronization does not lead to loss of any MACsec configurations. Otherwise, the chassis clusterwill break. For example, for nonsymmetric, node-specific MACsec configurations, identicalconfigurations should exist on both ends. That is, each node should contain the same configurationas the other node.
The ineligible timer is 300 seconds when MACsec on the chassis cluster control port is enabled onSRX340 and SRX345 devices.
If both control link fail, Junos OS changes the operating state of the secondary node to ineligible for a180 seconds. When MACsec is enabled on the control port, the ineligibility duration is 200 seconds forSRX4600 devices.
Starting with Junos OS Release 15.1X49-D60 and Junos OS Release 17.3R1, the initial hold timer isextended from 30 seconds to 120 seconds in chassis clusters on SRX340 and SRX345 devices.
For any change in the MACsec configurations of control ports, the steps mentioned above must berepeated.
Consider the following when configuring MACsec on fabric ports:
Configuring MACsec leads to link state changes that can affect traffic capability of the link. When youconfigure fabric ports, keep the effective link state in mind. Incorrect MACsec configuration on bothends of the fabric links can move the link to an ineligible state. Note the following key points aboutconfiguring fabric links:
• Both ends of the links must be configured simultaneously when the chassis cluster is formed.
• Incorrect configuration can lead to fabric failures and errors in fabric recovery logic.
Because of potential link failure scenarios, we recommend that fabric links be configured duringformation of the chassis cluster.
485

Configuring MACsec Using Static Connectivity Association Key Security Mode
You can enable MACsec encryption by using static connectivity association key (CAK) security mode ona point-to-point Ethernet link connecting devices. This procedure shows you how to configure MACsecusing static CAK security mode.
For SRX340 and SRX345 devices, ge-0/0/0 is a fabric port and ge-0/0/1 is a control port for the chassiscluster and assigned as cluster-control-port 0.
For SRX4600 devices, dedicated control and fabric ports are available. MACsec on control link can beconfigured on dedicated control ports (control port 0 [em0] and port 1 [em1]). Macsec on fabric links canbe configured only on dedicated fabric ports port 2 and port 3 of fpc0 pic0 (e.g. xe-0/0/2 and xe-0/0/3),similarly on port-2 and port-3 of fpc7 pic0.
To configure MACsec by using static CAK security mode to secure a device-to-device Ethernet link:
1. Create a connectivity association. You can skip this step if you are configuring an existingconnectivity association.
[edit security macsec]user@host# set connectivity-association connectivity-association-name
For instance, to create a connectivity association named ca1, enter:
[edit security macsec]user@host# set connectivity-association ca1
2. Configure the MACsec security mode as static-cak for the connectivity association.
[edit security macsec]user@host# set connectivity-association connectivity-association-name security-mode static-cak
For instance, to configure the MACsec security mode to static-cak on connectivity association ca1:
[edit security macsec]user@host# set connectivity-association connectivity-association-name security-mode static-cak
486

3. Create the preshared key by configuring the connectivity association key name (CKN) andconnectivity association key (CAK).
[edit security macsec]user@host# set connectivity-association connectivity-association-name pre-shared-key ckn hexadecimal-numberuser@host# set connectivity-association connectivity-association-name pre-shared-key cak hexadecimal-number
A preshared key is exchanged between directly-connected links to establish a MACsec-secure link.The pre-shared-key includes the CKN and the CAK. The CKN is a 64-digit hexadecimal number andthe CAK is a 64-digit hexadecimal number. The CKN and the CAK must match on both ends of alink to create a MACsec-secured link.
To maximize security, we recommend configuring all 64 digits of a CKN and all 64 digits of a CAK.
After the preshared keys are successfully exchanged and verified by both ends of the link, theMACsec Key Agreement (MKA) protocol is enabled and manages the secure link. The MKA protocolthen elects one of the two directly-connected devices as the key server. The key server then sharesa random security with the other device over the MACsec-secure point-to-point link. The keyserver will continue to periodically create and share a random security key with the other deviceover the MACsec-secured point-to-point link as long as MACsec is enabled.
To configure a CKN of 11c1c1c11xxx012xx5xx8ef284aa23ff6729xx2e4xxx66e91fe34ba2cd9fe311 and CAK of228xx255aa23xx6729xx664xxx66e91f on connectivity association ca1:
[edit security macsec]user@host# set connectivity-association ca1 pre-shared-key ckn 11c1c1c11xxx012xx5xx8ef284aa23ff6729xx2e4xxx66e91fe34ba2cd9fe311user@host# set connectivity-association ca1 pre-shared-key cak 228xx255aa23xx6729xx664xxx66e91f
MACsec is not enabled until a connectivity association is attached to an interface. See the final stepof this procedure to attach a connectivity association to an interface.
4. (Optional) Set the MKA key server priority.
[edit security macsec connectivity-association connectivity-association-name]user@host# set mka key-server-priority priority-number
487

Specifies the key server priority used by the MKA protocol to select the key server. The device withthe lower priority-number is selected as the key server.
The default priority-number is 16.
If the key-server-priority is identical on both sides of the point-to-point link, the MKA protocolselects the interface with the lower MAC address as the key server. Therefore, if this statement isnot configured in the connectivity associations at each end of a MACsec-secured point-to-pointlink, the interface with the lower MAC address becomes the key server.
To change the key server priority to 0 to increase the likelihood that the current device is selectedas the key server when MACsec is enabled on the interface using connectivity association ca1:
[edit security macsec connectivity-association ca1]user@host# set mka key-server-priority 0
To change the key server priority to 255 to decrease the likelihood that the current device isselected as the key server in connectivity association ca1:
[edit security macsec connectivity-association ca1]user@host# set mka key-server-priority 255
5. (Optional) Set the MKA transmit interval.
[edit security macsec connectivity-association connectivity-association-name]user@host# set mka transmit-interval interval
The MKA transmit interval setting sets the frequency for how often the MKA protocol data unit(PDU) is sent to the directly connected device to maintain MACsec connectivity on the link. Alower interval increases bandwidth overhead on the link; a higher interval optimizes MKA protocolcommunication.
The default interval is 2000 ms. We recommend increasing the interval to 6000 ms in high-trafficload environments. The transmit interval settings must be identical on both ends of the link whenMACsec using static CAK security mode is enabled.
Starting from Junos OS Release 17.4, for SRX340, SRX345, and SRX4600, the default MKAtransmit interval is 10000 ms on HA links.
488

For instance, if you wanted to increase the MKA transmit interval to 6000 milliseconds whenconnectivity association ca1 is attached to an interface:
[edit security macsec connectivity-association ca1]user@host# set mka transmit-interval 6000
6. (Optional) Disable MACsec encryption.
[edit security macsec connectivity-association connectivity-association-name]user@host# set no-encryption
Encryption is enabled for all traffic entering or leaving the interface when MACsec is enabled usingstatic CAK security mode, by default.
When encryption is disabled, traffic is forwarded across the Ethernet link in clear text. You are ableto view unencrypted data in the Ethernet frame traversing the link when you are monitoring it. TheMACsec header is still applied to the frame, however, and all MACsec data integrity checks are runon both ends of the link to ensure the traffic sent or received on the link has not been tamperedwith and does not represent a security threat.
7. (Optional) Set an offset for all packets traversing the link.
[edit security macsec connectivity-association connectivity-association-name]user@host# set offset (0 | 30 | 50)
For instance, if you wanted to set the offset to 30 in the connectivity association named ca1:
[edit security macsec connectivity-association ca1]user@host# set offset 30
The default offset is 0. All traffic in the connectivity association is encrypted when encryption isenabled and an offset is not set.
When the offset is set to 30, the IPv4 header and the TCP/UDP header are unencrypted whileencrypting the rest of the traffic. When the offset is set to 50, the IPv6 header and the TCP/UDPheader are unencrypted while encrypting the rest of the traffic.
You would typically forward traffic with the first 30 or 50 octets unencrypted if a feature needed tosee the data in the octets to perform a function, but you otherwise prefer to encrypt the remainingdata in the frames traversing the link. Load balancing features, in particular, typically need to seethe IP and TCP/UDP headers in the first 30 or 50 octets to properly load balance traffic.
489

8. (Optional) Enable replay protection.
[edit security macsec connectivity-association connectivity-association-name]user@host# set replay-protect replay-window-size number-of-packets
When MACsec is enabled on a link, an ID number is assigned to each packet on the MACsec-secured link.
When replay protection is enabled, the receiving interface checks the ID number of all packets thathave traversed the MACsec-secured link. If a packet arrives out of sequence and the differencebetween the packet numbers exceeds the replay protection window size, the packet is dropped bythe receiving interface. For instance, if the replay protection window size is set to five and a packetassigned the ID of 1006 arrives on the receiving link immediately after the packet assigned the IDof 1000, the packet that is assigned the ID of 1006 is dropped because it falls outside theparameters of the replay protection window.
Replay protection is especially useful for fighting man-in-the-middle attacks. A packet that isreplayed by a man-in-the-middle attacker on the Ethernet link will arrive on the receiving link out ofsequence, so replay protection helps ensure the replayed packet is dropped instead of forwardedthrough the network.
Replay protection should not be enabled in cases where packets are expected to arrive out of order.
You can require that all packets arrive in order by setting the replay window size to 0.
To enable replay protection with a window size of five on connectivity association ca1:
[edit security macsec connectivity-association ca1]user@host# set replay-protect replay-window-size 5
9. (Optional) Exclude a protocol from MACsec.
[edit security macsec connectivity-association connectivity-association-name]user@host# set exclude-protocol protocol-name
For instance, if you did not want Link Level Discovery Protocol (LLDP) to be secured using MACsec:
[edit security macsec connectivity-association connectivity-association-name]user@host# set exclude-protocol lldp
When this option is enabled, MACsec is disabled for all packets of the specified protocol—in thiscase, LLDP—that are sent or received on the link.
490

10. Assign the connectivity association to a chassis cluster control interface.
[edit security macsec]user@host# set cluster-control-port port-no connectivity-association connectivity-association-name
Assigning the connectivity association to an interface is the final configuration step for enablingMACsec on an interface.
For instance, to assign connectivity association ca1 to interface ge-0/0/1 (For SRX340/SRX345):
[edit security macsec]user@host# set cluster-control-port interfaces ge-0/0/1 connectivity-association ca1
11. Assign a connectivity association for enabling MACsec on a chassis cluster fabric interface.
[edit security macsec]user@host# set cluster-data-port port-number connectivity-association connectivity-association-name [edit security macsec]user@host# set cluster-data-port interfaces ge-5/0/2 connectivity-association ca1
MACsec using static CAK security mode is not enabled until a connectivity association on the oppositeend of the link is also configured, and contains preshared keys that match on both ends of the link.
Configuring Static CAK on the Chassis Cluster Control Port
To establish a CA over a chassis cluster control link on two SRX345 devices.
1. Configure the MACsec security mode as static-cak for the connectivity association:
[edit security macsec]user@host# set connectivity-association ca1 security-mode static-cak
2. Create the preshared key by configuring the connectivity association key name (CKN).
[edit security macsec]user@host# set connectivity-association ca1 pre-shared-key ckn 0123456789abcdefABCDEF0123456789
491

The CKN must be an even-length string up to 64 hexadecimal characters (0-9, a-f, A-F).
3. Create the pre-shared key by configuring the connectivity association key (CAK).
[edit security macsec]user@host# set connectivity-association ca1 pre-shared-key cak 0123456789abcdefABCDEF0123456789
The CAK must contain 64 hexadecimal characters (0-9, a-f, A-F).
4. Specify chassis cluster control ports for the connectivity association.
[edit security macsec]user@host# set cluster-control-port 0 connectivity-association ca1
Configuring Static CAK on the Chassis Cluster Fabric Port
To establish a connectivity association over a chassis cluster fabric link on two SRX345 devices:
1. Configure the MACsec security mode as static-cak for the connectivity association.
[edit security macsec]user@host# set connectivity-association ca2 security-mode static-cak
2. Create the preshared key by configuring the connectivity association key name (CKN).
[edit security macsec]user@host# set connectivity-association ca2 pre-shared-key ckn 0123456789abcdefABCDEF0123456789
The CKN must be an even-length string up to 64 hexadecimal characters (0-9, a-f, A-F).
3. Create the preshared key by configuring the connectivity association key (CAK).
[edit security macsec]user@host# set connectivity-association ca2 pre-shared-key cak 0123456789abcdefABCDEFabcdefabcdef
The CAK must contain 64 hexadecimal characters (0-9, a-f, A-F).
492

4. Specify a chassis cluster fabric ports to a connectivity association.
[edit security macsec]user@host# set cluster-data-port ge-0/0/2 connectivity-association ca2user@host# set cluster-data-port ge-5/0/2 connectivity-association ca2
Configuring Static CAK on the Control Port of SRX4600 Device in Chassis Cluster
Use this procedure to establish a CA over a chassis cluster control link on two SRX4600 devices.
1. Configure the MACsec security mode as static-cak for the connectivity association:
[edit]user@host# set security macsec connectivity-association ca1 security-mode static-cak
2. Create the preshared key by configuring the connectivity association key name (CKN).
[edit]user@host# set security macsec connectivity-association ca1 pre-shared-key ckn aaaaaaaaaaaaaaaaaaaaaaaaaaaaaaaaaaaaaaaaaaaaaaaaaaaaaaaaaaaaaaaa
The CKN must be an even-length string up to 64 hexadecimal characters (0-9, a-f, A-F).
3. Create the preshared key by configuring the connectivity association key (CAK).
[edit]user@host# set security macsec connectivity-association ca1 pre-shared-key cak ABCDEFABCDEFABCDEFABCDEFABCDEFABCDEFABCDEFABCDEF.
The CAK must contain 64 hexadecimal characters (0-9, a-f, A-F).
4. Specify a chassis cluster control port for the connectivity association.
[edit]user@host# set security macsec cluster-control-port 0 connectivity-association ca1user@host# set security macsec cluster-control-port 1 connectivity-association ca1
493

Verifying MACSEC Configuration
IN THIS SECTION
Display the Status of Active MACsec Connections on the Device | 494
Display MACsec Key Agreement (MKA) Session Information | 495
Verifying That MACsec-Secured Traffic Is Traversing Through the Interface | 496
Verifying Chassis Cluster Ports Are Secured with MACsec Configuration | 498
To confirm that the configuration provided in "Configuring Static CAK on the Control Port of SRX4600Device in Chassis Cluster" on page 493 is working properly, perform these tasks:
Display the Status of Active MACsec Connections on the Device
IN THIS SECTION
Purpose | 494
Action | 494
Meaning | 495
Purpose
Verify that MACsec is operational on the chassis cluster setup.
Action
From the operational mode, enter the show security macsec connections interface interface-name command onone or both of the nodes of chassis cluster setup.
{primary:node0}[edit]user@host# show security macsec connections
Interface name: em0 CA name: ca1
494

Cipher suite: GCM-AES-128 Encryption: on Key server offset: 0 Include SCI: no Replay protect: off Replay window: 0 Outbound secure channels SC Id: 02:00:00:01:01:04/1 Outgoing packet number: 1 Secure associations AN: 3 Status: inuse Create time: 00:01:43 Inbound secure channels SC Id: 02:00:00:02:01:04/1 Secure associations AN: 3 Status: inuse Create time: 00:01:43
Meaning
The Interface name and CA name outputs show that the MACsec connectivity association is operational onthe interface em0. The output does not appear when the connectivity association is not operational onthe interface.
Display MACsec Key Agreement (MKA) Session Information
IN THIS SECTION
Purpose | 495
Action | 496
Meaning | 496
Purpose
Display MACsec Key Agreement (MKA) session information for all interfaces.
495
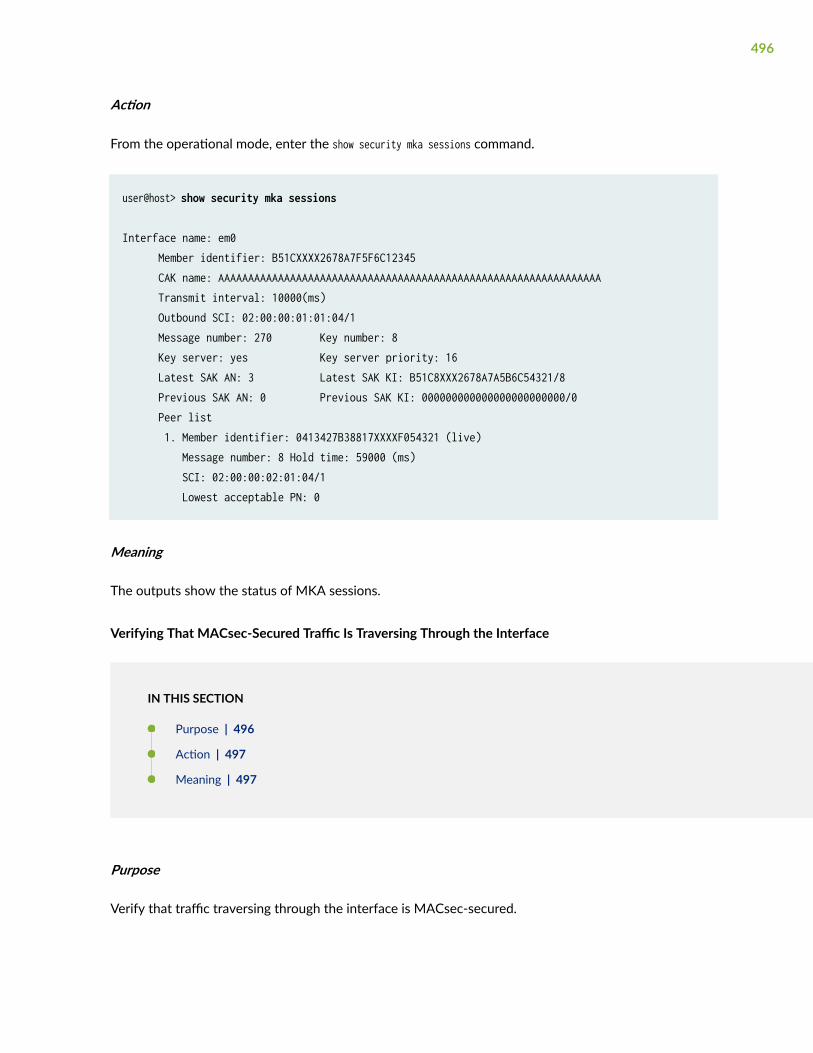
Action
From the operational mode, enter the show security mka sessions command.
user@host> show security mka sessions
Interface name: em0 Member identifier: B51CXXXX2678A7F5F6C12345 CAK name: AAAAAAAAAAAAAAAAAAAAAAAAAAAAAAAAAAAAAAAAAAAAAAAAAAAAAAAAAAAAAAAA Transmit interval: 10000(ms) Outbound SCI: 02:00:00:01:01:04/1 Message number: 270 Key number: 8 Key server: yes Key server priority: 16 Latest SAK AN: 3 Latest SAK KI: B51C8XXX2678A7A5B6C54321/8 Previous SAK AN: 0 Previous SAK KI: 000000000000000000000000/0 Peer list 1. Member identifier: 0413427B38817XXXXF054321 (live) Message number: 8 Hold time: 59000 (ms) SCI: 02:00:00:02:01:04/1 Lowest acceptable PN: 0
Meaning
The outputs show the status of MKA sessions.
Verifying That MACsec-Secured Traffic Is Traversing Through the Interface
IN THIS SECTION
Purpose | 496
Action | 497
Meaning | 497
Purpose
Verify that traffic traversing through the interface is MACsec-secured.
496

Action
From the operational mode, enter the show security macsec statistics command.
user@host> show security macsec statistics interface em0 detail
Interface name: em0 Secure Channel transmitted Encrypted packets: 2397305 Encrypted bytes: 129922480 Protected packets: 0 Protected bytes: 0 Secure Association transmitted Encrypted packets: 2397305 Protected packets: 0 Secure Channel received Accepted packets: 2395850 Validated bytes: 0 Decrypted bytes: 131715088 Secure Association received Accepted packets: 2395850 Validated bytes: 0 Decrypted bytes: 0
Meaning
The Encrypted packets line under the Secure Channel transmitted field are the values incremented each time apacket is sent from the interface that is secured and encrypted by MACsec.
The Accepted packets line under the Secure Association received field are the values incremented each time apacket that has passed the MACsec integrity check is received on the interface. The Decrypted bytes lineunder the Secure Association received output is incremented each time an encrypted packet is received anddecrypted.
497

Verifying Chassis Cluster Ports Are Secured with MACsec Configuration
IN THIS SECTION
Purpose | 498
Action | 498
Meaning | 499
Purpose
Verify that MACsec is configured on chassis cluster ports.
Action
From operational mode, enter the show chassis cluster interfaces command.
user@host> show chassis cluster interfaces
Control link status: Up
Control interfaces: Index Interface Monitored-Status Internal-SA Security 0 em0 Up Disabled Enabled
Fabric link status: Up
Fabric interfaces: Name Child-interface Status Security (Physical/Monitored) fab0 xe-1/1/6 Up / Up Enabled fab0 fab1 xe-8/1/6 Up / Up Enabled fab1
Redundant-ethernet Information: Name Status Redundancy-group reth0 Up 1
498
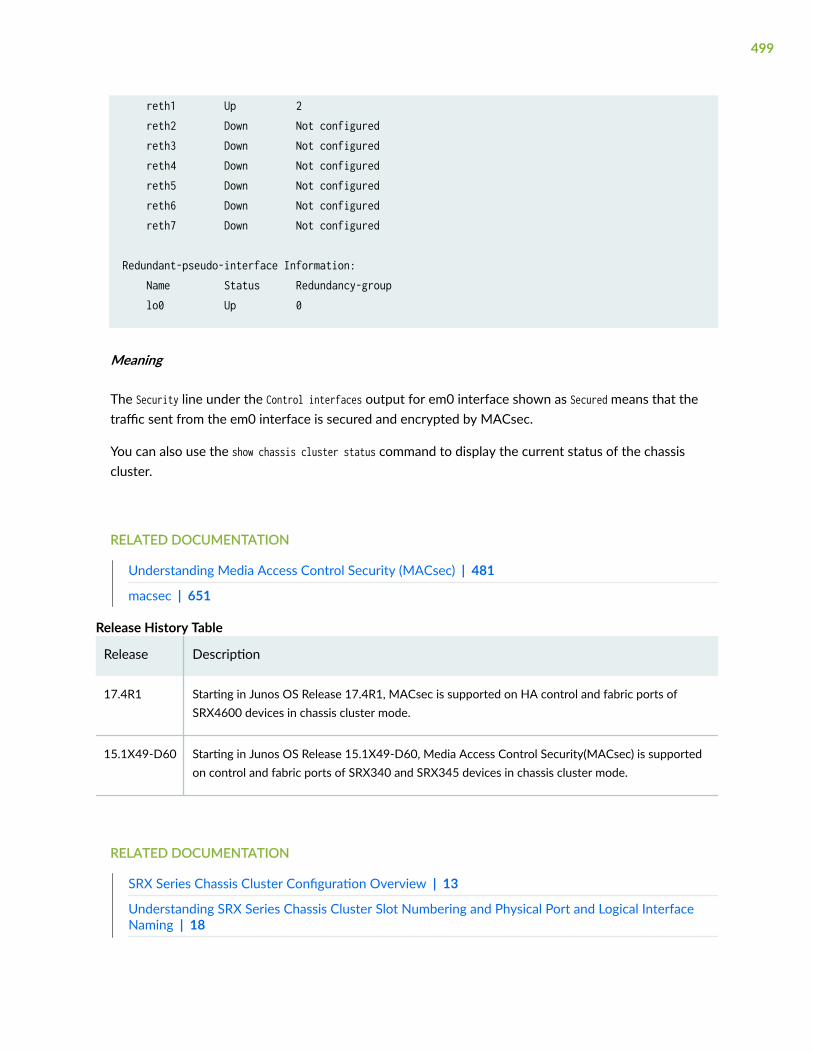
reth1 Up 2 reth2 Down Not configured reth3 Down Not configured reth4 Down Not configured reth5 Down Not configured reth6 Down Not configured reth7 Down Not configured
Redundant-pseudo-interface Information: Name Status Redundancy-group lo0 Up 0
Meaning
The Security line under the Control interfaces output for em0 interface shown as Secured means that thetraffic sent from the em0 interface is secured and encrypted by MACsec.
You can also use the show chassis cluster status command to display the current status of the chassiscluster.
RELATED DOCUMENTATION
Understanding Media Access Control Security (MACsec) | 481
macsec | 651
Release History Table
Release Description
17.4R1 Starting in Junos OS Release 17.4R1, MACsec is supported on HA control and fabric ports ofSRX4600 devices in chassis cluster mode.
15.1X49-D60 Starting in Junos OS Release 15.1X49-D60, Media Access Control Security(MACsec) is supportedon control and fabric ports of SRX340 and SRX345 devices in chassis cluster mode.
RELATED DOCUMENTATION
SRX Series Chassis Cluster Configuration Overview | 13
Understanding SRX Series Chassis Cluster Slot Numbering and Physical Port and Logical InterfaceNaming | 18
499

macsec | 651
Understanding SCTP Behavior in Chassis Cluster
In a chassis cluster configuration mode, the SCTP configuration and the established SCTP association issynced with the peer device. The SCTP module supports both active-active and active-passive modes.
The established SCTP association sends a creation or deletion message to the peer whenever anassociation is created or deleted on the active device. The secondary device adds or deletes anassociation respectively upon receiving the message from the established SCTP association. SCTPmodule then registers the corresponding callback function to receive and handle this message. There isno continuous timer sync between the two associations.
SCTP module will register a cold start sync function when a secondary device joins the cluster orreboots. The SCTP cold start function is called to sync all SCTP associations with the peer devices at thesame time.
After the switchover, the established SCTP associations will remain functioning, but the associations inthe progress of establishment will be lost and the establishment procedure needs to be re-initiated. It isalso possible that the associations in the progress of teardown miss the ack message and leavesunestablished SCTP associations in the firewall. These associations will be cleaned up when the timerexpires (5 hours by default) due to no activity in the association.
• You should configure all policies for your required SCTP sessions.For example, suppose you have endpoints A and B. Endpoint A has one SCTP association with xnumber of IPs (IP_a1, IP_a2, IP_a3...IP_ax). Endpoint B has one SCTP association with y number ofIPs (IP_b1, IP_b2, IP_b3...IP_by.) The policy on the security device should permit all possible x*y pathsin both directions.
• When an SCTP association is removed, the related SCTP sessions still exist and time out bythemselves.
Example: Encrypting Messages Between Two Nodesin a Chassis Cluster
This example provides you a procedure to enable encryption on security devices.
500

This procedure provides you step on how you can optionally configure the control-link to encryptmessages between two nodes in a chassis cluster. This configuration will ensure secure login by usingconfigured internal IPsec security association (SA).
When the internal IPsec SA is configured, IPsec-based rlogin and remote command (rcmd) are enforcedso that attackers cannot gain privileged access or observe traffic containing administrator commandsand outputs.
You do not need to configure the internal IPsec SA on both nodes because the nodes are synchronizedwhen the configuration is committed.
1. To enable control link encryption in chassis cluster, run the following commands:
The only supported encryption algorithm is 3des-cbc and the key must be exactly 24 bytes long,otherwise the configuration will result in commit failure.
edit security ipsec internal security-associationroot@srx-8# show | display setset security ipsec internal security-association manual encryption algorithm 3des-cbcset security ipsec internal security-association manual encryption ike-ha-link-encryption enableset security ipsec internal security-association manual encryption key ascii-text "$9$8gPx-b4aU.PQs2PQFnpu8X7dsgGUHPT3.Pu1EhvMwYgJjq3n9CpBFntOREeKZGDj.fu01hcr"
2. Commit the configuration.
{primary:node0} [edit] root@srx-8# commitwarning: changes needs reboot to take effect
warning: changes needs reboot to take effectnode0: commit completenode1: commit complete
After the settings have been configured correctly and committed, a reboot would be required for thefeature to take effect.
501

3. View the configuration of control link encryption before reboot and after reboot.
Before reboot, the status of this feature is disabled.show security internal-security-association
node0:--------------------------------------------------------------------------Internal SA Status : DisabledHA link encryption for IKE internal message status: Disabled
node1:--------------------------------------------------------------------------Internal SA Status : DisabledHA link encryption for IKE internal message status: Disabled
After reboot, to ensure that the encryption is activeshow security internal-security-association
{primary:node0}root@srx-8> show security internal-security-association
node0:--------------------------------------------------------------------------Internal SA Status : EnabledHA link encryption for IKE internal message status: Enabled
node1:--------------------------------------------------------------------------Internal SA Status : EnabledHA link encryption for IKE internal message status: Enabled
RELATED DOCUMENTATION
internal (Security IPsec)
502

5CHAPTER
Upgrading or Disabling a ChassisCluster
Upgrading Individual Devices in a Chassis Cluster Separately | 504
Upgrading Devices in a Chassis Cluster Using ICU | 504
Upgrading a Chassis Cluster Using In-Service Software Upgrade | 509
Disabling a Chassis Cluster | 531

Upgrading Individual Devices in a Chassis ClusterSeparately
Devices in a chassis cluster can be upgraded separately one at a time; some models allow one deviceafter the other to be upgraded using failover and an in-service software upgrade (ISSU) to reduce theoperational impact of the upgrade.
To upgrade each device in a chassis cluster separately:
During this type of chassis cluster upgrade, a service disruption of about 3 to 5 minutes occurs.
1. Load the new image file on node 0.
2. Perform the image upgrade without rebooting the node by entering:
user@host> request system software add image_name
3. Load the new image file on node 1.
4. Repeat Step 2.
5. Reboot both nodes simultaneously.
RELATED DOCUMENTATION
Upgrading Devices in a Chassis Cluster Using ICU | 504
Upgrading a Chassis Cluster Using In-Service Software Upgrade | 509
Upgrading Devices in a Chassis Cluster Using ICU
IN THIS SECTION
Upgrading Both Devices in a Chassis Cluster Using ICU | 505
Upgrading ICU Using a Build Available Locally on a Primary Node in a Chassis Cluster | 506
Upgrading ICU Using a Build Available on an FTP Server | 507
Terminating an Upgrade in a Chassis Cluster During an ICU | 507
504

The chassis cluster ICU feature allows both devices in a cluster to be upgraded from supported JunosOS versions using a single command. For more information, see the following topics:
Upgrading Both Devices in a Chassis Cluster Using ICU
Before you begin, note the following:
• ICU is available with the no-sync option only for SRX300, SRX320, SRX340, SRX345, SRX550M, andSRX380 devices.
• Before starting ICU, you should ensure that sufficient disk space is available. See "Upgrading ICUUsing a Build Available Locally on a Primary Node in a Chassis Cluster" on page 506 and "UpgradingICU Using a Build Available on an FTP Server" on page 507.
• For SRX300, SRX320, SRX340, SRX345, SRX550M, and SRX380 devices, this feature cannot be usedto downgrade to a build earlier than Junos OS 11.2 R2.
For SRX1500 devices, this feature cannot be used to downgrade to a build earlier than Junos OS15.1X49-D50.
SRX Series devices in a chassis cluster can be upgraded with a minimal service disruption using In-BandCluster Upgrade (ICU). The chassis cluster ICU feature allows both devices in a cluster to be upgradedfrom supported Junos OS versions using a single command. You can enable this feature by executing therequest system software in-service-upgrade image_name command on the primary node. This commandupgrades the Junos OS and reboots both the secondary node and the primary node in turn. During theICU process, traffic outage is minimal; however, cold synchronization is not provided between the twonodes.
For SRX300, SRX320, SRX340, SRX345, SRX550M, and SRX380 devices, the devices in a chassis clustercan be upgraded with a minimal service disruption of approximately 30 seconds using ICU with the no-sync option. The chassis cluster ICU feature allows both devices in a cluster to be upgraded fromsupported Junos OS versions.
You must use the in-band cluster upgrade (ICU) commands on SRX1500 device to upgrade followingJunos OS Releases:
• Junos OS Release 15.1X49-D50 to Junos OS Release 15.1X49-D100
• Junos OS Release 15.1X49-D60 to Junos OS Release 15.1X49-D110
• Junos OS Release 15.1X49-D50 to Junos OS Release 15.1X49-D120
For SRX300, SRX320, SRX340, SRX345, SRX550M, and SRX380 devices, the impact on traffic is asfollows:
505

• Drop in traffic (30 seconds approximately)
• Loss of security flow sessions
The upgrade is initiated with the Junos OS build locally available on the primary node of the device oron an FTP server.
• The primary node, RG0, changes to the secondary node after an ICU upgrade.
• During ICU, the chassis cluster redundancy groups are failed over to the primary node to change thecluster to active/passive mode.
• ICU states can be checked from the syslog or with the console/terminal logs.
• ICU requires that both nodes be running a dual-root partitioning scheme with one exception beingthe SRX1500. ICU will not continue if it fails to detect dual-root partitioning on either of the nodes.Requirement of the dual-root partitioning is applicable only for SRX300, SRX320, SRX340, SRX345,SRX550M, and SRX380 devices.
Dual-root partitioning is not supported on SRX1500 devices. SRX1500 uses solid-state drive (SSD) assecondary storage.
Upgrading ICU Using a Build Available Locally on a Primary Node in aChassis Cluster
Ensure that sufficient disk space is available for the Junos OS package in the /var/tmp location in thesecondary node of the cluster.
To upgrade ICU using a build locally available on the primary node of a cluster:
1. Copy the Junos OS package build to the primary node at any location, or mount a network file serverfolder containing the Junos OS build.
2. Start ICU by entering the following command:
user@host> request system software in-service-upgrade image_name no-sync (for SRX300, SRX320, SRX340,SRX345, SRX550M, and SRX380 devices)
user@host> request system software in-service-upgrade image_name (for SRX1500 devices prior to Junos OSRelease 15.1X49-D70)
506

Upgrading ICU Using a Build Available on an FTP Server
Ensure that sufficient disk space is available for the Junos OS package in the /var/tmp location in boththe primary and the secondary nodes of the cluster.
To upgrade ICU using a build available on an FTP server:
1. Place the Junos OS build on an FTP server.
2. (SRX300, SRX320, SRX340, SRX345, SRX550M, and SRX380 only) Start ICU by entering thefollowing command:
user@root> request system software in-service-upgrade <ftp url for junos image> no-sync
Sample Command
user@root> request system software in-service-upgrade ftp://<user>:<password>@<server>:/<path> no-sync
This command upgrades the Junos OS and reboots both nodes in turn.
3. (SRX1500 only prior to Junos OS Release 15.1X49-D70) Start ICU by entering the followingcommand:
user@root> request system software in-service-upgrade <ftp url for junos image>
Sample Command
user@root> request system software in-service-upgrade ftp://<user>:<password>@<server>:/<path>
This command upgrades the Junos OS and reboots both nodes in turn.
The upgrade process displays the following warning message to reboot the system:
WARNING: A reboot is required to load this software correctly. Use the request system reboot commandwhen software installation is complete.
This warning message can be ignored because the ICU process automatically reboots both the nodes.
Terminating an Upgrade in a Chassis Cluster During an ICU
You can terminate an ICU at any time by issuing the following command on the primary node:
request system software abort in-service-upgrade
507

Issuing an abort command during or after the secondary node reboots puts the cluster in an inconsistentstate. The secondary node boots up running the new Junos OS build, while the primary continues to runthe older Junos OS build.
To recover from the chassis cluster inconsistent state, perform the following actions sequentially on thesecondary node:
1. Issue an abort command:
request system software abort in-service-upgrade
2. Roll back the Junos OS build by entering the following command:
request system software rollback node < node-id >
3. Reboot the secondary node immediately by using the following command:
request system reboot
You must execute the above steps sequentially to complete the recovery process and avoid clusterinstability.
Table 35 on page 508 lists the options and their descriptions for the request system software in-service-upgrade command.
Table 35: request system software in-service-upgrade Output Fields
Options Description
no-sync Disables the flow state from syncing up when the old secondary node has booted with a newJunos OS image.
This option is not available on SRX1500 devices.
no-tcp-syn-check Creates a window wherein the TCP SYN check for the incoming packets will be disabled. Thedefault value for the window is 7200 seconds (2 hours).
This option is not available on SRX1500 devices.
no-validate Disables the validation of the configuration at the time of the installation. The systembehavior is similar to software add.
unlink Removes the package from the local media after installation.
• During ICU, if a termination command is executed, ICU will terminate only after the currentoperation finishes. This is required to avoid any inconsistency with the devices.
508

For example, if formatting and upgrade of a node is in progress, ICU terminates after this operationfinishes.
• After a termination, ICU will try to roll back the build on the nodes if the upgrading nodes step wascompleted.
RELATED DOCUMENTATION
Upgrading Individual Devices in a Chassis Cluster Separately | 504
Upgrading a Chassis Cluster Using In-Service Software Upgrade | 509
Disabling a Chassis Cluster | 531
Upgrading a Chassis Cluster Using In-ServiceSoftware Upgrade
IN THIS SECTION
Understanding ISSU for a Chassis Cluster | 509
ISSU System Requirements | 512
Upgrading Both Devices in a Chassis Cluster Using ISSU | 514
Rolling Back Devices in a Chassis Cluster After an ISSU | 516
Enabling an Automatic Chassis Cluster Node Failback After an ISSU | 516
Log Error Messages used for Troubleshooting ISSU-Related Problems | 517
Managing Chassis Cluster ISSU-Related Problems | 526
In-service software upgrade (ISSU) enables a software upgrade from one Junos OS version to a laterJunos OS version with minimal downtime. For more information, see the following topics:
Understanding ISSU for a Chassis Cluster
509

In-service software upgrade (ISSU) enables a software upgrade from one Junos OS version to a laterJunos OS version with little or no downtime. ISSU is performed when the devices are operating inchassis cluster mode only.
The chassis cluster ISSU feature enables both devices in a cluster to be upgraded from supported JunosOS versions with a minimal disruption in traffic and without a disruption in service.
Starting with Junos OS Release 15.1X49-D80, SRX4100 and SRX4200 devices support ISSU.
Starting with Junos OS Release 15.1X49-D70, SRX1500 devices support ISSU.
• On SRX1500, SRX4100, and SRX4200 devices, ISSU is not supported for upgrading to 17.4 releasesfrom previous Junos OS releases. ISSU is supported for upgrading from Junos OS 17.4 to successive17.4 releases.
• On SRX5400, SRX5600 and SRX5800 devices, ISSU is not supported for upgrading to 17.3 andhigher releases from earlier Junos OS releases. ISSU is supported for upgrading from Junos OS 17.3to Junos 17.4 releases.
• SRX300 Series devices, SRX550M devices and vSRX do not support ISSU.
You can use the in-band cluster upgrade (ICU) commands on SRX4100 and SRX4200 devices to upgradefollowing Junos OS Releases:
• Junos OS Release 15.1X49-D65 to Junos OS Release 15.1X49-D70
• Junos OS Release 15.1X49-D70 to Junos OS Release 15.1X49-D80.
You must use the in-band cluster upgrade (ICU) commands on SRX1500 device to upgrade followingJunos OS Releases:
• Junos OS Release 15.1X49-D50 to Junos OS Release 15.1X49-D60
• Junos OS Release 15.1X49-D60 to Junos OS Release 15.1X49-D70
• Junos OS Release 15.1X49-D50 to Junos OS Release 15.1X49-D70
ISSU provides the following benefits:
• Eliminates network downtime during software image upgrades
• Reduces operating costs, while delivering higher service levels
• Allows fast implementation of new features
ISSU has the following limitations:
• ISSU is available only for Junos OS Release 10.4R4 or later.
• ISSU does not support software downgrades.
510

• If you upgrade from a Junos OS version that supports only IPv4 to a version that supports both IPv4and IPv6, the IPv4 traffic continue to work during the upgrade process. If you upgrade from a JunosOS version that supports both IPv4 and IPv6 to a version that supports both IPv4 and IPv6, both theIPv4 and IPv6 traffic continue to work during the upgrade process. Junos OS Release 10.2 and laterreleases support flow-based processing for IPv6 traffic.
• During an ISSU, you cannot bring any PICs online. You cannot perform operations such as commit,restart, or halt.
• During an ISSU, operations like fabric monitoring, control link recovery, and RGX preempt aresuspended.
• During an ISSU, you cannot commit any configurations.
For details about ISSU support status, see knowledge base article KB17946.
The following process occurs during an ISSU for devices in a chassis cluster. The sequences given beloware applicable when RG-0 is node 0 (primary node). Note that you must initiate an ISSU from RG-0primary. If you initiate the upgrade on node 1 (RG-0 secondary), an error message is displayed.
1. At the beginning of a chassis cluster ISSU, the system automatically fails over all RG-1+ redundancygroups that are not primary on the node from which the ISSU is initiated. This action ensures thatall the redundancy groups are active on only the RG-0 primary node.
The automatic failover of all RG-1+ redundancy groups is available from Junos OS release 12.1 orlater. If you are using Junos OS release 11.4 or earlier, before starting the ISSU, ensure that all theredundancy groups are all active on only the RG-0 primary node.
After the system fails over all RG-1+ redundancy groups, it sets the manual failover bit and changesall RG-1+ primary node priorities to 255, regardless of whether the redundancy group failed over tothe RG-0 primary node.
2. The primary node (node 0) validates the device configuration to ensure that it can be committedusing the new software version. Checks are made for disk space availability for the /var file systemon both nodes, unsupported configurations, and unsupported Physical Interface Cards (PICs).
If the disk space available on either of the Routing Engines is insufficient, the ISSU process fails andreturns an error message. However, unsupported PICs do not prevent the ISSU. The software issuesa warning to indicate that these PICs will restart during the upgrade. Similarly, an unsupportedprotocol configuration does not prevent the ISSU. However, the software issues a warning thatpacket loss might occur for the protocol during the upgrade.
3. When the validation succeeds, the kernel state synchronization daemon (ksyncd) synchronizes thekernel on the secondary node (node 1) with the node 0.
511

4. Node 1 is upgraded with the new software image. Before being upgraded, the node 1 gets theconfiguration file from node 0 and validates the configuration to ensure that it can be committedusing the new software version. After being upgraded, it is resynchronized with node 0.
5. The chassis cluster process (chassisd) on the node 0 prepares other software processes for thelISSU. When all the processes are ready, chassisd sends a message to the PICs installed in thedevice.
6. The Packet Forwarding Engine on each Flexible PIC Concentrator (FPC) saves its state anddownloads the new software image from node 1. Next, each Packet Forwarding Engine sends amessage (unified-ISSU ready) to the chassisd.
7. After receiving the message (unified-ISSU ready) from a Packet Forwarding Engine, the chassisdsends a reboot message to the FPC on which the Packet Forwarding Engine resides. The FPCreboots with the new software image. After the FPC is rebooted, the Packet Forwarding Enginerestores the FPC state and a high-speed internal link is established with node 1 running the newsoftware. The chassisd is also reestablished with node 0.
8. After all Packet Forwarding Engines have sent a ready message using the chassisd on node 0, othersoftware processes are prepared for a node switchover. The system is ready for a switchover at thispoint.
9. Node switchover occurs and node 1 becomes the new primary node (hitherto secondary node 1).
10. The new secondary node (hitherto primary node 0) is now upgraded to the new software image.
When both nodes are successfully upgraded, the ISSU is complete.
When upgrading a version cluster that does not support encryption to a version that supportsencryption, upgrade the first node to the new version. Without the encryption configured and enabled,two nodes with different versions can still communicate with each other and service is not broken. Afterupgrading the first node, upgrade the second node to the new version. Users can decide whether to turnon the encryption feature after completing the upgrade. Encryption must be deactivated beforedowngrading to a version that does not support encryption. This ensures that communication betweenan encryption-enabled version node and a downgraded node does not break, because both are nolonger encrypted.
ISSU System Requirements
You can use ISSU to upgrade from an ISSU-capable software release to a later release.
To perform an ISSU, your device must be running a Junos OS release that supports ISSU for the specificplatform. See Table 36 on page 513 for platform support.
512
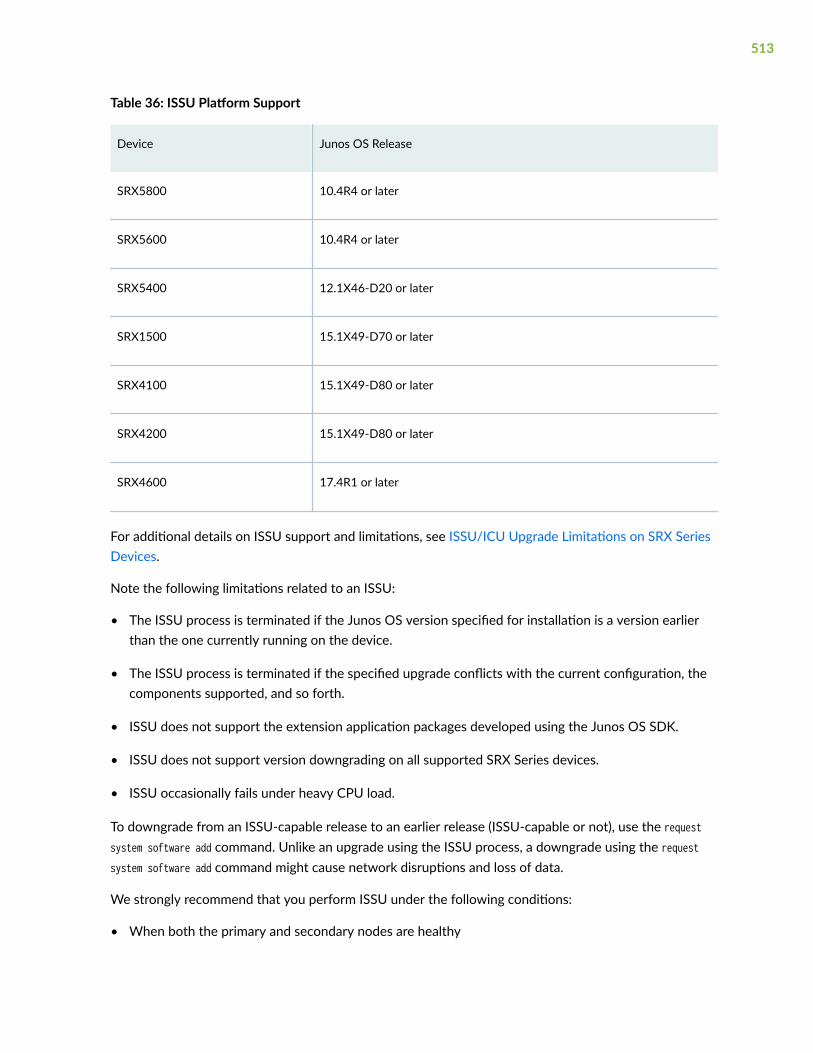
Table 36: ISSU Platform Support
Device Junos OS Release
SRX5800 10.4R4 or later
SRX5600 10.4R4 or later
SRX5400 12.1X46-D20 or later
SRX1500 15.1X49-D70 or later
SRX4100 15.1X49-D80 or later
SRX4200 15.1X49-D80 or later
SRX4600 17.4R1 or later
For additional details on ISSU support and limitations, see ISSU/ICU Upgrade Limitations on SRX SeriesDevices.
Note the following limitations related to an ISSU:
• The ISSU process is terminated if the Junos OS version specified for installation is a version earlierthan the one currently running on the device.
• The ISSU process is terminated if the specified upgrade conflicts with the current configuration, thecomponents supported, and so forth.
• ISSU does not support the extension application packages developed using the Junos OS SDK.
• ISSU does not support version downgrading on all supported SRX Series devices.
• ISSU occasionally fails under heavy CPU load.
To downgrade from an ISSU-capable release to an earlier release (ISSU-capable or not), use the requestsystem software add command. Unlike an upgrade using the ISSU process, a downgrade using the requestsystem software add command might cause network disruptions and loss of data.
We strongly recommend that you perform ISSU under the following conditions:
• When both the primary and secondary nodes are healthy
513

• During system maintenance period
• During the lowest possible traffic period
• When the Routing Engine CPU usage is less than 40 percent
In cases where ISSU is not supported or recommended, while still downtime during the system upgrademust be minimized, the minimal downtime procedure can be used, see knowledge base articleKB17947.
Upgrading Both Devices in a Chassis Cluster Using ISSU
Before you begin the ISSU for upgrading both the devices, note the following guidelines:
• Ensure the following ISSU pre-check requirements are met:
• All redundancy groups priority is greater than 0
• All redundancy groups are either primary or secondary in state
• There exists enough (double the image size) space available in the /var/tmp
• Usage of CPU is under 80% within 5 seconds period
If the pre-check requirements are not met, ISSU will terminate at the beginning.
• Back up the software using the request system snapshot command on each Routing Engine to back upthe system software to the device’s hard disk. The request system snapshot command is not supportedon SRX1500, SRX4100 and SRX4200 platforms.
• If you are using Junos OS Release 11.4 or earlier, before starting the ISSU, set the failover for allredundancy groups so that they are all active on only one node (primary). See "Initiating a ChassisCluster Manual Redundancy Group Failover" on page 281.
If you are using Junos OS Release 12.1 or later, Junos OS automatically fails over all RGs to the RG0primary.
• We recommend that you enable graceful restart for routing protocols before you start an ISSU.
On all supported SRX Series devices, the first recommended ISSU from release is Junos OS Release10.4R4.
The chassis cluster ISSU feature enables both devices in a cluster to be upgraded from supported JunosOS versions with a traffic impact similar to that of redundancy group failovers.
Starting with Junos OS Release 15.1X49-D70, SRX1500 devices support ISSU.
Starting with Junos OS Release 15.1X49-D80, SRX4100 and SRX4200 devices support ISSU.
514

Starting with Junos OS Release 17.4R1, SRX4600 devices support ISSU.
To perform an ISSU from the CLI on Routing Engine2:
1. Download the software package from the Juniper Networks Support website: https://www.juniper.net/support/downloads/
2. Copy the package on primary node of the cluster. We recommend that you copy the package tothe/var/tmp directory, which is a large file system on the hard disk. Note that the node from whereyou initiate the ISSU must have the software image.
user@host>file copy ftp://username:[email protected]/filename /var/tmp/filename
3. Verify the current software version running on both nodes by issuing the show version command onthe primary node.
4. Start the ISSU from the node that is primary for all the redundancy groups by entering the followingcommand:
user@host> request system software in-service-upgrade image-name-with-full-path
For SRX1500, SRX4100, and SRX4200 devices, you can optionally remove the original image file byincluding unlink in the command.
user@host> request system software in-service-upgrade image-name-with-full-path unlink
Wait for both nodes to complete the upgrade (After which you are logged out of the device).
5. Wait a few minutes, and then log in to the device again. Verify by using the show version commandthat both devices in the cluster are running the new Junos OS release.
6. Verify that all policies, zones, redundancy groups, and other real-time objects (RTOs) return to theircorrect states.
7. Make node 0 the primary node again by issuing the request chassis cluster failover node node-numberredundancy-group group-number command.
If you want redundancy groups to automatically return to node 0 as the primary after an in-servicesoftware upgrade (ISSU), you must set the redundancy group priority such that node 0 is primary andenable the preempt option. Note that this method works for all redundancy groups except redundancygroup 0. You must manually set the failover for redundancy group 0.
To set the redundancy group priority and enable the preempt option, see "Example: Configuring ChassisCluster Redundancy Groups" on page 97.
To manually set the failover for a redundancy group, see "Initiating a Chassis Cluster ManualRedundancy Group Failover" on page 281.
515

During the upgrade, both devices might experience redundancy group failovers, but traffic is notdisrupted. Each device validates the package and checks version compatibility before beginning theupgrade. If the system finds that the new package version is not compatible with the currently installedversion, the device refuses the upgrade or prompts you to take corrective action. Sometimes a singlefeature is not compatible, in which case, the upgrade software prompts you to either terminate theupgrade or turn off the feature before beginning the upgrade.
If you want to operate the SRX Series device back as a standalone device or to remove a node from achassis cluster, ensure that you have terminated the ISSU procedure on both the nodes (in case ISSUprocedure is initiated)
To start ISSU process on Routing Engine3 for SRX 5K devices:
1. Run the following command to start ISSU:
user@host> request vmhost software in-service-upgrade image-name-with-full-path
SEE ALSO
In-Service Hardware Upgrade for SRX5K-RE-1800X4 and SRX5K-SCBE in a Chassis Cluster
Rolling Back Devices in a Chassis Cluster After an ISSU
If an ISSU fails to complete and only one device in the cluster is upgraded, you can roll back to theprevious configuration on the upgraded device alone by issuing one of the following commands on theupgraded device:
• request chassis cluster in-service-upgrade abort
• request system software rollback node node-id reboot
• request system reboot
Enabling an Automatic Chassis Cluster Node Failback After an ISSU
If you want redundancy groups to automatically return to node 0 as the primary after the an in-servicesoftware upgrade (ISSU), you must set the redundancy group priority such that node 0 is primary andenable the preempt option. Note that this method works for all redundancy groups except redundancy
516

group 0. You must manually set the failover for a redundancy group 0. To set the redundancy grouppriority and enable the preempt option, see "Example: Configuring Chassis Cluster Redundancy Groups"on page 97. To manually set the failover for a redundancy group, see "Initiating a Chassis Cluster ManualRedundancy Group Failover" on page 281.
To upgrade node 0 and make it available in the chassis cluster, manually reboot node 0. Node 0 does notreboot automatically.
Log Error Messages used for Troubleshooting ISSU-Related Problems
IN THIS SECTION
Chassisd Process Errors | 517
Understanding Common Error Handling for ISSU | 518
ISSU Support-Related Errors | 522
Initial Validation Checks Failure | 522
Installation-Related Errors | 524
Redundancy Group Failover Errors | 525
Kernel State Synchronization Errors | 526
The following problems might occur during an ISSU upgrade. You can identify the errors by using thedetails in the logs. For detailed information about specific system log messages, see System LogExplorer.
Chassisd Process Errors
IN THIS SECTION
Problem | 518
Solution | 518
517
Problem
Description
Errors related to chassisd.
Solution
Use the error messages to understand the issues related to chassisd.
When ISSU starts, a request is sent to chassisd to check whether there are any problems related to theISSU from a chassis perspective. If there is a problem, a log message is created.
Understanding Common Error Handling for ISSU
IN THIS SECTION
Problem | 518
Solution | 518
Problem
Description
You might encounter some problems in the course of an ISSU. This section provides details on how tohandle them.
Solution
Any errors encountered during an ISSU result in the creation of log messages, and ISSU continues tofunction without impact to traffic. If reverting to previous versions is required, the event is either loggedor the ISSU is halted, so as not to create any mismatched versions on both nodes of the chassis cluster.Table 37 on page 519 provides some of the common error conditions and the workarounds for them.The sample messages used in the Table 37 on page 519 are from the SRX1500 device and are alsoapplicable to all supported SRX Series devices.
518

Table 37: ISSU-Related Errors and Solutions
Error Conditions Solutions
Attempt to initiate anISSU when previousinstance of an ISSU isalready in progress
The following message is displayed:
warning: ISSU in progress
You can abort the current ISSU process, and initiate the ISSU again using the requestchassis cluster in-service-upgrade abort command.
Reboot failure on thesecondary node
No service downtime occurs, because the primary node continues to provide requiredservices. Detailed console messages are displayed requesting that you manually clearexisting ISSU states and restore the chassis cluster.
error: [Oct 6 12:30:16]: Reboot secondary node failed (error-code: 4.1)
error: [Oct 6 12:30:16]: ISSU Aborted! Backup node maybe in inconsistent state, Please restore backup node [Oct 6 12:30:16]: ISSU aborted. But, both nodes are in ISSU window. Please do the following: 1. Rollback the node with the newer image using rollback command Note: use the 'node' option in the rollback command otherwise, images on both nodes will be rolled back 2. Make sure that both nodes (will) have the same image 3. Ensure the node with older image is primary for all RGs 4. Abort ISSU on both nodes 5. Reboot the rolled back node
Starting with Junos OS Release 17.4R1, the hold timer for the initial reboot of thesecondary node during the ISSU process is extended from 15 minutes (900 seconds) to45 minutes (2700 seconds) in chassis clusters on SRX1500, SRX4100, SRX4200, andSRX4600 devices.
519

Table 37: ISSU-Related Errors and Solutions (Continued)
Error Conditions Solutions
Secondary nodefailed to complete thecold synchronization
The primary node times out if the secondary node fails to complete the coldsynchronization. Detailed console messages are displayed that you manually clearexisting ISSU states and restore the chassis cluster. No service downtime occurs in thisscenario.
[Oct 3 14:00:46]: timeout waiting for secondary node node1 to sync(error-code: 6.1) Chassis control process started, pid 36707
error: [Oct 3 14:00:46]: ISSU Aborted! Backup node has been upgraded, Please restore backup node [Oct 3 14:00:46]: ISSU aborted. But, both nodes are in ISSU window. Please do the following: 1. Rollback the node with the newer image using rollback command Note: use the 'node' option in the rollback command otherwise, images on both nodes will be rolled back 2. Make sure that both nodes (will) have the same image 3. Ensure the node with older image is primary for all RGs 4. Abort ISSU on both nodes 5. Reboot the rolled back node
520

Table 37: ISSU-Related Errors and Solutions (Continued)
Error Conditions Solutions
Failover of newlyupgraded secondaryfailed
No service downtime occurs, because the primary node continues to provide requiredservices. Detailed console messages are displayed requesting that you manually clearexisting ISSU states and restore the chassis cluster.
[Aug 27 15:28:17]: Secondary node0 ready for failover.[Aug 27 15:28:17]: Failing over all redundancy-groups to node0ISSU: Preparing for Switchovererror: remote rg1 priority zero, abort failover.[Aug 27 15:28:17]: failover all RGs to node node0 failed (error-code: 7.1)error: [Aug 27 15:28:17]: ISSU Aborted![Aug 27 15:28:17]: ISSU aborted. But, both nodes are in ISSU window.Please do the following:1. Rollback the node with the newer image using rollback command Note: use the 'node' option in the rollback command otherwise, images on both nodes will be rolled back2. Make sure that both nodes (will) have the same image3. Ensure the node with older image is primary for all RGs4. Abort ISSU on both nodes5. Reboot the rolled back node{primary:node1}
Upgrade failure onprimary
No service downtime occurs, because the secondary node fails over as primary andcontinues to provide required services.
Reboot failure onprimary node
Before the reboot of the primary node, devices being out of the ISSU setup, no ISSU-related error messages are displayed. The following reboot error message is displayed ifany other failure is detected:
Reboot failure on Before the reboot of primary node, devices will be out of ISSU setup and no primary node error messages will be displayed.Primary node
521

ISSU Support-Related Errors
IN THIS SECTION
Problem | 522
Solution | 522
Problem
Description
Installation failure occurs because of unsupported software and unsupported feature configuration.
Solution
Use the following error messages to understand the compatibility-related problems:
WARNING: Current configuration not compatible with /var/tmp/junos-srx5000-11.4X3.2-domestic.tgzExiting in-service-upgrade windowExiting in-service-upgrade window
Initial Validation Checks Failure
IN THIS SECTION
Problem | 522
Solution | 523
Problem
Description
The initial validation checks fail.
522

Solution
The validation checks fail if the image is not present or if the image file is corrupt. The following errormessages are displayed when initial validation checks fail when the image is not present and the ISSU isaborted:
When Image Is Not Present
user@host> ...0120914_srx_12q1_major2.2-539764-domestic.tgz rebootChassis ISSU StartedChassis ISSU StartedISSU: Validating ImageInitiating in-service-upgradeInitiating in-service-upgradeFetching package...error: File does not exist: /var/tmp/junos-srx1k3k-12.1I20120914_srx_12q1_major2.2-539764-domestic.tgzerror: Couldn't retrieve package /var/tmp/junos-srx1k3k-12.1I20120914_srx_12q1_major2.2-539764-domestic.tgzExiting in-service-upgrade windowExiting in-service-upgrade windowChassis ISSU AbortedChassis ISSU AbortedChassis ISSU AbortedISSU: IDLEISSU aborted; exiting ISSU window.
When Image File Is Corrupted
If the image file is corrupted, the following output displays:
user@host> ...junos-srx1k3k-11.4X9-domestic.tgz_1 rebootChassis ISSU Startednode1:--------------------------------------------------------------------------Chassis ISSU StartedISSU: Validating ImageInitiating in-service-upgrade
node1:--------------------------------------------------------------------------
523

Initiating in-service-upgradeERROR: Cannot use /var/tmp/junos-srx1k3k-11.4X9-domestic.tgz_1:gzip: stdin: invalid compressed data--format violatedtar: Child returned status 1tar: Error exit delayed from previous errorsERROR: It may have been corrupted during download.ERROR: Please try again, making sure to use a binary transfer.Exiting in-service-upgrade window
node1:--------------------------------------------------------------------------Exiting in-service-upgrade windowChassis ISSU AbortedChassis ISSU Aborted
node1:--------------------------------------------------------------------------Chassis ISSU AbortedISSU: IDLEISSU aborted; exiting ISSU window.
{primary:node0}
The primary node validates the device configuration to ensure that it can be committed using the newsoftware version. If anything goes wrong, the ISSU aborts and error messages are displayed.
Installation-Related Errors
IN THIS SECTION
Problem | 524
Solution | 525
Problem
Description
The install image file does not exist or the remote site is inaccessible.
524
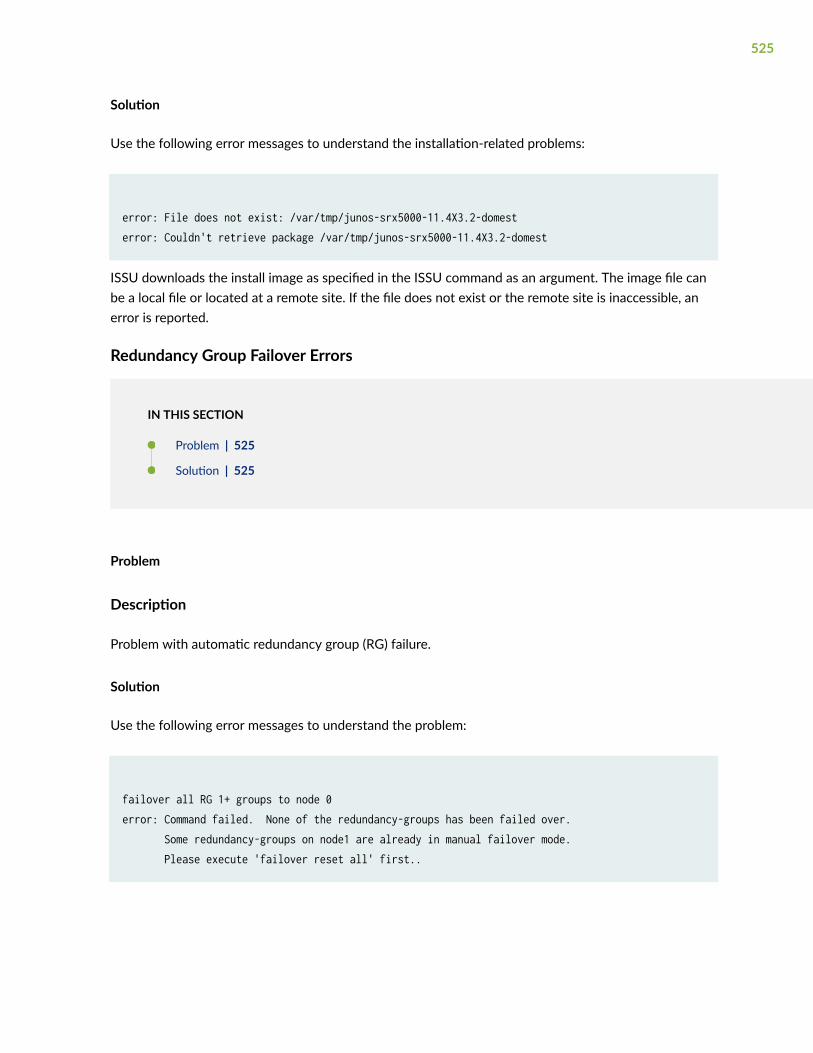
Solution
Use the following error messages to understand the installation-related problems:
error: File does not exist: /var/tmp/junos-srx5000-11.4X3.2-domesterror: Couldn't retrieve package /var/tmp/junos-srx5000-11.4X3.2-domest
ISSU downloads the install image as specified in the ISSU command as an argument. The image file canbe a local file or located at a remote site. If the file does not exist or the remote site is inaccessible, anerror is reported.
Redundancy Group Failover Errors
IN THIS SECTION
Problem | 525
Solution | 525
Problem
Description
Problem with automatic redundancy group (RG) failure.
Solution
Use the following error messages to understand the problem:
failover all RG 1+ groups to node 0error: Command failed. None of the redundancy-groups has been failed over. Some redundancy-groups on node1 are already in manual failover mode. Please execute 'failover reset all' first..
525

Kernel State Synchronization Errors
IN THIS SECTION
Problem | 526
Solution | 526
Problem
Description
Errors related to ksyncd.
Solution
Use the following error messages to understand the issues related to ksyncd:
Failed to get kernel-replication error information from Standby Routing Engine.mgd_slave_peer_has_errors() returns error at line 4414 in mgd_package_issu.
ISSU checks whether there are any ksyncd errors on the secondary node (node 1) and displays the errormessage if there are any problems and aborts the upgrade.
Managing Chassis Cluster ISSU-Related Problems
IN THIS SECTION
Viewing ISSU Progress | 527
Stopping ISSU Process if it Halts During an Upgrade | 528
Recovering the Node in Case of a Failed ISSU | 529
This topic includes the following sections:
526

Viewing ISSU Progress
IN THIS SECTION
Problem | 527
Solution | 527
Problem
Description
Rather than wait for an ISSU failure, you can display the progress of the ISSU as it occurs, noting anymessage indicating that the ISSU was unsuccessful. Providing such messages to JTAC can help withresolving the issue.
Solution
After starting an ISSU, issue the show chassis cluster information issu command. Output similar to thefollowing is displayed indicating the progress of the ISSU for all Services Processing Units (SPUs).
Note: Any management session to secondary node will be disconnected.Shutdown NOW![pid 2480]ISSU: Backup RE Prepare DoneWaiting for node1 to reboot.Current time: Tue Apr 22 14:37:32 2014Max. time to complete: 15min 0sec.Note: For real time ISSU status, open a new management session and run <show chassis cluster information issu> for detail informationnode1 booted up.Waiting for node1 to become secondaryCurrent time: Tue Apr 22 14:40:32 2014Max. time to complete: 60min 0sec.Note: For real time ISSU status, open a new management session and run<show chassis cluster information issu> for detail informationnode1 became secondary.Waiting for node1 to be ready for failover
527

ISSU: Preparing DaemonsCurrent time: Tue Apr 22 14:41:27 2014Max. time to complete: 60min 0sec.Note: For real time ISSU status, open a new management session and run <show chassis cluster information issu> for detail information Secondary node1 ready for failover.Installing package '/var/tmp/junos-srx5000-12.1I20140421_srx_12q1_x47.0-643920-domestic.tgz' ...Verified SHA1 checksum of issu-indb.tgzVerified junos-boot-srx5000-12.1I20140421_srx_12q1_x47.0-643920.tgz signed by PackageDevelopment_12_1_0Verified junos-srx5000-12.1I20140421_srx_12q1_x47.0-643920-domestic signed by PackageDevelopment_12_1_0
Stopping ISSU Process if it Halts During an Upgrade
IN THIS SECTION
Problem | 528
Solution | 528
Problem
Description
The ISSU process halts in the middle of an upgrade.
Solution
If the ISSU fails to complete and only one device in the cluster is upgraded, you can roll back to theprevious configuration on the upgraded device alone by issuing one of the following commands on theupgraded device:
• request chassis cluster in-service-upgrade abort to terminate the ISSU on both nodes.
• request system software rollback node node-id reboot to roll back the image.
• request system reboot to reboot the rolled back node.
528

Recovering the Node in Case of a Failed ISSU
IN THIS SECTION
Problem | 529
Solution | 529
Problem
Description
The ISSU procedure stops progressing.
Solution
Open a new session on the primary device and issue the request chassis cluster in-service-upgrade abortcommand.
This step terminates an in-progress ISSU . This command must be issued from a session other than theone on which you issued the request system in-service-upgrade command that launched the ISSU. If thenode is being upgraded, this command cancels the upgrade. The command is also helpful in recoveringthe node in case of a failed ISSU.
When an ISSU encounters an unexpected situation that necessitates a termination, the system messageprovides you with detailed information about when and why the upgrade stopped along withrecommendations for the next steps to take.
For example, the following message is issued when a node fails to become RG-0 secondary when itboots up:
Rebooting Secondary NodeShutdown NOW![pid 2120]ISSU: Backup RE Prepare DoneWaiting for node1 to reboot.node1 booted up.Waiting for node1 to become secondaryerror: wait for node1 to become secondary failed (error-code: 5.1)ISSU aborted. But, both nodes are in ISSU window.Please do the following:
529

1. Log on to the upgraded node.2. Rollback the image using rollback command with node optionNote: Not using the 'node' option might causethe images on both nodes to be rolled back3. Make sure that both nodes (will) have the same image4. Ensure the node with older image is primary for all RGs5. Abort ISSU on both nodes6. Reboot the rolled back node{primary:node0}
If you attempt to upgrade a device pair running a Junos OS release earlier than Release 9.6, ISSU failswithout changing anything on either device in the cluster. Devices running Junos OS releases earlierthan Release 9.6 must be upgraded separately using individual device upgrade procedures.
If the secondary device experiences a power-off condition before it boots up using the new imagespecified when the ISSU was initiated, the newly upgraded device will still be waiting to end the ISSUafter power is restored. To end the ISSU process on Routing Engine3 and Routing Engine2 on both thenodes, issue the request chassis cluster in-service-upgrade abort command.
Release History Table
Release Description
17.4R1 Starting with Junos OS Release 17.4R1, SRX4600 devices support ISSU.
17.4R1 Starting with Junos OS Release 17.4R1, the hold timer for the initial reboot of the secondary nodeduring the ISSU process is extended from 15 minutes (900 seconds) to 45 minutes (2700 seconds)in chassis clusters on SRX1500, SRX4100, SRX4200, and SRX4600 devices.
15.1X49-D80 Starting with Junos OS Release 15.1X49-D80, SRX4100 and SRX4200 devices support ISSU.
15.1X49-D80 Starting with Junos OS Release 15.1X49-D80, SRX4100 and SRX4200 devices support ISSU.
15.1X49-D70 Starting with Junos OS Release 15.1X49-D70, SRX1500 devices support ISSU.
15.1X49-D70 Starting with Junos OS Release 15.1X49-D70, SRX1500 devices support ISSU.
RELATED DOCUMENTATION
Upgrading Individual Devices in a Chassis Cluster Separately | 504
Upgrading Devices in a Chassis Cluster Using ICU | 504
Disabling a Chassis Cluster | 531
530

Disabling a Chassis Cluster
If you want to operate the SRX Series device back as a standalone device or to remove a node from achassis cluster, you must disable the chassis cluster.
The node could fail to load the configuration if you disable the cluster and the configuration containsgroups 'node0', 'node1' defining key resources. These groups (automatically generated in case of acluster) will exist no more and the resulting configuration could be inconsistent.
In such events, the node will come up partially amnesiac (logins will be remembered).
To disable chassis cluster, enter the following command:
{primary:node1}user@host> set chassis cluster disable rebootSuccessfully disabled chassis cluster. Going to reboot now.
After the system reboots, the chassis cluster is disabled.
After the chassis cluster is disabled using this CLI command, you do not have a similar CLI option toenable it back.
To restore the chassis cluster, set the cluster-id by entering the following command:
{primary:node1}user@host> set chassis cluster cluster-id node node-number reboot
When setting the cluster, the secondary node PFEMAN process will restart.
You can also use the below CLI commands to disable chassis cluster:
• To disable cluster on node 0:
user@host> set chassis cluster cluster-id 0 node 0 reboot
• To disable cluster on node 1:
user@host> set chassis cluster cluster-id 0 node 1 reboot
Setting cluster-id to zero disables clustering on a device.
531

RELATED DOCUMENTATION
Upgrading Individual Devices in a Chassis Cluster Separately | 504
Upgrading Devices in a Chassis Cluster Using ICU | 504
set chassis cluster disable reboot | 771
set chassis cluster cluster-id node node-number reboot | 773
532

6CHAPTER
Troubleshooting
Troubleshooting a Control Link Failure in an SRX Chassis Cluster | 534
Troubleshooting a Fabric Link Failure in an SRX Chassis Cluster | 536
Troubleshooting a Redundancy Group that Does Not Fail Over in an SRX ChassisCluster | 539
Troubleshooting an SRX Chassis Cluster with One Node in the Primary State andthe Other Node in the Disabled State | 544
Troubleshooting an SRX Chassis Cluster with One Node in the Primary State andthe Other Node in the Lost State | 548
Troubleshooting an SRX Chassis Cluster with One Node in the Hold State and theOther Node in the Lost State | 551
Troubleshooting Chassis Cluster Management Issues | 555
Data Collection for Customer Support | 580

Troubleshooting a Control Link Failure in an SRXChassis Cluster
IN THIS SECTION
Problem | 534
Diagnosis | 535
Problem
Description
The control link fails to come up in an SRX chassis cluster.
Environment
SRX chassis cluster
Symptoms
The chassis cluster is down due to a control link failure. The status of the control link is displayed as downin the output of the show chassis cluster interfaces command. Here are sample outputs for an SRX branchdevice and a high-end SRX device.
{primary:node0}root@J-SRX-branch> show chassis cluster interfacesControl link 0 name: fxp1Control link status: Down
{primary:node0}root@J-SRX-highend> show chassis cluster interfacesControl link 0 name: em0
534

Control link 1 name: em1Control link status: Down
Diagnosis
1. Are the control link ports connected through a switch?
• Yes: Remove the switch and connect the control link ports directly. Reboot the secondary nodeand check whether the control link is up.
• If the link is up, then there might be an issue in the chassis cluster setup on the Layer 2 switchnetwork. See SRX Series Gateway Cluster Deployment in Layer 2 Network.
• If the link is down, proceed to Step 2.
• No: Proceed to Step 2.
2. Are the link LEDs for the control link ports on both the nodes lit green?
• Yes: Proceed to Step 4.
• No: The control link cable might be faulty. Proceed to Step 3.
3. Change the cable connecting the control link ports and check the link LED. Is the LED lit green?
• Yes: This indicates that the original cable was faulty. Reboot both the nodes simultaneously tocome out of the bad state. If the control link does not come up after the reboot, proceed to Step4.
• No: Open a case with your technical support representative to resolve the issue. Proceed to "DataCollection for Customer Support" on page 580.
4. Is this device an SRX5400, SRX5600, or SRX5800?
• Yes: Reconfigure the control link on a different Services Processing Card (SPC), connect the cableto the new port, and reboot both the nodes.
a. Check whether the control link status is up:
• If the link is up, the issue is resolved.
There might be a hardware issue with the SPC. Open a case with your technical supportrepresentative to resolve the hardware issue. Proceed to "Data Collection for CustomerSupport" on page 580.
• If the link is still down, the transceivers might be faulty. Proceed to Step 5.
535

• No: Verify that the correct ports are connected (see the following table):
Port Type Port
Management (fxp0) An Ethernet port on the Routing Engine
HA Control(fxp1 or em0/em1)
• Port 0 (fiber only) on SPC—em0
• Port 1 (fiber only) on SPC—em1
Fabric(fab0 and fab1)
Any available ge or xe interface (fiber only)
If the ports are connected correctly, and the link is still down, proceed to Step 5.
5. If the control link port is an SFP or XFP port, change the transceivers on both the nodes. Ensure thatyou use transceivers provided by Juniper Networks and that the transceivers are of the same type(such as LX or SX). Is the control link up now?
• Yes: The issue is resolved.
The transceiver might be faulty. Open a case with your technical support representative toresolve the issue with the transceivers. Proceed to "Data Collection for Customer Support" onpage 580.
• No: Continue to troubleshoot this issue with your technical support representative. Proceed to"Data Collection for Customer Support" on page 580.
Troubleshooting a Fabric Link Failure in an SRXChassis Cluster
IN THIS SECTION
Problem | 537
Diagnosis | 538
536

Problem
Description
The fabric link fails to come up in an SRX chassis cluster.
Environment
SRX chassis cluster
Symptoms
The status of the fabric link is displayed as down in the output of the show chassis cluster interfacescommand. Here are sample outputs for an SRX branch device and a high-end SRX device.
{primary:node0} root@SRX_Branch> show chassis cluster interfaces Control link 0 name: fxp1 Control link status: Up
Fabric interfaces: Name Child-interface Status fab0 ge-0/0/2 down fab0 fab1 ge-9/0/2 down fab1 Fabric link status: down
{primary:node0}root@SRX_HighEnd> show chassis cluster interfacesControl link 0 name: em0Control link 1 name: em1Control link status: up
Fabric interfaces:Name Child-interface Statusfab0 ge-0/0/5 downfab0Fabric link status: down
537

Diagnosis
1. Are the fabric link ports connected through a switch?
• Yes: Remove the switch and connect the fabric link ports directly. Reboot the secondary node andcheck whether the fabric link is up.
• If the link is up, then there might be an issue in the chassis cluster setup on the Layer 2 switchnetwork. See SRX Series Gateway Cluster Deployment in Layer 2 Network.
• If the link is down, proceed to Step 2.
• No: Proceed to Step 2.
2. Are the link LEDs for the fabric link ports on both the nodes lit green?
• Yes: The physical link is up, but the fabric packets are not being processed. To eliminate possibleissues with the port:
a. Reconfigure the fabric link on a different port, connect the cable to the new port, and rebootthe secondary node.
b. Check whether the fabric link status is up:
• If the link is up, the issue is resolved.
There might be a hardware issue with the onboard ports or interface module ports onwhich you had previously configured the fabric link. Verify the interface statistics by usingthe show interfaces interface-name command. Open a case with your technical supportrepresentative to resolve the issue with the ports. Proceed to "Data Collection forCustomer Support" on page 580.
• If the link is still down, open a case with your technical support representative. Proceed to"Data Collection for Customer Support" on page 580.
• No: The fabric link cable might be faulty. Proceed to Step 3.
3. Change the cable connecting the fabric link ports and check the link LED. Is the LED lit green?
• Yes: This indicates that the original cable was faulty. Reboot both the nodes simultaneously tocome out of the bad state. If the fabric link does not come up after the reboot:
a. Reconfigure the fabric link on a different port, connect the cable to the new port, and rebootthe secondary node.
b. Check whether the fabric link status is up:
• If the link is up, the issue is resolved.
538

There might be a hardware issue with the onboard ports or interface module ports onwhich you had previously configured the fabric link. Verify the interface statistics by usingthe show interfaces interface-name command. Open a case with your technical supportrepresentative to resolve the issue with the ports. Proceed to "Data Collection forCustomer Support" on page 580.
• If the link is still down, open a case with your technical support representative. Proceed to"Data Collection for Customer Support" on page 580.
• No: The transceivers might be faulty. Proceed to step 4.
4. If the fabric link port is an SFP or XFP port, change the transceivers on both the nodes. Ensure thatyou use transceivers provided by Juniper Networks and that the transceivers are of the same type(such as LX or SX). Is the fabric link up now?
• Yes: The issue is resolved.
The original transceivers used on the fabric link ports might be faulty. Open a case with yourtechnical support representative to resolve the issue with the transceivers. Proceed to "DataCollection for Customer Support" on page 580.
• No: Continue to troubleshoot this issue with your technical support representative. Proceed to"Data Collection for Customer Support" on page 580.
Troubleshooting a Redundancy Group that Does NotFail Over in an SRX Chassis Cluster
IN THIS SECTION
Problem | 540
Diagnosis | 540
Resolution | 541
What's Next | 543
539

Problem
Description
A redundancy group (RG) in a high-availability (HA) SRX chassis cluster does not fail over.
Environment
SRX chassis cluster
Diagnosis
From the command prompt of the SRX Series Services Gateway that is part of the chassis cluster, runthe show chassis cluster status command.
Sample output:
Cluster ID: 1Node Priority Status Preempt Manual failover
Redundancy group: 0 , Failover count: 0node0 150 primary no nonode1 100 secondary no no
Redundancy group: 1 , Failover count: 0node0 255 primary yes nonode1 100 secondary yes no
In the sample output check the priority of the redundancy group that does not fail over.
• If the Priority is 255 and the Manual failover field is yes, proceed to "Redundancy Group ManualFailover" on page 541.
• If the priority is 0 or anything between 1 and 254, proceed to "Redundancy Group Auto Failover" onpage 542
540
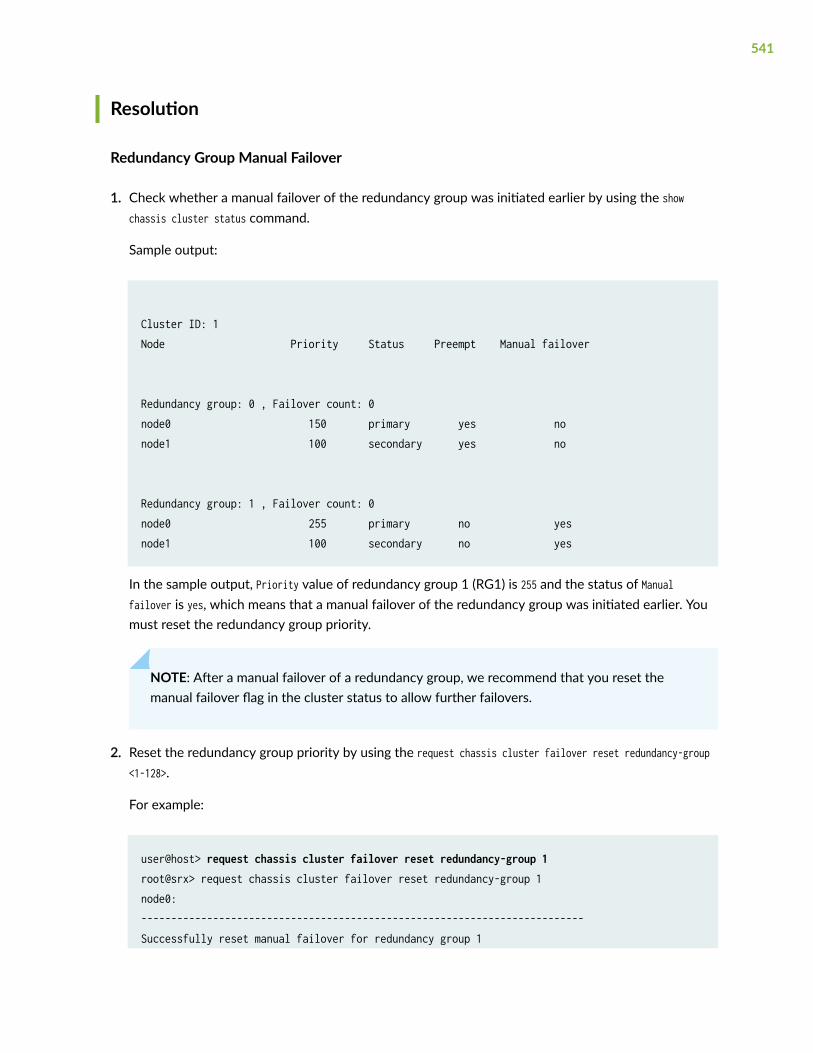
Resolution
Redundancy Group Manual Failover
1. Check whether a manual failover of the redundancy group was initiated earlier by using the showchassis cluster status command.
Sample output:
Cluster ID: 1Node Priority Status Preempt Manual failover
Redundancy group: 0 , Failover count: 0node0 150 primary yes nonode1 100 secondary yes no
Redundancy group: 1 , Failover count: 0node0 255 primary no yesnode1 100 secondary no yes
In the sample output, Priority value of redundancy group 1 (RG1) is 255 and the status of Manualfailover is yes, which means that a manual failover of the redundancy group was initiated earlier. Youmust reset the redundancy group priority.
NOTE: After a manual failover of a redundancy group, we recommend that you reset themanual failover flag in the cluster status to allow further failovers.
2. Reset the redundancy group priority by using the request chassis cluster failover reset redundancy-group<1-128>.
For example:
user@host> request chassis cluster failover reset redundancy-group 1root@srx> request chassis cluster failover reset redundancy-group 1 node0:--------------------------------------------------------------------------Successfully reset manual failover for redundancy group 1
541

node1:--------------------------------------------------------------------------No reset required for redundancy group 1.
3. This must resolve the issue and allow further redundancy group failovers. If these steps do notresolve the issue, proceed to section Whats Next.
4. If you want to initiate a redundancy group x (redundancy groups numbered 1 through 128) failovermanually, see Understanding Chassis Cluster Redundancy Group Manual Failover.
Redundancy Group Auto Failover
1. Check the configuration and link status of the control and fabric links by using the show chassis clusterinterfaces command.
Sample output for a branch SRX Series Services Gateway:
{primary:node0}root@SRX_Branch> show chassis cluster interfacesControl link 0 name: fxp1Control link status: Up
Fabric interfaces:Name Child-interface Statusfab0 ge-0/0/2 downfab0fab1 ge-9/0/2 downfab1Fabric link status: down
Sample output for a high-end SRX Series Services Gateway:
{primary:node0}root@SRX_HighEnd> show chassis cluster interfacesControl link 0 name: em0Control link 1 name: em1Control link status: up
542

Fabric interfaces:Name Child-interface Statusfab0 ge-0/0/5 downfab0Fabric link status: down
• If the control link is down, see KB article KB20698 to troubleshoot and bring up the control linkand proceed to "3" on page 543.
• If the fabric link is down, see "Troubleshooting a Fabric Link Failure in an SRX Chassis Cluster" onpage 536 to troubleshoot and bring up the fabric link and proceed to "3" on page 543.
2. Proceed to Step "3" on page 543 if both the control link and fabric link are up.
3. Check the interface monitoring or IP monitoring configurations that are up. If the configurations arenot correct rectify the configurations. If the configurations are correct proceed to step "4" on page543.
4. Check the priority of each node in the output of the show chassis cluster status command.
• If the priority is 0, see KB article KB16869 for JSRP (Junos OS Services Redundancy Protocol)chassis clusters and KB article KB19431 for branch SRX Series Services Gateways.
• If the priority is 255, see "Redundancy Group Manual Failover" on page 541.
• If the priority is between 1 and 254 and if still the redundancy group does not fail over, proceed tothe section Whats Next.
WHAT'S NEXT
If these steps do not resolve the issue, see KB article KB15911 for redundancy group failover tips.
If you wish to debug further, see KB article KB21164 to check the debug logs.
To open a JTAC case with the Juniper Networks Support team, see "Data Collection for CustomerSupport" | 580 for the data you should collect to assist in troubleshooting before you open a JTACcase.
543
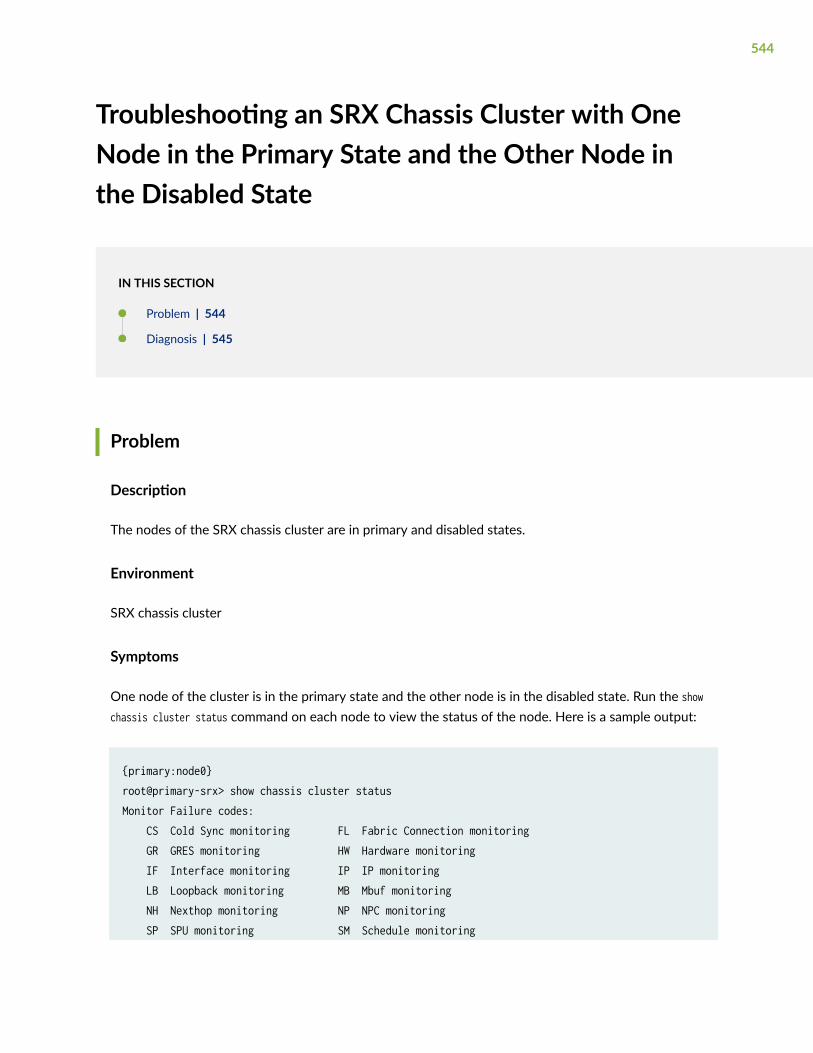
Troubleshooting an SRX Chassis Cluster with OneNode in the Primary State and the Other Node inthe Disabled State
IN THIS SECTION
Problem | 544
Diagnosis | 545
Problem
Description
The nodes of the SRX chassis cluster are in primary and disabled states.
Environment
SRX chassis cluster
Symptoms
One node of the cluster is in the primary state and the other node is in the disabled state. Run the showchassis cluster status command on each node to view the status of the node. Here is a sample output:
{primary:node0}root@primary-srx> show chassis cluster status Monitor Failure codes: CS Cold Sync monitoring FL Fabric Connection monitoring GR GRES monitoring HW Hardware monitoring IF Interface monitoring IP IP monitoring LB Loopback monitoring MB Mbuf monitoring NH Nexthop monitoring NP NPC monitoring SP SPU monitoring SM Schedule monitoring
544

CF Config Sync monitoring RE Relinquish monitoring Cluster ID: 1Node Priority Status Preempt Manual Monitor-failures
Redundancy group: 0 , Failover count: 1node0 255 primary no no None node1 129 disabled no no None
Redundancy group: 1 , Failover count: 1node0 255 primary no no None node1 129 disabled no no None
Diagnosis
1. Run the show chassis cluster interfaces command to verify the status of the control and fabric links. Areany of the links down?
Here are sample outputs for a branch SRX Series device and a high-end SRX Series device.
root@Branch-SRX> show chassis cluster interfacesControl link 0 name: fxp1Control link status: Up
Fabric interfaces:Name Child-interface Statusfab0 ge-0/0/2 upfab0 ge-2/0/6 upfab1 ge-9/0/2 upfab1 ge-11/0/6 upFabric link status: Up
{primary:node0}root@High-end-SRX> show chassis cluster interfacesControl link 0 name: em0Control link 1 name: em1Control link status: Up
545

Fabric interfaces:Name Child-interface Statusfab0 ge-2/0/0 downfab0fab1fab1Fabric link status: Up
• Yes: See "Troubleshooting a Fabric Link Failure in an SRX Chassis Cluster" on page 536 or"Troubleshooting a Control Link Failure in an SRX Chassis Cluster" on page 534.
• No: Proceed to Step 2.
2. Reboot the disabled node. Does the node come up in the disabled state after the reboot?
• Yes: There might be hardware issues. Proceed to Step 3.
• No: The issue is resolved.
3. Check the node for any hardware issues. Run the show chassis fpc pic-status command on both nodes,and ensure that the FPCs are online. Do you see the status of any FPC listed as Present, OK, or Offline?
Here is a sample output.
{primary:node1}root@J-SRX> show chassis fpc pic-statusnode0:--------------------------------------------------------------------------Slot 0 Online FPC PIC 0 Online 4x GE Base PICSlot 2 Online FPC PIC 0 Online 24x GE gPIMSlot 6 Online FPC PIC 0 Online 2x 10G gPIM
node1:--------------------------------------------------------------------------Slot 0 Online FPC PIC 0 Online 4x GE Base PICSlot 2 Online FPC PIC 0 Online 24x GE gPIMSlot 6 Online FPC PIC 0 Online 2x 10G gPIM
546

• Yes: Reseat the cards and reboot the node. If this does not resolve the issue, open a case withyour technical support representative for further troubleshooting. See "Data Collection forCustomer Support" on page 580.
• No: Proceed to Step 4.
4. Run the show chassis cluster statistics on both nodes, and analyze the output.
{primary:node0}root@J-SRX> show chassis cluster statisticsControl link statistics: Control link 0: Heartbeat packets sent: 418410 Heartbeat packets received: 418406 Heartbeat packet errors: 0Fabric link statistics: Probes sent: 418407 Probes received: 414896 Probe errors: 0
Does the Heartbeat packets received field show a non-increasing value or zero (0), or does the Heartbeatpacket errors field show a non-zero value?
• Yes: Open a case with your technical support representative for further troubleshooting. See"Data Collection for Customer Support" on page 580.
• No: Proceed to Step 5.
5. Configure set chassis cluster no-fabric-monitoring (hidden option) and commit the configuration totemporarily disable fabric monitoring during the troubleshooting process. Reboot the disabled node.After the node reboots, run the show chassis cluster statistics command. Are the probes still lost?
• Yes: Open a case with your technical support representative for further troubleshooting. See"Data Collection for Customer Support" on page 580
• No: Delete the set chassis cluster no-fabric-monitoring configuration, and verify that everything isoperational. If you notice any issue, open a case with your technical support representative forfurther troubleshooting. See "Data Collection for Customer Support" on page 580
547

Troubleshooting an SRX Chassis Cluster with OneNode in the Primary State and the Other Node inthe Lost State
IN THIS SECTION
Problem | 548
Diagnosis | 549
Problem
Description
The nodes of the SRX chassis cluster are in primary and lost states.
Environment
SRX chassis cluster
Symptoms
One node of the cluster is in the primary state and the other node is in the lost state. Run the showchassis cluster status command on each node to view the status of the node. Here is a sample output:
{primary:node0}root@primary-srx> show chassis cluster status Cluster ID: 1 Node Priority Status Preempt Manual failover
Redundancy group: 0 , Failover count: 1 node0 100 primary no no node1 0 lost no no
548

Redundancy group: 1 , Failover count: 1 node0 100 primary no no node1 0 lost no no
Diagnosis
1. Is the node that is in the lost state powered on?
• Yes: Are you able to access the node that is in the lost state through a console port? Do not useTelnet or SSH to access the node.
• If you are able to access the node, proceed to Step 3.
• If you are unable to access the node and if the device is at a remote location, access the nodethrough a console for further troubleshooting. If you have console access, but do not see anyoutput, it might indicate a hardware issue. Open a case with your technical supportrepresentative for further troubleshooting. See "Data Collection for Customer Support" onpage 580.
• No: Power on the node and proceed to Step 2.
2. After both nodes are powered on, run the show chassis cluster status command again. Is the node stillin the lost state?
• Yes: Are you able to access the node that is in the lost state through a console port? Do not useTelnet or SSH to access the node.
• If you are able to access the node, proceed to Step 3.
• If you are unable to access the node and if the node is at a remote location, access the nodethrough a console for further troubleshooting. If you have console access, but do not see anyoutput, it might indicate a hardware issue. Open a case with your technical supportrepresentative for further troubleshooting. See "Data Collection for Customer Support" onpage 580.
• No: Powering on the device has resolved the issue.
3. Connect a console to the primary node, and run the show chassis cluster status command. Does theoutput show this node as primary and the other node as lost?
• Yes: This might indicate a split-brain scenario. Each node would show itself as primary and theother node as lost. Run the following commands to verify which node is processing the traffic:
• show security monitoring
549

• show security flow session summary
• monitor interface traffic
Isolate the node that is not processing the traffic. You can isolate the node from the network byremoving all the cables except the control and fabric links. Proceed to Step 4.
• No: Proceed to Step 4.
4. Verify that all the FPCs are online on the node that is in the lost state by running the show chassis fpcpic-status command. Are all the FPCs online?
• Yes: Proceed to Step 5.
• No: Open a case with your technical support representative for further troubleshooting. See"Data Collection for Customer Support" on page 580.
5. Are the nodes connected through a switch?
• Yes: See "Troubleshooting a Fabric Link Failure in an SRX Chassis Cluster" on page 536 and"Troubleshooting a Control Link Failure in an SRX Chassis Cluster" on page 534.
• No: Proceed to Step 6.
6. Create a backup of the configuration from the node that is currently primary:
{primary:node0} root@primary-srx# show configuration | save /var/tmp/cfg-bkp.txt
Copy the configuration to the node that is in the lost state, and load the configuration:
root@lost-srx# load override <terminal or filename>
NOTE: If you use the terminal option, paste the complete configuration into the window. Makesure that you use Ctrl+D at the end of the configuration.
If you use the filename option, provide the path to the configuration file (forexample: /var/tmp/Primary_saved.conf), and press Enter.
When you connect to the node in the lost state through a console, you might see the state as eitherprimary or hold/disabled. If the node is in the hold/disabled state, a fabric link failure might haveoccurred before the device went into the lost state. To troubleshoot this issue, follow the steps in"Troubleshooting a Fabric Link Failure in an SRX Chassis Cluster" on page 536.
550

Commit the changes after the configuration is loaded. If the problem persists, then replace theexisting control and fabric links on this device with new cables and reboot the node:
{primary:node1}[edit]root@lost-srx# request system reboot
Is the issue resolved?
• No: Open a case with your technical support representative for further troubleshooting. See"Data Collection for Customer Support" on page 580.
Troubleshooting an SRX Chassis Cluster with OneNode in the Hold State and the Other Node in theLost State
IN THIS SECTION
Problem | 551
Cause | 552
Resolution | 553
Problem
Description
The nodes of the SRX chassis cluster are in hold and lost states.
Environment
SRX chassis cluster
551

Symptoms
One node of the SRX chassis cluster is in the hold state and the other node is in the lost state after youconnect the cables and reboot the devices in cluster mode. Run the show chassis cluster status commandon each node to view the status of the node. Here is a sample output:
{hold:node0} user@node0> show chassis cluster status
Cluster ID: 1, Redundancy-group: 0 Node name Priority Status Preempt Manual failover node0 100 hold No No node1 1 lost No No
{hold:node1}user@node1> show chassis cluster statusCluster ID: 1, Redundancy-group: 0Node name Priority Status Preempt Manual failovernode0 100 lost No Nonode1 1 hold No No
If the status of a node is hold, the node is not ready to operate in a chassis cluster.
NOTE: This issue does not impact high-end SRX Series devices because these devices havededicated control and management ports.
Cause
When you boot a branch SRX Series device in cluster mode, two revenue interfaces (depending uponthe model of the device) are designated for the out-of-band management link (fxp0) and control link(fxp1) of the chassis cluster. The fxp0 and fxp1 ports cannot be used for transit traffic.
If you configure the fxp0 and fxp1 ports, the chassis cluster goes into the hold/lost state. The followingtable lists the ports that are designated as fxp0 and fxp1 ports for branch SRX Series devices:
552

Table 38: fxp0 and fxp1 Ports on Branch SRX Series Devices
Device Management (fxp0) HA Control (fxp1) Fabric (fab0 and fab1)—must be configured
SRX300 ge-0/0/0 ge-0/0/1 Any ge interface
SRX320 ge-0/0/0 ge-0/0/1 Any ge interface
SRX340, SRX345, andSRX380
MGMT ge-0/0/1 Any ge interface
SRX550 HM ge-0/0/0 ge-0/0/1 Any ge or xe interface
Resolution
Remove the Configuration on a Device Running the Factory-Default Configuration
The factory-default configuration includes configuration for the interfaces that are transformed intofxp0 and fxp1 interfaces. You must delete these configurations before enabling chassis cluster mode. Adevice can have the factory-default configuration in the following scenarios:
• Typically, new devices are used in a chassis cluster. These new devices ship with the factory-defaultconfiguration, which includes configuration for the interfaces.
• If a device that is in chassis cluster mode crashes, the device might come up with the factory-defaultconfiguration.
To remove the configuration on the interfaces, delete the factory-default configuration and reconfigurethe device.
CAUTION: The following procedure removes the current configuration.
1. Log in to the device and enter the configuration mode.
553

2. Run the delete command to delete the current configuration from the device.
root# deleteThis will delete the entire configurationDelete everything under this level? [yes,no] (no) yes
3. Configure the root password and commit the configuration:
root# set system root-authentication plain-text-passwordroot# commit
Remove the Configuration on a Device Operating as a Standalone Device
If the device is currently running in a production environment, then check whether the interfaces thatare designated as the fxp0 and fxp1 interfaces are configured. To determine which interfaces aretransformed into fxp0 and fxp1 interfaces, see Table 38 on page 553.
1. Run the following commands to list the configuration for the fxp0 and fxp1 interfaces:
show | display set | match <physical interface of the control port (fxp1)>show | display set | match <physical interface of the management port (fxp0)>
For example:
show configuration | display set | match ge-0/0/0show configuration | display set | match ge-0/0/1
2. Delete all the configurations related to the interfaces from every configuration hierarchy.
You can also choose to delete the entire configuration and reconfigure the device:
root# delete
554

Troubleshooting Chassis Cluster Management Issues
IN THIS SECTION
Unable to Manage an SRX Series Chassis Cluster Using the Management Port or Revenue Ports | 555
Unable to Manage the Secondary Node of a Chassis Cluster Using J-Web | 567
Unable to Manage an SRX Series Chassis Cluster Using fxp0 When the Destination in the Backup Router is0/0 | 569
Unable to Upgrade a Chassis Cluster Using In-Service Software Upgrade | 575
Configuring backup-router Command on Chassis Cluster | 577
Unable to Upgrade a Chassis Cluster Using In-Service Software Upgrade | 578
Unable to Manage an SRX Series Chassis Cluster Using the ManagementPort or Revenue Ports
IN THIS SECTION
Problem | 555
Diagnosis | 556
Resolution | 556
Problem
Description
Cannot manage the SRX Series chassis cluster using the management port or revenue ports.
Environment
SRX Series chassis cluster
555

Diagnosis
1. Which node in the chassis cluster are you using to manage the cluster?
• Primary node—Proceed to:
• Manage the Chassis Cluster Using J-Web.
NOTE: You can use J-Web to manage only the primary node.
• Manage the Chassis Cluster Using the Revenue Port or fxp0 Management Port.
NOTE: You can use the revenue port or fxp0 management port to manage the primarynode.
• Secondary node—Proceed to "Manage the Chassis Cluster Using the fxp0 Management Port" onpage 565
NOTE: You can manage the secondary node only by using the fxp0 management port.
Resolution
Manage the Chassis Cluster Using J-Web
NOTE: You can use J-Web to manage only the primary node.
1. Connect a console to the primary node.
2. Using the CLI, run the show system services web-management command.
3. Check whether the loopback interface (lo0) is configured under the Web management HTTP/HTTPSconfiguration. See web-management (System Services) .
4. If the loopback interface (lo0) is configured under the Web management HTTP/HTTPS configuration,remove the loopback interface by running the delete system services web-management http interface lo.0command.
5. Commit the change, and check whether you can now manage the chassis cluster.
556

6. If you still cannot manage the chassis cluster, proceed to "Manage Chassis Cluster Using the RevenuePort or fxp0 Management Port" on page 562.
Manage Chassis Cluster Using the Revenue Port or fxp0 Management Port
NOTE: You can use both the revenue port or fxp0 management port to manage the primarynode.
1. Connect to a console using the revenue port of the primary node which you want to use as amanagement interface.
2. Verify the configuration of the management interface:
a. Verify that the required system services (SSH, Telnet, HTTP) are enabled at the host-inbound-traffic hierarchy level in the relevant zone:
zones { security-zone trust { host-inbound-traffic { system-services { any-service; } protocols { all; } } interfaces { reth0.0 reth0.1; } }
b. Verify that the required system services (SSH, Telnet, HTTP) are enabled at the system serviceshierarchy level:
{primary:node1}[edit]root# show system services { http; ssh;
557

telnet; }
3. Does ping to the management interface work?
• Yes: See Unable to Manage an SRX Series Chassis Cluster Using fxp0 When the Destination in theBackup Router is 0/0. If this solution doesn't work, proceed to "What’s Next" on page 566 toopen a case with Juniper Networks technical support.
• No: Proceed to step "4" on page 558.
4. Using the CLI, run the show interfaces terse command:
In the output, is the status of FXP0 interface Up, and does it provide an IP address?
• Yes: Proceed to step "5" on page 559.
• No: Verify the following:
a. Using the CLI, verify that the fxp0 interface is configured correctly: show groups.
Sample output:
root@srx# show groupsnode0 { system { host-name SRX3400-1; backup-router 192.168.1.254 destination 0.0.0.0/0; } interfaces { fxp0 { unit 0 { family inet { address 192.168.1.1/24; } } } } } node1 { system { host-name SRX3400-2; backup-router 192.168.1.254 destination 0.0.0.0/0; } interfaces {
558

fxp0 { unit 0 { family inet { address 192.168.1.2/24; } } } } }}apply-groups "${NODE}";system { services { ftp; ssh; telnet; }}
b. Check the condition of the cable that is connected to the fxp0 interface. Is the cable in goodcondition?
• Yes: Proceed to the next step.
• No: Replace the cable and try to manage the chassis cluster. If you still cannot manage thechassis cluster, proceed to the next step.
c. Using the CLI, check for incrementing error counters: show interfaces fxp0.0 extensive.
• Yes: If you find any errors in the output, proceed to "What’s Next" on page 566 to open acase with Juniper Networks technical support.
• No: If there are no errors in the output and if you still cannot manage the chassis cluster,proceed to step "5" on page 559.
5. Check whether the IP address of the fxp0 interface and the IP address of the management device arein the same subnet.
• Yes: Proceed to the step "6" on page 560.
• No: Using the CLI, check if there is a route for the management device IP address: show route<management device IP>:
a. If a route does not exist for the management device IP address, add a route for themanagement subnet in the inet.0 table with the next-hop as the backup router IP address.
559

6. Using the CLI, check whether there is an ARP entry for the management device on the servicesgateway: show arp no-resolve | match <ip>.
a. Yes: Check whether the chassis cluster has multiple routes to the management device: showroute <device-ip>.
• Yes: There could be routes to the management device through the fxp0 interface and otherinterface leading to asymmetric routing. Proceed to "What’s Next" on page 566 to open acase with Juniper Networks technical support.
• No: Proceed to "Manage the Chassis Cluster Using the fxp0 Management Port" on page 565.
b. No: Proceed to "What’s Next" on page 566 to open a case with Juniper Networks technicalsupport.
Manage the Chassis Cluster Using the fxp0 Management Port
NOTE: You can use only the fxp0 management port to manage the secondary node.
1. Verify the configuration of management interface on the secondary node:
• Verify that the required system services (SSH, Telnet, HTTP) are enabled at the host-inbound-traffic hierarchy level:
zones { security-zone trust { host-inbound-traffic { system-services { any-service; } protocols { all; } } interfaces { reth0.0 reth0.1; } }
560

• Verify that the required system services (SSH, Telnet, HTTP) are enabled at the system serviceshierarchy level:
{primary:node1}[edit]root# show system services { http; ssh; telnet; }
See Unable to Manage an SRX Series Chassis Cluster Using fxp0 When the Destination in theBackup Router is 0/0 and Configuring backup-router Command on Chassis Cluster for moreinformation about the configuration guidelines.
If the configuration is correct and you still cannot manage the chassis cluster, proceed to step "2" onpage 561.
2. Are the IP addresses of the fxp0 interfaces of the primary node and the secondary node in the samesubnet?
• Yes: Proceed to "What’s Next" on page 566.
• No: Configure the fxp0 interfaces of the primary node and the secondary node in the samesubnet. Go to step "1" on page 560 and verify the configuration.
What’s Next
• If the issue persists, see KB Article KB20795.
• If you wish to debug further, see KB Article KB21164 to check the debug logs.
• To open a JTAC case with the Juniper Networks support team, see Data Collection for CustomerSupport for the data you should collect to assist in troubleshooting prior to opening a JTAC case.
Manage the Chassis Cluster Using J-Web
NOTE: You can use J-Web to manage only the primary node.
1. Connect a console to the primary node.
2. Using the CLI, run the show system services web-management command.
561

3. Check whether the loopback interface (lo0) is configured under the Web management HTTP/HTTPSconfiguration. See web-management (System Services) .
4. If the loopback interface (lo0) is configured under the Web management HTTP/HTTPS configuration,remove the loopback interface by running the delete system services web-management http interface lo.0command.
5. Commit the change, and check whether you can now manage the chassis cluster.
6. If you still cannot manage the chassis cluster, proceed to "Manage Chassis Cluster Using the RevenuePort or fxp0 Management Port" on page 562.
Manage Chassis Cluster Using the Revenue Port or fxp0 Management Port
NOTE: You can use both the revenue port or fxp0 management port to manage the primarynode.
1. Connect to a console using the revenue port of the primary node which you want to use as amanagement interface.
2. Verify the configuration of the management interface:
a. Verify that the required system services (SSH, Telnet, HTTP) are enabled at the host-inbound-traffic hierarchy level in the relevant zone:
zones { security-zone trust { host-inbound-traffic { system-services { any-service; } protocols { all; } } interfaces { reth0.0 reth0.1; } }
562

b. Verify that the required system services (SSH, Telnet, HTTP) are enabled at the system serviceshierarchy level:
{primary:node1}[edit]root# show system services { http; ssh; telnet; }
3. Does ping to the management interface work?
• Yes: See Unable to Manage an SRX Series Chassis Cluster Using fxp0 When the Destination in theBackup Router is 0/0. If this solution doesn't work, proceed to "What’s Next" on page 566 toopen a case with Juniper Networks technical support.
• No: Proceed to step "4" on page 558.
4. Using the CLI, run the show interfaces terse command:
In the output, is the status of FXP0 interface Up, and does it provide an IP address?
• Yes: Proceed to step "5" on page 559.
• No: Verify the following:
a. Using the CLI, verify that the fxp0 interface is configured correctly: show groups.
Sample output:
root@srx# show groupsnode0 { system { host-name SRX3400-1; backup-router 192.168.1.254 destination 0.0.0.0/0; } interfaces { fxp0 { unit 0 { family inet { address 192.168.1.1/24; } } }
563

} } node1 { system { host-name SRX3400-2; backup-router 192.168.1.254 destination 0.0.0.0/0; } interfaces { fxp0 { unit 0 { family inet { address 192.168.1.2/24; } } } } }}apply-groups "${NODE}";system { services { ftp; ssh; telnet; }}
b. Check the condition of the cable that is connected to the fxp0 interface. Is the cable in goodcondition?
• Yes: Proceed to the next step.
• No: Replace the cable and try to manage the chassis cluster. If you still cannot manage thechassis cluster, proceed to the next step.
c. Using the CLI, check for incrementing error counters: show interfaces fxp0.0 extensive.
• Yes: If you find any errors in the output, proceed to "What’s Next" on page 566 to open acase with Juniper Networks technical support.
• No: If there are no errors in the output and if you still cannot manage the chassis cluster,proceed to step "5" on page 559.
5. Check whether the IP address of the fxp0 interface and the IP address of the management device arein the same subnet.
564

• Yes: Proceed to the step "6" on page 560.
• No: Using the CLI, check if there is a route for the management device IP address: show route<management device IP>:
a. If a route does not exist for the management device IP address, add a route for themanagement subnet in the inet.0 table with the next-hop as the backup router IP address.
6. Using the CLI, check whether there is an ARP entry for the management device on the servicesgateway: show arp no-resolve | match <ip>.
a. Yes: Check whether the chassis cluster has multiple routes to the management device: showroute <device-ip>.
• Yes: There could be routes to the management device through the fxp0 interface and otherinterface leading to asymmetric routing. Proceed to "What’s Next" on page 566 to open acase with Juniper Networks technical support.
• No: Proceed to "Manage the Chassis Cluster Using the fxp0 Management Port" on page 565.
b. No: Proceed to "What’s Next" on page 566 to open a case with Juniper Networks technicalsupport.
Manage the Chassis Cluster Using the fxp0 Management Port
NOTE: You can use only the fxp0 management port to manage the secondary node.
1. Verify the configuration of management interface on the secondary node:
• Verify that the required system services (SSH, Telnet, HTTP) are enabled at the host-inbound-traffic hierarchy level:
zones { security-zone trust { host-inbound-traffic { system-services { any-service; } protocols { all; } } interfaces {
565

reth0.0 reth0.1; } }
• Verify that the required system services (SSH, Telnet, HTTP) are enabled at the system serviceshierarchy level:
{primary:node1}[edit]root# show system services { http; ssh; telnet; }
See Unable to Manage an SRX Series Chassis Cluster Using fxp0 When the Destination in theBackup Router is 0/0 and Configuring backup-router Command on Chassis Cluster for moreinformation about the configuration guidelines.
If the configuration is correct and you still cannot manage the chassis cluster, proceed to step "2" onpage 561.
2. Are the IP addresses of the fxp0 interfaces of the primary node and the secondary node in the samesubnet?
• Yes: Proceed to "What’s Next" on page 566.
• No: Configure the fxp0 interfaces of the primary node and the secondary node in the samesubnet. Go to step "1" on page 560 and verify the configuration.
What’s Next
• If the issue persists, see KB Article KB20795.
• If you wish to debug further, see KB Article KB21164 to check the debug logs.
• To open a JTAC case with the Juniper Networks support team, see Data Collection for CustomerSupport for the data you should collect to assist in troubleshooting prior to opening a JTAC case.
566

Unable to Manage the Secondary Node of a Chassis Cluster Using J-Web
IN THIS SECTION
Problem | 567
Cause | 567
Solution | 569
Problem
Description
Cannot manage the secondary node of a chassis cluster using the J-Web interface.
Environment
SRX Series chassis cluster
Symptoms
When in the Junos Services Redundancy Protocol (JSRP) chassis cluster mode, you cannot manageredundancy group 0 (RG0) on the secondary node using the J-Web interface.
Cause
• You can use the J-Web interface to manage redundancy group 0 only on the primary node.
• The processes that J-Web references are not running on the secondary node.
Example
The following example shows the output of syslog and system process on both node0 and node1 afterRG0 was failed over from node1 to node0.
• On node1, web-management process (httpd-gk) was terminated (exited).
• On node0, web-management process (httpd-gk) was started.
567

• Two http-related processes (httpd-gk and httpd), run only on node0, which is the new primary nodeof RG0.
{secondary:node1}root@SRX210HE-B> show chassis cluster status Cluster ID: 1 Node Priority Status Preempt Manual failover
Redundancy group: 0 , Failover count: 1 node0 255 primary no yes node1 1 secondary no yes
Redundancy group: 1 , Failover count: 1 node0 100 primary yes no node1 1 secondary yes no {secondary:node1}root@SRX210HE-B> show log log-any | grep web-management Jul 5 11:31:52 SRX210HE-B init: web-management (PID 9660) startedJul 5 12:00:37 SRX210HE-B init: web-management (PID 9660) SIGTERM sentJul 5 12:00:37 SRX210HE-B init: web-management (PID 9660) exited with status=0 Normal Exit
{primary:node0}root@SRX210HE-A> show log log-any | grep web-management Jul 5 12:00:37 SRX210HE-A init: web-management (PID 9498) started
{primary:node0}root@SRX210HE-A> show system processes extensive node 0 | grep http 9498 root 1 76 0 12916K 4604K select 0 0:00 0.00% httpd-gk 9535 nobody 1 90 0 8860K 3264K select 0 0:00 0.00% httpd
{primary:node0}root@SRX210HE-A> show system processes extensive node 1 | grep http => No httpd-gk and httpd processes running on node 1 (secondary node)
NOTE: This limits remote procedure calls (RPCs) from the J-Web logic, and subsequently, pagesthat can be issued from the secondary node.
568

Solution
You can manage the secondary node of a chassis cluster using the CLI (SSH, telnet, and console). SeeManage the Chassis Cluster Using the fxp0 Management Port
Unable to Manage an SRX Series Chassis Cluster Using fxp0 When theDestination in the Backup Router is 0/0
SUMMARY
This topic explains, with an example, how tomanage an SRX Series chassis cluster configuredusing the backup-router configuration through thefxp0 interface.
IN THIS SECTION
Problem | 569
Cause | 571
Solution | 571
Problem
Description
The management device cannot manage the chassis cluster through an fxp0 interface, but it can pingboth fxp0 interfaces.
Sample Topology
The topology, IP addresses, and configuration are as follows:
• Primary fxp0: 192.168.1.1/24
• Secondary fxp0: 192.168.1.2/24
• Gateway for fxp0: 192.168.1.254
• Management device: 172.16.1.1/24
groups { node0 { system { host-name SRX5400-1; backup-router 192.168.1.254 destination 0.0.0.0/0;
569

} interfaces { fxp0 { unit 0 { family inet { address 192.168.1.1/24; } } } } } node1 { system { host-name SRX5400-2; backup-router 192.168.1.254 destination 0.0.0.0/0; } interfaces { fxp0 { unit 0 { family inet { address 192.168.1.2/24; } } } } }}apply-groups "${NODE}";system { services { ftp; ssh; telnet; }}
Environment
SRX Series chassis cluster
570

Cause
There is a route for 172.16.1.1 through the interfaces other than the fxp0 interface on the clusterdevices. We do not recommend using 0.0.0.0/0 as the backup-router destination. Ping works becausethe echo reply for an incoming echo request to the fxp0 interface is sent out following the route for172.16.1.1 through interfaces other than fxp0, but Telnet fails.
Solution
Remove the route for 172.16.1.1 in the routing table, and set a more specific backup-router destinationin group node0/node1.
For example:
groups { node0 { ... backup-router 192.168.1.254 destination 172.16.1.1/32; ... } node1 { ... backup-router 192.168.1.254 destination 172.16.1.1/32; ... }
No changes are displayed in the routing table after the configuration is applied because the backup-router configuration is intended to facilitate management access on the backup node only. Access to theprimary node is enabled through routing on the primary node.Thus, when the backup router configuration is complete, you can see that a route is injected into theforwarding table on the secondary node. You cannot see the routing table on the secondary nodebecause the routing subsystem does not run on the secondary node.
Sample Output when the Backup router is Configured with Destination 0/0
• Routing table on primary node:
{primary:node0}[edit]root@SRX5400-1# run show route
inet.0: 2 destinations, 2 routes (2 active, 0 holddown, 0 hidden)+ = Active Route, - = Last Active, * = Both
571

192.168.1.0/24 *[Direct/0] 00:00:54 > via fxp0.0192.168.1.1/32 *[Local/0] 00:00:54 Local via fxp0.0
• Forwarding table on secondary node with destination 0/0:
root@SRX3400-2# run show route forwarding-tableRouting table: default.inetInternet:Destination Type RtRef Next hop Type Index NhRef Netifdefault user 0 28:c0:da:a0:88:0 ucst 345 2 fxp0.0default perm 0 rjct 36 10.0.0.0/32 perm 0 dscd 34 1192.168.1.0/24 intf 0 rslv 344 1 fxp0.0192.168.1.0/32 dest 0 192.168.1.0 recv 342 1 fxp0.0192.168.1.2/32 intf 0 192.168.1.2 locl 343 2192.168.1.2/32 dest 0 192.168.1.2 locl 343 2192.168.1.254/32 dest 0 28:c0:da:a0:88:0 ucst 345 2 fxp0.0192.168.1.255/32 dest 0 192.168.1.255 bcst 336 1 fxp0.0224.0.0.0/4 perm 0 mdsc 35 1224.0.0.1/32 perm 0 224.0.0.1 mcst 31 1255.255.255.255/32 perm 0 bcst 32 1
Routing table: __master.anon__.inetInternet:Destination Type RtRef Next hop Type Index NhRef Netifdefault perm 0 rjct 526 10.0.0.0/32 perm 0 dscd 524 1224.0.0.0/4 perm 0 mdsc 525 1224.0.0.1/32 perm 0 224.0.0.1 mcst 521 1255.255.255.255/32 perm 0 bcst 522 1
Sample Output when the Backup router is Configured with Destination 172.16.1.1/32
572

• Routing table on primary node:
{primary:node0}[edit]root@SRX5400-1# run show route
inet.0: 2 destinations, 2 routes (2 active, 0 holddown, 0 hidden)+ = Active Route, - = Last Active, * = Both
192.168.1.0/24 *[Direct/0] 00:17:51 > via fxp0.0192.168.1.1/32 *[Local/0] 00:55:50 Local via fxp0.0
• Forwarding table on primary node:
NOTE: On the primary node, route 172.16.1.1/32 of the backup router is not shown in thesample output.
{primary:node0}[edit]root@SRX5400-1# run show route forwarding-tableRouting table: default.inetInternet:Destination Type RtRef Next hop Type Index NhRef Netifdefault perm 0 rjct 36 10.0.0.0/32 perm 0 dscd 34 1192.168.1.0/24 intf 0 rslv 334 1 fxp0.0192.168.1.0/32 dest 0 192.168.1.0 recv 331 1 fxp0.0192.168.1.1/32 intf 0 192.168.1.1 locl 332 2192.168.1.1/32 dest 0 192.168.1.1 locl 332 2 192.168.1.3/32 dest 0 5c:5e:ab:16:e3:81 ucst 339 1 fxp0.0192.168.1.6/32 dest 0 0:26:88:4f:c8:8 ucst 340 1 fxp0.0192.168.1.11/32 dest 0 0:30:48:bc:9f:45 ucst 342 1 fxp0.0192.168.1.254/32 dest 0 28:c0:da:a0:88:0 ucst 343 1 fxp0.0192.168.1.255/32 dest 0 192.168.1.255 bcst 329 1 fxp0.0224.0.0.0/4 perm 0 mdsc 35 1224.0.0.1/32 perm 0 224.0.0.1 mcst 31 1
573

255.255.255.255/32 perm 0 bcst 32 1
Routing table: __master.anon__.inetInternet:Destination Type RtRef Next hop Type Index NhRef Netifdefault perm 0 rjct 526 10.0.0.0/32 perm 0 dscd 524 1224.0.0.0/4 perm 0 mdsc 525 1224.0.0.1/32 perm 0 224.0.0.1 mcst 521 1255.255.255.255/32 perm 0 bcst 522 1
• Forwarding table on the secondary node:
NOTE: On the secondary node, route 172.16.1.1/32 of the backup router is shown in thesample output. This facilitates access to the secondary node through the fxp0 interface.
{secondary:node1}[edit]root@SRX5400-2# run show route forwarding-tableRouting table: default.inetInternet:Destination Type RtRef Next hop Type Index NhRef Netifdefault perm 0 rjct 36 10.0.0.0/32 perm 0 dscd 34 1172.16.1.1/32 user 0 192.168.1.254 ucst 345 2 fxp0.0192.168.1.0/24 intf 0 rslv 344 1 fxp0.0192.168.1.0/32 dest 0 192.168.1.0 recv 342 1 fxp0.0192.168.1.2/32 intf 0 192.168.1.2 locl 343 2192.168.1.2/32 dest 0 192.168.1.2 locl 343 2192.168.1.254/32 dest 0 28:c0:da:a0:88:0 ucst 345 2 fxp0.0192.168.1.255/32 dest 0 192.168.1.255 bcst 336 1 fxp0.0224.0.0.0/4 perm 0 mdsc 35 1224.0.0.1/32 perm 0 224.0.0.1 mcst 31 1255.255.255.255/32 perm 0 bcst 32 1
Routing table: __master.anon__.inetInternet:Destination Type RtRef Next hop Type Index NhRef Netifdefault perm 0 rjct 526 10.0.0.0/32 perm 0 dscd 524 1224.0.0.0/4 perm 0 mdsc 525 1
574

224.0.0.1/32 perm 0 224.0.0.1 mcst 521 1255.255.255.255/32 perm 0 bcst 522 1
If a particular subnet has a route configured through the backup router and a static route under routing-options, there could be problems accessing the fxp0 interface. In the example above, the issue withaccessing the fxp0 interface from the management device occurs when :
• The same route exists as a static route and through the backup router.
• There is a static route that is more specific than the route through the backup router.
In the examples, when the routes from the primary node are synchronized to the secondary node'sforwarding table, the route configured under static route takes precedence over the route under backuprouter. If 0/0 is configured under backup-router, the chances of a better matching route under staticroute is higher. Hence, we recommend avoiding 0/0 under backup router.
If you want to configure routes to the same destination using backup router as well as the static route,split the routes when configuring under backup-router. This makes the routes configured under backuprouter as the preferred routes and ensures that the fxp0 interface is accessible.
[edit routing-options static route]0.0.0.0/0 next-hop 100.200.200.254;
[edit groups node0 ]backup-router 192.168.1.254 destination [0.0.0.0/1 128.0.0.0/1];
Unable to Upgrade a Chassis Cluster Using In-Service Software Upgrade
IN THIS SECTION
Problem | 576
Cause | 576
Solution | 577
575

Problem
Description
Unable to upgrade a chassis cluster using minimal downtime upgrade method.
Environment
SRX5400 chassis cluster.
Symptoms
• Cluster stuck in node0 RG1 with IF flag and cannot upgarde.
• Configuration commit error is shown on CLI.
Cause
Configuration has same prefix on backup-router destinations (on backup RE/node) and user interfaceaddress.
regress@R1_re# show interfaces ge-0/0/0
unit 0 { family inet { address 192.1.1.1/24; }}
regress@R1_re# show groups re1 system backup-router
10.204.63.254 destination 192.1.1.1/18;
regress@R1_re# commit
re0: configuration check succeedsre1: error: Cannot have same prefix for backup-router destination and interface address. ge-0/0/0.0 inet 192.1.1error: configuration check-out failed
576

re0: error: remote commit-configuration failed on re1
Solution
In chassis cluster mode, the backup router's destination address for IPv4 and IPv6 routers using thecommands edit system backup-router address destination destination-address and edit system inet6-backup-router address destination destination-address must not be same as interface addressconfigured for IPv4 and IPv6 using the commands edit interfaces interface-name unit logical-unit-number family inet address ipv4-address and edit interfaces interface-name unit logical-unit-numberfamily inet6 address ipv6-address.
Configuring backup-router Command on Chassis Cluster
SUMMARY
How to back up a router in an SRX Series chassiscluster using the backup-router configurationcommand.
IN THIS SECTION
Problem | 577
Cause | 577
Solution | 578
Problem
Description
Intermittent connectivity issues to NSM and other management hosts from the secondary node.
Environment
SRX Series chassis cluster
Cause
Setting a destination of 0.0.0.0/0 on the backup router (without configuration) is not supported.
577

Example of an incorrect configuration:
set groups node0 system backup-router 10.10.10.1 destination 0.0.0.0/0
Solution
See Configuring a Backup Router for the recommended way to set up a backup router by using a non-zero prefix.
Example of a non-zero subnet backup-router configuration:
set groups node0 system backup-router 10.10.10.1 destination 10.100.0.0/16
As an alternative to the 0/0 backup-router destination, here is another example where 0/0 gets splitinto two prefixes:
set groups node0 system backup-router 10.10.10.1 destination 0.0.0.0/1set groups node0 system backup-router 10.10.10.1 destination 128.0.0.0/1
NOTE: If multiple networks need to be reachable through the backup router, you can addmultiple destination entries to the configuration. The backup-router configuration is used only bythe RG0 secondary node. The primary node continues to use the inet.0 route table.
Unable to Upgrade a Chassis Cluster Using In-Service Software Upgrade
IN THIS SECTION
Problem | 579
Cause | 579
Solution | 580
578

Problem
Description
Unable to upgrade a chassis cluster using minimal downtime upgrade method.
Environment
SRX5400 chassis cluster.
Symptoms
• Cluster stuck in node0 RG1 with IF flag and cannot upgarde.
• Configuration commit error is shown on CLI.
Cause
Configuration has same prefix on backup-router destinations (on backup RE/node) and user interfaceaddress.
regress@R1_re# show interfaces ge-0/0/0
unit 0 { family inet { address 192.1.1.1/24; }}
regress@R1_re# show groups re1 system backup-router
10.204.63.254 destination 192.1.1.1/18;
regress@R1_re# commit
re0: configuration check succeedsre1: error: Cannot have same prefix for backup-router destination and interface address. ge-0/0/0.0 inet 192.1.1error: configuration check-out failed
579

re0: error: remote commit-configuration failed on re1
Solution
In chassis cluster mode, the backup router's destination address for IPv4 and IPv6 routers using thecommands edit system backup-router address destination destination-address and edit system inet6-backup-router address destination destination-address must not be same as interface addressconfigured for IPv4 and IPv6 using the commands edit interfaces interface-name unit logical-unit-number family inet address ipv4-address and edit interfaces interface-name unit logical-unit-numberfamily inet6 address ipv6-address.
Data Collection for Customer Support
Before you contact customer support, collect the data listed in Table 39 on page 580.
Table 39: Data Collection for Customer Support
Background information
• All SSH or Telnet session captures
• Any available topology information
• Summary of how the device is being used (such as production, lab system, colocation)
• Summary of device history (new installation, production for x months or years, other recent cases)
• Summary of any recent changes in the network or on the device
Request support information (RSI)
Collect the RSI:
request support information | save /var/tmp/rsi-CURRENT DATE.log
Logs
580

Archive the contents of the /var/log/ folder:
file archive compress source /var/log/* destination /var/tmp/logs-CURRENT-DATE.tgz
Ensure that the /var/log/ directory is archived properly by verifying the file size using the file list /var/tmp/logs-CURRENT-DATE.tgz detail command.
NOTE: Upload all the logs to the JTAC support case. For instructions on how to upload the logs,see KB23337.
581

7CHAPTER
Configuration Statements
aggregated-devices | 585
apply-groups (Chassis Cluster) | 587
arp-detect | 589
arp-throttle | 591
authentication-key | 593
authentication-type | 595
cak | 597
ckn | 599
cluster (Chassis) | 601
configuration-synchronize (Chassis Cluster) | 605
connectivity-association | 607
connectivity-association (MACsec Interfaces) | 609
control-link-recovery | 611
control-ports | 612
exclude-protocol | 614
fabric-options | 616
gigether-options (Chassis Cluster) | 619
global-threshold | 621
global-weight | 623
gratuitous-arp-count | 625

heartbeat-interval | 627
heartbeat-threshold | 629
hold-down-interval | 631
include-sci | 632
interface (Chassis Cluster) | 634
interfaces (MACsec) | 636
interface-monitor | 638
internal (Security IPsec) | 640
ip-monitoring | 642
key-server-priority (MACsec) | 645
lacp (Interfaces) | 647
link-protection (Chassis Cluster) | 649
macsec | 651
mka | 654
network-management | 655
no-encryption (MACsec) | 657
node (Chassis Cluster Redundancy Group) | 659
ntp | 661
ntp threshold | 669
offset | 671
preempt (Chassis Cluster) | 674
pre-shared-key | 676
priority (Protocols VRRP) | 678
redundancy-group (Chassis Cluster) | 680
redundant-ether-options | 683
redundant-parent (Interfaces) | 686
redundant-pseudo-interface-options | 688
replay-protect | 689
replay-window-size | 692
resource-watch | 694
reth-count (Chassis Cluster) | 697
retry-count (Chassis Cluster) | 699
retry-interval (Chassis Cluster) | 701
route-active-on | 702

scb-control-ports | 704
security-mode | 706
traceoptions (Chassis Cluster) | 708
transmit-interval (MACsec) | 710
use-active-child-mac-on-reth | 713
use-actual-mac-on-physical-interfaces | 714
virtual-address | 715
vrrp-group | 717
weight | 721

aggregated-devices
IN THIS SECTION
Syntax | 585
Hierarchy Level | 586
Description | 586
Options | 586
Required Privilege Level | 586
Release Information | 587
Syntax
aggregated-devices { ethernet { device-count number; lacp { link-protection { non-revertive; } system-priority; } } sonet { device-count number; } maximum-links maximum-links-limit;}
585

Hierarchy Level
[edit chassis]
Description
Configure properties for aggregated devices on the router. Aggregate Ethernet links are logicalinterfaces defined on the device that bundle together multiple physical interfaces into a single interfacefor the use of redundancy and bandwidth aggregation. When interconnecting devices you can createaggregate ethernet interfaces to bundle together multiple physical ethernet links to increase bandwidthand redundancy between devices.
Link aggregation enables you to group Ethernet interfaces to form a single link layer interface. LinkAggregation Control Protocol (LACP) is supported in chassis cluster deployments, where aggregatedEthernet interfaces and redundant Ethernet interfaces are supported simultaneously.
You must first configure the system to enable configuring the Aggregated Ethernet (ae) Interfaces. Bydefault, Juniper devices do not have any aggregated ethernet interfaces created. To configure the deviceto support a given number of ae interfaces, you must define it on a per chassis basis using the set chassisaggregated-devices devices {1-32} in configuration mode. The number of devices you define will be thenumber of aggregated ethernet interfaces that the system will create which can be configured just likeany other ethernet interface. Also you can view the interfaces created by using the show interface tersecommand. Once you have defined the number of aggregated ethernet devices on the chassis you canthen continue to configure the LAG members on a per ethernet interface basis.
Options
The remaining statements are explained separately.
Required Privilege Level
interface—To view this statement in the configuration.
interface-control—To add this statement to the configuration.
586
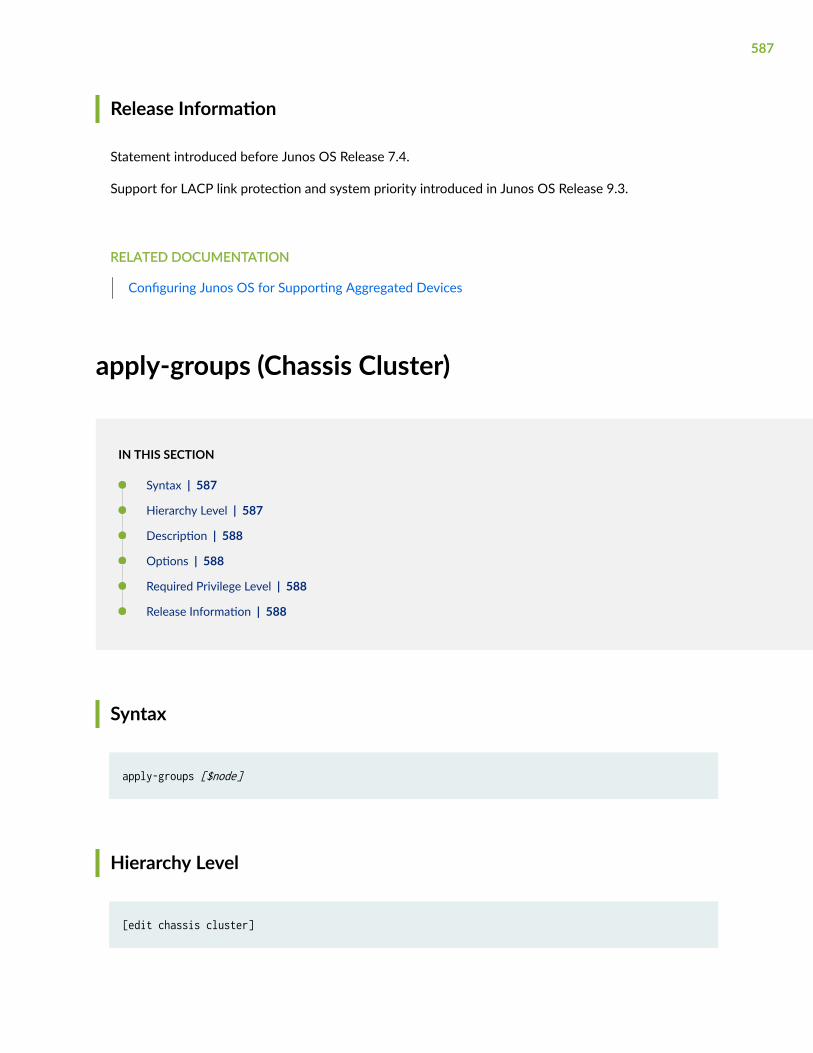
Release Information
Statement introduced before Junos OS Release 7.4.
Support for LACP link protection and system priority introduced in Junos OS Release 9.3.
RELATED DOCUMENTATION
Configuring Junos OS for Supporting Aggregated Devices
apply-groups (Chassis Cluster)
IN THIS SECTION
Syntax | 587
Hierarchy Level | 587
Description | 588
Options | 588
Required Privilege Level | 588
Release Information | 588
Syntax
apply-groups [$node]
Hierarchy Level
[edit chassis cluster]
587

Description
Apply node-specific parameters to each node in a chassis cluster.
You can use the [edit groups] option to create a unique configuration between the cluster members bydefining a unique hostname for each node and assigning a unique IP address for the fxp0 interface oneach node.
Each group is named after the node it is applied to (node 0 and node 1) and once you apply theconfigured groups using the apply-groups statement, only the group that matches the node name isapplied.
The configuration you specified under group node 0 will be active only on node 0 and the configurationyou specified under group node 1 will be active only on node 1.
Options
${node} Each node (node0 or node1) in a chassis cluster.
Required Privilege Level
interface—To view this statement in the configuration.
interface-control—To add this statement to the configuration.
Release Information
Statement introduced in Junos OS Release 9.0.
RELATED DOCUMENTATION
cluster (Chassis) | 601
588

arp-detect
IN THIS SECTION
Syntax | 589
Hierarchy Level | 589
Description | 589
Options | 590
Required Privilege Level | 590
Release Information | 590
Syntax
arp-detect milliseconds;
Hierarchy Level
[edit forwarding-options next-hop]
Description
Define the length of time (in milliseconds) for an SPU to wait for an acknowledgement from the RoutingEngine that an ARP request has been received from the SPU. If the Routing Engine fails to respondwithin the specific time interval, the SPU considers that the Routing Engine CPU utilization is high atthat moment, and initiates the ARP throttling. ARP throttling is initiated on the logical interface, wherethe incoming packet had triggered the ARP request.
589

Configuring a shorter ARP detect time interval results in triggering of ARP throttling more frequently.Frequent ARP throttling is useful for lowering Routing Engine CPU utilization caused by excessive ARPrequests.
For example, when you configure the set forwarding-options nexthop arp-detect 300 option, the nexthopresolution request must be acknowledged by the Routing Engine within 300 milliseconds. If the SPUdoes not get an acknowledgment from the Routing Engine in 300 milliseconds, the logical interfacewhich had received the packet that triggered the nexthop request, changes into ARP throttle state.While the ARP throttle state is active for that interface, traffic entering into that interface does nottrigger new nexthop resolution requests.
CAUTION: We recommend that only advanced Junos OS users attempt to configureARP throttle and ARP detect feature. Because, improper configuration might result inhigh CPU utilization of Routing Engine affecting other processes on your device.
Options
milliseconds—Number of seconds the SPU waits before receiving a response from Routing Engine.
• Range: 1 through 10000 milliseconds
• Default: 10000 milliseconds
Required Privilege Level
security—To view this statement in the configuration.
security-control—To add this statement to the configuration.
Release Information
Statement introduced in Junos OS Release 12.3X48-D65 and Junos OS Release 15.1X49-D130.
RELATED DOCUMENTATION
arp-throttle | 591
590
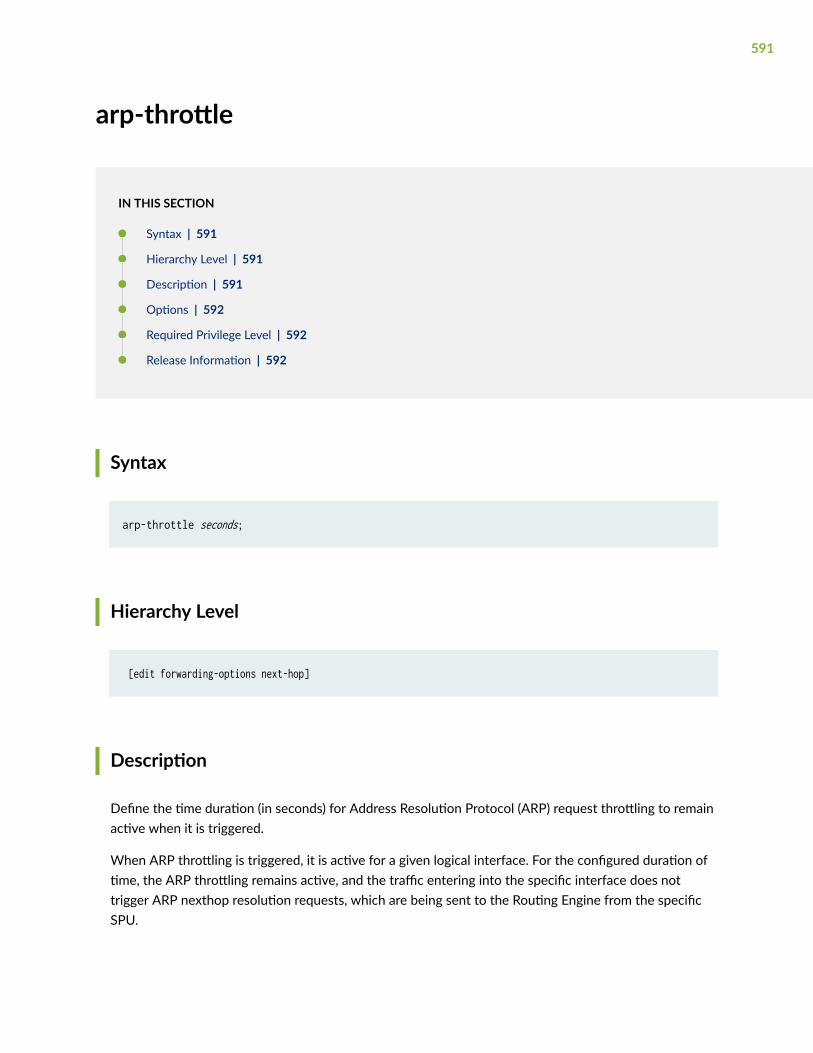
arp-throttle
IN THIS SECTION
Syntax | 591
Hierarchy Level | 591
Description | 591
Options | 592
Required Privilege Level | 592
Release Information | 592
Syntax
arp-throttle seconds;
Hierarchy Level
[edit forwarding-options next-hop]
Description
Define the time duration (in seconds) for Address Resolution Protocol (ARP) request throttling to remainactive when it is triggered.
When ARP throttling is triggered, it is active for a given logical interface. For the configured duration oftime, the ARP throttling remains active, and the traffic entering into the specific interface does nottrigger ARP nexthop resolution requests, which are being sent to the Routing Engine from the specificSPU.
591

When you configure a longer time duration, the ARP throttling can protect the Routing Engine bypreventing too many ARP requests being triggered by incoming traffic.
For example, if there is a large amount of traffic destined to a directly connected, unresolved IP address,chances of getting frequent ARP requests is very high, which eventually results into a high CPU load onthe Routing Engine. By setting a longer time interval of the ARP throttle, the Routing Engine is protectedfrom numerous ARP requests.
For example, when you configure the set forwarding-options nexthop arp-throttle 15 option, and theinterface state changes to throttle state, the nexthop requests triggered by incoming traffic into thisinterface, will not be sent. After 15 seconds, interface changes back from throttle to normal state. Thenthe nexthop requests triggered by the incoming traffic into this interface are sent to the Routing Engineagain.
Options
seconds—Time interval (in seconds) for Address Resolution Protocol (ARP) request throttling to remainactive when it is triggered.
• Range: 10 through 100 seconds
• Default: 10 seconds
Required Privilege Level
security—To view this statement in the configuration.
security-control—To add this statement to the configuration.
Release Information
Statement introduced in Junos OS Release 12.3X48-D65, Junos OS Release 15.1X49-D60, and JunosOS Release 15.1X49-D130.
RELATED DOCUMENTATION
arp-detect | 589
592

authentication-key
IN THIS SECTION
Syntax | 593
Hierarchy Level | 593
Description | 593
Options | 594
Required Privilege Level | 594
Release Information | 594
Syntax
authentication-key key;
Hierarchy Level
[edit interfaces interface-name unit logical-unit-number family inet address address vrrp-group group-id],[edit logical-systems logical-system-name interfaces interface-name unit logical-unit-number family inet address address vrrp-group group-id]
Description
Configure a Virtual Router Redundancy Protocol (VRRP) IPv4 authentication key. You also must specify aVRRP authentication scheme by including the authentication-type statement.
All devices in the VRRP group must use the same authentication scheme and password.
593

NOTE: When VRRPv3 is enabled, the authentication-type and authentication-key statements cannotbe configured for any VRRP groups.
Options
key—Authentication password. For simple authentication, it can be 1 through 8 characters long. ForMessage Digest 5 (MD5) authentication, it can be 1 through 16 characters long. If you include spaces,enclose all characters in quotation marks (“ ”).
Required Privilege Level
interface—To view this statement in the configuration.
interface-control—To add this statement to the configuration.
Release Information
Statement introduced before Junos OS Release 7.4.
RELATED DOCUMENTATION
Configuring VRRP Authentication (IPv4 Only)
authentication-type
version-3
Understanding VRRP on SRX Series Devices | 321
Example: Configuring VRRP/VRRPv3 on Chassis Cluster Redundant Ethernet Interfaces | 327
594

authentication-type
IN THIS SECTION
Syntax | 595
Hierarchy Level | 595
Description | 595
Options | 596
Required Privilege Level | 596
Release Information | 596
Syntax
authentication-type (md5 | simple);
Hierarchy Level
[edit interfaces interface-name unit logical-unit-number family inet address address vrrp-group group-id],[edit logical-systems logical-system-name interfaces interface-name unit logical-unit-number family inet address address vrrp-group group-id]
Description
Enable Virtual Router Redundancy Protocol (VRRP) IPv4 authentication and specify the authenticationscheme for the VRRP group. If you enable authentication, you must specify a password by including theauthentication-key statement. The specific type of authentication used by OSPF is encoded in this field.
All devices in the VRRP group must use the same authentication scheme and password.
595

NOTE: When VRRPv3 is enabled, the authentication-type and authentication-key statements cannotbe configured for any VRRP groups.
Options
authentication Authentication scheme:
• simple Use a simple password. The password is included in the transmitted packet, so this methodof authentication is relatively insecure.
• md5 Use the MD5 algorithm to create an encoded checksum of the packet. The encoded checksumis included in the transmitted packet. The receiving routing platform uses the authenticationkey to verify the packet, discarding it if the digest does not match. This algorithm provides amore secure authentication scheme.
• Default: none (no authentication is performed).
Required Privilege Level
interface—To view this statement in the configuration.
interface-control—To add this statement to the configuration.
Release Information
Statement introduced before Junos OS Release 7.4.
RELATED DOCUMENTATION
Configuring VRRP Authentication (IPv4 Only)
authentication-key
596

version-3
Understanding VRRP on SRX Series Devices | 321
Example: Configuring VRRP/VRRPv3 on Chassis Cluster Redundant Ethernet Interfaces | 327
cak
IN THIS SECTION
Syntax | 597
Hierarchy Level | 597
Description | 598
Default | 598
Options | 598
Required Privilege Level | 598
Release Information | 598
Syntax
ckn hexadecimal-number;
Hierarchy Level
[edit security macsec connectivity-association pre-shared-key]
597

Description
Specifies the connectivity association key (CAK) for a pre-shared key.
To configure MACsec on the supported ports, you need to create the preshared key by configuring theconnectivity association key name (CKN) and connectivity association key (CAK).
A preshared key is exchanged between directly-connected links to establish a MACsec-secure link. TheCKN is a 64-digit hexadecimal number and the CAK is a 32-digit hexadecimal number. The CKN and theCAK must match on both ends of a link to create a MACsec-secured link.
Default
No CAK exists, by default.
Options
hexadecimal-number
The key name, in hexadecimal format.
The key name is 32 hexadecimal characters in length. If you enter a key name that isless than 32 characters long, the remaining characters are set to 0.
Required Privilege Level
admin—To view this statement in the configuration.
admin-control—To add this statement to the configuration.
Release Information
Statement introduced in Junos OS Release 15.1X49-D60.
598
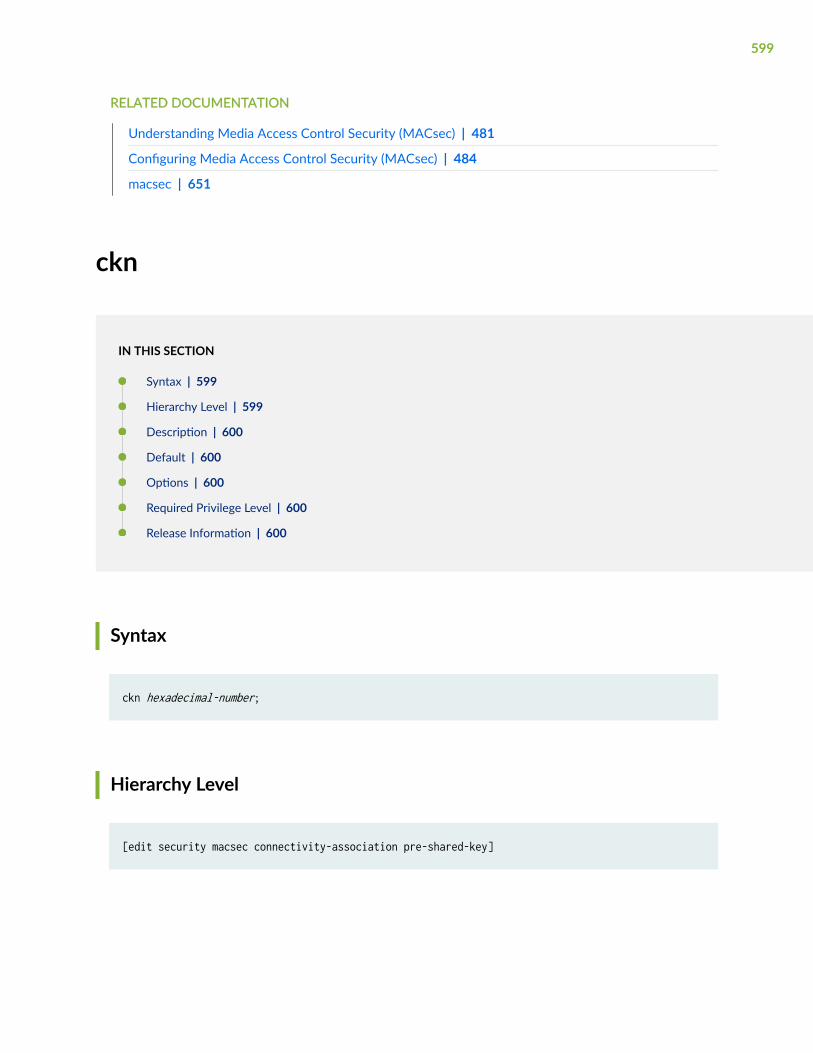
RELATED DOCUMENTATION
Understanding Media Access Control Security (MACsec) | 481
Configuring Media Access Control Security (MACsec) | 484
macsec | 651
ckn
IN THIS SECTION
Syntax | 599
Hierarchy Level | 599
Description | 600
Default | 600
Options | 600
Required Privilege Level | 600
Release Information | 600
Syntax
ckn hexadecimal-number;
Hierarchy Level
[edit security macsec connectivity-association pre-shared-key]
599

Description
Specifies the connectivity association key name (CKN) for a pre-shared key.
To configure MACsec on supported ports, you need to create the preshared key by configuring theconnectivity association key name (CKN) and connectivity association key (CAK).
A preshared key is exchanged between directly-connected links to establish a MACsec-secure link. TheCKN is a 64-digit hexadecimal number and the CAK is a 32-digit hexadecimal number. The CKN and theCAK must match on both ends of a link to create a MACsec-secured link.
Default
No CKN exists, by default.
Options
hexadecimal-number
The key name, in hexadecimal format.
The key name is 32 hexadecimal characters in length. If you enter a key name that isless than 32 characters long, the remaining characters are set to 0.
Required Privilege Level
admin—To view this statement in the configuration.
admin-control—To add this statement to the configuration.
Release Information
Statement introduced in Junos OS Release 15.1X49-D60.
600

RELATED DOCUMENTATION
Understanding Media Access Control Security (MACsec) | 481
Configuring Media Access Control Security (MACsec) | 484
macsec | 651
cluster (Chassis)
IN THIS SECTION
Syntax | 601
Hierarchy Level | 603
Description | 603
Options | 603
Required Privilege Level | 605
Release Information | 605
Syntax
cluster { configuration-synchronize (Chassis Cluster) { no-secondary-bootup-auto; } control-interface { node name { disable; } } control-link-recovery; control-ports fpc { port; } health-monitoring;
601

heartbeat-interval milliseconds; heartbeat-threshold heartbeat-threshold; network-management { cluster-master; } redundancy-group (Chassis Cluster) name { gratuitous-arp-count gratuitous-arp-count; hold-down-interval seconds; interface-monitor name { weight weight; } ip-monitoring { family { inet { address name { interface logical-interface-name { secondary-ip-address; } weight weight; } } } global-threshold global-threshold; global-weight global-weight; retry-count retry-count; retry-interval (Chassis Cluster) retry-interval; } node (Chassis Cluster Redundancy Group) (0 | 1) { priority priority; } preempt (Chassis Cluster) { delay seconds; limit limit; period seconds; } } redundant-interface name { mapping-interface mapping-interface; } reth-count (Chassis Cluster) reth-count; traceoptions (Chassis Cluster) { file <filename> <files files> <match match> <size size> <(world-readable | no-world-readable)>;
602

flag name; level (alert | all | critical | debug | emergency | error | info | notice | warning); no-remote-trace; }}
Hierarchy Level
[edit chassis]
Description
Configure a chassis cluster. Perform the configuration under the [edit chassis cluster] configurationstanza to define chassis cluster configuration, operations, and monitoring. This configuration mustspecify configuration synchronization, control link recovery, heartbeat interval and threshold, networkmanagement, redundancy group, and traceoptions.
Options
configuration-synchronize
Disable automatic chassis cluster synchronization. See "configuration-synchronize(Chassis Cluster)" on page 605.
control-interface Disable and Enable chassis cluster control-link interface on SRX1500, SRX4100,SRX4200, and SRX4600 devices. If you want to reboot any of the nodes, then youmust disable the control interfaces on both nodes using the CLI configuration toensure control link remains disabled after reboot. When control link is down,configuration change on local node will not be synchronized to the remote node.
From configuration mode, run the set chassis cluster control-interface <node0/node1>disable on node 0 or node 1 to disable the control link and to enable the controllink run the delete chassis cluster control-interface <node0/node1> disable on both thenodes. If you have disabled the links using the configuration command, then thelinks will remain disabled even after system reboot.
603

From the operational mode, run the request chassis cluster control-interface <node0/node1> disable or the request chassis cluster control-interface <node0/node1> enablecommands to enable or disable the control link from the local node. If you havedisabled control link using the operational mode CLI commands, the links will beenabled after system reboot.
control-link-recovery
Enable automatic control link recovery option.
control-ports Enable specific chassis cluster control ports.
• Values:
• fpc—FPC slot number
• port—Port number
health-monitoring Enable to monitor the health status of the SRX Series devices operating in chassiscluster mode. The health status between the two nodes is monitored and sharedover control links and fabric links. Failover between the nodes occurs based on theheart beat status and health status of the control links and fabric links. By default,the option is disabled.
heartbeat-interval Interval between successive heartbeats (milliseconds)
• Default: 1000
• Range: 1000-2000
heartbeat-threshold
Number of consecutive missed heartbeats to indicate device failure
• Default: 3
• Range: 3-8
network-management
Define parameters for network management. See "network-management" on page655.
redundancy-groupname
Define a redundancy group. See "redundancy-group (Chassis Cluster)" on page680.
reth-count Number of redundant ethernet interfaces
• Range: 1-128
traceoptions Define chassis cluster redundancy process tracing operations. See "traceoptions(Chassis Cluster)" on page 708.
604

The remaining statements are explained separately. See CLI Explorer.
Required Privilege Level
interface—To view this statement in the configuration.
interface-control—To add this statement to the configuration.
Release Information
Statement introduced in Junos OS Release 9.0.
The health-monitoring option is introduced in Junos OS Release 18.4R1.
The control-interface option is introduced in Junos OS Release 20.4R1 for SRX1500 devices.
RELATED DOCUMENTATION
ip-monitoring | 642
configuration-synchronize (Chassis Cluster)
IN THIS SECTION
Syntax | 606
Hierarchy Level | 606
Description | 606
Options | 606
Required Privilege Level | 606
Release Information | 607
605

Syntax
configuration-synchronize { no-secondary-bootup-auto;}
Hierarchy Level
{primary:node0}[edit chassis cluster]
Description
Disables the automatic chassis cluster synchronization between the primary and secondary nodes.
The chassis cluster synchronization feature automatically synchronizes the configuration from theprimary node to the secondary node when the secondary joins the primary as a cluster. If you want todisable automatic chassis cluster synchronization between the primary and secondary nodes, you can doso by entering the set chassis cluster configuration-synchronize no-secondary-bootup-auto command inconfiguration mode.
Options
no-secondary-bootup-auto Disable the automatic chassis cluster synchronization between the primaryand secondary nodes.
Required Privilege Level
interface—To view this statement in the configuration.
interface-control—To add this statement to the configuration.
606

Release Information
Statement introduced in Junos OS Release 12.1X47-D10.
RELATED DOCUMENTATION
Understanding Automatic Chassis Cluster Synchronization Between Primary and Secondary Nodes | 143
request chassis cluster configuration-synchronize | 739
show chassis cluster information configuration-synchronization | 797
connectivity-association
IN THIS SECTION
Syntax | 607
Hierarchy Level | 608
Description | 608
Required Privilege Level | 608
Release Information | 608
Syntax
connectivity-association connectivity-association-name; exclude-protocol protocol-name; include-sci; mka { must-secure; key-server-priority priority-number; transmit-interval interval; } no-encryption;
607

offset (0|30|50); pre-shared-key { cak hexadecimal-number; ckn hexadecimal-number; } replay-protect{ replay-window-size number-of-packets; } security-mode security-mode;}
Hierarchy Level
[edit security macsec]
Description
Create or configure a MACsec connectivity association.
A connectivity association is not applying MACsec to traffic until it is associated with an interface.MACsec connectivity associations are associated with interfaces using the interfaces statement in the[edit security macsec] hierarchy.
Required Privilege Level
admin—To view this statement in the configuration.
admin-control—To add this statement to the configuration.
Release Information
Statement introduced in Junos OS Release 15.1X49-D60.
608

RELATED DOCUMENTATION
Understanding Media Access Control Security (MACsec) | 481
Configuring Media Access Control Security (MACsec) | 484
macsec | 651
connectivity-association (MACsec Interfaces)
IN THIS SECTION
Syntax | 609
Hierarchy Level | 609
Description | 610
Default | 610
Required Privilege Level | 610
Release Information | 610
Syntax
connectivity-association connectivity-association-name;
Hierarchy Level
[edit security macsec cluster-control-port <idx>][edit security macsec cluster-data-port interface]
609

Description
Applies a connectivity association to an interface, which enables Media Access Control Security(MACsec) on that interface. The point-to-point links are secured after security keys are matched at theendpoints of the links. If you enable MACsec by using the static connectivity association key (CAK)security mode, user-configured, preshared keys are matched. If you enable MACsec by using the staticsecure association key (SAK) security mode, user-configured static security association keys arematched.
When you enable MACsec using static CAK, you have to create and configure a connectivityassociation.
Default
No connectivity associations are associated with any interfaces.
Required Privilege Level
admin—To view this statement in the configuration.
admin-control—To add this statement to the configuration.
Release Information
Statement introduced in Junos OS Release 15.1X49-D60.
RELATED DOCUMENTATION
Understanding Media Access Control Security (MACsec) | 481
Configuring Media Access Control Security (MACsec) | 484
macsec | 651
610

control-link-recovery
IN THIS SECTION
Syntax | 611
Hierarchy Level | 611
Description | 611
Required Privilege Level | 612
Release Information | 612
Syntax
control-link-recovery;
Hierarchy Level
[edit chassis cluster]
Description
Enable control link recovery to be done automatically by the system.
If the control link fails, the secondary node enters a disabled state. To recover the node from thedisabled mode, you must reboot the node to resume operations. You can make this reboot automatic byusing the control-link-recovery configuration option.
After the control link recovers, the system checks whether it receives at least three consecutiveheartbeats on the control link. This is to ensure that the control link is not flapping and is perfectlyhealthy. Once this criterion is met, the system issues an automatic reboot on the node that was disabled
611

when the control link failed. When the disabled node reboots, the node rejoins the cluster. There is noneed for any manual intervention.
Required Privilege Level
interface—To view this statement in the configuration.
interface-control—To add this statement to the configuration.
Release Information
Statement introduced in Junos OS Release 9.5.
RELATED DOCUMENTATION
interface (Chassis Cluster) | 634
control-ports
IN THIS SECTION
Syntax | 613
Hierarchy Level | 613
Description | 613
Options | 613
Required Privilege Level | 614
Release Information | 614
612
Syntax
control-ports fpc { port;}
Hierarchy Level
[edit chassis cluster]
Description
Enable the specific control port to use as a control link for the chassis cluster. By default, all controlports are disabled.
After connecting the control ports, you need to configure the control ports to setup control links as astep to establish the chassis cluster.
You need to configure a minimum of one control port per chassis of the cluster. If you configure port 0only, the Juniper Services Redundancy Protocol process (jsrpd) does not send control heartbeats oncontrol link 1 and the counters it sends will show zeroes.
Options
• fpc slot-number —Flexible PIC Concentrator (FPC) slot number.
NOTE: FPC slot range depends on platform. The maximum range of 0 through 23 applies toSRX5800 devices; for SRX5600 devices, the only applicable range is 0 through 11; forSRX5400 devices, the applicable slot range is 0 through 5. See "Chassis Cluster Control PlaneInterfaces" on page 69 for details.
• port port-number —Port number on which to configure the control port.
613

Required Privilege Level
interface—To view this statement in the configuration.
interface-control—To add this statement to the configuration.
Release Information
Statement introduced in Junos OS Release 9.2. Support.
RELATED DOCUMENTATION
cluster (Chassis) | 601
exclude-protocol
IN THIS SECTION
Syntax | 614
Hierarchy Level | 615
Description | 615
Default | 615
Options | 615
Required Privilege Level | 615
Release Information | 616
Syntax
exclude-protocol protocol-name;
614

Hierarchy Level
[edit security macsec connectivity-association]
Description
Specifies protocols whose packets are not secured using Media Access Control Security (MACsec) whenMACsec is enabled on a link using static connectivity association key (CAK) security mode.
When this option is enabled in a connectivity association that is attached to an interface, MACsec is notenabled for all packets of the specified protocols that are sent and received on the link.
Default
Disabled.
All packets are secured on a link when MACsec is enabled, with the exception of all types of SpanningTree Protocol (STP) packets.
Options
protocol-name
Specifies the name of the protocol that should not be MACsec-secured. Options include:
• cdp —Cisco Discovery Protocol.
• lacp —Link Aggregation Control Protocol.
• lldp —Link Level Discovery Protocol.
Required Privilege Level
admin—To view this statement in the configuration.
admin-control—To add this statement to the configuration.
615

Release Information
Statement introduced in Junos OS Release 15.1X49-D60.
RELATED DOCUMENTATION
Understanding Media Access Control Security (MACsec) | 481
Configuring Media Access Control Security (MACsec) | 484
macsec | 651
fabric-options
IN THIS SECTION
Syntax | 616
Hierarchy Level | 617
Description | 617
Options | 618
Required Privilege Level | 618
Release Information | 618
Syntax
fabric-options { member-interfaces member-interface-name;}
616

Hierarchy Level
[edit interfaces interface-name]
Description
Configure fabric interface specific options in chassis clusters.
The fabric is the data link between the nodes and is used to forward traffic between the chassis. Eachnode in the chassis requires a fabric interface configured. To create a fabric link between the two chassisrequires the creation of a special interface called the fab interface. Node 0’s fabric interface, called fab0,and node 1’s fabric interface, called fab1.
Only the same type of interfaces can be configured as fabric children, and you must configure an equalnumber of child links for fab0 and fab1.
You can enable and disable the fabric link on SRX1500, SRX4100, SRX4200, and SRX4600 devices.
From configuration mode,
run the set interfaces fab0 disable command to disable the fabric link interface fab0 and set interfaces fab1disable command to disable the fabric link interface fab1.
run the delete interfaces fab0 disable to enable fabric link interface fab0 and delete interfaces fab1 disableto enable fabric link interface fab1.
fab0 { fabric-options { member-interfaces { ge-0/0/4; } }}fab1 { fabric-options { member-interfaces { ge-2/0/4; } }}
617

NOTE: When you run the system autoinstallation command, the command will configure unit 0logical interface for all the active state physical interfaces. However, a few commands such asfabric-options do not allow the physical interface to be configured with a logical interface. If thesystem autoinstallation and the fabric-options commands are configured together, the followingmessage is displayed:
incompatible with 'system autoinstallation’
Options
member-interface-name—Member interface name.
Required Privilege Level
interface—To view this statement in the configuration.
interface-control—To add this statement to the configuration.
Release Information
Statement introduced in Junos OS Release 8.5.
RELATED DOCUMENTATION
Example: Configuring the Chassis Cluster Fabric Interfaces | 62
618

gigether-options (Chassis Cluster)
IN THIS SECTION
Syntax | 619
Hierarchy Level | 620
Description | 621
Options | 621
Required Privilege Level | 621
Release Information | 621
Syntax
gigether-options { 802.3ad { backup | primary | bundle; lacp { port-priority priority; } } auto-negotiation { remote-fault { local-interface-offline | local-interface-online; } } no-auto-negotiation; ethernet-switch-profile { mac-learn-enable; tag-protocol-id [tpids]; ethernet-policer-profile { input-priority-map { ieee802.1p { premium [values]; } }
619

output-priority-map { classifier { premium { forwarding-class class-name { loss-priority (high | low); } } } } policer cos-policer-name { aggregate { bandwidth-limit bps; burst-size-limit bytes; } premium { bandwidth-limit bps; burst-size-limit bytes; } } } } flow-control | no-flow-control; ieee-802-3az-eee; ignore-l3-incompletes; loopback | no-loopback; mpls { pop-all-labels { required-depth (1 | 2); } } redundant-parent (Interfaces Gigabit Ethernet) interface-name; source-address-filter { mac-address; }}
Hierarchy Level
[edit interfaces interface-name]
620

Description
Configure Gigabit Ethernet specific interface properties.
Options
The remaining statements are explained separately. See CLI Explorer.
Required Privilege Level
interface—To view this statement in the configuration.
interface-control—To add this statement to the configuration.
Release Information
Statement introduced in Junos OS Release 9.2.
RELATED DOCUMENTATION
Example: Configuring Chassis Cluster Redundant Ethernet Interfaces | 105
global-threshold
IN THIS SECTION
Syntax | 622
Hierarchy Level | 622
Description | 622
621

Options | 622
Required Privilege Level | 623
Release Information | 623
Syntax
global-threshold number;
Hierarchy Level
[edit chassis cluster redundancy-groupgroup-number ip-monitoring ]
Description
Define global threshold for IP monitoring. This is the number that needs to be met or exceeded by all ofthe cumulative weights of the monitored IP addresses to trigger a failover.
When a monitored address is marked as unreachable, the weight value associated with that address isdeducted from the the redundancy group IP address monitoring global threshold. If the accumulatedmonitored address weight values surpass the global-threshold value, that is, when the global thresholdreaches 0, the global weight is deducted from the redundancy group threshold. Every redundancy grouphas a default threshold of 255. If the threshold reaches 0, a failover is triggered
Options
number—Value at which the IP monitoring weight is applied against the redundancy group failoverthreshold.
• Range: 0 through 255
622

• Default: 255
Required Privilege Level
interface—To view this statement in the configuration.
interface-control—To add this statement to the configuration.
Release Information
Statement introduced in Junos OS Release 10.1.
RELATED DOCUMENTATION
ip-monitoring | 642
global-weight
IN THIS SECTION
Syntax | 624
Hierarchy Level | 624
Description | 624
Options | 624
Required Privilege Level | 625
Release Information | 625
623

Syntax
global-weight number;
Hierarchy Level
[edit chassis cluster redundancy-groupgroup-numberip-monitoring]
Description
Define global weight for IP monitoring. This is the weight that is subtracted from the redundancy groupweight for all of the hosts being monitored. This number specifies the relative importance of IP addressmonitored objects in the operation of the redundancy group.
Every monitored IP address is assigned a weight. If the monitored address becomes unreachable, theweight of the object is deducted from the global-threshold of IP monitoring objects in its redundancygroup. When the global-threshold reaches 0, the global-weight is deducted from the redundancy group.Every redundancy group has a default threshold of 255. If the threshold reaches 0, a failover is triggered.Failover is triggered even if the redundancy group is in manual failover mode and preemption is notenabled.
Options
number —Combined weight assigned to all monitored IP addresses. A higher weight value indicates agreater importance.
• Range: 0 through 255
• Default: 255
624

Required Privilege Level
interface—To view this statement in the configuration.
interface-control—To add this statement to the configuration.
Release Information
Statement introduced in Junos OS Release 10.1.
RELATED DOCUMENTATION
ip-monitoring | 642
gratuitous-arp-count
IN THIS SECTION
Syntax | 625
Hierarchy Level | 626
Description | 626
Options | 626
Required Privilege Level | 626
Release Information | 626
Syntax
gratuitous-arp-count number;
625

Hierarchy Level
[edit chassis cluster redundancy-group group-number]
Description
Specify the number of gratuitous Address Resolution Protocol (ARP) requests to send on an activeinterface after failover.
You can configure this option to specify the number of gratuitous ARP requests that an interface cansend to notify other network devices of its presence after the redundancy group it belongs to has failedover.
By default, the SRX series device sends four GARPs per reth on a failover. You can modify the number ofGARPs sent per-redundancy-group basis.
Options
number—Number of gratuitous ARP requests that a newly elected primary device in a chassis clustersends out to announce its presence to the other network devices.
• Range: 1 through 16
• Default: 4
Required Privilege Level
interface—To view this statement in the configuration.
interface-control—To add this statement to the configuration.
Release Information
Statement introduced in Junos OS Release 9.0.
626

RELATED DOCUMENTATION
redundancy-group (Chassis Cluster) | 680
heartbeat-interval
IN THIS SECTION
Syntax | 627
Hierarchy Level | 627
Description | 627
Options | 628
Required Privilege Level | 628
Release Information | 628
Syntax
heartbeat-interval milliseconds;
Hierarchy Level
[edit chassis cluster]
Description
Set the interval between the periodic signals broadcast to the devices in a chassis cluster to indicate thatthe active node is operational.
627

The heartbeat-interval option works in combination with the heartbeat-threshold option to define the waittime before failover is triggered in a chassis cluster. The default values of these options produce a waittime of 3 seconds. In a large configuration approaching full capacity on an SRX5400 or SRX5600 orSRX5800 device, however, we recommend that you increase the failover wait time to 5 seconds.
For example, a heartbeat-threshold of 3 and a heartbeat-interval of 1000 milliseconds result in a total wait of3 seconds before failover is triggered. To increase this wait to 5 seconds, you could increase theheartbeat-threshold, the heartbeat-interval, or both. A heartbeat-threshold of 5 and a heartbeat-interval of 1000milliseconds would yield a wait time of 5 seconds. Setting the heartbeat-threshold to 4 and the heartbeat-interval to 1250 milliseconds would also yield a wait time of 5 seconds.
NOTE: In a chassis cluster scaling environment, the heartbeat-threshold must always be set to 8.
Options
milliseconds—Time interval between any two heartbeat messages.
• Range: 1000 through 2000 milliseconds
• Default: 1000 milliseconds
Required Privilege Level
interface—To view this statement in the configuration.
interface-control—To add this statement to the configuration.
Release Information
Statement introduced in Junos OS Release 9. Statement updated in Junos OS Release 10.4.
RELATED DOCUMENTATION
cluster (Chassis) | 601
628

heartbeat-threshold
IN THIS SECTION
Syntax | 629
Hierarchy Level | 629
Description | 629
Options | 630
Required Privilege Level | 630
Release Information | 630
Syntax
heartbeat-threshold number;
Hierarchy Level
[edit chassis cluster]
Description
Set the number of consecutive missed heartbeat signals that a device in a chassis cluster must exceed totrigger failover of the active node.
The heartbeat-threshold option works in combination with the heartbeat-interval option to define the waittime before failover is triggered in a chassis cluster. The default values of these options produce a waittime of 3 seconds. In a large configuration approaching full capacity on an SRX5400 or SRX5600 orSRX5800 device, however, we recommend that you increase the failover wait time to 5 seconds.
629

For example, a heartbeat-threshold of 3 and a heartbeat-interval of 1000 milliseconds result in a total wait of3 seconds before failover is triggered. To increase this wait to 5 seconds, you could increase theheartbeat-threshold, the heartbeat-interval, or both. A heartbeat-threshold of 5 and a heartbeat-interval of 1000milliseconds would yield a wait time of 5 seconds. Setting the heartbeat-threshold to 4 and the heartbeat-interval to 1250 milliseconds would also yield a wait time of 5 seconds.
Options
number—Number of consecutive missed heartbeats.
• Range: 3 through 8
• Default: 3
Required Privilege Level
interface—To view this statement in the configuration.
interface-control—To add this statement to the configuration.
Release Information
Statement introduced in Junos OS Release 9.0. Statement updated in Junos OS Release 10.4.
RELATED DOCUMENTATION
cluster (Chassis) | 601
630

hold-down-interval
IN THIS SECTION
Syntax | 631
Hierarchy Level | 631
Description | 631
Options | 632
Required Privilege Level | 632
Release Information | 632
Syntax
hold-down-interval number;
Hierarchy Level
[edit chassis cluster redundancy-group group-number]
Description
Set the minimum interval to be allowed between back-to-back failovers for the specified redundancygroup (affects manual failovers, as well as automatic failovers associated with monitoring failures).
For redundancy group 0, this setting prevents back-to-back failovers from occurring less than 5 minutes(300 seconds) apart. Note that a redundancy group 0 failover implies a Routing Engine failure.
For some configurations, such as ones with a large number of routes or logical interfaces, the default orspecified interval for redundancy group 0 might not be sufficient. In such cases, the system
631

automatically extends the dampening time in increments of 60 seconds until the system is ready forfailover.
Options
number—Number of seconds specified for the interval.
• Range: For redundancy group 0, 300 through 1800 seconds; for redundancy group 1 through 128, 0through 1800 seconds.
• Default: For redundancy group 0, 300 seconds; for redundancy group 1 through 128, 1 second.
Required Privilege Level
interface—To view this statement in the configuration.
interface-control—To add this statement to the configuration.
Release Information
Statement introduced in Junos OS Release 10.0.
RELATED DOCUMENTATION
cluster (Chassis) | 601
include-sci
IN THIS SECTION
Syntax | 633
632

Hierarchy Level | 633
Description | 633
Default | 634
Required Privilege Level | 634
Release Information | 634
Syntax
include-sci;
Hierarchy Level
[edit security macsec connectivity-association]
Description
Specify that the SCI tag be appended to each packet on a link that has enabled MACsec.
You must enable SCI tagging on a switch that is enabling MACsec on an Ethernet link connecting to anSRX device.
SCI tags are automatically appended to packets leaving a MACsec-enabled interface on an SRX device.This option is, therefore, not available on an SRX device.
You should only use this option when connecting a switch to an SRX device, or to a host device thatrequires SCI tagging. SCI tags are eight octets long, so appending an SCI tag to all traffic on the link addsa significant amount of unneeded overhead.
633

Default
SCI tagging is enabled on an SRX device that have enabled MACsec using static connectivity associationkey (CAK) security mode, by default.
SCI tagging is disabled on all other interfaces, by default.
Required Privilege Level
admin—To view this statement in the configuration.
admin-control—To add this statement to the configuration.
Release Information
Statement introduced in Junos OS Release 15.1X49-D60.
RELATED DOCUMENTATION
Understanding Media Access Control Security (MACsec) | 481
Configuring Media Access Control Security (MACsec) | 484
macsec | 651
interface (Chassis Cluster)
IN THIS SECTION
Syntax | 635
Hierarchy Level | 635
Description | 635
Options | 635
634

Required Privilege Level | 636
Release Information | 636
Syntax
logical-interface-name secondary-ip-address;
Hierarchy Level
[edit chassis cluster redundancy-groupgroup-number ip-monitoring family family-name IP–address]
Description
Specify the redundant Ethernet interface, including its logical-unit-number, through which themonitored IP address must be reachable. The specified redundant Ethernet interface can be in anyredundancy group. Likewise specify a secondary IP address to be used as a ping source for monitoringthe IP address through the secondary node’s redundant Ethernet interface link.
Options
• logical-interface-name—Redundant Ethernet interface through which the monitored IP address must bereachable. You must specify the redundant Ethernet interface logical-unit-number. Note that youmust also configure a secondary ping source IP address (see below).
• Range: reth0.logical-unit-number through reth128.logical-unit-number (device dependent)
635

NOTE: If the redundant Ethernet interface belongs to a VPN routing and forwarding (VRF)routing instance type, then the IP monitoring feature will not work.
• secondary-ip-address IP–address—Specify the IP address that are used as the source IP address of pingpackets for IP monitoring from the secondary child link of the redundant Ethernet interface. An IPaddress for sourcing the ping packets on the primary link of the redundant Ethernet interface mustbe configured before you can configure secondary-ip-address. For legacy support reasons, monitoringon an IP address without identifying a redundant Ethernet interface and without configuring asecondary ping source IP address is permitted but not recommended.
Required Privilege Level
interface—To view this statement in the configuration.
interface-control—To add this statement to the configuration.
Release Information
Statement introduced in Junos OS Release 10.1.
RELATED DOCUMENTATION
cluster (Chassis) | 601
interfaces (MACsec)
IN THIS SECTION
Syntax | 637
Hierarchy Level | 637
636

Description | 637
Required Privilege Level | 637
Release Information | 638
Syntax
interface-name { connectivity-association connectivity-association-name;}
Hierarchy Level
[edit security macsec cluster-data-port]
Description
Specify chassis cluster fabric interface on which MACsec is enabled. For SRX340, and SRX345 devices,the fabric interface can be any 1 G Ethernet interface. Use this configuration to apply a connectivityassociation to an interface, which enables Media Access Control Security (MACsec) on that interface.
Required Privilege Level
admin—To view this statement in the configuration.
admin-control—To add this statement to the configuration.
637

Release Information
Statement introduced in Junos OS Release 15.1X49-D60.
RELATED DOCUMENTATION
Understanding Media Access Control Security (MACsec) | 481
Configuring Media Access Control Security (MACsec) | 484
macsec | 651
interface-monitor
IN THIS SECTION
Syntax | 638
Hierarchy Level | 639
Description | 639
Options | 639
Required Privilege Level | 639
Release Information | 640
Syntax
interface-monitor interface-name { weight number;}
638

Hierarchy Level
[edit chassis cluster redundancy-group group-number ]
Description
Specify a redundancy group interface to be monitored for failover and the relative weight of theinterface.
For a redundancy group to automatically failover to another node, its interfaces must be monitored.Interface monitoring monitors the physical status of an interface.
When you configure a redundancy group, you can specify a set of interfaces that the redundancy groupis to monitor for status (or “health”) of interface to determine whether the interface is up or down. Amonitored interface can be a child interface of any of its redundant Ethernet interfaces.
When you configure an interface for a redundancy group to monitor, you assign a weight to theinterface. Every redundancy group has a threshold tolerance value initially set to 255. When an interfacemonitored by a redundancy group becomes unavailable, its weight is subtracted from the redundancygroup's threshold. When a redundancy group's threshold reaches 0, the redundancy group fails over tothe other node in the cluster.
Options
name Name of the interface to monitor
weight Weight assigned to this interface that influences failover
• Range: 0-255
Required Privilege Level
interface—To view this statement in the configuration.
interface-control—To add this statement to the configuration.
639

Release Information
Statement introduced in Junos OS Release 9.0.
RELATED DOCUMENTATION
cluster (Chassis) | 601
internal (Security IPsec)
IN THIS SECTION
Syntax | 640
Hierarchy Level | 641
Description | 641
Options | 641
Required Privilege Level | 642
Release Information | 642
Syntax
internal { security-association { manual { encryption { algorithm (3des-cbc | aes-128-cbc); ike-ha-link-encryption enable; key ascii-text; } }
640

}}
Hierarchy Level
[edit security ipsec]
Description
Enable secure login and to prevent attackers from gaining privileged access through this control port byconfiguring the internal IP security (IPsec) security association (SA).
When the internal IPsec is configured, IPsec-based rlogin and remote command (rcmd) are enforced, so anattacker cannot gain unauthorized information.
Options
security-association
Specify an IPsec SA. An SA is a simplex connection that allows two hosts tocommunicate with each other securely by means of IPsec.
manual encryption Specify a manual SA. Manual SAs require no negotiation; all values, including thekeys, are static and specified in the configuration.
algorithm 3des-cbc Specify the encryption algorithm for the internal Routing-Engine-to-Routing-Engine IPsec SA configuration.
algorithm aes-128-cbc
Specify the encryption algorithm for high availability encryption link.
iked-ha-link-encryption
Enable encryption for internal messages.
• Values:
• enable—Enable HA link encryption IKE internal messages
641

key ascii-text Specify the encryption key. You must ensure that the manual encryption key is inASCII text and 24 characters long; otherwise, the configuration will result in acommit failure.
Required Privilege Level
interface—To view this statement in the configuration.
interface-control—To add this statement to the configuration.
Release Information
Statement introduced in Junos OS Release 12.1X45-D10.
Support for ike-ha-link-encryption option added in Junos OS Release 12.1X47-D15.
Support for iked_encryption option added in Junos OS Release 12.1X47-D10.
Support for aes-128-cbc option added in Junos OS Release 19.1R1.
Support for ike-ha-link-encryption option added for vSRX in Junos OS Release 19.4R1
RELATED DOCUMENTATION
Example: Configuring an Active/Passive Chassis Cluster on SRX5800 Devices | 362
show security internal-security-association | 966
ip-monitoring
IN THIS SECTION
Syntax | 643
Hierarchy Level | 643
642

Description | 644
Options | 644
Required Privilege Level | 645
Release Information | 645
Syntax
ip-monitoring { family { inet { ipv4-address { interface { logical-interface-name; secondary-ip-address ip-address; } weight number; } } } global-threshold number; global-weight number; retry-count number; retry-interval seconds;}
Hierarchy Level
[edit chassis cluster redundancy-group group-number]
643

Description
Specify a global IP address monitoring threshold and weight, and the interval between pings (retry-interval) and the number of consecutive ping failures (retry-count) permitted before an IP address isconsidered unreachable for all IP addresses monitored by the redundancy group. Also specify IPaddresses, a monitoring weight, a redundant Ethernet interface number, and a secondary IP monitoringping source for each IP address, for the redundancy group to monitor.
Options
IPv4 address The address to be continually monitored for reachability. You also set up a secondary IPaddress to allow testing from the secondary node.
NOTE: All monitored object failures, including IP monitoring, are deducted fromthe redundancy group threshold priority. Other monitored objects includeinterface monitor, SPU monitor, cold-sync monitor, and NPC monitor (onsupported platforms).
interface interface secondary-ip-address ip-address;
Define source address for monitoring packets onsecondary link.
global-threshold
Define global threshold for IP monitoring. See "global-threshold" on page 621.
• Default: 0
• Range: 0-255
global-weight Define global weight for IP monitoring. See "global-weight" on page 623.
• Default: 255
• Range: 0-255
retry-count Number of retries needed to declare reachablity failure. See "retry-count (ChassisCluster)" on page 699.
• Default: 5
• Range: 5-15
644

retry-interval Define the time interval in seconds between retries. See "retry-interval (Chassis Cluster)"on page 701.
• Default: 1
• Range: 1-30
The remaining statements are explained separately. See CLI Explorer.
Required Privilege Level
interface—To view this statement in the configuration.
interface-control—To add this statement to the configuration.
Release Information
Statement updated in Junos OS Release 10.1.
RELATED DOCUMENTATION
Example: Configuring Chassis Cluster Redundancy Group IP Address Monitoring | 253
key-server-priority (MACsec)
IN THIS SECTION
Syntax | 646
Hierarchy Level | 646
Description | 646
Default | 646
Options | 647
645

Required Privilege Level | 647
Release Information | 647
Syntax
key-server-priority priority-number;
Hierarchy Level
[edit security macsec connectivity-association mka]
Description
Specifies the key server priority used by the MACsec Key Agreement (MKA) protocol to select the keyserver when MACsec is enabled using static connectivity association key (CAK) security mode.
The switch with the lower priority-number is selected as the key server.
If the priority-number is identical on both sides of a point-to-point link, the MKA protocol selects thedevice with the lower MAC address as the key server.
Default
The default key server priority number is 16.
646

Options
priority-number
Specifies the MKA server election priority number.
The priority-number can be any number between 0 and 255. The lower the number, thehigher the priority.
Required Privilege Level
admin—To view this statement in the configuration.
admin-control—To add this statement to the configuration.
Release Information
Statement introduced in Junos OS Release 15.1X49-D60.
RELATED DOCUMENTATION
Understanding Media Access Control Security (MACsec) | 481
Configuring Media Access Control Security (MACsec) | 484
macsec | 651
lacp (Interfaces)
IN THIS SECTION
Syntax | 648
Hierarchy Level | 648
Description | 648
647

Options | 648
Required Privilege Level | 649
Release Information | 649
Syntax
lacp { (active | passive); periodic (fast | slow);}
Hierarchy Level
[edit interfaces interface-name redundant-ether-options]
Description
For redundant Ethernet interfaces in a chassis cluster only, configure Link Aggregation Control Protocol(LACP).
Options
• active—Initiate transmission of LACP packets.
• passive—Respond to LACP packets.
• periodic—Interval for periodic transmission of LACP packets. The options are:
• fast—Transmit link aggregation control PDUs every second.
648

• slow—Transmit link aggregation control PDUs every 30 seconds.
• Default: If you do not specify lacp as either active or passive, LACP remains off (the default).
The remaining statements are explained separately. See CLI Explorer.
Required Privilege Level
interface—To view this statement in the configuration.
interface-control—To add this statement to the configuration.
Release Information
Statement introduced in Junos OS Release 10.2.
RELATED DOCUMENTATION
Understanding LACP on Standalone Devices
periodic (Interfaces)
link-protection (Chassis Cluster)
IN THIS SECTION
Syntax | 650
Hierarchy Level | 650
Description | 650
Options | 650
Required Privilege Level | 650
Release Information | 651
649

Syntax
link-protection { non-revertive;}
Hierarchy Level
[edit chassis aggregated-devices ethernet lacp]
Description
Enable Link Aggregation Control Protocol (LACP) link protection at the global (chassis) level.
By default LACP link protection reverts to a higher-priority (lower-numbered) link when the higher-priority link becomes operational or when a higher-priority link is added to the aggregated Ethernetbundle.
You can suppress link calculation by adding the non-revertive statement to the link protectionconfiguration. In nonrevertive mode, when a link is active in sending and receiving LACP packets, addinga higher-priority link to the bundle does not change the status of the currently active link. It remainsactive.
Options
non-revertive Disable the ability to switch to a better priority link (if one is available) after a link isestablished as active and a collection or distribution is enabled.
Required Privilege Level
interface—To view this statement in the configuration.
650

interface-control—To add this statement to the configuration.
Release Information
Statement introduced in Junos OS Release 10.2.
RELATED DOCUMENTATION
cluster (Chassis) | 601
Example: Configuring Aggregated Ethernet Device with LAG and LACP on a Security Device (CLIProcedure)
macsec
IN THIS SECTION
Syntax | 651
Hierarchy Level | 652
Description | 653
Options | 653
Required Privilege Level | 653
Release Information | 653
Syntax
macsec { cluster-control-port <idx> { connectivity-association connectivity-association-name; } cluster-data-port interface-name {
651

connectivity-association connectivity-association-name; } connectivity-associationconnectivity-association-name { exclude-protocol protocol-name; include-sci; mka { key-server-priority priority-number; must-secure; transmit-interval milliseconds; } no-encryption; offset (0|30|50); pre-shared-key { cak hexadecimal-number; ckn hexadecimal-number; } replay-protect { replay-window-size number-of-packets; } security-mode security-mode; } traceoptions (Chassis Cluster){ file { filename; files number; match regular-expression; (world-readable | no-world-readable); size maximum-file-size; } flag flag; }}
Hierarchy Level
[edit security]
652

Description
Configure Media Access Control Security (MACsec). Media Access Control Security(MACsec) issupported on control and fabric ports of SRX340, SRX345, and SRX4600 devices in chassis clustermode to secure point-to-point Ethernet links between the peer devices in a cluster. Each point-to-pointEthernet link must be configured independently to secure using MACsec. You can enable MACsecencryption on device-to-device links using static connectivity association key (CAK) security mode.
Options
cluster-control-port <idx> Specify chassis cluster control interface on which MACsec is enabled.
• Values: 0.
cluster-data-port interface-name Specify chassis cluster fabric interface on which MACsec is enabled.
connectivity-association Create or configure a MACsec connectivity association.
traceoptions Define MACsec configuration tracing operations.
The remaining statements are explained separately. See CLI Explorer.
Required Privilege Level
admin—To view this statement in the configuration.
admin-control—To add this statement to the configuration.
Release Information
Statement introduced in Junos OS Release 15.1X49-D60.
RELATED DOCUMENTATION
Configuring Media Access Control Security (MACsec) | 484
Understanding Media Access Control Security (MACsec) | 481
653

mka
IN THIS SECTION
Syntax | 654
Hierarchy Level | 654
Description | 654
Options | 655
Required Privilege Level | 655
Release Information | 655
Syntax
mka { must-secure; key-server-priority priority-number; transmit-interval interval;}
Hierarchy Level
[edit security macsec connectivity-association]
Description
Specify parameters for the MACsec Key Agreement (MKA) protocol. You initially establish a MACsec-secured link using a pre-shared key when you are using static CAK security mode to enable MACsec.Once matching pre-shared keys are successfully exchanged, the MACsec Key Agreement (MKA)
654

protocol is enabled. The MKA protocol is responsible for maintaining MACsec on the link, and decideswhich switch on the point-to-point link becomes the key server. The key server then creates an SAK thatis shared with the switch at the other end of the point-to-point link only, and that SAK is used to secureall data traffic traversing the link.
Options
The remaining statements are explained separately.
Required Privilege Level
admin—To view this statement in the configuration.
admin-control—To add this statement to the configuration.
Release Information
Statement introduced in Junos OS Release 15.1X49-D60.
RELATED DOCUMENTATION
Understanding Media Access Control Security (MACsec) | 481
Configuring Media Access Control Security (MACsec) | 484
macsec | 651
network-management
IN THIS SECTION
Syntax | 656
655

Hierarchy Level | 656
Description | 656
Options | 657
Required Privilege Level | 657
Release Information | 657
Syntax
network-management { cluster-master;}
Hierarchy Level
[edit chassis cluster]
Description
Define parameters for network management. To manage an SRX Series Services Gateway clusterthrough a non-fxp0 interface, use this command to define the node as a virtual chassis in NSM. Thiscommand establishes a single DMI connection from the primary node to the NSM server. Thisconnection is used to manage both nodes in the cluster. Note that the non-fxp0 interface (regardless ofwhich node it is present on) is always controlled by the primary node in the cluster. The output of a<get-system-information> RPC returns a <chassis-cluster> tag in all SRX Series devices. When NSMreceives this tag, it models SRX Series clusters as devices with autonomous control planes.
656

Options
cluster-master—Enable in-band management on the primary cluster node through NSM.
Required Privilege Level
interface—To view this statement in the configuration.
interface-control—To add this statement to the configuration.
Release Information
Statement introduced in Junos OS Release 11.1.
RELATED DOCUMENTATION
cluster (Chassis) | 601
no-encryption (MACsec)
IN THIS SECTION
Syntax | 658
Hierarchy Level | 658
Description | 658
Default | 658
Required Privilege Level | 659
Release Information | 659
657

Syntax
no-encryption;
Hierarchy Level
[edit security macsec connectivity-association security-mode static-cak]
Description
Enable MACsec encryption within a secure channel.
You can enable MACsec without enabling encryption. If a connectivity association with a secure channelthat has not enabled MACsec encryption is associated with an interface, traffic is forwarded across theEthernet link in clear text. You are, therefore, able to view this unencrypted traffic when you aremonitoring the link. The MACsec header is still applied to the frame, however, and all MACsec dataintegrity checks are run on both ends of the link to ensure the traffic has not been tampered with anddoes not represent a security threat.
Traffic traversing a MAC-enabled point-to-point Ethernet link traverses the link at the same speedregardless of whether encryption is enabled or disabled. You cannot increase the speed of traffictraversing a MACsec-enabled Ethernet link by disabling encryption.
When MACsec is configuring using static connectivity association key (CAK) security mode, theencryption setting is configured outside of the secure channel using the no-encryption configurationstatement.
Default
MACsec encryption is disabled when MACsec is configured, by default.
658

Required Privilege Level
admin—To view this statement in the configuration.
admin-control—To add this statement to the configuration.
Release Information
Statement introduced in Junos OS Release 15.1X49-D60.
RELATED DOCUMENTATION
Understanding Media Access Control Security (MACsec) | 481
Configuring Media Access Control Security (MACsec) | 484
macsec | 651
node (Chassis Cluster Redundancy Group)
IN THIS SECTION
Syntax | 660
Hierarchy Level | 660
Description | 660
Options | 660
Required Privilege Level | 661
Release Information | 661
659

Syntax
node (0 | 1 ) { priority number;}
Hierarchy Level
[edit chassis cluster redundancy-group group-number ]
Description
Identify each cluster node in a redundancy group and set its relative priority for primary role.
A redundancy group is collection of objects. A redundancy group contains objects on both nodes. Aredundancy group is primary on one node and backup on the other at any time. When a redundancygroup is said to be primary on a node, its objects on that node are active. The primacy of a redundancygroup is dependent on the priority configured for the node, the node ID (in case of tied priorities), andthe order in which the node comes up.
Options
node Cluster node number, You can set with the set chassis cluster node node-number statement.
• Values:
• 0—Node identifier 0
• 1—Node identifier 1
prioritynumber
Priority value of the node. Each node is given a priority within a redundancy group. Theeligible node with the highest priority is elected primary. Initiating a failover with the requestchassis cluster failover node or request chassis cluster failover redundancy-group commandoverrides the priority settings.
660

• Range: 1-254
Required Privilege Level
interface—To view this statement in the configuration.
interface-control—To add this statement to the configuration.
Release Information
Statement introduced in Junos OS Release 9.0.
RELATED DOCUMENTATION
redundancy-group (Chassis Cluster) | 680
ntp
IN THIS SECTION
Syntax | 662
Hierarchy Level | 662
Description | 663
Options | 663
Required Privilege Level | 668
Release Information | 668
661

Syntax
ntp { authentication-key key-number type (md5 | sha1 | sha256) value password; boot-server (address | hostname); broadcast <address> <key key-number> <routing-instance-name routing-instance-name> <ttl value> <version value>; broadcast-client; interval-range value; multicast-client <address>; nts <local-certificate local-certificate><trusted-ca (trusted-ca-group trusted-ca-group | trusted-ca-profile trusted-ca-profile)>; peer address <key key-number> <prefer> <version value>; restrict address { mask network-mask; noquery; } server name { key key; nts <remote-identity distinguished-name(container container | wildcard wildcard) hostname hostname>; prefer; routing-instance routing-instance; version version; } source-address source-address <routing-instance routing-instance-name>; threshold value action (accept | reject); trusted-key [ key-numbers ];}
Hierarchy Level
[edit system]
662

Description
Configure NTP on the device. In both standalone and chassis cluster modes, the primary Routing Engineruns the NTP process to get the time from the external NTP server. Although the secondary RoutingEngine runs the NTP process in an attempt to get the time from the external NTP server, this attemptfails because of network issues. For this reason, the secondary Routing Engine uses NTP to get the timefrom the primary Routing Engine.
When configuring the NTP service in the management VRF (mgmt_junos), you must configure at least oneIP address on a physical or logical interface within the default routing instance and ensure that thisinterface is up in order for the NTP service to work with the mgmt_junos VRF.
Options
authentication-keykey_number
Configure key (key ID, key type, and key value) to authenticate NTP packetswith the devices (servers and clients). The authentication key has two fields:
• type—When authentication is specified, the key identifier (key ID) followedby the message digest is appended to the NTP packet header. Thesupported message digest formats are md5, sha1, sha256.
• value—If the key value is available in ASCII format and without specialcharacters, it can be entered directly. If the key value contains specialcharacters or is available in hex format, consider the following:
For specifying the keys in hex format, prepend a "\x" for each twocharacters. For hex key example, af60112f...39af4ced,set system ntp authentication-key <ID> value "\xaf\x60\x11\x2f\....\x39\xaf\x4c\xed".
If the key contains one of the characters from (null) 0x00, (space) 0x20, "0x22, & 0x26, ( 0x28 ) 0x29 prepend a "\\x" . For example, \\x22.
• Range: 1 to 65534
boot-server (address |hostname)
Configure the server that NTP queries when the device boots to determinethe local date and time.
When you boot the device, it issues an ntpdate request, which polls anetwork server to determine the local date and time. You must configure anNTP boot server that the device uses to determine the time when the device
663

boots. Otherwise, NTP cannot synchronize to a time server if the server timesignificantly differs from the local device’s time.
If you configure an NTP boot server, then when the device boots, itimmediately synchronizes with the boot server even if the NTP process isexplicitly disabled or if the time difference between the client and the bootserver exceeds the threshold value of 1000 seconds.
• Values: Configure one of the following:
• address—IP address of an NTP boot server.
• hostname—Hostname of an NTP boot server. If you configure ahostname instead of an IP address, the ntpdate request resolves thehostname to an IP address when the device boots up.
broadcast <address><key key-number><routing-instance-namerouting-instance-name><ttl value> <versionvalue>
Configure the device to operate in broadcast mode with the remote systemat the specified address. In this mode, the device sends periodic broadcastmessages to a client population at the specified broadcast or multicastaddress. Normally, you include this statement only when the device isoperating as a transmitter.
address Configure the broadcast address on one of the localnetworks or a multicast address assigned to NTP. You mustspecify an address, not a hostname. If the multicast addressis used, it must be 224.0.1.1.
key key-number
(Optional) All packets sent to the address includeauthentication fields that are encrypted using the specifiedkey number (any unsigned 32-bit integer except 0). The keycorresponds to the key number you specified in theauthentication-key statement.
routing-instance-namerouting-instance-name
(Optional) Configure the routing instance name in which theinterface has an address in the broadcast subnet.
• Default: The default routing instance is used to broadcastpackets.
ttl value (Optional) Configure the time-to-live (TTL) value.
• Range: 1 through 255
• Default: 1
664

version value (Optional) Specify the version number to be used in outgoingNTP packets.
• Range: 1 through 4
• Default: 4
broadcast-client Configure the local device to listen for broadcast messages on the localnetwork to discover other servers on the same subnet. To avoid accidental ormalicious disruption in this mode, both the local and remote systems mustuse authentication and the same trusted key and key identifier.
interval-range value Configure the poll interval range.
• Range: 0 through 3
multicast-client<address>
Configure the local device to listen for multicast messages on the localnetwork. To avoid accidental or malicious disruption in this mode, both thelocal and remote systems must use authentication and the same trusted keyand key identifier.
• Syntax: <address>—(Optional) Specify one or more IP addresses. If youspecify addresses, the device joins those multicast groups.
• Default: 224.0.1.1
nts <local-certificatelocal-certificate><trusted-ca(trusted-ca-grouptrusted-ca-group |trusted-ca-profiletrusted-ca-profile)
Configure the Network Time Security (NTS) features for NTP on your device.
local-certificatelocal-certificate
Specify the certificate loaded in your device duringcertificate enrollment or loaded manually by specifyingcertificate file.
trusted-ca Specify a trusted CA group or a CA profile. This configuration isoptional. If you do not specify a trusted CA profile the NTP trustall CA profiles configured for NTS.
trusted-ca-group trusted-ca-group
Specify the trusted CA group defined under [setsecurity pki trusted-ca-group].
trusted-ca-profile trusted-ca-profile Specify the trusted CA profile.
peer address <key key-number> <prefer><version value>
Configure the local device to operate in symmetric active mode with theremote system at the specified address. In this mode, the local device and
665

the remote system can synchronize with each other. This configuration isuseful in a network in which either the local device or the remote systemmight be a better source of time.
address Address of the remote system. You must specify an address, nota hostname.
key key-number
(Optional) All packets sent to the address includeauthentication fields that are encrypted using the specified keynumber (any unsigned 32-bit integer except 0). The keycorresponds to the key number you specified in theauthentication-key statement.
prefer (Optional) Mark the remote system as the preferred host, whichmeans that if all other factors are equal, this remote system ischosen for synchronization among a set of correctly operatingsystems.
versionvalue
(Optional) Specify the NTP version number to be used inoutgoing NTP packets.
• Range: 1 through 4
• Default: 4
restrict address masknetwork-mask noquery
Restrict packets from hosts (including remote time servers) and subnets.
• Syntax:
• address—Specify the IP address for a host or network.
• mask network-mask—Specify the network mask for a host or network.
• noquery—Deny ntpq and ntpdc queries from hosts and subnets. Thesequeries can be used in amplification attacks.
server Configure the local device to operate in client mode with the remote systemat the specified address. In this mode, the device can be synchronized withthe remote system, but the remote system can never be synchronized withthe device.
If the NTP client time drifts so that the difference in time from the NTPserver exceeds 128 milliseconds, the client is automatically stepped back intosynchronization. If the offset between the NTP client and server exceeds the1000-second threshold, the client still synchronizes with the server, but it
666

also generates a system log message noting that the threshold wasexceeded.
address Address of the remote system. You must specify an address,not a hostname.
key key-number
(Optional) All packets sent to the address includeauthentication fields that are encrypted using the specified keynumber (any unsigned 32-bit integer except 0). The keycorresponds to the key number you specified in theauthentication-key statement.
prefer (Optional) Mark the remote system as the preferred host,which means that if all other factors are equal, this remotesystem is chosen for synchronization among a set of correctlyoperating systems.
routing-instancerouting-instance
(Optional) Routing instance through which the server isreachable.
nts Enables NTS, which uses Transport Layer Security (TLS)protocol and Authenticated Encryption with Associated Data(AEAD) to obtain network time in an authenticated manner tothe users. Specified server must also support the NTS featurewhen you enable NTS on a client device.
versionvalue
(Optional) Specify the NTP version number to be used inoutgoing NTP packets.
• Range: 1 through 4
• Default: 4
source-addresssource-address <routing-instance [ routing-instance-name ]>
A valid IP address configured on one of the device’s interfaces to be used asthe source address for messages sent to the NTP server, and optionally, therouting instance in which the source address is configured.
• Default: The primary address of the interface
threshold seconds action(accept | reject)
Configure the maximum threshold in seconds allowed for NTP adjustmentand specify the mode for NTP abnormal adjustment.
• Range: 1 through 600 seconds
667

• Values: Configure one of the following:
• accept—Enable log mode for abnormal NTP adjustment.
• reject—Enable reject mode for abnormal NTP adjustment.
trusted-key [ key-numbers ]
Configure one or more keys you are allowed to use to authenticate othertime servers, when you configure the local device to synchronize its timewith other systems on the network. Each key can be any 32-bit unsignedinteger except 0. The key corresponds to the key number you specify in theauthentication-key statement.
By default, network time synchronization is unauthenticated. The devicesynchronizes to whatever system appears to have the most accurate time.We strongly encourage you to configure authentication of network timeservices.
Required Privilege Level
system—To view this statement in the configuration.
system-control—To add this statement to the configuration.
Release Information
Statement introduced before Junos OS Release 7.4.
routing-instance option for the server statement introduced in Junos OS Release 18.1.
restrict statement introduced in Junos OS Release 20.1.
RELATED DOCUMENTATION
Synchronizing and Coordinating Time Distribution Using NTP
Understanding NTP Time Servers
Configuring NTP Authentication Keys
NTP Time Synchronization on SRX Series Devices
Configuring the NTP Time Server and Time Services
668

Configuring the Switch to Listen for Broadcast Messages Using NTP
Configuring the Switch to Listen for Multicast Messages Using NTP
ntp threshold
IN THIS SECTION
Syntax | 669
Hierarchy Level | 669
Description | 669
Options | 670
Required Privilege Level | 670
Release Information | 671
Syntax
threshold value<action (accept | reject)>;
Hierarchy Level
[edit system ntp]
Description
Assign a threshold value for Network Time Protocol (NTP) adjustment that is outside of the acceptableNTP update and specify whether to accept or reject NTP synchronization when the proposed time fromthe NTP server exceeds the configured threshold value. If accept is the specified action, the system
669

synchronizes the device time with the NTP server, but logs the time difference between the configuredthreshold and the time proposed by the NTP server; if reject is the specified action, synchronizationwith the time proposed by the NTP server is rejected, but the system provides the option of manuallysynchronizing the device time with the time proposed by the NTP server and logs the time differencebetween the configured threshold and the time proposed by the NTP server. By logging the timedifference and rejecting synchronization when the configured threshold is exceeded, this feature helpsimprove security on the NTP service.
If this command is not configured or by default, the NTP will allow time adjustments for up to 1000seconds except for first time adjustment. After NTP synchronization starts, it will allow first timeadjustment to happen without any time limit. After first time adjustment happens, 1000 seconds timelimit will be enforced for future time adjustments.
Options
value Specify the maximum value in seconds allowed for NTP adjustment.
• Range: 1 through 600.
• Default: The default value is 400.
action Specify the actions for NTP abnormal adjustment.
• accept—Enable log mode for abnormal NTP adjustment. When the proposed time from theNTP server is outside of the configured threshold value, the device time synchronizes withthe NTP server, but the system logs the time difference between the configured thresholdand the time proposed by the NTP server.
• reject—Enable log and reject mode for abnormal NTP adjustment. When the proposed timefrom the NTP server is outside of the configured threshold value, the system rejectssynchronization, but provides the option for manually synchronizing the time and logs thetime difference between the configured threshold and the time proposed by the NTP server.
Required Privilege Level
security—To view this statement in the configuration.
security-control—To add this statement to the configuration.
670

Release Information
Statement introduced in Junos OS Release 15.1X49-D70.
RELATED DOCUMENTATION
ntp
set date ntp | 947
show system ntp threshold | 949
NTP Time Synchronization on SRX Series Devices | 353
offset
IN THIS SECTION
Syntax | 671
Hierarchy Level | 672
Description | 672
Default | 672
Options | 672
Required Privilege Level | 673
Release Information | 673
Syntax
offset (0 |30 | 50);
671
Hierarchy Level
[edit security macsec connectivity-association][edit security macsec connectivity-association security-mode static-cakl]
Description
Specifies the number of octets in an Ethernet frame that are sent in unencrypted plain-text whenencryption is enabled for MACsec.
Setting the offset to 30 allows a feature to see the IPv4 header and the TCP/UDP header whileencrypting the remaining traffic. Setting the offset to 50 allows a feature to see the IPv6 header and theTCP/UDP header while encrypting the remaining traffic.
You would typically forward traffic with the first 30 or 50 octets unencrypted if a feature needed to seethe data in the octets to perform a function, but you otherwise prefer to encrypt the remaining data inthe frames traversing the link. Load balancing features, in particular, typically need to see the IP andTCP/UDP headers in the first 30 or 50 octets to properly load balance traffic.
You configure the offset in the [edit security macsec connectivity-association] hierarchy when you areenabling MACsec using static connectivity association key (CAK) or dynamic security mode.
Default
0
Options
0 Specifies that no octets are unencrypted. When you set the offset to 0, all traffic on the interfacewhere the connectivity association or secure channel is applied is encrypted.
30 Specifies that the first 30 octets of each Ethernet frame are unencrypted.
672

NOTE: In IPv4 traffic, setting the offset to 30 allows a feature to see the IPv4 header andthe TCP/UDP header while encrypting the rest of the traffic. An offset of 30, therefore, istypically used when a feature needs this information to perform a task on IPv4 traffic.
50 Specified that the first 50 octets of each Ethernet frame are unencrypted.
NOTE: In IPv6 traffic, setting the offset to 50 allows a feature to see the IPv6 header andthe TCP/UDP header while encrypting the rest of the traffic. An offset of 50, therefore, istypically used when a feature needs this information to perform a task on IPv6 traffic.
Required Privilege Level
admin—To view this statement in the configuration.
admin-control—To add this statement to the configuration.
Release Information
Statement introduced in Junos OS Release 15.1X49-D60.
RELATED DOCUMENTATION
Understanding Media Access Control Security (MACsec) | 481
Configuring Media Access Control Security (MACsec) | 484
macsec | 651
673

preempt (Chassis Cluster)
IN THIS SECTION
Syntax | 674
Hierarchy Level | 674
Description | 674
Options | 675
Required Privilege Level | 675
Release Information | 676
Syntax
preempt { delay seconds; limit limit; period seconds;}
Hierarchy Level
[edit chassis cluster redundancy-group group-number]
Description
Allow preemption of the primary system based on the priority within a redundancy group.
Configuring preemption for RG0 is not allowed and is blocked when committed.
674

By configuring the preemptive delay timer and failover limit, you can limit the flapping of theredundancy group state between the secondary and the primary in a preemptive failover.
By default, preemption is disabled.
Example: Consider the following scenario where you have configured a preemptive period as 300seconds and preemptive limit as 50.
When the preemptive limit is configured as 50, the count starts at 0 and increments with a firstpreemptive failover; this process continues until the count reaches the configured preemptive limit, thatis 50, before the preemptive period expires. When the preemptive limit (50) is exceeded, you mustmanually reset the preempt count to allow preemptive failovers to occur again.
When you have configured the preemptive period as 300 seconds, and if the time difference betweenthe first preemptive failover and the current failover has already exceeded 300 seconds, and thepreemptive limit (50) is not yet reached, then the preemptive period will be reset. After resetting, thelast failover is considered as the first preemptive failover of the new preemptive period and the processstarts all over again.
Options
delay Time to wait before the node in secondary state transitions to primary state in a preemptivefailover.
• Range: 1 to 21,600 seconds
• Default: 1
limit Maximum number of preemptive failovers allowed in a configured preemptive period.
• Range: 1 to 50
period Time period during which the preemptive limit is applied.
• Range: 1 to 1400 seconds
Required Privilege Level
interface—To view this statement in the configuration.
interface-control—To add this statement to the configuration.
675

Release Information
Statement introduced in Junos OS Release 9.0. Support for delay, limit, and period options are added inJunos OS Release 17.4R1.
RELATED DOCUMENTATION
redundancy-group (Chassis Cluster) | 680
Understanding Chassis Cluster Redundancy Group Failover | 275
pre-shared-key
IN THIS SECTION
Syntax | 676
Hierarchy Level | 677
Description | 677
Default | 677
Options | 677
Required Privilege Level | 677
Release Information | 678
Syntax
pre-shared-key { cak hexadecimal-number; ckn hexadecimal-number;}
676

Hierarchy Level
[edit security macsec connectivity-association]
Description
Specifies the pre-shared key used to enable MACsec using static connectivity association key (CAK)security mode.
A pre-shared key includes a connectivity association key name (CKN) and a connectivity association key(CAK). A pre-shared key is exchanged between two devices at each end of a point-to-point link toenable MACsec using static CAK security mode. The MACsec Key Agreement (MKA) protocol is enabledafter the pre-shared keys are successfully verified and exchanged. The pre-shared key—the CKN andCAK—must match on both ends of a link.
Default
No pre-shared keys exist, by default.
Options
The remaining statements are explained separately.
Required Privilege Level
admin—To view this statement in the configuration.
admin-control—To add this statement to the configuration.
677

Release Information
Statement introduced in Junos OS Release 15.1X49-D60.
RELATED DOCUMENTATION
Understanding Media Access Control Security (MACsec) | 481
Configuring Media Access Control Security (MACsec) | 484
macsec | 651
priority (Protocols VRRP)
IN THIS SECTION
Syntax | 678
Hierarchy Level | 679
Description | 679
Options | 679
Required Privilege Level | 680
Release Information | 680
Syntax
priority priority;
678

Hierarchy Level
[edit interfaces interface-name unit logical-unit-number family inet address address vrrp-group group-id],[edit interfaces interface-name unit logical-unit-number family inet6 address address vrrp-inet6-group group-id],[edit logical-systems logical-system-name interfaces interface-name unit logical-unit-number family inet address address vrrp-group group-id],[edit logical-systems logical-system-name interfaces interface-name unit logical-unit-number family inet6 address address vrrp-inet6-group group-id]
Description
Configure a Virtual Router Redundancy Protocol (VRRP) device’s priority for becoming the primarydefault device. The device with the highest priority within the group becomes the primary. VRRP isdesigned to eliminate the single point of failure inherent in the static default routed environment. VRRPspecifies an election protocol that dynamically assigns responsibility for a virtual router to one of theVRRP routers on a LAN. The VRRP router controlling the IP address(es) associated with a virtual routeris called the Primary, and forwards packets sent to these IP addresses. The election process providesdynamic fail-over in the forwarding responsibility when the Primary become unavailable. Any of thevirtual router's IP addresses on a LAN can then be used as the default first hop router by end-hosts. Theadvantage gained from using VRRP is a higher availability default path without requiring configuration ofdynamic routing or router discovery protocols on every end-host.
Options
priority Device’s priority for being elected to be the primary device in the VRRP group. A larger valueindicates a higher priority for being elected.
• Range: 0 through 255
• Default: 100. If two or more devices have the highest priority in the VRRP group, the device with theVRRP interface that has the highest IP address becomes the primary, and the others serve asbackups.
679

Required Privilege Level
interface—To view this statement in the configuration.
interface-control—To add this statement to the configuration.
Release Information
Statement introduced before Junos OS Release 7.4.
RELATED DOCUMENTATION
Configuring Basic VRRP Support
Understanding VRRP on SRX Series Devices | 321
Example: Configuring VRRP/VRRPv3 on Chassis Cluster Redundant Ethernet Interfaces | 327
redundancy-group (Chassis Cluster)
IN THIS SECTION
Syntax | 681
Hierarchy Level | 682
Description | 682
Options | 682
Required Privilege Level | 683
Release Information | 683
680

Syntax
redundancy-group group-number { gratuitous-arp-count number; hold-down-interval number; interface-monitor interface-name { weight number; } ip-monitoring{ family { inet { ipv4-address { interface { logical-interface-name; secondary-ip-address ip-address; } weight number; } } } global-threshold number; global-weight number; retry-count number; retry-interval seconds; } node (0 | 1 ) { priority number; } preempt (Chassis Cluster){ delay seconds; limit limit; period seconds; }}
681

Hierarchy Level
[edit chassis cluster]
Description
Define a redundancy group. Except for redundancy group 0, a redundancy group is a logical interfaceconsisting of two physical Ethernet interfaces, one on each chassis. One interface is active, and theother is on standby. When the active interface fails, the standby interface becomes active. The logicalinterface is called a redundant Ethernet interface (reth).
Redundancy group 0 consists of the two Routing Engines in the chassis cluster and controls whichRouting Engine is primary. You must define redundancy group 0 in the chassis cluster configuration.
Options
group-number Redundancy group identification number.
NOTE: The maximum number of redundancy groups is equal to the numberof redundant Ethernet interfaces that you configure.
• Range: 0 through 128
interface-monitor Specify a redundancy group interface to be monitored for failover and the relativeweight of the interface.
ip-monitor Specify IP address of interface to be monitored for end-to-end connectivity.
gratuitous-arp-count
Number of gratuitous ARPs to send on an active interface after failover
• Range: 1-16
hold-down-interval
RG failover interval. RG0(300-1800) RG1+(0-1800) (seconds)
• Range: 0-1800
682

node Identify each cluster node in a redundancy group and set its relative priority forprimary role.
preempt Allow preemption of the primary system based on the priority within a redundancygroup.
The remaining statements are explained separately. See CLI Explorer.
Required Privilege Level
interface—To view this statement in the configuration.
interface-control—To add this statement to the configuration.
Release Information
Statement introduced in Junos OS Release 9.0.
RELATED DOCUMENTATION
ip-monitoring | 642
redundant-ether-options
IN THIS SECTION
Syntax | 684
Hierarchy Level | 684
Description | 684
Options | 685
Required Privilege Level | 685
683

Release Information | 686
Syntax
redundant-ether-options { (flow-control | no-flow-control); lacp { (active | passive); periodic (fast | slow); } link-speed speed; (loopback | no-loopback); minimum-links number; redundancy-group number; source-address-filter mac-address; (source-filtering | no-source-filtering); }
Hierarchy Level
[edit interfaces interface-name]
Description
Configure Ethernet redundancy options for a chassis cluster.
In a chassis cluster setup, a redundant Ethernet interface is a pseudointerface that includes at minimumone physical interface from each node of the cluster.
A reth is a special type of interface that has the characteristics of aggregated Ethernet interface.
684

Options
flow-control Enable flow control.
link-speed Link speed of individual interface that joins the reth interface.
• Values:
• 100m—Links are 100 Mbps
• 10g—Links are 10 Gbps
• 10m—Links are 10 Mbps
• 1g—Links are 1Gbps
loopback Enable loopback.
minimum-links Minimum number of active links.
• Default: 1
• Range: 1-8
no-flow-control Do not enable flow control.
no-loopback Do not enable loopback.
no-source-filtering Do not enable source address filtering.
redundancy-group Redundancy group of this interface.
• Range: 1-128
source-filtering Enable source address filtering.
Required Privilege Level
interface—To view this statement in the configuration.
interface-control—To add this statement to the configuration.
685

Release Information
Statement introduced in Junos OS Release 9.2.
RELATED DOCUMENTATION
Example: Enabling Eight-Queue Class of Service on Redundant Ethernet Interfaces on SRX SeriesDevices in a Chassis Cluster | 145
Example: Configuring Chassis Cluster Redundant Ethernet Interfaces | 105
redundant-parent (Interfaces)
IN THIS SECTION
Syntax | 686
Hierarchy Level | 687
Description | 687
Options | 687
Required Privilege Level | 687
Release Information | 687
Syntax
redundant-parent redundant-ethernet-interface-name;
686

Hierarchy Level
[edit interfaces interface-name gigether-options][edit interfaces interface-name fastether-options]
Description
Specify redundant Ethernet interfaces (reth) and assign local (child) interfaces to the reth interfaces. Aredundant Ethernet interface contains a pair of Fast Ethernet interfaces or a pair of Gigabit Ethernetinterfaces that are referred to as child interfaces of the redundant Ethernet interface.
Options
Required Privilege Level
interface—To view this statement in the configuration.
interface-control—To add this statement to the configuration.
Release Information
Statement introduced in Junos OS Release 10.2.
RELATED DOCUMENTATION
Example: Configuring Chassis Cluster Redundant Ethernet Interfaces | 105
687

redundant-pseudo-interface-options
IN THIS SECTION
Syntax | 688
Hierarchy Level | 688
Description | 688
Options | 689
Required Privilege Level | 689
Release Information | 689
Syntax
redundant-pseudo-interface-options { redundancy-group redundancy-group-number;}
Hierarchy Level
[edit interfaces lo0]
Description
Configure the loopback pseudointerface in a redundancy group.
Redundancy groups are used to bundle interfaces into a group for failover purpose in a chassis clustersetup. You can configure a loopback interface as an alternative physical interface to reach the peergateway. Loopback interfaces can be configured on any redundancy group.
688

For example: An Internet Key Exchange (IKE) gateway operating in chassis cluster, needs an externalinterface to communicate with a peer device. When an external interface (a reth interface or astandalone interface) is used for communication; the interface might go down when the physicalinterfaces are down. Instead, use loopback interfaces as an alternative to physical interfaces.
Options
redundancy-group-number Configure the redundancy group number.
• Range: 0 through 255
Required Privilege Level
interface—To view this statement in the configuration.
interface-control—To add this statement to the configuration.
Release Information
Statement introduced in Junos OS Release 12.1X44-D10.
RELATED DOCUMENTATION
Understanding the Loopback Interface for a High Availability VPN
replay-protect
IN THIS SECTION
Syntax | 690
689

Hierarchy Level | 690
Description | 690
Options | 691
Required Privilege Level | 691
Release Information | 691
Syntax
replay-protect { replay-window-size number-of-packets;}
Hierarchy Level
[edit security macsec connectivity-association]
Description
Enable replay protection for MACsec.
A replay window size specified using the replay-window-sizenumber-of-packets statement must bespecified to enable replay protection. When replay protection is enabled, the receiving interface checksthe ID number of all packets that have traversed the MACsec-secured link. If a packet arrives out ofsequence and the difference between the packet numbers exceeds the replay protection window size,the packet is dropped by the receiving interface. For instance, if the replay protection window size is setto five and a packet assigned the ID of 1006 arrives on the receiving link immediately after the packetassigned the ID of 1000, the packet that is assigned the ID of 1006 is dropped because it falls outsidethe parameters of the replay protection window. Replay protection is especially useful for fighting man-in-the-middle attacks.
690

A packet that is replayed by a man-in-the-middle attacker on the Ethernet link will arrive on thereceiving link out of sequence, so replay protection helps ensure the replayed packet is dropped insteadof forwarded through the network. Replay protection should not be enabled in cases where packets areexpected to arrive out of order. You can require that all packets arrive in order by setting the replaywindow size to 0.
Replay protection should not be enabled in cases where packets are expected to arrive out of order.
Options
The remaining statements are explained separately.
Required Privilege Level
admin—To view this statement in the configuration.
admin-control—To add this statement to the configuration.
Release Information
Statement introduced in Junos OS Release 15.1X49-D60.
RELATED DOCUMENTATION
Understanding Media Access Control Security (MACsec) | 481
Configuring Media Access Control Security (MACsec) | 484
macsec | 651
691

replay-window-size
IN THIS SECTION
Syntax | 692
Hierarchy Level | 692
Description | 692
Default | 693
Options | 693
Required Privilege Level | 693
Release Information | 693
Syntax
replay-window-size number-of-packets;
Hierarchy Level
[edit security macsec connectivity-association replay-protect]
Description
Specifies the size of the replay protection window.
This statement has to be configured to enable replay protection.
When MACsec is enabled on an Ethernet link, an ID number is assigned to each packet entering the link.The ID number of the packet is checked by the receiving interface after the packet has traversed theMACsec-enabled link.
692

When replay protection is enabled, the sequence of the ID number of received packets are checked. Ifthe packet arrives out of sequence and the difference between the packet numbers exceeds the replayprotection window size, the packet is dropped by the receiving interface. For instance, if the replayprotection window size is set to five and a packet assigned the ID of 1006 arrives on the receiving linkimmediately after the packet assigned the ID of 1000, the packet that is assigned the ID of 1006 isdropped because it falls outside the parameters of the replay protection window.
Replay protection is especially useful for fighting man-in-the-middle attacks. A packet that is replayed bya man-in-the-middle attacker on the Ethernet link will arrive on the receiving link out of sequence, soreplay protection helps ensure the replayed packet is dropped instead of forwarded through thenetwork.
Replay protection should not be enabled in cases where packets are expected to arrive out of order.
Default
Replay protection is disabled.
Options
number-of-packets
Specifies the size of the replay protection window, in packets.
When this variable is set to 0, all packets that arrive out-of-order are dropped. Themaximum out-of-order number-of-packets that can be configured is 65535.
Required Privilege Level
admin—To view this statement in the configuration.
admin-control—To add this statement to the configuration.
Release Information
Statement introduced in Junos OS Release 15.1X49-D60.
693

RELATED DOCUMENTATION
Understanding Media Access Control Security (MACsec) | 481
Configuring Media Access Control Security (MACsec) | 484
macsec | 651
resource-watch
IN THIS SECTION
Syntax | 694
Hierarchy Level | 695
Description | 695
Options | 695
Required Privilege Level | 696
Release Information | 697
Syntax
resource-watch { cpu-statistics; junos-statistics; orange-zone-enable; orange-zone-threshold; red-zone-cpu-threshold; red-zone-enable; red-zone-jkl-threshold; red-zone-snmp-enable; resource-watch-enable;}
694

Hierarchy Level
[edit chassis]
Description
In SRX chassis cluster mode, split brain caused by redundant failover is triggered due to Routing Enginebusy related to CPU overhead causing SRX HA cluster resiliency. To analyze CPU load, Reswatchd is aprocess running on Linux, Routing Engine3, and Routing Engine2 to collect and monitor the resourceusage data. You can generate CPU load statistics report to analyze the system load (resource assignmentand Junos kernel usage). You can enable statistics function through CLI to log CPU usage every secondand generate a statistics report. This feature is supported on chassis standalone mode to monitorRouting Engine CPU usage and Junos kernel usage and is disabled by default.
Resource availability is classified to three zones:
For RE2, the threshold values are:
• Green: CPU idle > 20%
• Orange: CPU idle <= 15%
• Red: CPU idle <= 5% or Junos Kernel load >= 50%
For RE3, the threshold values are:
• Green: CPU idle > 10%
• Orange: CPU idle <= 10%
• Red: CPU idle <= 3% or Junos Kernel load >= 50%
Options
cpu-statistics Display CPU load statistics report. When enable CPU statistics, reswatchd logsCPU idle values /var/log/reswatch_CPU_statistics_[1-5] in .csv format.
• Range: 0-604800 seconds.
695

• Values:
• 0—Disable
junos-statistics Display Junos kernel statistics report. When enable Junos Kernel statistics,reswatchd logs Junos Kernel usage values at /var/log/reswatch_JK_statistics_[1-5] in .csv format.
• Range: 0-604800 seconds.
• Values:
• 0—Disable
orange-zone-enable Enable orange zone.
orange-zone-threshold
Specify orange zone value (CPU idle %)
• Default: 20
• Range: 1-99
red-zone-cpu-threshold
Specify red zone value (CPU idle %).
• Default: 10
• Range: 1-99
red-zone-enable Enable red zone.
red-zone-jkl-threshold
Specify red zone value (Junos load %)
• Default: 50
• Range: 1-99
red-zone-snmp-enable
Enable red zone snmp.
resource-watch-enable
Enable resource watch.
Required Privilege Level
interface—To view this statement in the configuration.
696

interface-control—To add this statement to the configuration.
Release Information
Statement introduced in Junos OS release 20.4R1.
RELATED DOCUMENTATION
show chassis reswatch | 890
reth-count (Chassis Cluster)
IN THIS SECTION
Syntax | 697
Hierarchy Level | 698
Description | 698
Options | 698
Required Privilege Level | 698
Release Information | 698
Syntax
reth-count number;
697

Hierarchy Level
[edit chassis cluster]
Description
Specify the number of redundant Ethernet (reth) interfaces allowed in the chassis cluster. You need tospecify the total number of interfaces in the chassis cluster before redundant Ethernet interfaces arecreated. For example, the set chassis cluster reth-count 2 allow you to create two reth interfaces(example: reth0 and reth1)
Note that the number of reth interfaces configured determines the number of redundancy groups thatcan be configured and each SRX series device has a maximum number of reths that it can support.
Options
number —Number of redundant Ethernet interfaces allowed.
• Range: 1 through 128
• Default: 0
Required Privilege Level
interface—To view this statement in the configuration.
interface-control—To add this statement to the configuration.
Release Information
Statement introduced in Junos OS Release 9.0.
698

RELATED DOCUMENTATION
cluster (Chassis) | 601
retry-count (Chassis Cluster)
IN THIS SECTION
Syntax | 699
Hierarchy Level | 699
Description | 699
Options | 700
Required Privilege Level | 700
Release Information | 700
Syntax
retry-count number;
Hierarchy Level
[edit chassis cluster redundancy-groupgroup-number ip-monitoring ]
Description
Specify the number of consecutive ping attempts that must fail before an IP address monitored by theredundancy group is declared unreachable in IP address monitoring.
699

In the IP address monitoring, you can configure redundancy groups to monitor upstream resources bypinging specific IP addresses that are reachable through redundant Ethernet interfaces on either node ina cluster. In this configuration, the retry interval determines the ping interval for each IP addressmonitored by the redundancy group and the retry count sets the number of allowed consecutive pingfailures for each IP address monitored by the redundancy group.
(See "retry-interval (Chassis Cluster)" on page 701 for a related redundancy group IP addressmonitoring variable.)
Options
number—Number of consecutive ping attempt failures before a monitored IP address is declaredunreachable.
• Default: 5
• Range: 5-15
Required Privilege Level
interface—To view this statement in the configuration.
interface-control—To add this statement to the configuration.
Release Information
Statement introduced in Junos OS Release 10.1.
RELATED DOCUMENTATION
cluster (Chassis) | 601
700

retry-interval (Chassis Cluster)
IN THIS SECTION
Syntax | 701
Hierarchy Level | 701
Description | 701
Options | 702
Required Privilege Level | 702
Release Information | 702
Syntax
retry-interval interval;
Hierarchy Level
[edit chassis cluster redundancy-group group-number ip-monitoring ]
Description
Specify the ping packet send frequency (in seconds) for each IP address monitored by the redundancygroup.
In the IP address monitoring, you can configure redundancy groups to monitor upstream resources bypinging specific IP addresses that are reachable through redundant Ethernet interfaces on either node ina cluster. In this configuration, the retry interval determines the ping interval for each IP addressmonitored by the redundancy group and the retry count sets the number of allowed consecutive pingfailures for each IP address monitored by the redundancy group.
701

(See "retry-count (Chassis Cluster)" on page 699 for a related IP address monitoring configurationvariable.)
Options
interval—Pause time (in seconds) between each ping sent to each IP address monitored by theredundancy group.
• Default: 1
• Range: 1-30
Required Privilege Level
interface—To view this statement in the configuration.
interface-control—To add this statement to the configuration.
Release Information
Statement introduced in Junos OS Release 10.1.
RELATED DOCUMENTATION
ip-monitoring | 642
route-active-on
IN THIS SECTION
Syntax | 703
702

Hierarchy Level | 703
Description | 703
Options | 703
Required Privilege Level | 704
Release Information | 704
Syntax
route-active-on (node0 | node1);
Hierarchy Level
[edit policy-options condition condition-name]
Description
In chassis cluster configurations, the incoming traffic from the core network is sent to the interface thatexists on the current active node . For a route advertised by BGP, a policy is applied on BGPconfiguration before exporting routes. An additional term in the policy match condition determines thecurrent active device (node) before making the routing decision. In this way, the traffic is processed bythe active node.
Options
node0 Route active on node 0
node1 Route active on node 1
703

Required Privilege Level
routing—To view this statement in the configuration.
routing-control—To add this statement to the configuration.
Release Information
Statement introduced in Junos OS Release 9.0.
RELATED DOCUMENTATION
cluster (Chassis) | 601
Example: Configuring Conditional Route Advertising in a Chassis Cluster | 158
scb-control-ports
IN THIS SECTION
Syntax | 704
Hierarchy Level | 705
Description | 705
Options | 705
Required Privilege Level | 705
Release Information | 705
Syntax
scb-control-ports Control board number;
704

Hierarchy Level
[edit chassis cluster]
Description
You can enable the primary control link connected through control board member. SCB control ports aresupported on single and dual control links.
Options
cb Specify the control board number.
• Range: 0 through 2
Required Privilege Level
interface—To view this statement in the configuration.
interface-control—To add this statement to the configuration.
Release Information
Statement introduced in Junos OS Release 21.4R1.
RELATED DOCUMENTATION
Chassis Cluster Dual Control Links | 164
705

security-mode
IN THIS SECTION
Syntax | 706
Hierarchy Level | 706
Description | 706
Options | 707
Required Privilege Level | 707
Release Information | 707
Syntax
security-mode security-mode;
Hierarchy Level
[edit security macsec connectivity-association]
Description
Configure the MACsec security mode for the connectivity association.
We recommend enabling MACsec on switch-to-switch Ethernet links using static connectivityassociation key (CAK) security mode. Static CAK security mode ensures security by frequentlyrefreshing to a new random secure association key (SAK) and by only sharing the SAK between the twodevices on the MACsec-secured point-to-point link. Additionally, some optional MACsec features—replay protection, SCI tagging, and the ability to exclude traffic from MACsec—are only available whenyou enable MACsec using static CAK security mode.
706

Options
security-mode
Specifies the MACsec security mode. Options include:
• dynamic—Dynamic mode.
Dynamic security mode is used to enable MACsec on switch-to-host Ethernet links. Indynamic mode, a master key is retrieved from a RADIUS server by a switch and a host aspart of the AAA handshake in separate transactions. The MKA protocol is enabled whenthe master key is exchanged between the switch and the host.
• static-cak —Static connectivity association key (CAK) mode.
Static CAK security mode is used to enable MACsec on switch-to-switch Ethernet links.In static-cak mode, the switch at one end of the point-to-point link acts as the key serverand regularly transmits a randomized key using a process that does not transmit anytraffic outside of the MACsec-secured point-to-point link.
Required Privilege Level
admin—To view this statement in the configuration.
admin-control—To add this statement to the configuration.
Release Information
Statement introduced in Junos OS Release 15.1X49-D60.
RELATED DOCUMENTATION
Understanding Media Access Control Security (MACsec) | 481
Configuring Media Access Control Security (MACsec) | 484
macsec | 651
707

traceoptions (Chassis Cluster)
IN THIS SECTION
Syntax | 708
Hierarchy Level | 708
Description | 709
Options | 709
Required Privilege Level | 710
Release Information | 710
Syntax
traceoptions { file { filename; files number; match regular-expression; (world-readable | no-world-readable); size maximum-file-size; } flag flag; level { (alert | all | critical | debug | emergency | error | info | notice | warning); } no-remote-trace;}
Hierarchy Level
[edit chassis cluster]
708

Description
Define chassis cluster redundancy process tracing operations.
A minimum traceoptions configuration must include both a target file and a flag. The target filedetermines where the trace output is recorded. The flag defines what type of data is collected.
Options
• file filename —Name of the file to receive the output of the tracing operation. Enclose the namewithin quotation marks. All files are placed in the directory /var/log.
• files number —(Optional) Maximum number of trace files. When a trace file named trace-file reachesits maximum size, it is renamed to trace-file .0, then trace-file.1 , and so on, until the maximumnumber of trace files is reached. The oldest archived file is overwritten.
• If you specify a maximum number of files, you also must specify a maximum file size with the sizeoption and a filename.
• Range: 2 through 1000 files
• Default: 10 files
• match regular-expression —(Optional) Refine the output to include lines that contain the regularexpression.
• size maximum-file-size —(Optional) Maximum size of each trace file, in kilobytes (KB), megabytes (MB),or gigabytes (GB). When a trace file named trace-file reaches this size, it is renamed trace-file .0.When the trace-file again reaches its maximum size, trace-file .0 is renamed trace-file .1 and trace-file is renamed trace-file .0. This renaming scheme continues until the maximum number of tracefiles is reached. Then the oldest trace file is overwritten.
• If you specify a maximum file size, you also must specify a maximum number of trace files with thefiles option and filename.
• Syntax: x k to specify KB, x m to specify MB, or x g to specify GB
• Range: 0 KB through 1 GB
• Default: 128 KB
• world-readable | no-world-readable—(Optional) By default, log files can be accessed only by the user whoconfigures the tracing operation. The world-readable option enables any user to read the file. Toexplicitly set the default behavior, use the no-world-readable option.
709

• flag—Trace operation or operations to perform on chassis cluster redundancy processes. To specifymore than one trace operation, include multiple flag statements.
• all—Trace all the events
• configuration—Trace configuration events
• routing-socket—Trace logging of rtsock activity
• snmp—Trace SNMP events
Required Privilege Level
trace—To view this statement in the configuration.
trace-control—To add this statement to the configuration.
Release Information
Statement modified in Junos OS Release 9.5.
RELATED DOCUMENTATION
cluster (Chassis) | 601
transmit-interval (MACsec)
IN THIS SECTION
Syntax | 711
Hierarchy Level | 711
Description | 711
Default | 711
710

Options | 712
Required Privilege Level | 712
Release Information | 712
Syntax
transmit-interval interval;
Hierarchy Level
[edit security macsec connectivity-association mka]
Description
Specifies the transmit interval for MACsec Key Agreement (MKA) protocol data units (PDUs).
The MKA transmit interval setting sets the frequency for how often the MKA PDU is sent to the directlyconnected device to maintain MACsec on a point-to-point Ethernet link. A lower interval increasesbandwidth overhead on the link; a higher interval optimizes the MKA protocol data unit exchangeprocess.
The transmit interval settings must be identical on both ends of the link when MACsec using staticconnectivity association key (CAK) security mode is enabled.
We recommend increasing the interval to 6000 ms in high-traffic load environments.
Default
The default transmit interval is 10000 milliseconds (10 seconds).
711

NOTE: Configuring aggressive transmit interval will lead to broken chassis cluster.
Options
interval Specifies the transmit interval, in milliseconds.
Required Privilege Level
admin—To view this statement in the configuration.
admin-control—To add this statement to the configuration.
Release Information
Statement introduced in Junos OS Release 15.1X49-D60.
RELATED DOCUMENTATION
Understanding Media Access Control Security (MACsec) | 481
Configuring Media Access Control Security (MACsec) | 484
macsec | 651
712

use-active-child-mac-on-reth
IN THIS SECTION
Syntax | 713
Hierarchy Level | 713
Description | 713
Required Privilege Level | 714
Release Information | 714
Syntax
use-active-child-mac-on-reth;
Hierarchy Level
[edit chassis cluster]
Description
Copy child's physical MAC address on RETH parent's current MAC address.
NOTE: The commands use-active-child-mac-on-reth and use-actual-mac-on-physical-interfaces need tobe configured together for the feature to work.
713
Required Privilege Level
interface
Release Information
Statement introduced in Junos OS Release 19.4R1.
use-actual-mac-on-physical-interfaces
IN THIS SECTION
Syntax | 714
Hierarchy Level | 714
Description | 715
Required Privilege Level | 715
Release Information | 715
Syntax
use-actual-mac-on-physical-interfaces;
Hierarchy Level
[edit chassis cluster]
714

Description
Configure this command so that SR-IOV uses hypervisor’s provided MAC address for physical interfaceson KVM based systems.
NOTE: The commands use-active-child-mac-on-reth and use-actual-mac-on-physical-interfaces need tobe configured together for the feature to work.
Required Privilege Level
interface
Release Information
Statement introduced in Junos OS Release 19.4R1.
virtual-address
IN THIS SECTION
Syntax | 716
Hierarchy Level | 716
Description | 716
Options | 716
Required Privilege Level | 716
Release Information | 717
715

Syntax
virtual-address [ addresses ];
Hierarchy Level
[edit interfaces interface-name unit logical-unit-number family inet address address vrrp-group group-id],[edit logical-systems logical-system-name interfaces interface-name unit logical-unit-number family inet address address vrrp-group group-id]
Description
Configure the addresses of the devices in a Virtual Router Redundancy Protocol (VRRP) IPv4 or IPv6group. You can configure up to eight addresses.
Options
addresses Addresses of one or more devices. Do not include a prefix length. If the address is the sameas the interface’s physical address, the interface becomes the primary device for the group.
Required Privilege Level
interface—To view this statement in the configuration.
interface-control—To add this statement to the configuration.
716

Release Information
Statement introduced before Junos OS Release 7.4.
RELATED DOCUMENTATION
Configuring Basic VRRP Support
Understanding VRRP on SRX Series Devices | 321
Example: Configuring VRRP/VRRPv3 on Chassis Cluster Redundant Ethernet Interfaces | 327
vrrp-group
IN THIS SECTION
Syntax | 717
Hierarchy Level | 718
Description | 718
Options | 719
Required Privilege Level | 720
Release Information | 720
Syntax
vrrp-group group-id { (accept-data | no-accept-data); advertise-interval seconds; advertisements-threshold number; authentication-key key; authentication-type (md5 | simple); fast-interval milliseconds; no-accept-data;
717

no-preempt; preempt { hold-time seconds; } preferred; priority number; track { interface name { bandwidth-threshold bits-per-second priority-cost priority { priority-cost priority; } } priority-hold-time seconds; route route_address { routing-instance; } } virtual-addressvirtual-link-local-address; vrrp-inherit-from { active-group active-group; active-interface active-interface; }}
Hierarchy Level
[edit interfaces name unit name family inet address],[edit interfaces name unit name family inet inet6 address]
Description
The Routing Engine performs one-by-one state change for subsequent VRRP groups. Every time there isa state change, and the new state for a particular VRRP group is primary, the Routing Engine generatesappropriate VRRP announcement messages. When the first VRRP group detected by the Routing Enginechanges state, and the new state is primary, the Routing Engine generates appropriate VRRPannouncement messages. The Packet Forwarding Engine is informed about the state change, so that
718

hardware filters for that group are reprogrammed without delay. The new primary then sends gratuitousARP message to the VRRP groups.
Options
group-id VRRP group identifier. If you enable MAC source address filtering on theinterface, you must include the virtual MAC address in the list of sourceMAC addresses that you specify in the source-address-filter statement.MAC addresses ranging from 00:00:5e:00:53:00 through 00:00:5e:00:53:ffare reserved for VRRP, as defined in RFC 2338. The VRRP group numbermust be the decimal equivalent of the last hexadecimal byte of the virtualMAC address.
• Range: 0 through 255
accept-data Accept packets destined for virtual IP address
advertise-interval Advertisement interval (seconds)
• Range: 1 through 255
inet6-advertise-interval Inet6 advertisement interval (milliseconds)
• Range: 100-40000
advertisements-threshold Number of vrrp advertisements missed before declaring primary down
• Range: 1 through15
authentication-key Authentication key
authentication-type Authentication type
• Values:
• md5—HMAC-MD5-96
• simple—Simple password
fast-interval Fast advertisement interval (milliseconds)
• Range: 10 through 40950
no-accept-data Don't accept packets destined for virtual IP address
719

no-preempt Don't allow preemption
preempt Allow preemption
preferred Preferred group on subnet
priority Device election priority
• Range: 0 through 255
track Interfaces to track for VRRP group
virtual-address One or more virtual IPv4 addresses
virtual-inet6-address One or more virtual inet6 addresses
vrrp-inherit-from VRRP group to follow for the vrrp-group or vrrp-inet6-group
The remaining statements are explained separately. See CLI Explorer.
Required Privilege Level
interface
Release Information
Statement introduced before Junos OS Release 18.1R1.
RELATED DOCUMENTATION
Understanding VRRP on SRX Series Devices | 321
Example: Configuring VRRP/VRRPv3 on Chassis Cluster Redundant Ethernet Interfaces
720
weight
IN THIS SECTION
Syntax | 721
Hierarchy Level | 721
Description | 721
Options | 722
Required Privilege Level | 722
Release Information | 722
Syntax
weight number;
Hierarchy Level
[edit chassis cluster redundancy-group group-number interface-monitor interface ][edit chassis cluster redundancy-group group-number ip-monitoring IP–address]
Description
Specify the relative importance of the object to the operation of the redundancy group. This statementis primarily used with interface monitoring and IP address monitoring objects. The failure of an object—such as an interface—with a greater weight brings the group closer to failover. Every monitored object isassigned a weight.
721

• interface-monitor objects—If the object fails, its weight is deducted from the threshold of itsredundancy group;
• ip-monitoring objects—If a monitored IP address becomes unreachable for any reason, the weightassigned to that monitored IP address is deducted from the redundancy group’s global-threshold forIP address monitoring.
Every redundancy group has a default threshold of 255. If the threshold reaches 0, a failover is triggered.Failover is triggered even if the redundancy group is in manual failover mode and preemption is notenabled.
Options
number —Weight assigned to the interface or monitored IP address. A higher weight value indicates agreater importance.
• Range: 0 through 255
Required Privilege Level
interface—To view this statement in the configuration.
interface-control—To add this statement to the configuration.
Release Information
Statement modified in Junos OS Release 10.1.
RELATED DOCUMENTATION
cluster (Chassis) | 601
722

8CHAPTER
Operational Commands
clear chassis cluster control-plane statistics | 726
clear chassis cluster data-plane statistics | 727
clear chassis cluster failover-count | 729
clear chassis cluster ip-monitoring failure-count | 731
clear chassis cluster ip-monitoring failure-count ip-address | 733
clear chassis cluster statistics | 735
request chassis cb | 736
request chassis cluster configuration-synchronize | 739
request chassis cluster failover node | 740
request chassis cluster failover redundancy-group | 742
request chassis cluster failover reset | 744
request chassis fpc | 746
request chassis fpc-control-port | 748
request chassis cluster in-service-upgrade abort (ISSU) | 751
request chassis primary-ha-control-port-transition | 753
request security internal-security-association refresh | 755
request system scripts add | 757
request system reboot (SRX Series) | 762
request system software in-service-upgrade (Maintenance) | 764
request system software rollback (SRX Series) | 770

set chassis cluster disable reboot | 771
set chassis cluster cluster-id node node-number reboot | 773
show chassis cluster control-plane statistics | 776
show chassis cluster data-plane interfaces | 779
show chassis cluster data-plane statistics | 781
show chassis cluster ethernet-switching interfaces | 785
show chassis cluster ethernet-switching status | 787
show chassis cluster information | 790
show chassis cluster information configuration-synchronization | 797
show chassis cluster information issu | 800
show chassis cluster interfaces | 802
show chassis cluster ip-monitoring status redundancy-group | 812
show chassis cluster statistics | 816
show chassis cluster status | 823
show chassis environment (Security) | 828
show chassis environment cb | 836
show chassis ethernet-switch | 840
show chassis fabric plane | 847
show chassis fabric plane-location | 856
show chassis fabric summary | 859
show chassis hardware (View) | 862
show chassis routing-engine (View) | 883
show chassis reswatch | 890
show chassis temperature-thresholds | 892
show configuration chassis cluster traceoptions | 895
show interfaces (SRX Series) | 897
set date ntp | 947
show system ntp threshold | 949
show security macsec connections | 951
show security macsec statistics (SRX Series Devices) | 954
show security mka statistics | 960
show security mka sessions (SRX Series Device | 963
show security internal-security-association | 966
show system license (View) | 968

show vrrp | 973

clear chassis cluster control-plane statistics
IN THIS SECTION
Syntax | 726
Description | 726
Required Privilege Level | 726
Output Fields | 726
Sample Output | 727
Release Information | 727
Syntax
clear chassis cluster control-plane statistics
Description
Clear the control plane statistics of a chassis cluster.
Required Privilege Level
clear
Output Fields
When you enter this command, you are provided feedback on the status of your request.
726

Sample Output
clear chassis cluster control-plane statistics
user@host> clear chassis cluster control-plane statisticsCleared control-plane statistics
Release Information
Command introduced in Junos OS Release 9.3.
RELATED DOCUMENTATION
show chassis cluster control-plane statistics | 776
clear chassis cluster data-plane statistics
IN THIS SECTION
Syntax | 728
Description | 728
Required Privilege Level | 728
Output Fields | 728
Sample Output | 728
Release Information | 728
727

Syntax
clear chassis cluster data-plane statistics
Description
Clear the data plane statistics of a chassis cluster.
Required Privilege Level
clear
Output Fields
When you enter this command, you are provided feedback on the status of your request.
Sample Output
clear chassis cluster data-plane statistics
user@host> clear chassis cluster data-plane statisticsCleared data-plane statistics
Release Information
Command introduced in Junos OS Release 9.3.
728

RELATED DOCUMENTATION
show chassis cluster data-plane statistics | 781
clear chassis cluster failover-count
IN THIS SECTION
Syntax | 729
Description | 729
Required Privilege Level | 729
Output Fields | 730
Sample Output | 730
Release Information | 731
Syntax
clear chassis cluster failover-count
Description
Clear the failover count of all redundancy groups.
Required Privilege Level
clear
729

Output Fields
When you enter this command, you are provided feedback on the status of your request.
Sample Output
The following example displays the redundancy groups before and after the failover-counts are cleared.
show chassis cluster status
user@host> show chassis cluster status
Cluster ID: 3Node name Priority Status Preempt Manual failover
Redundancy group: 0 , Failover count: 1 node0 200 secondary no no node1 100 primary no no
Redundancy group: 1 , Failover count: 2 node0 100 primary no no node1 10 secondary no no
clear chassis cluster failover-count
user@host> clear chassis cluster failover-countCleared failover-count for all redundancy-groups
show chassis cluster status
user@host> show chassis cluster status
Cluster ID: 3Node name Priority Status Preempt Manual failover
Redundancy group: 0 , Failover count: 0
730

node0 200 secondary no no node1 100 primary no no
Redundancy group: 1 , Failover count: 0 node0 100 primary no no node1 10 secondary no no
Release Information
Command introduced in Junos OS Release 9.3.
RELATED DOCUMENTATION
request chassis cluster failover node | 740
request chassis cluster failover reset | 744
show chassis cluster status | 823
clear chassis cluster ip-monitoring failure-count
IN THIS SECTION
Syntax | 732
Description | 732
Required Privilege Level | 732
Output Fields | 732
Sample Output | 732
Release Information | 733
731

Syntax
clear chassis cluster ip-monitoring failure-count
Description
Clear the failure count for all IP addresses.
Required Privilege Level
clear
Output Fields
When you enter this command, you are provided feedback on the status of your request.
Sample Output
user@host> clear chassis cluster ip-monitoring failure-count
command-name
node0:--------------------------------------------------------------------------Cleared failure count for all IPs
node1:--------------------------------------------------------------------------Cleared failure count for all IPs
732

Release Information
Command introduced in Junos OS Release 10.1.
RELATED DOCUMENTATION
clear chassis cluster ip-monitoring failure-count ip-address | 733
clear chassis cluster ip-monitoring failure-count ip-address
IN THIS SECTION
Syntax | 733
Description | 733
Required Privilege Level | 734
Output Fields | 734
Sample Output | 734
Release Information | 734
Syntax
clear chassis cluster ip-monitoring failure-count ip-address IP-address
Description
Clear the failure count for a specified IP address.
733

NOTE: Entering an IP address at the end of this command is optional. If you do not specify an IPaddress, the failure count for all monitored IP addresses is cleared.
Required Privilege Level
clear
Output Fields
When you enter this command, you are provided feedback on the status of your request.
Sample Output
user@host> clear chassis cluster ip-monitoring failure-count ip-address 10.1.1.1
clear chassis cluster ip-monitoring failure-count ip-address 10.1.1.1
node0:--------------------------------------------------------------------------Cleared failure count for IP: 10.1.1.1
node1:--------------------------------------------------------------------------Cleared failure count for IP: 10.1.1.1
Release Information
Command introduced in Junos OS Release 10.1.
734

RELATED DOCUMENTATION
clear chassis cluster failover-count | 729
clear chassis cluster ip-monitoring failure-count | 731
clear chassis cluster statistics
IN THIS SECTION
Syntax | 735
Description | 735
Required Privilege Level | 735
Output Fields | 736
Sample Output | 736
Release Information | 736
Syntax
clear chassis cluster statistics
Description
Clear the control plane and data plane statistics of a chassis cluster.
Required Privilege Level
clear
735

Output Fields
When you enter this command, you are provided feedback on the status of your request.
Sample Output
clear chassis cluster statistics
user@host> clear chassis cluster statisticsCleared control-plane statisticsCleared data-plane statistics
Release Information
Command introduced in Junos OS Release 9.3.
RELATED DOCUMENTATION
show chassis cluster statistics | 816
request chassis cb
IN THIS SECTION
Syntax | 737
Description | 737
Options | 737
Required Privilege Level | 737
Output Fields | 737
736

Sample Output | 738
Release Information | 738
Syntax
request chassis cb (offline | online) slot slot-number
Description
Control the operation (take the CB offline or bring online) of the Control Board (CB).
Options
offline Take the Control Board offline.
online Bring the Control Board online.
slot slot-number Control Board slot number.
Required Privilege Level
maintenance
Output Fields
When you enter this command, you are provided feedback on the status of your request.
737

Sample Output
request chassis cb (SRX Series)
user@host> request chassis cb offline slot 2 node localnode0:--------------------------------------------------------------------------Offline initiated, use "show chassis environment cb" to verify
request chassis cb (PTX10008 Router)
user@host> request chassis cb offline slot 1Offline initiated, use "show chassis environment cb" to verify
Release Information
Command introduced in Junos OS Release 9.2.
Starting with Junos OS Release 12.1X47-D15, the SRX5K-SCBE (SCB2) is introduced and starting withJunos OS Release 15.1X49-D10, the SRX5K-SCB3 (SCB3) with enhanced midplane is introduced.
RELATED DOCUMENTATION
show chassis environment cb | 836
738

request chassis cluster configuration-synchronize
IN THIS SECTION
Syntax | 739
Description | 739
Required Privilege Level | 739
Output Fields | 739
Sample Output | 740
Release Information | 740
Syntax
request chassis cluster configuration-synchronize
Description
Synchronize the configuration from the primary node to the secondary node when the secondary nodejoins the primary node in a cluster.
Required Privilege Level
maintenance
Output Fields
When you enter this command, you are provided feedback on the status of your request.
739

Sample Output
request chassis cluster configuration-synchronize
user@host> request chassis cluster configuration-synchronize Performing configuration synchronization from remote node.
Release Information
Command introduced in Junos OS Release 12.1X47-D10.
RELATED DOCUMENTATION
Understanding Automatic Chassis Cluster Synchronization Between Primary and Secondary Nodes | 143
Verifying Chassis Cluster Configuration Synchronization Status | 144
NTP Time Synchronization on SRX Series Devices | 353
request chassis cluster failover node
IN THIS SECTION
Syntax | 741
Description | 741
Options | 741
Required Privilege Level | 741
Output Fields | 741
Sample Output | 742
Release Information | 742
740

Syntax
request chassis cluster failover node node-number redundancy-group group-number
Description
For chassis cluster configurations, initiate manual failover in a redundancy group from one node to theother, which becomes the primary node, and automatically reset the priority of the group to 255. Thefailover stays in effect until the new primary node becomes unavailable, the threshold of the redundancygroup reaches 0, or you use the request chassis cluster failover reset command.
After a manual failover, you must use the request chassis cluster failover reset command before initiatinganother failover.
Options
• node node-number—Number of the chassis cluster node to which the redundancy group fails over.
• Range: 0 through 1
• redundancy-group group-number—Number of the redundancy group on which to initiate manual failover.Redundancy group 0 is a special group consisting of the two Routing Engines in the chassis cluster.
Range: 0 through 255
Required Privilege Level
maintenance
Output Fields
When you enter this command, you are provided feedback on the status of your request.
741

Sample Output
request chassis cluster failover node
user@host> request chassis cluster failover node 0 redundancy-group 1 Initiated manual failover for redundancy group 1
Release Information
Command introduced in Junos OS Release 9.0.
RELATED DOCUMENTATION
clear chassis cluster failover-count | 729
request chassis cluster failover reset | 744
show chassis cluster status | 823
request chassis cluster failover redundancy-group
IN THIS SECTION
Syntax | 743
Description | 743
Options | 743
Required Privilege Level | 743
Output Fields | 743
Sample Output | 744
Release Information | 744
742

Syntax
request chassis cluster failover node node-number redundancy-group redundancy-group-number
Description
For chassis cluster configurations, initiate manual failover in a redundancy group from one node to theother, which becomes the primary node, and automatically reset the priority of the group to 255. Thefailover stays in effect until the new primary node becomes unavailable, the threshold of the redundancygroup reaches 0, or you use the request chassis cluster failover reset command.
After a manual failover, you must use the request chassis cluster failover reset command before initiatinganother failover.
Options
• node node-number—Number of the chassis cluster node to which the redundancy group fails over.
• Range: 0 or 1
• redundancy-group group-number—Number of the redundancy group on which to initiate manual failover.Redundancy group 0 is a special group consisting of the two Routing Engines in the chassis cluster.
Range: 0 through 255
Required Privilege Level
maintenance
Output Fields
When you enter this command, you are provided feedback on the status of your request.
743
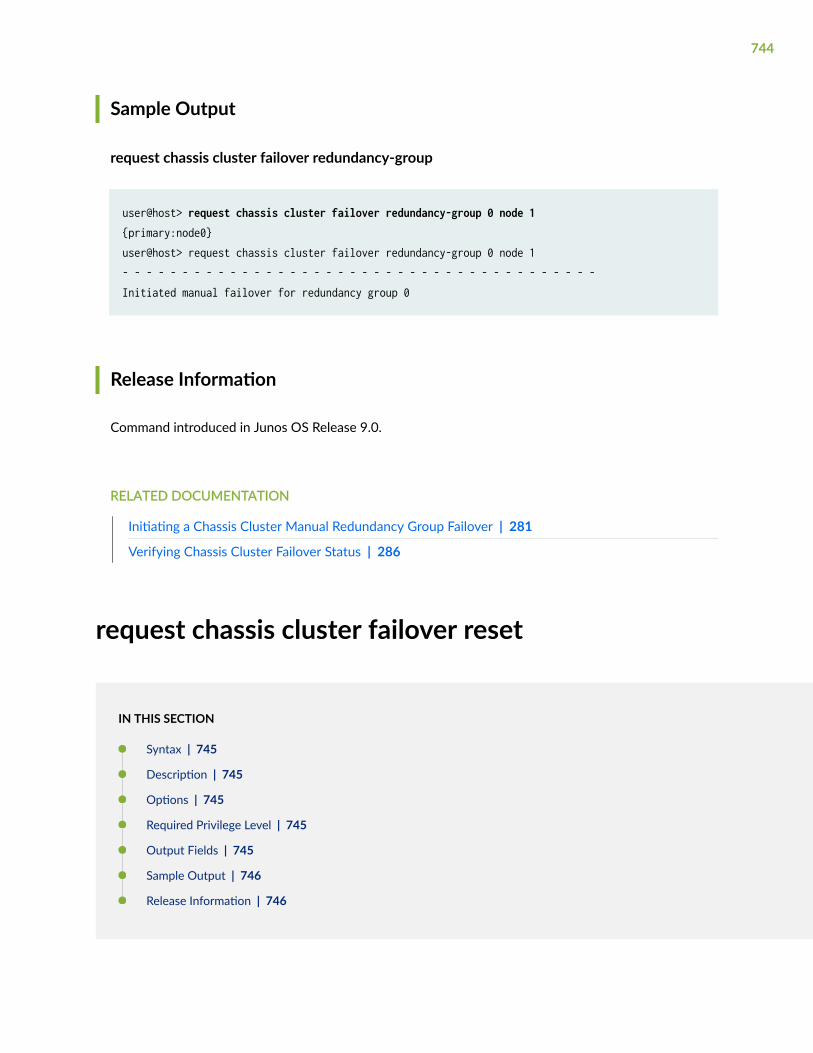
Sample Output
request chassis cluster failover redundancy-group
user@host> request chassis cluster failover redundancy-group 0 node 1 {primary:node0}user@host> request chassis cluster failover redundancy-group 0 node 1- - - - - - - - - - - - - - - - - - - - - - - - - - - - - - - - - - - - - - - -Initiated manual failover for redundancy group 0
Release Information
Command introduced in Junos OS Release 9.0.
RELATED DOCUMENTATION
Initiating a Chassis Cluster Manual Redundancy Group Failover | 281
Verifying Chassis Cluster Failover Status | 286
request chassis cluster failover reset
IN THIS SECTION
Syntax | 745
Description | 745
Options | 745
Required Privilege Level | 745
Output Fields | 745
Sample Output | 746
Release Information | 746
744
Syntax
request chassis cluster failover resetredundancy-group group-number
Description
In chassis cluster configurations, undo the previous manual failover and return the redundancy group toits original settings.
Options
redundancy-group group-number—Number of the redundancy group on which to reset manual failover.Redundancy group 0 is a special group consisting of the two Routing Engines in the chassis cluster.
Range: 0 through 255
Required Privilege Level
maintenance
Output Fields
When you enter this command, you are provided feedback on the status of your request.
745
Sample Output
request chassis cluster failover reset
user@host> request chassis cluster failover reset redundancy-group 0
Release Information
Command introduced in Junos OS Release 9.0.
RELATED DOCUMENTATION
clear chassis cluster failover-count | 729
request chassis cluster failover node | 740
show chassis cluster status | 823
request chassis fpc
IN THIS SECTION
Syntax | 747
Description | 747
Options | 747
Required Privilege Level | 747
Output Fields | 747
Sample Output | 748
Release Information | 748
746
Syntax
request chassis fpc (offline | online | restart) slot slot-number
Description
Control the operation of the Flexible PIC Concentrator (FPC).
NOTE: The SRX5K-SPC-2-10-40 (SPC1), SRX5K-SPC-4-15-320 (SPC2), and SRX5K-SPC3 doesnot support the request chassis fpc command.
Options
offline Take the FPC offline.
online Bring the FPC online.
restart Restart the FPC.
slot slot-number Specify the FPC slot number.
Required Privilege Level
maintenance
Output Fields
When you enter this command, you are provided feedback on the status of your request.
747

Sample Output
request chassis fpc (SRX Series)
user@host> request chassis fpc online slot 0FPC 0 already online
request chassis fpc (PTX10008 Router)
user@host> request chassis fpc online slot 1FPC 0 already online
Release Information
Command modified in Junos OS Release 9.2.
Command introduced in Junos OS Release 17.2.
RELATED DOCUMENTATION
show chassis fpc (View)
request chassis fpc-control-port
IN THIS SECTION
Syntax | 749
Description | 749
Options | 749
Required Privilege Level | 749
748

Output Fields | 750
Sample Output | 750
Release Information | 750
Syntax
request chassis fpc-control-port (disable | enable) fpc FPC slot number port Port number
Description
You can disable FPC HA control port 0 on primary node and enable FPC HA control port 0 on secondarynode.
Options
disable Disable HA control port on the local node.
enable Enable HA control port on the local node.
fpc Specify the fpc slot number.
Range: 0 through 23
port Specify the port number.
Range: 0 through 1
Required Privilege Level
maintenance
749
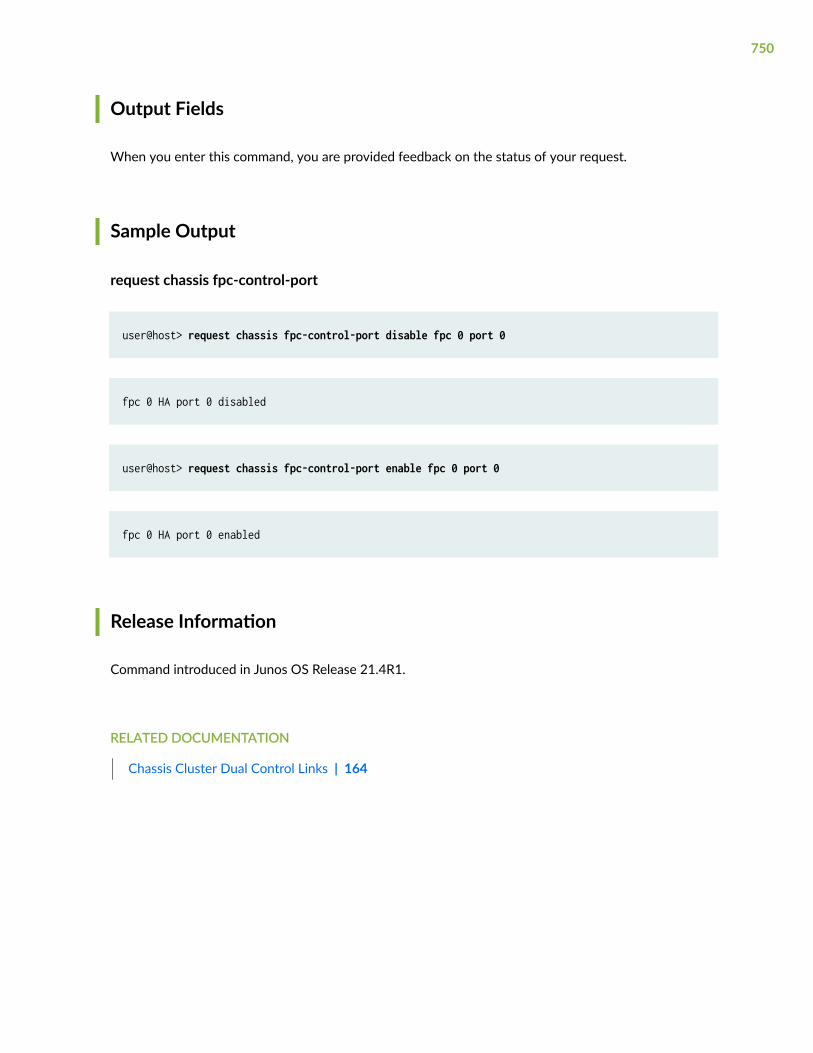
Output Fields
When you enter this command, you are provided feedback on the status of your request.
Sample Output
request chassis fpc-control-port
user@host> request chassis fpc-control-port disable fpc 0 port 0
fpc 0 HA port 0 disabled
user@host> request chassis fpc-control-port enable fpc 0 port 0
fpc 0 HA port 0 enabled
Release Information
Command introduced in Junos OS Release 21.4R1.
RELATED DOCUMENTATION
Chassis Cluster Dual Control Links | 164
750

request chassis cluster in-service-upgrade abort(ISSU)
IN THIS SECTION
Syntax | 751
Description | 751
Options | 751
Required Privilege Level | 752
Output Fields | 752
Sample Output | 752
Release Information | 752
Syntax
request chassis cluster in-service-upgrade abort
Description
Terminate an upgrade in a chassis cluster during an in-service software upgrade (ISSU). Use thiscommand to end the ISSU on any nodes in a chassis cluster followed by reboot to terminate the ISSU onthat device.
Options
This command has no options.
751

Required Privilege Level
view
Output Fields
When you enter this command, you are provided feedback on the status of your request.
Sample Output
request chassis cluster in-service-upgrade terminate
user@host> request chassis cluster in-service-upgrade abort Exiting in-service-upgrade windowChassis ISSU Aborted
Release Information
Command introduced in Junos OS Release 11.2.
RELATED DOCUMENTATION
Upgrading a Chassis Cluster Using In-Service Software Upgrade | 509
752
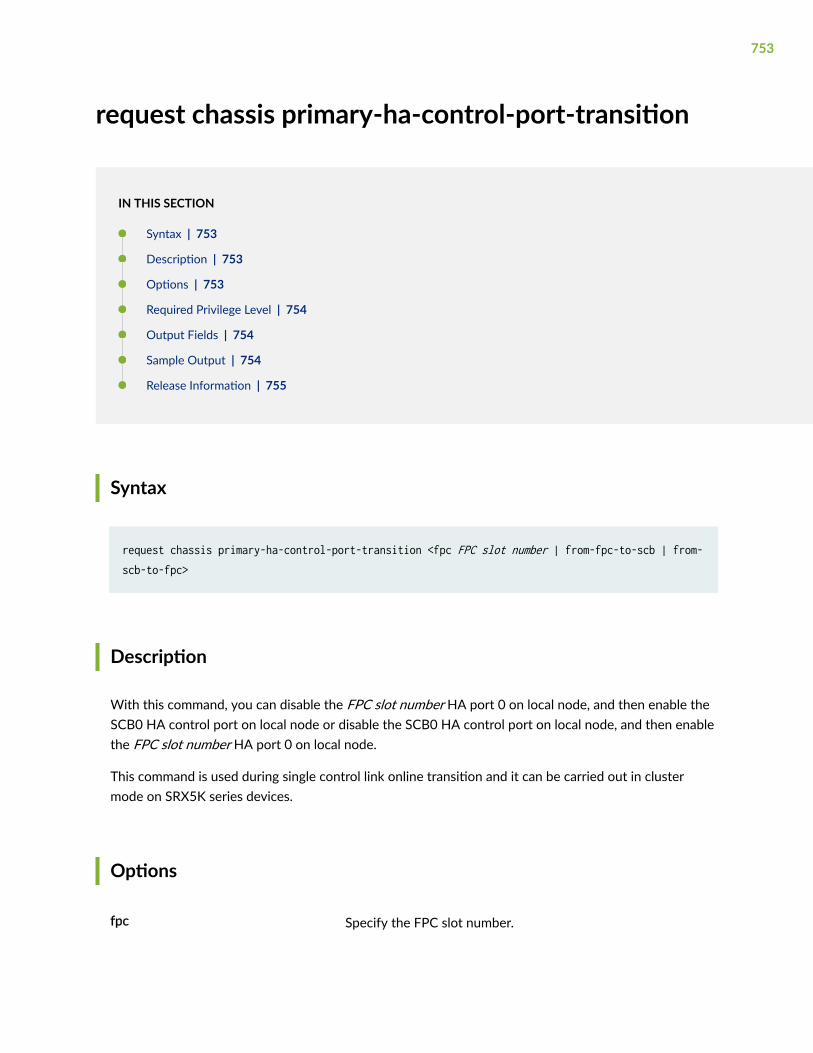
request chassis primary-ha-control-port-transition
IN THIS SECTION
Syntax | 753
Description | 753
Options | 753
Required Privilege Level | 754
Output Fields | 754
Sample Output | 754
Release Information | 755
Syntax
request chassis primary-ha-control-port-transition <fpc FPC slot number | from-fpc-to-scb | from-scb-to-fpc>
Description
With this command, you can disable the FPC slot number HA port 0 on local node, and then enable theSCB0 HA control port on local node or disable the SCB0 HA control port on local node, and then enablethe FPC slot number HA port 0 on local node.
This command is used during single control link online transition and it can be carried out in clustermode on SRX5K series devices.
Options
fpc Specify the FPC slot number.
753

Range: 0 through 23
from-fpc-to-scb Transition from FPC to SCB.
from-scb-to-fpc Transition from SCB to FPC.
Required Privilege Level
maintenance
Output Fields
When you enter this command, you are provided feedback on the status of your request.
Sample Output
request chassis primary-ha-control-port-transition
user@host> request chassis primary-ha-control-port-transition from-fpc-to-scb fpc 0
fpc 0 HA control port 0 disabled & scb 0 HA control port enabled
user@host> request chassis primary-ha-control-port-transition from-scb-to-fpc fpc 0
scb 0 HA control port disabled & fpc 0 HA control port 0 enabled
754

Release Information
Command introduced in Junos OS Release 21.4R1.
RELATED DOCUMENTATION
Chassis Cluster Dual Control Links | 164
request security internal-security-associationrefresh
IN THIS SECTION
Syntax | 755
Description | 755
Required Privilege Level | 756
Output Fields | 756
Sample Output | 756
Release Information | 757
Syntax
request security internal-security-association refresh node <node-id | all | local | primary>
Description
Activate internal IPsec so an attacker cannot gain unauthorized information.
755

Required Privilege Level
maintenance
Output Fields
When you enter this command, you are provided feedback on the status of your request. Table 40 onpage 756 shows the list of output fields.
Table 40: request security internal-security-association refresh Output Fields
Field Name Field Description
RE Specify key for the routing engine.
direction Direction of the manual security association. The direction must be bidirectional.
Sample Output
request security internal-security-association refresh
with security ipsec internal security-association enabled
user@host> request security internal-security-association refreshnode0:--------------------------------------------------------------------------RE: set up internal sa
node1:--------------------------------------------------------------------------RE: set up internal sa
756

with security ipsec internal security-association disabled
user@host> request security internal-security-association refreshnode0:--------------------------------------------------------------------------RE: no keydirection 0delete __juniper_internal_ipsec_sa__, direction 0direction 1delete __juniper_internal_ipsec_sa__, direction 1
node1:--------------------------------------------------------------------------RE: no keydirection 0delete __juniper_internal_ipsec_sa__, direction 0direction 1delete __juniper_internal_ipsec_sa__, direction 1
Release Information
Command introduced in Junos OS Release 12.1X45-D10.
RELATED DOCUMENTATION
show security internal-security-association | 966
internal (Security IPsec)
request system scripts add
IN THIS SECTION
Syntax | 758
757
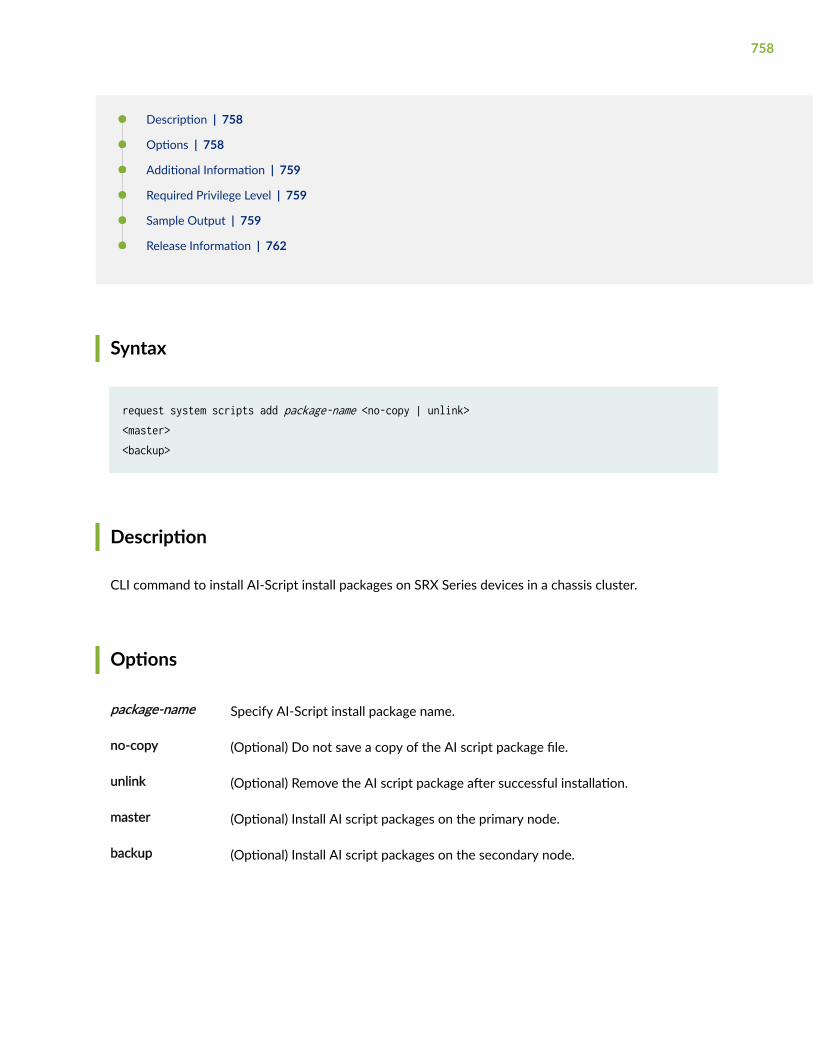
Description | 758
Options | 758
Additional Information | 759
Required Privilege Level | 759
Sample Output | 759
Release Information | 762
Syntax
request system scripts add package-name <no-copy | unlink><master><backup>
Description
CLI command to install AI-Script install packages on SRX Series devices in a chassis cluster.
Options
package-name Specify AI-Script install package name.
no-copy (Optional) Do not save a copy of the AI script package file.
unlink (Optional) Remove the AI script package after successful installation.
master (Optional) Install AI script packages on the primary node.
backup (Optional) Install AI script packages on the secondary node.
758

Additional Information
This command eliminates the AI script installation on both primary node and secondary node separately.
Required Privilege Level
maintenance
Sample Output
request system scripts add package-name
user@host> request system scripts add jais-5.0R1.0-signed.tgz master
[: -a: unexpected operatorgrep: /etc/db/pkg/jais/+COMMENT: No such file or directoryInstalling package '/var/tmp/jais-5.0R4.0-signed.tgz' ...Verified jais-5.0R4.0.tgz signed by PackageProductionRSA_2016Adding jais...Available space: 798414 require: 1814Installing AI-Scripts version: 5.0R4Saving package file in /var/db/scripts/commit/jais-5.0R4.0-signed.tgz ...NOTICE: uncommitted changes have been saved in /var/db/config/juniper.conf.pre-installln: ///etc/rc.d/ais: Read-only file systemModel: srx5600Model: srx5600Linking in Junos ES manifest file.Creating srx5800/srx5600 trend data file.Creating SRX intelligence attachments file.Creating SRX events attachments file.Creating AI-Scripts FIFOStarting AI-Scripts FIFO handler77834: old priority 0, new priority 2077842: old priority 0, new priority 20RSI parameters are now being setBIOS validation parameter is now being set
759

BIOS interval parameter is now being setJMB cleanup age is now being setJMB Event file is now being setJMB User Event file is now being setPHDC collect parameter is now being setPHDC duration parameter is now being setPHDC commands file is now being setJMB Progress Logging parameter is now being setiJMB generation parameters are now being setAI-Scripts platform support flag is now being setInterval event commands file is now being setInterval event enabled parameter is now being setAll node log collect parameter is now being setDisk Warning Threshold is now being setDisk Full Threshold is now being setRSI Lite Enabled is now being setRemoving any old files that need to be updatedCopying updated filesRestarting eventd ...Event processing process started, pid 78147Installation completedSaving package file in /var/sw/pkg/jais-5.0R4.0-signed.tgz ...Saving state for rollback ...
request system scripts add package-name
user@host> request system scripts add jais-5.0R1.0-signed.tgz backup Pushing bundle to node1[: -a: unexpected operatorgrep: /etc/db/pkg/jais/+COMMENT: No such file or directoryInstalling package '/var/tmp/jais-5.0R4.0-signed.tgz' ...Verified jais-5.0R4.0.tgz signed by PackageProductionRSA_2016Adding jais...Available space: 2619677 require: 1814Installing AI-Scripts version: 5.0R4chmod: /var/db/scripts/event/cron.slax: No such file or directorychmod: /var/db/scripts/event/bit_event.slax: No such file or directorychmod: /var/db/scripts/event/bit_event2.slax: No such file or directorychmod: /var/db/scripts/op/ais_bit.slax: No such file or directorySaving package file in /var/db/scripts/commit/jais-5.0R4.0-signed.tgz ...NOTICE: uncommitted changes have been saved in /var/db/config/juniper.conf.pre-install
760

ln: ///etc/rc.d/ais: Read-only file systemMounted jais package on /dev/md2...Verified manifest signed by PackageProductionRSA_2016Verified jais-5.0R4.0 signed by PackageProductionRSA_2016Model: srx5600Model: srx5600Linking in Junos ES manifest file.Creating srx5800/srx5600 trend data file.Creating SRX intelligence attachments file.Creating SRX events attachments file.Creating AI-Scripts FIFOStarting AI-Scripts FIFO handler99423: old priority 0, new priority 2099428: old priority 0, new priority 2099429: old priority 0, new priority 2099430: old priority 0, new priority 20RSI parameters are now being setBIOS validation parameter is now being setBIOS interval parameter is now being setJMB cleanup age is now being setJMB Event file is now being setJMB User Event file is now being setPHDC collect parameter is now being setPHDC duration parameter is now being setPHDC commands file is now being setJMB Progress Logging parameter is now being setiJMB generation parameters are now being setAI-Scripts platform support flag is now being setInterval event commands file is now being setInterval event enabled parameter is now being setAll node log collect parameter is now being setDisk Warning Threshold is now being setDisk Full Threshold is now being setRSI Lite Enabled is now being setchmod: /var/db/scripts/event/cron.slax: No such file or directorychmod: /var/db/scripts/event/bit_event.slax: No such file or directorychmod: /var/db/scripts/event/bit_event2.slax: No such file or directorychmod: /var/db/scripts/op/ais_bit.slax: No such file or directoryRemoving any old files that need to be updatedCopying updated filesRestarting eventd ...Event processing process started, pid 99730Installation completed
761

Saving package file in /var/sw/pkg/jais-5.0R4.0-signed.tgz ...Saving state for rollback ...
Release Information
Command introduced before Junos OS Release 9.0. The options master and backup are introduced in JunosOS Release 15.1X49-D50.
RELATED DOCUMENTATION
Understanding Automatic Chassis Cluster Synchronization Between Primary and Secondary Nodes | 143
request system reboot (SRX Series)
IN THIS SECTION
Syntax | 762
Description | 763
Options | 763
Required Privilege Level | 763
Release Information | 764
Syntax
request system reboot <at time> <in minutes><media><message “text”>
762

Description
Reboot the software.
Options
• at time (Optional)— Specify the time at which to reboot the device. You can specify time in one ofthe following ways:
• now— Reboot the device immediately. This is the default.
• +minutes— Reboot the device in the number of minutes from now that you specify.
• yymmddhhmm— Reboot the device at the absolute time on the date you specify. Enter the year,month, day, hour (in 24-hour format), and minute.
• hh:mm— Reboot the device at the absolute time you specify, on the current day. Enter the time in24-hour format, using a colon (:) to separate hours from minutes.
• in minutes(Optional)— Specify the number of minutes from now to reboot the device. This option is asynonym for the at +minutes option
• media type(Optional)— Specify the boot device to boot the device from:
• disk/internal— Reboot from the internal media. This is the default.
• usb— Reboot from the USB storage device.
• compact flash— Reboot from the external CompactFlash card.
NOTE: The media command option is not available on vSRX.
• message “text” (Optional)— Provide a message to display to all system users before the devicereboots.
Example: request system reboot at 5 in 50 media internal message stop
Required Privilege Level
maintenance
763

Release Information
Command introduced in Junos OS Release 10.1.
Command hypervisor option introduced in Junos OS Release 15.1X49-D10 for vSRX.
RELATED DOCUMENTATION
request system software rollback (SRX Series)
request system software in-service-upgrade(Maintenance)
IN THIS SECTION
Syntax | 764
Description | 765
Options | 765
Required Privilege Level | 766
Output Fields | 766
Sample Output | 766
Sample Output | 767
Release Information | 769
Syntax
request system software in-service-upgrade image_name <no-copy><no-old-master-upgrade><no-sync><no-tcp-syn-check>
764

<no-validate><status><unlink>
Description
The in-service software upgrade (ISSU) feature allows a chassis cluster pair to be upgraded fromsupported Junos OS versions with a traffic impact similar to that of redundancy group failovers. Beforeupgrading, you must perform failovers so that all redundancy groups are active on only one device. Werecommend that graceful restart for routing protocols be enabled before you initiate an ISSU.
For SRX300, SRX320, SRX340, SRX345, SRX550M, and SRX380 devices, you must use the no-syncparameter to perform an in-band cluster upgrade (ICU). This allows a chassis cluster pair to be upgradedwith a minimal service disruption of approximately 30 seconds.
For SRX1500, SRX4100, and SRX4200 devices, the no-sync parameter is not supported when using ISSUto upgrade. The no-sync option specifies that the state is not synchronized from the primary node to thesecondary node.
For SRX1500 devices, the no-tcp-syn-check parameter is not supported when using ISSU to upgrade.
Options
• image_name—Specify the location and name of the software upgrade package to be installed.
• no-copy—(Optional) Install the software upgrade package but do not save the copies of package files.
• no-old-master-upgrade—(Optional) Do not upgrade the old primary after switchover.
This parameter applies to SRX5400, SRX5600, and SRX5800 devices only.
• no-sync—(Optional) Stop the flow state from synchronizing when the old secondary node has bootedwith a new Junos OS image.
This parameter applies to SRX300, SRX320, SRX340, SRX345, SRX550M, and SRX380 devices only.It is required for an ICU.
• no-tcp-syn-check—(Optional) Create a window wherein the TCP SYN check for the incoming packets isdisabled. The default value for the window is 7200 seconds (2 hours).
This parameter applies to SRX300, SRX320, SRX340, SRX345, SRX550M and SRX380 devices only.
765
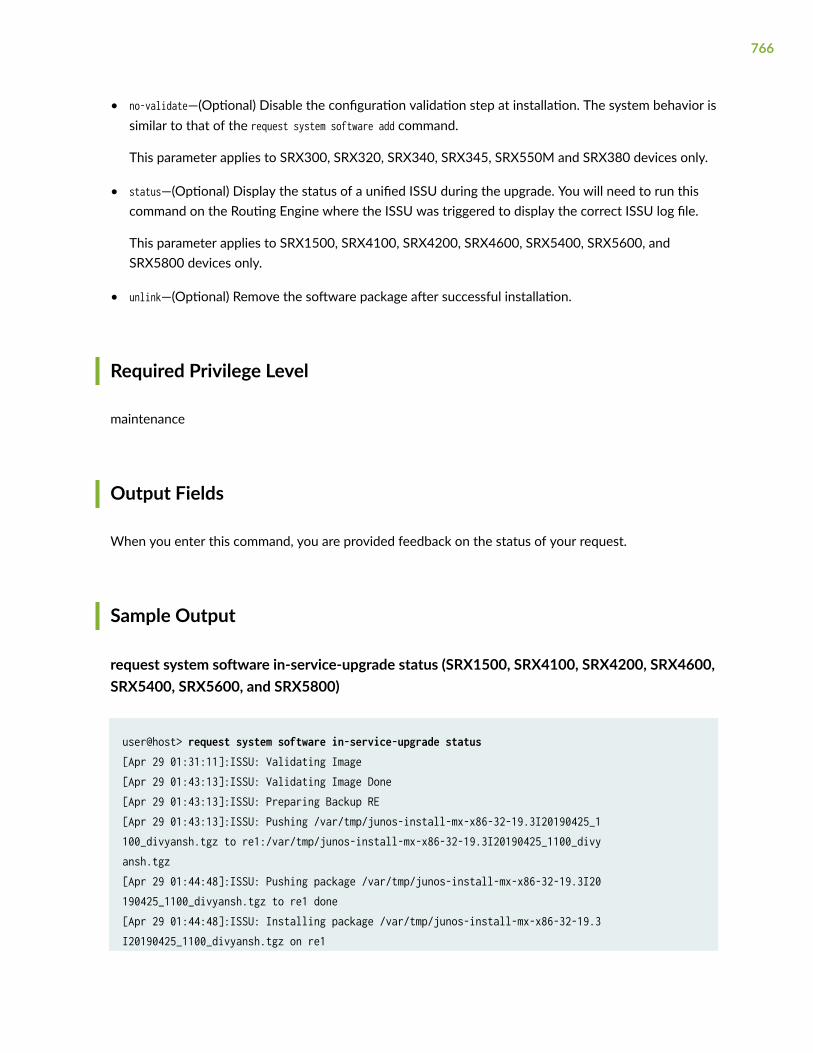
• no-validate—(Optional) Disable the configuration validation step at installation. The system behavior issimilar to that of the request system software add command.
This parameter applies to SRX300, SRX320, SRX340, SRX345, SRX550M and SRX380 devices only.
• status—(Optional) Display the status of a unified ISSU during the upgrade. You will need to run thiscommand on the Routing Engine where the ISSU was triggered to display the correct ISSU log file.
This parameter applies to SRX1500, SRX4100, SRX4200, SRX4600, SRX5400, SRX5600, andSRX5800 devices only.
• unlink—(Optional) Remove the software package after successful installation.
Required Privilege Level
maintenance
Output Fields
When you enter this command, you are provided feedback on the status of your request.
Sample Output
request system software in-service-upgrade status (SRX1500, SRX4100, SRX4200, SRX4600,SRX5400, SRX5600, and SRX5800)
user@host> request system software in-service-upgrade status[Apr 29 01:31:11]:ISSU: Validating Image[Apr 29 01:43:13]:ISSU: Validating Image Done[Apr 29 01:43:13]:ISSU: Preparing Backup RE[Apr 29 01:43:13]:ISSU: Pushing /var/tmp/junos-install-mx-x86-32-19.3I20190425_1100_divyansh.tgz to re1:/var/tmp/junos-install-mx-x86-32-19.3I20190425_1100_divyansh.tgz[Apr 29 01:44:48]:ISSU: Pushing package /var/tmp/junos-install-mx-x86-32-19.3I20190425_1100_divyansh.tgz to re1 done[Apr 29 01:44:48]:ISSU: Installing package /var/tmp/junos-install-mx-x86-32-19.3I20190425_1100_divyansh.tgz on re1
766

[Apr 29 01:52:35]:ISSU: Installing package /var/tmp/junos-install-mx-x86-32-19.3I20190425_1100_divyansh.tgz on re1 done[Apr 29 01:52:35]:ISSU: Rebooting Backup RE[Apr 29 01:52:36]:ISSU: Backup RE Prepare Done[Apr 29 01:52:36]:ISSU: Waiting for Backup RE reboot[Apr 29 01:56:45]:ISSU: Backup RE reboot done. Backup RE is up[Apr 29 01:56:45]:ISSU: Waiting for Backup RE state synchronization[Apr 29 01:57:10]:ISSU: Backup RE state synchronization done[Apr 29 01:57:10]:ISSU: GRES operational[Apr 29 01:58:16]:ISSU: Preparing Daemons[Apr 29 01:58:40]:ISSU: Daemons Ready for ISSU[Apr 29 01:58:46]:ISSU: Offline Incompatible FRUs[Apr 29 01:58:51]:ISSU: Starting Upgrade for FRUs[Apr 29 02:03:32]:ISSU: Preparing for Switchover[Apr 29 02:03:57]:ISSU: Ready for Switchover[Apr 29 02:03:59]:ISSU: RE switchover Done[Apr 29 02:03:59]:ISSU: Upgrading Old Master RE[Apr 29 02:12:51]:ISSU: Old Master Upgrade Done[Apr 29 02:12:51]:ISSU: IDLE
Sample Output
request system software in-service-upgrade (SRX300, SRX320, SRX340, SRX345, SRX550M,and SRX380 Devices)
user@host> request system software in-service-upgrade /var/tmp/junos-srxsme-15.1I20160520_0757-domestic.tgz no-sync
ISSU: Validating packageWARNING: in-service-upgrade shall reboot both the nodes in your cluster. Please ignore any subsequent reboot request message ISSU: start downloading software package on secondary nodePushing /var/tmp/junos-srxsme-15.1I20160520_0757-domestic.tgz to node0:/var/tmp/junos-srxsme-15.1I20160520_0757-domestic.tgzFormatting alternate root (/dev/da0s1a).../dev/da0s1a: 2510.1MB (5140780 sectors) block size 16384, fragment size 2048 using 14 cylinder groups of 183.62MB, 11752 blks, 23552 inodes.super-block backups (for fsck -b #) at:
767

32, 376096, 752160, 1128224, 1504288, 1880352, 2256416, 2632480, 3008544,3384608, 3760672, 4136736, 4512800, 4888864Installing package '/altroot/cf/packages/install-tmp/junos-15.1I20160520_0757-domestic' ...Verified junos-boot-srxsme-15.1I20160520_0757.tgz signed by PackageDevelopmentEc_2016 method ECDSA256+SHA256Verified junos-srxsme-15.1I20160520_0757-domestic signed by PackageDevelopmentEc_2016 method ECDSA256+SHA256 WARNING: The software that is being installed has limited support.WARNING: Run 'file show /etc/notices/unsupported.txt' for details. Verified junos-boot-srxsme-15.1I20160520_0757.tgz signed by PackageDevelopmentEc_2016 method ECDSA256+SHA256Verified junos-srxsme-15.1I20160520_0757-domestic signed by PackageDevelopmentEc_2016 method ECDSA256+SHA256JUNOS 15.1I20160520_0757 will become active at next rebootWARNING: A reboot is required to load this software correctlyWARNING: Use the 'request system reboot' commandWARNING: when software installation is completecp: cannot overwrite directory /altroot/cf/etc/ssh with non-directory /cf/etc/sshSaving state for rollback ...ISSU: finished upgrading on secondary node node0ISSU: start upgrading software package on primary nodeFormatting alternate root (/dev/da0s1a).../dev/da0s1a: 2510.1MB (5140780 sectors) block size 16384, fragment size 2048 using 14 cylinder groups of 183.62MB, 11752 blks, 23552 inodes.super-block backups (for fsck -b #) at:32, 376096, 752160, 1128224, 1504288, 1880352, 2256416, 2632480, 3008544,3384608, 3760672, 4136736, 4512800, 4888864Installing package '/altroot/cf/packages/install-tmp/junos-15.1I20160520_0757-domestic' ...Verified junos-boot-srxsme-15.1I20160520_0757.tgz signed by PackageDevelopmentEc_2016 method ECDSA256+SHA256Verified junos-srxsme-15.1I20160520_0757-domestic signed by PackageDevelopmentEc_2016 method ECDSA256+SHA256 WARNING: The software that is being installed has limited support.WARNING: Run 'file show /etc/notices/unsupported.txt' for details. Verified junos-boot-srxsme-15.1I20160520_0757.tgz signed by PackageDevelopmentEc_2016 method ECDSA256+SHA256Verified junos-srxsme-15.1I20160520_0757-domestic signed by PackageDevelopmentEc_2016 method ECDSA256+SHA256JUNOS 15.1I20160520_0757 will become active at next reboot
768

WARNING: A reboot is required to load this software correctlyWARNING: Use the 'request system reboot' commandWARNING: when software installation is completecp: cannot overwrite directory /altroot/cf/etc/ssh with non-directory /cf/etc/sshSaving state for rollback ...ISSU: failover all redundancy-groups 1...n to primary nodeSuccessfully reset all redundancy-groups priority back to configured priority.Successfully reset all redundancy-groups priority back to configured priority.error: Command failed. None of the redundancy-groups has been failed over. Some redundancy-groups' priority on node1 are 0. e.g.: priority of redundancy-groups-1 on node1 is 0.Use 'force' option at the end to ignore this check.WARNING: Using force option may cause traffic loss.ISSU: rebooting Secondary NodeShutdown NOW!ISSU: Waiting for secondary node node0 to reboot.ISSU: node 0 went downISSU: Waiting for node 0 to come upISSU: node 0 came upISSU: secondary node node0 booted up.ISSU: failover all redundancy-groups 1...n to remote node, before reboot.Successfully reset all redundancy-groups priority back to configured priority.
Shutdown NOW! {primary:node1}user@host> *** FINAL System shutdown message from user@host *** System going down IMMEDIATELY
Release Information
For SRX5400, SRX5600, and SRX5800 devices, command introduced in Junos OS Release 9.6. ForSRX5400 devices, the command is introduced in Junos OS Release 12.1X46-D20. For SRX300, SRX320,SRX340, and SRX345 devices, command introduced in Junos OS Release 15.1X49-D40. For SRX1500devices, command introduced in Junos OS Release 15.1X49-D50. For SRX380 devices, commandintroduced in Junos OS Release 20.1R1.
769

Starting with Junos OS Release 15.1X49-D80, SRX4100 and SRX4200 devices support ISSU.
Starting with Junos OS Release 17.4R1, SRX4600 devices support ISSU.
SRX300 Series devices, SRX550M devices and vSRX do not support ISSU.
For SRX1500, SRX4100, SRX4200, SRX4600, SRX5400, SRX5600, and SRX5800, the status option isintroduced in Junos OS Release 20.4R1.
RELATED DOCUMENTATION
request system software rollback (SRX Series)
request system software rollback (SRX Series)
IN THIS SECTION
Syntax | 770
Description | 770
Options | 771
Required Privilege Level | 771
Release Information | 771
Syntax
request system software rollback <node-id>
Description
Use this command to revert to the software that was loaded at the last successful request system softwareadd command. The upgraded FreeBSD 11.x (supported in Junos OS Release 17.4R1) Junos OS image
770

provides an option to save a recovery image in an Operation, Administration, and Maintenance (OAM)partition, but that option will save only the Junos OS image, not the Linux image. If a user saves theJunos OS image and recovers it later, it might not be compatible with the Linux software loaded on thesystem.
Options
node-id—Identification number of the chassis cluster node. It can be 0 or 1.
Required Privilege Level
maintenance
Release Information
Command introduced in Junos OS Release 10.1.
RELATED DOCUMENTATION
Upgrading Junos OS with Upgraded FreeBSD
Release Information for Junos OS with Upgraded FreeBSD
set chassis cluster disable reboot
IN THIS SECTION
Syntax | 772
Description | 772
Options | 772
771

Required Privilege Level | 772
Output Fields | 773
Sample Output | 773
Release Information | 773
Syntax
set chassis cluster disable <reboot>
Description
After defining chassis cluster configuration, you can disable or remove a chassis cluster and change theSRX devices to standalone devices by running the set chassis cluster disable reboot command from theoperational mode.
After the chassis cluster is disabled using this CLI command, you do not have a similar CLI option toenable it.
Options
reboot You can disable the chassis cluster and run the reboot command. When the reboot iscompleted, you can view the SRX device functioning in standalone mode.
Required Privilege Level
maintenance
772

Output Fields
Sample Output
set chassis cluster disable reboot
user@host> set chassis cluster disable rebootSuccessfully disabled chassis cluster. Going to reboot now.
Release Information
Statement introduced in Junos OS Release 9.0.
RELATED DOCUMENTATION
set chassis cluster cluster-id node node-number reboot | 773
Disabling a Chassis Cluster | 531
set chassis cluster cluster-id node node-numberreboot
IN THIS SECTION
Syntax | 774
Description | 774
Options | 774
Required Privilege Level | 775
773

Output Fields | 775
Release Information | 775
Syntax
set chassis cluster cluster-id cluster-id node node-number reboot
Description
Sets the chassis cluster identifier (ID) and node ID on each device, and reboots the devices to enableclustering. The system uses the chassis cluster ID and chassis cluster node ID to apply the correctconfiguration for each node (for example, when you use the apply-groups command to configure thechassis cluster management interface). The chassis cluster ID and node ID statements are written to theEPROM, and the statements take effect when the system is rebooted.
Setting a cluster ID to 0 is equivalent to disabling a cluster. A cluster ID greater than 15 can only be setwhen the fabric and control link interfaces are connected back-to-back.
NOTE: If you have a cluster set up and running with an earlier release of Junos OS, you canupgrade to Junos OS Release 12.1X45-D10 or later and re-create a cluster with cluster IDsgreater than 16. If for any reason you decide to revert to the previous version of Junos OS thatdid not support extended cluster IDs, the system comes up with standalone devices after youreboot. If the cluster ID set is less than 16 and you roll back to a previous release, the systemcomes back with the previous setup.
Options
cluster-id cluster-id Identifies the cluster within the Layer 2 domain.
• Range: 0 through 255
774

node node Identifies a node within a cluster.
• Range: 0 through 1
reboot reboot the specified devices to configure the chassis cluster.
Required Privilege Level
maintenance
Output Fields
When you enter this command, you are provided feedback on the status of your request.
Release Information
Support for extended cluster identifiers (more than 15 identifiers) added in Junos OS Release 12.1X45-D10.
RELATED DOCUMENTATION
Example: Setting the Chassis Cluster Node ID and Cluster ID
Understanding the Interconnect Logical System and Logical Tunnel Interfaces
Example: Configuring Logical Systems in an Active/Passive Chassis Cluster (Primary AdministratorsOnly)
Disabling a Chassis Cluster
set chassis cluster disable reboot
775

show chassis cluster control-plane statistics
IN THIS SECTION
Syntax | 776
Description | 776
Required Privilege Level | 776
Output Fields | 777
Sample Output | 778
Sample Output | 778
Release Information | 779
Syntax
show chassis cluster control-plane statistics
Description
Display information about chassis cluster control plane statistics.
Required Privilege Level
view
776

Output Fields
Table 41 on page 777 lists the output fields for the show chassis cluster control-plane statisticscommand. Output fields are listed in the approximate order in which they appear.
Table 41: show chassis cluster control-plane statistics Output Fields
Field Name Field Description
Control link statistics Statistics of the control link used by chassis cluster traffic. Statistics for Controllink 1 are displayed when you use dual control links (SRX5600 and SRX5800devices only).
• Heartbeat packets sent—Number of heartbeat messages sent on thecontrol link.
• Heartbeat packets received—Number of heartbeat messages received onthe control link.
• Heartbeat packet errors—Number of heartbeat packets received witherrors on the control link.
Fabric link statistics Statistics of the fabric link used by chassis cluster traffic. Statistics for ChildLink 1 are displayed when you use dual fabric links.
• Probes sent—Number of probes sent on the fabric link.
• Probes received—Number of probes received on the fabric link.
Switch fabric link statistics Statistics of the switch fabric link used by chassis cluster traffic.
• Probe state—State of the probe, UP or DOWN.
• Probes sent—Number of probes sent.
• Probes received—Number of probes received.
• Probe recv error —Error in receiving probe.
• Probe send error—Error in sending probe.
777

Sample Output
show chassis cluster control-plane statistics
user@host> show chassis cluster control-plane statistics Control link statistics: Control link 0: Heartbeat packets sent: 11646 Heartbeat packets received: 8343 Heartbeat packet errors: 0Fabric link statistics: Child link 0 Probes sent: 11644 Probes received: 8266 Switch fabric link statistics: Probe state : DOWN Probes sent: 8145 Probes received: 8013 Probe recv errors: 0 Probe send errors: 0
Sample Output
show chassis cluster control-plane statistics (SRX5000 Line Devices)
user@host> show chassis cluster control-plane statisticsControl link statistics: Control link 0: Heartbeat packets sent: 2061982 Heartbeat packets received: 2060367 Heartbeat packet errors: 0 Control link 1: Heartbeat packets sent: 2061982 Heartbeat packets received: 0 Heartbeat packet errors: 0Fabric link statistics: Child link 0 Probes sent: 3844342
778

Probes received: 3843841 Child link 1 Probes sent: 0 Probes received: 0
Release Information
Command introduced in Junos OS Release 9.3. Output changed to support dual control ports in JunosOS Release 10.0.
RELATED DOCUMENTATION
clear chassis cluster control-plane statistics | 726
show chassis cluster data-plane interfaces
IN THIS SECTION
Syntax | 779
Description | 780
Required Privilege Level | 780
Output Fields | 780
Sample Output | 780
Release Information | 781
Syntax
show chassis cluster data-plane interfaces
779

Description
Display the status of the data plane interface (also known as a fabric interface) in a chassis clusterconfiguration.
Required Privilege Level
view
Output Fields
Table 42 on page 780 lists the output fields for the show chassis cluster data-plane interfaces command.Output fields are listed in the approximate order in which they appear.
Table 42: show chassis cluster data-plane interfaces Output Fields
Field Name Field Description
fab0/fab1 Name of the logical fabric interface.
• Name—Name of the physical Ethernet interface.
• Status—State of the fabric interface: up or down.
Sample Output
show chassis cluster data-plane interfaces
user@host> show chassis cluster data-plane interfaces fab0: Name Status ge-2/1/9 up ge-2/2/5 up fab1:
780

Name Status ge-8/1/9 up ge-8/2/5 up
Release Information
Command introduced in Junos OS Release 10.2.
RELATED DOCUMENTATION
cluster (Chassis) | 601
show chassis cluster data-plane statistics
IN THIS SECTION
Syntax | 781
Description | 782
Required Privilege Level | 782
Output Fields | 782
Sample Output | 784
Release Information | 784
Syntax
show chassis cluster data-plane statistics
781

Description
Display information about chassis cluster data plane statistics.
Required Privilege Level
view
Output Fields
Table 43 on page 783 lists the output fields for the show chassis cluster data-plane statistics command.Output fields are listed in the approximate order in which they appear.
782

Table 43: show chassis cluster data-plane statistics Output Fields
Field Name Field Description
Services Synchronized • Service name—Name of the service.
• Rtos sent—Number of runtime objects (RTOs) sent.
• Rtos received—Number of RTOs received.
• Translation context—Messages synchronizing Network Address Translation(NAT) translation context.
• Incoming NAT—Messages synchronizing incoming Network AddressTranslation (NAT) service.
• Resource manager—Messages synchronizing resource manager groups andresources.
• Session create—Messages synchronizing session creation.
• Session close—Messages synchronizing session close.
• Session change—Messages synchronizing session change.
• Gate create—Messages synchronizing creation of pinholes (temporaryopenings in the firewall).
• Session ageout refresh request—Messages synchronizing request sessionafter age-out.
• Session ageout refresh reply—Messages synchronizing reply session afterage-out.
• IPsec VPN—Messages synchronizing VPN session.
• Firewall user authentication—Messages synchronizing firewall userauthentication session.
• MGCP ALG—Messages synchronizing MGCP ALG sessions.
• H323 ALG—Messages synchronizing H.323 ALG sessions.
• SIP ALG—Messages synchronizing SIP ALG sessions.
• SCCP ALG—Messages synchronizing SCCP ALG sessions.
783

Table 43: show chassis cluster data-plane statistics Output Fields (Continued)
Field Name Field Description
• PPTP ALG—Messages synchronizing PPTP ALG sessions.
• RTSP ALG—Messages synchronizing RTSP ALG sessions.
Sample Output
show chassis cluster data-plane statistics
user@host> show chassis cluster data-plane statistics Services Synchronized: Service name RTOs sent RTOs received Translation context 0 0 Incoming NAT 0 0 Resource manager 0 0 Session create 0 0 Session close 0 0 Session change 0 0 Gate create 0 0 Session ageout refresh requests 0 0 Session ageout refresh replies 0 0 IPsec VPN 0 0 Firewall user authentication 0 0 MGCP ALG 0 0 H323 ALG 0 0 SIP ALG 0 0 SCCP ALG 0 0 PPTP ALG 0 0 RTSP ALG 0 0
Release Information
Command introduced in Junos OS Release 9.3.
784

RELATED DOCUMENTATION
clear chassis cluster data-plane statistics | 727
show chassis cluster ethernet-switching interfaces
IN THIS SECTION
Syntax | 785
Description | 785
Required Privilege Level | 785
Output Fields | 786
Sample Output | 786
Release Information | 786
Syntax
show chassis cluster ethernet-switching interfaces
Description
Display the status of the switch fabric interfaces (swfab interfaces) in a chassis cluster.
Required Privilege Level
view
785

Output Fields
Table 44 on page 786 lists the output fields for the show chassis cluster ethernet-switching interfacescommand. Output fields are listed in the approximate order in which they appear.
Table 44: show chassis cluster ethernet-switching interfaces Output Fields
Field Name Field Description
swfab switch fabric interface-name
Name of the switch fabric interface.
• Name—Name of the physical interface.
• Status—State of the switch fabric interface: up or down.
Sample Output
show chassis cluster ethernet-switching interfaces
user@host> show chassis cluster ethernet-switching interfacesswfab0: Name Status ge-0/0/9 up ge-0/0/10 upswfab1: Name Status ge-7/0/9 up ge-7/0/10 up
Release Information
Command introduced in Junos OS Release 11.1.
786

RELATED DOCUMENTATION
cluster (Chassis) | 601
Ethernet Switching User Guide
show chassis cluster ethernet-switching status
IN THIS SECTION
Syntax | 787
Description | 787
Required Privilege Level | 787
Output Fields | 788
Sample Output | 789
Release Information | 789
Syntax
show chassis cluster ethernet-switching status
Description
Display the Ethernet switching status of the chassis cluster.
Required Privilege Level
view
787

Output Fields
Table 45 on page 788 lists the output fields for the show chassis cluster ethernet-switching statuscommand. Output fields are listed in the approximate order in which they appear.
Table 45: show chassis cluster ethernet-switching status Output Fields
Field Name Field Description
Cluster ID ID number (1-255) of a cluster. Setting a cluster ID to 0 is equivalent to disabling a cluster. Acluster ID greater than 15 can only be set when the fabric and control link interfaces areconnected back-to-back.
Redundancy-Group You can create up to 128 redundancy groups in the chassis cluster.
Node name Node (device) in the chassis cluster (node0 or node1).
Priority Assigned priority for the redundancy group on that node.
Status State of the redundancy group (Primary, Secondary, Lost, or Unavailable).
• Primary—Redundancy group is active and passing traffic.
• Secondary—Redundancy group is passive and not passing traffic.
• Lost—Node loses contact with the other node through the control link. Most likely to occurwhen both nodes are in a cluster and there is a control link failure, one node cannotexchange heartbeats, or when the other node is rebooted.
• Unavailable—Node has not received a single heartbeat over the control link from the othernode since the other node booted up. Most likely to occur when one node boots up beforethe other node, or if only one node is present in the cluster.
Preempt • Yes: Primary Role can be preempted based on priority.
• No: Change in priority will not preempt primary role.
Manual failover • Yes: Primary Role is set manually through the CLI.
• No: Primary Role is not set manually through the CLI.
788
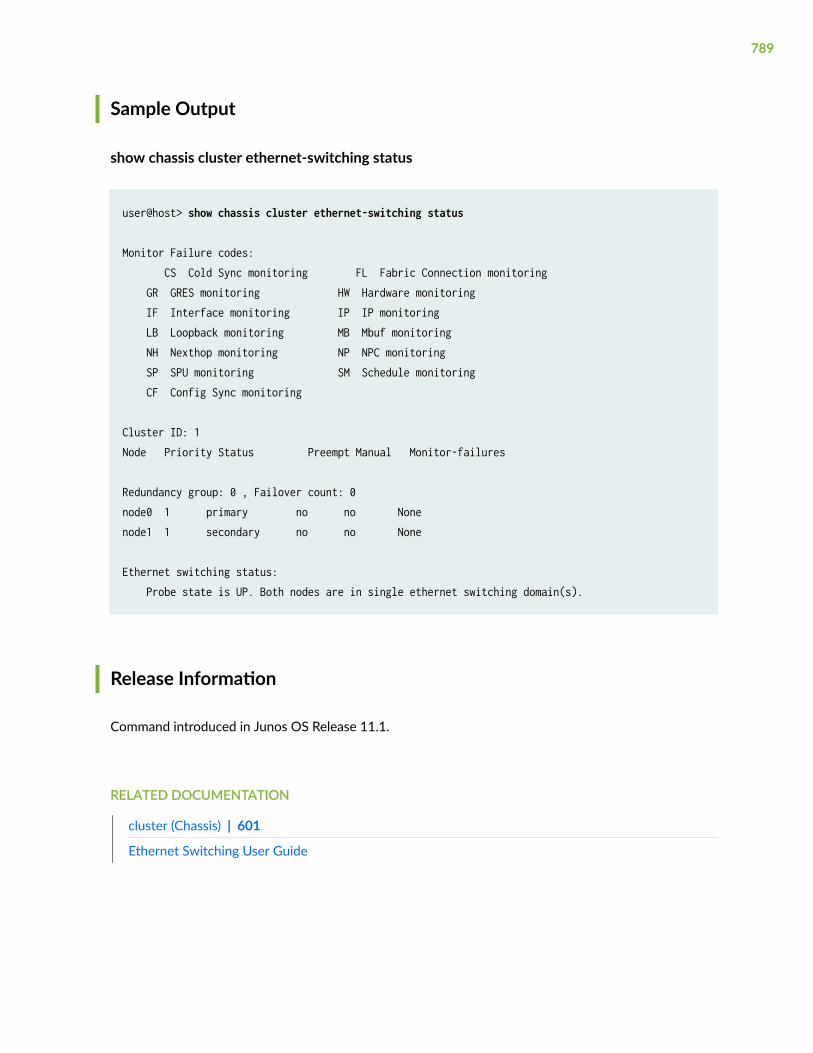
Sample Output
show chassis cluster ethernet-switching status
user@host> show chassis cluster ethernet-switching status
Monitor Failure codes: CS Cold Sync monitoring FL Fabric Connection monitoring GR GRES monitoring HW Hardware monitoring IF Interface monitoring IP IP monitoring LB Loopback monitoring MB Mbuf monitoring NH Nexthop monitoring NP NPC monitoring SP SPU monitoring SM Schedule monitoring CF Config Sync monitoring
Cluster ID: 1Node Priority Status Preempt Manual Monitor-failures
Redundancy group: 0 , Failover count: 0node0 1 primary no no Nonenode1 1 secondary no no None
Ethernet switching status: Probe state is UP. Both nodes are in single ethernet switching domain(s).
Release Information
Command introduced in Junos OS Release 11.1.
RELATED DOCUMENTATION
cluster (Chassis) | 601
Ethernet Switching User Guide
789

show chassis cluster information
IN THIS SECTION
Syntax | 790
Description | 790
Required Privilege Level | 790
Output Fields | 791
Sample Output | 791
Sample Output | 793
Sample Output | 795
Release Information | 796
Syntax
show chassis cluster information
Description
Display chassis cluster messages. The messages indicate each node's health condition and details of themonitored failure.
Required Privilege Level
view
790

Output Fields
Table 46 on page 791 lists the output fields for the show chassis cluster information command. Outputfields are listed in the approximate order in which they appear.
Table 46: show chassis cluster information Output Fields
Field Name Field Description
Node Node (device) in the chassis cluster (node0 or node1).
Redundancy Group Information • Redundancy Group—ID number (0 - 255) of a redundancy group in thecluster.
• Current State—State of the redundancy group: primary, secondary, hold, orsecondary-hold.
• Weight—Relative importance of the redundancy group.
• Time—Time when the redundancy group changed the state.
• From—State of the redundancy group before the change.
• To—State of the redundancy group after the change.
• Reason—Reason for the change of state of the redundancy group.
Chassis cluster LED information • Current LED color—Current color state of the LED.
• Last LED change reason—Reason for change of state of the LED.
Sample Output
show chassis cluster information
user@host> show chassis cluster information
node0:--------------------------------------------------------------------------
791

Redundancy Group Information:
Redundancy Group 0 , Current State: primary, Weight: 255
Time From To Reason Mar 27 17:44:19 hold secondary Hold timer expired Mar 27 17:44:27 secondary primary Better priority (200/200)
Redundancy Group 1 , Current State: primary, Weight: 255
Time From To Reason Mar 27 17:44:19 hold secondary Hold timer expired Mar 27 17:44:27 secondary primary Remote yield (0/0)
Redundancy Group 2 , Current State: secondary, Weight: 255
Time From To Reason Mar 27 17:44:19 hold secondary Hold timer expired Mar 27 17:44:27 secondary primary Remote yield (0/0) Mar 27 17:50:24 primary secondary-hold Preempt/yield(100/200) Mar 27 17:50:25 secondary-hold secondary Ready to become secondary
Chassis cluster LED information: Current LED color: Green Last LED change reason: No failures
node1:--------------------------------------------------------------------------Redundancy Group Information:
Redundancy Group 0 , Current State: secondary, Weight: 255
Time From To Reason Mar 27 17:44:27 hold secondary Hold timer expired
Redundancy Group 1 , Current State: secondary, Weight: 255
Time From To Reason Mar 27 17:44:27 hold secondary Hold timer expired Mar 27 17:50:23 secondary primary Remote yield (100/0) Mar 27 17:50:24 primary secondary-hold Preempt/yield(100/200) Mar 27 17:50:25 secondary-hold secondary Ready to become secondary
792

Redundancy Group 2 , Current State: primary, Weight: 255
Time From To Reason Mar 27 17:44:27 hold secondary Hold timer expired Mar 27 17:50:23 secondary primary Remote yield (200/0)
Chassis cluster LED information: Current LED color: Green Last LED change reason: No failures
Sample Output
show chassis cluster information (Monitoring Abnormal Case)
user@host> show chassis cluster information
The following output is specific to monitoring abnormal (unhealthy) case.
node0:--------------------------------------------------------------------------Redundancy Group Information:
Redundancy Group 0 , Current State: secondary, Weight: 255
Time From To Reason Apr 1 11:07:38 hold secondary Hold timer expired Apr 1 11:07:41 secondary primary Only node present Apr 1 11:29:20 primary secondary-hold Manual failover Apr 1 11:34:20 secondary-hold secondary Ready to become secondary
Redundancy Group 1 , Current State: primary, Weight: 0
Time From To Reason Apr 1 11:07:38 hold secondary Hold timer expired Apr 1 11:07:41 secondary primary Only node present
Redundancy Group 2 , Current State: primary, Weight: 255
793
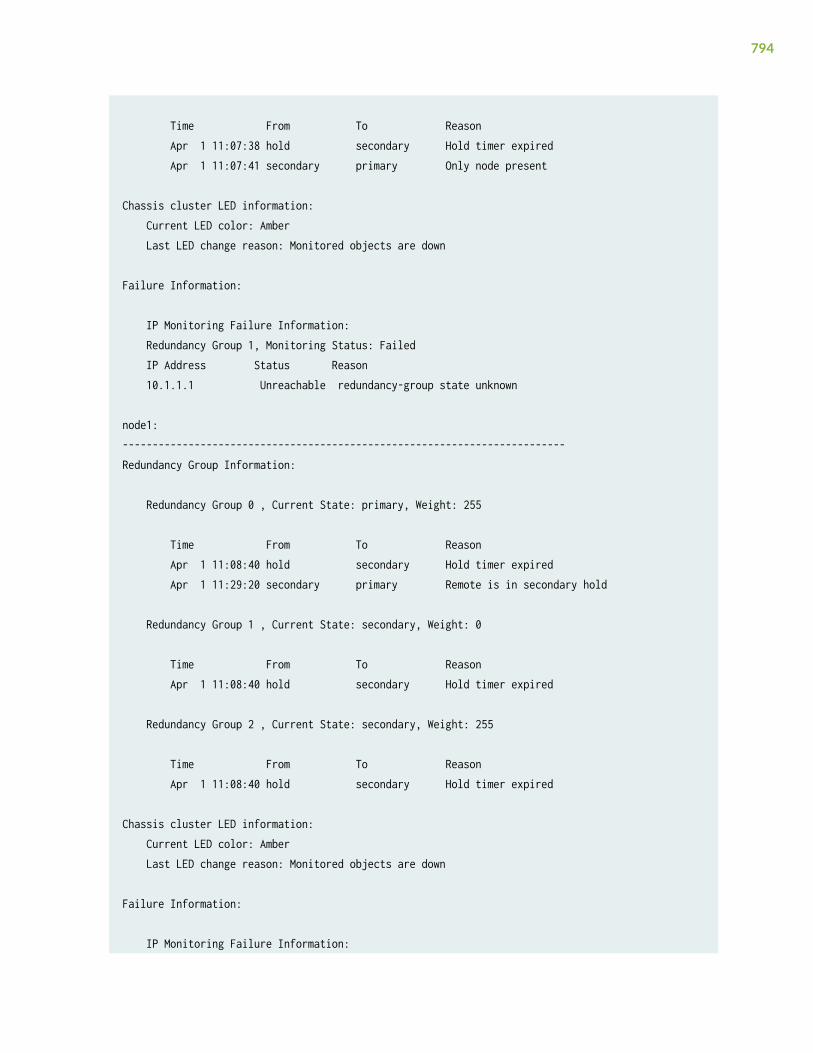
Time From To Reason Apr 1 11:07:38 hold secondary Hold timer expired Apr 1 11:07:41 secondary primary Only node present
Chassis cluster LED information: Current LED color: Amber Last LED change reason: Monitored objects are down
Failure Information:
IP Monitoring Failure Information: Redundancy Group 1, Monitoring Status: Failed IP Address Status Reason 10.1.1.1 Unreachable redundancy-group state unknown
node1:--------------------------------------------------------------------------Redundancy Group Information:
Redundancy Group 0 , Current State: primary, Weight: 255
Time From To Reason Apr 1 11:08:40 hold secondary Hold timer expired Apr 1 11:29:20 secondary primary Remote is in secondary hold
Redundancy Group 1 , Current State: secondary, Weight: 0
Time From To Reason Apr 1 11:08:40 hold secondary Hold timer expired
Redundancy Group 2 , Current State: secondary, Weight: 255 Time From To Reason Apr 1 11:08:40 hold secondary Hold timer expired
Chassis cluster LED information: Current LED color: Amber Last LED change reason: Monitored objects are down
Failure Information:
IP Monitoring Failure Information:
794

Redundancy Group 1, Monitoring Status: Failed IP Address Status Reason 10.1.1.1 Unreachable redundancy-group state unknown
Sample Output
show chassis cluster information (Preempt Delay Timer)
user@host> show chassis cluster information
node0:--------------------------------------------------------------------------Redundancy Group Information:
Redundancy Group 0 , Current State: secondary, Weight: 255
Time From To Reason Aug 4 12:30:02 hold secondary Hold timer expired Aug 4 12:30:05 secondary primary Only node present Aug 4 14:19:58 primary secondary-hold Manual failover Aug 4 14:24:58 secondary-hold secondary Ready to become secondary
Redundancy Group 1 , Current State: secondary, Weight: 255
Time From To Reason Aug 4 14:07:57 secondary primary Remote is in secondary hold Aug 4 14:20:23 primary secondary-hold Monitor failed: IF Aug 4 14:20:24 secondary-hold secondary Ready to become secondary Aug 4 14:20:54 secondary primary Remote is in secondary hold Aug 4 14:21:30 primary secondary-hold Monitor failed: IF Aug 4 14:21:31 secondary-hold secondary Ready to become secondary
Chassis cluster LED information: Current LED color: Green Last LED change reason: No failures
node1:--------------------------------------------------------------------------Redundancy Group Information:
795

Redundancy Group 0 , Current State: primary, Weight: 255
Time From To Reason Aug 4 12:33:47 hold secondary Hold timer expired Aug 4 14:19:57 secondary primary Remote is in secondary hold Redundancy Group 1 , Current State: primary, Weight: 255
Time From To Reason Aug 4 14:07:56 secondary-hold secondary Ready to become secondary Aug 4 14:20:22 secondary primary Remote is in secondary hold Aug 4 14:20:37 primary primary-preempt-hold Preempt (99/101) Aug 4 14:20:52 primary-preempt-hold secondary-hold Primary preempt hold timer e Aug 4 14:20:53 secondary-hold secondary Ready to become secondary Aug 4 14:21:28 secondary primary Remote yield (99/0) Chassis cluster LED information: Current LED color: Green Last LED change reason: No failures
Release Information
Command introduced in Junos OS Release 12.1X47-D10.
RELATED DOCUMENTATION
show chassis cluster status | 823
796

show chassis cluster information configuration-synchronization
IN THIS SECTION
Syntax | 797
Description | 797
Required Privilege Level | 797
Output Fields | 798
Sample Output | 798
Release Information | 799
Syntax
show chassis cluster information configuration-synchronization
Description
Display chassis cluster messages. The messages indicate the redundancy mode, automaticsynchronization status, and if automatic synchronization is enabled on the device.
Required Privilege Level
view
797

Output Fields
Table 47 on page 798 lists the output fields for the show chassis cluster information configuration-synchronization command. Output fields are listed in the approximate order in which they appear.
Table 47: show chassis cluster information configuration-synchronization Output Fields
Field Name Field Description
Node name Node (device) in the chassis cluster (node0 or node1).
Status • Activation status—State of automatic configuration synchronization:Enabled or Disabled.
• Last sync operation—Status of the last synchronization.
• Last sync result—Result of the last synchronization.
• Last sync mgd messages—Management daemon messages of the lastsynchronization.
Events The timestamp of the event, the automatic configuration synchronizationstatus, and the number of synchronization attempts.
Sample Output
show chassis cluster information configuration-synchronization
user@host> show chassis cluster information configuration-synchronization
node0:--------------------------------------------------------------------------Configuration Synchronization: Status: Activation status: Enabled Last sync operation: Auto-Sync Last sync result: Not needed Last sync mgd messages:
798

Events: Feb 25 22:21:49.174 : Auto-Sync: Not needednode1:--------------------------------------------------------------------------Configuration Synchronization: Status: Activation status: Enabled Last sync operation: Auto-Sync Last sync result: Succeeded Last sync mgd messages: mgd: rcp: /config/juniper.conf: No such file or directory Network security daemon: warning: You have enabled/disabled inet6 flow. Network security daemon: You must reboot the system for your change to take effect. Network security daemon: If you have deployed a cluster, be sure to reboot all nodes. mgd: commit complete Events: Feb 25 23:02:33.467 : Auto-Sync: In progress. Attempt: 1 Feb 25 23:03:13.200 : Auto-Sync: Succeeded. Attempt: 1
Release Information
Command introduced in Junos OS Release 12.1X47-D10.
RELATED DOCUMENTATION
Understanding Automatic Chassis Cluster Synchronization Between Primary and Secondary Nodes | 143
NTP Time Synchronization on SRX Series Devices | 353
Example: Simplifying Network Management by Synchronizing the Primary and Backup Nodes withNTP | 353
request chassis cluster configuration-synchronize | 739
799

show chassis cluster information issu
IN THIS SECTION
Syntax | 800
Description | 800
Required Privilege Level | 800
Output Fields | 800
Sample Output | 801
Release Information | 802
Syntax
show chassis cluster information issu
Description
Display chassis cluster messages. The messages indicate the progress of the in-service software upgrade(ISSU).
Required Privilege Level
view
Output Fields
Table 48 on page 801 lists the output fields for the show chassis cluster information issu command.Output fields are listed in the approximate order in which they appear.
800

Table 48: show chassis cluster information issu Output Fields
Field Name Field Description
Node name Node (device) in the chassis cluster (node0 or node1).
CS Prereq Status of all cold synchronization prerequisites:
• if_state sync—Status of if_state synchronization.
• fabric link—Status of fabric link synchronization.
• policy data sync—Status of policy data synchronization.
• cp ready—Status of the central point.
• VPN data sync—Status of the VPN data synchronization.
CS RTO sync Status of cold synchronization runtime objects.
CS postreq Status of cold synchronization postrequirements.
Sample Output
show chassis cluster information issu
user@host> show chassis cluster information issu
node0:--------------------------------------------------------------------------Cold Synchronization Progress: CS Prereq 10 of 10 SPUs completed 1. if_state sync 10 SPUs completed 2. fabric link 10 SPUs completed 3. policy data sync 10 SPUs completed 4. cp ready 10 SPUs completed 5. VPN data sync 10 SPUs completed CS RTO sync 10 of 10 SPUs completed
801

CS Postreq 10 of 10 SPUs completed
node1:--------------------------------------------------------------------------Cold Synchronization Progress: CS Prereq 10 of 10 SPUs completed 1. if_state sync 10 SPUs completed 2. fabric link 10 SPUs completed 3. policy data sync 10 SPUs completed 4. cp ready 10 SPUs completed 5. VPN data sync 10 SPUs completed CS RTO sync 10 of 10 SPUs completed CS Postreq 10 of 10 SPUs completed
Release Information
Command introduced in Junos OS Release 12.1X47-D10.
RELATED DOCUMENTATION
show chassis cluster status | 823
show chassis cluster interfaces
IN THIS SECTION
Syntax | 803
Description | 803
Required Privilege Level | 803
Output Fields | 803
Sample Output | 805
802

Sample Output | 806
Sample Output | 807
Sample Output | 808
Sample Output | 809
Sample Output | 810
Sample Output | 811
Release Information | 811
Syntax
show chassis cluster interfaces
Description
Display the status of the control interface in a chassis cluster configuration.
Required Privilege Level
view
Output Fields
Table 49 on page 804 lists the output fields for the show chassis cluster interfaces command. Outputfields are listed in the approximate order in which they appear.
803

Table 49: show chassis cluster interfaces Output Fields
Field Name Field Description
Control link status State of the chassis cluster control interface: up or down.
Control interfaces • Index—Index number of the chassis cluster control interface.
• Interface—Name of the chassis cluster control interface. The controlinterface names differ based on the routing engine. For RE2, the controlinterfaces are displayed as em0 and em1 and for RE3, the controlinterfaces are displayed as ixlv0 and igb0.
• Monitored-Status—Monitored state of the interface: up or down.
• Internal SA—State of the internal SA option on the chassis cluster controllink: enabled or disabled.
NOTE: This field is available only on SRX5000 line devices.
• Security—State of MACsec on chassis cluster control interfaces.
Fabric link status State of the fabric interface: up or down.
Fabric interfaces • Name—Name of the fabric interface.
• Child-interface—Name of the child fabric interface.
• Status—State of the interface: up or down.
• Security—State of MACsec on chassis cluster fabric interfaces.
Redundant-ethernet Information • Name—Name of the redundant Ethernet interface.
• Status—State of the interface: up or down.
• Redundancy-group—Identification number (1–255) of the redundancy groupassociated with the redundant Ethernet interface.
804

Table 49: show chassis cluster interfaces Output Fields (Continued)
Field Name Field Description
Redundant-pseudo-interfaceInformation
• Name—Name of the redundant pseudointerface.
• Status—State of the redundant pseudointerface: up or down.
• Redundancy-group—Identification number (1–255) of the redundancy groupassociated with the redundant pseudointerface.
Interface Monitoring • Interface—Name of the interface to be monitored.
• Weight—Relative importance of the interface to redundancy groupoperation.
• Status—State of the interface: up or down.
• Redundancy-group—Identification number of the redundancy groupassociated with the interface.
Sample Output
show chassis cluster interfaces (SRX5000 line devices with RE3)
user@host> show chassis cluster interfacesControl link status: Down
Control interfaces: Index Interface Monitored-Status Internal-SA Security 0 ixlv0 Down Enabled Disabled 1 igb0 Down Enabled Disabled
Fabric link status: Down
Fabric interfaces: Name Child-interface Status Security (Physical/Monitored) fab0
805

fab0
Redundant-ethernet Information: Name Status Redundancy-group reth0 Down Not configured reth1 Down Not configured reth2 Down Not configured reth3 Down Not configured reth4 Down Not configured
Redundant-pseudo-interface Information: Name Status Redundancy-group lo0 Up 0
Sample Output
show chassis cluster interfaces (SRX5000 line devices with RE2)
user@host> show chassis cluster interfaces Control link status: Up
Control interfaces: Index Interface Monitored-Status Internal-SA Security 0 em0 Up Disabled Disabled 1 em1 Down Disabled DisabledFabric link status: Up
Fabric interfaces: Name Child-interface Status Security (Physical/Monitored) fab0 xe-1/0/3 Up / Down Disabled fab0 fab1 xe-7/0/3 Up / Down Disabled fab1
Redundant-ethernet Information: Name Status Redundancy-group reth0 Up 1
806

reth1 Up 2 reth2 Down Not configured reth3 Down Not configured reth4 Down Not configured reth5 Down Not configured reth6 Down Not configured reth7 Down Not configured reth8 Down Not configured reth9 Down Not configured reth10 Down Not configured reth11 Down Not configured
Redundant-pseudo-interface Information: Name Status Redundancy-group lo0 Up 1
Interface Monitoring: Interface Weight Status Redundancy-group ge-0/1/9 100 Up 0 ge-0/1/9 100 Up
Sample Output
show chassis cluster interfaces
user@host> show chassis cluster interfaces
The following output is specific to fabric monitoring failure:
Control link status: Up
Control interfaces: Index Interface Monitored-Status Internal-SA Security 0 em0 Up Disabled Disabled
Fabric link status: Down
807

Fabric interfaces: Name Child-interface Status Security (Physical/Monitored) fab0 ge-0/0/2 Down / Down Disabled fab0 fab1 ge-9/0/2 Up / Up Disabled fab1 Redundant-pseudo-interface Information: Name Status Redundancy-group lo0 Up 0
Sample Output
show chassis cluster interfaces (SRX5400, SRX5600, and SRX5800 Devices with SRX5000line SRX5K-SCB3 [SCB3] with Enhanced Midplanes and SRX5K-MPC3-100G10G [IOC3] orSRX5K-MPC3-40G10G [IOC3])
user@host> show chassis cluster interfaces
The following output is specific to SRX5400, SRX5600, and SRX5800 devices in a chassis cluster cluster,when the PICs containing fabric links on the SRX5K-MPC3-40G10G (IOC3) are powered off to turn onalternate PICs. If no alternate fabric links are configured on the PICs that are turned on, RTOsynchronous communication between the two nodes stops and the chassis cluster session state will notback up, because the fabric link is missing.
Control link status: Up Control interfaces: Index Interface Monitored-Status Internal-SA Security 0 em0 Up Disabled Disabled 1 em1 Down Disabled Disabled Fabric link status: Down Fabric interfaces: Name Child-interface Status Security
808

(Physical/Monitored) fab0 <<< fab child missing once PIC off lined Disabled fab0 fab1 xe-10/2/7 Up / Down Disabled fab1 Redundant-ethernet Information: Name Status Redundancy-group reth0 Up Not configured reth1 Down 1 Redundant-pseudo-interface Information: Name Status Redundancy-group lo0 Up 0
Sample Output
show chassis cluster interfaces (vSRX)
user@host> show chassis cluster interfaces
The following output is specific to view control link status with internal SAs.
Control link status: Up
Control interfaces: Index Interface Status Internal SA 305 0 em0 Up enabled 306 1 em1 Down enabled
809

Sample Output
show chassis cluster interfaces (SRX1500 Devices)
user@host> show chassis cluster interfaces
Check chassis cluster control link and fabric link status.
Control link status: Up
Control interfaces: Index Interface Monitored-Status Internal-SA Security 0 em0 Up Disabled Disabled
Fabric link status: Up
Fabric interfaces: Name Child-interface Status Security (Physical/Monitored) fab0 ge-0/0/11 Up / Up Disabled fab0 fab1 ge-7/0/11 Up / Up Disabled fab1
Redundant-ethernet Information: Name Status Redundancy-group reth0 Up 1 reth1 Up 1 reth2 Down Not configured reth3 Down Not configured reth4 Down Not configured
Redundant-pseudo-interface Information: Name Status Redundancy-group lo0 Up 1
Interface Monitoring: Interface Weight Status Redundancy-group (Physical/Monitored) ge-0/0/4 255 Up / Up 1 ge-7/0/4 255 Up / Up 1
810

ge-0/0/2 255 Up / Up 1 ge-7/0/2 255 Up / Up 1
command-name
After you disable control link:
Control link status: Admin Down
Control interfaces: Index Interface Monitored-Status Internal-SA Security0 em0 Down Disabled Disabled
Sample Output
Release Information
Command modified in Junos OS Release 9.0. Output changed to support dual control ports in Junos OSRelease 10.0. Output changed to support control interfaces in Junos OS Release 11.2. Output changedto support redundant pseudo interfaces in Junos OS Release 12.1X44-D10. For SRX5000 line devices,output changed to support the internal security association (SA) option in Junos OS Release 12.1X45-D10. Output changed to support MACsec status on control and fabric interfaces in Junos OS Release15.1X49-D60. For vSRX, output changed to support the internal security association (SA) option inJunos OS Release 19.4R1.
RELATED DOCUMENTATION
cluster (Chassis) | 601
811

show chassis cluster ip-monitoring statusredundancy-group
IN THIS SECTION
Syntax | 812
Description | 812
Options | 812
Required Privilege Level | 813
Output Fields | 813
Sample Output | 814
Sample Output | 815
Release Information | 816
Syntax
show chassis cluster ip-monitoring status <redundancy-group group-number>
Description
Display the status of all monitored IP addresses for a redundancy group.
Options
• none— Display the status of monitored IP addresses for all redundancy groups on the node.
• redundancy-group group-number— Display the status of monitored IP addresses under the specifiedredundancy group.
812

Required Privilege Level
view
Output Fields
Table 50 on page 813 lists the output fields for the show chassis cluster ip-monitoring status command.
Table 50: show chassis cluster ip-monitoring status Output Fields
Field Name Field Description
Redundancy-group ID number (0 - 255) of a redundancy group in the cluster.
Global threshold Failover value for all IP addresses monitored by the redundancy group.
Current threshold Value equal to the global threshold minus the total weight of the unreachableIP address.
IP Address Monitored IP address in the redundancy group.
Status Current reachability state of the monitored IP address.
Values for this field are: reachable, unreachable, and unknown. The status is“unknown” if Packet Forwarding Engines (PFEs) are not yet up and running.
Failure count Number of attempts to reach an IP address.
Reason Explanation for the reported status. See Table 51 on page 814.
Weight Combined weight (0 - 255) assigned to all monitored IP addresses. A higherweight value indicates greater importance.
Expanded reason output fields for unreachable IP addresses added in Junos OS Release 10.1. You mightsee any of the following reasons displayed.
813

Table 51: show chassis cluster ip-monitoring status redundancy group Reason Fields
Reason Reason Description
No route to host The router could not resolve the ARP, which is needed to send the ICMPpacket to the host with the monitored IP address.
No auxiliary IP found The redundant Ethernet interface does not have an auxiliary IP addressconfigured.
Reth child not up A child interface of a redundant Ethernet interface is down.
redundancy-group state unknown Unable to obtain the state (primary, secondary, secondary-hold, disable) of aredundancy-group.
No reth child MAC address Could not extract the MAC address of the redundant Ethernet child interface.
Secondary link not monitored The secondary link might be down (the secondary child interface of aredundant Ethernet interface is either down or non-functional).
Unknown The IP address has just been configured and the router still does not know thestatus of this IP.
or
Do not know the exact reason for the failure.
Sample Output
show chassis cluster ip-monitoring status
user@host> show chassis cluster ip-monitoring status node0:--------------------------------------------------------------------------
Redundancy group: 1Global threshold: 200
814

Current threshold: -120
IP address Status Failure count Reason Weight10.254.5.44 reachable 0 n/a 22010.2.2.1 reachable 0 n/a 100
node1:--------------------------------------------------------------------------
Redundancy group: 1Global threshold: 200Current threshold: -120
IP address Status Failure count Reason Weight10.254.5.44 reachable 0 n/a 22010.2.2.1 reachable 0 n/a 100
Sample Output
show chassis cluster ip-monitoring status redundancy-group
user@host> show chassis cluster ip-monitoring status redundancy-group 1 node0:--------------------------------------------------------------------------
Redundancy group: 1
IP address Status Failure count Reason10.254.5.44 reachable 0 n/a10.2.2.1 reachable 0 n/a10.1.1.5 reachable 0 n/a10.1.1.4 reachable 0 n/a10.1.1.1 reachable 0 n/a
node1:--------------------------------------------------------------------------
Redundancy group: 1
815

IP address Status Failure count Reason10.254.5.44 reachable 0 n/a10.2.2.1 reachable 0 n/a10.1.1.5 reachable 0 n/a10.1.1.4 reachable 0 n/a10.1.1.1 reachable 0 n/a
Release Information
Command introduced in Junos OS Release 9.6. Support.
RELATED DOCUMENTATION
clear chassis cluster failover-count
show chassis cluster statistics
IN THIS SECTION
Syntax | 817
Description | 817
Required Privilege Level | 817
Output Fields | 817
Sample Output | 820
Sample Output | 821
Sample Output | 822
Release Information | 823
816

Syntax
show chassis cluster statistics
Description
This command displays information about chassis cluster services and interfaces.
Required Privilege Level
view
Output Fields
Table 52 on page 818 lists the output fields for the show chassis cluster statistics command. Outputfields are listed in the approximate order in which they appear.
817

Table 52: show chassis cluster statistics Output Fields
Field Name Field Description
Control link statistics Statistics of the control link used by chassis cluster traffic. Statistics for Controllink 1 are displayed when you use dual control links (SRX5000 lines only).Note that the output for the SRX5000 lines will always show Control link 0and Control link 1 statistics, even though only one control link is active orworking.
• Heartbeat packets sent—Number of heartbeat messages sent on thecontrol link.
• Heartbeat packets received—Number of heartbeat messages received onthe control link.
• Heartbeat packet errors—Number of heartbeat packets received witherrors on the control link.
Fabric link statistics Statistics of the fabric link used by chassis cluster traffic. Statistics for ChildLink 1 are displayed when you use dual fabric links.
• Probes sent—Number of probes sent on the fabric link.
• Probes received—Number of probes received on the fabric link.
818

Table 52: show chassis cluster statistics Output Fields (Continued)
Field Name Field Description
Services Synchronized • Service name—Name of the service.
• Rtos sent—Number of runtime objects (RTOs) sent.
• Rtos received—Number of RTOs received.
• Translation context—Messages synchronizing Network Address Translation(NAT) translation context.
• Incoming NAT—Messages synchronizing incoming Network AddressTranslation (NAT) service.
• Resource manager—Messages synchronizing resource manager groups andresources.
• Session create—Messages synchronizing session creation.
• Session close—Messages synchronizing session close.
• Session change—Messages synchronizing session change.
• Gate create—Messages synchronizing creation of pinholes (temporaryopenings in the firewall).
• Session ageout refresh request—Messages synchronizing request sessionafter age-out.
• Session ageout refresh reply—Messages synchronizing reply session afterage-out.
• IPsec VPN—Messages synchronizing VPN session.
• Firewall user authentication—Messages synchronizing firewall userauthentication session.
• MGCP ALG—Messages synchronizing MGCP ALG sessions.
• H323 ALG—Messages synchronizing H.323 ALG sessions.
• SIP ALG—Messages synchronizing SIP ALG sessions.
• SCCP ALG—Messages synchronizing SCCP ALG sessions.
819

Table 52: show chassis cluster statistics Output Fields (Continued)
Field Name Field Description
• PPTP ALG—Messages synchronizing PPTP ALG sessions.
• RTSP ALG—Messages synchronizing RTSP ALG sessions.
• MAC address learning—Messages synchronizing MAC address learning.
Sample Output
show chassis cluster statistics
user@host> show chassis cluster statistics Control link statistics: Control link 0: Heartbeat packets sent: 798 Heartbeat packets received: 784 Heartbeat packets errors: 0Fabric link statistics: Child link 0 Probes sent: 793 Probes received: 0Services Synchronized: Service name RTOs sent RTOs received Translation context 0 0 Incoming NAT 0 0 Resource manager 0 0 Session create 0 0 Session close 0 0 Session change 0 0 Gate create 0 0 Session ageout refresh requests 0 0 Session ageout refresh replies 0 0 IPsec VPN 0 0 Firewall user authentication 0 0 MGCP ALG 0 0 H323 ALG 0 0
820
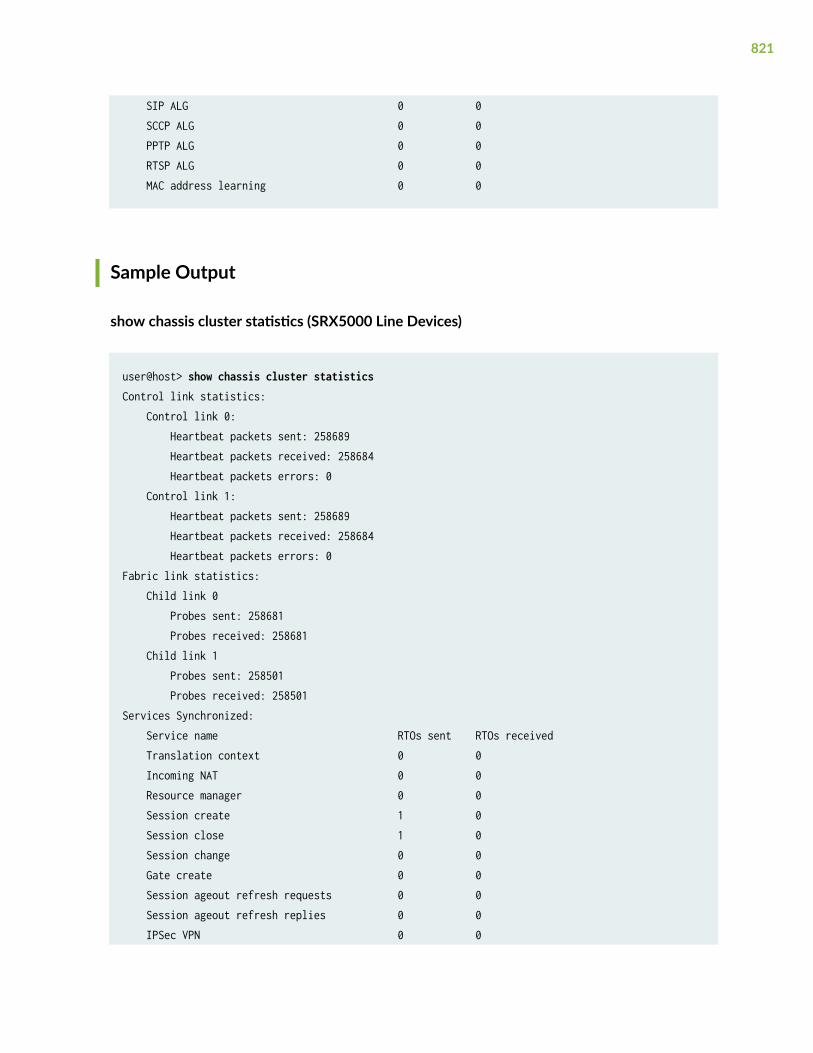
SIP ALG 0 0 SCCP ALG 0 0 PPTP ALG 0 0 RTSP ALG 0 0 MAC address learning 0 0
Sample Output
show chassis cluster statistics (SRX5000 Line Devices)
user@host> show chassis cluster statistics Control link statistics: Control link 0: Heartbeat packets sent: 258689 Heartbeat packets received: 258684 Heartbeat packets errors: 0 Control link 1: Heartbeat packets sent: 258689 Heartbeat packets received: 258684 Heartbeat packets errors: 0Fabric link statistics: Child link 0 Probes sent: 258681 Probes received: 258681 Child link 1 Probes sent: 258501 Probes received: 258501Services Synchronized: Service name RTOs sent RTOs received Translation context 0 0 Incoming NAT 0 0 Resource manager 0 0 Session create 1 0 Session close 1 0 Session change 0 0 Gate create 0 0 Session ageout refresh requests 0 0 Session ageout refresh replies 0 0 IPSec VPN 0 0
821

Firewall user authentication 0 0 MGCP ALG 0 0 H323 ALG 0 0 SIP ALG 0 0 SCCP ALG 0 0 PPTP ALG 0 0 RPC ALG 0 0 RTSP ALG 0 0 RAS ALG 0 0 MAC address learning 0 0 GPRS GTP 0 0
Sample Output
show chassis cluster statistics (SRX5000 Line Devices)
user@host> show chassis cluster statistics Control link statistics: Control link 0: Heartbeat packets sent: 82371 Heartbeat packets received: 82321 Heartbeat packets errors: 0 Control link 1: Heartbeat packets sent: 0 Heartbeat packets received: 0 Heartbeat packets errors: 0Fabric link statistics: Child link 0 Probes sent: 258681 Probes received: 258681 Child link 1 Probes sent: 258501 Probes received: 258501Services Synchronized: Service name RTOs sent RTOs received Translation context 0 0 Incoming NAT 0 0 Resource manager 0 0 Session create 1 0
822

Session close 1 0 Session change 0 0 Gate create 0 0 Session ageout refresh requests 0 0 Session ageout refresh replies 0 0 IPSec VPN 0 0 Firewall user authentication 0 0 MGCP ALG 0 0 H323 ALG 0 0 SIP ALG 0 0 SCCP ALG 0 0 PPTP ALG 0 0 RPC ALG 0 0 RTSP ALG 0 0 RAS ALG 0 0 MAC address learning 0 0 GPRS GTP 0 0
Release Information
Command modified in Junos OS Release 9.0.
Output changed to support dual control ports in Junos OS Release 10.0.
RELATED DOCUMENTATION
clear chassis cluster statistics | 735
show chassis cluster status
IN THIS SECTION
Syntax | 824
Description | 824
823

Options | 824
Required Privilege Level | 824
Output Fields | 825
Sample Output | 826
Sample Output | 827
Sample Output | 827
Release Information | 828
Syntax
show chassis cluster status <redundancy-group group-number >
Description
Display the current status of the Chassis Cluster. You can use this command to check the status ofchassis cluster nodes, redundancy groups, and failover status.
Options
• none—Display the status of all redundancy groups in the chassis cluster.
• redundancy-group group-number—(Optional) Display the status of the specified redundancy group.
Required Privilege Level
view
824

Output Fields
Table 53 on page 825 lists the output fields for the show chassis cluster status command. Output fieldsare listed in the approximate order in which they appear.
Table 53: show chassis cluster status Output Fields
Field Name Field Description
Cluster ID ID number (1-15) of a cluster is applicable for releases upto Junos OS Release12.1X45-D10. ID number (1-255) is applicable for Releases 12.1X45-D10 andlater. Setting a cluster ID to 0 is equivalent to disabling a cluster.
Redundancy-Group You can create up to 128 redundancy groups in the chassis cluster.
Node name Node (device) in the chassis cluster (node0 or node1).
Priority Assigned priority for the redundancy group on that node.
Status State of the redundancy group (Primary, Secondary, Lost, or Unavailable).
• Primary—Redundancy group is active and passing traffic.
• Secondary—Redundancy group is passive and not passing traffic.
• Lost—Node loses contact with the other node through the control link.Most likely to occur when both nodes are in a cluster and there is a controllink failure, one node cannot exchange heartbeats, or when the other nodeis rebooted.
• Unavailable—Node has not received a single heartbeat over the control linkfrom the other node since the other node booted up. Most likely to occurwhen one node boots up before the other node, or if only one node ispresent in the cluster.
Preempt • Yes: Primary state can be preempted based on priority.
• No: Change in priority will not preempt the primary state.
825

Table 53: show chassis cluster status Output Fields (Continued)
Field Name Field Description
Manual failover • Yes: Primary state is set manually through the CLI with the request chassiscluster failover node or request chassis cluster failover redundancy-groupcommand. This overrides Priority and Preempt.
• No: Primary state is not set manually through the CLI.
Monitor-failures • None: Cluster working properly.
• Monitor Failure code: Cluster is not working properly and the respectivefailure code is displayed.
Sample Output
show chassis cluster status
user@host> show chassis cluster status
Monitor Failure codes: CS Cold Sync monitoring FL Fabric Connection monitoring GR GRES monitoring HW Hardware monitoring IF Interface monitoring IP IP monitoring LB Loopback monitoring MB Mbuf monitoring NH Nexthop monitoring NP NPC monitoring SP SPU monitoring SM Schedule monitoring CF Config Sync monitoring
Cluster ID: 1Node Priority Status Preempt Manual Monitor-failures
Redundancy group: 0 , Failover count: 1node0 200 primary no no Nonenode1 1 secondary no no None
Redundancy group: 1 , Failover count: 1
826

node0 101 primary no no Nonenode1 1 secondary no no None
Sample Output
show chassis cluster status with preemptive delay
user@host> show chassis cluster status
Cluster ID: 1Node Priority Status Preempt Manual Monitor-failuresRedundancy group: 0, Failover count: 1node0 200 primary no no Nonenode1 100 secondary no no NoneRedundancy group: 1, Failover count: 3node0 200 primary-preempt-hold yes no None node1 100 secondary yes no None
Sample Output
show chassis cluster status redundancy-group 1
user@host> show chassis cluster status redundancy-group 1
Monitor Failure codes: CS Cold Sync monitoring FL Fabric Connection monitoring GR GRES monitoring HW Hardware monitoring IF Interface monitoring IP IP monitoring LB Loopback monitoring MB Mbuf monitoring NH Nexthop monitoring NP NPC monitoring SP SPU monitoring SM Schedule monitoring CF Config Sync monitoring
Cluster ID: 1Node Priority Status Preempt Manual Monitor-failures
827

Redundancy group: 1 , Failover count: 1node0 101 primary no no Nonenode1 1 secondary no no None
Release Information
Support for monitoring failures added in Junos OS Release 12.1X47-D10.
RELATED DOCUMENTATION
redundancy-group (Chassis Cluster)
clear chassis cluster failover-count
request chassis cluster failover node
request chassis cluster failover reset
show chassis environment (Security)
IN THIS SECTION
Syntax | 829
Description | 829
Options | 829
Required Privilege Level | 829
Output Fields | 830
Sample Output | 830
Release Information | 836
828

Syntax
show chassis environment
Description
Display environmental information about the services gateway chassis, including the temperature andinformation about the fans, power supplies, and Routing Engine.
Options
none Display environmental information about the device.
cb slot-number Display chassis environmental information for the Control Board.
fpc fpc-slot Display chassis environmental information for a specified Flexible PICConcentrator.
fpm Display chassis environmental information for the craft interface (FPM).
node Display node specific chassis information.
pem slot-number Display chassis environmental information for the specified Power EntryModule.
routing-engine slot-number
Display chassis environmental information for the specified Routing Engine.
Required Privilege Level
view
829

Output Fields
Table 54 on page 830 lists the output fields for the show chassis environment command. Output fields arelisted in the approximate order in which they appear.
Table 54: show chassis environment Output Fields
Field Name Field Description
Temp Temperature of air flowing through the chassis in degrees Celsius (C) and Fahrenheit (F).
Fan Fan status: OK, Testing (during initial power-on), Failed, or Absent.
Sample Output
show chassis environment
user@host> show chassis environmentuser@host> show chassis environmentClass Item Status MeasurementTemp PEM 0 OK 40 degrees C / 104 degrees F PEM 1 OK 40 degrees C / 104 degrees F PEM 2 OK 40 degrees C / 104 degrees F PEM 3 OK 45 degrees C / 113 degrees F Routing Engine 0 OK 31 degrees C / 87 degrees F Routing Engine 0 CPU OK 27 degrees C / 80 degrees F Routing Engine 1 Absent Routing Engine 1 CPU Absent CB 0 Intake OK 28 degrees C / 82 degrees F CB 0 Exhaust A OK 27 degrees C / 80 degrees F CB 0 Exhaust B OK 29 degrees C / 84 degrees F CB 0 ACBC OK 29 degrees C / 84 degrees F CB 0 SF A OK 36 degrees C / 96 degrees F CB 0 SF B OK 31 degrees C / 87 degrees F CB 1 Intake OK 27 degrees C / 80 degrees F CB 1 Exhaust A OK 26 degrees C / 78 degrees F CB 1 Exhaust B OK 29 degrees C / 84 degrees F
830

CB 1 ACBC OK 27 degrees C / 80 degrees F CB 1 SF A OK 36 degrees C / 96 degrees F CB 1 SF B OK 31 degrees C / 87 degrees F CB 2 Intake Absent CB 2 Exhaust A Absent CB 2 Exhaust B Absent CB 2 ACBC Absent CB 2 XF A Absent CB 2 XF B Absent FPC 0 Intake OK 47 degrees C / 116 degrees F FPC 0 Exhaust A OK 44 degrees C / 111 degrees F FPC 0 Exhaust B OK 52 degrees C / 125 degrees F FPC 0 xlp0 TSen OK 51 degrees C / 123 degrees F FPC 0 xlp0 Chip OK 46 degrees C / 114 degrees F FPC 0 xlp1 TSen OK 51 degrees C / 123 degrees F FPC 0 xlp1 Chip OK 47 degrees C / 116 degrees F FPC 0 xlp2 TSen OK 44 degrees C / 111 degrees F FPC 0 xlp2 Chip OK 42 degrees C / 107 degrees F FPC 0 xlp3 TSen OK 48 degrees C / 118 degrees F FPC 0 xlp3 Chip OK 43 degrees C / 109 degrees F FPC 1 Intake OK 41 degrees C / 105 degrees F FPC 1 Exhaust A OK 41 degrees C / 105 degrees F FPC 1 Exhaust B OK 51 degrees C / 123 degrees F FPC 1 LU TSen OK 46 degrees C / 114 degrees F FPC 1 LU Chip OK 45 degrees C / 113 degrees F FPC 1 XM TSen OK 46 degrees C / 114 degrees F FPC 1 XM Chip OK 52 degrees C / 125 degrees F FPC 1 xlp0 TSen OK 49 degrees C / 120 degrees F FPC 1 xlp0 Chip OK 42 degrees C / 107 degrees F FPC 1 xlp1 TSen OK 49 degrees C / 120 degrees F FPC 1 xlp1 Chip OK 44 degrees C / 111 degrees F FPC 1 xlp2 TSen OK 38 degrees C / 100 degrees F FPC 1 xlp2 Chip OK 39 degrees C / 102 degrees F FPC 1 xlp3 TSen OK 44 degrees C / 111 degrees F FPC 1 xlp3 Chip OK 42 degrees C / 107 degrees F FPC 2 Intake OK 29 degrees C / 84 degrees F FPC 2 Exhaust A OK 34 degrees C / 93 degrees F FPC 2 Exhaust B OK 40 degrees C / 104 degrees F FPC 2 I3 0 TSensor OK 42 degrees C / 107 degrees F FPC 2 I3 0 Chip OK 41 degrees C / 105 degrees F FPC 2 I3 1 TSensor OK 40 degrees C / 104 degrees F FPC 2 I3 1 Chip OK 39 degrees C / 102 degrees F FPC 2 I3 2 TSensor OK 38 degrees C / 100 degrees F
831

FPC 2 I3 2 Chip OK 37 degrees C / 98 degrees F FPC 2 I3 3 TSensor OK 35 degrees C / 95 degrees F FPC 2 I3 3 Chip OK 35 degrees C / 95 degrees F FPC 2 IA 0 TSensor OK 45 degrees C / 113 degrees F FPC 2 IA 0 Chip OK 42 degrees C / 107 degrees F FPC 2 IA 1 TSensor OK 41 degrees C / 105 degrees F FPC 2 IA 1 Chip OK 43 degrees C / 109 degrees F FPC 9 Intake OK 29 degrees C / 84 degrees F FPC 9 Exhaust A OK 41 degrees C / 105 degrees F FPC 9 Exhaust B OK 48 degrees C / 118 degrees F FPC 9 LU TSen OK 48 degrees C / 118 degrees F FPC 9 LU Chip OK 47 degrees C / 116 degrees F FPC 9 XM TSen OK 48 degrees C / 118 degrees F FPC 9 XM Chip OK 54 degrees C / 129 degrees F FPC 9 xlp0 TSen OK 45 degrees C / 113 degrees F FPC 9 xlp0 Chip OK 42 degrees C / 107 degrees F FPC 9 xlp1 TSen OK 49 degrees C / 120 degrees F FPC 9 xlp1 Chip OK 46 degrees C / 114 degrees F FPC 9 xlp2 TSen OK 37 degrees C / 98 degrees F FPC 9 xlp2 Chip OK 40 degrees C / 104 degrees F FPC 9 xlp3 TSen OK 45 degrees C / 113 degrees F FPC 9 xlp3 Chip OK 41 degrees C / 105 degrees F FPC 10 Intake OK 32 degrees C / 89 degrees F FPC 10 Exhaust A OK 44 degrees C / 111 degrees F FPC 10 Exhaust B OK 53 degrees C / 127 degrees F FPC 10 LU 0 TSen OK 43 degrees C / 109 degrees F FPC 10 LU 0 Chip OK 52 degrees C / 125 degrees F FPC 10 LU 1 TSen OK 43 degrees C / 109 degrees F FPC 10 LU 1 Chip OK 44 degrees C / 111 degrees F FPC 10 LU 2 TSen OK 43 degrees C / 109 degrees F FPC 10 LU 2 Chip OK 50 degrees C / 122 degrees F FPC 10 LU 3 TSen OK 43 degrees C / 109 degrees F FPC 10 LU 3 Chip OK 58 degrees C / 136 degrees F FPC 10 XM 0 TSen OK 43 degrees C / 109 degrees F FPC 10 XM 0 Chip OK 53 degrees C / 127 degrees F FPC 10 XF 0 TSen OK 43 degrees C / 109 degrees F FPC 10 XF 0 Chip OK 64 degrees C / 147 degrees F FPC 10 PLX Switch TSen OK 43 degrees C / 109 degrees F FPC 10 PLX Switch Chip OK 44 degrees C / 111 degrees F FPC 11 Intake OK 32 degrees C / 89 degrees F FPC 11 Exhaust A OK 41 degrees C / 105 degrees F FPC 11 Exhaust B OK 56 degrees C / 132 degrees F FPC 11 LU 0 TSen OK 45 degrees C / 113 degrees F
832

FPC 11 LU 0 Chip OK 50 degrees C / 122 degrees F FPC 11 LU 1 TSen OK 45 degrees C / 113 degrees F FPC 11 LU 1 Chip OK 47 degrees C / 116 degrees F FPC 11 LU 2 TSen OK 45 degrees C / 113 degrees F FPC 11 LU 2 Chip OK 52 degrees C / 125 degrees F FPC 11 LU 3 TSen OK 45 degrees C / 113 degrees F FPC 11 LU 3 Chip OK 60 degrees C / 140 degrees F FPC 11 XM 0 TSen OK 45 degrees C / 113 degrees F FPC 11 XM 0 Chip OK 56 degrees C / 132 degrees F FPC 11 XF 0 TSen OK 45 degrees C / 113 degrees F FPC 11 XF 0 Chip OK 65 degrees C / 149 degrees F FPC 11 PLX Switch TSen OK 45 degrees C / 113 degrees F FPC 11 PLX Switch Chip OK 46 degrees C / 114 degrees FFans Top Fan Tray Temp OK 34 degrees C / 93 degrees F Top Tray Fan 1 OK Spinning at normal speed Top Tray Fan 2 OK Spinning at normal speed Top Tray Fan 3 OK Spinning at normal speed Top Tray Fan 4 OK Spinning at normal speed Top Tray Fan 5 OK Spinning at normal speed Top Tray Fan 6 OK Spinning at normal speed Top Tray Fan 7 OK Spinning at normal speed Top Tray Fan 8 OK Spinning at normal speed Top Tray Fan 9 OK Spinning at normal speed Top Tray Fan 10 OK Spinning at normal speed Top Tray Fan 11 OK Spinning at normal speed Top Tray Fan 12 OK Spinning at normal speed Bottom Fan Tray Temp OK 31 degrees C / 87 degrees F Bottom Tray Fan 1 OK Spinning at normal speed Bottom Tray Fan 2 OK Spinning at normal speed Bottom Tray Fan 3 OK Spinning at normal speed Bottom Tray Fan 4 OK Spinning at normal speed Bottom Tray Fan 5 OK Spinning at normal speed Bottom Tray Fan 6 OK Spinning at normal speed Bottom Tray Fan 7 OK Spinning at normal speed Bottom Tray Fan 8 OK Spinning at normal speed Bottom Tray Fan 9 OK Spinning at normal speed Bottom Tray Fan 10 OK Spinning at normal speed Bottom Tray Fan 11 OK Spinning at normal speed Bottom Tray Fan 12 OK Spinning at normal speed OK
833

When you enter the show chassis environment pem command, the sample output is shown for DCPEM.
user@host> show chassis environment pemnode0:--------------------------------------------------------------------------PEM 0 status: State Online Temperature OK DC Input: OK DC Output Voltage(V) Current(A) Power(W) Load(%) 50 12 600 24 PEM 1 status: State Online Temperature OK DC Input: OK DC Output Voltage(V) Current(A) Power(W) Load(%) 50 31 1550 63
node1:--------------------------------------------------------------------------PEM 0 status: State Online Temperature OK DC Input: OK DC Output Voltage(V) Current(A) Power(W) Load(%) 50 12 600 24 PEM 1 status: State Online Temperature OK DC Input: OK DC Output Voltage(V) Current(A) Power(W) Load(%) 49 31 1519 62
show chassis environment fpc (SRX5800, SRX5400, and SRX5600)
user@host> show chassis environment fpcFPC 1 status: State Online
834

Temperature Intake 34 degrees C / 93 degrees F Temperature Exhaust A 48 degrees C / 118 degrees F Temperature Exhaust B 48 degrees C / 118 degrees F Temperature CPU0 DTS 55 degrees C / 131 degrees F Temperature CPU1 DTS 60 degrees C / 140 degrees F Temperature CPU2 DTS 54 degrees C / 129 degrees F Temperature CPU3 DTS 70 degrees C / 158 degrees F Temperature Talus 0 106 degrees C / 222 degrees F Temperature Middle 0 40 degrees C / 104 degrees F Temperature Talus 1 76 degrees C / 168 degrees F Temperature Middle 1 67 degrees C / 152 degrees F Power TALUS0-1.20V 1199 mV 14187 mA 17010 mW TALUS0-0.90V 900 mV 5000 mA 4500 mW BIAS0-3.30V 3299 mV 3769 mA 12433 mW PIC0_CPU_memory_CD-1.20 1199 mV 3781 mA 4533 mW USB0-5.00V 5000 mV 155 mA 775 mW PIC0_CPU_memory_AB-1.20 1200 mV 5820 mA 6984 mW PCH0-1.05V 1050 mV 3582 mA 3761 mW TALUS1-1.20V 1199 mV 13640 mA 16354 mW TALUS1-0.90V 899 mV 4679 mA 4206 mW BIAS1-3.30V 3300 mV 3175 mA 10477 mW PIC1_CPU_memory_GH-1.20 1200 mV 4648 mA 5577 mW USB1-5.00V 4999 mV 346 mA 1729 mW PIC1_CPU_memory_EF-1.20 1200 mV 5218 mA 6261 mW PCH1-1.05V 1050 mV 3328 mA 3494 mW TPS53641-CPU0 1750 mV 46062 mA 80608 mW TPS53641-CPU1 1739 mV 47437 mA 82492 mW TPS53641-CPU2 1750 mV 45250 mA 79187 mW TPS53641-CPU3 1739 mV 46875 mA 81515 mW ETH-1.00V 994 mV 2674 mA 2657 mW TALUS0_Core-0.85V 849 mV 37750 mA 32049 mW TALUS1_Core-0.85V 849 mV 26750 mA 22710 mW Power_Brick1-12.00V 12001 mV 21000 mA 252021 mW Power_Brick2-12.00V 11998 mV 23125 mA 277453 mW PIM4820_48V0-48.00V 58392 mV 10286 mA 600620 mW I2C Slave Revision 0
835

Release Information
Command introduced in Junos OS Release 9.2.
RELATED DOCUMENTATION
show chassis hardware (View) | 862
show chassis environment cb
IN THIS SECTION
Syntax | 836
Description | 836
Options | 837
Required Privilege Level | 837
Output Fields | 837
Sample Output | 838
Release Information | 840
Syntax
show chassis environment cb <slot>
Description
Display environmental information about the Control Boards (CBs) installed on SRX Series devices.
836

Options
slot (Optional) Display environmental information about the specified CB.
Required Privilege Level
view
Output Fields
Table 55 on page 837 lists the output fields for the show chassis environment cb command. Outputfields are listed in the approximate order in which they appear.
Table 55: show chassis environment cb Output Fields
Field Name Field Description
State Status of the CB. If two CBs are installed and online, one is functioning as the primary, andthe other is the standby.
• Online—CB is online and running.
• Offline— CB is powered down.
Temperature Temperature in Celsius (C) and Fahrenheit (F) of the air flowing past the CB.
• Temperature Intake—Measures the temperature of the air intake to cool the powersupplies.
• Temperature Exhaust—Measures the temperature of the hot air exhaust.
Power Power required and measured on the CB. The left column displays the required power, involts. The right column displays the measured power, in millivolts.
BUS Revision Revision level of the generic bus device.
837

Table 55: show chassis environment cb Output Fields (Continued)
Field Name Field Description
FPGA Revision Revision level of the field-programmable gate array (FPGA).
PMBus device Enhanced SCB on SRX Series devices allows the system to save power by supplying only theamount of voltage that is required. Configurable PMBus devices are used to provide thevoltage for each individual device. There is one PMBus device for each XF ASIC so that theoutput can be customized to each device. The following PMBus device information isdisplayed for devices with Enhanced MX SCB:
• Expected voltage
• Measured voltage
• Measured current
• Calculated power
Sample Output
show chassis environment cb (SRX5600 devices with SRX5K-SCB3 [SCB3] and EnhancedMidplanes)
user@host> show chassis environment cb node 0node0:----------------------------------------------------------------------------------------------------------------------------------------------------CB 0 status: State Online Master Temperature 34 degrees C / 93 degrees F Power 1 1.0 V 1002 1.2 V 1198 1.5 V 1501 1.8 V 1801 2.5 V 2507 3.3 V 3300
838

5.0 V 5014 5.0 V RE 4982 12.0 V 11988 12.0 V RE 11930 Power 2 4.6 V bias MidPlane 4801 11.3 V bias PEM 11292 11.3 V bias FPD 11272 11.3 V bias POE 0 11214 11.3 V bias POE 1 11253 Bus Revision 96 FPGA Revision 16 PMBus Expected Measured Measured Calculated device voltage voltage current power XF ASIC A 1033 mV 1033 mV 15500 mA 16011 mW XF ASIC B 1034 mV 1033 mV 15000 mA 15495 mW
show chassis environment cb node 1 (SRX5600 devices with SRX5K-SCB3 [SCB3] andEnhanced Midplanes)
user@host> show chassis environment cb node 1node1:--------------------------------------------------------------------------CB 0 status: State Online Master Temperature 35 degrees C / 95 degrees F Power 1 1.0 V 1002 1.2 V 1198 1.5 V 1504 1.8 V 1801 2.5 V 2507 3.3 V 3325 5.0 V 5014 5.0 V RE 4943 12.0 V 12007 12.0 V RE 12007 Power 2 4.6 V bias MidPlane 4814 11.3 V bias PEM 11272 11.3 V bias FPD 11330
839

11.3 V bias POE 0 11176 11.3 V bias POE 1 11292 Bus Revision 96 FPGA Revision 16 PMBus Expected Measured Measured Calculated device voltage voltage current power XF ASIC A 958 mV 959 mV 13500 mA 12946 mW XF ASIC B 1033 mV 1031 mV 16500 mA 17011 mW
Release Information
Command introduced in Junos OS Release 9.2.
Starting with Junos OS Release 12.1X47-D15, the SRX5K-SCBE (SCB2) is introduced and starting withJunos OS Release 15.1X49-D10, the SRX5K-SCB3 (SCB3) with enhanced midplane is introduced.
RELATED DOCUMENTATION
request chassis cb | 736
show chassis ethernet-switch
IN THIS SECTION
Syntax | 841
Description | 841
Required Privilege Level | 841
Output Fields | 841
Sample Output | 842
Release Information | 847
840
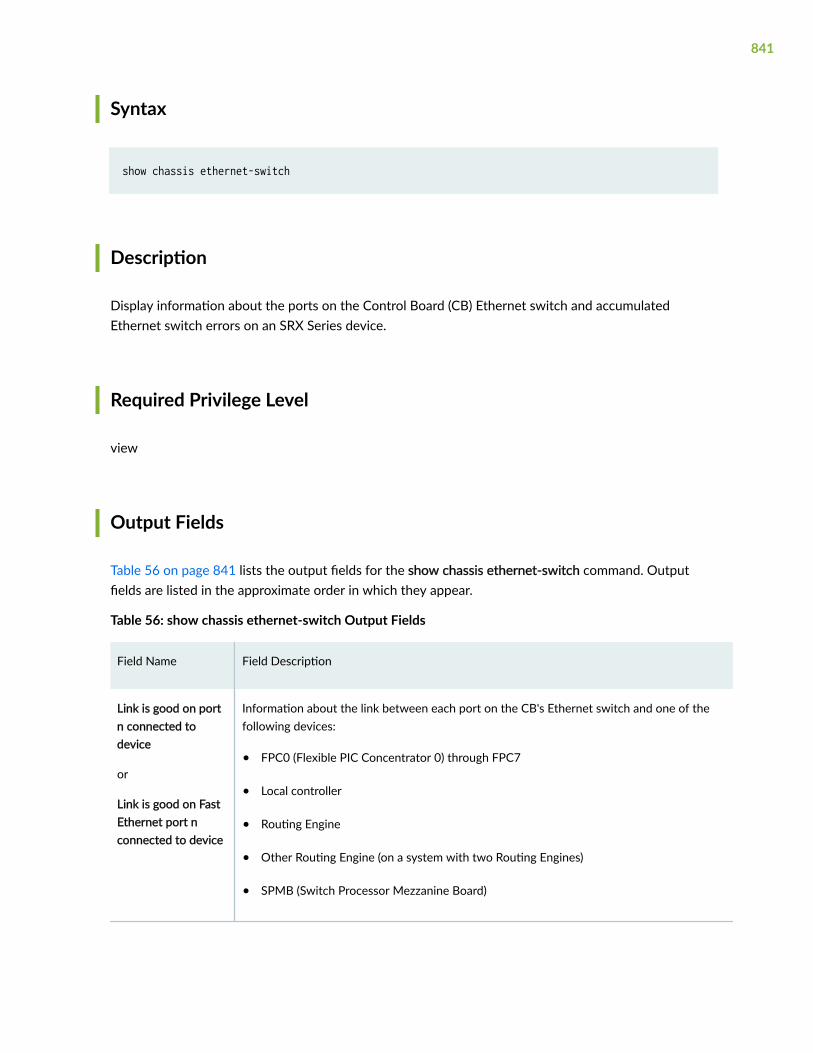
Syntax
show chassis ethernet-switch
Description
Display information about the ports on the Control Board (CB) Ethernet switch and accumulatedEthernet switch errors on an SRX Series device.
Required Privilege Level
view
Output Fields
Table 56 on page 841 lists the output fields for the show chassis ethernet-switch command. Outputfields are listed in the approximate order in which they appear.
Table 56: show chassis ethernet-switch Output Fields
Field Name Field Description
Link is good on portn connected todevice
or
Link is good on FastEthernet port nconnected to device
Information about the link between each port on the CB's Ethernet switch and one of thefollowing devices:
• FPC0 (Flexible PIC Concentrator 0) through FPC7
• Local controller
• Routing Engine
• Other Routing Engine (on a system with two Routing Engines)
• SPMB (Switch Processor Mezzanine Board)
841

Table 56: show chassis ethernet-switch Output Fields (Continued)
Field Name Field Description
Speed is Speed at which the Ethernet link is running.
Duplex is Duplex type of the Ethernet link: full or half.
Autonegotiate isEnabled (orDisabled)
By default, built-in Fast Ethernet ports on a PIC autonegotiate whether to operate at 10Mbps or 100 Mbps. All other interfaces automatically choose the correct speed based onthe PIC type and whether the PIC is configured to operate in multiplexed mode.
Sample Output
show chassis ethernet-switch
user@host> show chassis ethernet-switchnode0:--------------------------------------------------------------------------Displaying summary for switch 0Link is good on GE port 0 connected to device: FPC0 Speed is 1000Mb Duplex is full Autonegotiate is Enabled Flow Control TX is Disabled Flow Control RX is Disabled
Link is good on GE port 1 connected to device: FPC1 Speed is 1000Mb Duplex is full Autonegotiate is Enabled Flow Control TX is Disabled Flow Control RX is Disabled
Link is good on GE port 2 connected to device: FPC2 Speed is 1000Mb Duplex is full
842

Autonegotiate is Enabled Flow Control TX is Disabled Flow Control RX is Disabled
Link is good on GE port 3 connected to device: FPC3 Speed is 1000Mb Duplex is full Autonegotiate is Enabled Flow Control TX is Disabled Flow Control RX is Disabled
Link is good on GE port 4 connected to device: FPC4 Speed is 1000Mb Duplex is full Autonegotiate is Enabled Flow Control TX is Disabled Flow Control RX is Disabled
Link is down on GE port 5 connected to device: FPC5
Link is down on GE port 6 connected to device: FPC6
Link is good on GE port 7 connected to device: FPC7 Speed is 1000Mb Duplex is full Autonegotiate is Enabled Flow Control TX is Disabled Flow Control RX is Disabled
Link is good on GE port 8 connected to device: FPC8 Speed is 1000Mb Duplex is full Autonegotiate is Enabled Flow Control TX is Disabled Flow Control RX is Disabled
Link is good on GE port 9 connected to device: FPC9 Speed is 1000Mb Duplex is full Autonegotiate is Enabled Flow Control TX is Disabled Flow Control RX is Disabled
843

Link is down on GE port 10 connected to device: FPC10
Link is down on GE port 11 connected to device: FPC11
Link is good on GE port 12 connected to device: Other RE Speed is 1000Mb Duplex is full Autonegotiate is Enabled Flow Control TX is Disabled Flow Control RX is Disabled
Link is good on GE port 13 connected to device: RE-GigE Speed is 1000Mb Duplex is full Autonegotiate is Enabled Flow Control TX is Disabled Flow Control RX is Disabled
Link is down on GE port 14 connected to device: Debug-GigE
node1:--------------------------------------------------------------------------Displaying summary for switch 0Link is good on GE port 0 connected to device: FPC0 Speed is 1000Mb Duplex is full Autonegotiate is Enabled Flow Control TX is Disabled Flow Control RX is Disabled
Link is good on GE port 1 connected to device: FPC1 Speed is 1000Mb Duplex is full Autonegotiate is Enabled Flow Control TX is Disabled Flow Control RX is Disabled
Link is good on GE port 2 connected to device: FPC2 Speed is 1000Mb Duplex is full Autonegotiate is Enabled Flow Control TX is Disabled Flow Control RX is Disabled
844

Link is good on GE port 3 connected to device: FPC3 Speed is 1000Mb Duplex is full Autonegotiate is Enabled Flow Control TX is Disabled Flow Control RX is Disabled
Link is good on GE port 4 connected to device: FPC4 Speed is 1000Mb Duplex is full Autonegotiate is Enabled Flow Control TX is Disabled Flow Control RX is Disabled
Link is down on GE port 5 connected to device: FPC5
Link is down on GE port 6 connected to device: FPC6
Link is good on GE port 7 connected to device: FPC7 Speed is 1000Mb Duplex is full Autonegotiate is Enabled Flow Control TX is Disabled Flow Control RX is Disabled
Link is good on GE port 8 connected to device: FPC8 Speed is 1000Mb Duplex is full Autonegotiate is Enabled Flow Control TX is Disabled Flow Control RX is Disabled
Link is good on GE port 9 connected to device: FPC9 Speed is 1000Mb Duplex is full Autonegotiate is Enabled Flow Control TX is Disabled Flow Control RX is Disabled
Link is down on GE port 10 connected to device: FPC10
Link is down on GE port 11 connected to device: FPC11
845
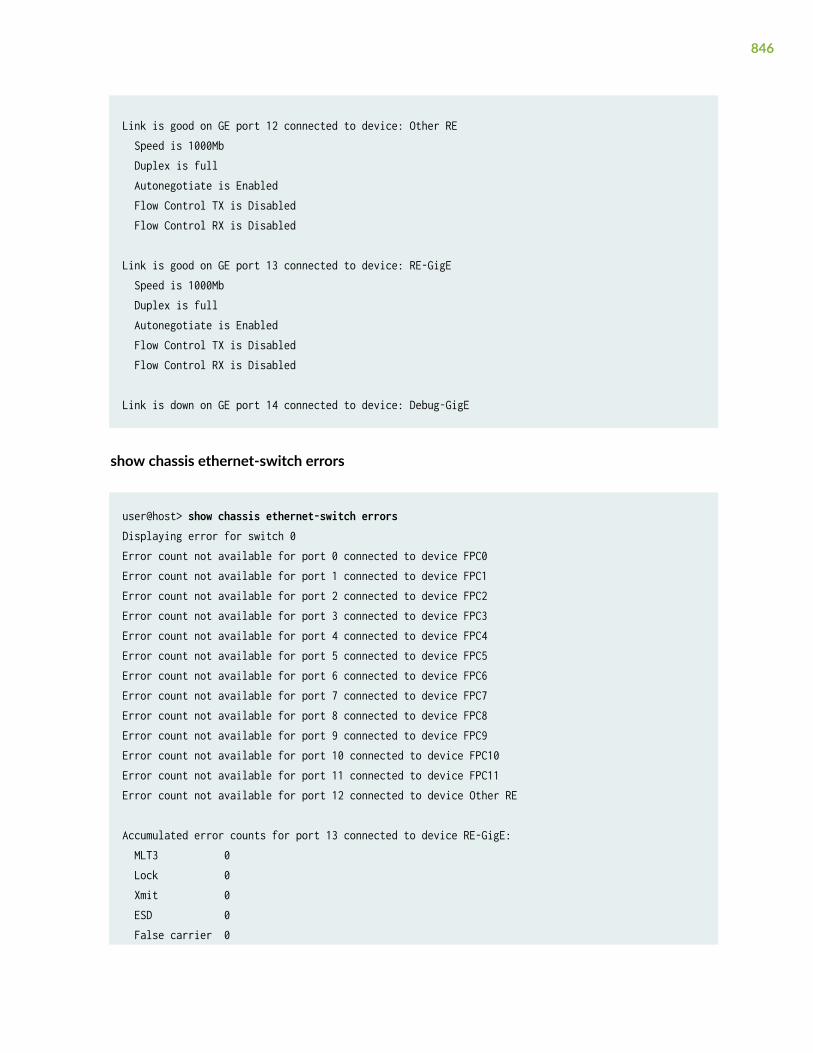
Link is good on GE port 12 connected to device: Other RE Speed is 1000Mb Duplex is full Autonegotiate is Enabled Flow Control TX is Disabled Flow Control RX is Disabled
Link is good on GE port 13 connected to device: RE-GigE Speed is 1000Mb Duplex is full Autonegotiate is Enabled Flow Control TX is Disabled Flow Control RX is Disabled
Link is down on GE port 14 connected to device: Debug-GigE
show chassis ethernet-switch errors
user@host> show chassis ethernet-switch errorsDisplaying error for switch 0Error count not available for port 0 connected to device FPC0Error count not available for port 1 connected to device FPC1Error count not available for port 2 connected to device FPC2Error count not available for port 3 connected to device FPC3Error count not available for port 4 connected to device FPC4Error count not available for port 5 connected to device FPC5Error count not available for port 6 connected to device FPC6Error count not available for port 7 connected to device FPC7Error count not available for port 8 connected to device FPC8Error count not available for port 9 connected to device FPC9Error count not available for port 10 connected to device FPC10Error count not available for port 11 connected to device FPC11Error count not available for port 12 connected to device Other RE
Accumulated error counts for port 13 connected to device RE-GigE: MLT3 0 Lock 0 Xmit 0 ESD 0 False carrier 0
846

Disconnects 0 FX mode 0Accumulated error counts for port 14 connected to device Debug-GigE: MLT3 0 Lock 0 Xmit 0 ESD 0 False carrier 0 Disconnects 0 FX mode 0Error count not available for port 15 connected to device NothingError count not available for port 16 connected to device NothingError count not available for port 17 connected to device Debug-GigEError count not available for port 18 connected to device NothingError count not available for port 19 connected to device NothingError count not available for port 20 connected to device NothingError count not available for port 21 connected to device NothingError count not available for port 22 connected to device NothingError count not available for port 23 connected to device NothingError count not available for port 24 connected to device External-Ethernet
Release Information
Command introduced in Junos OS Release 9.2.
show chassis fabric plane
IN THIS SECTION
Syntax | 848
Description | 848
Required Privilege Level | 848
Output Fields | 848
Sample Output | 851
847

Release Information | 856
Syntax
show chassis fabric plane
Description
Show state of fabric management plane.
Required Privilege Level
view
Output Fields
Table 57 on page 848 lists the output fields for the show chassis fabric plane command. Output fieldsare listed in the approximate order in which they appear.
Table 57: show chassis fabric plane Output Fields
Field Name Field Description Level of output
Plane Number of the plane. none
848

Table 57: show chassis fabric plane Output Fields (Continued)
Field Name Field Description Level of output
Plane state State of each plane:
• ACTIVE—SIB is operational and running.
• FAULTY— SIB is in alarmed state where the SIB’s plane isnot operational for the following reasons:
• On-board fabric ASIC is not operational.
• Fiber-optic connector faults.
• FPC connector faults.
• SIB midplane connector faults.
none
FPC Slot number of each Flexible PIC Concentrator (FPC). none
PFE Slot number of each Packet Forwarding Engine and the stateof the links to the FPC:
• Links ok: Link between SIB and FPC is active.
• Link error: Link between SIB and FPC is not operational.
• Unused: No FPC is present.
none
849

Table 57: show chassis fabric plane Output Fields (Continued)
Field Name Field Description Level of output
State State of the fabric plane:
• Online: Fabric plane is operational and running and linkson the SIB are operational.
• Offline: Fabric plane state is Offline because the planedoes not have four or more F2S and one F13 online.
• Empty: Fabric plane state is Empty if all SIBs in the planeare absent.
• Spare: Fabric plane is redundant and can be operational ifthe operational fabric plane encounters an error.
• Check: Fabric plane is in alarmed state due to thefollowing reason and the cause of the error must beresolved:
• One or more SIBs (belonging to the fabric plane) inthe Online or Spare states has transitioned to theCheck state.
Check state of the SIB can be caused by link errors ordestination errors.
• Fault: Fabric plane is in alarmed state if one or more SIBsbelonging to the plane are in the Fault state. A SIB can bein the Fault state because of the following reasons:
• On-board fabric ASIC is not operational.
• Fiber-optic connector faults.
• FPC connector faults.
• SIB midplane connector faults.
• Link errors have exceeded the threshold.
none
850

Sample Output
show chassis fabric plane (SRX5600 and SRX5800 Devices with SRX5000 Line SCB II[SRX5K-SCBE] and SRX5K-RE-1800X4)
user@host> show chassis fabric planenode0:--------------------------------------------------------------------------Fabric management PLANE statePlane 0 Plane state: ACTIVE FPC 0 PFE 0 :Links ok FPC 2 PFE 0 :Links ok FPC 3 PFE 0 :Links ok FPC 4 PFE 0 :Links ok FPC 7 PFE 0 :Links ok FPC 8 PFE 0 :Links ok FPC 9 PFE 0 :Links ok FPC 10 PFE 0 :Links okPlane 1 Plane state: ACTIVE FPC 0 PFE 0 :Links ok FPC 2 PFE 0 :Links ok FPC 3 PFE 0 :Links ok FPC 4 PFE 0 :Links ok FPC 7 PFE 0 :Links ok FPC 8 PFE 0 :Links ok
851

FPC 9 PFE 0 :Links ok FPC 10 PFE 0 :Links okPlane 2 Plane state: ACTIVE FPC 0 PFE 0 :Links ok FPC 2 PFE 0 :Links ok FPC 3 PFE 0 :Links ok FPC 4 PFE 0 :Links ok FPC 7 PFE 0 :Links ok FPC 8 PFE 0 :Links ok FPC 9 PFE 0 :Links ok FPC 10 PFE 0 :Links okPlane 3 Plane state: ACTIVE FPC 0 PFE 0 :Links ok FPC 2 PFE 0 :Links ok FPC 3 PFE 0 :Links ok FPC 4 PFE 0 :Links ok FPC 7 PFE 0 :Links ok FPC 8 PFE 0 :Links ok FPC 9 PFE 0 :Links ok FPC 10 PFE 0 :Links okPlane 4 Plane state: SPARE FPC 0
852

PFE 0 :Links ok FPC 2 PFE 0 :Links ok FPC 3 PFE 0 :Links ok FPC 4 PFE 0 :Links ok FPC 7 PFE 0 :Links ok FPC 8 PFE 0 :Links ok FPC 9 PFE 0 :Links ok FPC 10 PFE 0 :Links okPlane 5 Plane state: SPARE FPC 0 PFE 0 :Links ok FPC 2 PFE 0 :Links ok FPC 3 PFE 0 :Links ok FPC 4 PFE 0 :Links ok FPC 7 PFE 0 :Links ok FPC 8 PFE 0 :Links ok FPC 9 PFE 0 :Links ok FPC 10 PFE 0 :Links ok
node1:--------------------------------------------------------------------------Fabric management PLANE statePlane 0 Plane state: ACTIVE FPC 0 PFE 0 :Links ok FPC 1 PFE 0 :Links ok
853

FPC 2 PFE 0 :Links ok FPC 3 PFE 0 :Links ok FPC 4 PFE 0 :Links ok FPC 7 PFE 0 :Links ok FPC 8 PFE 0 :Links ok FPC 10 PFE 0 :Links okPlane 1 Plane state: ACTIVE FPC 0 PFE 0 :Links ok FPC 1 PFE 0 :Links ok FPC 2 PFE 0 :Links ok FPC 3 PFE 0 :Links ok FPC 4 PFE 0 :Links ok FPC 7 PFE 0 :Links ok FPC 8 PFE 0 :Links ok FPC 10 PFE 0 :Links okPlane 2 Plane state: ACTIVE FPC 0 PFE 0 :Links ok FPC 1 PFE 0 :Links ok FPC 2 PFE 0 :Links ok FPC 3 PFE 0 :Links ok FPC 4 PFE 0 :Links ok FPC 7
854

PFE 0 :Links ok FPC 8 PFE 0 :Links ok FPC 10 PFE 0 :Links okPlane 3 Plane state: ACTIVE FPC 0 PFE 0 :Links ok FPC 1 PFE 0 :Links ok FPC 2 PFE 0 :Links ok FPC 3 PFE 0 :Links ok FPC 4 PFE 0 :Links ok FPC 7 PFE 0 :Links ok FPC 8 PFE 0 :Links ok FPC 10 PFE 0 :Links okPlane 4 Plane state: SPARE FPC 0 PFE 0 :Links ok FPC 1 PFE 0 :Links ok FPC 2 PFE 0 :Links ok FPC 3 PFE 0 :Links ok FPC 4 PFE 0 :Links ok FPC 7 PFE 0 :Links ok FPC 8 PFE 0 :Links ok FPC 10 PFE 0 :Links okPlane 5 Plane state: SPARE
855

FPC 0 PFE 0 :Links ok FPC 1 PFE 0 :Links ok FPC 2 PFE 0 :Links ok FPC 3 PFE 0 :Links ok FPC 4 PFE 0 :Links ok FPC 7 PFE 0 :Links ok FPC 8 PFE 0 :Links ok FPC 10 PFE 0 :Links ok
Release Information
Command introduced in Junos OS Release 9.2.
RELATED DOCUMENTATION
show chassis fabric plane-location | 856
show chassis fabric plane-location
IN THIS SECTION
Syntax | 857
Description | 857
Required Privilege Level | 857
Output Fields | 857
856

Sample Output | 858
Release Information | 858
Syntax
show chassis fabric plane-location
Description
Show fabric plane location.
Required Privilege Level
view
Output Fields
Table 58 on page 857 lists the output fields for the show chassis fabric plane-location command.Output fields are listed in the approximate order in which they appear.
Table 58: show chassis fabric plane-location Output Fields
Field Name Field Description
Plane n Plane number.
Control Board n Control Board number.
857

Sample Output
show chassis fabric plane-location (SRX5600 and SRX5800 Devices with SRX5000 Line SCBII [SRX5K-SCBE] and SRX5K-RE-1800X4)
user@host> show chassis fabric plane-locationnode0:--------------------------------------------------------------------------------------Fabric Plane Locations-------------Plane 0 Control Board 0Plane 1 Control Board 0Plane 2 Control Board 1Plane 3 Control Board 1Plane 4 Control Board 2Plane 5 Control Board 2
node1:--------------------------------------------------------------------------------------Fabric Plane Locations-------------Plane 0 Control Board 0Plane 1 Control Board 0Plane 2 Control Board 1Plane 3 Control Board 1Plane 4 Control Board 2Plane 5 Control Board 2
Release Information
Command introduced in Junos OS Release 9.2.
RELATED DOCUMENTATION
show chassis fabric plane | 847
858

show chassis fabric summary
IN THIS SECTION
Syntax | 859
Description | 859
Options | 859
Required Privilege Level | 859
Output Fields | 860
Sample Output | 861
Release Information | 862
Syntax
show chassis fabric summary
Description
Show summary fabric management state.
Options
This command has no options.
Required Privilege Level
view
859

Output Fields
Table 59 on page 860 lists the output fields for the show chassis fabric summary command. Outputfields are listed in the approximate order in which they appear.
Table 59: show chassis fabric summary Output Fields
Field Name Field Description
Plane Plane number.
State State of the SIB or FPC:
• Online—Switch Interface Board (SIB) is operational and running.
• Empty—SIB is powered down.
• Check—SIB is in the Check state because of the following reasons:
• SIB is not inserted properly.
• Some destination errors are detected on the SIB. In this case, thePacket Forwarding Engine stops using the SIB to send traffic to theaffected destination Packet Forwarding Engine.
• Some link errors are detected on the channel between the SIB and aPacket Forwarding Engine. Link errors can be detected at initializationtime or runtime:
• Link errors caused by a link training failure at initialization time—The Packet Forwarding Engine does not use the SIB to send traffic.The show chassis fabric fpcs command shows Plane disabled asstatus for this link.
• Link errors caused by CRC errors detected at runtime—The PacketForwarding Engine continues to use the SIB to send traffic. Theshow chassis fabric fpcs command shows Link error as the statusfor this link.
For information about link and destination errors, issue the show chassisfabric fpc commands.
• Spare—SIB is redundant and will move to active state if one of the workingSIBs fails.
860

Table 59: show chassis fabric summary Output Fields (Continued)
Field Name Field Description
Errors Indicates whether there is any error on the SIB.
• None—No errors
• Link Errors—Fabric link errors were found on the SIB RX link.
• Cell drops—Fabric cell drops were found on the SIB ASIC.
• Link, Cell drops—Both link errors and cell drops were detected on at leastone of the FPC’s fabric links.
NOTE: The Errors column is empty only when the FPC or SIB is offline.
Uptime Elapsed time the plane has been online.
Sample Output
show chassis fabric summary (SRX5600 and SRX5800 devices with SRX5000 line SCB II(SRX5K-SCBE) and SRX5K-RE-1800X4)
user@host> show chassis fabric summarynode0:--------------------------------------------------------------------------Plane State Uptime 0 Online 14 minutes, 10 seconds 1 Online 14 minutes, 5 seconds 2 Online 14 minutes 3 Online 13 minutes, 55 seconds 4 Spare 13 minutes, 50 seconds 5 Spare 13 minutes, 44 seconds
node1:--------------------------------------------------------------------------Plane State Uptime 0 Online 14 minutes, 7 seconds
861

1 Online 14 minutes, 2 seconds 2 Online 13 minutes, 57 seconds 3 Online 13 minutes, 51 seconds 4 Spare 13 minutes, 46 seconds 5 Spare 13 minutes, 41 seconds
Release Information
Command introduced in Junos OS Release 9.2.
RELATED DOCUMENTATION
show chassis fabric plane | 847
show chassis fabric plane-location | 856
show chassis hardware (View)
IN THIS SECTION
Syntax | 863
Description | 863
Options | 864
Required Privilege Level | 864
Output Fields | 864
show chassis hardware | 870
show chassis hardware (SRX4200) | 880
show chassis hardware (vSRX 3.0) | 881
show chassis hardware clei-models | 881
Release Information | 882
862

Syntax
show chassis hardware <clei-models | detail | extensive | models | node ( node-id | all | local | primary)>
Description
Display chassis hardware information.
Starting in Junos OS Release 20.1R1, when vSRX 3.0 performs resource management, the vCPUs andRAM available to the instance are assigned based on what has been allocated prior to launching theinstance. A maximum of 32 cores will be assigned to SRXPFE, for flow processing. Any allocation ofcores in excess of 32 will automatically be assigned to the Routing Engine. For example, if 36 cores areallocated to the VM during the creation process, 32 cores are assigned for flow processing and 4 coreswill be assigned to the RE. For memory allocations, up to 64G of vRAM would be used by the SRXPFE.Any allocated memory in excess of 64G would be assigned to system memory and would not be usedfor maintaining flow sessions information.
Table 60: Recommended vCPU and vRAM Combinations
vCPU Number vRAM Size (G)
2 4
5 8
9 16
17 32
On a deployed vSRX, only memory scale up is supported. Scaling down memory on a deployed vSRX, isnot supported. If you need to scale down memory, then a fresh install is required.
863

Options
• clei-models—(Optional) Display Common Language Equipment Identifier Code (CLEI) barcode andmodel number for orderable field-replaceable units (FRUs).
• detail | extensive—(Optional) Display the specified level of output.
• models—(Optional) Display model numbers and part numbers for orderable FRUs.
• node—(Optional) For chassis cluster configurations, display chassis hardware information on a specificnode (device) in the cluster.
• node-id —Identification number of the node. It can be 0 or 1.
• local—Display information about the local node.
• primary—Display information about the primary node.
Required Privilege Level
view
Output Fields
Table 61 on page 864 lists the output fields for the show chassis hardware command. Output fields arelisted in the approximate order in which they appear.
Table 61: show chassis hardware Output Fields
Field Name Field Description
Item Chassis component—Information about the backplane; power supplies; fantrays; Routing Engine; each Physical Interface Module (PIM)—reported as FPCand PIC—and each fan, blower, and impeller.
Version Revision level of the chassis component.
864

Table 61: show chassis hardware Output Fields (Continued)
Field Name Field Description
Part Number Part number for the chassis component.
Serial Number Serial number of the chassis component. The serial number of the backplane isalso the serial number of the device chassis. Use this serial number when youneed to contact Juniper Networks Customer Support about the device chassis.
Assb ID or Assembly ID Identification number that describes the FRU hardware.
FRU model number Model number of FRU hardware component.
CLEI code Common Language Equipment Identifier code. This value is displayed only forhardware components that use ID EEPROM format v2. This value is notdisplayed for components that use ID EEPROM format v1.
EEPROM Version ID EEPROM version used by hardware component: 0x01 (version 1) or 0x02(version 2).
865

Table 61: show chassis hardware Output Fields (Continued)
Field Name Field Description
Description Brief description of the hardware item:
• Type of power supply.
• Switch Control Board (SCB)
Starting with Junos OS Release 12.1X47-D15 and Junos OS Release17.3R1, the SRX5K-SCBE (SCB2) is introduced.
• There are three SCB slots in SRX5800 devices. The third slot can beused for an SCB or an FPC. When an SRX5K-SCB was used , the thirdSCB slot was used as an FPC. SCB redundancy is provided in chassiscluster mode.
• With an SCB2, a third SCB is supported. If a third SCB is plugged in, itprovides intra-chassis fabric redundancy.
• The Ethernet switch in the SCB2 provides the Ethernet connectivityamong all the FPCs and the Routing Engine. The Routing Engine usesthis connectivity to distribute forwarding and routing tables to theFPCs. The FPCs use this connectivity to send exception packets to theRouting Engine.
• Fabric connects all FPCs in the data plane. The Fabric Managerexecutes on the Routing Engine and controls the fabric system in thechassis. Packet Forwarding Engines on the FPC and fabric planes onthe SCB are connected through HSL2 channels.
• SCB2 supports HSL2 with both 3.11 Gbps and 6.22 Gbps (SerDes) linkspeed and various HSL2 modes. When an FPC is brought online, thelink speed and HSL2 mode are determined by the type of FPC.
Starting with Junos OS Release 15.1X49-D10 and Junos OS Release17.3R1, the SRX5K-SCB3 (SCB3) with enhanced midplane is introduced.
• All existing SCB software that is supported by SCB2 is supported onSCB3.
• SRX5K-RE-1800X4 mixed Routing Engine use is not supported.
866

Table 61: show chassis hardware Output Fields (Continued)
Field Name Field Description
• SCB3 works with the SRX5K-MPC (IOC2), SRX5K-MPC3-100G10G(IOC3), SRX5K-MPC3-40G10G (IOC3), and SRX5K-SPC-4-15-320(SPC2) with current midplanes and the new enhanced midplanes.
• Mixed SCB use is not supported. If an SCB2 and an SCB3 are used, thesystem will only power on the primary Routing Engine's SCB and willpower off the other SCBs. Only the SCB in slot 0 is powered on and asystem log is generated.
• SCB3 supports up to 400 Gbps per slot with old midplanes and up to500 Gbps per slot with new midplanes.
• SCB3 supports fabric intra-chassis redundancy.
• SCB3 supports the same chassis cluster function as the SRX5K-SCB(SCB1) and the SRX5K-SCBE (SCB2), except for in-service softwareupgrade (ISSU) and in-service hardware upgrade (ISHU).
• SCB3 has a second external Ethernet port.
• Fabric bandwidth increasing mode is not supported.
Starting in Junos OS 19.3R1, SRX5K-SCB4 is supported on SRX5600 andSRX5800 devices along with SRX5K-SPC3.
SRX5K-SCB4:
• Interoperate with SRX5K-RE3-128G, SRX5K-RE-1800X4, IOC2, IOC3,IOC4, SPC2, and SPC3. SCB4 is compatible with all midplanes andinteroperate with existing PEMs, fan trays, and front panel displays.
• Does not interoperate with SCB, SCB2, and SCB3.
• Supports 480-Gbps link speed per slot.
• Supports 1-Gigabit Ethernet interfaces speed with SRX5K-RE-1800X4and 1-Gigabit, 2.5-Gigabit, and 10-Gigabit Ethernet speeds withSRX5K-RE3-128G.
• Support ISHU and ISSU in chassis cluster.
867

Table 61: show chassis hardware Output Fields (Continued)
Field Name Field Description
• Supports fabric bandwidth mode and redundant fabric mode onSRX5600 and SRX5800 devices. The bandwidth mode is the newdefault mode which is necessary to configure redundant mode insetting up the chassis cluster successfully.
• Type of Flexible PIC Concentrator (FPC), Physical Interface Card (PIC),Modular Interface Cards (MICs), and PIMs.
• IOCs
Starting with Junos OS Release 15.1X49-D10 and Junos OS Release17.3R1, the SRX5K-MPC3-100G10G (IOC3) and the SRX5K-MPC3-40G10G (IOC3) are introduced.
• IOC3 has two types of IOC3 MPCs, which have different built-in MICs:the 24x10GE + 6x40GE MPC and the 2x100GE + 4x10GE MPC.
• IOC3 supports SCB3 and SRX5000 line backplane and enhancedbackplane.
• IOC3 can only work with SRX5000 line SCB2 and SCB3. If an SRX5000line SCB is detected, IOC3 is offline, an FPC misconfiguration alarm israised, and a system log message is generated.
• IOC3 interoperates with SCB2 and SCB3.
• IOC3 interoperates with the SRX5K-SPC-4-15-320 (SPC2) and theSRX5K-MPC (IOC2).
• The maximum power consumption for one IOC3 is 645W. Anenhanced power module must be used.
• The IOC3 does not support the following command to set a PIC to gooffline or online:
request chassis pic fpc-slot <fpc-slot> pic-slot <pic-slot> <offline |online> .
• IOC3 supports 240 Gbps of throughput with the enhanced SRX5000line backplane.
• Chassis cluster functions the same as for the SRX5000 line IOC2.
868
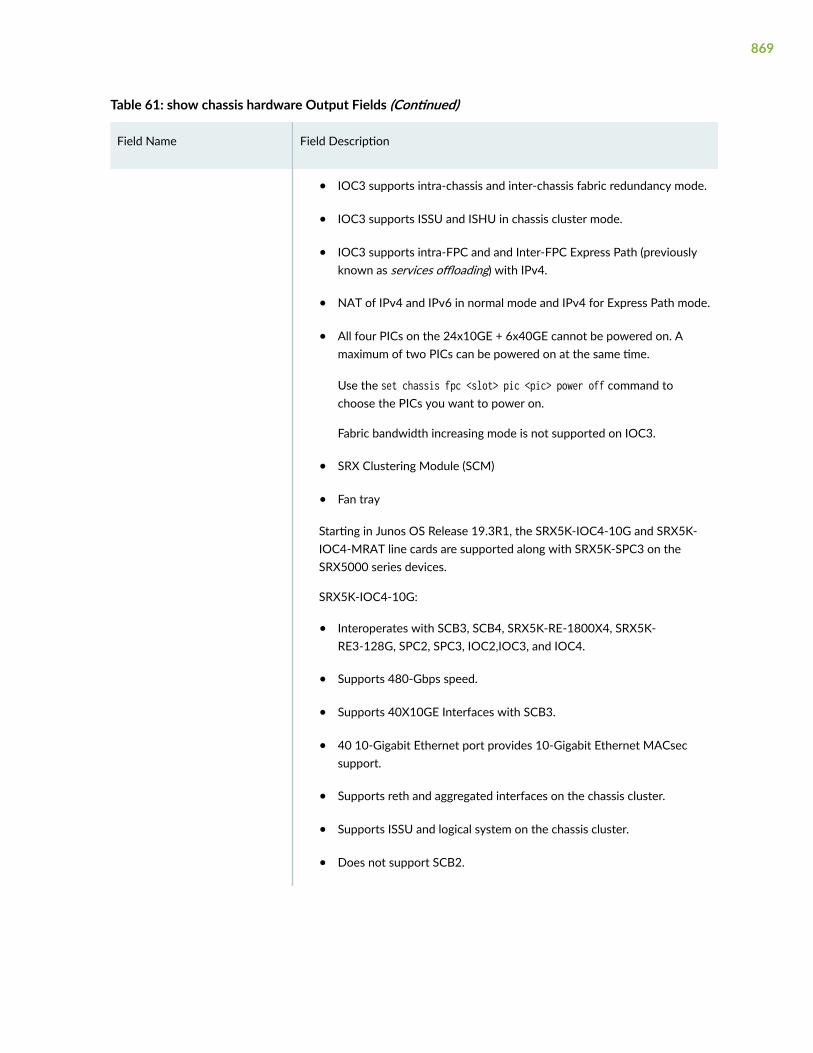
Table 61: show chassis hardware Output Fields (Continued)
Field Name Field Description
• IOC3 supports intra-chassis and inter-chassis fabric redundancy mode.
• IOC3 supports ISSU and ISHU in chassis cluster mode.
• IOC3 supports intra-FPC and and Inter-FPC Express Path (previouslyknown as services offloading) with IPv4.
• NAT of IPv4 and IPv6 in normal mode and IPv4 for Express Path mode.
• All four PICs on the 24x10GE + 6x40GE cannot be powered on. Amaximum of two PICs can be powered on at the same time.
Use the set chassis fpc <slot> pic <pic> power off command tochoose the PICs you want to power on.
Fabric bandwidth increasing mode is not supported on IOC3.
• SRX Clustering Module (SCM)
• Fan tray
Starting in Junos OS Release 19.3R1, the SRX5K-IOC4-10G and SRX5K-IOC4-MRAT line cards are supported along with SRX5K-SPC3 on theSRX5000 series devices.
SRX5K-IOC4-10G:
• Interoperates with SCB3, SCB4, SRX5K-RE-1800X4, SRX5K-RE3-128G, SPC2, SPC3, IOC2,IOC3, and IOC4.
• Supports 480-Gbps speed.
• Supports 40X10GE Interfaces with SCB3.
• 40 10-Gigabit Ethernet port provides 10-Gigabit Ethernet MACsecsupport.
• Supports reth and aggregated interfaces on the chassis cluster.
• Supports ISSU and logical system on the chassis cluster.
• Does not support SCB2.
869

Table 61: show chassis hardware Output Fields (Continued)
Field Name Field Description
• SRX5K-IOC4-MRAT with SCB3 supports 10-Gigabit, 40-Gigabit, and100-Gigabit Ethernet Interfaces.
• For hosts, the Routing Engine type.
Starting with Junos OS Release 12.1X47-D15 and Junos OS Release17.3R1, the SRX5K-RE-1800X4 Routing Engine is introduced.
• The SRX5K-RE-1800X4 has an Intel Quad core Xeon processor, 16 GBof DRAM, and a 128-GB solid-state drive (SSD).
The number 1800 refers to the speed of the processor (1.8 GHz). Themaximum required power for this Routing Engine is 90W.
NOTE: The SRX5K-RE-1800X4 provides significantly betterperformance than the previously used Routing Engine, even with asingle core.
Starting in Junos OS Release 19.3R1, SRX5K-RE3-128G Routing Engine issupported along with SRX5K-SPC3 on the SRX5000 series devices.
SRX5K-RE3-128G:
• Provides improved control plane performance and scalability. SRX5K-RE3-128G has Intel’s Haswell-EP based processor with six cores.
• Supports two 200G SSDs to store log files and 128-GB of memory forstoring routing and forwarding tables and for other routing engines.
• Interoperates with SCB3, SCB4, SRX5K-RE3-128G, SPC2, SPC3, IOC2,IOC3, and IOC4.
• Does not support SCB2 and SRX5K-RE-1800X4.
show chassis hardware
show chassis hardware (SRX5800)
user@host> show chassis hardwarenode0:
870

--------------------------------------------------------------------------Hardware inventory:Item Version Part number Serial number DescriptionChassis JN1267B0FAGA SRX5800Midplane REV 42 760-063937 ACRL3065 Enhanced SRX5800 Backpl aneFPM Board REV 05 760-061272 CAHE4860 Front Panel DisplayPDM Rev 01 740-063049 QCS2209509D Power Distribution Modu lePEM 0 Rev 04 740-034724 QCS171002016 PS 4.1kW; 200-240V AC i nPEM 1 Rev 11 740-027760 QCS1825N07S PS 4.1kW; 200-240V AC i nRouting Engine 0 REV 01 750-095568 CALK8884 SRX5k RE-2000x6Routing Engine 1 REV 01 750-095568 CADZ9076 SRX5k RE-2000x6CB 0 REV 26 750-031391 CALV3002 SRX5k SCB4CB 1 REV 26 750-031391 CALV3009 SRX5k SCB4FPC 2 REV 28 750-073435 CALS4630 SPC3 CPU BUILTIN BUILTIN SRX5k vCPP Broadwell PIC 0 BUILTIN BUILTIN SPU Cp-Flow PIC 1 BUILTIN BUILTIN SPU FlowFPC 3 REV 17 750-044175 CABE7777 SRX5k SPC II CPU BUILTIN BUILTIN SRX5k DPC PPC PIC 0 BUILTIN BUILTIN SPU Flow PIC 1 BUILTIN BUILTIN SPU Flow PIC 2 BUILTIN BUILTIN SPU Flow PIC 3 BUILTIN BUILTIN SPU FlowFPC 4 REV 08 750-061262 CAFD8147 SRX5k IOC II CPU REV 02 711-061263 CAFV7488 SRX5k MPC PMB MIC 0 REV 03 750-055732 CAFV9369 20x 1GE(LAN) SFP PIC 0 BUILTIN BUILTIN 10x 1GE(LAN) SFP Xcvr 0 REV 02 740-011613 PNB1GJR SFP-SX PIC 1 BUILTIN BUILTIN 10x 1GE(LAN) SFPFPC 5 REV 10 750-062242 CAKX2328 SRX5k IOC3 2CGE+4XGE PIC 0 BUILTIN BUILTIN 2x 10GE SFP+ Xcvr 0 REV 01 740-021308 ANA07RE SFP+-10G-SR Xcvr 1 REV 01 740-031980 AQF0RBJ SFP+-10G-SR PIC 1 BUILTIN BUILTIN 1x 100GE CFP2 PIC 2 BUILTIN BUILTIN 2x 10GE SFP+
871

Xcvr 0 REV 01 740-031980 AA1650304RF SFP+-10G-SR Xcvr 1 REV 01 740-021308 AQ93BDK SFP+-10G-SR PIC 3 BUILTIN BUILTIN 1x 100GE CFP2FPC 8 REV 46 750-056519 CALC4514 SRX5k IOC4 MRAT CPU REV 21 750-057177 CALC3494 SMPC PMB PIC 0 BUILTIN BUILTIN MRATE-6xQSFPP-XGE-XLGE-CGE Xcvr 0 REV 01 740-059437 000T20128 QSFP28-LPBK Xcvr 1 REV 01 740-067443 1ACP13450KH QSFP+-40G-SR4 PIC 1 BUILTIN BUILTIN MRATE-6xQSFPP-XGE-XLGE-CGE Xcvr 0 REV 01 740-059437 0000T3443 QSFP28-LPBKFan Tray 0 REV 06 740-035409 ACAE9390 Enhanced Fan TrayFan Tray 1 REV 06 740-035409 ACAE9386 Enhanced Fan Tray
node1:--------------------------------------------------------------------------Hardware inventory:Item Version Part number Serial number DescriptionChassis JN1267B01AGA SRX5800Midplane REV 42 760-063937 ACRL3068 Enhanced SRX5800 BackplaneFPM Board REV 05 760-061272 CAJX9988 Front Panel DisplayPDM Rev 01 740-063049 QCS2209507A Power Distribution ModulePEM 0 Rev 11 740-027760 QCS1822N0EY PS 4.1kW; 200-240V AC inPEM 1 Rev 03 740-034724 QCS17020203F PS 4.1kW; 200-240V AC inRouting Engine 0 REV 01 750-095568 CALK8904 SRX5k RE-2000x6Routing Engine 1 REV 01 750-095568 CADZ9076 SRX5k RE-2000x6CB 0 REV 26 750-031391 CALV3010 SRX5k SCB4CB 1 REV 26 750-031391 CALV3000 SRX5k SCB4FPC 2 REV 28 750-073435 CAKZ9620 SPC3 CPU BUILTIN BUILTIN SRX5k vCPP Broadwell PIC 0 BUILTIN BUILTIN SPU Cp-Flow PIC 1 BUILTIN BUILTIN SPU FlowFPC 3 REV 18 750-054877 CACH4082 SRX5k SPC II CPU BUILTIN BUILTIN SRX5k DPC PPC PIC 0 BUILTIN BUILTIN SPU Flow PIC 1 BUILTIN BUILTIN SPU Flow PIC 2 BUILTIN BUILTIN SPU Flow PIC 3 BUILTIN BUILTIN SPU FlowFPC 4 REV 08 750-061262 CAFD8165 SRX5k IOC II CPU REV 02 711-061263 CAFV7507 SRX5k MPC PMB MIC 0 REV 03 750-055732 CAFV6603 20x 1GE(LAN) SFP PIC 0 BUILTIN BUILTIN 10x 1GE(LAN) SFP Xcvr 0 REV 01 740-011613 AM0805S8M4N SFP-SX PIC 1 BUILTIN BUILTIN 10x 1GE(LAN) SFP
872

FPC 5 REV 03 750-062242 CAFZ2748 SRX5k IOC3 2CGE+4XGE PIC 0 BUILTIN BUILTIN 2x 10GE SFP+ Xcvr 0 REV 01 740-021308 11T511100788 SFP+-10G-SR Xcvr 1 REV 01 740-031980 AS92WJ0 SFP+-10G-SR PIC 1 BUILTIN BUILTIN 1x 100GE CFP2 PIC 2 BUILTIN BUILTIN 2x 10GE SFP+ Xcvr 0 REV 01 740-031980 AA1650304EZ SFP+-10G-SR Xcvr 1 REV 01 740-031980 ANS0EAR SFP+-10G-SR PIC 3 BUILTIN BUILTIN 1x 100GE CFP2FPC 8 REV 46 750-056519 CALC4526 SRX5k IOC4 MRAT CPU REV 21 750-057177 CALF5727 SMPC PMB PIC 0 BUILTIN BUILTIN MRATE-6xQSFPP-XGE-XLGE-CGE Xcvr 1 REV 01 740-067443 1ACP13450L9 QSFP+-40G-SR4 PIC 1 BUILTIN BUILTIN MRATE-6xQSFPP-XGE-XLGE-CGEFan Tray 0 REV 06 740-035409 ACAE9298 Enhanced Fan TrayFan Tray 1 REV 06 740-035409 ACAE9314 Enhanced Fan Tray
{primary:node0}
show chassis hardware (SRX5600 and SRX5800 devices for SRX5K-MPC)
user@host> show chassis hardwareHardware inventory:Item Version Part number Serial number DescriptionChassis JN12170EAAGA SRX 5800Midplane REV 01 710-041799 ACAX3849 SRX 5800 BackplaneFPM Board REV 01 710-024632 CAAX7297 Front Panel DisplayPDM Rev 03 740-013110 QCS170250DU Power Distribution ModulePEM 0 Rev 03 740-034724 QCS17020203F PS 4.1kW; 200-240V AC inPEM 1 Rev 03 740-034724 QCS17020203C PS 4.1kW; 200-240V AC inPEM 2 Rev 04 740-034724 QCS17100200A PS 4.1kW; 200-240V AC inPEM 3 Rev 03 740-034724 QCS17080200M PS 4.1kW; 200-240V AC inRouting Engine 0 REV 11 740-023530 9012047437 SRX5k RE-13-20CB 0 REV 09 710-024802 CAAX7202 SRX5k SCBCB 1 REV 09 710-024802 CAAX7157 SRX5k SCBFPC 0 REV 07 750-044175 CAAD0791 SRX5k SPC II
873

CPU BUILTIN BUILTIN SRX5k DPC PPC PIC 0 BUILTIN BUILTIN SPU Cp PIC 1 BUILTIN BUILTIN SPU Flow PIC 2 BUILTIN BUILTIN SPU Flow PIC 3 BUILTIN BUILTIN SPU FlowFPC 1 REV 07 750-044175 CAAD0751 SRX5k SPC II CPU BUILTIN BUILTIN SRX5k DPC PPC PIC 0 BUILTIN BUILTIN SPU Flow PIC 1 BUILTIN BUILTIN SPU Flow PIC 2 BUILTIN BUILTIN SPU Flow PIC 3 BUILTIN BUILTIN SPU FlowFPC 2 REV 28 750-020751 CAAW1817 SRX5k DPC 4X 10GE CPU REV 04 710-024633 CAAZ5269 SRX5k DPC PMB PIC 0 BUILTIN BUILTIN 1x 10GE(LAN/WAN) RichQ Xcvr 0 REV 02 740-014289 T10A00404 XFP-10G-SR PIC 1 BUILTIN BUILTIN 1x 10GE(LAN/WAN) RichQ PIC 2 BUILTIN BUILTIN 1x 10GE(LAN/WAN) RichQ PIC 3 BUILTIN BUILTIN 1x 10GE(LAN/WAN) RichQFPC 6 REV 02 750-044175 ZY2552 SRX5k SPC II CPU BUILTIN BUILTIN SRX5k DPC PPCFPC 9 REV 10 750-044175 CAAP5932 SRX5k SPC II CPU BUILTIN BUILTIN SRX5k DPC PPC PIC 0 BUILTIN BUILTIN SPU Flow PIC 1 BUILTIN BUILTIN SPU Flow PIC 2 BUILTIN BUILTIN SPU Flow PIC 3 BUILTIN BUILTIN SPU FlowFPC 10 REV 22 750-043157 ZH8192 SRX5k IOC II CPU REV 08 711-043360 YX3879 SRX5k MPC PMB MIC 0 REV 01 750-049488 YZ2084 10x 10GE SFP+ PIC 0 BUILTIN BUILTIN 10x 10GE SFP+ Xcvr 0 REV 01 740-031980 AMB0HG3 SFP+-10G-SR Xcvr 1 REV 01 740-031980 AM20B6F SFP+-10G-SR MIC 1 REV 19 750-049486 CAAH3504 1x 100GE CFP PIC 2 BUILTIN BUILTIN 1x 100GE CFP Xcvr 0 REV 01 740-035329 X000D375 CFP-100G-SR10FPC 11 REV 07.04.07 750-043157 CAAJ8771 SRX5k IOC II CPU REV 08 711-043360 CAAJ3881 SRX5k MPC PMB MIC 0 REV 19 750-049486 CAAH0979 1x 100GE CFP PIC 0 BUILTIN BUILTIN 1x 100GE CFP Xcvr 0 REV 01 740-035329 UP1020Z CFP-100G-SR10 MIC 1 REV 08 750-049487 CAAM1160 2x 40GE QSFP+ PIC 2 BUILTIN BUILTIN 2x 40GE QSFP+ Xcvr 0 REV 01 740-032986 QB151094 QSFP+-40G-SR4
874

Xcvr 1 REV 01 740-032986 QB160509 QSFP+-40G-SR4Fan Tray 0 REV 04 740-035409 ACAE0875 Enhanced Fan TrayFan Tray 1 REV 04 740-035409 ACAE0876 Enhanced Fan Tray
show chassis hardware (with 20-Gigabit Ethernet MIC with SFP)
user@host> show chassis hardwareHardware inventory:Item Version Part number Serial number DescriptionChassis JN108DA5AAGA SRX 5800Midplane REV 02 710-013698 TR0037 SRX 5600 MidplaneFPM Board REV 02 710-014974 JY4635 Front Panel DisplayPDM Rev 02 740-013110 QCS10465005 Power Distribution ModulePEM 0 Rev 03 740-023514 QCS11154040 PS 1.7kW; 200-240VAC inPEM 2 Rev 02 740-023514 QCS10504014 PS 1.7kW; 200-240VAC inRouting Engine 0 REV 05 740-015113 1000681023 RE-S-1300CB 0 REV 05 710-013385 JY4775 SRX5k SCBFPC 1 REV 17 750-020751 WZ6349 SRX5k DPC 4X 10GE CPU REV 02 710-024633 WZ0718 SRX5k DPC PMB PIC 0 BUILTIN BUILTIN 1x 10GE(LAN/WAN) RichQ Xcvr 0 NON-JNPR C724XM088 XFP-10G-SR PIC 1 BUILTIN BUILTIN 1x 10GE(LAN/WAN) RichQ Xcvr 0 REV 02 740-011571 C831XJ08S XFP-10G-SR PIC 2 BUILTIN BUILTIN 1x 10GE(LAN/WAN) RichQ PIC 3 BUILTIN BUILTIN 1x 10GE(LAN/WAN) RichQFPC 3 REV 22 750-043157 ZH8189 SRX5k IOC II CPU REV 06 711-043360 YX3912 SRX5k MPC PMB MIC 0 REV 01 750-055732 CACF9115 20x 1GE(LAN) SFP PIC 0 BUILTIN BUILTIN 10x 1GE(LAN) SFP Xcvr 2 REV 02 740-013111 B358549 SFP-T Xcvr 9 REV 02 740-011613 PNB1FQS SFP-SX PIC 1 BUILTIN BUILTIN 10x 1GE(LAN) SFP Xcvr 9 REV 02 740-011613 PNB1FFF SFP-SXFPC 5 REV 01 750-027945 JW9665 SRX5k FIOC CPU FPC 8 REV 08 750-023996 XA7234 SRX5k SPC CPU REV 02 710-024633 XA1599 SRX5k DPC PMB PIC 0 BUILTIN BUILTIN SPU Cp-Flow PIC 1 BUILTIN BUILTIN SPU Flow
875

Fan Tray 0 REV 03 740-014971 TP0902 Fan TrayFan Tray 1 REV 01 740-014971 TP0121 Fan Tray
show chassis hardware (SRX5600 and SRX5800 devices with SRX5000 line SRX5K-SCBE[SCB2] and SRX5K-RE-1800X4 [RE2])
user@host> show chassis hardwarenode0:--------------------------------------------------------------------------Hardware inventory:Item Version Part number Serial number DescriptionChassis JN1251EA1AGB SRX5600Midplane REV 01 760-063936 ACRE2657 Enhanced SRX5600 MidplaneFPM Board REV 01 710-024631 CABY3551 Front Panel DisplayPEM 0 Rev 03 740-034701 QCS13380901P PS 1.4-2.6kW; 90-264V AC inPEM 1 Rev 03 740-034701 QCS133809019 PS 1.4-2.6kW; 90-264V AC inRouting Engine 0 REV 02 740-056658 9009210105 SRX5k RE-1800X4Routing Engine 1 REV 02 740-056658 9013115551 SRX5k RE-1800X4CB 0 REV 01 750-062257 CADW3663 SRX5k SCB3CB 1 REV 01 750-062257 CADZ3263 SRX5k SCB3FPC 0 REV 18 750-054877 CABG6043 SRX5k SPC II CPU BUILTIN BUILTIN SRX5k DPC PPC PIC 0 BUILTIN BUILTIN SPU Cp PIC 1 BUILTIN BUILTIN SPU Flow PIC 2 BUILTIN BUILTIN SPU Flow PIC 3 BUILTIN BUILTIN SPU FlowFPC 1 REV 01 750-062243 CAEE5918 SRX5k IOC3 24XGE+6XLG CPU REV 02 711-062244 CADX8509 RMPC PMB PIC 0 BUILTIN BUILTIN 12x 10GE SFP+ Xcvr 0 REV 01 740-031980 273363A01891 SFP+-10G-SR Xcvr 1 REV 01 740-031980 273363A01915 SFP+-10G-SR Xcvr 2 REV 01 740-031980 ANA0BK6 SFP+-10G-SR Xcvr 3 REV 01 740-031980 AP407GA SFP+-10G-SR Xcvr 9 REV 01 740-021308 MUC20G1 SFP+-10G-SR PIC 1 BUILTIN BUILTIN 12x 10GE SFP+ PIC 2 BUILTIN BUILTIN 3x 40GE QSFP+ PIC 3 BUILTIN BUILTIN 3x 40GE QSFP+ WAN MEZZ REV 15 750-049136 CAEE5845 MPC5E 24XGE OTN MezzFPC 3 REV 11 750-043157 CACL7452 SRX5k IOC II CPU REV 04 711-043360 CACP1977 SRX5k MPC PMB MIC 0 REV 04 750-049488 CABL4759 10x 10GE SFP+
876

PIC 0 BUILTIN BUILTIN 10x 10GE SFP+ Xcvr 0 REV 01 740-021308 CF36KM0SY SFP+-10G-SR Xcvr 1 REV 01 740-021308 MUC0MF2 SFP+-10G-SR Xcvr 2 REV 01 740-021308 CF36KM01S SFP+-10G-SR Xcvr 3 REV 01 740-021308 MUC229N SFP+-10G-SRFPC 5 REV 07 750-044175 CAAD0764 SRX5k SPC II CPU BUILTIN BUILTIN SRX5k DPC PPC PIC 0 BUILTIN BUILTIN SPU Flow PIC 1 BUILTIN BUILTIN SPU Flow PIC 2 BUILTIN BUILTIN SPU Flow PIC 3 BUILTIN BUILTIN SPU FlowFan Tray Enhanced Fan Tray
node1:--------------------------------------------------------------------------Hardware inventory:Item Version Part number Serial number DescriptionChassis JN124FE77AGB SRX5600Midplane REV 01 760-063936 ACRE2970 Enhanced SRX5600 MidplaneFPM Board REV 01 710-024631 CABY3552 Front Panel DisplayPEM 0 Rev 03 740-034701 QCS133809028 PS 1.4-2.6kW; 90-264V AC inPEM 1 Rev 03 740-034701 QCS133809027 PS 1.4-2.6kW; 90-264V AC inRouting Engine 0 REV 02 740-056658 9009218294 SRX5k RE-1800X4Routing Engine 1 REV 02 740-056658 9013104758 SRX5k RE-1800X4CB 0 REV 01 750-062257 CAEB8180 SRX5k SCB3CB 1 REV 01 750-062257 CADZ3334 SRX5k SCB3FPC 0 REV 18 750-054877 CACJ9834 SRX5k SPC II CPU BUILTIN BUILTIN SRX5k DPC PPC PIC 0 BUILTIN BUILTIN SPU Cp PIC 1 BUILTIN BUILTIN SPU Flow PIC 2 BUILTIN BUILTIN SPU Flow PIC 3 BUILTIN BUILTIN SPU FlowFPC 1 REV 01 750-062243 CAEB0981 SRX5k IOC3 24XGE+6XLG CPU REV 02 711-062244 CAEA4644 RMPC PMB PIC 0 BUILTIN BUILTIN 12x 10GE SFP+ Xcvr 0 REV 01 740-031980 AP41BLH SFP+-10G-SR Xcvr 1 REV 01 740-031980 AQ400SL SFP+-10G-SR Xcvr 2 REV 01 740-031980 AP422LJ SFP+-10G-SR Xcvr 3 REV 01 740-021308 AMG0RBT SFP+-10G-SR Xcvr 9 REV 01 740-021308 MUC2FRG SFP+-10G-SR PIC 1 BUILTIN BUILTIN 12x 10GE SFP+ PIC 2 BUILTIN BUILTIN 3x 40GE QSFP+ PIC 3 BUILTIN BUILTIN 3x 40GE QSFP+
877

WAN MEZZ REV 15 750-049136 CAEA4837 MPC5E 24XGE OTN MezzFPC 3 REV 11 750-043157 CACA8784 SRX5k IOC II CPU REV 04 711-043360 CACA8820 SRX5k MPC PMB MIC 0 REV 05 750-049488 CADF0521 10x 10GE SFP+ PIC 0 BUILTIN BUILTIN 10x 10GE SFP+ Xcvr 0 REV 01 740-030658 AD1130A00PV SFP+-10G-USR Xcvr 1 REV 01 740-031980 AN40MVV SFP+-10G-SR Xcvr 2 REV 01 740-021308 CF36KM37B SFP+-10G-SR Xcvr 3 REV 01 740-021308 AD153830DSZ SFP+-10G-SR MIC 1 REV 01 750-049487 CABB5961 2x 40GE QSFP+ PIC 2 BUILTIN BUILTIN 2x 40GE QSFP+ Xcvr 1 REV 01 740-032986 QB160513 QSFP+-40G-SR4FPC 5 REV 02 750-044175 ZY2569 SRX5k SPC II CPU BUILTIN BUILTIN SRX5k DPC PPC PIC 0 BUILTIN BUILTIN SPU Flow PIC 1 BUILTIN BUILTIN SPU Flow PIC 2 BUILTIN BUILTIN SPU Flow PIC 3 BUILTIN BUILTIN SPU FlowFan Tray Enhanced Fan Tray
show chassis hardware (SRX5400, SRX5600, and SRX5800 devices with SRX5000 lineSRX5K-SCB3 [SCB3] with enhanced midplanes and SRX5K-MPC3-100G10G [IOC3] orSRX5K-MPC3-40G10G [IOC3])
user@host> show chassis hardwarenode0:--------------------------------------------------------------------------Hardware inventory:Item Version Part number Serial number DescriptionChassis JN1250870AGB SRX5600Midplane REV 01 760-063936 ACRE2578 Enhanced SRX5600 Midplane FPM Board REV 02 710-017254 KD9027 Front Panel DisplayPEM 0 Rev 03 740-034701 QCS13090900T PS 1.4-2.6kW; 90-264V A C inPEM 1 Rev 03 740-034701 QCS13090904T PS 1.4-2.6kW; 90-264V A C inRouting Engine 0 REV 01 740-056658 9009196496 SRX5k RE-1800X4
878

CB 0 REV 01 750-062257 CAEC2501 SRX5k SCB3FPC 0 REV 10 750-056758 CADC8067 SRX5k SPC II CPU BUILTIN BUILTIN SRX5k DPC PPC PIC 0 BUILTIN BUILTIN SPU Cp PIC 1 BUILTIN BUILTIN SPU Flow PIC 2 BUILTIN BUILTIN SPU Flow PIC 3 BUILTIN BUILTIN SPU FlowFPC 2 REV 01 750-062243 CAEE5924 SRX5k IOC3 24XGE+6XLG CPU REV 01 711-062244 CAEB4890 SRX5k IOC3 PMB PIC 0 BUILTIN BUILTIN 12x 10GE SFP+ PIC 1 BUILTIN BUILTIN 12x 10GE SFP+ PIC 2 BUILTIN BUILTIN 3x 40GE QSFP+ Xcvr 0 REV 01 740-038623 MOC13156230449 QSFP+-40G-CU1M Xcvr 2 REV 01 740-038623 MOC13156230449 QSFP+-40G-CU1M PIC 3 BUILTIN BUILTIN 3x 40GE QSFP+ WAN MEZZ REV 01 750-062682 CAEE5817 24x 10GE SFP+ MezzFPC 4 REV 11 750-043157 CACY1595 SRX5k IOC II CPU REV 04 711-043360 CACZ8879 SRX5k MPC PMB MIC 1 REV 04 750-049488 CACM6062 10x 10GE SFP+ PIC 2 BUILTIN BUILTIN 10x 10GE SFP+ Xcvr 7 REV 01 740-021308 AD1439301TU SFP+-10G-SR Xcvr 8 REV 01 740-021308 AD1439301SD SFP+-10G-SR Xcvr 9 REV 01 740-021308 AD1439301TS SFP+-10G-SRFPC 5 REV 05 750-044175 ZZ1371 SRX5k SPC II CPU BUILTIN BUILTIN SRX5k DPC PPC PIC 0 BUILTIN BUILTIN SPU Flow PIC 1 BUILTIN BUILTIN SPU Flow PIC 2 BUILTIN BUILTIN SPU Flow PIC 3 BUILTIN BUILTIN SPU FlowFan Tray Enhanced Fan Tray
node1:--------------------------------------------------------------------------Hardware inventory:Item Version Part number Serial number DescriptionChassis JN124FEC0AGB SRX5600Midplane REV 01 760-063936 ACRE2946 Enhanced SRX5600 MidplaneFPM Board test 710-017254 test Front Panel DisplayPEM 0 Rev 01 740-038514 QCS114111003 DC 2.6kW Power Entry ModulePEM 1 Rev 01 740-038514 QCS12031100J DC 2.6kW Power Entry ModuleRouting Engine 0 REV 01 740-056658 9009186342 SRX5k RE-1800X4CB 0 REV 01 750-062257 CAEB8178 SRX5k SCB3FPC 0 REV 07 750-044175 CAAD0769 SRX5k SPC II
879

CPU BUILTIN BUILTIN SRX5k DPC PPC PIC 0 BUILTIN BUILTIN SPU Cp PIC 1 BUILTIN BUILTIN SPU Flow PIC 2 BUILTIN BUILTIN SPU Flow PIC 3 BUILTIN BUILTIN SPU FlowFPC 4 REV 11 750-043157 CACY1592 SRX5k IOC II CPU REV 04 711-043360 CACZ8831 SRX5k MPC PMB MIC 1 REV 04 750-049488 CACN0239 10x 10GE SFP+ PIC 2 BUILTIN BUILTIN 10x 10GE SFP+ Xcvr 7 REV 01 740-031980 ARN23HW SFP+-10G-SR Xcvr 8 REV 01 740-031980 ARN2FVW SFP+-10G-SR Xcvr 9 REV 01 740-031980 ARN2YVM SFP+-10G-SRFPC 5 REV 10 750-056758 CADA8736 SRX5k SPC II CPU BUILTIN BUILTIN SRX5k DPC PPC PIC 0 BUILTIN BUILTIN SPU Flow PIC 1 BUILTIN BUILTIN SPU Flow PIC 2 BUILTIN BUILTIN SPU Flow PIC 3 BUILTIN BUILTIN SPU FlowFan Tray Enhanced Fan Tray
show chassis hardware (SRX4200)
command-name
user@host> show chassis hardware
Hardware inventory:Item Version Part number Serial number DescriptionChassis DK2816AR0020 SRX4200Mainboard REV 01 650-071675 16061032317 SRX4200Routing Engine 0 BUILTIN BUILTIN SRX Routing EngineFPC 0 BUILTIN BUILTIN FEB PIC 0 BUILTIN BUILTIN 8x10G-SFP Xcvr 0 REV 01 740-038153 MOC11511530020 SFP+-10G-CU3M Xcvr 1 REV 01 740-038153 MOC11511530020 SFP+-10G-CU3M Xcvr 2 REV 01 740-038153 MOC11511530020 SFP+-10G-CU3M Xcvr 3 REV 01 740-038153 MOC11511530020 SFP+-10G-CU3M Xcvr 4 REV 01 740-021308 04DZ06A00364 SFP+-10G-SR Xcvr 5 REV 01 740-031980 233363A03066 SFP+-10G-SR
880

Xcvr 6 REV 01 740-021308 AL70SWE SFP+-10G-SR Xcvr 7 REV 01 740-031980 ALN0N6C SFP+-10G-SR Xcvr 8 REV 01 740-030076 APF16220018NK1 SFP+-10G-CU1MPower Supply 0 REV 04 740-041741 1GA26241849 JPSU-650W-AC-AFOPower Supply 1 REV 04 740-041741 1GA26241846 JPSU-650W-AC-AFOFan Tray 0 SRX4200 0, Front to Back Airflow - AFOFan Tray 1 SRX4200 1, Front to Back Airflow - AFOFan Tray 2 SRX4200 2, Front to Back Airflow - AFOFan Tray 3 SRX4200 3, Front to Back Airflow - AFO
show chassis hardware (vSRX 3.0)
command-name
user@host> show chassis hardwareHardware inventory:Item Version Part number Serial number DescriptionChassis 806dddb1a141 VSRXMidplaneSystem IORouting Engine VSRX-2CPU-8G memoryFPC 0 FPC PIC 0 VSRX DPDK GEPower Supply 0
show chassis hardware clei-models
show chassis hardware clei-models (SRX5600 and SRX5800 devices with SRX5000 lineSRX5K-SCBE [SCB2] and SRX5K-RE-1800X4 [RE2])
user@host> show chassis hardware clei-models node 1node1:--------------------------------------------------------------------------Hardware inventory:Item Version Part number CLEI code FRU model number
881

Midplane REV 01 710-024803 SRX5800-BP-AFPM Board REV 01 710-024632 SRX5800-CRAFT-APEM 0 Rev 04 740-034724 SRX5800-PWR-4100-ACPEM 1 Rev 05 740-034724 SRX5800-PWR-4100-ACRouting Engine 0 REV 01 740-056658 COUCATTBAA SRX5K-RE-1800X4CB 0 REV 01 750-056587 COUCATSBAA SRX5K-SCBECB 1 REV 01 750-056587 COUCATSBAA SRX5K-SCBECB 2 REV 01 750-056587 COUCATSBAA SRX5K-SCBEFPC 0 REV 18 750-054877 COUCATLBAA SRX5K-SPC-4-15-320 CPU BUILTINFPC 1 REV 18 750-054877 COUCATLBAA SRX5K-SPC-4-15-320 CPU BUILTINFPC 2 REV 18 750-054877 COUCATLBAA SRX5K-SPC-4-15-320 CPU BUILTINFPC 3 REV 11 750-043157 COUIBCWBAA SRX5K-MPC MIC 0 REV 05 750-049486 COUIBCYBAA SRX-MIC-1X100G-CFP MIC 1 REV 04 750-049488 COUIBCXBAA SRX-MIC-10XG-SFPPFPC 4 REV 18 750-054877 COUCATLBAA SRX5K-SPC-4-15-320 CPU BUILTINFPC 7 REV 18 750-054877 COUCATLBAA SRX5K-SPC-4-15-320 CPU BUILTINFPC 8 REV 11 750-043157 COUIBCWBAA SRX5K-MPC MIC 0 REV 05 750-049486 COUIBCYBAA SRX-MIC-1X100G-CFPFPC 9 REV 18 750-054877 COUCATLBAA SRX5K-SPC-4-15-320 CPU BUILTINFPC 10 REV 18 750-054877 COUCATLBAA SRX5K-SPC-4-15-320 CPU BUILTINFan Tray 0 REV 04 740-035409 SRX5800-HC-FANFan Tray 1 REV 04 740-035409 SRX5800-HC-FAN
Release Information
Command introduced in Junos OS Release 9.2. Command modified in Junos OS Release 9.2 to includenode option.
RELATED DOCUMENTATION
Understanding Traffic Processing on Security Devices
Interface Naming Conventions
882
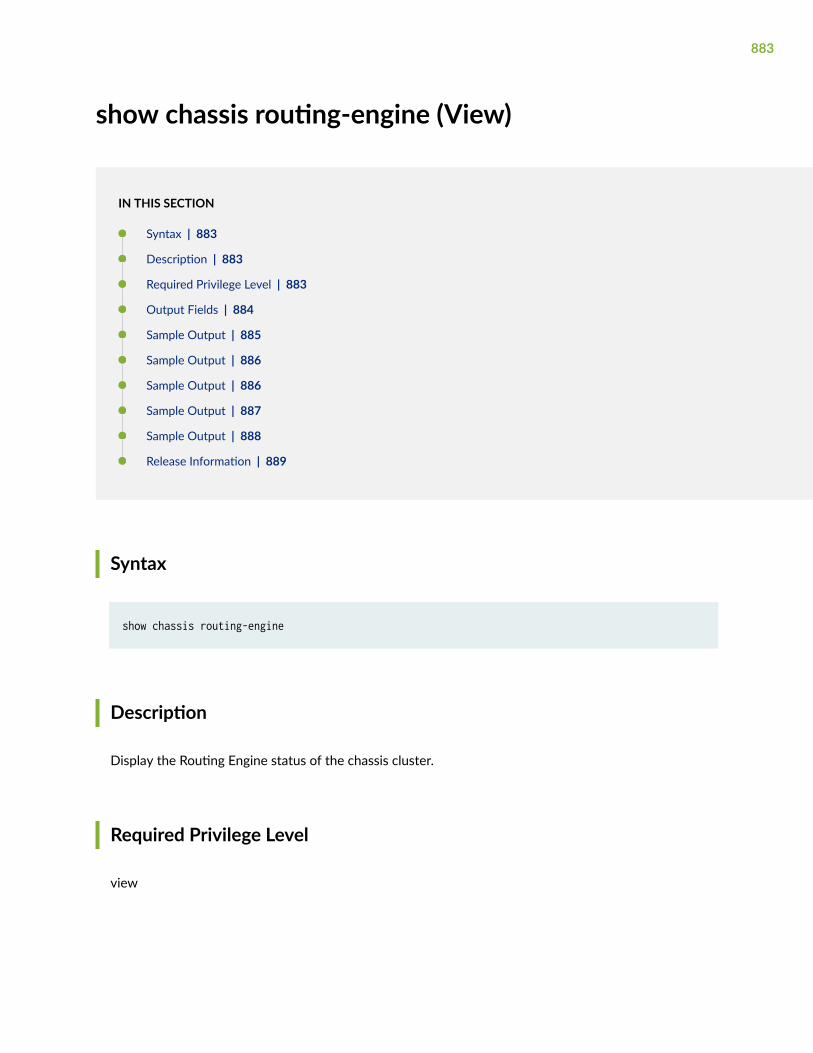
show chassis routing-engine (View)
IN THIS SECTION
Syntax | 883
Description | 883
Required Privilege Level | 883
Output Fields | 884
Sample Output | 885
Sample Output | 886
Sample Output | 886
Sample Output | 887
Sample Output | 888
Release Information | 889
Syntax
show chassis routing-engine
Description
Display the Routing Engine status of the chassis cluster.
Required Privilege Level
view
883

Output Fields
Table 62 on page 884 lists the output fields for the show chassis routing-engine command. Output fieldsare listed in the approximate order in which they appear.
Table 62: show chassis routing-engine Output Fields
Field Name Field Description
Temperature Routing Engine temperature. (Not available for vSRX deployments.)
CPU temperature CPU temperature. (Not available for vSRX deployments.)
Total memory Total memory available on the system.
NOTE: Starting with Junos OS Release 15.1x49-D70 and Junos OS Release17.3R1, there is a change in the method for calculating the memory utilizationby a Routing Engine. The inactive memory is now subtracted from the totalavailable memory. There is thus, a decrease in the reported value for usedmemory; as the inactive memory is now considered as free.
Control plane memory Memory available for the control plane.
Data plane memory Memory reserved for data plane processing.
CPU utilization Current CPU utilization statistics on the control plane core.
User Current CPU utilization in user mode on the control plane core.
Background Current CPU utilization in nice mode on the control plane core.
Kernel Current CPU utilization in kernel mode on the control plane core.
Interrupt Current CPU utilization in interrupt mode on the control plane core.
Idle Current CPU utilization in idle mode on the control plane core.
884

Table 62: show chassis routing-engine Output Fields (Continued)
Field Name Field Description
Model Routing Engine model.
Start time Routing Engine start time.
Uptime Length of time the Routing Engine has been up (running) since the last start.
Last reboot reason Reason for the last reboot of the Routing Engine.
Load averages The average number of threads waiting in the run queue or currentlyexecuting over 1-, 5-, and 15-minute periods.
Sample Output
show chassis routing-engine (Sample 1 - SRX550M)
user@host> show chassis routing-engine Routing Engine status: Temperature 38 degrees C / 100 degrees F CPU temperature 36 degrees C / 96 degrees F Total memory 512 MB Max 435 MB used ( 85 percent) Control plane memory 344 MB Max 296 MB used ( 86 percent) Data plane memory 168 MB Max 138 MB used ( 82 percent) CPU utilization: User 8 percent Background 0 percent Kernel 4 percent Interrupt 0 percent Idle 88 percent Model RE-SRX5500-LOWMEM Serial ID AAAP8652 Start time 2009-09-21 00:04:54 PDT Uptime 52 minutes, 47 seconds
885

Last reboot reason 0x200:chassis control reset Load averages: 1 minute 5 minute 15 minute 0.12 0.15 0.10
Sample Output
show chassis routing-engine (Sample 2 - vSRX)
user@host> show chassis routing-engine Routing Engine status: Total memory 1024 MB Max 358 MB used ( 35 percent) Control plane memory 1024 MB Max 358 MB used ( 35 percent) 5 sec CPU utilization: User 2 percent Background 0 percent Kernel 4 percent Interrupt 6 percent Idle 88 percent Model VSRX RE Start time 2015-03-03 07:04:18 UTC Uptime 2 days, 11 hours, 51 minutes, 11 seconds Last reboot reason Router rebooted after a normal shutdown. Load averages: 1 minute 5 minute 15 minute 0.07 0.04 0.06
Sample Output
show chassis routing-engine (Sample 3- SRX5400)
user@host> show chassis routing-engine Routing Engine status: Slot 0: Current state Master Election priority Master (default) Temperature 31 degrees C / 87 degrees F CPU temperature 31 degrees C / 87 degrees F
886

DRAM 16323 MB (16384 MB installed) Memory utilization 10 percent 5 sec CPU utilization: User 2 percent Background 0 percent Kernel 12 percent Interrupt 1 percent Idle 85 percent Model RE-S-1800x4 Serial ID 9016272401 Start time 2019-07-08 01:17:10 PDT Uptime 2 minutes, 43 seconds Last reboot reason Router rebooted after a normal shutdown. Load averages: 1 minute 5 minute 15 minute 0.63 0.52 0.24
Sample Output
show chassis routing-engine (Sample 4- SRX4100)
user@host> show chassis routing-engine Routing Engine status: Temperature 29 degrees C / 84 degrees F CPU temperature 29 degrees C / 84 degrees F Total memory 1954 MB Max 567 MB used ( 29 percent) Memory utilization 24 percent 5 sec CPU utilization: User 0 percent Background 0 percent Kernel 0 percent Interrupt 0 percent Idle 100 percent 1 min CPU utilization: User 0 percent Background 0 percent Kernel 0 percent Interrupt 0 percent Idle 100 percent 5 min CPU utilization:
887

User 0 percent Background 0 percent Kernel 0 percent Interrupt 0 percent Idle 100 percent 15 min CPU utilization: User 0 percent Background 0 percent Kernel 0 percent Interrupt 0 percent Idle 100 percent Model SRX Routing Engine Serial ID BUILTIN Uptime 17 days, 5 hours, 1 minute, 52 seconds Last reboot reason 0x4000:VJUNOS reboot Load averages: 1 minute 5 minute 15 minute 0.00 0.00 0.00
The Total memory 64 GB is distributed between the routing engine in the form of virtual machine forthe TVP platforms (SRX1500, SRX4100, SRX4200) and the rest for the packet forwarding engine (PFE).TVP has a different architecture differentiating PFE from Junos and additional API compatibility. Theabove mentioned devices are the only ones with this TVP architecture in SRX. The show chassis routing-engine command displays only the Routing Engine memory.
Sample Output
show chassis routing-engine (Sample 5- SRX1500)
user@host> show chassis routing-engine Routing Engine status: Temperature 42 degrees C / 107 degrees F CPU temperature 42 degrees C / 107 degrees F Total memory 1954 MB Max 528 MB used ( 27 percent) Memory utilization 23 percent 5 sec CPU utilization: User 0 percent Background 0 percent Kernel 0 percent Interrupt 0 percent Idle 100 percent
888

1 min CPU utilization: User 0 percent Background 0 percent Kernel 0 percent Interrupt 0 percent Idle 99 percent 5 min CPU utilization: User 0 percent Background 0 percent Kernel 0 percent Interrupt 0 percent Idle 99 percent 15 min CPU utilization: User 0 percent Background 0 percent Kernel 0 percent Interrupt 0 percent Idle 96 percent Model SRX Routing Engine Serial ID BUILTIN Uptime 52 minutes, 27 seconds Last reboot reason 0x4000:VJUNOS reboot Load averages: 1 minute 5 minute 15 minute 0.00 0.00 0.00
Release Information
Command introduced in Junos OS Release 9.5.
RELATED DOCUMENTATION
cluster (Chassis) | 601
request system snapshot (Maintenance)
889

show chassis reswatch
IN THIS SECTION
Syntax | 890
Description | 890
Required Privilege Level | 890
Output Fields | 890
Sample Output | 891
Release Information | 892
Syntax
show chassis reswatch-config
Description
Display resource usage statistics report. By default, reswatch only logs resource usages when themonitored resource entered its orange zone.
Required Privilege Level
Output Fields
Table 63 on page 891 lists the output fields for the show chassis reswatch-config command. Output fieldsare listed in the approximate order in which they appear.
890

Table 63: Show chassis reswatch-config
Field Name Field Description
Reswatch Enable or Disable.
CPU statistics count CPU statistics count value.
Junos statistics count Junos kernel statistics count value.
Red Zone Enable or Disable.
Red Zone CPU threshold Red zone CPU threshold value
Red Zone Junos threshold Red zone Junos threshold vlaue
Red Zone SNMP Enable or Disable.
Orange Zone Enable or Disable.
Orange Zone threshold Orange zone threshold value.
Sample Output
show chassis reswatch-config
user@host> show chassis reswatch-config
Reswatch: Enable CPU statistics count: 0 Junos statistics count: 0 Red Zone: Enable Red Zone CPU threshold: 15 Red Zone Junos threshold: 60
891

Red Zone SNMP: Enable Orange Zone: Enable Orange Zone threshold: 30
Release Information
Command introduced in Junos OS Release 20.4R1.
RELATED DOCUMENTATION
resource-watch | 694
show chassis temperature-thresholds
IN THIS SECTION
Syntax | 892
Description | 893
Required Privilege Level | 893
Output Fields | 893
Sample Output | 895
Release Information | 895
Syntax
show chassis temperature-thresholds
892

Description
Display chassis temperature threshold settings, in degrees Celsius.
Required Privilege Level
View
Output Fields
Table 64 on page 893 lists the output fields for the show chassis temperature-thresholds command. Outputfields are listed in the approximate order in which they appear.
Table 64: show chassis temperature-thresholds Output Fields
Field name Field Description
Item Chassis component. If per FRU per slot thresholds are configured, the components aboutwhich information is displayed include the chassis, the Routing Engines, FPCs, and FEBs. Ifper FRU per slot thresholds are not configured, the components about which information isdisplayed include the chassis and the Routing Engines.
Chassis Default Default values of the chassis in degrees Celsius.
Routing Engine Default values of the routing engine in degrees Celsius.
893

Table 64: show chassis temperature-thresholds Output Fields (Continued)
Field name Field Description
Fan speed The fan speed changes at the threshold when going from a low speed to a higher speed.When the fan speed changes from a higher speed to a lower speed, the temperaturechanges two degrees below the threshold.
Temperature threshold settings, in degrees Celsius, for the fans to operate at normal andhigh speeds.
• Normal—The fans operate at normal speed if the component is at or below thistemperature and all the fans are present and functioning normally.
• High—The fans operate at high speed if the component has exceeded this temperatureor a fan has failed or is missing.
An alarm is not triggered until the temperature exceeds the threshold settings for a yellowalarm or a red alarm.
Yellow alarm Temperature threshold settings, in degrees Celsius, that trigger a yellow alarm.
• Normal—The temperature that must be exceeded on the component to trigger a yellowalarm when the fans are running at full speed.
• Bad fan—The temperature that must be exceeded on the component to trigger a yellowalarm when one or more fans have failed or are missing.
Red alarm Temperature threshold settings, in degrees Celsius, that trigger a red alarm.
• Normal—The temperature that must be exceeded on the component to trigger a redalarm when the fans are running at full speed.
• Bad fan—The temperature that must be exceeded on the component to trigger a redalarm when one or more fans have failed or are missing.
Fire shutdown Temperature threshold settings, in degrees Celsius, for the device to shut down.
894

Sample Output
show chassis temperature-thresholds
user@host> show chassis temperature-thresholds Fan speed Yellow alarm Red alarm Fire Shutdown (degrees C) (degrees C) (degrees C) (degrees C)Item Normal High Normal Bad fan Normal Bad fan NormalChassis default 48 54 65 55 75 65 100Routing Engine 0 70 80 95 95 110 110 112FPC 0 55 60 75 65 90 80 95FPC 2 55 60 75 65 90 80 95
Release Information
Command introduced in Junos OS Release 9.0
show configuration chassis cluster traceoptions
IN THIS SECTION
Syntax | 896
Description | 896
Required Privilege Level | 896
Output Fields | 896
Sample Output | 897
Release Information | 897
895

Syntax
show configuration chassis cluster traceoptions
Description
Display tracing options for the chassis cluster redundancy process.
Required Privilege Level
view
Output Fields
Table 65 on page 896 lists the output fields for the show configuration chassis cluster traceoptionscommand. Output fields are listed in the approximate order in which they appear.
Table 65: show configuration chassis cluster traceoptions Output Fields
Field Name Field Description
file Name of the file that receives the output of the tracing operation.
size Size of each trace file.
files Maximum number of trace files.
896

Sample Output
show configuration chassis cluster traceoptions
user@host> show configuration chassis cluster traceoptionsfile chassis size 10k files 300;level all;
Release Information
Command introduced in Junos OS Release 12.1.
RELATED DOCUMENTATION
cluster (Chassis) | 601
traceoptions (Chassis Cluster) | 708
show interfaces (SRX Series)
IN THIS SECTION
Syntax | 898
Description | 899
Options | 899
Required Privilege Level | 901
Output Fields | 901
Sample Output | 915
Sample Output | 916
Sample Output | 917
Sample Output | 919
897

Sample Output | 922
Sample Output | 923
Sample Output | 924
Sample Output | 925
Sample Output | 925
Sample Output | 927
Sample Output | 928
Sample Output | 928
Sample Output | 930
Sample Output | 931
Sample Output | 932
Sample Output | 934
Sample Output | 936
Sample Output | 936
Sample Output | 938
Sample Output | 939
Sample Output | 941
Sample Output | 941
Sample Output | 942
Sample Output | 942
Sample Output | 943
Sample Output | 944
Sample Output | 946
Release Information | 946
Syntax
show interfaces { <brief | detail | extensive | terse> controller interface-name descriptions interface-name destination-class (all | destination-class-name logical-interface-name)
898

diagnostics optics interface-name far-end-interval interface-fpc/pic/port filters interface-name flow-statistics interface-name interval interface-name load-balancing (detail | interface-name) mac-database mac-address mac-address mc-ae id identifier unit number revertive-info media interface-name policers interface-name queue both-ingress-egress egress forwarding-class forwarding-class ingress l2-statistics redundancy (detail | interface-name) routing brief detail summary interface-name routing-instance (all | instance-name) snmp-index snmp-index source-class (all | destination-class-name logical-interface-name) statistics interface-name switch-port switch-port number transport pm (all | optics | otn) (all | current | currentday | interval | previousday) (all | interface-name) zone interface-name}
Description
Display status information and statistics about interfaces on SRX Series appliance running Junos OS.
On SRX Series appliance, on configuring identical IPs on a single interface, you will not see a warningmessage; instead, you will see a syslog message.
Options
• interface-name—(Optional) Display standard information about the specified interface. Following is alist of typical interface names. Replace pim with the PIM slot and port with the port number.
• at- pim/0/port—ATM-over-ADSL or ATM-over-SHDSL interface.
• ce1-pim/0/ port—Channelized E1 interface.
899

• cl-0/0/8—3G wireless modem interface for SRX320 devices.
• ct1-pim/0/port—Channelized T1 interface.
• dl0—Dialer Interface for initiating ISDN and USB modem connections.
• e1-pim/0/port—E1 interface.
• e3-pim/0/port—E3 interface.
• fe-pim/0/port—Fast Ethernet interface.
• ge-pim/0/port—Gigabit Ethernet interface.
• se-pim/0/port—Serial interface.
• t1-pim/0/port—T1 (also called DS1) interface.
• t3-pim/0/port—T3 (also called DS3) interface.
• wx-slot/0/0—WAN acceleration interface, for the WXC Integrated Services Module (ISM 200).
• brief | detail | extensive | terse—(Optional) Display the specified level of output.
• controller—(Optional) Show controller information.
• descriptions—(Optional) Display interface description strings.
• destination-class—(Optional) Show statistics for destination class.
• diagnostics—(Optional) Show interface diagnostics information.
• far-end-interval—(Optional) Show far end interval statistics.
• filters—(Optional) Show interface filters information.
• flow-statistics—(Optional) Show security flow counters and errors.
• interval—(Optional) Show interval statistics.
• load-balancing—(Optional) Show load-balancing status.
• mac-database—(Optional) Show media access control database information.
• mc-ae—(Optional) Show MC-AE configured interface information.
• media—(Optional) Display media information.
• policers—(Optional) Show interface policers information.
• queue—(Optional) Show queue statistics for this interface.
900

• redundancy—(Optional) Show redundancy status.
• routing—(Optional) Show routing status.
• routing-instance—(Optional) Name of routing instance.
• snmp-index—(Optional) SNMP index of interface.
• source-class—(Optional) Show statistics for source class.
• statistics—(Optional) Display statistics and detailed output.
• switch-port—(Optional) Front end port number (0..15).
• transport—(Optional) Show interface transport information.
• zone—(Optional) Interface's zone.
Required Privilege Level
view
Output Fields
Table 66 on page 901 lists the output fields for the show interfaces command. Output fields are listed inthe approximate order in which they appear.
Table 66: show interfaces Output Fields
Field Name Field Description Level of Output
Physical Interface
Physical interface Name of the physical interface. All levels
Enabled State of the interface. All levels
901

Table 66: show interfaces Output Fields (Continued)
Field Name Field Description Level of Output
Interface index Index number of the physical interface, which reflects its initializationsequence.
detail extensivenone
SNMP ifIndex SNMP index number for the physical interface. detail extensivenone
Link-level type Encapsulation being used on the physical interface. All levels
Generation Unique number for use by Juniper Networks technical support only. detail extensive
MTU Maximum transmission unit size on the physical interface. All levels
Link mode Link mode: Full-duplex or Half-duplex.
Speed Speed at which the interface is running. All levels
BPDU error Bridge protocol data unit (BPDU) error: Detected or None
Loopback Loopback status: Enabled or Disabled. If loopback is enabled, type ofloopback: Local or Remote.
All levels
Source filtering Source filtering status: Enabled or Disabled. All levels
Flow control Flow control status: Enabled or Disabled. All levels
Auto-negotiation (Gigabit Ethernet interfaces) Autonegotiation status: Enabled or Disabled. All levels
Remote-fault (Gigabit Ethernet interfaces) Remote fault status:
• Online—Autonegotiation is manually configured as online.
• Offline—Autonegotiation is manually configured as offline.
All levels
902

Table 66: show interfaces Output Fields (Continued)
Field Name Field Description Level of Output
Device flags Information about the physical device. All levels
Interface flags Information about the interface. All levels
Link flags Information about the physical link. All levels
CoS queues Number of CoS queues configured. detail extensivenone
Current address Configured MAC address. detail extensivenone
Last flapped Date, time, and how long ago the interface went from down to up. Theformat is Last flapped: year-month-day hour:minute:second:timezone(hour:minute:second ago). For example, Last flapped: 2002-04-2610:52:40 PDT (04:33:20 ago).
detail extensivenone
Input Rate Input rate in bits per second (bps) and packets per second (pps). None
Output Rate Output rate in bps and pps. None
Active alarms andActive defects
Ethernet-specific defects that can prevent the interface from passingpackets. When a defect persists for a certain amount of time, it ispromoted to an alarm. These fields can contain the value None or Link.
• None—There are no active defects or alarms.
• Link—Interface has lost its link state, which usually means that thecable is unplugged, the far-end system has been turned off, or thePIC is malfunctioning.
detail extensivenone
Statistics lastcleared
Time when the statistics for the interface were last set to zero. detail extensive
903

Table 66: show interfaces Output Fields (Continued)
Field Name Field Description Level of Output
Traffic statistics Number and rate of bytes and packets received and transmitted on thephysical interface.
• Input bytes—Number of bytes received on the interface.
• Output bytes—Number of bytes transmitted on the interface.
• Input packets—Number of packets received on the interface.
• Output packets—Number of packets transmitted on the interface.
detail extensive
904
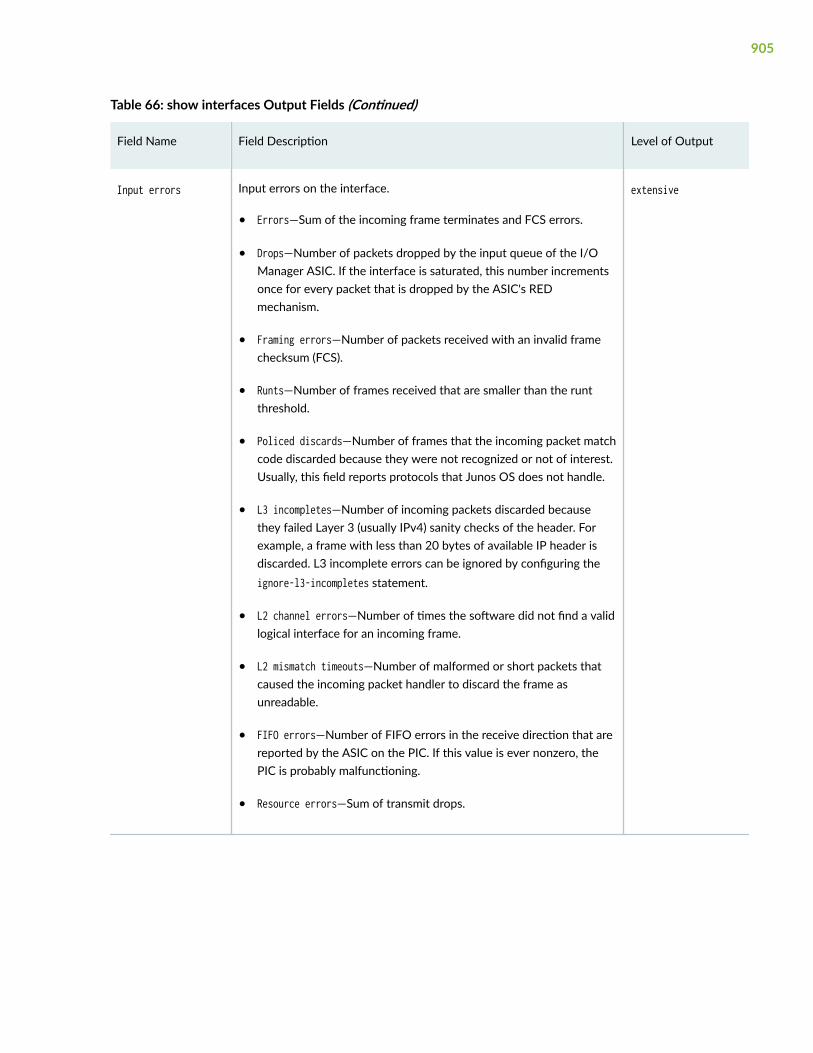
Table 66: show interfaces Output Fields (Continued)
Field Name Field Description Level of Output
Input errors Input errors on the interface.
• Errors—Sum of the incoming frame terminates and FCS errors.
• Drops—Number of packets dropped by the input queue of the I/OManager ASIC. If the interface is saturated, this number incrementsonce for every packet that is dropped by the ASIC's REDmechanism.
• Framing errors—Number of packets received with an invalid framechecksum (FCS).
• Runts—Number of frames received that are smaller than the runtthreshold.
• Policed discards—Number of frames that the incoming packet matchcode discarded because they were not recognized or not of interest.Usually, this field reports protocols that Junos OS does not handle.
• L3 incompletes—Number of incoming packets discarded becausethey failed Layer 3 (usually IPv4) sanity checks of the header. Forexample, a frame with less than 20 bytes of available IP header isdiscarded. L3 incomplete errors can be ignored by configuring theignore-l3-incompletes statement.
• L2 channel errors—Number of times the software did not find a validlogical interface for an incoming frame.
• L2 mismatch timeouts—Number of malformed or short packets thatcaused the incoming packet handler to discard the frame asunreadable.
• FIFO errors—Number of FIFO errors in the receive direction that arereported by the ASIC on the PIC. If this value is ever nonzero, thePIC is probably malfunctioning.
• Resource errors—Sum of transmit drops.
extensive
905

Table 66: show interfaces Output Fields (Continued)
Field Name Field Description Level of Output
Output errors Output errors on the interface.
• Carrier transitions—Number of times the interface has gone fromdown to up. This number does not normally increment quickly,increasing only when the cable is unplugged, the far-end system ispowered down and then up, or another problem occurs. If thenumber of carrier transitions increments quickly (perhaps onceevery 10 seconds), the cable, the far-end system, or the PIC or PIMis malfunctioning.
• Errors—Sum of the outgoing frame terminates and FCS errors.
• Drops—Number of packets dropped by the output queue of the I/OManager ASIC. If the interface is saturated, this number incrementsonce for every packet that is dropped by the ASIC's REDmechanism.
• Collisions—Number of Ethernet collisions. The Gigabit Ethernet PICsupports only full-duplex operation, so for Gigabit Ethernet PICs,this number should always remain 0. If it is nonzero, there is asoftware bug.
• Aged packets—Number of packets that remained in shared packetSDRAM so long that the system automatically purged them. Thevalue in this field should never increment. If it does, it is most likely asoftware bug or possibly malfunctioning hardware.
• FIFO errors—Number of FIFO errors in the send direction asreported by the ASIC on the PIC. If this value is ever nonzero, thePIC is probably malfunctioning.
• HS link CRC errors—Number of errors on the high-speed linksbetween the ASICs responsible for handling the interfaces.
• MTU errors—Number of packets whose size exceeded the MTU ofthe interface.
• Resource errors—Sum of transmit drops.
extensive
Ingress queues Total number of ingress queues supported on the specified interface. extensive
906

Table 66: show interfaces Output Fields (Continued)
Field Name Field Description Level of Output
Queue counters andqueue number
CoS queue number and its associated user-configured forwarding classname.
• Queued packets—Number of queued packets.
• Transmitted packets—Number of transmitted packets.
• Dropped packets—Number of packets dropped by the ASIC's REDmechanism.
detail extensive
907

Table 66: show interfaces Output Fields (Continued)
Field Name Field Description Level of Output
MAC statistics Receive and Transmit statistics reported by the PIC's MAC subsystem,including the following:
• Total octets and total packets—Total number of octets and packets.
• Unicast packets, Broadcast packets, and Multicast packets—Numberof unicast, broadcast, and multicast packets.
• CRC/Align errors—Total number of packets received that had a length(excluding framing bits, but including FCS octets) of between 64 and1518 octets, inclusive, and had either a bad FCS with an integralnumber of octets (FCS Error) or a bad FCS with a nonintegralnumber of octets (Alignment Error).
• FIFO error—Number of FIFO errors that are reported by the ASIC onthe PIC. If this value is ever nonzero, the PIC or a cable is probablymalfunctioning.
• MAC control frames—Number of MAC control frames.
• MAC pause frames—Number of MAC control frames with pauseoperational code.
• Oversized frames—There are two possible conditions regarding thenumber of oversized frames:
• Packet length exceeds 1518 octets, or
• Packet length exceeds MRU
• Jabber frames—Number of frames that were longer than 1518 octets(excluding framing bits, but including FCS octets), and had either anFCS error or an alignment error. This definition of jabber is differentfrom the definition in IEEE-802.3 section 8.2.1.5 (10BASE5) andsection 10.3.1.4 (10BASE2). These documents define jabber as thecondition in which any packet exceeds 20 ms. The allowed range todetect jabber is from 20 ms to 150 ms.
• Fragment frames—Total number of packets that were less than 64octets in length (excluding framing bits, but including FCS octets)and had either an FCS error or an alignment error. Fragment frames
extensive
908

Table 66: show interfaces Output Fields (Continued)
Field Name Field Description Level of Output
normally increment because both runts (which are normaloccurrences caused by collisions) and noise hits are counted.
• VLAN tagged frames—Number of frames that are VLAN tagged. Thesystem uses the TPID of 0x8100 in the frame to determine whethera frame is tagged or not.
• Code violations—Number of times an event caused the PHY toindicate “Data reception error” or “invalid data symbol error.”
909

Table 66: show interfaces Output Fields (Continued)
Field Name Field Description Level of Output
Filter statistics Receive and Transmit statistics reported by the PIC's MAC address filtersubsystem. The filtering is done by the content-addressable memory(CAM) on the PIC. The filter examines a packet's source and destinationMAC addresses to determine whether the packet should enter thesystem or be rejected.
• Input packet count—Number of packets received from the MAChardware that the filter processed.
• Input packet rejects—Number of packets that the filter rejectedbecause of either the source MAC address or the destination MACaddress.
• Input DA rejects—Number of packets that the filter rejected becausethe destination MAC address of the packet is not on the accept list.It is normal for this value to increment. When it increments veryquickly and no traffic is entering the device from the far-end system,either there is a bad ARP entry on the far-end system, or multicastrouting is not on and the far-end system is sending many multicastpackets to the local device (which the router is rejecting).
• Input SA rejects—Number of packets that the filter rejected becausethe source MAC address of the packet is not on the accept list. Thevalue in this field should increment only if source MAC addressfiltering has been enabled. If filtering is enabled, if the valueincrements quickly, and if the system is not receiving traffic that itshould from the far-end system, it means that the user-configuredsource MAC addresses for this interface are incorrect.
• Output packet count—Number of packets that the filter has given tothe MAC hardware.
• Output packet pad count—Number of packets the filter padded to theminimum Ethernet size (60 bytes) before giving the packet to theMAC hardware. Usually, padding is done only on small ARP packets,but some very small IP packets can also require padding. If this valueincrements rapidly, either the system is trying to find an ARP entryfor a far-end system that does not exist or it is misconfigured.
• Output packet error count—Number of packets with an indicatederror that the filter was given to transmit. These packets are usually
extensive
910

Table 66: show interfaces Output Fields (Continued)
Field Name Field Description Level of Output
aged packets or are the result of a bandwidth problem on the FPChardware. On a normal system, the value of this field should notincrement.
• CAM destination filters, CAM source filters—Number of entries inthe CAM dedicated to destination and source MAC address filters.There can only be up to 64 source entries. If source filtering isdisabled, which is the default, the values for these fields should be 0.
Autonegotiationinformation
Information about link autonegotiation.
• Negotiation status:
• Incomplete—Ethernet interface has the speed or link modeconfigured.
• No autonegotiation—Remote Ethernet interface has the speed orlink mode configured, or does not perform autonegotiation.
• Complete—Ethernet interface is connected to a device thatperforms autonegotiation and the autonegotiation process issuccessful.
extensive
Packet ForwardingEngine configuration
Information about the configuration of the Packet Forwarding Engine:
• Destination slot—FPC slot number.
extensive
911
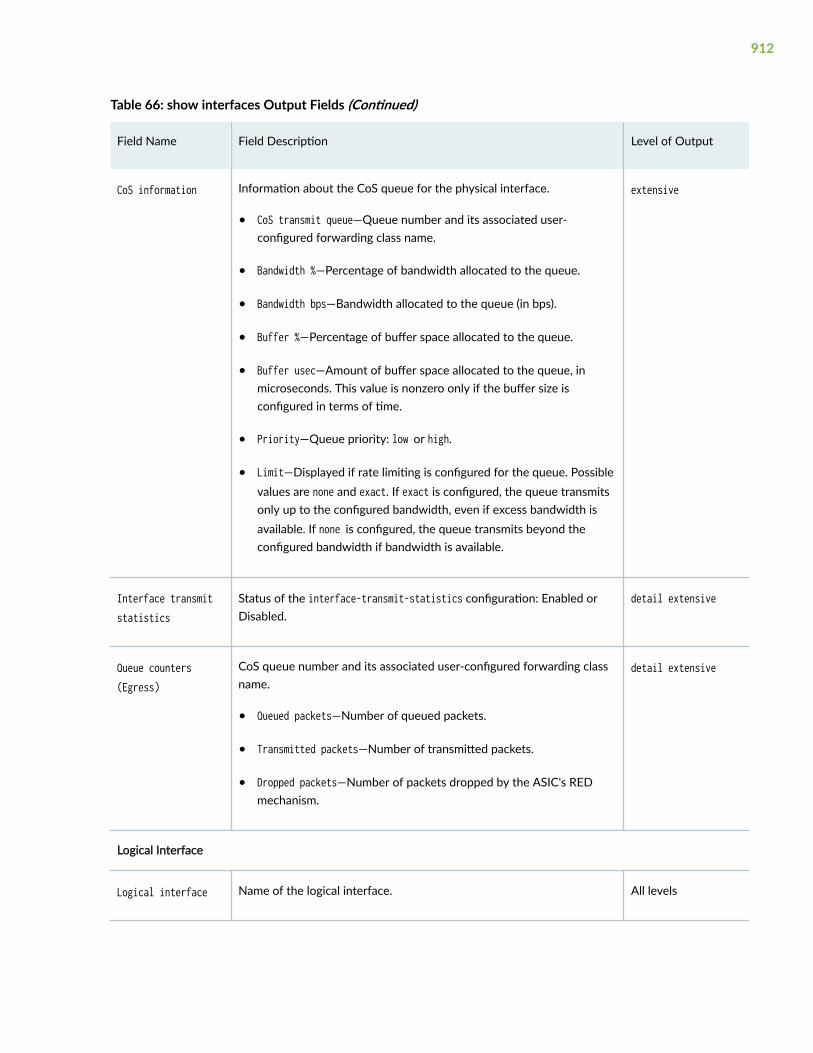
Table 66: show interfaces Output Fields (Continued)
Field Name Field Description Level of Output
CoS information Information about the CoS queue for the physical interface.
• CoS transmit queue—Queue number and its associated user-configured forwarding class name.
• Bandwidth %—Percentage of bandwidth allocated to the queue.
• Bandwidth bps—Bandwidth allocated to the queue (in bps).
• Buffer %—Percentage of buffer space allocated to the queue.
• Buffer usec—Amount of buffer space allocated to the queue, inmicroseconds. This value is nonzero only if the buffer size isconfigured in terms of time.
• Priority—Queue priority: low or high.
• Limit—Displayed if rate limiting is configured for the queue. Possiblevalues are none and exact. If exact is configured, the queue transmitsonly up to the configured bandwidth, even if excess bandwidth isavailable. If none is configured, the queue transmits beyond theconfigured bandwidth if bandwidth is available.
extensive
Interface transmitstatistics
Status of the interface-transmit-statistics configuration: Enabled orDisabled.
detail extensive
Queue counters(Egress)
CoS queue number and its associated user-configured forwarding classname.
• Queued packets—Number of queued packets.
• Transmitted packets—Number of transmitted packets.
• Dropped packets—Number of packets dropped by the ASIC's REDmechanism.
detail extensive
Logical Interface
Logical interface Name of the logical interface. All levels
912

Table 66: show interfaces Output Fields (Continued)
Field Name Field Description Level of Output
Index Index number of the logical interface, which reflects its initializationsequence.
detail extensivenone
SNMP ifIndex SNMP interface index number for the logical interface. detail extensivenone
Generation Unique number for use by Juniper Networks technical support only. detail extensive
Flags Information about the logical interface. All levels
Encapsulation Encapsulation on the logical interface. All levels
Traffic statistics Number and rate of bytes and packets received and transmitted on thespecified interface set.
• Input bytes, Output bytes—Number of bytes received andtransmitted on the interface set. The value in this field also includesthe Layer 2 overhead bytes for ingress or egress traffic on Ethernetinterfaces if you enable accounting of Layer 2 overhead at the PIClevel or the logical interface level.
• Input packets, Output packets—Number of packets received andtransmitted on the interface set.
detail extensive
Local statistics Number and rate of bytes and packets destined to the device. extensive
Transit statistics Number and rate of bytes and packets transiting the switch.
NOTE: For Gigabit Ethernet intelligent queuing 2 (IQ2) interfaces, thelogical interface egress statistics might not accurately reflect the trafficon the wire when output shaping is applied. Traffic management outputshaping might drop packets after they are tallied by the Output bytes andOutput packets interface counters. However, correct values display forboth of these egress statistics when per-unit scheduling is enabled forthe Gigabit Ethernet IQ2 physical interface, or when a single logicalinterface is actively using a shared scheduler.
extensive
913

Table 66: show interfaces Output Fields (Continued)
Field Name Field Description Level of Output
Security Security zones that interface belongs to. extensive
Flow Inputstatistics
Statistics on packets received by flow module. extensive
Flow Outputstatistics
Statistics on packets sent by flow module. extensive
Flow errorstatistics (Packetsdropped due to)
Statistics on errors in the flow module. extensive
Protocol Protocol family. detail extensivenone
MTU Maximum transmission unit size on the logical interface. detail extensivenone
Generation Unique number for use by Juniper Networks technical support only. detail extensive
Route Table Route table in which the logical interface address is located. Forexample, 0 refers to the routing table inet.0.
detail extensivenone
Flags Information about protocol family flags. . detail extensive
Addresses, Flags Information about the address flags.. detail extensivenone
Destination IP address of the remote side of the connection. detail extensivenone
914

Table 66: show interfaces Output Fields (Continued)
Field Name Field Description Level of Output
Local IP address of the logical interface. detail extensivenone
Broadcast Broadcast address of the logical interface. detail extensivenone
Generation Unique number for use by Juniper Networks technical support only. detail extensive
Sample Output
show interfaces Gigabit Ethernet
user@host> show interfaces ge-0/0/1 Physical interface: ge-0/0/1, Enabled, Physical link is Down Interface index: 135, SNMP ifIndex: 510 Link-level type: Ethernet, MTU: 1514, Link-mode: Full-duplex, Speed: 1000mbps, BPDU Error: None, MAC-REWRITE Error: None, Loopback: Disabled, Source filtering: Disabled, Flow control: Enabled, Auto-negotiation: Enabled, Remote fault: Online Device flags : Present Running Down Interface flags: Hardware-Down SNMP-Traps Internal: 0x0 Link flags : None CoS queues : 8 supported, 8 maximum usable queues Current address: 00:00:12:e4:b1:01, Hardware address: 00:00:12:e4:b1:01 Last flapped : 2015-05-12 08:36:59 UTC (1w1d 22:42 ago) Input rate : 0 bps (0 pps) Output rate : 0 bps (0 pps) Active alarms : LINK Active defects : LINK Interface transmit statistics: Disabled
Logical interface ge-0/0/1.0 (Index 71) (SNMP ifIndex 514) Flags: Device-Down SNMP-Traps 0x0 Encapsulation: ENET2
915

Input packets : 0 Output packets: 0 Security: Zone: public Protocol inet, MTU: 1500 Flags: Sendbcast-pkt-to-re Addresses, Flags: Dest-route-down Is-Preferred Is-Primary Destination: 10.1.1/24, Local: 10.1.1.1, Broadcast: 10.1.1.255
Sample Output
show interfaces brief (Gigabit Ethernet)
user@host> show interfaces ge-3/0/2 brief Physical interface: ge-3/0/2, Enabled, Physical link is Up Link-level type: 52, MTU: 1522, Speed: 1000mbps, Loopback: Disabled, Source filtering: Disabled, Flow control: Enabled, Auto-negotiation: Enabled, Remote fault: Online Device flags : Present Running Interface flags: SNMP-Traps Internal: 0x4000 Link flags : None
Logical interface ge-3/0/2.0 Flags: SNMP-Traps 0x4000 VLAN-Tag [ 0x8100.512 0x8100.513 ] In(pop-swap 0x8100.530) Out(swap-push 0x8100.512 0x8100.513) Encapsulation: VLAN-CCC ccc
Logical interface ge-3/0/2.32767 Flags: SNMP-Traps 0x4000 VLAN-Tag [ 0x0000.0 ] Encapsulation: ENET2
916

Sample Output
show interfaces detail (Gigabit Ethernet)
user@host> show interfaces ge-0/0/1 detail Physical interface: ge-0/0/1, Enabled, Physical link is Down Interface index: 135, SNMP ifIndex: 510, Generation: 138 Link-level type: Ethernet, MTU: 1514, Link-mode: Full-duplex, Speed: 1000mbps, BPDU Error: None, MAC-REWRITE Error: None, Loopback: Disabled, Source filtering: Disabled, Flow control: Enabled, Auto-negotiation: Enabled, Remote fault: Online Device flags : Present Running Down Interface flags: Hardware-Down SNMP-Traps Internal: 0x0 Link flags : None CoS queues : 8 supported, 8 maximum usable queues Hold-times : Up 0 ms, Down 0 ms Current address: 00:1f:12:e4:b1:01, Hardware address: 00:1f:12:e4:b1:01 Last flapped : 2015-05-12 08:36:59 UTC (1w2d 00:00 ago) Statistics last cleared: Never Traffic statistics: Input bytes : 0 0 bps Output bytes : 0 0 bps Input packets: 0 0 pps Output packets: 0 0 pps Egress queues: 8 supported, 4 in use Queue counters: Queued packets Transmitted packets Dropped packets 0 best-effort 0 0 0 1 expedited-fo 0 0 0 2 assured-forw 0 0 0 3 network-cont 0 0 0 Queue number: Mapped forwarding classes 0 best-effort 1 expedited-forwarding 2 assured-forwarding 3 network-control Active alarms : LINK Active defects : LINK Interface transmit statistics: Disabled Logical interface ge-0/0/1.0 (Index 71) (SNMP ifIndex 514) (Generation 136) Flags: Device-Down SNMP-Traps 0x0 Encapsulation: ENET2 Traffic statistics:
917

Input bytes : 0 Output bytes : 0 Input packets: 0 Output packets: 0 Local statistics: Input bytes : 0 Output bytes : 0 Input packets: 0 Output packets: 0 Transit statistics: Input bytes : 0 0 bps Output bytes : 0 0 bps Input packets: 0 0 pps Output packets: 0 0 pps Security: Zone: public Flow Statistics : Flow Input statistics : Self packets : 0 ICMP packets : 0 VPN packets : 0 Multicast packets : 0 Bytes permitted by policy : 0 Connections established : 0 Flow Output statistics: Multicast packets : 0 Bytes permitted by policy : 0 Flow error statistics (Packets dropped due to): Address spoofing: 0 Authentication failed: 0 Incoming NAT errors: 0 Invalid zone received packet: 0 Multiple user authentications: 0 Multiple incoming NAT: 0 No parent for a gate: 0 No one interested in self packets: 0 No minor session: 0 No more sessions: 0 No NAT gate: 0 No route present: 0 No SA for incoming SPI: 0 No tunnel found: 0 No session for a gate: 0 No zone or NULL zone binding 0
918

Policy denied: 0 Security association not active: 0 TCP sequence number out of window: 0 Syn-attack protection: 0 User authentication errors: 0 Protocol inet, MTU: 1500, Generation: 150, Route table: 0 Flags: Sendbcast-pkt-to-re Addresses, Flags: Dest-route-down Is-Preferred Is-Primary Destination: 10.1.1/24, Local: 10.1.1.1, Broadcast: 10.1.1.255, Generation: 150
Sample Output
show interfaces extensive (Gigabit Ethernet)
user@host> show interfaces ge-0/0/1.0 extensive Physical interface: ge-0/0/1, Enabled, Physical link is Down Interface index: 135, SNMP ifIndex: 510, Generation: 138 Link-level type: Ethernet, MTU: 1514, Link-mode: Full-duplex, Speed: 1000mbps, BPDU Error: None, MAC-REWRITE Error: None, Loopback: Disabled, Source filtering: Disabled, Flow control: Enabled, Auto-negotiation: Enabled, Remote fault: Online Device flags : Present Running Down Interface flags: Hardware-Down SNMP-Traps Internal: 0x0 Link flags : None CoS queues : 8 supported, 8 maximum usable queues Hold-times : Up 0 ms, Down 0 ms Current address: 00:1f:12:e4:b1:01, Hardware address: 00:1f:12:e4:b1:01 Last flapped : 2015-05-12 08:36:59 UTC (1w1d 22:57 ago) Statistics last cleared: Never Traffic statistics: Input bytes : 0 0 bps Output bytes : 0 0 bps Input packets: 0 0 pps Output packets: 0 0 pps Input errors: Errors: 0, Drops: 0, Framing errors: 0, Runts: 0, Policed discards: 0, L3 incompletes: 0, L2 channel errors: 0, L2 mismatch timeouts: 0, FIFO errors: 0, Resource errors: 0 Output errors:
919

Carrier transitions: 0, Errors: 0, Drops: 0, Collisions: 0, Aged packets: 0, FIFO errors: 0, HS link CRC errors: 0, MTU errors: 0, Resource errors: 0 Egress queues: 8 supported, 4 in use Queue counters: Queued packets Transmitted packets Dropped packets 0 best-effort 0 0 0 1 expedited-fo 0 0 0 2 assured-forw 0 0 0 3 network-cont 0 0 0 Queue number: Mapped forwarding classes 0 best-effort 1 expedited-forwarding 2 assured-forwarding 3 network-control Active alarms : LINK Active defects : LINK MAC statistics: Receive Transmit Total octets 0 0 Total packets 0 0 Unicast packets 0 0 Broadcast packets 0 0 Multicast packets 0 0 CRC/Align errors 0 0 FIFO errors 0 0 MAC control frames 0 0 MAC pause frames 0 0 Oversized frames 0 Jabber frames 0 Fragment frames 0 VLAN tagged frames 0 Code violations 0 Filter statistics: Input packet count 0 Input packet rejects 0 Input DA rejects 0 Input SA rejects 0 Output packet count 0 Output packet pad count 0 Output packet error count 0 CAM destination filters: 2, CAM source filters: 0 Autonegotiation information: Negotiation status: Incomplete Packet Forwarding Engine configuration: Destination slot: 0
920
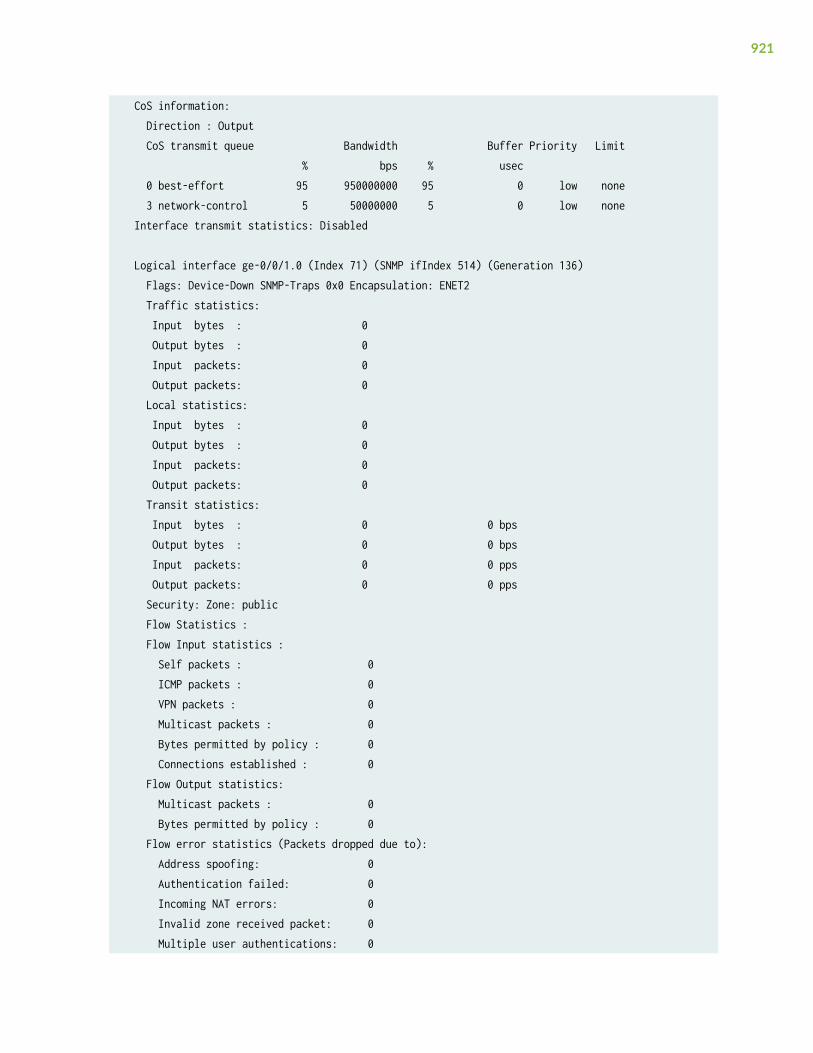
CoS information: Direction : Output CoS transmit queue Bandwidth Buffer Priority Limit % bps % usec 0 best-effort 95 950000000 95 0 low none 3 network-control 5 50000000 5 0 low none Interface transmit statistics: Disabled Logical interface ge-0/0/1.0 (Index 71) (SNMP ifIndex 514) (Generation 136) Flags: Device-Down SNMP-Traps 0x0 Encapsulation: ENET2 Traffic statistics: Input bytes : 0 Output bytes : 0 Input packets: 0 Output packets: 0 Local statistics: Input bytes : 0 Output bytes : 0 Input packets: 0 Output packets: 0 Transit statistics: Input bytes : 0 0 bps Output bytes : 0 0 bps Input packets: 0 0 pps Output packets: 0 0 pps Security: Zone: public Flow Statistics : Flow Input statistics : Self packets : 0 ICMP packets : 0 VPN packets : 0 Multicast packets : 0 Bytes permitted by policy : 0 Connections established : 0 Flow Output statistics: Multicast packets : 0 Bytes permitted by policy : 0 Flow error statistics (Packets dropped due to): Address spoofing: 0 Authentication failed: 0 Incoming NAT errors: 0 Invalid zone received packet: 0 Multiple user authentications: 0
921

Multiple incoming NAT: 0 No parent for a gate: 0 No one interested in self packets: 0 No minor session: 0 No more sessions: 0 No NAT gate: 0 No route present: 0 No SA for incoming SPI: 0 No tunnel found: 0 No session for a gate: 0 No zone or NULL zone binding 0 Policy denied: 0 Security association not active: 0 TCP sequence number out of window: 0 Syn-attack protection: 0 User authentication errors: 0 Protocol inet, MTU: 1500, Generation: 150, Route table: 0 Flags: Sendbcast-pkt-to-re Addresses, Flags: Dest-route-down Is-Preferred Is-Primary Destination: 10.1.1/24, Local: 10.1.1.1, Broadcast: 10.1.1.255, Generation: 150
Sample Output
show interfaces terse
user@host> show interfaces terse Interface Admin Link Proto Local Remote ge-0/0/0 up up ge-0/0/0.0 up up inet 10.209.4.61/18 gr-0/0/0 up up ip-0/0/0 up up st0 up up st0.1 up ready inet ls-0/0/0 up up lt-0/0/0 up up mt-0/0/0 up up
922

pd-0/0/0 up up pe-0/0/0 up up e3-1/0/0 up up t3-2/0/0 up up e1-3/0/0 up up se-4/0/0 up down t1-5/0/0 up up br-6/0/0 up up dc-6/0/0 up up dc-6/0/0.32767 up up bc-6/0/0:1 down up bc-6/0/0:1.0 up down dl0 up up dl0.0 up up inet dsc up up gre up up ipip up up lo0 up up lo0.16385 up up inet 10.0.0.1 --> 0/0 10.0.0.16 --> 0/0 lsi up up mtun up up pimd up up pime up up pp0 up up
Sample Output
show interfaces controller (Channelized E1 IQ with Logical E1)
user@host> show interfaces controller ce1-1/2/6
Controller Admin Linkce1-1/2/6 up upe1-1/2/6 up up
923

show interfaces controller (Channelized E1 IQ with Logical DS0)
user@host> show interfaces controller ce1-1/2/3
Controller Admin Linkce1-1/2/3 up up ds-1/2/3:1 up up ds-1/2/3:2 up up
Sample Output
show interfaces descriptions
user@host> show interfaces descriptions Interface Admin Link Description so-1/0/0 up up M20-3#1 so-2/0/0 up up GSR-12#1 ge-3/0/0 up up SMB-OSPF_Area300 so-3/3/0 up up GSR-13#1 so-3/3/1 up up GSR-13#2 ge-4/0/0 up up T320-7#1 ge-5/0/0 up up T320-7#2 so-7/1/0 up up M160-6#1 ge-8/0/0 up up T320-7#3 ge-9/0/0 up up T320-7#4 so-10/0/0 up up M160-6#2 so-13/0/0 up up M20-3#2 so-14/0/0 up up GSR-12#2 ge-15/0/0 up up SMB-OSPF_Area100 ge-15/0/1 up up GSR-13#3
924

Sample Output
show interfaces destination-class all
user@host> show interfaces destination-class allLogical interface so-4/0/0.0 Packets Bytes Destination class (packet-per-second) (bits-per-second) gold 0 0 ( 0) ( 0) silver 0 0 ( 0) ( 0) Logical interface so-0/1/3.0 Packets Bytes Destination class (packet-per-second) (bits-per-second) gold 0 0 ( 0) ( 0) silver 0 0 ( 0) ( 0)
Sample Output
show interfaces diagnostics optics
user@host> show interfaces diagnostics optics ge-2/0/0 Physical interface: ge-2/0/0 Laser bias current : 7.408 mA Laser output power : 0.3500 mW / -4.56 dBm Module temperature : 23 degrees C / 73 degrees F Module voltage : 3.3450 V Receiver signal average optical power : 0.0002 mW / -36.99 dBm Laser bias current high alarm : Off Laser bias current low alarm : Off Laser bias current high warning : Off Laser bias current low warning : Off Laser output power high alarm : Off Laser output power low alarm : Off Laser output power high warning : Off
925

Laser output power low warning : Off Module temperature high alarm : Off Module temperature low alarm : Off Module temperature high warning : Off Module temperature low warning : Off Module voltage high alarm : Off Module voltage low alarm : Off Module voltage high warning : Off Module voltage low warning : Off Laser rx power high alarm : Off Laser rx power low alarm : On Laser rx power high warning : Off Laser rx power low warning : On Laser bias current high alarm threshold : 17.000 mA Laser bias current low alarm threshold : 1.000 mA Laser bias current high warning threshold : 14.000 mA Laser bias current low warning threshold : 2.000 mA Laser output power high alarm threshold : 0.6310 mW / -2.00 dBm Laser output power low alarm threshold : 0.0670 mW / -11.74 dBm Laser output power high warning threshold : 0.6310 mW / -2.00 dBm Laser output power low warning threshold : 0.0790 mW / -11.02 dBm Module temperature high alarm threshold : 95 degrees C / 203 degrees F Module temperature low alarm threshold : -25 degrees C / -13 degrees F Module temperature high warning threshold : 90 degrees C / 194 degrees F Module temperature low warning threshold : -20 degrees C / -4 degrees F Module voltage high alarm threshold : 3.900 V Module voltage low alarm threshold : 2.700 V Module voltage high warning threshold : 3.700 V Module voltage low warning threshold : 2.900 V Laser rx power high alarm threshold : 1.2590 mW / 1.00 dBm Laser rx power low alarm threshold : 0.0100 mW / -20.00 dBm Laser rx power high warning threshold : 0.7940 mW / -1.00 dBm Laser rx power low warning threshold : 0.0158 mW / -18.01 dBm
926

Sample Output
show interfaces far-end-interval coc12-5/2/0
user@host> show interfaces far-end-interval coc12-5/2/0Physical interface: coc12-5/2/0, SNMP ifIndex: 121 05:30-current: ES-L: 1, SES-L: 1, UAS-L: 0 05:15-05:30: ES-L: 0, SES-L: 0, UAS-L: 0 05:00-05:15: ES-L: 0, SES-L: 0, UAS-L: 0 04:45-05:00: ES-L: 0, SES-L: 0, UAS-L: 0 04:30-04:45: ES-L: 0, SES-L: 0, UAS-L: 0 04:15-04:30: ES-L: 0, SES-L: 0, UAS-L: 0 04:00-04:15:...
show interfaces far-end-interval coc1-5/2/1:1
user@host> run show interfaces far-end-interval coc1-5/2/1:1 Physical interface: coc1-5/2/1:1, SNMP ifIndex: 342 05:30-current: ES-L: 1, SES-L: 1, UAS-L: 0, ES-P: 0, SES-P: 0, UAS-P: 0 05:15-05:30: ES-L: 0, SES-L: 0, UAS-L: 0, ES-P: 0, SES-P: 0, UAS-P: 0 05:00-05:15: ES-L: 0, SES-L: 0, UAS-L: 0, ES-P: 0, SES-P: 0, UAS-P: 0 04:45-05:00: ES-L: 0, SES-L: 0, UAS-L: 0, ES-P: 0, SES-P: 0, UAS-P: 0 04:30-04:45: ES-L: 0, SES-L: 0, UAS-L: 0, ES-P: 0, SES-P: 0, UAS-P: 0 04:15-04:30: ES-L: 0, SES-L: 0, UAS-L: 0, ES-P: 0, SES-P: 0, UAS-P: 0 04:00-04:15:
927

Sample Output
show interfaces filters
user@host> show interfaces filters Interface Admin Link Proto Input Filter Output Filterge-0/0/0 up upge-0/0/0.0 up up inet isoge-5/0/0 up up ge-5/0/0.0 up up any f-any inet f-inet multiservicegr-0/3/0 up upip-0/3/0 up upmt-0/3/0 up uppd-0/3/0 up uppe-0/3/0 up upvt-0/3/0 up upat-1/0/0 up upat-1/0/0.0 up up inet isoat-1/1/0 up downat-1/1/0.0 up down inet iso....
Sample Output
show interfaces flow-statistics (Gigabit Ethernet)
user@host> show interfaces flow-statistics ge-0/0/1.0 Logical interface ge-0/0/1.0 (Index 70) (SNMP ifIndex 49) Flags: SNMP-Traps Encapsulation: ENET2 Input packets : 5161 Output packets: 83 Security: Zone: zone2 Allowed host-inbound traffic : bootp bfd bgp dns dvmrp ldp msdp nhrp ospf pgm
928

pim rip router-discovery rsvp sap vrrp dhcp finger ftp tftp ident-reset http https ike netconf ping rlogin rpm rsh snmp snmp-trap ssh telnet traceroute xnm-clear-text xnm-ssl lsping Flow Statistics : Flow Input statistics : Self packets : 0 ICMP packets : 0 VPN packets : 2564 Bytes permitted by policy : 3478 Connections established : 1 Flow Output statistics: Multicast packets : 0 Bytes permitted by policy : 16994 Flow error statistics (Packets dropped due to): Address spoofing: 0 Authentication failed: 0 Incoming NAT errors: 0 Invalid zone received packet: 0 Multiple user authentications: 0 Multiple incoming NAT: 0 No parent for a gate: 0 No one interested in self packets: 0 No minor session: 0 No more sessions: 0 No NAT gate: 0 No route present: 0 No SA for incoming SPI: 0 No tunnel found: 0 No session for a gate: 0 No zone or NULL zone binding 0 Policy denied: 0 Security association not active: 0 TCP sequence number out of window: 0 Syn-attack protection: 0 User authentication errors: 0 Protocol inet, MTU: 1500 Flags: None Addresses, Flags: Is-Preferred Is-Primary Destination: 203.0.113.1/24, Local: 203.0.113.2, Broadcast: 203.0.113.255
929

Sample Output
show interfaces interval (Channelized OC12)
user@host> show interfaces interval t3-0/3/0:0 Physical interface: t3-0/3/0:0, SNMP ifIndex: 23 17:43-current: LCV: 0, PCV: 0, CCV: 0, LES: 0, PES: 0, PSES: 0, CES: 0, CSES: 0, SEFS: 0, UAS: 0 17:28-17:43: LCV: 0, PCV: 0, CCV: 0, LES: 0, PES: 0, PSES: 0, CES: 0, CSES: 0, SEFS: 0, UAS: 0 17:13-17:28: LCV: 0, PCV: 0, CCV: 0, LES: 0, PES: 0, PSES: 0, CES: 0, CSES: 0, SEFS: 0, UAS: 0 16:58-17:13: LCV: 0, PCV: 0, CCV: 0, LES: 0, PES: 0, PSES: 0, CES: 0, CSES: 0, SEFS: 0, UAS: 0 16:43-16:58: LCV: 0, PCV: 0, CCV: 0, LES: 0, PES: 0, PSES: 0, CES: 0, CSES: 0, ...Interval Total: LCV: 230, PCV: 1145859, CCV: 455470, LES: 0, PES: 230, PSES: 230, CES: 230, CSES: 230, SEFS: 230, UAS: 238
show interfaces interval (E3)
user@host> show interfaces interval e3-0/3/0 Physical interface: e3-0/3/0, SNMP ifIndex: 23 17:43-current: LCV: 0, PCV: 0, CCV: 0, LES: 0, PES: 0, PSES: 0, CES: 0, CSES: 0, SEFS: 0, UAS: 0 17:28-17:43: LCV: 0, PCV: 0, CCV: 0, LES: 0, PES: 0, PSES: 0, CES: 0, CSES: 0, SEFS: 0, UAS: 0 17:13-17:28: LCV: 0, PCV: 0, CCV: 0, LES: 0, PES: 0, PSES: 0, CES: 0, CSES: 0, SEFS: 0, UAS: 0 16:58-17:13: LCV: 0, PCV: 0, CCV: 0, LES: 0, PES: 0, PSES: 0, CES: 0, CSES: 0,
930

SEFS: 0, UAS: 0 16:43-16:58: LCV: 0, PCV: 0, CCV: 0, LES: 0, PES: 0, PSES: 0, CES: 0, CSES: 0, ....Interval Total: LCV: 230, PCV: 1145859, CCV: 455470, LES: 0, PES: 230, PSES: 230, CES: 230, CSES: 230, SEFS: 230, UAS: 238
show interfaces interval (SONET/SDH)
user@host> show interfaces interval so-0/1/0 Physical interface: so-0/1/0, SNMP ifIndex: 19 20:02-current: ES-S: 0, SES-S: 0, SEFS-S: 0, ES-L: 0, SES-L: 0, UAS-L: 0, ES-P: 0, SES-P: 0, UAS-P: 0 19:47-20:02: ES-S: 267, SES-S: 267, SEFS-S: 267, ES-L: 267, SES-L: 267, UAS-L: 267, ES-P: 267, SES-P: 267, UAS-P: 267 19:32-19:47: ES-S: 56, SES-S: 56, SEFS-S: 56, ES-L: 56, SES-L: 56, UAS-L: 46, ES-P: 56, SES-P: 56, UAS-P: 46 19:17-19:32: ES-S: 0, SES-S: 0, SEFS-S: 0, ES-L: 0, SES-L: 0, UAS-L: 0, ES-P: 0, SES-P: 0, UAS-P: 0 19:02-19:17:.....
Sample Output
show interfaces load-balancing
user@host> show interfaces load-balancingInterface State Last change Member countams0 Up 1d 00:50 2ams1 Up 00:00:59 2
931

show interfaces load-balancing detail
user@host>show interfaces load-balancing detailLoad-balancing interfaces detailInterface : ams0 State : Up Last change : 1d 00:51 Member count : 2 Members : Interface Weight State mams-2/0/0 10 Active mams-2/1/0 10 Active
Sample Output
show interfaces mac-database (All MAC Addresses on a Port)
user@host> show interfaces mac-database xe-0/3/3 Physical interface: xe-0/3/3, Enabled, Physical link is Up Interface index: 372, SNMP ifIndex: 788 Link-level type: Ethernet, MTU: 1514, LAN-PHY mode, Speed: 10Gbps, Loopback: None, Source filtering: Disabled, Flow control: Enabled Device flags : Present Running Interface flags: SNMP-Traps Internal: 0x4000 Link flags : None
Logical interface xe-0/3/3.0 (Index 364) (SNMP ifIndex 829) Flags: SNMP-Traps 0x4004000 Encapsulation: ENET2 MAC address Input frames Input bytes Output frames Output bytes 00:00:00:00:00:00 1 56 0 0 00:00:c0:01:01:02 7023810 323095260 0 0 00:00:c0:01:01:03 7023810 323095260 0 0 00:00:c0:01:01:04 7023810 323095260 0 0 00:00:c0:01:01:05 7023810 323095260 0 0 00:00:c0:01:01:06 7023810 323095260 0 0 00:00:c0:01:01:07 7023810 323095260 0 0
932

00:00:c0:01:01:08 7023809 323095214 0 0 00:00:c0:01:01:09 7023809 323095214 0 0 00:00:c0:01:01:0a 7023809 323095214 0 0 00:00:c0:01:01:0b 7023809 323095214 0 0 00:00:c8:01:01:02 30424784 1399540064 37448598 1722635508 00:00:c8:01:01:03 30424784 1399540064 37448598 1722635508 00:00:c8:01:01:04 30424716 1399536936 37448523 1722632058 00:00:c8:01:01:05 30424789 1399540294 37448598 1722635508 00:00:c8:01:01:06 30424788 1399540248 37448597 1722635462 00:00:c8:01:01:07 30424783 1399540018 37448597 1722635462 00:00:c8:01:01:08 30424783 1399540018 37448596 1722635416 00:00:c8:01:01:09 8836796 406492616 8836795 406492570 00:00:c8:01:01:0a 30424712 1399536752 37448521 1722631966 00:00:c8:01:01:0b 30424715 1399536890 37448523 1722632058 Number of MAC addresses : 21
show interfaces mac-database (All MAC Addresses on a Service)
user@host> show interfaces mac-database xe-0/3/3 Logical interface xe-0/3/3.0 (Index 364) (SNMP ifIndex 829) Flags: SNMP-Traps 0x4004000 Encapsulation: ENET2 MAC address Input frames Input bytes Output frames Output bytes 00:00:00:00:00:00 1 56 0 0 00:00:c0:01:01:02 7023810 323095260 0 0 00:00:c0:01:01:03 7023810 323095260 0 0 00:00:c0:01:01:04 7023810 323095260 0 0 00:00:c0:01:01:05 7023810 323095260 0 0 00:00:c0:01:01:06 7023810 323095260 0 0 00:00:c0:01:01:07 7023810 323095260 0 0 00:00:c0:01:01:08 7023809 323095214 0 0 00:00:c0:01:01:09 7023809 323095214 0 0 00:00:c0:01:01:0a 7023809 323095214 0 0 00:00:c0:01:01:0b 7023809 323095214 0 0 00:00:c8:01:01:02 31016568 1426762128 38040381 1749857526 00:00:c8:01:01:03 31016568 1426762128 38040382 1749857572 00:00:c8:01:01:04 31016499 1426758954 38040306 1749854076 00:00:c8:01:01:05 31016573 1426762358 38040381 1749857526 00:00:c8:01:01:06 31016573 1426762358 38040381 1749857526 00:00:c8:01:01:07 31016567 1426762082 38040380 1749857480 00:00:c8:01:01:08 31016567 1426762082 38040379 1749857434
933

00:00:c8:01:01:09 9428580 433714680 9428580 433714680 00:00:c8:01:01:0a 31016496 1426758816 38040304 1749853984 00:00:c8:01:01:0b 31016498 1426758908 38040307 1749854122
show interfaces mac-database mac-address
user@host> show interfaces mac-database xe-0/3/3 mac-address 00:00:c8:01:01:09 Physical interface: xe-0/3/3, Enabled, Physical link is Up Interface index: 372, SNMP ifIndex: 788 Link-level type: Ethernet, MTU: 1514, LAN-PHY mode, Speed: 10Gbps, Loopback: None, Source filtering: Disabled, Flow control: Enabled Device flags : Present Running Interface flags: SNMP-Traps Internal: 0x4000 Link flags : None
Logical interface xe-0/3/3.0 (Index 364) (SNMP ifIndex 829) Flags: SNMP-Traps 0x4004000 Encapsulation: ENET2 MAC address: 00:00:c8:01:01:09, Type: Configured, Input bytes : 202324652 Output bytes : 202324560 Input frames : 4398362 Output frames : 4398360 Policer statistics: Policer type Discarded frames Discarded bytes Output aggregate 3992386 183649756
Sample Output
show interfaces mc-ae
user@host> show interfaces mc-ae ae0 unit 512 Member Links : ae0 Local Status : active Peer Status : active Logical Interface : ae0.512
934

Core Facing Interface : Label Ethernet Interface ICL-PL : Label Ethernet Interface
show interfaces media (SONET/SDH)
The following example displays the output fields unique to the show interfaces media command for aSONET interface (with no level of output specified):
user@host> show interfaces media so-4/1/2Physical interface: so-4/1/2, Enabled, Physical link is Up Interface index: 168, SNMP ifIndex: 495 Link-level type: PPP, MTU: 4474, Clocking: Internal, SONET mode, Speed: OC48, Loopback: None, FCS: 16, Payload scrambler: Enabled Device flags : Present Running Interface flags: Point-To-Point SNMP-Traps 16384 Link flags : Keepalives Keepalive settings: Interval 10 seconds, Up-count 1, Down-count 3 Keepalive: Input: 1783 (00:00:00 ago), Output: 1786 (00:00:08 ago) LCP state: Opened NCP state: inet: Not-configured, inet6: Not-configured, iso: Not-configured, mpls: Not-configured CHAP state: Not-configured CoS queues : 8 supported Last flapped : 2005-06-15 12:14:59 PDT (04:31:29 ago) Input rate : 0 bps (0 pps) Output rate : 0 bps (0 pps) SONET alarms : None SONET defects : None SONET errors: BIP-B1: 121, BIP-B2: 916, REI-L: 0, BIP-B3: 137, REI-P: 16747, BIP-BIP2: 0 Received path trace: routerb so-1/1/2 Transmitted path trace: routera so-4/1/2
935

Sample Output
show interfaces policers
user@host> show interfaces policersInterface Admin Link Proto Input Policer Output Policerge-0/0/0 up upge-0/0/0.0 up up inet isogr-0/3/0 up upip-0/3/0 up upmt-0/3/0 up uppd-0/3/0 up uppe-0/3/0 up up...so-2/0/0 up upso-2/0/0.0 up up inet so-2/0/0.0-in-policer so-2/0/0.0-out-policer isoso-2/1/0 up down...
show interfaces policers interface-name
user@host> show interfaces policers so-2/1/0Interface Admin Link Proto Input Policer Output Policerso-2/1/0 up downso-2/1/0.0 up down inet so-2/1/0.0-in-policer so-2/1/0.0-out-policer iso inet6
Sample Output
show interfaces queue
936

The following truncated example shows the CoS queue sizes for queues 0, 1, and 3. Queue 1 has aqueue buffer size (guaranteed allocated memory) of 9192 bytes.
user@host> show interfaces queue Physical interface: ge-0/0/0, Enabled, Physical link is Up Interface index: 134, SNMP ifIndex: 509Forwarding classes: 8 supported, 8 in useEgress queues: 8 supported, 8 in useQueue: 0, Forwarding classes: class0 Queued: Packets : 0 0 pps Bytes : 0 0 bps Transmitted: Packets : 0 0 pps Bytes : 0 0 bps Tail-dropped packets : 0 0 pps RL-dropped packets : 0 0 pps RL-dropped bytes : 0 0 bps RED-dropped packets : 0 0 pps Low : 0 0 pps Medium-low : 0 0 pps Medium-high : 0 0 pps High : 0 0 pps RED-dropped bytes : 0 0 bps Low : 0 0 bps Medium-low : 0 0 bps Medium-high : 0 0 bps High : 0 0 bps Queue Buffer Usage: Reserved buffer : 118750000 bytes Queue-depth bytes : Current : 0....Queue: 1, Forwarding classes: class1.... Queue Buffer Usage: Reserved buffer : 9192 bytes Queue-depth bytes : Current : 0..
937

..Queue: 3, Forwarding classes: class3 Queued:....Queue Buffer Usage: Reserved buffer : 6250000 bytes Queue-depth bytes : Current : 0....
Sample Output
show interfaces redundancy
user@host> show interfaces redundancy Interface State Last change Primary Secondary Current statusrsp0 Not present sp-1/0/0 sp-0/2/0 both downrsp1 On secondary 1d 23:56 sp-1/2/0 sp-0/3/0 primary downrsp2 On primary 10:10:27 sp-1/3/0 sp-0/2/0 secondary down rlsq0 On primary 00:06:24 lsq-0/3/0 lsq-1/0/0 both up
show interfaces redundancy (Aggregated Ethernet)
user@host> show interfaces redundancyInterface State Last change Primary Secondary Current statusrlsq0 On secondary 00:56:12 lsq-4/0/0 lsq-3/0/0 both up ae0 ae1 ae2 ae3 ae4
938

show interfaces redundancy detail
user@host> show interfaces redundancy detailInterface : rlsq0 State : On primary Last change : 00:45:47 Primary : lsq-0/2/0 Secondary : lsq-1/2/0 Current status : both up Mode : hot-standby
Interface : rlsq0:0 State : On primary Last change : 00:45:46 Primary : lsq-0/2/0:0 Secondary : lsq-1/2/0:0 Current status : both up Mode : warm-standby
Sample Output
show interfaces routing brief
user@host> show interfaces routing brief Interface State Addressesso-5/0/3.0 Down ISO enabledso-5/0/2.0 Up MPLS enabled ISO enabled INET 192.168.2.120 INET enabledso-5/0/1.0 Up MPLS enabled ISO enabled INET 192.168.2.130 INET enabledat-1/0/0.3 Up CCC enabledat-1/0/0.2 Up CCC enabledat-1/0/0.0 Up ISO enabled INET 192.168.90.10
939

INET enabledlo0.0 Up ISO 47.0005.80ff.f800.0000.0108.0001.1921.6800.5061.00 ISO enabled INET 127.0.0.1fxp1.0 Upfxp0.0 Up INET 192.168.6.90
show interfaces routing detail
user@host> show interfaces routing detail so-5/0/3.0 Index: 15, Refcount: 2, State: Up <Broadcast PointToPoint Multicast> Change:<> Metric: 0, Up/down transitions: 0, Full-duplex Link layer: HDLC serial line Encapsulation: PPP Bandwidth: 155Mbps ISO address (null) State: <Broadcast PointToPoint Multicast> Change: <> Preference: 0 (120 down), Metric: 0, MTU: 4470 bytesso-5/0/2.0 Index: 14, Refcount: 7, State: <Up Broadcast PointToPoint Multicast> Change:<> Metric: 0, Up/down transitions: 0, Full-duplex Link layer: HDLC serial line Encapsulation: PPP Bandwidth: 155Mbps MPLS address (null) State: <Up Broadcast PointToPoint Multicast> Change: <> Preference: 0 (120 down), Metric: 0, MTU: 4458 bytes ISO address (null) State: <Up Broadcast PointToPoint Multicast> Change: <> Preference: 0 (120 down), Metric: 0, MTU: 4470 bytes INET address 192.168.2.120 State: <Up Broadcast PointToPoint Multicast Localup> Change: <> Preference: 0 (120 down), Metric: 0, MTU: 4470 bytes Local address: 192.168.2.120 Destination: 192.168.2.110/32 INET address (null) State: <Up Broadcast PointToPoint Multicast> Change: <> Preference: 0 (120 down), Metric: 0, MTU: 4470 bytes...
940

Sample Output
show interfaces routing-instance all
user@host> show interfaces terse routing-instance allInterface Admin Link Proto Local Remote Instance at-0/0/1 up up inet 10.0.0.1/24ge-0/0/0.0 up up inet 192.168.4.28/24 sample-a at-0/1/0.0 up up inet6 fe80::a:0:0:4/64 sample-b so-0/0/0.0 up up inet 10.0.0.1/32
Sample Output
show interfaces snmp-index
user@host> show interfaces snmp-index 33Physical interface: so-2/1/1, Enabled, Physical link is Down Interface index: 149, SNMP ifIndex: 33 Link-level type: PPP, MTU: 4474, Clocking: Internal, SONET mode, Speed: OC48, Loopback: None, FCS: 16, Payload scrambler: Enabled Device flags : Present Running Down Interface flags: Hardware-Down Point-To-Point SNMP-Traps 16384 Link flags : Keepalives CoS queues : 8 supported Last flapped : 2005-06-15 11:45:57 PDT (05:38:43 ago) Input rate : 0 bps (0 pps) Output rate : 0 bps (0 pps) SONET alarms : LOL, PLL, LOS SONET defects : LOL, PLL, LOF, LOS, SEF, AIS-L, AIS-P
941

Sample Output
show interfaces source-class all
user@host> show interfaces source-class allLogical interface so-0/1/0.0 Packets Bytes Source class (packet-per-second) (bits-per-second) gold 1928095 161959980 ( 889) ( 597762) bronze 0 0 ( 0) ( 0) silver 0 0 ( 0) ( 0) Logical interface so-0/1/3.0 Packets Bytes Source class (packet-per-second) (bits-per-second) gold 0 0 ( 0) ( 0) bronze 0 0 ( 0) ( 0) silver 116113 9753492 ( 939) ( 631616)
Sample Output
show interfaces statistics (Fast Ethernet)
user@host> show interfaces fe-1/3/1 statisticsPhysical interface: fe-1/3/1, Enabled, Physical link is Up Interface index: 144, SNMP ifIndex: 1042 Description: ford fe-1/3/1 Link-level type: Ethernet, MTU: 1514, Speed: 100mbps, Loopback: Disabled, Source filtering: Disabled, Flow control: Enabled Device flags : Present Running Interface flags: SNMP-Traps Internal: 0x4000 CoS queues : 4 supported, 4 maximum usable queues Current address: 00:90:69:93:04:dc, Hardware address: 00:90:69:93:04:dc
942

Last flapped : 2006-04-18 03:08:59 PDT (00:01:24 ago) Statistics last cleared: Never Input rate : 0 bps (0 pps) Output rate : 0 bps (0 pps) Input errors: 0, Output errors: 0 Active alarms : None Active defects : None Logical interface fe-1/3/1.0 (Index 69) (SNMP ifIndex 50) Flags: SNMP-Traps Encapsulation: ENET2 Protocol inet, MTU: 1500 Flags: Is-Primary, DCU, SCU-in Packets Bytes Destination class (packet-per-second) (bits-per-second) silver1 0 0 ( 0) ( 0) silver2 0 0 ( 0) ( 0) silver3 0 0 ( 0) ( 0) Addresses, Flags: Is-Default Is-Preferred Is-Primary Destination: 10.27.245/24, Local: 10.27.245.2, Broadcast: 10.27.245.255 Protocol iso, MTU: 1497 Flags: Is-Primary
Sample Output
show interfaces switch-port
user@host# show interfaces ge-slot/0/0 switch-port port-numberPort 0, Physical link is Up Speed: 100mbps, Auto-negotiation: Enabled Statistics: Receive Transmit Total bytes 28437086 21792250 Total packets 409145 88008 Unicast packets 9987 83817 Multicast packets 145002 0 Broadcast packets 254156 4191 Multiple collisions 23 10
943

FIFO/CRC/Align errors 0 0 MAC pause frames 0 0 Oversized frames 0 Runt frames 0 Jabber frames 0 Fragment frames 0 Discarded frames 0 Autonegotiation information: Negotiation status: Complete Link partner: Link mode: Full-duplex, Flow control: None, Remote fault: OK, Link partner Speed: 100 Mbps Local resolution: Flow control: None, Remote fault: Link OK
Sample Output
show interfaces transport pm
user@host> show interfaces transport pm all current et-0/1/0Physical interface: et-0/1/0, SNMP ifIndex 515 14:45-current Elapse time:900 Seconds Near End Suspect Flag:False Reason:None PM COUNT THRESHOLD TCA-ENABLED TCA-RAISED OTU-BBE 0 800 No No OTU-ES 0 135 No No OTU-SES 0 90 No No OTU-UAS 427 90 No No Far End Suspect Flag:True Reason:Unknown PM COUNT THRESHOLD TCA-ENABLED TCA-RAISED OTU-BBE 0 800 No No OTU-ES 0 135 No No OTU-SES 0 90 No No OTU-UAS 0 90 No No Near End Suspect Flag:False Reason:None PM COUNT THRESHOLD TCA-ENABLED TCA-RAISED ODU-BBE 0 800 No No ODU-ES 0 135 No No ODU-SES 0 90 No No
944

ODU-UAS 427 90 No No Far End Suspect Flag:True Reason:Unknown PM COUNT THRESHOLD TCA-ENABLED TCA-RAISED ODU-BBE 0 800 No No ODU-ES 0 135 No No ODU-SES 0 90 No No ODU-UAS 0 90 No No FEC Suspect Flag:False Reason:None PM COUNT THRESHOLD TCA-ENABLED TCA-RAISED FEC-CorrectedErr 2008544300 0 NA NA FEC-UncorrectedWords 0 0 NA NA BER Suspect Flag:False Reason:None PM MIN MAX AVG THRESHOLD TCA-ENABLED TCA-RAISED BER 3.6e-5 5.8e-5 3.6e-5 10.0e-3 No YesPhysical interface: et-0/1/0, SNMP ifIndex 515 14:45-current Suspect Flag:True Reason:Object Disabled PM CURRENT MIN MAX AVG THRESHOLD TCA-ENABLED TCA-RAISED (MIN) (MAX) (MIN) (MAX) (MIN) (MAX) Lane chromatic dispersion 0 0 0 0 0 0 NA NA NA NA Lane differential group delay 0 0 0 0 0 0 NA NA NA NA q Value 120 120 120 120 0 0 NA NA NA NA SNR 28 28 29 28 0 0 NA NA NA NA Tx output power(0.01dBm) -5000 -5000 -5000 -5000 -300 -100 No No No No Rx input power(0.01dBm) -3642 -3665 -3626 -3637 -1800 -500 No No No No Module temperature(Celsius) 46 46 46 46 -5 75 No No No No Tx laser bias current(0.1mA) 0 0 0 0 0 0 NA NA NA NA Rx laser bias current(0.1mA) 1270 1270 1270 1270 0 0 NA NA NA NA Carrier frequency offset(MHz) -186 -186 -186 -186 -5000 5000 No No No No
945

Sample Output
show security zones
user@host> show security zonesFunctional zone: management Description: This is the management zone. Policy configurable: No Interfaces bound: 1 Interfaces: ge-0/0/0.0Security zone: Host Description: This is the host zone. Send reset for non-SYN session TCP packets: Off Policy configurable: Yes Interfaces bound: 1 Interfaces: fxp0.0Security zone: abc Description: This is the abc zone. Send reset for non-SYN session TCP packets: Off Policy configurable: Yes Interfaces bound: 1 Interfaces: ge-0/0/1.0Security zone: def Description: This is the def zone. Send reset for non-SYN session TCP packets: Off Policy configurable: Yes Interfaces bound: 1 Interfaces: ge-0/0/2.0
Release Information
Command modified in Junos OS Release 9.5.
946

set date ntp
IN THIS SECTION
Syntax | 947
Description | 947
Options | 947
Required Privilege Level | 948
Output Fields | 948
Sample Output | 948
Release Information | 949
Syntax
set date ntp <servers | force | key key | node node-number | routing-instance routing-instance-name | source-address source-address>
Description
Set the date and local time. If reject mode is enabled and the system rejected the update from the NTPserver because it exceeds the configured threshold value, an administrator has two options to overrulethe reject mode action: manually set the date and time in YYYYMMDDhhmm.ss format, or forcesynchronization of device time with the NTP server update by specifying the force option.
Options
servers Specify the IP address of one or more NTP servers.
947

force Force system date and time to update to NTP server values. The device date andtime are synchronized with the NTP proposed date and time even if reject is set asthe action and the difference between the device time and NTP proposed timeexceeds the default or the configured threshold value.
key key Specify a key number to authenticate the NTP server used to synchronize the dateand time. You must specify the same key number used to authenticate the server,configured at the [edit system ntp authentication-key number] hierarchy level.
node node-name
Specify system date and time using NTP servers on specific node.
routing-instancerouting-instance-name
Specify the routing instance through which server is available.
source-addresssource-address
Specify the source address that the SRX Series devices use to contact the remoteNTP server.
Required Privilege Level
view
Output Fields
When you enter this command, you are provided feedback on the status of your request.
Sample Output
set date ntp force
user@host> set date ntp force18 Jul 16:52:43 ntpdate[3319]: NTP update request has been accepted, The time offset is 147605840.624994 sec from the time server 66.129.255.62 which is larger than the maximum threshold of 400 sec allowed.
948

Release Information
Command introduced in Junos OS Release 15.1X49-D70.
RELATED DOCUMENTATION
show system ntp threshold | 949
ntp
ntp threshold | 669
NTP Time Synchronization on SRX Series Devices | 353
show system ntp threshold
IN THIS SECTION
Syntax | 949
Description | 950
Options | 950
Required Privilege Level | 950
Output Fields | 950
Sample Output | 951
Release Information | 951
Syntax
show system ntp threshold
949

Description
Display the current threshold and reject mode configured information.
Options
Required Privilege Level
view
Output Fields
lists the output fields for the Table 67 on page 950 show system ntp threshold command. Output fields arelisted in the approximate order in which they appear.
Table 67: show system ntp threshold Output Fields
Field Name Field Description
NTP threshold Assign a threshold value for Network Time Protocol (NTP) adjustment that is outside of theacceptable NTP update and specify whether to accept or reject NTP synchronization whenthe proposed time from the NTP server exceeds the configured threshold value.
Success Criteria Verifies the NTP threshold and provide the status of NTP adjustment mode (accept or reject).
950

Sample Output
show system ntp threshold
user@host> show system ntp thresholdNTP threshold: 400 secNTP adjustment reject mode is enabledSuccess Criteria: verify threshold and reject mode can appear after user configuration.
Release Information
Command introduced in Junos OS Release 15.1X49-D70.
RELATED DOCUMENTATION
set date ntp | 947
ntp threshold | 669
ntp
NTP Time Synchronization on SRX Series Devices | 353
show security macsec connections
IN THIS SECTION
Syntax | 952
Description | 952
Options | 952
Required Privilege Level | 952
Output Fields | 952
Sample Output | 953
951
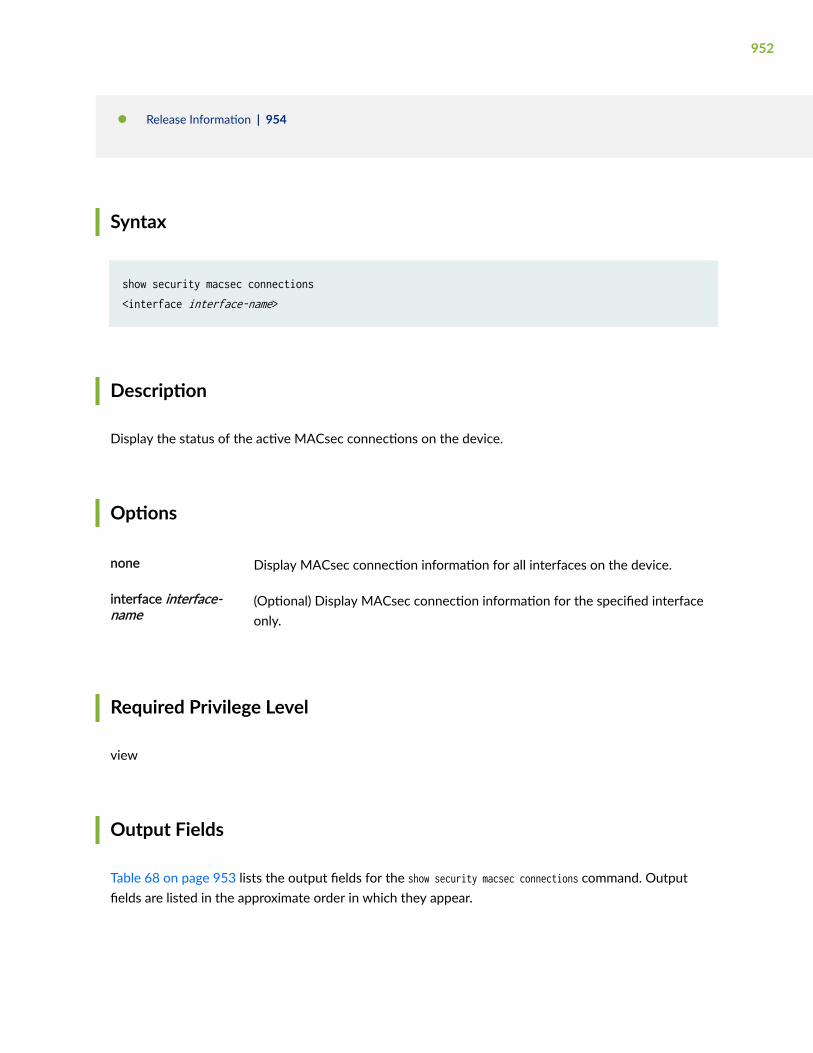
Release Information | 954
Syntax
show security macsec connections<interface interface-name>
Description
Display the status of the active MACsec connections on the device.
Options
none Display MACsec connection information for all interfaces on the device.
interface interface-name
(Optional) Display MACsec connection information for the specified interfaceonly.
Required Privilege Level
view
Output Fields
Table 68 on page 953 lists the output fields for the show security macsec connections command. Outputfields are listed in the approximate order in which they appear.
952

Table 68: show security macsec connections Output Fields
Field Name Field Description
Fields for Interface
Interface name Name of the interface.
CA name Name of the connectivity association.
A connectivity association is named using the connectivity-associationstatement when you are enabling MACsec.
Cipher suite Name of the cipher suite used for encryption.
Key server offset Offset setting.
The offset is set using the offset statement when configuring the connectivityassociation when using static connectivity association key (CAK) or dynamicsecurity mode.
Replay protect Replay protection setting. Replay protection is enabled when this output is onand disabled when this output is off.
You can enable replay protection using the replay-protect statement in theconnectivity association.
Sample Output
show security macsec connections
user@host> show security macsec connectionsInterface name: fxp1 CA name: ca1 Cipher suite: GCM-AES-128 Encryption: on Key server offset: 0 Include SCI: no
953

Replay protect: off Replay window: 0
Release Information
Command introduced in Junos OS Release 15.1X49-D60.
RELATED DOCUMENTATION
show security mka statistics | 960
show security macsec statistics (SRX Series Devices)
IN THIS SECTION
Syntax | 954
Description | 955
Options | 955
Required Privilege Level | 955
Output Fields | 955
Sample Output | 959
Release Information | 959
Syntax
show security macsec statistics<brief | detail><interface interface-name>
954

Description
Display Media Access Control Security (MACsec) statistics.
Options
none Display MACsec statistics in brief form for all interfaces on the switch.
brief | detail (Optional) Display the specified level of output. Using the brief option is equivalent toentering the command with no options (the default). The detail option displaysadditional fields that are not visible in the brief output.
NOTE: The field names that only appear in this command output when youenter the detail option are mostly useful for debugging purposes by JuniperNetworks support personnel.
interfaceinterface-name
(Optional) Display MACsec statistics for the specified interface only.
Required Privilege Level
view
Output Fields
Table 69 on page 956 lists the output fields for the show security macsec statistics command. Outputfields are listed in the approximate order in which they appear.
The field names that appear in this command output only when you enter the detail option are mostlyuseful for debugging purposes by Juniper Networks support personnel. Those field names are, therefore,not included in this table.
955

Table 69: show security macsec statistics Output Fields
Field Name Field Description Level of Output
Interface name Name of the interface. All levels
Fields for Secure Channel transmitted
Encrypted packets Total number of packets transmitted out of the interface inthe secure channel that were secured and encrypted usingMACsec.
Data packets are sent in the secure channel when MACsecis enabled, and are secured using a connectivity associationkey (CAK).
All levels
Encrypted bytes Total number of bytes transmitted out of the interface inthe secure channel that were secured and encrypted usingMACsec.
Data packets are sent in the secure channel when MACsecis enabled, and are secured using a connectivity associationkey (CAK).
All levels
Protected packets Total number of packets transmitted out of the interface inthe secure channel that were secured but not encryptedusing MACsec.
Data packets are sent in the secure channel when MACsecis enabled, and are secured using a connectivity associationkey (CAK).
All levels
Protected bytes Total number of bytes transmitted out of the interface inthe secure channel that were secured but not encryptedusing MACsec.
Data packets are sent in the secure channel when MACsecis enabled, and are secured using a connectivity associationkey (CAK).
All levels
Fields for Secure Association transmitted
956

Table 69: show security macsec statistics Output Fields (Continued)
Field Name Field Description Level of Output
Encrypted packets Total number of packets transmitted out of the interface inthe connectivity association that were secured andencrypted using MACsec.
The total includes the data packets transmitted in thesecure channel and the control packets secured using aconnectivity association key (CAK).
All levels
Protected packets Total number of packets transmitted out of the interface inthe connectivity association that were secured but notencrypted using MACsec.
The total includes the data packets transmitted in thesecure channel and the control packets secured using aconnectivity association key (CAK).
All levels
Fields for Secure Channel received
Accepted packets The number of received packets that have been acceptedby the secure channel on the interface. The secure channelis used to send all data plane traffic on a MACsec-enabledlink.
A packet is considered accepted for this counter when ithas been received by this interface and it has passed theMACsec integrity check.
This counter increments for traffic that is and is notencrypted using MACsec.
All levels
Validated bytes The number of bytes that have been validated by theMACsec integrity check and received on the secure channelon the interface. The secure channel is used to send all dataplane traffic on a MACsec-enabled link.
This counter does not increment when MACsec encryptionis disabled.
All levels
957

Table 69: show security macsec statistics Output Fields (Continued)
Field Name Field Description Level of Output
Decrypted bytes The number of bytes received in the secure channel on theinterface that have been decrypted. The secure channel isused to send all data plane traffic on a MACsec-enabledlink.
An encrypted byte has to be decrypted before it can bereceived on the receiving interface. The decrypted bytescounter is incremented for received traffic that wasencrypted using MACsec.
All levels
Fields for Secure Association received
Accepted packets The number of received packets that have been accepted inthe connectivity association on the interface. The counterincludes all control and data plane traffic accepted on theinterface.
A packet is considered accepted for this counter when ithas been received by this interface and it has passed theMACsec integrity check.
All levels
Validated bytes The number of bytes that have been validated by theMACsec integrity check and received on the connectivityassociation on the interface. The counter includes allcontrol and data plane traffic accepted on the interface.
This counter does not increment when MACsec encryptionis disabled.
All levels
Decrypted bytes The number of bytes received in the connectivityassociation on the interface that have been decrypted. Thecounter includes all control and data plane traffic acceptedon the interface.
An encrypted byte has to be decrypted before it can bereceived on the receiving interface. The decrypted bytescounter is incremented for received traffic that wasencrypted using MACsec.
All levels
958

Sample Output
show security macsec statistics interface
user@host> show security macsec statistics interface fxp1 detail
Interface name: fxp1 Secure Channel transmitted Encrypted packets: 2397305 Encrypted bytes: 129922480 Protected packets: 0 Protected bytes: 0 Secure Association transmitted Encrypted packets: 2397305 Protected packets: 0 Secure Channel received Accepted packets: 2395850 Validated bytes: 0 Decrypted bytes: 131715088 Secure Association received Accepted packets: 2395850 Validated bytes: 0 Decrypted bytes: 0
Release Information
Command introduced in Junos OS Release 15.1X49-D60.
RELATED DOCUMENTATION
Understanding Media Access Control Security (MACsec) | 481
Configuring Media Access Control Security (MACsec) | 484
macsec | 651
show interfaces (Gigabit Ethernet)
show security mka sessions (SRX Series Device | 963
959

show security mka statistics
IN THIS SECTION
Syntax | 960
Description | 960
Options | 960
Required Privilege Level | 961
Output Fields | 961
Sample Output | 962
Release Information | 963
Syntax
show security mka statistics<interface interface-name>
Description
Display MACsec Key Agreement (MKA) protocol statistics.
The output for this command does not include statistics for MACsec data traffic. For MACsec datatraffic statistics, see "show security macsec statistics (SRX Series Devices)" on page 954.
Options
• interface interface-name—(Optional) Display the MKA information for the specified interface only.
960

Required Privilege Level
view
Output Fields
Table 70 on page 961 lists the output fields for the show security mka statistics command. Output fieldsare listed in the approximate order in which they appear.
Table 70: show security mka statistics Output Fields
Field Name Field Description
Received packets Number of received MKA control packets.
This counter increments for received MKA control packets only. This counterdoes not increment when data packets are received.
Transmitted packets Number of transmitted MKA packets
This counter increments for transmitted MKA control packets only. Thiscounter does not increment when data packets are transmitted.
Version mismatch packets Number of version mismatch packets.
CAK mismatch packets Number of Connectivity Association Key (CAK) mismatch packets.
This counter increments when the connectivity association key (CAK) andconnectivity association key name (CKN), which are user-configured valuesthat have to match to enable MACsec, do not match for an MKA controlpacket.
ICV mismatch packets Number of ICV mismatched packets.
This counter increments when the connectivity association key (CAK) valuedoes not match on both ends of a MACsec-secured Ethernet link.
Duplicate message identifierpackets
Number of duplicate message identifier packets.
961

Table 70: show security mka statistics Output Fields (Continued)
Field Name Field Description
Duplicate message numberpackets
Number of duplicate message number packets.
Duplicate address packets Number of duplicate source MAC address packets.
Invalid destination addresspackets
Number of invalid destination MAC address packets.
Formatting error packets Number of formatting error packets.
Old Replayed message numberpackets
Number of old replayed message number packets.
Sample Output
show security mka statistics
user@host> show security mka statistics
Interface name: fxp1 Received packets: 3 Transmitted packets: 14 Version mismatch packets: 0 CAK mismatch packets: 0 ICV mismatch packets: 0 Duplicate message identifier packets: 0 Duplicate message number packets: 0 Duplicate address packets: 0 Invalid destination address packets: 0 Formatting error packets: 0 Old Replayed message number packets: 0
962

Release Information
Command introduced in Junos OS Release 15.1X49-D60.
RELATED DOCUMENTATION
Understanding Media Access Control Security (MACsec) | 481
Configuring Media Access Control Security (MACsec) | 484
macsec | 651
show interfaces (Gigabit Ethernet)
show security macsec statistics (SRX Series Devices) | 954
show security mka sessions (SRX Series Device
IN THIS SECTION
Syntax | 963
Description | 964
Options | 964
Required Privilege Level | 964
Output Fields | 964
Sample Output | 965
Release Information | 966
Syntax
show security mka sessions<interface interface-name>
963

Description
Display MACsec Key Agreement (MKA) session information.
Options
• interface interface-name—(Optional) Display the MKA information for the specified interface only.
Required Privilege Level
view
Output Fields
Table 71 on page 964 lists the output fields for the show security mka sessions command. Output fieldsare listed in the approximate order in which they appear.
Table 71: show security mka sessions Output Fields
Field Name Field Description
Interface name Name of the interface.
Member identifier Name of the member identifier.
CAK name Name of the Connectivity Association Key (CAK..
The CAK is configured using the cak keyword when configuring the pre-sharedkey.
Transmit interval The transmit interval.
Outbound SCI Name of the outbound secure channel identifier.
964

Table 71: show security mka sessions Output Fields (Continued)
Field Name Field Description
Message number Number of the last data message.
Key server Key server status.
The switch is the key server when this output is yes. The switch is not the keyserver when this output is no.
Key number Key number.
Key server priority The key server priority.
The key server priority can be set using the key-server-priority statement.
Latest SAK AN Name of the latest secure association key (SAK) association number.
Latest SAK KI Name of the latest secure association key (SAK) key identifier.
Previous SAK AN Name of the previous secure association key (SAK) association number.
Previous SAK KI Name of the previous secure association key (SAK) key identifier.
Sample Output
show security mka sessions
user@host> show security mka sessions
Interface name: fxp1 Member identifier: 71235CA1B78D0AF7B3F29CFB CAK name: AAAA Transmit interval: 10000(ms)
965

Outbound SCI: 30:7C:5E:44:98:42/1 Message number: 2326 Key number: 2 Key server: yes Key server priority: 16 Latest SAK AN: 1 Latest SAK KI: 71235CA1B78D0AF7B3F29CFB/2 Previous SAK AN: 0 Previous SAK KI: 71235CA1B78D0AF7B3F29CFB/1
Release Information
Command introduced in Junos OS Release 15.1X49-D60.
RELATED DOCUMENTATION
Understanding Media Access Control Security (MACsec) | 481
Configuring Media Access Control Security (MACsec) | 484
macsec | 651
show interfaces (Gigabit Ethernet)
show security macsec statistics (SRX Series Devices) | 954
show security internal-security-association
IN THIS SECTION
Syntax | 967
Description | 967
Required Privilege Level | 967
Output Fields | 967
Sample Output | 968
Release Information | 968
966

Syntax
show security internal-security-association
Description
Provide secure login by enabling the internal security association in a chassis cluster configuration.
Required Privilege Level
view
Output Fields
Table 72 on page 967 lists the output fields for the show security internal-security-association command.Output fields are listed in the approximate order in which they appear.
Table 72: show security internal-security-association Output Fields
Field Name Field Description
Internal SA Status State of the internal SA option on the chassis cluster control link: enabled ordisabled.
Iked Encryption Status State of the iked encryption.
967

Sample Output
show security internal-security-association
user@host>show security internal-security-association
node0:--------------------------------------------------------------------------Internal SA Status : EnabledIked Encryption Status : Enabled
node1:--------------------------------------------------------------------------Internal SA Status : EnabledIked Encryption Status : Enabled
Release Information
Command introduced in Junos OS Release 12.1X47-D10.
RELATED DOCUMENTATION
Chassis Cluster User Guide for SRX Series Devices
show system license (View)
IN THIS SECTION
Syntax | 969
Description | 969
Options | 969
968

Required Privilege Level | 969
Output Fields | 970
Sample Output | 971
Release Information | 973
Syntax
show system license<installed | keys | status | usage>
Description
Display licenses and information about how licenses are used.
Options
none Display all license information.
installed (Optional) Display installed licenses only.
keys (Optional) Display a list of license keys. Use this information to verify that each expectedlicense key is present.
status (Optional) Display license status for a specified logical system or for all logical systems.
usage (Optional) Display the state of licensed features.
Required Privilege Level
view
969

Output Fields
Table 73 on page 970 lists the output fields for the show system license command. Output fields are listedin the approximate order in which they appear.
Table 73: show system license Output Fields
Field Name Field Description
Feature name Name assigned to the configured feature. You use this information to verify that all thefeatures for which you installed licenses are present.
Licenses used Number of licenses used by the device. You use this information to verify that the numberof licenses used matches the number configured. If a licensed feature is configured, thefeature is considered used.
Licenses installed Information about the installed license key:
• License identifier—Identifier associated with a license key.
• License version—Version of a license. The version indicates how the license is validated,the type of signature, and the signer of the license key.
• Valid for device—Device that can use a license key.
• Features—Feature associated with a license.
Licenses needed Number of licenses required for features being used but not yet properly licensed.
Expiry Time remaining in the grace period before a license is required for a feature being used.
Logical systemlicense status
Displays whether a license is enabled for a logical system.
970

Sample Output
show system license
user@host> show system license
License usage: Licenses Licenses Licenses Expiry Feature name used installed needed av_key_kaspersky_engine 1 1 0 2012-03-30 01:00:00 IST wf_key_surfcontrol_cpa 0 1 0 2012-03-30 01:00:00 IST dynamic-vpn 0 1 0 permanent ax411-wlan-ap 0 2 0 permanent
Licenses installed: License identifier: JUNOS301998 License version: 2 Valid for device: AG4909AA0080 Features: av_key_kaspersky_engine - Kaspersky AV date-based, 2011-03-30 01:00:00 IST - 2012-03-30 01:00:00 IST
License identifier: JUNOS302000 License version: 2 Valid for device: AG4909AA0080 Features: wf_key_surfcontrol_cpa - Web Filtering date-based, 2011-03-30 01:00:00 IST - 2012-03-30 01:00:00 IST
show system license installed
user@host> show system license installed
License identifier: JUNOS301998 License version: 2 Valid for device: AG4909AA0080 Features: av_key_kaspersky_engine - Kaspersky AV date-based, 2011-03-30 01:00:00 IST - 2012-03-30 01:00:00 IST
971

License identifier: JUNOS302000 License version: 2 Valid for device: AG4909AA0080 Features: wf_key_surfcontrol_cpa - Web Filtering date-based, 2011-03-30 01:00:00 IST - 2012-03-30 01:00:00 IST
show system license keys
user@host> show system license keys
XXXXXXXXXX xxxxxx xxxxxx xxxxxx xxxxxx xxxxxx xxxxxx xxxxxx xxxxxx xxxxxx xxxxxx xxxxxx xxxxxx xxxxxx xxxxxx xxx
show system license usage
user@host> show system license usage
Licenses Licenses Licenses ExpiryFeature name used installed needed av_key_kaspersky_engine 1 1 0 2012-03-30 01:00:00 IST wf_key_surfcontrol_cpa 0 1 0 2012-03-30 01:00:00 IST dynamic-vpn 0 1 0 permanent ax411-wlan-ap 0 2 0 permanent
show system license status logical-system all
user@host> show system license status logical-system allLogical system license status: logical system name license statusroot-logical-system enabled LSYS0 enabled LSYS1 enabled LSYS2 enabled
972

Release Information
Command introduced in Junos OS Release 9.5. Logical system status option added in Junos OS Release11.2.
RELATED DOCUMENTATION
Adding New Licenses (CLI Procedure)
show vrrp
IN THIS SECTION
Syntax | 973
Description | 974
Options | 974
Required Privilege Level | 974
Output Fields | 974
Sample Output | 982
Release Information | 988
Syntax
show vrrp<brief | detail | extensive | summary><interface�interface-name><logical-system�logical-system-name><nsr><track�track-interfaces>
973

Description
Display information and status about VRRP groups.
Options
none (Same as brief) Display brief status information about all VRRP interfaces.
brief | detail | extensive |summary
(Optional) Display the specified level of output.
interface interface-name (Optional) Display information and status about the specified VRRPinterface.
logical-system (Optional) Display information and status about the specified logicalsystem.
nsr (Optional) Display information and status about the primary routing engine.
track track-interfaces (Optional) Display information and status about VRRP track interfaces.
Required Privilege Level
view
Output Fields
Table 74 on page 975 lists the output fields for the show vrrp command. Output fields are listed in theapproximate order in which they appear.
974

Table 74: show vrrp Output Fields
Field Name Field Description Level of Output
Interface Name of the logical interface. none, brief,extensive, summary
Interface index Physical interface index number, which reflects its initializationsequence.
extensive
Groups Total number of VRRP groups configured on the interface. extensive
Active Total number of VRRP groups that are active (that is, whose interfacestate is either up or down).
extensive
Interface VRRPPDU statistics
Nonerrored statistics for the logical interface:
• Advertisement sent�Number of VRRP advertisement protocol dataunits (PDUs) that the interface has transmitted.
• Advertisement received�Number of VRRP advertisement PDUsreceived by the interface.
• Packets received�Number of VRRP packets received for VRRPgroups on the interface.
• No group match received�Number of VRRP packets received forVRRP groups that do not exist on the interface.
extensive
975
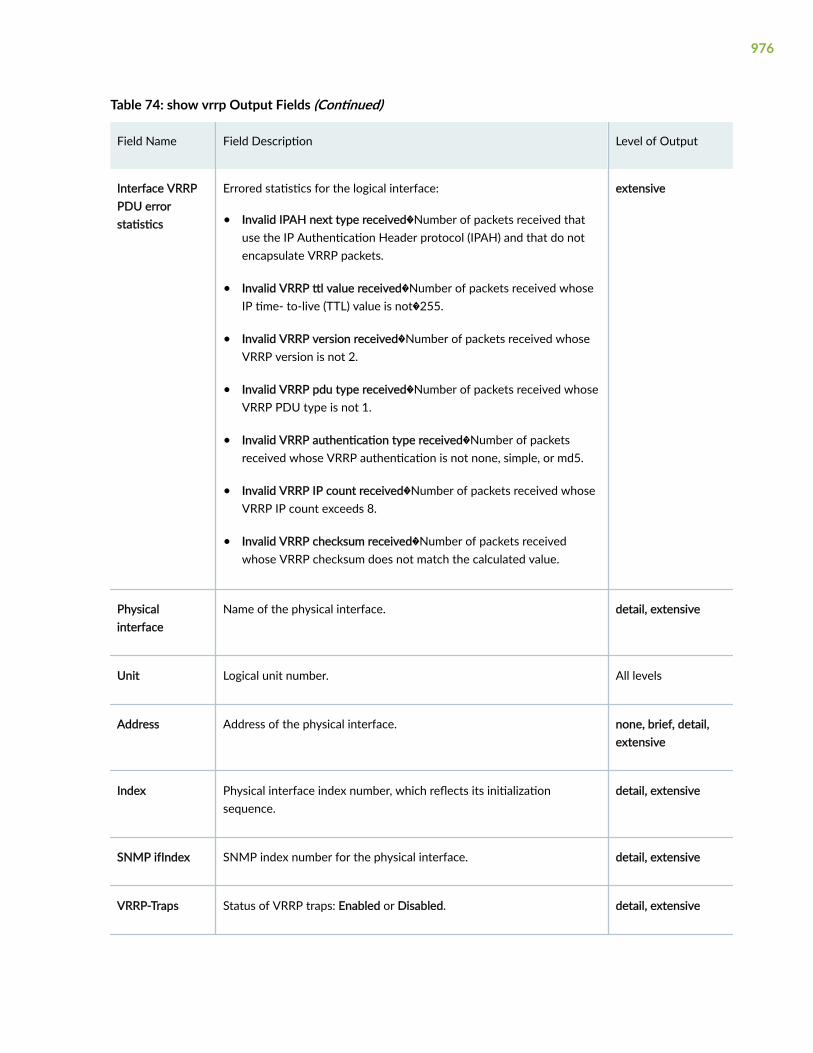
Table 74: show vrrp Output Fields (Continued)
Field Name Field Description Level of Output
Interface VRRPPDU errorstatistics
Errored statistics for the logical interface:
• Invalid IPAH next type received�Number of packets received thatuse the IP Authentication Header protocol (IPAH) and that do notencapsulate VRRP packets.
• Invalid VRRP ttl value received�Number of packets received whoseIP time- to-live (TTL) value is not�255.
• Invalid VRRP version received�Number of packets received whoseVRRP version is not 2.
• Invalid VRRP pdu type received�Number of packets received whoseVRRP PDU type is not 1.
• Invalid VRRP authentication type received�Number of packetsreceived whose VRRP authentication is not none, simple, or md5.
• Invalid VRRP IP count received�Number of packets received whoseVRRP IP count exceeds 8.
• Invalid VRRP checksum received�Number of packets receivedwhose VRRP checksum does not match the calculated value.
extensive
Physicalinterface
Name of the physical interface. detail, extensive
Unit Logical unit number. All levels
Address Address of the physical interface. none, brief, detail,extensive
Index Physical interface index number, which reflects its initializationsequence.
detail, extensive
SNMP ifIndex SNMP index number for the physical interface. detail, extensive
VRRP-Traps Status of VRRP traps: Enabled or Disabled. detail, extensive
976

Table 74: show vrrp Output Fields (Continued)
Field Name Field Description Level of Output
Type andAddress
Identifier for the address and the address itself:
• lcl�Configured local interface address.
• mas�Address of the primary device. This address is displayed onlywhen the local interface is acting as a backup device.
• vip�Configured virtual IP addresses.
none, brief, summary
Interface state orInt state
State of the physical interface:
• down�The device is present and the link is unavailable.
• not present�The interface is configured, but no physical device ispresent.
• unknown�The VRRP process has not had time to query the kernelabout the state of the interface.
• up�The device is present and the link is established.
none, brief,extensive, summary
Group VRRP group number. none, brief,extensive, summary
State VRRP state:
• backup�The interface is acting as the backup device interface.
• bringup�VRRP is just starting, and the physical device is not yetpresent.
• idle�VRRP is configured on the interface and is disabled. This canoccur when VRRP is first enabled on an interface whose link isestablished.
• initializing�VRRP is initializing.
• master�The interface is acting as the primary device interface.
• transition�The interface is changing between being the backup andbeing the primary device.
extensive
977

Table 74: show vrrp Output Fields (Continued)
Field Name Field Description Level of Output
Priority Configured VRRP priority for the interface. detail, extensive
Advertisementinterval
Configured VRRP advertisement interval. detail, extensive
Authenticationtype
Configured VRRP authentication type: none, simple, or md5. detail, extensive
Preempt Whether preemption is allowed on the interface: yes or no. detail, extensive
Accept-datamode
Whether the interface is configured to accept packets destined for thevirtual IP address: yes or no.
detail, extensive
VIP count Number of virtual IP addresses that have been configured on theinterface.
detail, extensive
VIP List of virtual IP addresses configured on the interface. detail, extensive
Advertisementtimer
Time until the advertisement timer expires. detail, extensive
Master router IP address of the interface that is acting as the primary. If the VRRPinterface is down, the output is N/A.
detail, extensive
Virtual routeruptime
Time that the virtual device has been up. detail, extensive
Master routeruptime
Time that the primary device has been up. detail, extensive
Virtual MAC MAC address associated with the virtual IP address. detail, extensive
Tracking Whether tracking is enabled or disabled. detail, extensive
978

Table 74: show vrrp Output Fields (Continued)
Field Name Field Description Level of Output
Current priority Current operational priority for being the VRRP primary. detail, extensive
Configuredpriority
Configured base priority for being the VRRP primary. detail, extensive
Priority hold-time
Minimum time interval, in seconds, between successive changes to thecurrent priority. Disabled indicates no minimum interval.
detail, extensive
Remaining-time (track option only) Displays the time remaining in the priority hold-timeinterval.
detail
Interfacetracking
Whether interface tracking is enabled or disabled. When enabled, theoutput also displays the number of tracked interfaces.
detail extensive
Interface/Tracked interface
Name of the tracked interface. detail extensive
Int state/Interface state
Current operational state of the tracked interface: up or down. detail, extensive
Int speed/Speed Current operational speed, in bits per second, of the tracked interface. detail, extensive
Incurred prioritycost
Operational priority cost incurred due to the state and speed of thistracked interface. This cost is applied to the configured priority toobtain the current priority.
detail, extensive
Threshold Speed below which the corresponding priority cost is incurred. In otherwords, when the speed of the interface drops below the thresholdspeed, the corresponding priority cost is incurred.
An entry of down means that the corresponding priority cost is incurredwhen the interface is down.
detail, extensive
979

Table 74: show vrrp Output Fields (Continued)
Field Name Field Description Level of Output
Route tracking Whether route tracking is enabled or disabled. When enabled, theoutput also displays the number of tracked routes.
detail, extensive
Route count The number of routes being tracked. detail, extensive
Route The IP address of the route being tracked. detail, extensive
VRF name The VPN routing and forwarding (VRF) routing instance that the trackedroute is in.
detail, extensive
Route state The state of the route being tracked: up, down, or unknown. detail, extensive
Priority cost Configured priority cost. This value is incurred when the interface speeddrops below the corresponding threshold or when the tracked routegoes down.
detail, extensive
Active Whether the threshold is active (*). If the threshold is active, thecorresponding priority cost is incurred.
detail, extensive
Group VRRPPDU statistics
Number of VRRP advertisements sent and received by the group. extensive
980

Table 74: show vrrp Output Fields (Continued)
Field Name Field Description Level of Output
Group VRRPPDU errorstatistics
Errored statistics for the VRRP group:
• Bad authentication type received�Number of VRRP PDUs receivedwith an invalid authentication type. The received authentication canbe none, simple, or md5 and must be the same for all devices in theVRRP group.
• Bad password received�Number of VRRP PDUs received with aninvalid key (password). The password for simple authentication mustbe the same for all devices in the VRRP group
• Bad MD5 digest received�Number of VRRP PDUs received forwhich the MD5 digest computed from the VRRP PDU differs fromthe digest expected by the VRRP instance configured on the device.
• Bad advertisement timer received�Number of VRRP PDUs receivedwith an advertisement time interval that is inconsistent with the onein use among the devices in the VRRP group.
• Bad VIP count received�Number of VRRP PDUs whose virtual IPaddress counts differ from the count that has been configured onthe VRRP instance.
• Bad VIPADDR received�Number of VRRP PDUs whose virtual IPaddresses differ from the list of virtual IP addresses configured onthe VRRP instance.
extensive
Group statetransitionstatistics
State transition statistics for the VRRP group:
• Idle to master transitions�Number of times that the VRRP instancetransitioned from the idle state to the primary state.
• Idle to backup transitions�Number of times that the VRRP instancetransitioned from the idle state to the backup state.
• Backup to master transitions�Number of times that the VRRPinstance transitioned from the backup state to the primary state.
• Master to backup transitions�Number of times that the VRRPinstance transitioned from the primary state to the backup state.
extensive
981

Table 74: show vrrp Output Fields (Continued)
Field Name Field Description Level of Output
Vlan-id ID of Vlan detail
VR state VRRP information:
• backup�The interface is acting as the backup device interface.
• bringup�VRRP is just starting, and the physical device is not yetpresent.
• idle�VRRP is configured on the interface and is disabled. This canoccur when VRRP is first enabled on an interface whose link isestablished.
• initializing�VRRP is initializing.
• master�The interface is acting as the primary device interface.
• transition�The interface is changing between being the backup andbeing the primary device.
none, brief
Timer VRRP timer information:
• A�Time, in seconds, until the advertisement timer expires.
• D�Time, in seconds, until the Primary is Dead timer expires.
none, brief
Sample Output
show vrrp
user@host> show vrrp Interface State Group VR state Timer Type Addressge-0/0/0.121 up 1 master A 1.052 lcl ge2001:db8::12:1:1:1 vip ge2001:db8:0:1:12:1:1:99
982

vip ge2001:db8::12:1:1:99ge-0/0/2.131 up 1 master A 0.364 lcl ge2001:db8::13:1:1:1 vip ge2001:db8:0:1:13:1:1:99 vip ge2001:db8::13:1:1:99
show vrrp brief
The output for the show vrrp brief command is identical to that for the show vrrp command. For sampleoutput, see "show vrrp" on page 982.
show vrrp detail (IPv6)
user@host> show vrrp detail Physical interface: ge-0/0/0, Unit: 121, Vlan-id: 212, Address: ge2001:db8::12:1:1:1/120 Index: 67, SNMP ifIndex: 45, VRRP-Traps: enabled Interface state: up, Group: 1, State: master Priority: 200, Advertisement interval: 1, Authentication type: none Preempt: yes, Accept-data mode: no, VIP count: 2, VIP: ge2001:db8:0:1:12:1:1:99, ge2001:db8::12:1:1:99 Advertisement timer: 1.121s, Master router: ge2001:db8:0:1:12:1:1:1 Virtual router uptime: 00:03:47, Master router uptime: 00:03:41 Virtual MAC: 00:00:5e:00:02:01 Tracking: disabled
Physical interface: ge-0/0/2, Unit: 131, Vlan-id: 213, Address: ge2001:db8::13:1:1:1/120 Index: 69, SNMP ifIndex: 47, VRRP-Traps: enabled Interface state: up, Group: 1, State: master Priority: 200, Advertisement interval: 1, Authentication type: none Preempt: yes, Accept-data mode: no, VIP count: 2, VIP: ge2001:db8:0:1:13:1:1:99, ge2001:db8::13:1:1:99 Advertisement timer: 0.327s, Master router: ge2001:db8:0:1:13:1:1:1 Virtual router uptime: 00:03:47, Master router uptime: 00:03:41 Virtual MAC: 00:00:5e:00:02:01 Tracking: disabled
983

show vrrp detail (Route Track)
user@host> show vrrp detail Physical interface: ge-1/1/0, Unit: 0, Address: 192.0.2.30/24 Index: 67, SNMP ifIndex: 379, VRRP-Traps: enabled Interface state: up, Group: 100, State: master Priority: 150, Advertisement interval: 1, Authentication type: none Preempt: yes, Accept-data mode: no, VIP count: 1, VIP: 192.0.2.100 Advertisement timer: 1.218s, Master router: 192.0.2.30 Virtual router uptime: 00:04:28, Master router uptime: 00:00:13 Virtual MAC: 00:00:5e:00:01:64 Tracking: enabled Current priority: 150, Configured priority: 150 Priority hold-time: disabled Interface tracking: disabled Route tracking: enabled, Route count: 1 Route VRF name Route state Priority cost 198.51.100.0/24 default up 30
show vrrp extensive
user@host> show vrrp extensive Interface: ge-0/0/0.121, Interface index: 67, Groups: 1, Active : 1 Interface VRRP PDU statistics Advertisement sent : 188 Advertisement received : 0 Packets received : 0 No group match received : 0 Interface VRRP PDU error statistics Invalid IPAH next type received : 0 Invalid VRRP TTL value received : 0 Invalid VRRP version received : 0 Invalid VRRP PDU type received : 0 Invalid VRRP authentication type received: 0 Invalid VRRP IP count received : 0 Invalid VRRP checksum received : 0
Physical interface: ge-0/0/0, Unit: 121, Vlan-id: 212, Address: ge2001:db8::12:1:1:1/120 Index: 67, SNMP ifIndex: 45, VRRP-Traps: enabled Interface state: up, Group: 1, State: master
984

Priority: 200, Advertisement interval: 1, Authentication type: none Preempt: yes, Accept-data mode: no, VIP count: 2, VIP: ge2001:db8:0:1:12:1:1:99, ge2001:db8::12:1:1:99 Advertisement timer: 1.034s, Master router: ge2001:db8:0:1:12:1:1:1 Virtual router uptime: 00:04:04, Master router uptime: 00:03:58 Virtual MAC: 00:00:5e:00:02:01 Tracking: disabled Group VRRP PDU statistics Advertisement sent : 188 Advertisement received : 0 Group VRRP PDU error statistics Bad authentication type received: 0 Bad password received : 0 Bad MD5 digest received : 0 Bad advertisement timer received: 0 Bad VIP count received : 0 Bad VIPADDR received : 0 Group state transition statistics Idle to master transitions : 0 Idle to backup transitions : 1 Backup to master transitions : 1 Master to backup transitions : 0
Interface: ge-0/0/2.131, Interface index: 69, Groups: 1, Active : 1 Interface VRRP PDU statistics Advertisement sent : 186 Advertisement received : 0 Packets received : 0 No group match received : 0 Interface VRRP PDU error statistics Invalid IPAH next type received : 0 Invalid VRRP TTL value received : 0 Invalid VRRP version received : 0 Invalid VRRP PDU type received : 0 Invalid VRRP authentication type received: 0 Invalid VRRP IP count received : 0 Invalid VRRP checksum received : 0
Physical interface: ge-0/0/2, Unit: 131, Vlan-id: 213, Address: ge2001:db8::13:1:1:1/120 Index: 69, SNMP ifIndex: 47, VRRP-Traps: enabled Interface state: up, Group: 1, State: master Priority: 200, Advertisement interval: 1, Authentication type: none Preempt: yes, Accept-data mode: no, VIP count: 2, VIP: ge2001:db8:0:1:13:1:1:99,
985

ge2001:db8::13:1:1:99 Advertisement timer: 0.396s, Master router: ge2001:db8:0:1:13:1:1:1 Virtual router uptime: 00:04:04, Master router uptime: 00:03:58 Virtual MAC: 00:00:5e:00:02:01 Tracking: disabled Group VRRP PDU statistics Advertisement sent : 186 Advertisement received : 0 Group VRRP PDU error statistics Bad authentication type received: 0 Bad password received : 0 Bad MD5 digest received : 0 Bad advertisement timer received: 0 Bad VIP count received : 0 Bad VIPADDR received : 0 Group state transition statistics Idle to master transitions : 0 Idle to backup transitions : 1 Backup to master transitions : 1 Master to backup transitions : 0
show vrrp interface
user@host> show vrrp interface Interface: ge-0/0/0.121, Interface index: 67, Groups: 1, Active : 1 Interface VRRP PDU statistics Advertisement sent : 205 Advertisement received : 0 Packets received : 0 No group match received : 0 Interface VRRP PDU error statistics Invalid IPAH next type received : 0 Invalid VRRP TTL value received : 0 Invalid VRRP version received : 0 Invalid VRRP PDU type received : 0 Invalid VRRP authentication type received: 0 Invalid VRRP IP count received : 0 Invalid VRRP checksum received : 0
Physical interface: ge-0/0/0, Unit: 121, Vlan-id: 212, Address: ge2001:db8::12:1:1:1/120 Index: 67, SNMP ifIndex: 45, VRRP-Traps: enabled
986

Interface state: up, Group: 1, State: master Priority: 200, Advertisement interval: 1, Authentication type: none Preempt: yes, Accept-data mode: no, VIP count: 2, VIP: ge2001:db8:0:1:12:1:1:99, gec2001:db8::12:1:1:99 Advertisement timer: 0.789s, Master router: ge2001:db8:0:1:12:1:1:1 Virtual router uptime: 00:04:26, Master router uptime: 00:04:20 Virtual MAC: 00:00:5e:00:02:01 Tracking: disabled Group VRRP PDU statistics Advertisement sent : 205 Advertisement received : 0 Group VRRP PDU error statistics Bad authentication type received: 0 Bad password received : 0 Bad MD5 digest received : 0 Bad advertisement timer received: 0 Bad VIP count received : 0 Bad VIPADDR received : 0 Group state transition statistics Idle to master transitions : 0 Idle to backup transitions : 1 Backup to master transitions : 1 Master to backup transitions : 0
show vrrp summary
user@host> show vrrp summary Interface State Group VR state Type Addressge-3/2/6.0 up 1 backup lcl 10.57.0.2 vip 10.57.0.100
show vrrp track detail
user@host> show vrrp track detail Tracked interface: ae1.211 State: up, Speed: 400m Incurred priority cost: 0 Threshold Priority cost Active 400m 10 300m 60
987

200m 110 100m 160 down 190 Tracking VRRP interface: ae0.210, Group: 1 VR State: master Current priority: 200, Configured priority: 200 Priority hold-time: disabled, Remaining-time: 50.351
show vrrp track summary
user@host> show vrrp track summary Track if State Speed VRRP if Group VR State Current priorityae1.211 up 400m ae0.210 1 master 200
Release Information
Statement introduced in Junos OS Release 18.1R1.
RELATED DOCUMENTATION
Configuring VRRP for IPv6 (CLI Procedure)
Understanding VRRP on SRX Series Devices | 321
Example: Configuring VRRP/VRRPv3 on Chassis Cluster Redundant Ethernet Interfaces
988

9CHAPTER
Chassis Cluster Support on SRX100,SRX210, SRX220, SRX240, SRX650and SRX1400 Devices
Chassis Cluster Support on SRX100, SRX210, SRX220, SRX240, SRX650, andSRX1400 Devices | 990

Chassis Cluster Support on SRX100, SRX210,SRX220, SRX240, SRX650, and SRX1400 Devices
IN THIS SECTION
SRX Series Chassis Cluster Configuration Overview | 990
Flow and Processing | 990
Chassis Cluster Slot Numbering and Physical Port and Logical Interface Naming for SRX100, SRX210,SRX220, SRX240, and SRX650 | 991
Chassis Cluster Slot Numbering and Physical Port and Logical Interface Naming for SRX3600, SRX3400, andSRX1400 | 996
Supported Fabric Interface Types for SRX Series Devices (SRX210, SRX240, SRX220, SRX100, and SRX650Devices) | 1001
Redundant Ethernet Interfaces | 1002
Control Links | 1003
ISSU System Requirements for SRX1400, SRX3400 and SRX3600 | 1004
This topic includes the supported information for SRX100, SRX210, SRX220, SRX240, SRX650,SRX1400, SRX3400, and SRX3600 devices.
SRX Series Chassis Cluster Configuration Overview
Following are the prerequisites for configuring a chassis cluster:
Flow and Processing
Flowd monitoring is supported on SRX100, SRX210, SRX240, and SRX650 devices.
990

Chassis Cluster Slot Numbering and Physical Port and Logical InterfaceNaming for SRX100, SRX210, SRX220, SRX240, and SRX650
Information about chassis cluster slot numbering is also provided in Figure 49 on page 991, Figure 50on page 991, Figure 51 on page 991, Figure 52 on page 992, and Figure 53 on page 992.
Figure 49: Chassis Cluster Slot Numbering for SRX100 Devices
Figure 50: Chassis Cluster Slot Numbering for SRX210 Devices
Figure 51: Chassis Cluster Slot Numbering for SRX220 Devices
991

Figure 52: Chassis Cluster Slot Numbering for SRX240 Devices
Figure 53: Chassis Cluster Slot Numbering for SRX650 Devices
Layer 2 switching must not be enabled on an SRX Series device when chassis clustering is enabled. Ifyou have enabled Layer 2 switching, make sure you disable it before enabling chassis clustering.
The factory default configuration for SRX100, SRX210, and SRX220 devices automatically enables Layer2 Ethernet switching. Because Layer 2 Ethernet switching is not supported in chassis cluster mode, ifyou use the factory default configuration for these devices, you must delete the Ethernet switchingconfiguration before you enable chassis clustering. See Disabling Switching on SRX100, SRX210, andSRX220 Devices Before Enabling Chassis Clustering.
In chassis cluster mode, the interfaces on the secondary node are renumbered internally. For example,the management interface port on the front panel of each SRX210 device is still labeled fe-0/0/6, butinternally, the node 1 port is referred to as fe-2/0/6.
For SRX650 devices, control interfaces are dedicated Gigabit Ethernet ports.
For SRX100, SRX220, and SRX210 devices, after you enable chassis clustering and reboot the system,the built-in interface named fe-0/0/6 is repurposed as the management interface and is automaticallyrenamed fxp0.
For SRX550 devices, control interfaces are dedicated Gigabit Ethernet ports.
For SRX210 devices, after you enable chassis clustering and reboot the system, the built-in interfacenamed fe-0/0/7 is repurposed as the control interface and is automatically renamed fxp1.
992

In chassis cluster mode, the interfaces on the secondary node are renumbered internally. For example,the management interface port on the front panel of each SRX210 device is still labeled fe-0/0/6, butinternally, the node 1 port is referred to as fe-2/0/6.
For SRX240 devices, control interfaces are dedicated Gigabit Ethernet ports. For SRX100 and SRX220devices, after you enable chassis clustering and reboot the system, the built-in interface named fe-0/0/7is repurposed as the control interface and is automatically renamed fxp1.
NOTE: For SRX210 Services Gateways, the base and enhanced versions of a model can be usedto form a cluster. For example:
• SRX210B and SRX210BE
• SRX210H and SRX210HE
However, the following combinations cannot be used to form a cluster:
• SRX210B and SRX210H
• SRX210B and SRX210HE
• SRX210BE and SRX210H
• SRX210BE and SRX210HE
993

Figure 54 on page 994, Figure 55 on page 994, Figure 56 on page 994, Figure 57 on page 995,Figure 58 on page 995, Figure 59 on page 995 and all show pairs of SRX Series devices with thefabric links and control links connected.
Figure 54: Connecting SRX100 Devices in a Chassis Cluster
Figure 55: Connecting SRX110 Devices in a Chassis Cluster
Figure 56: Connecting SRX210 Devices in a Chassis Cluster
994

Figure 57: Connecting SRX220 Devices in a Chassis Cluster
Figure 58: Connecting SRX240 Devices in a Chassis Cluster
Figure 59: Connecting SRX650 Devices in a Chassis Cluster
The fabric link connection for the SRX100 and SRX210 must be a pair of either Fast Ethernet or GigabitEthernet interfaces. The fabric link connection must be any pair of either Gigabit Ethernet or 10-GigabitEthernet interfaces on all SRX Series devices.
For some SRX Series devices, such as the SRX100 and SRX200 line devices, do not have a dedicatedport for fxp0. For SRX100, SRX210, the fxp0 interface is repurposed from a built-in interface.
995

Chassis Cluster Slot Numbering and Physical Port and Logical InterfaceNaming for SRX3600, SRX3400, and SRX1400
Table 75 on page 996 shows the slot numbering, as well as the physical port and logical interfacenumbering, for both of the SRX Series devices that become node 0 and node 1 of the chassis clusterafter the cluster is formed.
Table 75: Chassis Cluster Slot Numbering, and Physical Port and Logical Interface Naming for SRX1400,SRX3400, and SRX3600
Model Chassis MaximumSlots PerNode
SlotNumbering ina Cluster
ManagementPhysicalPort/LogicalInterface
ControlPhysicalPort/LogicalInterface
FabricPhysicalPort/LogicalInterface
SRX3600 Node 0 13 (CFMslots)
0 — 12 DedicatedGigabitEthernet port
DedicatedGigabitEthernet port
Any Ethernetport
fxp0 em0 fab0
Node 1 13 — 25 DedicatedGigabitEthernet port
DedicatedGigabitEthernet port
Any Ethernetport
fxp0 em0 fab1
SRX3400 Node 0 8 (CFM slots) 0 — 7 DedicatedGigabitEthernet port
DedicatedGigabitEthernet port
Any Ethernetport
fxp0 em0 fab0
Node 1 8 — 15 DedicatedGigabitEthernet port
DedicatedGigabitEthernet port
Any Ethernetport
fxp0 em0 fab1
996

Table 75: Chassis Cluster Slot Numbering, and Physical Port and Logical Interface Naming for SRX1400,SRX3400, and SRX3600 (Continued)
Model Chassis MaximumSlots PerNode
SlotNumbering ina Cluster
ManagementPhysicalPort/LogicalInterface
ControlPhysicalPort/LogicalInterface
FabricPhysicalPort/LogicalInterface
SRX1400 Node 0 4 (FPC slots) 0 — 3 DedicatedGigabitEthernet port
DedicatedGigabitEthernet port
Any Ethernetport
fxp0 em0 fab0
Node 1 4 — 7 DedicatedGigabitEthernet port
DedicatedGigabitEthernet port
Any Ethernetport
fxp0 em0 fab1
997

Information about chassis cluster slot numbering is also provided in Figure 60 on page 998, Figure 61on page 999 and Figure 62 on page 999.
Figure 60: Chassis Cluster Slot Numbering for SRX3600 Devices
998

Figure 61: Chassis Cluster Slot Numbering for SRX3400 Devices
Figure 62: Chassis Cluster Slot Numbering for SRX1400 Devices
You can connect two control links (SRX1400, SRX4600, SRX5000 and SRX3000 lines only) and twofabric links between the two devices in the cluster to reduce the chance of control link and fabric linkfailure. See "Understanding Chassis Cluster Dual Control Links" on page 164 and "UnderstandingChassis Cluster Dual Fabric Links" on page 193.
Figure 65 on page 1001 show pairs of SRX Series devices with the fabric links and control linksconnected.
999

Figure 63 on page 1000 and Figure 64 on page 1000 show pairs of SRX Series devices with the fabriclinks and control links connected.
Figure 63: Connecting SRX3600 Devices in a Chassis Cluster
Figure 64: Connecting SRX3400 Devices in a Chassis Cluster
1000

For dual control links on SRX3000 line devices, the Routing Engine must be in slot 0 and the SRXClustering Module (SCM) in slot 1. The opposite configuration (SCM in slot 0 and Routing Engine in slot1) is not supported.
Figure 65: Connecting SRX1400 Devices in a Chassis Cluster
Supported Fabric Interface Types for SRX Series Devices (SRX210,SRX240, SRX220, SRX100, and SRX650 Devices)
For SRX210 devices, the fabric link can be any pair of Gigabit Ethernet interfaces or Fast Ethernetinterfaces (as applicable). Interfaces on SRX210 devices are Fast Ethernet or Gigabit Ethernet (the pairedinterfaces must be of a similar type) and all interfaces on SRX100 devices are Fast Ethernet interfaces.
For SRX550 devices, the fabric link can be any pair of Gigabit Ethernet interfaces or Fast Ethernetinterfaces (as applicable).
For SRX Series chassis clusters, the fabric link can be any pair of Ethernet interfaces spanning thecluster; the fabric link can be any pair of Gigabit Ethernet interface.
Table 76 on page 1001 shows the fabric interface types that are supported for SRX Series devices.
Table 76: Supported Fabric Interface Types for SRX Series Devices
SRX550 SRX650 SRX240 SRX220 SRX100 SRX210
Fast Ethernet Fast Ethernet Fast Ethernet Fast Ethernet Fast Ethernet
1001

Table 76: Supported Fabric Interface Types for SRX Series Devices (Continued)
SRX550 SRX650 SRX240 SRX220 SRX100 SRX210
Gigabit Ethernet Gigabit Ethernet Gigabit Ethernet Gigabit Ethernet Gigabit Ethernet
Redundant Ethernet Interfaces
Table 77: Maximum Number of Redundant Ethernet Interfaces Allowed (SRX100, SRX220, SRX240,SRX210, and SRX650)
Device Maximum Number of reth Interfaces
SRX100 8
SRX210 8
SRX220 8
SRX240 24
SRX650 68
• Point-to-Point Protocol over Ethernet (PPPoE) over redundant Ethernet (reth) interface is supportedon SRX100, SRX210, SRX220, SRX240, and SRX650 devices in chassis cluster mode. This featureallows an existing PPPoE session to continue without starting a new PPP0E session in the event of afailover.
For SRX100, SRX220, and SRX240 devices, the total number of logical interfaces that you can configureacross all the redundant Ethernet (reth) interfaces in a chassis cluster deployment is 1024.
IP address monitoring cannot be used on a chassis cluster running in transparent mode. The maximumnumber of monitoring IP addresses that can be configured per cluster is 32 for the SRX1400 device andthe SRX3000 line of devices.
1002

Control Links
• For SRX100, SRX210, and SRX220 devices, the control link uses the fe-0/0/7 interface.
• For SRX210 devices, the total number of logical interfaces that you can configure across all theredundant Ethernet (reth) interfaces in a chassis cluster deployment is 1024.
• For SRX240, SRX650M, devices, the control link uses the ge-0/0/1 interface.
Table 78: SRX Series Services Gateways Interface Settings (SRX100, SRX210, SRX220, SRX240)
Command SRX100 SRX210 SRX220 SRX240
set interfaces
fab0
fabric-options
member-interfaces
fe-0/0/1 ge-0/0/1 ge-0/0/0 toge-0/0/5
ge-0/0/2
set interfaces
fab1
fabric-options
member-interfaces
fe-1/0/1 ge-2/0/1 ge-3/0/0 toge-3/0/5
ge-5/0/2
set chassis clusterredundancy-group 1interface-monitor
fe-0/0/0 weight255
fe-0/0/3 weight255
ge-0/0/0 weight 255 ge-0/0/5 weight255
set chassis clusterredundancy-group 1interface-monitor
fe-0/0/2 weight255
fe-0/0/2 weight255
ge-3/0/0 weight 255 ge-5/0/5 weight255
set chassis clusterredundancy-group 1interface-monitor
fe-1/0/0 weight255
fe-2/0/3 weight255
ge-0/0/1 weight 255 ge-0/0/6 weight255
1003

Table 78: SRX Series Services Gateways Interface Settings (SRX100, SRX210, SRX220, SRX240)(Continued)
Command SRX100 SRX210 SRX220 SRX240
set chassis clusterredundancy-group 1interface-monitor
fe-1/0/2 weight255
fe-2/0/2 weight255
ge-3/0/1 weight 255 ge-5/0/6 weight255
set interfaces fe-0/0/2fastether-optionsredundant-parentreth1
fe-0/0/2fastether-optionsredundant-parentreth1
ge-0/0/2 fastether-options redundant-parent reth0
ge-0/0/5 gigether-options redundant-parent reth1
set interfaces fe-1/0/2fastether-optionsredundant-parentreth1
fe-2/0/2fastether-optionsredundant-parentreth1
ge-0/0/3 fastether-options redundant-parent reth1
ge-5/0/5 gigether-options redundant-parent reth1
set interfaces fe-0/0/0fastether-optionsredundant-parentreth0
fe-0/0/3fastether-optionsredundant-parentreth0
ge-3/0/2 fastether-options redundant-parent reth0
ge-0/0/6 gigether-options redundant-parent reth0
set interfaces fe-1/0/0fastether-optionsredundant-parentreth0
fe-2/0/3fastether-optionsredundant-parentreth0
ge-3/0/3 fastether-options redundant-parent reth1
ge-5/0/6 gigether-options redundant-parent reth0
ISSU System Requirements for SRX1400, SRX3400 and SRX3600
To perform an ISSU, your device must be running a Junos OS release that supports ISSU for the specificplatform. See Table 79 on page 1005 for platform support.
1004

Table 79: ISSU Platform Support SRX1400, SRX3400 and SRX3600
Device Junos OS Release
SRX1400 12.1X47-D10
SRX3400 12.1X47-D10
SRX3600 12.1X47-D10
1005