Embed Size (px)
Citation preview
254 IEEE TRANSACTIONS ON ENERGY CONVERSION, VOL. 30, NO. 1, MARCH 2015
An Experimental Design for Static EccentricityDetection in Synchronous Machines Using
a Cramer–Rao Lower Bound TechniqueWesley Doorsamy, Student Member, IEEE, Ahmed Abou-Elyazied Abdallh, Member, IEEE,
Willem A. Cronje, Member, IEEE, and Luc Dupre, Member, IEEE
Abstract—Detection of a static eccentricity fault in rotating elec-trical machines is possible through several measurement tech-niques, such as shaft voltages and flux probes. A predictive main-tenance approach typically requires that the condition monitoringtechnique is online, accurate, and able to detect incipient faults.This paper presents a study of the optimal measurement modalitythat leads to a minimal identification error of the static eccentric-ity in synchronous machines. The Cramer–Rao lower bound tech-nique is implemented by taking into account both measurementand model uncertainties. Numerical results are obtained using atwo-dimensional finite element model and is experimentally vali-dated on a synchronous two-pole generator. Results indicate thatshaft voltage measurements are better suited to the detection ofstatic eccentricity.
Index Terms—Cramer–Rao lower bound, experimental design,static eccentricity, synchronous generator.
I. INTRODUCTION
ROTATING electrical machines are indispensable compo-nents in industry. These machines require dedicated sys-
tems to prevent catastrophic failures, especially when involvedin critical industrial processes. Therefore, it is essential to usecontinuous online monitoring systems that can diagnose incipi-ent faults at an early stage and allow for remedial action beforedevelopment of severe fault mechanisms [1]. A typical exam-ple is the synchronous machine, which is commonly utilized inpower generation schemes where early fault detection methodsare imperative. In synchronous generators, an air gap eccentric-ity fault can deteriorate and through a cascading effect resultsin problems such as bearing failure amongst others [2].
Numerous methods are available for the diagnosis of an ec-centricity fault in rotating machines [3]–[5]. Each technique is
Manuscript received February 10, 2014; revised June 26, 2014; accepted Au-gust 11, 2014. Date of publication September 4, 2014; date of current versionFebruary 16, 2015. The work of W. Doorsamy was supported by the NationalResearch Foundation of South Africa. The work of A. A.-E. Abdallh was sup-ported by the Special Research Fund “Bijzonder Onderzoeksfonds” of GhentUniversity. Paper no. TEC-00034-2014.R1.
W. Doorsamy and W. A. Cronje are with the University of the Wit-watersrand, Johannesburg 2050, South Africa (e-mail: [email protected]; [email protected]).
A. A.-E. Abdallh is with the Department of Electrical Energy, Systems,and Automation, Ghent University, Ghent 9000, Belgium. He is also withthe Electrical Power and Machines Department, Cairo University, Giza, Egypt(e-mail: [email protected]).
L. Dupre is with the Department of Electrical Energy, Systems, and Automa-tion, Ghent 9000, Belgium (e-mail: [email protected]).
Color versions of one or more of the figures in this paper are available onlineat http://ieeexplore.ieee.org.
Digital Object Identifier 10.1109/TEC.2014.2347895
based on measurements which have an associated accuracy andresolution. For diagnosis of an early eccentricity fault in a syn-chronous machine, some well-known techniques such as shaftvoltage and magnetic flux measurements are available [6]. Inpractice, the identification process is critically dependent on themeasurements used [7]. Therefore, the selection of the optimalmeasurement shall ensure the accuracy of the eccentricity faultdetection. The research presented in this paper aims at selectingthe best measurement modality for diagnosis of a static eccen-tricity fault in a synchronous generator. The Cramer–Rao lowerbound (CRLB) technique is adopted to estimate the error onthe identification of the eccentricity fault associated with shaftvoltage and magnetic flux-based measurement techniques. Thismethod takes into account the effect of the measurement noiseas well as the uncertainty in some model parameters. First, anumerical analysis is performed, and thereafter, these resultsare then validated experimentally by carrying out real measure-ments on a synchronous generator. To the best of the authors’knowledge, this type of investigation has not yet been presentedand will definitely enhance the accuracy of the eccentricity iden-tification procedure.
In the subsequent section, the relevance of the investigatedmeasurement modes used in eccentricity detection is discussed.Sections III and IV describe the methodology and mathematicalmodeling, respectively. Numerical results are then presented inSection V followed by the experimental validation. Finally, abrief conclusion and summary of this paper is given.
II. ECCENTRICITY FAULT DETECTION
An eccentricity fault in a cylindrical rotor synchronous ma-chine occurs due to a deviation in the rotor position relative tothe stator and results in an asymmetrical air gap. In synchronousgenerators, unbalanced magnetic pull occurs due to higher fluxdensities as pole centers pass the smaller air gap. The altered fluxdistribution induces circulating currents in the rotor windingsresulting in higher losses. Additionally, an asymmetrical air gapcan also produce a considerable increase in end fringing flux,resulting in irregular local temperatures [8]. Several methods areavailable to detect eccentricity in synchronous generators. Someof these methods measure the resulting symptoms, e.g., vibra-tion and circulating currents. Examples of other online methodsare shaft voltage and magnetic flux monitoring, which have beenfound to have exceptional fault diagnostic capabilities [9], [10]and are selected for the presented investigation.
0885-8969 © 2014 IEEE. Personal use is permitted, but republication/redistribution requires IEEE permission.See http://www.ieee.org/publications standards/publications/rights/index.html for more information.
DOORSAMY et al.: AN EXPERIMENTAL DESIGN FOR STATIC ECCENTRICITY DETECTION IN SYNCHRONOUS MACHINES 255
Fig. 1. Experimental synchronous generator with a magnified view of shaftriding brushes (at the driven-end) used for condition monitoring purposes.
A. Shaft Voltage Monitoring
In a generator, the stray voltage observed across the rotatingshaft, or the voltage difference between the shaft and groundplane is called the shaft voltage [11]. Although emphasis hasbeen placed on the elimination, mitigation, and interpretationof the phenomena [12], [13], more recent work has shownthat the method is extremely valuable in the area of conditionmonitoring due its incipient fault diagnosing capabilities [14].Accurate and reliable shaft voltage sensing is possible witha suitable signal capturing system, consisting of two special-ized shaft riding brushes, together with a reliable ground grid[15]. Fig. 1 shows the experimental generator and one of thesebrushes. Several repeatable shaft voltage measurements are car-ried out with an approximate error of 1% from the nominalvalue.
B. Magnetic Flux Monitoring
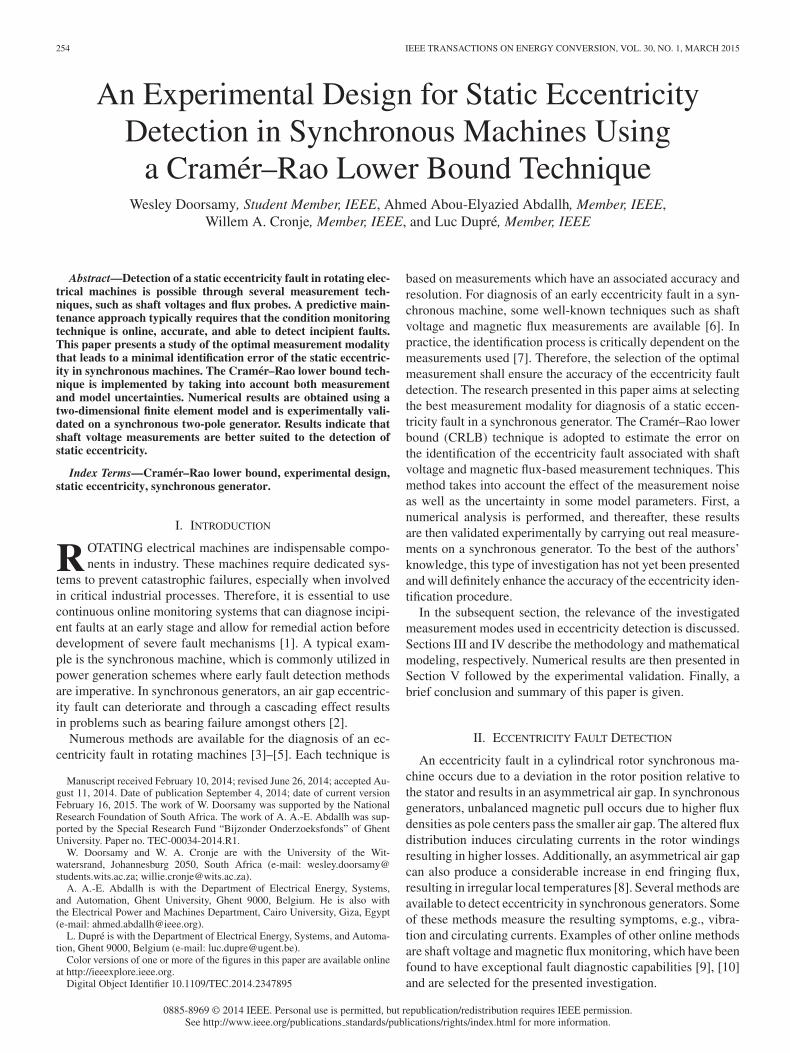
There are numerous modern technologies which allow foronline monitoring of the magnetic flux in the air gap. One ofthe earliest and most common methods is the use of a searchcoil/flux probe (hereafter referred to as flux probe). The methodutilizes a stationary coil fitted in the air gap of the machine asfirst described in [16]. The actual coil is fitted in the air gapof the machine, fixed to the stator, and detects the radial orcircumferential component of the magnetic flux (see Fig. 2).Some examples of the manner in which the technique is appliedto fault diagnosis are:
1) capturing of differential voltages when more than one coilis used;
2) analysis of the variations of the coil voltage amplitude;3) calculation and analysis of the flux directly from the mea-
sured voltage;4) analysis of the signal harmonics in the frequency domain
(also utilized in the presented paper).
Fig. 2. Picture of flux probes on the inner surface of the stator of the experi-mental generator.
III. METHODOLOGY
The rotor eccentricity in rotating electrical machines canbe identified by interpreting well-defined measurements via amathematical model of the considered machine [17].
The accuracy of the identification process depends on themeasured quantity being used. On the one hand, the measure-ment noise may largely influence the results. On the other hand,the sensitivity of the measured quantity on the eccentricity levelmay have a large impact on the identification results. There-fore, it is proposed that the CRLB stochastic technique, whichis widely used in signal processing [18] and heat transfer appli-cations [19], is utilized here. This technique has been recentlyused for estimating the error in the inverse problem solution ofmagnetic material characterization in different electromagneticdevices [20], [21].
In addition to the effect of the measurement noise, the identi-fication procedure is significantly influenced by the ambigu-ous knowledge of some model parameters [22]. In rotatingelectrical machines, one of the most uncertain parameters isthe one related to the magnetic material properties. The mate-rial properties of the magnetic core of rotating electrical ma-chines are classically obtained by performing some standardmeasurements, e.g., Epstein frame measurements, on a sepa-rate electrical steel sheet of the material used inside the ma-chine [23]. However, these standard measurements may notgive the actual properties of the material that exists in themachine.
In practice, the electrical steels are modified by mechanicaland thermal stresses during the manufacturing process due tocutting, clamping, welding, shrink fitting, etc. These mechani-cal and thermal stresses often deteriorate the material behavior[24]. Therefore, knowledge of the real magnetic material prop-erties located in the machine is uncertain. The effect of suchuncertainties on the accuracy of the eccentricity identificationprocess needs to be estimated. This can be done by adapting theclassical CRLB approach.
In the following section, the classical CRLB technique isbriefly described. Thereafter, the adjusted CRLB technique isoutlined in order to take the effect of uncertain model parame-ters, i.e., magnetic material characteristics, into account.
256 IEEE TRANSACTIONS ON ENERGY CONVERSION, VOL. 30, NO. 1, MARCH 2015
A. Classical CRLB Technique
In the classical CRLB technique, it is assumed that the iden-tification procedure is only affected by the accuracy of the mea-surements, while the machine model is assumed to be perfect,i.e., all physical phenomena are well described in the model. Inother words, the uncertainty in magnetic material properties isnot considered in this classical approach.
In fact, the classical CRLB can be seen as a kind of sensitivityanalysis of the system response R to the sought-after parameterδ, which is the rotor eccentricity level in this study. Since theair gap uncertainty level in not known in advance, the CRLBtechnique is used here as a priori “qualitative” error estimationbased on predefined values for the unknown parameters. Ac-cording to the Cramer–Rao inequality theorem, the covariancematrix of the lowest difference between the estimated and actual“predefined” parameter is bounded by the inverse of the Fisherinformation matrix [25]. In other words, the lower bound of thevariance of the unknown parameter σ2
δ is given by [26]
σ2δ ≥ FIM−1 (1)
where FIM is the Fisher information matrix, which reduces toa scalar for one unknown parameter, and can be simplified asfollows:
FIM =∂R
∂δ
T
S−1 ∂R
∂δ(2)
where ∂R∂δ is the sensitivity of the model response R to the
unknown parameter δ, and S is the variance of the noisy mea-sured quantity, which is assumed to be Gaussian white dis-tributed with zero mean and a standard deviation of σn .
B. Adjusted CRLB Technique
In order to study the effect of the uncertainties in some modelparameters on the accuracy of the detected eccentricity level,the classical CRLB is modified. The adjusted CRLB techniquecalculates the extended Fisher information matrix (EFIM) byincorporating the total equivalent noise of the experiment, i.e.,combined measurement and numerical noise, instead of the mea-surement noise in (2)
EFIM =∂R
∂δ
T
α−1∣∣δ=const.
∂R
∂δ(3)
where α is the total equivalent noise of the experiment [27]
α =∂R
∂x
T
G∂R
∂x+ S (4)
where G is the variance of the uncertain model parameter, whichis assumed to be normally distributed with mean value of μx anda standard deviation of σx . ∂R
∂x is the sensitivity of the modelresponse R to the uncertain model parameter x. α needs to becalculated for a predefined value of the unknown parameter δ.Similarly, the lower bound of the variance of the unknown pa-rameter σ2
δ , in the adjusted CRLB approach, is given in [28]
σ2δ ≥ EFIM−1 . (5)
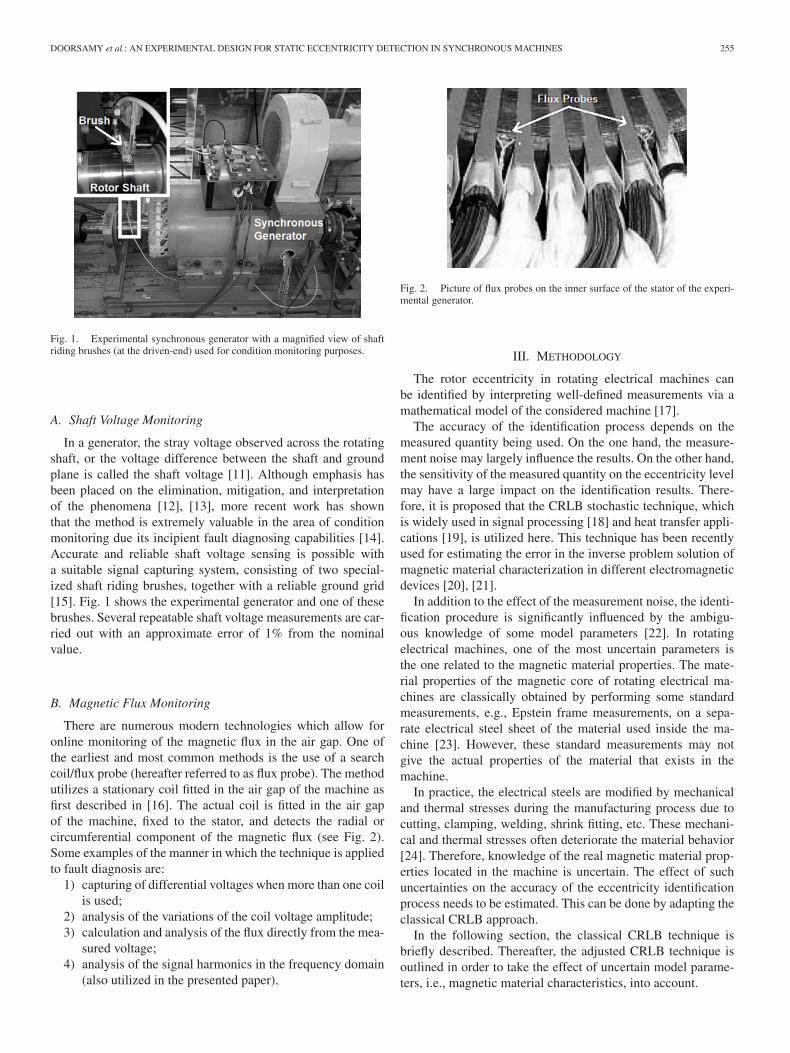
Fig. 3. Overview of proposed methodology for the estimation of the faultidentification error of a measurement modality.
C. General Overview
Fig. 3 depicts the flowchart of the proposed methodology. Ingeneral, the proposed methodology is a combined experimental-numerical approach. The main part of the approach, in the caseof the idealized model, is to calculate the sensitivity of thenumerical model response that corresponds to the consideredmeasurement modality to the unknown parameter, here the ec-centricity level, i.e., ∂R
∂δ . Based on the measurement noise S, thelower bound of the variance of the recovered parameter σ2
δ canbe computed. In case of the uncertainty existence, the extendedFIM needs to be calculated using the ∂R
∂δ , ∂R∂x , and the total noise
G. Hence, the σ2δ can be obtained. The measurement modality
with the lowest σδ is the best candidate for the static eccentricitydiagnosis.
IV. MATHEMATICAL MODELING
A Finite-Element (FE) model of the used generator was con-structed for this investigation. The model is designed for bothtransient and steady-state magnetic applications and enablescoupling with an external electric circuit. The model accommo-dates induced currents in addition to skin and proximity effectsin conducting regions, as necessary. Only the steady-state appli-cation is considered in the presented paper. A two-dimensional(2-D) plane model is assumed suitable for the purpose of thisinvestigation.
However, for the 2-D-FE, certain assumptions are intrinsic,such as the direction of the magnetic fields and flow of currents,and equal length of the stator and rotor cores. Fig. 4 illustratesthe modeled 2-D geometry of the used generator during this
DOORSAMY et al.: AN EXPERIMENTAL DESIGN FOR STATIC ECCENTRICITY DETECTION IN SYNCHRONOUS MACHINES 257
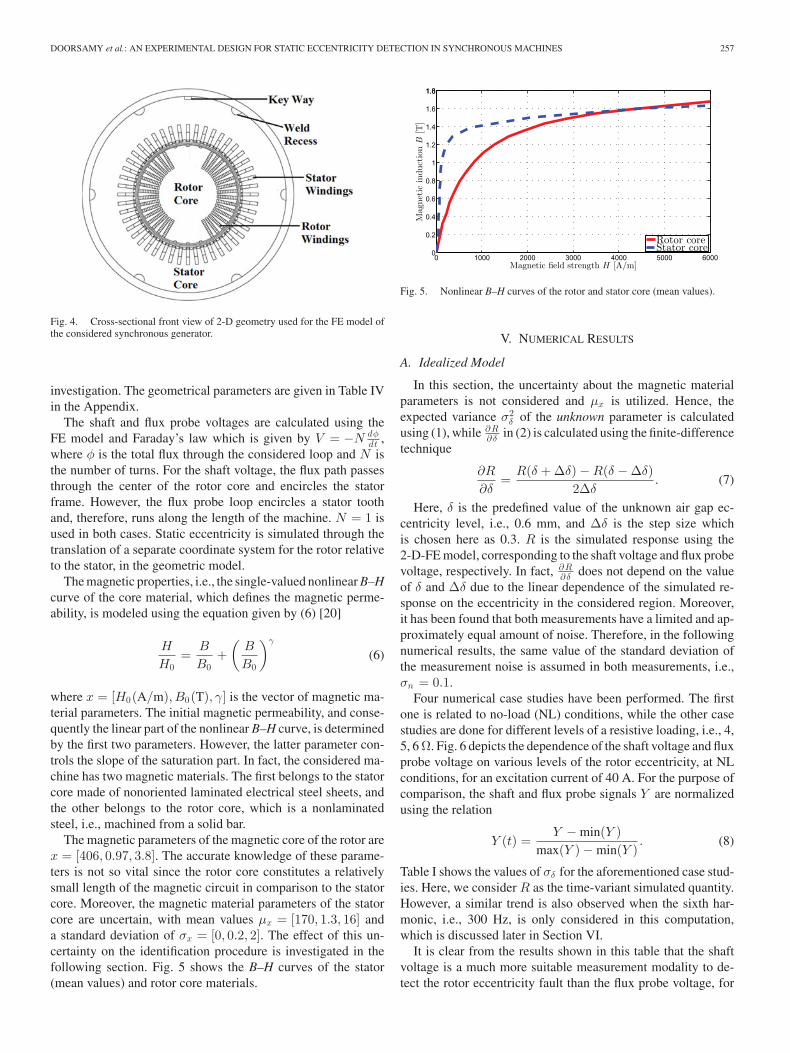
Fig. 4. Cross-sectional front view of 2-D geometry used for the FE model ofthe considered synchronous generator.
investigation. The geometrical parameters are given in Table IVin the Appendix.
The shaft and flux probe voltages are calculated using theFE model and Faraday’s law which is given by V = −N dφ
dt ,where φ is the total flux through the considered loop and N isthe number of turns. For the shaft voltage, the flux path passesthrough the center of the rotor core and encircles the statorframe. However, the flux probe loop encircles a stator toothand, therefore, runs along the length of the machine. N = 1 isused in both cases. Static eccentricity is simulated through thetranslation of a separate coordinate system for the rotor relativeto the stator, in the geometric model.
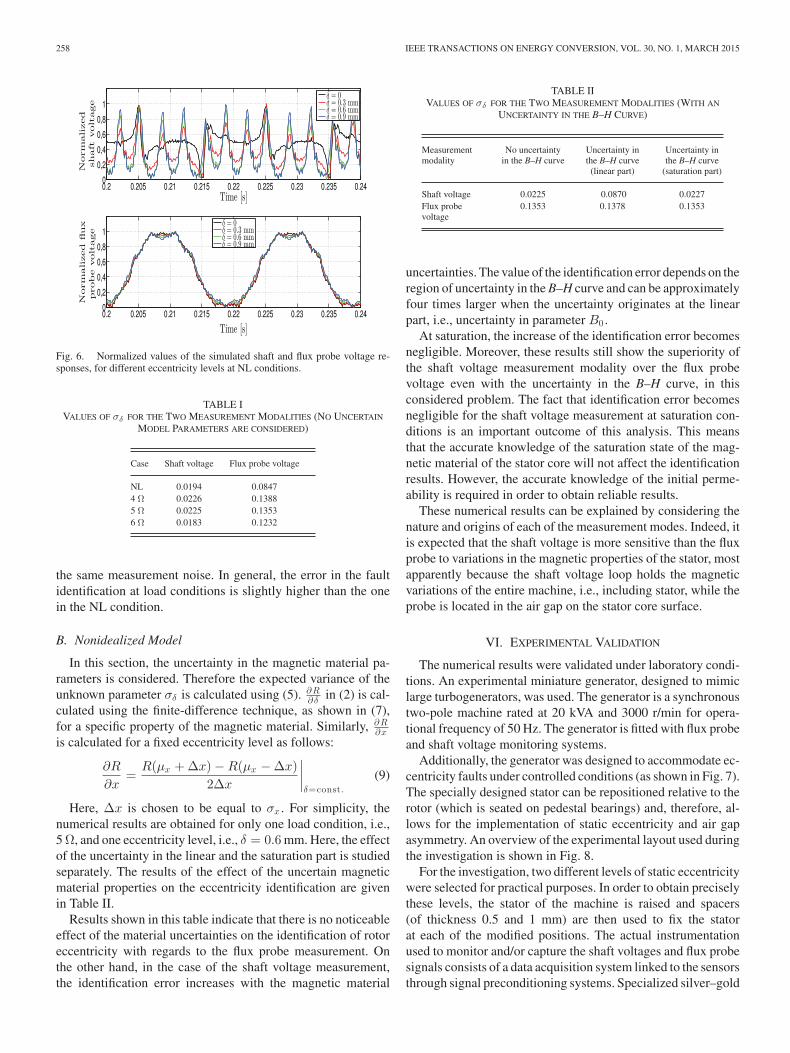
The magnetic properties, i.e., the single-valued nonlinear B–Hcurve of the core material, which defines the magnetic perme-ability, is modeled using the equation given by (6) [20]
H
H0=
B
B0+
(B
B0
)γ
(6)
where x = [H0(A/m), B0(T), γ] is the vector of magnetic ma-terial parameters. The initial magnetic permeability, and conse-quently the linear part of the nonlinear B–H curve, is determinedby the first two parameters. However, the latter parameter con-trols the slope of the saturation part. In fact, the considered ma-chine has two magnetic materials. The first belongs to the statorcore made of nonoriented laminated electrical steel sheets, andthe other belongs to the rotor core, which is a nonlaminatedsteel, i.e., machined from a solid bar.
The magnetic parameters of the magnetic core of the rotor arex = [406, 0.97, 3.8]. The accurate knowledge of these parame-ters is not so vital since the rotor core constitutes a relativelysmall length of the magnetic circuit in comparison to the statorcore. Moreover, the magnetic material parameters of the statorcore are uncertain, with mean values μx = [170, 1.3, 16] anda standard deviation of σx = [0, 0.2, 2]. The effect of this un-certainty on the identification procedure is investigated in thefollowing section. Fig. 5 shows the B–H curves of the stator(mean values) and rotor core materials.
Fig. 5. Nonlinear B–H curves of the rotor and stator core (mean values).
V. NUMERICAL RESULTS
A. Idealized Model
In this section, the uncertainty about the magnetic materialparameters is not considered and μx is utilized. Hence, theexpected variance σ2
δ of the unknown parameter is calculatedusing (1), while ∂R
∂δ in (2) is calculated using the finite-differencetechnique
∂R
∂δ=
R(δ + Δδ) − R(δ − Δδ)2Δδ
. (7)
Here, δ is the predefined value of the unknown air gap ec-centricity level, i.e., 0.6 mm, and Δδ is the step size whichis chosen here as 0.3. R is the simulated response using the2-D-FE model, corresponding to the shaft voltage and flux probevoltage, respectively. In fact, ∂R
∂δ does not depend on the valueof δ and Δδ due to the linear dependence of the simulated re-sponse on the eccentricity in the considered region. Moreover,it has been found that both measurements have a limited and ap-proximately equal amount of noise. Therefore, in the followingnumerical results, the same value of the standard deviation ofthe measurement noise is assumed in both measurements, i.e.,σn = 0.1.
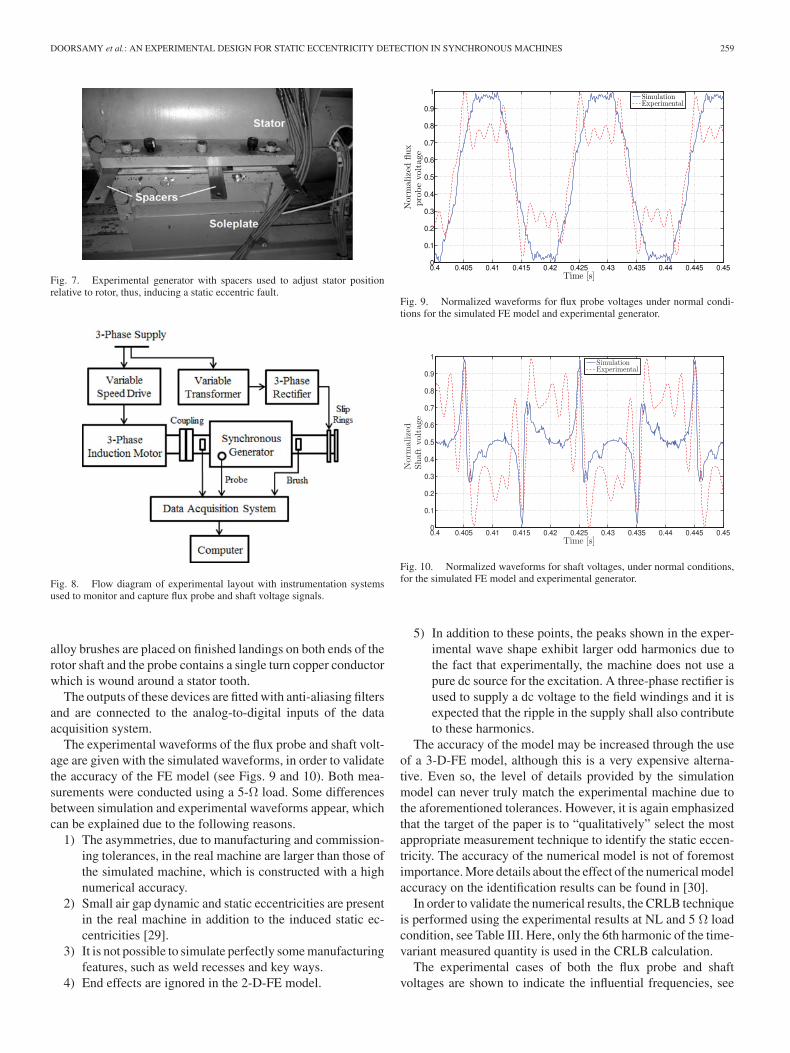
Four numerical case studies have been performed. The firstone is related to no-load (NL) conditions, while the other casestudies are done for different levels of a resistive loading, i.e., 4,5, 6 Ω. Fig. 6 depicts the dependence of the shaft voltage and fluxprobe voltage on various levels of the rotor eccentricity, at NLconditions, for an excitation current of 40 A. For the purpose ofcomparison, the shaft and flux probe signals Y are normalizedusing the relation
Y (t) =Y − min(Y )
max(Y ) − min(Y ). (8)
Table I shows the values of σδ for the aforementioned case stud-ies. Here, we consider R as the time-variant simulated quantity.However, a similar trend is also observed when the sixth har-monic, i.e., 300 Hz, is only considered in this computation,which is discussed later in Section VI.
It is clear from the results shown in this table that the shaftvoltage is a much more suitable measurement modality to de-tect the rotor eccentricity fault than the flux probe voltage, for
258 IEEE TRANSACTIONS ON ENERGY CONVERSION, VOL. 30, NO. 1, MARCH 2015
Fig. 6. Normalized values of the simulated shaft and flux probe voltage re-sponses, for different eccentricity levels at NL conditions.
TABLE IVALUES OF σδ FOR THE TWO MEASUREMENT MODALITIES (NO UNCERTAIN
MODEL PARAMETERS ARE CONSIDERED)
Case Shaft voltage Flux probe voltage
NL 0.0194 0.08474 Ω 0.0226 0.13885 Ω 0.0225 0.13536 Ω 0.0183 0.1232
the same measurement noise. In general, the error in the faultidentification at load conditions is slightly higher than the onein the NL condition.
B. Nonidealized Model
In this section, the uncertainty in the magnetic material pa-rameters is considered. Therefore the expected variance of theunknown parameter σδ is calculated using (5). ∂R
∂δ in (2) is cal-culated using the finite-difference technique, as shown in (7),for a specific property of the magnetic material. Similarly, ∂R
∂xis calculated for a fixed eccentricity level as follows:
∂R
∂x=
R(μx + Δx) − R(μx − Δx)2Δx
∣∣∣∣δ=const.
(9)
Here, Δx is chosen to be equal to σx . For simplicity, thenumerical results are obtained for only one load condition, i.e.,5 Ω, and one eccentricity level, i.e., δ = 0.6 mm. Here, the effectof the uncertainty in the linear and the saturation part is studiedseparately. The results of the effect of the uncertain magneticmaterial properties on the eccentricity identification are givenin Table II.
Results shown in this table indicate that there is no noticeableeffect of the material uncertainties on the identification of rotoreccentricity with regards to the flux probe measurement. Onthe other hand, in the case of the shaft voltage measurement,the identification error increases with the magnetic material
TABLE IIVALUES OF σδ FOR THE TWO MEASUREMENT MODALITIES (WITH AN
UNCERTAINTY IN THE B–H CURVE)
Measurementmodality
No uncertaintyin the B–H curve
Uncertainty inthe B–H curve
(linear part)
Uncertainty inthe B–H curve
(saturation part)
Shaft voltage 0.0225 0.0870 0.0227Flux probevoltage
0.1353 0.1378 0.1353
uncertainties. The value of the identification error depends on theregion of uncertainty in the B–H curve and can be approximatelyfour times larger when the uncertainty originates at the linearpart, i.e., uncertainty in parameter B0 .
At saturation, the increase of the identification error becomesnegligible. Moreover, these results still show the superiority ofthe shaft voltage measurement modality over the flux probevoltage even with the uncertainty in the B–H curve, in thisconsidered problem. The fact that identification error becomesnegligible for the shaft voltage measurement at saturation con-ditions is an important outcome of this analysis. This meansthat the accurate knowledge of the saturation state of the mag-netic material of the stator core will not affect the identificationresults. However, the accurate knowledge of the initial perme-ability is required in order to obtain reliable results.
These numerical results can be explained by considering thenature and origins of each of the measurement modes. Indeed, itis expected that the shaft voltage is more sensitive than the fluxprobe to variations in the magnetic properties of the stator, mostapparently because the shaft voltage loop holds the magneticvariations of the entire machine, i.e., including stator, while theprobe is located in the air gap on the stator core surface.
VI. EXPERIMENTAL VALIDATION
The numerical results were validated under laboratory condi-tions. An experimental miniature generator, designed to mimiclarge turbogenerators, was used. The generator is a synchronoustwo-pole machine rated at 20 kVA and 3000 r/min for opera-tional frequency of 50 Hz. The generator is fitted with flux probeand shaft voltage monitoring systems.
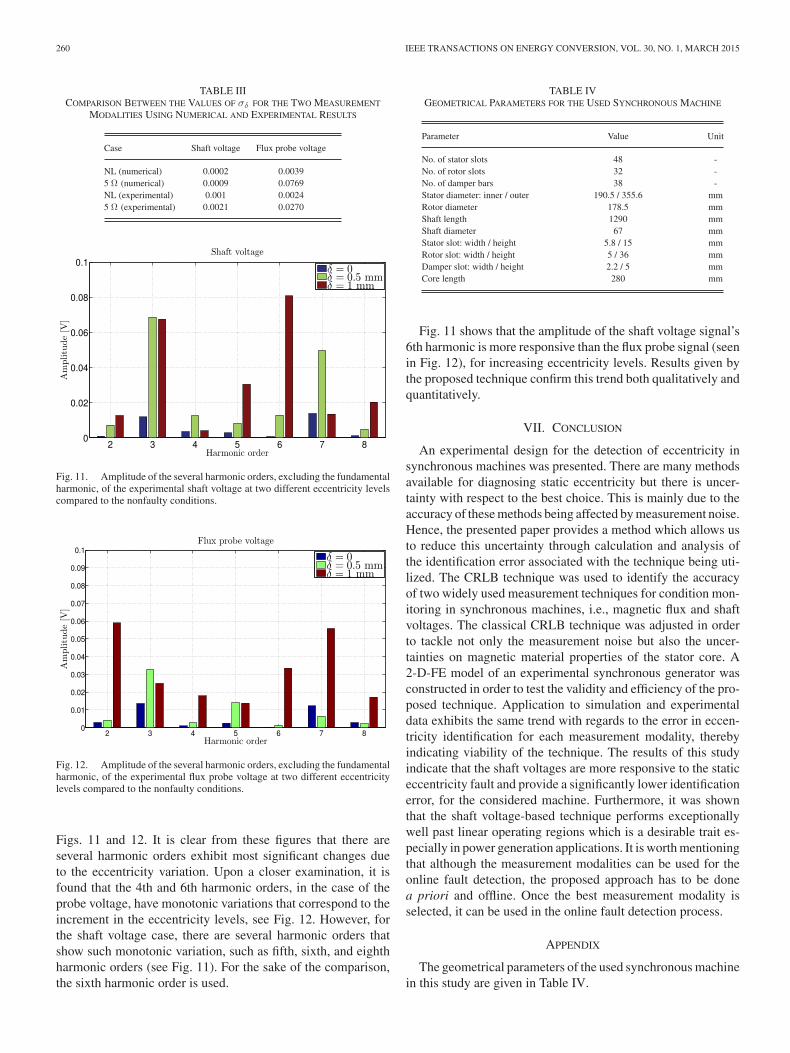
Additionally, the generator was designed to accommodate ec-centricity faults under controlled conditions (as shown in Fig. 7).The specially designed stator can be repositioned relative to therotor (which is seated on pedestal bearings) and, therefore, al-lows for the implementation of static eccentricity and air gapasymmetry. An overview of the experimental layout used duringthe investigation is shown in Fig. 8.
For the investigation, two different levels of static eccentricitywere selected for practical purposes. In order to obtain preciselythese levels, the stator of the machine is raised and spacers(of thickness 0.5 and 1 mm) are then used to fix the statorat each of the modified positions. The actual instrumentationused to monitor and/or capture the shaft voltages and flux probesignals consists of a data acquisition system linked to the sensorsthrough signal preconditioning systems. Specialized silver–gold
DOORSAMY et al.: AN EXPERIMENTAL DESIGN FOR STATIC ECCENTRICITY DETECTION IN SYNCHRONOUS MACHINES 259
Fig. 7. Experimental generator with spacers used to adjust stator positionrelative to rotor, thus, inducing a static eccentric fault.
Fig. 8. Flow diagram of experimental layout with instrumentation systemsused to monitor and capture flux probe and shaft voltage signals.
alloy brushes are placed on finished landings on both ends of therotor shaft and the probe contains a single turn copper conductorwhich is wound around a stator tooth.
The outputs of these devices are fitted with anti-aliasing filtersand are connected to the analog-to-digital inputs of the dataacquisition system.
The experimental waveforms of the flux probe and shaft volt-age are given with the simulated waveforms, in order to validatethe accuracy of the FE model (see Figs. 9 and 10). Both mea-surements were conducted using a 5-Ω load. Some differencesbetween simulation and experimental waveforms appear, whichcan be explained due to the following reasons.
1) The asymmetries, due to manufacturing and commission-ing tolerances, in the real machine are larger than those ofthe simulated machine, which is constructed with a highnumerical accuracy.
2) Small air gap dynamic and static eccentricities are presentin the real machine in addition to the induced static ec-centricities [29].
3) It is not possible to simulate perfectly some manufacturingfeatures, such as weld recesses and key ways.
4) End effects are ignored in the 2-D-FE model.
Fig. 9. Normalized waveforms for flux probe voltages under normal condi-tions for the simulated FE model and experimental generator.
Fig. 10. Normalized waveforms for shaft voltages, under normal conditions,for the simulated FE model and experimental generator.
5) In addition to these points, the peaks shown in the exper-imental wave shape exhibit larger odd harmonics due tothe fact that experimentally, the machine does not use apure dc source for the excitation. A three-phase rectifier isused to supply a dc voltage to the field windings and it isexpected that the ripple in the supply shall also contributeto these harmonics.
The accuracy of the model may be increased through the useof a 3-D-FE model, although this is a very expensive alterna-tive. Even so, the level of details provided by the simulationmodel can never truly match the experimental machine due tothe aforementioned tolerances. However, it is again emphasizedthat the target of the paper is to “qualitatively” select the mostappropriate measurement technique to identify the static eccen-tricity. The accuracy of the numerical model is not of foremostimportance. More details about the effect of the numerical modelaccuracy on the identification results can be found in [30].
In order to validate the numerical results, the CRLB techniqueis performed using the experimental results at NL and 5 Ω loadcondition, see Table III. Here, only the 6th harmonic of the time-variant measured quantity is used in the CRLB calculation.
The experimental cases of both the flux probe and shaftvoltages are shown to indicate the influential frequencies, see
260 IEEE TRANSACTIONS ON ENERGY CONVERSION, VOL. 30, NO. 1, MARCH 2015
TABLE IIICOMPARISON BETWEEN THE VALUES OF σδ FOR THE TWO MEASUREMENT
MODALITIES USING NUMERICAL AND EXPERIMENTAL RESULTS
Case Shaft voltage Flux probe voltage
NL (numerical) 0.0002 0.00395 Ω (numerical) 0.0009 0.0769NL (experimental) 0.001 0.00245 Ω (experimental) 0.0021 0.0270
Fig. 11. Amplitude of the several harmonic orders, excluding the fundamentalharmonic, of the experimental shaft voltage at two different eccentricity levelscompared to the nonfaulty conditions.
Fig. 12. Amplitude of the several harmonic orders, excluding the fundamentalharmonic, of the experimental flux probe voltage at two different eccentricitylevels compared to the nonfaulty conditions.
Figs. 11 and 12. It is clear from these figures that there areseveral harmonic orders exhibit most significant changes dueto the eccentricity variation. Upon a closer examination, it isfound that the 4th and 6th harmonic orders, in the case of theprobe voltage, have monotonic variations that correspond to theincrement in the eccentricity levels, see Fig. 12. However, forthe shaft voltage case, there are several harmonic orders thatshow such monotonic variation, such as fifth, sixth, and eighthharmonic orders (see Fig. 11). For the sake of the comparison,the sixth harmonic order is used.
TABLE IVGEOMETRICAL PARAMETERS FOR THE USED SYNCHRONOUS MACHINE
Parameter Value Unit
No. of stator slots 48 -No. of rotor slots 32 -No. of damper bars 38 -Stator diameter: inner / outer 190.5 / 355.6 mmRotor diameter 178.5 mmShaft length 1290 mmShaft diameter 67 mmStator slot: width / height 5.8 / 15 mmRotor slot: width / height 5 / 36 mmDamper slot: width / height 2.2 / 5 mmCore length 280 mm
Fig. 11 shows that the amplitude of the shaft voltage signal’s6th harmonic is more responsive than the flux probe signal (seenin Fig. 12), for increasing eccentricity levels. Results given bythe proposed technique confirm this trend both qualitatively andquantitatively.
VII. CONCLUSION
An experimental design for the detection of eccentricity insynchronous machines was presented. There are many methodsavailable for diagnosing static eccentricity but there is uncer-tainty with respect to the best choice. This is mainly due to theaccuracy of these methods being affected by measurement noise.Hence, the presented paper provides a method which allows usto reduce this uncertainty through calculation and analysis ofthe identification error associated with the technique being uti-lized. The CRLB technique was used to identify the accuracyof two widely used measurement techniques for condition mon-itoring in synchronous machines, i.e., magnetic flux and shaftvoltages. The classical CRLB technique was adjusted in orderto tackle not only the measurement noise but also the uncer-tainties on magnetic material properties of the stator core. A2-D-FE model of an experimental synchronous generator wasconstructed in order to test the validity and efficiency of the pro-posed technique. Application to simulation and experimentaldata exhibits the same trend with regards to the error in eccen-tricity identification for each measurement modality, therebyindicating viability of the technique. The results of this studyindicate that the shaft voltages are more responsive to the staticeccentricity fault and provide a significantly lower identificationerror, for the considered machine. Furthermore, it was shownthat the shaft voltage-based technique performs exceptionallywell past linear operating regions which is a desirable trait es-pecially in power generation applications. It is worth mentioningthat although the measurement modalities can be used for theonline fault detection, the proposed approach has to be donea priori and offline. Once the best measurement modality isselected, it can be used in the online fault detection process.
APPENDIX
The geometrical parameters of the used synchronous machinein this study are given in Table IV.
DOORSAMY et al.: AN EXPERIMENTAL DESIGN FOR STATIC ECCENTRICITY DETECTION IN SYNCHRONOUS MACHINES 261
REFERENCES
[1] P. J. Tavner, L. Ran, J. Penman and H. Sedding, “Introduction to conditionmonitoring,” in Condition Monitoring of Rotating Electrical Machines,1st ed., vol. 56, London, U.K.: Inst. Eng. Technol., 2008, pp. 1–10.
[2] J. L. Kohler, J. Sottile and F. C. Trutt, “Condition-based maintenance ofelectrical machines,” in Proc. IEEE 34th Ind. Appl. Conf., Pheonix, AZ,USA, 1999, pp. 205–211.
[3] K. Gyftakis and J. Kappatou, “A novel and effective method of staticeccentricity diagnosis in three-phase PSH induction motors,” IEEE Trans.Energy Convers., vol. 28, no. 2, pp. 405–412, Jun. 2013.
[4] D. Hyun, S. Lee, J. Hong, S. B. Lee, and S. Nandi, “Detection of airgapeccentricity for induction motors using the single-phase rotation test,”IEEE Trans. Energy Convers., vol. 27, no. 3, pp. 689–696, Sep. 2012.
[5] S. Nandi, S. Ahmed, and H. Toliyat, “Detection of rotor slot and other ec-centricity related harmonics in a three phase induction motor with differentrotor cages,” IEEE Trans. Energy Convers., vol. 16, no. 3, pp. 253–260,Sep. 2001.
[6] P. J. Tavner, B. G. Gaydon, and D. M. Ward, “Monitoring generatorsand large motors,” Proc. IEE, B, Elect. Power Appl., vol. 133, no. 3,pp. 169–180, May 1986.
[7] G. Crevecoeur, D. Baumgarten, U. Steinhoff, J. Haueisen, L. Trahms, andL. Dupre, “Advancements in magnetic nanoparticle reconstruction usingsequential activation of excitation coil arrays using magnetorelaxometry,”IEEE Trans. Magn., vol. 48, pp. 1313–1316, Apr. 2012.
[8] L. T. Rosenberg, “Eccentricity, vibration and shaft currents in turbinegenerators,” AIEE Trans., vol. 74, no. 3, pp. 38–41, Jan. 1955.
[9] R. L. Stoll and A. Hennache, “Method of detecting and modelling presenceof shorted turns in DC Filed winding of cylindrical rotor synchronousmachines using two airgap search coils,” IEE Proc. Elect. Power Appl.,vol. 135, no. 6, pp. 281–294, Nov. 1988.
[10] W. Doorsamy, W. A. Cronje, and A. S. Meyer, “Multiple fault diagnosison a synchronous 2 pole generator using shaft and flux probe signals,”in Proc. IEEE Int. Conf. Ind. Technol., Cape Town, South Africa, 2013,pp. 362–367.
[11] G. D’Antona, P. Pennacchi, C. Pensieri, and C. Rolla, “Turboalternatorshaft voltage measurements,” in Proc. IEEE Appl. Meas. Power Syst.,Aachen, Germany, 2012, pp. 1–4.
[12] M. J. Costello, “Shaft voltages and rotating machinery,” IEEE Trans. Ind.Appl., vol. 29, no. 2, pp. 419–426, Mar. 1993.
[13] J. Torlay, A. Foggia, C. Corenwinder, A. Audoli, and J. Herigault, “Anal-ysis of shaft voltages in large synchronous generators,” in Proc. IEEE Int.Conf. Elect. Mach. Drives, Seattle, WA, USA, 1999, pp. 607–609.
[14] W. Yucai, L. Yonggang, and L. Heming, “Diagnosis of turbine generatortypical faults by shaft voltage,” in Proc. IEEE Annu. Meeting Ind. Appl.Soc., Las Vegas, NV, USA, 2012, pp. 1–6.
[15] P. I. Nippes, “Early warning of developing problems in rotating machineryas provided by monitoring shaft voltages and grounding currents,” IEEETrans. Energy Convers., vol. 19, no. 2, pp. 340–345, Jun. 2004.
[16] D. R. Albright, “Interturn short-circuit detector for turbine-generator rotorwindings,” IEEE Trans. Power App. Syst., vol. PAS-90, no. 2, pp. 478–483,Mar. 1971.
[17] B. Ebrahimi, M. Roshtkhari, J. Faiz, and S. Khatami, “Advanced eccen-tricity fault recognition in permanent magnet synchronous motors usingstator current signature analysis,” IEEE Trans. Ind. Elect., vol. 61, no. 4,pp. 2041–2052, Apr. 2014.
[18] P. Stoica, E. Larsson, and A. Gershman, “The stochastic CRB for arrayprocessing: A textbook derivation,” IEEE Signal Process. Lett., vol. 8,no. 5, pp. 148–150, May 2001.
[19] A. Emery, A. Nenarokomov, and T. Fadale, “Uncertainties in parameterestimation: the optimal experiment,” Int. J. Heat Mass Transfer, vol. 43,pp. 3331–3339, 2000.
[20] A. Abdallh, G. Crevecoeur, and L. Dupre, “Optimal needle placementfor the accurate magnetic material quantification based on uncertaintyanalysis in the inverse approach,” Meas. Sci. Technol., vol. 21, pp. 115703-1–115703-16, 2010.
[21] A. Abdallh, G. Crevecoeur, and L. Dupre, “Selection of measurementmodality for magnetic material characterization of an electromagneticdevice using stochastic uncertainty analysis,” IEEE Trans. Magn., vol. 47,no. 11, pp. 4564–4573, Nov. 2011.
[22] A. Abdallh and L. Dupre, “Magnetic material characterization using aninverse problem approach,” in Adv. Magn. Mater., InTech, May, 2012,ISBN 978-953-51-0637-1.
[23] T. Mthombeni, P. Pillay, and R. Strnat, “New Epstein frame for laminationcore loss measurements under high frequencies and high flux densities,”IEEE Trans. Energy Convers., vol. 22, no. 3, pp. 614–620, Sep. 2007.
[24] B. Vaseghi, S. Rahman, and A. Knight, “Influence of steel manufacturingon J-A model parameters and magnetic properties,” IEEE Trans. Magn.,vol. 49, no. 5, pp. 1961–1964, May 2013.
[25] G. Strang, Introduction to Applied Mathematics. Cambridge, U.K.:Wellesley, 1986.
[26] T. Fadale, A. Nenarokomov, and A. Emery, “Uncertainties in parameterestimation: The inverse problem,” Int. J. Heat Mass Transfer, vol. 38,pp. 511–518, 1995.
[27] A. Emery and A. Nenarokomovz, “Optimal experiment design,” Meas.Sci. Technol., vol. 9, pp. 864–876, 1998.
[28] B. Radich and K. Buckley, “EEG dipole localization bounds and MAPalgorithms for head models with parameter uncertainties,” IEEE Trans.Biomed. Eng., vol. 42, no. 3, pp. 233–241, Mar. 1995.
[29] S. Nandi, H. A. Toliyat, and X. Li, “Condition monitoring and fault di-agnosis of electrical motors–A review,” IEEE Trans. Energy Convers.,vol. 20, no. 4, pp. 719–729, Dec. 2005.
[30] A. Abdallh, G. Crevecoeur, and L. Dupre, “A Bayesian approach forstochastic modeling error reduction of magnetic material identification ofan electromagnetic device,” Meas. Sci. Technol., vol. 23, pp. 035601-1–035601–12, 2012.
Wesley Doorsamy (SM’12) received the B.Sc. andM.Sc. degrees in electrical engineering from the Uni-versity of the Witwatersrand, Johannesburg, SouthAfrica, in 2008 and 2012, respectively.
His research interests include electrical machines.
Ahmed Abou-Elyazied Abdallh (M’12) was born inEgypt in 1980. He received the B.Sc. and , M.Sc. de-grees in electrical engineering from Cairo University,Giza, Egypt, in 2003 and 2006, respectively. In 2012,he received the Ph.D. degree in electromechanicalengineering from Ghent University, Ghent, Belgium.
Since 2012, he has been a Postdoctoral Researcherfor the BOF (Bijzonder Onderzoeksfonds) at GhentUniversity. His research interests include numericalmethods for electromagnetics, especially the mag-netic materials identification using inverse problems.
Willem A. Cronje (M’92) received the D.Ing. de-gree from Rand Afrikaans University, Johannesburg,South Africa, in 1993.
He works in power electronics and magnetic de-sign, has coauthored several papers in the field, andcurrently holds a chair in the Department of Electri-cal Machines and Drives, University of the Witwa-tersrand, Johannesburg.
Luc Dupre (M’00) was born in 1966. He receivedthe Graduate degree in electrical and mechanical en-gineering in 1989, and the Doctorate degree in ap-plied sciences in 1995, from the University of Ghent,Ghent, Belgium.
He is currently a Full Professor in the Fac-ulty of Engineering and Architecture, Ghent Univer-sity. His research interests mainly include numer-ical methods for electromagnetics, modeling, andcharacterization of soft magnetic materials, micro-magnetism, inverse problems, and optimization in
(bio)electromagnetism.