Embed Size (px)
Citation preview
25.3.2004 1
A thematic map module at Virtual School of Statistics Finland
Nordic Forum for GeostatisticsCopenhagen 25.3.2004
Ulla-Maarit SaarinenStatistics Finland
25.3.2004 2
H E L S I N K I
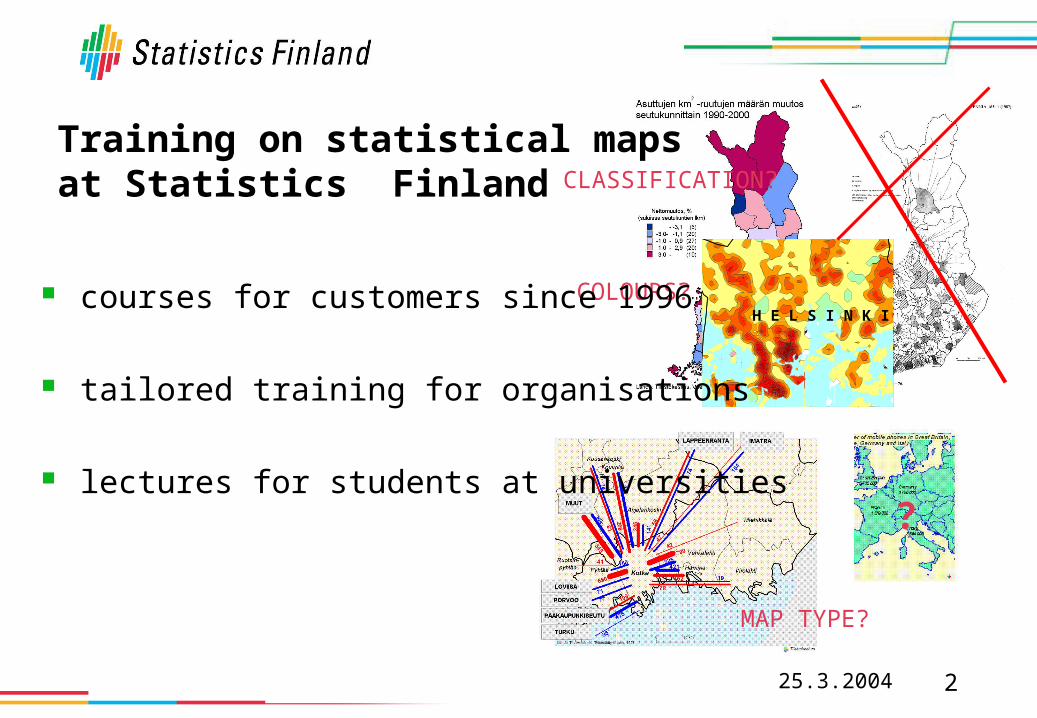
?
MAP TYPE?
CLASSIFICATION?
COLOURS?
Training on statistical maps at Statistics Finland
courses for customers since 1996
tailored training for organisations
lectures for students at universities
25.3.2004 3
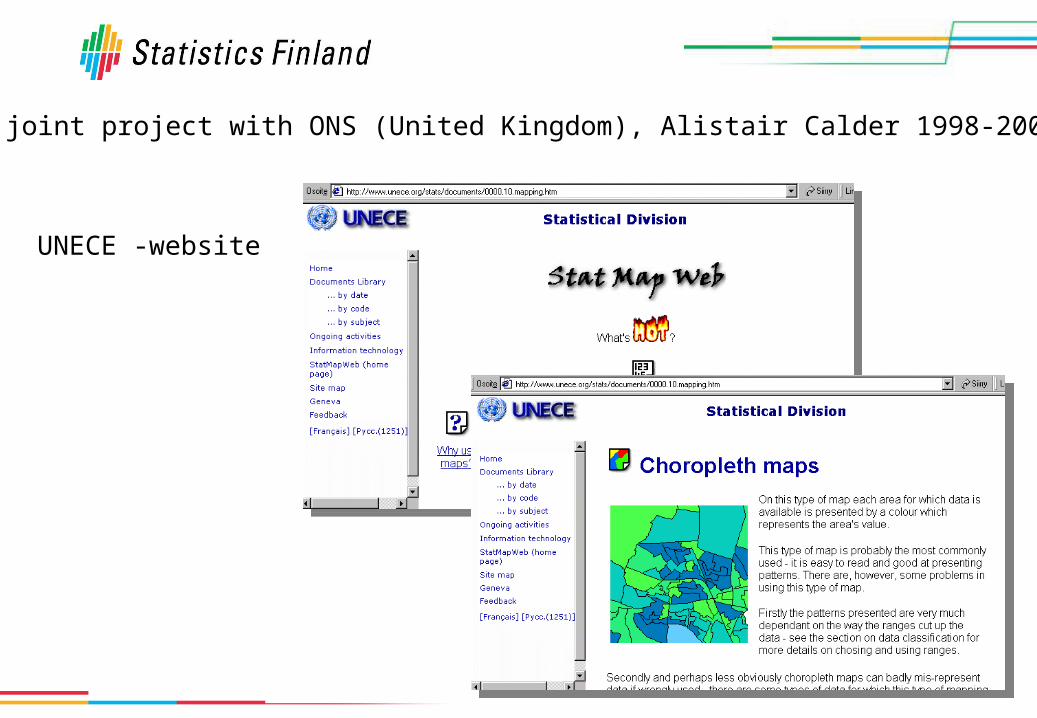
A joint project with ONS (United Kingdom), Alistair Calder 1998-2000
UNECE -website
25.3.2004 4
Statistics Finland’s Virtual School
project started in the beginning of 2001
the first course (Demographics) on the web was published in autumn 2001
first lessons of the thematic maps course were published on the web in Dec. 2003
25.3.2004 5
For what are statistics needed?
How are statistics used?
How should statistics to be understood?
Virtual School offers basic knowledge of statistics and helps to understand statistics.
Training at Virtual School
25.3.2004 6
Virtual school of Statistics Finland
”a school for citizens”: open to everybody
is useful tohigh school studentscollege and university students for basic knowledgeall those who use/read/study statistical informationall those who want to improve their understanding of
statistical information
to start the ’school’ no knowledge of statistics is required
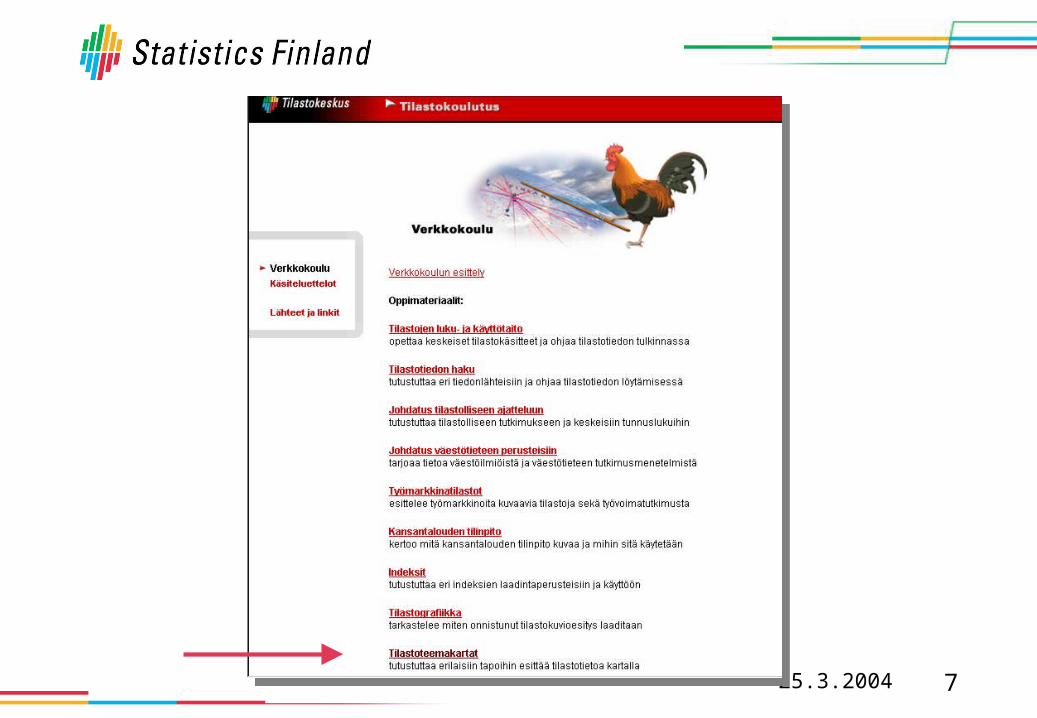
25.3.2004 7
25.3.2004 8
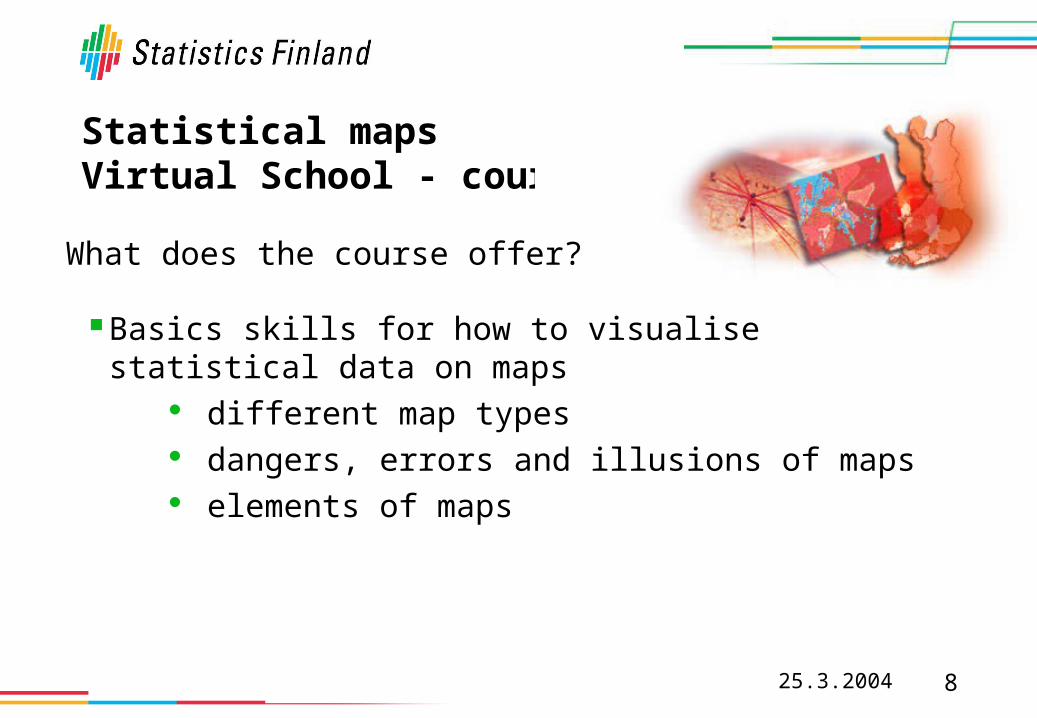
Statistical maps Virtual School - course
Basics skills for how to visualise statistical data on maps
different map types dangers, errors and illusions of maps elements of maps
What does the course offer?
25.3.2004 9
To whom the training is for?
those who use statistical maps in their work or study
those who make thematic maps those using or studying regional statistics graphic designers, visual designers, editors everybody interested in maps
25.3.2004 10
25.3.2004 11
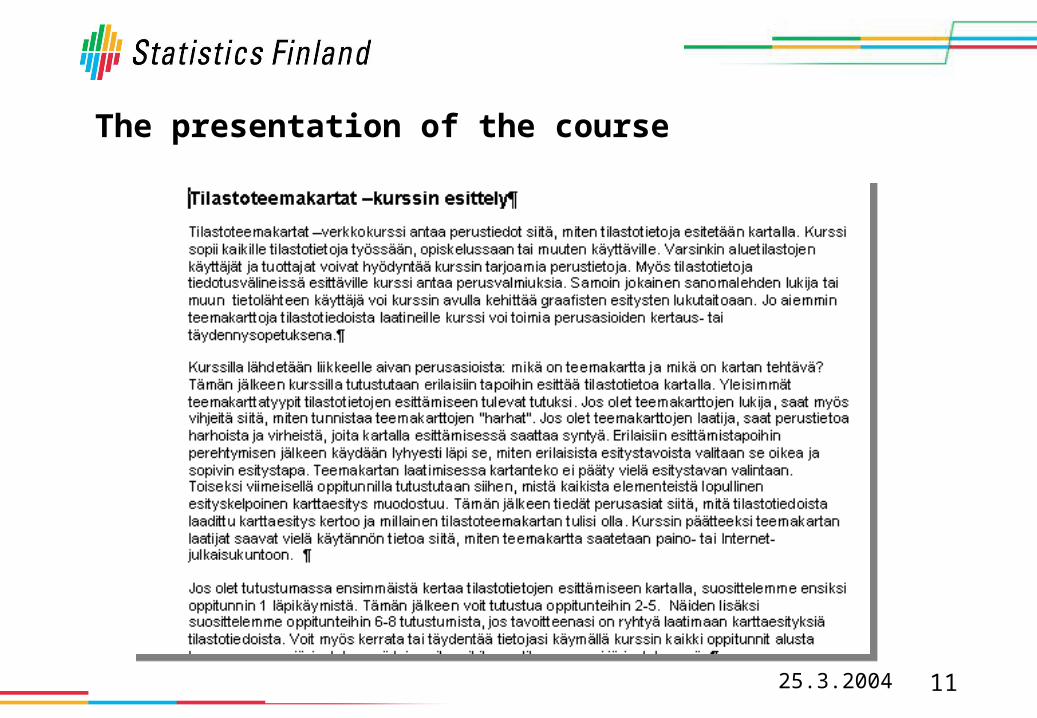
The presentation of the course
25.3.2004 12
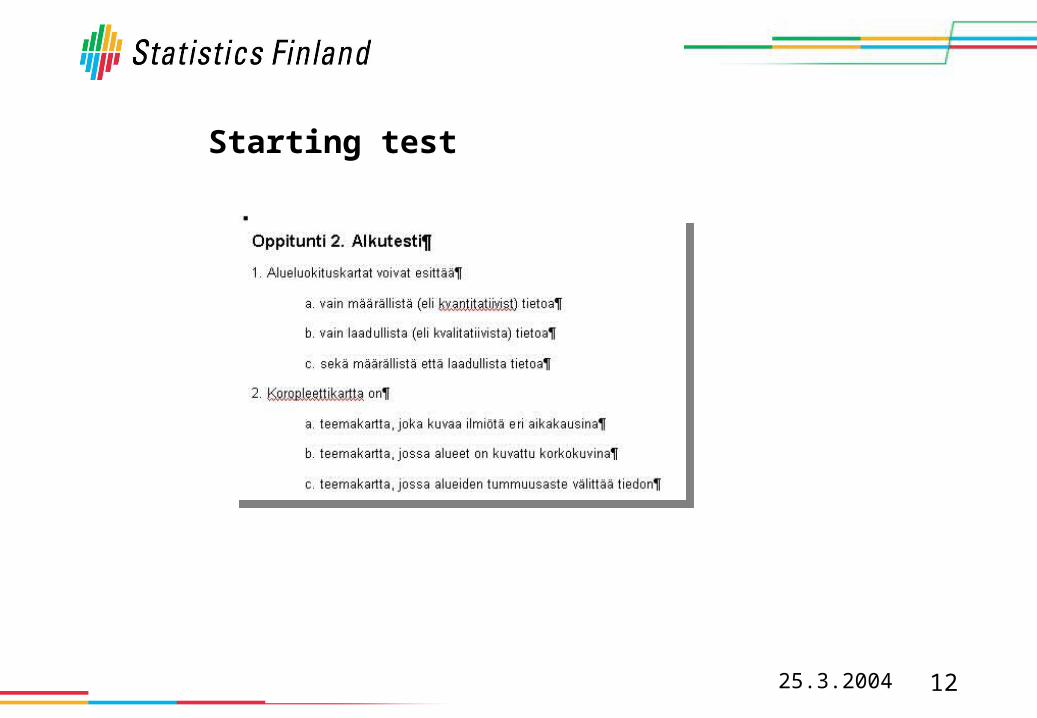
Starting test
25.3.2004 13
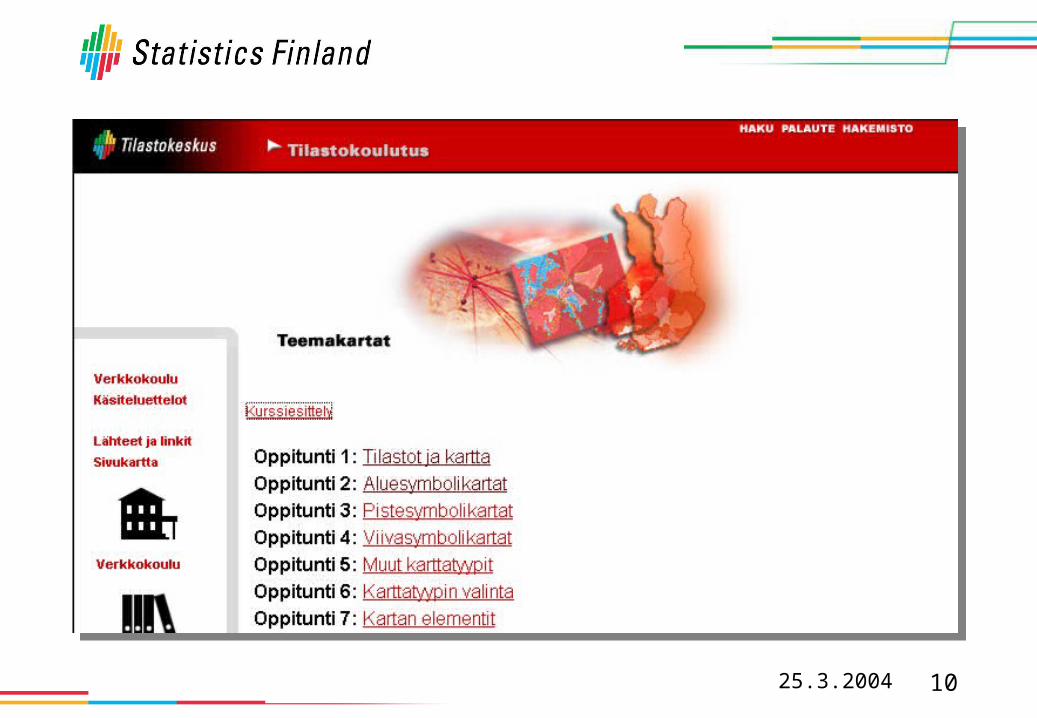
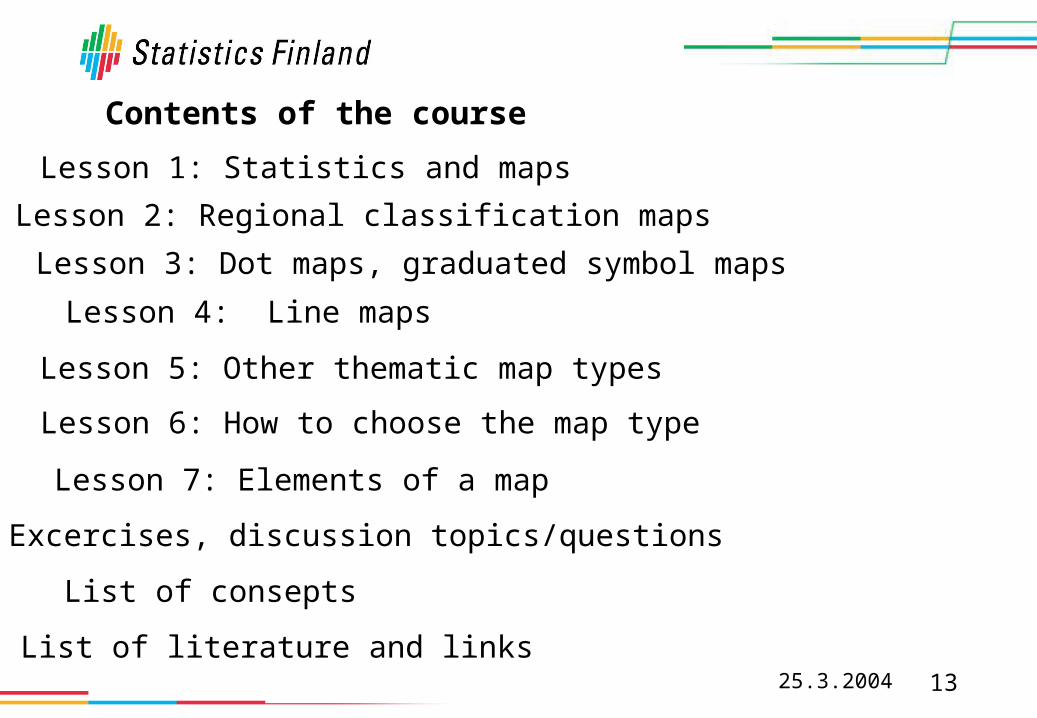
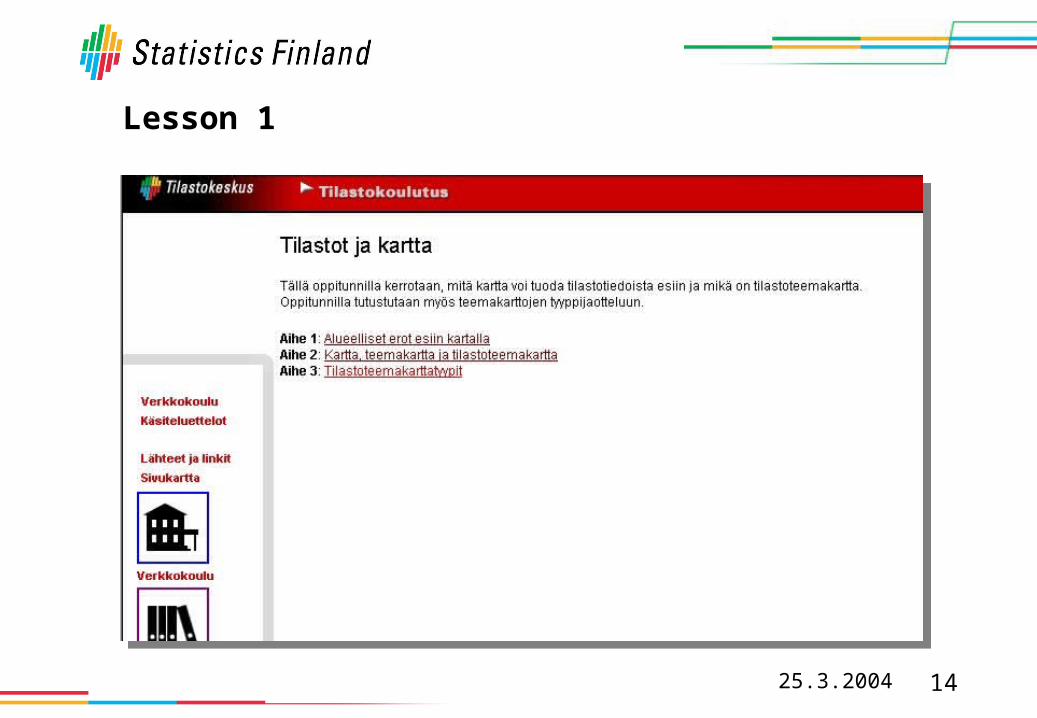
Lesson 1: Statistics and maps
Lesson 2: Regional classification maps
Lesson 4: Line maps
Lesson 3: Dot maps, graduated symbol maps
Lesson 5: Other thematic map types
Lesson 6: How to choose the map type
Lesson 7: Elements of a map
List of consepts
Excercises, discussion topics/questions
Contents of the course
List of literature and links
25.3.2004 14
Lesson 1
25.3.2004 15
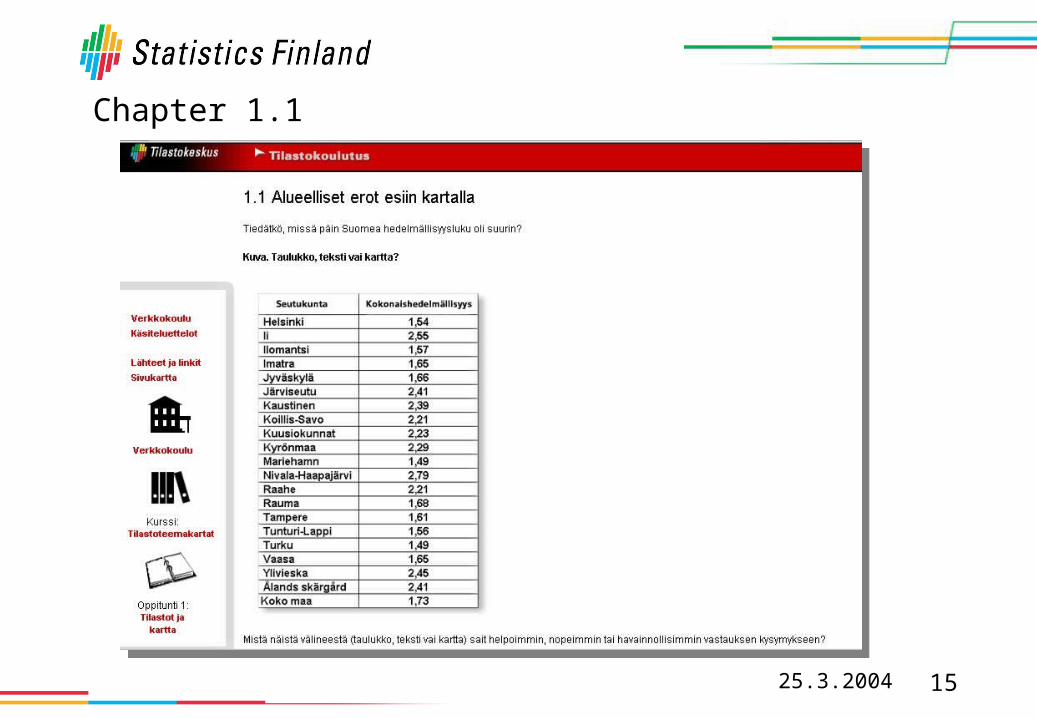
Chapter 1.1
25.3.2004 16
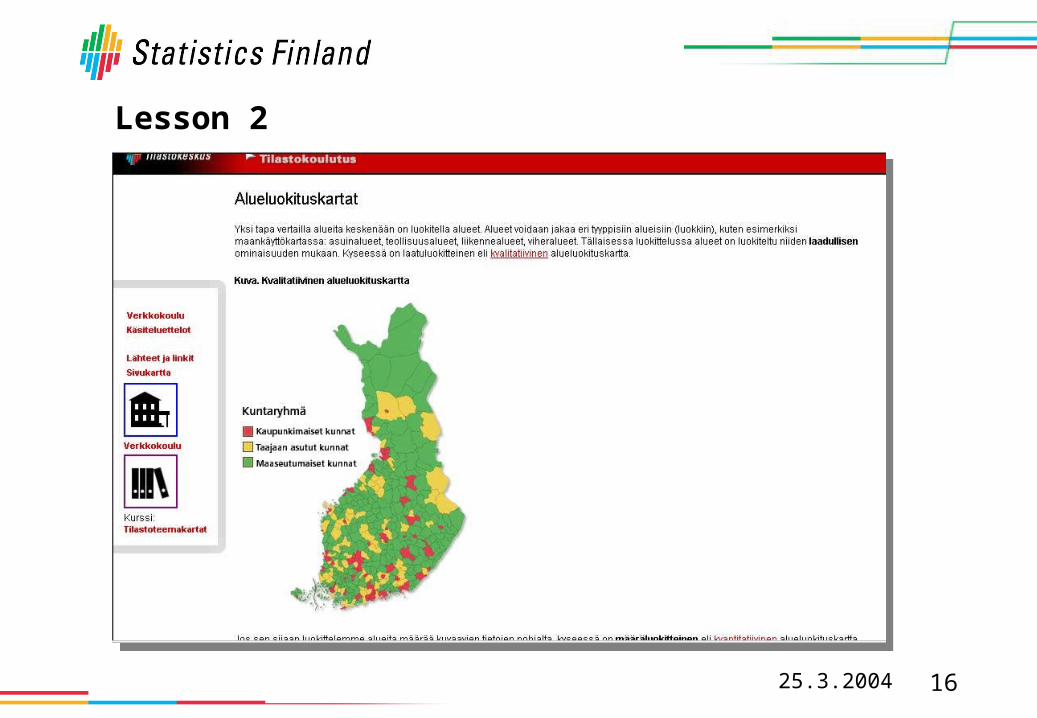
Lesson 2
25.3.2004 17
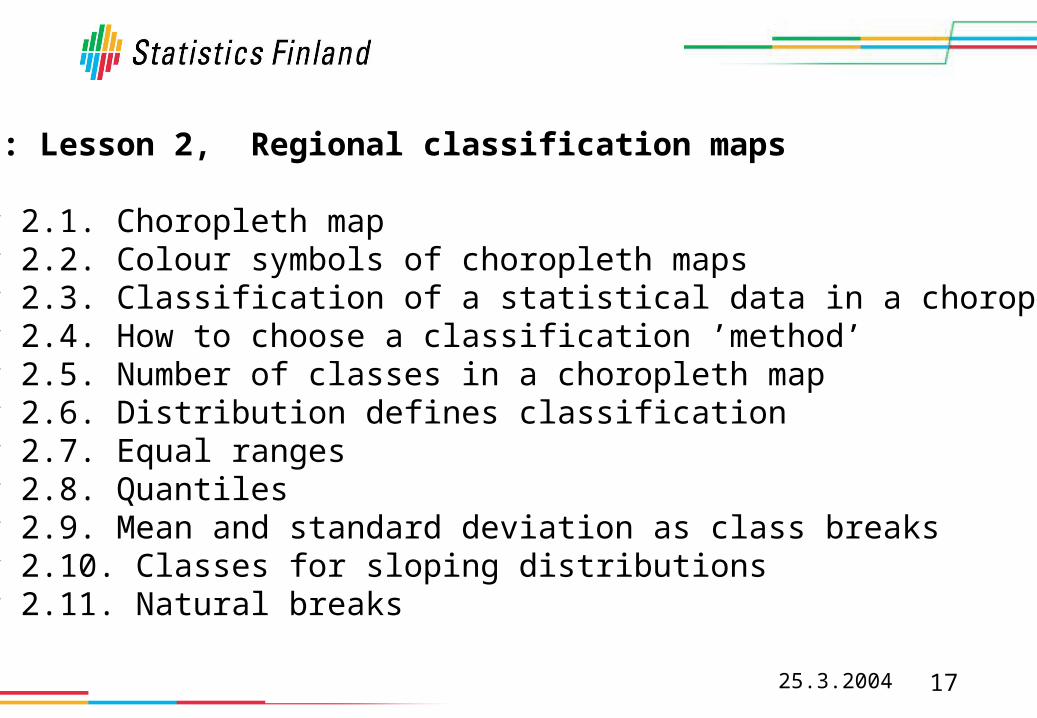
Example: Lesson 2, Regional classification maps
Chapter 2.1. Choropleth mapChapter 2.2. Colour symbols of choropleth mapsChapter 2.3. Classification of a statistical data in a choropleth map Chapter 2.4. How to choose a classification ’method’Chapter 2.5. Number of classes in a choropleth mapChapter 2.6. Distribution defines classificationChapter 2.7. Equal rangesChapter 2.8. QuantilesChapter 2.9. Mean and standard deviation as class breaksChapter 2.10. Classes for sloping distributionsChapter 2.11. Natural breaks
25.3.2004 18
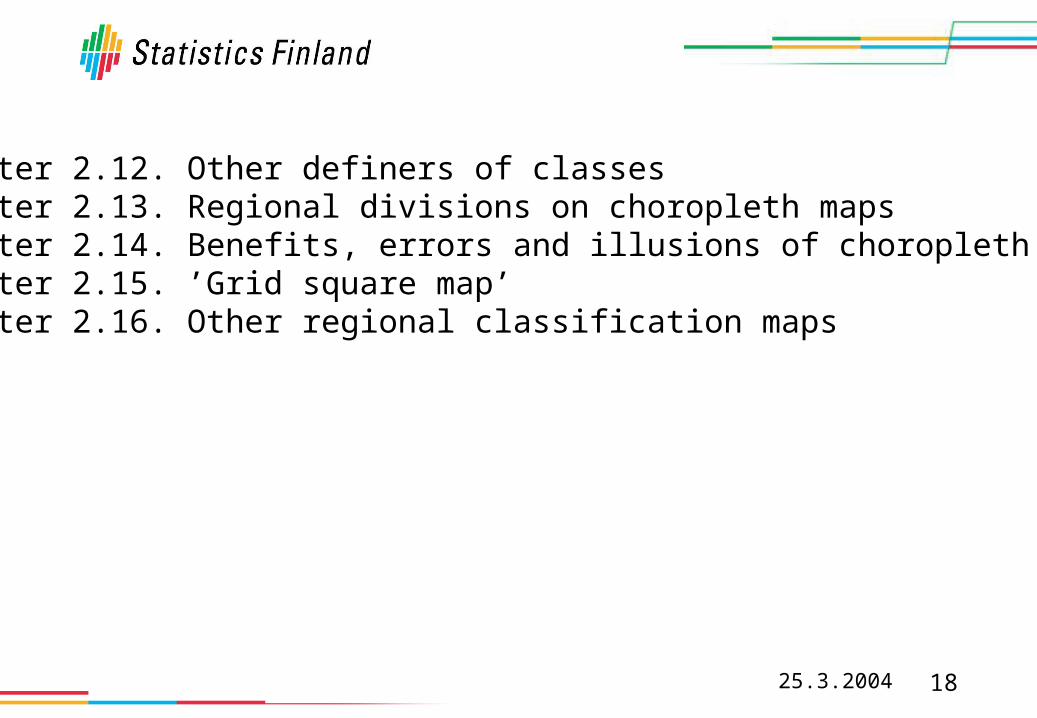
Chapter 2.12. Other definers of classesChapter 2.13. Regional divisions on choropleth mapsChapter 2.14. Benefits, errors and illusions of choropleth mapsChapter 2.15. ’Grid square map’Chapter 2.16. Other regional classification maps
25.3.2004 19
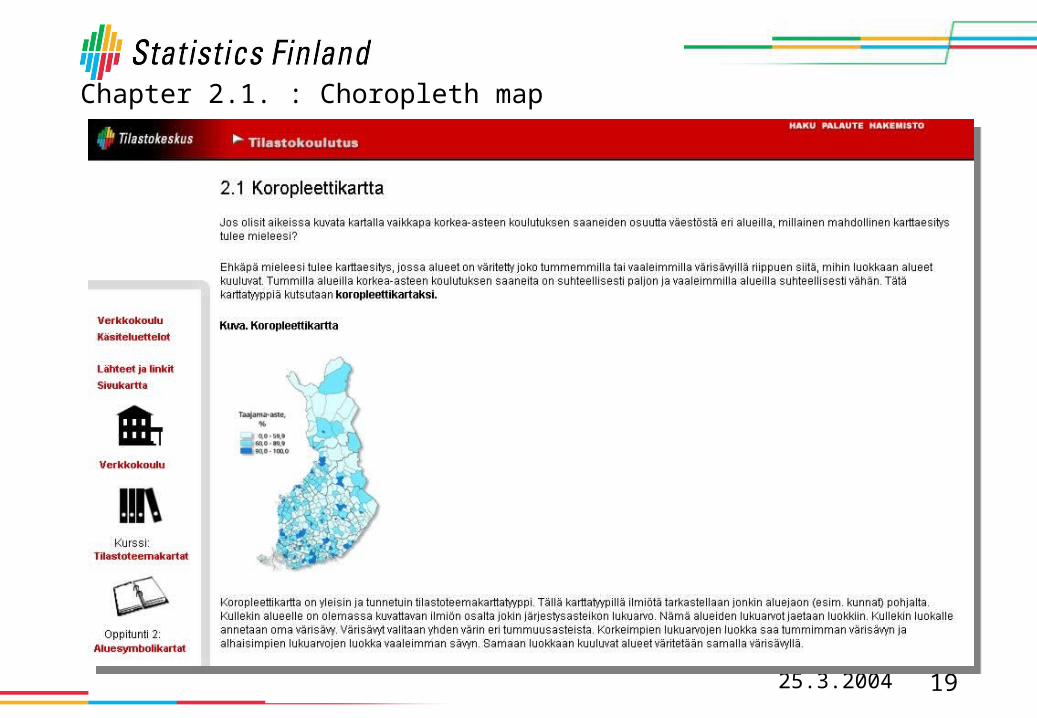
Chapter 2.1. : Choropleth map
25.3.2004 20
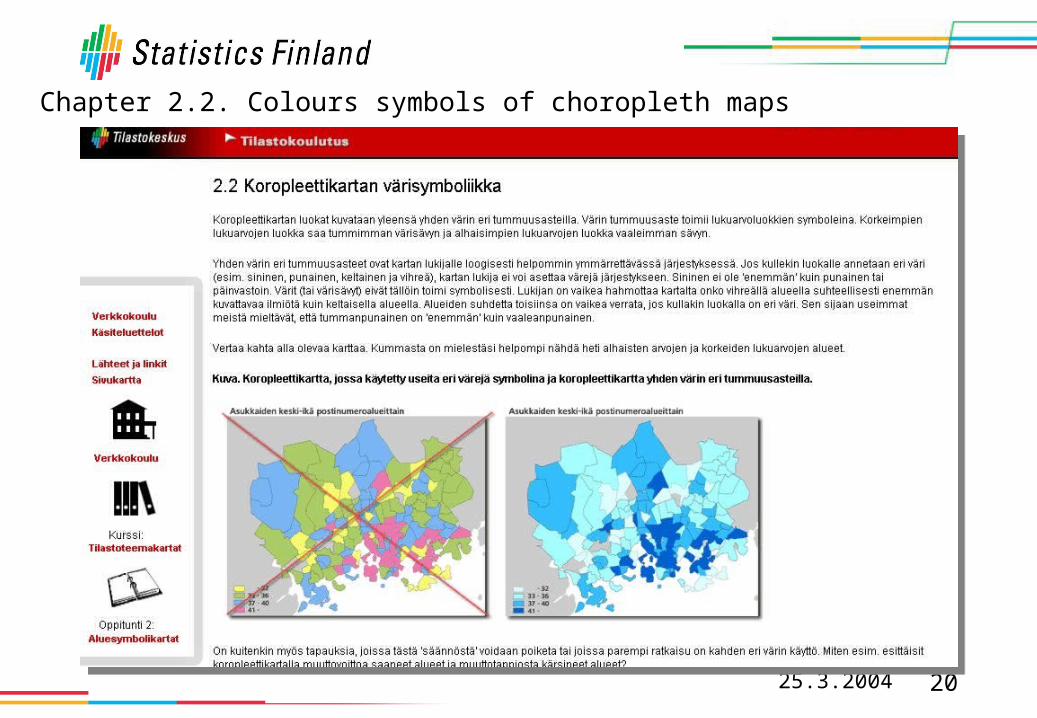
Chapter 2.2. Colours symbols of choropleth maps
25.3.2004 21
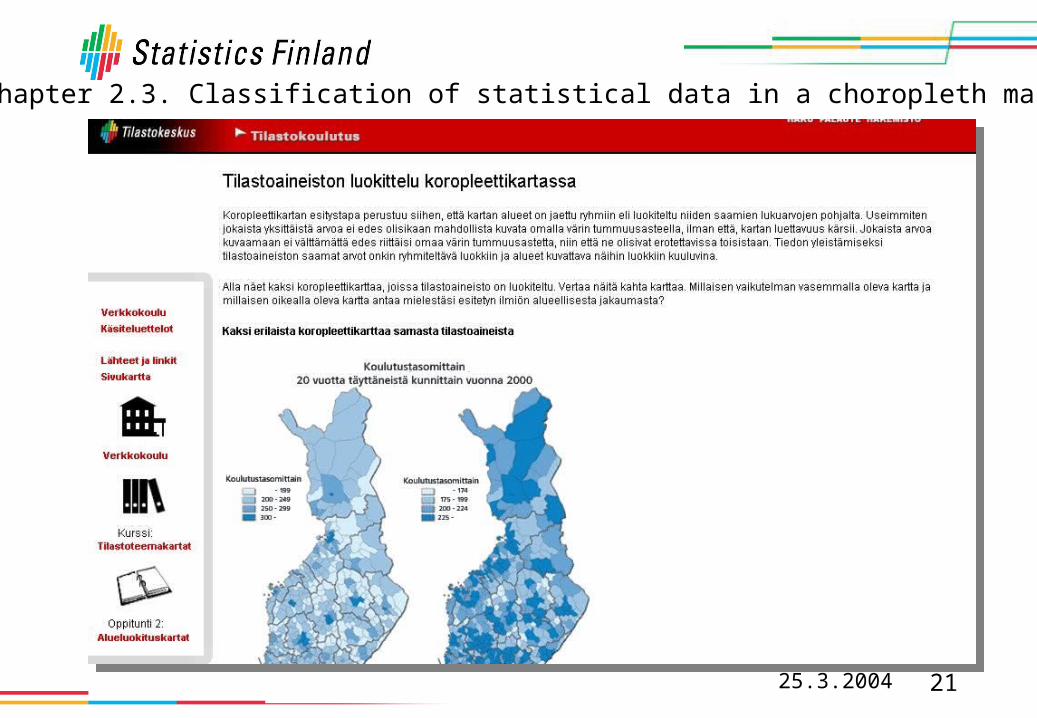
Chapter 2.3. Classification of statistical data in a choropleth map
25.3.2004 22
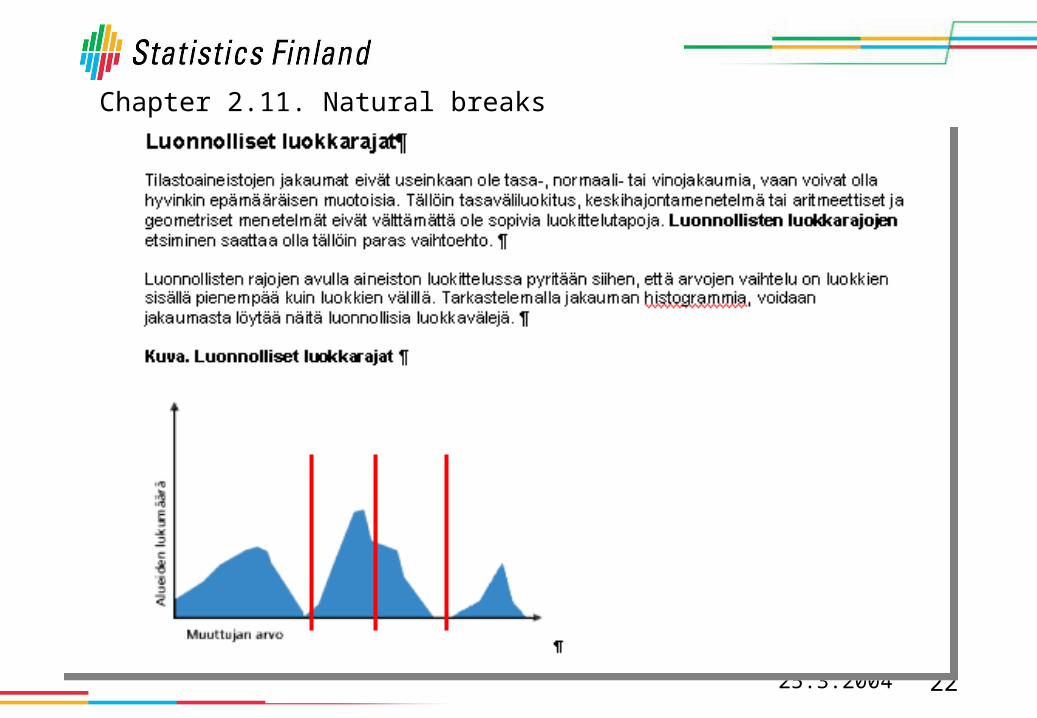
Chapter 2.11. Natural breaks
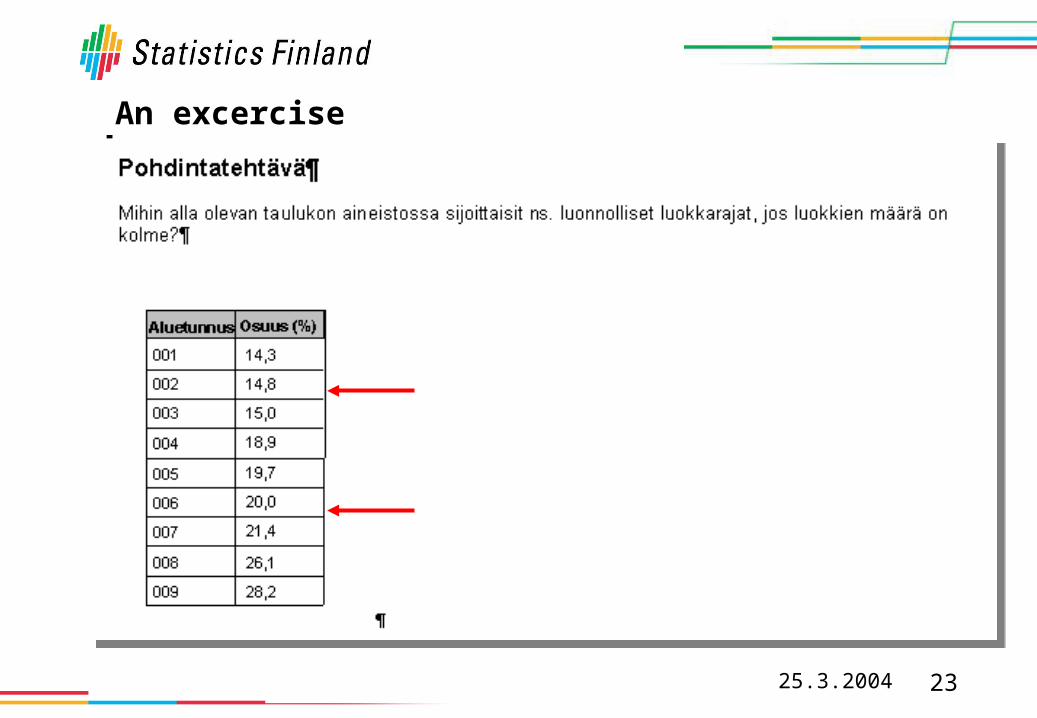
25.3.2004 23
An excercise
25.3.2004 24
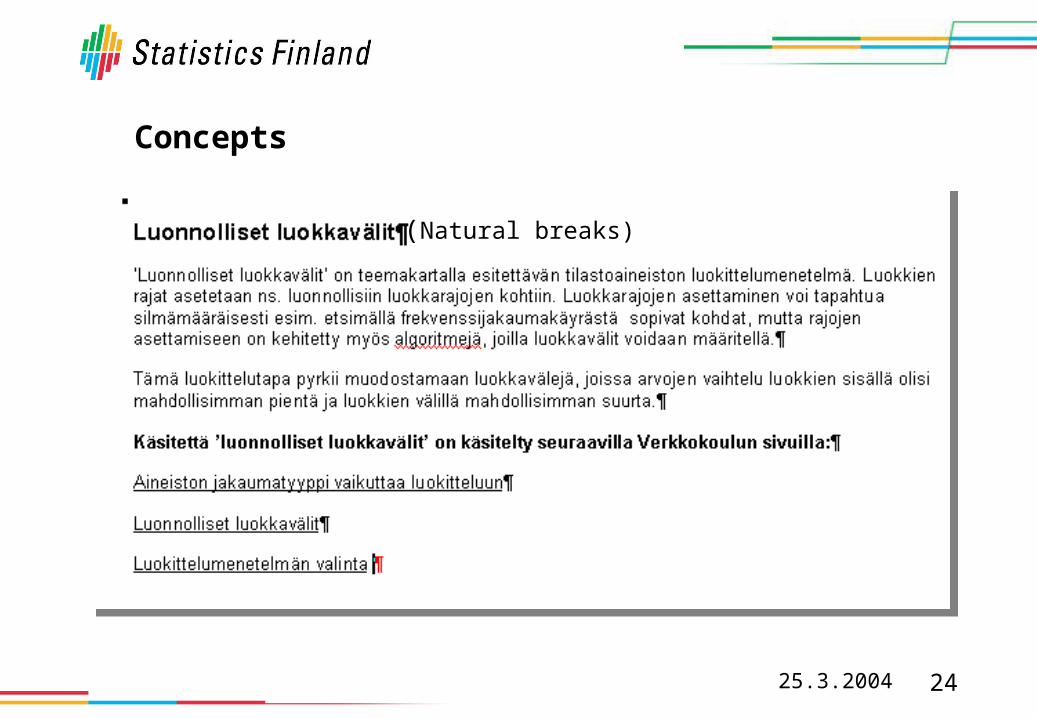
Concepts
(Natural breaks)
25.3.2004 25
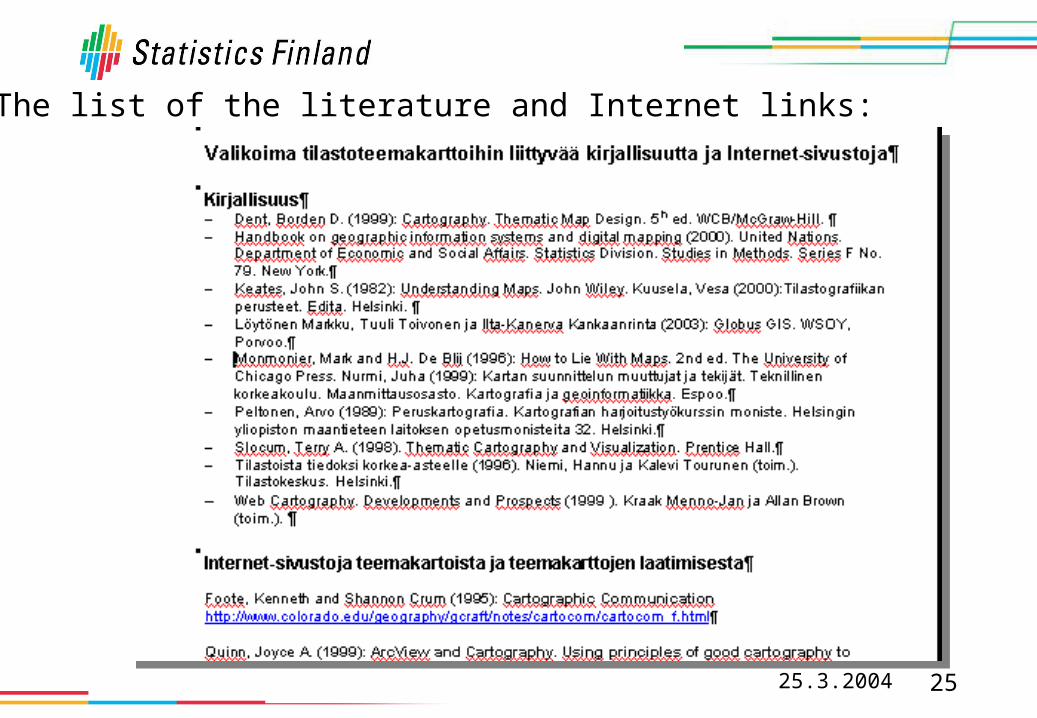
The list of the literature and Internet links:
25.3.2004 26
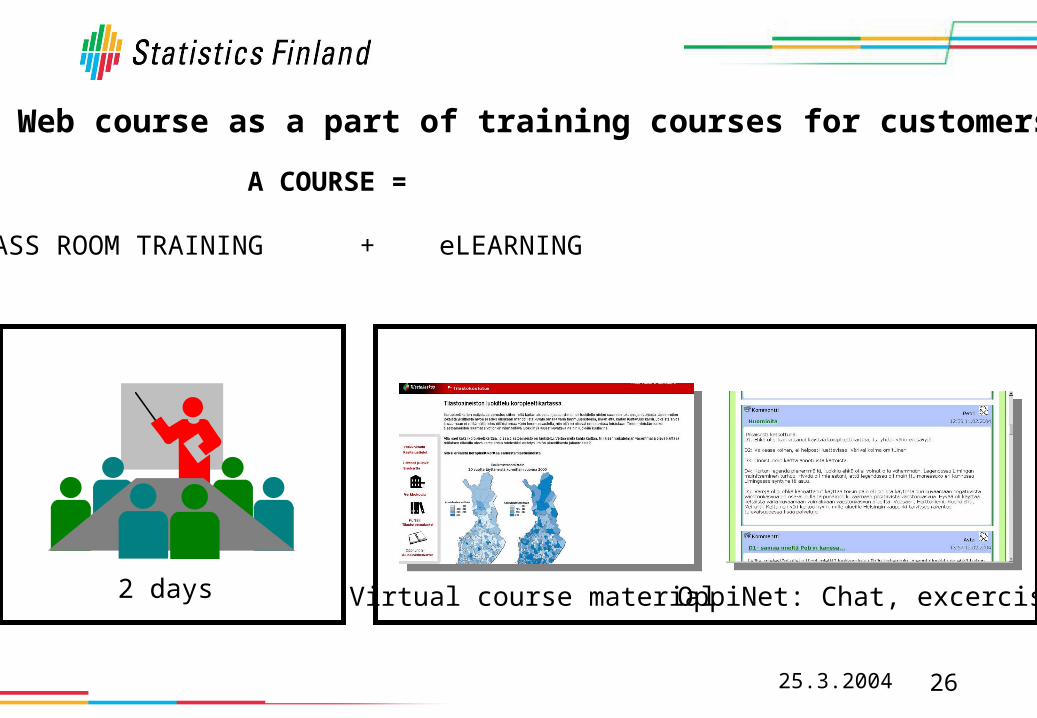
Web course as a part of training courses for customers
A COURSE =
CLASS ROOM TRAINING + eLEARNING
Virtual course material OppiNet: Chat, excercises2 days
25.3.2004 27
www.stat.fi/verkkokoulu