Embed Size (px)
Citation preview
1
25 September, 2018
LIVERMORE INVESTMENTS GROUP LIMITED
UNAUDITED INTERIM RESULTS FOR SIX MONTHS ENDED 30 JUNE 2018
Livermore Investments Group Limited (the “Company” or “Livermore”) today announces its interim results for
the six months ended 30 June 2018.
For further investor information please go to www.livermore-inv.com.
Enquiries:
Livermore Investments Group Limited +41 43 344 3200
Arden Partners plc +44 (0)20 7614 5917
Steve Douglas
2
Chairman’s and Chief Executive’s Review Introduction
We are pleased to announce the interim financial results for Livermore Investments Group Limited (the
“Company” or “Livermore”) for the six months ended 30 June 2018. References to the Company hereinafter also
include its consolidated subsidiaries (note 8).
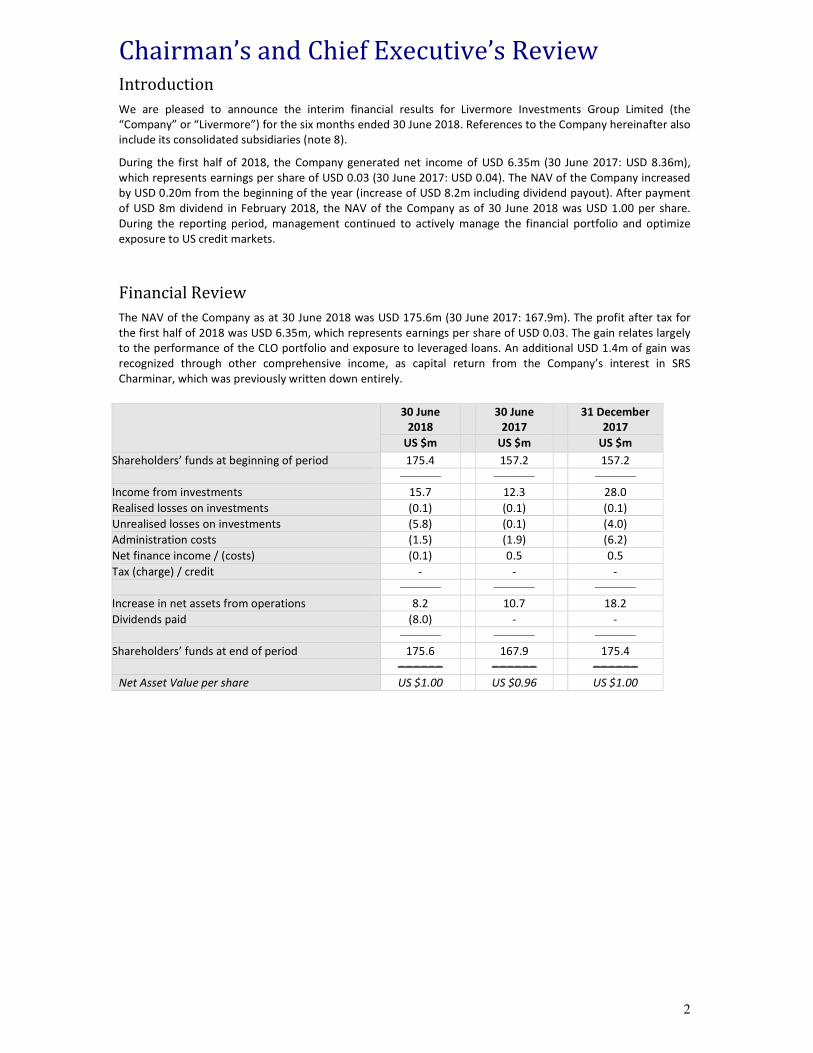
During the first half of 2018, the Company generated net income of USD 6.35m (30 June 2017: USD 8.36m),
which represents earnings per share of USD 0.03 (30 June 2017: USD 0.04). The NAV of the Company increased
by USD 0.20m from the beginning of the year (increase of USD 8.2m including dividend payout). After payment
of USD 8m dividend in February 2018, the NAV of the Company as of 30 June 2018 was USD 1.00 per share.
During the reporting period, management continued to actively manage the financial portfolio and optimize
exposure to US credit markets.
Financial Review
The NAV of the Company as at 30 June 2018 was USD 175.6m (30 June 2017: 167.9m). The profit after tax for
the first half of 2018 was USD 6.35m, which represents earnings per share of USD 0.03. The gain relates largely
to the performance of the CLO portfolio and exposure to leveraged loans. An additional USD 1.4m of gain was
recognized through other comprehensive income, as capital return from the Company’s interest in SRS
Charminar, which was previously written down entirely.
30 June
2018
30 June
2017
31 December
2017
US $m US $m US $m
Shareholders’ funds at beginning of period 175.4 157.2 157.2
___________ ___________ ___________
Income from investments 15.7 12.3 28.0
Realised losses on investments (0.1) (0.1) (0.1)
Unrealised losses on investments (5.8) (0.1) (4.0)
Administration costs (1.5) (1.9) (6.2)
Net finance income / (costs) (0.1) 0.5 0.5
Tax (charge) / credit - - -
___________ ___________ ___________
Increase in net assets from operations 8.2 10.7 18.2
Dividends paid (8.0) - -
___________ ___________ ___________
Shareholders’ funds at end of period 175.6 167.9 175.4
–––––– –––––– ––––––
Net Asset Value per share US $1.00 US $0.96 US $1.00
3
Livermore’s Strategy
The Company’s primary investment objective is to generate high current income and regular cash flows. The
financial portfolio is constructed around fixed income instruments such as Collateralized Loan Obligations
(“CLOs”) and other securities or instruments with exposure primarily to senior secured and usually broadly
syndicated US loans. The Company has a long-term oriented investment philosophy and invests primarily with a
buy-and-hold mentality, though from time to time the Company will sell investments to realize gains or for risk
management purposes.
Strong emphasis is given to maintaining sufficient liquidity and low leverage at the overall portfolio level
and to re-invest in existing and new investments along the economic cycle.
Dividend & Buyback
At 15 January 2018, the Board announced an interim dividend of USD 8m (USD 0.04576 per share) to members
on the register on 26 January 2018. The dividend was paid on 23 February 2018.
The Board of Directors will decide on the Company's dividend policy for 2018 based on profitability, liquidity
requirements, portfolio performance, market conditions, and the share price of the Company relative to its
NAV.
The company has no shares in treasury.
Richard Rosenberg Noam Lanir
Chairman Chief Executive
25 September 2018
4
Review of Activities Economic & Investment Environment
Overall, global economic growth was solid in the first half of the year. Growth in the US and China was strong
and broad-based. The pace of economic expansion slowed in the euro area, however, albeit partly due to
temporary factors. In the US, economic growth remained robust and broad-based at 2.2% in the first quarter
followed by a 4.2% growth in the second quarter of 2018. In addition, employment continued to increase in the
past few months, and the unemployment rate dropped further to 3.8% by May 2018. The economy in the euro
area lost some momentum at the beginning of 2018, due in part to temporary factors such as strikes and the
exceptionally cold weather. Following on from strong growth in previous quarters, GDP subsequently expanded
in the first quarter by only 0.4% in the first and second quarters of 2018. Although private consumption picked
up pace, exports and manufacturing receded for the first time in quite a while. In Germany and France, the
slowdown was pronounced, whereas in Italy and Spain developments were stable. Meanwhile, the
improvement in euro area employment continued, and the unemployment rate declined further.
In the US, inflation has reached the target level set by the US Federal Reserve. The US Federal Reserve therefore
continues its plans to normalize monetary policy. In the euro area, by contrast, core inflation has continued to
move sideways in recent months. The European Central Bank (ECB) therefore intends to pursue its asset
purchase programme until December 2018, and to leave its key rates at their present levels at least through the
summer of 2019. Japan is also likely to maintain its highly expansionary monetary policy given the ongoing
modest rate of inflation.
The international financial markets have been volatile since the beginning of the year. Market expectations that
monetary policy – particularly in the US – could be tightened more quickly than previously assumed prompted a
correction in stock market prices. Having hit an all-time high at the end of January, the MSCI World Index fell by
around 8% in the space of just a few days, and by mid-March was at roughly the level recorded in mid-
December. The volatility of US stocks as measured by option prices (VIX) – which serves as a gauge of market
uncertainty – spiked temporarily after having reached historical lows. Sentiment on the international financial
markets remained dominated by turbulence and stock markets struggled at times with political uncertainties
and protectionist tendencies, but recovered on the back of the continued favourable growth outlook for the
global economy. In mid-June, the MSCI World Index was slightly above its mid-March level.
The expectations of a more rapid normalisation of monetary policy also had an impact on the bond markets.
Long-term government bond yields rose significantly in virtually all the major advanced economies, with the
strongest increases coming in the US. In the US, yields on ten-year government bonds rose temporarily to above
3.0% as a result of monetary policy tightening and rising inflation. Yields in euro area member states presented
a mixed picture. In Italy, they increased considerably owing to political uncertainty. They also rose in Europe’s
peripheral economies, while in Germany, they declined. In Japan, yields on ten-year government bonds
remained close to the Bank of Japan’s target of 0%.
In the wake of the equity market correction, the US dollar initially weakened on a trade-weighted basis, but
recouped some ground by mid-March. Against the euro, it temporarily hit its lowest level since the end of 2014.
The euro, pound sterling and yen all trended somewhat firmer on a trade-weighted basis. In the second
quarter, however, the US dollar gained significantly in value on a trade weighted basis, returning in mid-June to
its year-back level. It appreciated markedly against the euro. The euro and the yen trended somewhat weaker
on a trade weighted basis.
The heightened risk perception on the financial markets also weighed temporarily on commodity prices. Oil
prices initially continued to rise in January, reaching a three-year high of just under USD 70 per barrel. However,
following a marked increase in oil production in the US, it declined again by mid-March. Subsequently, however,
Oil prices rose against a backdrop of higher demand and tighter supply and climbed temporarily to USD 80 per
barrel in the wake of the US’s announcement to withdraw from the nuclear deal with Iran and its threat of
sanctions on importers of Iranian oil. The ongoing crisis in Venezuela also contributed to higher oil prices. Amid
plans to increase the oil output in Russia and Saudi Arabia, oil prices recently dropped again.
With the strong and continued economic growth in the US and a resulting rising rate environment, strong
demand for floating rate assets such as US senior secured loans and CLOs continued during the first half of the
year. According to S&P Capital IQ, total institutional loan issuance was $271 billion during the first half of 2018,
slightly below the record $297 billion amount recorded in the first half of 2017, and driven primarily by the
significant amount of reset activity thus far in 2018. Leveraged buyout (LBO) and merger & acquisition (M&A)
deals increased by 12% year-over-year to $183 billion. Total institutional loans outstanding was $1.048 trillion as
of June 30, 2018, up 11% from the prior year. While loan spreads remain compressed, the pace of the tightening
has slowed, and notably, no syndicated loan repricing took place in July, according to JP Morgan. Given the
5
length of the credit cycle and the insatiable demand for floating rate instruments, certain loan fundamentals
have deteriorated and the loan market exposure to Single-B rated loans is at its highest level. Default rates,
however, have continued to stay well below historical levels. The Company anticipates default rates to stay
below historical average levels as there are few near-term maturities and interest coverage ratios remain
healthy. For the six months ended June 30, 2018, the S&P 500 Index, Merrill Lynch High Yield Master II Index
and Credit Suisse Leverage Loan Index (“CSLLI”) generated returns of 2.65%, 0.07% and 2.38%, respectively.
Sources: Swiss National Bank (SNB), European Central Bank (ECB), US Federal Reserve, Bloomberg, JP Morgan, S&P Capital IQ
Financial Portfolio and trading activity
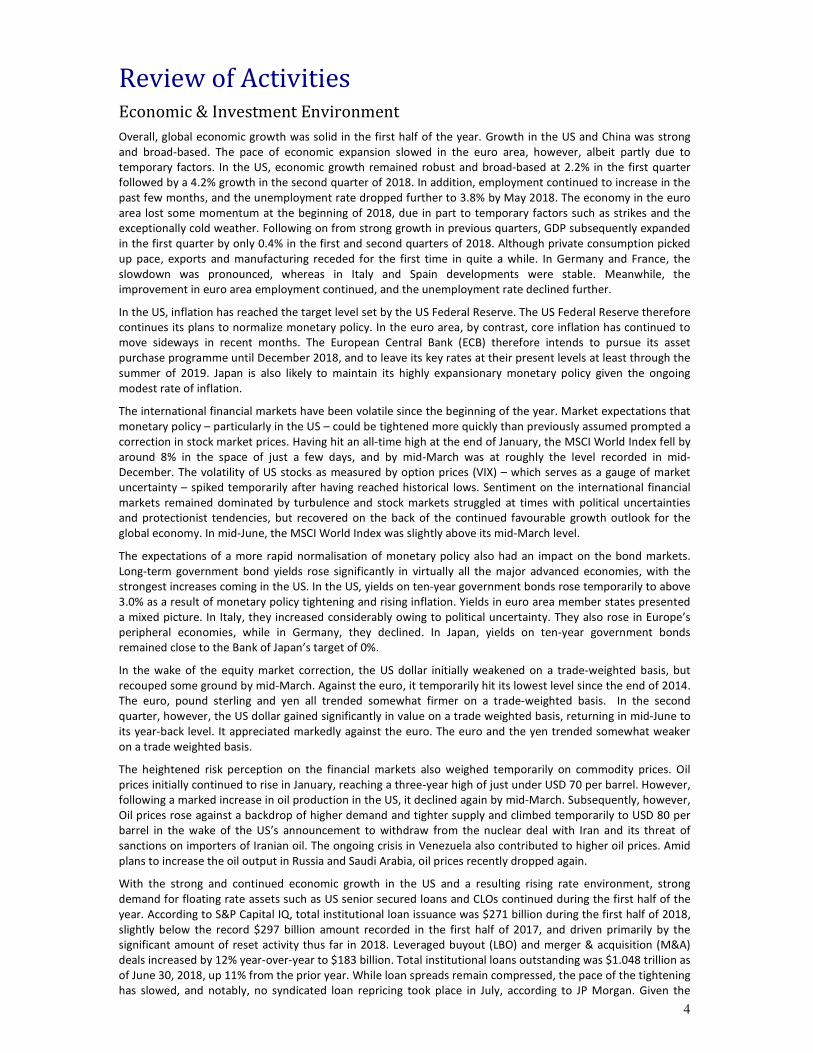
The Company manages a financial portfolio valued at USD 162.6m as at 30 June 2018, which is invested mainly
in fixed income and credit related securities.
The following is a table summarizing the financial portfolio as at 30 June 2018
Name 30 June 2018
Book Value US $m
30 June 2017
Book Value US $m
31 December 2017
Book Value US $m
Investment in the loan market through CLOs 108.5 94.2 97.2
Open Warehouse facilities 5.0 30.5 25.5
Hedge Funds 1.1 1.1 1.0
Corporate Bonds 1.1 1.1 1.2
Other Public Equities 2.8 1.9 2.0
Invested Total 118.5 128.8 126.9
Cash 44.1 23.2 34.2
Total 162.6 152.0 161.1
Senior Secured Loans and CLOs:
The US senior secured loan market continued to offer good risk adjusted returns as a floating rate asset class
with a senior secured claim on the borrower and with overall low volatility and low correlation to the equity
market. CLOs are managed portfolios invested into diversified pools of senior secured loans and financed with
long term financing pre-fixed at the time of issuance.
Continuing the trend in 2017, the leveraged loan market performed well in the first half of 2018 with the Credit
Suisse Leveraged Loan Index recording a total return of 2.38%. The demand for floating rate instruments
remained strong on the back of rate increases by the US Federal Reserve, and this allowed borrowers to take
advantage of the favourable financing conditions and reduce the spread they pay on their loans as well as
address near term maturities and reduce the risk of default in the near term. During the reporting period,
default rates continued to stay below average levels (1.95% for the S&P/LSTA Leverage Loan Index as at the end
of June 2018) and the near to mid-term outlook remains benign.
The demand for floating rate paper was also apparent in the CLO market in the first quarter of 2018 with debt
spreads tightening to their tightest levels since the financial crisis. CLO equity investors took advantage of this
window and issued new CLO transactions as well as refinanced existing transactions. The tightening trend,
however, reversed somewhat in the second quarter as the repeal of Risk Retention requirement brought on
anticipation of a significant amount of refinancing supply. CLO equity market was relatively stable during the
first half of 2018 on the back of stable credit markets. CLO equity distributions were in line as the Company had
refinanced several of its deals in 2017 and reduced the cost of financing. Management continues to proactively
work on utilizing its option to refinance the cost of CLO liabilities lower where possible, or extend the
reinvestment period of its CLO positions, or both. In the first half of 2018, the Company converted its two open
warehouses into new CLO transactions at the lowest cost of financing since the crisis, and also refinanced one of
its existing transactions. The reduced financing costs should help offset some of the loan spread reduction and
provide optionality of higher and longer cash flows from our CLO equity positions. Further, management
reduced exposure to deal with shorter reinvestment period and increased exposure to deals with longer
6
reinvestment period. Management continues to follow problem credits and focus on Retail industry exposure
due to the expected decline in fundamentals.
During the reporting period the Company’s US CLO portfolio performed well as cash flows remained stable and
the value of optionality embedded within CLO equity increased. Management has been proactively working on
benefitting from this optionality to lower financing costs or increasing the length of cash flows or both. The
warehouses generated strong returns and the Company received net income of USD 2.45m from its warehouse
investments. For the period, the CLO and warehouse portfolio generated net gains of USD 7.5m. As of the end of
the reporting period, management has one new warehouse open with non-mark-to-market financing. As at 30
June 2018, over 100% of the Company’s CLO portfolio is invested in post-crisis US CLOs.
Although management maintains a positive view on the CLO portfolio, mid-long term performance may be
negatively impacted by a strong pull back in the US or European economy or geo-political events that could
result in a spike in defaults. Despite positive developments in the overall health of the US economy, we
acknowledge the continued below trend growth globally as well as headwinds relating to the political turmoil,
trade tensions, monetary tightening in advanced economies, and geopolitical risks.
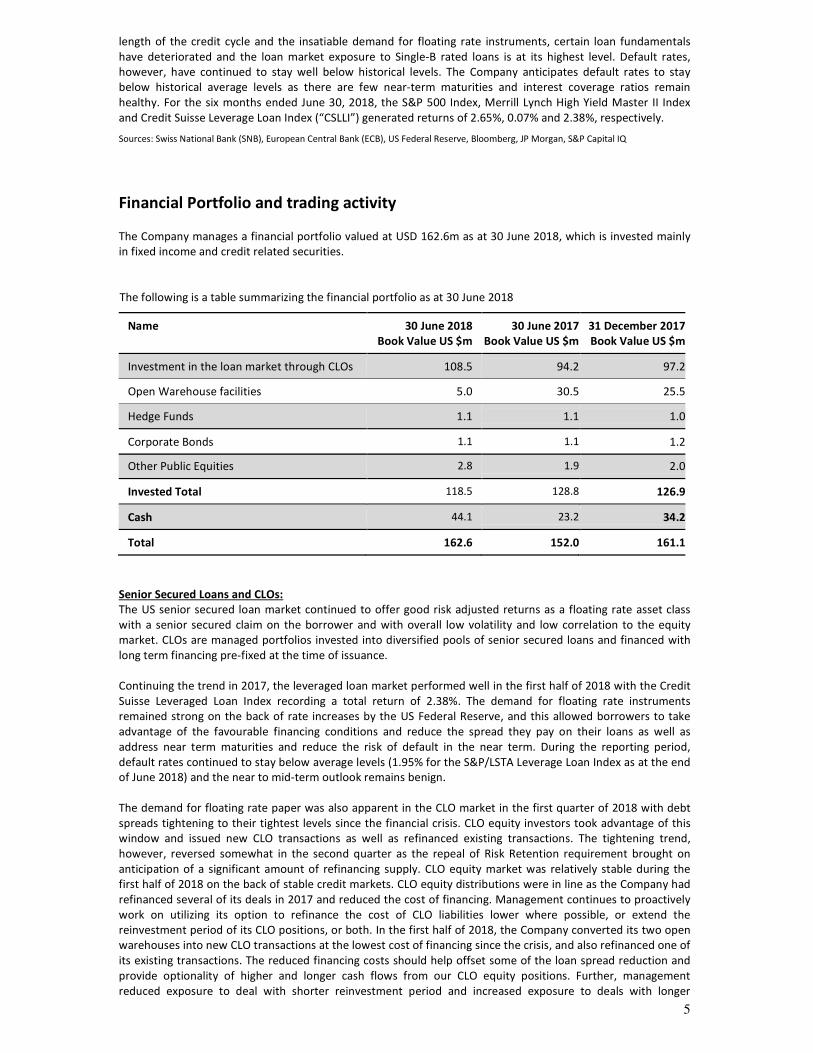
The Company’s CLO portfolio is divided into the following geographical areas:
30 June
2018
Amount
Percentage 30 June
2017
Amount
Percentage
US $000 US $000
US CLOs 108,462 100.0% 93,447 99.2%
European CLOs - - 594 0.6%
Global Credit CLOs - - 124 0.2%
–––––– –––––– –––––– ––––––
108,462 100% 94,165 100%
–––––– –––––– –––––– ––––––
Private Equity Funds
The other private equity investments held by the Company are incorporated in the form of Managed Funds
(mostly closed end funds) mainly in emerging economies. The investments of these funds into their portfolio
companies were mostly done in 2008 and 2009. During the first half of 2018, the Company negotiated and sold
its remaining interest in SRS Charminar for USD 1.4m. This investment was previously completely written off.
Further, management is in discussions with the fund manager of SRS Private to liquidate the fund or sell its
interest in the fund. Overall, the Company expects that exits of portfolio companies should materialize between
2018 and 2020.
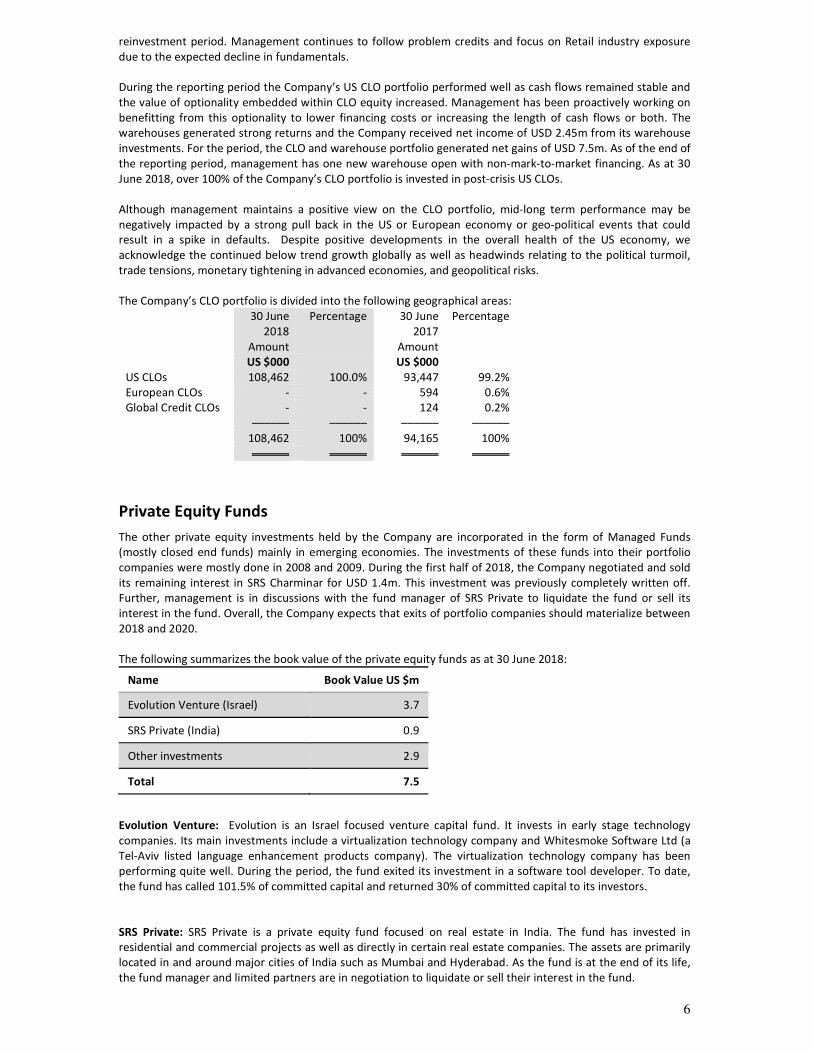
The following summarizes the book value of the private equity funds as at 30 June 2018:
Name Book Value US $m
Evolution Venture (Israel) 3.7
SRS Private (India) 0.9
Other investments 2.9
Total 7.5
Evolution Venture: Evolution is an Israel focused venture capital fund. It invests in early stage technology
companies. Its main investments include a virtualization technology company and Whitesmoke Software Ltd (a
Tel-Aviv listed language enhancement products company). The virtualization technology company has been
performing quite well. During the period, the fund exited its investment in a software tool developer. To date,
the fund has called 101.5% of committed capital and returned 30% of committed capital to its investors.
SRS Private: SRS Private is a private equity fund focused on real estate in India. The fund has invested in
residential and commercial projects as well as directly in certain real estate companies. The assets are primarily
located in and around major cities of India such as Mumbai and Hyderabad. As the fund is at the end of its life,
the fund manager and limited partners are in negotiation to liquidate or sell their interest in the fund.
7
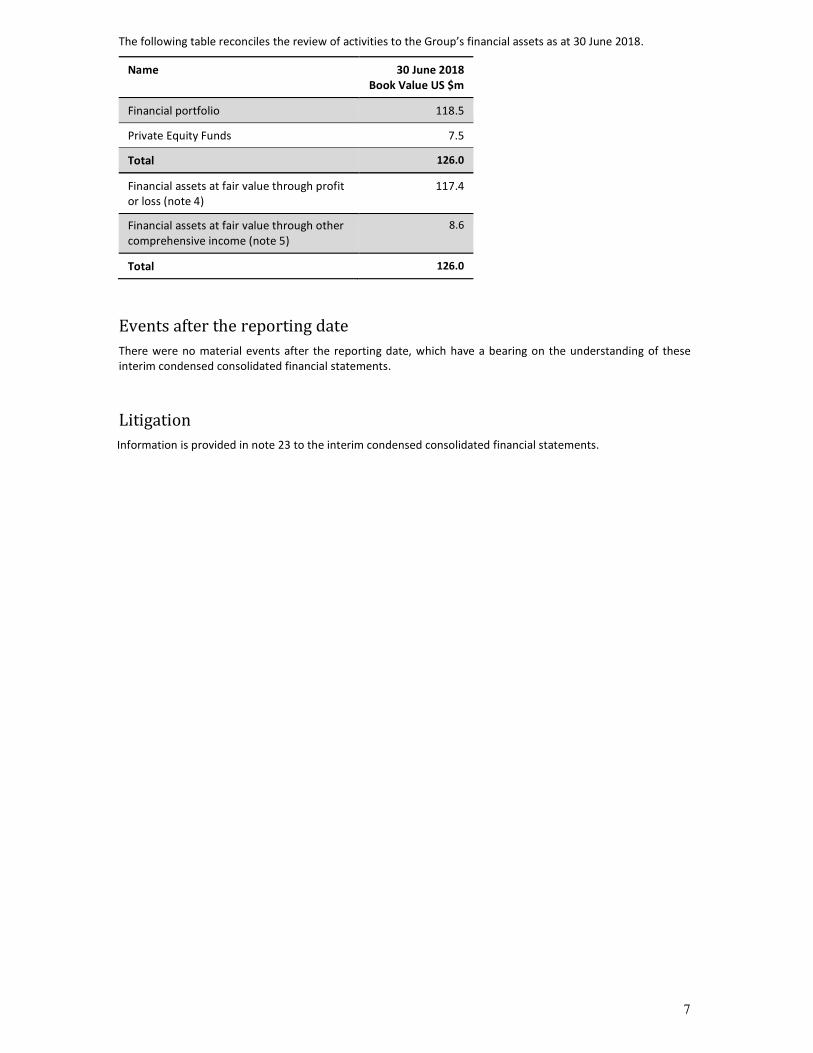
The following table reconciles the review of activities to the Group’s financial assets as at 30 June 2018.
Name 30 June 2018
Book Value US $m
Financial portfolio 118.5
Private Equity Funds 7.5
Total 126.0
Financial assets at fair value through profit
or loss (note 4)
117.4
Financial assets at fair value through other
comprehensive income (note 5)
8.6
Total 126.0
Events after the reporting date
There were no material events after the reporting date, which have a bearing on the understanding of these
interim condensed consolidated financial statements.
Litigation
Information is provided in note 23 to the interim condensed consolidated financial statements.
8
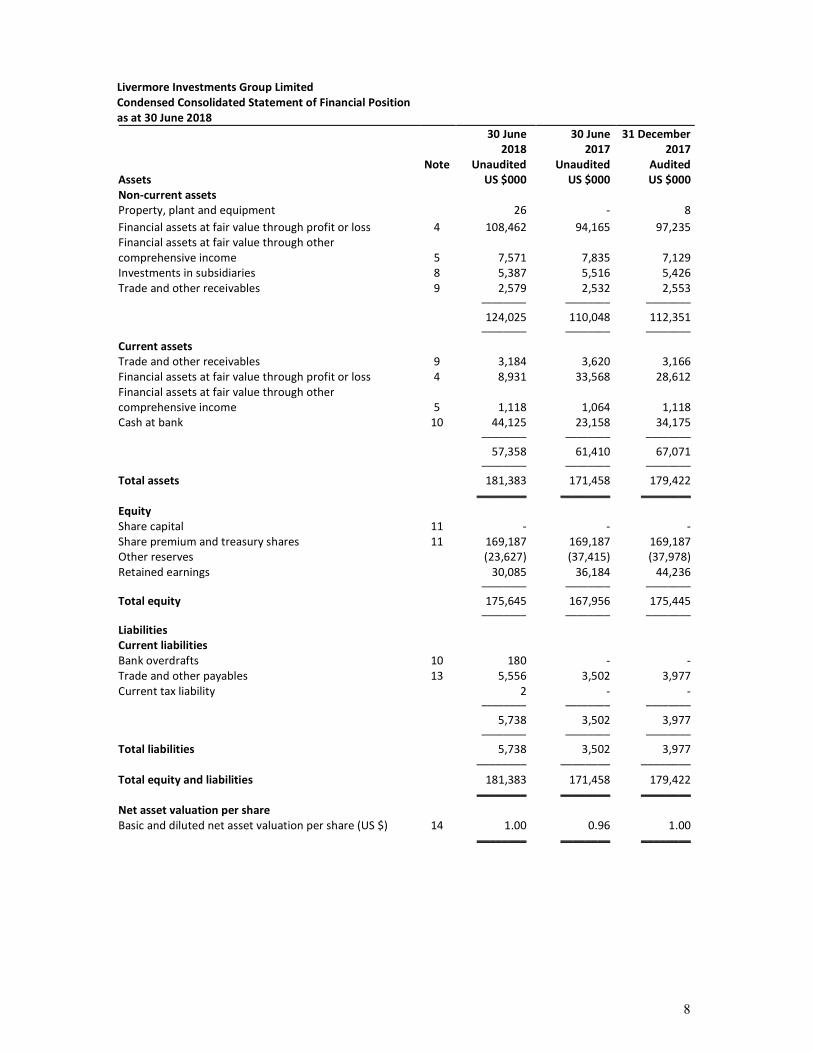
Livermore Investments Group Limited
Condensed Consolidated Statement of Financial Position
as at 30 June 2018
Note
30 June
2018
Unaudited
30 June
2017
Unaudited
31 December
2017
Audited
Assets US $000 US $000 US $000
Non-current assets
Property, plant and equipment 26 - 8
Financial assets at fair value through profit or loss 4 108,462 94,165 97,235
Financial assets at fair value through other
comprehensive income
5
7,571
7,835
7,129
Investments in subsidiaries 8 5,387 5,516 5,426
Trade and other receivables 9 2,579 2,532 2,553 –––––––– –––––––– ––––––––
124,025 110,048 112,351 –––––––– –––––––– ––––––––
Current assets
Trade and other receivables 9 3,184 3,620 3,166
Financial assets at fair value through profit or loss 4 8,931 33,568 28,612
Financial assets at fair value through other
comprehensive income
5
1,118
1,064
1,118
Cash at bank 10 44,125 23,158 34,175 –––––––– –––––––– ––––––––
57,358 61,410 67,071 –––––––– –––––––– ––––––––
Total assets 181,383 171,458 179,422
–––––––– –––––––– ––––––––
Equity
Share capital 11 - - -
Share premium and treasury shares 11 169,187 169,187 169,187
Other reserves (23,627) (37,415) (37,978)
Retained earnings 30,085 36,184 44,236 –––––––– –––––––– ––––––––
Total equity 175,645 167,956 175,445 –––––––– –––––––– ––––––––
Liabilities
Current liabilities
Bank overdrafts 10 180 - -
Trade and other payables 13 5,556 3,502 3,977
Current tax liability 2 - - –––––––– –––––––– ––––––––
5,738 3,502 3,977
–––––––– –––––––– ––––––––
Total liabilities 5,738 3,502 3,977
–––––––– –––––––– ––––––––
Total equity and liabilities 181,383 171,458 179,422
–––––––– –––––––– ––––––––
Net asset valuation per share
Basic and diluted net asset valuation per share (US $) 14 1.00 0.96 1.00
–––––––– –––––––– ––––––––
9
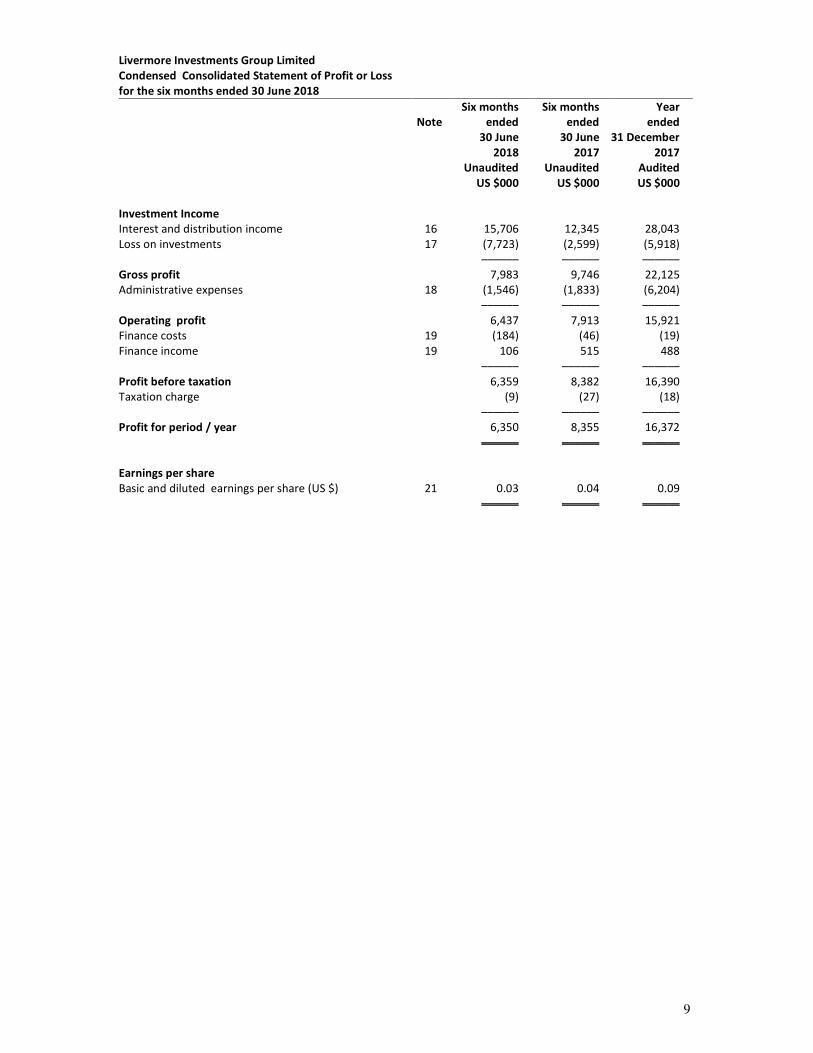
Livermore Investments Group Limited
Condensed Consolidated Statement of Profit or Loss
for the six months ended 30 June 2018
Note
Six months
ended
30 June
2018
Unaudited
Six months
ended
30 June
2017
Unaudited
Year
ended
31 December
2017
Audited
US $000 US $000 US $000
Investment Income
Interest and distribution income 16 15,706 12,345 28,043
Loss on investments 17 (7,723) (2,599) (5,918)
–––––– –––––– ––––––
Gross profit 7,983 9,746 22,125
Administrative expenses 18 (1,546) (1,833) (6,204)
–––––– –––––– ––––––
Operating profit 6,437 7,913 15,921
Finance costs 19 (184) (46) (19)
Finance income 19 106 515 488
–––––– –––––– ––––––
Profit before taxation 6,359 8,382 16,390
Taxation charge (9) (27) (18)
–––––– –––––– ––––––
Profit for period / year 6,350 8,355 16,372
–––––– –––––– ––––––
Earnings per share
Basic and diluted earnings per share (US $) 21 0.03 0.04 0.09
–––––– –––––– ––––––
10
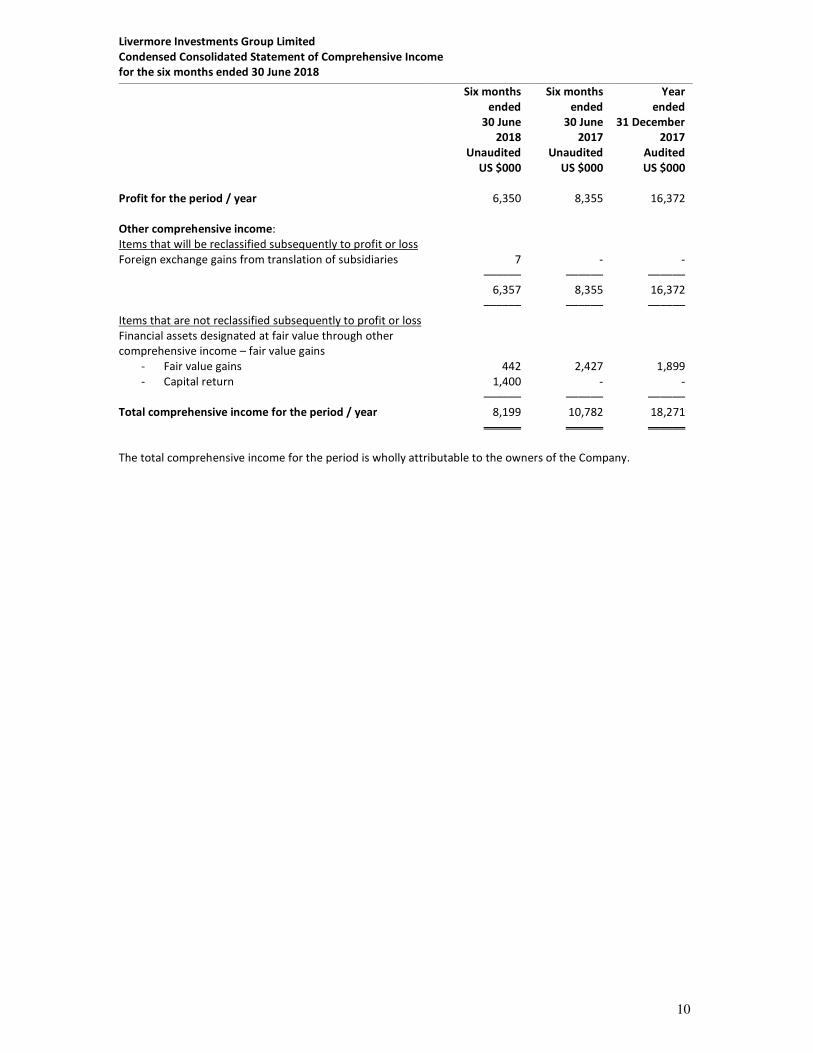
Livermore Investments Group Limited
Condensed Consolidated Statement of Comprehensive Income
for the six months ended 30 June 2018
The total comprehensive income for the period is wholly attributable to the owners of the Company.
Six months
ended
30 June
2018
Unaudited
Six months
ended
30 June
2017
Unaudited
Year
ended
31 December
2017
Audited
US $000 US $000 US $000
Profit for the period / year 6,350 8,355 16,372
Other comprehensive income:
Items that will be reclassified subsequently to profit or loss
Foreign exchange gains from translation of subsidiaries 7 - -
–––––– –––––– ––––––
6,357 8,355 16,372
–––––– –––––– ––––––
Items that are not reclassified subsequently to profit or loss
Financial assets designated at fair value through other
comprehensive income – fair value gains
- Fair value gains 442 2,427 1,899
- Capital return 1,400 - -
–––––– –––––– ––––––
Total comprehensive income for the period / year 8,199 10,782 18,271
–––––– –––––– ––––––
11
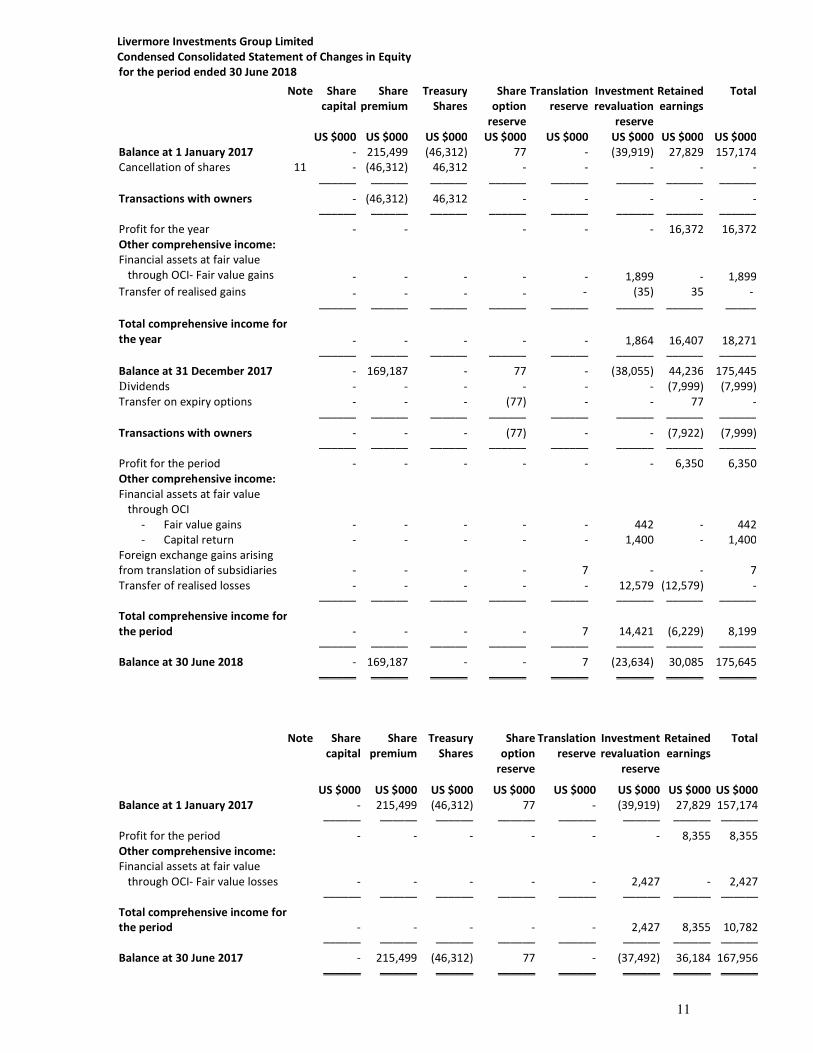
Livermore Investments Group Limited
Condensed Consolidated Statement of Changes in Equity
for the period ended 30 June 2018
Note
Share
capital
Share
premium
Treasury
Shares
Share
option
reserve
Translation
reserve
Investment
revaluation
reserve
Retained
earnings
Total
US $000 US $000 US $000 US $000 US $000 US $000 US $000 US $000
Balance at 1 January 2017 - 215,499 (46,312) 77 - (39,919) 27,829 157,174
–––––– –––––– –––––– –––––– –––––– –––––– –––––– ––––––
Profit for the period - - - - - - 8,355 8,355
Other comprehensive income:
Financial assets at fair value
through OCI- Fair value losses
- - - - - 2,427 - 2,427
–––––– –––––– –––––– –––––– –––––– –––––– –––––– ––––––
Total comprehensive income for
the period
- - - - - 2,427 8,355 10,782
–––––– –––––– –––––– –––––– –––––– –––––– –––––– ––––––
Balance at 30 June 2017 - 215,499 (46,312) 77 - (37,492) 36,184 167,956
–––––– –––––– –––––– –––––– –––––– –––––– –––––– ––––––
Note Share
capital
Share
premium
Treasury
Shares
Share
option
reserve
Translation
reserve
Investment
revaluation
reserve
Retained
earnings
Total
US $000 US $000 US $000 US $000 US $000 US $000 US $000 US $000
Balance at 1 January 2017 - 215,499 (46,312) 77 - (39,919) 27,829 157,174
Cancellation of shares 11 - (46,312) 46,312 - - - - -
–––––– –––––– –––––– –––––– –––––– –––––– –––––– ––––––
Transactions with owners - (46,312) 46,312 - - - - -
–––––– –––––– –––––– –––––– –––––– –––––– –––––– ––––––
Profit for the year - - - - - 16,372 16,372
Other comprehensive income:
Financial assets at fair value
through OCI- Fair value gains
- - - - -
1,899 -
1,899
Transfer of realised gains - - - - - (35) 35 -
–––––– –––––– –––––– –––––– –––––– –––––– –––––– –––––
Total comprehensive income for
the year
- - - -
-
1,864 16,407
18,271
–––––– –––––– –––––– –––––– –––––– –––––– –––––– ––––––
Balance at 31 December 2017 - 169,187 - 77 - (38,055) 44,236 175,445
Dividends - - - - - - (7,999) (7,999)
Transfer on expiry options - - - (77) - - 77 -
–––––– –––––– –––––– –––––– –––––– –––––– –––––– ––––––
Transactions with owners - - - (77) - - (7,922) (7,999)
–––––– –––––– –––––– –––––– –––––– –––––– –––––– ––––––
Profit for the period - - - - - - 6,350 6,350
Other comprehensive income:
Financial assets at fair value
through OCI
- Fair value gains - - - - - 442 - 442
- Capital return - - - - - 1,400 - 1,400
Foreign exchange gains arising
from translation of subsidiaries
- - - - 7 - - 7
Transfer of realised losses - - - - - 12,579 (12,579) -
–––––– –––––– –––––– –––––– –––––– –––––– –––––– ––––––
Total comprehensive income for
the period
- - - - 7 14,421 (6,229) 8,199
–––––– –––––– –––––– –––––– –––––– –––––– –––––– ––––––
Balance at 30 June 2018 - 169,187 - - 7 (23,634) 30,085 175,645
–––––– –––––– –––––– –––––– –––––– –––––– –––––– ––––––
12
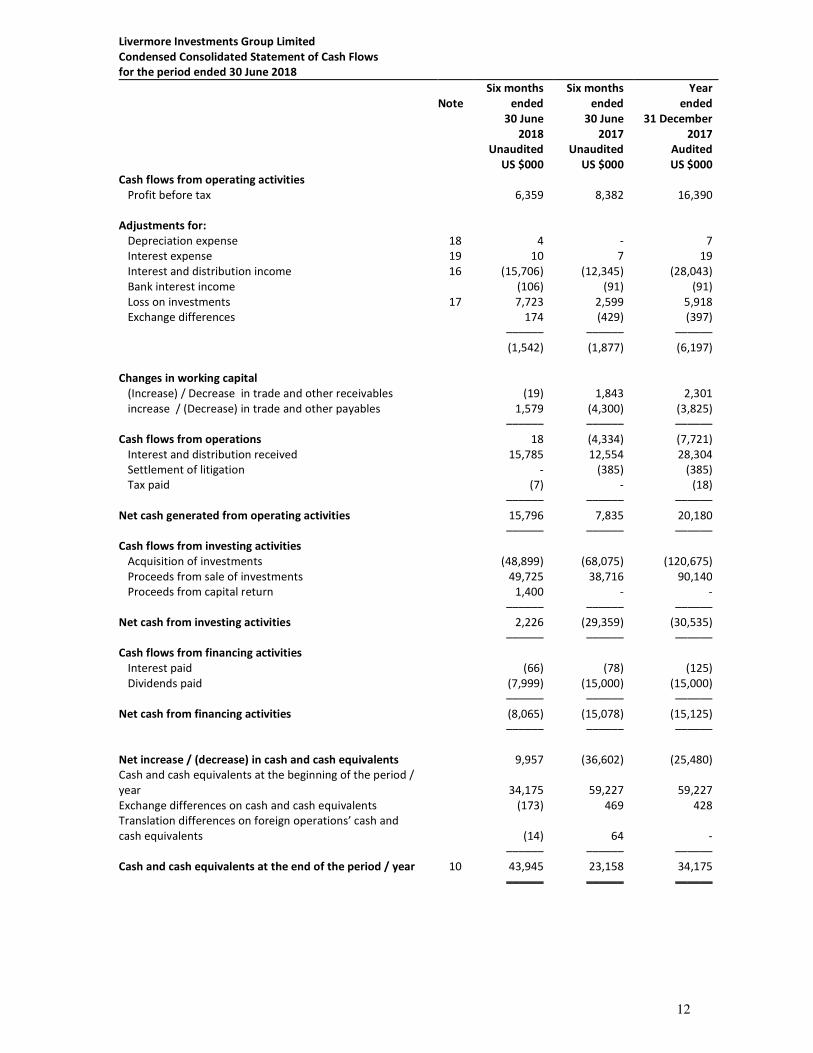
Livermore Investments Group Limited
Condensed Consolidated Statement of Cash Flows
for the period ended 30 June 2018
Note
Six months
ended
30 June
2018
Unaudited
Six months
ended
30 June
2017
Unaudited
Year
ended
31 December
2017
Audited
US $000 US $000 US $000
Cash flows from operating activities
Profit before tax 6,359 8,382 16,390
Adjustments for:
Depreciation expense 18 4 - 7
Interest expense 19 10 7 19
Interest and distribution income 16 (15,706) (12,345) (28,043)
Bank interest income (106) (91) (91)
Loss on investments 17 7,723 2,599 5,918
Exchange differences 174 (429) (397)
–––––– –––––– ––––––
(1,542) (1,877) (6,197)
Changes in working capital
(Increase) / Decrease in trade and other receivables (19) 1,843 2,301
increase / (Decrease) in trade and other payables 1,579 (4,300) (3,825)
–––––– –––––– ––––––
Cash flows from operations 18 (4,334) (7,721)
Interest and distribution received 15,785 12,554 28,304
Settlement of litigation - (385) (385)
Tax paid (7) - (18)
–––––– –––––– ––––––
Net cash generated from operating activities 15,796 7,835 20,180
–––––– –––––– ––––––
Cash flows from investing activities
Acquisition of investments (48,899) (68,075) (120,675)
Proceeds from sale of investments 49,725 38,716 90,140
Proceeds from capital return 1,400 - -
–––––– –––––– ––––––
Net cash from investing activities 2,226 (29,359) (30,535)
–––––– –––––– ––––––
Cash flows from financing activities
Interest paid (66) (78) (125)
Dividends paid (7,999) (15,000) (15,000)
–––––– –––––– ––––––
Net cash from financing activities (8,065) (15,078) (15,125)
–––––– –––––– ––––––
Net increase / (decrease) in cash and cash equivalents 9,957 (36,602) (25,480)
Cash and cash equivalents at the beginning of the period /
year 34,175 59,227 59,227
Exchange differences on cash and cash equivalents (173) 469 428
Translation differences on foreign operations’ cash and
cash equivalents (14) 64 -
–––––– –––––– ––––––
Cash and cash equivalents at the end of the period / year 10 43,945 23,158 34,175
–––––– –––––– ––––––
13
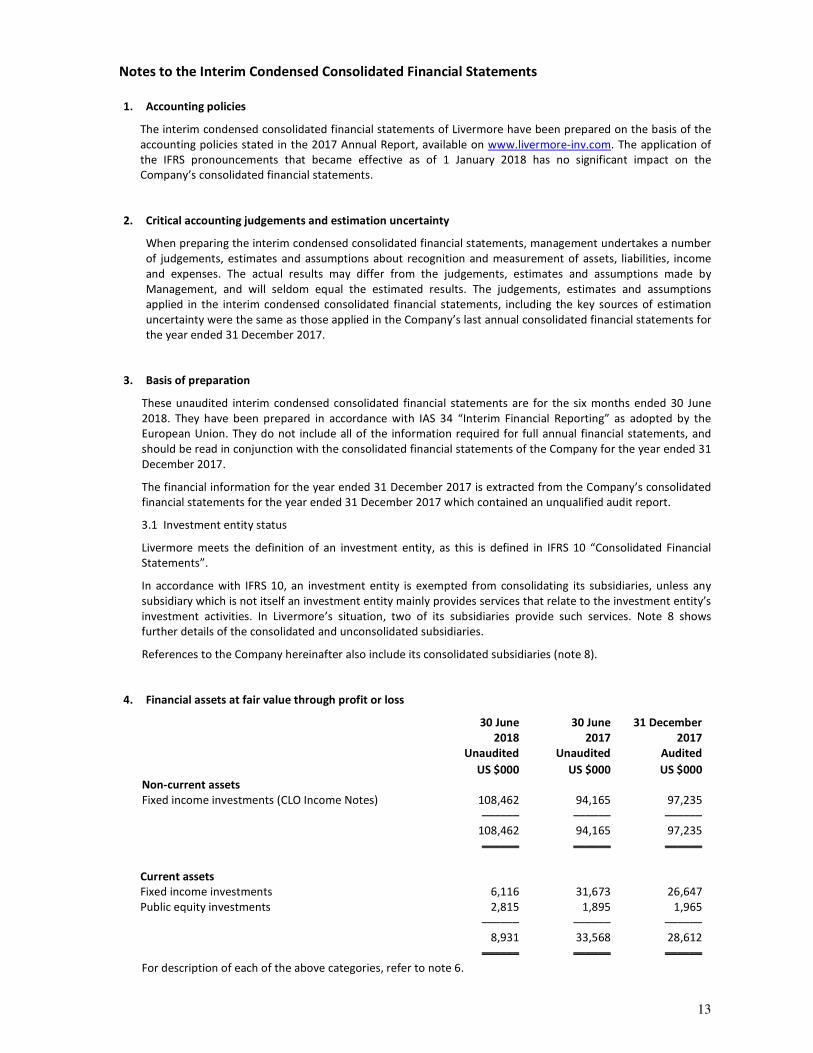
Notes to the Interim Condensed Consolidated Financial Statements
1. Accounting policies
The interim condensed consolidated financial statements of Livermore have been prepared on the basis of the
accounting policies stated in the 2017 Annual Report, available on www.livermore-inv.com. The application of
the IFRS pronouncements that became effective as of 1 January 2018 has no significant impact on the
Company’s consolidated financial statements.
2. Critical accounting judgements and estimation uncertainty
When preparing the interim condensed consolidated financial statements, management undertakes a number
of judgements, estimates and assumptions about recognition and measurement of assets, liabilities, income
and expenses. The actual results may differ from the judgements, estimates and assumptions made by
Management, and will seldom equal the estimated results. The judgements, estimates and assumptions
applied in the interim condensed consolidated financial statements, including the key sources of estimation
uncertainty were the same as those applied in the Company’s last annual consolidated financial statements for
the year ended 31 December 2017.
3. Basis of preparation
These unaudited interim condensed consolidated financial statements are for the six months ended 30 June
2018. They have been prepared in accordance with IAS 34 “Interim Financial Reporting” as adopted by the
European Union. They do not include all of the information required for full annual financial statements, and
should be read in conjunction with the consolidated financial statements of the Company for the year ended 31
December 2017.
The financial information for the year ended 31 December 2017 is extracted from the Company’s consolidated
financial statements for the year ended 31 December 2017 which contained an unqualified audit report.
3.1 Investment entity status
Livermore meets the definition of an investment entity, as this is defined in IFRS 10 “Consolidated Financial
Statements”.
In accordance with IFRS 10, an investment entity is exempted from consolidating its subsidiaries, unless any
subsidiary which is not itself an investment entity mainly provides services that relate to the investment entity’s
investment activities. In Livermore’s situation, two of its subsidiaries provide such services. Note 8 shows
further details of the consolidated and unconsolidated subsidiaries.
References to the Company hereinafter also include its consolidated subsidiaries (note 8).
4. Financial assets at fair value through profit or loss
30 June
2018
Unaudited
30 June
2017
Unaudited
31 December
2017
Audited
US $000 US $000 US $000
Non-current assets
Fixed income investments (CLO Income Notes) 108,462 94,165 97,235
–––––– –––––– ––––––
108,462 94,165 97,235
–––––– –––––– ––––––
Current assets
Fixed income investments 6,116 31,673 26,647
Public equity investments 2,815 1,895 1,965
–––––– –––––– ––––––
8,931 33,568 28,612
–––––– –––––– ––––––
For description of each of the above categories, refer to note 6.
14
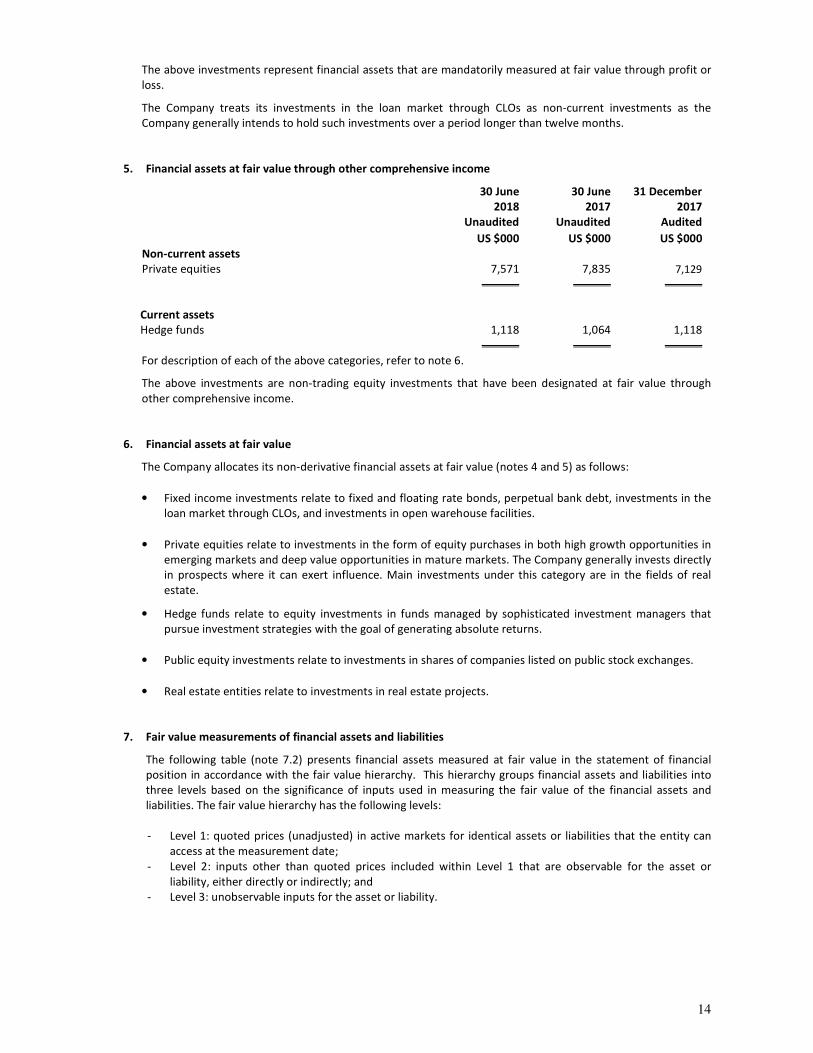
The above investments represent financial assets that are mandatorily measured at fair value through profit or
loss.
The Company treats its investments in the loan market through CLOs as non-current investments as the
Company generally intends to hold such investments over a period longer than twelve months.
5. Financial assets at fair value through other comprehensive income
30 June
2018
Unaudited
30 June
2017
Unaudited
31 December
2017
Audited
US $000 US $000 US $000
Non-current assets
Private equities 7,571 7,835 7,129
–––––– –––––– ––––––
Current assets
Hedge funds 1,118 1,064 1,118
–––––– –––––– ––––––
For description of each of the above categories, refer to note 6.
The above investments are non-trading equity investments that have been designated at fair value through
other comprehensive income.
6. Financial assets at fair value
The Company allocates its non-derivative financial assets at fair value (notes 4 and 5) as follows:
• Fixed income investments relate to fixed and floating rate bonds, perpetual bank debt, investments in the
loan market through CLOs, and investments in open warehouse facilities.
• Private equities relate to investments in the form of equity purchases in both high growth opportunities in
emerging markets and deep value opportunities in mature markets. The Company generally invests directly
in prospects where it can exert influence. Main investments under this category are in the fields of real
estate.
• Hedge funds relate to equity investments in funds managed by sophisticated investment managers that
pursue investment strategies with the goal of generating absolute returns.
• Public equity investments relate to investments in shares of companies listed on public stock exchanges.
• Real estate entities relate to investments in real estate projects.
7. Fair value measurements of financial assets and liabilities
The following table (note 7.2) presents financial assets measured at fair value in the statement of financial
position in accordance with the fair value hierarchy. This hierarchy groups financial assets and liabilities into
three levels based on the significance of inputs used in measuring the fair value of the financial assets and
liabilities. The fair value hierarchy has the following levels:
- Level 1: quoted prices (unadjusted) in active markets for identical assets or liabilities that the entity can
access at the measurement date;
- Level 2: inputs other than quoted prices included within Level 1 that are observable for the asset or
liability, either directly or indirectly; and
- Level 3: unobservable inputs for the asset or liability.
15
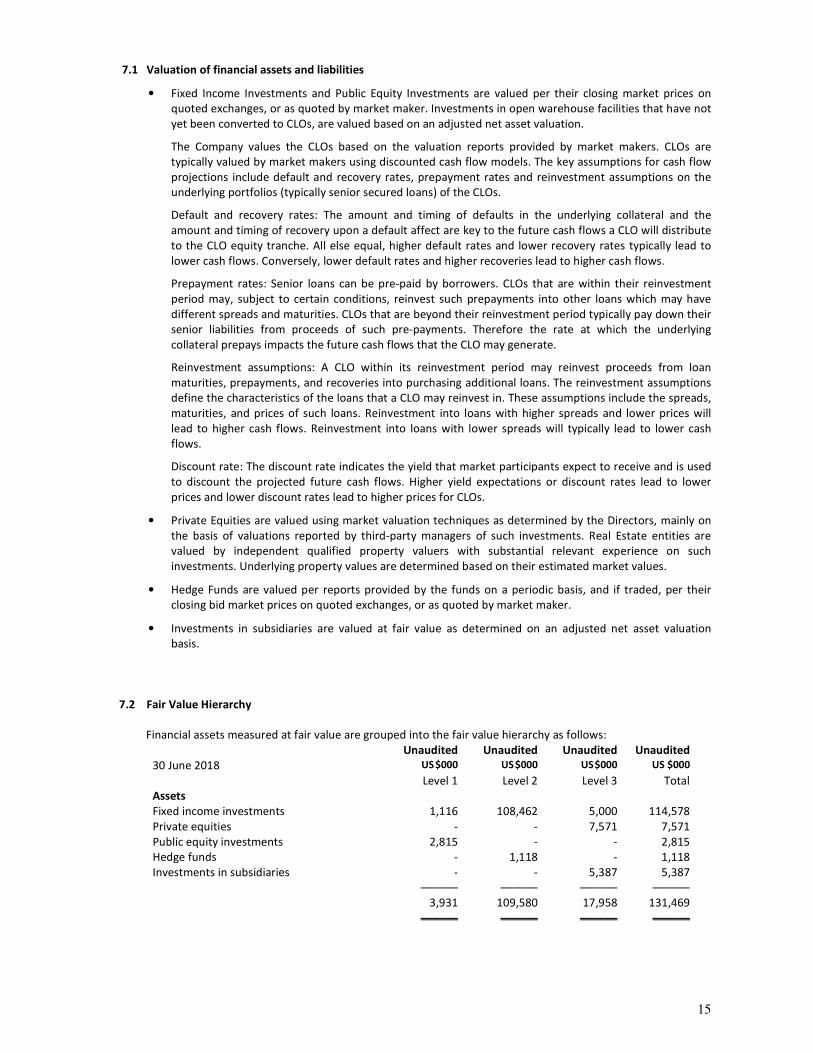
7.1 Valuation of financial assets and liabilities
• Fixed Income Investments and Public Equity Investments are valued per their closing market prices on
quoted exchanges, or as quoted by market maker. Investments in open warehouse facilities that have not
yet been converted to CLOs, are valued based on an adjusted net asset valuation.
The Company values the CLOs based on the valuation reports provided by market makers. CLOs are
typically valued by market makers using discounted cash flow models. The key assumptions for cash flow
projections include default and recovery rates, prepayment rates and reinvestment assumptions on the
underlying portfolios (typically senior secured loans) of the CLOs.
Default and recovery rates: The amount and timing of defaults in the underlying collateral and the
amount and timing of recovery upon a default affect are key to the future cash flows a CLO will distribute
to the CLO equity tranche. All else equal, higher default rates and lower recovery rates typically lead to
lower cash flows. Conversely, lower default rates and higher recoveries lead to higher cash flows.
Prepayment rates: Senior loans can be pre-paid by borrowers. CLOs that are within their reinvestment
period may, subject to certain conditions, reinvest such prepayments into other loans which may have
different spreads and maturities. CLOs that are beyond their reinvestment period typically pay down their
senior liabilities from proceeds of such pre-payments. Therefore the rate at which the underlying
collateral prepays impacts the future cash flows that the CLO may generate.
Reinvestment assumptions: A CLO within its reinvestment period may reinvest proceeds from loan
maturities, prepayments, and recoveries into purchasing additional loans. The reinvestment assumptions
define the characteristics of the loans that a CLO may reinvest in. These assumptions include the spreads,
maturities, and prices of such loans. Reinvestment into loans with higher spreads and lower prices will
lead to higher cash flows. Reinvestment into loans with lower spreads will typically lead to lower cash
flows.
Discount rate: The discount rate indicates the yield that market participants expect to receive and is used
to discount the projected future cash flows. Higher yield expectations or discount rates lead to lower
prices and lower discount rates lead to higher prices for CLOs.
• Private Equities are valued using market valuation techniques as determined by the Directors, mainly on
the basis of valuations reported by third-party managers of such investments. Real Estate entities are
valued by independent qualified property valuers with substantial relevant experience on such
investments. Underlying property values are determined based on their estimated market values.
• Hedge Funds are valued per reports provided by the funds on a periodic basis, and if traded, per their
closing bid market prices on quoted exchanges, or as quoted by market maker.
• Investments in subsidiaries are valued at fair value as determined on an adjusted net asset valuation
basis.
7.2 Fair Value Hierarchy
Financial assets measured at fair value are grouped into the fair value hierarchy as follows:
30 June 2018
Unaudited
US $000
Unaudited
US $000
Unaudited US $000
Unaudited
US $000
Level 1 Level 2 Level 3 Total
Assets
Fixed income investments 1,116 108,462 5,000 114,578
Private equities - - 7,571 7,571
Public equity investments 2,815 - - 2,815
Hedge funds - 1,118 - 1,118
Investments in subsidiaries - - 5,387 5,387
–––––– –––––– –––––– ––––––
3,931 109,580 17,958 131,469
–––––– –––––– –––––– ––––––
16
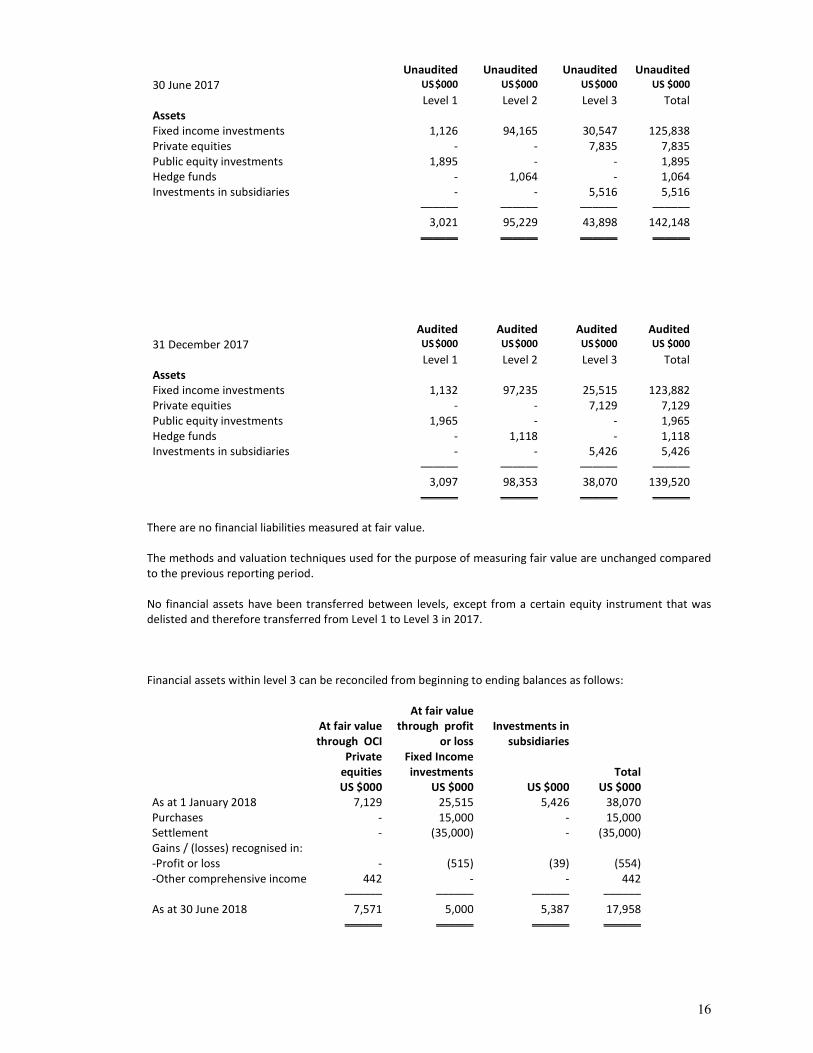
30 June 2017
Unaudited
US $000
Unaudited
US $000
Unaudited US $000
Unaudited
US $000
Level 1 Level 2 Level 3 Total
Assets
Fixed income investments 1,126 94,165 30,547 125,838
Private equities - - 7,835 7,835
Public equity investments 1,895 - - 1,895
Hedge funds - 1,064 - 1,064
Investments in subsidiaries - - 5,516 5,516
–––––– –––––– –––––– ––––––
3,021 95,229 43,898 142,148
–––––– –––––– –––––– ––––––
31 December 2017
Audited
US $000
Audited
US $000
Audited US $000
Audited US $000
Level 1 Level 2 Level 3 Total
Assets
Fixed income investments 1,132 97,235 25,515 123,882
Private equities - - 7,129 7,129
Public equity investments 1,965 - - 1,965
Hedge funds - 1,118 - 1,118
Investments in subsidiaries - - 5,426 5,426
–––––– –––––– –––––– ––––––
3,097 98,353 38,070 139,520
–––––– –––––– –––––– ––––––
There are no financial liabilities measured at fair value.
The methods and valuation techniques used for the purpose of measuring fair value are unchanged compared
to the previous reporting period.
No financial assets have been transferred between levels, except from a certain equity instrument that was
delisted and therefore transferred from Level 1 to Level 3 in 2017.
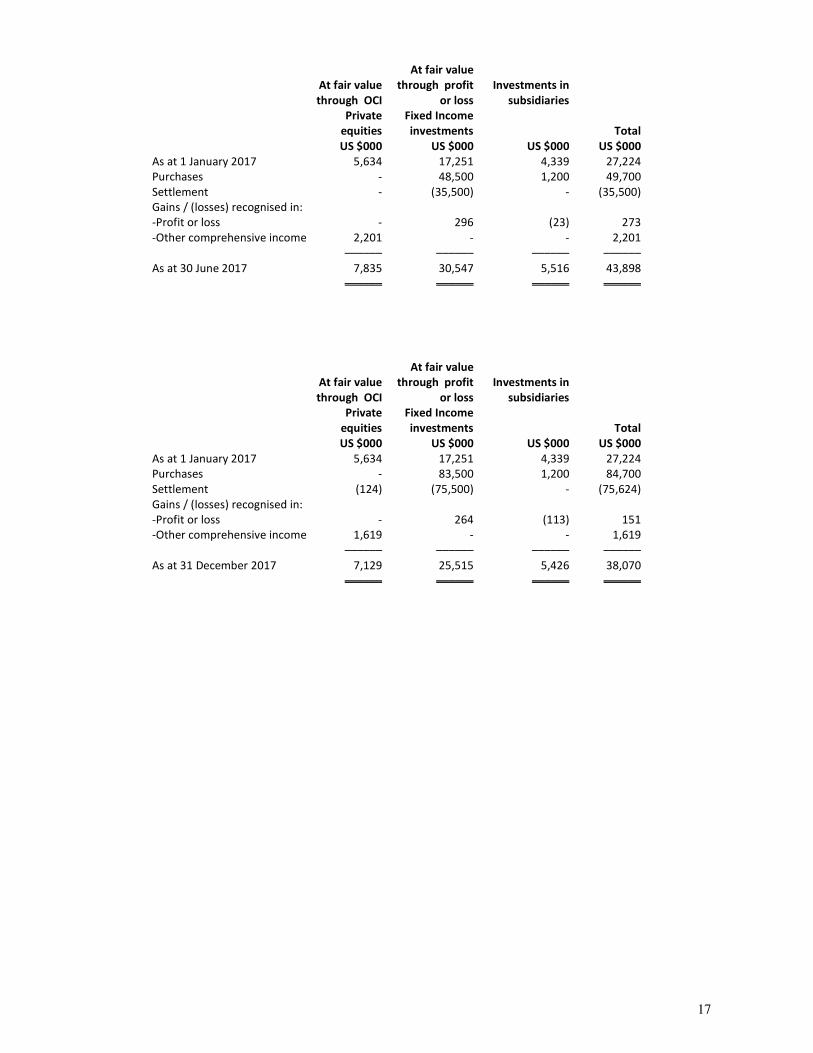
Financial assets within level 3 can be reconciled from beginning to ending balances as follows:
At fair value
through OCI
At fair value
through profit
or loss
Investments in
subsidiaries
Private
equities
Fixed Income
investments
Total
US $000 US $000 US $000 US $000
As at 1 January 2018 7,129 25,515 5,426 38,070
Purchases - 15,000 - 15,000
Settlement - (35,000) - (35,000)
Gains / (losses) recognised in:
-Profit or loss - (515) (39) (554)
-Other comprehensive income 442 - - 442
–––––– –––––– –––––– ––––––
As at 30 June 2018 7,571 5,000 5,387 17,958
–––––– –––––– –––––– ––––––
17
At fair value
through OCI
At fair value
through profit
or loss
Investments in
subsidiaries
Private
equities
Fixed Income
investments
Total
US $000 US $000 US $000 US $000
As at 1 January 2017 5,634 17,251 4,339 27,224
Purchases - 48,500 1,200 49,700
Settlement - (35,500) - (35,500)
Gains / (losses) recognised in:
-Profit or loss - 296 (23) 273
-Other comprehensive income 2,201 - - 2,201
–––––– –––––– –––––– ––––––
As at 30 June 2017 7,835 30,547 5,516 43,898
–––––– –––––– –––––– ––––––
At fair value
through OCI
At fair value
through profit
or loss
Investments in
subsidiaries
Private
equities
Fixed Income
investments
Total
US $000 US $000 US $000 US $000
As at 1 January 2017 5,634 17,251 4,339 27,224
Purchases - 83,500 1,200 84,700
Settlement (124) (75,500) - (75,624)
Gains / (losses) recognised in:
-Profit or loss - 264 (113) 151
-Other comprehensive income 1,619 - - 1,619
–––––– –––––– –––––– ––––––
As at 31 December 2017 7,129 25,515 5,426 38,070
–––––– –––––– –––––– ––––––
18
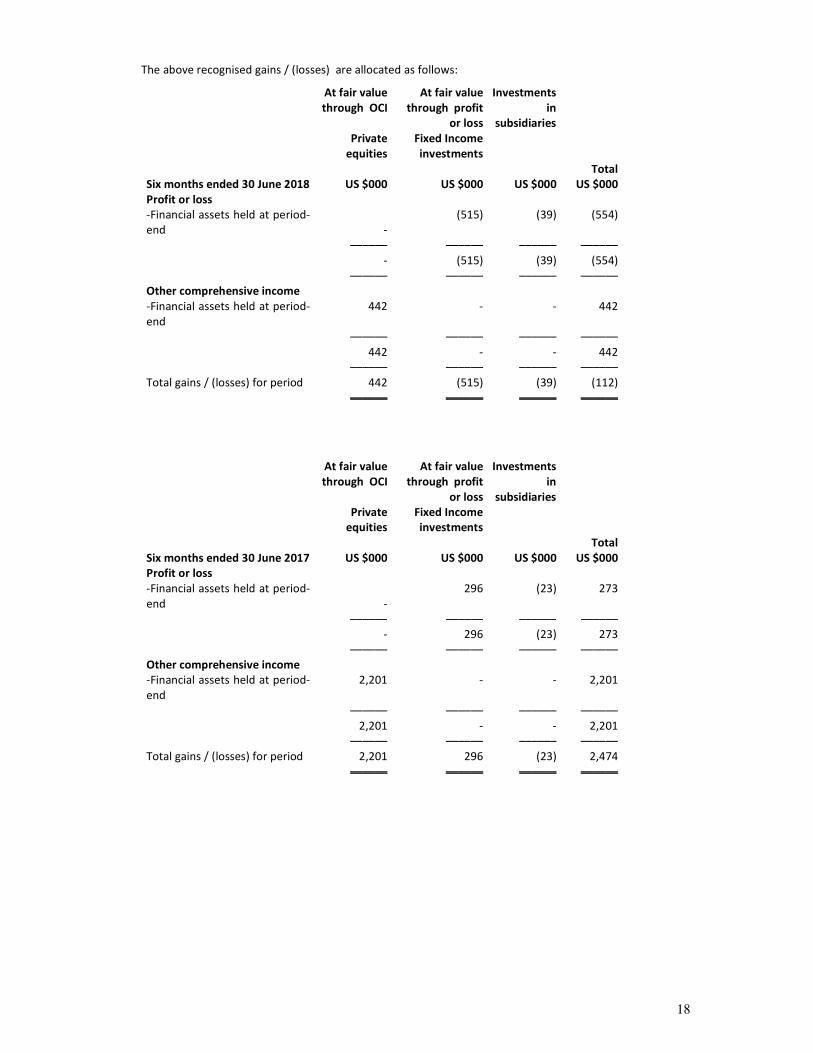
The above recognised gains / (losses) are allocated as follows:
At fair value
through OCI
At fair value
through profit
or loss
Investments
in
subsidiaries
Private
equities
Fixed Income
investments
Total
Six months ended 30 June 2018 US $000 US $000 US $000 US $000
Profit or loss
-Financial assets held at period-
end
-
(515) (39) (554)
–––––– –––––– –––––– ––––––
- (515) (39) (554)
–––––– –––––– –––––– ––––––
Other comprehensive income
-Financial assets held at period-
end
442 - - 442
–––––– –––––– –––––– ––––––
442 - - 442
–––––– –––––– –––––– ––––––
Total gains / (losses) for period 442 (515) (39) (112)
–––––– –––––– –––––– ––––––
At fair value
through OCI
At fair value
through profit
or loss
Investments
in
subsidiaries
Private
equities
Fixed Income
investments
Total
Six months ended 30 June 2017 US $000 US $000 US $000 US $000
Profit or loss
-Financial assets held at period-
end
-
296 (23) 273
–––––– –––––– –––––– ––––––
- 296 (23) 273
–––––– –––––– –––––– ––––––
Other comprehensive income
-Financial assets held at period-
end
2,201 - - 2,201
–––––– –––––– –––––– ––––––
2,201 - - 2,201
–––––– –––––– –––––– ––––––
Total gains / (losses) for period 2,201 296 (23) 2,474
–––––– –––––– –––––– ––––––
19
At fair value
through OCI
At fair value
through profit
or loss
Investments
in
subsidiaries
Private
equities
Fixed Income
investments
Total
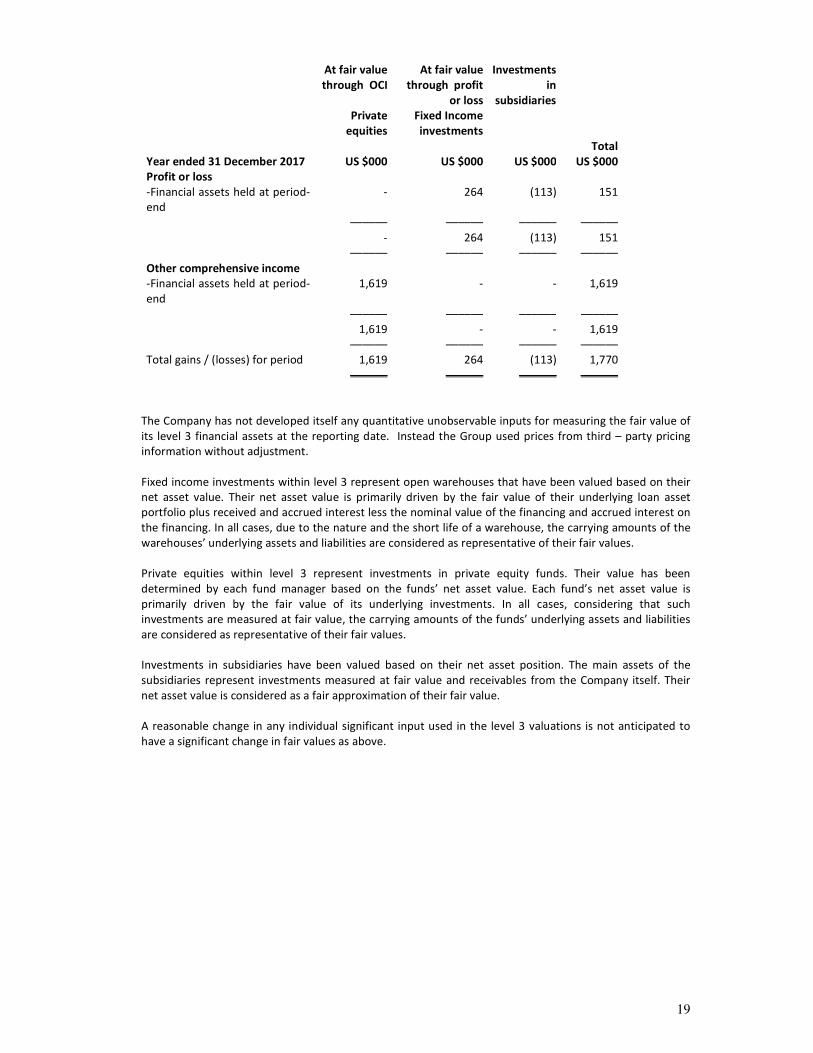
Year ended 31 December 2017 US $000 US $000 US $000 US $000
Profit or loss
-Financial assets held at period-
end
- 264 (113) 151
–––––– –––––– –––––– ––––––
- 264 (113) 151
–––––– –––––– –––––– ––––––
Other comprehensive income
-Financial assets held at period-
end
1,619 - - 1,619
–––––– –––––– –––––– ––––––
1,619 - - 1,619
–––––– –––––– –––––– ––––––
Total gains / (losses) for period 1,619 264 (113) 1,770
–––––– –––––– –––––– ––––––
The Company has not developed itself any quantitative unobservable inputs for measuring the fair value of
its level 3 financial assets at the reporting date. Instead the Group used prices from third – party pricing
information without adjustment.
Fixed income investments within level 3 represent open warehouses that have been valued based on their
net asset value. Their net asset value is primarily driven by the fair value of their underlying loan asset
portfolio plus received and accrued interest less the nominal value of the financing and accrued interest on
the financing. In all cases, due to the nature and the short life of a warehouse, the carrying amounts of the
warehouses’ underlying assets and liabilities are considered as representative of their fair values.
Private equities within level 3 represent investments in private equity funds. Their value has been
determined by each fund manager based on the funds’ net asset value. Each fund’s net asset value is
primarily driven by the fair value of its underlying investments. In all cases, considering that such
investments are measured at fair value, the carrying amounts of the funds’ underlying assets and liabilities
are considered as representative of their fair values.
Investments in subsidiaries have been valued based on their net asset position. The main assets of the
subsidiaries represent investments measured at fair value and receivables from the Company itself. Their
net asset value is considered as a fair approximation of their fair value.
A reasonable change in any individual significant input used in the level 3 valuations is not anticipated to
have a significant change in fair values as above.
20
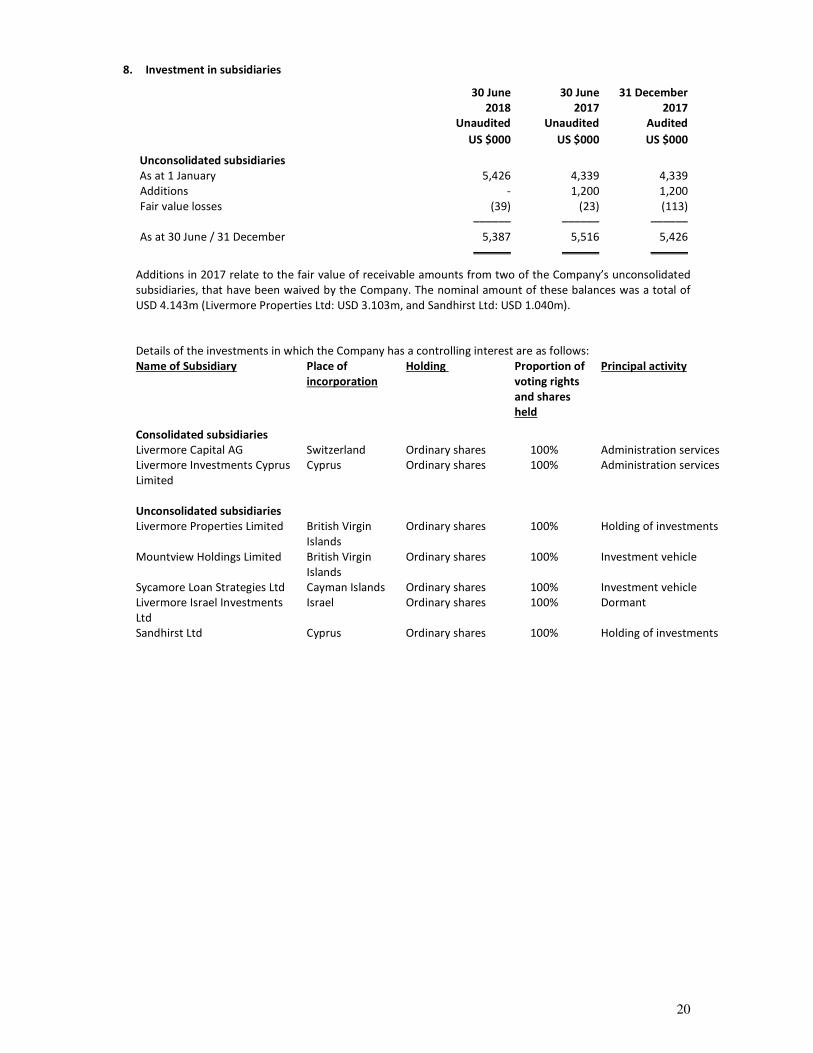
8. Investment in subsidiaries
30 June
2018
Unaudited
30 June
2017
Unaudited
31 December
2017
Audited
US $000 US $000 US $000
Unconsolidated subsidiaries
As at 1 January 5,426 4,339 4,339
Additions - 1,200 1,200
Fair value losses (39) (23) (113)
–––––– –––––– ––––––
As at 30 June / 31 December 5,387 5,516 5,426
–––––– –––––– ––––––
Additions in 2017 relate to the fair value of receivable amounts from two of the Company’s unconsolidated
subsidiaries, that have been waived by the Company. The nominal amount of these balances was a total of
USD 4.143m (Livermore Properties Ltd: USD 3.103m, and Sandhirst Ltd: USD 1.040m).
Details of the investments in which the Company has a controlling interest are as follows:
Name of Subsidiary Place of
incorporation
Holding Proportion of
voting rights
and shares
held
Principal activity
Consolidated subsidiaries
Livermore Capital AG Switzerland Ordinary shares 100% Administration services
Livermore Investments Cyprus
Limited
Cyprus Ordinary shares 100% Administration services
Unconsolidated subsidiaries
Livermore Properties Limited British Virgin
Islands
Ordinary shares 100% Holding of investments
Mountview Holdings Limited British Virgin
Islands
Ordinary shares 100% Investment vehicle
Sycamore Loan Strategies Ltd Cayman Islands Ordinary shares 100% Investment vehicle
Livermore Israel Investments
Ltd
Israel Ordinary shares 100% Dormant
Sandhirst Ltd Cyprus Ordinary shares 100% Holding of investments
21
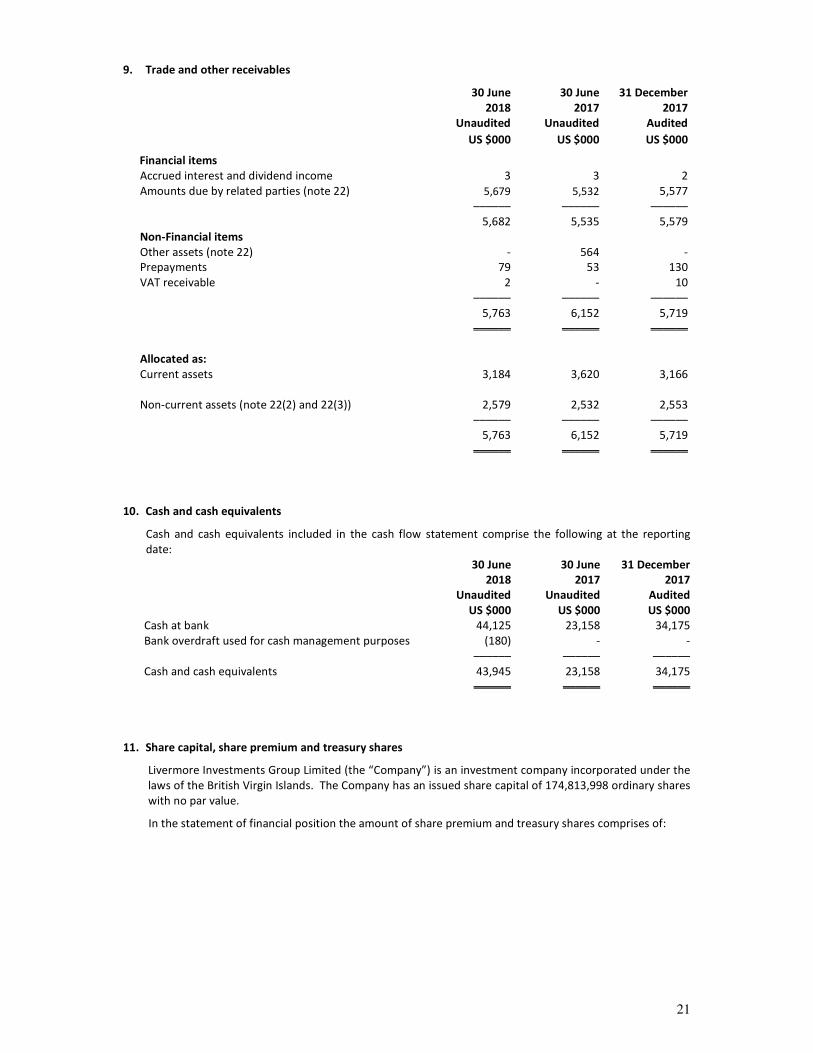
9. Trade and other receivables
30 June
2018
Unaudited
30 June
2017
Unaudited
31 December
2017
Audited
US $000 US $000 US $000
Financial items
Accrued interest and dividend income 3 3 2
Amounts due by related parties (note 22) 5,679 5,532 5,577
–––––– –––––– ––––––
5,682 5,535 5,579
Non-Financial items
Other assets (note 22) - 564 -
Prepayments 79 53 130
VAT receivable 2 - 10
–––––– –––––– ––––––
5,763 6,152 5,719
–––––– –––––– ––––––
Allocated as:
Current assets 3,184 3,620 3,166
Non-current assets (note 22(2) and 22(3)) 2,579 2,532
2,553
–––––– –––––– ––––––
5,763 6,152 5,719
–––––– –––––– ––––––
10. Cash and cash equivalents
Cash and cash equivalents included in the cash flow statement comprise the following at the reporting
date:
30 June
2018
Unaudited
30 June
2017
Unaudited
31 December
2017
Audited
US $000 US $000 US $000
Cash at bank 44,125 23,158 34,175
Bank overdraft used for cash management purposes (180) - -
–––––– –––––– ––––––
Cash and cash equivalents 43,945 23,158 34,175
–––––– –––––– ––––––
11. Share capital, share premium and treasury shares
Livermore Investments Group Limited (the “Company”) is an investment company incorporated under the
laws of the British Virgin Islands. The Company has an issued share capital of 174,813,998 ordinary shares
with no par value.
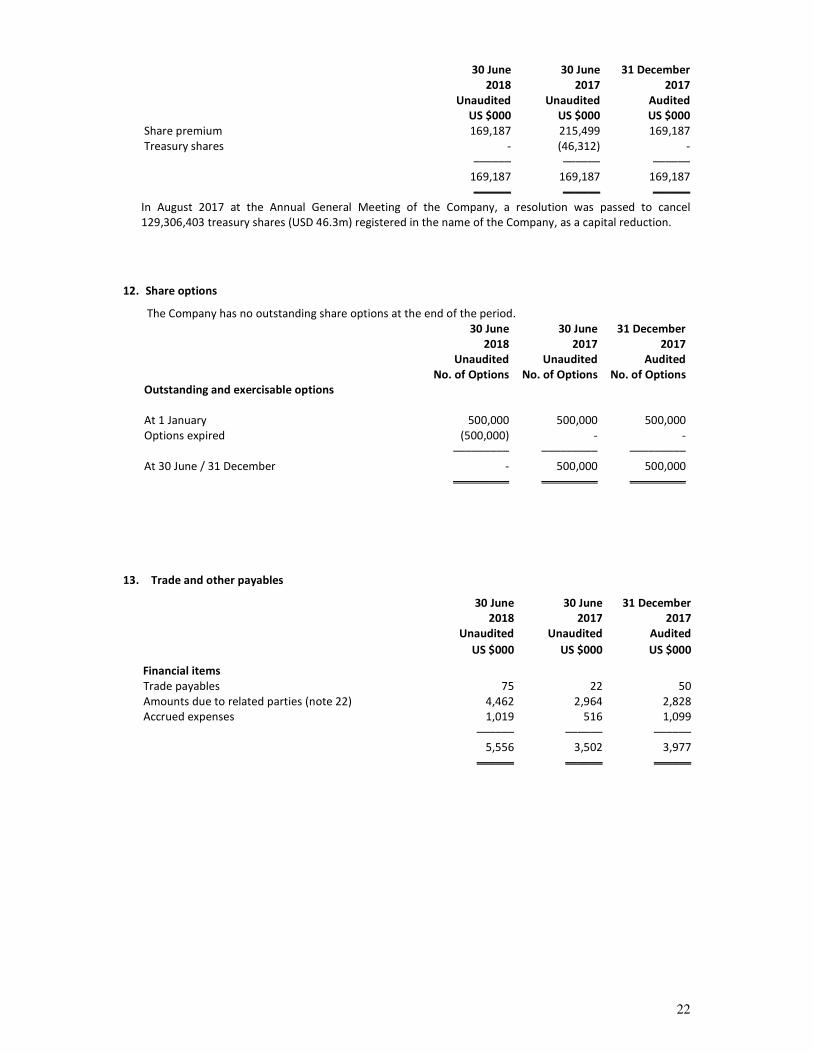
In the statement of financial position the amount of share premium and treasury shares comprises of:
22
30 June
2018
Unaudited
30 June
2017
Unaudited
31 December
2017
Audited
US $000 US $000 US $000
Share premium 169,187 215,499 169,187
Treasury shares - (46,312) -
–––––– –––––– ––––––
169,187 169,187 169,187
–––––– –––––– ––––––
In August 2017 at the Annual General Meeting of the Company, a resolution was passed to cancel
129,306,403 treasury shares (USD 46.3m) registered in the name of the Company, as a capital reduction.
12. Share options
The Company has no outstanding share options at the end of the period.
30 June
2018
Unaudited
30 June
2017
Unaudited
31 December
2017
Audited
No. of Options No. of Options No. of Options
Outstanding and exercisable options
At 1 January 500,000 500,000 500,000
Options expired (500,000) - -
––––––––– ––––––––– –––––––––
At 30 June / 31 December - 500,000 500,000
––––––––– ––––––––– –––––––––
13. Trade and other payables
30 June
2018
Unaudited
30 June
2017
Unaudited
31 December
2017
Audited
US $000 US $000 US $000
Financial items
Trade payables 75 22 50
Amounts due to related parties (note 22) 4,462 2,964 2,828
Accrued expenses 1,019 516 1,099
–––––– –––––– ––––––
5,556 3,502 3,977
–––––– –––––– ––––––
23
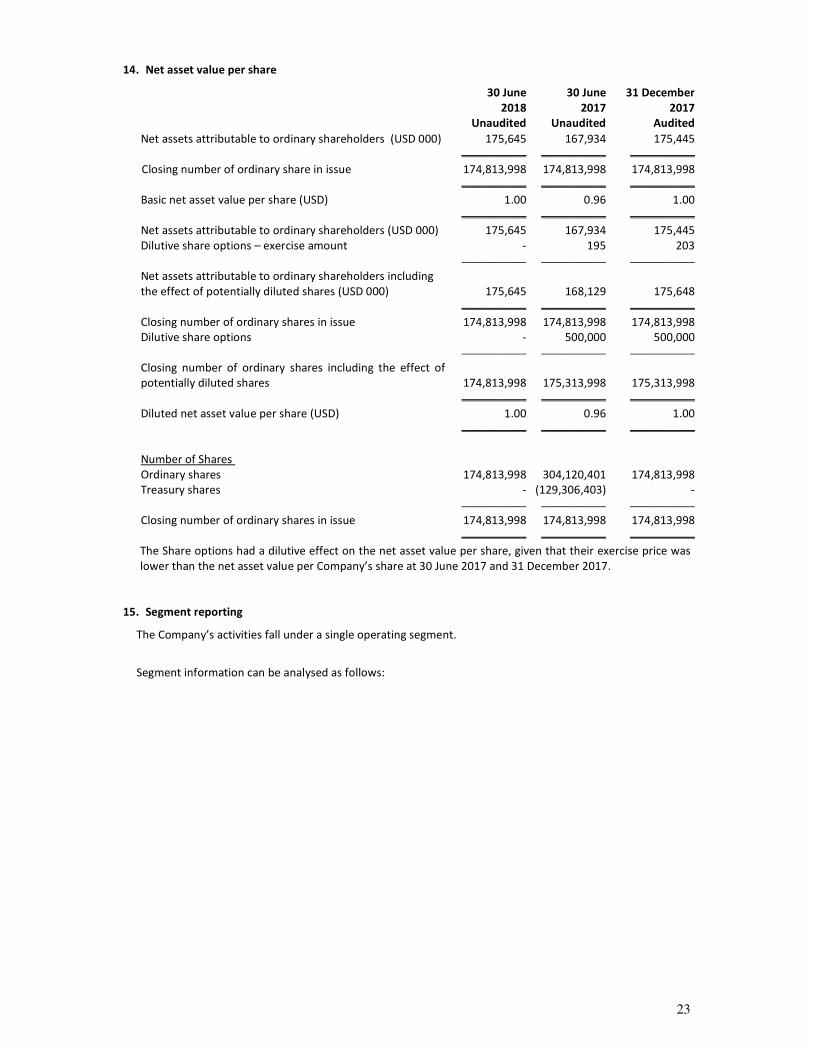
14. Net asset value per share
30 June
2018
Unaudited
30 June
2017
Unaudited
31 December
2017
Audited
Net assets attributable to ordinary shareholders (USD 000) 175,645 167,934 175,445
––––––––––––– ––––––––––––– –––––––––––––
Closing number of ordinary share in issue 174,813,998 174,813,998 174,813,998
––––––––––––– ––––––––––––– –––––––––––––
Basic net asset value per share (USD) 1.00 0.96 1.00
––––––––––––– ––––––––––––– –––––––––––––
Net assets attributable to ordinary shareholders (USD 000) 175,645 167,934 175,445
Dilutive share options – exercise amount - 195 203
––––––––––––– ––––––––––––– –––––––––––––
Net assets attributable to ordinary shareholders including
the effect of potentially diluted shares (USD 000) 175,645 168,129 175,648
––––––––––––– ––––––––––––– –––––––––––––
Closing number of ordinary shares in issue 174,813,998 174,813,998 174,813,998
Dilutive share options - 500,000 500,000
––––––––––––– ––––––––––––– –––––––––––––
Closing number of ordinary shares including the effect of
potentially diluted shares 174,813,998 175,313,998 175,313,998
––––––––––––– ––––––––––––– –––––––––––––
Diluted net asset value per share (USD) 1.00 0.96 1.00
––––––––––––– ––––––––––––– –––––––––––––
Number of Shares
Ordinary shares 174,813,998 304,120,401 174,813,998
Treasury shares - (129,306,403) -
––––––––––––– ––––––––––––– –––––––––––––
Closing number of ordinary shares in issue 174,813,998 174,813,998 174,813,998
––––––––––––– ––––––––––––– –––––––––––––
The Share options had a dilutive effect on the net asset value per share, given that their exercise price was
lower than the net asset value per Company’s share at 30 June 2017 and 31 December 2017.
15. Segment reporting
The Company’s activities fall under a single operating segment.
Segment information can be analysed as follows:
24
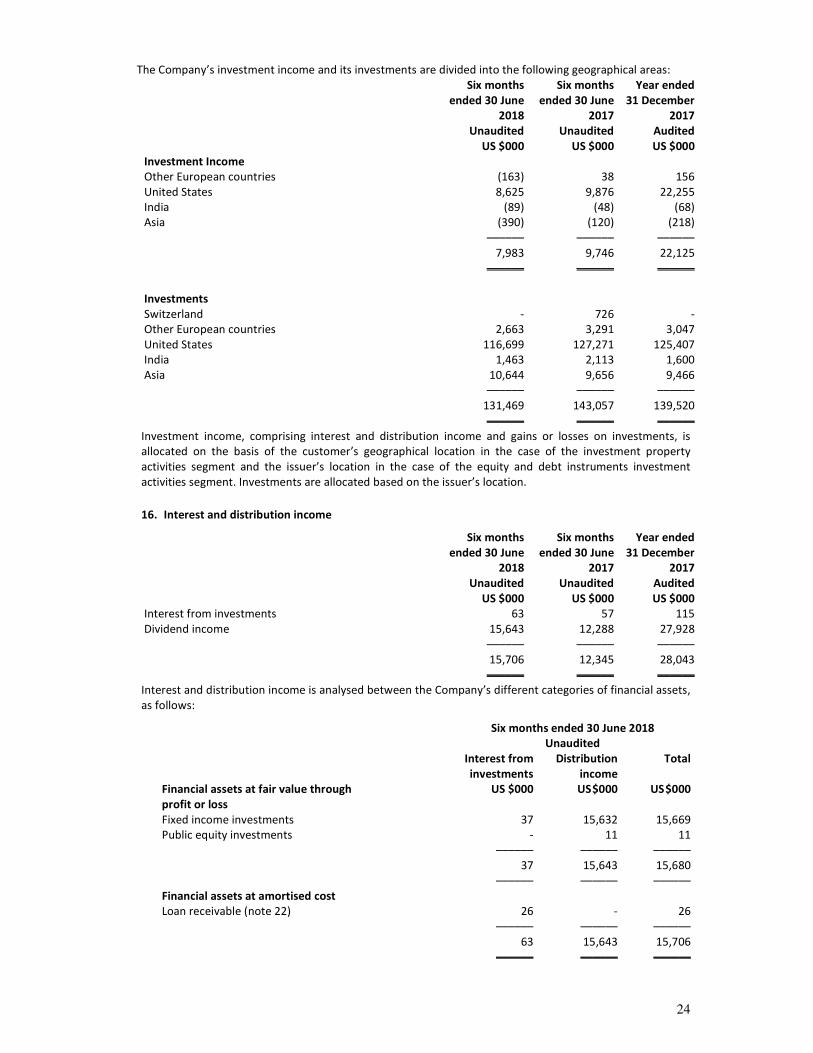
The Company’s investment income and its investments are divided into the following geographical areas:
Six months
ended 30 June
2018
Unaudited
Six months
ended 30 June
2017
Unaudited
Year ended
31 December
2017
Audited
US $000 US $000 US $000
Investment Income
Other European countries (163) 38 156
United States 8,625 9,876 22,255
India (89) (48) (68)
Asia (390) (120) (218)
–––––– –––––– ––––––
7,983 9,746 22,125
–––––– –––––– ––––––
Investments
Switzerland - 726 -
Other European countries 2,663 3,291 3,047
United States 116,699 127,271 125,407
India 1,463 2,113 1,600
Asia 10,644 9,656 9,466
–––––– –––––– ––––––
131,469 143,057 139,520
–––––– –––––– ––––––
Investment income, comprising interest and distribution income and gains or losses on investments, is
allocated on the basis of the customer’s geographical location in the case of the investment property
activities segment and the issuer’s location in the case of the equity and debt instruments investment
activities segment. Investments are allocated based on the issuer’s location.
16. Interest and distribution income
Six months
ended 30 June
2018
Unaudited
Six months
ended 30 June
2017
Unaudited
Year ended
31 December
2017
Audited
US $000 US $000 US $000
Interest from investments 63 57 115
Dividend income 15,643 12,288 27,928
–––––– –––––– ––––––
15,706 12,345 28,043
–––––– –––––– ––––––
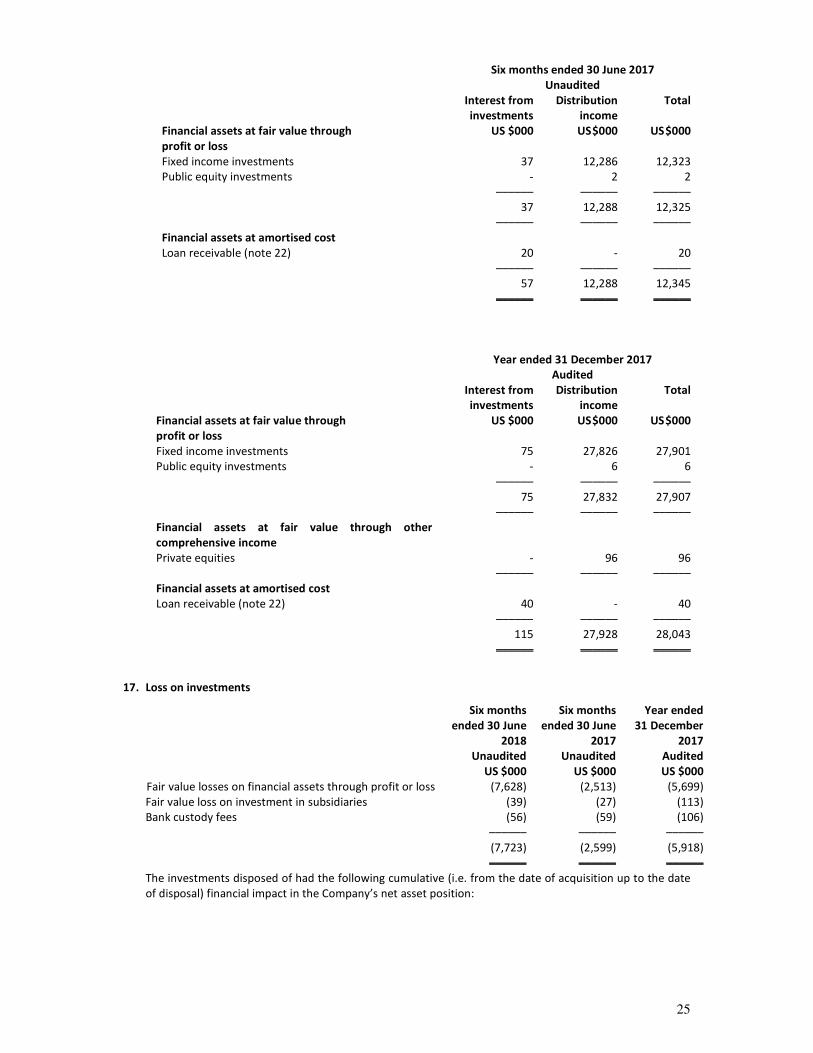
Interest and distribution income is analysed between the Company’s different categories of financial assets,
as follows:
Six months ended 30 June 2018
Unaudited
Interest from
investments
Distribution
income
Total
Financial assets at fair value through US $000 US $000 US $000
profit or loss
Fixed income investments 37 15,632 15,669
Public equity investments - 11 11
–––––– –––––– ––––––
37 15,643 15,680
–––––– –––––– ––––––
Financial assets at amortised cost
Loan receivable (note 22) 26 - 26
–––––– –––––– ––––––
63 15,643 15,706
–––––– –––––– ––––––
25
Six months ended 30 June 2017
Unaudited
Interest from
investments
Distribution
income
Total
Financial assets at fair value through US $000 US $000 US $000
profit or loss
Fixed income investments 37 12,286 12,323
Public equity investments - 2 2
–––––– –––––– ––––––
37 12,288 12,325
–––––– –––––– ––––––
Financial assets at amortised cost
Loan receivable (note 22) 20 - 20
–––––– –––––– ––––––
57 12,288 12,345
–––––– –––––– ––––––
Year ended 31 December 2017
Audited
Interest from
investments
Distribution
income
Total
Financial assets at fair value through US $000 US $000 US $000
profit or loss
Fixed income investments 75 27,826 27,901
Public equity investments - 6 6
–––––– –––––– ––––––
75 27,832 27,907
–––––– –––––– ––––––
Financial assets at fair value through other
comprehensive income
Private equities - 96 96
–––––– –––––– ––––––
Financial assets at amortised cost
Loan receivable (note 22) 40 - 40
–––––– –––––– ––––––
115 27,928 28,043
–––––– –––––– ––––––
17. Loss on investments
Six months
ended 30 June
2018
Unaudited
Six months
ended 30 June
2017
Unaudited
Year ended
31 December
2017
Audited
US $000 US $000 US $000
Fair value losses on financial assets through profit or loss (7,628) (2,513) (5,699)
Fair value loss on investment in subsidiaries (39) (27) (113)
Bank custody fees (56) (59) (106)
–––––– –––––– ––––––
(7,723) (2,599) (5,918)
–––––– –––––– ––––––
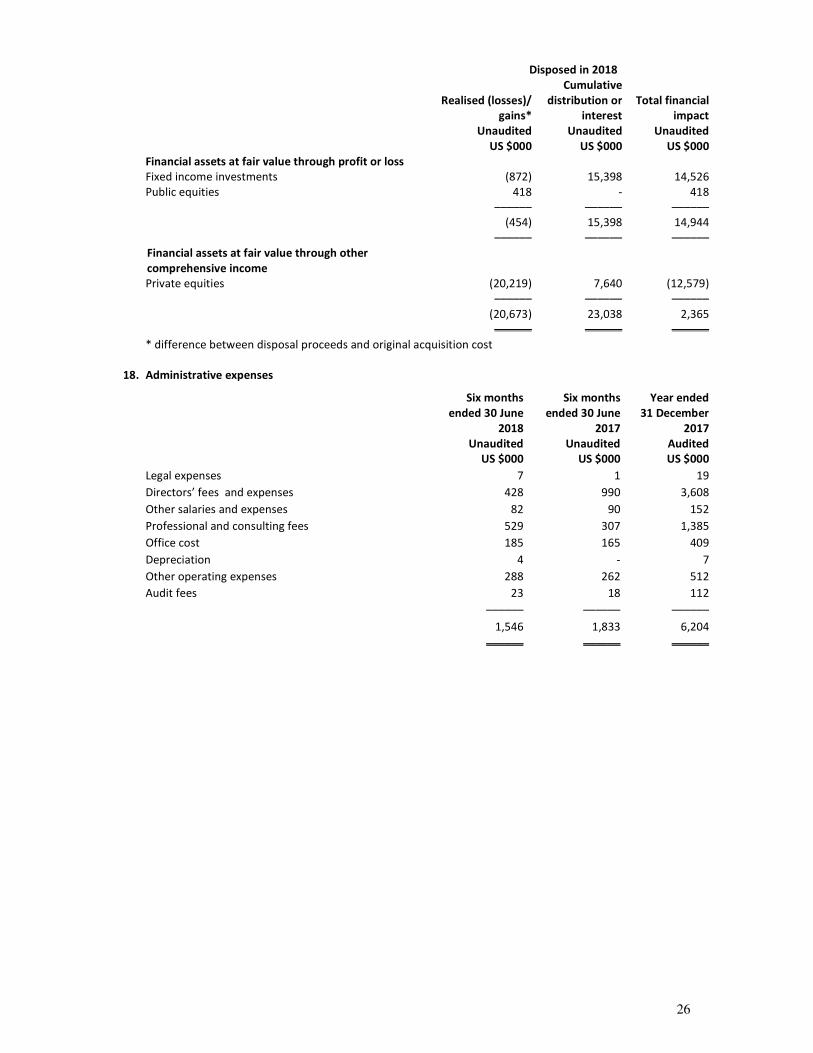
The investments disposed of had the following cumulative (i.e. from the date of acquisition up to the date
of disposal) financial impact in the Company’s net asset position:
26
Disposed in 2018
Realised (losses)/
gains*
Unaudited
Cumulative
distribution or
interest
Unaudited
Total financial
impact
Unaudited
US $000 US $000 US $000
Financial assets at fair value through profit or loss
Fixed income investments (872) 15,398 14,526
Public equities 418 - 418
–––––– –––––– ––––––
(454) 15,398 14,944
–––––– –––––– ––––––
Financial assets at fair value through other
comprehensive income
Private equities (20,219) 7,640 (12,579)
–––––– –––––– ––––––
(20,673) 23,038 2,365
–––––– –––––– ––––––
* difference between disposal proceeds and original acquisition cost
18. Administrative expenses
Six months
ended 30 June
2018
Unaudited
Six months
ended 30 June
2017
Unaudited
Year ended
31 December
2017
Audited
US $000 US $000 US $000
Legal expenses 7 1 19
Directors’ fees and expenses 428 990 3,608
Other salaries and expenses 82 90 152
Professional and consulting fees 529 307 1,385
Office cost 185 165 409
Depreciation 4 - 7
Other operating expenses 288 262 512
Audit fees 23 18 112
–––––– –––––– ––––––
1,546 1,833 6,204
–––––– –––––– ––––––
27
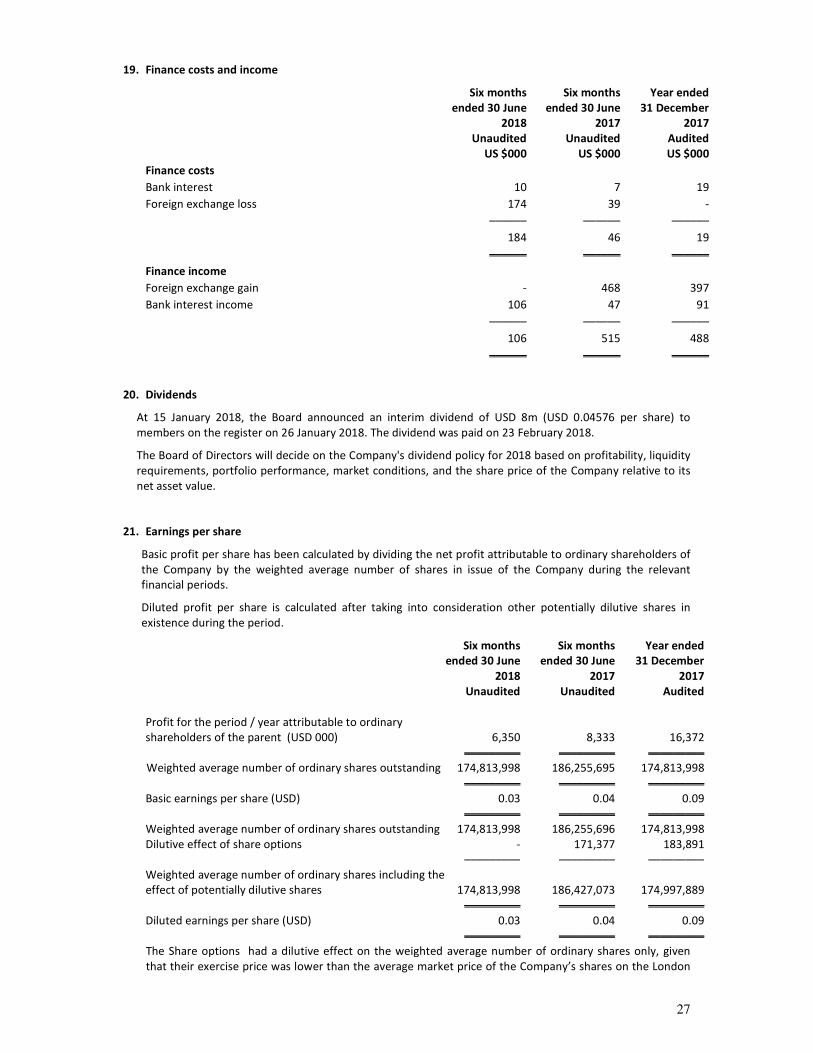
19. Finance costs and income
Six months
ended 30 June
2018
Unaudited
Six months
ended 30 June
2017
Unaudited
Year ended
31 December
2017
Audited
US $000 US $000 US $000
Finance costs
Bank interest 10 7 19
Foreign exchange loss 174 39 -
–––––– –––––– ––––––
184 46 19
–––––– –––––– ––––––
Finance income
Foreign exchange gain - 468 397
Bank interest income 106 47 91
–––––– –––––– ––––––
106 515 488
–––––– –––––– ––––––
20. Dividends
At 15 January 2018, the Board announced an interim dividend of USD 8m (USD 0.04576 per share) to
members on the register on 26 January 2018. The dividend was paid on 23 February 2018.
The Board of Directors will decide on the Company's dividend policy for 2018 based on profitability, liquidity
requirements, portfolio performance, market conditions, and the share price of the Company relative to its
net asset value.
21. Earnings per share
Basic profit per share has been calculated by dividing the net profit attributable to ordinary shareholders of
the Company by the weighted average number of shares in issue of the Company during the relevant
financial periods.
Diluted profit per share is calculated after taking into consideration other potentially dilutive shares in
existence during the period.
Six months
ended 30 June
2018
Unaudited
Six months
ended 30 June
2017
Unaudited
Year ended
31 December
2017
Audited
Profit for the period / year attributable to ordinary
shareholders of the parent (USD 000) 6,350 8,333 16,372
––––––––– ––––––––– –––––––––
Weighted average number of ordinary shares outstanding 174,813,998 186,255,695 174,813,998
––––––––– ––––––––– –––––––––
Basic earnings per share (USD) 0.03 0.04 0.09
––––––––– ––––––––– –––––––––
Weighted average number of ordinary shares outstanding 174,813,998 186,255,696 174,813,998
Dilutive effect of share options - 171,377 183,891
––––––––– ––––––––– –––––––––
Weighted average number of ordinary shares including the
effect of potentially dilutive shares
174,813,998
186,427,073
174,997,889
––––––––– ––––––––– –––––––––
Diluted earnings per share (USD) 0.03 0.04 0.09
––––––––– ––––––––– –––––––––
The Share options had a dilutive effect on the weighted average number of ordinary shares only, given
that their exercise price was lower than the average market price of the Company’s shares on the London
28
Stock Exchange (AIM division) during the period ended 30 June 2017 and the year ended 31 December
2017.
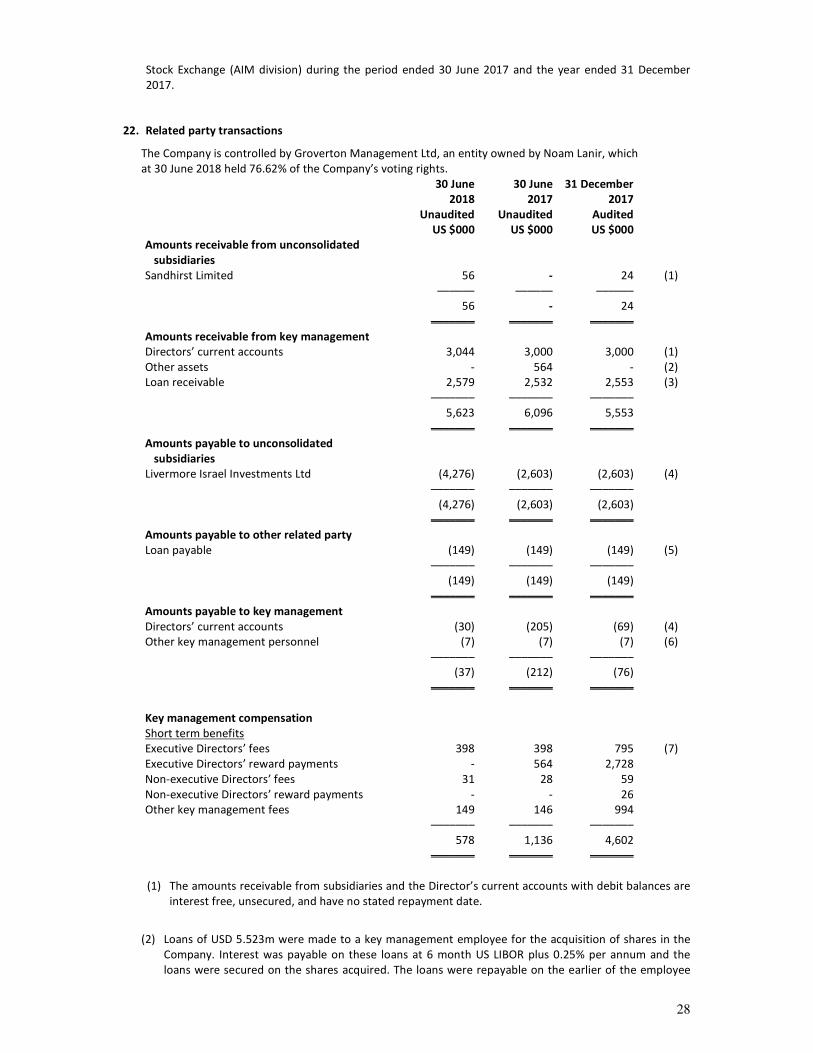
22. Related party transactions
The Company is controlled by Groverton Management Ltd, an entity owned by Noam Lanir, which
at 30 June 2018 held 76.62% of the Company’s voting rights.
30 June
2018
Unaudited
30 June
2017
Unaudited
31 December
2017
Audited
US $000 US $000 US $000
Amounts receivable from unconsolidated
subsidiaries
Sandhirst Limited 56 - 24 (1)
–––––– –––––– ––––––
56 - 24
––––––– ––––––– –––––––
Amounts receivable from key management
Directors’ current accounts 3,044 3,000 3,000 (1)
Other assets - 564 - (2)
Loan receivable 2,579 2,532 2,553 (3)
––––––– ––––––– –––––––
5,623 6,096 5,553
––––––– ––––––– –––––––
Amounts payable to unconsolidated
subsidiaries
Livermore Israel Investments Ltd (4,276) (2,603) (2,603) (4)
––––––– ––––––– –––––––
(4,276) (2,603) (2,603)
––––––– ––––––– –––––––
Amounts payable to other related party
Loan payable (149) (149) (149) (5)
––––––– ––––––– –––––––
(149) (149) (149)
––––––– ––––––– –––––––
Amounts payable to key management
Directors’ current accounts (30) (205) (69) (4)
Other key management personnel (7) (7) (7) (6)
––––––– ––––––– –––––––
(37) (212) (76)
––––––– ––––––– –––––––
Key management compensation
Short term benefits
Executive Directors’ fees 398 398 795 (7)
Executive Directors’ reward payments - 564 2,728
Non-executive Directors’ fees 31 28 59
Non-executive Directors’ reward payments - - 26
Other key management fees 149 146 994
––––––– ––––––– –––––––
578 1,136 4,602
––––––– ––––––– –––––––
(1) The amounts receivable from subsidiaries and the Director’s current accounts with debit balances are
interest free, unsecured, and have no stated repayment date.
(2) Loans of USD 5.523m were made to a key management employee for the acquisition of shares in the
Company. Interest was payable on these loans at 6 month US LIBOR plus 0.25% per annum and the
loans were secured on the shares acquired. The loans were repayable on the earlier of the employee
29
leaving the Company or April 2013. In December 2012 the Board decided to renew the outstanding
amount of these loans for a period of another five years. Based on the Board’s decision, the
outstanding amount is reduced annually on a straight line over five years, as long as the key
management employee remains with the Company. The loans are classified as “other assets” and are
included under trade and other receivables (note 9).
(3) A loan of USD 2.500m was made to a key management employee for the acquisition of shares in the
Company. Interest is payable on the loan at 6 month US LIBOR plus 0.25% per annum and the loan is
secured on the shares acquired. The loan is repayable on the earlier of the employee leaving the
Company or April 2020. The loan is included within trade and other receivables (note 9).
(4) The amounts payable to subsidiaries and Director’s current accounts with credit balances are interest
free, unsecured, and have no stated repayment date.
(5) A loan with a balance at 30 June 2017 of USD 0.149m has been received from a related company
(under common control) Chanpak Ltd. The loan is free of interest, unsecured and repayable on
demand. This loan is included within trade and other payables (note 13).
(6) The amount payable to other key management personnel relates to a payment made on behalf of the
Company for investment purposes and accrued consultancy fees.
(7) These payments were made directly to companies which are related to the Directors.
No social insurance and similar contributions nor any other defined benefit contributions plan costs
incurred for the Group in relation to its key management personnel in either 2018 or 2017.
Noam Lanir, through an Israeli partnership, is the major shareholder of Babylon Limited, an Israel based
Internet Services Company. The Company as of 30 June 2018 held a total of 1.941m shares at a value of
USD 0.753m which represents 4% of its effective voting rights.
As at the reporting, date Livermore had 335,816 shares of Wanaka Capital Partners Mid-Tech Opportunity
Fund registered in its name but held for the absolute benefit of a related company (under common
control). These shares are not included in the financial assets of the Company.
During the period ended 30 June 2018, the Company received administrative services of USD 0.086m
(December 2017: USD 0.048m), in connection with investments, from a related company (under common
control).
23. Litigation
Fairfield Sentry Ltd vs custodian bank and beneficial owners
One of the custodian banks that the Company uses faces a contingent claim up to USD 2.1m, and any
interest as will be decided by a US court and related legal fees, with regard to the redemption of shares in
Fairfield Sentry Ltd, which were bought in 2008 at the request of Livermore and on its behalf. The same
case was also filed in BVI where the Privy Council ruled against the plaintiffs.
As a result of the surrounding uncertainties over the existence of any obligation for Livermore, as well as
for the potential amount of exposure, the Directors cannot form an estimate of the outcome for this case
and therefore no provision has been made.
No further information is provided on the above case as the Directors consider it could prejudice its
outcome.
24. Commitments
The Company has expressed its intention to provide financial support to its subsidiaries, where necessary
to enable them to meet their obligations as they fall due.
Other than the above, the Company has no capital or other commitments as at 30 June 2018.

30
25. Events after the reporting date
There were no material events after the reporting date, which have a bearing on the understanding of
these interim condensed consolidated financial statements.
26. Preparation of interim financial statements
Interim condensed consolidated financial statements are unaudited. Consolidated financial statements for
Livermore Investments Group Limited for the year ended 31 December 2017, prepared in accordance with
International Financial Reporting Standards as adopted by the European Union, on which the auditors gave
an unqualified audit report are available on the Company’s website www.livermore-inv.com.
31
Review Report to Livermore Investments Group Limited
Report on the Review of the Condensed Consolidated Financial Statements
Introduction
We have reviewed the accompanying interim condensed consolidated financial statements of Livermore Investments Group Limited (the ''Company'') and its consolidated subsidiaries (together with the Company ''the Group''), which are presented in pages 8 to 30 and comprise the condensed consolidated statement of financial position as at 30 June 2018 and the condensed consolidated statements of comprehensive income, changes in equity, and cash flows for the period from 1 January to 30 June 2018, and other explanatory information.
The Board of Directors is responsible for the preparation and fair presentation of these interim condensed consolidated financial statements in accordance with International Accounting Standard 34 ''Interim Financial Reporting'' as adopted by the European Union (EU). Our responsibility is to express a conclusion on these interim condensed consolidated financial statements based on our review.
Scope of Review
We conducted our review in accordance with the International Standard on Review Engagement 2410 ''Review of Interim Financial Information Performed by the Independent Auditor of the Entity''. A review of interim financial information consists of making inquiries, primarily of persons responsible for financial and accounting matters, and applying analytical and other review procedures. A review is substantially less in scope than an audit conducted in accordance with International Standards on Auditing and consequently does not enable us to obtain assurance that we would become aware of all significant matters that might be identified in an audit. Accordingly, we do not express an audit opinion.
Conclusion
Based on our review, nothing has come to our attention that causes us to believe that the accompanying interim condensed consolidated financial statements do not give a true and fair view, in all material respects, of the financial position of the Group of Livermore Investments Group Limited as at 30 June 2018 and of their financial performance and its cash flows for the period from 1 January to 30 June 2018 in accordance with the International Accounting Standard 34 ''Interim Financial Reporting'' as adopted by the EU.
Other Matter
This report, including the conclusion, has been prepared for and only for the Company and for no other purpose. We do not, in giving this conclusion, accept or assume responsibility for any other purpose or to any other person to whose knowledge this report may come to.
Nicos Mouzouris Certified Public Accountant and Registered Auditor for and on behalf of Grant Thornton (Cyprus) Ltd Certified Public Accountants and Registered Auditors Limassol, 23 September 2018