Embed Size (px)
Citation preview

ED 052 834
POCUMENT RESUME
24 PS 004 886
AUTHOR Hines, Brainard W.TITLE Detailed Analysis of Language Development of
Preschool Children in ECE Program. Technical ReportNo. 4.
INSTITUTION Appalachia Educational Lab., Charleston, W. Va.SPONS AGENCY Office of Education (DREW), Washington, D.C. Bureau
of Research.BUREAU NO BR-6-2909PUB DATE 71CONTRACT OEC-3-7-062909-3070NOTE 49p.
EDRS PRICE EDRS Price MF-$0.65 HC-$3.29DESCRIPTORS *Language Development, *Language Skills, *Language
Tests, Mobile Classrooms, Nonprofessional Personnel,*Preschool Programs, *Program Effectiveness, Tables(Data), Television, Verbal Ability
IDENTIFIERS Early Childhood Education Program, Illinois Test ofPsycholinguistic Abilities, ITPA
ABSTRACTThis report is concerned with the language skills
category of objectives of the Early Childhood Education (BCE)Program. The Illinois Test of Psycholinguistic Ability (ITPA) was theprimary instrument used for evaluation of 3-, 4-, and 5-year-oldchildren in three treatment groups: (1) mobile educational facility,TV, and paraprofessional, (2) TV and paraprofessional, and (3) TVonly. A control group received no treatment. An overview of the ITPAis given, as well as separate descriptions of each of the tensubtests. The subtests overlap somewhat in the functions theymeasure, but cover the broad areas of auditory memory and acuity,verbal expression and grammar, syntax and transi:ormations, and theability to associate various auditory and visual stimuli. Statisticaldescriptions and inferences are presented for each subtest. Anoverall summary of the findings of the effects for the second year'sprogramming in language development is presented. Trends reportedindicate that the ECE Program is having an effect on a broad range ofpsycholinguistic abilities. Tables and figures comprise aboutone-half of the document. A summary of *EL Early Child Educationprogram is available as PS 004 889. (Author/NH)

U.S. DEPARTMENT DF HEALTH,EDUCATION & WELFAREOFFICE,OF EDUCATIDN
THIS DOCUMENT HAS BEEN REPRO-DUCED EXACTLY AS RECEIVED FROMTHE PERSON OR ORGANIZATION ORIG-INATING IT. POINTS OF VIEW OR OPIN-IONS STATED DO NOT NECESSARILYREPRESENT OFFICIAL OFFICE OF EDU-CATION POSITION OR POLICY.
DETAILED ANALYSIS OF LANGUAGE DEVELOPMENT
OF PRESCHOOL CHILDREN IN ECE PROGRAM
Technical Report No. 4
Division of Research and EvaluationAppalachia Educational Laboratory
Charleston, West Virginia
PR- 24- 6-A101:UM

TABLE OF CONTENTS
1-AGE
INTRODUCTION 1
THE MODEL OF THE ITPA 2
METHODS OF ANALYSIS 3
DESCRIPTION OF ITPA SUBTESTS AND DATA ANALYSIC 4
SUMMARY OF RESULTS 41
LIST OF TABLES.
TABLE
4-1 ITPA SUBTEST 1 MEANS, STANDARD DEVIATIONS
AND NUMBERS OF SUBJECTS BY AGE AND SEX
WITHIN TREATMENT GROUPS
4-2 SUBTEST 1 MEANS, STANDARD DEVIATIONS, AND
SAMPLE SIZES BY TREATMENT GROUPS 5
4-3 ANALYSIS OF VARIANCE TLBLE FOR ITPA SUBTEST 1 6
4-4 ITPA SUBTEST 2 MEANS, STANDARD DEVIATIONS,
AND SAMPLE SIZES BY AGE AND SEX WITHIN
TREATMENT GROUPS 13
4-5 ITPA SUBTEST 2 MEAN SCORES AND NATIONAL
NORMS BY TREATMENT GROUPS 13
4-6 ANALYSIS OF VARIANCE TABLE FOR ITPA SUBTEST 2 14
4-7 ITPA SUBTEST 3 MEANS, STANDARD DEVIATIONS,
AND SAMPLE SIZES BY AGE AND SEX WITHIN
TREATMENT GROUPS 16
4-8 ITPA SUBTEST 3 MEAN SCORES AND NATIONAL
NORMS BY TREATMENT GROUPS 16
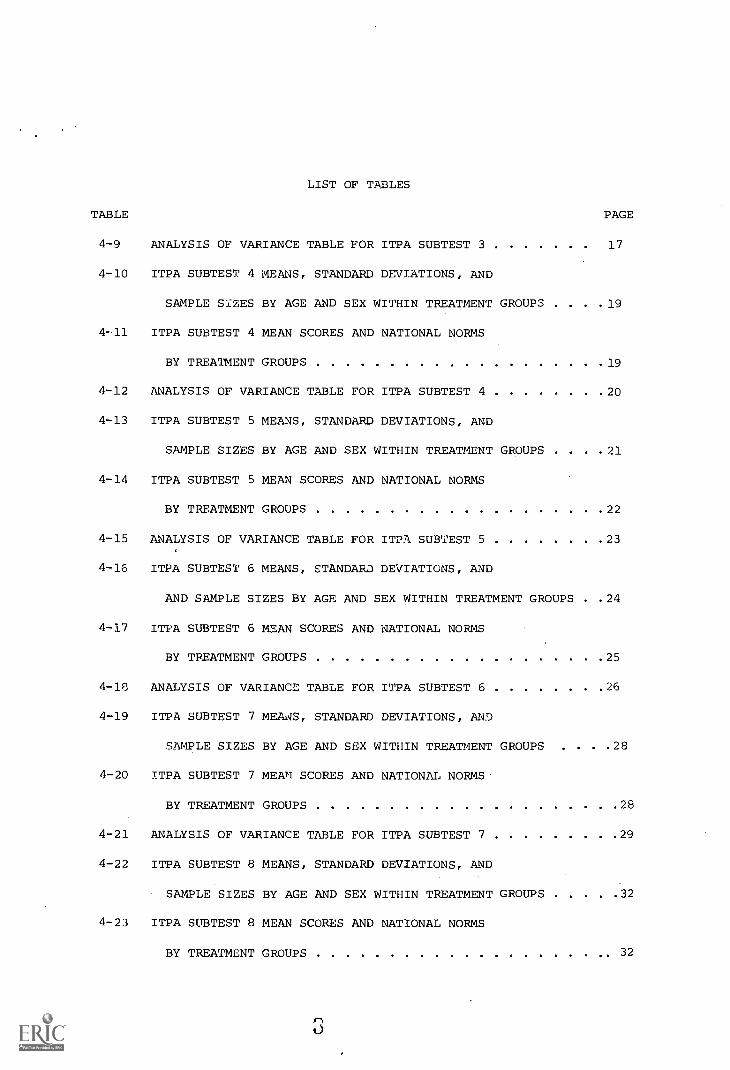
LIST OF TABLES
TABLE PAGE
4-9 ANALYSIS OF VARIANCE TABLE FOR ITPA SUBTEST 3 17
4-10 ITPA SUBTEST 4 MEANS, STANDARD DEVIATIONS, AND
SAMPLE SIZES BY AGE AND SEX WITHIN TREATMENT GROUPS . . 19
411 ITPA SUBTEST 4 MEAN SCORES AND NATIONAL NORMS
BY TREATMENT GROUPS 19
4-12 ANALYSIS OF VARIANCE TABLE FOR ITPA SUBTEST 4 20
4-13 ITPA SUBTEST 5 MEANS, STANDARD DEVIATIONS, AND
SAMPLE SIZES BY AGE AND SEX WITHIN TREATMENT GROUPS . . . .21
4-14 ITPA SUBTEST 5 MEAN SCORES AND NATIONAL NORMS
BY TREATMENT GROUPS 22
4-15 ANALYSIS OF VARIANCE TABLE FOR ITL SUBTEST 5 23
4-16 ITPA SUBTEST 6 MEANS, STANDARD DEVIATIONS, AND
AND SAMPLE SIZES BY AGE AND SEX WITHIN TREATMENT GROUPS . .24
4-17 ITPA SUBTEST 6 MEAN SCORES AND NATIONAL NORMS
BY TREATMENT GROUPS 25
4-18 ANALYSIS OF VARIANCE TABLE FOR ITPA SUBTEST 6 26
4-19 ITPA SUBTEST 7 MEANS, STANDARD DEVIATIONS, AND
SAMPLE SIZES BY AGE AND SEX WITHIN TREATMENT GROUPS . . .28
4-20 ITPA SUBTEST 7 MEAfl SCORES AND NATIONAL NORMS
BY TREATMENT GROUPS 28
4-21 ANALYSIS OF VARIANCE TABLE FOR ITPA SUBTEST 7 29
4-22 ITPA SUBTEST 8 MEANS, STANDARD DEVIATIONS, AND
SAMPLE SIZES BY AGE AND SEX WITHIN TREATMENT GROUPS 32
4-23 ITPA SUBTEST 8 MEAN SCORES AND NATIONAL NORMS
BY TREATMENT GROUPS 32

LIST OF TABLES
TABLE PAGE
4-24 ANALYSIS OF VARIANCE TABLE FOR ITPA SUBTEST 8 33
4-25 ITPA SUBTEST 9 MEANS, STANDARD DEVIATIONS, AND
SAMPLE SIZES BY AGE AND SEX WITHIN TREATMENT GROUPS . 34
4-26 ITPA SUBTEST 9 MPAN SCORES AND NATIONAL NORMS
BY TREATMENT GROUPS 35
4-27 ANALYSIS OF VARIANCE TABLE FOR ITPA SUBTEST 9 36
4-28 ITPA SUBTEST 10 MEANS, STANDARD DEVIATIONS, AND
SAMPLE SIZES BY AGE AND SEX WITHIN TREATMENT GROUPS . . . 37
4-29 ITPA SUBTEST 10 MEAN SCORES AND NATIONAL NORMS
BY TREATMENT GROUPS 37
4-30 ANALYSIS OF VARIANCE TABLE FOR ITPA SUBTEST 10 39
4-31 ITPA TOTAL RAW SCORE MEANS, STANDARD DEVIATIONS
AND SAMPLE SIZES BY AGE AND SEX WITHIN TREATMENT
GROUPS 39
4-32 ITPA TOTAL RAW SCORE MEAN SCORES AND NATIONAL
NORMS BY TREATMENT GROUPS 40
4-33 ANALYSIS OF VARIANCE TABLE FOR ITPA TOTAL RAW SCORE . . . 41
4

LIST OF FIGURES
FIGURE PAGE
4-1 ITPA SUBTEST 1 (AUDITORY RECEPTION) MEAN SCORES
AND NATIONAL NORMS BY TREATMENT GROUPS. 6
4-2 ILLUSTRATION OF THE SIGNIFICANT TREATMENT-AGE-SEX
INTERACTION ON ITPA SUBTEST 1 (AUDITORY RECEPTION). 7
4-3 SEX-TREATMENT INTERACTION WITHIN AGE ON ITPA 8
4-4 PPVT RAW MEAN SCORES OF FOUR YEAR OLD FEMALES
SUPERIMPOSED ON THE ITPA SUBTEST ONE MEAN SCORES . . 9
4-5 PPVT RAW SCORES OF FOUR YEAR OLD MALES SUPERIMPOSED
ON THE ITPA SUBTEST ONE MEAN SCORES 10
4-6 ITPA SUBTFST 2 (VISUAL DECODING) MEAN SCORES AND
NATIONAL NORMS BY TREATMENT GROUPS 14
4-7 ITPA SUBTEST 3 (AUDITORY-VOCAL ASSOCIATION) MEAN
SCORES AND NATIONAL NORMS BY TREATMENT GROUPS 17
4-8 ITPA SUBTEST 4 (VISUAL-MOTOR ASSOCIATION) MEAN
SCORES AND NATIONAL NORMS BY TREATMENT GROUPS 20
4-9 ITPA SUBTEST 5 (VERBAL EXPRESSION) MEAN SCORES
AND NATIONAL NORMS BY TREATMENT GROUPS 22
4-10 ITPA SUBTEST 6 (MANUAL EXPRESSION) MEAN SCORES
AND NATIONAL NORMS BY TREATMENT GROUPS 25
4-11 ITPA SUBTEST 7 (GRAMMATIC CLOSURE) MEAN SCORES
AND NATIONAL NORMS BY TREATMENT GROUPS 29
4-12 ILLUSTRATION OF THE SIGNIFICANT TREATMENT-AGE-SEX
INTERACTION ON ITPA SUBTEST 7 (GRAMMATIC CLOSURE) . . . 30

LIST OF FIGURES
FIGURE PAGE
4-13 ITPA SUBTEST 8 (VISUAL CLOSURE) MEAN SCORES AND
NATIONAL NORMS BY TREATMENT GROUPS 32
4-14 ITPA SUBTEST 9 (AUDITORY SEQUENTIAL MEMORY) MEAN
SCORES AND NATIONAL NORMS BY TREATMENT GROUPS 35
4-15 ITPA SUBTEST 10 (VISUAL SEQUENTIAL MEMORY) MEAN
SCORES AND NATIONAL NORMS BY TREATMENT GROUPS 38
4-16 ITPA TOTAL MEAN SCORES BY TREATMENT GROUPS 40
E
DETAILED ANALYSIS OF LANGUAGE DEVELOPMENTOF PRiSCFOOL CHILDREN IN ECE PROGRAM*
Introduction
Originally, the objectives for the Early Childhood Education Program were
divided into four major categories - -motor activities, language skills, cog-
nition, and orienting and attending skills. 1 This report is concerned with the
language skills category of objectives.
One of the difficulties associated with evaluating language skills is
the loose fit between available theoretical and operational definitions of
language. Often language is not theoretically defined at all, and must be
operationally defined by the particular instrument being .,..sed for evaluation
purposes.
This procedure has been followed for the summative evaluation of
language growth in the ECE program. Consequently, the theoretical model
underlying the Illinois Test of Psycholinguistic Ability, the test used for
language evaluation, is considered to be applicable to our ECE program. The
definition of language used, therefore, was that of the authors of the ITPA.
The ITPA was a primary instrument in gathering data for the development
of the Early Childhood curriculum objectives. 2 Since this is so, it was
assumed that the ITPA would measure many of the language objectives of the
program as it proceeded through its three year development cycle. The ITPA
also has the advantage of being a nationally normed test and thus providing
1Frank H. Hooper and William H. Marshall, The Initial Phase of a PreschoolCurriculum Development Project (Charleston: Research and Information Center,1968), p. 99.
2Ibid, pp. 76-89.
*This report was prepared by Brainard W. Hines of the Research andEvaluation Division of the Appalachia Educational Laboratory.

2
comparisons with a large sample of children outside of the AEL geographic
area.
The text of this report will give an overview of the instrument, as
well as separate descriptions of each of the subtests. Following this,
statistical descriptions and inferences will be presented for each subtest.
Finally an overall summary of our findings of the effects for the second
year's programming in language development will be presented.
The Model of the ITPA
According to the authors of the ITPA, the purpose of the test is:
To relate those functions whereby the intentions of one individualare transmitted (verbally or nonverbally) to another individual,and, reciprocally, functions whereby the environment or theintentions of another individual are received and interpreted.It attempts to interrelate the processes which take place, forexample, when one person receives a message, interprets it, orbecomes a source of a new signal to be transmitted. It dealswith the psychological functions of the individual which operatein communication activities.3
It was hoped that the child would model his language behavior on the
example provided by the television teacher, the paraprofessional, and the
teacher.on the mobile facility. Further, the ECE program does not stress
verbal communication alone, but also attempts to involve the child in learning
to express himself through gestures or pantomime. Thus, the model of language
quoted above is closely applicable to the objectives of the ECE program.
The ITPA itself consists of ten subtests, each of which attempts to
measure a different aspect of language skills, and those cognitive abilities
which are related to language. These subtests overlap somewhat in the
functions which they measure, but cover the broad areas of auditory memory
3Samuel A. Kirk, James J. McCarthy, aad Winifred D. Kirk, Examiners Manual,Illinois Test of Psycholinguistic Abilities, (Urbana: The Board of Trusteesof the University of Illinois, 1968.)

3
and acuity, verbal expression and grammar, syntax and tran.formations, and
the ability to associate various auditory and visual stimuli. A total score
is compared for the test which attempts to give an overall picture of the
individual's psycholinguistic functioning.
It should be noted that the ITPA's major function that for which it
was developed - is the identification and diagnosis of individual deficiencies
in receptive or expressive language abilities. Its close congruence with many
of the overall objectives of AEL's Early Childhood Education Program justify
its use as a major evaluation instrument, but it must be considered as a
secondary and less responsive indicator of differences among the treatment
groups.
Methods of Analysis
The primary statistical technique used Lo analyze data from the ITPA was
a three-way analysis of variance.. This procedure involved measuring the sig-
nificance of the effects of the four levels of treatment (van + TV + para-
professional), (TV + paraprofessional), (TV only), (no treatment); three levels
of age (3, 4, and 5); and two levels of sex. The BMD series analysis of
variance program with the correction routine for unequal n's was used. An
analysis of covariance Was also performed, using chronological age and
Peabody Picture Vocabulary Test raw score as covariates. This procedure
yielded little information beyond that obtained from the ANOVA, however.
Data were collected in June and September of 1970 from a sample of 273
children in the three treatment groups described above, as well as from 60
children in a comparison group located in Morgantown, West Virginia. A
more complete description of the sampling technique used is presented in
the introduction to this report.

4
Only raw scores were included for analysis of data from the ITPA.
Scaled scores and derived scores were excluded because of the difficulties
arising from comparing results from two different numerical measuring systems.
Description of ITPA Subtests and Data Analysis
ITPA Subtest 1, Auditory Reception
Auditory reception measures the ability of a child to derive meaning from
verbally presented material. Since the receptive rather than the expressive
process is ,Jeing sampled, the response throughout is kept at the simple level
of a "yes" or "no" or even a nod or shake of the head. The vocabulary becomes
more and more difficult while the response remains at a two-year level.
Similarly, the automatic function of determining meaning from syntax has been
minimized by retaining only one sentence form. The test contains 50 short,
direct questions printed in the manual. TypicE.1 items are: "Do dogs eat?"
"Do dials yawn?" "Do carpenters kneel?" "Do wingless birds soar?"4
It seems likely that this subtest measures functions more complex than
the ability to hear and understand simple questions. At the very least it is
responsive to the vocabulary level of the individual, especially in the area of
noun-verb relationships.
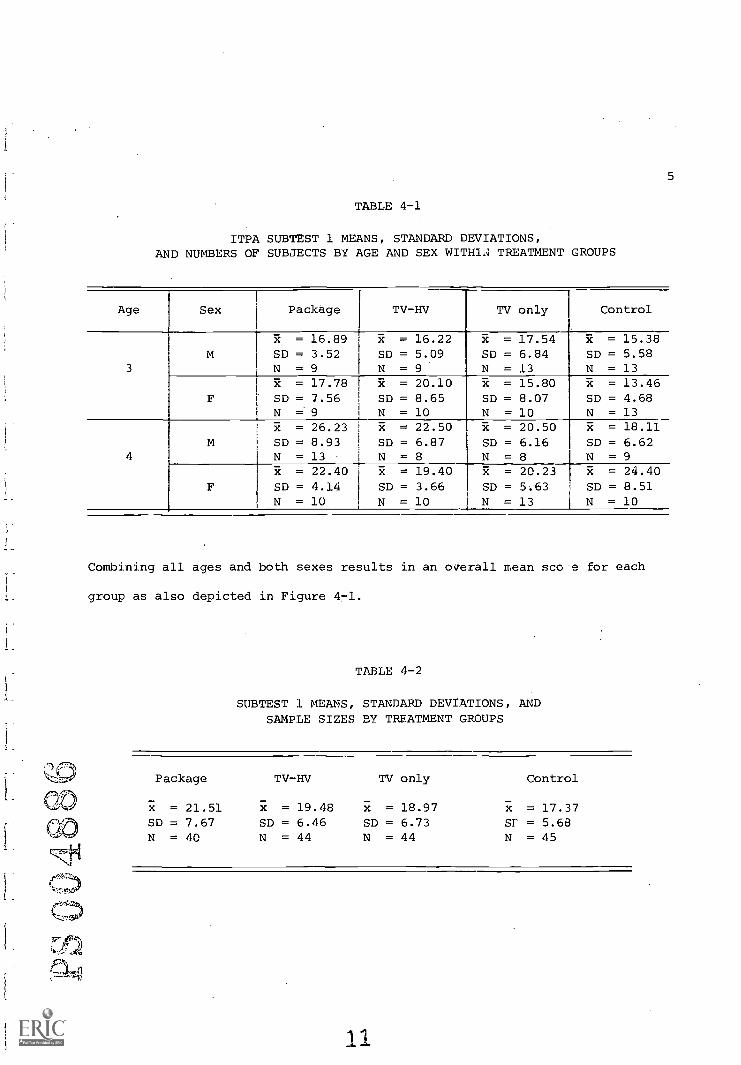
Table 4-1 indicates means and standard deviations for each sex and age
cell within the four levels of treatment, and Table 4-2 shows the means by
treatment groups without sex or age differentiation. These means and national
norms according to the age of each treatment group are presented in Figure 4-1.
4Ibid, p. 9.
1r)
5
TABLE 4-1
ITPA SUBTEST 1 MEANS, STANDARD DEVIATIONS,AND NUMBERS OF SUBJECTS BY AGE AND SEX WITH1A TREATMENT GROUPS
Age Sex Package TV-HV TV only Control
= 16.89 x = 16.22 x = 17.54 R = 15.38
M SD = 3.52 SD = 5.09 SD = 6.84 SD = 5.583 N = 9 N= 9 N= 13 N= 13
x = 17.78 x = 20.10 x = 15.80 x = 13.46F SD = 7.56 SD = 8.65 SD = 8.07 SD = 4.68
N = 9 N = 10 N = 10 N = 13
x = 26.23 x = 22.50 x = 20.50 x = 18.11M SD = 8.93 SD = 6.87 SD = 6.16 SD = 6.62
4 N = 13 N= 8 N= 8 N= 9
x = 22.40 x = 19.40 x = 20.23 R = 24.40
F SD = 4.14 SD = 3.66 SD = 5.63 SD = 8.51N = 10 N = 10 N = 13 N = 10
Combining all ages and both sexes results in an overall mean sco e for each
group as also depicted in Figure 4-1.
TABLE 4-2
SUBTEST 1 MEANS, STANDARD DEVIATIONS, ANDSAMPLE SIZES BY TREATMENT GROUPS
Package TV-HV TV only Control
x = 21.51 = 19.48 x = 18.97 x = 17.37SD = 7.67 SD = 6.46 SD = 6.73 Sr = 5.68N = 40 N = 44 N = 44 N = 45
11

20
10
0
6
SampleMeans
NationalNorms
21.51 19.00 19.48 18 00 18.97 18.00 17.37 17.00
Package TV-HV TV only Control
FIGURE 4-1
ITPA Subtext 1 (Auditory Reception) MeanScores and National Norms by Treatment Groups
Analysis of variance for subtest 1 of the ITPA produced the results
exhibited in Table 4-3.
TABLE 4-3
ANALYSIS OF VARIANCE TABLE FOR ITPA SUBTEST 1
Source eta2 D.F Mean Square
I(trt) .016 3 45.42182414 0.99J(sex) .000 1 3.853257387 0.08K(age) .110 1 950.9626239 20.78 P <.0005
IJ-INT .016 3 45.76211651 1.00IK-INT .013 3 37.52099342 0.82JK-INT .001 1 7.293674101 0.16IJKINT .045 3 129.9578338 2,84 Pc.05ERROR 150 45.77295830
2
P = Package
H = TV-HV
T = TV only
C = Control
Group
Mean
Score
30
25
20
15
13
Age:
C
3
Male
4
Mean
Score
25
20
15
13
Age:
/C
Female
ILLUSTRATION OF THE
SIGNIFICANT TREATMENT-AGE-SEX
INTERACTION ON ITPASUBTEST 1
(AU
DIT
OR
Y R
EC
EPT
ION
)
FIGURE 4-2
c o
Mean
Score
(sex-age)
25
20
15
10->
M-4 Au
0
F-4 %
F-3 f.-
M-3
KF-4
M-4
J( M-3
Package
TV-HV
TVonly
Control
FIGURE 4-3
SEX-TREATMENT INTERACTION WITHIN AGE ON ITPA

9
As can be seen from the above, the differences between treatment groups
were not statistically significant. However, the trend to relatively higher
scores for children in the Package and TV-HV groups is consistently apparent
throughout all of the subtOsts. This is indicative of the possibility of
program effects which wete not apparent in the statistical analysis. A
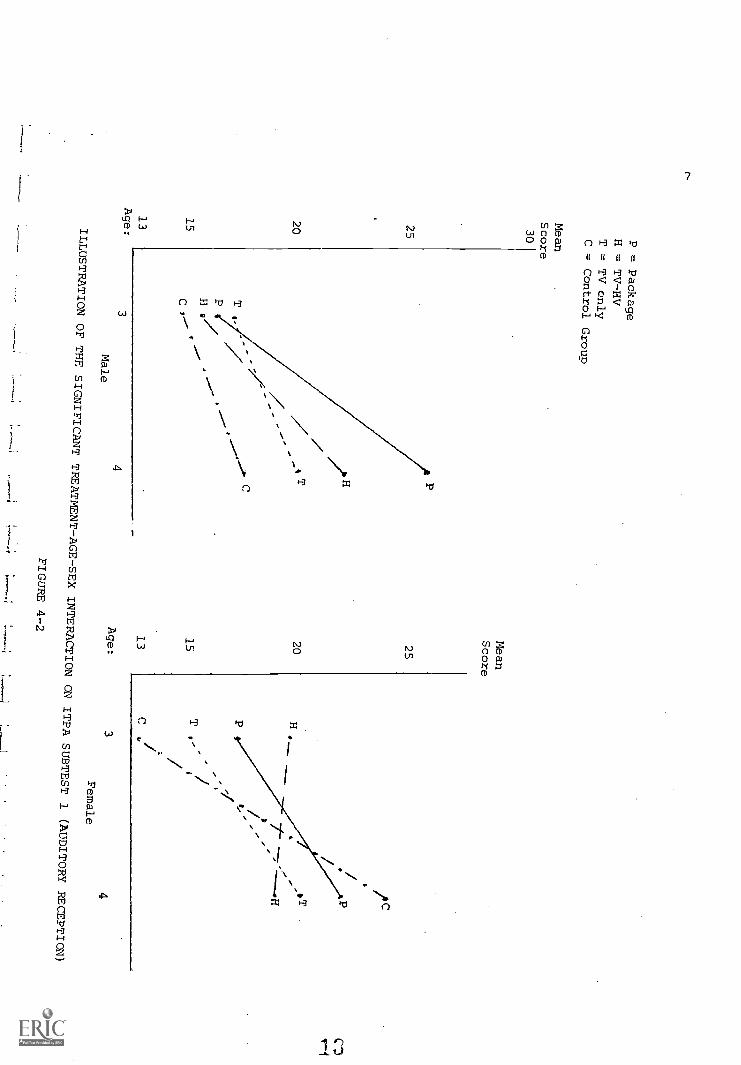
treatment by age and sex i.,1:eraction effect was also present on Subtest 1.
Figure 4-2 illustrates this interaction graphically for males and females
each of the four treatment groups.
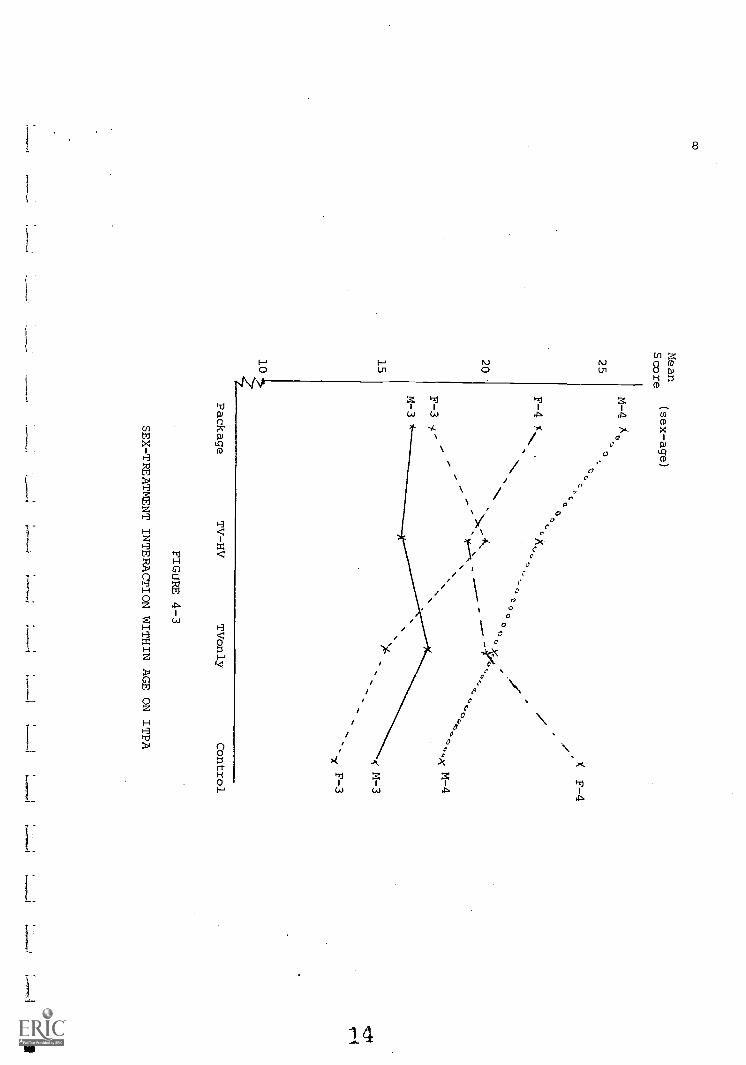
If we separate the four treatments into two groups using the presence
or absence of the home visitor as a criterion for division, Figure 4-3 shows
the superiority of the TV-HV and Package group over the TVonly and Control
groups for four year old males and three year old females. It is possible
that the home visitors reacted differently with the older females in each
group. Also, the four year old females in the comparison group had the
highest Peabody raw score which may account for their relatively supeuior
performance on ITPA Subtest 1.
Figure 4-3 illustrates the sex-treatment interaction for both ages and
sexes and all levels of treatment. Here again we can see the effectiveness
of all three components on the four year old males and the lack of treatment
effects for the three year old males. The females show a much more complex
interaction which is particularly evident in the disparity of the scores of
three and four year olds in the Control group.
Figures 4-4 and 4-5 show the correspondence of PPVT raw scores and ITPA
Subtest 1 raw scores for each sex and age over the four treatment groups.
Although there seems to be a fairly close relationship for the females, the
males show little common variation. In both cases, however, the trend was in .
the same direction -- that is from higher scores for the Package group to
relatively lower scores for the comparison and TVonly groups.
5

Fa:
G.
H
(50) 25
(45) 20
(40) 15
(Rank)
(2)
F -44 if
(3)
- (-4(2)',,
(4)
(1)
PPVT,' ITPA 1
(1)
10
Package TV-HV TVonly Comparison
FIGURE 4-4
PPVT RAW MEAN SCORES OF FOUR YEAR OLD FEMALES SUPERIMPOSED ONTHE ITPA SUBTEST ONE MEAN SCORES
11

(25)50
(20)45
(20)40
35
(3)
PPVT/ (3)
ITPA I(4)
Package TV-HV TV only Comparison
PPVT RAW SCORES OF FOUR YEAR OLD MALESSUPERIMPOSED ON THE ITPA SUBTEST ONE
MEAN SCORES
FIGURE 4-5
11
12
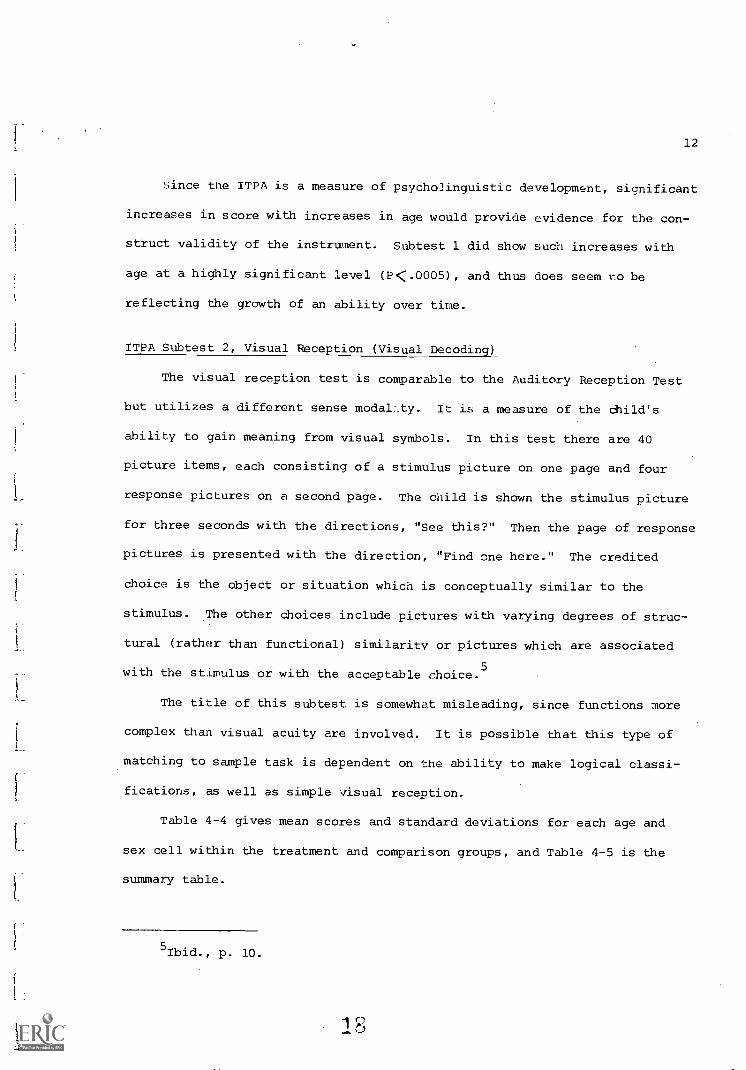
Since the ITPA is a measure of psycho:linguistic development, significant
increases in score with increases in age would provide evidence for the con-
struct validity of the instrument. Subtest 1 did show such increases with
age at a highly significant level (P<.0005), and thus does seem to be
reflecting the growth of an ability over time.
ITPA Subtest 2, Visual Reception (Visual Decoding)
The visual reception test is comparable to the Auditory Reception Test
but utilizes a different sense modalLty. It is a measure of the child's
ability to gain meaning from visual symbols. In this test there are 40
picture items, each consisting of a stimulus picture on one page and four
response pictures on a second page. The child is shown the stimulus picture
for three seconds with the directions, "See this?" Then the page of response
pictures is presented with the direction, "Find one here." The credited
choice is the object or situation which is conceptually similar to the
stimulus. The other choices include pictures with varying degrees of struc-
tural (rather than functional) similarity or pictures which are associated
with the stimulus or with the acceptable choice.5
The title of this subtest is somewhat misleading, since functions more
complex than visual acuity are involved. It is possible that this type of
matching to sample task is dependent on the ability to make logical classi-
[ fications, as well as simple visual reception.
Table 4-4 gives mean scores and standard deviations for each age and
L. sex cell within the treatment and comparison groups, and Table 4-5 is the
summary table.
5Ibid., p. 10.
1 .5

13
TABLE 4-4
ITPA SUBTEST 2 MEANS, STANDARD DEVIATIONS,AND SAMPLE SIZES BY AGE AND SEX WITHIN TREATMENT GROUPS
AgeI
Sex I Package TV-HV TV only Control
R = 12.67 x = 11.78 x = 11.85 = 10.15M SD = 3.67 SD = 5.19 SD = 5.49 SD = 5.80
3 i N= 9 N= 9 N= 13 N= 13x = 15.22 R = 12.60 x = 10.80 x = 11.38
F SD = 5.63 SD = 5.54 SD = 4.13 SD = 4.75N = 9 N = 10 N = 10 N = 13R = 14.92 R = 14.63 x = 14.63 x = 12.11
M SD = 5.77 SD = 7.05 SD = 6.44 SD = 3.664 N= 13 N= 8 N= 8 N= 9
x = 14.80 R = 11.60 R = 13.38 R = 14.30F SD = 4.08 SD = 5.15 SD = 4.56 SD = 7.75
N = 10 N = 10 I N = 13 N = 10
The results for all ages and both sexes are combined graphically in Figure
4-6 and compared with the national norms for this subtest.
TABLE "! -5
ITPA SUBTEST 2 MEAN SCORES AND NATIONALNORMS BY TREATMENT GROUPS
Package TV-HV TV only Control
R = 14.33 R = 12.57 x = 12.56SD = 4.95 SD = 5.59 SD = 5.13N = 40 N = 37 N = 44
= 11.82
SD = 5.68N = 45
19

14.33 13.00Package
12.59 12.00TV -HV
SampleMeans 1
1 National
Norms
12.56 12.00 11.82 11 00TV only Control
FIGURE 4-6
ITPA Subtest 2 (Visual Decoding) Mean Scoresand National Norms by Treatment Groups
14
As can be seen from the above, all groups of children scored slightly
(but not significantly) above the national norms for this subtest. As in
the case of ITPA Subtest 1, little evidence is present here for the intellectual
or perceptual inferiority of children in Appalachia.
The analysis of variance table for Subtest 2 of the ITPA is presented
in Table 4-6.
TABLE 4-6
ANALYSIS OF VARIANCE TABLE FOR ITPA SUBTEST 2
Source eta 2 D.F. Mean Square P
I(trt) .015 3 24.88545805 0.82 NSJ(sex) .000 1 0.0047166723 0.00K(age) .023 1 111.3115834 3.68IJ-INT .012 3 20.01997927 0.66IK-INT .007 3 10.88551579 0.36JK-INT .006 1 32.23751829 1.06IJKINT .010 3 16.53055900 0.54ERROR 150 30.28172170
2

15
The analysis of variance did not reveal any significant main or interaction
effects for this subtest, but the trend to higher scores was evident for
the package and TV-HV groups here as well.
The fact that no significant age effect appeared casts considerable
doubt on the validity of this particular subtest in measuring a develop-
mental aspect of the child's psycholinguistic ability.
ITPA Subtest 3, Auditory-Vocal Association
This measure taps the child's ability to relate concepts presented
orally. In this test the requirements of the auditory receptive process
and the vocal expressive process are minimal, while the organizing process
of manipulating linguistic symbols in a meaningful way is tested by verbal
analogies of increasing difficulty. A sentence completion technique is
used, presenting one statement followed by an incomplete analogous state-
ment, and allowing the child to complete the second statement appropriately.
There are 42 orally presented analogies, such as, "I cut with a saw; I pound
with a ." "A dog has hair; a fish has
Subtest 3 probably is an overall measure of the child's ability to
reason by analogies, as well as his general knowledge of objects and their
functions in the environment.
Table 4-7 indicates mean scores and standard deviations for each age
and sex cell with the four treatment groups.
21

16
TABLE 4-7
ITPA SUBTEST 3 MEANS, STANDARD DEVIATIONS,AND SAMPLE SIZES BY AGE AND SEX WITHIN TREATMENT GROUPS
Age Sex Package TV-HV TV-only Control
X = 14.56 x = 12.89 = 12.46 x = 11.08
M SD = 5.08 SD = 6.79 SD = 6.79 SD = 6.21
3 N= 9 N= 9 N= 13 N= 13
x = 13.89 x = 15.73 R = 11.90 x = 11.08
F SD = 4.65 SD = 6.24 SD = 4.28 SD = 5.53
N = 9 N = 10 N = 10 N = 13
x = 17.92 x = 18.25 x = 13.75 x = 14.78
M SD = 4.82 SD = 2.82 SD = 7.63 SD = 2.63
4 N= 13 N= 8 N= 8 N= 9
R = 18.50 R = 15.50 R = 16.54 x = 16.60
F SD = 4.50 SD = 6.69 SD = 6.60 SD = 5.19
N = 10 N = 10 N = 13 N = 10
These results are combined in Table 4-8 and represented graphically in
Figure 4-7. The latter includes the mean scores of the normative sample in
this age group.
TABLE 4-8
ITPA SUBTEST 3 MEAN SCORES AND NATIONALNORMS BY TREATMENT GROUPS
Package TV-HV TV only Control
x = 16.55 x = 15.51 x = 14.09 x = 13.34
SD = 5.10 SD = 6.00 SD = 6.19 SD = 5.30
N = 40 N = 37 N = 44 N = 45
P`?

20
15
10,
5
0
1
17
SampleMeans
NationalNorms
16.55 15.50 15.51 14.50 14.09 14.50 13.34 13.50
Package TV-HV TV only Control
FIGURE 4- 7
ITPA SUBTEST 3 (AUDITORY-VOCAL ASSOCIATION)MEAN SCORES AND NATIONAL NORMS BY TREATMENT GROUPS
Subtest 3 of the ITPA thus appears to continue the pattern which was
evident throughout the balance of the instrument. Each group tends to score
near or slightly above the national norms for that particular age, and there
is a trend to higher scores for individuals exposed to the entire program
package. Table 4-8 below presents a summary of the analysis of variance
done on this subtest of the ITPA.
TABLE 4-9
ANALYSIS (. VARIANCE TABLE FOR ITPA SUBTEST 3
Source eta2 D.F. Mean Squares F
I(trt) .029 3 57.05480801 1.69
J(sex) .001 1 4.036195198 0.12
K(age) .080 1 467.7392341 13.82 P<.0005
IJ-INT .004 3 7.625972229 0.22
IK-INT .004 3 8.089065620 0.24
JK-INT .000 1 0.9158882076 0.23
IJKINT .019 3 37.05652825 1.10
ERROR 150 33.83038021

18
As can be seen, from the above, neither treatment or sex produced
main effects at a statistically significant level. Age was a highly sig-
nifidant (P.0005) factor in the test, as was expected. It is of interest
that no trend to higher scores for girls appears in this subtest, since
even at this age traditional developmental theory gives females a slight
edge in language development.
ITPA Subtest 4 (Visual-Motor Association)
The organizing process in this channel is tapped by a picture associa-
tion test with which to assess the child's ability to relate concepts
presented visually. The child is presented with a single stimulus picture
surrounded by four optional pictures, one of which is associated with the
stimulus picture. The child is asked, "What goes with this?" (pointing to
the stimulus picture). "Which one of these?" (pointing to the four optional
pictures). The child is to choose the one picture which is most closely
related to the stimulus picture, such as a Rock belonging with a shoe, or a
hammer with a nail. The test is expanded at the upper level to provide
visual analogies comparable to the auditory analogies.. "If this goes with
this" (pointing to each of a preliminary pair of pictures), "then what goes
with this?" (pointing to the central picture as before). The test consists
of 20 items of the simpler form and 22 visual analogies.?
Intuitively, this subtest seems very similar to Auditory Association
(Subtest 3) and the relatively high correlation coefficient of .59 between
the two measures provides empirical evidence for this similarity. In both
cases the child's ability to reason by analogies and previous associations
is being tapped.
7Ibid, p. 10.
19
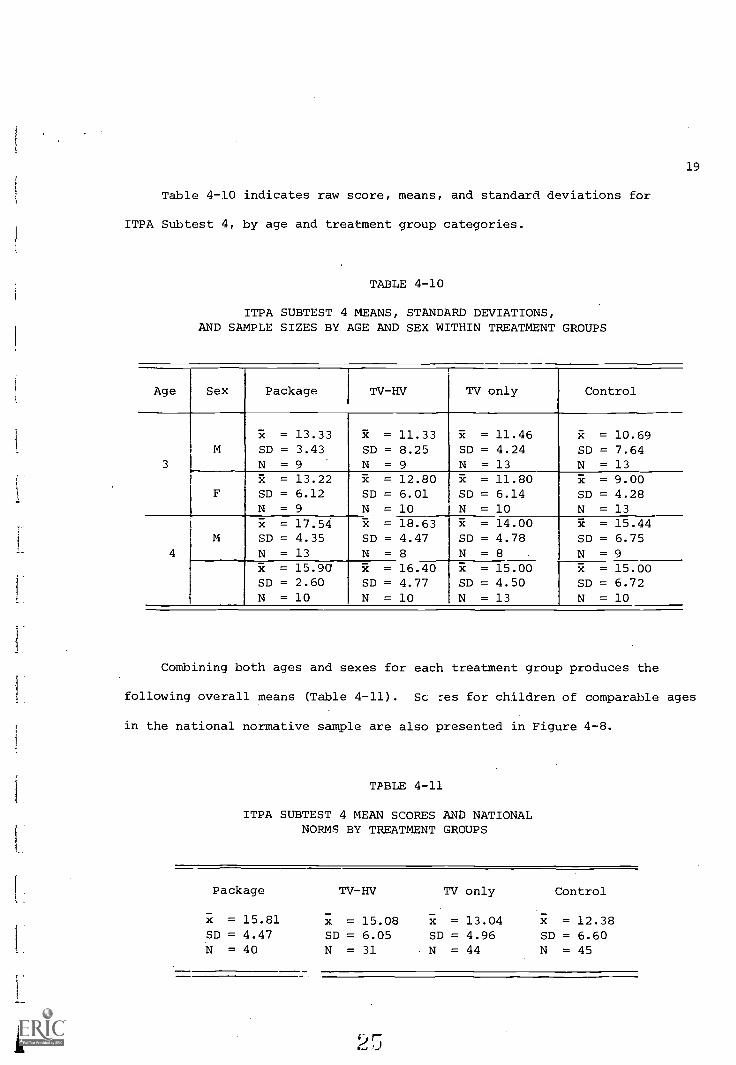
Table 4-10 indicates raw score, means, and standard deviations for
ITPA Subtest 4, by age and treatment group categories.
TABLE 4-10
ITPA SUBTEST 4 MEANS, STANDARD DEVIATIONS,AND SAMPLE SIZES BY AGE AND SEX WITHIN TREATMENT GROUPS
Age Sex Package TV-HV TV only Control
R = 13.33 R = 11.33 R = 11.46 R = 10.69M SD = 3.43 SD = 8.25 SD = 4.24 SD = 7.64
3 N= 9 N= 9 N= 13 N = 13R = 13.22 R = 12.80 R = 11.80 R = 9.00
F SD = 6.12 SD = 6.01 SD = 6.14 SD = 4.28N = 9 N = 10 N = 10 N = 13
il = 17.54 R = 18.63 R = 14.00 R = 15.44M SD = 4.35 SD = 4.47 SD = 4.78 SD = 6.75
4 N= 13 N= 8 N= 8 N= 9
R = 15.90 R = 16.40 R = 15.00 R = 15.00SD = 2.60 SD = 4.77 SD = 4.50 SD = 6.72N = 10 N = 10 N = 13 N = 10
Combining both ages and sexes for each treatment group produces the
following overall means (Table 4-11). Sc res for children of comparable ages
in the national normative sample are also presented in Figure 4-8.
TPBLE 4-11
ITPA SUBTEST 4 MEAN SCORES ANID NATIONALNORMS BY TREATMENT GROUPS
Package TV -HV TV only Control
= 15.81 x. = 15.08 x = 13.04 x = 12.38SD = 4.47 SD = 6.05 SD = 4.96 SD = 6.60N = 40 N = 31 N = 44 N = 45
4
16
12
SampleMeans
NationalNorms
15.81 16.00 15.08 14.00 13.04 14.00 12.38 13.5Package TV-HV TV only Control
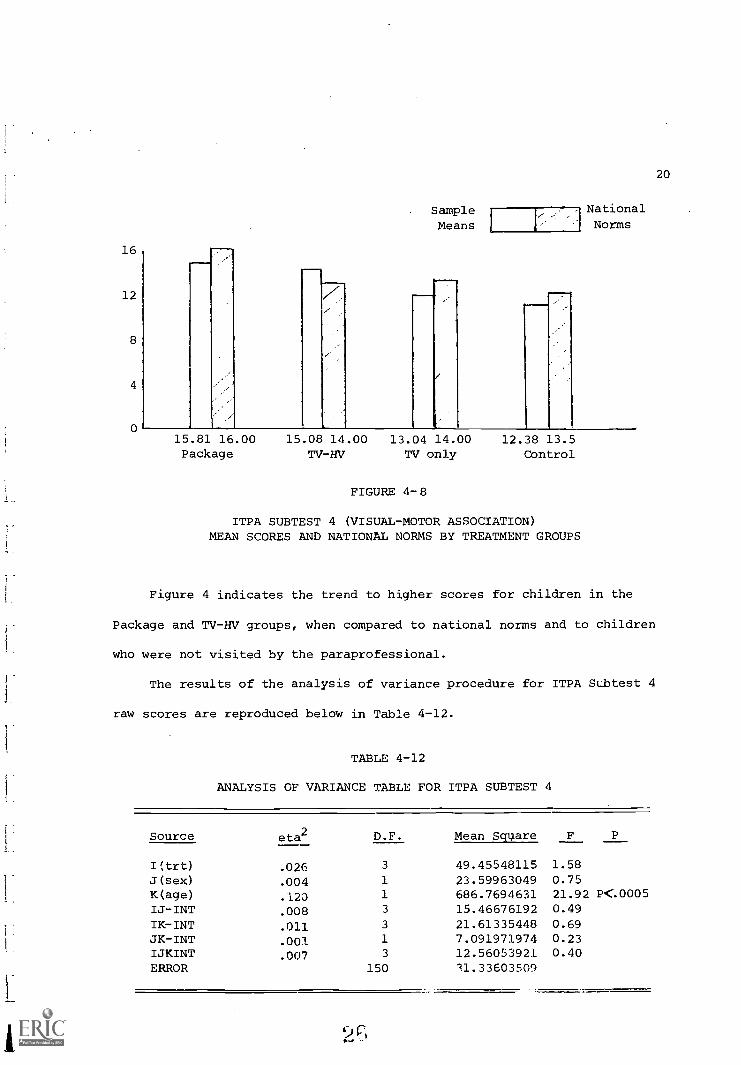
FIGURE 4-8
ITPA SUBTEST 4 (VISUAL-MOTOR ASSOCIATION)MEAN SCORES AND NATIONAL NORMS BY TREATMENT GROUPS
Figure 4 indicates the trend to higher scores for children in the
Package and TV-HV groups, when compared to national norms and to children
who were not visited by the paraprofessional.
The results of the analysis of variance procedure for ITPA Subtest 4
raw scores are reproduced below in Table 4-12.
TABLE 4-12
ANALYSIS OF VARIANCE TABLE FOR ITPA SUBTEST 4
Source eta2 D.F. Mean Square F
I(trt) .026 3 49.45548115 1.58J(sex) .004 1 23.59963049 0.75K(age) .L20 1 686.7694631 21.92 P.00005IJ-INT .008 3 15.46676192 0.49
IK-INT .011 3 21.61335448 0.69JK-INT .001 1 7.091971974 0.23IJKINT .007 3 12.56053921 0.40ERROR 150 11.33603500
2'
20
21
Only age produced a significant main effect (P<.0005), but this lends
validity to the hypothesized developmental nature of the subtest. In t'-is
case also, no significant male-female differences were apparent..
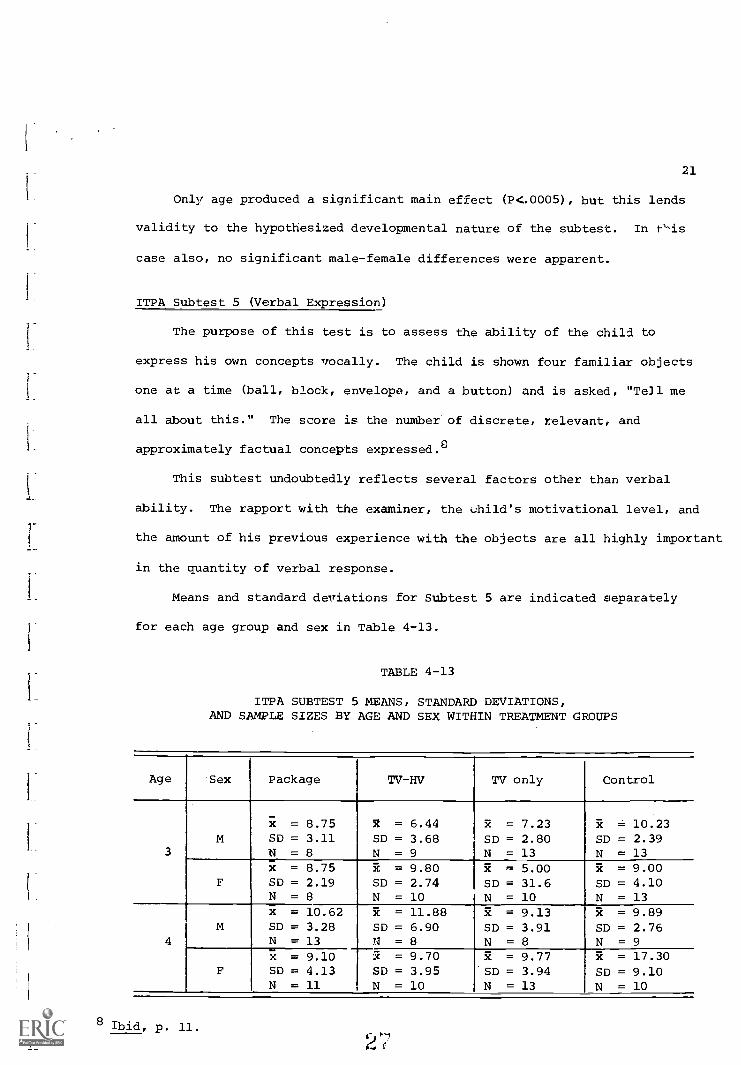
ITPA Subtest 5 (Verbal Expression)
The purpose of this test is to assess the ability of the child to
express his own concepts irocally. The child is shown four familiar objects
one at a time (ball, block, envelope, and a button) and is asked, "TeJl me
all about this." The score is the number of discrete, relevant, and
approximately factual concepts expressed.8
This subtest undoubtedly reflects several factors other than verbal
ability. The rapport with the examiner, the c.hild's motivational level, and
the amount of his previous experience with the objects are all highly important
in the quantity of verbal response.
Means and standard deviations for Subtest 5 are indicated separately
for each age group and sex in Table 4-13.
TABLE 4-13
ITPA SUBTEST 5 MEANS, STANDARD DEVIATIONS,AND SAMPLE SIZES BY AGE AND SEX WITHIN TREATMENT GROUPS
Age Sex Package TV-HV TV only Control
x = 8.75 2 = 6.44 2 = 7.23 R = 10.23M SD = 3.11 SD = 3.68 SD = 2.80 SD = 2.39
3 N= 8 N= 9 N= 13 N= 13R = 8.75 R = 9.80 R = 5.00 R = 9.00
F SD = 2.19 SD = 2.74 SD = 31.6 SD = 4.10N = 8 N = 10 N = 10 N = 13R = 10.62 FE = 11.88 R = 9.13 R = 9.89
M SD = 3.28 SD = 6.90 SD = 3.91 SD = 2.764 N= 13 N = 8 N= 8 N = 9
; = 9.10 R = 9.70 R = 9.77 R = 17.30F SD = 4.13 SD = 3.95 SD = 3.94 SD = 9.10
N = 11 N = 10 N = 13 N = 10
8 Ibid, p. 11.
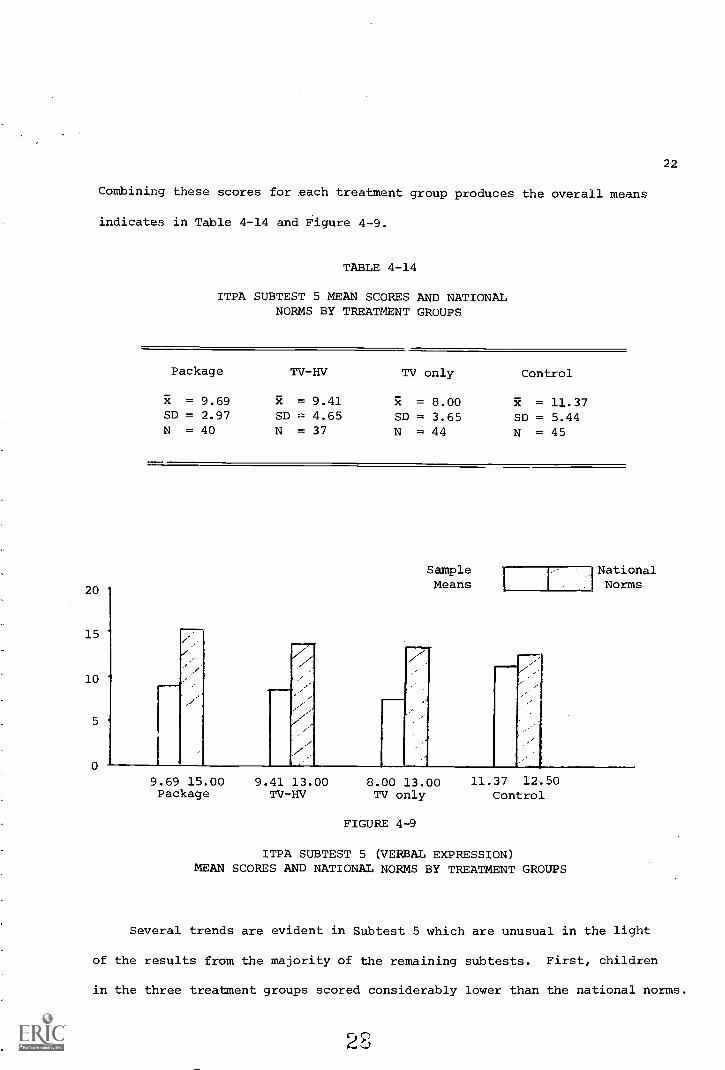
Combining these scores for each treatment group produces the overall means
indicates in Table 4-14 and Figure 4-9.
20
15
10
TABLE 4-14
ITPA SUBTEST 5 MEAN SCORES AND NATIONALNORMS BY TREATMENT GROUPS
Package TV -HV TV only Control
R = 9.69 R = 9.41 R = 8.00 = 11.37SD = 2.97 SD = 4.65 SD = 3.65 SD = 5.44N = 40 N = 37 N = 44 N = 45
SampleMeans
NationalNorms
9.69 15.00Package
9.41 13.00 8.00 13.00 11.37 12.50TV-HV TV only Control
FIGURE 4-9
ITPA SUBTEST 5 (VERBAL EXPRESSION)MEAN SCORES AND NATIONAL NORMS BY TREATMENT GROUPS
22
Several trends are evident in Subtest 5 which are unusual in the light
of the results from the majority of the remaining subtests. First, children
in the three treatment groups scored considerably lower than the national norms.
28

23
And, second, the comparison group scored significantly higher than the
treatment groups. The analysis of variance summary table, presented below
(Table 4-15) illustrates these inferences
TABLE 4-15
ANALYSIS OF VARIANCE TABLE FOR ITPA SUBTEST 5
Source eta2
D.F. Mean Square
I(trt) .056 3 95.05296202 3.76 P<.025J(sex) .017 1 84.74292314 3.36K(age) .131 1 664.2441430 26.31 P1.0005IJ-INT .(J19 3 32.65865934 1.29IK-INT .021 3 35.50957917 1.41JK-INT .000 1 0.1256927372 0.00IJKIN2 .006 3 10.53560919 0.42ERROR 150 25.25012769
In this case, treatment and age produced significant effects on the
raw score for Subtest 5 of the ITPA. A post-hoc comparison utilizing the
Scheffe test, indicated the difference favoring the Control group in com-
parison to the TVonly group, produced a significant contribution to the
treatment effect.
It is difficult to explain both the overall depression of scores for
the three treatment groups and the comparative elevation of scores for chil-
dren in the comparison group. It is possible that differences existed in
tester training for this measure or that the comparison group differed in
some aspects of home environment from the chiidren exposed to the program
components.
The most likely explanation is that the children in the three treatment
groups are representative of the children in rural Appalachia in their
expressive abilities, and that children in the comparison group more closely
resemble the national norms in this respect.
9
24
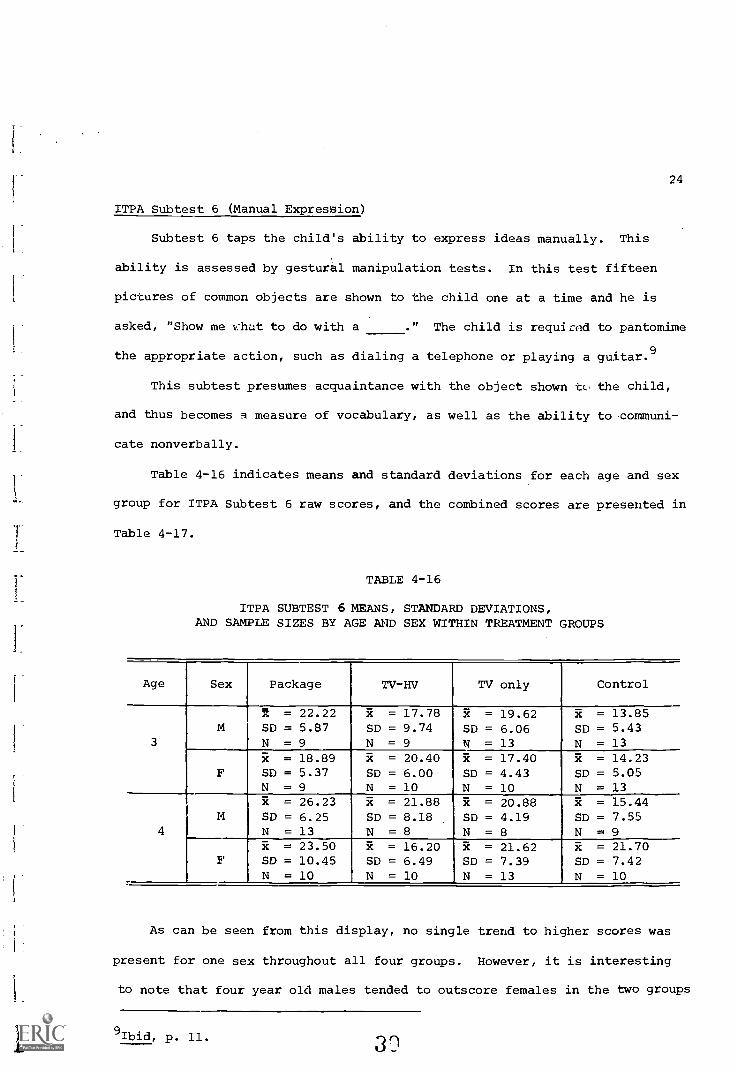
ITPA Subtest 6 (Manual Expression)
Subtest 6 taps the child's ability to express ideas manually. This
ability is assessed by gestural manipulation tests. In this test fifteen
pictures of common objects are shown to the child one at a time and he is
asked, "Show me what to do with a ." The child is required to pantomime
the appropriate action, such as dialing a telephone or playing a guitar.9
This subtest presumes acquaintance with the object shown tc, the child,
and thus becomes a measure of vocabulary, as well as the ability to communi-
cate nonverbally.
Table 4-16 indicates means and standard deviations for each age and sex
group for ITPA Subtest 6 raw scores, and the combined scores are presented in
Table 4-17.
TABLE 4-16
ITPA SUBTEST 6 MEANS, STANDARD DEVIATIONS,AND SAMPLE SIZES BY AGE AND SEX WITHIN TREATMENT GROUPS
Age Sex Package TV-HV TV only Control
ft = 22.22 x = 17.78 x = 19.62 x = 13.85M SD = 5.87 SD = 9.74 SD = 6.06 SD = 5.43
3 N= 9 N= 9 N= 13 N= 13
ii = 18.89 R = 20.40 x = 17.40 31 = 14.23F SD = 5.37 SD = 6.00 SD = 4.43 SD = 5.05
N = 9 N = 10 N = 10 N = 13R. = 26.23 R = 21.88 Ft = 20.88 x = 15.44
M SD = 6.25 SD = 8.18 SD = 4.19 SD = 7.554 N = 13 N = 8 N = 8 N = 9
x = 23.50 R = 16.20 R = 21.62 R = 21.70F SD = 10.45 SD = 6.49 SD = 7.39 SD = 7.42
N = 10 N = 10 N = 13 N = 10
As can be seen from this display, no single trend to higher scores was
present for one sex throughout all four groups. However, it is interesting
to note that four year old males tended to outscore females in the two groups
9Ibid, p. 11. 32

25
visited by the paraprofessional, while this trend is reversed in the two
remaining groups.
25
20
15-
10-1
TABLE 4-17
ITPA SUBTEST 6 MEAN SCORES AND NATIONALNORMS BY TREATMENT GROUPS
Package TV-HV TV only Control
= 23.05SD = 7.65N = 40
= 17.49SD = 7.11N = 37
= 17.93SD = 5.71N = 44
= 17.16SD = 7.90N = 45
Sample
MeansNationalNorms
23.05 17.00 17.49 16.00 17.93 16.00 17.16 16.00Package TV-HV TV only Control
FIGURE 4- 10
ITPA SUBTEST 6 (MANUAL EXPRESSION)MEAN SCORES AND NATIONAL NORMS BY TREATMENT GROUPS
Figure 4 -10 indicates the large al_? significant (P(.025) difference between
the treatment groups and the comparison. It also shows the relatively high
31

26
level of performance of these children when compared to the national norms.
As an example, children in the Package group scored as highly as did indivi-
duals almost two years older in the national norms.
These inferences are clarified in Table 4-18 which presents a summary
of the analysis of variance procedure for Subtest 6.
TABLE 4-18
ANALYSIS OF VARIANCE TABLE FOR ITPA SUBTEST 6
Source eta2 D.F. Mean Square
I(trt) .078 3 229.0346593 4.80 P .025J(sex) .001 1 8.245994401 0.17K(age) .040 1 350.3404769 7.33 P .0005IJ-INT .030 3 89.39034888 1.87IK-INT .008 3 22.87959922 0.48JK-INT .000 1 0.1807230504 0.00IJKINT .025 3 71.91810046 1.50ERROR 150 47.76273181
A Scheffe post-hoc comparison reveals that the significant (P .025)
main effect of treatment favors the Package in comparison to the TV-HV,
TVonly and Control groups. This is attributable to the emphasis placed
on pantomime and "acting out" stories, by the van teacher and the parapro-
fessionals.
It is likely that purely verbal measures of intelligence (such as the
PPVT) tend to underestimate the I.Q. level of rural and underprivileged
10children, as was pointed out by Rosenberg. His views are given relevance
to children in the Appalachian region by the findings of Hooper and Marshall,11
10Rosenberg, Leon - The J.H.P.T: Its Development and Current Status as a
Measure of Intellectual Functioning. Prepublication Draft for the DisadvantagedChild, Vol. 2, 1969, Special Child Publications, Seattle, Washington.
11Hooper and Marshall, 212_. Cit., p. 32.

27
who showed mean differences of nearly ten points in I.O. between the PPVT
and the more broadly based Stanford-Binet.
By circumventing the verbal channel of communication, the children are
displaying more of their innate ability and knowledge of concepts by communi-
cating by pantomime.
ITPA Subtest 7 (Grammatic Closure)
This subtest assesses the child's ability to make use of:
The redundancies of oral language in acquiring automatic habitsfor handling syntax and grammatic inflections. In this test theconceptual difficulty is low, but the task elicits the child'sability to respond automatically to often repeated verbal ex-pressions of standard American speech. The child comes to expector predict grammatic form so that when part of an expression ispresented he closes the gap by supplying the missing parts. Thetest measures the form rather than the content of the missingword, since the content is provided by the examiner.
There are 33 orally presented items accompanied by pictureswhich portray the content of the verbal expression. The picturesare included to avoid contamiaating the test with difficulty inthe receptive process. Each verbal item consists of a completestatement followed by an incomplete statement to be finished bythe child. The examiner points to the appropriate picture as hereads the given statements; for example: "Here is a dog; here
1112are
Essentially, Subtest 7 measures the ability to follow the conventional
rules of grammar and make single-plural and possessive transformations. Pilot
data gathered by Hooper and Marshall indicate that children in the Appalachian
region showed large defects in this area of functioning, as did children in
other "deprived" regions.13
Mean raw scores and standard deviations for age and sex cells on ITPA
Subtest 7 are presented in Table 4-19, and means for combined groups are
given in Table 4-20.
12Kirk and McCarthy, 22. Cit., p.11.
13Hooper and Marshall, 222 Cit., p. 89.
3 3

28
TABLE 4-19
ITPA SUBTEST 7 MEANS, STANDARD DEVIATIONS,AND SAMPLE SIZES BY AGE AND SEX WITHIN TREATMENT GROUPS
Age Sex Package TV-HV TV only Control
= 9.11 = 9.56 x = 8.00 R = 9.62M SD = 5.11 SD = 5.27 SD = 4.28 SD = 4.03
3 N = 9 N = 9 N = 13 N = 13.
R = 9.44 R = 12.20 R = 8.60 x = 7.69F SD = 5.75 SD = 4.66 SD = 3.37 SD = 3.77
N = 9 N = 10 N = 10 N = 13
x = 13.92 x = 14.75 x = 7.25 x = 12.11M SD = 5.60 SD = 5.39 SD = 3.01 SD = 3.30
4 N= 13 N= 8 N= 8 N = 9
x = 11.10 x = 12.40 x = 12.15 x = 14.40F SD = 4,20 SD = 4.95 SD = 7.72 SD = 5.32
N = 10 N = 10 N = 13 N = 10
These mean scores are combined and graphically presented in Figure 4-11
along with the means of children of comparable age in the national normative
sample.
TABLE 4-20
ITPA SUBTEST 7 MEAN SCORES AND NATIONALNORMS BY TREATMENT GROUPS
Package TV-HV TV only Control
= 11.28 = 12.16 = 9.44 = 10.86SD = 5.51 SD = 6.16 SD = 5.30 SD = 4.52N = 40 N = 37 N = 44 N = 45

15
10
SampleMeans
NationalNorms
11.28 11.00Package
12.16 10.00TV -HV
9.44 10.00 10.86 9.00TV only Control
FIGURE 4-11
ITPA SUBTEST 7 (GRAMMATIC CLOSURE)MEAN SCORES AND NATIONAL NORMS BY TREATMENT GROUPS
29
Inspection of the relative height of these figures indicates that Subtest
7 provides another example of the ECE sample group exceeding the national
norms. The lower scores for the TV only group is consistent with the score
pattern evident throughout most of the battery.
Table 4-21 provides further evidence for these differences through a
summary of the analysis of variance procedure which was applied to the raw
scores from Subtest 7.
TABLE 4-21
ANALYSIS OF VARIANCE TABLE FOR ITPA SUBTEST 7
Source eta2
D.F. Mean Square F_I(trt) .045 3 70.03365775 2.80 P.05J(sex) .001 1 5.944823235 0.23K(age) .071 1 328.6685537 13.12 P<.0005IJ-INT .021 3 31.83897364 1.27IK-INT .012 3 18.66772990 0.74JK-INT .000 1 0.7043026914 0.03IJKINT .044 3 68.30950624 2.73 P.05ERROR 150 25.04687827
rt r3
15
10
5
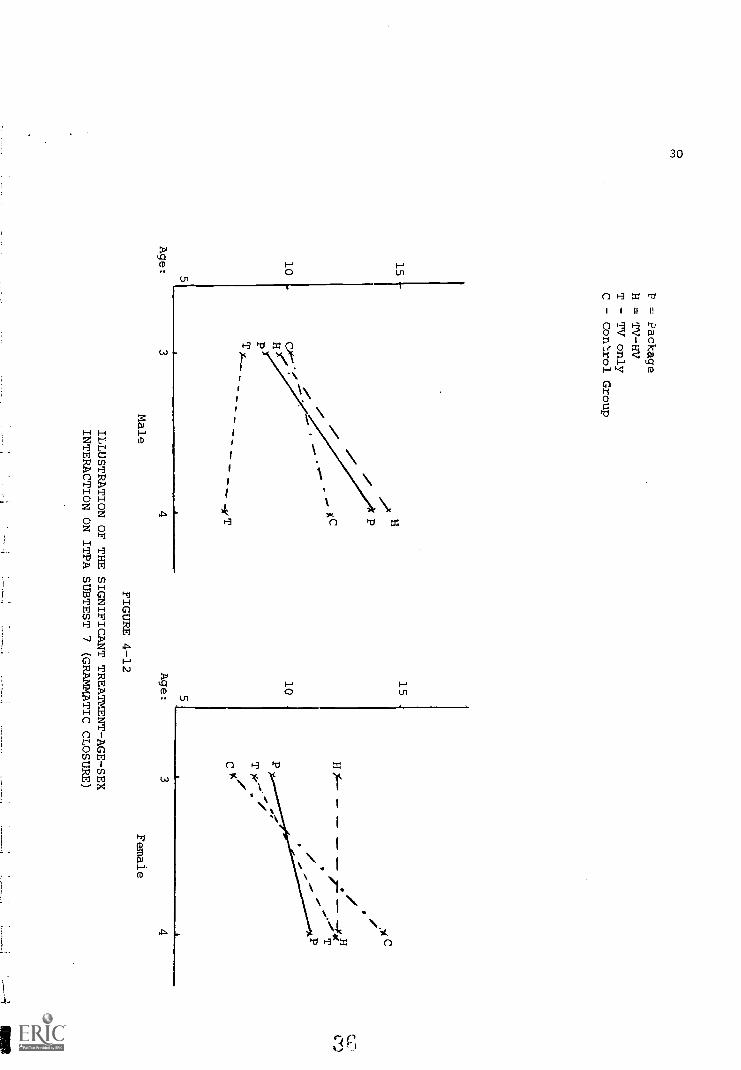
Age:
P = Package
H = TV-HV
T - TV only
C - Control Group
4
Male
FIGURE 4-12
15
10
5
Age:
HS
PT ?c,
C
3
ILLUSTRATION OF THE SIGNIFICANT TREATMENT-AGE-SEX
INTERACTION ON ITPA SUBTEST 7 (GRAMMATIC CLOSURE)
Female
4

31
The highly significant (P<.005) age effect is expected throughout the
ITPA. A post-hoc comparison did not reveal any single pair of comparisons
which were significant. However, the main effect of treatment which is
evident seems to result from the disparity between the TV-HV and Package
groups when compared to the TVonly and Control groups. Since one of the
main purposes of the paraprofessional is to provide a model for the child's
language behavior, it is likely that she has had an effect in raising these
scores.
A signiacant age, sex and treatment interaction is present in the
program's effects on grammar as measured by Subtest 7. Figure 4-10 illus-
trates this interaction graphically for both males and females in each of
the four treatment groups. As for Subtest 1 the home visitor group four year
old males seem to be showing the greatest treatment effect. The home visitor
group females do not show increases with age for this particular measure. This
graphical representation clearly indicates the program's differential effective-
ness on age-sex combinations.
ITPA Subtest 8 (Visual Closure)
This test is designed to measure:
The child's ability to identify a common object from an incompletevisual presentation. There are four scenes, presented separately,each containing 14 or 15 examples of a specified object. Theobjects are seen in varying degrees of concealment. The child isasked to see how quickly he can point to all examples of a particularobject within a time limit of 30 seconds for each scene. 14
This measure probably involves few central mediating processes (cognition)
and provides an estimate of the child's motivation and attentiveness, as well
as his visual acuity.
Table 4-22 indicates raw score means obtained by each age and sex sub-
grouping on ITPA Subtest 8. Combined score means are presented as Table 4-23,
and representing them graphically produces Figure 4-13, in which national norms
are also presented.
1 4Ibid., p. 12.

15
10'
TABLE 4-22
ITPA SUBTEST 8 MEANS, STANDARD DEVIATIONS,AND SAMPLE SIZES BY AGE AND SEX WITHIN TREATMENT GROUPS
Age Sex Package TV-HV TV only Control
3
M
R =
SD =N =
12.002.299
51 =
SD =N =
9.89
5.169
51 =
SD =N =
11.38
3.6613
R =
SD =N =
9.771.94
1
R = 8.33 51 = 9.80 51 = 11.60 51 = 11.62F SD = 3.04 SD = 4.18 SD = 4.25 SD = 5.03
N = 9 N = 10 N = 10 N = 13
31 = 14.00 5i = 13.25 51 = 13.88 51 = 15.22M SD = 4.04 SD = 4.17 SD = 3.36 SD = 9.98
4 N= 13 N= 8 N = 8 N= 9
51 = 15.80 51 = 14.70 51 = 14.62 51 = 20.60F SD = 2.74 SD = 7.06 SD = 5.11 SD = 7.88
N = 10 N = 10 N = 13 N = 10
TABLE 4-23
ITPA SUBTEST 8 MEAN SCORES AND NATIONALNORMS BY TREATMENT GROUPS
Package TV-HV TV only Control
R = 12.89 x = 11.89 R = 12.84 R = 13.80SD = 4.16 SD = 5.56 3D = 4.33 SD = 8.69N = 40 N = 37 N = 44 N = 45
SampleMeans
32
NationalNorms
12 89 14 00 11 89 13 00 12.84 13 00 13 80 12 00Package TV-HV TV only Control
FIGURE 4-13
ITPA SUBTEST 8 (VISUAL CLOSURE)MEAN SCORES AND NATIONAL NORMS BY TREATMENT GROUPS
(-1P

33
The fact that all treatment groups scores at essentially the same level,
provides evidence that these children are functioning at the same level of
motivation and visual discrimination.
Table 4-24 below presents the analysis of variance data for Subtest 8.
TABLE 4-24
ANALYSIS OF VARIANCE TABLE FOR ITPA SUBTEST 8
Source eta D.F. Mean Square F
I(trt) .026 3 47.22397700 1.73J(sex) .004 1 20.90570617 0.76K(age) .150 1 819.8685021 30.00 P<.0005IJ-INT .029 3 52.22436931 1.91IK-INT .021 3 38.90092937 1.42JK-INT .012 1 63.64592392 2.33IJKINT .004 3 8.264058789 0.30ERROR 150 27.33185574
No treatment or sex effects were evident on Subtest 8 but age proved to
be a major factor in causing score differences. As has been mentioned pre-
viously, this provides validation of the developmental nature of the
instrument.
ITPA Subtest 9 (Auditory Sequential Memory)
The purpose of this test is to:
Assess the child's ability to reproduce from memory sequencesof digits increasing in ]ergth from two to eight digits. Thetest differs from the digit repetition task of the Stanford-Binet or the WISC in that the digits are presented at the rateof two per second instead of one per second and in that thechild is allowed a second trial of each sequence if he failson the first presentation. He receives more credit for asuccess on the first than on the second trial. A more rapidpresentation makes the task easier, which is necessary for thetwo and the three year old children. 15
lb id., p. 12-13.

34
Although he format of this subtest differs slightly from that used
on the Wechsler scales or the Stanford-Binet, it duplicates the type of
function measured on those instruments. That is, it estimates the child's
ability to use immediate recall of recently learned auditory sequences.
This type of measure does not involve much cognitive (analytic) activity
but is sensitive to outside distractions and anxiety level.
Table 4-25 presents means, standard deviations, and numbers of subjecis
for Subtest 9. The combined means are given in Table 4-26.
TABLE 4-25
ITPA SUBTEST 9 MEANS, STANDARD DEVIATIONS,AND SAMPLE SIZES BY AGE AND SEX WITHIN TREATMENT GROUPS
Age Sex Package TV-HV TV only Control
x = 17.78 x = 14.89 x = 16.92 x = 17.46M SD = SD = 8.39 SD = 8.12 SD = 7.69
3 N= 9 N= 9 N= 13 N= 13
x = 13.44 TE = 16.90 51 = 17.40 Sc = 13.85F SD = 7.75 SD = 5.51 SD = 6.95 SD = 9.67
N = 9 N = 10 N = 10 N = 13
x = 21.23 x = 20.50 R = 18.25 R = 18.11M SD = 8.56 SD = 7.50 SD = 10.81 SD = 7.57
4 N= 13 N= 8 N= 8 N= 9
R = 19.70 x = 21.10 x = 19.77 x = 18.40F SD = 2.95 SD = 6.72 SD = 7.62 SD = 7.63
N = 10 N = 10 N = 13 N = 10
The scores are also combined in Figure 4-14 which also presents graphical
representation of normative scores for this subtest.
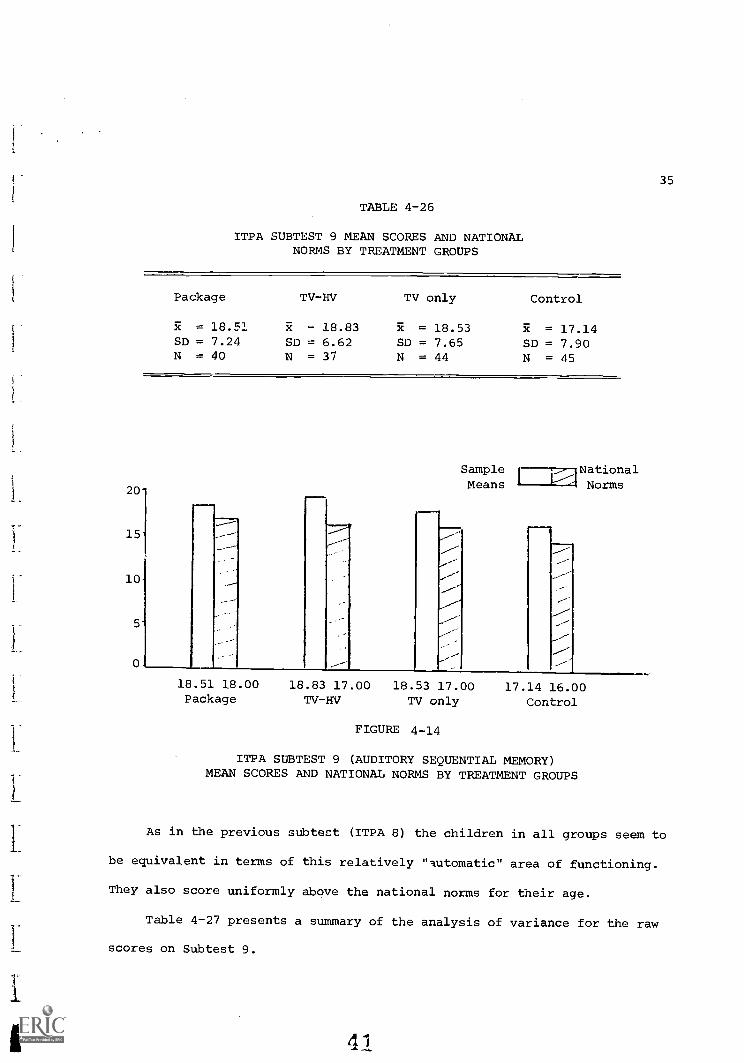
TABLE 4-26
ITPA SUBTEST 9 MEAN SCORES AND NATIONALNORMS BY TREATMENT GROUPS
Package TV-HV TV only Control
= 18.51 - 18.83 = 18.53 = 17.14SD = 7.24 SD = 6.62 SD = 7.65 SD = 7.90N = 40 N = 37 N = 44 N = 45
20
15
10
5.
0
...SampleMeans I
18.51 18.00 18.83 17.00 18.53 17.00Package TV-HV TV only
FIGURE 4-14
NationalNorms
17.14 16.00Control
ITPA SUBTEST 9 (AUDITORY SEQUENTIAL MEMORY)MEAN SCORES AND NATIONAL NORMS BY TREATMENT GROUPS
35
As in the previous subtect (ITPA 8) the children in all groups seem to
be equivalent in terms of this relatively "automatic" area of functioning.
They also score uniformly above the national norms for their age.
Table 4-27 presents a summary of the analysis of variance for the raw
scores on Subtest 9.
4

36
TABLE 4-27
ANALYSIS OF VARIANCE TABLE FOR ITPA SUBTEST 9
Source eta D.F. Mean Square
0.250.397.270.890.300.190.20
I (trt)
J(sex)K(age)
IJ-INTIK-INTJK-INTIJKINTERROR
.005
.002
.045
.016
.006
.001
.004
3
1
1
3
3
1
3
150
15.5513262623.79503270447.038756454.9200854918.6606757511.7822893912.0378463461.46082271
P<.01
In this case, only one major effect was evident, that fc.,r age, which is
expected throughout the instrument.
The uniform trend to scores slightly above the norm provides evidence
for the good quality of rapport which was present during testing. If the
examiner had provoked high levels of anxiety, it is likely that these scores
would have been substantially reduced.
ITPA Subtest 10 (Visual Sequential Memory)
According to the authors:
This test assesses the child's ability to reproduce sequences ofnonmeaningful figures from memory. A child is shown each sequenceof figures for five seconds and then is asked to put correspondingchips of figures in the same order. Here again the child isallowed two trials on each sequence when the first attempt is un-successful. The sequence increases in length from two to eightfigures.16
Subtest 10 measures the same short-term memory as the previous subtest,
but does so in terms of visual configurations, rather than auditory sequencing.
It is subject to the same influences and intervening factors as that of Sub-
test 9.
16Ibid., p. 13.

37
Means, standard deviations, and numbers of subjects are presented in
Table 4-28, which includes each age and sex cell in the four groups analyzed.
Table 4-29 is a presentation of means for each treatment group, and combining
these scores and comparing them graphically with the normative sample for the
ITPA produces Figure 4-15.
TABLE 4-28
ITPA SUBTEST 10 MEANS, STANDARD DEVIATIONS,AND SAMPLE SIZES BY AGE AND SEX WITHIN TREATMENT GROUPS
Age Sex Package TV-HV TV only Control
51 = 7.00 R = 7.44 R = 6.85 51 = 4.85M SD = 3.77 SD = 3.81 SD = 3.91 SD = 3.91
3 N= 9 N = 9 N= 13 N= 13
R = 8.1] 51 = 10.20 51 = 6.20 R = 8.15F SD = 5.04 SD = 4.16 SD = 4.05 SD = 6.71
N = 13 N = 10 N = 10 N = 13
51 = 9.54 R = 11.50 R = 9.13 R = 12.11M SD = 5.04 SD = 2.67 SD = 5.49 SD = 7.74
4 N= 13 N= 8 N= 8 N= 9
51 = 9.40 51 = 16.10 51 = 9.92 R = 13.30F SD = 2.67 SD = 7.46 SD = 3.73 SD = 6.36
N = 10 N = 10 N = 13 N = 10
TABLE 4-29
ITPA SUBTEST 10 MEAN SCORES AND NATIONALNORMS BY TREATMENT GROUPS
Package TV-HV TV only Control
= 8.94 = 11.72 = 9.05 51 = 9.55SD = 4.20 SD = 5.52 SD = 3.45 SD = 6.72N = 40 N = 37 N = 44 N = 45

15
10
38
Sample i -_TationalMeans i i Norms
8.94 13.00 11.72 12.00 9.05 12.00Package TV-HV TV only
FIGURE 4-15
9.55 11.00Control
ITPA SUBTEST 10 (VISUAL SEQUENTIAL MEMORY)MEAN SCORES AND NATIONAL NORMS BY TREATMENT GROUPS
The considerable discrepancy between national norms and the ECE sample
is evident in the figure above. It is extremely difficult to present ex-
planations which could account for this apparent deficit in visual memory,
and is particularly difficult in light of the sample group's performance on
the remainder of the test battery. The most likely hypothesis is that this
subtest is perhaps the most difficult to administer and score of the entire
battery, and that a significant examiner factor reduced the overall scores
of the group.
The analysis of variance summary table is presented for Subtest 10 in
Table 4-30.
cid

39
TABLE 4-30
ANALYSIS OF VARIANCE TABLE FOR ITPA SUBTEST 10
Source eta2 D.F. Mean Square
I(trt) .056 3 95.05296202 3.76 P .025J(sex) .017 1 84.74292314 3.36K(age) .131 1 664.2441430 26.31 P .00
IJ-INT .019 3 32.65865934 1.29IK-INT .021 3 35.50957917 1.41JK-INT .000 1 0.1256927372 0.00IJKINT .006 3 10.53560919 0.41ERROR 150 25.25012769
The large and significant effects of treatment and sex are equally
difficult to explain. A post-hoc comparison of group means did not indicate
any single pair of significant differences. Although age effects are expected
for all measures of developmental factors, it is not likely that depressed
scores for the Package group are due to pure treatment effects.
ITPA Total Raw Score
The total score for all ten subtests is presented below in Table 4-31
for each age and sex cell of the four treatment groups.
TABLE 4-31
ITPA TOTAL RAW SCORE MEANS, STANDARD DEVIATIONSAND SAMPLE SIZES BY AGE AND SEX WITHIN TREATMENT GROUPS
Age Sex Package TV-HV TV only Control
R = 132.88 R = 118.22 R = 123.31 R = 113.08
M SD = 26.90 SD = 45.54 SD = 34.78 SD = 33.72
3 N= 8 N= 9 N= 13 N= 13
R = 124.13 R = 140.50 R = 116.50 R -- 109.15
F SD = 3.63 SD = 38.02 SD = 35.61 SD = 29.91
N = 8 N = 10 N = 10 N = 13
R = 172.15 R = 167.75 R = 141.38 R = 143.33
M SD = 27.36 SD = 39.08 SD = 38.62 SD = 35.27
4 N= 13 N= 8 N= 8 N= 9
R = 160.10 R = 155.10 R = 153.00 R = 176.00
F SD = 23.59 SD = 38.69 SD = 34.24 SD = 51.05
N = 10 N = 10 N = 13 N = 10
40
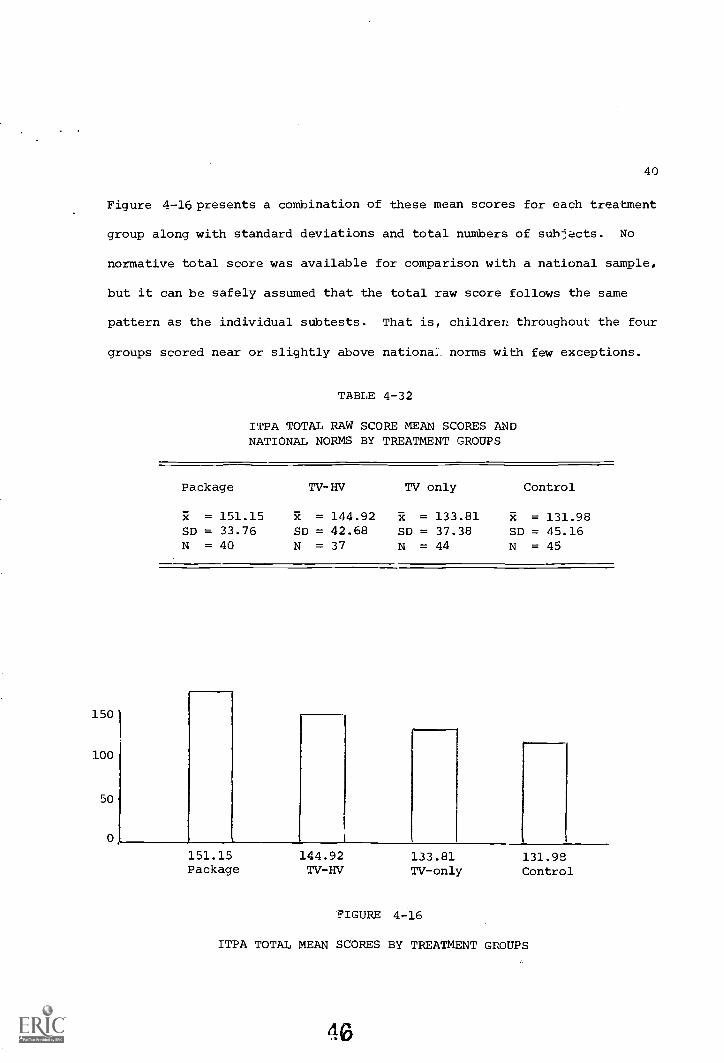
Figure 4-16 presents a combination of these mean scores for each treatment
group along with standard deviations and total numbers of subjects. No
normative total score was available for comparison with a national sample,
but it can be safely assumed that the total raw score follows the same
pattern as the individual subtests. That is, children throughout the four
groups scored near or slightly above national. norms with few exceptions.
150
100
50
0
TABLE 4-32
ITPA TOTAL RAW SCORE MEAN SCORES ANDNATIONAL NORMS BY TREATMENT GROUPS
Package TV -'HV TV only Control
= 151.15 R = 144.92 R = 133.81 R = 131.98SD = 33.76 SD = 42.68 SD = 37.38 SD = 45.16N = 40 N = 37 N = 44 N = 45
151.15Package
144.92TV-HV
133.81 131.99TV-only Control
'FIGURE 4-16
ITPA TOTAL MEAN SCORES BY TREATMENT GROUPS
46

41
The differences which appear in the overall raw, score means are not
statistically significant. However, the continuing trend which they
represent, which is evident throughout the ten ITPA subtests, is increasingly
indicative of program effects which are present but not being precisely
tapped.
Table 4-33 presents the summary of the analysis of variance procedure
which was performed on the total ITPA raw score.
TABLE 4-33
ANALYSIS OF VARIANCE TABLE FOR ITPA TOTAL RAW SCORE
Source eta2 D.F. Mean Square F
I(trt) .015 3 1386.633021 0.97J(sex) .000 1 38.37488222 0.03K(age) .170 1 47848.98859 33.60 P4.0005IJ-INT .019 3 1815.543056 1.28IK-INT .010 3 975.6609285 0.68JK-INT .000 1 3.129962914 0.00IJKINT .028 3 2686.089878 1.89ERROR 150 1423.895898
As is evident from the table above, only age produced a significant main
effect on the ITPA total test. While this in itself does not validate the
instrument, it does provide evidence for the developmental nature of the
test, and for the content validity of the other significant effects which
were uncovered.
Summary of Results
Although the ITPA did not correspond closely to AEL's Early Childhood
Education Program curriculum objectives, it was decided to use the ITPA as
a data gathering instrument which would indirectly measure program effects.
A "

42
All but one of the ten subtests showed significant increases with age,
a fact which lends credi7aility to the developmental nature of the test.
Surprisingly, few significant sex effects were present despite the fact
that traditional developmental theory places girls of this age (3-4 1/2
years) slightly ahead of their male counterparts in language shills. Also,
the majority of the subtests showed all of the sample groups to be scoring
near or above national norms. This finding runs contrary to the view that
Appalachian children are behind their age peers in the rest of the nation
in terms of language development.
One significant exception to the above occurred in the results of Sub-
test 5, which measures expressive '.anguage ability. Here, all the groups
scored well below the national norms, and the TV only group produced the
lowest scores of all the samples. Although no empirical evidence was
available to explain this trend, it seems likely that a rural Appalachian
environment has a great effect on the child's ability to express himself
verbally in a relatively unstructured situation. Since the TV only group
tended to have a more rural environment, and differed only in this respect
from the other treatment groups' socio-economic status, this is the most
likely explanation for their differing performance.
Other significant treatment effects Indicated that children who received
all three program components wEre more able to express themselves nonverbally
(by gestures and pantomime) than were children in the comparison group, and
that the TV-HV group was more able to make correct grammatical transformations
than the TV only group.
Although only a few measures included in the ITPA showed significant
treatment effects, eight of the ten subtests administered and the total test
raw score showed a trend to increasingly higher scores for children who
4S

43
received more of the program components. The consistency of these trends
indicates that the Early Childhood Education Program is having an effect on
a broad range of psycholinguistic abilities.
dr)