Embed Size (px)
Citation preview

DOCUMENT RESUME
ED 071 239 EC 050 514
AUTHOR Moores, Donald F.; McIntyre, Cynthia K.TITLE Evaluation of Programs for Hearing Impaired Children:
Report of 1970-71. Research Report #27.TNSTITUTION Minnesota Univ., Minneapolis. Research, Development,
and Demonstration Center in Education of HandicappedChildren.
SPONS AGENCY Bureau of Education for the Handicapped (DHEW/OE),Washington, D.C.
BUREAU NO BR-332189PUP DATE Dec 71GRANT OEG -09- 332189 -4533 (032)NOTE 139p.
EDRS PRICE MF-$0.65 HC-$6.58DESCRIPTORS Administrative Organization; *Aurally Handicapped;
*Early Childhood Education; Educational Facili.ties;*Educational Programs; Equipment Utilization;*Exceptional Child Research; Manual Communice.-A, 1;Oral Communication; Personnel; Preschool Children;*Program Descriptions; Program Evaluation; StucentEvaluation
ABSTRACTThe study, based on L. Cronbach's Characteristics by
Treatment Interaction model, investigated seven preschool programsfor aurally handicapped children which variously employed theoral-aural method, the Rochester method, or the total communicationmethod. Equipment, materials, grouping procedures, and activitieswere indicated for each program. Programs were compared for degree ofparent involvement, adequacy of facilities and personnel,administrative organization of services, pupil populations, anddegree of program structure. One hundred and two children from theprograms were selected as the sample population. Data were reportedfrom the Leiter Performance Test, the Illinois Test ofPsycholinguistic Abilities, classroom observation, communicationanalysis, pupil records, the Brown Parent Attitude Scale, and asemantic differential measuring parent attitudes towards conceptsrelated to deafness. Conclusions such as the following were drawn:children in structured programs tended to have higher IQ scores thanthose in unstructured programs; gestures were the most common mode ofcommunication between children, regardless of the program's officialmethodology; communication from child to teacher most frequentlyinvolved the oral aural mode; and no differences were found inspeechreading abilities in the oral-combined andstructured-unstructured comparisons. (GW)

FILMED FROM BEST AVAILABLE COPY
RESEARCH REPORT #27
Project No. 332189Grant No. 0E-09-332189-4533 (032)
EVALUATION OF PROGRAMS FOR HEARING
IMPAIRED CHILDREN: Report of 1970-71
Donald F. Moores and Cynthia K. McIntyreUniversity of Minnesota
Research, Development and DemonstrationCenter in Education of Handicapped Children
Minneapolis, Minnesota
December 1971
Department of Health, Education and Welfare
U. S. Office of Education
Bureau of Education for the Handicapped

T2THNIOditZ, REPORTS
University of Minnesota Research, Development arid DemonstrationCenter in Education of Handicapped Children
(Place of publication shown in parentheses where applicable.)
1. D. Feldman. The Fixed-Sequence Hypothesis: Individual Differences in the Development of SchoolRelated Spatial Reasoning. Research Report 1 /1, March, 1970.
2. D. Feldman & W. Markwalder. Systematic Scoring of Ranked Distractors for the Assessment ofPiag,tian Reasoning Levels. Research Report #2, March, 1970. (Educatiorel and PsychologicalMeasurement, 1971, 31, 347-362.)
3. D. Moores. Evaluation of Preschool Programs: An Interaction Analysis Mode.. Occasional Paper 01.April, 1970. (Keynote Address, Diagnostic Pedagogy, Intcarnational Congress on Deafness.Stockholm, August 1970, also presented at American Instructors of the Deaf Annual Convention,St. Augustine, Florida, April, 1970).
4. J. Turnure. Reactions to Physical and Social Distractors b" Moderately Retarded InstitutionalizedChildren. Research Report 03. June, 1970. Journal of Special Educaticn, 1970, 4, 283-294.
5. J. Turnure, J. Rynders, & N. Jones. Effectiveness of Manual Guidance, Modeling & Trial & ErrorLearning for Inducting Instrumental Behavior in Institutionalized Retardates. ResearchReport #4. June, 1970.
6. J. Turnure & M. Walsh. The Effects of Varied Levels of Vernal Mediatio: on the Learning &Reversal of Paired-Associates by Educable Mentally RetardeG Childran. Research Report #5.June, 1970. (Study I: American Journal of Mental Deficiency, 1971, 76, 60-67. Study II:American Journal of Mental Deticiency, 1971 in press).
7. R. Martin & L. Berndt. The Effects of Time-Out on Stuttering in a 12-year-old Boy, ResearchReport ?6. July, 1970. (Exceptional Children, 1970, 37, 303-304).
8. J. Turnure, M. Thurlow, & S. Larsen. Syntactic Elaboration in the Learning & Reversal of Paired-Associates by Young Children. Research Report 07, January, 1971.
9. D. Feldman & J. Bratton. On the Relativity of Giftedness: An Empirical Study. Research Report 08.Aug., 1970. (American Educational Research Annual Conference, N. Y., February, 1971.
10. R. Rubin & B. Balow. Prevalence of School Learning & Behavior Disorders in a LongitudinalStudy Poptlation. Research Report 09. October, 1970. (Exceptional Children, 1971, 38,293-299).
11. R. Rubin. Sex Differences in Effects of Kindergarten Attendance on Development of SchoolReadiness and Language Skills. Research Report / /10. October, 1970, (Elementary School
Journal in press).
12. R. Bruininks & W. Lucker. Change and Stability in Correlations Between Intelligence andReading Test Scores Among Disadvantaged Children. Research Report 011. October, 1970.(Journal of Reading Behavior, 1970, 2, 295-305)
13. R. Bruininks. Teaching Word Recognition to Disadvantaged Boys with Variations in Auditory
and Visual Perceptual Abilities. Research Report #12. November, 1970. (Journal of LearningDisabilities, 1970, 3, 30-39)
14. R. Bruininks & C. Clark. Auditory and Visual Learning in First Grade Educable MentallyRetarded Normal Children. Research Report 013. November, 1970. (American Journal of MentalDeficiency, in press)
15. R. Bruininks & C. Clark., !auditory and Visual Learning_ in First-, Third-, and Fifth-Grade
Children. Research Report 014. November 1970.
16. D. Moores. Education of the Deaf in the United States*, Occasional Paper 02. November,
1970. (Moscow Institute 04 Defectology, 1971, Published in Russian)
17. J. Rynders. Industrial Arts for Elementary Mentally Retarded Children: An Attempt to Rede-
fine and Clarify Goals. Occasional Paper 03. January, 1971.
18. D. Feldman. Map Understanding as a Possible Crystallizer of Cognitive Structures. Occasional
Paper 04. January, 1971. (American Educational Research Journal, 1971, 3, 484-502)
19. P. Broen & G. Siegel. Variations in Normal Speech Disfluencies. Research Report 1115.
January, 1.971 (Language & Speech, in press)
20. D. Feldman, B. Marrinan, & S. Hartfeldt. Unusualness, Appropriateness, Transformation and
Condensation as Criteria for Crearivity". Research Report 016. February, 1971. (American
Educational Research Association Annual Conference, New York, February 1971)
21. D. Moores. Neo-Oralism and the Education of the Deaf in the Soviet Union. Occasional Paper 05.
February, 1971. (Exceptional Children, January, 1972)

RESEARCH REPORT i/27
Project No. 332189Grant No. 0E-09-332189-4533 (032)
EVALUATION OF PROGRAMS FOR HEARING
IMPAIRED CHILDREN: Report of 1970-71
Donald F. Moores and Cynthis K. McIntyreUniversity of Minnesota
Research, Development and DemonstrationCenter in Education of Handicapped Children
University of MinnesotaMinneapolis, Minnesota
December 1971
The research reported herein was performed pursuant to a
grant from the Bureau of Education for the Handicapped,U. S. Office of Education, Department of Health, Education,and Welfare to the Center of Research and Development inEducation of Handicapped Children, Department of SpecialEducation, University of Minnesota. Contractors undertakingsuch projects under government sponsorship are encouragedto express freely their professional judgment in theconduct of the proje,t. Points of view or opinions stateddo not, therefore, necessarily represent official positionof the Bureau of Education for the Handicapped.
Department of Health, Education and Welfare
U. S. Office of Education
Bureau of Education for the Handicapped
U S DEPARTMENT OF HEALTH.EDIZATION & WELFAREOFFICE OF EDUCATION
THIS DOCUMENT HAS BEEN REPROOUCEO EXACTLY AS RECEIVED FROMTHE PERSON OR ORGANIZATION ORIGINATING 'T POINTS OF VIEW OR OPINIONS STATED DO NOT NECESSARILYREPRESENT OFFICIAL OFFICE OF EOUCATIOI. OSITION OR POLICY
RESEARCH AND DEVELOPMENT CENTERIN EDUCATION OF HANDICAPPED CHILDRENDepartment of Special Education
Pattee Hall, University of 1V1;;mesota, Minneapolis, Minnesota 55455
The University of Minnesota Research, Development and Demonstration
Center in Education of Handicapped Children has been established to
concentrate on intervention strategies and materials which develop and
improve language and communication skills in young handicapped children.
The long term objective of the Center is to improve the language
and communication abilities of handicapped children by means of iden-
tification of linguistically and potentially linguistically handicapped
children, development and evaluation of intervention strategies with
young handicapped children and dissemination of findings and products
of benefit to young handicapped children.

Acknowledgements
The authors would like to thank the following people at each
program who were especially helpful during the research visits in
1970-71: Caroline Halberg, American School for the Deaf; Kay Horton
and Beverly Stanton, Bill Wilkerson Hearing and Speech Center; Dr.
Judy Burroughs and Dorine Cunningham, Callier Hearing and Speech
Center; Jayne Nelson, Pat Kennedy &Harriet Kaplan, Minneapolis Public
School System; Koz Bradford and Donna Groves, New Mexico School for
the Deaf; Jan Proehl and Sandy Bakken, St. Paul Tilden School. We
would also like to thank Judi Masoner, Audrey Buhr and DeAnna Gehant
for their assistance with data tabulation and preparation of the
manuscript.
Very special thanks go to Karin Eyles for her extensive work
piloting and modifying various tests, reviewing relevant literature,
preparing materials and collecting data. In general, she deserves
credit for the often tedious and difficult initial phases of the
project.
i

TABLE OF CONTENTS
Page
Acknowledgements
Table of Contentsii
List of Tablesiii
List of Figures
Introduction1
Description of Programs 6
Methodologies18
Program Information. 20
Subject Selection 24Etiology and Onset 27Amplification 28Teachers and Supportive Staff 28
Description and Results of Testing
Leiter Performance Test31
Illinois Test of Psycholinguistic Abilities36
Classroom Observation48
Communication Analysis 56
brown Parent Attitude Scale69
Semantic Differential82
Summary96
Future Plans99
References102
Appendices
A. Classroom Cbservation Form 106
B. Classroom Observation Statements by Categories 117
C. Brown Parent Attitude Scale 119
D. Page from Semantic Differential 129
ii
LIST OF TABLES
Td1)1(.
1 Pupil information
2 Administrative Organization of Services
3 Age of Onset of Loss
4 Etiological Diagnosis
5 Breakdown of Programs by Teachers,Supportive Staff,
and Certification
6 Program "Teachers by Certification, Advanced Degrees,
Length of Time with Program and Previous Work
Experience
7 Leiter Performance Test
8 Illinois Test of Psycholinguistic Abilities
9 Comparison of ITPA Scores by Structuredand Unstructured
Programs
10 Classroom Observation Ratings of Communication
Modes by Program
11 Percent of Words Children Uttered Spontaneously,
Imitated, Attempted, or Failed to Attempt
by Program
12 Speech Assignment by Programs to Predominant
Class of Response
13 Proportion of Correct Responses on Nine Speech Items by
Programs and Length of Enrollment
14 Breakdown of Correct and Incorrect Speechreading
Items by Programs
15 Specchreading Assignment by Programs to Predominant
Class of Response
iii
29
30
33
39
47
52
59
60
62
64
66

LIST OF TABLES (Continued)
TablePage
16 Proportion of Correct Responses on Speechreading
Items by Programs and Length of Enrollment 67
17 Parent Information from Brown Attitude Scale 71
18 Parent and Child Information from Brown
Attitude Scale72
19 The Number of Physicians or Specialists Visited
before Hearing Loss was Identified 73
20 Person Originally Visited by Parents when
Hearing Loss was Suspected 74
21 Diagnosis Given Other than Hearing Loss7:,-
22 Summary of Questions on which Only One Group
of Parents Differed79
23 Analysis of Variance: Combined versus Oral Group I . 85
24 Analysis of Variance: Combined versus Oral Grcup II. 86
25 Analysis of Variance: Oral Group I versus Oral
Group II87
26 Analysis of Variance: Structured I versus
Unstructured 91
27 Analysis of Variance: Structured II versus
Unstructured 92
28 Analysis of Variance: Structured I versus
Structured II 93
iv

LIST OF FIGURES
Figure Pale
1 Overall Mean Scores on the ITPA by Subtest 40
2 ITPA Scores of Children in Combined and
Oral Programs 43
3 ITPA Subtest Scores by Etiology of Deafness 44
4 Mean Score on ITPA Subtests by Amount Structuring . 46
5 Semantic Differential: Deaf-Related Concepts by
Combined and Oral Programs 89
6 Semantic Differential: Deaf-Related Concepts by
Structured and Unstructured Programs 95

EVALUATION OF PROGRAMS FOR HEARING
IMPAIRED CHILDREN: Report of 1970-71
Donald F. Moores and Cynthia K. McIntyre
University of Minnesota
In the fall of 1969, the University of Minnesota Research,
Development and Demonstration Center provided support for planning
activities designed to evaluate the effectiveness of preschool
programs for deaf children. The impetus for such a study comes from
a number of sources. First, it is well known that high school age
students of present educational programs are shamefully undereducated.
Secondly, normal deaf adolescents and young adults in North America
and Europe are unable to read at the fifth grade level (Furth, 1966;
Norden, 1970; Wrightstone, Aranow, and Moskowitz, 1963), lack basic
linguistic skills (Moores, 1970a; Simmons, 1962; Tervoort and Verbeck,
1967) and are incapable of expressing and receiving oral communication
on anything but a primitive level (Montgomery, 1966; Report of the
Chief Medical Officer of the British Department of Education and
Services, 1964).
Consistent with the trends in general education, increasing
numbers of educators of the deaf have come to look at the preschool
years as being the cornerstone for later development, and the last
decade has witnessed a proliferation of preschool intervention programs
designed to minimize or eliminate educational and communication deficits.
1
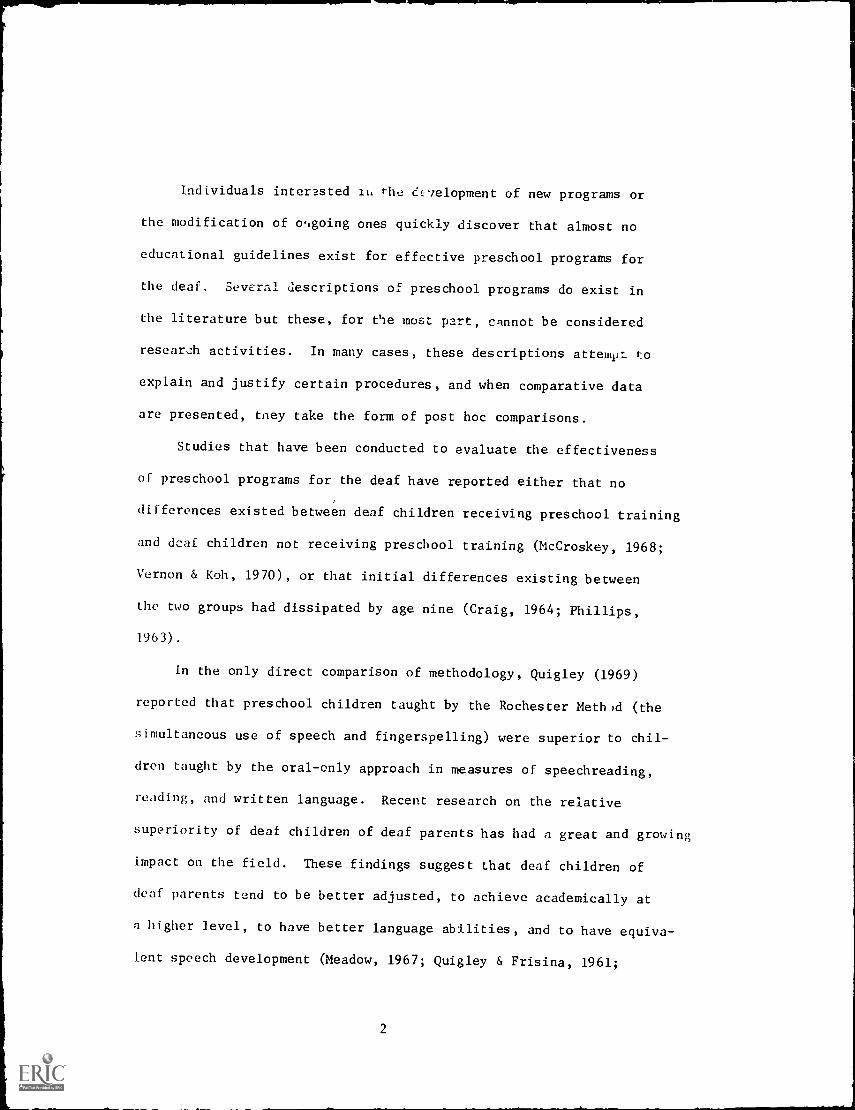
Individuals interested iii. the dEelopment of new programs or
the modification of o,,going ones quickly discover that almost no
educational guidelines exist for effective preschool programs for
the deaf. Several descriptions of preschool programs do exist in
the literature but these, for the most part, cannot be considered
research activities. In many cases, these descriptions attemvI to
explain and justify certain procedures, and when comparative data
are presented, toey take the form of post hoc comparisons.
Studies that have been conducted to evaluate the effectiveness
of preschool programs for the deaf have reported either that no
differences existed between deaf children receiving preschool training
and deaf children not receiving preschool training (McCroskey, 1968;
Vernon & Koh, 1970), or that initial differences existing between
the two groups had dissipated by age nine (Craig, 1964; Phillips,
1963).
In the only direct comparison of methodology, Quigley (1969)
reported that preschool children taught by the Rochester Meth'd (the
simultaneous use of speech and fingerspelling) were superior to chil-
dren taught by the oral-only approach in measures of speechreading,
reading, and written language. Recent research on the relative
superiority of deaf children of deaf parents has had a great and growing
impact on the field. These findings suggest that deaf children of
deaf parents tend to be better adjusted, to achieve academically at
a higher level, to have better language abilities, and to have equiva-
lent speech development (Meadow, 1967; Quigley & Frisina, 1961;
2

Stevenson, 1964; Stuckiess & Birch, 1966: Vernon & Koh, 1970) in re-
lationship to deaf children of hearing parents.
In view of the above findings in favor of deaf children of deaf
parents (which may have been the result of an exp igns from
birth), and because studies of oral-only programs have shown no dif-
ferences or only temporary effects, it has been argued that many
preschool programs have failed because they have been restricted to
oral-only instruction (Vernon & Koh, 1971). Perhaps, then, the
addition of manual communication would improve results. Such reasoning
has led to the development of many recent preschool programs utilizing
a system, named Total Communication, which involves the use of signs,
fingerspelling, and oral communication.
Although the evidence of the superiority of deaf children of
deaf parents is substantial, it does not necessarily follow that
the use of manual communication in preschool programs will produce
better results. At present, no data exist on the comparative
efficiency of the use of Total Communication as opposed to either
an oral-only method or the Rochester Method.
This lack of data may u. traced to . primary concerns. First
is the extreme difficulty 1.-; evaluating t!lc effectiveness of preschool
programs which is further confounded by the added dimension of
deafness. Second, and perhaps an even more inhibiting factor, is the
highly emotional nature of the question of methodology with young
deaf children. In a report to the Secretary of Health, Education and
Welfare (Babbidge, 1965), it was noted that for more than 100 years
emotion has served as a substitute for research in the education
3
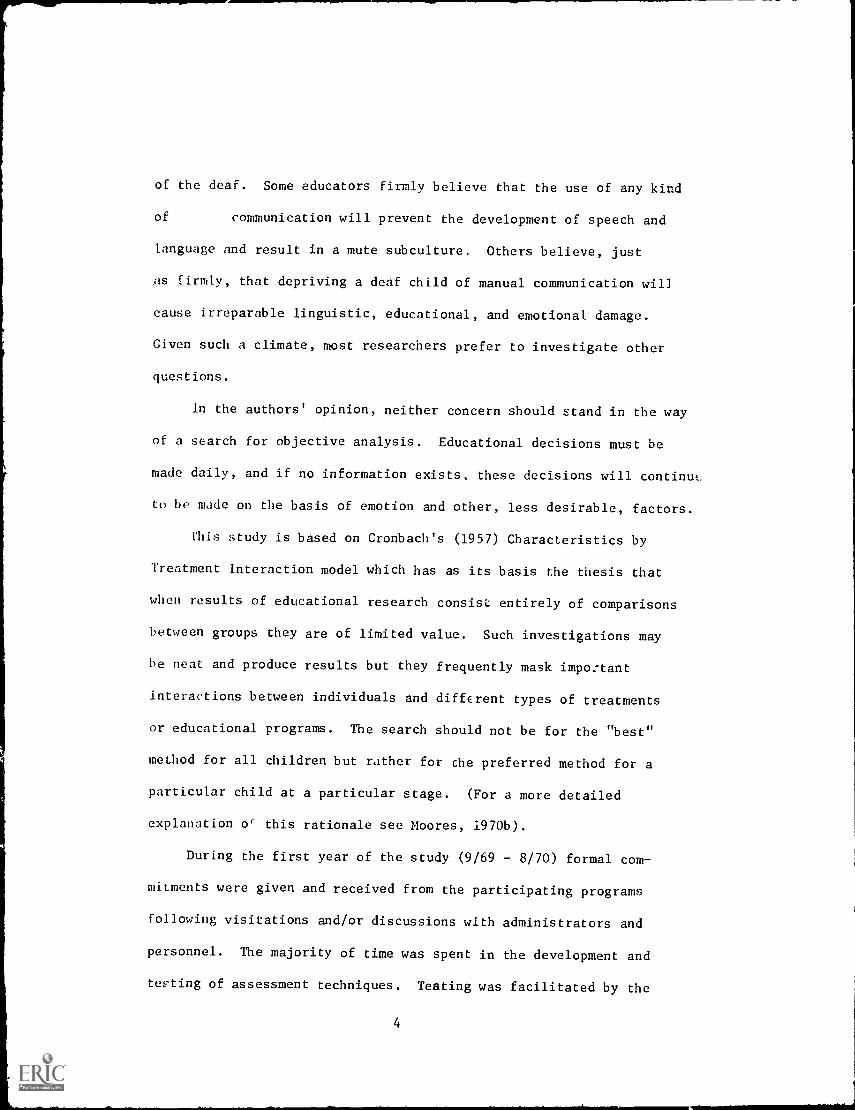
of the deaf. Some educators firmly believe that the use of any kind
of communication will prevent the development of speech and
language and result in a mute subculture. Others believe, just
as firmly, that depriving a deaf child of manual communication will
cause irreparable linguistic, educational, and emotional damage.
Given such a climate, most researchers prefer to investigate other
questions.
In the authors' opinion, neither concern should stand in the way
of a search for objective analysis. Educational decisions must be
made daily, and if no information exists, these decisions will continut
to be made on the basis of emotion and other, less desirable, factors.
Phis study is based on Cronbach's (1957) Characteristics by
Treatment Interaction model which has as its basis the thesis that
when results of educational research consist entirely of comparisons
between groups they are of limited value. Such investigations may
be neat and produce results but they frequently mask important
interactions between individuals and different types of treatments
or educational programs. The search should not be for the "best"
method for all children but rather for the preferred method for a
particular child at a particular stage. (For a more detailed
explanation or this rationale see Moores, 1970b).
During the first year of the study (9/69 - 8/70) formal com-
mitments were given and received from the participating programs
following visitations and/or discussions with administrators and
personnel. The majority of time was spent in the development and
teFting of assessment techniques. Testing was facilitated by the
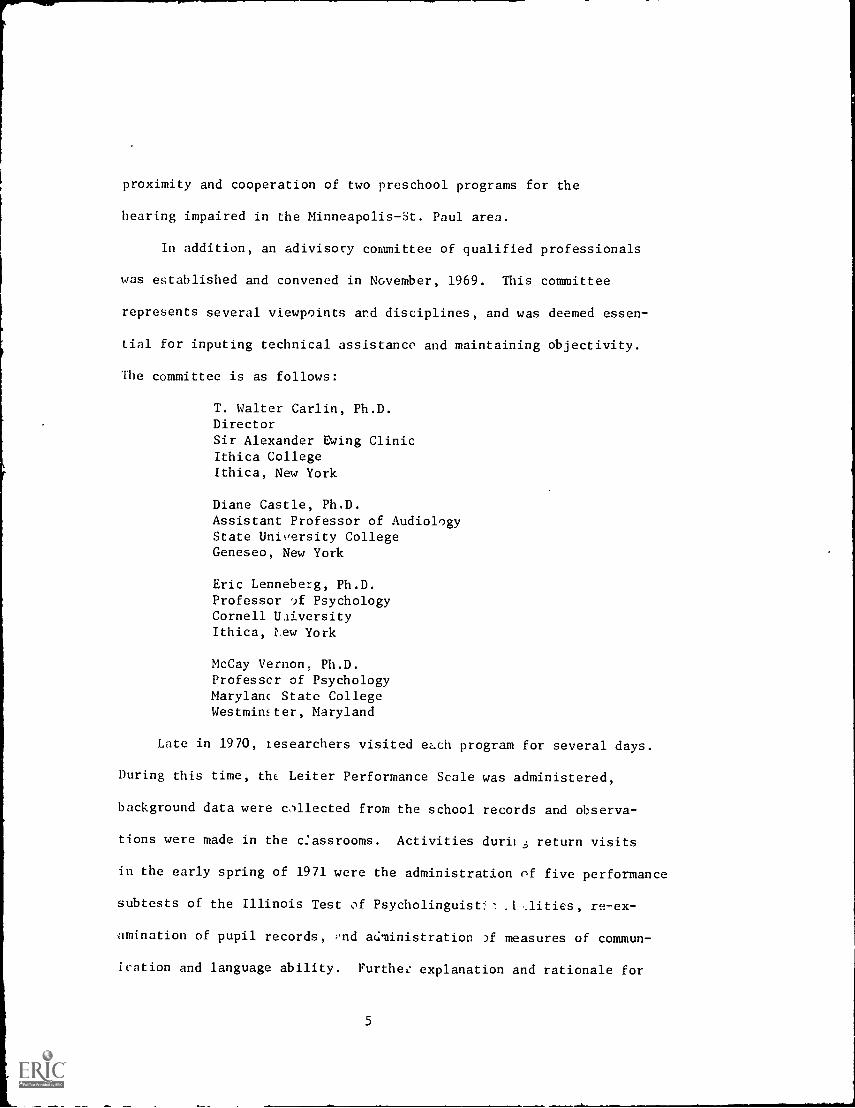
proximity and cooperation of two preschool programs for the
hearing impaired in the Minneapolis-St. Paul area.
In addition, an adivisory committee of qualified professionals
was established and convened in November, 1969. This committee
represents several viewpoints and disciplines, and was deemed essen-
tial for inputing technical assistance and maintaining objectivity.
The committee is as follows:
T. Walter Carlin, Ph.D.DirectorSir Alexander Ewing ClinicIthica CollegeIthica, New York
Diane Castle, Ph.D.Assistant Professor of AudiologyState University CollegeGeneseo, New York
Eric Lenneberg, Ph.D.Professor PsychologyCornell UliversityIthica, l',ew York
McCay Vernon, Ph.D.Professcr of PsychologyMarylanc State CollegeWestminster, Maryland
Late in 1970, researchers visited etch program for several days.
During this time, the Leiter Performance Scale was administered,
background data were ualected from the school records and observa-
tions were made in the c2assrooms. Activities duril.; return visits
in the early spring of 1971 were the administration of five performance
subtexts of the Illinois Test of Psycholinguistf. .1 ,litics, re-ex-
-amination of pupil records, ;11d administration 3f measures of commun-
ication and language ability. Further explanation and rationale for
5
the above measures will be presented later.
Description of Programs
Each program is considered a strong representation of a parti-
cular preschool model. Background information is presented in
Table 1. Programs were chosen on the basis of willingness to partici-
pate in a longitudinal study, adequately large preschool etrLllments
and a diversity of educational methodologies. Some attention was
also paid to geographic location. It should be noted, at this point,
that the administrators are under no obligation to maintain any or
uIl aspects of their respective programs for the duration of this
research. They are requested only to continue to provide what they
consider to be an effective preschool program for hearing impaired
children.
The participating programs, presented alphabetically, and
their locations are as follows:
American School for the DeafHartford, Connecticut
Bill Wilkerson Hearing and Speech CenterNashville, Tennessee
Callier Hearing and Speech CenterDallas, Texas
Minneapolis Public School ProgramMinneapolis, Minnesota
New Mexico School for the DeafSanta Fe & Albuquerque, New Mexico
Rochester School for the DeafRochester, New York
St. Paul Public School ProgramSt. Paul, Minnesota
6

Table 1
Pupil Information
Program
Male
Female
Program
Total
Mean Age
In Months,
9/30/71
Number with
Hearing Aids
Number Receiving
Prior Training
American School
for the Deaf
14
317
47.73
86
Bill Wilkerson
Hearing Center
49
13
48.00
13
2
Callier Hearing &
Speech Canter
15
520
46.84
20
10
Minneapolis Public
School System
17
219
44.70
18
7
New Mexico School
for the Deaf
66
12
45.25
11
0
Rochester School
for the Deaf
76
13
51.38
912
St. Paul Tilden
School
35
845.42
85
Totals
66
36
102
87
42

American School for the Deaf
The classrooms are located in a building specifically designed
for preschool deaf children. In addition to classroom and recrea-
tional facilities it contains a dormitory, kitchen and dining
facilities. The-children in the sample attend classes in three large
rooms, two have adjoining smaller rooms for individual speech tutoring
and also private bathroom facilities. Parts of the roots are newly
carpeted.
Equipment and Materials. The classes are equipped with a wide
variety of materials. These include a housekeeping corner, charts of
different shapes, readiness materials, books, blocks, art supplies,
jungle gym and wheel toys. There are many tables and chairs reflecting
the large class size.
Grouping and Activities. Infant Program. Two teachers alternate
days with the four children. Both teachers meet at the beginning of
the month to prepare lesson plans. The function of these teachers is
to prepare the young children for entry into one of the nursery
classes. Classroom activities include color and shape matching,
alphabet recognition, and some experiential activity to build vocabu-
lary And language skills.
Nursery I and II. The program combines academic and socializa-
tion pctivities. The children ',lave reading groups and math but they
also paint, play with blocks, and take naps. Free play activities
are linked to language and diverse enriching experiences. The
children are active and spontaneous and the teachers often direct
events subtly without placing restrictions on the pupils. Activities
8

are made available by the teachers who know the children well and
attempt to give each one a positive experience. Although the teachers
and aides do not use formal sign language or even many gestures,
they know which children can speechread and those who cannot and
treat them individually.
Bill Wilkerson Hearing and Speech Center
The classrooms are located on the first floor of a modern clinic
building. Rooms are spacious and two have doors opening onto a play-
ground. Each teacher has a small working office adjoining the class-
room. There is also a small room and a bathroom connected to each
class.
Equipment and Materials. The classrooms contain mostly nursery
school type materials. Two of the three rooms have a more academic
atmosphere. "Rebus-writing" can be seen on the door to the play-
ground, an abacus stands in one corner, and large cardboard letters
and numbers decorate the walls. All rooms have small tables and
chairs but no carpet.
Grouping and Activities. Hearing children as well as deaf
children participate in this program. The deaf children are
grouped into three classes mainly on the basis of their functional
use of residual hearing and their developmental maturity. The
degree to which the parents participate is also considered in
grouping the children. Grouping is discussed among the staff and
decided yearly. Each class can consist of pupils who have spent
different amounts of time in the program.
9

The yt-JI:gig..2r and less mn!..... children engage mostly in group
play activities. Typical activities include four children having
a self initiated tea party, one girl playing with a doll house and
supervised by a student teacher, several children pulling each other
in a wagon, or the whole class working on fingerplays.
A freouent activity in the other two classes is rebus reading,
e.g., children identifying the desired objects denoted by the
written symbols while the teacher assistant supervises the remaining
children in the large room. In one of the two classes the activities
are more structured. The children use some gestures but the teachers'
communication is all oral.
Home Demonstration Program. Several children in the sample are
enrolled in the Home Demonstration Program. This is a parentoriented
program in which the children are used only for demonstration. The
parents attend bimonthly meetings at a residence near the Wilkerson
Center. The house is equipped like a normal middleclass home and
also includes videotape equipment. A new facility is under construction
and attention is now being given to other standards of living relevant
to the parental population.
The purpose of the program is to supply parents with general
information and specific demonstrations suitable for application
in the home setting. The emphasis is on language input and on making
every encounter with the child relevant and useful.
(tallier Speech and Hearing Center
The three year old facility was designed to 1--, a complete
functional unit; included are an educational division, a clinical
10

division and a research division. The school buildings comprise
the educational division. Rooms are l ight, modern, and carpeted
except for a large playroom. The preschool centers around a general
playroom supervised by teacher aides and assistants. Doors off
the general playroom lead to somewhat smaller areas used for class-
size group activities including experiential activities at the stove
And sink. At the four corners of this area are four teacher class-
rooms. These are designed for one to five children plus the teacher.
Classrooms for the older children are large with various areas deline-
ated by functional arrangements of the furniture and equipment.
Equipment and materials. The large playroom contains child-
size tables and chairs, many toys, puzzles, dolls and enough room to
allow organized games with large numbers of pupils.
The smaller rooms off the general playroom contain a stove,
sink, round table, and other tables for speechreading practice and
small group session.
The individual teacher rooms contain large storage shelves
with readiness materials, a mirror, an auditory system, and a
t'eacher's desk and chairs.
Located in the Hearing Center itself, is a complete media
center containing audiovisual equipment and teaching machines which
are now being used with older children. A programmed instruction
unit has been de2eloped and is being simplified for use with the
young preschoolers.
Grouping and Activities. The children are grouped this year
According to age and academic level due to a large increase in
11

enrollment. Usually the children are grouped regardless of age
but according to their "comfort" level. The teachers may or may not
follow through with the same children, for placement ' not final
until a comfortable level can be found for each child.
One teacher can be seen working one to one with a young boy,
slowing her space to wait for his responses on a speech sound pro-
duction task. Another teacher is engaged with two children who
take turns speechreading objects from an assortment in front of them.
One child is a bit poorer at the task, she explains, so his assort-
ment consists of only two objects but in large quantity so he can
receive repeated practice discrimination between them. The teacher
rewards the boys with stars drawn on the back of their hands with
a magic marker. She also cuts out paper neckties on which she
writes the speech sounds they could identify and produce. The boys
march out wearing their ties. Several entire classes can be seen
working on readiness materials while a student teacher conducts an
experi,2ntial activity.
In the large playroom, teacher aides and assistants organize
circle games and supervise free play.
Another teacher works with five children on pronouns and verbs.
She gently "spanks" one child and then asks "What happened?" The
correct answer is "You spanked me." Two children work together to
obtain "He tickled me," or "I hit her." Here the reward is verbal
praise and Perhaps a hug.
In general, the activities are structured with goals clearly
defined by the perceived needs of the children. Communication is
12
completely oral.
Minneapolis Public School Program
Four children in the sample attend day classes at elementary
schools in spacious, well-equipped classrooms. The majority of
the sample attends the parent-oriented preschool program located in
the basement of an elementary school. The three rooms are carpeted
and recently decorated. Two of the rooms include a kitchen area
and are furnished in a home-like fashion. The other room is more like
a school room.
Equipment and Materials. The two home-like rooms are complete
with o dining room table and chairs, sofa, coffee table, and occasional
chairs. The nursery room contains toys, and wall decorations such as
calendars, seasonal pictures and name cards. The room also contains
a kitchen-corner, dolls, cars, manipulative toys, puzzles, gerbils,
a fish bowl, and tables and chairs.
Grouping and Activities. The children in the parent-oriented
preschool are being prepared for entry into a nursery class in one
of the other elementary schools. This program is designed primarily
to teach parents ways of putting language into and getting language
out of their children. The children engage in activities such as
auditory training, show and tell, and experiential activities. These
activities are designed to train the children to look at and be aware
of lip movements and speech, and also to produce some speech themselves.
All instruction from teachers is oral.
In addition to three group sessions a week, these children also
are tutored individually for one hour once a week.
13
New Mexico School for the Deaf
The Santa Fe preschool contains a kitchen, dining, and dormitory
areas in addition to a very large playroom and smaller classrooms.
The large playroom is lighted with big windows facing the playground.
The class is held in a smaller, carpeted room which has a large storage
closet.
The Albuquerque preschool unit is located in a semi-commercial
area of the city. It is not aS large as some other programs in the
study, but space is used economically and efficiently. The classrooms
line up along two corridors with a library and holding room between.
There is also a kitchen and dining area plus bathroom, reception room
and office. The rooms used for instruction are carpeted. There is
also a facility next door which is used for rhythm and ocher large
group activities.
Equipment and Materials. In Santa Fe, the large playroom is
equipped with a piano, teaching machine, tables and chairs, blocks,
paints, manipulative toys, puzzles, books, kitcnen-corner and dress-up
clothes. This room is supervised by a kindergarten teacher wbo has
charge of from 5 to 7 children, depending on the activities going on
in the classrooms. In the teaching rooms, an overhead projector, film-
strip projector, and record player were seen along with toys, rhythm
instruments and coloring materials.
In Albuquerque, the classrooms have horseshoe tables and chairs,
weather calendars, flannel board, pictures of the children's families
and several books. There is also a tutoring room to which the children
go for speech therapy and other language activities. This room contains
14

boxes of vocabulary toys, a record player and auditory unit. The
older children have a similar setting.
Grouping and Activities. Of the four children in the Santa Fe
sample, two came for individual tutoring; the other two staved in the
large playroom for most of the day and were taken out for instruction
during this time.
The activities in the classroom are somewhat structured though
relatively brief. Matching forms, colors and colored objects, a short
number exercise and supervised free play were observed in one tutoring
session.
The Albuquerque children are grouped on the basis of age, length
of time in the program and developmental and academic maturity.
The atmosphere is work oriented. Activities include printed name
identification, receptive signing, speechreading and speech related
tasks plus an experiential activity emphasizing color matching ability.
During an individual tutoring session a child may receive auditory
training, lipreading, expressive and receptive signing, speechreading
of objects, and matching printed words to objects. Other activities
observed were rhythm exercises, verbal identification of picture voca-
bulary, labelling the same pictures with printed words and removing
these pictures from a :file board via receptive fingerspclling.
Rochester School for the Deaf
The classrooms are located in a building des:gne0 pr )reschool
4.42af children. There is a large playroom (holding roon) where the
children gather when they arrive. Classrooms are spacious and well
lighted with windows along two walls. Room divisions are provided
15

via furniture arrangements. Smaller rooms adjoin for individual
tutoring by speech therapists (one per class).
Equipment ani Materials. Nursery school materials are in
evidence. The children's art work decorates many of the walls and
toys consist of blocks, trucks, dolls, dress-up clothes and house-
keeping items. Each class contains sinks that are child-sized plus
the usual tables and chairs. Auditory units are located in the
therapist's rooms.
Grouping and Activities. Grouping is mainly on the basis of
length of time in the program and developmental maturity. Activities
in the morning groups are repeated in the afternoon for a different
group of children. These activities range from potato printing to
matching objects to pictures and then identifying their printed names.
These children are learning to match their own arms to a stick figure
with varying arm positions. In the older group, calendar, weather
and news are followed by experiential activities such as making
presents for parents.
Two speech therapists work with the children in the sample. The
therapists use the auditory training units and do some readiness work
with the pupils.
A rhytl.m teacher visits the preschool building several times
each week. Classes are allotted one 20 minute period during which
the children stand around the piano to listen and feel the vibrations.
Communication from teacher to child is a simultaneous combination
of oral-aural and fingerspelling, i.e., visible English or the Rochester
Method.
16

Si. Paul., Tilden School
The program is located in an elementary school of which five
rooms are allocated to the hearing impaired program. The room in which
the sample of children is located is large and uncluttered. Spatial
divisions are accomplished via storage cabinets which house many
materials. The floor is carpeted and there are sufficient chairs and
tables.
Equipment and Materials. The room is equipped with audio-visual
projectors, screen, auditory unit with record player, wheel toys,
some housekeeping items, and a variety of readiness materials and
workbooks. In general, it is a working type atmosphere rather than a
nursery school environment.
Grouping and Activities. All children new to the program are
assigned to this room and remain there until they are academically
and socially mature enough to move into another class. The teacher
and her aide have two groups of children for three hours in the
morning and three in the afternoon. Their function is preparatory:
lengthening attention span, discipline, reinforcing vocal output,
manipulation of materials, recognizing alphabet letters both in print
and on the hand, and, in general, school adjustment and academic readi-
ness activities.
The children gather for weather and date check followed by a
discussion of something each child has brought or is wearing. The
the class is divided between the teacher and the aide for different
activities. Far example, the teacher may take the more advanced children
17
L

for speechreading and fingerspelling exercises while the aide
supervises number work or letter recognition. After a time the
children change places and the same activity is modified for the
other group. When they re-group again, wcrkbooks are brought out
and each child works at his own rate. Experiential activities can
also be observed.
The children are taken from the loom for individual (sometimes
in pairs) sessions with the speech therapist. Reinforcement techniques
are used. They are also taken downstairs for individualized sessions
with an occupational therapist.
Communication is a combination of oral language and fingerspelling.
An attempt is made to simultaneously fingerspell and say everything to
the children in complete sentences. The general impression is one of
good planning and highly structured activity.
METHODOLOGIES
Each of the programs was classified as employing one of three
methodological approaches; the Oral-Aural, the Rochester, or the
Total (Simultaneous) Method. -!or purposes of the present study, they
are defined as follows:
1. Oral-Aural Method In this method, the child receives input
through speechreading (lipreading) and amplification of
soind and he expresses himself through speech. The use of
signs and fingerspelling ar, aot part of the educational
process.
18

2. Rochester Method This is a combination of the Oral-Aural
Method plus fingerspelling. The child receives information
through speechreading, amplification and fingerspelling and
expresses himself through speech and fingerspelling. When
practiced correctly the teacher spells every letter of
every word in coordination with speech.
3. Total Communication This approach also known as the Simul-
taneous Method, is a combination of the Oral-Aural Method plus
signs and fingerspelling. The child receives input through
speechreading, amplication, signs, and fingerspelling. He
expresses himself through speech, signs and fingerspelling.
A proficient teacher will sign in coordination with the
spoken word, using spelling to illustrate elements of
language for which no signs exist.
Classification presented some problems due to the fact that some
of the programs are in the process of change. The changes are similar
to those in many preschool programs for the deaf in the United States.
For the 1970-71 academic year the programs were classified as follows:
1. American School for the Deaf, Oral-Aural Method.
The superintendent, Dr. Hoffmeyer, has stated that
the school is committed to changing to Total Communication
over a three year period as personnel become trained.
Although some parents had received training in manual
communication and some children used signs in class, the
teachers input consisted solely of the spoken word.
19

MK.
2. Bill Wilkerson Hearing and Speech Center, Oral-Aural Method.
3. Callier Speech and Hearing Center, Oral-Aural Method.
4. Minneapolis Preschool Program, Oral-Aural Method.
5. New Mexico School for the Deaf, Total Communication. The
preschool program has recently changed from the Rochester
Method.
6. Rochester School for the Deaf, Rochester Method. The
program is in the process of changing from the Oral-Aural
Method.
7. St. Paul Preschool Program, -Aochester Method.
Program Information
A comparative view of the Programs can be found in Tables 2,3,
4,5, and 6. These tables, along with Table 1, contain information
concerning pupils, parents, teachers, and services offered by each
program.
,n general, all programs provide adequate facilities and quali-
fied personnel. The equipment and materials vary with some more
academic and structured than others, reflecting the objectives of the
specific programs. The activities also diverge along this dimension.
A'1 the programs are mainly concerned with the input of language to
these young children. Differences occur in the type of input and
the output that is expected from the pupils.
The degree of parent involvement varies also. The residential
programs do not involve the parents as much as the other programs due
to distance constraints imposed on many families. One program offers
20

Administrative Organization of Services
Program
Residential
Pupils
Day Pupils in
Residential Schools
or Hearing Centers
Pupils in
Public School
Classes for the Deaf
Home Dem./Parent
Oriented Services
Children
Hours/week
Children
Hours/week
Children
Hours/week
Children
Hours/week
American School
for the Deaf
9 3
27.5
12
4 1
27.5
12
Bill Wilkerson
Hearing Center
4 6
8
12
3 (Parents take
turns bringing
children for demon
strations)
Callier Hearing &
Speech Center
18 2
15
30
Minneapolis Public
School System
430
57
74
31
ew Mexico School
for the Deaf
2 8 1 1
22
15 2.5
1.5
Rochester School
for the Deaf
615
715
St. Paul Tilden
School
7 1
15 9
TOTAL
18
54
12
18

"fable 3
Age of Onset of Loss
Program
Present at
Birth
Birth
to
12 Months
12 Months
to
24 Months
Unknown
Program
Totals
American School
for the Deaf
13
10
317
Bill Wilkerson
Hearing Center
71
05
13
Callier Hearing &
IVSpeech Center
12
21
520
I's)
Minneapolis Public
School System
13
13
219
New Mexico School
for the Deaf
50
34
12
Rochester School
for the Deaf
23
17
13
St. Paul Tilden
School
30
23
8
Totals
55
810
29
102

Table 4
Etiological Diagnosis
Program
Heredity
Illness
Meningitis
Prematurity
Rh
Factor
Maternal
Rubella
Unknown
Program
Total
American School
for the Deaf
70
21
02
517
Bill Wilkerson
Hearing Center
01
10
23
613
Callier Hearing &
Speech Center
10
30
07
990
Minneapolis Public
School System
11
22
05
819
New Mexico School
for the Deaf
21
21
01
512
Rochester School
for the Deaf
13
11
00
713
St. Paul Tilden
School
00
21
10
48
Totals
12
613
63
18
44
102

an orientation week plus weekly parent observations and meetings
with the teachers. The majority, however, provide two conferences
yearly and a variety of activities on a weekly, bi-weekly or monthly
basis. Parent-oriented programs necessitate greater participation
on the part of specific families and therefore allow for fewer hours
of teacher-child interaction.
For purposes of comparison, some programs have been designated
as "structured" and "unstructured." In the latter case. this is a
rather gross exaggeration. No program in this study is without
structure. What is meant, however, is structure in greater or lesser
degrees. Those programs with a relatively high degree of structure
(presented alphabetically) are: American School for the Deaf, Callier
Hearing and Speech Center, New Mexico School for the Deaf, and St. Paul
Tilden School. Programs with a lesser degree of structure are : Bill
Wilkerson Hearing and Speech Center, Minneapolis Public School System,
and Rochester School for the Deaf. This is not a permanent classifi-
cation but one which will be reexamined each year. For a description
of the variables which define a program as "structured" or "unstructured"
the reader is referred to the section concerning the Illinois Test of
Psycholinguistic Abilities.
Selection of Subjects
Certain restrictions were imposed in order to limit the sample
to prelingually and profoundly deaf children at very young ages.
Criteria for inclusion in the sample consisted of the following:
(1) birthdate between March 1, 1966 and March 1, 1968, (2) at least
70 decibel sensori-neural hearing loss in the better ear, averaged
24

across the speech range frequencies, (3) A Leiter Performance Scale
IQ of 80 or better, (4) age of onset of deafness of 2 years or younger
and (5) no severely obvious handicap other than deafness.
The age criterion itself imposed other difficulties on subject
selection. Several pupils' audiometric data are still incomplete
and may necessitate exclusion when aore confident decisions are made
concerning the type and extent of the hearing losses. Eight children
were eliminated after the spring visit for this reason. One subject
failed to meet criterion on the Leiter Performance Scale and one
child withdrew from his program.
The primary source of information other than test data was the
pupil's cumulative record file. These files were reveiwed during the
fall visit and again in the spring. From these records, data on age,
sex, racial origin, admission date, reside-Aal status, hearing loss
(de.;ree, type, age of onset, and etiology), hearing ability of parents
altl siblings, hearing aids, schools attended previously, I.Q. scores
Aen available, and any other relevant data were obtained.
For the most part, these files were readily accessible, fairly
complete, and very helpful. In all cases the supervisors and teachers
were willing, and usually able to supply missing information about
the children's background.
At present there are 102 children involved in the project who
satisfied the a priori requirements of age and decibel loss. There
are 66 males and 36 females: 97 Caucasions and 5 Negroes. The
largest sample is at Callier Hearing and Speech Center (N=20) and
the smallest sample is St. Paul, Tilden (N=8). Others range from
25
12 to 19 children.
Forty-two children had training prior to entry in their present
program. The overall average is 15.11 months training in other pre-
schools, 10.28 months in speech and hearing centers, and 15.55 months
in home demonstration programs.
Of the 42 children in residential programs 18 are housed in the
schools and 24 are day students in classes in residential schools.
Twenty-seven attend day programs for the deaf located in public schools.
The number of hours per week spent in the classroom varies from
program to program and within each program. Using a weighted mean
according to the number of children in each classification (e.g., 15
children at 9 hours per week, 3 children at 4 hours per week, etc.)
the average number for all 102 children is 14.35 hours per week. Cal-
culations for each program are as follows:
American School for the Deaf 23.6 hours per week
Bill Wilkerson Hearing and Speech Center 10.0 hours per week
Calker Hearing and Speech Center
Minneapolis Public School Program
New Mexico School for the Deaf
Rochester School for the Deaf
St. Paul Tilden Program
16.4 hours per week
9.8 hours per week
14.0 hours per week
15.0 hours per week
14.0 Hours per week
The date of admission was recorded to determine the length of
time each child has been in the program. Forty-nine children in the
sample have attended their programs for one year or less; 36 children
not more than 2 years, 12 children not more than 3 years; and 2 for
more than 3 years as of June 30, 1971.
26
(No admission date was

available for 3 children.)
Etiology and Onset
The job of diagnosing the cause of a child's deafness is often
very difficult. Hospital records can be sketchy, mothers can be
unsure about aspects of pregnancy and delivery, family histories
may be unknown especially in the case of an adopted child. Wherever
possible the official diagnosis listed in the files has been used.
Often there is more than one probably cause. The following represents
the etiological breakdown as accurately as it could be ascertained.
44 Unknown
18 Maternal Rubella
13 Meningitis
12 Hereditary
9 Otitis Media, Rh Factor,
illness, or "fever"
6 Premature birth
Fifty-five children were deafened at birth, 8 were deafened
before one year and 10 deafened before age two. It is unknown when
29 children became deaf, however in all cases the deafness was dis-
covered before age three.
Fourteen of the subjects have minor handicaps in addition to
their deafness: 7 with perceptual-motor difficulties, 3 with poor
vision, 3 with heart murmur and 1 with emotional problems. A decision
will eventually be made to keep or drop these children depending on
the effect these additional handicaps have on their development.
27

Amplification
Eight-nine children or 85% of the sample of children have some
type of hearing aid, either their own or one loaned to them by the
program. Data on length of time the aid has been in use was not
found in pupil recrod files, however, an attempt is being made
to obtain this important information.
Teachers and Supportive Staff
The breakdown of services and the certification and experience
of personnel in each program are presented in Tables 5 and 6. Although
the pattern of services varies, all programs appear to be adequately
staffed.
28

Table S
Breakdown of Programs by Teachers,
Supportive Staff and Certification
Program
Supervising
Teachers
Occupa.
Thera.
Supportive Staff
Tutors
Total
Certified
Bachelor's
Regular
Speech
Aids
Thera.
to Teach
or Teaching
Deaf
Certi. Only
American School
for the Deaf
15
28
61
Bill Wilkerson
Hearing Center
13
37
32
Callier Hearing &
Speech Center
19
212
10
1
Minneapolis Public
School System
16
18
5
New Mexico School
for the Deaf
23
11
74
2
Rochester School
for the Deaf
12
22
18
14
St. Paul Tilden
School
11
11
26
22
* Bill Wilkersonhas three teachers for the HomeDemonstration program in addition to those shown
above.
wo
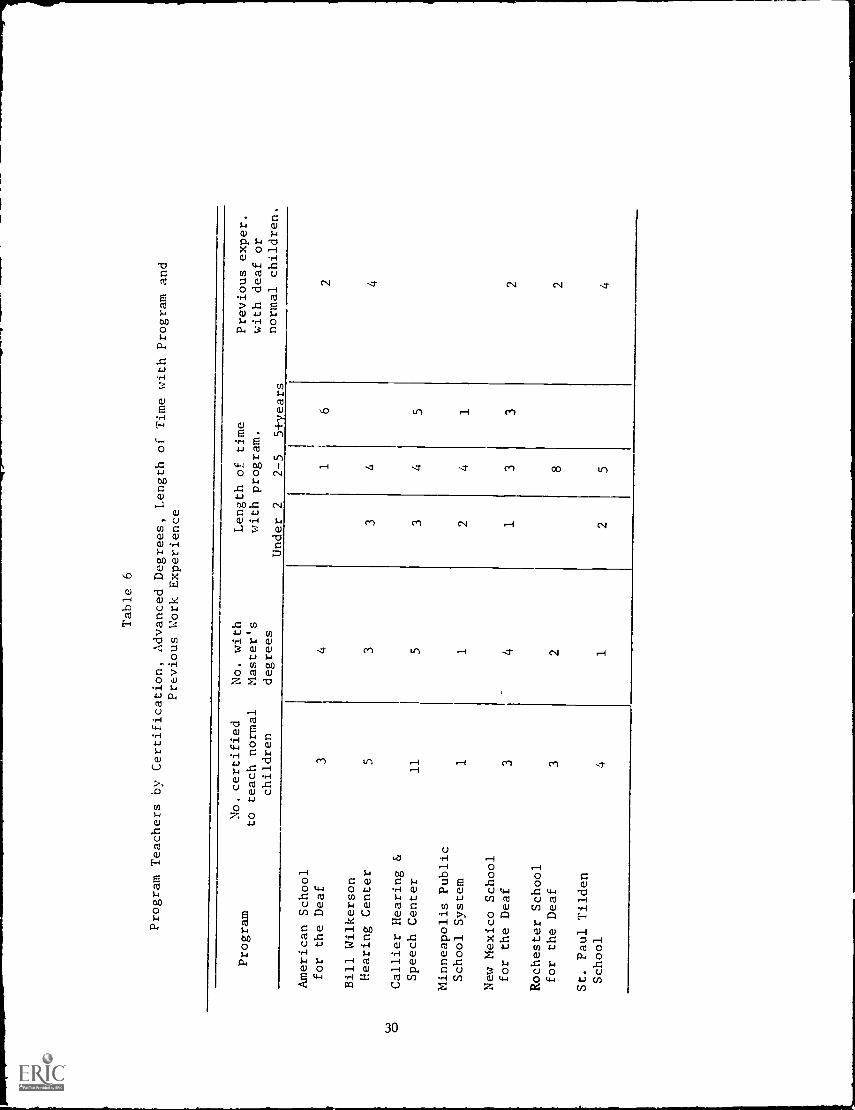
Table 6
Program Teachers by Certification, Advanced
Degrees, Length of Time with Program and
Previous Work Experience
No. certified
No. with
Length of time
Previous exper.
Program
to teach normal
Master's
with program.
with deaf or
children
degrees
normal children.
Under 2
2-5
5+years
American School
for the Deaf
34
16
2
Bill Wilkerson
Hearing Center
53
34
4
Callier Hearing &
Speech Center
11
53
45
Minneapolis Public
School System
11
24
1
New Mexico School
for the Deaf
34
13
32
Rochester School
for the Deaf
32
82
St. Paul Tilden
School
41
25
4

DESCRIPTION AND RESULTS OF TESTING
Leiter Performance Scale
An attempt was made to administer the Leiter International
Performance Scale to all children in the sample. The attempt was
successful with only a few exceptions due to absence or inability
to obtain a basal age. All children found to be non-testable in
the fall of 1970 were re-examined during the spring 1971 school visits.
Children remaining non-testable for any reason after the spring visit
are not included in the statistical analyses. The results are based
on data on 94 children from the total sample of 102. Plans have been
made to test the remaining eight children during the 1971-72 academic
year.
For those who are unfamiliar with the test, a brief explanation
is provided below. The following is taken from the Arthur Adaptation
of the Leiter International Performance Scale reprinted from the Journal
of Clinical Psychology, Vol. V, No. 4, 345-349, 10, 1949 with permission
of the editor. More detailed information on materials and standardiza-
tion may be obtained from this publication or the test manual.
The Arthur Adaptation of the Leiter International
Performance Scale is, 'n principle, a non-verbal Ilinet
scale for young children. 7 main advantages are:
(1) it reaches down to lower chronological age levels
than the other performance scales, (2) the tests
lowest in the scale are tests of ability to learn
rather than tests of acquired skills or material
31

already leained: the first five tests are given credit
as passed if the subject is able to perform the task
without demonstration or help during any one trial, no
matter how many previous trials have been given and
without regard to the amount of demonstration and help
it has been necessary to give during previous trials;
(3) every test of the scale is b. n without time
limit; and (4) the entire scale is given, as it was
standardized, without any verbal directions.
There has been much controversy about the use of any test which
may be interpreted as permanently fixing a child's intellectual level
or ability with an IQ score. The authors are very concerned and aware
of this controversy and also are cognizant that children as well as
examiners have their good and bad days. For these reasons it is
well to note that any one score may be considered relatively accurate
to within 10 points (plus or minus) of the obtained score and even
then the individual child's score may change very dramatically as he
mature -. It is necessary, however, to have a numerical value with
which to work for purposes of comparison, but caution and discretion
should be used in dissemination of the information to parents and
others concerned with the children. For these reasons only group
scores and statistics based on the entire population of children
are reported.
Results
Table 7 contains all pertinent information for each sample of
32

Table 7
Leiter Performance Test
Program
Number of
Subjects
Mean I.Q.
Standard
Deviation
Range
Mean Age
in Months
American School
for the Deaf
15 (2)
109.200
15.6533
88-133
47.733
Bill Wilkerson
Hearing Center
11 (2)
98.454
10.7551
82-118
48.000
Callier Hearing &
Speech Center
19 (1)
119.158
14.7092
35-151
46.842
Minneapolis Public
School System
17 (2)
112.059
13.0598
85-135
44.706
New Mexico School
for the Deaf
12
128.083
15.0722
110-157
45.250
Rochester School
for the Deaf
13
108.308
11.3606
90-131
51.385
St. Paul Tilden
School
7 (1)
122.286
13.1746
104.138
45.428
Totals
94 (8)
113.734*
13.3978
82-157
47.049
(#) = Number of children not tested
*= weighted mean

children from which to compute a t-rest. The t-test is one of the
most commonly used tests to determine whether the performance dif-
ference between two group: of subjects is significantly different
from chance level. On the Leiter Performance Scale, the New Mexico
School for the Deaf (Santa Fe and Albuquerque combined) was signifi-
cantly different from the American School for the Deaf (t = 3.046,
df = 25, p < .01), Bill Wilkerson Hearing and Speech Center
(t = 5.1440, df = 21, p < .001), Minneapolis (Whittier, Emerson and
Hamilton) (t = 2.9443, df = 27, p < .ol) and Rochester School for
the Deaf (t = 3.5699, df = 23, p < .01). The Callier Speech and
Hearing Center was significantly different from the Bill Wilkerson
Center (t = 3.9411, df = 28, p < .001) and St. Paul (Tilden) was
significantly different from Bill Wilkerson (t = 3.9532, df = 16,
p < .01). In this comparison, each program was compared with every
other program in our sample. All comparisons not reported above
were not significant at the .01 level of significance.
There are at least two factors which may account for these
differences between programs. The first is the small number of
children in some samples, and the second is the age of the children.
A small number of subjects in a sample tends to make the t-test
less sensitive, and the Leiter Performance Scale tends to score higher
at very young ages. Therefore, a program whose sample contains a
-elatively large number of children at young ages has a distinct ad-
vantage in this type of comparison.
Another factor which might be considered is the type of experiences
children have in some of the programs might be very similar to the
34
1
demands of the Leiter Scale. Despite the claim that the Scale at
lower levels has tests of ability to learn rather than of acquired
skills, it is interesting to note that the programs which have been
classified as most structured (Callier, New Mexico, and St. Paul)
show the highest mean scores. An important consideration for the
future is whether the differences will disappear as the children
mature.
It should be stressed that the average IQ of 113.7 for the
group may be spuriously high. The children who were not testable
will probably lower the mean score when included in the sample.
Also Quigley (1969) reported a mean Leiter Scale IQ of 114 for
32 deaf children with an average age of 3.8. When tested four years
later at an average age of 7.8, the WISC Performance Scale average
IQ was reported as 102. It is possible the present study will
observe a similar drop in reporcea IQ.
35
Illinois Test of Psycholinguistic Abilities
The Illinois Test of Psycholinguistic Abilities (ITPA) was
administered to 96 children in the Sprint, of 1971. Six children
were absent during the visits and were not tested. The ITPA
norms include approximately 15% non-testables so that each child
received a score for each subtest regardless of a refusal to parti-
cipate or a failure to obtain a basal on a particular task.
The ITPA was selected for inclusion in the battery because it
is a diagnostic test of specific abilities and can be used to
delineate areas of difficulty in communication. As a complete unit,
the ITPA can isolate problems in (a) three processes of communication,
(b) two levels of organization, and/or (c) two channels of input and
output. Performance on individual subtests can indicate specific
abilities or disabilities in psycholinguistic functioning. Addi-
tional information about this test may be obtained from the Examiner's
Manua], revised edition, University of Illinois, 1969.
Five of the subtests of the ITPA were administered to the
sample of children. The others required complex instructions and
were restricted to the auditory-vocal channel. Some verbal in-
structions were required on all the subtests, but the five selected
were the most self explanatory and relied on the visual mode. In
some cases, additional instructional materials were devised to
further assist the child in understanding the tasks. A brief des-
cription of the five subtests follows:
36

1. Visual Reception: A measure of the child's ability to
gain meaning from visual symbols. The child is shown a stimulus
picture (EX. a dog) and must find an object or situation that is
conceptually similar to one of four objects or situations contained
in a second picture (EX. another dog).
2. Visual-Motor Association: A picture association test to
assess the child's ability to relate concepts presented visually.
The child is shown a stimulus picture surrounded by four response
pictures. The task is to choose the response picture that is most
closely related to the stimulus picture (EX. sock and shoe). As
a whole this test taps the subject's organization and association
abilities.
3. Manual Expression (motor encoding): A gestural manipulation
Lest to assess the child's ability to express ideas manua)Ly. Fifteen
pictures of common objects are shown one at a time and the child is
asked to pantomine the action (combing hair, dialing phone).
4. Visual Closure: The child's ability to identify a common
object from an incomplete visual presentation is assessed. Four
separate scenes are shown each depicting a different subject matter
(shoes, fish, dogs or tools) in varying degrees of concealment. The
child must point to as many of the 14 or 15 particular objects as he
can find in 30 seconds.
37

r
5. visual Sequential Memory : The abiliLV Lo reproduce sequences
of non-meaningful geometrical figures from memory. The child is shown
the sequences for five seconds and then must put corresponding chips
of the figures in the same order. There are two trials for each
sequence (if the first trial is unsuccessful). This test has been
shown to be a good predictor of reading skills for children with
normal hearing.
Results
Scaled scores were used in all statistical calculations. Scaled
scores are transformed raw scores such that at each age and for each
subtest the mean or average performance of the referral group is
eqial to a score of 36 with a standard deviation of 6. Scaled scores
ta,ce into account both group means and variances and provide a help
ful comparison of the child's performance.
The weighted mean score of 170 for the complete sample is
somewhat below the score of 180 which would be predicted for children
with normal hearing as shown in Table 8. Students in the Callier,
New Mexico, Rochester and St. Paul programs scored above the sample
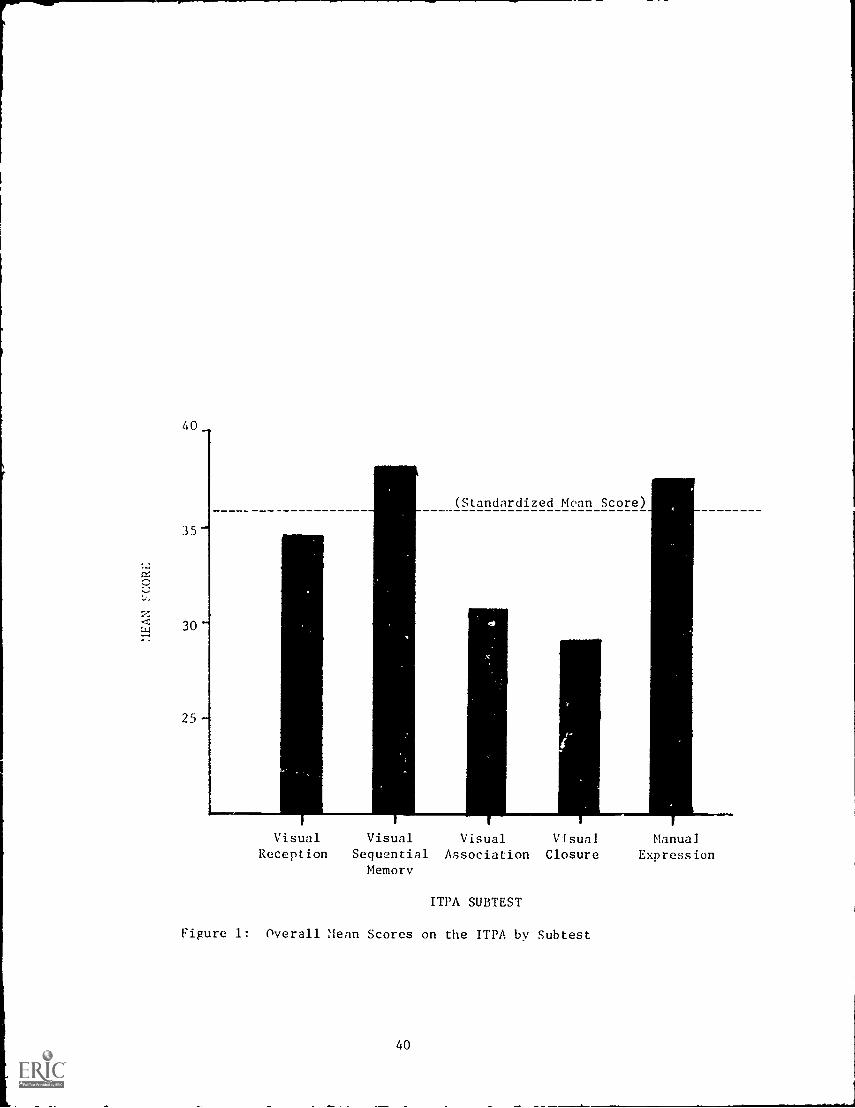
,0 In. Of greater immediate importance, however, is the pattern of
responses over the various subtests. Figure 1 graphically depicts
the overall performance of all subjects on each of the five subtests
of the ITPA. On two of the subtests, Visual Sequential Memory and
Manual Expression, the children achieved above the mean scaled score
of 36 for normally hearing subjects. They were below the norm in
Visual Reception, Visual Association and Visual Closure, with
38
i

Table 8
Illinois Test of Psycholinguistic Abilities
Program
NMean ITPA Score
Standard Deviation
Range
Mean Age
(months)
American School
for the Deaf
15
164.07
26.40
103-206
50.13
Bill Wilkerson
Hearing Center
13
147.69
21.84
103-182
51.08
Callier Hearing E.
Speech Center
16
190.56
18.68
159-223
49.62
4) VD
Minneapolis Public
School System
19
159.95
26.38
103-201
48.16
New Mexico School
for the Deaf
12
182.00
9.76
115-226
49.42
Rochester School
for the Deaf
13
176.00
22.64
122-203
55.15
St. Paul Tilden
School
8174.75
42.46
116-231
48.25
Totals
96
*170.1982
50.26
* Weighted mean score
40
35
30"
25
(Standardized Mean Score)
Visual Visual Visual Visual ManualReception Sequential Association Closure Expression
Memory
ITPA SUBTEST
Figure 1: Overall Mean Scores on the ITPA by Subtest
40
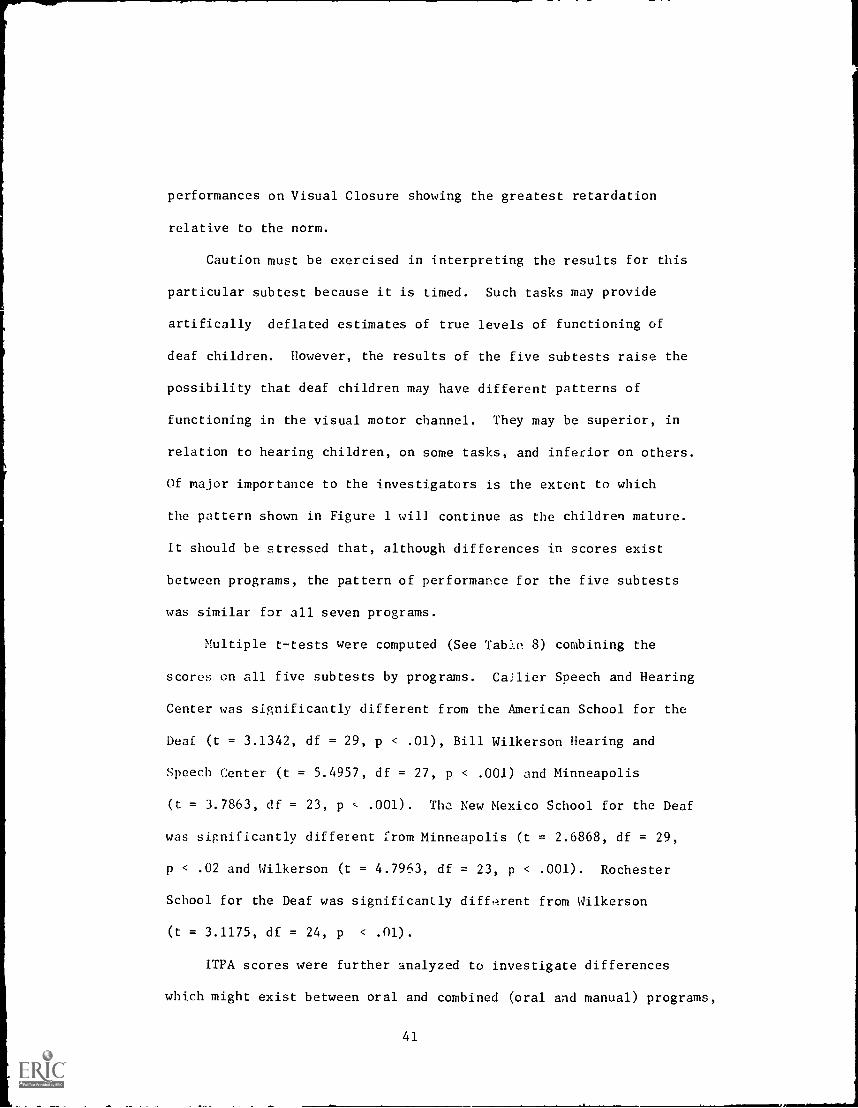
performances on Visual Closure showing the greatest retardation
relative to the norm.
Caution must be exercised in interpreting the results for this
particular subtest because it is timed. Such tasks may provide
artifically deflated estimates of true levels of functioning of
deaf children. However, the results of the five subtests raise the
possibility that deaf children may have different patterns of
functioning in the visual motor channel. They may be superior, in
relation to hearing children, on some tasks, and inferior on others.
Of major importance to the investigators is the extent to which
the pattern shown in Figure 1 will continue as the children mature.
It should be stressed that, although differences in scores exist
between programs, the pattern of performance for the five subtests
was similar for all seven programs.
Multiple t-tests were computed (See Table 8) combining the
scores on all five subtests by programs. Cailier Speech and Hearing
Center was significantly different from the American School for the
Deaf (t = 3.1342, df = 29, p < .01), Bill Wilkerson Hearing and
Speech Center (t = 5.4957, df = 27, p < .001) and Minneapolis
(t = 3.7863, df = 23, p .001). The New Mexico School for the Deaf
was significantly different from Minneapolis (t = 2.6868, df = 29,
p < .02 and Wilkerson (t = 4.79f3, df = 23, p < .001). Rochester
School for the Deaf was significantly different from Wilkerson
(t = 3.1175, df = 24, p < .01).
ITPA scores were further analyzed to investigate differences
which might exist between oral and combined (oral and manual) programs,
41

between structured and unstructured programs and between children
classified by etiology. Figure 2 graphically presents the scores
of children in combined and oral programs. Although there are
small differences favoring the combined group on each subtest, no
significant differences were observed by t-tests. Again, it should
be stressed that the pattern of scores across subtests was similar
for each group.
The children then were separated and compared on the basis of
etiology. Some causes had to be grouped for expediency but the
overall best performance (Figure 3) was given by the hereditary
group followed by unknown cause, rubella, meningitis and the "other"
group (including prematurity, RH factor, fever, etc.). In all cases,
either Visual Sequential Memory or Manual Expression was the best
subtest followed by Visual Reception, Visual Association and Visual
Closure (except the Rubella group which reversed the last two sub-
tests). This grouping almost exactly duplicates the overall
pattern performance of the entire sample of children. (See Figure 1).
In other words, no particular cause of the deafness accounted for much
of the population variance.
One other classification was developed as a result of observa-
tions at various programs. It is not an official designation but
one based on a number of factors: (1) academic or pre-academic work
undertaken by the children, (2) organization and use of class time,
(3) amount of free play allowed, either supervised or unsupervised,
(4) type of ongoing activities, (5) amo.int of attention expected
from the children and (6) teacher's expectation. We have classified
42

11.1
1,
35-
30 -
25
Ficzure
cn <
(t(t
H.
5 n
(n0
C C rtM 0
r.
I-I
1
<n
<rd
::.r.
H.
H. H
X 0
M0
MC
cnc
75 Pic
Wc a)
(1)
0.)
FPi
1..
C./)
F(1
)U) r. 0
ITPA SUBTEST
2:
'TPA Scores of Children in Combined and
Oral Programs
- Combined Programs
- Oral Programs

45
40
35
o:..)
30 '
25
KEY
X Unknown
0
Hereditary
Meningitis
, Rubella
c)
Other
I0 (A 0 .C1
(A
C C
"0 0 PI 0 0
rt
1-..
'.4 0 1
-..
H.
11.
i-J
< (-)
<I
r i.--,
1-.
m 0 cf)
C (i) c
ca C o
i-'
PI i-..
(1)
ITPA
SUBTEST
Figure
3:
ITPA
Subtest
by
Etiology
of
Deafness.
44
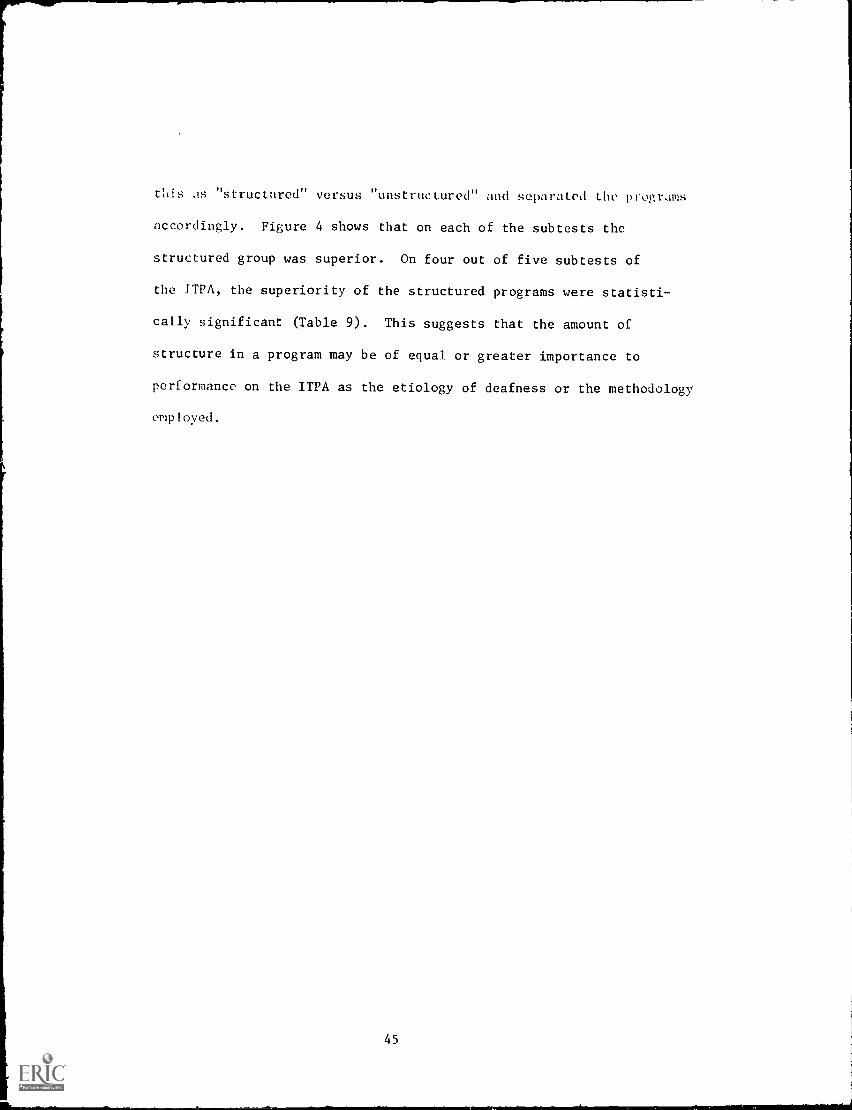
this as "structured" versus "unstructured" and separated the programs
accordingly. Figure 4 shows that on each of the subtests the
structured group was superior. On four out of five subtests of
the ITPA, the superiority of the structured programs were statisti-
cally significant (Table 9). This suggests that the amount of
structure in a program may be of equal or greater importance to
performance on the ITPA as the etiology of deafness or the methodology
employed.

uoT3daJaN
TunsTA
Alowaw
TuTluonbas
TunsTA
uoTleTpossy
TensfA
DansoTo
TensTA
uoTssaidxa
Tunuew
99
MEAN
SCALED
SCORE
NwW4> In0InCD
IiI1
j

Table 9
Comparison of IPA Scores by structured and Unstructured Programs
Visual
Reception
Visual
Sequential Memory
Visual
Visual
Manual
Association
Closure
Expression
N X36.1
32.8
.v-
--,
SD
6.2
5.5
df
94
94
t2.6534**
SU
51
45
SU
51
45
SU
51
45
39.8
35.9
33.0
28.3
8.1
8.2
7.8
5.8
* p
<.05
**p
<.01
S = Structured Programs
U = Unstructured Programs
2.3130*
SU
SU
51
45
51
45
30.8
27.3
38.7
36.7
7.8
6.8
6.1
7.5
94
94
3.2527**
2.3024*
94
1 . 3248

Classroom Observation
As part of the fall and spring visits, observations we:e
made in the various classrooms. A running account of the type
and length of activity, as well as the mode in which the activity
was conducted, was recorded. In addition, equipment and materials
being used and seen during the observation period were noted on a
list of items frequently found in a prekindergarten classroom.
The form used for these observations (Appendix A) consisted of a
modified version of the Classroom Observation Schedule used by
DLLorenzo (1969) with additions appropriate to a population of deaf
children.
Immediately following the observation period, statements were
rated under six major headings (See Appendix B): (1) Classroom
Organization, which was concerned with the manning and execution
of the program and its organization (one to small, small groups,
entire group); (2) Discipline and Classroom Relationships which was
concerned with the methods and manner in which disciplinary problems
are handled and/or avoided and the prevailing atmosphere in the
room itself. (3) Program Structure, which considered special
materials, varieties of experience and organization of time periods;
(4) Encouraging Language and Speech Development; (5) Reacting_ to
Pupil Needs, which was concerned with modifications of teacher's be
havior required by the developmental status and the particular im
pairments of the individual children in her class. (6) Communication
48
from Pupils and from Teachers to Pupils, which dealt with the various
modes of communication used by the teacher and the children (adult
to child, child to adult, and child to child).
Forty-nine statements under the above headings were rated on
a seven point scale from "never" to "frequently." These ratings
could then be combined across raters and compared between programs
and modes of communica:io;,. (See Appendix B for individual state-
ments).
Equipment and Materials
All of the classroom.: observed were very well equipped. All
contained auditory uaits ox some kind and math and/or reading readi-
ness materials were present in all but one program. Many were
equipped with child -size' sinks and toilets adjoining the classrooms---
others had nearby facilities.
Audiograms were on display in four programs and most contained
the usual blocks, paints, books, puzzles and other manipulative
tovs. Many evidenced record players, housekeeping corners, dress-up
clothes, rhythm instruments, flannel boards and calendars. Only two
programs were observed using overhead projectors during the observa-
tions and few programs used labels extensively throughout the class-
room.
Results
The basic data were the combined scores of two raters on each
statement over severe., observations for each school. Initial t-test
computations revealed no significant differences between groups in
49

the category of "encouraging language and speech development." The
programs, then, seem fairly equivalent in taking advantage of
spontaneous language learning opportunities, exposing the children to
varied concepts, and giving controlled practice in selected terms
to establish specified language patterns.
The other four categories (Communication will be discussed
separately) were combined with the following significant results
on t-tests: American School was significantly higher, in terms of
frequency, than Callier (t = 4.0567, p < .001, df = 64), New Mexico
(t = 4.8094, p < .001, df = 64), Dill Wilkerson (t = 5.7693,
p , .001, df = 64), Rochester (t = 6.2318, p < .001, df = 64), and
Minneapolis (t = 8.1419, p < .001, df = 64). St. Paul was signifi-
cantly higher than New Mexico (t = 3.2460, p < .01, df = 64), Wilker-
son (t = 3.8447, p < .001, df = 64), Rochester (t = 4.7338, p < .001,
df = 64), and Minneapolis (t = 6.6464, p < .001, df = 64). Callier,
Bill Wilkerson, and New Mexico were all significantly higher than
Minneapolis at the .01 level or beyond.
To further delineate the sources for these differences, the
individual categories were compared. On "reacting to pupil needs,"
American School was significantly higher than Callier (t = 4.1024,
p , .01, df = 12), Wilkerson (t = 7.2463, p < .001, df = 12), Rochester
(t = 4.8271, p < .001, df = 12), and Minneapolis (t = 7.8691, p <.001,
df = 12). St. Paul was significantly higher than Rochester (t = 3.0827,
p < .01, df = 12), and Minneapolis (t = 4.7608, p < .001, df = 12).
Wilkerson was significantly higher than Minneapolis (t = 4.287,
p < .01, df = 12).
50

On the statements under the heading of "classroom organization,"
the results were as follows: American School was significantly higher
than New Mexico (t = 4.055, p < .001, df = 16), Rochester (t = 4.9769,
p < .001, df = 16), Minneapolis (t = 5.1461, p < .001, df = 16), and
Wilkerson (t = 5.552, p < .001, df = 16). St. Paul was significantly
higher than Minneapolis (t = 2.9309, p < .01, df = 16) and Rochester
(t = 3.0940, p <.01, df = 16).
On the statements under the heading of "structuring program,"
American School was significantly higher than Rochester (t = 3.3842,
p < .01, df = 14), and Wilkerson (t = 3.4439, p < .01, df = 14).
On statements under the heading of "discipline and classroom
relationships," only one significant difference was found with St.
Paul significantly higher than Minneapolis (t = 3.0983, p < .01,
df = 16).
Results---Communication
The degree and mode in which the children communicated with
each other and with the teacher were also rated on a seven point
scale from "never" to "frequently." These data are presented in
Table 10a. T-tests on theae data revealed no significant differ-
ences between programs on the overall expressive output of the
sample of children.
Inspection of Table 10a reveals that gestures (other than
American Sign Language) are most frequently used between the
children in all programs. Gestures are used more frequently than
any other mode in the American School (tied with signs for most
51

Table 10
Classroom Observation Ratings of Communication Modes by Program
Program
Communication Child to Child (a)
Fingerspelling Sign Oral-Aural Combined Gestures
American Schoolfor the Deaf 1.0 3.5 2.0 1.0 3.5
Bill WilkersonHearing Center 1.0 1.0 2.0 1.0 3.25
CJIlier Hearing &Speech Center 1.0 1.0 2.75 1.0 2.75
Minneapolis PublicSchool System 1.0 1.0 1.87 1.0 3.27
,,,,w Mexico School
for the Deaf 1.5 2.87 1.5 1.5 2.75
Rochester Schoolfor the Deaf 1.5 1.0 2.0 1.0 3.5
St. Paul Tilden 1.75 1.5 2.25 1.0 3.75
Total 8.75 11.87 14.37 7.50 22.77
Communication Child to Teacher (b)
American Schoolior the D.'df 1.0 4.0 3.0 1.0 2.5
Bill WilkersonHearing Cent,,r 1.0 1.0 2.75 1.0 2.75
Cdllier Hearin?, &Speech Center 1.0 1.0 4.0 1.0 2.50
Minneapolis Publictichool System 1.0 1.0 3.0 1.0 3.27
New Mexico Schoolfor the Deaf 2.25 4.0 2.25 1.25 2.0
Rochester Schoolfor the Deaf
1.5 1.0 2.5 1.0 2.5
St. Paul Tilden 4.0 1.75 2.50 1.25 3.5
Total 11.75 13.75 20.00 7.5 19.02
52

Table 10 (Continued)
Classroom Observation Ratings of Communication Modes by Program
Program Fingerspelliag
Communication Teacher to Child (c)
Sign Oral-Aural Combined Gestures
American Schoolfor the Deaf 1.0 1.5 7.0 1.0 2.0
Bill WilkersonHearing Center 1.0 1.0 7.0 1.0 2.5
Callier Hearing &Speech Center 1.0 1.0 7.0 1.0 2.0
Minneapolis PublicSchool System 1.0 1.0 6.75 1.0 3.5
New Mexico Schoolfor the Deaf 3.75 4.5 4.75 3.0 1.75
Rochester Schoolfor the Deaf 6.0 1.0 6.5 1.0 2.5
St. Paul Tilden 6.25 1.75 6.75 1.0 2.75
Total 20.00 11.75 45.75 9.0 17.00
I Never7 , Frequently

frequent), Bill Wilkerson, Callier (tied with oral-aural), Minnea-
polis, Rochester and St. Paul programs. In the New Mexico program
signs are used somewhat more frequently than gestures.
Communication from child to teacher follows a somewhat different
pattern (Table 10b). The most common mode of communication is oral-
aural, followed by gestures. Signs are used more frequently than
other modes in the American School and New Mexico programs. Finger-
spelling is the most common mode in SI-. Paul. Gestures and oral-
aural are the most frequently used modes in the Wilkerson and Rochester
programs. The most frequent child to teacher communication in Callier
is oral-aural and in the Minneapolis program it consists of gestures.
Table 10c presents the breakdown of communication from teacher
to child. In all cases the most frequent mode of communication
was oral-aural which was consistently accompanied by fingerspelling
in Rochester and St. Paul and by signs and fingerspelling in New
Mexico. Oral-aural communication was less frequent in New Mexico
than in the other programs. Signs and fingerspelling were non-
existant or rarely observed in programs presently designated oral-
aural (American, Wilkerson, Callier and Minneapolis). Signs were
not observed in Rochester and were rarely used in St. Paul. In each
of the oral programs the second most frequently used mode of communi-
cation from teacher to child was gesture.
Results from Table 10c suggest some inconsistencies between the
stated methodology in use in some programs and the actual way in
which teachers may communicate. In the case of the New Mexico pro-
gram this probably represents a transition from the Rochester Method
54

to Total Communication and may be temporary. It will be interesting
to observe whether the same pattern will emerge if the American
School changes to the same system. A somewhat more surprising
finding is the relatively heavy reliance placed on gestures by
teachers in oral programs. At present it is unclear if teachers
are aware of the extent to which they resort to gestures. For some
it may be an integral part of the teaching process. For others it
may be unconscious. It is possible that some teachers of the deaf
convey large amounts of information through gestures of which they
are not aware.
55

Communication Analysis
Preliminary investigation revealed the majority of the population
was too young and had had too little training to instigate valid and
reliable speech articulation, and speechreading measures. At this
point, rather, a gross measure of the children's level of functioning
was desirable. For this reason, a communication analysis was devised
to investigate whether or not sound and words carried meaning for the
subjects and to assess their awareness that their lip movements and
those of others can influence, direct, and instruct. Ia addition,
the ability of the children to imitate or respond to sound produced
by others with comparable self-produced sound was investiSated. More
comprehensive evaluation of all modes of language production and
reception will be employed as the children mature.
The communication analysis was administered to 96 children in
the sample (six were absent). The analysis was composed of two parts.
The first part (expressive) consisted of showing the child nine
pictures selected from the Peabody Language Development Kit: Ball,
Airplane, Mama (woman washing dishes), Daddy (man hoeing), Baby,
Red, Blue, Shoes, and Boy or Girl (depending on the sex of tha child).
The initial trial of nine items was intended to familiarize and/or
teach the child the desired response. After the experimenter was
convinced that the child understood what was expected of him, the
pictures were presented again and the child was encouraged (in the
same manner used by his classroom teacher) to respond to each picture
56

using his very hest speech. Upon presentation of each picture, time
was allowed in which the child could respond spontaneously. If he
did not, toe word was spoken by the experimenter and the child was
encouraged to imitate the word. If the child did not immediately
imitate, several repetitions were given by the experimenter. A
reasonably close approximation was scored as an "imitation," an
indistinguishable vocalization scored as an "attempt," and no sound
at all was scored as "no response."
The second part of the communication analysis was concerned
with speechreading ability (reception). The same nine pictures were
used. Three pictures were layed out randomly and when the child's
attention was focused on the experimenter one of the three words
was spoken. The task was to choose the correct picture on the first
try. The correct picture was then removed and another substituted
randomly and so on until all nine pictures had been given. If an
error occurred, the word was repeated until the correct choice was
made. Only the first picture pointed to by the child on each trial
was scored. If the child had yet to respond after 3 or 4 repetitions
of tl word and conditions warrented, the word was simultaneously
presented via speech, sign language or fingerspelling. Correct
responses obtained by this method were not counted in the statistical
analysis.
The entire session was recorded on a Craig cassette tape
recorder for later scoring.
57

Results
Speech
The basic data consisted of the frequency with which each child
replied spontaneously, imitated, attempted, or failed to respond on
the nine words. These percentages by programs are presented in
'fable 11. Inspection of this table reveals that over 50% (in all
but one case) of the children's responses were either spontaneous
or imitated.
Frequency data were also computed for each word. Combining
the spontaneous and imitated, Ball was the easiest for our subjects
(72% correct) and Blue was the hardest (57% correct).
For statistical purposes, the children were then assigned to
a position determined by the predominat score they received (5 or
more similar responses-coin flip for ties). This was necessary
because one of the contingencies when dealing with frequency data
is that each score or subject must be independent from al] other
scores or subjects. These assignments are depicted in Table 12.
Comparisons were then made between programs, types of programs,
and types of children.
The Chi-Square statistic was used to 3ive as indication of the
degree of relationship between the categories spontaneous, imitation,
and no response, and variables such as age, hearing loss, etc. A
total of four Chi-Squares were computed: Oral vs. Combined (X2
= 2.54529),
Structured vs. Unstructured Programs (X2= 1.7973), Age 35-50 months
vs. 51-61 months (X2= 2.0759) and Decibel Loss 70-85, 86-95, 96-110
(X2= 5.92685). None of the Chi-Squares was significant. The speech
58

Table 11
Percent of Words Children Uttered Spontaneously, Imitated,Attempted, or Failed to Attempt by Program
Program
Spontaneous Imitated Attempted No Response
American Schoolfor the Deaf 28 29 5 38
Bill WilkersonHearing Center 11 17 14 58
Callier Hearingand Speech Certer 43 33 0 20
Minneapolis PublicSchool System 31 35 5 28
New Mexico Schoolfor the Deaf 30 29 9 31
Rochester Schoolfor the Deaf 21 52 6 20
St. Paul Tilden 59 33 0 8
Overall Percent 31.86 32.57 5.57 29.00
59

Table 12
Speech Assignment by Programs to Prec:Jminant Class of Response
Program Spontaneous Imitation Attempts* No Response
American Schoolfor the Deaf 4 5 0 5
Bill WilkersonHearing Center 2 1 3 7
Callier Hearing& Speech Center 7 8 0 3
Minneapolis PublicScnool System 6 8 0 5
New Mexico Schoolfor the Deaf 3 5 0 4
Rochester Schoolfor the Deaf 2 8 1 2
St. Paul Tilden 4 3 0 0
* Not included in statistical analy-is.
60

according to decibel loss did show a trend, with the lesser hearing
Losses giving rise to better scores.
One factor of possible importance was the length of time each
child had attended his respective program. For example, a child that
has been in a program for two years should be more adept at using his
powers of speech than a child in a program for one year or less.
Therefore, children were placed into their groups according to time
in a program; 1 to 12 months; 13 to 24 months; and 25 to 36 months
and above. The groups were compared between programs on length of
training time, on amount of structure, and between oral and combined
orientation. This was accomplished by taking the number of spontaneous
and imitated utterances and dividing by the number of possible utter-
ances yielding a proportion of correct responses (See Table 13). These
proportions were then subjected to a test of significance with the
following results:
Using weighted mean proportions, overall comparisons were made of
children in each of the three groups (1-12 months; 13-24 months; and
beyond-25 months) across programs. No significant differences were
found.
Between program comparisons resulted in the following: For
children in programs 12 months or less, St. Paul (Tilden) was signi-
ficantly higher than Callier (z = 2.8125, p < .01), New Mexico
(z = 2.9445, p < .01), American School (z = 4.2407, p < .001) and
Bill Wilkerson (z = 5.1313, p < .001). Rochester School was
significantly higher than Bill Wilkerson (z = 3.6945, p < .01).
61
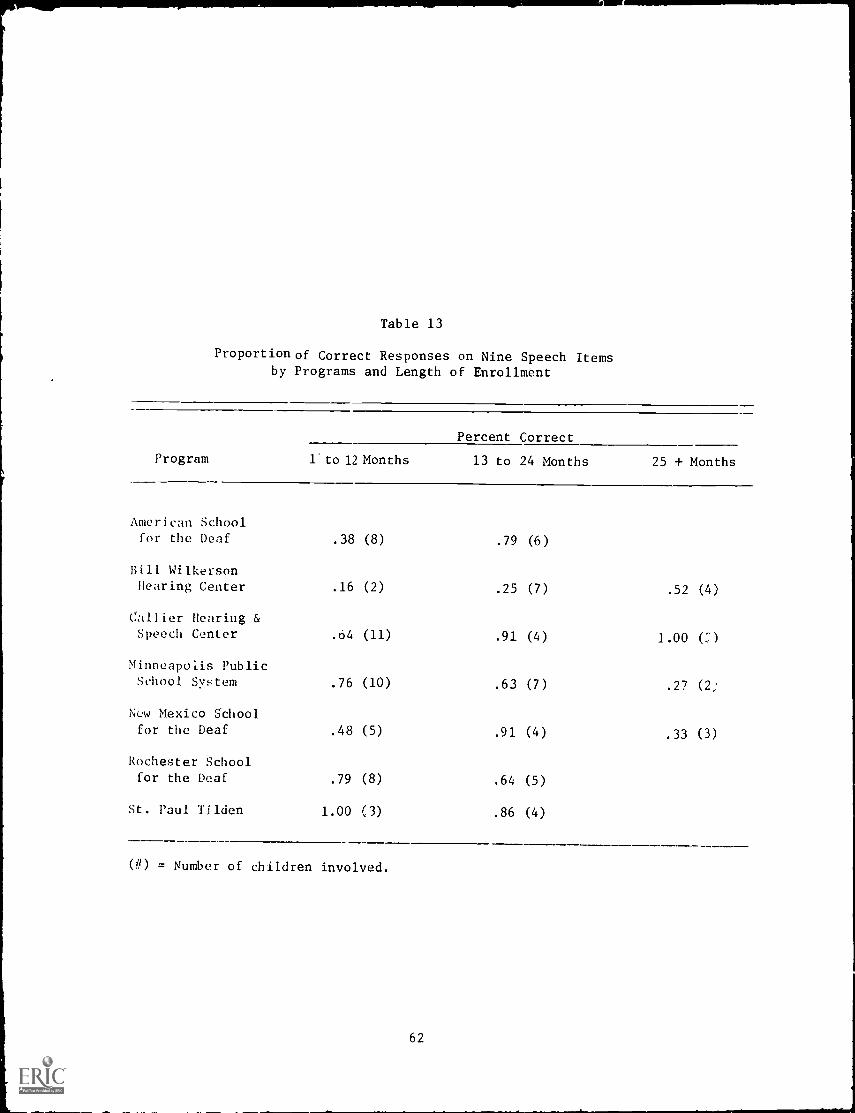
Table 13
Proportion of Correct Responses on Nine Speech Itemsby Programs and Length of Enrollment
Percent Correct
Program 1-to 12 Months 13 to 24 Months 25 + Months
American Schoolfor the Deaf .38 (8) .79 (6)
Bill WilkersonHearing Center .16 (2) .25 (7) .52 (4)
Callier Hearing &Speech Center .64 (11) .91 (4) 1.00 (;)
Minneapolis PublicSchool System .76 (10) .63 (7) .27 (2;
New Mexico Schoolfor the Deaf .48 (5) .91 (4) .33 (3)
Rochester Schoolfor the Deaf .79 (8) .64 (5)
St. Paul Tilden 1.00 (3) .86 (4)
(#) = Number of children involved.
62

For children in programs 13 to 24 months, New Mexico, Callier,
St. Paul And American School were significantly higher than Bill
Wilkerson at the .0l level or beyond.
For children in programs 25 months or longer (only 4 schools
involved: Callier, Wilkerson, New Mexico and Minneapolis) Callier
was significantly higher than New Mexico (z = 3.5023, p < .01) and
Minneapolis (z = 3.5794, p < .01).
Comparisons were then made on the basis of the amount of structure
inherent in the programs. For the groups with less than one year or
more than 25 months, the results were not significant. For children
with 13 to 24 months of training the structured programs were signifi-
cantly higher than -.he unstructured programs (z = 3.5678, p < .01).
No significant differences were found between oral and combined
programs.
A Kuder-Richardson reliability coefficient was coxputed or the
individual items of the speech portion of the communication ana.,ysis.
A high reliability coefficient (.70 or higher) means that the test
items were equal in difficulty and capable or producing similar
response patterns in different people. The r "liability coefficient
was .9349 indicating homogeneity and, therefore, validity of the test
items.
S:peechreading
The basic data consisted of the freqhency with which each child
speechread correctly, incorrectly, or failed to respond. These
percentages are presented by program in Table 14. Table lz. also
includes the percentages of children who correctly responded with the
imultaneous presentation of the word via signs or fingerspolling.
63

Table 14
Breakdown of Correct and Incorrect Speechreading Items by Programs
Program No. of
Subjects Correct
American School
% Correct:
Signs & F.S.Added Incorrect No. Resp.
for the Deaf 14 58 13 21 7
Bill WilkersonHearing Center 13 20 6 28 45
Callier Hearing &Speech Center 18 71 0 23 5
Minneapolis PublicScnool System 19 58 .6 17 23
New Mexico Schoolfor the Deaf 12 64 2 5 29
Rochester Schoolfor the Deaf 13 63 10 13 14
St. Paul Tilden 7 68 6 14 7
Overall Percent 57.00 5.3 17.28 18.57
64

Since this was a test of speechreading, these data are presented only
for inspection and were not included in the statistical analyses.
It should be emphasized that they do not reflect receptive ability
for signs and fingerspelling. This will be assessed beginning in
the 1971-72 academic }ear.
Subjects were assigned to a position on the basis of their
most frequent response as shown in Table 15. Chi Squares were
then computed with the following results: Age 35-50 months vs.
51-61 months (X2= 1.682246), Decibel Loss 70-95 vs. 96-110dB
(X2= 1.752436), Oral vs. Combined (X2 = 4.391703). None of the
comparisons was significant.
Additional comparisons were made according to the length of
time in training using the underlying logic 'that a child with two
years of training in speechreading should be more proficient at this
skill than a child with a year or less of training. (See Table 16
for percent correct for all programs.) The following results were
obtained:
An overall comparison (using weighted means) across programs
revealed no significant differences, e.g., children in the sample
with three or more years of training were not significantly more
proficient at the speechreading task than children with one year
or less training.
Comparisons of children in programs 12 months or less revealed
tIvit Rochester, Minneapolis, and Callier were significantly higher
than Bill Wilkerson at the .01 level or greater.
65
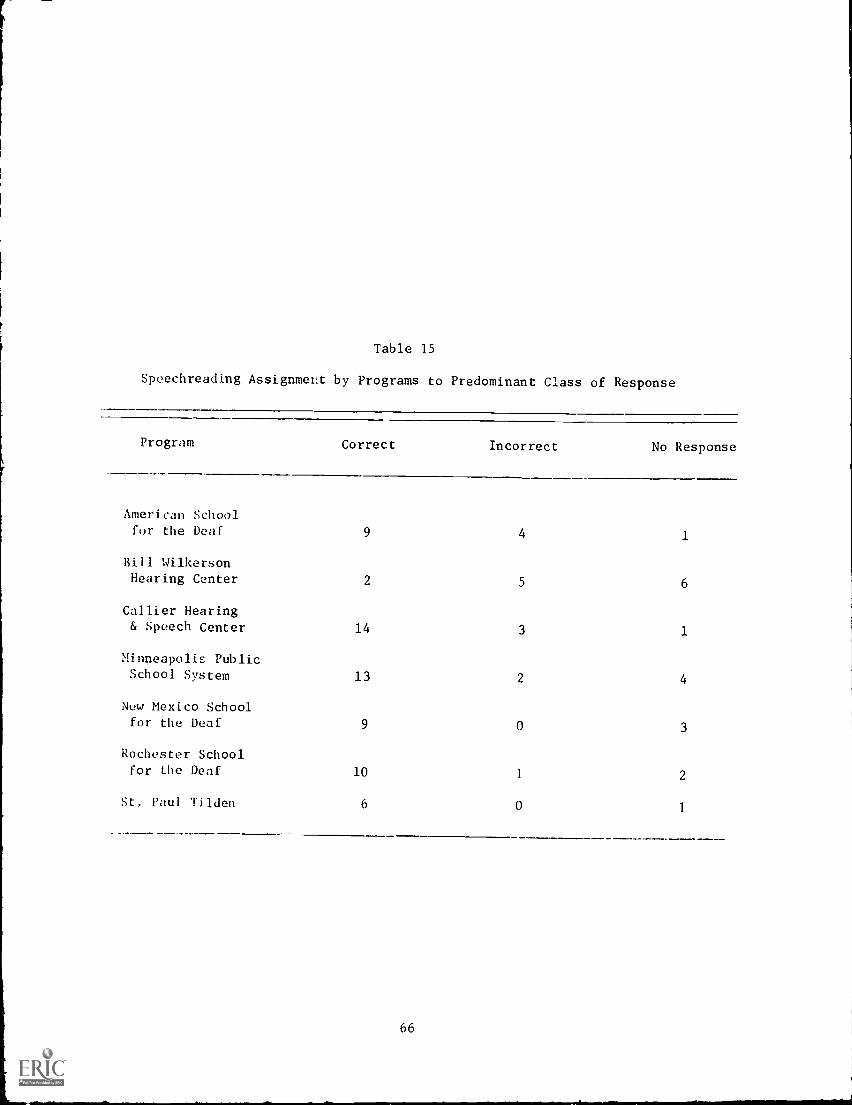
Table 15
Spcechreading Assignment by Programs to Predominant Class of Response
Program Correct Incorrect No Response
American Schoolfor the Deaf 9 4 1
Hill WilkersonHearing Center 2 5 6
Calker Hearing& Speech Center 14 3 1
Minneapolis PublicSchool System 13 2 4
New Mexico Schoolfor the Deaf 9 0 3
Rochester Schoolfor the Deaf 10 1 2
St, Paul Tilden 6 0 1
66

Table 16
Proportion of Correct Responses on Nine Speechrcading Itemsby Programs and Length of Enrollment
Program Percent Correct
1 to 12 Months 13 to 24 Months 25 + Months
American Schoolfor the Deaf .50 (8) .68 (6)
Bill WilkersonHearing Center .00 (2) .21 (7) .30 (4)
Callier Hearing& Speech Center .65 (11) .72 (4) .92 (3)
Minneapolis PublicSchoo System .67 (10) .54 (7) .28 (2)
New Mexico Schoolfor the Deaf .44 (5) 1.00 (4) .48 (3)
Rochebter Schoolfor the Deaf .76 (8) .42 (5)
St. Paul Tilden .63 (3) .75 (4)
(#) = Number of children involved
67
L
For children in programs 13 to 24 months, New Mexico was signifi-
cantlyhigher than Rochester (z = 3.5301, p < .01) and Bill Wilkerson
(z = 6.4542, p < .001). For children in programs longer than 24 months,
no significant differences were revealed.
Additional comparisons were computed between programs with oral
and combined orientations and between structured and unstructured
programs. For children with 13 to 24 months of training, structured
programs were significantly higher than unstructured programs (z = 3.5916,
p < .01). All other comparisons were not significant.
68

Brown Parent Attitude Scale
One important variable in the educational development of pre-
school children, both hearing and deaf, is their parents. The
attitudes, feelings and expectations they hold for their children
may significantly affect educational progress. Attitudes and
expectations may predict success in pre-school and beyond.
Of particular importance in the present study are any changes
that may occur in parent attitude as the child gets older. Will
parents lower their expectations, or raise them? If there are
changes, will they be a function of the child's success or failure?
What role does the child's program play in the formation and change
of parent attitudes?
A Parental Information and Attitude Scale for Parents of Hear-
ing Impaired Children (Appendix C) has been developed by Dr. Donald
W. Brown at Gallaudet College. This scale was distributed to all
parents in the sample for completion and return. The scale is
divided into 3 parts: Part 1 deals with general information such
as occupation, education, and questions concerning the discovery
of the child's hearing impairment.
Part 2 is entitled "Your Child Thirty Years from Now" and
assesses parental expectation by having parents rate statements
(from "very good chance" to "no chance at all") such as "will be a
college graduate," etc.
Part 3 contains statements and opinions often expressed about
69

hearing impaired individuals. The parents are requested to circle
the choice of answers which best indicates their own feelings about
that particular statement.
The data were coded onto IBM cards and several programs of
descriptive statistics were run. Ninety-six parents returned the
completed questionnaires.
Results
Part I: General Information
Table 17 contains a summary of the questions related to the
parents themselves. Examination of Table 17 reveals that the parents
are relatively young (mean age = 32.16 years), and well educated
(68 have completed 12 or more years of school, 20 have college
degrees and eight have done some graduate work).
For information on deafness, the parents tend to rely on school
administrators or sources other than books and periodicals. Only
three families subscribe to any journal and only 50 of the responding
parents have ever read any journals or books related to deafness.
Tables 18, 19, 20 and 21 contain a summary of questions concern-
ing the hearing impaired children. The hearing impaired child was
the first-born in 21 families and sixth-born in only tc.o families.
When the hearing loss was suspected, 43 parents originally went to
a pediatrician, 22 visited general practitioners, 12 visited audiolo-
gists, and eight visited otologists. In 13 cases, diagnoses other
than hearing impairment were given including mental retardation,
"slowness," brain damage and hyperactivity.
70

Table 17
Parent Information from Brown Attitude
Scale
Groups
Mean Age
Mean No. Years of
Formal Education
Working Mothers
Full/Part Time
No. Not Reading
Journal since Child's
Impairment
Members of Org.
for Parents of
Hrng. Impaired
Local
State
Mothers
30.98
12.39
13
19
21
1
Fathers
33.63
13.77
27
16
2
Oral Program
Parents
30.66
12.80
11
31
22
3
Combined Program
Parents
35.41
13.35
215
15
0
Structured
Program Parents
33.40
13.19
927
25
2
Unstructured
Program Parents
29.75
12.57
419
12
1
Overall
32.16
12.97
13
46
37
3
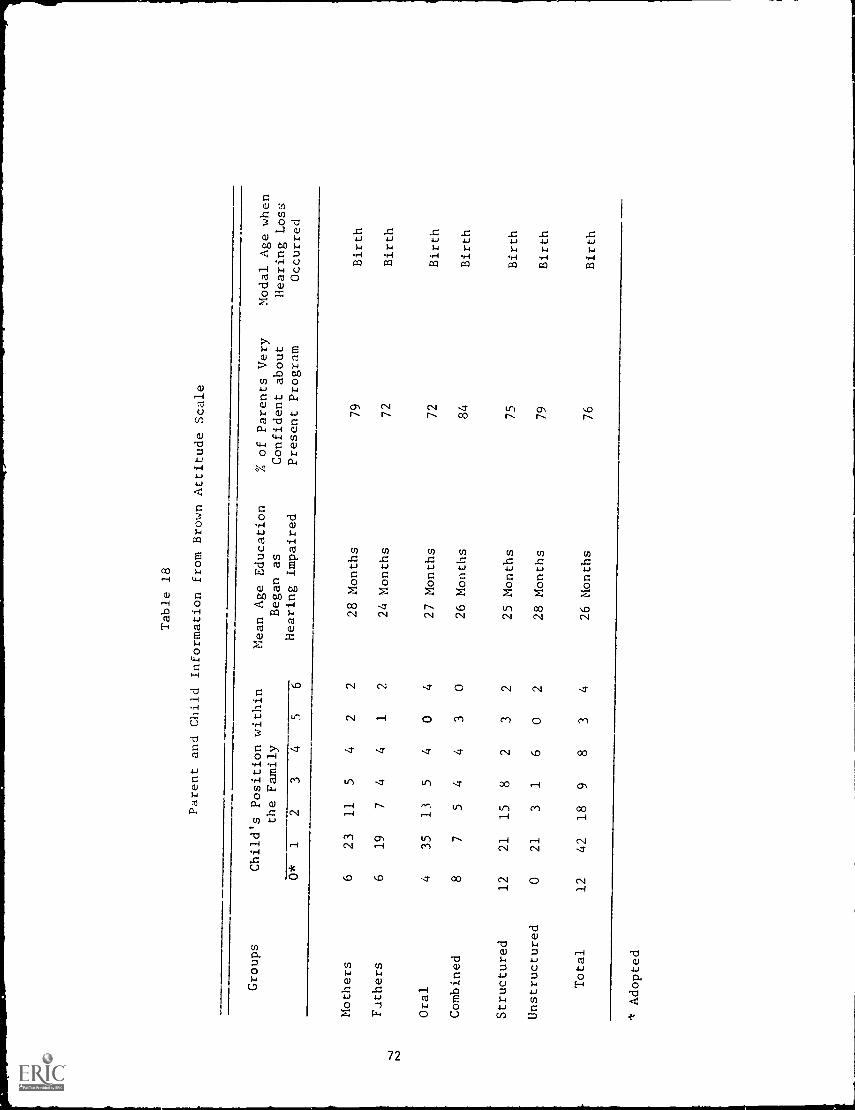
Table 18
Parent and Child Information from Brown
Attitude Scale
Groups
Child's Position within
the Family
Mean Age Education
Began as
Hearing Impaired
% of Parents Very
Confident about
Present Program
Modal Age when
Hearing Loss
Occurred
0*
12
34
56
Mothers
623
11
54
22
28 Months
79
Birth
Fathers
619
74
41
224 Months
72
Birth
Oral
435
13
54
04
27 Months
72
Birth
Combined
87
54
43
026 Months
84
Birth
Structured
12
21
15
82
32
25 Months
75
Birth
Unstructured
021
31
60
228 Months
79
Birth
Total
12
42
18
98
34
26 Months
76
Birth
Adopted
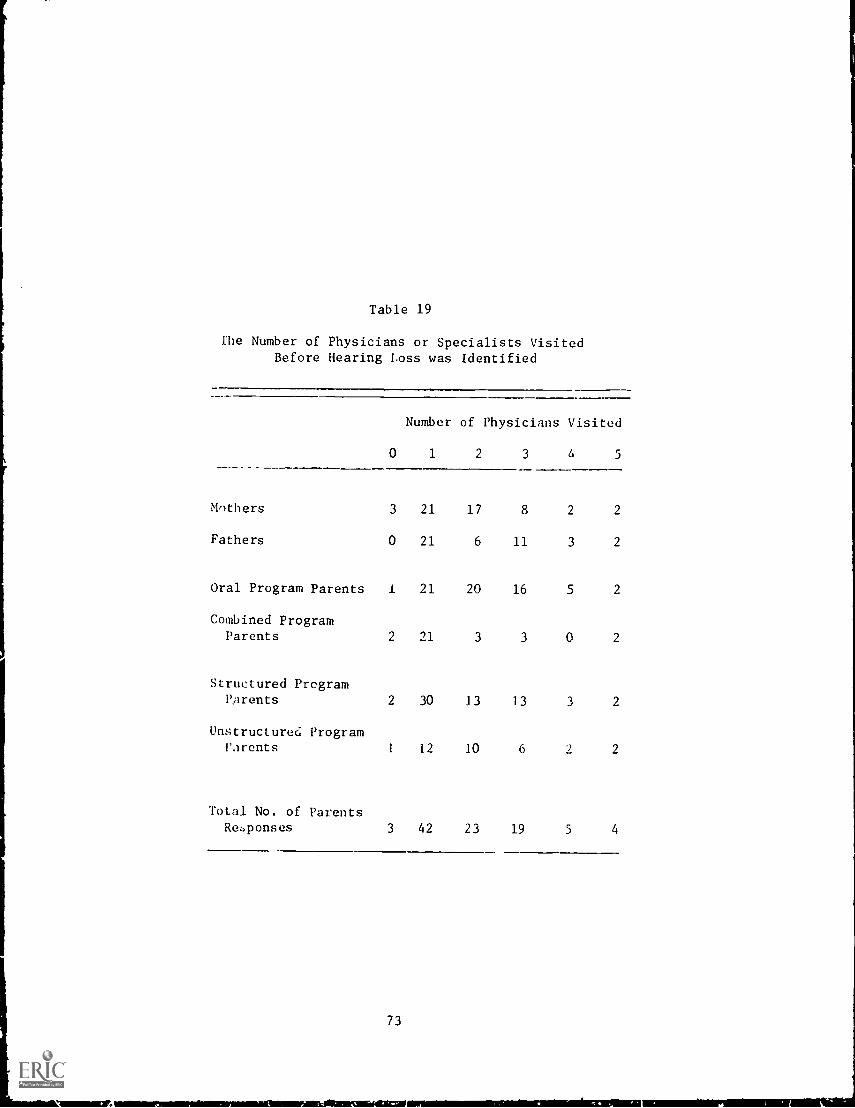
I
Table 19
Ilse Number of Physicians or Specialists VisitedBefore Hearing Loss was Identified
Number of Physicians Visited
0 1 2 3 G 5
Mothers 3 21 17 8 2 2
Fathers 0 21 6 11 3 2
Oral Program Parents 1 21 20 16 5 2
Combined ProgramParents 2 21 3 3 0 2
Structured ProgramPArents 2 30 13 13 3 2
Unstructured ProgramParents 1 19 10 6 2 2
Toial No. of ParentsRe,,ponses 3 42 23 19 5 4

i
Table 20
Person Originally Visited by
Parents when
Hearing Loss was Suspected
Pediatrician
Gen.
Practitioner
Audiologist
Otologist
S&H Center
Other
Mothers
21
13
74
53
Fathers
22
95
43
0
Oral Program
Parents
24
21
94
52
`-.1
.L.,
Combined Program
Parents
19
13
43
1
Structured Program
33
95
87
1
Unstructured Program
10
13
70
12
Total Parent Responses
43
22
12
88
3

1
Table 21
Diagnoses Given Other Than Hearing Loss
M.R.
"Slow"
C.P.
Heart Trouble
Hyperactive
Brain Damage
None
Mothers
28
31
21
33
Fathers
14
21
00
33
Oral Program
Parents
112
32
01
42
Combined Program
Parents
20
20
20
24
Structured Program
Parents
27
40
21
45
Unstructured Program
Parents
15
12
00
21
Total No. of Parents
Responses
312
52
21
66

Fifty-five percent of the parents reported that their child
had begun his education in a program for the hearing impaired by
the age of 24 months. Seventy-three parents are "very confident"
about placing their child in his current program. Only four
reported a "serious lack of confidence." In this same vein, 40
parents have visited their child's classroom 12 or more times while
only two have never visited the classroom.
Fifty-one parents feel that blindness or cerebral palsy are
more educationally handicapping than deafness.
Part II: Your Child Thirty Years from Not%
The data consisted of the number of parent responses to each of
nineteen statements rated on a five point scale from "very good
chance" to "no chance at all." The Chi Square statistic was used
to test for differences between groups (fathers-mothers, oral
program-combined program, structured-unstructured program).
There are six statements in which all groups had modal agree-
ment (the largest number of responses fell in the same category).
The parents telt there was a "very good dance" that their hearing
impaired child would: drive a car, be close to brothers and sisters,
know the neighbors well, be in good health, keep in touch, and belong
to organizations of deaf and hard of hearing. Parents indicated
there was "some chance" their child would have more deaf than
hearing friends, and "no chance at all" that he would read at the
fifth or sixth grade level or below.
Five out of six groups agreed there was some chance their
child would marry a normal hearing person, and a very good chance
76

that he would be a college graduate.
The following differences were found at the .05 level of signifi-
cance. Differences of tais magnitude have not been reported so far
in this report, for it is possible to obtain similar results by
chance in 5 out o: every 100 times. But the results do indicate
a cifinite directilnal trend which may be of interest to readers.
Ratings on the .tatements "will have speech that is easily
understood by most p.-_ople." and "will graduate from a regular high
school" were much nigher for parents of children in oral programs.
In other words, tLey felt these things were much more likely to occur
than did pareu's )'. children in combined programs. Similarly,
oral program parents felt there was little or no chance that their
children would haNde difficulty in using English correctly.
Differences were also found between parents of children in
structured versus unstructured programs. On the statements concern-
ing speech and using English correctly, the unstructured group ratings
were much more positive than the structured group.
Only one difference was found to be significani. at the .01
level. On the statement "will use sign language as his preferred
means of communication," parents of children in unstructured programs
were more certain that this would not be the case (X2
= 10.6833,
p - .01). There were -to diffecences between the combined and oral
groups.
Part ill
The data consiF.ted of the number of parent responses to fourteen
statements each containing five alternative answers in multiple choice
77

form. Instructions to the parents were as follows:
Many statements and opinions have been expressed
about hearing handicapped people. We are interested
in learning the reactions that ycu, as the parent of
a hearing impaired child, would have to the following
statements. Please read .ach statement carefully.
Circle the letter in front of the response which best
expresses what you think of or would do about the
statement.
Results
Six groups were compared: oral-manual, structured-unstructured
program, and father-mother. All of the groups evidenced modal agree-
ment on three questions. To the statement that many fewer deaf people
than hearing people are able to go to college, parents agreed that
"they were talking about previous generations and were unaware of
current progress." To the statement that many deaf adults who do not
have intelligible speech are successfully cmplo,Ted and well adjusted,
the parents replied "this does not surprise me." In addition, most
parents in all groups agreed that there were no disadvantages in geting
together with other parents ar their child's school.
There are several other questions where almost complete agreement
prevailed. Table 22 presents each of these statements and the choice
of most parents f)llowed by the divergent group.
A test of significance of proportions compared statements where
there was little or no agreement between the groups. Only one
78

Table 22
Summary of Questions on which Only One 2,roup of Parents Differed
Question 1. Alexander Graham Bell, inventor of the telephone and strong supporterof teaching speech to deaf children, once said that fingerspellingwas the fastest and most efficient way to teach language to deafchildren.
d. This is interesting but probably needs some research to proveit or disprove it.
a. (Combined group) I think he was probably right.
Question 3. There is so much disagreement about education of the deaf that the bestthing to do is:
d. Realize that what seems to be best for others may not be best formy child.
a. (Combined group) Be sure I've picked the best school and thenget information frorA that school's staff.
Question 6. Most deaf people marry a deaf person.
d. This is fine if it's what the deaf want.
c. (CuAlbined group and fathers) This is true only if the deaf haveheea segregated from contact with hearing people.
Question 7. If a frit, of .tine discovered that her child was deaf:
a. I'd tell Ivr about the school my child is in.
e. (Unstit.:%tir-d group) I would feel obligated to share with herthe sat:sfaction I have now that I've foud the right program.
Question 9. An oral teacher of the deaf claims that ma-ay deaf children can't learnto speak and lipread.
e. I agree--some can, but many can't.
a. (Unstructured group) The statement is false and I can't believea teacher would say that.
Question IL A deaf adult says that he and his deaf friends don't think speech isvery important.
c. Possibly he and his friends have found satisfactory adjustmentwithout speech.
a. (Combined group) I can't imagine anyone, deaf or hearing saying that.
7q

Table 22 (Continued)
Summary of Questions on which Only One Group of Parents Di:fered
Question 12. We all have too little time. Because of this I should devote my shortreading time to:
a. Books and articles whose authors know what they're talking about.
e. (Combined group) Books on manual communication so I can get to knowmy child better.
question 13. Most deaf people prefer to associate with other deaf people rather thanhearing people.
d. I imagine this is true they understand each other's speech easier.
e. (Mothers) If they are happy doing this--that's fine.
Question 14. The primary function of an educational program of hearing impairedchildren is to:
c. Development speech and speechreading skills.
d. (Combined group) Provide appropriate instruction in academicskills, i.e., reading, language, writing.
80

significant difference was found. The statement reads: "Stuckless
and Birch report that their study has indicated that manual communication
(sign language and fingerspelling) does not hindc- the development of
speech in young deaf children." Parents of children in combined
programs chose the answer "This is reassuring because I've wondered
about that." A significantly different proportion of parents of children
in oral programs chose the following statement: "They mean this is true
if the child has already developed speech before he is exposed to manual
communication" (z = 3.7572, p < .01).
81

Semantic Differential
In addition to the Brown Parent Attitude Scale, another measure
of attitude was desired: one that would systematically compare the
attitudes of groups of parents towards concepts related to deafness.
Consequently, a scale was devised using the semantic differential
technique (Osgood, Suci & Tannenbaum, 1957). This principle involves
rating a concept (like deafness) along a seven step scale between
pairs of bipolar adjectives (sweet-sour, etc.). The rationale and
execution of the semantic differential are complex and the reader
is referred to Osgood et al. (1957) for more detailed information and
description of the differential as an attitude measuring tool. In
general, however, most authorities agree that attitudes are not only
learned but are predispositions to respond in certain ways. The
semantic differential developed measures attitudes towards 19 concepts,
as listed Lelow:
Mother
*
Coat
Food
Speechreading-Lipreading*Hearing Imcaired
Water*Integration of deaf
child into ahearing class
CLr
Sign Language*Hearing-Aid
Concept Related to Deafness
82
Father
Book
Hat*Auditory Training
*Fingerspelling
Picture*Deafness
*Speech
Ball
Of the 19 concepts, nine are obviously related to deafness and
ten are not. It was hypothesized that if all of the parents in the
samples are drawn from similar populations, then there would be no
overall differences between different groups. Responses to words
such as food and picture for example, would show little variability.
If any differences were to surface on the particular instrument em-
ployed, they could be expected to be in reactions to words related
to hearing impairment. Thus, differences in relation to concepts
such as Sign Language and Auditory Training might be traced to varia-
tions between programs in emphasis and parent counseling.
The 12 pairs of bipolar adjectives were chosen on the basis on
previous work by the senior investigator. A sample page from the
semantic differential developed is presented in Appendix D.
All parents of the sample of children received a copy of the
semantic differential to be filled out and returned with the Brown
Parent Attitude Scale. All the returned scales were punched on IBM
cards and computer analyzed.
Results
At this point in the study it is hypothesized that parents may
differ along dimensions according to the program in which their child
in enrolled. Presumably parent: have certain attitudes towards various
methodolcgies either because they hve chosen a particular program
for the child or because through patent involvement and parent-
teacher meetings they have been convinced of the efficacy of a parti-
cular program's methods. One goal of the study is to investigate
changes in attitude in parents as children progress through the
83

various educational systems.
Analysis of variance was performed on responses of parents of
children in oral programs versus parents of children in combined
(oral/manual) programs. Only families with both parents responding
were used resulting in 28 combined program parents and 56 oral prO-
: 'am parents. To facilitate .statistical analysis the oral program
parents were randomly divided into two groups of 14 families each
Three analyses of variance were performed:
Oral Group I versus Combined Group
Oral Group II versus Combined Group
Or.,1 Group I versus Oral Group II
Summary data are presented in Tables 23, 24, and 25 for those readers
familiar with analysis of variance. In general the results are in-
terpretable as follows:
There were no significant differences on the combined versus oral
variable. This means that by isolating this factor independently of
other factors being measured the parents do not differ from each other
as groups. This is encouragine in that subsequent comparisons, if
significant, will be a result of the new added dimension and not a
result of original differences in parent attitude.
The main effect of "concepts" was significant in all three compari-
sons. The concepts, as previously noted, were originally chosen such
that nine were deaf-related and ten were relatively neutral words such
as car and coat. Differences here suggest the technique was obtaining
differential results, as planned.
The important variable was the interaction between the combined-
84
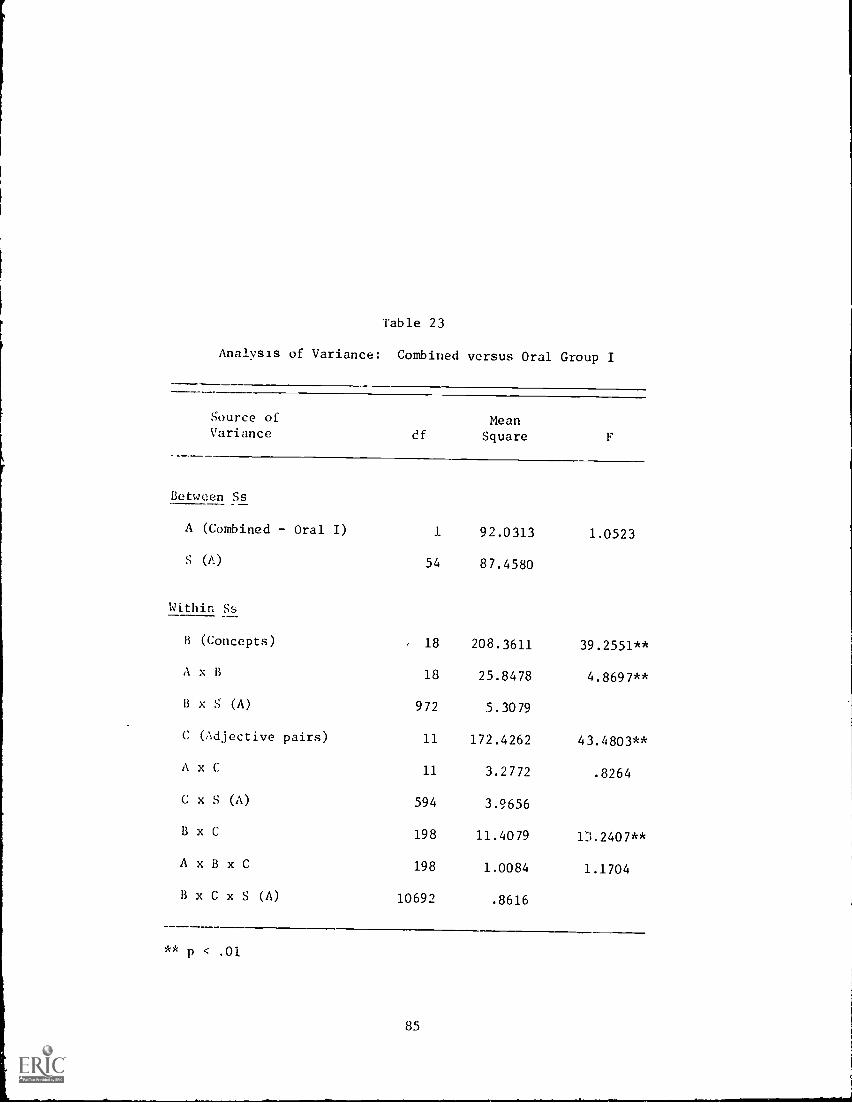
Table 23
Analysis of Variance: Combined versus Oral Group I
Source ofVariance df
MeanSquare F
Between Ss
A (Combined - Oral I)
S (A)
1
54
92.0313
87.4580
1.0523
Within Ss
B (Concepts), 18 208.3611 39.2551**
A x B 18 25.8478 4.8697**
B x S (A) 972 5.3079
C (Adjective pairs) 11 172.4262 43.4803**
A x C 11 3.2772 .8264
C x S (A) 594 3.9656
B x C 198 11.4079 n.2407**
A x B x C 198 1.0084 1.1704
B x C x S (A) 10692 .8616
** p < .01
85

Table 24
Analysis of Variance: Combined versus Oral Group II
Source of
Variance dfMeanSquare F
Between Ss
A (Combined Oral II)
S (A)
1
54
127.3202
88.3019
1.4419
Within Ss
B (Concepts) 18 214.7243 43.8745*
A x B 18 25.1324 5.1353**
B x s (A) 972 4.8940
C (Adjective pairs) 11 196.0052 28.9261**
A x C 11 20.3838 3.)083**
C x S (A) 594 5.7759
B x C 198 10.5250 12.0667**
A x B x C 198 1.3863 1.5893**
B x C x S (A) 10692 .8722
** p c .01
86
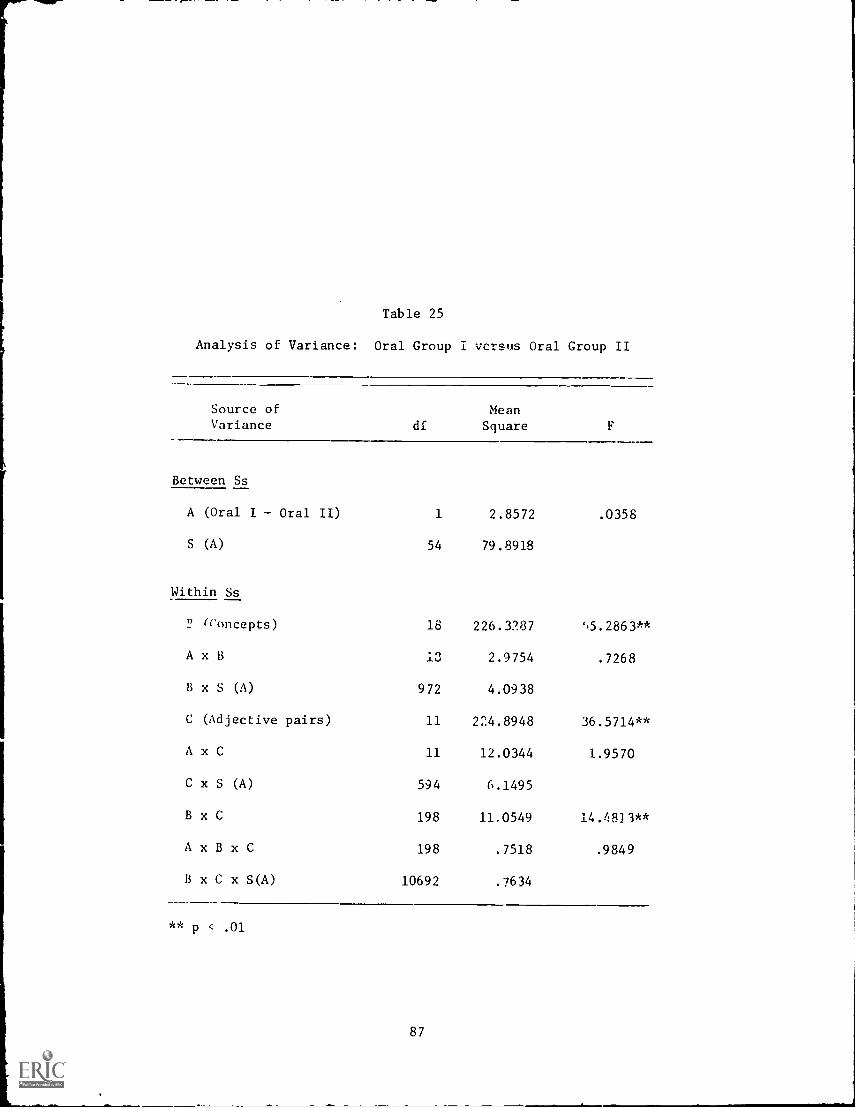
Table 25
Analysis of Variance: Oral Group I versus Oral Group II
Source ofVariance di
MeanSquare F
Between Ss
A (Oral I Oral II)
S (A)
1
54
2.8572
79.8918
.0358
Within Ss
T.! (concepts) 18 226.3287 '6.2863**
A x B .0A.0 2.9754 .7268
B x S (A) 972 4.0938
C (Adjective pairs) 11 224.8948 36.5714**
A x C 11 12.0344 1.9570
C x S (A) 594 6.1495
B x C 198 11.0549 14.0113**
A x B x C 198 .7518 .9849
B x C x S(A) 10692 .7634
** p < .01
87

oral program groups and the various concepts. Significant inter-
actions were found in the Combined versus Oral Group I (F = 4.8697,
df = 18/972, p < .0i) and the Combined versus Oral Group II compari-
son (F = 5.1353, df = 18/972, p < .01). But differences were not
found between the two oral groups (I and II) when they were compared
with each other. This means that when combined program parents and
oral program parents are administered this questionnaire, the two
groups respond in a significantly different way to the concepts and
that the semantic differential was sensitive enough to measure the
differences.
In order to present the results of the interaction clearly,
the means for the deaf-related words were plotted in Figure 5.
Inspection of Figure 5 reveals that the parents in both groups have
similar attitudes towards the concepts of Hearing Aid, Hearing
Impaired, Speech, and Auditory Training. Combined program parents
are more positive iL their attitudes toward Speechreading, Sign
Language, and Fingerspelling while oral program parents are more
positive in their attitudes toward Deafness, and Integration of a
deaf child into a hearing class.
It is apparent that parents with children in the combined programs
do not perceive these programs as manual only. Speechreading.L Hearing
Aid, Speech and Auditory Training all receive positive ratings
equivalent to Sign Language and Fingerspelling.
As with the concepts, the main effect of adjective pairs was
also significant in all three comparisons. The pairs were selected
because of divergent measuring properties aid significant effects were
88

-14
0 0
c7 U
ro
)-,
ct)
0
OAT1ISOd
Finger-
spelling
AuditoryTraining
Sign
Language
Integra-tion
Speech
=
Hearing =Impaired
Deafness
HearingAid
Speech-reading
O
aco)

expected (Osgood, et al., 1957). Me into-action of concepts and
adjective pairs (B x C) was also significant in the three analyses.
If the semantic differential is operating effectively, one would
expect the adjective pair responses to vary according to the con-
cepts being rated or judged.
The interaction between the combined-oral variable and the
adjective pairs (A x C) was significant in only one comparison
(Combined versus Oral Group II, F = 3.00, df = 11/594, p < .01).
Also the combined-oral by concepts by adjective pairs interaction
(A x B x C) was significant in the Combined versus Oral Group II
comparison (F = 1.5893, df = 198/10692, p .01).
Analysis of variance ,gas also performed on parents of chilJrcn
in structured programs versus parents of children in unstructured
programs. As before, only families with both parents responding
were used resulting in 28 unstructured program parents and 56
structured program parents. The structured program parents were
randomly divided into two groups of 14 families each. Again three
analyses of variance were performed.
Structured Group I versus Unstructured
Structured Group 1-1 versus Unst uctured
Structured Group I versus Structured Group II
Summary data are presented in fables 26, 27 and 28.
There were no significant differences between parents on the
structured-unstructured variable in isolation. This means that any
differences obtained between these groups upon addition of the con-
cepts and adjective pair variables are a function of these additions
90

Table 26
Analysis of Variance: Structured I versus Unstructured
Source ofVariance df Square F
Between Ss
A (Structure I -Unstructured)
S (A)
1
54
76.2977
75.2779
1.0135
Within Ss
B (Concepts) 18 240.9564 52.9485**
A x B 18 13.1310 2.8855**
B x S(A) 972 4.5508
C (Adjective pairs) 11 202.9362 48.6618**
A x C 11 5.5708 1.3358
C x S(A) 594 4.1703
B x C 198 11.7722 14.7198**
A x B x C 198 .9941 1.2430
B x C x S(A) 10692 .7997
** p < .01
91

Table 27
Analysis of Variance: Structured II versus Unstructured
Source of
Variance dfMeanSquare F
Between Ss
A (Structure IIUnstructured)
S (A)
1
54
.1730
89.2660
.0019
Within Ss
B (Concepts) 18 204.1178 39.2326**
A x B 18 20.2760 3.7955**
B x S(A) 972 5.3421
C (Adjective pairs) 11 183.7267 30.4131**
A x C 11 5.7128 .9457
C x S(A) 594 6.0410
B x C 198 10.1376 12.0084**
A x B x C 198 1.1676 1.3830**
B x C x S(A) 10692 .8442
** p < .01
92
i

r
Table 28
Analysis of Variance: Structured I versus Structured II
Source ofVariance df
MeanSquare F
Between Ss
A (Structured I - 1 69.2043 .7441Structured II)
S (A) 54 92.9973
Within Ss
B (Concepts) 18 199.1371 40.3079**
A x B 18 4.9404 1.0318
B x S(A) 972 4.7882
C (Adjective Pairs) 11 200.2253 27.9781**
A x C 11 5.0974 .7123
C x S(A) 594 7.1565
B x C 198 11.0995 13.0337**
AxExC 198 1.0495 1.2324
B x C x S(A) 10692 .8516
** p < .01
93
1
and not attributable to inherent differences in the two groups.
The main effect of "concepts" was significant in all three
comparisons as well as the two concepts by structured-unstructured
interaction (Structured I versus Unstructured, F = 2.88, df = 18/972,
p < .01) and Structured II versus Unstructured, F = 3.79, df = 18/972,
p < .01). Evidently there are differences in the ways parents of
children in structured programs respond to the concepts as opposed
to the ways parents of children in unstructured programs respond.
In order to see the shape of this interaction, the means for the
deaf-related words were plotted in Figure 6. Inspection of Figure 6
reveals that parents in both groups have similar attitudes toward
the concepts of Hearing Aid, Hearing Impaired, Speech, and Deafness.
Unstructured program parents feel more positively toward the concepts
of Integration of deaf child into hearing class, and Auditory Trainin&
while structured program parents are most positive toward Speech-
readia, Sign Language, and Fingerspelling.
The main effect of adjective pairs was significant in three com-
parisons. As expected, also, the interaction of concepts with adjective
pairs was significant indicating that the semantic differential is
operating correctly. The triple interaction (A x B x C) is not
readily interpretable.
94

X X N
N MUMf;77:`
\NX%Xl laN1 N ,
S, MXXILW 11,N,..N\X`4,:4:2t 7.14
AXN'.<
%NIL. X, N16,11._ \WM, 1:v1-2,',
,
I - .
a1
1
1. The mean IQ scores of the subjects, as measured by the Leiter
International Performance Scale, was 113.7. Children in structured
programs tended to have higher scores than children in unstructured
programs.
2. On modifications of visual-motor subtests of the Illinois Test
of Psycholinguistic Abilities (ITPA), the children as a group scored
slightly below the norms for hearing children. Regardless of program,
methodology, or etiology a definite pattern of strengths and weak-
nesses appeared. Oil Visual Sequential Memory and Manual Expression
the children were above the norms and on Visual Reception and Visual
Association they were below the norm. Performance on the Visual
Closure subtest revealed a substantial retardation, perhaps due
to the timed nature of the test.
3. No significant differences (defined as < .01) were found between
combined (oral-manual) and oral programs on the ITPA. Children in
structured programs scored higher than those in unstructured. When
grouped by etiology, children with hereditary deafness were superior
to other classifications.
4. The most common mode of communication between children was through
gestures, regardless of the official philosophy of the program. The
only exception was the New Mexico program where signs were the most
common mode.
5. Communication from child to teacher most frequently involved the
96

oral-aural mode, closely tollowed by gestures. Programs showed
great variability in this measure. Signs were most frequent in
the American School and New Mexico programs; gestures were most
frequent in the Minneapolis program; oral-aural communication was
most frequent in Callier; fingerspelling was the most common mode
in St. Paul; and in the Wilkerson and Rochester programs, gestures
and oral-aural communication were most common.
6. Communication from teacher to child most frequently was oral-
aural, accompanied by fingerspelling in Rochester and St. Paul
and by signs and fingerspelling in New Mexico. Teachers in oral
programs used gestures as much as, or more than, teachers in com-
bined programs.
7. Speech and speechreading abilities of the children, around
chronological age four, were extremely difficult to assess during
the first year of testing. Ratings of children's attempts of
articulation showed no significant differences between oral and
combined or structured and unstructured programs.
8. No differences in speechreading were found in the oral-combined
and structured-unstructured comparisons.
9. Responses to the Brown Attitude scale suggest that parents tend
to be relatively young (mean age 32 years) and well educated.
10. Parents were similar in their future expectations for their
children. Only one significant difference was found. Parents of
children in unstructured programs were more certain that their
children would not use sign language as their preferred form of
communication as adults.
97
11. Reactions to a semantic differential revealed no differences
between parents of children in combined and oral programs in reactions
to concepts Hearing Aid, Hearing Impaired, Speech and Auditory Train-
ing. Parents in the combined group were more positive toward
Speechreading, Sign Language and Fingerspelling. Parents in the
oral group were mole positive toward Deafness and Integration of a
deaf child in a hearing class. Comparisons between structured-
unstructured programs showed parents of children in unstructured
programs to be more positive toward Auditory Training and Integration
of a deaf child into a hearing class and less positive toward Speech-
reading, Sign Language and Fingerspelling.
12. In the 1971-72 academic year increased emphasis will be placed
on assessment of readiness and academic skills as well as measurement
of linguistic functioning, both receptive and expressive, in all modes
of communication. As the children mature, each year should allow more
sophisticated analysis.
98

FUTURE PLANS
The project has been progressing on schedule and plans call
for its continuation, following the same children, until at
the 1973-74 academic year. The modification of the Visual-Motor
subtests of the Illinois Psycholinguistic Abilities was successful
will be administered each spring under present projections. Of
particular interest will be the extent to which deaf children con-
tinue to show distinct patterns of strength and weakness on the
various subtests.
The Leiter International Performance Scale provided a valid
instrument of initial assessment of children in the first year
of study and will not be administered on an annual basis. The
children will be tested on another instrument, probably the WISC
(Weschler Intelligence Scale for Children) Performance Scale, in
the spring of 1974.
The Brown Attitude and Opinion Scale and the Semantic Differential
which was developed for the project have been shown to provide sensi-
tive measures of parent attitudes and reactions to deafness. Both
will continue to be administered on an annual basis.
The classroom observation methods provide useful information of
classroom activf ies and interaction patterns. The techniques, with
some modifications, will be used for the remainder of the project.
The most substantial changes will be in the area of communication.
As mentioned previously, because of the level of functioning of the
99

children, assessment in the first year was limited to speech and
speed- !evolving concrete stimuli and limited to the expression
and reception of one word at a time. In no way should this be con-
sidered assessment of language ability.
For the academic year 1971-7: the children will be tested in
the area of communication through the following modes:
A. Receptive Communication
1. Sound alone (without speechreading)
2. Sound plus speechreading
3. Sound plus speechreading plus fingerspelling
4- Sound plus speechreading plus signs and fingerspelling
5. The printed word
B. Expressive Communication
1. Speech
2. Fingerspelling
3. Signs
4. The Written Word
Sound plus speechreading is consist -'nt with the oral-aural
method. The addition of fingerspelling introduces the Rochester
Method and the addition of signs brings in all of the elements of
the Simultaneous Method or, as it is defined in some quarters, Total
Communication.
Children from all programs will be tested in all modes for both
receptive and expressive communication. If any of the teachers or
programs object to the use of manual communication in the classroom,
these parts of the instrument will not be emphasized for that

L
particular case.
A major new component of the. assessment will be in the area of
academic readiness and academic achievement. Tests standardized on
normally hearing children have been pilot tested and modified. This
phase of assessment will begin in the spring of 1972.
The schedule will follow the pattern of the first year of data
collection and analysis for the remainder of the study. Data will
be gathered in the sprir.g of each year and analyzed in the summer.
Procedural modifications will be made on the basis of feedback and
the results of the testing. Results will be published each fall,
with a comprehensive report scheduled for publication in December,
1974. Other dissemination activities include presentations to
workshops, seminars and conventions as well as publication of
results of parts of the project in appropriate journals.
101
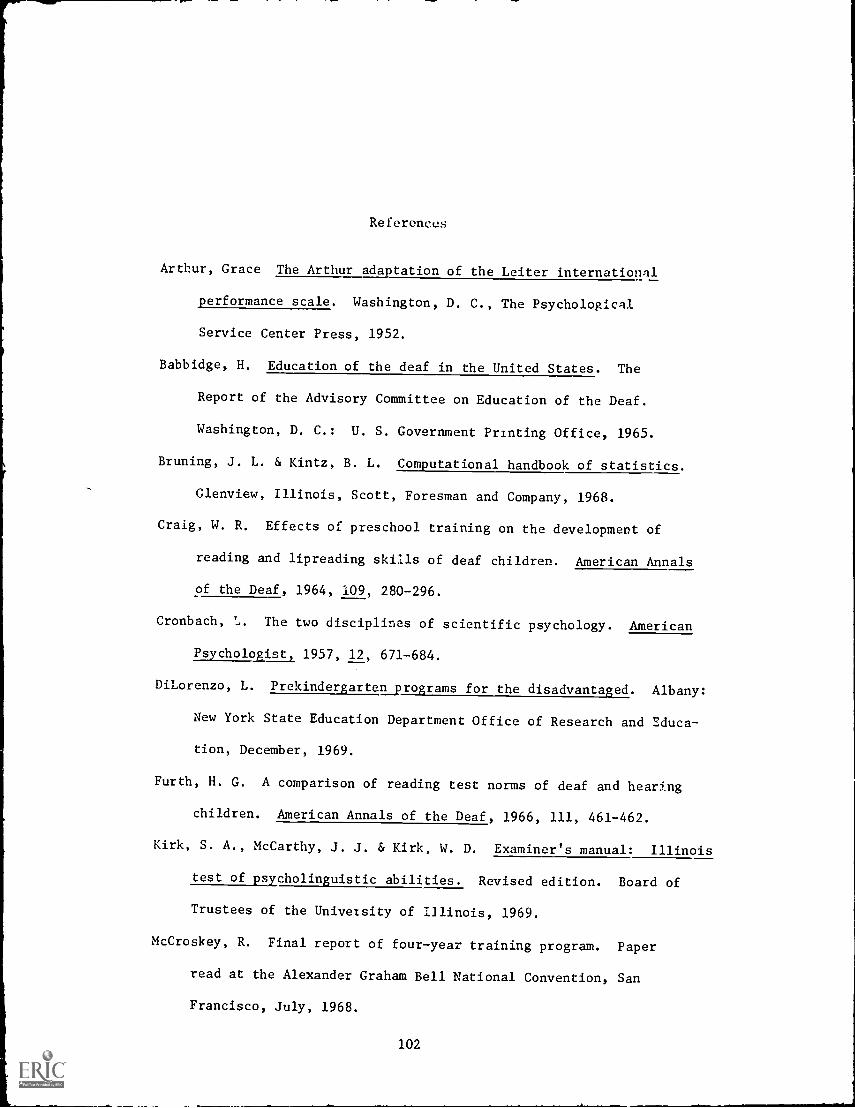
References
Arthur, Grace The Arthur adaptation of the Leiter international
performance scale. Washington, D. C., The Psychological
Service Center Press, 1952.
Babbidge, H. Education of the deaf in the United States. The
Report of the Advisory Committee on Education of the Deaf.
Washington, D. C.: U. S. Government Printing Office, 1965.
Bruning, J. L. & Kintz, B. L. Computational handbook of statistics.
Glenview, Illinois, Scott, Foresman and Company, 1968.
Craig, W. R. Effects of preschool training on the development of
reading and lipreading skills of deaf children. American Annals
of the Deaf, 1964, 109, 280-296.
Cronbach, L. The two disciplines of scientific psychology. American
Psychologist, 1957, 12, 671-684.
DiLorenzo, L. Prekindergarten programs for the disadvantaged. Albany:
New York State Education Department Office of Research and Educa-
tion, December, 1969.
Furth, H. G. A comparison of reading test norms of deaf and hearing
children. American Annals of the Deaf, 1966, 111, 461-462.
Kirk, S. A., McCarthy, J. J. & Kirk, W. D. Examiner's manual: Illinois
test of psycholinguistic abilities. Revised edition. Board of
Trustees of the Univetsity of Illinois, 1969.
McCroskey, R. Final report of four-year training program. Paper
read at the Alexander Graham Bell National Convention, San
Francisco, July, 1968.
102

Meadow, K. M. The effect of early manual communication and family
climate on the deaf child's development. Unpublished doctoral
dissertation, University of California, Berkeley, 1967.
Montgomery, G. The relationship of oral skills to manual communica-
tion in profoundly deaf adolescents. American Annals of the
Deaf, 1966, 111, 557-565.
Moores, D. An investigation of the psycholinguistic functioning of
deaf adolescents. Exceptional Children, 1970a, 36, 645-654.
Moores, D. Evaluation of preschool programs: An interaction
analysis model. University of Minnesota Research and Development
Center. Occasional Paper #1, July, 1970b.
Norden, Kerstin. The structure of abilities in a group of deaf
adolescents. Paper presented to the international Congress on
Education of the Deaf, Stockholm, August 17-21, 1970.
Osgood, C. E., St.ci, G. J. & Tannenbaum, P. H. The measurement of
meaning. Urbana, University of Illinois Press, 1957.
Phillips, W. D. Influence of preschool training on achievement in
language arts, arithmetic concepts and socialization of young
deaf children. Unpublished doctoral dissertation, Columbia
University, 1963.
Quigley, S. P. The influence of fin ers ellin on the development
of language, communication, and educational achievement in deaf
children. Urbana, University of Illinois, 1969.
Quigley, S. P. & Frisina, D. R. Institutionalization and psycho-
educational development of deaf children. Washington, D. C.:
Council for Exceptional Children Research Monograph, 1961.
103
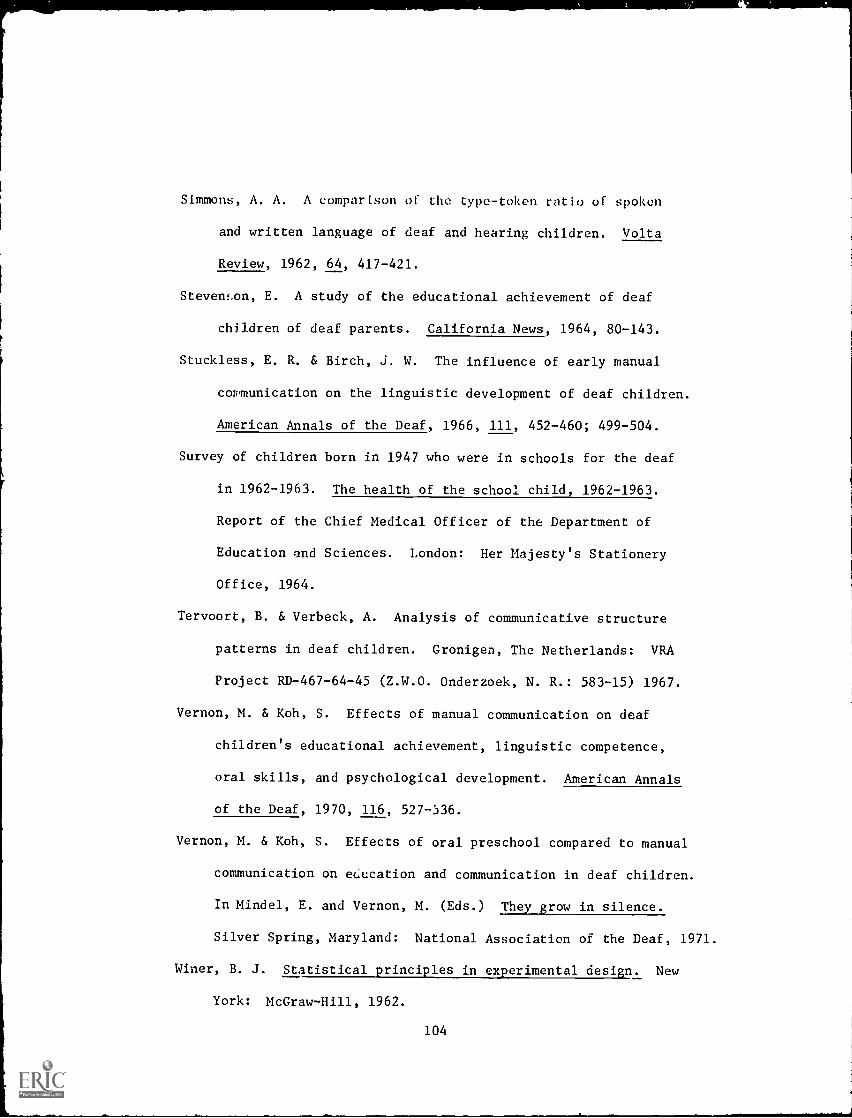
Simmons, A. A. A comparison of the type-token ratio of spoken
and written language of deaf and hearing children. Volta
Review, 1962, 64, 417-421.
Stevenson, E. A study of the educational achievement of deaf
children of deaf parents. California News, 1964, 80-143.
Stuckless, E. R. & Birch, J. W. The influence of early manual
communication on the linguistic development of deaf children.
American Annals of the Deaf, 1966, 111, 452-460; 499-504.
Survey of children born in 1947 who were in schools for the deaf
in 1962-1963. The health of the school child, 1962-1963.
Report of the Chief Medical Officer of the Department of
Education and Sciences. London: Her Majesty's Stationery
Office, 1964.
Tervoort, B. & Verbeck, A. Analysis of communicative structure
patterns in deaf children. Gronigen, The Netherlands: VRA
Project RD-467-64-45 (Z.W.O. Onderzoek, N. R.: 583-15) 1967.
Vernon, M. & Koh, S. Effects of manual communication on deaf
children's educational achievement, linguistic competence,
oral skills, and psychological development. American Annals
of the Deaf, 1970, 116, 527-536.
Vernon, M. & Koh, S. Effects of oral preschool compared to manual
communication on education and communication in deaf children.
In Mindel, E. and Vernon, M. (Eds.) They grow in silence.
Silver Spring, Maryland: National Association of the Deaf, 1971.
Winer, B. J. Statistical principles in experimental design. New
York: McGraw-Hill, 1962.
104

Wrightstone, J. W., Aranow, M. S. & Moskowitz, S. Developing read-
ing test norms for deaf children. American Annals of the Deaf,
1963, 108, 311-316.
105

Appendix A
Classroom Observation
Teacher: Observer:
Time TimeDistrict: Date: Start Finish
No. of Children: Supporting Staff:
DAILY PROGRAM
Listed below are a number of activities thay may be included in the daily program ofpre-kindergarten class. Indicate by number the sequence of activities in the sessioncbserved and the amount of time spent on each. Add activities not listed in spacesprovided.
Order Activity Minutes
F.S. expr.
F.S. rec.
Signing expr.
Signing rec.
Writing
Speech
Lipreading
Auditory Trng.
ReadingReadiness
Number Work
Free play
Role Taking
Date &
weather check
GroupDiscussion
Story time
Tioleting
Snack
Rest Period
Order Activity Minutes
106
Order Activity Minutes
1

EQUIPMENT AND MATERIALS
Listed below are materials and equipment that may be found in a pre-kindergartenclassroom. Check those seen in this classroom (x) and double check those usedduring the observation period (xx). Add items not listed in the spaces provided.
Large blocks
Small unit blocks
Books
Record player,tape recorder
Paints
Crayons
Pencils
Feltpens
Play dough
Clay
Scissors
Housekeepingcorner
Dress-up clothes
Pupil name cards
Jungle gym, climbingladder
Carpentry bench
Water play utensils
Rhythm band instruments
Puppets
Wheel toys
Readiness workbooks
Readiness materials
Ditto masters
AV projectors
Overhead projector
Auditory unit
Audiograms
Pupil records
Color charts
Labels
Picture puzzles
Lotto games
Flannel board
Plants
Live animals
Manipulative toys
Northampton Chart
Htzgerald Key
107
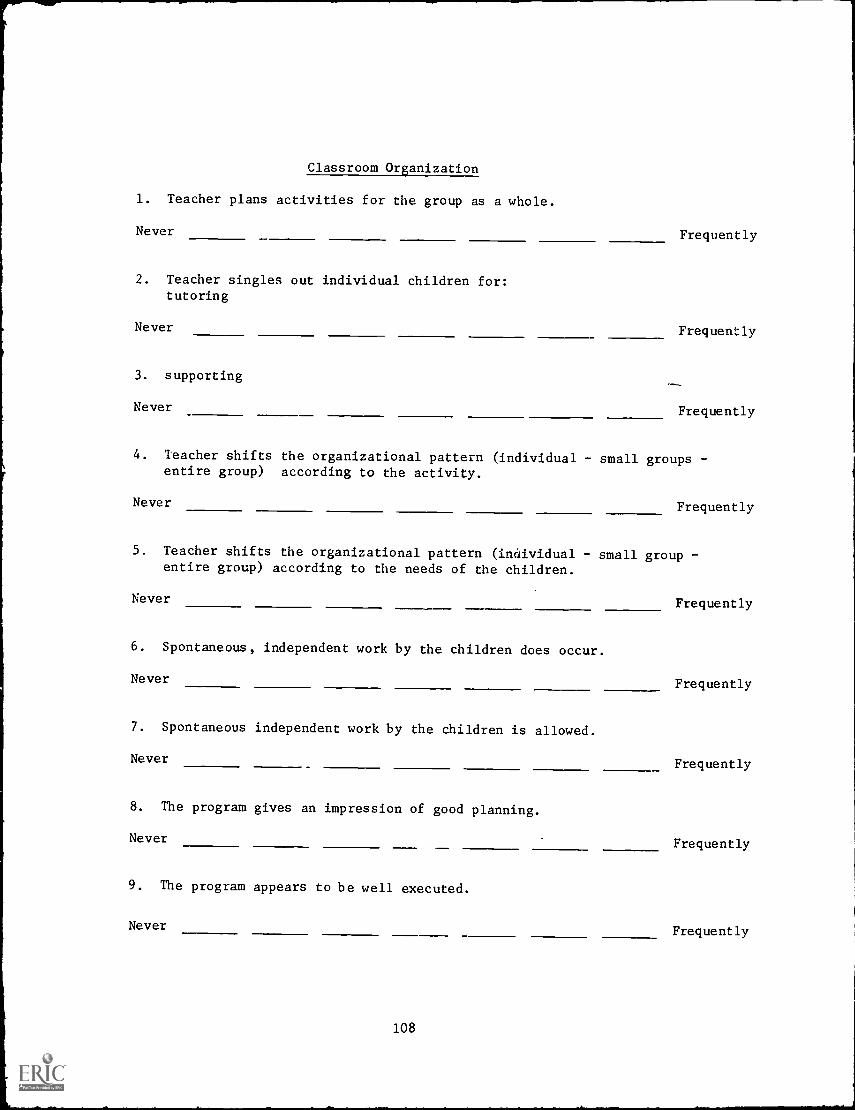
Classroom Organization
1. Teacher plans activities for the group as a whole.
Never
2. Teacher singles out individual children for:tutoring
Frequently
Never Frequently
3. supporting
Never Frequently
4. Teacher shifts the organizational pattern (individual - small groups -entire group) according to the activity.
Never Frequently
5. Teacher shifts the organizational pattern (individual - small group -entire group) according to the needs of the children.
Never Frequently
6. Spontaneous, independent work by the children does occur.
Never Frequently
7. Spontaneous independent work by the children is allowed.
Never Frequently
8. The program gives an impression of good planning.
Never Frequently
9. The program appears to be well executed.
Never Frequently
108

Use of Supporting Staff
Type of staff: X = Parent 0 = Paid PersonnelV = Volunteer * = Other
10. Supporting Staff works in a supportive manner.
Never
11. Supporting Staff performs housekeeping functions.
Never
12. Supporting Staff assists in maintaining discipline.
Never
13. Supporting Staff prepares teaching materials.
Never
14. Supporting Staff has responsibility for specific portions of theeducational program.
Never
Frequently
Frequently
Frequently
Frequently
Frequently
15. Teacher and Supporting Staff function as a team, shifting responsi-bilities according to the needs of the children.
Never
Discipline and Classroom Relationships
16. Teacher admonishes the children for misbehavior.
Frequently
17. Teacher threatens and cajoles.
Frequently
109
Frequently
Never
Never

18. Teacher controls through reiteration of the expectations of "good"and "grown-up" boys and girls.
Frequently Never
19. Conforming behavior is rewarded.
Never Frequently
20. Teacher avoids problems by changing the pace of the program.
NeverFrequently
21. Teacher quickly reprimands those who depart from the group pattern.
LeverFrequently
22. The children cooperate readily.
NeverFrequently
23. A laissez-faire attitude prevails in the classroom.
FrequentlyNever
24. Teacher places restrictions on the childrens behavior.
NeverFrequently
Structuring Program
25. Teacher emphasizes diverse experiences for general enrichment.
NeverFrequently
26. Children's activities have discernable objectives related to apparent needs.
NeverFrequently
27. Teacher relies primarily on children's responses to determine her teachinggoal at a given time.
NeverFrequently
110

28. Teacher evidenced specific instructional goals.
Never Frequently
29. Teacher focuses attention on the objectives:through defining the time period of the activity.
Never Frequently
30. through the use of special materials.
Never Frequently
31. through prescribing the child's responses.
Frequently Never
32. Teacher utilizes both enriching experiences and instructionalactivities.
NeverFrequently
33 Encouraging Language and Speech Development
33. Teacher takes advantage of spontaneous language learning oppOrtunities.
NeverFrequently
34. Teacher makes provisions for language development:through discussions, question and answer period.
NeverFrequently
35. through planned exposure to concepts.
NeverFrequently
36. Teacher gives the child controlled practice in J ! .1se of selectedterms and concepts in order to establish specific.'.. mguage patterns.
NeverFrequently
111

Communication From Pupils
E = Expected
S = Spontaneous
37. Child - Childa) Fingerspelling
NeverFrequently
b) Sign Language
NeverFrequently
c) Oral - Aural
NeverFrequently
d) Combined
NeverFrequently
e) Written
NeverFrequently
f) Gestures
NeverFrequently
38. Child - Teachera) Fingerspelling
NeverFrequently
b) Sign language
NeverFrequently
c) Oral - Aural
NeverFrequently
112

Never
N'Iver
Never
d) Combined
e) Written
f) Gestures
39. Child - Supporting Staffa) Fingerspelling
Never
Never
Never
Never
Never
Never
b) Sing language
c) Oral - Aural
d) Combined
e) Written
f) Gestures
113
Frequently
Frequently
Frequently
Frequently
Frequently
Frequently
Frequently
Frequently
Frequently

pupils Receptive Communication
E = Expected
S = Spontaneous
40. Child - Child
a) Fingerspelling
NeverFrequently
b) Sign language
NeverFrequently
c) Oral - Aural
NeverFrequently
d) Combined
NeverFrequently
Never
e) Written, Printed
f) Gestures
Frequently
NeverFrequently
41. Teacher - Child
a) Fingerspelling
Neverfrequently
Never
b) Sign Language
Frequently
c) Oral - Aural
NeverFrequently
114

7
d) Combined
Never Frequently
Never Frequently
Never Frequently
e) Written, Printed
f) Gestures
42. Supportive Staff Child
Never
Never
Never
Never
Never
Never
a) Fingerspelling
b) Sign language
c) Oral Aural
d) Combined
e) Written, Printed
f) Gestures
Reacting to Pupil Needs
43. In planning and carryingthe developmental status
Frequently
Frequently
Frequently
Frequently
Frequently
Frequently
out the program, teacher takes into account:of the children.
NeverFrequently
115

44. The children's particular impairments.
NeverFrequently
45. Teacher modified her behavior to the childrens' needs and reactions:in small groups
Never
46. entire group
Never
47. individually
Never
48. Teacher uses his capacity to recieve childrens communication.
Never
49. Teacher domineers
Frequently
Frequently
Frequently
Frequently
Frequently
Never

Appendix B
Classroom Observation Statements by Categories
Classroom Organization
1. Teacher plans activities for the group as a whole.
2. Teacher singles out individual children for: tutoring
3. Supporting
4. Teacher shifts the organizational pattern (individual, small
groups, entire group) according to the activity.
5. Teacher shifts the organizational pattern (see 4) according to
the needs of the children.
6. Spontaneous, independent work by the children does occur.
7. Spontaneous, independent work by the children is allowed.
8. The program gives an impression of good planning.
9. The program appears to be well executed.
Discipline and Classroom Relationships
16. Teacher admonishes the children for behavior
17. Teacher threatens and cajoles.
18. Teacher controls through reiteration of the expectations of "good"
and "grown up" boys and girls.
19. Conforming behavior is rewarded.
20. Teacher avoids problems by changing the pace of the program.
21. Teacher quickly reprimands those who depart from the group pattern.
22. The children cooperate readily.
23. A laissez-faire attitude prevails in the classroom.
24. Teacher places restrictions on the children's behavior.
117

Structuring Program
25. Teacher emphasizes diverse experiences for general enrichment.
26. Children's activities have discernable objectives related to
apparent needs.
27. Teacher relies primarily on children's responses to determine
her teaching goal at a given moment.
28. Teacher evidenced specific instructional goals.
29. Teacher focuses attention of the objectives: Through defining
the time period of the activity.
30. . . . Through the use of special materials.
31. . . . Through prescribing the child's responses.
32. Teacher utilizes both enriching experiences and instructional
activities.
Reacting to Pupil Needs
43. In planning and carrying out the program, teacher takes into
account: The developmental status of the children.
44. The children's particular impairments.
45. Teacher modifies her behavior to the children's needs and reactions:
In small groups
46. Entire group
47. Individually
48. Teacher uses her capacity to receive the children's communications.
49. Teacher domineers.
118

Appendix C
PARENTAL INFORMATION AND ATTITUDE SCALE
FOR PARENTS OF HEARING IMPAIRED CHILDREN
Donald W. Brown, Ph.D.Associate ProfessorThe Graduate SchoolGallaudet CollegeWashington, D. C.
119

Name of organization or meeting at which you received this questionaire
GENERAL INFORMATION
Part I.
Note: Please do not put your name or address on this form. All information willbe treated confidentially and will be used only for purposes of scientificresearch.
1. Sex: Mal?. Female 2. Year of birth 3. Year of marriage
4. Living with spouse at spouse at present time. Yes No
5. Married more than once. Yes No
6. If married more thnn once, was previous marriage ended because of:Death Divorce Other (please state)
7. Draw a circle around the number of years of schooling you have completed.12345678 1 2 3 4 1 2 3 4 1 2 3 4Gra,!e School High School College Graduate Work
8. Religious affiliation:Protestant JewishRoman Catholic Other
9 Present family income (annual)
under $3,0003,000 to 4,9995,000 to 6,9997,000 to 8,9999,000 to 10,99911,000 to 14,99915,000 or over
None
10. Husband's occupation (He specific such as Drug Store Clerk, College Professor,Automobile Mechanic, etc.)
11. Wife's occupationFull time Part time
Note: In the following questions the child referred to is always your hearingimpaired child.
12. Child's position in the family (1st born, 2nd, etc.
13. Child's birthdate Age
14. Age of child when hearing loss occured
120
was diagnosed

15. How many physicians or specialists did you visit before hearing loss wasidentified
16. Degree of child's hearing loss: Profound SevereMild Average loss for speech frequencies (if known)
Right ear dB Left ear dBDeaf Hard of Hearing
17. To whom did you originallyPediatricianGeneral PractitionerAudiologistFriend or relative
Moderate
go when you suspected a hearing loss:OtologistHearing Aid DealerSpeech & Hearing CenterOther
18. What diagnoses other than hearing loss were given; e.g. mental retardation,"slow development"By whom
19. Who gave the diagnosis of hearing impairment?
20. Are any members of Wife's family deaf or hard of hearing (Do not includeelderly relatives who lost hearing late in life)Yes State relationship No.
21. Are any members of Husband's family deaf or hard of hearingYes State relationship No
22. When you were a youngster did you know any G,af children or adults?Yes No
23. During any part of your life have you known a deaf person? Yes NoIf Ye', give name(s)
24. Prior to the discovery of your child's hearing loss had you ever seen amagazine or journal about deaf children or adults? Yes NoIf Yes, give name(s)
95. Since learning of your child's impairment have you read any of the following:(Please check those which you have read)
American Annals of the Deaf Teacher of the DeafDeaf American (Silent Worker) Volta ReviewExceptional. Children OtherBooks Specify title(s)
26. Do you subscribe to any of the above periodicals? Yes NoIf Yes, give name(s) and length of time during which you have subscribed.
121

NOTE: The following questions assume that your child is presently enrolled in aprogram for the hearing impaired. If this is not the case, answer thequestions in terms of the program your child will be entering.
27. At what age did your child begin his education as a hearing impaired child
28. Have you ever visited a school or class for hearing impaired children otherthan the one in which your child is enrolled? Yes NoIf Yes, please give name(s)Age level(s) of class(es) visited
29. Please give the names of at least three other schools, classes, or programs(in this state) that your child could have been enrolled in if you had notchosen the one he is presently attending
30. How did you first hear about the program your child is attending?
31. Did anyone encourage you to send your child to his present school?Yes No
If Yes, state relationship of the person(s)
32. Have you visited your child's classroom? Yes No If Yes, approximatelyhow many times
33. Has anyone suggested that you enroll your child in a program other than the onehe is attending? Yes No If Yes, what was the relationship of thatperson to you and what type of program(s) did he (she) suggest?
34. Would you please rate the amount of confidence you have that you made thecorrect decision in placing your child in the program he is now attending:
Very confidentFairly confidentSlight lack of confidenceSerious lack of confidence
35. Have you seen any television programs about deaf children or adults or witha deaf character? Yes No
36. Which of the following conditions do you feel is the most educationally handicappcfor a young child? (Check one)
DeafnessBlindness
Cerebral PalsyRheumatic Fever
122

37. What does the name Gallaudet mean to you?
38. Are you a member of the Alexander Graham Bell Association for the Deaf?Yes No
39. Do you belong to any association of parents of deaf or hard of hearing children?Yes No If yes, give name(s)
40. Have you ever known a deaf person who is a parent of deaf or hearing children?Yes No
123
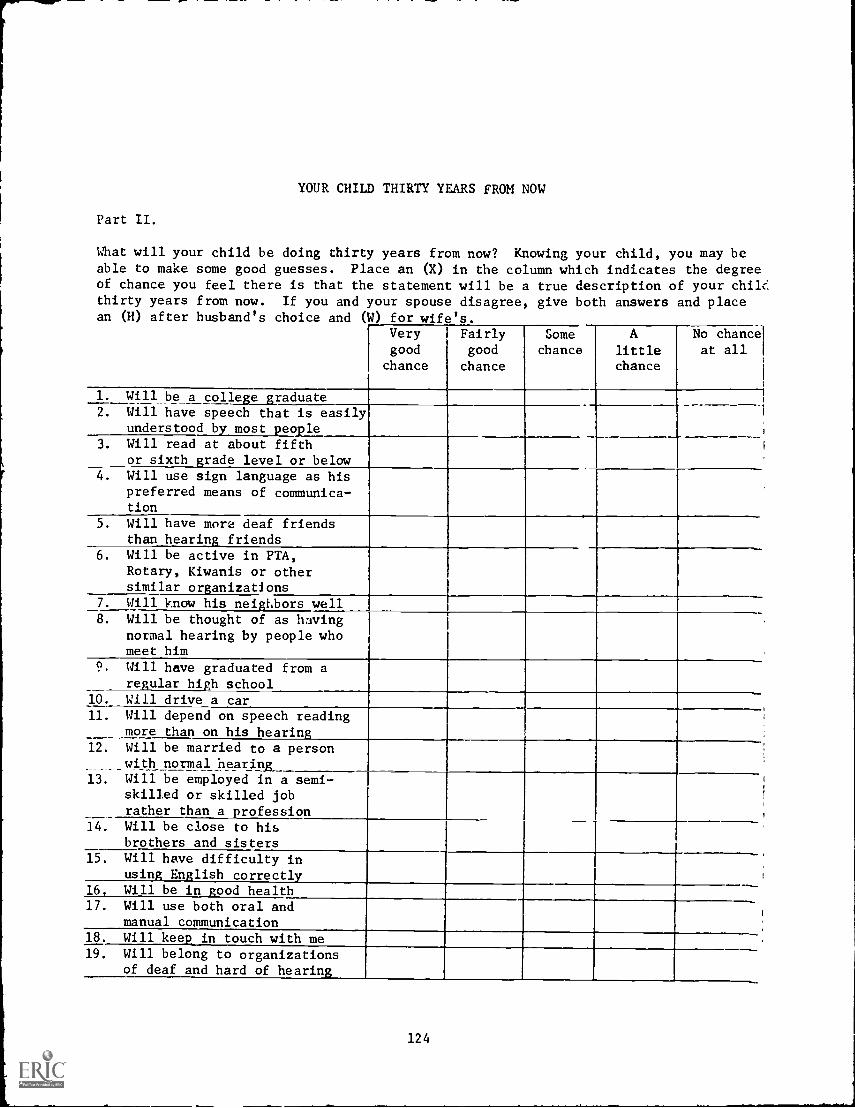
YOUR CHILD THIRTY YEARS FROM NOW
Part II.
What will your child be doing thirty years from now? Knowing your child, you may beable to make some good guesses. Place an (X) in the column which indicates the degreeof chance you feel there is that the statement will be a true description of your chile:thirty years from now. If you and your spouse disagree, give both answers and placean (H) after husband's choice and (W) for wife's.
Very I
goodchance
Fairlygood
chance
Somechance
Alittlechance
No chancel
at all1
I
1.
2.
Will be a college graduateWill have speech that is easilyunderstood by most peo.le
3. Will read at about fifthor sixth :rade level or below
4. Will use sign language as hispreferred means of communica-tion
5. Will have more deaf friendsthan hearing friends
6. Will be active in PTA,Rotary, Kiwanis or othersimilar organizations
7. Will know his neigLbors well8. Will be thought of as having
normal hearing by people whomeet him
Q. Will have graduated from aregular high school
10. Will drive a car11. Will depend on speech reading
more than on his hearin:12.
___with13.
Will be married to a personnormal hearing
Will be employed in a semi-skilled or skilled jobrather than a profession
14. Will be close to hisbrothers and sisters
15. Will have difficulty inusing En:lish correctl
16. Will be in good health17. Will use both oral and
manual communication18. Will kee. in touch with me19. Will belong to organizations
of deaf and hard of hearing
124

Part III.
Many statements and opinions have been expressed about hearing handicappedpeople. We are interested in learning the reactions that you, as the parent of ahearing impaired child, would have to the following statements. Please read eachstatement carefully. Circle the letter in front of the response which bestexpresses what you think of or would do about the statement.
In completing this form, please keep the following points in mind:
1. Everything you write will be kept confidential.
2. Try to circle one response for every question. (If
you skip a statement, we will not know what you meant,)

1. Alexander Granam Bell, inventor of the telephone and strong supporter of teaching
speech to deaf children, once said that finger spelling was the fastest and
most efficient wqy to teach language to deaf children
a. I think he was probably rightb. I find it difficult to believe that he ever said thatc. He meant this only for retarded or slow learning deaf childrend. This is interesting but probably needs some research to prove it or disprove
it
e. Such a statement proves that he never truly believed in the importance ofspeech
2. Stuckless and Birch (University of Pittsburgh) report that their study has
indicated that manual communication (sign language and finger spelling) does
not hinder the development cf speech in young deaf child
a. I'd like to get the opinion of the principal of my child's school on thatb. This is reassuring because I've wondered about thatc. They probably didn't do a very careful studyd. They mean that this is true if the child has already developed speech
before he is exposed to manual communicatione. This sounds like propaganda to me
3. There is so much disagreement about education of the deaf that the best thing
to do is:
a. Be sure I've picked the best school and then get information from thatschool's staff
b. Read everything I can and then just trust that I've done the right thingc. Find out what approach has the most supporters and try that firstd. Realize that what seems to be best for others may not 1e best for my childe. Read everything I can and then get the opinion of a school principal or
superintendent
4. Some people have said that many fewer deaf people than hearing people are able
to go to college
a. This is probably true because of the deaf child's difficulty in learningb. This is only true if the deaf child gets the wrong elementary educationc. Colleges shouldn't be allowed to discriminate against the deaf that wayd. These people are talking about previous generations and are unaware of current
progresse. This seems quite logical to me
126

5. Alexander Graham Bell said, "I think the use of the sign language will go out
of existance very soon".
a. This has happenedb. This statement just shows how wrong Bell could bec. This will happen soon because of our better teaching methodsd. Bell would never have said thate. This is why it is unnecessary for my children to learn signs
6. Most deaf people marry a deaf person
a. This is not trueb. If this is true, it is because of the communication barrier imposed by deaf-
nessc. This is true only if the deaf have been segregated from contact with hearing
peopled. This is fine if it's what the deaf wante. This will not be true of my child because we're treating him as a normal
person
7. If a friend of mine discovered that her child was deaf
a. I'd tell her about the school my child is inb. I'd suggest some things she should read about the different types of programsc. I would sympathize with her but not interfere with her right to make har
own decisiond. I'd try to get to her before people filled her with wrong informatione. I would feel obligated to share with her the satisfaction I have now that
I've found the right program
8. It is reported that many deaf adults who do not have intelligible speech are
successfully employed. and well adjusted.
a. There are rare exceptionsb. This does not surprise mec. They would be even more successful if they could speakd. I don't think this is truee. Statements like this should not be made as they will discourage parents from
teaching their child to talk
9. An oral teacher of the deaf claims that map- deaf children can't learn to speak
and lipread.
a. The statement is false and I can't believe a teacher would say thatb. She probably doesn't know the methods used at my child's schoolc. That's true - she means retarded and visually handicapped deaf childrend. She shouldn't be allowed to teache. I agree - some can but many can't
127

10. One of the disadvantages of getting together with other parents whose
children are in my child's school is:
a. I know what they think - I want to hear the other sideb. No one of us has the same problems as another parentc. There are no disadvantagesd. It requires time away from my own familye. We might support each other's mistakes
11. A deaf adult says that he and his deaf friends don't think speech is very
important.
a. He and his friends probably have poor speech - sour grapesb. I can't imagine anyone,- deaf or hearing, saying thatc. Possibly he and his friends have found satisfactory adjustment without
speechd. This is what can happen if a child is sent to the wrong type of schoole. This is an unfortunate but very common statement
12. We all have too little time. Because of this I should devote my short read-
ing time to:
a. Books and articles whose authors know what they're talking aboutb. Topics other than deafness because I have faith in my child's schoolc. Learning about methods of teaching the deaf which I disagree withd. Controversial articles - so I can defend the correct approache. Books on manual communication so I can get to know my child better
H. Most deaf people prefer to associate with other deaf people rather than
hearing people.
a. This is not trueb. This will not: be true of my child if I raise him rightc. I imagine this is true - they understand each other's speech easierd. This is why deaf children should be taught with regular childrene. If they are happy doing this - that's fine
14. The primary function of an educational program of hearing impaired children
is to:
a. Provide short term help which will enable the child to enter a regularschool with hearing children
b. Teach the children to hear betterc. Develop speech and speechreading skillsd. Provide appropriate instruction in academic skills, i.e., reading,
language, writinge. Present opportunities for association with hearing children
128

Appendix D
Page from Semantic Differential
FATHER
good: bad
sweet: sour
dirty: : clean
sad: : : happy
nice :: : awful
fair : : : : : unfair
pessimistic : : :: optimistic
distasteful' : :: tasty
valuable : :: worthless
healthy: :
: sick
cowardly: brave
calm: agitated
129

22. R. Bruininks & J. Rynd,,,s. Alternatives to Special Class Placement for Educable MentallyRetarded Children. Occasional Paper #6. Marc`, 1971. (Focus on Exceptional Children,1971, 3, 1-12)
23. J. Turnure, S. Larsen, & M. Thurlow. Two Studies on Verbal Elaboration in Special Popula-tions I. The Effects of Brain Injury II. Evidence of Transfer of Training. ResearchReport 1117. April, 1971.
24. D. Moores. Recent Research on Manual Communication. Occasional Paper 07. April, 1971.(Keynote Address, Division of Communication Disorders, Council for Exceptional ChildrenAnnual Convention, Miami Beach, April, 1971).
25. D. Moores. An Investigation of the Psvcholinguistic Functioning of Deaf Adolescents.Research Report / /18. May, 1971. (Exceptional Children, May, 1970, 36, 645-652).
26. G. Siegel. Three Approaches to Speech Retardation. Occasional Paper 48. May, 1971.
27. M. Thurlow & J. Turnure. Mental Elaboration and the Extension of Mediational Research:List Length of Verbal Phenomena in the Mentally Retarded'. Research Report 1119. June, 1971.
28. R. Bruininks, T. Glaman, & C. Clark. Prevalence of learning Disabilities: Findings, Issues,and Recommendations. Research Report #20. June, 1971. (Presented at Council for ExceptionalChildren Convention, Miami Beach, April, 1971).
29. J. Turnure & S. Larsen. Outerdirectedness in Educable Mentally Retarded Boys and Girls.Research Report 021. September, 1971.
30. A. Taylor, M. Josberger, & J. Knowlton. Mental Elaboration and Learning in Retarded Children'.Research Report #22. September, 1971. (Mental Elaboration and Learning in EMR Children',American Journal of Mental Deficiency, 1972 in press.)
31. W. Bart & P. Krus. An Ordering - Theoretic Method to Determine Hierarchies Among Items.Research Report 1123. September, 1971.
32. A. Taylor, M. Josberger, & S. Whitely. Elaboration Training and Verbalization as FactorsFacilitating Retarded Children's Recall. Research Report 024, October, 1971.
33. J. Turnure & M. Thurlow. Verbal Elaboration and the Promotion of Transfer of Training inEducable Mentally Retarded. Research Report 025. November, 1971.
34. S. Samuels. Attention and Visual Memory in Reading Acquisition*. Research Report 026,November, 1971.
35. S. Saniels. Success and Failure in Learnin to Read: A Criti ue of the Research.Occasional Paper 09. November, 1971. (In M. Kling, the Literature of Research inReading with Emphasis on Models, Rutgers University, 1971).
36. D. Moores & C. McIntyre. Evaluation of Programs for Hearin: Im aired Children: Pro ressReport 1970-71. Research Report 027, December, 1971
37. J. Turnure & M. Thurlow. Verbal Elaboration Phenomena in Nursery School Children'.Research Report 028. December, 1971.