Embed Size (px)
Citation preview

S1
Supporting Information
Facet Dependent Islet Amyloid Polypeptide (IAPP) Interactions with Gold
Nanoparticles: Implications for Fibril Formation and Peptide-Induced Lipid Membrane
Disruption
Shih-Ting Wang1, 2, Yiyang Lin1, 2, Nevena Todorova3, Yingqi Xu4, Manuel Mazo1, 2, Subinoy
Rana1, 2, Vincent Leonardo1, 2, Nadav Amdursky1, 2, Christopher D. Spicer1, 2, Bruce D.
Alexander5, Alison A. Edwards6, Steve J. Matthews4, Irene Yarovsky3, and Molly M. Stevens1,
2*
1Department of Materials, Imperial College London, London, SW7 2AZ, UK 2Department of Bioengineering and Institute of Biomedical Engineering, Imperial College
London, London, SW7 2AZ, UK 3School of Engineering, RMIT University, GPO Box 2476, Melbourne, Victoria 3001,
Australia 4Department of Life Sciences, Imperial College London, London, SW7 2AZ, UK 5Department of Pharmaceutical, Chemical and Environmental Science, University of
Greenwich, Central Avenue, Chatham, Kent, ME4 4TB, UK 6Medway School of Pharmacy, Universities of Kent and Greenwich at Medway, Central
Avenue, Chatham, Kent, ME4 4TB, UK
Corresponding author:
*Email: [email protected]
Materials
Full-length islet amyloid polypeptide (IAPP-amide, 95 %) was purchased from
Cambridge Bioscience, and IAPP 20-29 was synthesised by solid phase peptide
synthesis using the typical Fmoc chemistry. Gold nanoparticles (AuNPs) were
purchased from BBI Solutions, and all other chemicals were obtained from Sigma-
Aldrich (U.K.).
Preparation of IAPP stock solution. To remove pre-existing IAPP aggregates, the
full-length IAPP powder was dissolved in hexafluoro-2-propanol (HFIP), and kept in
a sealed vial for 8 h at room temperature. After evaporating the solvent, the treated

S2
IAPP powder was stored at -20 °C. For IAPP 20-29, the stock solution was prepared
at a concentration of 10 mM in dimethyl sulfoxide (DMSO) and stored at -20 °C.
Diffusion-ordered NMR spectroscopy (DOSY-NMR). For high-resolution DOSY 1H NMR (Bruker NMR 600) analysis, IAPP (50 µM) was dissolved in D2O with or
without 2 nm AuNPs (BBI, 62 nM) and loaded into standard 5-mm tubes before NMR
measurement. The gradient pulses were adjusted to 1.4 ms, and 2.2 ms for IAPP
without and with 2 nm AuNPs, respectively. The spectra width was 15000 Hz, and the
free induction decay contained 8192 data points. For all of the experiments, the
ledbpgppr2s1d pulse sequence was used, and 10 spectra of 128 transients each were
collected with gradient pulse amplitudes ranging from 0.5 to 45 G·cm-1, where ~ 90-
95 % decrease was achieved at the largest gradient amplitudes. The baselines of all
arrayed spectra were corrected before processing the data. After data acquisition, each
free induction decay was apodised with Gaussian window multiplication at LB = -14
Hz and GB = 0.06 Hz, and Fourier-transformed. The spectra acquired with the lowest
gradient was used to obtain the relative intensities in the region between 1.25 and 0.70
ppm. The diffusion coefficient was calculated by fitting the experimental data to the
Stejskal-Tanner formula1:
S(Gz) = S(0)*exp[-Dγ 2δ2(Gz)2(∆-δ/3)]FFS15
where S(Gz) and S(0) are the signal intensities obtained with respective gradients
strengths of Gz and 0, D is the diffusion coefficient, γ is the gyromagnetic constant, δ
is the gradient pulse duration, and ∆ is the diffusion delay.
Gel electrophoresis. Agarose gel (0.5 wt%) was prepared in Tris/Borate/EDTA (TBE,
1X) buffer with 25 wells, and 1.0 mm in thickness. IAPP-AuNPs samples were
prepared by incubating 5 µL of IAPP monomers at different concentrations (8, 4, 2,
0.4, 0.2, 0.04, and 0.02 µM in deionised water) with 15 µL of 5 nm AuNPs (62 nM)
for 1 h. After mixing with 1 µL of glycerol, 20 µL of the IAPP-AuNP solutions were
loaded into each well. The gel was run at 120 V for 5-10 min before imaging under
white light.
Carr-Purcell-Meiboom-Grill (CPMG) NMR measurement of proton relaxation.
Proton T2 constants were measured from a series of 1d spectra with 0 ms, 8 ms, 16
ms, 24 ms, 32 ms CPMG relaxation, for IAPP in the absence or presence of AuNPs
on a 600 MHz Bruker NMR spectrometer, equipped with a triple-resonance z-gradient
cryogenic probe optimized for 1H-detection. Data was processed using TOPSPIN 3.1,
and the resonance peaks were assigned according to previous reports.2, 3

S3
Characterisation of the surface charge of IAPP and AuNPs. The ζ-potential (zeta
sizer nanoseries, ZEN3600, Malvern Instruments Ltd.) was obtained with an
equilibrium time of 60 s, and the result was the average from three individual
measurements. Prior to the measurements, IAPP monomers and fibrils were prepared
at 25 µM in 20 mM phosphate buffer (pH 7.5). IAPP fibrils (50 µM) were pre-formed
by aging at r.t. in phosphate buffer for 30 h. The AuNP solutions (2 nm, 5 nm, and 10
nm) were diluted by 1:1 (v/v) with buffer before ζ-potential measurement.
IAPP monomers and fibrils induced AuNP aggregation. IAPP monomers and
fibrils were diluted to different concentrations (0.1-50 µM) in deionised water. The
fibrils were aged at the concentration of 25 µM in 20 mM phosphate buffer (pH 7.5)
for 24 h. The assay was prepared in a 96-well plate, with a total volume of 100 µL.
Briefly, 20 µL of the peptide solutions was mixed with 60 µL of 33 mM phosphate
buffer (pH 7.5). After that, 20 µL of AuNPs (5 nm, 10 nm, and 20 nm) were added to
each well before UV-vis measurement. The final concentration of 5 nm, 10 nm, and
20 nm AuNPs are 16.6 nM, 1.89 nM, and 0.23 nM, respectively. The absorption
spectra were obtained by the Perkin Elmer EnSpire plate reader, with the wavelength
ranging from 450 nm to 850 nm, and intervals of 5 nm.
Isothermal titration calorimetry (ITC). The binding affinity of IAPP to AuNPs was
measured by MicroCal iTC200 (Malvern Instruments). Typically, 50 µL of freshly
prepared IAPP solution prepared at a concentration of 120 µM in deionised water was
filled to the syringe, and 180 µL of 5 nm AuNPs (~10.4 nM) was loaded into the
sample cell. The titration of AuNPs into IAPP solution was performed every 3 min for
20 injections. The volume of each injection was 2 µL with the exception of the initial
delay to be 0.5 µL. The reference power was set at 5 µcal/s and a stirring speed of 750
rpm. The MicroCal Analysis software was used for data analysis. Control experiments
were performed by titrating deionised water into the 5 nm AuNP solution (~10.4 nM)
in the sample cell, and the measurement methods were the same as for IAPP-AuNP
binding experiments. Results in Figure 1, S4, and S5 were presented with the control
data subtracted from the original data of IAPP-AuNP binding experiments.
Transmission electron microscopy (TEM) imaging. All imaging was performed
with JEOL 2100F TEM, with an acceleration voltage of 200 kV. For sample
preparation, 10 µL of the aging solution at different time points were dropped on the
200 mesh copper grid covered with a carbon-stabilised Formvar film. The residual
solution was removed after 5 min, and then the sample was negatively stained by 5 µL
S4
of 1 wt% uranyl acetate solution on the grid for 5 min. Elemental analysis was
performed by energy dispersive x-ray spectroscopy (EDS) at the dark-field scanning
TEM (DF-TEM) mode on the TEM.
Atomic force microscopy (AFM) imaging. AFM imaging was performed on an
AFM 5500 Microscope (Keysight technologies, previously Agilent) in tapping mode
in air. A HQ:NSC15/Al BS tip (µmasch) was used for the topography imaging (tip
radius of 8 nm, resonance frequency of 325 kHz, force constant of 40 N m-1).
Templated growth of AuNPs on IAPP fibrils. Typically, IAPP fibrils were pre-
formed by incubating IAPP (100 µM) in 20 mM phosphate buffer (pH 7.5) for 19 h.
To this solution, the desired amount of chloroauric acid (HAuCl4) solution was added
and the mixture was incubated for 30 min before the addition of 4-(2-
hydroxyethyl)piperazine-1-ethanesulfonic acid (HEPES). The mixture was left
overnight at r.t. The final concentration of HAuCl4, IAPP and HEPES was 100 µM, 2
µM, and 0.1 M, respectively. The corresponding TEM sample was prepared according
to the method discussed above and imaged at an acceleration voltage of 200 kV.
Molecular Dynamics (MD) Simulations. Solvent all-atom MD simulations were
used to study the mechanisms of interaction, and dynamics of monomeric and fibrillar
IAPP on citrate-coated Au(111) and Au(100) surfaces, which are the most stable and
commonly featured facets on AuNPs.4 The citrate concentration on each surface was
based on the ζ-potential determined experimentally (Table 1), and determined using
the approach of Brancolini and colleagues.5 Using the Poisson-Boltzmann formulation,
a ζ-potential of -21.4 mV would require a surface charge density of approximately -
0.12 e/nm2. A citrate concentration of ~2.7×10⁻¹⁰ mol/cm2 was used for the Au(111)
and Au(100) surfaces, and resulted in an equal distribution of citrate molecules and
surface charge density of <0.2 e/nm2. The citrate concentration of 1.4-5×10⁻¹⁰
mol/cm2 on AuNPs was within the experimentally determined citrate concentration
range.6, 7 Note that the amorphous character of the citrate adlayer on citrate-capped
AuNPs at pH 7 in our simulation was consistent with the result from Lin et al.,6 in
which the adsorption of citric acid on Au(111) electrode was carried at pH 1. Some of
the resulting discrepancies in citrate-Au geometries could be accounted for the lack of
counterion-mediated stabilisation in the latter system.8 The monomeric hIAPP
structure was taken from the PDB databank (PDB ID 2L86), as shown in Figure
S10a.9 The pre-formed fibril tetramer of IAPP was based on the proposed IAPP fibril
S5
model by Wiltzius et al.,10 and built in the CreateFibril database, as shown in Figure
S10b.11
All-atom classical MD simulations were performed using the Gromacs 4.5.6
software package.12 The intermolecular interactions between IAPP and the citrate-
coated Au surfaces were modelled using the GolP-CHARMM force field,13, 14 which
included the dynamic polarization of Au atoms and the modified TIP3P water
model.15 The method using an empirical model of rigid rods, has been shown to be
not only computationally efficient by allowing to incorporate the image charge effect
in planar interfacial metal force field,16-18 but also physically realistic.16 It is worth to
note that based on the similar force field developments philosophy between GolP-
OPLS16 and GolP-CHARMM,13, 14 we consider the citrate parameters used in this
study to be consistent with previous studies by Brancolini et al.5 In all simulations, the
Au surfaces were neutral, the geometry of the Au atoms was fixed, but the Au dipole
charges were free to move. The simulation unit-cell was 8.79 nm × 10.10 nm and 9.38
× 9.38 nm for the Au(111) and Au(100) facets, respectively. The height of the unit-
cell varied between the systems (described below), and the periodic boundary
conditions minimum-image convention was never breached. To ensure overall neutral
system sodium counterions were incorporated in the simulation unit-cell. Initially, the
citrate layer was allowed to relax on each surface for 5 ns of simulations in explicit
solvent. The citrate layer exhibited a disordered 3-D morphology with the anions
(carboxylate groups) closest to the surface, and were exposed to the solvent, which
was in agreement with previous work by Wright and colleagues.8 The IAPP monomer
was then placed ~9 Å from the Au surface and the system was re-solvated. To
eliminate any potential bias from the starting orientation, four different initial
structures were examined. Starting with the N-terminus closest to the surface, IAPP
was rotated 90° by its principal y-axis each time. The same procedure was also
applied for the tetramer simulations. It should be noted that the two cysteine residues
(C2 and C7) of IAPP are bound by a disulphide bond, and this bond is present in both
in its monomeric and fibrillar form. As such the disulphide-bonded cysteine residues
cannot participate in the formation of thiol-Au bonds in the MD simulations, although
they are able to interact with the Au surfaces experimentally.19 It should also be noted
that in the IAPP fibril model, the disulphide bond is shielded by the N-terminal loop,
which makes it sufficiently distant and protected from the Au surface.

S6
In all simulations, periodic boundary conditions were applied with switch
cutoffs to calculate the Coulomb, and van der Waals interaction at 1.0 nm. Long-
range electrostatics were also calculated using the particle mesh Ewald method (grid
spacing of 0.1 nm).20 MD was performed in the canonical NVT ensemble (constant
number of atoms, volume, and temperature) using the Nosé-Hoover thermostat at 300
K.21 An integration time-step of 2 fs was applied with all bond lengths constrained
using the LINCS algorithm.22 The steepest descent algorithm was applied to minimize
the energy in each system, with a convergence criterion of 20 kJ mol-1 nm-1. A 500 ps
solvent equilibration was performed where IAPP and the citrate molecules were
restrained to their starting positions. Each IAPP-citrate-Au system was then allowed
to evolve for 100 ns of MD, and equilibration was verified by monitoring the energy
and RMSD drifts. Four independent simulations were performed for the monomeric
and fibrillar IAPP on Au(111) and Au(100) surfaces, respectively. A total of 1.6 µs of
simulation data was collected. The last 50 ns of each simulation were used for
statistical analysis. Secondary structure analysis was performed using the STRIDE
algorithm in VMD,23 to identify the conformational preference of monomeric and
fibrillar IAPP when adsorbed to each surface. The contact stabilities of individual
residues with the Au surface and citrate layer were investigated individually. A
contact was defined when any residue atom was within 4 Å of any Au or citrate atom.
The residues were grouped based on the conformational domain they were found in
(Figure S10), and averaged in order to identify the persistent peptide regions
interacting with surface and/or the citrate layer. The water and citrate density were
also analysed to determine the role of water/citrate structure on the binding
interactions of IAPP to Au surface.
Thioflavin T (ThT) fluorescence assay. ThT assay was performed in a 384-well
plate with a total volume of 80 µL. The IAPP solution was prepared at concentrations
of 250, 200, 150, 100, 50 µM in phosphate buffer (20 mM, pH 7.5). Then, 8 µL of
ThT stock solution (100 µM) was added to the peptide solution. Fluorescence kinetics
was measured with Perkin Elmer EnSpire plate reader, with a time interval of 2 min.
The excitation wavelength of ThT fluorescence at 440 nm, and the emission
wavelength at 485 nm.
Circular dichroism (CD). The kinetic change of secondary structure during IAPP
(25 µM) fibrillation was recorded using a Jasco-715 circular dichroism
spectrophotometer. The samples were loaded into a rectangular quartz cell with the

S7
light path length of 1 mm. The measurements were performed at a scanning speed of
50 nm/min, data pitch of 0.1 nm, response time of 4 s, and a band width of 2 nm. In
Figure 4, the CD kinetics acquired for IAPP-AuNP samples were performed by
mixing IAPP (25 µM) with AuNPs at 20.8 nM for 2 nm and 5 nm AuNPs, and 2.1 nM
for 10 nm AuNPs. For all the kinetic experiments, there was approximately a 20 min
delay from the addition of NPs until the start of the t = 0 scans. Spectral fitting was
performed using the software on Dichroweb, including K2D, SELCON3, CONTIN
and CDSSTR. However, significant errors were observed for the samples in the
presence of AuNPs. The CDSSTR method showed the closest fitting, but a decrease
in the β-sheet content after 11 hrs in the presence of 5 nm AuNPs, which was
incorrect based on the fibril formation observed from the TEM imaging in Figure 2j-l.
It could be that the presence of AuNPs affects the spectral fitting and therefore it was
difficult to deconvolute the CD spectra due to the inadequate reference spectra.
Dye leakage assay. The carboxyfluorescein (CF)-encapsulated liposomes were
prepared by typical hydration method. Briefly, a mixture of 1-palmitoyl-2-oleoyl-sn-
glycero-3-phosphocholine (POPC, 2.5 mg), and 1-palmitoyl-2-oleoyl-sn-glycero-3-
phospho-(1’-rac-glycerol) (POPG, 2.5 mg) was dissolved in 1 mL
chloroform/methanol. The solvent was evaporated gently by blowing with nitrogen
gas for 10 min. Then, the dried lipid films were hydrated with 1 mL, 50 mM of CF in
20 mM, pH 7.5 phosphate buffer, followed by vortexing for 1 min to produce the
POPC/POPG (50:50) liposomes. To form narrowly distributed vesicles, the solution
was extruded through a 200 nm pore-sized polycarbonate membrane 21 times, and
purified by gel filtration with Sephadex G-100 column eluted with the buffer (in 20
mM, pH 7.5 phosphate).
To perform the dye leakage test, IAPP solution (12.5 µM) was prepared in the
phosphate buffer (20 mM, pH 7.5) immediately before diluting into the CF-
encapsulated liposome/AuNP solution with 5 nm AuNPs at different concentrations
(84, 42, 21, 10, 0 nM). The final concentrations of IAPP and liposomes were 0.31 µM
and 12.5 µg/mL, respectively. For IAPP fibril-induced dye leakage, the IAPP solution
(25 µM) was left undisturbed for 4 hrs, followed by mixing with different
concentrations of 5 nm AuNPs (42, 21, 10, 0 nM) for 10 min, and the addition of CF-
encapsulated liposomes. The final concentrations of IAPP and liposomes were 1 µM
and 0.3 mg/mL, respectively. Fluorescence intensity was measured with the excitation
wavelength of 485 nm, and the emission wavelength of 520 nm. Triton-X (0.25 wt%)

S8
was added to break the liposomes and the dye leakage of each sample was calculated
by setting the fluorescence of Triton-X treated samples as 100 % release.
Nile red (NR) solubilisation assay. Prior to experiment, liposomes were prepared by
mixing 50:50 of 1-palmitoyl-2-oleoyl-sn-glycero-3-phosphocholine (DMPC), and 1-
palmitoyl-2-oleoyl-sn-glycero-3-phospho-(1’-rac-glycerol) (DMPG) in 20 mM, pH
7.5 phosphate buffer, followed by size exclusion with 200 nm membrane. Next, IAPP
(12 µM) was mixed with different concentrations of 5 nm AuNPs (10.4, 5.2, 2.6, 0
nM) in 20 mM, pH 7.5 phosphate buffer for 10 min, before incubating the
DMPC/DMPG liposomes with IAPP solution for 30 min. NR (10 µM) was added to
the solution, and fluorescence spectra were collected after 1 h incubation at room
temperature. The spectra were obtained by Perkin Elmer EnSpire plate reader, with an
excitation wavelength of 575 nm, emission ranged from 590-750 nm, and data
interval of 3 nm.
Figure S1 2D DOSY plot of diffusion data showing the observed differences in
diffusion of IAPP monomer in the presence of AuNPs.
Figure S2 Agarose gel electrophoresis showing a reduced mobility of 5 nm AuNPs in
the presence of different amounts of IAPP monomers, due to the binding of AuNPs to
IAPP monomers.
S9
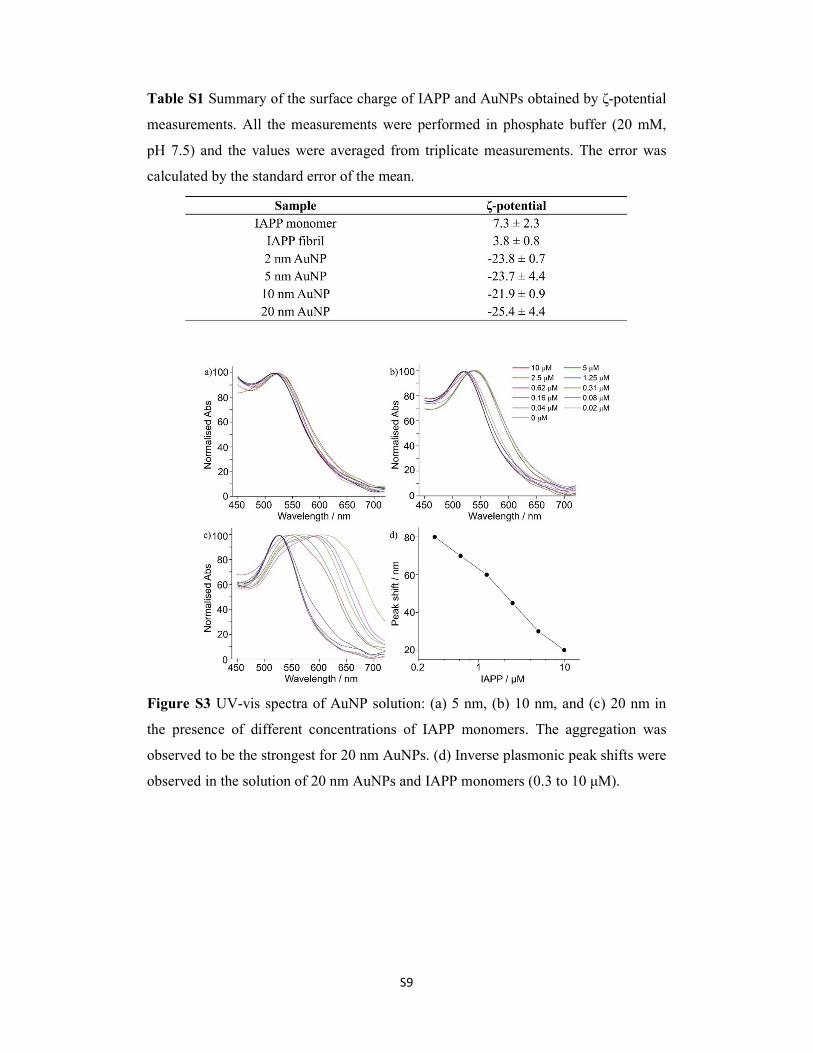
Table S1 Summary of the surface charge of IAPP and AuNPs obtained by ζ-potential
measurements. All the measurements were performed in phosphate buffer (20 mM,
pH 7.5) and the values were averaged from triplicate measurements. The error was
calculated by the standard error of the mean.
Figure S3 UV-vis spectra of AuNP solution: (a) 5 nm, (b) 10 nm, and (c) 20 nm in
the presence of different concentrations of IAPP monomers. The aggregation was
observed to be the strongest for 20 nm AuNPs. (d) Inverse plasmonic peak shifts were
observed in the solution of 20 nm AuNPs and IAPP monomers (0.3 to 10 µM).
S10
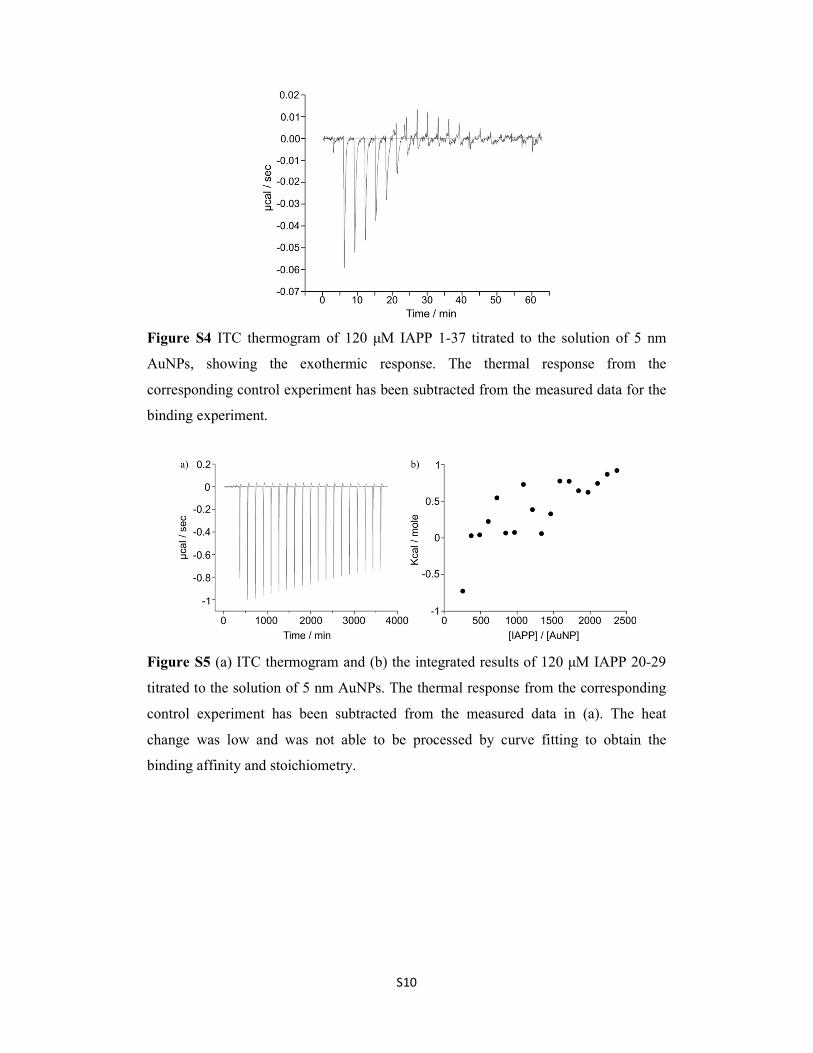
Figure S4 ITC thermogram of 120 µM IAPP 1-37 titrated to the solution of 5 nm
AuNPs, showing the exothermic response. The thermal response from the
corresponding control experiment has been subtracted from the measured data for the
binding experiment.
Figure S5 (a) ITC thermogram and (b) the integrated results of 120 µM IAPP 20-29
titrated to the solution of 5 nm AuNPs. The thermal response from the corresponding
control experiment has been subtracted from the measured data in (a). The heat
change was low and was not able to be processed by curve fitting to obtain the
binding affinity and stoichiometry.

S11
Figure S6 UV-vis spectra of 20 nm AuNPs in the presence of different concentrations
of IAPP 20-29: (a) monomeric state and (b) fibrillar state, showing no aggregation of
AuNPs was observed in both samples. The absorption spectra were measured in a 96-
well plate, with a wavelength scan between 450 and 800 nm.
Figure S7 UV-vis spectra showing the aggregation of AuNPs in the presence of
different concentrations of IAPP fibrils: (a) 5 nm, (b) 10 nm, and (c) 20 nm.

S12
Figure S8 (a) TEM image and (b) dark field-scanning transmission electron
microscopy (DF-STEM) image showing the direct growth of AuNPs on IAPP fibrils.
(c) EDS was performed by line-scan over the fibril as shown in (b), in which the Au
peaks matches the presence of AuNPs.
Figure S9 Starting structures of a) monomeric9 and b) pre-formed fibril (tetramer)11
IAPP used in the molecular dynamics simulations. The conformational domains are
labelled as follows: Monomer: N-ter (Res 1-5), Helix1 (Res 6-17), Helix2 (Res 19-28),
C-ter (Res 29-37); Fibril: N-ter (Res 1-5), B-Sheet1 (Res 6-18), Loop (Res 19-24), B-
Sheet2 (25-36), C-ter (Res 37).

S13
Figure S10 Representative mass density profiles of (a) water and (b) citrate molecules
as a function of distance from the Au(111) (blue) and Au(100) (green) surfaces from
the simulations of monomeric (solid line) and fibrillar (dashed line) IAPP.
Figure S11 (a) Characterisation of IAPP fibrillation with ThT assay, showing the
fibrillation kinetics was dependent on the peptide concentration (5, 10, 15, 20, 25 µM).

S14
(b) TEM image showing the morphology of mature fibrils (25 µM) grown in solution.
The fibrils were revealed by negative staining by 1 wt% uranyl acetate.
Figure S12 (a) CD spectra of IAPP (25 µM) in the absence and presence of 2 nm
(20.8 nM), 5 nm (20.8 nM), and 10 nm (2.08 nM) AuNPs in single-scan
measurements. The measurement was performed immediately after adding the

S15
solution into the IAPP powder. (b) CD spectra of AuNPs in buffer solution in the
absence of IAPP, and the (c) HT values of AuNPs in the presence and absence of
IAPP. No noticeable absorbance was observed in the detecting wavelength (190-260
nm).
Figure S13 CD spectra of IAPP at 4 h in the absence and presence of 2 nm, 5 nm, and
10 nm AuNPs. The spectra were plotted from the kinetic measurements in Figure 4.

S16
Figure S14 TEM images of IAPP (25 µM) fibrillation in the absence (a-c) and
presence (d-f) of 5 nm AuNPs (20.8 nM) at shorter time points: (a, d) 10 min, (b, e)
30 min, and (c, f) 60 min, showing the fibrillation was accelerated by the presence of
AuNPs. The samples were negatively stained with 1 wt% uranyl acetate. Scale bar:
(a-e) 200 nm, (f) 100 nm.
S17
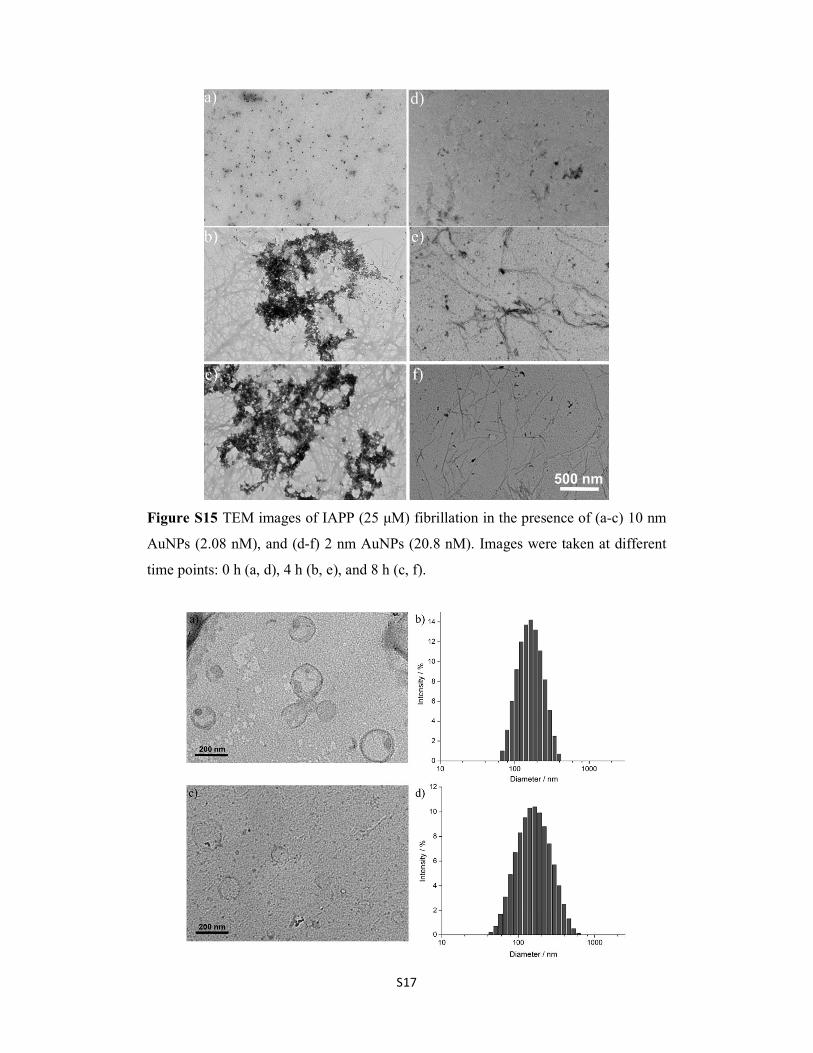
Figure S15 TEM images of IAPP (25 µM) fibrillation in the presence of (a-c) 10 nm
AuNPs (2.08 nM), and (d-f) 2 nm AuNPs (20.8 nM). Images were taken at different
time points: 0 h (a, d), 4 h (b, e), and 8 h (c, f).

S18
Figure S16 (a, c) TEM imaging and (b, d) dynamic light scattering (DLS)
measurement showing the morphologies and sizes of (a, b) POPC/POPG (50:50), and
(c, d) DMPC/DMPG (50:50) liposomes.
Figure S17 TEM image showing the interaction of IAPP with POPC/POPG (50:50)
liposomes, which the peptide can penetrate through the lipid membranes during
growth into larger fibrils (indicated by arrows).
Figure S18 Dye leakage assay from CF-encapsulated POPC/POPG (50:50) liposomes
triggered by IAPP oligomers. IAPP was dissolved in phosphate buffer (20 mM, pH
7.5) immediately before diluting into the liposome solutions. The fluorescence was
recorded with an excitation of 485 nm and emission of 520 nm.

S19
1. Stejskal, E. O.; Tanner, J. E., Spin Diffusion Measurements: Spin Echoes in the Presence of a Time‐Dependent Field Gradient. The Journal of Chemical Physics 1965, 42, (1), 288-292. 2. Salamekh, S.; Brender, J. R.; Hyung, S.-J.; Nanga, R. P. R.; Vivekanandan, S.; Ruotolo, B. T.; Ramamoorthy, A., A Two-Site Mechanism for the Inhibition of IAPP Amyloidogenesis by Zinc. Journal of Molecular Biology 2011, 410, (2), 294-306. 3. Brender, J. R.; Krishnamoorthy, J.; Messina, G. M. L.; Deb, A.; Vivekanandan, S.; La Rosa, C.; Penner-Hahn, J. E.; Ramamoorthy, A., Zinc stabilization of prefibrillar oligomers of human islet amyloid polypeptide. Chemical Communications 2013, 49, (32), 3339-3341. 4. Marks, L. D., Experimental studies of small particle structures. Reports on Progress
in Physics 1994, 57, (6), 603. 5. Brancolini, G.; Corazza, A.; Vuano, M.; Fogolari, F.; Mimmi, M. C.; Bellotti, V.; Stoppini, M.; Corni, S.; Esposito, G., Probing the Influence of Citrate-Capped Gold Nanoparticles on an Amyloidogenic Protein. ACS Nano 2015, 9, (3), 2600-2613. 6. Lin, Y.; Pan, G.-B.; Su, G.-J.; Fang, X.-H.; Wan, L.-J.; Bai, C.-L., Study of Citrate Adsorbed on the Au(111) Surface by Scanning Probe Microscopy. Langmuir 2003, 19, (24), 10000-10003. 7. Rostek, A.; Mahl, D.; Epple, M., Chemical composition of surface-functionalized gold nanoparticles. Journal of Nanoparticle Research 2011, 13, (10), 4809-4814. 8. Wright, L. B.; Rodger, P. M.; Walsh, T. R., Structure and Properties of Citrate Overlayers Adsorbed at the Aqueous Au(111) Interface. Langmuir 2014, 30, (50), 15171-15180. 9. Nanga, R. P.; Brender, J. R.; Vivekanandan, S.; Ramamoorthy, A., Structure and membrane orientation of IAPP in its natively amidated form at physiological pH in a membrane environment. Biochim Biophys Acta 2011, 1808, (10), 2337-42. 10. Wiltzius, J. J. W.; Sievers, S. A.; Sawaya, M. R.; Cascio, D.; Popov, D.; Riekel, C.; Eisenberg, D., Atomic structure of the cross-β spine of islet amyloid polypeptide (amylin). Protein Science 2008, 17, (9), 1467-1474. 11. Smaoui, Mohamed R.; Poitevin, F.; Delarue, M.; Koehl, P.; Orland, H.; Waldispühl, J., Computational Assembly of Polymorphic Amyloid Fibrils Reveals Stable Aggregates. Biophysical Journal 2013, 104, (3), 683-693. 12. Berendsen, H. J. C.; van der Spoel, D.; van Drunen, R., GROMACS: A message-passing parallel molecular dynamics implementation. Computer Physics Communications
1995, 91, (1–3), 43-56. 13. Wright, L. B.; Rodger, P. M.; Corni, S.; Walsh, T. R., GolP-CHARMM: First-Principles Based Force Fields for the Interaction of Proteins with Au(111) and Au(100). Journal of Chemical Theory and Computation 2013, 9, (3), 1616-1630. 14. Wright, L. B.; Rodger, P. M.; Walsh, T. R., Aqueous citrate: a first-principles and force-field molecular dynamics study. RSC Advances 2013, 3, (37), 16399-16409. 15. Jorgensen, W. L.; Chandrasekhar, J.; Madura, J. D.; Impey, R. W.; Klein, M. L., Comparison of simple potential functions for simulating liquid water. The Journal of
Chemical Physics 1983, 79, (2), 926-935. 16. Iori, F.; Di Felice, R.; Molinari, E.; Corni, S., GolP: an atomistic force-field to describe the interaction of proteins with Au(111) surfaces in water. J Comput Chem 2009, 30, (9), 1465-76. 17. Barone, V.; Casarin, M.; Forrer, D.; Monti, S.; Prampolini, G., Molecular Dynamics Simulations of the Self-Assembly of Tetraphenylporphyrin-Based Monolayers and Bilayers at a Silver Interface. The Journal of Physical Chemistry C 2011, 115, (38), 18434-18444. 18. Mendonça, A. C. F.; Malfreyt, P.; Pádua, A. A. H., Interactions and Ordering of Ionic Liquids at a Metal Surface. Journal of Chemical Theory and Computation 2012, 8, (9), 3348-3355. 19. Hakkinen, H., The gold-sulfur interface at the nanoscale. Nat Chem 2012, 4, (6), 443-455. 20. Darden, T.; York, D.; Pedersen, L., Particle mesh Ewald: An N⋅log(N) method for Ewald sums in large systems. The Journal of Chemical Physics 1993, 98, (12), 10089-10092.

S20
21. Nosé, S., A molecular dynamics method for simulations in the canonical ensemble. Molecular Physics 1984, 52, (2), 255-268. 22. Hess, B.; Bekker, H.; Berendsen, H. J. C.; Fraaije, J. G. E. M., LINCS: A linear constraint solver for molecular simulations. Journal of Computational Chemistry 1997, 18, (12), 1463-1472. 23. Humphrey, W.; Dalke, A.; Schulten, K., VMD: visual molecular dynamics. Journal
of molecular graphics 1996, 14, (1), 33-8, 27-8.