Embed Size (px)
Citation preview

Data and Insights to Get More Value from Your Program
2021
The Definitive Risk & ComplianceBenchmark Report

NAVEX Global is the worldwide leader in integrated risk and
compliance management software and services that help organizations
manage risk, address regulatory compliance requirements and foster
an ethical workplace culture.
For more information visit www.navexglobal.com.

THE 2021 DEFINITIVE RISK & COMPLIANCE BENCHMARK REPORT
1NAVEX Global | Protecting Your People, Reputation and Bottom Line
Contents
Introduction 2
Survey Respondent Profile 4
Executive Summary 6
Key Findings 9
1. Program Maturity 10
2. COVID-19 Impact 12
3. Program Priorities 16
4. Risk Assessment & Measures of Effectiveness 26
5. Resources and Empowerment 30
6. Program Elements 38
a. Incident Management 38
b. Policy & Procedure Management 42
c. Third-Party Risk Management 46
d. Ethics & Compliance Training 50
e. ESG Reporting 54
7. Risk Management 58
About the Authors 63

THE 2021 DEFINITIVE RISK & COMPLIANCE BENCHMARK REPORT
2NAVEX Global | Protecting Your People, Reputation and Bottom Line
Introduction
NAVEX Global has been collecting and delivering leading-edge market benchmark reports to the risk and compliance (R&C) industry since 2012. In 2019, we published our first-ever “Definitive Corporate Compliance Benchmark Report,” a comprehensive review of risk and compliance (R&C) programs that offered key findings, analysis, and insight to help organizations measure, evaluate and advance their programs.
This year, NAVEX Global partnered with an independent research firm to survey R&C professionals from a wide range of industries about the design, priorities and performance of their R&C programs. The results of the survey represent over 1,000 respondents globally who influence or manage their organization’s risk and compliance programs. In addition, this report includes detailed responses from those who actively manage or influence their program’s incident management, policy and procedure management, ethics and compliance training, third-party risk management, integrated risk management, and/or environmental, social and governance (ESG) functions.
Insights and analysis addressed in the new 2021 report include:
• What are the top priorities of R&C decision makers?
• What elements make an effective R&C program, and how are they administered?
• How do programs evaluate their performance?
• How does technology impact program effectiveness and design?
• How does senior management’s view of R&C programs influence program outcomes?
• How do R&C programs integrate risk management functions?
• What role does the regulatory environment play in program performance?
• How can a successful program reduce regulatory risk while measurably improving efficiency, accuracy and consistency?
How to Use This ReportThe data and insights in this report help chief compliance officers and other R&C professionals make informed program decisions. The report also outlines practical ways to improve R&C programs of all maturity levels and organizational sizes:
• Benchmark your organization’s program against peers, industry standards and best practices.
• Assess your program maturity.
• Identify specific steps to improve performance.
• Review and compare program priorities and effectiveness measures.
• Determine whether your approach to organizational risk is aligned with market trends and best practices.
• Review how your organization is protected or exposed to risk through your approach to incident management; policy and procedure management; ethics and compliance training; third-party risk management; and environmental, social and governance practices.
• Leverage reports and recommendations to get organizational buy-in, budget and understand the ROI of a comprehensive risk and compliance program.

THE 2021 DEFINITIVE RISK & COMPLIANCE BENCHMARK REPORT
3NAVEX Global | Protecting Your People, Reputation and Bottom Line
Key Definitions
POLICY MANAGEMENT includes controlling the organization’s policies and procedures throughout the policy lifecycle: drafting, editing, approving, updating, distributing, storing and documenting attestations. Policy management software (or a policy management system) refers to the technology that enables more efficient management and execution of those practices.
ETHICS AND COMPLIANCE (E&C) TRAINING includes regulatory compliance, conduct, employment law and information security training from a behavioral perspective. This definition includes all forms of training on ethics and compliance topics: online, in-person, virtual and blended training approaches. Educational and awareness approaches are also within this scope of training.
INCIDENT MANAGEMENT typically consists of telephone, web, mobile and other whistleblower channels where employees and other stakeholders can make reports. Incident management systems record and encourage responses to questions, reports and incidents received, and offer executive reporting tools and the ability to track and manage resolution.
THIRD-PARTY RISK MANAGEMENT is an umbrella term that refers to all risk-management activities related to third parties: onboarding, screening, monitoring and in-depth risk analysis; as well as associated processes to identify, stratify, prioritize and mitigate third-party risks. Third-party due diligence refers to the studied assessment of third parties before, during and after an engagement. Internal business justifications, external preliminary risk assessments, establishing business rules and authorizations, processing documentation and policies, database analysis and reputational reporting are all third-party due diligence. It also includes active monitoring of third-party engagements for new “red flags” and real-time changes to the third party’s risk profile.
INTEGRATED RISK MANAGEMENT is a process that improves decision making and enhances business value by integrating risk intelligence into activities across the enterprise, such as strategic planning and strategy execution, investment decision making, project portfolio management, enterprise performance management, third-party performance management, and information governance.
PROGRAM MATURITY is a measure of the size and sophistication of a company’s existing risk and compliance program. For the purposes of the 2020 study, maturity designations were based on the number of program elements employed, the systems used to administer them, and respondents’ assessment of their program’s overall ability to address R&C issues and concerns. The maturity scoring describes five progressive levels of program development: Reactive, Basic, Definitive, Maturing and Advanced. We utilize program maturity as an indicator of current proficiency and performance.
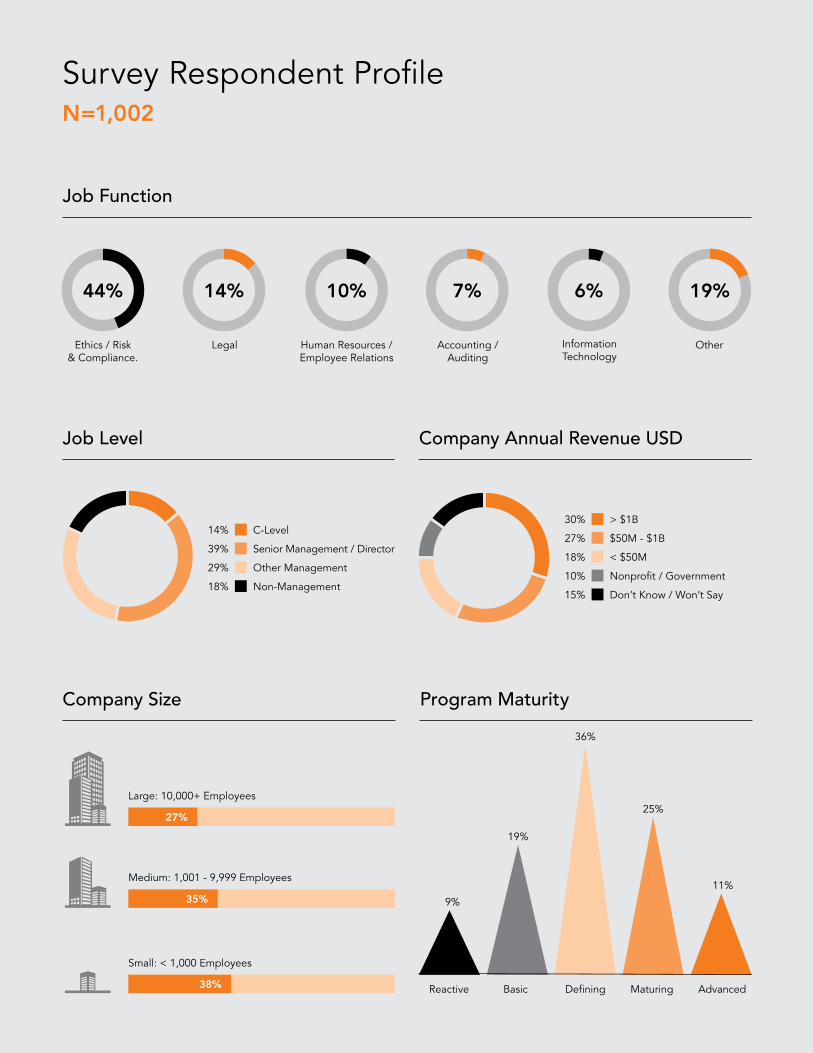
Survey Respondent ProfileN=1,002
Job Function
C-Level14%
Senior Management / Director39%
Other Management29%
Non-Management18%Don’t Know / Won’t Say15%
> $1B30%
$50M - $1B27%
< $50M18%
Nonprofit / Government10%
Job Level Company Annual Revenue USD
Company Size Program Maturity
Ethics / Risk & Compliance.
44%
Human Resources / Employee Relations
10%
Legal
14%
Accounting / Auditing
7%
Information Technology
6%
Other
19%
Large: 10,000+ Employees
27%
Medium: 1,001 - 9,999 Employees
35%
Small: < 1,000 Employees
38%
11%
9%
19%
36%
25%
Reactive Basic Defining Maturing Advanced

Note: Totals may be over 100% due to multiple selection options.
Knowledgeable About
Geographical Footprint Headquarters Other Locations
AMERICAS 82% 79%
North America 79% 29%
South America 1% 23%
Central America 1% 17%
Caribbean 1% 10%
EMEA 13% 66%
Europe 9% 30%
Middle East 2% 20%
Africa 2% 16%
APAC 5% 34%
Incident Management
70%
Ethics and Compliance Training
81%
Policy and Procedure Management
82%
Third-Party Risk Management
50%
Environmental, Social & Governance
27%
Integrated Risk Management
43%
Industries (Percentage of Respondents)
Other 37%
Educational Services 5%
Professional / Scientific / Technical Services
9%
Finance / Insurance 15%
Manufacturing 17%
Healthcare / Social Assistance
17%
82%
79%13%
66%
5%
34%

THE 2021 DEFINITIVE RISK & COMPLIANCE BENCHMARK REPORT
6NAVEX Global | Protecting Your People, Reputation and Bottom Line
Executive Summary
As we stated in our 2021 Incident Management Benchmark, to say 2020 was disruptive is an exercise in understatement. And while we may reasonably hope that the worst is behind us, the uncertainty and risk that it introduced is unlikely to recede anytime soon.
Fortunately, there are valuable lessons to be learned from the events of the past year, as well as positive signs for the risk and compliance space in particular. In the face of sudden and massive shifts in how, where and with whom we work, the risk and compliance functions of businesses across the globe responded with strength and resiliency, adapting to new conditions and challenges as they arose.
The crisis also prompted new and renewed interest in going beyond compliance to tackle a host of risks through activities including business continuity planning; enhanced due diligence and continuous monitoring of third parties; advancements in how we update, disseminate, and document the use of policies and procedures; and in better training of employees, third parties and leadership on ethics and compliance issues. Our incident management systems proved consistently robust, taking full advantage of technology and automation solutions.
Similarly, the increasing size and scope of environmental disasters has led to an increased (and welcome) sense of urgency from the broader public, as well as commitments from businesses to make a difference through robust and impactful Environmental, Social and Governance (ESG) programs.
Above all, this year’s benchmark report demonstrates that the quickly maturing risk and compliance sector is taking a broader, more integrated and holistic approach to managing uncertainty. And that’s a good thing, because there is every indication that this will be its defining challenge in the months and years to come.
This rapid pace of change makes benchmarking your program more important than ever. As risk and compliance functions innovate to meet an expanding universe of business needs, it is essential they measure their programs and progress against both their peers and increasingly demanding regulatory guidance.
To that end, this year’s risk and compliance benchmark has drawn on a variety of expert opinion and regulatory guidance, including the U.S. Department of Justice’s “Evaluation of Corporate Compliance Programs,” for its questioning and analysis. We chose this guidance for its current and holistic view of the ethics and compliance function. However, be aware; this tool is just one of many global guidelines for creating and maintaining effective R&C programs. Its purpose is to guide prosecutors in assessing programs that have already committed a compliance failure. As Hui Chen, former compliance counsel for the Justice Department and author of the original DOJ corporate compliance guidance, notes, “If you can give fairly reasonable answers to these questions, congratulations, you are a C student. The A students are not in front of us.”1 In other words, the guidance provides the necessary table stakes to play, but not best practices to win.
1 Chen, Hui, and Carrie Penman. “Decoding the DOJ’s Guidance: An Insider’s Guide.” Webinar, May 2019.

THE 2021 DEFINITIVE RISK & COMPLIANCE BENCHMARK REPORT
7NAVEX Global | Protecting Your People, Reputation and Bottom Line
The results of our survey identified several key successes and challenges, specifically:
• The risk and compliance sector is rapidly maturing. This year we witnessed sizeable increases in program maturity and confidence. The number of Mature and Advanced programs grew by 29%, while the number of Reactive and Basic ones declined by 35%. We also saw a significant increase in the adoption of purpose-built systems to manage R&C functions, as well as robust use of program measures, continuous access to data across functions and integration of risk management throughout the enterprise. However, programs should take note: More sophistication can create opportunity for growth, but programs that don’t seize the moment could be left behind.
• The pandemic did not significantly disrupt risk and compliance, but it did impact R&C priorities. Surprisingly (given the size and scope of the pandemic), risk and compliance programs emerged relatively unscathed. None of the R&C functions surveyed were described as “disrupted” or “very disrupted” by more than a fifth of respondents, and over half reported that none of the R&C functions surveyed experienced significant disruption. Workplace culture also remained largely unharmed. Half of those surveyed said they experienced no change in their workplace culture, while the other half was just as likely to say it improved as not. However, R&C priorities did shift. Business continuity ranked as the number two priority for respondents, right behind data privacy, protection and security – a clear sign R&C programs are thinking about operational risk.
• Programs say they are under-resourced. One major point of interest this year is the fact that many programs say they suffer from a lack of adequate funding and staff. Only a third (34%) of respondents rated their access to both these resources as “good” or “very good.” This is especially important since, as the report demonstrates, substantive resourcing is strongly correlated to a host of positive program
outcomes. Fortunately, however, respondents are satisfied with the skill and quality of the staff they have. Over two-thirds (69%) say their staff have appropriate experience and qualifications.
• Leadership’s commitment to compliance wavers in challenging circumstances. Three-fourths of respondents said their senior leaders and managers both demonstrate a commitment to compliance. However, when asked if their leadership had persisted in that commitment in the face of competing interests or business objectives, that number shrank by as much as 37 percentage points. This is further validation of last year’s benchmark finding that a substantive portion of leadership support was “soft” or situational.
• Organizations are good at acquiring data – but are not effectively utilizing it. Overall, R&C programs are excelling at collecting information. They relied on multiple sources for their program audits, testing and analysis, and rated their continuous access to data across business functions relatively high. However, programs still lagged when it came to effectively leveraging that access, whether that meant using risk assessment results to make risk-based resource allocation decisions or using metrics to track policy access or to assess reporting effectiveness.
To make the most of this moment, R&C professionals must make culture a must, not a “nice to have.” That means elevating the importance of improving organizational culture in your decision-making processes and holding all employees accountable for their actions. They must also make securing funds and staff a top priority, and jealously pursue leadership support even in the face of competing priorities. They must learn to effectively use the data available to them and integrate their risk management practices throughout the enterprise. Above all, they must seize the opportunity of this moment, uncertainty and all – or risk getting left behind.

THE 2021 DEFINITIVE RISK & COMPLIANCE BENCHMARK REPORT
8NAVEX Global | Protecting Your People, Reputation and Bottom Line

9NAVEX Global | Protecting Your People, Reputation and Bottom Line
Key Findings

THE 2021 DEFINITIVE RISK & COMPLIANCE BENCHMARK REPORT KEY FINDINGS
10NAVEX Global | Protecting Your People, Reputation and Bottom Line
1 “Evaluation of Corporate Compliance Programs.” U.S. Department of Justice, Criminal Division, June 2020, p4-6.
1. Program Maturity
Risk & Compliance Program Maturity Is IncreasingProgram maturity, which measures the size and sophistication of company’s existing risk and compliance program, is a key indicator of program performance. It is based on the number of program elements employed, the systems used to administer them, and respondents’ assessment of their program’s overall ability to address R&C concerns. The maturity scoring describes five progressive levels of program development: Reactive, Basic, Defining, Maturing and Advanced. Generally, the more mature an R&C program is, the better its outcomes. Throughout this study, a program’s likelihood to rate its performance as “good” or “excellent” is positively associated with its level of maturity.
Risk and compliance programs have come a long way in a short time. Program maturity has steadily increased, with Mature/Advanced programs growing by 29% over last year, while the number of Reactive/Basic programs declined by 35% (Figure 1.1). This is tremendous progress. Confidence in risk and compliance programs is also high, with over two- thirds (67%) of our survey respondents describing
their programs as strong and capable of covering most or all risk and compliance issues (Figure 1.2). Such confidence is greater in highly regulated industries such as healthcare and financial services, likely due to the self-preserving need to comply with myriad government regulations.
However, while more Mature programs perform better than their less-developed peers, they still underperform in several key areas. For example, fewer than half (44%) of Mature and Advanced programs track employee access to policies and procedures, and a similar percentage don’t address employees who fail all or part of their ethics and compliance training – practices specifically outlined in the U.S. Department of Justice’s Evaluation of Corporate Compliance Programs.1
The bottom line: While program maturity and high levels of program confidence are very important, there is still lots of opportunity to improve our R&C programs.

THE 2021 DEFINITIVE RISK & COMPLIANCE BENCHMARK REPORT KEY FINDINGS
11NAVEX Global | Protecting Your People, Reputation and Bottom Line
Program Maturity (Continued)
Figure 1.1 Risk & Compliance Program MaturityShown: Percent of respondents per maturity level, 2020 vs 2021
Figure 1.2 Risk & Compliance Program ConfidenceShown: Responses to “Which of the following best describes your risk & compliance program?”
11%
25%
35%
19%
9%
2021
8%
20%
29%
30%
13%
2020
AdvancedMatureDefiningBasicReactive
1: Risk & Compliance Program Maturity
70%
17%50%27%6%
We Fully Cover All Risk & Compliance Issues
We Have a Strong Program, but Have Room for Improvement
We Have Essential Capabilities, but Are Not Where We Should Be
We Can Respond to Critical Issues, but Can't Scale or Plan for Additional Needs
Percent of respondents with strong programs that cover most or all risk & compliance issues67%
2: Risk & Compliance Program Confidence

THE 2021 DEFINITIVE RISK & COMPLIANCE BENCHMARK REPORT KEY FINDINGS
12NAVEX Global | Protecting Your People, Reputation and Bottom Line
53%
23% 45%19%9%
20%16%8%
4%
28%21%12%4% 35%
21%20%11%6% 42%
26%21%12%4% 37%
25%24%14%6% 31%
Policy & ProcedureManagement
Incident Management
Managing ComplianceIssues
Data Privacy& Protection
Ethics & ComplianceTraining
Third-Party RiskManagement
4 3 2 1 (Minimally Disruptive)5 (Very Disruptive)
7: COVID-19 Impact on Risk & Compliance
Figure 2.1 COVID-19 Impact on Risk & ComplianceShown: Responses to “How disruptive has the COVID-19 pandemic been?” by program element
2. COVID-19 Impact
COVID-19 Did Not Significantly Disrupt Risk & Compliance Functions It seems safe to say all organizations worldwide have felt the worrying effects of the global pandemic on their internal functions. However, risk and compliance programs fortunately experienced only minor disruption of their core activities. None of the R&C functions surveyed were described as “disrupted” or “very disrupted” by more than a fifth (20%) of respondents (Figure 2.1). Over half (53%) oreported that none of the R&C functions surveyed experienced significant disruption.2 COVID-19 was most unsettling for Third-Party Risk Management and Compliance Training. It had less impact on Policy Management and Incident Management – a finding reinforced by our 2021 Incident Management Benchmark Report.3 The minimal impact numbers for these and all other program elements increased even further as maturity increased. Interestingly, many of these core program components (particularly Incident Management)
were frequently administered through purpose-built software, which is adopted more often as programs Mature. Automated R&C solutions can be operated remotely by a small staff – great features for minimizing disruption at a time when much of the workforce was reduced or working from home.
The Shift to Remote Work Varied by IndustryRemote working ushered in a sea change in the way people do their jobs, with almost 2 of 3 (61%) employees working from home. The number varied by industry, with desk-based workers heading to home offices most frequently, such as those in professional and financial organizations (81% and 77%, respectively). Employees with jobs requiring their physical presence in the workplace, for example those in healthcare or manufacturing, were about half as likely to work remotely.
2 Don’t Know/Not Applicable responses excluded from base; N=891.3 Penman, Carrie, and Andrew Burt. “2021 Risk & Compliance Incident Management Benchmark Report.” NAVEX Global, May 2021.

THE 2021 DEFINITIVE RISK & COMPLIANCE BENCHMARK REPORT KEY FINDINGS
13NAVEX Global | Protecting Your People, Reputation and Bottom Line
57%
33%
10%
YesNot SureNo
9: Return to Work Planning Post-COVID
Figure 2.2 Work-From-Home Impact on Workplace CultureShown: Responses to “How has work-from-home affected your workplace culture?”
26%
49%
25%
ImprovedNo ChangeNegatively Impacted
11: Return to Work Planning Post-COVID
Figure 2.3 Return to Work Planning Post-COVIDShown: Responses to “Do you plan on returning to Pre-COVID working conditions?”
COVID-19 Impact (Continued)
Half of Organizations Experienced No Change in Workplace CultureWith so many people working from home, it seems likely that the change in workplace dynamics would cause significant damage to the culture of many organizations. However, the survey revealed a surprise – half (49%) of cultures saw no change and another one-quarter (26%) even improved (Figure 2.2). But remote work may not be the common practice much longer. Most (57%) surveyed organizations plan to return employees to their pre-COVID work environment (Figure 2.3). The top priority of employers by far (78%) in mobilizing the back-to-work effort is safety first (Figure 2.4). There are no differences based on industry; workforce size; revenue; geographic footprint or headquarters location. The world is one on this prime concern.
Business Continuity Plans Helped Mitigate COVID-19Safety first may be an obvious top issue in recovering from a pandemic, but this is hindsight. Without the pandemic experience, legal or operational matters may have taken first place. This is where business continuity pre-planning can make a difference in handling a crisis. Almost half (46%) of organizations affirmed they had a business continuity plan and more than 3 out of 4 (80%) of those agreed on its value in mitigating the pandemic’s impact (Figure 2.5).

2021 RISK & COMPLIANCE INCIDENT MANAGEMENT BENCHMARK REPORT
14NAVEX Global | Protecting Your People, Reputation and Bottom Line
COVID-19 Impact (Continued)
8%34%58%
14%50%36%
78%15%7%
Operational
Legal
Safety
Second Priority First PriorityThird Priority
10: Return to Work Priorities
Figure 2.4 Return to Work PrioritiesShown: Responses to “Which considerations are most important to your organization’s return to work decision making?”
70%
46%20% 11%17%7%
We Did, and It Helped Mitigate the Impact of COVID-19
We Did, but It Didn't Help Mitigate the Impact of COVID-19
We Didn’t, But We Are Planning / Developing One Now
We Didn’t, but We Do NowWe Didn’t, And Have No Plans to Develop One
Percent of respondents who had a business continuity plan in place and said it helped mitigate the pandemic’s impact 80%
12: Business Continuity Planning Impact
Figure 2.5 Business Continuity Planning ImpactShown: Responses to “Did you have a business continuity plan in place for a global pandemic prior to COVID-19?”

2021 RISK & COMPLIANCE INCIDENT MANAGEMENT BENCHMARK REPORT
15NAVEX Global | Protecting Your People, Reputation and Bottom Line
THE 2021 DEFINITIVE RISK & COMPLIANCE BENCHMARK REPORT KEY FINDINGS
16NAVEX Global | Protecting Your People, Reputation and Bottom Line
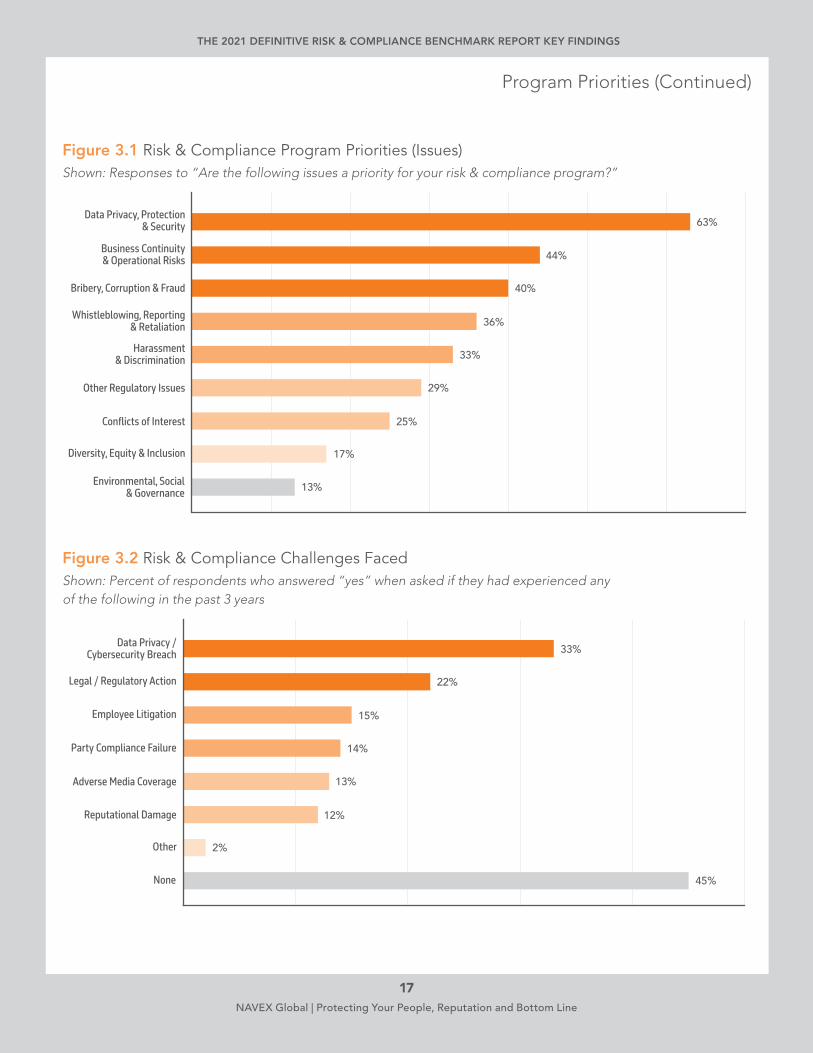
Cybersecurity and Business Continuity Top Priorities; Diversity and ESG Concerns LaggingWith finite resources and a limited budget, R&C programs must be judicious each year in their prioritization of focus areas. This is typically driven by level of unmitigated risk for each area. This year, COVID-19 had a dramatic effect on program priorities with pandemic-related issues propelling Business Continuity & Operational Risks from relative obscurity to the second top spot in organizations’ lists of concerns (Figure 3.1).
However, data privacy and cybersecurity issues remain the chief concern, likely due to the ever-increasing number of serious headline-worthy hacks into major organizations. No entity wants to be that headline or pay the financial and reputational penalties. Firsthand experience may have also played a role. One in three programs have experienced a data privacy and/or cybersecurity breach within the past three years, making it the most widely experienced R&C challenge surveyed (Figure 3.2).
Also noteworthy are the two bottom priorities that are far below the pack – Diversity/Inclusion and ESG. The bottom spot winners are surprising given the global social justice movement that ignited in 2020.4 It appears the priority ranking is ordered by level of risk and legal compliance – starting with potentially catastrophic areas of concern that could take down an organization; followed by legal/regulatory matters; ending with the “soft” areas (ESG is admittedly governed by laws, but it also has a significant, emotional component that until recently has caused this risk to be largely treated like other “soft” risk areas such as diversity, inclusion, respect and professionalism). Legal and regulatory requirements also remain the primary decision-making factor for setting R&C program priorities. This risk category is associated with tangible, defined “hard” consequences that can seriously harm an organization – there is nothing soft about it.
3. Program Priorities
4 Silverstein, Jason. “The Global Impact of George Floyd: How Black Lives Matter Protests Shaped Movements around the World.” CBS News, June 4, 2021.
THE 2021 DEFINITIVE RISK & COMPLIANCE BENCHMARK REPORT KEY FINDINGS
17NAVEX Global | Protecting Your People, Reputation and Bottom Line
Program Priorities (Continued)
3%
17%
13%
4%
25%4%
33%6%
29%4%
36%
40%
44%
63%
6%
Diversity, Equity & Inclusion
Environmental, Social& Governance
Conflicts of Interest
Other Regulatory Issues
Harassment& Discrimination
Whistleblowing, Reporting& Retaliation
Bribery, Corruption & Fraud
Business Continuity & Operational Risks
Data Privacy, Protection& Security
17: Risk & Compliance Program Priorities (Issues)
Figure 3.1 Risk & Compliance Program Priorities (Issues) Shown: Responses to “Are the following issues a priority for your risk & compliance program?”
2%
45%
12%
14%
13%
15%
22%
33%
Other
None
Reputational Damage
Adverse Media Coverage
Party Compliance Failure
Employee Litigation
Legal / Regulatory Action
Data Privacy /Cybersecurity Breach
15: Risk & Compliance Challenges Faced
Figure 3.2 Risk & Compliance Challenges Faced Shown: Percent of respondents who answered “yes” when asked if they had experienced any of the following in the past 3 years

THE 2021 DEFINITIVE RISK & COMPLIANCE BENCHMARK REPORT KEY FINDINGS
18NAVEX Global | Protecting Your People, Reputation and Bottom Line
R&C Priorities Differ by IndustryR&C program priorities are ranked differently based on industry. For example, harassment and discrimination is a higher priority than overall for the Education sector (Figure 3.3). In contrast, the financial services industry has given a low priority to harassment and discrimination, despite several recent high-profile incidents in this area. This may be partly due to the fact that many financial firms have required employees to agree to mandatory arbitration for sexual harassment claims – leading some to assert the sector did not have an accounting during the #METoo movement.5 There continues to be a massive gap in the pay scale between men and women doing the same job in this sector and top positions in the firms rarely are awarded to women, indicating there may be a cultural component at work that makes this risk area a blind spot.6
Whistleblowing and retaliation is another area where industries have different priorities. The manufacturing sector ranks this risk significantly higher, while the financial services industry again considers it a significantly lower priority. A 2020 survey found more misconduct was observed by employees who experienced several significant workplace changes in a year than those who endured none.7 The rapid succession of changes pushed on most employers by the pandemic may have fueled the increased focus on whistleblowing and retaliation, with the manufacturing sector being particularly hard-hit by change. Finance, in contrast, may not have undergone as many changes over the last year as manufacturing.
It is also important to note that reports of retaliation have dropped during the COVID-19 pandemic.8 However, a lack of reporting does not mean retaliation isn’t occurring. Financial organizations would be well-advised to make reporting/retaliation a higher R&C program priority.
Bribery, corruption and fraud is also much more of a priority than overall for the Manufacturing industry. This is logical given most manufacturers conduct at least some cross-border commerce and frequently have relationships with many global third parties through their supply chains and distribution networks, increasing their risk. Healthcare and professional services, in contrast, rank this priority much lower. Healthcare organizations typically share limited opportunity for corruption, mostly through their purchasing processes; therefore, this industry prioritizes corruption risk much lower than overall (20% vs. 40%). The Professional Services sector also sees corruption as an almost equally low (24%) R&C priority, though the reasons are not readily apparent.
Curiously, Professional Services was the only industry to prioritize diversity, equity and inclusion at a significant higher rate than overall (31% vs. 17%). This possibly indicates an inclination within this industry to engage more diverse providers for the wider range of talent and creativity a diverse provider brings to the client’s work.
Program Priorities (Continued)
5 Krawcheck, Sallie. “Why Women Continue to Lose in the Financial Services Industry and How We Can Fix It.” Fortune, October 17, 2019. 6 Antilla, Susan. “25 Years after the ‘Boom Boom Room’ Lawsuit, Wall Street Still Has a Long Way to Go.” CNN, May 27, 2021. 7 “2020 Global Business Ethics Survey Report: Pressure in the Workplace.” ECI, March, 2021. 8 Penman, Carrie, and Andrew Burt. “2021 Risk & Compliance Incident Management Benchmark Report.” NAVEX Global, May 2021, p.48-49.

THE 2021 DEFINITIVE RISK & COMPLIANCE BENCHMARK REPORT KEY FINDINGS
19NAVEX Global | Protecting Your People, Reputation and Bottom Line
36%
18%
48%
15%
33%
65%
Overall
Finance
Manufacturing
WHISTLEBLOWING, REPORTING & RETALIATION
Finance
Overall
Education
HARASSMENT & DISCRIMINATION
18: Risk & Compliance Program Priorities (By Industry)
31%
17%
20%
24%
40%
62%
ProfessionalServices
Overall
DIVERSITY, EQUITY & INCLUSION
Healthcare
ProfessionalServices
Overall
Manufacturing
BRIBERY, CORRUPTION & FRAUD
19: Risk & Compliance Program Priorities (By Industry)
Figure 3.3 Risk & Compliance Program Priorities (By Industry) Shown: Percent of respondents who prioritized the following issues by industry
Program Priorities (Continued)

THE 2021 DEFINITIVE RISK & COMPLIANCE BENCHMARK REPORT KEY FINDINGS
20NAVEX Global | Protecting Your People, Reputation and Bottom Line
Resources, Industry & Independence Affect Importance of Organizational Culture Several factors influence R&C priorities (Figure 3.4). Unsurprisingly, meeting legal and regulatory compliance was the main consideration with 84% of organizations rating it “very important,” followed by 63% that rated mitigating risk in the same tier. The two remaining surveyed drivers – improving corporate culture and alignment with business strategies – occupied last place (43%) for the highest rating. When expanding the rating scale to “important/very important,” culture improvement ranked as the overall lowest (77%) influence on R&C program decision-making.
Nonetheless, organizational culture was rated as “very important” more often by two key industries – Healthcare (51%) and Professional Services (54%), both very client-focused sectors (meaning relationship focused – another “soft” cultural attribute) (Figure 3.5). More than half (51%) of independent R&C programs also gave culture these top two ratings. Additionally, 55% of programs with very sufficient resources – staffing, funding and access to data – rated culture as “very important,” with almost 9 of 10 (86%) placing it in the top two levels of importance.
These data appear to loosely reflect Maslow’s Hierarchy of Needs.9 R&C Programs will prioritize their basic needs first – stay out of jail, minimize litigation costs and reputational damage, mitigate key risks overall, regulatory compliance. When those needs are well-controlled, programs perceive they have the luxury of moving on to tackle more emotional, “softer” cultural needs – workplace civility and respect, diversity and inclusion, social issues, caring for environment.
Catastrophic events aside, it is ironic that both “soft” priorities and regulatory concerns are risk areas that are best mitigated broadly with a strong culture of ethics and integrity, and culture is fueled by the factor of emotion. Yet the lowest priority areas are soft – diversity, inclusion, environment, social issues – and are all about respectful conduct and the motivation to do the right thing. If those areas received more fruitful focus from organizations, daily workplace conduct (read as “culture”) would change for the better. Culture is the root cause and main driver of all human behavior. As we likely have heard repeatedly, culture trumps rules every time. Getting the culture right is ultimately the most effective way to successfully meet the basic needs of your R&C program.
Program Priorities (Continued)
9 McLeod, Saul. “Maslow’s Hierarchy of Needs.” Simply Psychology, December 29, 2020.

THE 2021 DEFINITIVE RISK & COMPLIANCE BENCHMARK REPORT KEY FINDINGS
21NAVEX Global | Protecting Your People, Reputation and Bottom Line
83%6% 11%
63%10% 27%
44%18% 38%
43%23% 34%
Aligning With Business Strategies
Improving Organizational Culture
Mitigating Risk
Meeting Legal /Regulatory Requirements
Important Very ImportantNot Important
20: Risk & Compliance Program Decision-Making Considerations
43%
32%
51%
51%
54%
55%
Overall
Finance
Healthcare
Independent R&C Function
Professional & Technical Services
Well-Resourced
21: Importance of Organizational Culture in Risk & Compliance Program Decision Making
Figure 3.4 Risk & Compliance Program Decision-Making Considerations Shown: Responses to “How important are the following considerations in your R&C program’s decision-making process?”
Figure 3.5 Importance of Organizational Culture in Risk & Compliance Program Decision Making Shown: Percent of respondents who cited improving organizational culture as “very important” by cross-section
Program Priorities (Continued)

THE 2021 DEFINITIVE RISK & COMPLIANCE BENCHMARK REPORT KEY FINDINGS
22NAVEX Global | Protecting Your People, Reputation and Bottom Line
A Majority of R&C Programs Use Purpose-Built Solutions to Administer Elements The use of automated systems to manage R&C program elements is becoming more common. At least a third of respondents who have a given element administer it with a purpose-built solution (Figure 3.6). Sixty-one percent (61%) of surveyed programs use purpose-built systems to administer at least one of
the R&C elements surveyed, with a whopping three-quarters (73%) planning to adopt such solutions within the next two years. The shift to automation is highest among Advanced and independent programs (Figure 3.7), which are typically better resourced than their less Mature or non-independent counterparts. Maturing organizations take note – independent programs are not always found in large or high-revenue organizations; risk and compliance
27%
25%
28%
37%
38%
38%
39%
60%
Awareness Solutions
ESG Reporting
Code of Conduct
Ethics & Compliance Training
Third-Party Risk Management
Policy & Procedure Management
Conflicts of Interest
Incident Management
61% Percent of respondents who use purpose-built solutions to administer at least one element of their risk & compliance program
23: Purpose-Built Solution Use (by Program Element)
Figure 3.6 Purpose-Built Solution Use (by Program Element) Shown: Percent of respondents with a given element who use purpose-built solutions to administer the following R&C elements
Program Priorities (Continued)
THE 2021 DEFINITIVE RISK & COMPLIANCE BENCHMARK REPORT KEY FINDINGS
23NAVEX Global | Protecting Your People, Reputation and Bottom Line
3%
39%
33%
4%
41%4%
48%6%
43%4%
6%
Over 5,000 Employees
Overall
Finance
Independent R&C Function
Advanced Programs
22: Risk & Compliance Program Priorities (Automation)
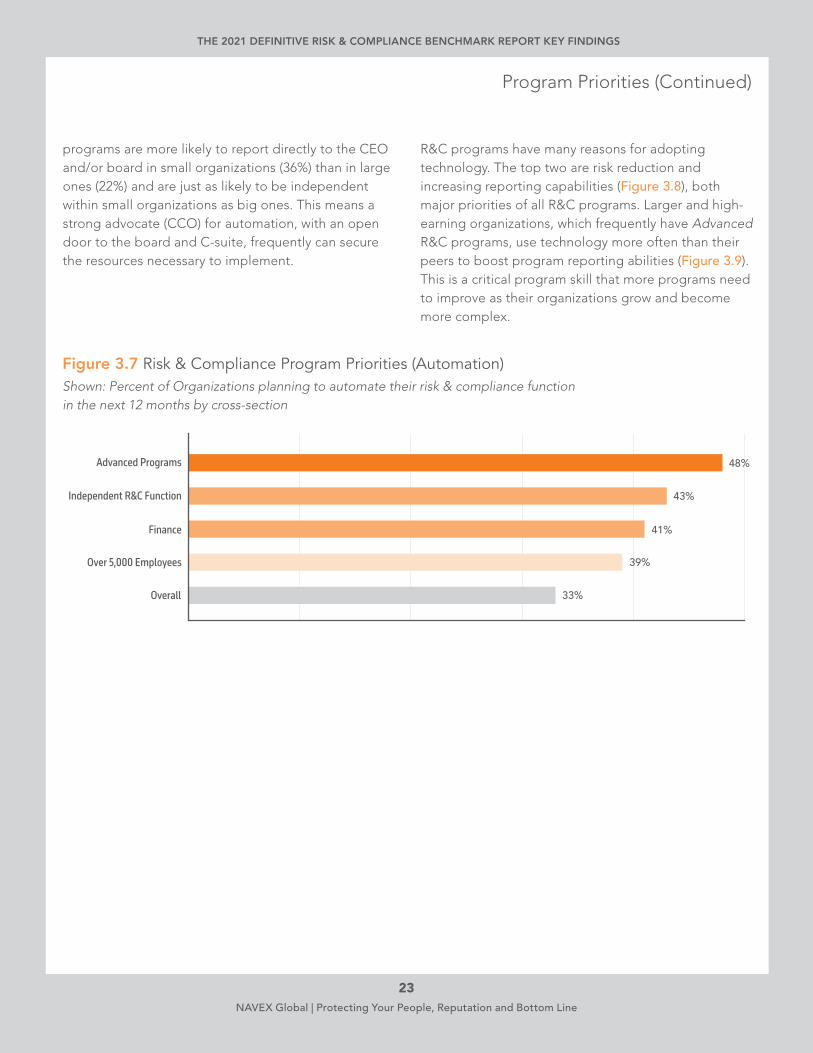
Figure 3.7 Risk & Compliance Program Priorities (Automation) Shown: Percent of Organizations planning to automate their risk & compliance function in the next 12 months by cross-section
Program Priorities (Continued)
programs are more likely to report directly to the CEO and/or board in small organizations (36%) than in large ones (22%) and are just as likely to be independent within small organizations as big ones. This means a strong advocate (CCO) for automation, with an open door to the board and C-suite, frequently can secure the resources necessary to implement.
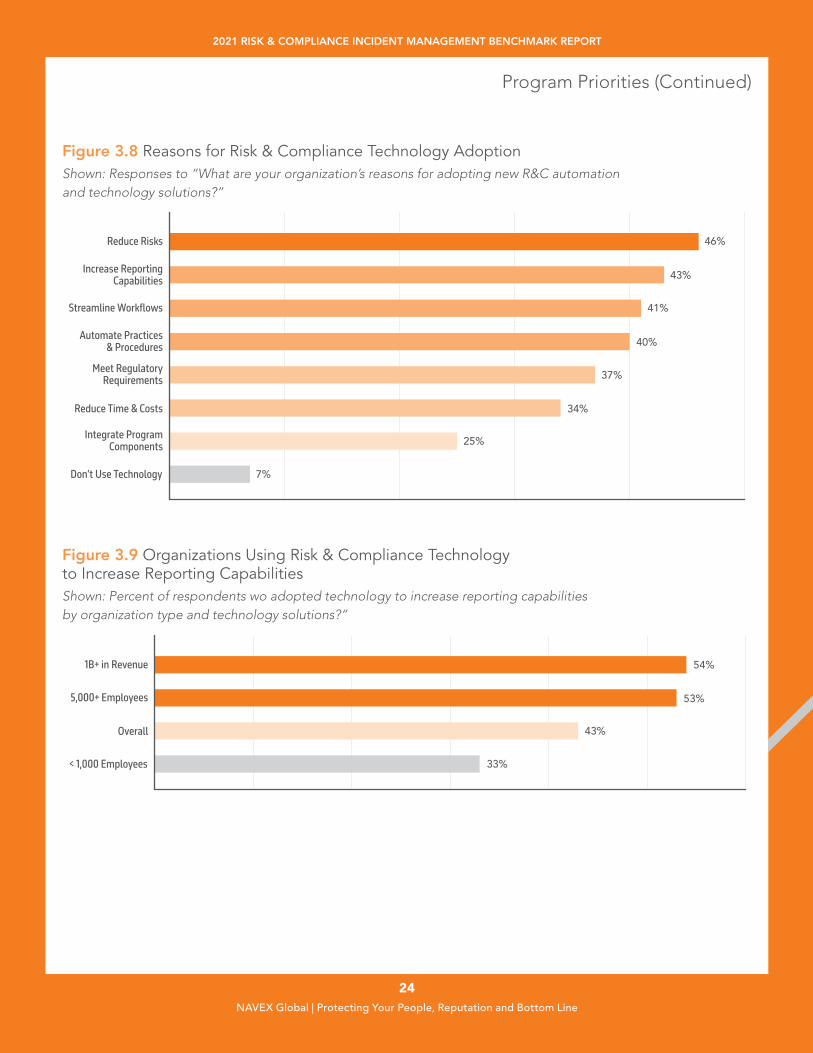
R&C programs have many reasons for adopting technology. The top two are risk reduction and increasing reporting capabilities (Figure 3.8), both major priorities of all R&C programs. Larger and high-earning organizations, which frequently have Advanced R&C programs, use technology more often than their peers to boost program reporting abilities (Figure 3.9). This is a critical program skill that more programs need to improve as their organizations grow and become more complex.
2021 RISK & COMPLIANCE INCIDENT MANAGEMENT BENCHMARK REPORT
24NAVEX Global | Protecting Your People, Reputation and Bottom Line
Program Priorities (Continued)
3%
25%
7%
4%
34%4%
40%
41%
43%
46%
6%
37%4%
6%
Integrate ProgramComponents
Don’t Use Technology
Reduce Time & Costs
Meet RegulatoryRequirements
Automate Practices& Procedures
Streamline Workflows
Increase ReportingCapabilities
Reduce Risks
24: Reasons for Risk & Compliance Technology Adoption
43%
33%
53%
54%
Overall
< 1,000 Employees
5,000+ Employees
1B+ in Revenue
25: Organizations Using Risk & Compliance Technology to Increase Reporting Capabilities
Figure 3.8 Reasons for Risk & Compliance Technology Adoption Shown: Responses to “What are your organization’s reasons for adopting new R&C automation and technology solutions?”
Figure 3.9 Organizations Using Risk & Compliance Technology to Increase Reporting Capabilities Shown: Percent of respondents wo adopted technology to increase reporting capabilities by organization type and technology solutions?”

2021 RISK & COMPLIANCE INCIDENT MANAGEMENT BENCHMARK REPORT
25NAVEX Global | Protecting Your People, Reputation and Bottom Line

THE 2021 DEFINITIVE RISK & COMPLIANCE BENCHMARK REPORT KEY FINDINGS
26NAVEX Global | Protecting Your People, Reputation and Bottom Line
4. Risk Assessment & Measures of Effectiveness
29%
34%
50%
Is Informed by ContinuousAccess to Data
Results in Risk-TailoredResource Allocation
Is Current & Subjectto Periodic Review
Percent of respondents who use risk assessments to review, test & improve their risk & compliance programs71%
48: Risk & Compliance Risk Assessments
Figure 4.1 Risk & Compliance Risk Assessments Shown: Responses to “Which of the following is true about your risk assessment?”
Most Programs Lack Fully Informed & Utilized Risk Assessments Risk assessment is the critical first step in crafting an effective compliance program. As the U.S. Department of Justice’s “Evaluation of Corporate Compliance Programs” states:
“The starting point for a prosecutor’s evaluation of whether a company has a well-designed compliance program is to understand the company’s business from a commercial perspective, how the company has identified, assessed, and defined its risk profile, and the degree to which the program devotes appropriate scrutiny and resources to the spectrum of risks.”10
Note the emphasis on understanding an organization’s business. The expectation is that a risk and compliance program will utilize many sources of information, including operational data, to review, test and improve their programs so that there is sufficient scrutiny and management of their risks. This may surprise some compliance professionals who focus exclusively
on “compliance” risks, such as regulatory (e.g., bribery, insider trading); R&C program matters (e.g., training completion rates, hotline reporting numbers); and cultural or human resources concerns (e.g., bullying, inclusion, equal opportunity). Taking a universal look at risk, including operational risk, enables programs to appropriately prioritize resources and focus efforts accordingly.
When asked about their use of risk assessments, almost three quarters (71%) of respondents said they used them to inform the testing, review and improvement of their R&C programs (Figure 4.1). While half of respondents reported their risk assessments were current and periodically reviewed, only 29% said those assessments were informed by continuous access to operational data across business lines. Additionally, only a third used their assessments to make risk-based resource allocations. Overall, only 16% of respondents meet all three criteria outlined by the DOJ for risk assessment design and use – a sobering thought for many organizations regardless of their size, industry or geography.
10 “Evaluation of Corporate Compliance Programs.” U.S. Department of Justice, Criminal Division, June 2020.

THE 2021 DEFINITIVE RISK & COMPLIANCE BENCHMARK REPORT KEY FINDINGS
27NAVEX Global | Protecting Your People, Reputation and Bottom Line
Risk Assessment & Measures of Effectiveness (Continued)
2%
3%
45%
59%
62%
68%
71%
73%
60%
Other
None
Measures of Org. Culture
Lessons From Peers
Lessons From Prior Misconduct
Compliance Program Audits
Risk Assessment Results
Regulatory Updates
Percent of respondents who use 3 or more information sources to review, test & improve their programs77%
47: Risk & Compliance Testing & Analysis
Figure 4.2 Information Sources for Testing, Review & ImprovementShown: Responses to “Which of the following information sources does your organization use to review, test and improve your risk and compliance program?”

THE 2021 DEFINITIVE RISK & COMPLIANCE BENCHMARK REPORT KEY FINDINGS
28NAVEX Global | Protecting Your People, Reputation and Bottom Line
Programs Use Multiple Sources to Test, Analyze & Audit FunctionsRisk and compliance programs operate in a constant cycle that begins with risk assessment and ends with review of the program to uncover improvement opportunities, then the cycle repeats. Tools that can be used to help improve an R&C program include: changing or updated regulations, risk and program assessment results, program audit results, lessons learned and measures of the compliance culture.
Overall, programs scored well in this area, with over 77% of respondents using 3 or more of these information sources to review, test and improve their programs. Unsurprisingly, the most used is regulatory changes and updates, while evaluation
of the culture of compliance remarkably was at the bottom of the list (Figure 4.2). Though a healthy culture of compliance is the ultimate indicator of R&C program effectiveness, it is intangible and requires measurement and triangulation of many cultural factors such as employee fear of retaliation and prevalence of management’s good example. By contrast, changes in the laws and audit results are tangible with straightforward improvement opportunities. The state of the culture of compliance may be the best tool to uncover program opportunities, but it is simply more difficult to quantify and to develop tangible R&C program improvements based on intangible opinions instead of tangible facts.
Figure 4.3 Risk & Compliance Program AuditsShown: Responses to “Which of the following are part of your compliance program audits?”
58%
58%
59%
61%
67%
73%
81%
70%
Employee Feedback
Program Data
Gap Analysis
Testing of Controls
Incident Reports
Internal InvestigationReports
Policy / Practice Review
Percent of respondents who use 3 or more information sources to conduct program audits59%
49: Risk & Compliance Program Audits
Risk Assessment & Measures of Effectiveness (Continued)

THE 2021 DEFINITIVE RISK & COMPLIANCE BENCHMARK REPORT KEY FINDINGS
29NAVEX Global | Protecting Your People, Reputation and Bottom Line
Figure 4.4 Data Access and UseShown: Percent of programs utilizing data for the following functions. Responses to “How would you rate your access to data across business functions?”
34%
27%
35%
40%
47%
Track Policy Access
Measure TrainingEffectiveness / Impact
Conduct Ongoing3P Monitoring
Ensure Incident ReportingResponsiveness
Assess ReportingEffectiveness
Respondents gave their access to data across business functions an average rating of 3.5 out of 5
OUT OF 53.5
46 / 50. Data Access and Use
Risk Assessment & Measures of Effectiveness (Continued)
More than 2 of 3 (68%) respondents use data from periodic compliance program assessments to expose gaps in risk controls and reveal ways to enhance their R&C programs. The most common sources of data are reviews of policies, procedures and practices and internal investigation reports (Figure 4.3). In addition, roughly two-thirds use hotline incident reports (67%) and testing of risk controls (61%). Used less often were employee interviews and feedback – again a less tangible measure, but indispensable for understanding the state of the compliance culture.
Data Utilization Lags Behind CollectionGenerally, respondents were pleased with their access to data across business functions, giving it an average rating of 3.5 out of 5. However, programs
were less satisfied with their efforts to effectively capitalize on that data (Figure 4.4). Fewer than half (47%) of respondents rated their ability to use incident management information to accurately assess reporting effectiveness as “good” or “very good.” Barely a quarter (27%) of respondents gave a similar rating to their use of metrics gained from their compliance training programs to measure training effectiveness and impact. Across a variety of R&C functions – including incident management, third-party risk management, policy and procedure management, and ethics and compliance training – respondents generally reserved their lowest scores for their ability to effectively leverage the data they acquired.

THE 2021 DEFINITIVE RISK & COMPLIANCE BENCHMARK REPORT KEY FINDINGS
30NAVEX Global | Protecting Your People, Reputation and Bottom Line
5. Resources & Empowerment
Fewer than Half of Programs Are Well-ResourcedOne key, tangible and impactful measure of support is funding. This year, we asked respondents to rate the level of funding they receive. The results were disappointing, if unsurprising. Less than half (44%) rated their program funding as sufficient or very sufficient, indicating that about half of compliance functions suffer from less sufficient financial support (Figure 5.1). Of course, Mature and Advanced programs were more likely to say they had sufficient or very sufficient funding and data access. The survey also revealed dissatisfaction with the level of staffing. Overall, 41% of respondents said their R&C programs had sufficient or very sufficient staffing.
It is no surprise that satisfaction with funding and staffing levels increases with program maturity and organization revenue. Also, independent compliance functions reporting directly to the CEO and board are more likely to report having sufficient resources. Conversely, organizations headquartered in the APAC region apparently use different criteria for funding their R&C functions. This region’s rating of staffing and funding was the lowest of any demographic (29% and 25% respectively).
Risk & Compliance Staff Are Qualified & Well-TrainedWhile a majority of programs report being under-staffed, it is positive to note that the satisfaction with the staff they do have is quite high. More than 2 of 3 respondents (69%) agreed that their R&C team members had appropriate experience and qualifications for their positions (Figure 5.2). Meanwhile, 58% said their personnel received periodic training and development opportunities. A majority held no other non-compliance duties, with small organizations significantly more likely than their peers to split their compliance staff’s duties. Only a fraction of respondents (5%) complained of a high turnover rate.
The same factors that direct money to R&C drive this number higher – more organization revenue; independent function; higher sufficiency of program funding, staffing and program maturity. Again, APAC rated this personnel criterion the lowest of all demographics; just 56% said they have qualified/ experienced staff.

THE 2021 DEFINITIVE RISK & COMPLIANCE BENCHMARK REPORT KEY FINDINGS
31NAVEX Global | Protecting Your People, Reputation and Bottom Line
Resources & Empowerment (Continued)
70%
17%33% 27%15%8%
15%32% 26%17%10%
Very GoodGoodFairPoorVery Poor
Staffing
Funding
Respondents gave their access to resources an average rating of 3.3 out of 5
OUT OF 53.3
39: Access to Resources
5%
4%
47%
58%
69%
Comparatively HighTurnover Rate
None of the Above
Non-ComplianceResponsibilities
Periodic Training /Development
Appropriate Experience& Qualifications
40. Risk & Compliance Staff Attributes
Figure 5.1 Access to ResourcesShown: Responses to “How would you rate your program’s access to the following?”
Figure 5.2 Risk & Compliance Staff AttributesShown: Responses to “Do your risk and compliance personnel have/receive the following?”

THE 2021 DEFINITIVE RISK & COMPLIANCE BENCHMARK REPORT KEY FINDINGS
32NAVEX Global | Protecting Your People, Reputation and Bottom Line
Resources & Empowerment (Continued)
Leadership’s Commitment to Compliance Weakened by Competing PrioritiesIn our past definitive benchmark surveys, we have queried organizations about the buy-in, oversight and commitment of their senior leadership to compliance. This year, we attempted to delve deeper by asking a series of questions to help us better assess the depth and nature of that support. This included questions about whether they demonstrated a commitment to compliance through their actions as well as their words, and how strongly they held to their convictions in the face of competing priorities. We also asked about middle managers’ commitment to compliance, including whether they took actions that overtly or implicitly frustrated compliance objectives.
Initially, the results appear to reinforce the confidence respondents have traditionally had in their leadership support. Over three-quarters said that senior leaders have encouraged compliance within their organizations (Figure 5.3). Conversely, only a small number of respondents said their managers had encouraged unethical behavior or actively impeded compliance.
However, while most leaders may be willing to talk up compliance, significantly fewer appear willing to “walk the walk.” Just over half of respondents said their senior leadership actually models proper behavior. And while managers generally don’t actively frustrate compliance efforts, one in four (27%) are willing to tolerate greater compliance risks if it could mean higher revenues. Perhaps most telling is the difference between leaders’ willingness to demonstrate a commitment to compliance versus their persistence in the face of competing factors. Both senior leaders and managers were significantly less likely to maintain their commitment when faced with conflicting objectives (Figure 5.4).
Risk & Compliance Programs Enjoy Good Board AccessThe governing board has ultimate responsibility to oversee the performance and effectiveness of its organization’s R&C function. Programs have traditionally fared well in this regard, with 83% of respondents saying they met regularly with their board in 2020. This year, respondents continued to give comparatively high marks to their board’s availability, rating their access to the board at an average of 3.7 out of 5.
However, access is just one dimension of board engagement. This year we examined the board’s level of oversight, expertise and familiarity with reporting data. Overall, the results were encouraging. Three of 5 (60%) said their boards used compliance data in the oversight process (Figure 5.5). Almost half (47%) claim there was compliance expertise on the board and the same number (46%) said the board held executive sessions with compliance. Additionally, more than half of respondents (54%) say their organizations engages periodically with the board on risk and compliance matters and the board has oversight.
Larger organizations, more Mature programs, and those with an independent compliance function reporting to the CEO and board understandably do an even better job in these areas. The highly-regulated and data-driven healthcare (69%), manufacturing (65%) and finance (69%) industries also significantly exceed programs overall for boards that use compliance data in their oversight.

THE 2021 DEFINITIVE RISK & COMPLIANCE BENCHMARK REPORT KEY FINDINGS
33NAVEX Global | Protecting Your People, Reputation and Bottom Line
Resources & Empowerment (Continued)
12%
11%
27%
56%
77%
Encouraged Unethical Behaviorto Achieve Objectives
Impeded Compliance FromImplementing Duties
Tolerated Risk to PursueNew Business / Greater Revenue
OUR MANAGEMENT HAS
Models Proper Behavior
Encourages Compliance
OUR SENIOR LEADERSHIP
43: Senior Leadership & Manager Characteristics
75%
71%
38%
46%
Demonstrates Commitmentto Compliance
Persists in That Commitment
Management Senior Leadership
44: Leadership Commitment: Demonstration vs. Persistence
Figure 5.3 Senior Leadership & Manager CharacteristicsShown: Responses to “Which of the following statements are true of your senior leadership? Which of the following statements are true of your manager?”
Figure 5.4 Leadership Commitment: Demonstration vs. PersistenceShown: Responses to “Which of the following statements are true of your senior leadership? Which of the following statements are true of your manager?”
THE 2021 DEFINITIVE RISK & COMPLIANCE BENCHMARK REPORT KEY FINDINGS
34NAVEX Global | Protecting Your People, Reputation and Bottom Line
Resources & Empowerment (Continued)
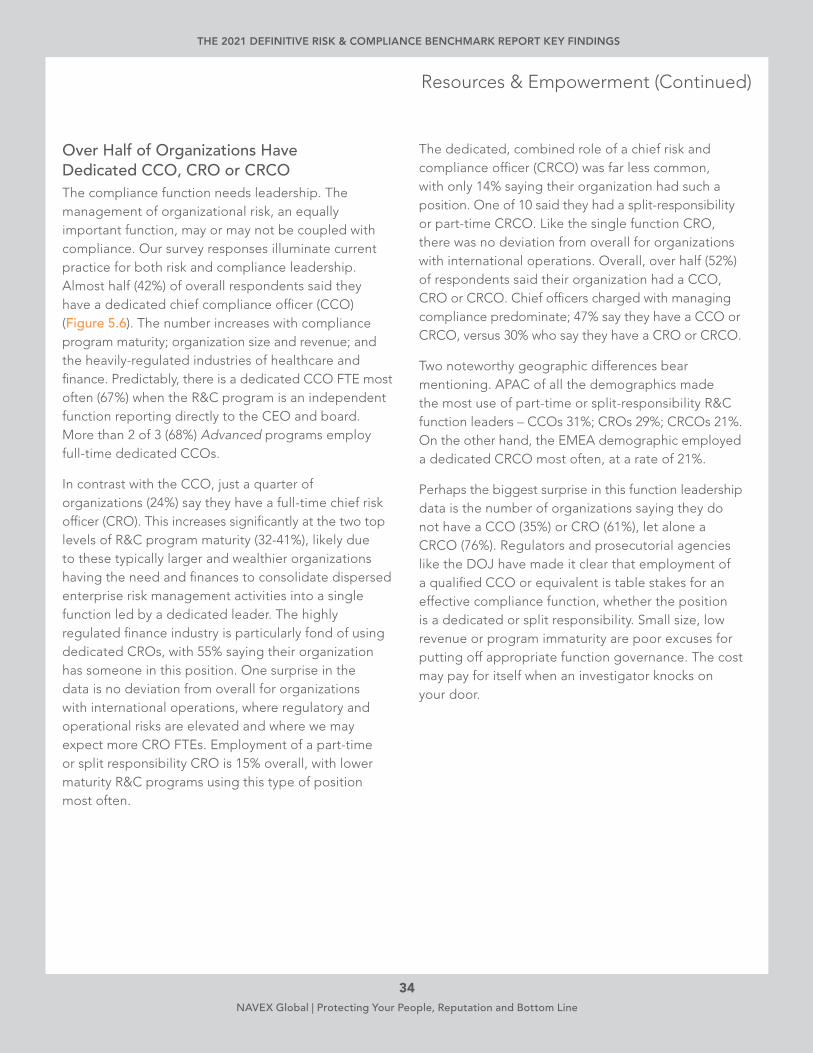
Over Half of Organizations Have Dedicated CCO, CRO or CRCOThe compliance function needs leadership. The management of organizational risk, an equally important function, may or may not be coupled with compliance. Our survey responses illuminate current practice for both risk and compliance leadership. Almost half (42%) of overall respondents said they have a dedicated chief compliance officer (CCO) (Figure 5.6). The number increases with compliance program maturity; organization size and revenue; and the heavily-regulated industries of healthcare and finance. Predictably, there is a dedicated CCO FTE most often (67%) when the R&C program is an independent function reporting directly to the CEO and board. More than 2 of 3 (68%) Advanced programs employ full-time dedicated CCOs.
In contrast with the CCO, just a quarter of organizations (24%) say they have a full-time chief risk officer (CRO). This increases significantly at the two top levels of R&C program maturity (32-41%), likely due to these typically larger and wealthier organizations having the need and finances to consolidate dispersed enterprise risk management activities into a single function led by a dedicated leader. The highly regulated finance industry is particularly fond of using dedicated CROs, with 55% saying their organization has someone in this position. One surprise in the data is no deviation from overall for organizations with international operations, where regulatory and operational risks are elevated and where we may expect more CRO FTEs. Employment of a part-time or split responsibility CRO is 15% overall, with lower maturity R&C programs using this type of position most often.
The dedicated, combined role of a chief risk and compliance officer (CRCO) was far less common, with only 14% saying their organization had such a position. One of 10 said they had a split-responsibility or part-time CRCO. Like the single function CRO, there was no deviation from overall for organizations with international operations. Overall, over half (52%) of respondents said their organization had a CCO, CRO or CRCO. Chief officers charged with managing compliance predominate; 47% say they have a CCO or CRCO, versus 30% who say they have a CRO or CRCO.
Two noteworthy geographic differences bear mentioning. APAC of all the demographics made the most use of part-time or split-responsibility R&C function leaders – CCOs 31%; CROs 29%; CRCOs 21%. On the other hand, the EMEA demographic employed a dedicated CRCO most often, at a rate of 21%.
Perhaps the biggest surprise in this function leadership data is the number of organizations saying they do not have a CCO (35%) or CRO (61%), let alone a CRCO (76%). Regulators and prosecutorial agencies like the DOJ have made it clear that employment of a qualified CCO or equivalent is table stakes for an effective compliance function, whether the position is a dedicated or split responsibility. Small size, low revenue or program immaturity are poor excuses for putting off appropriate function governance. The cost may pay for itself when an investigator knocks on your door.

THE 2021 DEFINITIVE RISK & COMPLIANCE BENCHMARK REPORT KEY FINDINGS
35NAVEX Global | Protecting Your People, Reputation and Bottom Line
Resources & Empowerment (Continued)
47%
46%
54%
60%
Has Members WithCompliance Expertise
Holds Execuive / PrivateSessions With Compliance
Has Oversight of Compliance
Examines Reporting Data
Respondents gave their access to their board of directors an average rating of 3.7 out of 5
OUT OF 53.7
45: Board Access and Attributes
14%10%76%
23%35%
24%
42%
15%61%Chief Risk Officer
Chief Compliance Officer
Chief Risk & Compliance Officer
Part-Tme Dedicated / Full-TimeDo Not Have
41/54. Prevalence and Role of Chief Compliance Officers / Chief Risk & Compliance Officers
Figure 5.5 Board Access & AttributesShown: Responses to “Which of the following is true of your board of directors? How would you rate your program’s direct access to the board of directors?”
Figure 5.6 Prevalence and Role of Chief Compliance Officers / Chief Risk & Compliance Officers Shown: Responses to “Does your organization have a Chief Compliance Officer and/or a Chief Risk & Compliance Officer? Are they full-time or part-time role?

THE 2021 DEFINITIVE RISK & COMPLIANCE BENCHMARK REPORT KEY FINDINGS
36NAVEX Global | Protecting Your People, Reputation and Bottom Line
Resources & Empowerment (Continued)
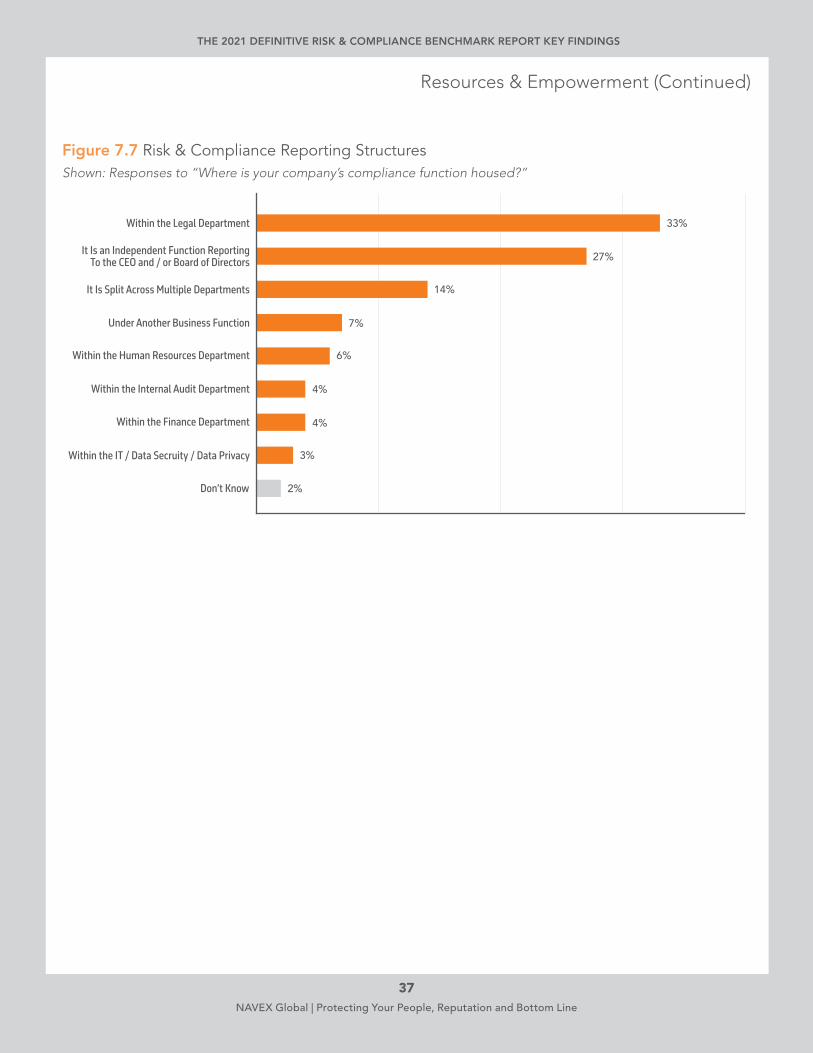
Compliance Independence Correlates With Better PerformanceThe question of where the compliance function should be housed is somewhat controversial. Our survey results reflect the currently increasing cross-industry trend. One of 3 compliance programs (33%) are located within and report through the legal department (Figure 5.7). This poses a conundrum. In 2003, a U.S. Medicare fraud scandal at a large healthcare company raised conflict of interest allegations related to the top legal officer’s dual roles of General Counsel and Chief Compliance Officer because she had a duty to “ensure both that the company was following federal guidelines and that it also was protected from charges of wrong-doing.”11
Curiously, Advanced maturity programs report through legal at the highest rate – almost half (46%). The reason for the current trend toward this reporting structure may be rooted in a need for a more efficient administrative solution than afforded by reporting to the CEO or the board. But efficiency should not trump independence.
Even if the roles are separate, with the CCO reporting to the GC, the potential for conflict of interest remains. The best alternative arrangement is an independent compliance function reporting to the CEO and/or board of directors. The survey revealed slightly more than 1 of 4 programs (27%) are set up as an independent entity, with 1 of 3 Mature and Advanced programs adopting this structure.
In addition, having an independent compliance function is correlated to a host of positive outcomes. R&C programs whose leadership report directly to the CEO or board are 25% more likely than programs overall to enjoy leadership support. They are also 39% more likely to have sufficient access to resources.
There appears to be a theme here. Independent CCOs that report directly to the CEO are able to secure higher budgets for their programs. The cash infusion enables programs to grow and mature, which in turn results in greater performance outcomes.
11 “Chief Counsel, Compliance Officer at Tenet Healthcare Resigns.” California Healthline Daily Edition, September 23, 2003.
THE 2021 DEFINITIVE RISK & COMPLIANCE BENCHMARK REPORT KEY FINDINGS
37NAVEX Global | Protecting Your People, Reputation and Bottom Line
Resources & Empowerment (Continued)
3%
2%
4%
4%
6%
7%
14%
27%
33%
Within the IT / Data Secruity / Data Privacy
Don’t Know
Within the Finance Department
Within the Internal Audit Department
Within the Human Resources Department
Under Another Business Function
It Is Split Across Multiple Departments
It Is an Independent Function ReportingTo the CEO and / or Board of Directors
Within the Legal Department
42: Risk & Compliance Program Reporting Structures
Figure 7.7 Risk & Compliance Reporting StructuresShown: Responses to “Where is your company’s compliance function housed?”

THE 2021 DEFINITIVE RISK & COMPLIANCE BENCHMARK REPORT KEY FINDINGS
38NAVEX Global | Protecting Your People, Reputation and Bottom Line
6. Program Elements
9%
27% 22%8%
22%63% 6%
43%
31%8%37% 24%
21%8%27% 44%
37%14%20% 30%
Third-Party RiskManagement
ESG Reporting
Policy & ProcedureManagement
Ethics & ComplianceTraining
Incident Management
Yes, an Office Productivity / ERP Solution
Yes, a Paper-Based Solution
No, We Do NotHave This
Yes, a Purpose-Built Solution
62: Program Elements and Automation
Figure 6.1 Program Elements & AutomationShown: Responses to “How do you administer the following elements?”
Incident Management Is the Most Advanced Component of R&C ProgramsOrganizations with a well-designed compliance program should have robust reporting and investigation processes. Three of four (73%) programs surveyed have a solution to capture and investigate reports, making it one of the most widely adopted compliance functions. A plurality (44%) use purpose-built software, making this program element the most supported by purpose-specific technology (Figure 6.1).
When respondents who have a reporting and investigation process rate the performance of these systems, more than half described the awareness, operation and data collection of their solution as good or excellent (Figure 6.2). The lowest-ranked aspects of reporting and investigation systems all address retrospective analysis of the collected data – patterns of misconduct (51% good/excellent), reporting process effectiveness (47%) and responsiveness metrics (40%). These are considered part of a minimally effective E&C program for organizations of all sizes, revenues, industries and geographies.
Incident Management

THE 2021 DEFINITIVE RISK & COMPLIANCE BENCHMARK REPORT KEY FINDINGS
39NAVEX Global | Protecting Your People, Reputation and Bottom Line
Program Elements (Continued)
47%
40%
51%
55%
58%
61%
64%
70%
74%
Assessing ReportingEffectiveness
Using Metrics toEnsure Responsiveness
Identifying Patternsof Misconduct
Generating Awareness
Tracking & UsingReporting Data
Monitoring InvestigationOutcomes
Properly ScopingInvestigations
Conducting IndependentInvestigations
Assessing the Seriousnessof Allegations
Respondents gave their incident management function an average rating of 3.6 out of 5
OUT OF 53.6
26: Incident Management Performance Rating
Figure 6.2 Incident Management Performance RatingShown: Percent of respondents who rated their program’s incident management performance as “good” to “great” in the following areas
12 Bayt, Katie, and James Plunkett. “EEOC Roundup, Part I: 10 Things to Know About the 2020 Charges and Litigation Statistics.” Ogletree Deakins, March 5, 2021.
Of all the facets handled by an incident management system, case closure time may be the most challenging, even for excellent E&C programs. The two primary factors that extend the time taken to investigate and close a report are resource constraints and case complexity (Figure 6.3). Over the past three years, the lack of resources has trended steadily downward from 42% to 38%, while complex cases trended upward from 33% to 37%. Perhaps resource constraints are becoming less of an issue due to better funding; however, more may need to be invested in resources to properly handle increasingly complex cases in a timely manner.
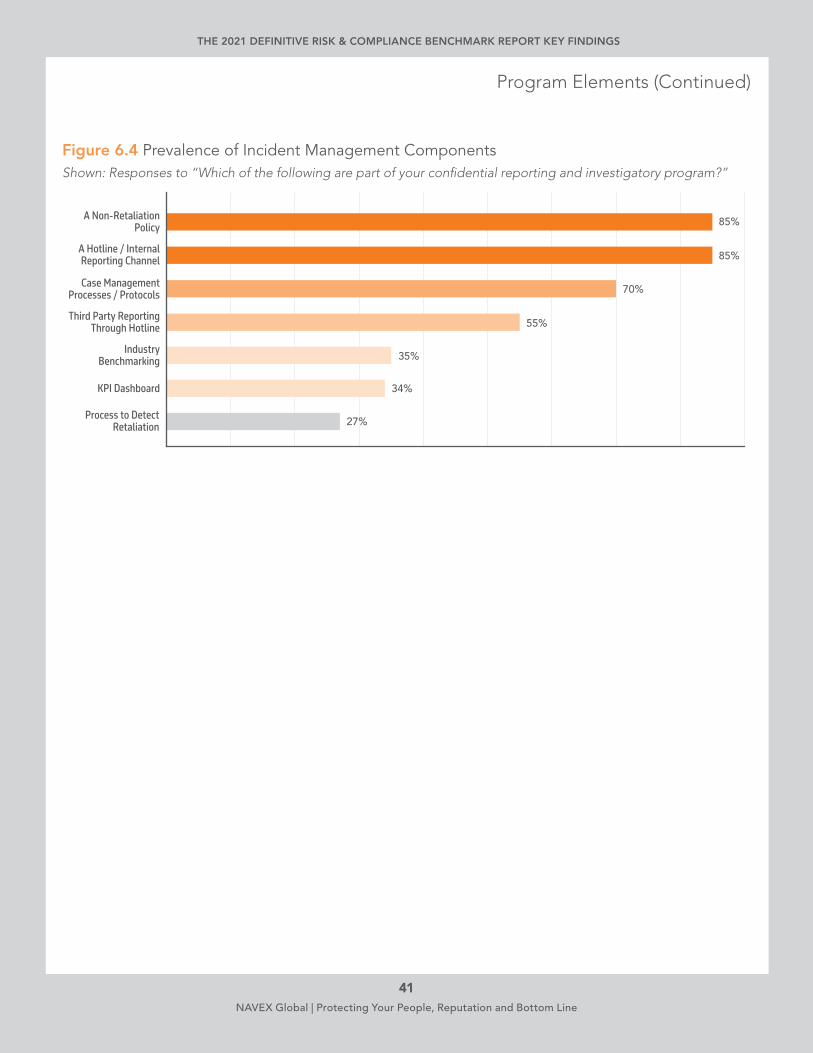
A key focus of an incident management process is prevention and detection of retaliation. Our survey revealed overall 85% of R&C programs have a non-retaliation policy; however, just 27% have a process to detect retribution (Figure 6.4). More work needs to be done to implement a detection process, though it continues to be a mid- to low priority for most organizations. Retaliation was the top claim made to the EEOC in 2020 with 55.8% of charges filed.12 If you think retaliation is not happening in your organization, you need a process in place to detect it. Retaliation happens everywhere and better to have the report come to you than to a government agency.

THE 2021 DEFINITIVE RISK & COMPLIANCE BENCHMARK REPORT KEY FINDINGS
40NAVEX Global | Protecting Your People, Reputation and Bottom Line
Figure 6.3 Factors Impacting Case Closure TimesShown: Responses to “What has the biggest impact on the time it takes to investigate and close a report in your organization?”
Program Elements (Continued)
4%3%
6%
6%
6%
5%
4%6%
7%
9%12%
11%
33%
32%37%
39%41%
42%
Legal Team Involvement
Other
Case Ownership Issues
Process Inefficiencies
Case Complexity
Resource Constraints
20202019 2021
28: Factors Impacting Case Closure Times
THE 2021 DEFINITIVE RISK & COMPLIANCE BENCHMARK REPORT KEY FINDINGS
41NAVEX Global | Protecting Your People, Reputation and Bottom Line
Figure 6.4 Prevalence of Incident Management ComponentsShown: Responses to “Which of the following are part of your confidential reporting and investigatory program?”
Program Elements (Continued)
34%
27%
35%
55%
70%
85%
85%
KPI Dashboard
Process to DetectRetaliation
IndustryBenchmarking
Third Party ReportingThrough Hotline
Case ManagementProcesses / Protocols
A Hotline / InternalReporting Channel
A Non-RetaliationPolicy
27: Prevalence of Incident Management Components

THE 2021 DEFINITIVE RISK & COMPLIANCE BENCHMARK REPORT KEY FINDINGS
42NAVEX Global | Protecting Your People, Reputation and Bottom Line
Program Elements (Continued)
Policy & Procedure Management Secure in Development, but Lacks Tracking CapabilitiesThis year, organizations rated their policy and procedure management systems higher than other program elements. Two out of 3 programs (64%) have a solution to develop, distribute and attest to policies and procedures, which is up from 57% last year. Overall, a quarter (24%) utilize purpose- built software to administer their policy and procedure management.
Two-thirds (64%) of organizations with policy and procedure management functions in place are confident in their ability to do a good or excellent job developing policies that reflect their legal and regulatory risks (Figure 6.5), though it remains a top challenge for more than half (53%) (Figure 6.6). The biggest challenge for 3 of 5 (58%) programs, however, is employee communication/training on the policies. Unsurprisingly, those with insufficient funding in several program areas struggle the most.
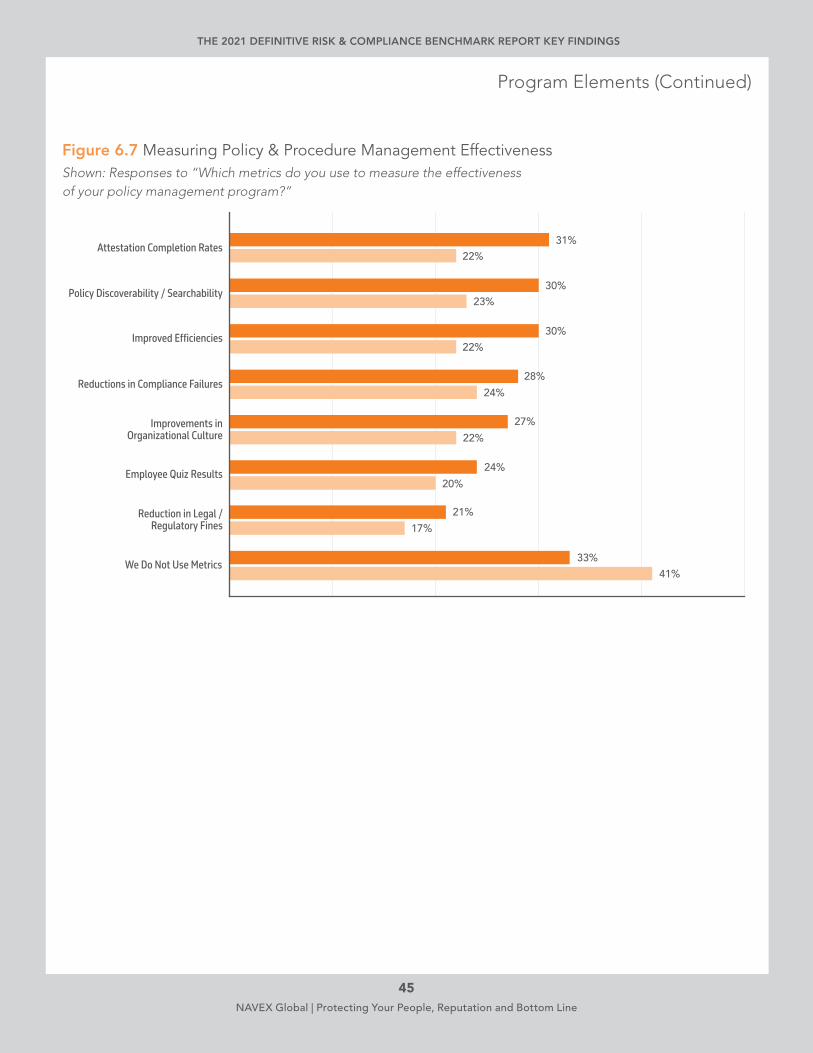
Perhaps most concerning are two findings. First, just 1 of 3 (34%) organizations say they are good or very good at tracking access to policies. Even Advanced programs struggle here, with just over half (57%) monitoring access. Second, a third (33%)
of organizations said they use no metrics to measure the effectiveness of their policy and procedure management process (Figure 6.7). This is less than last year (41%) but it is still problematic. Proper program assessment includes reviewing the effectiveness of the policy and procedure management solution; therefore, organizations are well advised to start measuring whether this element is in fact effective.
The minimum elements of an effective policy system – development, distribution, attestation, accessibility, training, access tracking – can be managed best with the features in purpose-built software. Our survey indicates an upward trend in adoption of this tool with 38% of respondents stating they use such a solution to automate their policy and procedure management. This overall number is up from 34% last year and 25% in 2019.
However, providing easy access to policies is a challenge for 1 out of 3 (34%) programs, up from 1 in 4 (28%) last year. The manufacturing industry is challenged most with over half (51%) struggling to provide easy access, most likely because many workers are production-based and cannot easily access computers.
Policy & Procedure Management

THE 2021 DEFINITIVE RISK & COMPLIANCE BENCHMARK REPORT KEY FINDINGS
43NAVEX Global | Protecting Your People, Reputation and Bottom Line
Program Elements (Continued)
42%
34%
48%
49%
50%
53%
64%
60%
Addressing Barriers toEmployee P&P Access
Tracking Access to P&P
Providing Guidanceto Key Gatekeepers
Consulting With BusinessUnits on P&P Design
Communicating P&P toEmployees & Third Parties
Publishing P&P in EasilySearchable Formats
Developing P&P for Legal& Regulatory Risks
Respondents gave their policy & procedure management function an average rating of 3.3 out of 5
OUT OF 53.3
30: Policy & Procedure Management Performance Rating
Figure 6.5 Policy & Procedure Management Performance RatingShown: Percent of respondents who rated their program’s policy & procedure management performance as “good” to “great” in the following areas

THE 2021 DEFINITIVE RISK & COMPLIANCE BENCHMARK REPORT KEY FINDINGS
44NAVEX Global | Protecting Your People, Reputation and Bottom Line
Program Elements (Continued)
Figure 6.6 Top Policy & Procedure Management ChallengesShown: Responses to “What are your top policy management challenges?”
17%24%
16%
29%
16%14%
30%
25%28%
34%
26%
25%36%
36%24%
24%
58%47%
48%
53%37%
39%
Adapting Policies &Procedures toRemote Work
Managing Records
Connecting Policies toIncident Management
Providing EasyAccess to Policies
Managing Version Control
Creating & DocumentingDocuments Easily
Aligning Policies WithChanging Regulations
Training Employeeson Policies
20202019 2021
32. Top Policy & Procedure Management Challenges
THE 2021 DEFINITIVE RISK & COMPLIANCE BENCHMARK REPORT KEY FINDINGS
45NAVEX Global | Protecting Your People, Reputation and Bottom Line
Figure 6.7 Measuring Policy & Procedure Management EffectivenessShown: Responses to “Which metrics do you use to measure the effectiveness of your policy management program?”
Program Elements (Continued)
31%22%
22%
24%
30%
30%
28%
22%
27%
20%
24%
17%
21%
41%
33%
23%
Reduction in Legal /Regulatory Fines
We Do Not Use Metrics
Employee Quiz Results
Improvements inOrganizational Culture
Reductions in Compliance Failures
Improved Efficiencies
Policy Discoverability / Searchability
Attestation Completion Rates
2020 2021
31: Measuring Policy & Procedure Management Effectiveness

THE 2021 DEFINITIVE RISK & COMPLIANCE BENCHMARK REPORT KEY FINDINGS
46NAVEX Global | Protecting Your People, Reputation and Bottom Line
Program Elements (Continued)
Third-Party Risk Management Effective at Enhanced Due Diligence, but Struggles With Resource Allocation & Ongoing MonitoringA third-party management solution is a must for any R&C program seeking to meet increasingly broad regulatory standards. Our survey revealed 57% of R&C programs are using such a mechanism, a significant increase over the 44% and 46% of last two years. Purpose-built software is often used to administer third-party management processes. While automation is low in comparison to the other elements surveyed, it is an increase over prior years – a good sign that organizations understand the scope and commitment involved in doing this work and the value of technology in making the tasks more efficient.
Regarding performance, the overall top two tasks in a third-party solution rated good or very good by R&C programs were ensuring appropriate contract terms (53%) and performing enhanced due diligence based on defined risk levels (48%) (Figure 6.8). Advanced programs and well-resourced programs unsurprisingly rated performance of these tasks at the highest levels more frequently. By contrast, just 1 out of 4 organizations headquartered in APAC rated their performance high on these tasks.
The two duties rated as fair or poor mostly commonly were ongoing monitoring of relationships (39%) and requiring third-party training and certifications (43%). R&C programs that were under-resourced rated performance of these two tasks at the low end more often. Apparently, sufficient resources make a big difference in boosting performance of third-party management systems.
When it comes to applying a risk-based approach to third-party risk management solutions, the data from R&C programs show little change in their approaches from last year (Figure 6.9). One-quarter tailor risk management to the business partner’s unique risks at onboarding (27%); another quarter (25%) stratify risk first and apply different levels of risk management throughout the term of engagement based on risk ranking. One of five (22%) manage only high-risk business partners, with organizations headquartered outside North America using this approach more often. Those who do nothing have decreased slightly from the prior year to 10%.
Performance is one measure of effectiveness, but the ultimate measurement is whether a third-party management system significantly reduces an organization’s legal, financial and reputational risks. Most respondents to our survey (61%) agreed, both strongly and somewhat, that such a system does indeed have a positive impact on these risks (Figure 6.10). Agreement increased with R&C program maturity, which is understandable due to the higher amount of funding and resources enjoyed by more Mature programs; they simply can do more to manage business partner risk. However, the regulators do not exempt less Mature programs from managing their third parties in a way that is commensurate with the size and scope of their business. This area of risk is becoming such a big regulatory focus that all R&C programs should consider devoting appropriate resources to its management.
Third-Party Risk Management

THE 2021 DEFINITIVE RISK & COMPLIANCE BENCHMARK REPORT KEY FINDINGS
47NAVEX Global | Protecting Your People, Reputation and Bottom Line
Program Elements (Continued)
35%
32%
37%
41%
43%
46%
48%
53% 60%
Ongoing Monitoringof Third Parties
Requiring Third-Party Training
Risk-Based Resource Allocation
Collecting Third-Party Records
Establishing RelationshipRationales
Tracking & Addressing Red Flags
Risk-Based EnhancedDue Diligence
Setting Specific &Accurate Contract Terms
3.1 Respondents gave their third-party risk management function an average rating of 3.1 out of 5
OUT OF 5
33: Third-Party Risk Management Performance Rating
Figure 6.8 Third-Party Risk Management Performance RatingShown: Percent of respondents who rated their program’s third-party risk management performance as “good” to “great” in the following areas

THE 2021 DEFINITIVE RISK & COMPLIANCE BENCHMARK REPORT KEY FINDINGS
48NAVEX Global | Protecting Your People, Reputation and Bottom Line
Program Elements (Continued)
Figure 6.9 Application of Third-Party Risk ManagementShown: Responses to “How do you apply risk-based management?”
26%
25%
26%
27%
23%
22%
13%
16%
12%
10%
To High-Risk Parties Only
We Do Nothing Currently
To All Parties Regardlessof Risk Level
To All Parties Based on Risk Level(Determined at Onboarding)
To All Parties Based on Risk Level(Continuously Assessed)
20212020
34. Application of Third-Party Risk Management

THE 2021 DEFINITIVE RISK & COMPLIANCE BENCHMARK REPORT KEY FINDINGS
49NAVEX Global | Protecting Your People, Reputation and Bottom Line
Figure 6.10 Assessment of Third-Party Risk ManagementShown: Responses to “Rate your agreement with the following statement: Our third-party due diligence program significantly reduces our legal, financial and reputational risks.”
Program Elements (Continued)
17%
24%
37%
37%
24%22%
13%13%
8%
4%
Disagree
Strongly Disagree
Neutral
Agree
Strongly Agree
2020 2021
35. Assessment of Third-Party Risk Management

THE 2021 DEFINITIVE RISK & COMPLIANCE BENCHMARK REPORT KEY FINDINGS
50NAVEX Global | Protecting Your People, Reputation and Bottom Line
Program Elements (Continued)
E&C Training in Harassment & Discrimination Prevention, Data Privacy & Cybersecurity Predominate; Diversity & Inclusion LaggingThe use of training plans to lay out the topics, audiences, formats, lengths of time, responsible parties, launch dates and effectiveness measures for all compliance training courses and communications is an essential part of any R&C program. The use of these plans has been steadily on the rise and the 2021 survey data indicates 80% of R&C programs are now using an E&C training plan. Moreover, 30% said they were using purpose-built software to administer these plans, making it one of the most automated elements surveyed.
In rating the performance of their R&C training programs, organizations struggle most with measuring training effectiveness and the impact of training on employee behavior. Three out of 4 rate these areas as average to poor (Figure 6.11). Another concern is how programs deal with employees who fail testing. Our survey revealed two-thirds of programs rate this area average to poor. It appears that many R&C programs need to focus more attention on these areas, which applies to organizations of all industries, sizes and geographies. Anecdotal information suggests government surveyors and investigators are taking the latest DOJ guidance to heart. They are asking for evidence of further remediation, other than re-training, for employees who fail testing, especially multiple times. It is time to address this gap in your program if it exists.
The most popular training topics in 2021 mirror the top organizational risks: ethics and code of conduct, which includes many risk areas (81%); harassment and
discrimination (78%); data privacy and cybersecurity (66%); and conflicts of interest (65%) (Figure 6.12). Ethics/code were not included in last year’s survey; however, the other three top courses in 2021 were in the same prime position in 2020. This year, there was a noteworthy 10% jump in number of organizations that are planning to train on harassment, discrimination and retaliation. This may be in response to new sexual harassment prevention training legislation such as California’s SB 778, which went into effect in January of this year.13
While new legislative and regulatory changes may have impacted training topics, other recent events – such as the racial justice and social equity movements – appear less impactful. Little more than half (56%) of respondents said they plan to offer D&I training in the next 3 years – essentially the same percentage as 2020. Though initially surprising, this result may make more sense when placed in the context of our 2021 Incident Management Benchmark, which found a decline in discrimination reports as a percentage of total reporting over the past year, as well as a decrease in the relative percentage of “HR, Diversity & Workplace Respect” reports more broadly.14 These internal signals may have influenced training priorities more than external events. However, as we stressed in our earlier benchmark, a lack of reporting does not necessarily indicate the absence of a problem. Other factors – such as economic anxiety and widespread remote-work environments – may be suppressing reports or temporarily lowering incidents. Organizations would be well-advised to monitor this issue as economic and public health conditions improve.
Ethics & Compliance Training
13 TBJ Content Studio. “Where to Start When It Comes to Stopping Sexual Harassment in the Workplace” (Podcast), July 1 2021. 14 Penman, Carrie, and Andrew Burt. “2021 Risk & Compliance Incident Management Benchmark Report.” NAVEX Global, May 2021.

THE 2021 DEFINITIVE RISK & COMPLIANCE BENCHMARK REPORT KEY FINDINGS
51NAVEX Global | Protecting Your People, Reputation and Bottom Line
Program Elements (Continued)
27%
27%
34%
40%
42%
42%
43%
47%
53%
Measuring Effectiveness
Measuring Impact
Addressing Test Failure
Micro Learning
Employee Testing
Training for High-Risk Employees
Training for Supervisors
Process to Ask Questions
Multi-Format Training
3.1 Respondents gave their ethics & compliance training function an average rating of 3.1 out of 5
OUT OF 5
36: Ethics & Compliance Performance Rating
Figure 6.11 Ethics & Compliance Performance RatingShown: Percent of respondents who rated their program’s ethics & compliance training performance as “good” to “great” in the following areas
Seat time for training has not changed appreciably since the 2020 survey. Hours trained are important, as they are an indicator of an organization’s commitment to managing key areas of risk. So it is surprising that just 1 out of 4 managers and leaders continue to receive 4+ hours of R&C training each year and 1 out of 5 board members continue to receive no R&C training at all (Figure 6.13). This data suggests an ongoing
weakness in organizational commitment to managing top compliance risks. Board members and company leaders are typically not inherently aware of what they must know and do to shape the cultural tone that supports ethical conduct or even why it is important. They need sufficient training to create and sustain an ethical culture; it is the biggest mitigator of R&C risk.

THE 2021 DEFINITIVE RISK & COMPLIANCE BENCHMARK REPORT KEY FINDINGS
52NAVEX Global | Protecting Your People, Reputation and Bottom Line
Program Elements (Continued)
Figure 6.12 Top Ethics & Compliance Training TopicsShown: Responses to “On which of the following ethics and compliance topics will your organization provide training in the next 3 years?”
33%
25%
40%
41%
48%
52%
56%
60%
65%
67%
78%
81%
Third-Party Risk Management
Active Shooter
Environment, Health & Safety
Abusive Conduct & Bullying
Use of Social Media
Antibribery & Corruption
Diversity & Inclusion
Whistleblowing & Retaliation
Conflicts of Interest
Data Privacy / Cybersecurity
Harassment & Discrimination
Ethics & Code of Conduct
37. Top Ethics & Compliance Training Topics

THE 2021 DEFINITIVE RISK & COMPLIANCE BENCHMARK REPORT KEY FINDINGS
53NAVEX Global | Protecting Your People, Reputation and Bottom Line
Figure 6.13 Hours of Training by AudienceShown: Responses to “How many total hours do the following audiences receive in R&C training each year?”
Program Elements (Continued)
12% 30% 23% 32%
42% 24% 17% 8% 9%
4% 8% 27% 23% 38%
22% 19% 25% 13% 21%
Managers & Leadership
Board of Directors
Non-Managers
Third Parties
<1 1 to <2 2 to <3 3+None
38. Hours of Training by Audience
THE 2021 DEFINITIVE RISK & COMPLIANCE BENCHMARK REPORT KEY FINDINGS
54NAVEX Global | Protecting Your People, Reputation and Bottom Line
Program Elements (Continued)
ESG Sophistication & Support Varies by Region & IndustryEnvironmental, Social, and Governance (ESG) data has become a key topic during board room discussions, elevating Corporate Social Responsibility (CSR) and Sustainability to a business strategy with quantifiable objectives. It represents a variety of traditional corporate compliance areas in addition to those of business operations and corporate responsibility.
ESG awareness and reporting has vastly increased over the past decade, resulting in growing pressure on organizations to adopt ESG initiatives from all quarters. According to the latest Edelman Trust Barometer Special Report, consumers are 70% more likely to be attracted to brands that focus on making the world a better place than those that focus on making them a better person. They are also more willing to act on this preference; nearly 2 out of 3 consumers said they believed they could get a brand to change almost anything about themselves through their buying decisions.15 This is not lost on investors, who are applying a premium valuation to companies with strong ESG initiatives.16
In February of 2021, NAVEX Global conducted a survey of managers and senior executives on ESG practices across the U.S., U.K., France and Germany. The results found while over 4 out of 5 (81%) of companies surveyed had a formal ESG program in place, there was not a high level of confidence that companies were effectively performing against all their stated ESG metrics. That said, spending on ESG initiatives was on the rise, with 63% of companies
planning to increase spending on ESG in 2021. The report also found the United States lagging behind its European counterparts with respect to its ESG program maturity.17
The current results differ in some significant respects. Nearly two thirds (63%) of respondents to our benchmark survey said they did not include ESG reporting as part of their risk and compliance program, which we attribute to ESG principles being a proactive approach to how a company does business, not a traditional risk mitigation activity. This may also be why ESG ranked last on the list of R&C priorities (Figure 3.1). However, 64% of respondents who described themselves as knowledgeable about their organization’s ESG program listed ESG as a priority. In other words, the more a respondent knew about ESG, the more likely they were to prioritize it.
As with the earlier survey, we did find that region played a notable role. Companies operating outside of North America were significantly more likely than their peers to have ESG reporting. Nearly half (48%) of organizations that operated internationally had ESG reporting, versus less than a quarter (23%) of their domestic-only counterparts. This is likely due to the European Commission’s early adoption of ESG and alignment to the United Nations Sustainable Development goals over a decade ago. European companies have been embedding sustainability into their organizations for years, and now the EU has actually regulated the reporting of ESG under SFDR and NFRD guidelines. The U.S. is lagging in these requirements.
ESG Reporting
15 “Trust: The New Brand Equity.” Edelman Trust Barometer Special Report. Edelman, June 2021. 16 “Institutional Investors (U.S. Results).” Edelman Trust Barometer Special Report. Edelman, November 2020. 17 “Measuring Environmental Social and Governance (ESG) Program Commitment in the US and Europe.” NAVEX Global, February 2021.

THE 2021 DEFINITIVE RISK & COMPLIANCE BENCHMARK REPORT KEY FINDINGS
55NAVEX Global | Protecting Your People, Reputation and Bottom Line
Program Elements (Continued)
18%
19%
18%
19%
32%
33%
47%
62%
70%
Can Integrate ESG &Financial Reporting
Utilizes an External Auditor
We Have None of These
Can Easily Generate Reports
Has a Dedicated Budget
Has Dedicated Personnel
Is Integrated WithinOur Organization
Enjoys CEO Support
59: ESG Resources
Figure 6.14 ESG ResourcesShown: Responses to “Which of the following is true for your ESG program?”
Amongst respondents who were knowledgeable of their organization’s ESG efforts, leadership support for ESG reporting was remarkably high, with nearly two-thirds (62%) of respondents saying they enjoyed the support of their CEO (Figure 6.14). Integration with the organization was also high. Resourcing for ESG efforts, however, were significantly lower, with a distinct minority of respondents affirming they had dedicated staff (33%) budget (32%). CEO support, dedicated budgets, and integration (both within the organization and with financial reporting) were strongly associated with overall program maturity. Dedicated budgets were also (unsurprisingly) tied to company size and revenue, as well as the level of R&C program resourcing. Programs headquartered in the EMEA region were notably more sophisticated. They were significantly more likely to have a dedicated budget (54% of EMEA vs. 27% non-EMEA) and staff (54% vs. 28%). Consequently, they were also more easily able to generate sustainability reports (35% vs. 15%).
When it came to ESG concerns, employee wellness programs, community volunteer programs and diversity metrics tracking topped the list (Figure 6.15). This makes sense, as not all businesses have a large environmental footprint; thus HR-centric ESG measures like wellness rank higher because they are within the control of a greater number of companies. As expected, there are significant differences by industry based on what is material. Greenhouse gas (GHG) emissions tracking and reduction goals are much lower in the healthcare industry (12% and 15% respectively). Conversely, respondents in manufacturing were significantly more likely to engage in GHG calculations (51%). The professional services sector, meanwhile, was far more likely than their peers to focus on incentives for career advancement (69%).

THE 2021 DEFINITIVE RISK & COMPLIANCE BENCHMARK REPORT KEY FINDINGS
56NAVEX Global | Protecting Your People, Reputation and Bottom Line
International operations also had a measurable impact on GHG tracking and reduction efforts. Forty-one percent (41%) of companies operating internationally made GHG calculations, as opposed to just 16% of domestic businesses. An organization’s international profile also affected its diversity efforts. Over half (54%) of companies operating internationally engaged in diversity metrics tracking, as opposed to just 39% of domestic businesses.
Frameworks were initially developed to help companies report on their ESG performance. However, their one-size-fits-all approach means many of them cover sections that aren’t materially relevant to the respondent, while simultaneously not going deep enough into areas that are. Despite these limitations, frameworks fill an important gap currently left by the lack of industry-specific regulatory standards, and allow organizations to broadly compare themselves to industry peers.
Regarding frameworks, the most notable result (at least initially) is the lack of consensus. Nearly half (47%) of respondents reported operating under no framework (Figure 6.16). However, these numbers mask some regional consensus. Use of the United Nations Sustainable Development Goals differed dramatically by region. Forty-three percent (43%) of companies headquartered in the EMEA region and 35% of APAC-headquartered organizations have adopted this framework, as opposed to a mere 12% of U.S. organizations. EMEA-led organizations were also much more likely to utilize the Carbon Disclosure Project (22% EMEA vs. 9% non-EMEA). More than half of North American (NAM) companies, in contrast, have yet to adopt a framework. Fifty-four percent (54%) of NAM-headquartered organizations had no frameworks, versus 29% of companies incorporated outside of the North American Region.
Program Elements (Continued)

THE 2021 DEFINITIVE RISK & COMPLIANCE BENCHMARK REPORT KEY FINDINGS
57NAVEX Global | Protecting Your People, Reputation and Bottom Line
Program Elements (Continued)
8%
47%
4%
5%
9%
12%
20%
20%
25%
Other
None
WFE (World Federationof Exchanges)
Sustainalytics(Formerly Morningstar)
TCFD (Task Force ClimateFinancial Disclosures)
CDP (Carbon Disclosure Project)
SDG (United Nations SustainableDevelopment Goals)
SASB (Sustainability AccountingStandards Board)
GRI (Global Reporting Initiative)
61: ESG Frameworks
Figure 6.16 ESG FrameworksShown: Responses to “Which frameworks do you use to measure/contextualize your ESG performance?”
28%
13%
28%
32%
39%
49%
57%
72%
70%
Supplier Dirversity Program
GHG Reduction Goals
None
GHG Emission Calculations
Employee Incentives
Diversity Metrics Tracking
Community Volunteer Programs
Employee Wellness Programs
60: ESG Measures
Figure 6.15 ESG MeasuresShown: Responses to “Which of the following are included in your environmental, social and governance (ESG) program?”

THE 2021 DEFINITIVE RISK & COMPLIANCE BENCHMARK REPORT KEY FINDINGS
58NAVEX Global | Protecting Your People, Reputation and Bottom Line
7. Risk Management
2020 was a threshold year for the field of risk management. A seemingly interminable series of low-probability, high-risk events introduced an unprecedented level of uncertainty into organizational operations. Paramount among these was the COVID-19 pandemic, which forced massive, sudden shifts to work-from-home environments; extensive supply chain disruptions; surging unemployment and market contractions. However, the pandemic is far from the only crisis; a series of social, technological, economic, environmental, and political upheavals continue to strike populations and institutions across the globe, creating novel, complex and interconnected risks. For businesses, this has resulted in a new and renewed focus on the need to identify, measure, respond to and monitor risks across the enterprise in a consistent and cohesive manner.
Risk Ownership Increases With Program SophisticationWhile recognition of the need for an integrated approach to risk management is on the rise, our survey results demonstrate a lack of consensus around who should manage the task (Figure 7.1). Respondents identified a plethora of officers charged with managing risk in their organization, including the chief risk officer
(17%), chief compliance officer (14%), chief executive officer (13%), general counsel (12%) and chief risk and compliance officer (9%). However, there are some trends by industry and region. Nearly half of respondents in the finance sector (47%) and 29% of those whose organizations are headquartered in the APAC region are likely to say this is the duty of the CRO. A quarter (24%) of respondents in healthcare place it with the CCO.
When we look at well-resourced programs, a clear trio and hierarchy emerges – CRO, CCO and CRCOs, in that order. Advanced programs, meanwhile, are twice as likely to place this duty with a CRCO than programs overall (18% vs. 9%). This makes sense, as Advanced programs are much more likely to have a dedicated CRCO than their peers (26% vs. 14% overall). As R&C programs become more sophisticated and grow in size, the more likely the risk and compliance functions are to integrate, and in some cases merge, with a CRCO as oversight. However, it is important to note that, even within Advanced programs, everyone owns risk. As the Institute of Internal Auditors reinforced in the recent update to their storied “Three Lines of Defense Model,” collaboration, alignment and accountability across the organization at every level is essential for effective risk management.18
18 “IIA Issues Important Update to Three Lines Model.” Institute of Internal Auditors (IIA), July 20, 2020.

THE 2021 DEFINITIVE RISK & COMPLIANCE BENCHMARK REPORT KEY FINDINGS
59NAVEX Global | Protecting Your People, Reputation and Bottom Line
6%
6%
3%
3%
8%
9%
9%
12%
13%
14%
17%
Other
No One
Chief InformationSecurity Officer
Chief Audit Executive
Chief Finance Officer
Management-Level
Chief Risk &Compliance Officer
General Counsel
Chief Executive Officer
Chief Compliance Officer
Chief Risk Officer
Percent of respondents who have a committee to address risk strategy enterprise-wide77%
55 / 56. Risk Management Responsibilities & Oversight
Risk Management (Continued)
Figure 7.1 Risk Management Responsibilities & OversightShown: Responses to “Who in your organization is responsible for managing your risk strategy? Does your organization have a committee to address risk and risk strategy enterprise-wide?”

THE 2021 DEFINITIVE RISK & COMPLIANCE BENCHMARK REPORT KEY FINDINGS
60NAVEX Global | Protecting Your People, Reputation and Bottom Line
Risk Management (Continued)
Programs Have Reached the “Optimization Midpoint”Strong policy and procedure management (P&P) is another key element to well-disciplined risk management. The Capability Maturity Model Integration, developed at Carnegie Mellon University and administered through ISACA, offers a reliable measure of P&P optimization. Its levels include:
• Reactive; our P&P are mostly ad hoc and undocumented
• Managed: Our P&P are repeatable and consistent
• Defined: Our P&P are well-defined and documented
• Measured: Our P&P are tested, measured and refined
• Optimized: Our P&P are flexible, continually monitored and improved
On average, respondents assessed their P&P optimization at 3.0 out of 5 on the CMMI scale – an exact midpoint (Figure 7.2). As with risk ownership, there were some trends within subgroups. Respondents from government entities where overwhelmingly likely to rate their program as Reactive (33%), while those representing nonprofits and healthcare organizations were more likely to rate their programs as Optimized (37% and 24% respectively). Advanced programs were more likely to be Optimized (38%). A program’s access to resources was also positively correlated to P&P optimization. In other words, the better a program’s access to funding and staff, the better its policy and procedure management. Interestingly, there were no significant trends correlating to company size or revenue, indicating that any organization can achieve P&P optimization – if it provides its R&C program with sufficient resources.
Figure 7.2 Risk & Compliance Policy & Procedure OptimizationShown: Responses to “How would you describe your program’s processes and procedures?
29%
12%
31%
12%
18%
Managed
Reactive
Defined
Measured
Optimized
Respondents gave their level of policy & process optimization an average rating of 3.0 out of 5
OUT OF 53.0
51: Risk & Compliance Policy & Procedure Optimization

THE 2021 DEFINITIVE RISK & COMPLIANCE BENCHMARK REPORT KEY FINDINGS
61NAVEX Global | Protecting Your People, Reputation and Bottom Line
Risk Management (Continued)
Figure 7.3 Risk Areas ManagedShown: Responses to “Which of the following risk areas are currently managed by your R&C program?”
24%
7%
34%
36%
42%
42%
43%
50%
52%
58%
79%
ESG
Don’t Know
Health & Safety
Business Continuity
Audit
Reputational Risk
IT / Infosec Risk
Operational Risk
Third-Party Risk
Data Privacy
Compliance Risk
52. Risk Areas Managed
Compliance, Data Privacy Top Risk AreasOverall, compliance risk remained the risk area of greatest importance to respondents, with 79% stating their program was responsible for this type of risk (Figure 7.3). That was followed by data privacy, third party, and operational risk, at 58%, 52% and 50%, respectively. Conversely, business continuity, health and safety, and ESG risks were covered by only a third or less of the programs surveyed.
Survey results also showed the respondent’s industry strongly influenced what types of risk their program managed. Those in finance were much more likely to cover business continuity risk (51% vs. 36%),
manufacturing to manage third-party risk (63% vs. 52%), and healthcare to manage audit (57% vs. 42%). This demonstrates an organic response to risk, with programs responding to their organizations’ individual risk profile and needs. Programs in high-revenue organizations were much more concerned about reputational risk (62% vs. 42%). Interestingly, the likelihood of a respondent’s program covering operational, business continuity, health and safety, and IT/Infosec risk was inversely proportional to an organization’s size and revenue. This is likely because responsibility for these risks is shared with other functions as organizations grow.

THE 2021 DEFINITIVE RISK & COMPLIANCE BENCHMARK REPORT KEY FINDINGS
62NAVEX Global | Protecting Your People, Reputation and Bottom Line
Risk Management (Continued)
Most R&C Programs Have Begun IntegratingRisk integration is integral to proper risk management. Programs that silo risk management activities across their organization are less able to identify, define and effectively mitigate risk, as it prohibits risk intelligence from informing important business activities such as strategic planning, strategy execution, enterprise performance management, investment decision making and more. To assess respondents’ level of integration, we asked them to select one of the following to describe their organization’s governance, risk and compliance (GRC) capabilities:
• Siloed throughout our organization
• Currently siloed, but we are planning to integrate
• We have integrated some of our risk management capabilities, but not all
• We have a centralized integrated risk management program run by senior management
• We have a federated integrated risk management program run by the business that reports to senior management
Importantly, over three-quarters of those surveyed described their risk management as at least partially integrated (Figure 7.4). Unsurprisingly, these results are correlated with program maturity and resources, demonstrating that the more developed and better supported a program is, the more it will seek to integrate risk management practices throughout the enterprise. However, as with P&P optimization, there is no correlation between an organization’s size or revenue and its level of integration. This should send a clear message to R&C programs – no matter what the shape, size or profitability of your organization, if you have not begun to integrate your risk management activities across your enterprise, then you are decidedly behind the curve.
Figure 7.4 Risk & Compliance IntegrationShown: Responses to “How integrated are your organization’s governance, risk and compliance capabilities?”
7%46% 23%9%16%
Federated IRM Program
CentralizedIRM Program
PartiallyIntegrated
Planning to IntegrateSiloed
53: Risk & Compliance Integration
THE 2021 DEFINITIVE RISK & COMPLIANCE BENCHMARK REPORT
63NAVEX Global | Protecting Your People, Reputation and Bottom Line
About the Authors
Carrie Penman Executive Editor Chief Risk and Compliance Officer, NAVEX Global
As one of the earliest ethics officers, Carrie Penman has been with NAVEX Global since 2003 after serving four years as deputy director of the Ethics and Compliance Officer Association (ECOA) now ECI. A scientist by training, she developed and directed the first corporate-wide global ethics program at Westinghouse Electric Corporation from 1994 – 1999. As Chief Compliance Officer for NAVEX Global, she oversees the company’s internal ethics and compliance activities employing many of the best practices that NAVEX Global recommends to its customers.
Carrie has conducted numerous training programs for client Boards of Directors and executive teams, as well as culture, program and risk assessment projects globally. She has also served as a corporate monitor and independent consultant for companies with government settlement agreements.
Carrie is the author of numerous compliance-related articles and commentary and is regularly featured or quoted as a compliance expert in the press. Carrie was featured in the Wall Street Journal’s Risk and Compliance Journal and on the cover of Compliance Week magazine. Carrie is a recognized expert in the area of hotline reporting and is the author of NAVEX Global’s annual Hotline Benchmark Report which evaluates data from over one million hotline reports annually.
Carrie is currently an Executive Fellow at the Bentley University Center for Business Ethics. She previously served on the ECOA Board of Directors and its Executive Committee and served on the Advisory Board for the Duquesne University, Beard Center for Leadership in Ethics.
Carrie is a regular speaker at leading ethics and compliance conferences and events. She is a 19-year member of the faculty of the Managing Ethics in Organizations course that is co-sponsored by ECI and the Center for Business Ethics at Bentley University.
In 2017, Carrie received the Ethics & Compliance Initiative (ECI) Carol R. Marshall Award for Innovation in Corporate Ethics for an extensive career contributing to the advancement of the ethics and compliance field worldwide and was a finalist in the Women in Compliance Lifetime Achievement Award for 2018.

THE 2021 DEFINITIVE RISK & COMPLIANCE BENCHMARK REPORT
64NAVEX Global | Protecting Your People, Reputation and Bottom Line
Mary Bennett Research Analyst and Content Manager, NAVEX Global
Mary Bennett is a former Vice President of Advisory Services, NAVEX Global. She joined the company in 1999 when it was a one-consultant company and helped to grow its advisory practice into a group that has served 25% of the Fortune 200 in 40 countries worldwide.
She left NAVEX Global and created her own firm, Right Compliance Consulting LLC, in 2017. As President of her own company, Mary works across all industries and all sizes of organizations to create and facilitate award-winning training programs; conduct culture and program assessments; develop compliance communications and education plans; and help clients develop best practice programs from the ground up.
Throughout her career, Mary has been invited to share her expertise at many conferences including The Conference Board, Health Care Compliance Association, Society of Corporate Compliance and Ethics, Ethics and Compliance Initiative, and Consero Forums for both legal and compliance professionals on topics such as basic business ethics management, taking compliance education to the next level, ethics risk assessment, compliance program and culture evaluation.
During her tenure at NAVEX Global, Bennett pioneered innovative ethics training and assessment methods. She has many recognized communications, customized video work and training programs to her credit.
Prior to working as a consultant, Mary served as Vice President of the Compliance and Integrity Group at Caremark. In that role, she implemented the requirements of one of the first healthcare CIAs, grew the helpline function and developed a helpline computer management system. She created and implemented best practice training programs for over 800 healthcare facilities across the country, wrote compliance and communication plans and implemented human resource tools to embed ethics into the reward systems.
Mary is a registered pharmacist by training and has over thirty years of management, education and clinical experience. She has published and consulted nationally and internationally in the areas of compliance, medications and disease states.
When not consulting, Mary has participated in a community organization which is devoted to bringing character education into area schools.

THE 2021 DEFINITIVE RISK & COMPLIANCE BENCHMARK REPORT
65NAVEX Global | Protecting Your People, Reputation and Bottom Line
Andrew Burt Research Analyst and Content Manager, NAVEX Global
Andrew Burt is a writer and researcher for NAVEX Global, where he collaborates with risk and compliance experts to develop content offering information, education, and best practices on industry issues and trends. After obtaining his MPA from Indiana University, Andrew managed communications for the University of Oregon’s Global Education Oregon initiative, where he directed messaging for over 20 educational programs worldwide. More recently, he served as a writer and research historian for the Reuben G. Soderstrom Foundation for Organized Labor Studies, and was co-author of the award-winning biographical series Forty Gavels.
AMERICAS
5500 Meadows Road, Suite 500 Lake Oswego, OR 97035United States of [email protected] www.navexglobal.com+1 (866) 297 0224
EMEA + APAC
4th Floor, Vantage LondonGreat West Road
Brentford, TW8 9AG United Kingdom
+44 (0) 20 8939 1650
PLEASE RECYCLE
Copyright © 2021 NAVEX Global Inc. All Rights Reserved.