Embed Size (px)
Citation preview
United Counties of Leeds and Grenville Jeeds(~ Community and Social Services Division Gl'env1Tle
Directive
Directive: 2021 Market Rent Index & Indices for Non-Profit Projects (Revised)
Issue Date: August 25, 2020 Directive No.: DI R2020-10
Revision Date: December 18, 2020 Revision No.: 1
Applicable Policy:
Type: Operational
The policies and procedures in this Directive are to be implemented by Housing Providers/Cooperatives funded by the Municipality under the following programs.
Provincial Non-Profit Housing Providers
~ Gananoque Family Housing
~ Legion Village 96 Seniors Residence
~ Brockville Municipal Non-Profit Housing Corp.
~ Gananoque Housing Inc.
~ Twp. of Bastard & South Burgess Housing Corp.
~ South Crosby Non-Profit Housing Corp. - Pineview
Federal Non-Profit Housing Providers
D Athens & District Non-Profit D Marguerita Residence Corp. Housing Providers
D Gananoque Housing Inc. D South Crosby Non-Profit Housing Corp. - Rideau Lakes
Federal/Provincial Cooperative Housing
~ Shepherds Green Cooperative Homes Inc.
Housing Providers
D Leeds Grenville Housing Department
D Marguerita Residence Corp. (RGI Service Agreement)
D Athens & District Non-Profit Housing (RGI Service Agreement)
D Rent Supplement Program, including Providers with expired Federal Operating Agreement
Page 1 of 3
J PedsC:~ United Counties of Leeds and Grenville Gretlv1TTe Community and Social Services Division
Directive
Directive: 2021 Market Rent Index & Indices for Non-Profit Projects (Revised)
Issue Date: August 25, 2020 Directive No.: D1R2020-10
Revision Date: December 18, 2020 Revision No.: 1
BACKGROUND
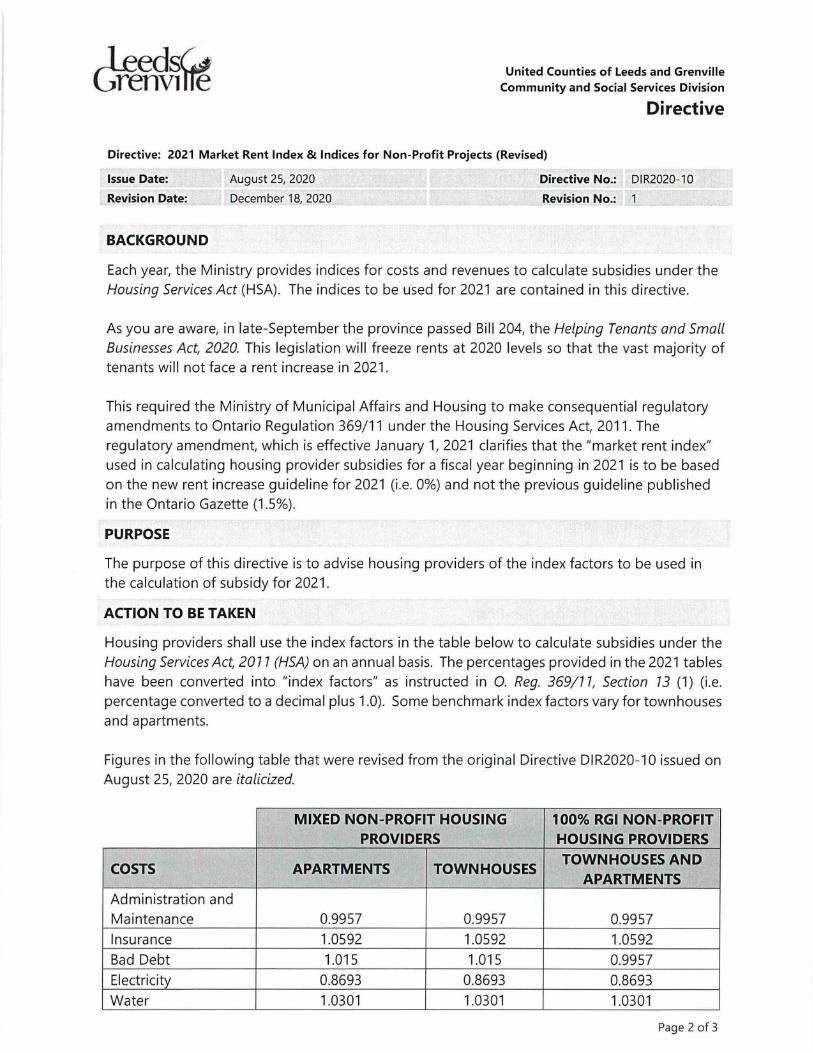
Each year, the Ministry provides indices for costs and revenues to calculate subsidies under the Housing Services Act (HSA). The indices to be used for 2021 are contained in this directive.
As you are aware, in late-September the province passed Bill 204, the Helping Tenants and Small
Businesses Act, 2020. This legislation will freeze rents at 2020 levels so that the vast majority of tenants will not face a rent increase in 2021 .
This required the Ministry of Municipal Affairs and Housing to make consequential regulatory amendments to Ontario Regulation 369/11 under the Housing Services Act, 2011 . The regulatory amendment, which is effective January 1, 2021 clarifies that the "market rent index" used in calculating housing provider subsidies for a fiscal year beginning in 2021 is to be based on the new rent increase guideline for 2021 (i .e. 0%) and not the previous guideline published in the Ontario Gazette (1 .5%).
PURPOSE
The purpose of this directive is to advise housing providers of the index factors to be used in the calculation of subsidy for 2021 .
ACTION TO BE TAKEN
Housing providers shall use the index factors in the table below to calculate subsidies under the Housing Services Act, 207 7 (HSA) on an annual basis. The percentages provided in the 2021 tables have been converted into "index factors" as instructed in 0. Reg. 369/ 77, Section 7 3 (1) (i .e. percentage converted to a decimal plus 1.0). Some benchmark index factors vary for townhouses and apartments.
Figures in the following table that were revised from the original Directive DIR2020-10 issued on August 25, 2020 are italicized.
MIXED NON-PROFIT HOUSING PROVIDERS
100% RGI NON-PROFIT HOUSING PROVIDERS
COSTS APARTMENTS TOWNHOUSES TOWNHOUSES AND
APARTMENTS Administration and Maintenance 0.9957 0.9957 0.9957 Insurance 1.0592 1.0592 1.0592 Bad Debt 1.015 1.015 0.9957 Electricity 0.8693 0.8693 0.8693 Water 1.0301 1.0301 1.0301
Page 2 of 3
United Counties of Leeds and Grenville Community and Social Services Division
Directive
Directive: 2021 Market Rent Index & Indices for Non-Profit Projects (Revised)
Issue Date:
Revision Date:
August 25, 2020
December 18, 2020
Directive No.:
Revision No.:
DI R2020-10
1
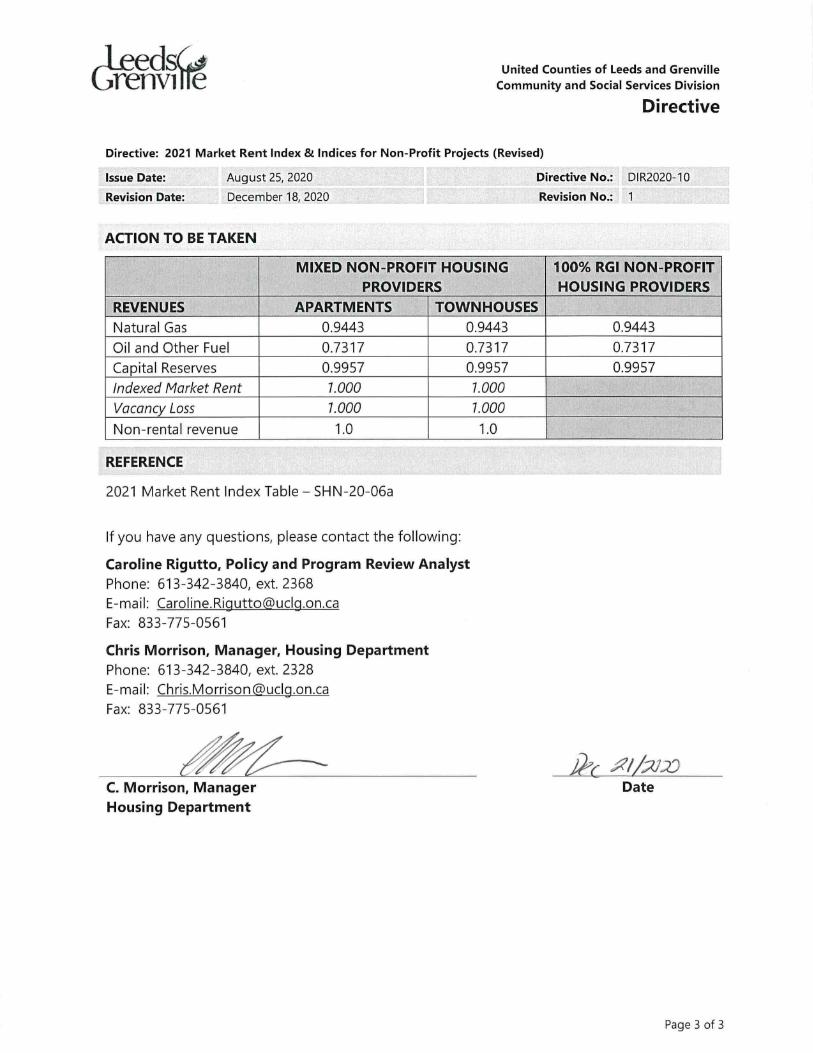
ACTION TO BE TAKEN -II MIXED NON-PROFIT HOUSING
PROVIDERS 100% RGI NON-PROFIT HOUSING PROVIDERS
REVENUES APARTMENTS TOWNHOUSES
Natural Gas 0.9443 0.9443 0.9443
Oil and Other Fuel 0.7317 0.7317 0.7317
Capital Reserves 0.9957 0.9957 0.9957
Indexed Market Rent 7.000 7.000
Vacancy Loss 7.000 7.000
Non-rental revenue 1.0 1.0
REFERENCE
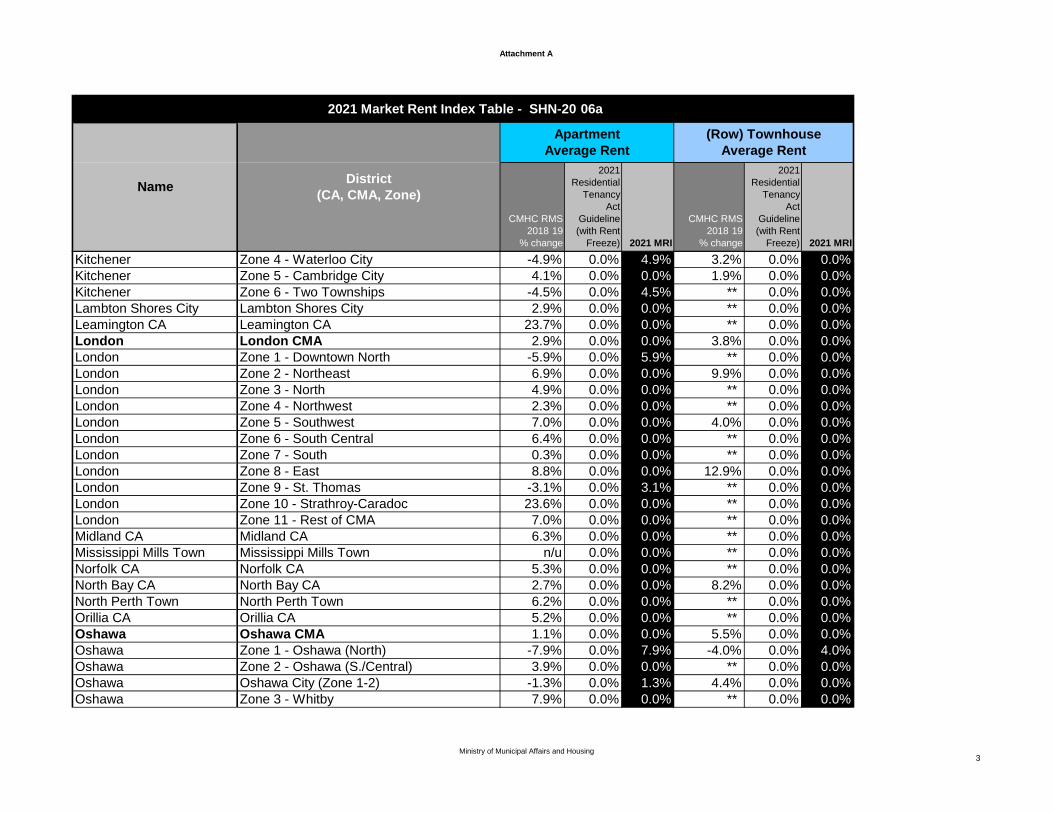
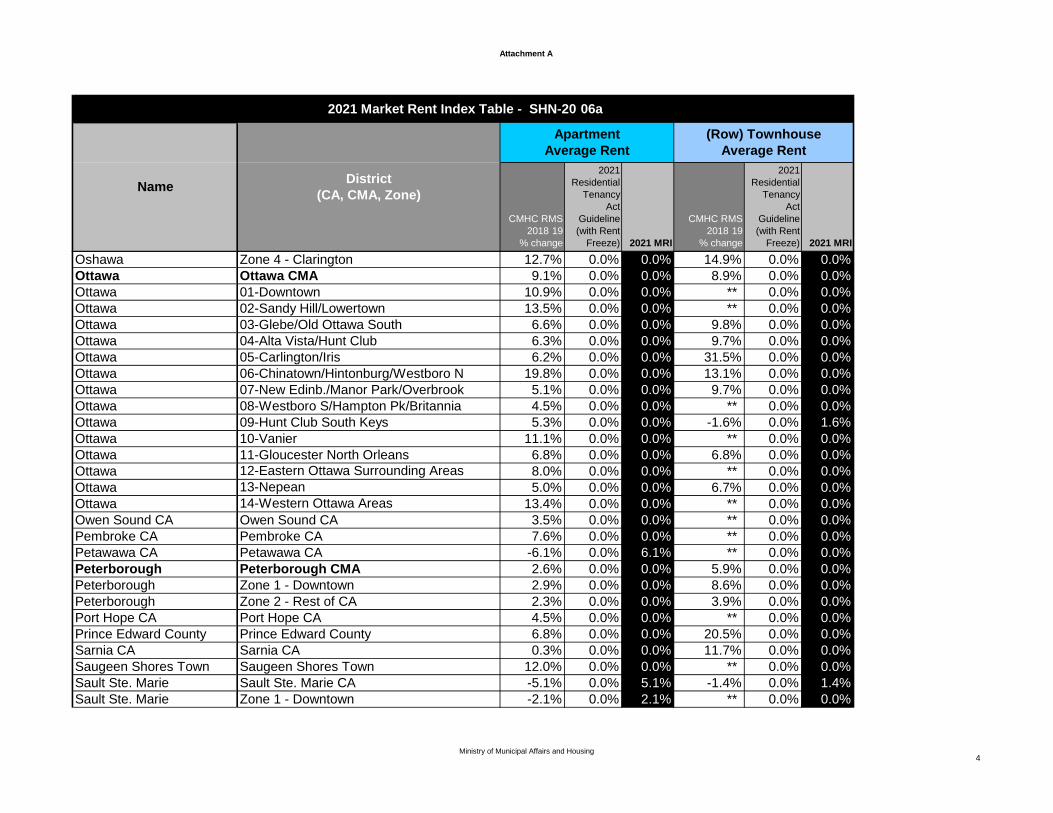
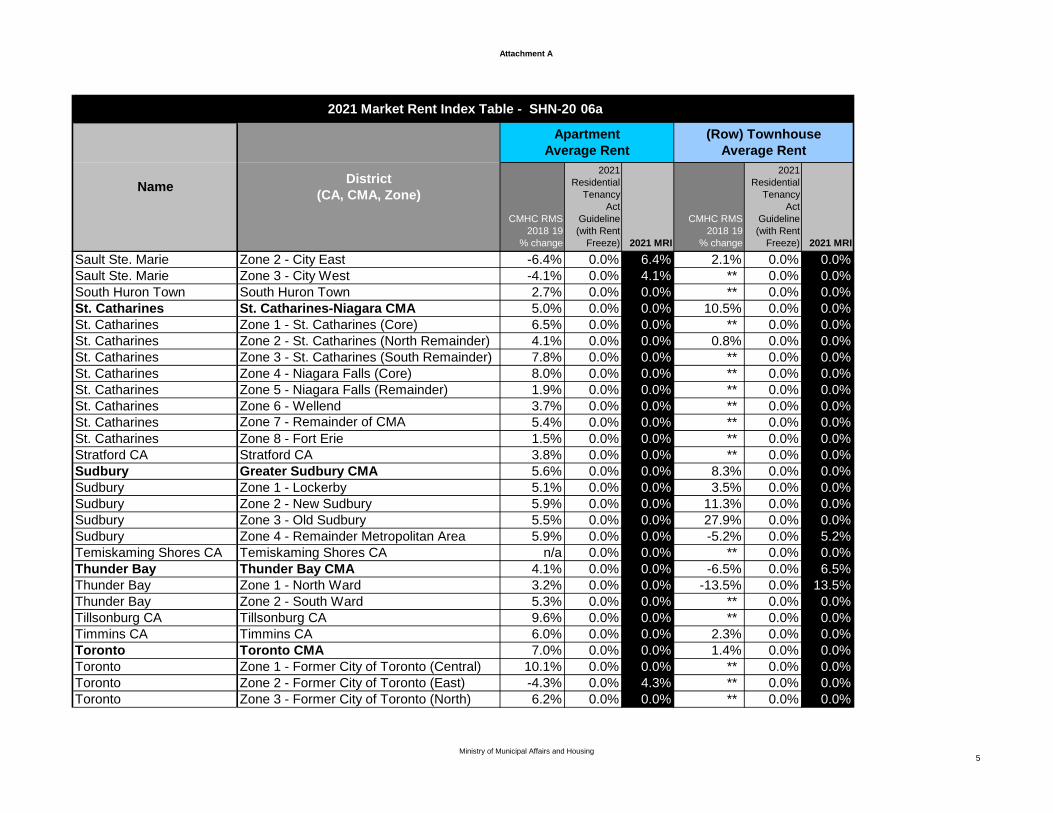
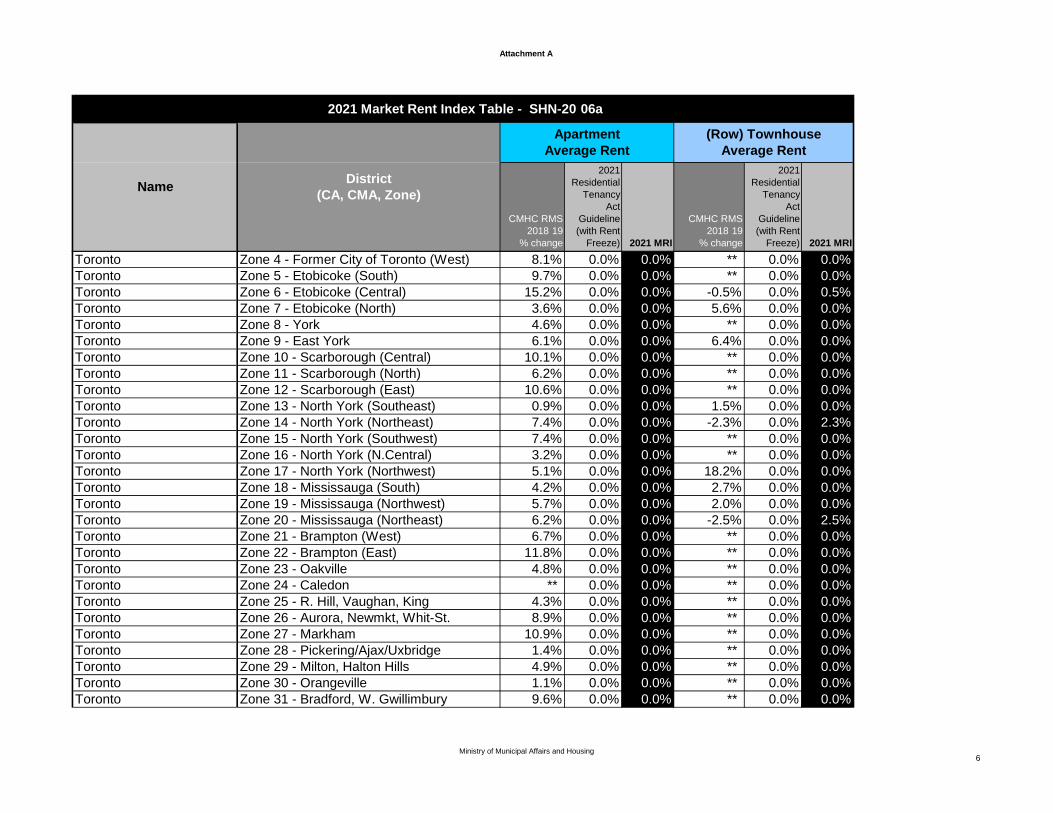
2021 Market Rent Index Table - SHN-20-06a
If you have any questions, please contact the following:
Caroline Rigutto, Policy and Program Review Analyst Phone: 613-342-3840, ext. 2368
E-mail: Caroline.Rigutto@uclg .on.ca
Fax: 833-775-0561
Chris Morrison, Manager, Housing Department Phone: 613-342-3840, ext. 2328
E-mail: [email protected]
Fax: 833-775-0561
C. Morrison, Manager Date Housing Department
Page 3 of 3
-
-
-
Attachment A
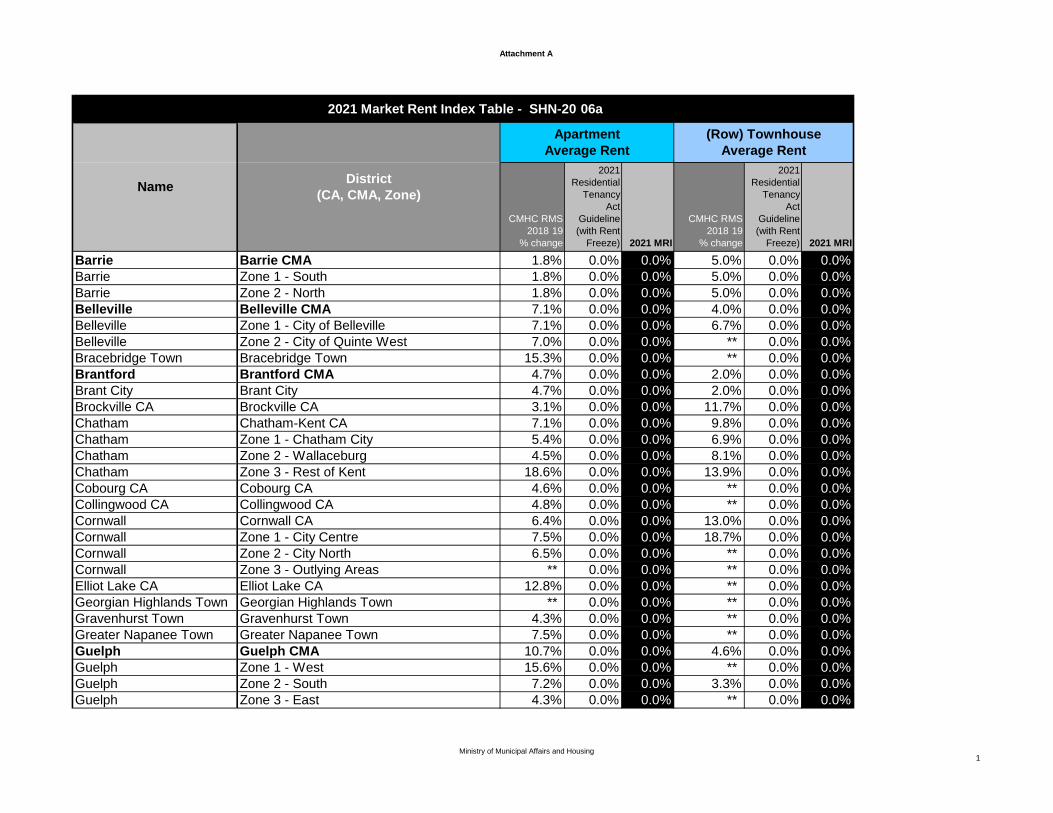
2021 Market Rent Index Table - SHN-20 06a
Apartment
Average Rent
(Row) Townhouse
Average Rent
Name District
(CA, CMA, Zone)
CMHC RMS
2018 19
% change
2021
Residential
Tenancy
Act
Guideline
(with Rent
Freeze) 2021 MRI
CMHC RMS
2018 19
% change
2021
Residential
Tenancy
Act
Guideline
(with Rent
Freeze) 2021 MRI
Barrie Barrie CMA 1.8% 0.0% 0.0% 5.0% 0.0% 0.0%
Barrie Zone 1 - South 1.8% 0.0% 0.0% 5.0% 0.0% 0.0%
Barrie Zone 2 - North 1.8% 0.0% 0.0% 5.0% 0.0% 0.0%
Belleville Belleville CMA 7.1% 0.0% 0.0% 4.0% 0.0% 0.0%
Belleville Zone 1 - City of Belleville 7.1% 0.0% 0.0% 6.7% 0.0% 0.0%
Belleville Zone 2 - City of Quinte West 7.0% 0.0% 0.0% ** 0.0% 0.0%
Bracebridge Town Bracebridge Town 15.3% 0.0% 0.0% ** 0.0% 0.0%
Brantford Brantford CMA 4.7% 0.0% 0.0% 2.0% 0.0% 0.0%
Brant City Brant City 4.7% 0.0% 0.0% 2.0% 0.0% 0.0%
Brockville CA Brockville CA 3.1% 0.0% 0.0% 11.7% 0.0% 0.0%
Chatham Chatham-Kent CA 7.1% 0.0% 0.0% 9.8% 0.0% 0.0%
Chatham Zone 1 - Chatham City 5.4% 0.0% 0.0% 6.9% 0.0% 0.0%
Chatham Zone 2 - Wallaceburg 4.5% 0.0% 0.0% 8.1% 0.0% 0.0%
Chatham Zone 3 - Rest of Kent 18.6% 0.0% 0.0% 13.9% 0.0% 0.0%
Cobourg CA Cobourg CA 4.6% 0.0% 0.0% ** 0.0% 0.0%
Collingwood CA Collingwood CA 4.8% 0.0% 0.0% ** 0.0% 0.0%
Cornwall Cornwall CA 6.4% 0.0% 0.0% 13.0% 0.0% 0.0%
Cornwall Zone 1 - City Centre 7.5% 0.0% 0.0% 18.7% 0.0% 0.0%
Cornwall Zone 2 - City North 6.5% 0.0% 0.0% ** 0.0% 0.0%
Cornwall Zone 3 - Outlying Areas ** 0.0% 0.0% ** 0.0% 0.0%
Elliot Lake CA Elliot Lake CA 12.8% 0.0% 0.0% ** 0.0% 0.0%
Georgian Highlands Town Georgian Highlands Town ** 0.0% 0.0% ** 0.0% 0.0%
Gravenhurst Town Gravenhurst Town 4.3% 0.0% 0.0% ** 0.0% 0.0%
Greater Napanee Town Greater Napanee Town 7.5% 0.0% 0.0% ** 0.0% 0.0%
Guelph Guelph CMA 10.7% 0.0% 0.0% 4.6% 0.0% 0.0%
Guelph Zone 1 - West 15.6% 0.0% 0.0% ** 0.0% 0.0%
Guelph Zone 2 - South 7.2% 0.0% 0.0% 3.3% 0.0% 0.0%
Guelph Zone 3 - East 4.3% 0.0% 0.0% ** 0.0% 0.0%
Ministry of Municipal Affairs and Housing 1
-
-
-
-
-
Attachment A
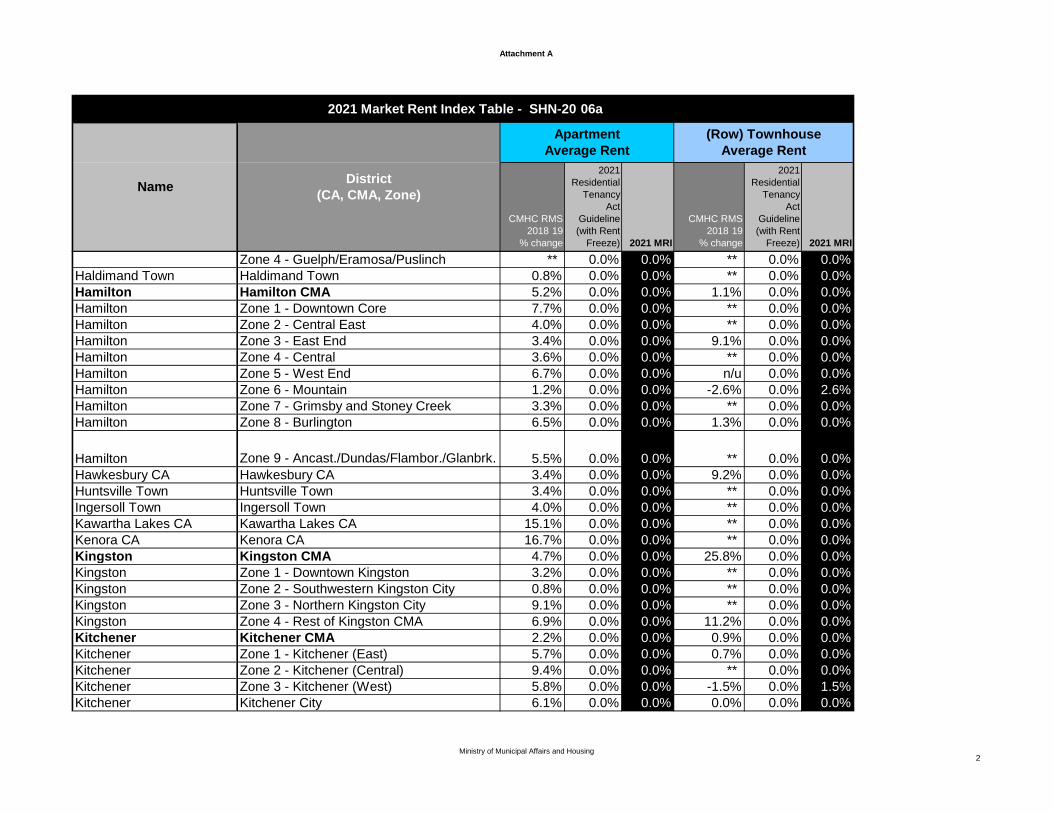
2021 Market Rent Index Table - SHN-20 06a
Apartment
Average Rent
(Row) Townhouse
Average Rent
Name District
(CA, CMA, Zone)
CMHC RMS
2018 19
% change
2021
Residential
Tenancy
Act
Guideline
(with Rent
Freeze) 2021 MRI
CMHC RMS
2018 19
% change
2021
Residential
Tenancy
Act
Guideline
(with Rent
Freeze) 2021 MRI
Zone 4 - Guelph/Eramosa/Puslinch ** 0.0% 0.0% ** 0.0% 0.0%
Haldimand Town Haldimand Town 0.8% 0.0% 0.0% ** 0.0% 0.0%
Hamilton Hamilton CMA 5.2% 0.0% 0.0% 1.1% 0.0% 0.0%
Hamilton Zone 1 - Downtown Core 7.7% 0.0% 0.0% ** 0.0% 0.0%
Hamilton Zone 2 - Central East 4.0% 0.0% 0.0% ** 0.0% 0.0%
Hamilton Zone 3 - East End 3.4% 0.0% 0.0% 9.1% 0.0% 0.0%
Hamilton Zone 4 - Central 3.6% 0.0% 0.0% ** 0.0% 0.0%
Hamilton Zone 5 - West End 6.7% 0.0% 0.0% n/u 0.0% 0.0%
Hamilton Zone 6 - Mountain 1.2% 0.0% 0.0% -2.6% 0.0% 2.6%
Hamilton Zone 7 - Grimsby and Stoney Creek 3.3% 0.0% 0.0% ** 0.0% 0.0%
Hamilton Zone 8 - Burlington 6.5% 0.0% 0.0% 1.3% 0.0% 0.0%
Hamilton Zone 9 - Ancast./Dundas/Flambor./Glanbrk. 5.5% 0.0% 0.0% ** 0.0% 0.0%
Hawkesbury CA Hawkesbury CA 3.4% 0.0% 0.0% 9.2% 0.0% 0.0%
Huntsville Town Huntsville Town 3.4% 0.0% 0.0% ** 0.0% 0.0%
Ingersoll Town Ingersoll Town 4.0% 0.0% 0.0% ** 0.0% 0.0%
Kawartha Lakes CA Kawartha Lakes CA 15.1% 0.0% 0.0% ** 0.0% 0.0%
Kenora CA Kenora CA 16.7% 0.0% 0.0% ** 0.0% 0.0%
Kingston Kingston CMA 4.7% 0.0% 0.0% 25.8% 0.0% 0.0%
Kingston Zone 1 - Downtown Kingston 3.2% 0.0% 0.0% ** 0.0% 0.0%
Kingston Zone 2 - Southwestern Kingston City 0.8% 0.0% 0.0% ** 0.0% 0.0%
Kingston Zone 3 - Northern Kingston City 9.1% 0.0% 0.0% ** 0.0% 0.0%
Kingston Zone 4 - Rest of Kingston CMA 6.9% 0.0% 0.0% 11.2% 0.0% 0.0%
Kitchener Kitchener CMA 2.2% 0.0% 0.0% 0.9% 0.0% 0.0%
Kitchener Zone 1 - Kitchener (East) 5.7% 0.0% 0.0% 0.7% 0.0% 0.0%
Kitchener Zone 2 - Kitchener (Central) 9.4% 0.0% 0.0% ** 0.0% 0.0%
Kitchener Zone 3 - Kitchener (West) 5.8% 0.0% 0.0% -1.5% 0.0% 1.5%
Kitchener Kitchener City 6.1% 0.0% 0.0% 0.0% 0.0% 0.0%
Ministry of Municipal Affairs and Housing 2
-
-
-
-
-
-
-
- -
-
Attachment A
2021 Market Rent Index Table - SHN-20 06a
Apartment
Average Rent
(Row) Townhouse
Average Rent
Name District
(CA, CMA, Zone)
CMHC RMS
2018 19
% change
2021
Residential
Tenancy
Act
Guideline
(with Rent
Freeze) 2021 MRI
CMHC RMS
2018 19
% change
2021
Residential
Tenancy
Act
Guideline
(with Rent
Freeze) 2021 MRI
Kitchener Zone 4 - Waterloo City -4.9% 0.0% 4.9% 3.2% 0.0% 0.0%
Kitchener Zone 5 - Cambridge City 4.1% 0.0% 0.0% 1.9% 0.0% 0.0%
Kitchener Zone 6 - Two Townships -4.5% 0.0% 4.5% ** 0.0% 0.0%
Lambton Shores City Lambton Shores City 2.9% 0.0% 0.0% ** 0.0% 0.0%
Leamington CA Leamington CA 23.7% 0.0% 0.0% ** 0.0% 0.0%
London London CMA 2.9% 0.0% 0.0% 3.8% 0.0% 0.0%
London Zone 1 - Downtown North -5.9% 0.0% 5.9% ** 0.0% 0.0%
London Zone 2 - Northeast 6.9% 0.0% 0.0% 9.9% 0.0% 0.0%
London Zone 3 - North 4.9% 0.0% 0.0% ** 0.0% 0.0%
London Zone 4 - Northwest 2.3% 0.0% 0.0% ** 0.0% 0.0%
London Zone 5 - Southwest 7.0% 0.0% 0.0% 4.0% 0.0% 0.0%
London Zone 6 - South Central 6.4% 0.0% 0.0% ** 0.0% 0.0%
London Zone 7 - South 0.3% 0.0% 0.0% ** 0.0% 0.0%
London Zone 8 - East 8.8% 0.0% 0.0% 12.9% 0.0% 0.0%
London Zone 9 - St. Thomas -3.1% 0.0% 3.1% ** 0.0% 0.0%
London Zone 10 - Strathroy-Caradoc 23.6% 0.0% 0.0% ** 0.0% 0.0%
London Zone 11 - Rest of CMA 7.0% 0.0% 0.0% ** 0.0% 0.0%
Midland CA Midland CA 6.3% 0.0% 0.0% ** 0.0% 0.0%
Mississippi Mills Town Mississippi Mills Town n/u 0.0% 0.0% ** 0.0% 0.0%
Norfolk CA Norfolk CA 5.3% 0.0% 0.0% ** 0.0% 0.0%
North Bay CA North Bay CA 2.7% 0.0% 0.0% 8.2% 0.0% 0.0%
North Perth Town North Perth Town 6.2% 0.0% 0.0% ** 0.0% 0.0%
Orillia CA Orillia CA 5.2% 0.0% 0.0% ** 0.0% 0.0%
Oshawa Oshawa CMA 1.1% 0.0% 0.0% 5.5% 0.0% 0.0%
Oshawa Zone 1 - Oshawa (North) -7.9% 0.0% 7.9% -4.0% 0.0% 4.0%
Oshawa Zone 2 - Oshawa (S./Central) 3.9% 0.0% 0.0% ** 0.0% 0.0%
Oshawa Oshawa City (Zone 1-2) -1.3% 0.0% 1.3% 4.4% 0.0% 0.0%
Oshawa Zone 3 - Whitby 7.9% 0.0% 0.0% ** 0.0% 0.0%
Ministry of Municipal Affairs and Housing 3
-
-
-
-
-
- -
-
Attachment A
2021 Market Rent Index Table - SHN-20 06a
Apartment
Average Rent
(Row) Townhouse
Average Rent
Name District
(CA, CMA, Zone)
CMHC RMS
2018 19
% change
2021
Residential
Tenancy
Act
Guideline
(with Rent
Freeze) 2021 MRI
CMHC RMS
2018 19
% change
2021
Residential
Tenancy
Act
Guideline
(with Rent
Freeze) 2021 MRI
Oshawa Zone 4 - Clarington 12.7% 0.0% 0.0% 14.9% 0.0% 0.0%
Ottawa Ottawa CMA 9.1% 0.0% 0.0% 8.9% 0.0% 0.0%
Ottawa 01-Downtown 10.9% 0.0% 0.0% ** 0.0% 0.0%
Ottawa 02-Sandy Hill/Lowertown 13.5% 0.0% 0.0% ** 0.0% 0.0%
Ottawa 03-Glebe/Old Ottawa South 6.6% 0.0% 0.0% 9.8% 0.0% 0.0%
Ottawa 04-Alta Vista/Hunt Club 6.3% 0.0% 0.0% 9.7% 0.0% 0.0%
Ottawa 05-Carlington/Iris 6.2% 0.0% 0.0% 31.5% 0.0% 0.0%
Ottawa 06-Chinatown/Hintonburg/Westboro N 19.8% 0.0% 0.0% 13.1% 0.0% 0.0%
Ottawa 07-New Edinb./Manor Park/Overbrook 5.1% 0.0% 0.0% 9.7% 0.0% 0.0%
Ottawa 08-Westboro S/Hampton Pk/Britannia 4.5% 0.0% 0.0% ** 0.0% 0.0%
Ottawa 09-Hunt Club South Keys 5.3% 0.0% 0.0% -1.6% 0.0% 1.6%
Ottawa 10-Vanier 11.1% 0.0% 0.0% ** 0.0% 0.0%
Ottawa 11-Gloucester North Orleans 6.8% 0.0% 0.0% 6.8% 0.0% 0.0%
Ottawa 12-Eastern Ottawa Surrounding Areas 8.0% 0.0% 0.0% ** 0.0% 0.0%
Ottawa 13-Nepean 5.0% 0.0% 0.0% 6.7% 0.0% 0.0%
Ottawa 14-Western Ottawa Areas 13.4% 0.0% 0.0% ** 0.0% 0.0%
Owen Sound CA Owen Sound CA 3.5% 0.0% 0.0% ** 0.0% 0.0%
Pembroke CA Pembroke CA 7.6% 0.0% 0.0% ** 0.0% 0.0%
Petawawa CA Petawawa CA -6.1% 0.0% 6.1% ** 0.0% 0.0%
Peterborough Peterborough CMA 2.6% 0.0% 0.0% 5.9% 0.0% 0.0%
Peterborough Zone 1 - Downtown 2.9% 0.0% 0.0% 8.6% 0.0% 0.0%
Peterborough Zone 2 - Rest of CA 2.3% 0.0% 0.0% 3.9% 0.0% 0.0%
Port Hope CA Port Hope CA 4.5% 0.0% 0.0% ** 0.0% 0.0%
Prince Edward County Prince Edward County 6.8% 0.0% 0.0% 20.5% 0.0% 0.0%
Sarnia CA Sarnia CA 0.3% 0.0% 0.0% 11.7% 0.0% 0.0%
Saugeen Shores Town Saugeen Shores Town 12.0% 0.0% 0.0% ** 0.0% 0.0%
Sault Ste. Marie Sault Ste. Marie CA -5.1% 0.0% 5.1% -1.4% 0.0% 1.4%
Sault Ste. Marie Zone 1 - Downtown -2.1% 0.0% 2.1% ** 0.0% 0.0%
Ministry of Municipal Affairs and Housing 4
-
-
-
-
-
-
-
-
-
Attachment A
2021 Market Rent Index Table - SHN-20 06a
Apartment
Average Rent
(Row) Townhouse
Average Rent
Name District
(CA, CMA, Zone)
CMHC RMS
2018 19
% change
2021
Residential
Tenancy
Act
Guideline
(with Rent
Freeze) 2021 MRI
CMHC RMS
2018 19
% change
2021
Residential
Tenancy
Act
Guideline
(with Rent
Freeze) 2021 MRI
Sault Ste. Marie Zone 2 - City East -6.4% 0.0% 6.4% 2.1% 0.0% 0.0%
Sault Ste. Marie Zone 3 - City West -4.1% 0.0% 4.1% ** 0.0% 0.0%
South Huron Town South Huron Town 2.7% 0.0% 0.0% ** 0.0% 0.0%
St. Catharines St. Catharines-Niagara CMA 5.0% 0.0% 0.0% 10.5% 0.0% 0.0%
St. Catharines Zone 1 - St. Catharines (Core) 6.5% 0.0% 0.0% ** 0.0% 0.0%
St. Catharines Zone 2 - St. Catharines (North Remainder) 4.1% 0.0% 0.0% 0.8% 0.0% 0.0%
St. Catharines Zone 3 - St. Catharines (South Remainder) 7.8% 0.0% 0.0% ** 0.0% 0.0%
St. Catharines Zone 4 - Niagara Falls (Core) 8.0% 0.0% 0.0% ** 0.0% 0.0%
St. Catharines Zone 5 - Niagara Falls (Remainder) 1.9% 0.0% 0.0% ** 0.0% 0.0%
St. Catharines Zone 6 - Wellend 3.7% 0.0% 0.0% ** 0.0% 0.0%
St. Catharines Zone 7 - Remainder of CMA 5.4% 0.0% 0.0% ** 0.0% 0.0%
St. Catharines Zone 8 - Fort Erie 1.5% 0.0% 0.0% ** 0.0% 0.0%
Stratford CA Stratford CA 3.8% 0.0% 0.0% ** 0.0% 0.0%
Sudbury Greater Sudbury CMA 5.6% 0.0% 0.0% 8.3% 0.0% 0.0%
Sudbury Zone 1 - Lockerby 5.1% 0.0% 0.0% 3.5% 0.0% 0.0%
Sudbury Zone 2 - New Sudbury 5.9% 0.0% 0.0% 11.3% 0.0% 0.0%
Sudbury Zone 3 - Old Sudbury 5.5% 0.0% 0.0% 27.9% 0.0% 0.0%
Sudbury Zone 4 - Remainder Metropolitan Area 5.9% 0.0% 0.0% -5.2% 0.0% 5.2%
Temiskaming Shores CA Temiskaming Shores CA n/a 0.0% 0.0% ** 0.0% 0.0%
Thunder Bay Thunder Bay CMA 4.1% 0.0% 0.0% -6.5% 0.0% 6.5%
Thunder Bay Zone 1 - North Ward 3.2% 0.0% 0.0% -13.5% 0.0% 13.5%
Thunder Bay Zone 2 - South Ward 5.3% 0.0% 0.0% ** 0.0% 0.0%
Tillsonburg CA Tillsonburg CA 9.6% 0.0% 0.0% ** 0.0% 0.0%
Timmins CA Timmins CA 6.0% 0.0% 0.0% 2.3% 0.0% 0.0%
Toronto Toronto CMA 7.0% 0.0% 0.0% 1.4% 0.0% 0.0%
Toronto Zone 1 - Former City of Toronto (Central) 10.1% 0.0% 0.0% ** 0.0% 0.0%
Toronto Zone 2 - Former City of Toronto (East) -4.3% 0.0% 4.3% ** 0.0% 0.0%
Toronto Zone 3 - Former City of Toronto (North) 6.2% 0.0% 0.0% ** 0.0% 0.0%
Ministry of Municipal Affairs and Housing 5
-
-
-
-
-
-
Attachment A
2021 Market Rent Index Table - SHN-20 06a
Apartment
Average Rent
(Row) Townhouse
Average Rent
Name District
(CA, CMA, Zone)
CMHC RMS
2018 19
% change
2021
Residential
Tenancy
Act
Guideline
(with Rent
Freeze) 2021 MRI
CMHC RMS
2018 19
% change
2021
Residential
Tenancy
Act
Guideline
(with Rent
Freeze) 2021 MRI
Toronto Zone 4 - Former City of Toronto (West) 8.1% 0.0% 0.0% ** 0.0% 0.0%
Toronto Zone 5 - Etobicoke (South) 9.7% 0.0% 0.0% ** 0.0% 0.0%
Toronto Zone 6 - Etobicoke (Central) 15.2% 0.0% 0.0% -0.5% 0.0% 0.5%
Toronto Zone 7 - Etobicoke (North) 3.6% 0.0% 0.0% 5.6% 0.0% 0.0%
Toronto Zone 8 - York 4.6% 0.0% 0.0% ** 0.0% 0.0%
Toronto Zone 9 - East York 6.1% 0.0% 0.0% 6.4% 0.0% 0.0%
Toronto Zone 10 - Scarborough (Central) 10.1% 0.0% 0.0% ** 0.0% 0.0%
Toronto Zone 11 - Scarborough (North) 6.2% 0.0% 0.0% ** 0.0% 0.0%
Toronto Zone 12 - Scarborough (East) 10.6% 0.0% 0.0% ** 0.0% 0.0%
Toronto Zone 13 - North York (Southeast) 0.9% 0.0% 0.0% 1.5% 0.0% 0.0%
Toronto Zone 14 - North York (Northeast) 7.4% 0.0% 0.0% -2.3% 0.0% 2.3%
Toronto Zone 15 - North York (Southwest) 7.4% 0.0% 0.0% ** 0.0% 0.0%
Toronto Zone 16 - North York (N.Central) 3.2% 0.0% 0.0% ** 0.0% 0.0%
Toronto Zone 17 - North York (Northwest) 5.1% 0.0% 0.0% 18.2% 0.0% 0.0%
Toronto Zone 18 - Mississauga (South) 4.2% 0.0% 0.0% 2.7% 0.0% 0.0%
Toronto Zone 19 - Mississauga (Northwest) 5.7% 0.0% 0.0% 2.0% 0.0% 0.0%
Toronto Zone 20 - Mississauga (Northeast) 6.2% 0.0% 0.0% -2.5% 0.0% 2.5%
Toronto Zone 21 - Brampton (West) 6.7% 0.0% 0.0% ** 0.0% 0.0%
Toronto Zone 22 - Brampton (East) 11.8% 0.0% 0.0% ** 0.0% 0.0%
Toronto Zone 23 - Oakville 4.8% 0.0% 0.0% ** 0.0% 0.0%
Toronto Zone 24 - Caledon ** 0.0% 0.0% ** 0.0% 0.0%
Toronto Zone 25 - R. Hill, Vaughan, King 4.3% 0.0% 0.0% ** 0.0% 0.0%
Toronto Zone 26 - Aurora, Newmkt, Whit-St. 8.9% 0.0% 0.0% ** 0.0% 0.0%
Toronto Zone 27 - Markham 10.9% 0.0% 0.0% ** 0.0% 0.0%
Toronto Zone 28 - Pickering/Ajax/Uxbridge 1.4% 0.0% 0.0% ** 0.0% 0.0%
Toronto Zone 29 - Milton, Halton Hills 4.9% 0.0% 0.0% ** 0.0% 0.0%
Toronto Zone 30 - Orangeville 1.1% 0.0% 0.0% ** 0.0% 0.0%
Toronto Zone 31 - Bradford, W. Gwillimbury 9.6% 0.0% 0.0% ** 0.0% 0.0%
Ministry of Municipal Affairs and Housing 6
-
-
-
-
-
-
Attachment A
2021 Market Rent Index Table - SHN-20 06a
Apartment
Average Rent
(Row) Townhouse
Average Rent
Name District
(CA, CMA, Zone)
CMHC RMS
2018 19
% change
2021
Residential
Tenancy
Act
Guideline
(with Rent
Freeze) 2021 MRI
CMHC RMS
2018 19
% change
2021
Residential
Tenancy
Act
Guideline
(with Rent
Freeze) 2021 MRI
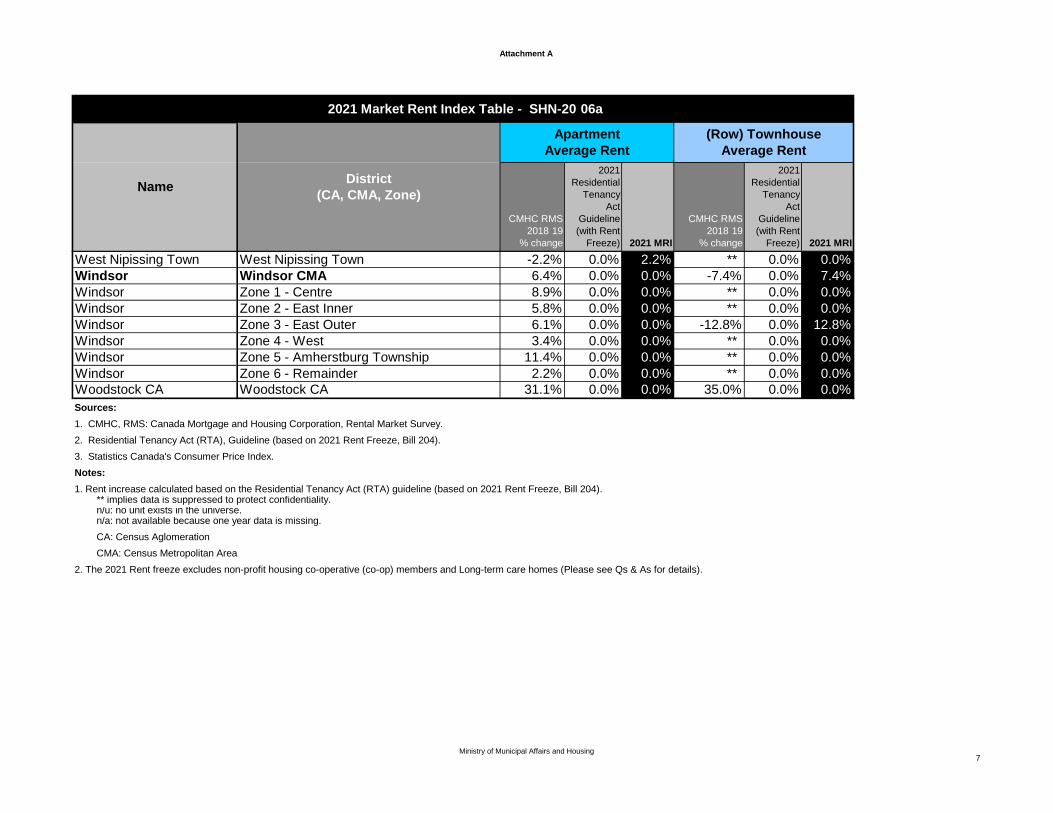
West Nipissing Town West Nipissing Town -2.2% 0.0% 2.2% ** 0.0% 0.0%
Windsor Windsor CMA 6.4% 0.0% 0.0% -7.4% 0.0% 7.4%
Windsor Zone 1 - Centre 8.9% 0.0% 0.0% ** 0.0% 0.0%
Windsor Zone 2 - East Inner 5.8% 0.0% 0.0% ** 0.0% 0.0%
Windsor Zone 3 - East Outer 6.1% 0.0% 0.0% -12.8% 0.0% 12.8%
Windsor Zone 4 - West 3.4% 0.0% 0.0% ** 0.0% 0.0%
Windsor Zone 5 - Amherstburg Township 11.4% 0.0% 0.0% ** 0.0% 0.0%
Windsor Zone 6 - Remainder 2.2% 0.0% 0.0% ** 0.0% 0.0%
Woodstock CA Woodstock CA 31.1% 0.0% 0.0% 35.0% 0.0% 0.0%
Sources:
1. CMHC, RMS: Canada Mortgage and Housing Corporation, Rental Market Survey.
2. Residential Tenancy Act (RTA), Guideline (based on 2021 Rent Freeze, Bill 204).
3. Statistics Canada's Consumer Price Index.
Notes:
1. Rent increase calculated based on the Residential Tenancy Act (RTA) guideline (based on 2021 Rent Freeze, Bill 204). ** implies data is suppressed to protect confidentiality. n/u: no unit exists in the universe. n/a: not available because one year data is missing.
CA: Census Aglomeration
CMA: Census Metropolitan Area
2. The 2021 Rent freeze excludes non-profit housing co-operative (co-op) members and Long-term care homes (Please see Qs & As for details).
Ministry of Municipal Affairs and Housing 7
SHN-20-06a Revised Attachment D
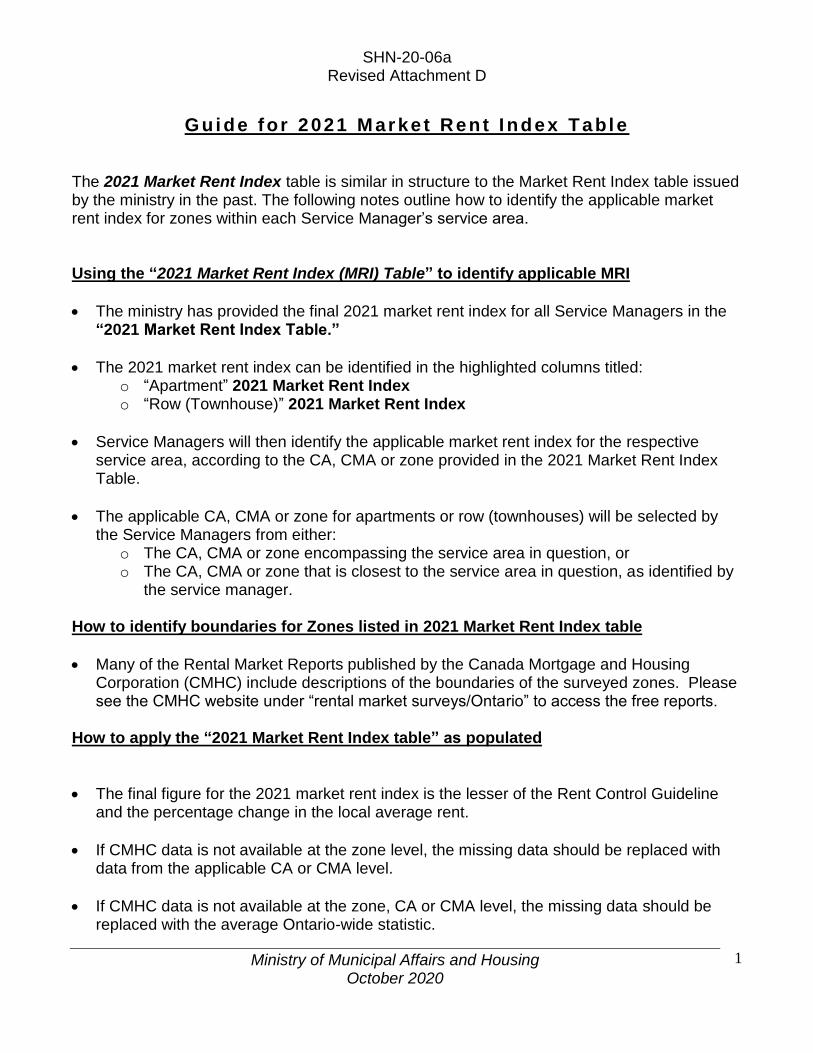
Gui de for 2021 M ar ke t Rent I ndex Tabl e
The 2021 Market Rent Index table is similar in structure to the Market Rent Index table issued by the ministry in the past. The following notes outline how to identify the applicable market rent index for zones within each Service Manager’s service area.
Using the “2021 Market Rent Index (MRI) Table” to identify applicable MRI
• The ministry has provided the final 2021 market rent index for all Service Managers in the “2021 Market Rent Index Table.”
• The 2021 market rent index can be identified in the highlighted columns titled: o “Apartment” 2021 Market Rent Index o “Row (Townhouse)” 2021 Market Rent Index
• Service Managers will then identify the applicable market rent index for the respective service area, according to the CA, CMA or zone provided in the 2021 Market Rent Index Table.
• The applicable CA, CMA or zone for apartments or row (townhouses) will be selected by the Service Managers from either:
o The CA, CMA or zone encompassing the service area in question, or o The CA, CMA or zone that is closest to the service area in question, as identified by
the service manager.
How to identify boundaries for Zones listed in 2021 Market Rent Index table
• Many of the Rental Market Reports published by the Canada Mortgage and Housing Corporation (CMHC) include descriptions of the boundaries of the surveyed zones. Please see the CMHC website under “rental market surveys/Ontario” to access the free reports.
How to apply the “2021 Market Rent Index table” as populated
• The final figure for the 2021 market rent index is the lesser of the Rent Control Guideline and the percentage change in the local average rent.
• If CMHC data is not available at the zone level, the missing data should be replaced with data from the applicable CA or CMA level.
• If CMHC data is not available at the zone, CA or CMA level, the missing data should be replaced with the average Ontario-wide statistic.
Ministry of Municipal Affairs and Housing October 2020
1
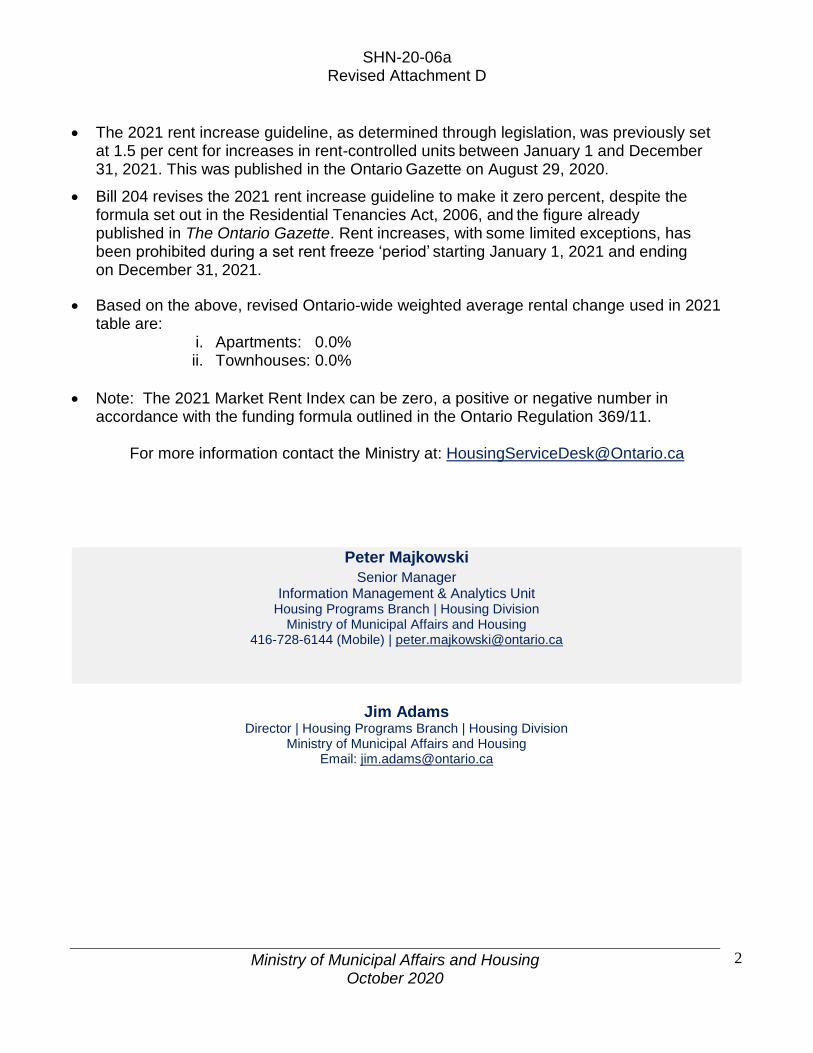
SHN-20-06a Revised Attachment D
• The 2021 rent increase guideline, as determined through legislation, was previously set at 1.5 per cent for increases in rent-controlled units between January 1 and December 31, 2021. This was published in the Ontario Gazette on August 29, 2020.
• Bill 204 revises the 2021 rent increase guideline to make it zero percent, despite the formula set out in the Residential Tenancies Act, 2006, and the figure already published in The Ontario Gazette. Rent increases, with some limited exceptions, has been prohibited during a set rent freeze ‘period’ starting January 1, 2021 and ending on December 31, 2021.
• Based on the above, revised Ontario-wide weighted average rental change used in 2021 table are:
i. Apartments: 0.0% ii. Townhouses: 0.0%
• Note: The 2021 Market Rent Index can be zero, a positive or negative number in accordance with the funding formula outlined in the Ontario Regulation 369/11.
For more information contact the Ministry at: [email protected]
Peter Majkowski
Senior Manager Information Management & Analytics Unit
Housing Programs Branch | Housing Division Ministry of Municipal Affairs and Housing
416-728-6144 (Mobile) | [email protected]
Jim Adams Director | Housing Programs Branch | Housing Division
Ministry of Municipal Affairs and Housing Email: [email protected]
Ministry of Municipal Affairs and Housing October 2020
2