Embed Size (px)
Citation preview

2021 FINRA Industry Snapshot
A REPORT FROM THE FINANCIAL INDUSTRY REGULATORY AUTHORITY
FINRA INDUSTRY SNAPSHOT | 2021ii
Table of Contents
I. FINRA-RegisteredRepresentatives 2Figure 1.1 Total Number of FINRA-Registered Representatives, 2016–2020 2
Figure 1.2 FINRA-Registered Representatives by Firm Size, 2016–2020 3
Table 1.2 FINRA-Registered Representatives by Firm Size, 2016–2020 3
Figure 1.3 Average and Median Number of FINRA-Registered Representatives per Firm, 2016–2020 4
Table 1.3 Average and Median Number of FINRA-Registered Representatives per Firm, 2016–2020 4
Figure 1.4 Registered Individuals by Type of Registration, 2020 5
Table 1.4 Securities Industry Registered Individuals by Type of Registration, 2020 5
Figure 1.5 Securities Industry Registered Individuals by Type of Registration, 2011–2020 6
Figure 1.6 FINRA-Registered Representatives – Leaving/Entering the Industry, 2006–2020 7
Table 1.6 FINRA-Registered Representatives – Leaving/Entering the Industry, 2006–2020 7
Figure 1.7 Firm Size Distribution of FINRA-Registered Representatives Leaving/Entering the Industry, 2006–2020 8
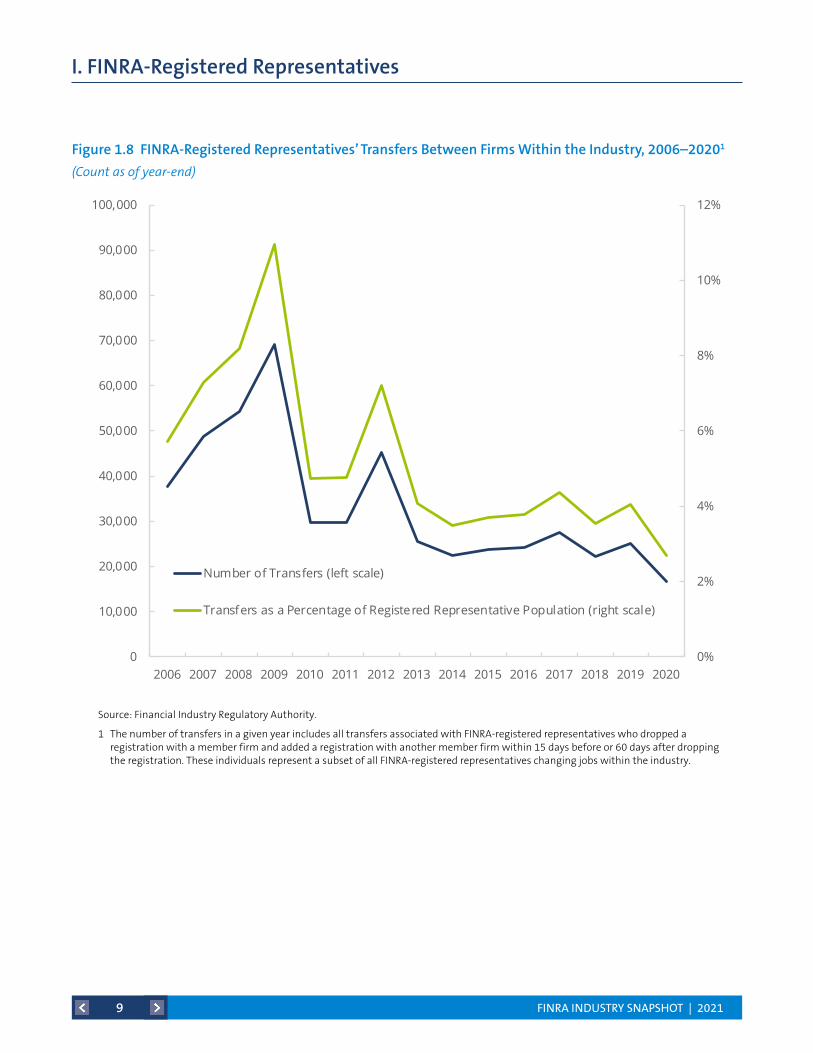
Figure 1.8 FINRA-Registered Representatives’ Transfers Between Firms Within the Industry, 2006–2020 9
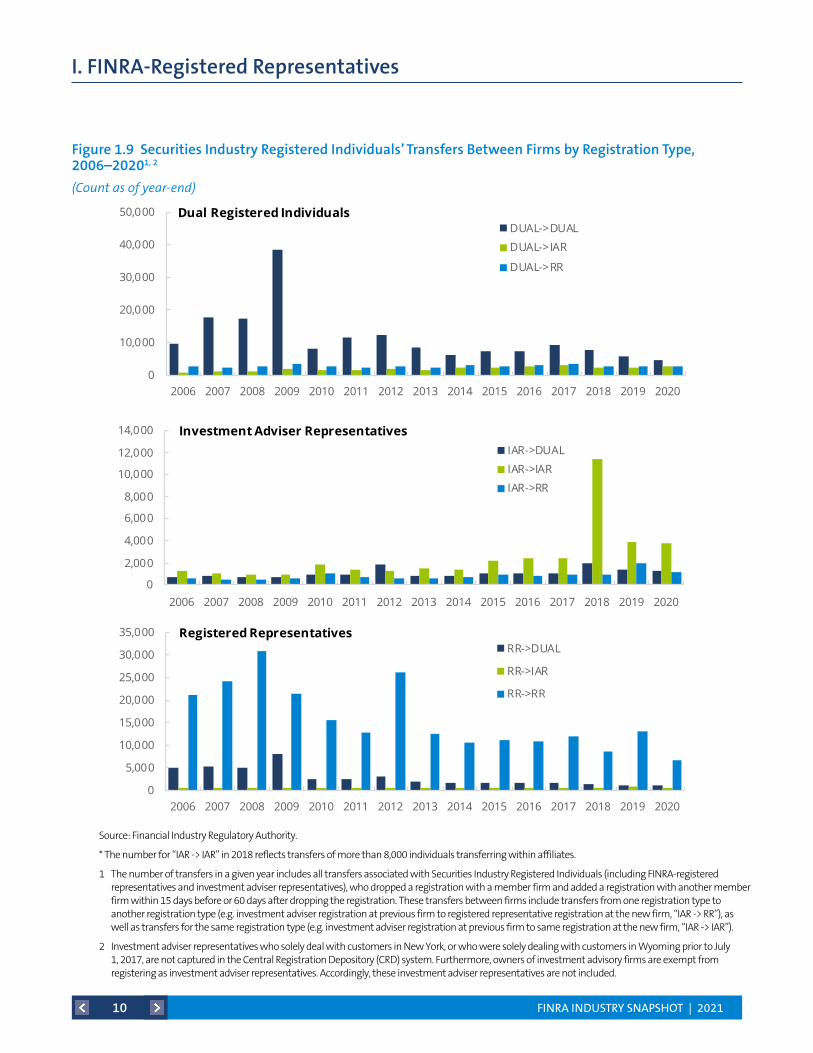
Figure 1.9 Securities Industry Registered Individuals’ Transfers Between Firms by Registration Type, 2006–2020 10
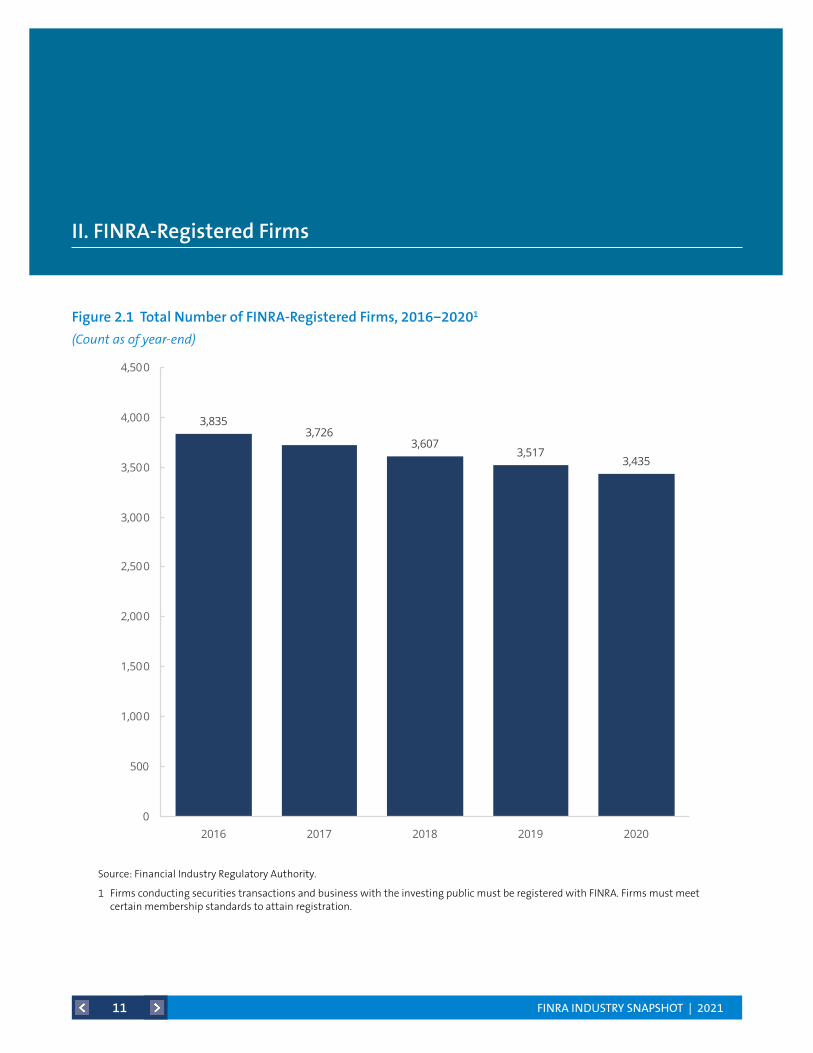
II. FINRA-RegisteredFirms 11Figure 2.1 Total Number of FINRA-Registered Firms, 2016−2020 11
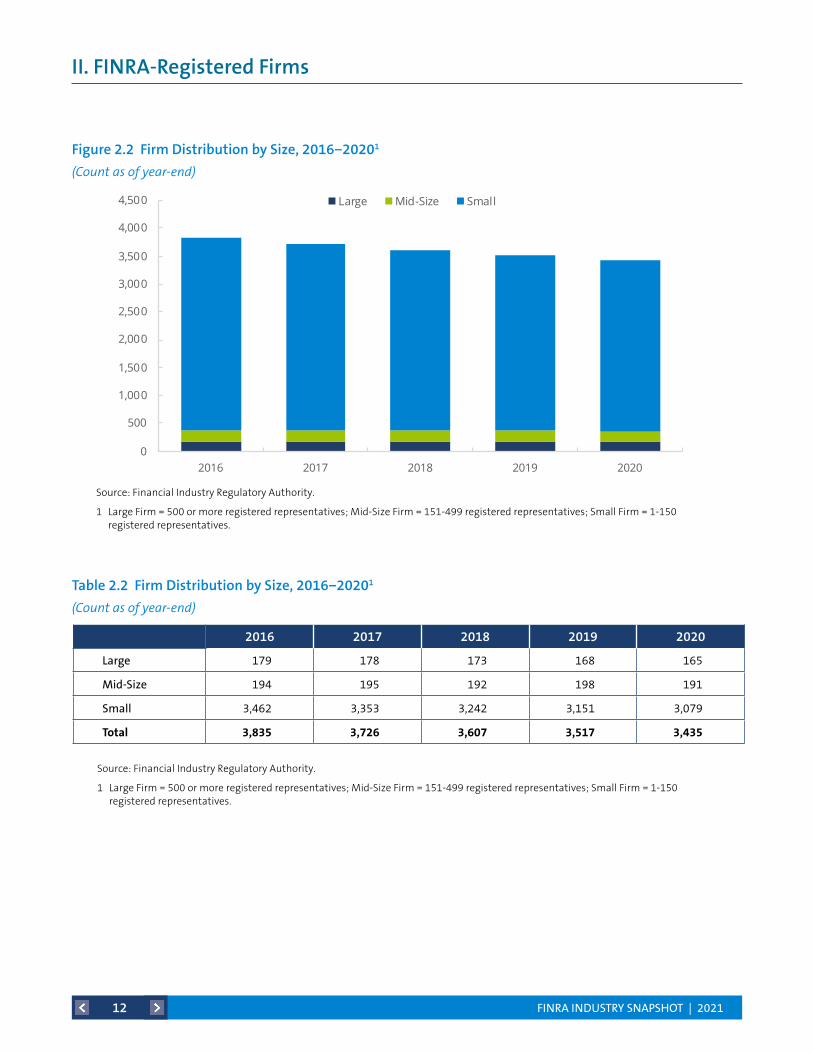
Figure 2.2 Firm Distribution by Size, 2016−2020 12
Table 2.2 Firm Distribution by Size, 2016−2020 12
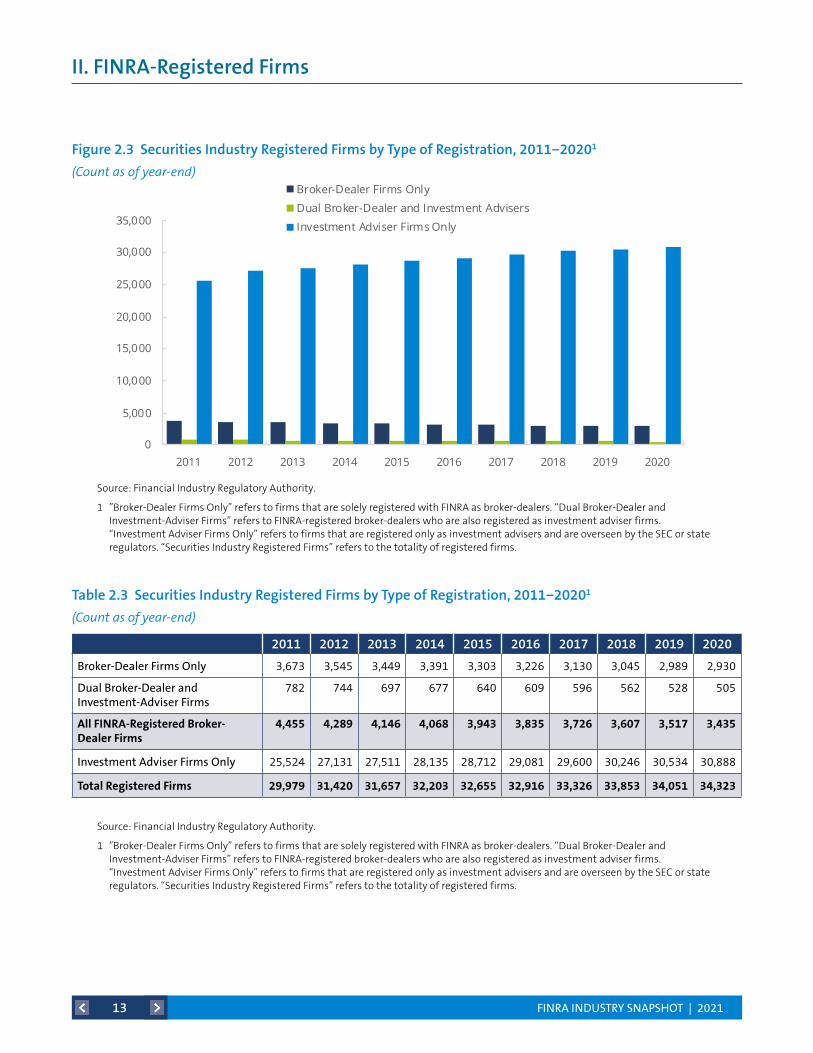
Figure 2.3 Securities Industry Registered Firms by Type of Registration, 2011−2020 13
Table 2.3 Securities Industry Registered Firms by Type of Registration, 2011−2020 13
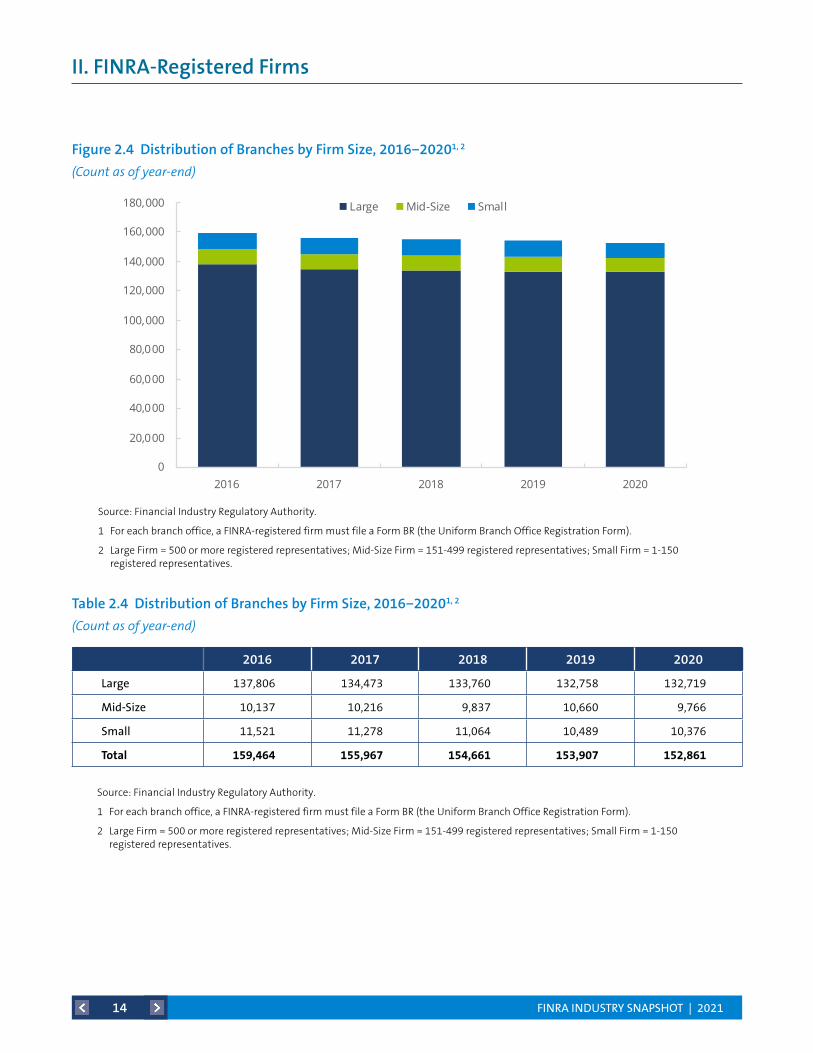
Figure 2.4 Distribution of Branches by Firm Size, 2016−2020 14
Table 2.4 Distribution of Branches by Firm Size, 2016−2020 14
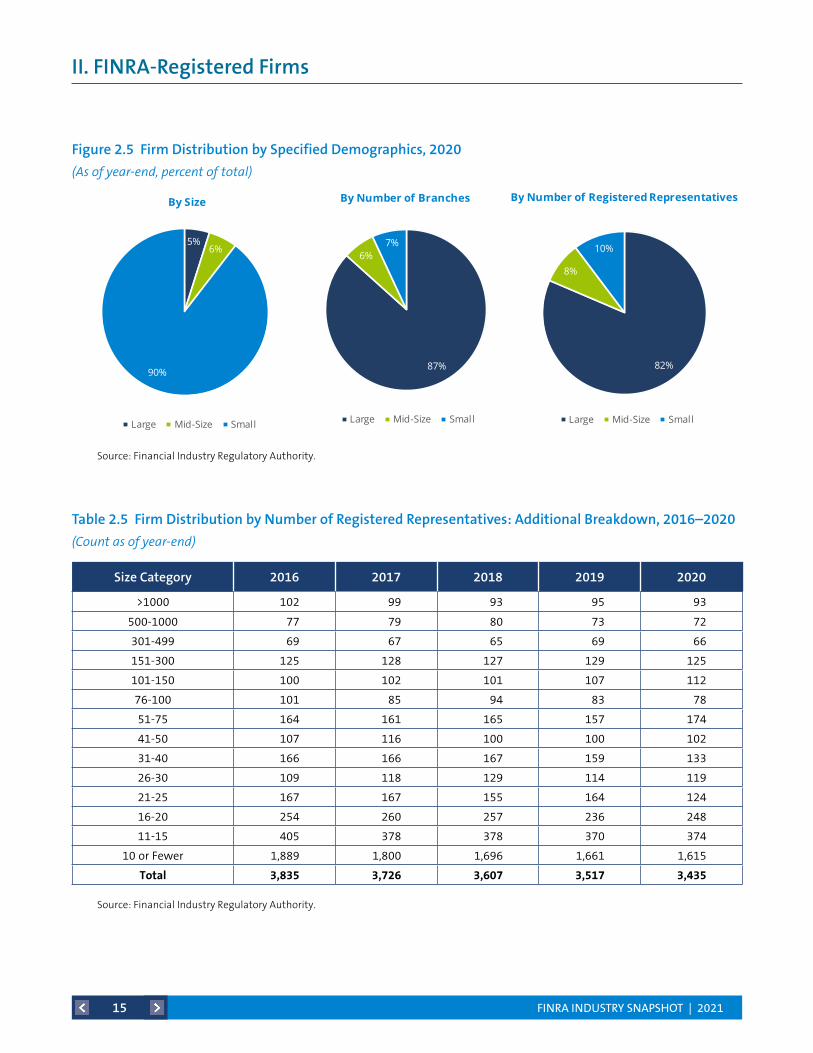
Figure 2.5 Firm Distribution by Specified Demographics, 2020 15
Table 2.5 Firm Distribution by Number of Registered Representatives: Additional Breakdown, 2016–2020 15
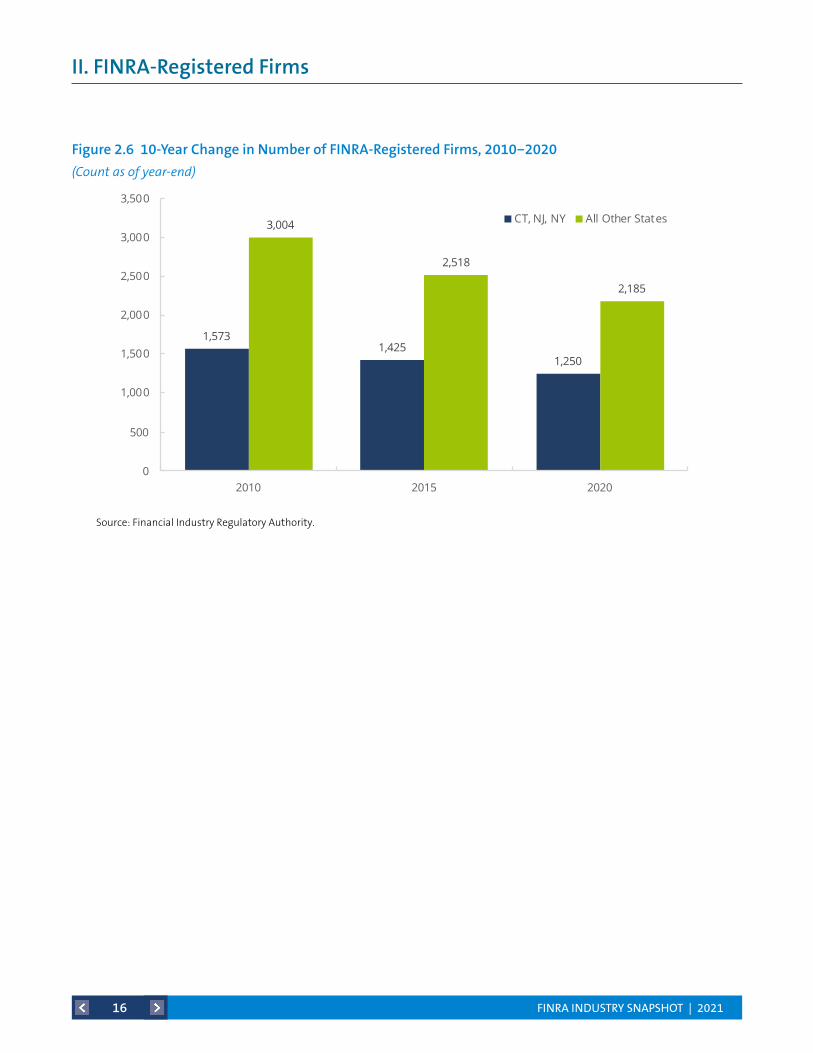
Figure 2.6 10-Year Change in Number of FINRA-Registered Firms, 2010−2020 16
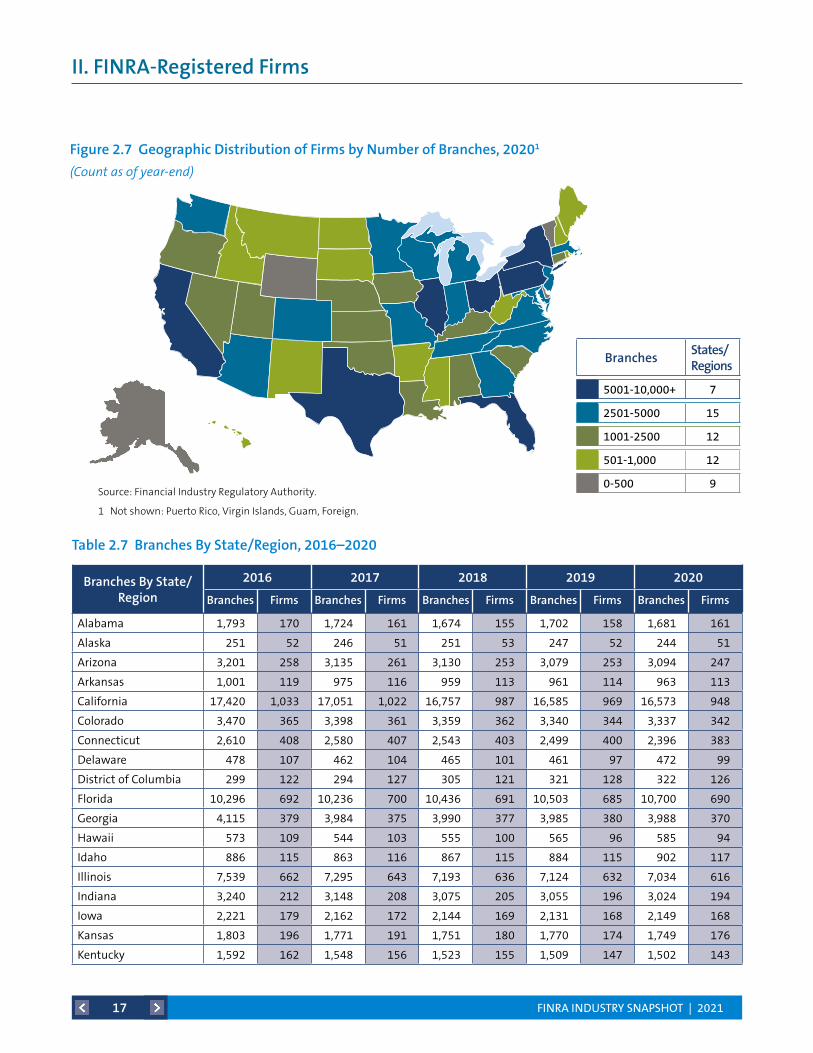
Figure 2.7 Geographic Distribution of Firms by Number of Branches, 2020 17
Table 2.7 Branches By State/Region, 2016–2020 17
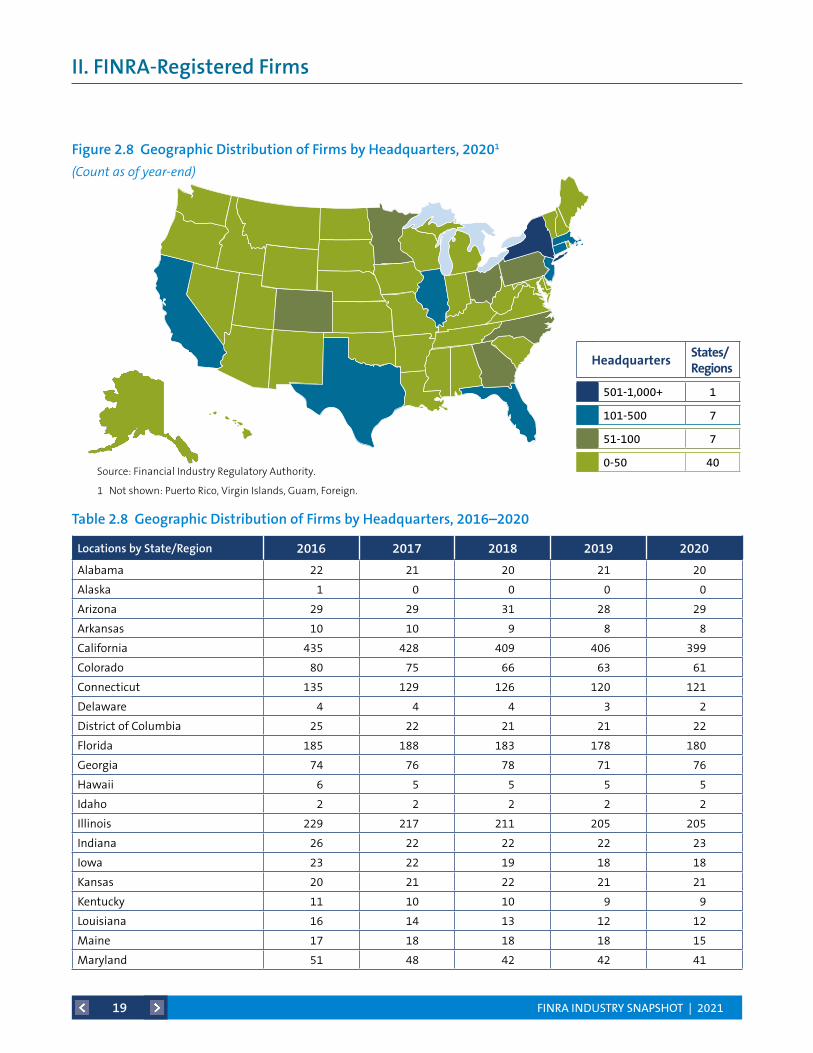
Figure 2.8 Geographic Distribution of Firms by Headquarters, 2020 19
Table 2.8 Geographic Distribution of Firms by Headquarters, 2016–2020 19
Figure 2.9 Urban-Rural Breakdown of FINRA-Registered Firms and Branches by Firm Size—2020 21
Table 2.9 Urban-Rural Breakdown of FINRA-Registered Firms and Branches by Firm Size—2020 22
Figure 2.10 FINRA-Registered Firms – Median Number of Years in Business, 2010–2020 22
Figure 2.11 FINRA-Registered Firms – Revenues and Expenses, 2016−2020 23
Table 2.11 FINRA-Registered Firms – Aggregate Financial Information, 2016–2020 23
Figure 2.12 FINRA-Registered Firms – Leaving/Entering the Industry, 2006–2020 24
Table 2.12 FINRA-Registered Firms – Leaving/Entering the Industry, 2006–2020 24
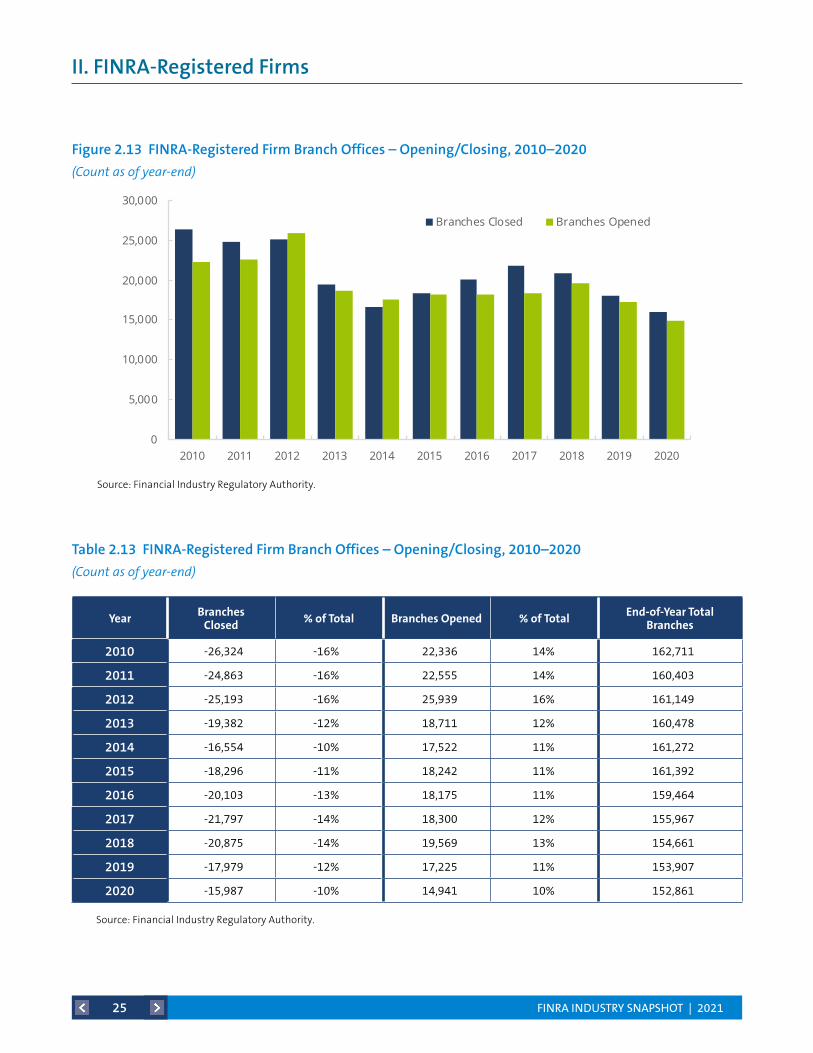
Figure 2.13 FINRA-Registered Firm Branch Offices – Opening/Closing, 2010–2020 25
Table 2.13 FINRA-Registered Firm Branch Offices – Opening/Closing, 2010–2020 25
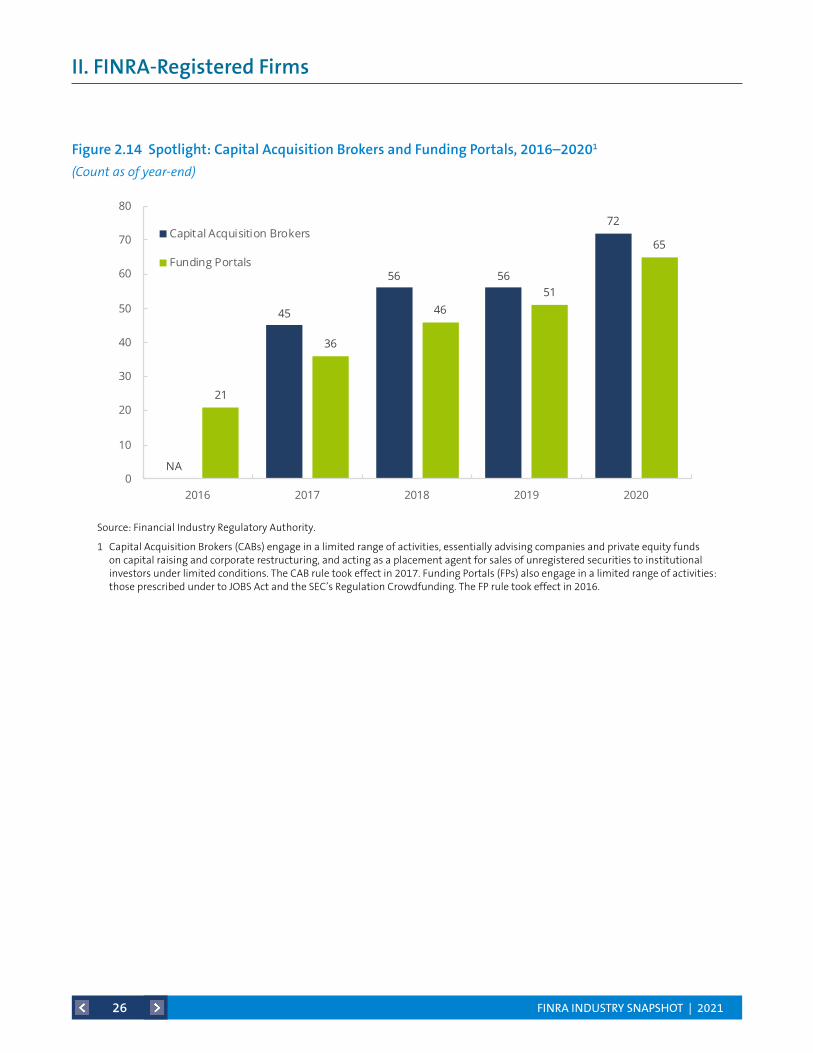
Figure 2.14 Spotlight: Capital Acquisition Brokers and Funding Portals, 2016–2020 26
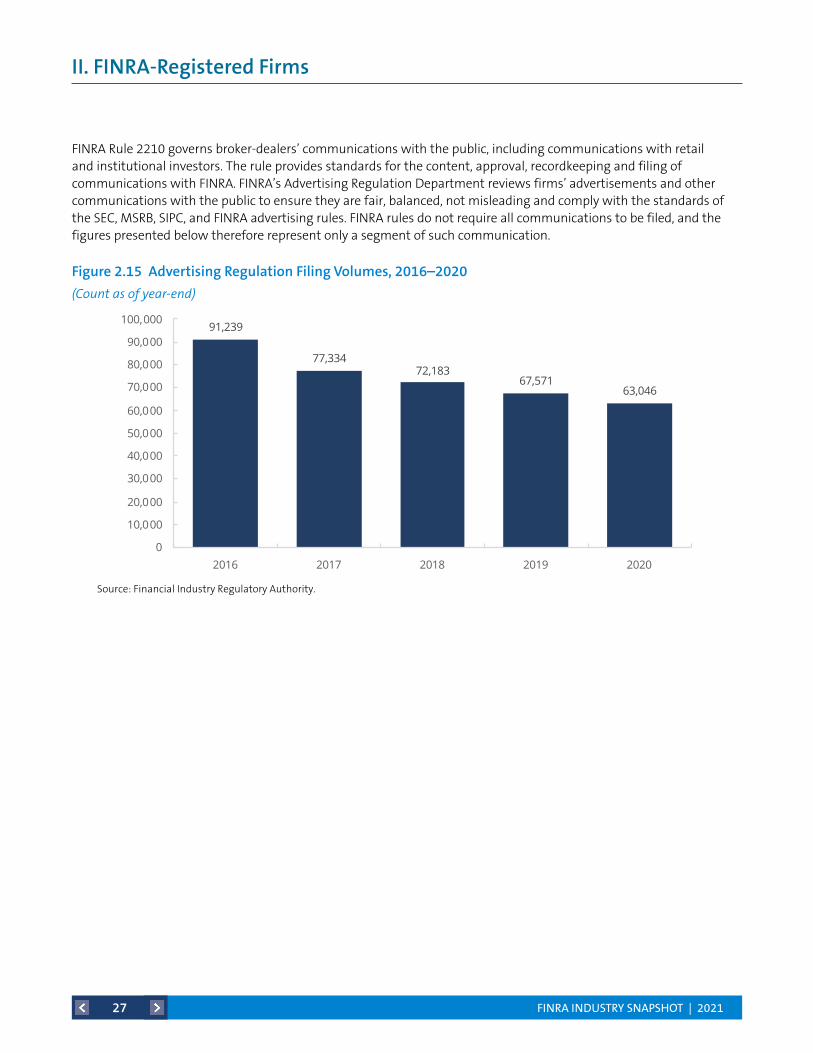
Figure 2.15 Advertising Regulation Filing Volumes, 2016–2020 27
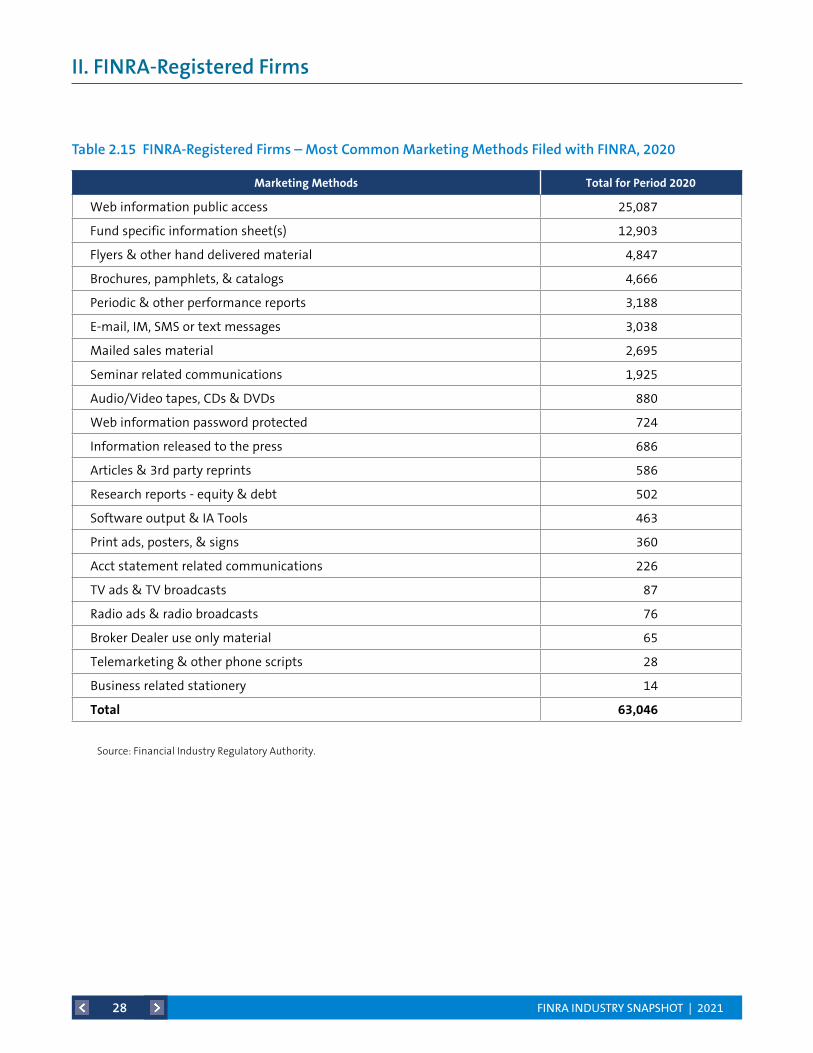
Table 2.15 FINRA-Registered Firms – Most Common Marketing Methods Filed with FINRA, 2020 28
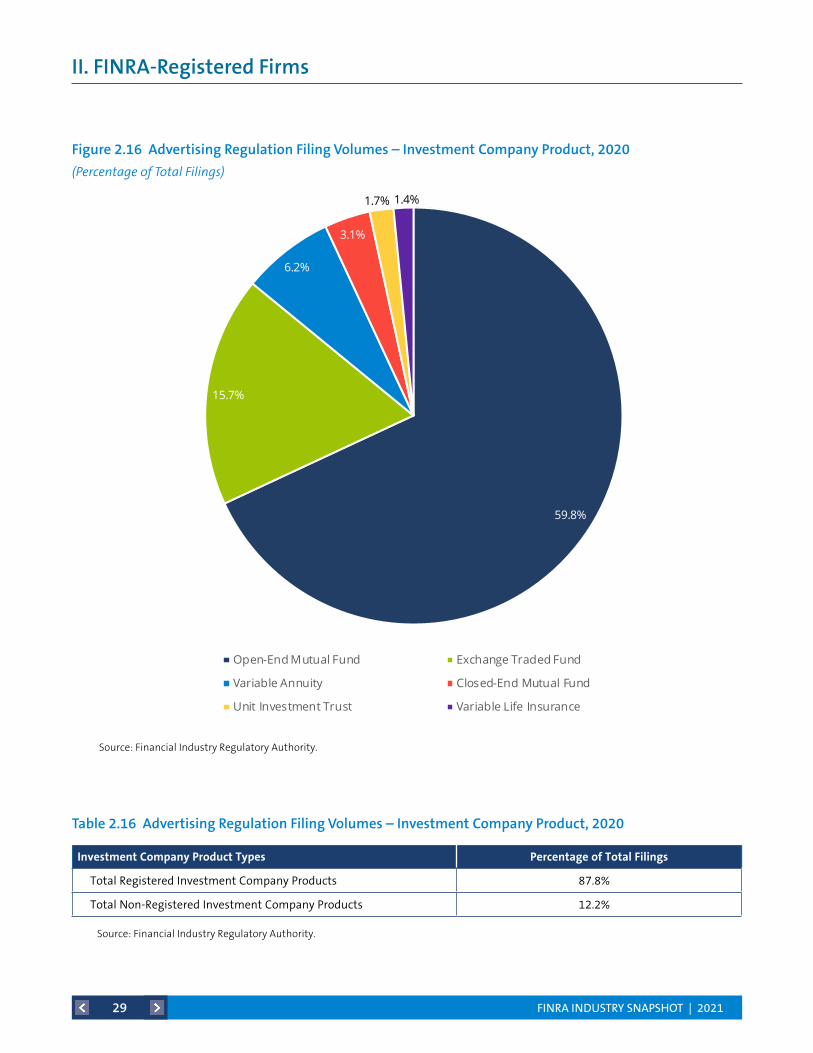
Figure 2.16 Advertising Regulation Filing Volumes – Investment Company Product, 2020 29
Table 2.16 Advertising Regulation Filing Volumes – Investment Company Product, 2020 29

FINRA INDUSTRY SNAPSHOT | 2021iii
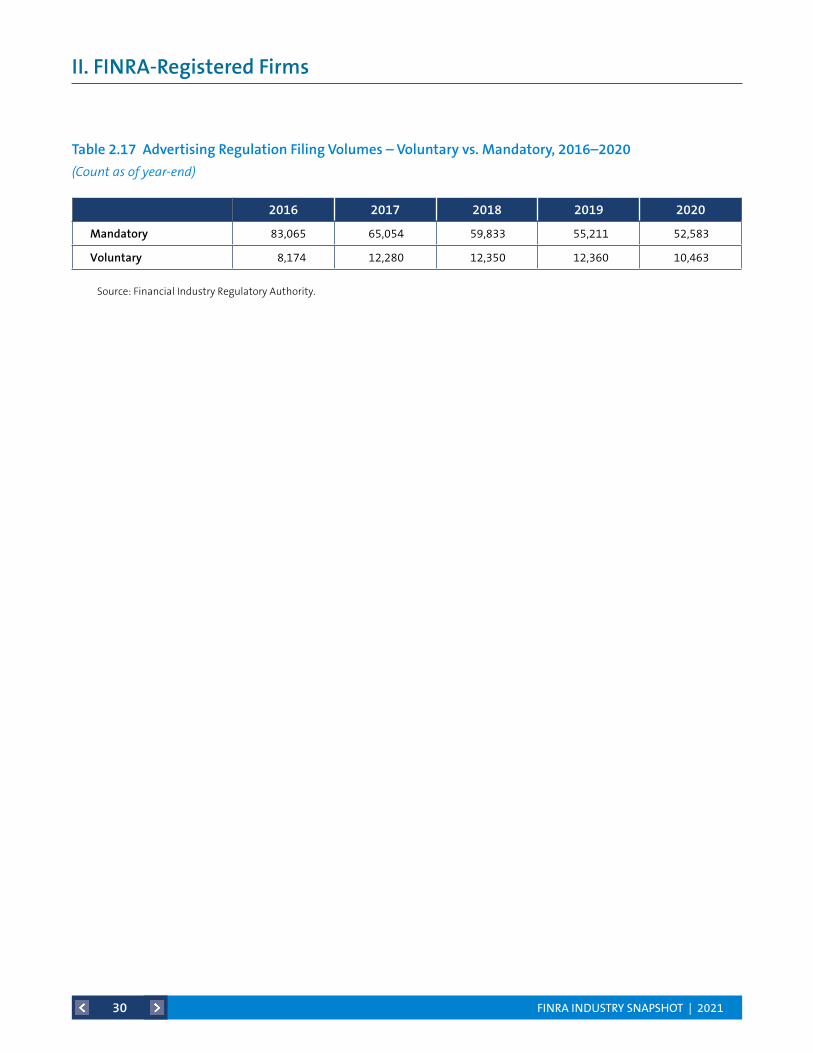
Table 2.17 Advertising Regulation Filing Volumes – Voluntary vs. Mandatory, 2016–2020 30
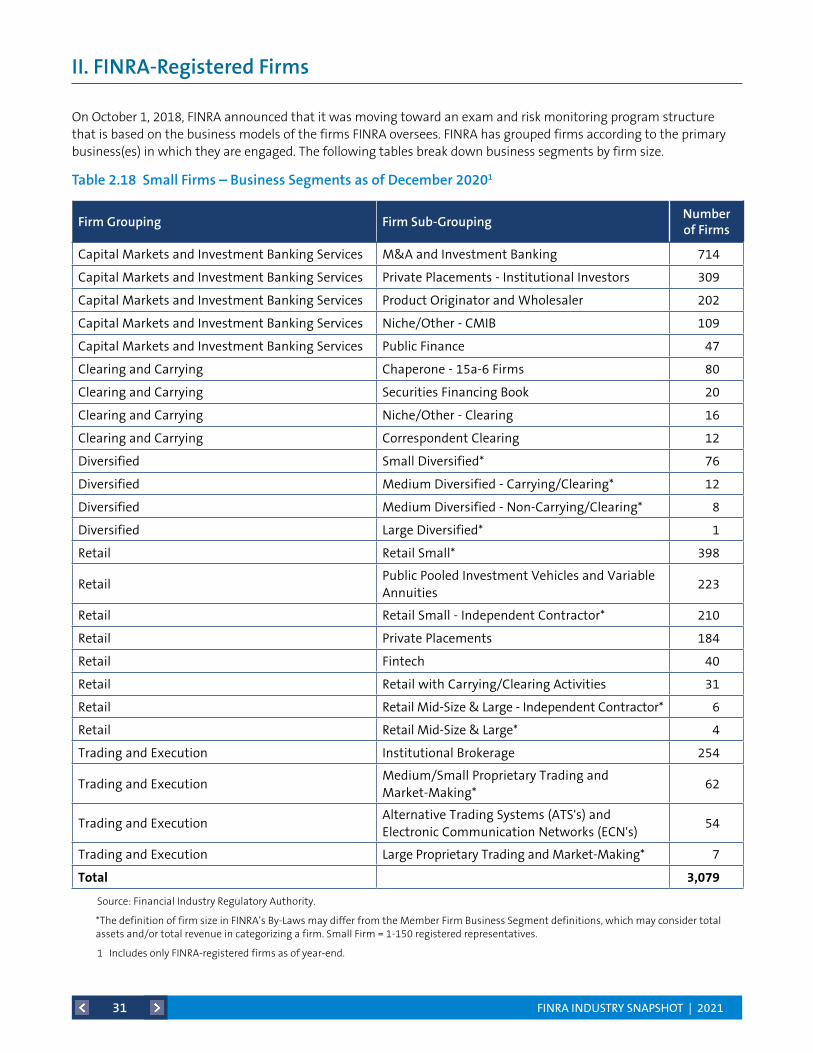
Table 2.18 Small Firms – Business Segments as of December 2020 31
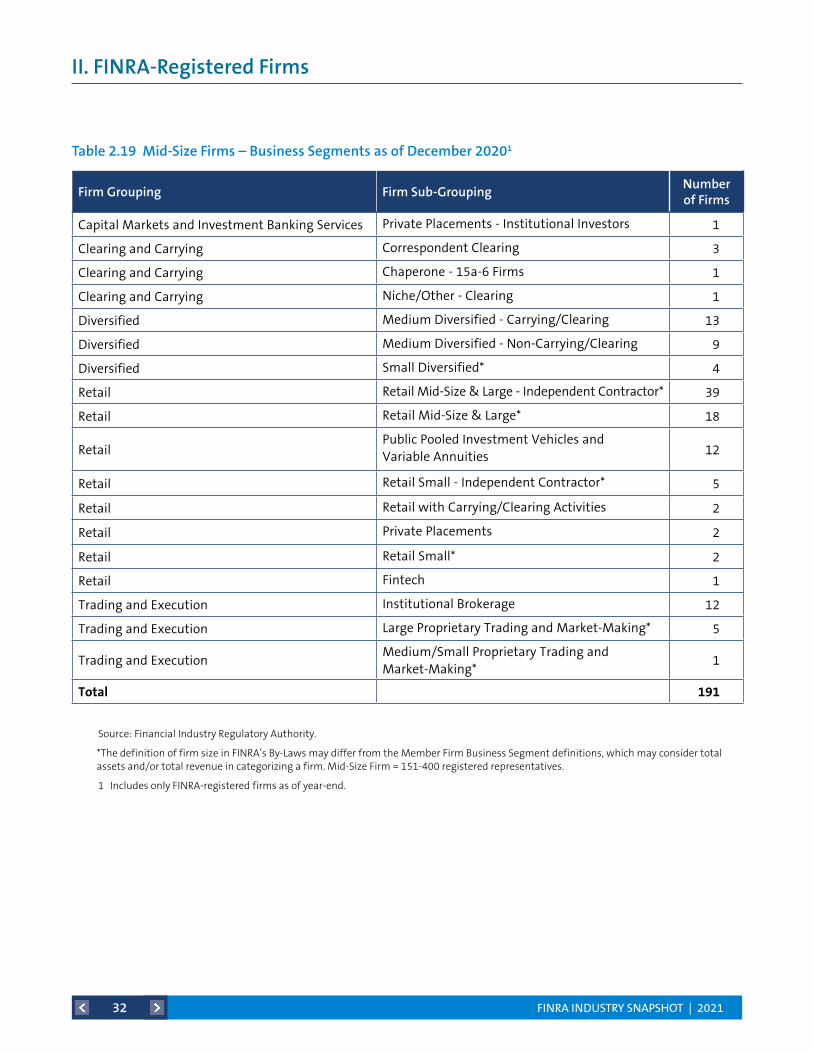
Table 2.19 Mid-Size Firms – Business Segments as of December 2020 32
Table 2.20 Large Firms – Business Segments as of December 2020 33
Table 2.21 Total Number of Unique Corporate Financing Filings, 2016–2020 33
III. MarketActivity 34Table 3.1 National Market Systems (NMS) Stocks Trading Summary, 2016–2020 34
Table 3.2 National Market Systems (NMS) Stocks Trading by Venue Type, 2017–2020 34
Figure 3.1 Monthly National Market Systems (NMS) Stocks Trading by Venue Type 35
Figure 3.2 Monthly National Market Systems (NMS) Stocks Trading During Non-Exchange Hours 36
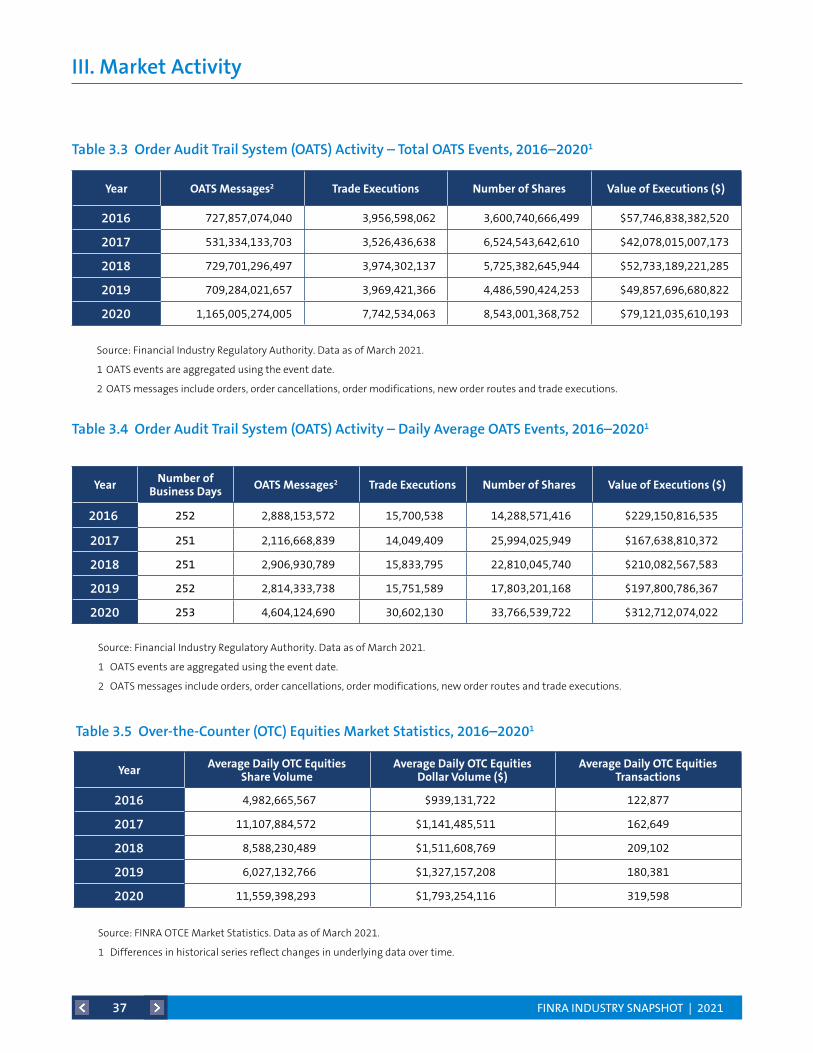
Table 3.3 Order Audit Trail System (OATS) Activity – Total OATS Events, 2016–2020 37
Table 3.4 Order Audit Trail System (OATS) Activity – Daily Average OATS Events, 2016–2020 37
Table 3.5 Over-the-Counter (OTC) Equities Market Statistics, 2016–2020 37
Figure 3.3 Monthly OTC Equities Trading by Venue Type 38
Table 3.6 TRACE Reported Fixed Income Activity by Product Type and Venue Type, 2017–2020 39
Figure 3.4 Monthly TRACE Reported Fixed Income Activity By Product Type and Venue Type 40
Figure 3.5 Monthly U.S. Treasuries Dollar Volumes by Participant and Product Type, 2020 41
Figure 3.6 U.S. Treasuries Dollar Volumes by Product Type and Participant, 2020 42
Table of Contents (continued)

FINRA INDUSTRY SNAPSHOT | 20211
FINRA regulates a critical part of the securities industry – brokerage firms doing business with the public
in the United States. In an effort to increase public awareness and understanding about the broad range
of FINRA-registered firms and individuals, FINRA shares an annual snapshot of some of the data collected
in the course of its work.
The 2021 FINRA Industry Snapshot provides a high-level overview of the industry, ranging from the
number of FINRA-registered individuals to the overall revenues of firms, and from trading activity to
how firms market their products and services. All of the data are reported in aggregate to respect the
confidentiality of regulatory information.
Note: FINRA regularly updates historical data series due to data revisions by reporting firms.
2021 FINRA Industry Snapshot – Introduction
FINRA INDUSTRY SNAPSHOT | 20212
I. FINRA-Registered Representatives
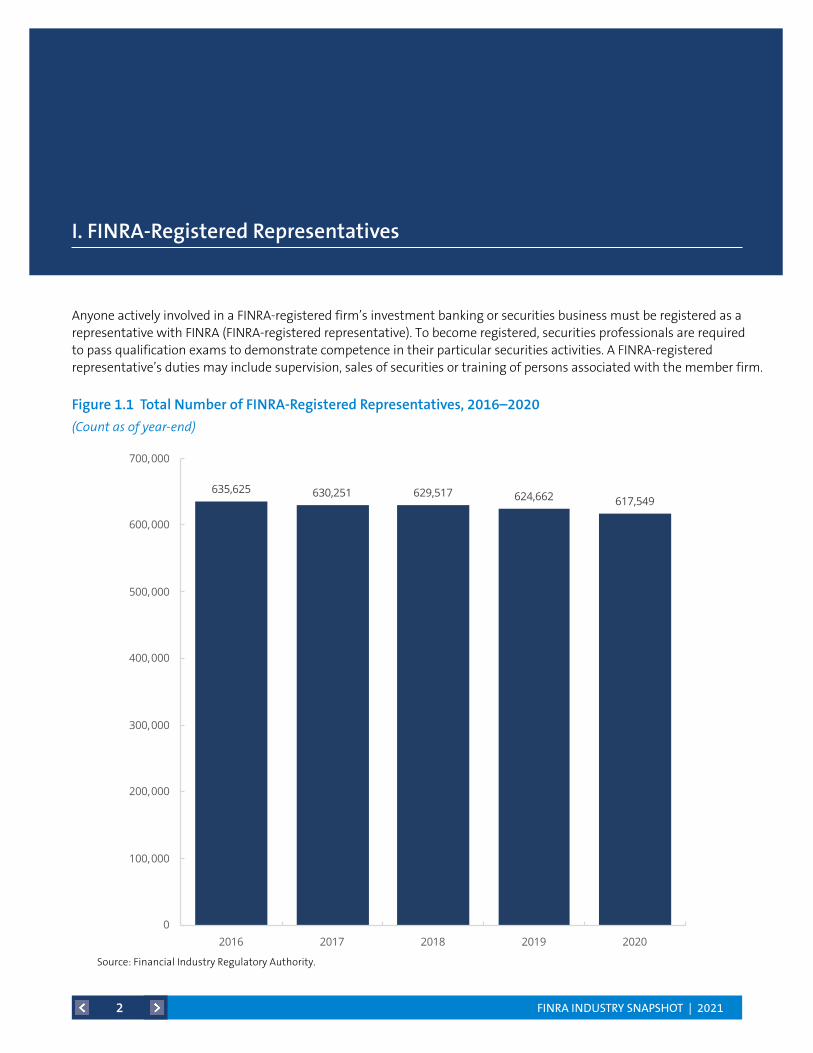
Figure 1.1 Total Number of FINRA-Registered Representatives, 2016–2020
(Count as of year-end)
Anyone actively involved in a FINRA-registered firm’s investment banking or securities business must be registered as a representative with FINRA (FINRA-registered representative). To become registered, securities professionals are required to pass qualification exams to demonstrate competence in their particular securities activities. A FINRA-registered representative’s duties may include supervision, sales of securities or training of persons associated with the member firm.
635,625 630,251 629,517 624,662 617,549
0
100,000
200,000
300,000
400,000
500,000
600,000
700,000
2016 2017 2018 2019 2020
Source: Financial Industry Regulatory Authority.
Total Number of FINRA-Registered Representatives, 2016–2020(Counts as of year-end)
Source: Financial Industry Regulatory Authority.
FINRA INDUSTRY SNAPSHOT | 20213
I. FINRA-Registered Representatives
2016 2017 2018 2019 2020
Firm Size Total % Total % Total % Total % Total %
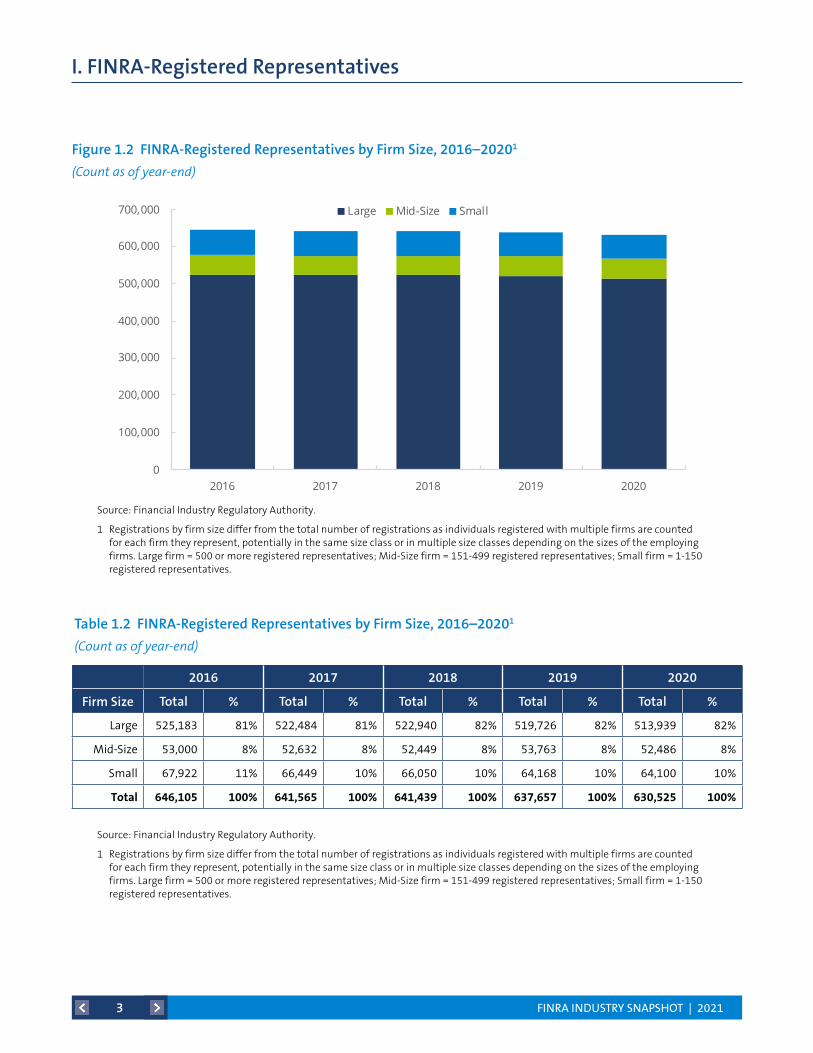
Large 525,183 81% 522,484 81% 522,940 82% 519,726 82% 513,939 82%
Mid-Size 53,000 8% 52,632 8% 52,449 8% 53,763 8% 52,486 8%
Small 67,922 11% 66,449 10% 66,050 10% 64,168 10% 64,100 10%
Total 646,105 100% 641,565 100% 641,439 100% 637,657 100% 630,525 100%
Table 1.2 FINRA-Registered Representatives by Firm Size, 2016–20201
(Count as of year-end)
Figure 1.2 FINRA-Registered Representatives by Firm Size, 2016–20201
(Count as of year-end)
Source: Financial Industry Regulatory Authority.
1 Registrations by firm size differ from the total number of registrations as individuals registered with multiple firms are counted for each firm they represent, potentially in the same size class or in multiple size classes depending on the sizes of the employing firms. Large firm = 500 or more registered representatives; Mid-Size firm = 151-499 registered representatives; Small firm = 1-150 registered representatives.
0
100,000
200,000
300,000
400,000
500,000
600,000
700,000
2016 2017 2018 2019 2020
Large Mid-Size Small
Source: Financial Industry Regulatory Authority.
1Registrations by firm size differ from the total number of registrations as individuals registered with multiple firms are counted for each firm they represent, potentially in the same size class or in multiple size classes depending on the sizes of the employing firms. Large firm = 500 or more registered representatives; Mid-Size firm = 151-499 registered representatives; Small firm = 1-150 registered representatives.
FINRA-Registered Representatives by Firm Size, 2016–20201
(Counts as of year-end)
FINRA INDUSTRY SNAPSHOT | 20214
I. FINRA-Registered Representatives
2016 2017 2018 2019 2020
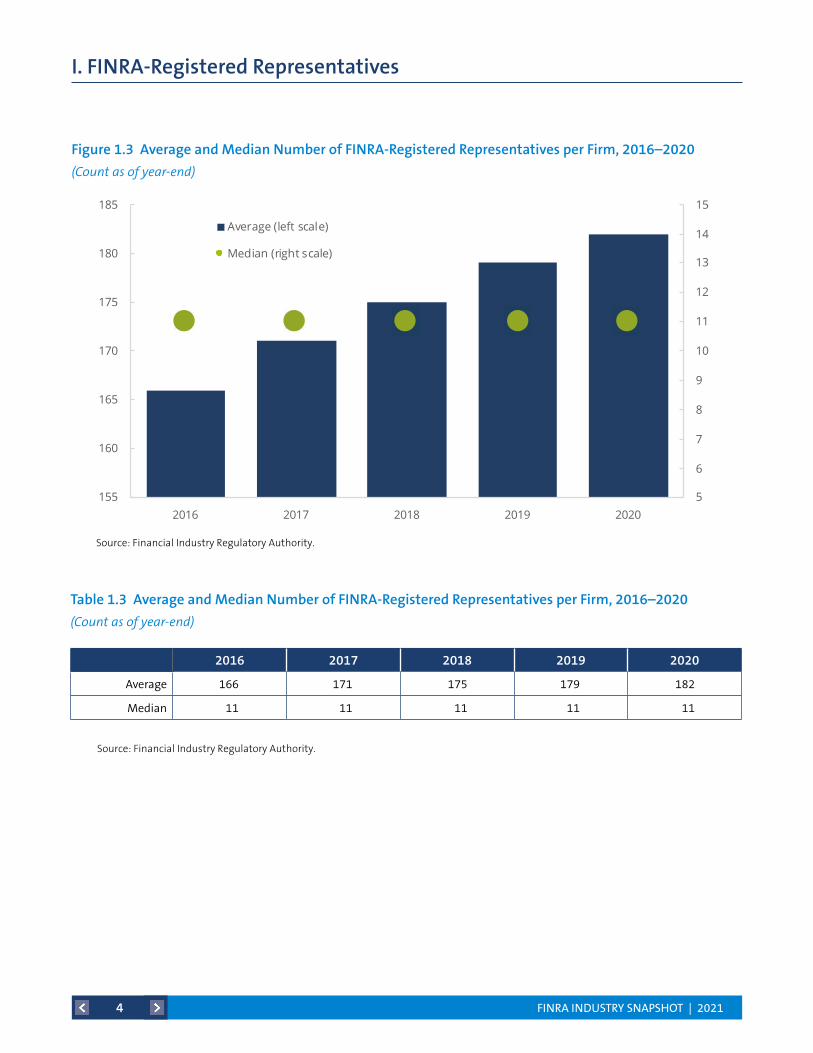
Average 166 171 175 179 182
Median 11 11 11 11 11
Table 1.3 Average and Median Number of FINRA-Registered Representatives per Firm, 2016–2020
(Count as of year-end)
Figure 1.3 Average and Median Number of FINRA-Registered Representatives per Firm, 2016–2020
(Count as of year-end)
Source: Financial Industry Regulatory Authority.
Source: Financial Industry Regulatory Authority.
2015.5 2016 2016.5 2017 2017.5 2018 2018.5 2019 2019.5 2020 2020.5
5
6
7
8
9
10
11
12
13
14
15
155
160
165
170
175
180
185
2016 2017 2018 2019 2020
Average (left scale)
Median (right scale)
Average and Median Number of FINRA-Registered Representatives per Firm, 2016–2020(Counts as of year-end)
Source: Financial Industry Regulatory Authority.
FINRA INDUSTRY SNAPSHOT | 20215
I. FINRA-Registered Representatives
51%
49%
Broker-Dealer Only
Dual Representatives
46%
44%
10%
Broker-Dealer Only
Dual Representatives
Investment Adviser Representative Only
Source: Financial Industry Regulatory Authority.
1Investment Adviser Representatives who solely deal with customers in New York, or who were solely dealing with customers in Wyoming prior to July 1, 2017, are not captured in the Central Registration Depository (CRD) system. Furthermore, owners of investment advisory firms are exempt from registering as Investment Adviser Representatives. Accordingly, these Investment Adviser Representatives are not included in the table.
2"Broker Dealer Representatives Only" refers to FINRA-registered representatives. "Dual Representatives" refers to FINRA-registered representatives who are also registered as investment adviser representatives. "Investment Adviser Representatives Only" refers to individuals who are registered only as investment adviser representatives and are overseen by the SEC or state regulators. Individuals are counted only once regardless of how many firms they represent.
FINRA-Registered Individuals by Type of Registration—2020
Securities Industry Registered Individuals by Type of Registration—2020
Total Number of Individuals
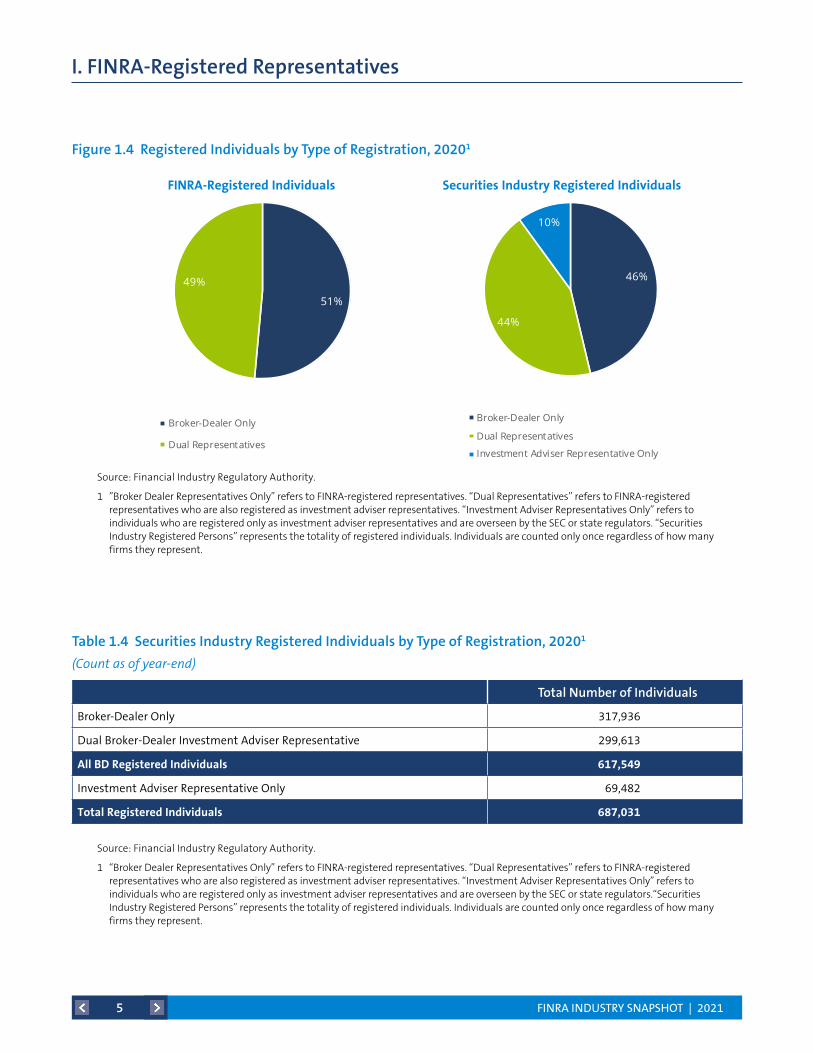
Broker-Dealer Only 317,936
Dual Broker-Dealer Investment Adviser Representative 299,613
AllBDRegisteredIndividuals 617,549
Investment Adviser Representative Only 69,482
TotalRegisteredIndividuals 687,031
Table 1.4 Securities Industry Registered Individuals by Type of Registration, 20201
(Count as of year-end)
Figure 1.4 Registered Individuals by Type of Registration, 20201
Source: Financial Industry Regulatory Authority.
1 “Broker Dealer Representatives Only” refers to FINRA-registered representatives. “Dual Representatives” refers to FINRA-registered representatives who are also registered as investment adviser representatives. “Investment Adviser Representatives Only” refers to individuals who are registered only as investment adviser representatives and are overseen by the SEC or state regulators.“Securities Industry Registered Persons” represents the totality of registered individuals. Individuals are counted only once regardless of how many firms they represent.
Source: Financial Industry Regulatory Authority.
1 ”Broker Dealer Representatives Only” refers to FINRA-registered representatives. “Dual Representatives” refers to FINRA-registered representatives who are also registered as investment adviser representatives. “Investment Adviser Representatives Only” refers to individuals who are registered only as investment adviser representatives and are overseen by the SEC or state regulators. “Securities Industry Registered Persons” represents the totality of registered individuals. Individuals are counted only once regardless of how many firms they represent.
51%
49%
Broker-Dealer Only
Dual Representatives
46%
44%
10%
Broker-Dealer Only
Dual Representatives
Investment Adviser Representative Only
Source: Financial Industry Regulatory Authority.
1Investment Adviser Representatives who solely deal with customers in New York, or who were solely dealing with customers in Wyoming prior to July 1, 2017, are not captured in the Central Registration Depository (CRD) system. Furthermore, owners of investment advisory firms are exempt from registering as Investment Adviser Representatives. Accordingly, these Investment Adviser Representatives are not included in the table.
2"Broker Dealer Representatives Only" refers to FINRA-registered representatives. "Dual Representatives" refers to FINRA-registered representatives who are also registered as investment adviser representatives. "Investment Adviser Representatives Only" refers to individuals who are registered only as investment adviser representatives and are overseen by the SEC or state regulators. Individuals are counted only once regardless of how many firms they represent.
FINRA-Registered Individuals by Type of Registration—2020
Securities Industry Registered Individuals by Type of Registration—2020
FINRA-RegisteredIndividuals SecuritiesIndustryRegisteredIndividuals
FINRA INDUSTRY SNAPSHOT | 20216
I. FINRA-Registered Representatives
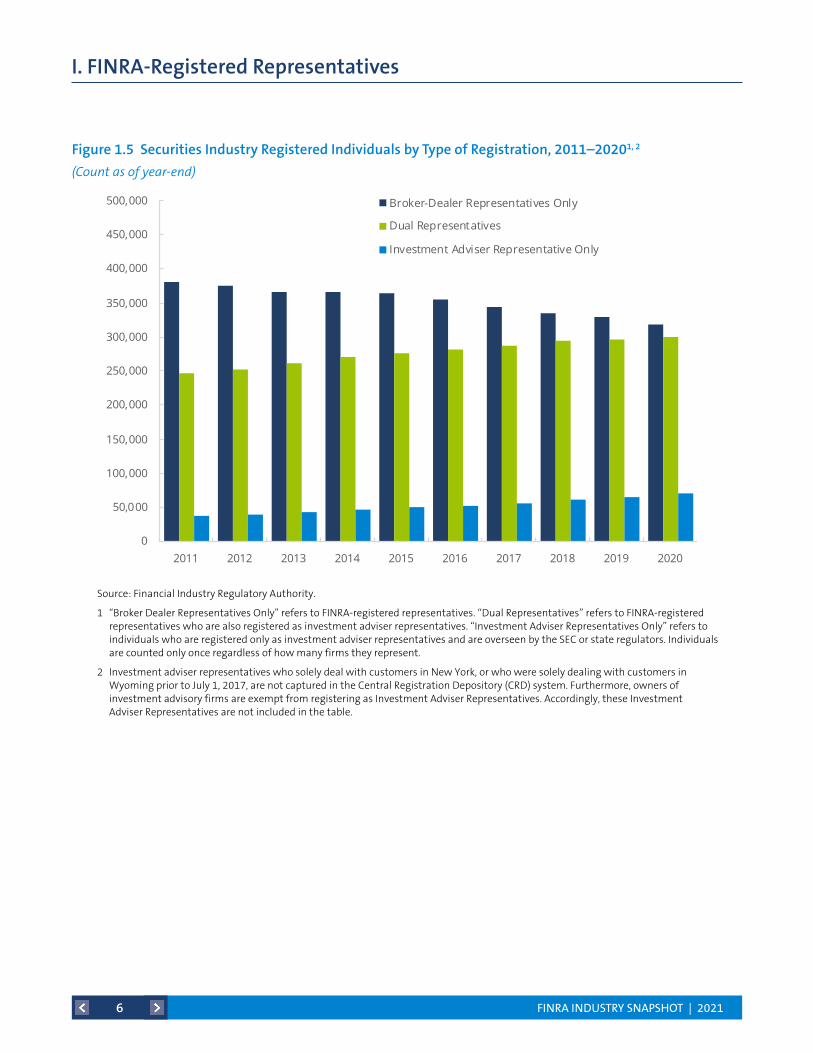
Figure 1.5 Securities Industry Registered Individuals by Type of Registration, 2011–20201, 2
(Count as of year-end)
Source: Financial Industry Regulatory Authority.
1 “Broker Dealer Representatives Only” refers to FINRA-registered representatives. “Dual Representatives” refers to FINRA-registered representatives who are also registered as investment adviser representatives. “Investment Adviser Representatives Only” refers to individuals who are registered only as investment adviser representatives and are overseen by the SEC or state regulators. Individuals are counted only once regardless of how many firms they represent.
2 Investment adviser representatives who solely deal with customers in New York, or who were solely dealing with customers in Wyoming prior to July 1, 2017, are not captured in the Central Registration Depository (CRD) system. Furthermore, owners of investment advisory firms are exempt from registering as Investment Adviser Representatives. Accordingly, these Investment Adviser Representatives are not included in the table.
0
50,000
100,000
150,000
200,000
250,000
300,000
350,000
400,000
450,000
500,000
2011 2012 2013 2014 2015 2016 2017 2018 2019 2020
Broker-Dealer Representatives Only
Dual Representatives
Investment Adviser Representative Only
Securities Industry Registered Individuals by Type of Registration, 2011–20201,2
(Counts as of year-end)
Source: Financial Industry Regulatory Authority.
1"Broker Dealer Representatives Only" refers to FINRA-registered representatives. "Dual Representatives" refers to FINRA-registered representatives who are also registered as investment adviser representatives. "Investment Adviser Representatives Only" refers to individuals who are registered only as investment adviser representatives and are overseen by the SEC or state regulators. Individuals are counted only once regardless of how many firms they represent.
2Investment Adviser Representatives who solely deal with customers in New York, or who were solely dealing with customers in Wyoming prior to July 1, 2017, are not captured in the Central Registration Depository (CRD) system. Furthermore, owners of investment advisory firms are exempt from registering as Investment Adviser Representatives. Accordingly, these Investment Adviser Representatives are not included in the table.
FINRA INDUSTRY SNAPSHOT | 20217
I. FINRA-Registered Representatives
Year IndividualsLeaving %ofTotal IndividualsEntering %ofTotal End-of-YearTotalRegisteredRepresentatives
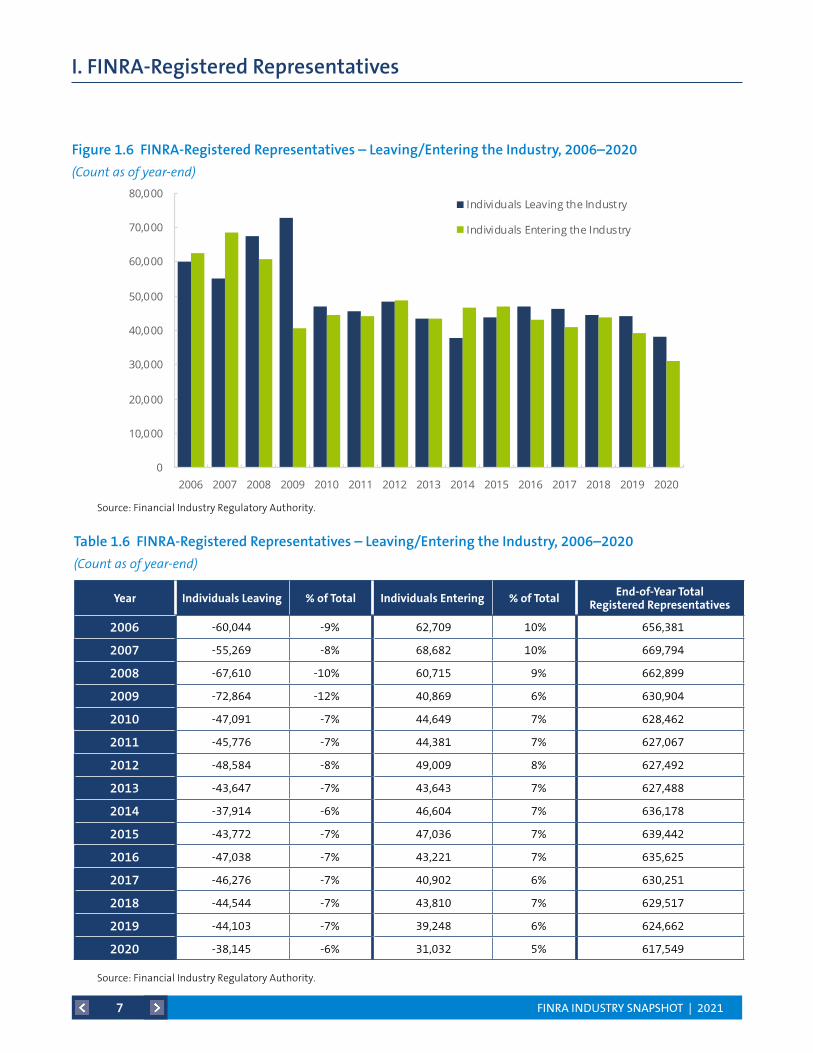
2006 -60,044 -9% 62,709 10% 656,381
2007 -55,269 -8% 68,682 10% 669,794
2008 -67,610 -10% 60,715 9% 662,899
2009 -72,864 -12% 40,869 6% 630,904
2010 -47,091 -7% 44,649 7% 628,462
2011 -45,776 -7% 44,381 7% 627,067
2012 -48,584 -8% 49,009 8% 627,492
2013 -43,647 -7% 43,643 7% 627,488
2014 -37,914 -6% 46,604 7% 636,178
2015 -43,772 -7% 47,036 7% 639,442
2016 -47,038 -7% 43,221 7% 635,625
2017 -46,276 -7% 40,902 6% 630,251
2018 -44,544 -7% 43,810 7% 629,517
2019 -44,103 -7% 39,248 6% 624,662
2020 -38,145 -6% 31,032 5% 617,549
Table 1.6 FINRA-Registered Representatives – Leaving/Entering the Industry, 2006–2020
(Count as of year-end)
Figure 1.6 FINRA-Registered Representatives – Leaving/Entering the Industry, 2006–2020
(Count as of year-end)
Source: Financial Industry Regulatory Authority.
FINRA-Registered Representatives – Leaving/Entering the Industry, 2006–2020(Counts as of year-end)
Source: Financial Industry Regulatory Authority.
0
10,000
20,000
30,000
40,000
50,000
60,000
70,000
80,000
2006 2007 2008 2009 2010 2011 2012 2013 2014 2015 2016 2017 2018 2019 2020
Individuals Leaving the Industry
Individuals Entering the Industry
Source: Financial Industry Regulatory Authority.
FINRA-Registered Representatives – Leaving/Entering the Industry, 2006–2020(Counts as of year-end)
Source: Financial Industry Regulatory Authority.
0
10,000
20,000
30,000
40,000
50,000
60,000
70,000
80,000
2006 2007 2008 2009 2010 2011 2012 2013 2014 2015 2016 2017 2018 2019 2020
Individuals Leaving the Industry
Individuals Entering the Industry
FINRA INDUSTRY SNAPSHOT | 20218
I. FINRA-Registered Representatives
0%
10%
20%
30%
40%
50%
60%
70%
80%
90%
2006 2007 2008 2009 2010 2011 2012 2013 2014 2015 2016 2017 2018 2019 2020
Individuals Entering the Industry
Source: Financial Industry Regulatory Authority.
1Individuals entering and exiting by firm size may differ from the total number of individuals entering and exiting the industry as individuals registered with multiple firms are counted for each firm they represent, potentially in the same sizeclass or in multiple size classes depending on the sizes of the employing firms. Large Firm = 500 or more registered representatives; Mid-Size Firm = 151-499 registered representatives; Small Firm = 1-150 registered representatives.
2An individual is considered to have left the industry when the individual has no open registration with any FINRA approved member firm from the date of their last registration through the end of the next calendar year. Values for 2020 are estimates given that a full year's worth of 2021 data is required to compute individuals leaving the industry.
Firm Size Distribution of FINRA-Registered Representatives Leaving/Entering the Industry, 2006–20201
(Percentage of Total)
0%
10%
20%
30%
40%
50%
60%
70%
80%
90%
2006 2007 2008 2009 2010 2011 2012 2013 2014 2015 2016 2017 2018 2019 2020Est.
Individuals Leaving the Industry2
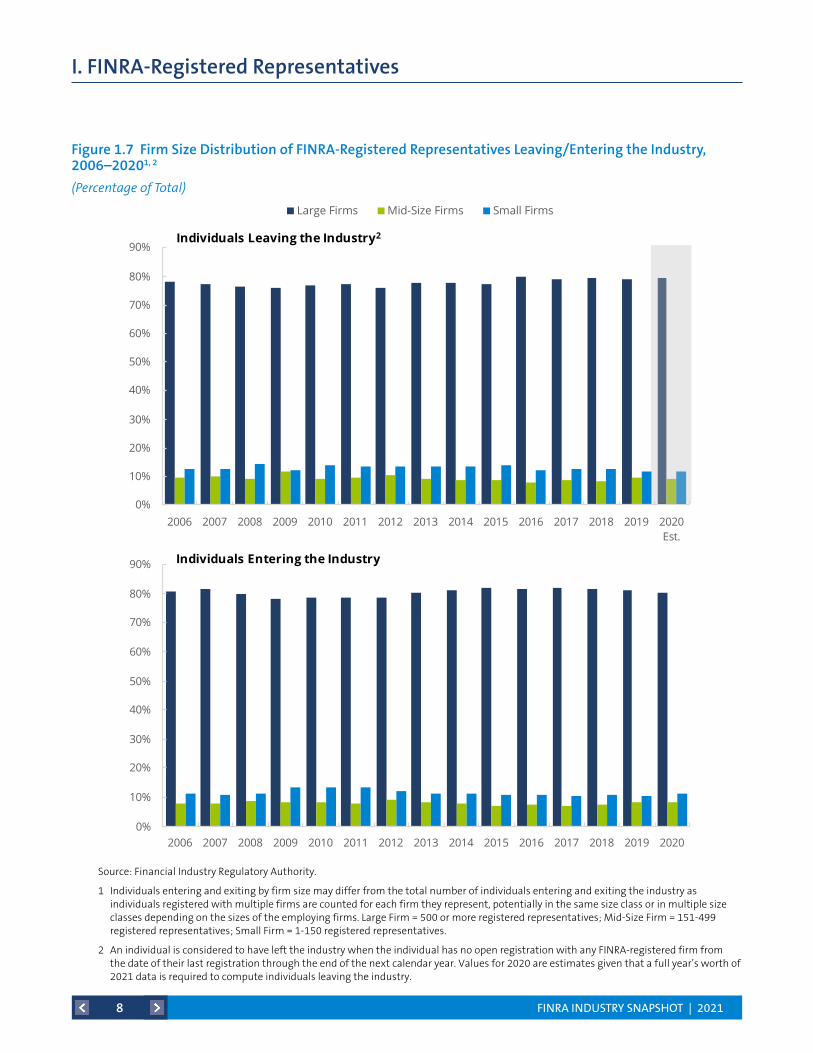
Figure 1.7 Firm Size Distribution of FINRA-Registered Representatives Leaving/Entering the Industry, 2006–20201, 2
(Percentage of Total)
Source: Financial Industry Regulatory Authority.
1 Individuals entering and exiting by firm size may differ from the total number of individuals entering and exiting the industry as individuals registered with multiple firms are counted for each firm they represent, potentially in the same size class or in multiple size classes depending on the sizes of the employing firms. Large Firm = 500 or more registered representatives; Mid-Size Firm = 151-499 registered representatives; Small Firm = 1-150 registered representatives.
2 An individual is considered to have left the industry when the individual has no open registration with any FINRA-registered firm from the date of their last registration through the end of the next calendar year. Values for 2020 are estimates given that a full year’s worth of 2021 data is required to compute individuals leaving the industry.
0%
10%
20%
30%
40%
50%
60%
70%
80%
90%
2006 2007 2008 2009 2010 2011 2012 2013 2014 2015 2016 2017 2018 2019 2020
Individuals Entering the Industry
Source: Financial Industry Regulatory Authority.
1Individuals entering and exiting by firm size may differ from the total number of individuals entering and exiting the industry as individuals registered with multiple firms are counted for each firm they represent, potentially in the same sizeclass or in multiple size classes depending on the sizes of the employing firms. Large Firm = 500 or more registered representatives; Mid-Size Firm = 151-499 registered representatives; Small Firm = 1-150 registered representatives.
2An individual is considered to have left the industry when the individual has no open registration with any FINRA approved member firm from the date of their last registration through the end of the next calendar year. Values for 2020 are estimates given that a full year's worth of 2021 data is required to compute individuals leaving the industry.
Firm Size Distribution of FINRA-Registered Representatives Leaving/Entering the Industry, 2006–20201
(Percentage of Total)
0%
10%
20%
30%
40%
50%
60%
70%
80%
90%
2006 2007 2008 2009 2010 2011 2012 2013 2014 2015 2016 2017 2018 2019 2020Est.
Individuals Leaving the Industry2
0%
10%
20%
30%
40%
50%
60%
70%
80%
90%
2004 2005 2006 2007 2008 2009 2010 2011 2012 2013 2014 2015 2016 2017 2018
Large Firms Mid-Size Firms Small Firms
0%
10%
20%
30%
40%
50%
60%
70%
80%
90%
2004 2005 2006 2007 2008 2009 2010 2011 2012 2013 2014 2015 2016 2017 2018
2. Individuals Entering the Industry
1. Individuals Leaving the Industry
Source: Financial Industry Regulatory Authority.
1Large Firm = 500 or more registered representatives; Mid-Size Firm = 151-499 registered representatives; Small Firm = 1-150 registered representatives.
Firm Size Distribution of FINRA-Registered Representatives Leaving/Entering the Industry, 2004—20181
(Percentage of Total)
FINRA INDUSTRY SNAPSHOT | 20219
I. FINRA-Registered Representatives
0%
2%
4%
6%
8%
10%
12%
0
10,000
20,000
30,000
40,000
50,000
60,000
70,000
80,000
90,000
100,000
2006 2007 2008 2009 2010 2011 2012 2013 2014 2015 2016 2017 2018 2019 2020
Number of Transfers (left scale)
Transfers as a Percentage of Registered Representative Population (right scale)
FINRA-Registered Representatives’ Transfers Between Firms within the Industry, 2006–20201
(Counts as of year-end)
Source: Financial Industry Regulatory Authority.
1The number of transfers in a given year includes all transfers associated with FINRA-registered representatives who dropped a registration with a member firm and added a registration with another member firm within 15 days before or 60 days after dropping the registration.
Figure 1.8 FINRA-Registered Representatives’ Transfers Between Firms Within the Industry, 2006–20201
(Count as of year-end)
Source: Financial Industry Regulatory Authority.
1 The number of transfers in a given year includes all transfers associated with FINRA-registered representatives who dropped a registration with a member firm and added a registration with another member firm within 15 days before or 60 days after dropping the registration. These individuals represent a subset of all FINRA-registered representatives changing jobs within the industry.
FINRA INDUSTRY SNAPSHOT | 202110
I. FINRA-Registered Representatives
Figure 1.9 Securities Industry Registered Individuals’ Transfers Between Firms by Registration Type, 2006–20201, 2
(Count as of year-end)
Source: Financial Industry Regulatory Authority.
* The number for “IAR -> IAR” in 2018 reflects transfers of more than 8,000 individuals transferring within affiliates.
1 The number of transfers in a given year includes all transfers associated with Securities Industry Registered Individuals (including FINRA-registered representatives and investment adviser representatives), who dropped a registration with a member firm and added a registration with another member firm within 15 days before or 60 days after dropping the registration. These transfers between firms include transfers from one registration type to another registration type (e.g. investment adviser registration at previous firm to registered representative registration at the new firm, “IAR -> RR”), as well as transfers for the same registration type (e.g. investment adviser registration at previous firm to same registration at the new firm, “IAR -> IAR”).
2 Investment adviser representatives who solely deal with customers in New York, or who were solely dealing with customers in Wyoming prior to July 1, 2017, are not captured in the Central Registration Depository (CRD) system. Furthermore, owners of investment advisory firms are exempt from registering as investment adviser representatives. Accordingly, these investment adviser representatives are not included.
0
10,000
20,000
30,000
40,000
50,000
2006 2007 2008 2009 2010 2011 2012 2013 2014 2015 2016 2017 2018 2019 2020
DUAL->DUAL
DUAL->IAR
DUAL->RR
Dual Registered Individuals
0
2,000
4,000
6,000
8,000
10,000
12,000
14,000
2006 2007 2008 2009 2010 2011 2012 2013 2014 2015 2016 2017 2018 2019 2020
IAR->DUAL
IAR->IAR
IAR->RR
Investment Adviser Representatives
0
5,000
10,000
15,000
20,000
25,000
30,000
35,000
2006 2007 2008 2009 2010 2011 2012 2013 2014 2015 2016 2017 2018 2019 2020
RR->DUAL
RR->IAR
RR->RR
Registered Representatives
Securities Industry Registered Individuals' Transfers Between Firms by Registration Type, 2006–20201,2
(Count as of year-end)
Source: Financial Industry Regulatory Authority.
*The number for "IAR -> IAR" in 2018 reflects transfers of more than 8,000 individuals transferring within affiliates.
1The number of transfers in a given year includes all transfers associated with Securities Industry Registered Individuals (including FINRA registered representatives and Investment Adviser Representatives), who dropped a registration with a member firm and added a registration with another member firm within 15 days before or 60 days after dropping the registration. These transfers between firms include transfers from one registration type to another registration type (e.g. investment adviser registration at previous firm to registered representative registration at the new firm, "IAR -> RR"), as well as transfers for the same registration type (e.g. investment adviser registration at previous firm to same registration at the new firm, "IAR -> IAR").
2Investment Adviser Representatives who solely deal with customers in New York, or who were solely dealing with customers in Wyoming prior to July 1, 2017, are not captured in the Central Registration Depository (CRD) system. Furthermore, owners of investment advisory firms are exempt from registering as Investment Adviser Representatives. Accordingly, these Investment Adviser Representatives are not included.
FINRA INDUSTRY SNAPSHOT | 202111
II. FINRA-Registered Firms
Figure 2.1 Total Number of FINRA-Registered Firms, 2016−20201
(Count as of year-end)
Source: Financial Industry Regulatory Authority.
1 Firms conducting securities transactions and business with the investing public must be registered with FINRA. Firms must meet certain membership standards to attain registration.
3,8353,726
3,6073,517
3,435
0
500
1,000
1,500
2,000
2,500
3,000
3,500
4,000
4,500
2016 2017 2018 2019 2020
Total Number of FINRA-Registered Firms, 2016−20201
(Counts as of year-end)
Source: Financial Industry Regulatory Authority.
1Firms conducting securities transactions and business with the investing public must be registered with FINRA. Firms must meet certain membership standards to attain registration.
FINRA INDUSTRY SNAPSHOT | 202112
II. FINRA-Registered Firms
2016 2017 2018 2019 2020
Large 179 178 173 168 165
Mid-Size 194 195 192 198 191
Small 3,462 3,353 3,242 3,151 3,079
Total 3,835 3,726 3,607 3,517 3,435
Table 2.2 Firm Distribution by Size, 2016−20201
(Count as of year-end)
Figure 2.2 Firm Distribution by Size, 2016−20201
(Count as of year-end)
Source: Financial Industry Regulatory Authority.
1 Large Firm = 500 or more registered representatives; Mid-Size Firm = 151-499 registered representatives; Small Firm = 1-150 registered representatives.
Source: Financial Industry Regulatory Authority.
1 Large Firm = 500 or more registered representatives; Mid-Size Firm = 151-499 registered representatives; Small Firm = 1-150 registered representatives.
0
500
1,000
1,500
2,000
2,500
3,000
3,500
4,000
4,500
2016 2017 2018 2019 2020
Large Mid-Size Small
Source: Financial Industry Regulatory Authority.
1Large Firm = 500 or more registered representatives; Mid-Size Firm = 151-499 registered representatives; Small Firm = 1-150 registered representatives.
Firm Distribution by Size, 2016−20201
(Counts as of year-end)
FINRA INDUSTRY SNAPSHOT | 202113
II. FINRA-Registered Firms
0
5,000
10,000
15,000
20,000
25,000
30,000
35,000
2011 2012 2013 2014 2015 2016 2017 2018 2019 2020
Broker-Dealer Firms Only
Dual Broker-Dealer and Investment Advisers
Investment Adviser Firms Only
Securities Industry Registered Firms by Type of Registration, 2011−20201
(Counts as of year-end)
Source: Financial Industry Regulatory Authority.
1"Broker-Dealer Firms Only" refers to firms that are solely registered with FINRA as broker-dealers. "Dual Broker-Dealer and Investment-Adviser Firms" refers to FINRA-registered broker-dealers who are also registered as investment adviser firms. "Investment Adviser Firms Only" refers to firms that are registered only as investment advisers and are overseen by the SEC or state regulators.
2011 2012 2013 2014 2015 2016 2017 2018 2019 2020
Broker-Dealer Firms Only 3,673 3,545 3,449 3,391 3,303 3,226 3,130 3,045 2,989 2,930
Dual Broker-Dealer and Investment-Adviser Firms
782 744 697 677 640 609 596 562 528 505
AllFINRA-RegisteredBroker-DealerFirms
4,455 4,289 4,146 4,068 3,943 3,835 3,726 3,607 3,517 3,435
Investment Adviser Firms Only 25,524 27,131 27,511 28,135 28,712 29,081 29,600 30,246 30,534 30,888
TotalRegisteredFirms 29,979 31,420 31,657 32,203 32,655 32,916 33,326 33,853 34,051 34,323
Table 2.3 Securities Industry Registered Firms by Type of Registration, 2011−20201
(Count as of year-end)
Source: Financial Industry Regulatory Authority.
1 ”Broker-Dealer Firms Only” refers to firms that are solely registered with FINRA as broker-dealers. “Dual Broker-Dealer and Investment-Adviser Firms” refers to FINRA-registered broker-dealers who are also registered as investment adviser firms. “Investment Adviser Firms Only” refers to firms that are registered only as investment advisers and are overseen by the SEC or state regulators. “Securities Industry Registered Firms” refers to the totality of registered firms.
Figure 2.3 Securities Industry Registered Firms by Type of Registration, 2011−20201
(Count as of year-end)
Source: Financial Industry Regulatory Authority.
1 ”Broker-Dealer Firms Only” refers to firms that are solely registered with FINRA as broker-dealers. “Dual Broker-Dealer and Investment-Adviser Firms” refers to FINRA-registered broker-dealers who are also registered as investment adviser firms. “Investment Adviser Firms Only” refers to firms that are registered only as investment advisers and are overseen by the SEC or state regulators. “Securities Industry Registered Firms” refers to the totality of registered firms.
FINRA INDUSTRY SNAPSHOT | 202114
II. FINRA-Registered Firms
2016 2017 2018 2019 2020
Large 137,806 134,473 133,760 132,758 132,719
Mid-Size 10,137 10,216 9,837 10,660 9,766
Small 11,521 11,278 11,064 10,489 10,376
Total 159,464 155,967 154,661 153,907 152,861
Table 2.4 Distribution of Branches by Firm Size, 2016−20201, 2
(Count as of year-end)
Figure 2.4 Distribution of Branches by Firm Size, 2016−20201, 2
(Count as of year-end)
Source: Financial Industry Regulatory Authority.
1 For each branch office, a FINRA-registered firm must file a Form BR (the Uniform Branch Office Registration Form).
2 Large Firm = 500 or more registered representatives; Mid-Size Firm = 151-499 registered representatives; Small Firm = 1-150 registered representatives.
0
20,000
40,000
60,000
80,000
100,000
120,000
140,000
160,000
180,000
2016 2017 2018 2019 2020
Large Mid-Size Small
Distribution of Branches by Firm Size, 2016−20201,2
(Counts as of year-end)
Source: Financial Industry Regulatory Authority.
1For each branch office, a FINRA-registered firms must file a Form BR (the Uniform Branch Office Registration Form). 2Large Firm = 500 or more registered representatives; Mid-Size Firm = 151-499 registered representatives; Small Firm = 1-150 registered representatives.
FINRA INDUSTRY SNAPSHOT | 202115
II. FINRA-Registered Firms
5%6%
90%
By Size
Large Mid-Size Small
87%
6%7%
By Number of Branches
Large Mid-Size Small
82%
8%
10%
By Number of Registered Representatives
Large Mid-Size Small
Firm Distribution, 2020(As of year-end, percent of total)
5%6%
90%
By Size
Large Mid-Size Small
87%
6%7%
By Number of Branches
Large Mid-Size Small
82%
8%
10%
By Number of Registered Representatives
Large Mid-Size Small
Firm Distribution, 2020(As of year-end, percent of total)
Figure 2.5 Firm Distribution by Specified Demographics, 2020
(As of year-end, percent of total)
Source: Financial Industry Regulatory Authority.
Size Category 2016 2017 2018 2019 2020
>1000 102 99 93 95 93
500-1000 77 79 80 73 72
301-499 69 67 65 69 66
151-300 125 128 127 129 125
101-150 100 102 101 107 112
76-100 101 85 94 83 78
51-75 164 161 165 157 174
41-50 107 116 100 100 102
31-40 166 166 167 159 133
26-30 109 118 129 114 119
21-25 167 167 155 164 124
16-20 254 260 257 236 248
11-15 405 378 378 370 374
10 or Fewer 1,889 1,800 1,696 1,661 1,615
Total 3,835 3,726 3,607 3,517 3,435
Table 2.5 Firm Distribution by Number of Registered Representatives: Additional Breakdown, 2016–2020
(Count as of year-end)
Source: Financial Industry Regulatory Authority.
5%6%
90%
By Size
Large Mid-Size Small
87%
6%7%
By Number of Branches
Large Mid-Size Small
82%
8%
10%
By Number of Registered Representatives
Large Mid-Size Small
Firm Distribution, 2020(As of year-end, percent of total)
FINRA INDUSTRY SNAPSHOT | 202116
II. FINRA-Registered Firms
Figure 2.6 10-Year Change in Number of FINRA-Registered Firms, 2010−2020
(Count as of year-end)
Source: Financial Industry Regulatory Authority.
1,5731,425
1,250
3,004
2,518
2,185
0
500
1,000
1,500
2,000
2,500
3,000
3,500
2010 2015 2020
CT, NJ, NY All Other States
10-Year Change in Number of FINRA-Registered Firms, 2010−2020(Counts as of year-end)
Source: Financial Industry Regulatory Authority.
FINRA INDUSTRY SNAPSHOT | 202117
II. FINRA-Registered Firms
Branches By State/Region
2016 2017 2018 2019 2020
Branches Firms Branches Firms Branches Firms Branches Firms Branches Firms
Alabama 1,793 170 1,724 161 1,674 155 1,702 158 1,681 161
Alaska 251 52 246 51 251 53 247 52 244 51
Arizona 3,201 258 3,135 261 3,130 253 3,079 253 3,094 247
Arkansas 1,001 119 975 116 959 113 961 114 963 113
California 17,420 1,033 17,051 1,022 16,757 987 16,585 969 16,573 948
Colorado 3,470 365 3,398 361 3,359 362 3,340 344 3,337 342
Connecticut 2,610 408 2,580 407 2,543 403 2,499 400 2,396 383
Delaware 478 107 462 104 465 101 461 97 472 99
District of Columbia 299 122 294 127 305 121 321 128 322 126
Florida 10,296 692 10,236 700 10,436 691 10,503 685 10,700 690
Georgia 4,115 379 3,984 375 3,990 377 3,985 380 3,988 370
Hawaii 573 109 544 103 555 100 565 96 585 94
Idaho 886 115 863 116 867 115 884 115 902 117
Illinois 7,539 662 7,295 643 7,193 636 7,124 632 7,034 616
Indiana 3,240 212 3,148 208 3,075 205 3,055 196 3,024 194
Iowa 2,221 179 2,162 172 2,144 169 2,131 168 2,149 168
Kansas 1,803 196 1,771 191 1,751 180 1,770 174 1,749 176
Kentucky 1,592 162 1,548 156 1,523 155 1,509 147 1,502 143
Table 2.7 Branches By State/Region, 2016–2020
BranchesStates/Regions
5001-10,000+ 7
2501-5000 15
1001-2500 12
501-1,000 12
0-500 9
Figure 2.7 Geographic Distribution of Firms by Number of Branches, 20201
(Count as of year-end)
Source: Financial Industry Regulatory Authority.
1 Not shown: Puerto Rico, Virgin Islands, Guam, Foreign.
FINRA INDUSTRY SNAPSHOT | 202118
II. FINRA-Registered Firms
Branches By State/Region
2016 2017 2018 2019 2020
Branches Firms Branches Firms Branches Firms Branches Firms Branches Firms
Louisiana 1,775 173 1,792 160 1,766 159 1,784 156 1,776 156
Maine 640 124 610 119 597 116 583 116 581 112
Maryland 2,797 289 2,717 287 2,724 269 2,708 273 2,692 266
Massachusetts 3,687 495 3,624 484 3,571 469 3,568 463 3,497 447
Michigan 5,266 283 5,107 269 5,027 254 5,009 255 4,954 251
Minnesota 3,686 281 3,617 273 3,582 267 3,592 269 3,603 263
Mississippi 736 103 707 99 702 97 687 94 695 91
Missouri 3,070 296 2,969 273 2,901 257 2,887 255 2,902 233
Montana 629 94 599 91 595 88 588 83 587 83
Nebraska 1,305 143 1,250 138 1,259 136 1,240 135 1,248 137
Nevada 1,267 184 1,277 173 1,254 170 1,233 170 1,212 172
New Hampshire 810 133 798 128 798 130 811 130 774 127
New Jersey 5,127 477 4,945 469 4,865 454 4,827 458 4,792 453
New Mexico 791 106 785 105 786 107 773 104 757 103
New York 10,642 1,571 10,524 1,606 10,335 1,579 10,240 1,538 9,962 1,482
North Carolina 4,617 345 4,535 345 4,564 339 4,576 346 4,614 346
North Dakota 567 88 553 86 543 83 544 84 548 82
Ohio 6,676 339 6,462 330 6,418 325 6,287 326 6,116 318
Oklahoma 1,902 157 1,853 151 1,804 144 1,785 142 1,728 139
Oregon 2,276 192 2,232 185 2,199 177 2,181 178 2,114 169
Pennsylvania 7,349 443 7,152 425 6,937 423 6,843 414 6,709 396
Rhode Island 516 111 509 108 516 112 509 109 509 103
South Carolina 1,946 204 1,939 206 2,010 203 2,013 199 2,077 204
South Dakota 582 86 560 82 552 77 557 78 554 79
Tennessee 2,627 258 2,544 251 2,540 248 2,562 251 2,573 243
Texas 11,172 645 10,997 651 10,957 653 10,912 648 10,845 609
Utah 1,297 176 1,269 169 1,258 162 1,282 163 1,291 167
Vermont 407 101 375 90 363 85 367 83 330 82
Virginia 3,669 299 3,607 295 3,631 280 3,624 277 3,630 272
Washington 3,726 253 3,670 259 3,679 251 3,678 247 3,586 234
West Virginia 630 99 584 100 581 94 560 92 547 92
Wisconsin 3,564 228 3,462 216 3,441 214 3,452 207 3,415 215
Wyoming 377 68 363 68 361 66 350 65 355 66
Puerto Rico 150 42 145 45 145 49 147 47 150 49
Virgin Islands 9 8 6 5 7 6 7 6 7 6
Guam 9 7 10 7 10 7 11 8 11 8
Foreign 380 189 403 195 406 203 409 193 405 192
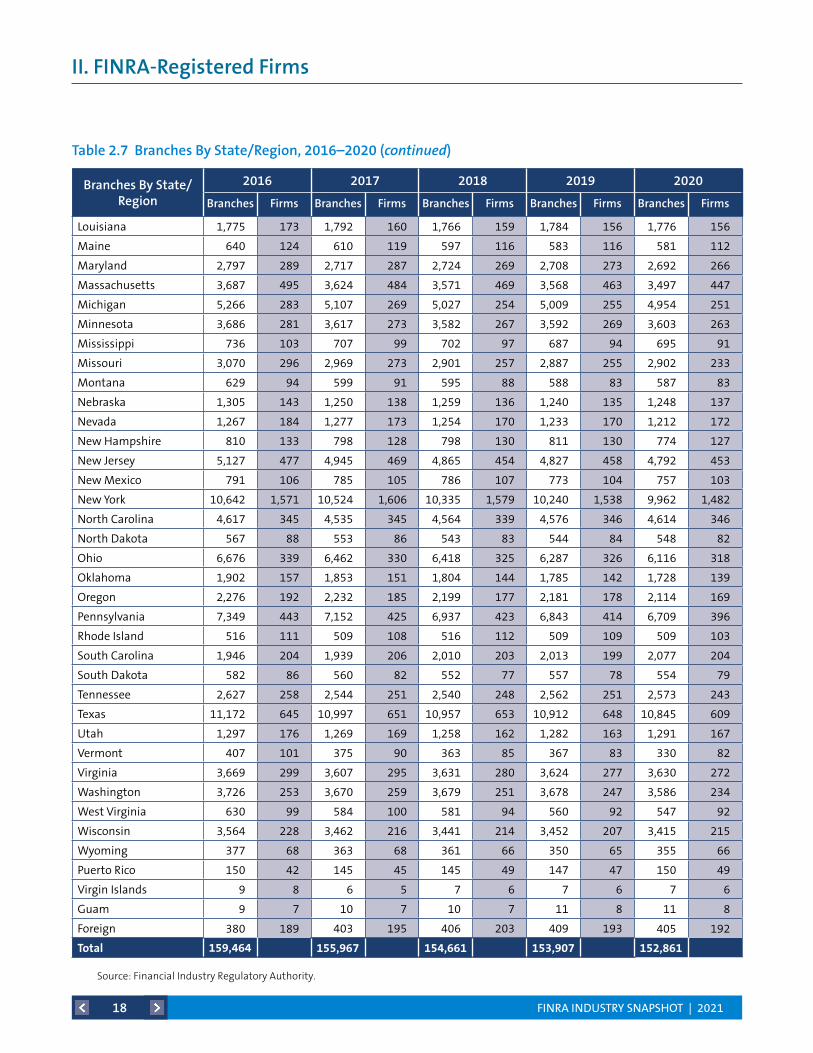
Total 159,464 155,967 154,661 153,907 152,861
Table 2.7 Branches By State/Region, 2016–2020 (continued)
Source: Financial Industry Regulatory Authority.
FINRA INDUSTRY SNAPSHOT | 202119
II. FINRA-Registered Firms
Locations by State/Region 2016 2017 2018 2019 2020
Alabama 22 21 20 21 20
Alaska 1 0 0 0 0
Arizona 29 29 31 28 29
Arkansas 10 10 9 8 8
California 435 428 409 406 399
Colorado 80 75 66 63 61
Connecticut 135 129 126 120 121
Delaware 4 4 4 3 2
District of Columbia 25 22 21 21 22
Florida 185 188 183 178 180
Georgia 74 76 78 71 76
Hawaii 6 5 5 5 5
Idaho 2 2 2 2 2
Illinois 229 217 211 205 205
Indiana 26 22 22 22 23
Iowa 23 22 19 18 18
Kansas 20 21 22 21 21
Kentucky 11 10 10 9 9
Louisiana 16 14 13 12 12
Maine 17 18 18 18 15
Maryland 51 48 42 42 41
Table 2.8 Geographic Distribution of Firms by Headquarters, 2016–2020
Figure 2.8 Geographic Distribution of Firms by Headquarters, 20201
(Count as of year-end)
HeadquartersStates/Regions
501-1,000+ 1
101-500 7
51-100 7
0-50 40Source: Financial Industry Regulatory Authority.
1 Not shown: Puerto Rico, Virgin Islands, Guam, Foreign.
FINRA INDUSTRY SNAPSHOT | 202120
II. FINRA-Registered Firms
Locations by State/Region 2016 2017 2018 2019 2020
Massachusetts 141 138 129 132 125
Michigan 45 44 39 38 35
Minnesota 60 55 56 54 54
Mississippi 2 2 2 2 2
Missouri 64 63 54 52 49
Montana 2 2 2 2 2
Nebraska 15 15 15 16 16
Nevada 12 13 10 8 9
New Hampshire 7 6 6 5 5
New Jersey 149 154 147 145 140
New Mexico 1 1 1 1 1
New York 1,122 1,095 1,070 1,038 989
North Carolina 69 65 61 60 64
North Dakota 8 8 7 7 6
Ohio 71 66 65 66 67
Oklahoma 13 11 11 10 10
Oregon 18 16 17 20 19
Pennsylvania 108 100 103 99 90
Rhode Island 12 12 12 11 11
South Carolina 19 18 21 21 21
South Dakota 2 2 2 2 2
Tennessee 43 41 40 39 39
Texas 212 205 201 201 199
Utah 23 21 24 25 25
Vermont 4 3 3 3 4
Virginia 55 55 51 47 46
Washington 43 42 40 38 32
West Virginia 2 2 2 2 2
Wisconsin 41 38 37 35 31
Wyoming 0 0 0 0 1
Puerto Rico 12 13 11 11 14
Virgin Islands 1 1 1 0 1
Guam 1 1 1 1 1
Foreign 57 57 55 53 54
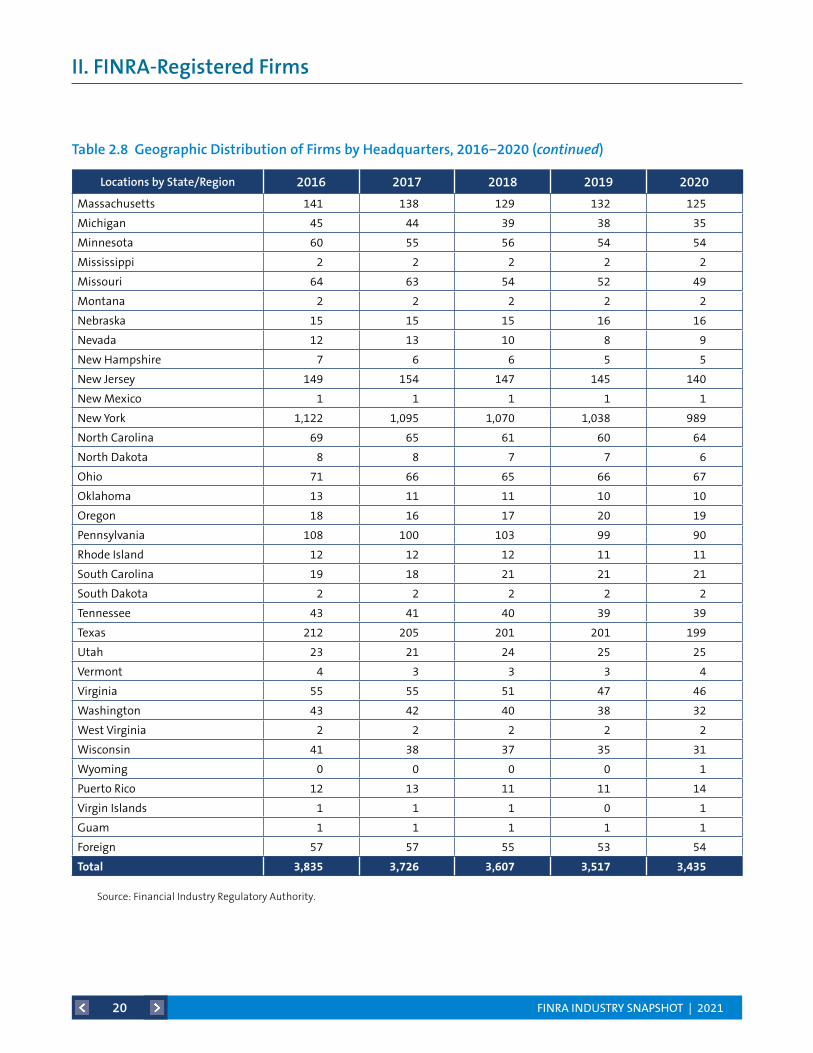
Total 3,835 3,726 3,607 3,517 3,435
Table 2.8 Geographic Distribution of Firms by Headquarters, 2016−2020 (continued)
Source: Financial Industry Regulatory Authority.
FINRA INDUSTRY SNAPSHOT | 202121
II. FINRA-Registered Firms
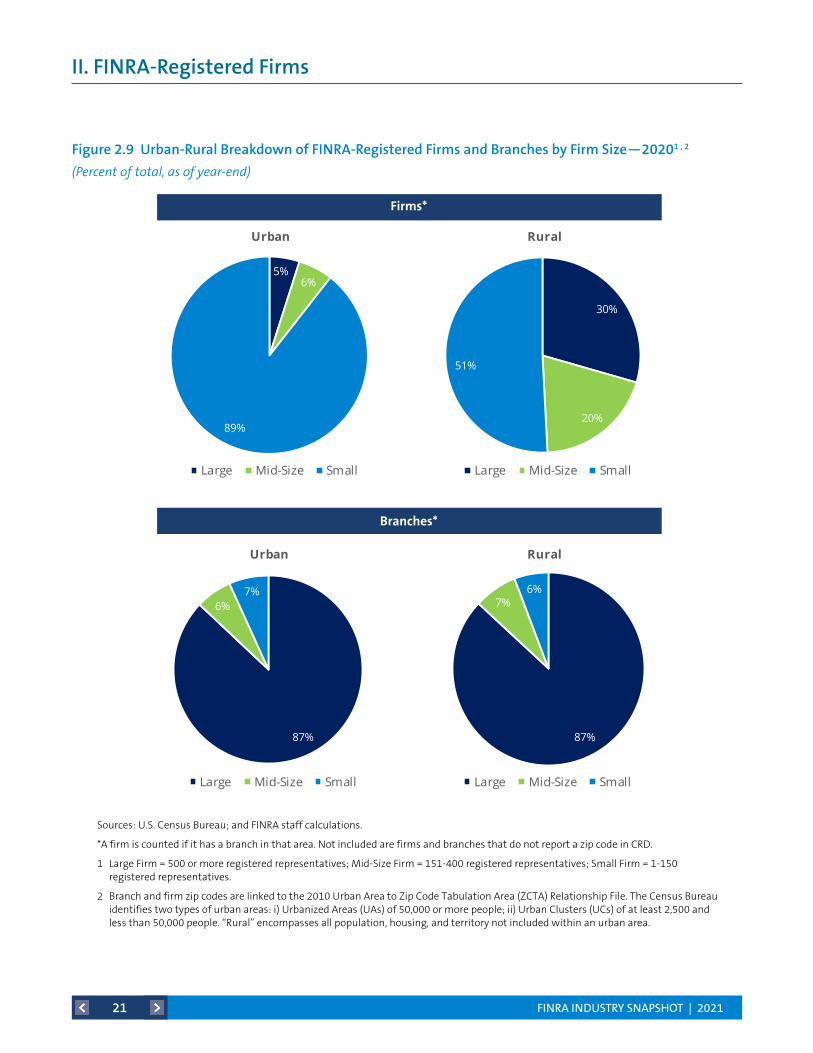
Figure 2.9 Urban-Rural Breakdown of FINRA-Registered Firms and Branches by Firm Size—20201 , 2
(Percent of total, as of year-end)
Sources: U.S. Census Bureau; and FINRA staff calculations.
*A firm is counted if it has a branch in that area. Not included are firms and branches that do not report a zip code in CRD.
1 Large Firm = 500 or more registered representatives; Mid-Size Firm = 151-400 registered representatives; Small Firm = 1-150 registered representatives.
2 Branch and firm zip codes are linked to the 2010 Urban Area to Zip Code Tabulation Area (ZCTA) Relationship File. The Census Bureau identifies two types of urban areas: i) Urbanized Areas (UAs) of 50,000 or more people; ii) Urban Clusters (UCs) of at least 2,500 and less than 50,000 people. “Rural” encompasses all population, housing, and territory not included within an urban area.
Urban-Rural Breakdown of FINRA-Registered Firms and Branches by Firm Size—20201,2
(Percent, as of year-end)
5%6%
89%
Urban
Large Mid-Size Small
30%
20%
51%
Rural
Large Mid-Size Small
87%
6%7%
Urban
Large Mid-Size Small
87%
7%6%
Rural
Large Mid-Size Small
Branches*
Firms*
Sources: U.S. Census Bureau; and FINRA staff calculations.
*A firm is counted if it has a branch in that area. Not included are firms and branches that do not report a zip code in CRD.
1Large Firm = 500 or more registered representatives; Mid-Size Firm = 151-400 registered representatives; Small Firm = 1-150 registered representatives.
2Branch and firm zip codes are linked to the 2010 Urban Area to Zip Code Tabulation Area (ZCTA) Relationship File. The Census Bureau identifies two types of urban areas: i) Urbanized Areas (UAs) of 50,000 or more people; ii) Urban Clusters (UCs) of at least 2,500 and less than 50,000 people. "Rural" encompasses all population, housing, and territory not included within an urban area.
Firms*
Branches*
FINRA INDUSTRY SNAPSHOT | 202122
II. FINRA-Registered Firms
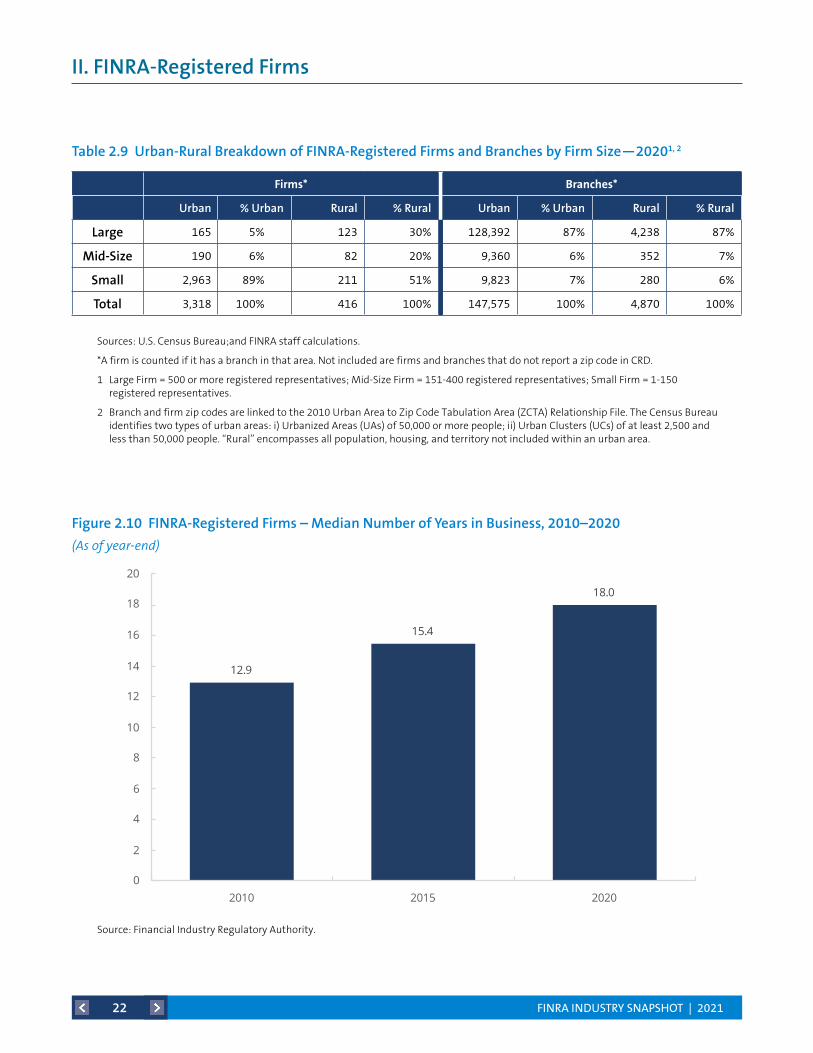
Figure 2.10 FINRA-Registered Firms – Median Number of Years in Business, 2010–2020
(As of year-end)
Source: Financial Industry Regulatory Authority.
12.9
15.4
18.0
0
2
4
6
8
10
12
14
16
18
20
2010 2015 2020
FINRA-Registered Firms – Median Number of Years in Business, 2010−2020(As of year-end)
Source: Financial Industry Regulatory Authority.
Firms* Branches*
Urban % Urban Rural % Rural Urban % Urban Rural % Rural
Large 165 5% 123 30% 128,392 87% 4,238 87%
Mid-Size 190 6% 82 20% 9,360 6% 352 7%
Small 2,963 89% 211 51% 9,823 7% 280 6%
Total 3,318 100% 416 100% 147,575 100% 4,870 100%
Sources: U.S. Census Bureau;and FINRA staff calculations.
*A firm is counted if it has a branch in that area. Not included are firms and branches that do not report a zip code in CRD.
1 Large Firm = 500 or more registered representatives; Mid-Size Firm = 151-400 registered representatives; Small Firm = 1-150 registered representatives.
2 Branch and firm zip codes are linked to the 2010 Urban Area to Zip Code Tabulation Area (ZCTA) Relationship File. The Census Bureau identifies two types of urban areas: i) Urbanized Areas (UAs) of 50,000 or more people; ii) Urban Clusters (UCs) of at least 2,500 and less than 50,000 people. “Rural” encompasses all population, housing, and territory not included within an urban area.
Table 2.9 Urban-Rural Breakdown of FINRA-Registered Firms and Branches by Firm Size—20201, 2
FINRA INDUSTRY SNAPSHOT | 202123
II. FINRA-Registered Firms
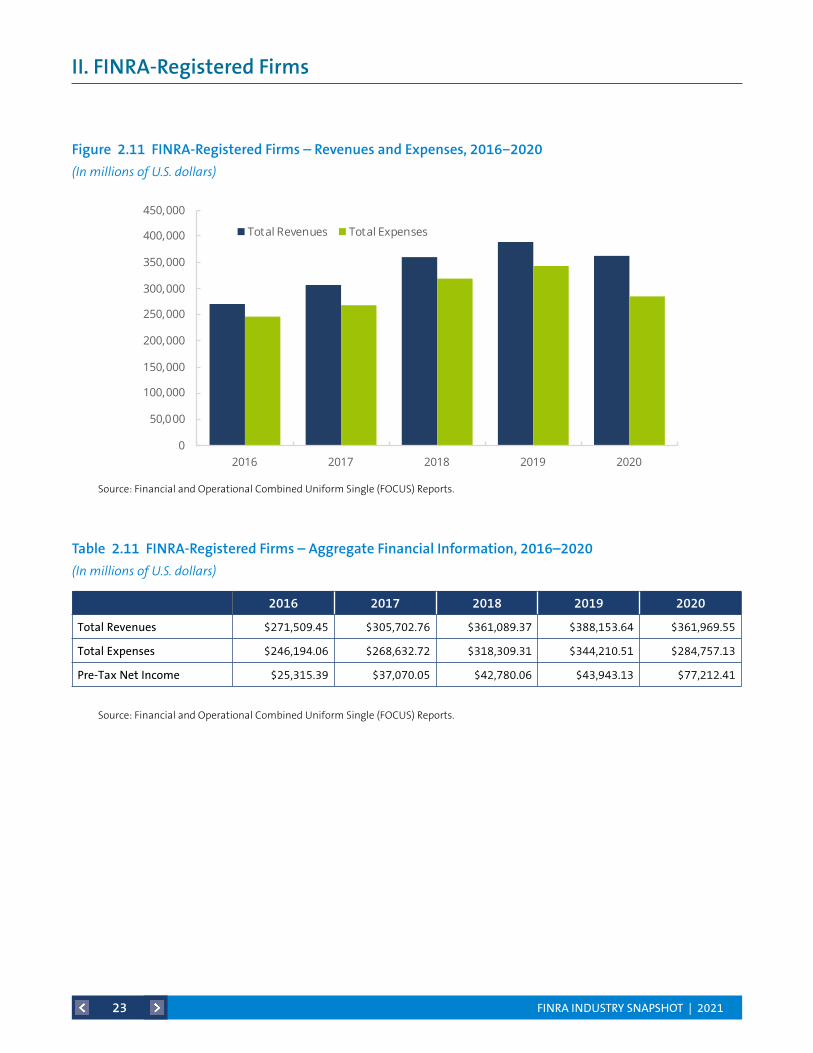
2016 2017 2018 2019 2020
Total Revenues $271,509.45 $305,702.76 $361,089.37 $388,153.64 $361,969.55
Total Expenses $246,194.06 $268,632.72 $318,309.31 $344,210.51 $284,757.13
Pre-Tax Net Income $25,315.39 $37,070.05 $42,780.06 $43,943.13 $77,212.41
Table 2.11 FINRA-Registered Firms – Aggregate Financial Information, 2016–2020
(In millions of U.S. dollars)
Figure 2.11 FINRA-Registered Firms – Revenues and Expenses, 2016−2020
(In millions of U.S. dollars)
Source: Financial and Operational Combined Uniform Single (FOCUS) Reports.
Source: Financial and Operational Combined Uniform Single (FOCUS) Reports.
0
50,000
100,000
150,000
200,000
250,000
300,000
350,000
400,000
450,000
2016 2017 2018 2019 2020
Total Revenues Total Expenses
FINRA-Registered Firms – Revenues and Expenses, 2016−2020 (In millions of U.S. dollars)
Source: Financial and Operational Combined Uniform Single (FOCUS) Reports.
FINRA INDUSTRY SNAPSHOT | 202124
II. FINRA-Registered Firms
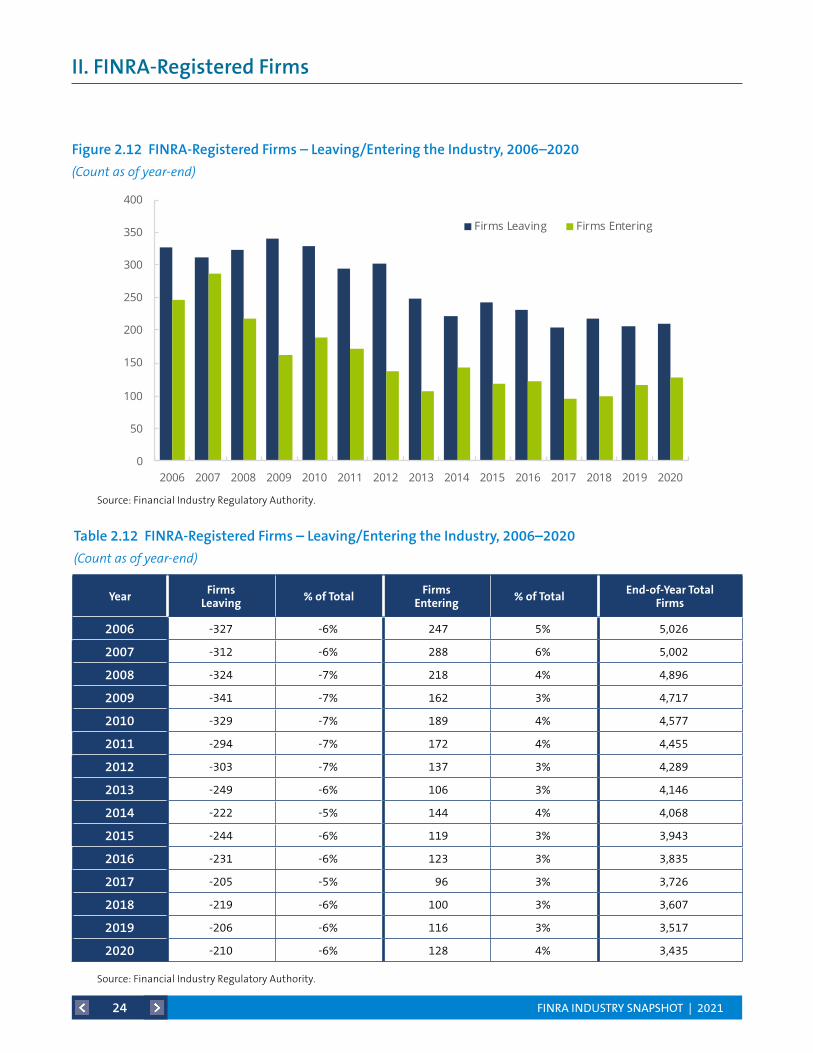
Year FirmsLeaving %ofTotal Firms
Entering %ofTotal End-of-YearTotalFirms
2006 -327 -6% 247 5% 5,026
2007 -312 -6% 288 6% 5,002
2008 -324 -7% 218 4% 4,896
2009 -341 -7% 162 3% 4,717
2010 -329 -7% 189 4% 4,577
2011 -294 -7% 172 4% 4,455
2012 -303 -7% 137 3% 4,289
2013 -249 -6% 106 3% 4,146
2014 -222 -5% 144 4% 4,068
2015 -244 -6% 119 3% 3,943
2016 -231 -6% 123 3% 3,835
2017 -205 -5% 96 3% 3,726
2018 -219 -6% 100 3% 3,607
2019 -206 -6% 116 3% 3,517
2020 -210 -6% 128 4% 3,435
Table 2.12 FINRA-Registered Firms – Leaving/Entering the Industry, 2006–2020
(Count as of year-end)
Figure 2.12 FINRA-Registered Firms – Leaving/Entering the Industry, 2006–2020
(Count as of year-end)
Source: Financial Industry Regulatory Authority.
Source: Financial Industry Regulatory Authority.
0
50
100
150
200
250
300
350
400
2006 2007 2008 2009 2010 2011 2012 2013 2014 2015 2016 2017 2018 2019 2020
Firms Leaving Firms Entering
FINRA-Registered Firms – Leaving/Entering the Industry, 2006−2020(Count as of year-end)
Source: Financial Industry Regulatory Authority.
FINRA INDUSTRY SNAPSHOT | 202125
II. FINRA-Registered Firms
Year BranchesClosed %ofTotal BranchesOpened %ofTotal End-of-YearTotal
Branches
2010 -26,324 -16% 22,336 14% 162,711
2011 -24,863 -16% 22,555 14% 160,403
2012 -25,193 -16% 25,939 16% 161,149
2013 -19,382 -12% 18,711 12% 160,478
2014 -16,554 -10% 17,522 11% 161,272
2015 -18,296 -11% 18,242 11% 161,392
2016 -20,103 -13% 18,175 11% 159,464
2017 -21,797 -14% 18,300 12% 155,967
2018 -20,875 -14% 19,569 13% 154,661
2019 -17,979 -12% 17,225 11% 153,907
2020 -15,987 -10% 14,941 10% 152,861
Table 2.13 FINRA-Registered Firm Branch Offices – Opening/Closing, 2010–2020
(Count as of year-end)
Figure 2.13 FINRA-Registered Firm Branch Offices – Opening/Closing, 2010–2020
(Count as of year-end)
Source: Financial Industry Regulatory Authority.
Source: Financial Industry Regulatory Authority.
0
5,000
10,000
15,000
20,000
25,000
30,000
2010 2011 2012 2013 2014 2015 2016 2017 2018 2019 2020
Branches Closed Branches Opened
FINRA-Registered Firm Branch Offices – Opening/Closing, 2010−2020(Count as of year-end)
Source: Financial Industry Regulatory Authority.
FINRA INDUSTRY SNAPSHOT | 202126
II. FINRA-Registered Firms
Figure 2.14 Spotlight: Capital Acquisition Brokers and Funding Portals, 2016–20201
(Count as of year-end)
Source: Financial Industry Regulatory Authority.
1 Capital Acquisition Brokers (CABs) engage in a limited range of activities, essentially advising companies and private equity funds on capital raising and corporate restructuring, and acting as a placement agent for sales of unregistered securities to institutional investors under limited conditions. The CAB rule took effect in 2017. Funding Portals (FPs) also engage in a limited range of activities: those prescribed under to JOBS Act and the SEC’s Regulation Crowdfunding. The FP rule took effect in 2016.
NA
45
56 56
72
21
36
4651
65
0
10
20
30
40
50
60
70
80
2016 2017 2018 2019 2020
Capital Acquisition Brokers
Funding Portals
Spotlight: Capital Acquisition Brokers and Funding Portals, 2016−20201
(Count as of year-end)
Source: Financial Industry Regulatory Authority.
1Capital Acquisition Brokers (CABs) engage in a limited range of activities, essentially advising companies and private equity funds on capital raising and corporate restructuring, and acting as a placement agent for sales of unregistered securities to institutional investors under limited conditions. The CAB rule took effect in 2017. Funding Portals (FPs) also engage in a limited range of activities: those prescribed under to JOBS Act and the SEC's Regulation Crowdfunding. The FP rule took effect in 2016.
FINRA INDUSTRY SNAPSHOT | 202127
II. FINRA-Registered Firms
Figure 2.15 Advertising Regulation Filing Volumes, 2016–2020
(Count as of year-end)
Source: Financial Industry Regulatory Authority.
FINRA Rule 2210 governs broker-dealers’ communications with the public, including communications with retail and institutional investors. The rule provides standards for the content, approval, recordkeeping and filing of communications with FINRA. FINRA’s Advertising Regulation Department reviews firms’ advertisements and other communications with the public to ensure they are fair, balanced, not misleading and comply with the standards of the SEC, MSRB, SIPC, and FINRA advertising rules. FINRA rules do not require all communications to be filed, and the figures presented below therefore represent only a segment of such communication.
91,239
77,33472,183
67,57163,046
0
10,000
20,000
30,000
40,000
50,000
60,000
70,000
80,000
90,000
100,000
2016 2017 2018 2019 2020
Advertising Regulation Filing Volumes, 2016−20201
(Count as of year-end)
Source: Financial Industry Regulatory Authority.
1Based on communications filed by broker-dealers for review by FINRA's Advertising Regulation Department ("Filings"). The filing requirements were modified in January 2017 as part of a retrospective review of the Communications with the Public Rules, as described in Regulatory Notice 16-41.
FINRA INDUSTRY SNAPSHOT | 202128
II. FINRA-Registered Firms
Table 2.15 FINRA-Registered Firms – Most Common Marketing Methods Filed with FINRA, 2020
Source: Financial Industry Regulatory Authority.
MarketingMethods TotalforPeriod2020
Web information public access 25,087
Fund specific information sheet(s) 12,903
Flyers & other hand delivered material 4,847
Brochures, pamphlets, & catalogs 4,666
Periodic & other performance reports 3,188
E-mail, IM, SMS or text messages 3,038
Mailed sales material 2,695
Seminar related communications 1,925
Audio/Video tapes, CDs & DVDs 880
Web information password protected 724
Information released to the press 686
Articles & 3rd party reprints 586
Research reports - equity & debt 502
Software output & IA Tools 463
Print ads, posters, & signs 360
Acct statement related communications 226
TV ads & TV broadcasts 87
Radio ads & radio broadcasts 76
Broker Dealer use only material 65
Telemarketing & other phone scripts 28
Business related stationery 14
Total 63,046
FINRA INDUSTRY SNAPSHOT | 202129
II. FINRA-Registered Firms
Figure 2.16 Advertising Regulation Filing Volumes – Investment Company Product, 2020
(Percentage of Total Filings)
Source: Financial Industry Regulatory Authority.
InvestmentCompanyProductTypes PercentageofTotalFilings
Total Registered Investment Company Products 87.8%
Total Non-Registered Investment Company Products 12.2%
Table 2.16 Advertising Regulation Filing Volumes – Investment Company Product, 2020
Source: Financial Industry Regulatory Authority.
59.8%
15.7%
6.2%
3.1%
1.7% 1.4%
Open-End Mutual Fund Exchange Traded Fund
Variable Annuity Closed-End Mutual Fund
Unit Investment Trust Variable Life Insurance
Advertising Regulation Filing Volumes – Investment Company Product—2020(Percentage of Total Filings)
Source: Financial Industry Regulatory Authority.
FINRA INDUSTRY SNAPSHOT | 202130
II. FINRA-Registered Firms
Table 2.17 Advertising Regulation Filing Volumes – Voluntary vs. Mandatory, 2016–2020
(Count as of year-end)
2016 2017 2018 2019 2020
Mandatory 83,065 65,054 59,833 55,211 52,583
Voluntary 8,174 12,280 12,350 12,360 10,463
Source: Financial Industry Regulatory Authority.
FINRA INDUSTRY SNAPSHOT | 202131
II. FINRA-Registered Firms
Firm Grouping Firm Sub-GroupingNumber of Firms
Capital Markets and Investment Banking Services M&A and Investment Banking 714
Capital Markets and Investment Banking Services Private Placements - Institutional Investors 309
Capital Markets and Investment Banking Services Product Originator and Wholesaler 202
Capital Markets and Investment Banking Services Niche/Other - CMIB 109
Capital Markets and Investment Banking Services Public Finance 47
Clearing and Carrying Chaperone - 15a-6 Firms 80
Clearing and Carrying Securities Financing Book 20
Clearing and Carrying Niche/Other - Clearing 16
Clearing and Carrying Correspondent Clearing 12
Diversified Small Diversified* 76
Diversified Medium Diversified - Carrying/Clearing* 12
Diversified Medium Diversified - Non-Carrying/Clearing* 8
Diversified Large Diversified* 1
Retail Retail Small* 398
RetailPublic Pooled Investment Vehicles and Variable Annuities
223
Retail Retail Small - Independent Contractor* 210
Retail Private Placements 184
Retail Fintech 40
Retail Retail with Carrying/Clearing Activities 31
Retail Retail Mid-Size & Large - Independent Contractor* 6
Retail Retail Mid-Size & Large* 4
Trading and Execution Institutional Brokerage 254
Trading and ExecutionMedium/Small Proprietary Trading and Market-Making*
62
Trading and ExecutionAlternative Trading Systems (ATS's) and Electronic Communication Networks (ECN's)
54
Trading and Execution Large Proprietary Trading and Market-Making* 7
Total 3,079
Table 2.18 Small Firms – Business Segments as of December 20201
Source: Financial Industry Regulatory Authority.
*The definition of firm size in FINRA’s By-Laws may differ from the Member Firm Business Segment definitions, which may consider total assets and/or total revenue in categorizing a firm. Small Firm = 1-150 registered representatives.
1 Includes only FINRA-registered firms as of year-end.
On October 1, 2018, FINRA announced that it was moving toward an exam and risk monitoring program structure that is based on the business models of the firms FINRA oversees. FINRA has grouped firms according to the primary business(es) in which they are engaged. The following tables break down business segments by firm size.
FINRA INDUSTRY SNAPSHOT | 202132
II. FINRA-Registered Firms
Table 2.19 Mid-Size Firms – Business Segments as of December 20201
Source: Financial Industry Regulatory Authority.
*The definition of firm size in FINRA’s By-Laws may differ from the Member Firm Business Segment definitions, which may consider total assets and/or total revenue in categorizing a firm. Mid-Size Firm = 151-400 registered representatives.
1 Includes only FINRA-registered firms as of year-end.
Firm Grouping Firm Sub-GroupingNumber of Firms
Capital Markets and Investment Banking Services Private Placements - Institutional Investors 1
Clearing and Carrying Correspondent Clearing 3
Clearing and Carrying Chaperone - 15a-6 Firms 1
Clearing and Carrying Niche/Other - Clearing 1
Diversified Medium Diversified - Carrying/Clearing 13
Diversified Medium Diversified - Non-Carrying/Clearing 9
Diversified Small Diversified* 4
Retail Retail Mid-Size & Large - Independent Contractor* 39
Retail Retail Mid-Size & Large* 18
RetailPublic Pooled Investment Vehicles and Variable Annuities 12
Retail Retail Small - Independent Contractor* 5
Retail Retail with Carrying/Clearing Activities 2
Retail Private Placements 2
Retail Retail Small* 2
Retail Fintech 1
Trading and Execution Institutional Brokerage 12
Trading and Execution Large Proprietary Trading and Market-Making* 5
Trading and ExecutionMedium/Small Proprietary Trading and Market-Making*
1
Total 191
FINRA INDUSTRY SNAPSHOT | 202133
II. FINRA-Registered Firms
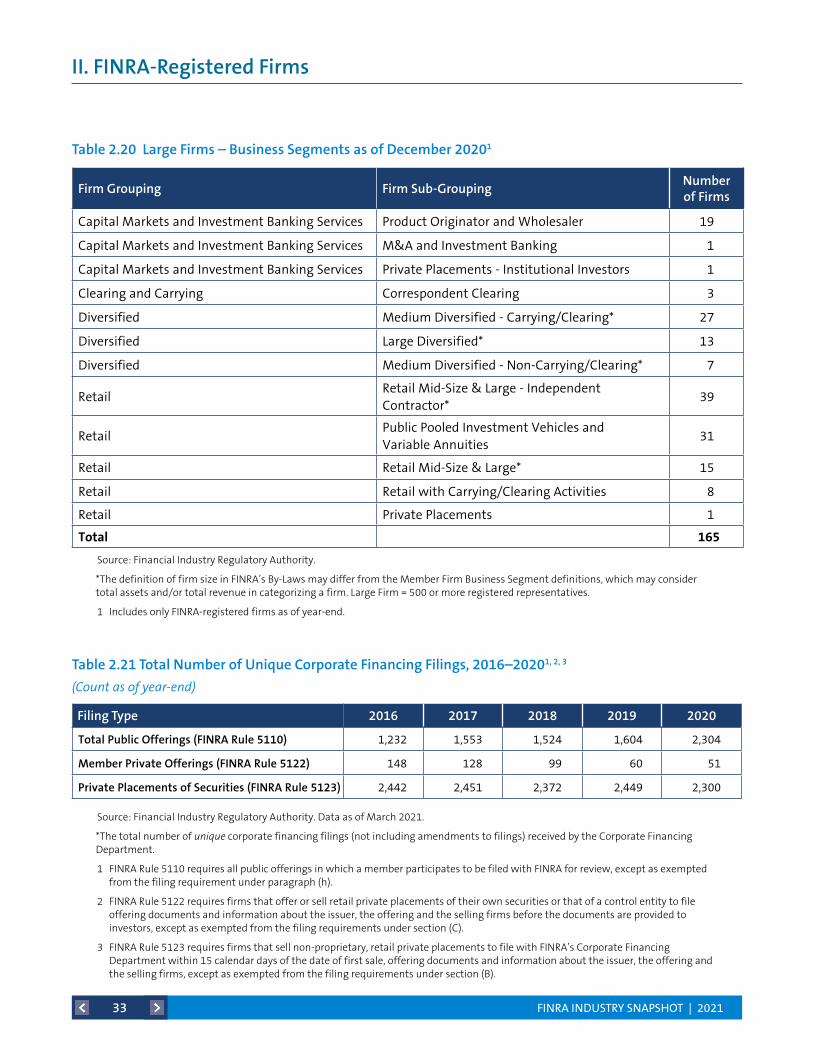
Firm Grouping Firm Sub-GroupingNumber of Firms
Capital Markets and Investment Banking Services Product Originator and Wholesaler 19
Capital Markets and Investment Banking Services M&A and Investment Banking 1
Capital Markets and Investment Banking Services Private Placements - Institutional Investors 1
Clearing and Carrying Correspondent Clearing 3
Diversified Medium Diversified - Carrying/Clearing* 27
Diversified Large Diversified* 13
Diversified Medium Diversified - Non-Carrying/Clearing* 7
RetailRetail Mid-Size & Large - Independent Contractor*
39
RetailPublic Pooled Investment Vehicles and Variable Annuities
31
Retail Retail Mid-Size & Large* 15
Retail Retail with Carrying/Clearing Activities 8
Retail Private Placements 1
Total 165
Table 2.20 Large Firms – Business Segments as of December 20201
Source: Financial Industry Regulatory Authority.
*The definition of firm size in FINRA’s By-Laws may differ from the Member Firm Business Segment definitions, which may consider total assets and/or total revenue in categorizing a firm. Large Firm = 500 or more registered representatives.
1 Includes only FINRA-registered firms as of year-end.
Table 2.21 Total Number of Unique Corporate Financing Filings, 2016–20201, 2, 3
(Count as of year-end)
Filing Type 2016 2017 2018 2019 2020
Total Public Offerings (FINRA Rule 5110) 1,232 1,553 1,524 1,604 2,304
Member Private Offerings (FINRA Rule 5122) 148 128 99 60 51
Private Placements of Securities (FINRA Rule 5123) 2,442 2,451 2,372 2,449 2,300
Source: Financial Industry Regulatory Authority. Data as of March 2021.
*The total number of unique corporate financing filings (not including amendments to filings) received by the Corporate Financing Department.
1 FINRA Rule 5110 requires all public offerings in which a member participates to be filed with FINRA for review, except as exempted from the filing requirement under paragraph (h).
2 FINRA Rule 5122 requires firms that offer or sell retail private placements of their own securities or that of a control entity to file offering documents and information about the issuer, the offering and the selling firms before the documents are provided to investors, except as exempted from the filing requirements under section (C).
3 FINRA Rule 5123 requires firms that sell non-proprietary, retail private placements to file with FINRA’s Corporate Financing Department within 15 calendar days of the date of first sale, offering documents and information about the issuer, the offering and the selling firms, except as exempted from the filing requirements under section (B).
FINRA INDUSTRY SNAPSHOT | 202134
III. Market Activity
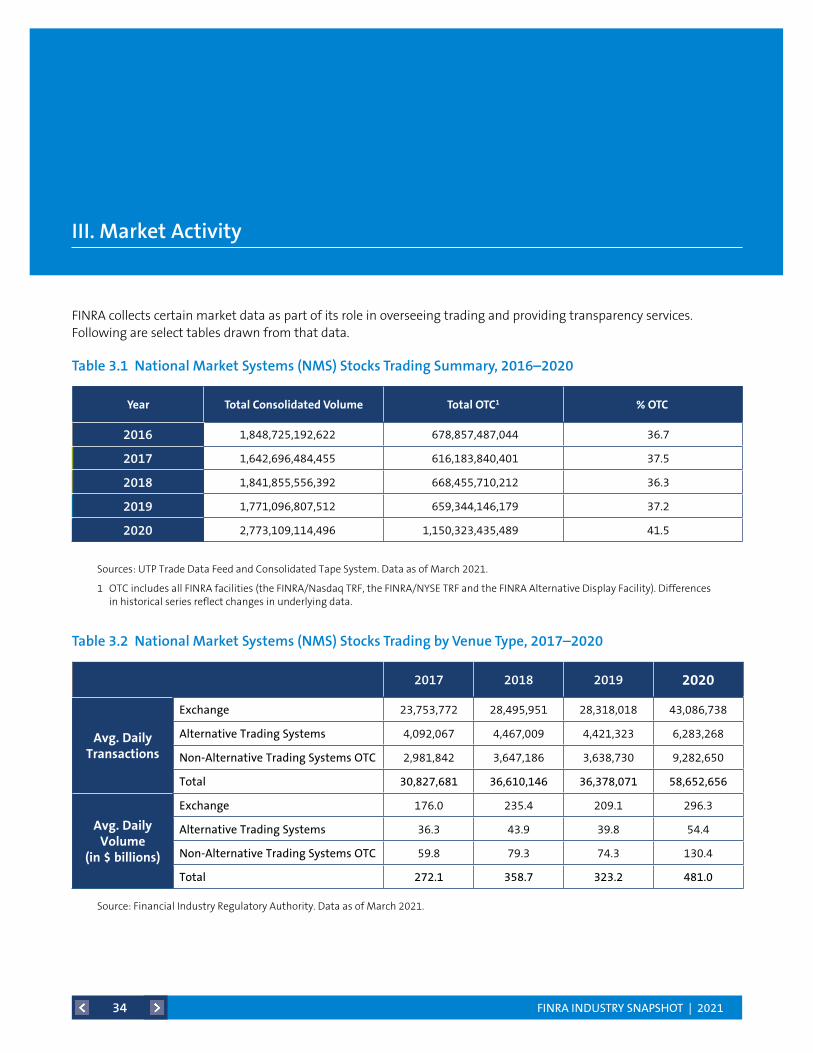
FINRA collects certain market data as part of its role in overseeing trading and providing transparency services. Following are select tables drawn from that data.
Year TotalConsolidatedVolume TotalOTC1 %OTC
2016 1,848,725,192,622 678,857,487,044 36.7
2017 1,642,696,484,455 616,183,840,401 37.5
2018 1,841,855,556,392 668,455,710,212 36.3
2019 1,771,096,807,512 659,344,146,179 37.2
2020 2,773,109,114,496 1,150,323,435,489 41.5
Sources: UTP Trade Data Feed and Consolidated Tape System. Data as of March 2021.
1 OTC includes all FINRA facilities (the FINRA/Nasdaq TRF, the FINRA/NYSE TRF and the FINRA Alternative Display Facility). Differences in historical series reflect changes in underlying data.
Table 3.1 National Market Systems (NMS) Stocks Trading Summary, 2016–2020
Source: Financial Industry Regulatory Authority. Data as of March 2021.
Table 3.2 National Market Systems (NMS) Stocks Trading by Venue Type, 2017–2020
2017 2018 2019 2020
Avg.DailyTransactions
Exchange 23,753,772 28,495,951 28,318,018 43,086,738
Alternative Trading Systems 4,092,067 4,467,009 4,421,323 6,283,268
Non-Alternative Trading Systems OTC 2,981,842 3,647,186 3,638,730 9,282,650
Total 30,827,681 36,610,146 36,378,071 58,652,656
Avg.DailyVolume
(in$billions)
Exchange 176.0 235.4 209.1 296.3
Alternative Trading Systems 36.3 43.9 39.8 54.4
Non-Alternative Trading Systems OTC 59.8 79.3 74.3 130.4
Total 272.1 358.7 323.2 481.0
FINRA INDUSTRY SNAPSHOT | 202135
III. Market Activity
Source: Financial Industry Regulatory Authority. Data as of March 2021.
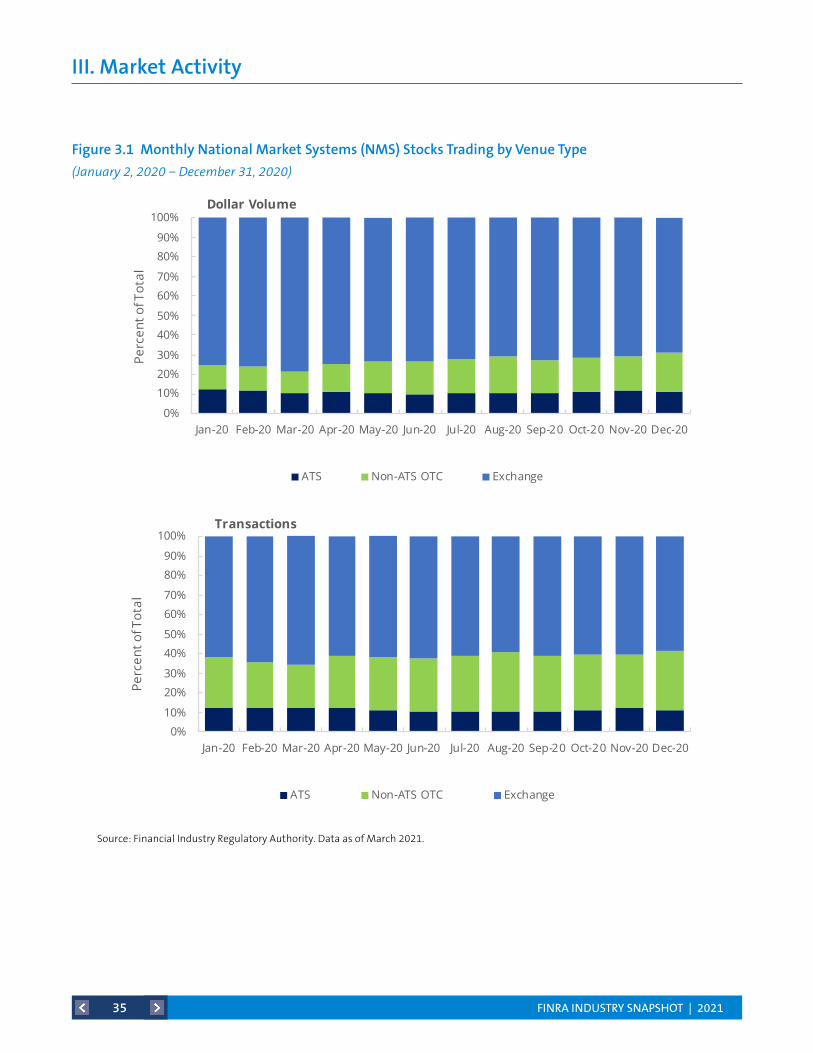
Figure 3.1 Monthly National Market Systems (NMS) Stocks Trading by Venue Type
(January 2, 2020 − December 31, 2020)
Figure 3.1 Monthly National Market Systems (NMS) Stocks Trading by Venue Type (January2, 2020 − December 31, 2020)
Source: Financial Industry Regulatory Authority. Data as of March 9, 2021.
0%
10%
20%
30%
40%
50%
60%
70%
80%
90%
100%
Jan-20 Feb-20 Mar-20 Apr-20 May-20 Jun-20 Jul-20 Aug-20 Sep-20 Oct-20 Nov-20 Dec-20
Perc
ent o
f Tot
al
Dollar Volume
ATS Non-ATS OTC Exchange
0%
10%
20%
30%
40%
50%
60%
70%
80%
90%
100%
Jan-20 Feb-20 Mar-20 Apr-20 May-20 Jun-20 Jul-20 Aug-20 Sep-20 Oct-20 Nov-20 Dec-20
Perc
ent o
f Tot
al
Transactions
ATS Non-ATS OTC Exchange
FINRA INDUSTRY SNAPSHOT | 202136
III. Market Activity
0%
2%
4%
6%
8%
10%
12%
14%
16%
18%
Jan-20
Feb-20
Mar-20
Apr-20
May-20
Jun-20Jul-2
0
Aug-20
Sep-20
Oct-20
Nov-20
Dec-20
Perc
ent o
f Tot
al N
MS
Trad
ing
Transactions Dollar Volume
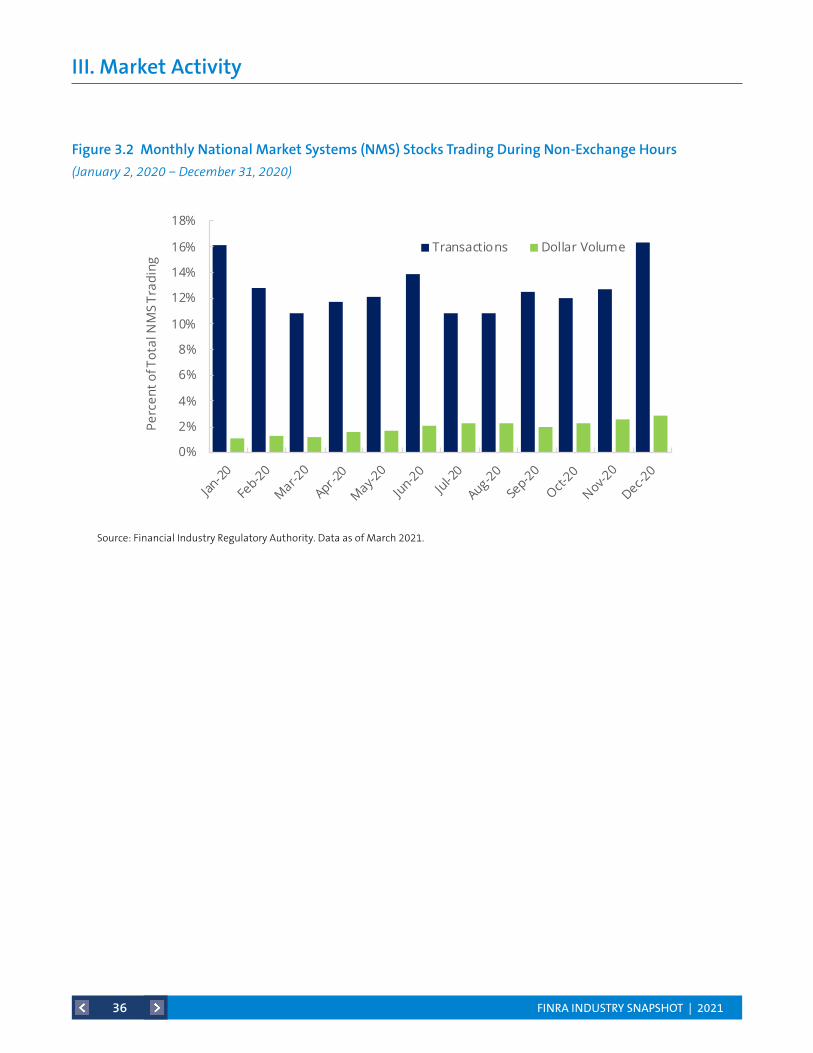
Figure 3.2 Monthly National Market Systems (NMS) Stocks Trading During Non-Exchange Hours (January 2, 2020 − December 31, 2020)
Source: Financial Industry Regulatory Authority. Data as of March 9, 2021.Source: Financial Industry Regulatory Authority. Data as of March 2021.
Figure 3.2 Monthly National Market Systems (NMS) Stocks Trading During Non-Exchange Hours
(January 2, 2020 − December 31, 2020)
FINRA INDUSTRY SNAPSHOT | 202137
III. Market Activity
Year NumberofBusinessDays OATSMessages2 TradeExecutions NumberofShares ValueofExecutions($)
2016 252 2,888,153,572 15,700,538 14,288,571,416 $229,150,816,535
2017 251 2,116,668,839 14,049,409 25,994,025,949 $167,638,810,372
2018 251 2,906,930,789 15,833,795 22,810,045,740 $210,082,567,583
2019 252 2,814,333,738 15,751,589 17,803,201,168 $197,800,786,367
2020 253 4,604,124,690 30,602,130 33,766,539,722 $312,712,074,022
Table 3.4 Order Audit Trail System (OATS) Activity – Daily Average OATS Events, 2016–20201
Source: Financial Industry Regulatory Authority. Data as of March 2021.
1 OATS events are aggregated using the event date.
2 OATS messages include orders, order cancellations, order modifications, new order routes and trade executions.
Year OATSMessages2 TradeExecutions NumberofShares ValueofExecutions($)
2016 727,857,074,040 3,956,598,062 3,600,740,666,499 $57,746,838,382,520
2017 531,334,133,703 3,526,436,638 6,524,543,642,610 $42,078,015,007,173
2018 729,701,296,497 3,974,302,137 5,725,382,645,944 $52,733,189,221,285
2019 709,284,021,657 3,969,421,366 4,486,590,424,253 $49,857,696,680,822
2020 1,165,005,274,005 7,742,534,063 8,543,001,368,752 $79,121,035,610,193
Source: Financial Industry Regulatory Authority. Data as of March 2021.
1 OATS events are aggregated using the event date.
2 OATS messages include orders, order cancellations, order modifications, new order routes and trade executions.
Table 3.3 Order Audit Trail System (OATS) Activity – Total OATS Events, 2016–20201
Year AverageDailyOTCEquitiesShareVolume
AverageDailyOTCEquitiesDollarVolume($)
AverageDailyOTCEquitiesTransactions
2016 4,982,665,567 $939,131,722 122,877
2017 11,107,884,572 $1,141,485,511 162,649
2018 8,588,230,489 $1,511,608,769 209,102
2019 6,027,132,766 $1,327,157,208 180,381
2020 11,559,398,293 $1,793,254,116 319,598
Table 3.5 Over-the-Counter (OTC) Equities Market Statistics, 2016–20201
Source: FINRA OTCE Market Statistics. Data as of March 2021.
1 Differences in historical series reflect changes in underlying data over time.
FINRA INDUSTRY SNAPSHOT | 202138
III. Market Activity
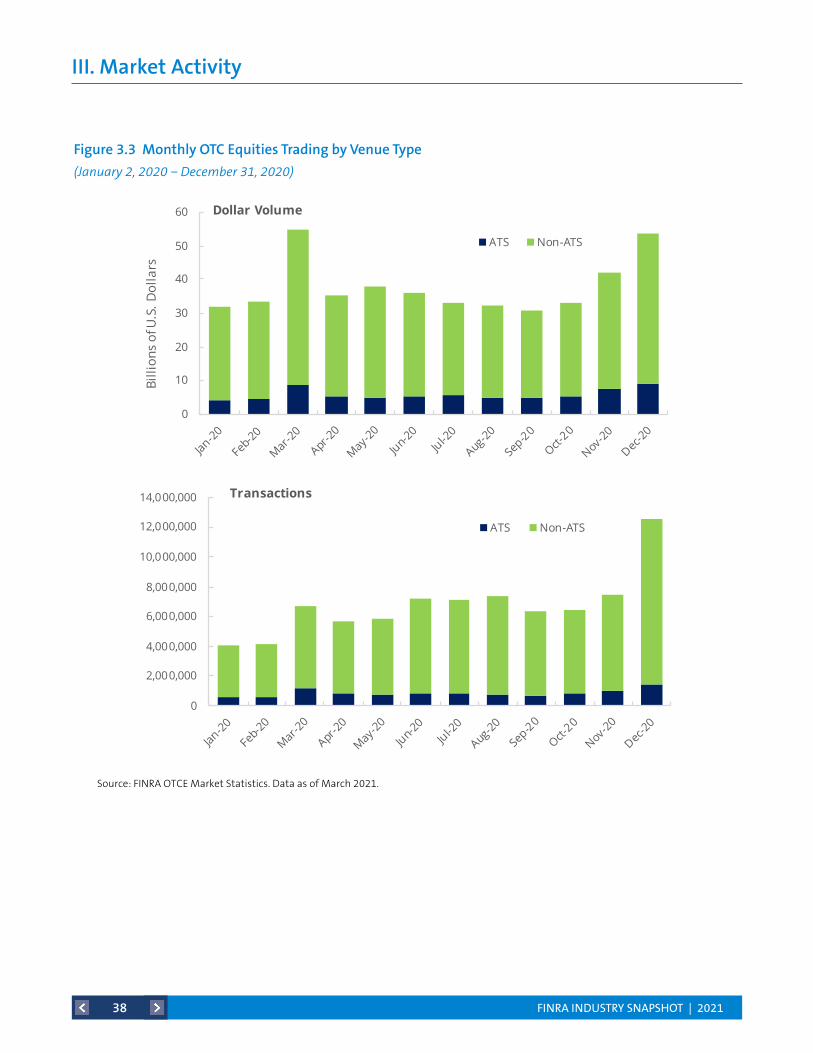
Figure 3.3 Monthly OTC Equities Trading by Venue Type
(January 2, 2020 − December 31, 2020)
0
2,000,000
4,000,000
6,000,000
8,000,000
10,000,000
12,000,000
14,000,000
Jan-20
Feb-20
Mar-20
Apr-20
May-20
Jun-20Jul-2
0
Aug-20
Sep-20
Oct-20
Nov-20
Dec-20
Transactions
ATS Non-ATS
0
10
20
30
40
50
60
Jan-20
Feb-20
Mar-20
Apr-20
May-20
Jun-20Jul-2
0
Aug-20
Sep-20
Oct-20
Nov-20
Dec-20
Billi
ons
of U
.S. D
olla
rs
Dollar Volume
ATS Non-ATS
Figure 3.3 Monthly OTC Equities Trading by Venue Type(January 2, 2020 − December 31, 2020)
Source: FINRA OTCE Market Statistics. Data as of March 9, 2021.Source: FINRA OTCE Market Statistics. Data as of March 2021.
FINRA INDUSTRY SNAPSHOT | 202139
III. Market Activity
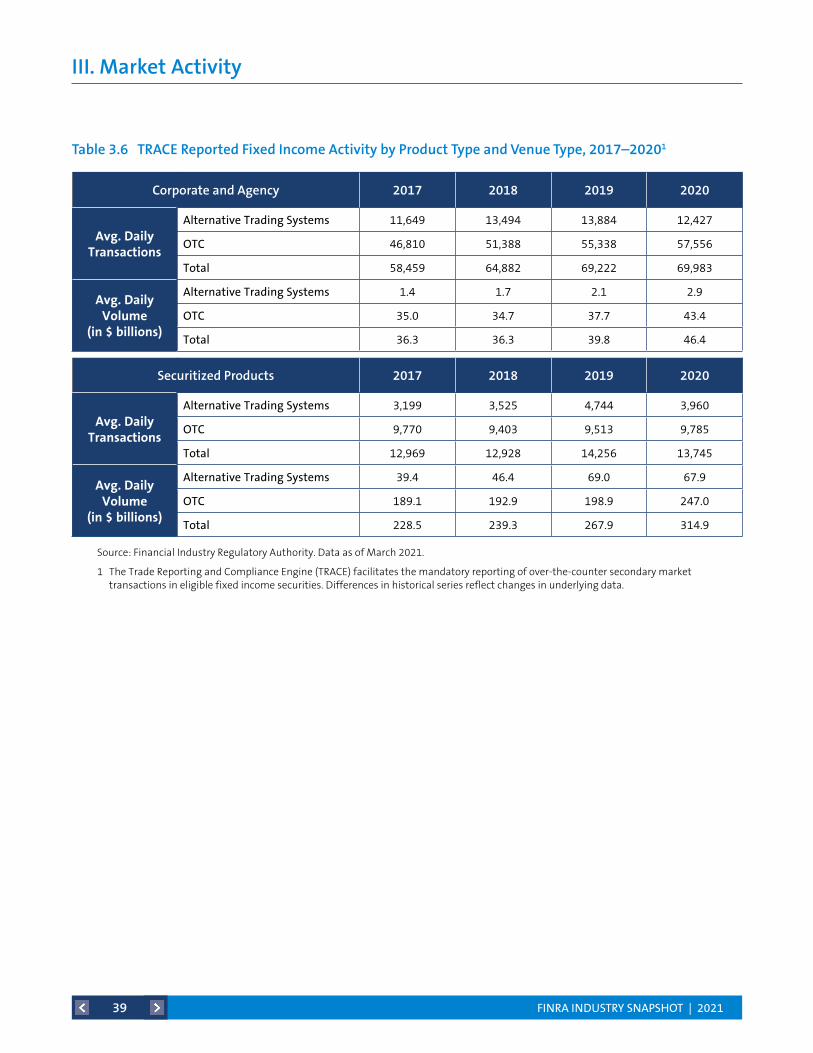
Corporate and Agency 2017 2018 2019 2020
Avg.DailyTransactions
Alternative Trading Systems 11,649 13,494 13,884 12,427
OTC 46,810 51,388 55,338 57,556
Total 58,459 64,882 69,222 69,983
Avg.DailyVolume
(in$billions)
Alternative Trading Systems 1.4 1.7 2.1 2.9
OTC 35.0 34.7 37.7 43.4
Total 36.3 36.3 39.8 46.4
Securitized Products 2017 2018 2019 2020
Avg.DailyTransactions
Alternative Trading Systems 3,199 3,525 4,744 3,960
OTC 9,770 9,403 9,513 9,785
Total 12,969 12,928 14,256 13,745
Avg.DailyVolume
(in$billions)
Alternative Trading Systems 39.4 46.4 69.0 67.9
OTC 189.1 192.9 198.9 247.0
Total 228.5 239.3 267.9 314.9
Source: Financial Industry Regulatory Authority. Data as of March 2021.
1 The Trade Reporting and Compliance Engine (TRACE) facilitates the mandatory reporting of over-the-counter secondary market transactions in eligible fixed income securities. Differences in historical series reflect changes in underlying data.
Table 3.6 TRACE Reported Fixed Income Activity by Product Type and Venue Type, 2017–20201
FINRA INDUSTRY SNAPSHOT | 202140
III. Market Activity
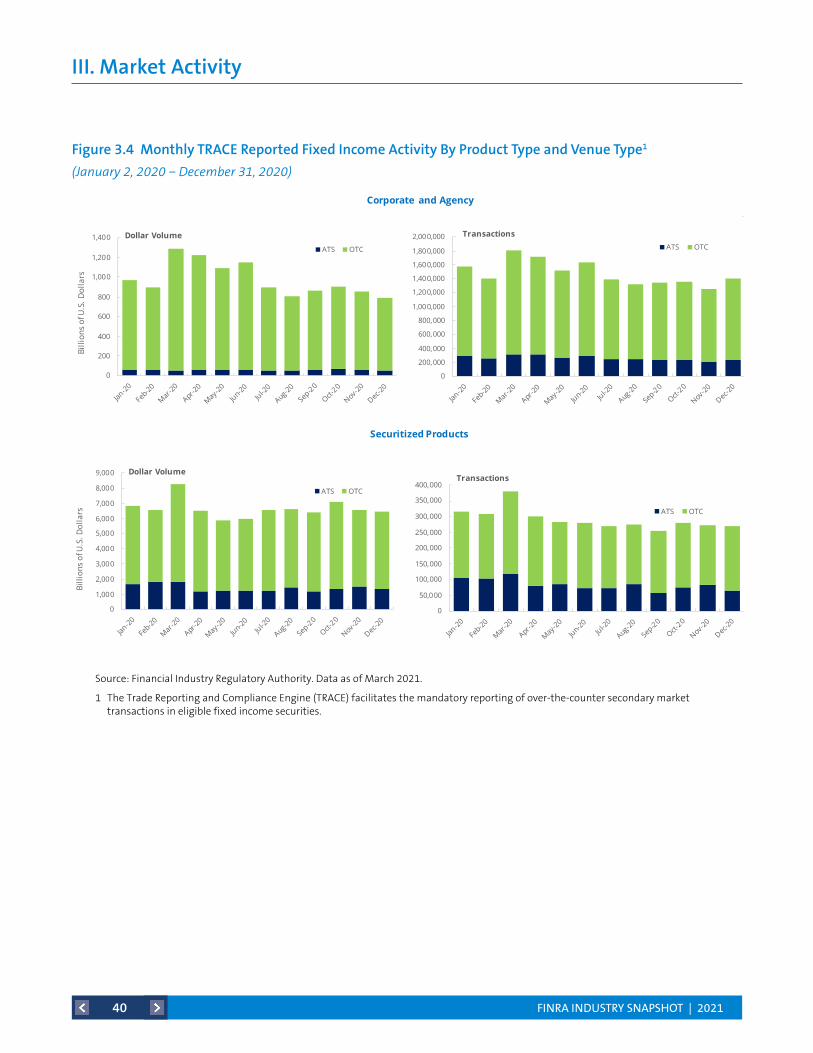
Figure 3.4 Monthly TRACE Reported Fixed Income Activity By Product Type and Venue Type1
(January 2, 2020 − December 31, 2020)
Figure 3.4 Monthly TRACE Reported Fixed Income Activity By Product Type and Venue Type1
(January 2, 2020 − December 31, 2020)
0
200
400
600
800
1,000
1,200
1,400
Jan-20
Feb-20
Mar-20
Apr-20
May-20
Jun-20Jul-2
0
Aug-20
Sep-20
Oct-20
Nov-20
Dec-20
Billi
ons
of U
.S. D
olla
rs
Dollar VolumeATS OTC
0
200,000
400,000
600,000
800,000
1,000,000
1,200,000
1,400,000
1,600,000
1,800,000
2,000,000
Jan-20
Feb-20
Mar-20
Apr-20
May-20
Jun-20Jul-2
0
Aug-20
Sep-20
Oct-20
Nov-20
Dec-20
TransactionsATS OTC
Corporate and Agency
0
1,000
2,000
3,000
4,000
5,000
6,000
7,000
8,000
9,000
Jan-20
Feb-20
Mar-20
Apr-20
May-20
Jun-20Jul-2
0
Aug-20
Sep-20
Oct-20
Nov-20
Dec-20
Billi
ons
of U
.S. D
olla
rs
Dollar Volume
ATS OTC
0
50,000
100,000
150,000
200,000
250,000
300,000
350,000
400,000
Jan-20
Feb-20
Mar-20
Apr-20
May-20
Jun-20Jul-2
0
Aug-20
Sep-20
Oct-20
Nov-20
Dec-20
Transactions
ATS OTC
Securitized Products
Source: Financial Industry Regulatory Authority. Data as of March 10, 2021.1The Trade Reporting and Compliance Engine (TRACE) facilitates the mandatory reporting of over-the-counter secondary market transactions in eligible fixed income securities. Source: Financial Industry Regulatory Authority. Data as of March 2021.
1 The Trade Reporting and Compliance Engine (TRACE) facilitates the mandatory reporting of over-the-counter secondary market transactions in eligible fixed income securities.
FINRA INDUSTRY SNAPSHOT | 202141
III. Market Activity
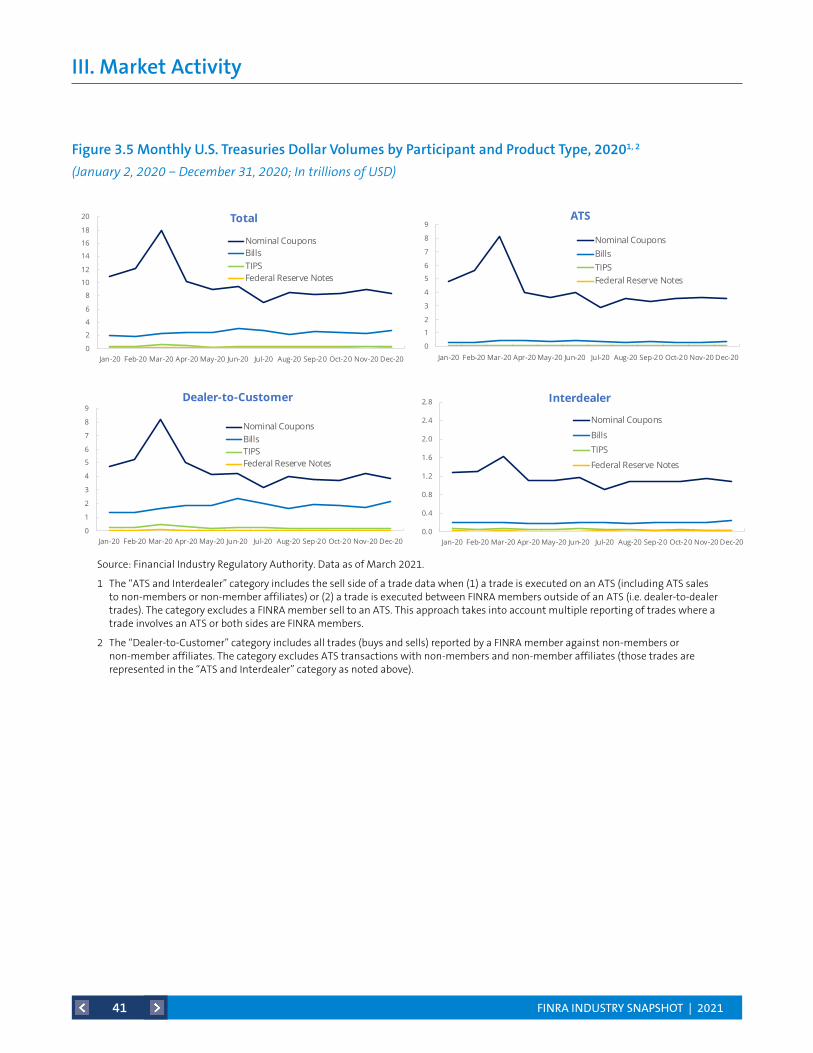
Figure 3.5 Monthly U.S. Treasuries Dollar Volumes by Participant and Product Type, 20201, 2
(January 2, 2020 − December 31, 2020; In trillions of USD)Figure 3.x Monthly TRACE Volumes by Participant and Product Type, Jan. 2020−Mar. 2021(In trillions of USD)
0
1
2
3
4
5
6
7
8
9
Jan-20 Feb-20 Mar-20 Apr-20May-20 Jun-20 Jul-20 Aug-20 Sep-20 Oct-20 Nov-20Dec-20
ATS
Nominal CouponsBillsTIPSFederal Reserve Notes
0
1
2
3
4
5
6
7
8
9
Jan-20 Feb-20 Mar-20 Apr-20 May-20 Jun-20 Jul-20 Aug-20 Sep-20 Oct-20 Nov-20 Dec-20
Dealer-to-Customer
Nominal CouponsBillsTIPSFederal Reserve Notes
0.0
0.4
0.8
1.2
1.6
2.0
2.4
2.8
Jan-20 Feb-20 Mar-20 Apr-20 May-20 Jun-20 Jul-20 Aug-20 Sep-20 Oct-20 Nov-20 Dec-20
Interdealer
Nominal Coupons
BillsTIPS
Federal Reserve Notes
Figure 3.5 Monthly U.S. Treasuries Dollar Volumes by Participant and Product Type1,2
(January 2, 2020 − December 31, 2020; In trillions of USD)
0
2
4
6
8
10
12
14
16
18
20
Jan-20 Feb-20 Mar-20 Apr-20 May-20 Jun-20 Jul-20 Aug-20 Sep-20 Oct-20 Nov-20 Dec-20
Total
Nominal CouponsBillsTIPSFederal Reserve Notes
Source: Financial Industry Regulatory Authority. Data as of March 2021.
1The “ATS and Interdealer” category includes the sell side of a trade data when (1) a trade is executed on an ATS (including ATS sales to non-members or non-member affiliates) or (2) a trade is executed between FINRA members outside of an ATS (i.e. dealer-to-dealer trades). The category excludes a FINRA member sell to an ATS. This approach takes into account multiple reporting of trades where a trade involves an ATS or both sides are FINRA members.
2The “Dealer-to-Customer” category includes all trades (buys and sells) reported by a FINRA member against non-members or non-member affiliates. The category excludes ATS transactions with non-members and non-member affiliates (those trades are represented in the “ATS and Interdealer” category as noted above).
Source: Financial Industry Regulatory Authority. Data as of March 2021.
1 The “ATS and Interdealer” category includes the sell side of a trade data when (1) a trade is executed on an ATS (including ATS sales to non-members or non-member affiliates) or (2) a trade is executed between FINRA members outside of an ATS (i.e. dealer-to-dealer trades). The category excludes a FINRA member sell to an ATS. This approach takes into account multiple reporting of trades where a trade involves an ATS or both sides are FINRA members.
2 The “Dealer-to-Customer” category includes all trades (buys and sells) reported by a FINRA member against non-members or non-member affiliates. The category excludes ATS transactions with non-members and non-member affiliates (those trades are represented in the “ATS and Interdealer” category as noted above).
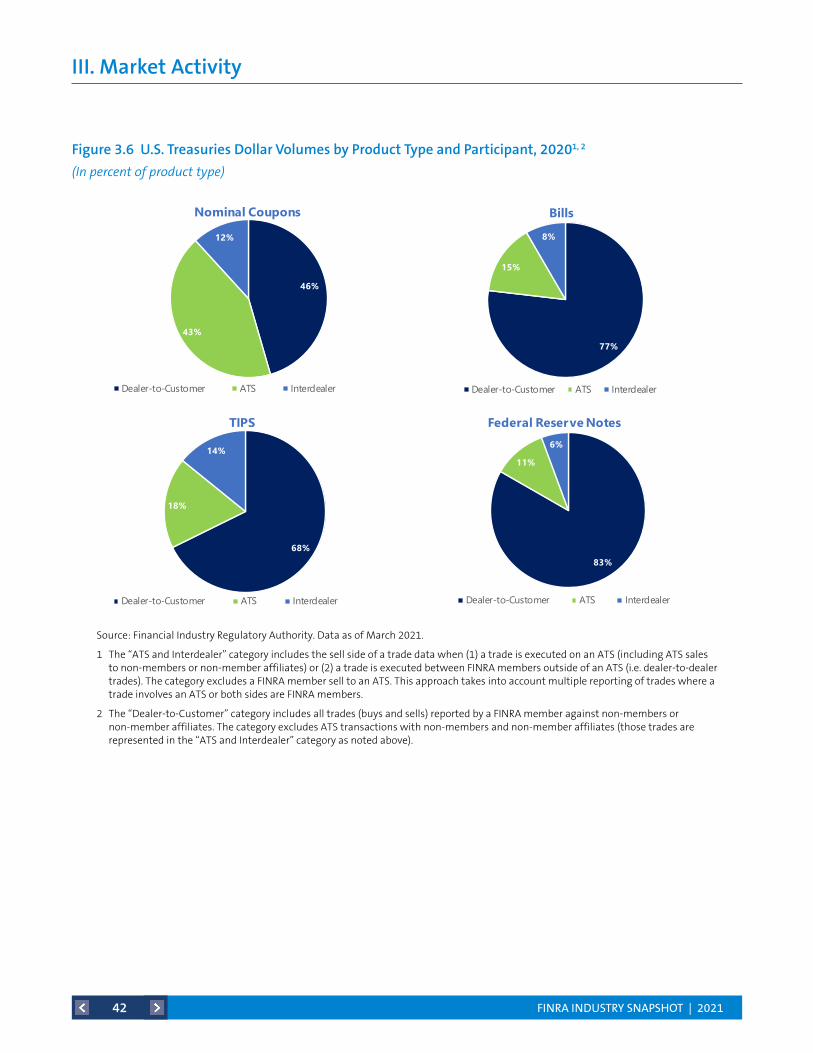
FINRA INDUSTRY SNAPSHOT | 202142
III. Market Activity
Figure 3.6 U.S. Treasuries Dollar Volumes by Product Type and Participant, 20201, 2
(In percent of product type)
46%
43%
12%
Nominal Coupons
Dealer-to-Customer ATS Interdealer
77%
15%
8%
Bills
Dealer-to-Customer ATS Interdealer
68%
18%
14%
TIPS
Dealer-to-Customer ATS Interdealer
83%
11%
6%
Federal Reserve Notes
Dealer-to-Customer ATS Interdealer
Figure 3.6 U.S. Treasuries Dollar Volumes by Product Type and Participant, 20201,2
(In percent of product type)
Source: Financial Industry Regulatory Authority. Data as of March 2021.
1The “ATS and Interdealer” category includes the sell side of a trade data when (1) a trade is executed on an ATS (including ATS sales to non-members or non-member affiliates) or (2) a trade is executed between FINRA members outside of an ATS (i.e. dealer-to-dealer trades). The category excludes a FINRA member sell to an ATS. This approach takes into account multiple reporting of trades where a trade involves an ATS or both sides are FINRA members.
2The “Dealer-to-Customer” category includes all trades (buys and sells) reported by a FINRA member against non-members or non-member affiliates. The category excludes ATS transactions with non-members and non-member affiliates (those trades are represented in the “ATS and Interdealer” category as noted above).
Source: Financial Industry Regulatory Authority. Data as of March 2021.
1 The “ATS and Interdealer” category includes the sell side of a trade data when (1) a trade is executed on an ATS (including ATS sales to non-members or non-member affiliates) or (2) a trade is executed between FINRA members outside of an ATS (i.e. dealer-to-dealer trades). The category excludes a FINRA member sell to an ATS. This approach takes into account multiple reporting of trades where a trade involves an ATS or both sides are FINRA members.
2 The “Dealer-to-Customer” category includes all trades (buys and sells) reported by a FINRA member against non-members or non-member affiliates. The category excludes ATS transactions with non-members and non-member affiliates (those trades are represented in the “ATS and Interdealer” category as noted above).

www.finra.org
© 2021 FINRA. All rights reserved.
FINRA and other trademarks of the Financial Industry Regulatory Authority, Inc. may not be used without permission.
21_0078.1 – 04/21