Embed Size (px)
Citation preview

1
2021 EAST CENTRAL DISTRICT COMPREHENSIVE COMMUNITY
HEALTH NEEDS ASSESSMENT
BOONE | COLFAX | NANCE | PLATTE
Report prepared by the Nebraska Association for Local Health Directors in conjunction with East Central District Health Department
Sponsored by: Boone County Health Center, CHI Health Schuyler, Columbus Community Hospital, Genoa Medical Facilities

2
Table of Contents Introduction .................................................................................................................................................. 4
Health Equity-District Overview.................................................................................................................... 8
Population Characteristics ......................................................................................................................... 10
District Overview ..................................................................................................................................... 10
Population Demographics ................................................................................................................... 10
Race and Ethnicity ............................................................................................................................... 11
Median Age ......................................................................................................................................... 13
County Quick Facts .............................................................................................................................. 15
Health Issue Overview ................................................................................................................................ 19
Socio-Economic Status ........................................................................................................................... 20
Economics ........................................................................................................................................... 20
Educational Level ................................................................................................................................ 25
Health Outcomes ........................................................................................................................................ 26
Leading Causes of Death ......................................................................................................................... 26
General Health ....................................................................................................................................... 29
Leading Causes of Chronic Disease ......................................................................................................... 29
Cancer ................................................................................................................................................. 30
Heart Disease ...................................................................................................................................... 38
Overweight/Obesity ............................................................................................................................ 40
Diabetes .............................................................................................................................................. 44
Leading Causes of Injury ......................................................................................................................... 46
Behavioral/Mental Health and Related Risk Factors .............................................................................. 48
Suicide Risk .......................................................................................................................................... 51
Adverse Childhood Experiences .......................................................................................................... 51
Substance Use Disorders ........................................................................................................................ 55
Alcohol Use ......................................................................................................................................... 55
Maternal and Perinatal Outcomes ........................................................................................................ 57
Healthcare Access and Utilization ............................................................................................................. 60
Healthcare Insurance Coverage .............................................................................................................. 60
Healthcare Providers ............................................................................................................................... 61
Health Care and Prevention Assets ....................................................................................................... 65
Access for Aging Populations .............................................................................................................. 66

3
Access for Veteran Populations .......................................................................................................... 66
Preventative Screenings ......................................................................................................................... 67
Barriers to Accessing Health Care .......................................................................................................... 70
Community Themes and Strengths ........................................................................................................... 71
Platte and Colfax counties highlights: ................................................................................................. 73
Boone and Nance counties highlights: ................................................................................................ 74
Health Summary: ECDHD District .............................................................................................................. 75
Appendices ................................................................................................................................................. 76
Appendix A: List of Tables ....................................................................................................................... 76
Appendix B: List of Figures ...................................................................................................................... 53
Appendix C: Community Health Survey Demographics .......................................................................... 55
Appendix D: References .......................................................................................................................... 56

4
Introduction East Central District Health Department (ECDHD) serves 52,890i people within a four-county district comprised of Boone, Colfax, Nance, and Platte counties in northeastern Nebraska. All of these counties are classified as rural counties by the Federal Office of Rural Health Policyii.
ECDHD was formed in 2002 as a result of State legislation that applied Tobacco Master Settlement funds to organize local health departments statewide. The mission of ECDHD is to complement community health services in order to make a positive difference in the quality of life for all individuals and families.
As Chief Health Strategist—who convenes partners that investigate and take action to make meaningful progress on complex health community issuesiii—for this four-county district, ECDHD conducts a community health assessment (CHA) and community health improvement plan (CHIP) every three years. The CHA is a process of gathering and interpreting information from multiple and diverse sources in order to develop a deeper understanding of the health and wellbeing of a community/jurisdiction. The CHA process describes the current health status of the community, identifies, prioritizes health issues, and develops a better understanding of the range of factors that influence and impact health. This report focuses on the Community Health Status Assessment portion of ECDHD’s CHA. Data were gathered from secondary sources such as County Health Rankings and Roadmaps (CHRR), Nebraska Department of Health and Human Services Office of Health Disparities and Health Equity Data Dashboards and American Community Survey/US Census Bureau. This assessment identifies leading causes and emerging issues that impact community health and quality of life, including the leading causes of mortality and morbidity, the general health status of community members, disparities in health outcomes, the access and availability of behavioral and health care, etc.
Five of the main partners who take the lead role in providing healthcare for the communities within ECDHD region and play an important role in the development of this assessment include:
Boone County Health Center, located in Albion, Nebraska, is a recognized leader in providing a continuum of healthcare to the 10,000 rural residents in Boone, Antelope, Greeley, western Madison and Platte, Nance, and Wheeler Counties. The Health Center is a county hospital, twenty-five bed, five nursery facility, that sees over 70,000 outpatient visits and over 30,000 clinic visits on an annual basis and is the primary source of healthcare for the rural communities it serves in the towns of Albion, Spalding, Newman Grove, Fullerton, and Elgin. With eight physicians and four physician assistants, a well-rounded medical staff is present to meet the

5
needs of the patients and their families. In addition, two affiliate physician clinics are in St. Edward and Cedar Rapids. Services provided by the 250 employees at the Health Center include; cardiac rehab, physical therapy, occupational therapy, speech therapy, radiology (ultrasound, digital mammography, nuclear medicine, CT, open MRI, DEXA scanner, fluoroscopy and general x-ray), full laboratory services, oncology, aesthetics care, full OB services, home health and mental health services. In addition to the services provided by our local staff, a full range of seventeen specialty clinics are scheduled throughout the month to allow patients the ability to obtain these services at home. CHI Health Schuyler, located in Schuyler, Nebraska, is a 25-bed Critical Access Hospital. The physicians, nurses, and other associates at this faith-based community hospital are committed to delivering personalized, compassionate care to approximately 10,441 individuals that reside in Colfax County. Such care takes many forms - technologically advanced medical services, quality health education, health screenings, and more. Beyond the hospital walls, Memorial Hospital works closely with businesses, community groups, churches, schools, social service agencies, and others to build a healthier community. Acute care and outpatient services include general medical-surgical care, skilled nursing care, home health care, outpatient specialty care that includes general surgery, cardiology, urology, gastrointestinal, orthopedic, gynecology, otolaryngology, nephrology, and podiatry services. Restorative services such as physical therapy and cardiac rehabilitation are also available. A full complement of diagnostic services are offered for the laboratory and radiology which include: CT, MRI, mammography, ultrasound, nuclear medicine, echocardiograms, and vascular exams. Columbus Community Hospital is a community-owned, not-for-profit hospital. The facility opened its doors at its new location in August 2002 and is located on 60 acres in the northwest part of Columbus, NE. The Hospital is a 47-bed acute care facility (certified for swing beds), with 4 skilled nursing beds and 14 ambulatory outpatient beds, all private rooms. Columbus Community Hospital is licensed by the Nebraska State Board of Health and is accredited through The Joint Commission. The Hospital is also a member of the Nebraska Hospital Association (NHA), American Hospital Association (AHA), Voluntary Hospital Association (VHA) and Heartland Health Alliance (HHA). Columbus Community Hospital’s success can be measured in the quality of its facilities and the commitment of volunteers, staff, board, and physicians. Leadership consists of an 11-member Board of Directors, President/CEO, 4 Vice-Presidents, 38 members of the Medical Staff, over 550 employees, and 300+ volunteers. In October 2010, the Hospital expanded services in the Emergency Department, increased patient privacy in the registration area and created a women’s imaging center.
Genoa Medical Facilities (GMF) is the sole health care facility in Nance County, Nebraska, located in the city of Genoa, NE. GMF is comprised of the hospital, long-term care, and assisted living facilities. The hospital is a 19-bed, critical access, city owned, non-profit facility. GMF provides healthcare for a community of almost 5,000 people within a 10-mile radius. The 35-bed long-term care unit and the 20-unit assisted living facility provide a home for those whose needs include additional living care. Most importantly, GMF provides the care for the people of the community. Although the care people receive here pales by comparison to the services available at large facilities, this hospital is critical to the area and plays an important role in

6
providing access to care in the region. For this reason, the community is uniquely supportive of the hospital's mission, which is to be “Champions for Rural Healthcare.” Good Neighbor Community Health Center in Columbus is one of seven Federally Qualified Health Centers in Nebraska. Federally Qualified Health Centers are an integral part of the nation's health delivery system, providing cost effective, community oriented, and comprehensive primary health care services. Offering payment options on a sliding scale for patients who would be otherwise unable to afford health care, a Federally Qualified Health Center serves medically underserved areas and/or populations and receives Public Health Service funds.
County Health Rankings and Roadmaps (CHRR), is a collaboration between the Robert Wood Johnson Foundation and the University of Wisconsin that provides reliable county-level data and evidence to communities to help them identify opportunities to improve their health. The CHRR model was used as the lens for this community health status assessment (see Figure 1). Most county-level measures used in this assessment came from the County Health Rankings, a source of secondary data compiled from a variety of national and state data sources, such as Behavioral Risk Factor Surveillance System (BRFSS), Centers for Disease Control and Prevention databases, National Center for Health Statistics, USDA Food Environment Atlas, US Census, etc. To find out more, visit County Health Rankings: Measures and Data Sources.
Figure 1. County Health Rankings and Roadmaps Framework

7
This community health status assessment gathered data from secondary sources to assess the health status of the ECDHD region to identify emerging issues and trends, when possible, and to gauge big changes from the previous Community Health Improvement Plan priorities.
Additionally, this community health status assessment uses the responses to the community health survey, designed by ECDHD and distributed across the ECDHD region, to determine Community Themes and Strengths. The survey assessed community members’ perceptions of important health issues, including wellbeing and quality of life. This survey was available in English and Spanish and was distributed through ECDHD and their partners. To promote access to the survey, ECDHD posted the survey link on the ECDHD website and Facebook pages and made it available in print. Results are discussed in this report.

8
Health Equity-District Overview Rurality is associated with a number of negative health outcomes, specifically higher premature mortality rates, infant mortality rates, and age-adjusted death rates. Rurality is also associated with a number of negative health behaviors that contribute to chronic disease and death, such as unhealthy diets and limitations in meeting moderate or vigorous physical activity recommendations.iv These data paint a stark picture of health disparities given one factor, geography. Additionally, it is important to understand that there are disparities related to race and ethnicity independent from geography, and there are disparities related to geography independent from race and ethnicity. When disparities from independent factors overlap, such as race/ethnicity overlapping with geography, the result is a dual disparity resulting in some of the poorest health statuses seen in the nation.v Literacy and primary language must be considered in all health contexts. It is estimated that only 1 in 10 American adults have the skills needed to use health information that is routinely available in health care facilities, retail outlets, and the media.vi “Being able to read does not necessarily mean one will be health literate, however, the lack of basic literacy skills does mean that patients almost certainly will have difficulty reading and understanding basic health information”.vii Basic literacy and health literacy levels are also factors associated with health disparities. Language barriers also contribute to health disparities and exacerbate difficulties understanding and acting on health information.viii The ECDHD district is home to multiple immigrant populations and second-language English speakers with concentrations from Mexico, Central America, Guatemalan, Africa, Myanmar (Karenni) ix and as well as smaller populations from other areas.
Figure 2. Proportion of Residents with Limited English Proficiency in East Central District, By Countyx
Table 1 summarizes the health literacy indicators within the ECDHD district. Nearly 50% of the adult population in the ECDHD district reported that written health information and verbal health information given by medical professionals is not easy to understand.
0.96%
29.94%
0.74%
4.5%
0
5
10
15
20
25
30
35
Boone Colfax Nance Platte

9
Table 1. Health Literacy Indicators, ECDHD District
Health Literacy Indicatorsxi ECDHD Region
Very easy to get needed advice or information about health or medical topics 69% Written health information very easy to understand 51% Very easy to understand information that medical professions tell you 52%
Overall, ECDHD district has a higher percentage of residents who were Veterans than compared to the state (see Table 2). Nearly 1 in 7 residents in the ECDHD were Veterans aged 18 and older with over 1 in 3 residents in Platte County as Veterans aged 18 and older. Although the US Department of Veteran Affairs (VA) assists Veterans in accessing health care and other services, eligibility status for these services depends greatly upon the branch of service, time served, and discharge status. Even when Veterans access services, challenges still exist for health care professionals to effectively understand and treat health issues in Veterans due to complex military histories and medical needs. Unlike previous generations, many younger Veterans experienced frequent deployments to multiple conflict areas, exposure to explosions in close proximity and longer tours of duty.xii
Table 2. Veteran Status, ECDHD District
Veteran Statusxiii % Veterans (age 18+)
Boone County 7% Colfax County 6% Nance County 5% Platte County 35% ECDHD District 14% Nebraska 6%
10
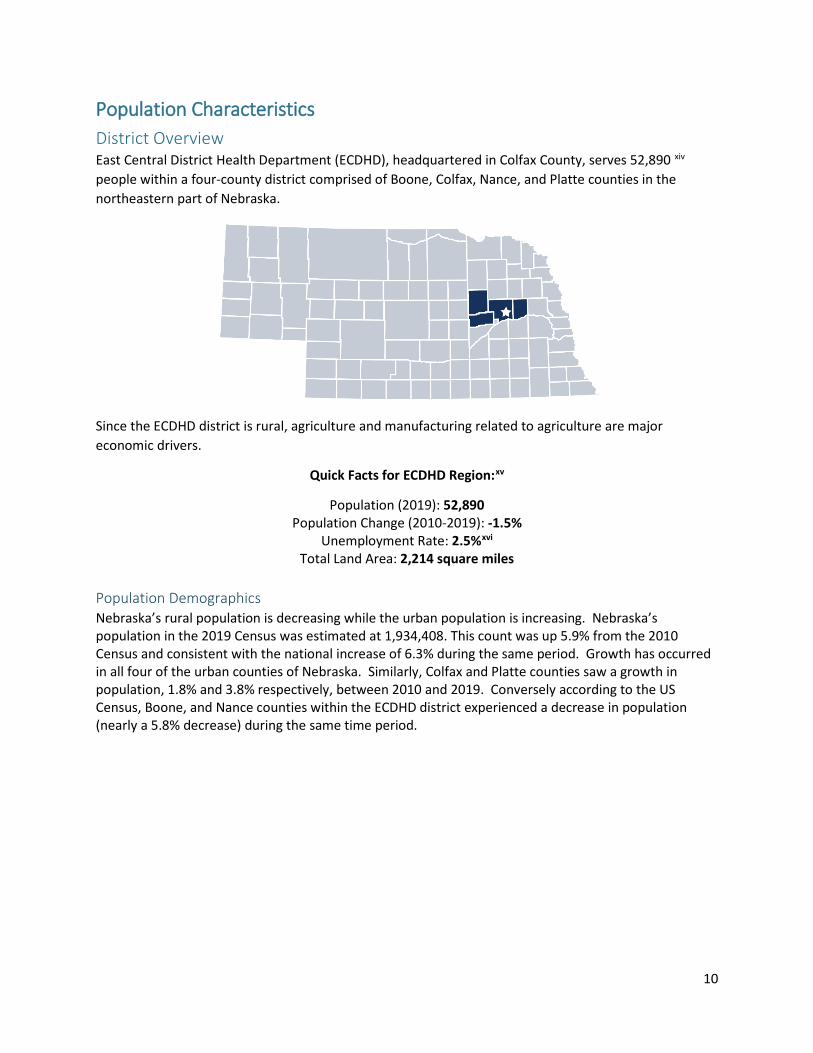
Population Characteristics District Overview East Central District Health Department (ECDHD), headquartered in Colfax County, serves 52,890 xiv people within a four-county district comprised of Boone, Colfax, Nance, and Platte counties in the northeastern part of Nebraska.
Since the ECDHD district is rural, agriculture and manufacturing related to agriculture are major economic drivers.
Quick Facts for ECDHD Region:xv
Population (2019): 52,890 Population Change (2010-2019): -1.5%
Unemployment Rate: 2.5%xvi Total Land Area: 2,214 square miles
Population Demographics Nebraska’s rural population is decreasing while the urban population is increasing. Nebraska’s population in the 2019 Census was estimated at 1,934,408. This count was up 5.9% from the 2010 Census and consistent with the national increase of 6.3% during the same period. Growth has occurred in all four of the urban counties of Nebraska. Similarly, Colfax and Platte counties saw a growth in population, 1.8% and 3.8% respectively, between 2010 and 2019. Conversely according to the US Census, Boone, and Nance counties within the ECDHD district experienced a decrease in population (nearly a 5.8% decrease) during the same time period.

11
Figure 3. Overall Population Trend, ECDHD (1970-2019)
Race and Ethnicity Nebraska has a high Hispanic population growth rate. Between 2005 and 2014, the Hispanic population growth rate was more than five times higher than the overall population growth rate in Nebraska (55% vs. 10%).xvii Hispanics represented 5.6% of the total population in Nebraska in 2000, 9.2% in 2010, and 11.4% in 2019, and it is estimated that by 2025, the Hispanics will make up nearly a quarter of Nebraska’s population (23.4%). Hispanics in Nebraska are from a variety of countries, but Mexico is the primary country of origin (76%). In the ECDHD district, the majority of the Hispanic population resided in Colfax County (47%), over two times the Hispanic population across the ECDHD district (18%) and the state (11%), followed by Platte County (20%)—see Figure 4. Racial diversity is greatest in Colfax County with 3.8% of residents identifying as Black, 3.3% as American Indian/Alaskan Native, 1.1% as Asian, and 0.5% as Native Hawaiian/Other Pacific Islander, which is more than three quarters the state percentage of residents identifying as Black (4.8%). All other counties with ECDHD are predominately White.

12
Figure 4. Hispanic Origin, ECDHD District
Figure 5. Race by county, ECDHD District

13
Median Age The average median age in the ECDHD district was 40 years in 2018, which was four years older than the average median age in Nebraska.
Figure 6. Age Distribution, ECDHD District by county
Notably, nearly 1 in 4 adults in Boone County were 65 years and older, and about 1 in 5 adults in Nance and Platte counties were 65 years and older (22% and 18%, respectively). Colfax County (14%) was below the percentage of adults aged 65 years and older across the ECDHD district (19%) and state (16%).

14
Figure 7. Percent Population Aged 65+, ECDHD District

15
County Quick Facts
Quick Facts for Boone County:xviii
Population (2019): 5,192 Population Change (2010-2019): -5.7% % children under 18: 23% Median Household Income: $51,900 % total population in poverty: 10% % children living in povertyxix: 13% Unemployment Rate: 2.5%xx Race/Ethnicityxxi--
% Hispanic: 2% % non-Hispanic, White: 96% % Black: 0.4% % American Indian/Alaska Native: 0.3% % Asian: 0.3% % Native Hawaiian/Other Pacific Islander: 0.0%
Figure 8. Proportion of Hispanic or Latino Residents of East Central District, Boone County.xxii
White98.38%
Black0.41%
Asian0.11%
Native American/Alaska Native0.11%
Native Hawaiian/Paci
fic Islander0.11%
Other0.11%
Multiple0.75%
Other
Boone County

16
Quick Facts for Colfax County:xxiii
Population (2019): 10,709 Population Change (2010-2019): 1.8% % children under 18: 30% Median Household Income: $55,800 % total population in poverty: 8% % children living in povertyxxiv: 13% Unemployment Rate: 2.3%xxv Race/Ethnicityxxvi--
% Hispanic: 47% % non-Hispanic, White: 48% % Black: 3.8% % American Indian/Alaska Native: 3.3% % Asian: 1.1%
% Native Hawaiian/Other Pacific Islander: 0.5%
Figure 9. Proportion of Hispanic or Latino Residents of East Central District, Colfax County.xxvii
White86.89%
Black3.48%
Asian0.59%
Native American/Alaska
Native1.54%
Native Hawaiian/Pacific Islander0.20%
Other4.66%
Multiple2.64%
Other13.11%
Colfax County

17
Quick Facts for Nance County:xxviii
Population (2019): 3,519 Population Change (2010-2019): -5.8% % children under 18: 22% Median Household Income: $47,300 % total population in poverty: 10% % children living in povertyxxix: 14% Unemployment Rate: 2.5%xxx Race/Ethnicityxxxi--
% Hispanic: 3% % non-Hispanic, White: 95% % Black: 0.5% % American Indian/Alaska Native: 0.8% % Asian: 0.1%
% Native Hawaiian/Other Pacific Islander: 0.0%
Figure 10. Proportion of Hispanic or Latino Residents of East Central District, Nance Countyxxxii
White99.04%
Black0.45%
Asian0.06%
Native American/Alaska Native0.39%
Other0.06%
Other0.96%
Nance County

18
Quick Facts for Platte County:xxxiii
Population (2019): 33,470 Population Change (2010-2019): 3.8% % children under 18: 26% Median Household Income: $63,700 % total population in poverty: 9% % children living in povertyxxxiv: 11% Unemployment Rate: 2.6%xxxv Race/Ethnicityxxxvi--
% Hispanic: 20% % non-Hispanic, White: 77% % Black: 0.6% % American Indian/Alaska Native: 1.3% % Asian: 1.0%
% Native Hawaiian/Other Pacific Islander: 0.0%
Figure 11. Proportion of Hispanic or Latino Residents of East Central District, Platte County.xxxvii
White95.38%
Black0.48%
Asian0.77%
Native American/
Alaska Native…
Native Hawaiian/Pacific
Islander…
Other1.93%
Multiple1.06%
Other4.62%
Platte County

19
Health Issue Overview The subsequent body of the report presents data from 1) secondary sources, including the County Health Roadmaps and Rankings, the Behavioral Risk Factor Surveillance System (BRFSS), and the Census; 2) the 2021 Community Concerns Survey; and 3) focus groups conducted with residents and stakeholders from all four counties within the East Central Health District.
Table 3 displays the change within the primary health indicators measured across these data collection methodologies from the last Community Health Needs Assessment.
Table 3. Health issue status change from 2018 to 2021, ECDHD District
▲ = Improvement ▼ = Worsened
Median household income Boone ▲ Colfax ▲ Nance ▲ Platte ▲
Poverty Boone ▼ Colfax ▲ Nance ▲ Platte ▼
Children in poverty Boone ▼ Colfax ▲ Nance ▼ Platte No change
Reported health as fair or poor (ECD) ▼ Overall cancer rates
Boone ▲ Colfax ▲ Nance ▲ Platte ▲
Ever told they have high cholesterol (ECD) ▼ Ever told they have high blood pressure No change Diabetes (ECD) ▼ Injury Deaths
Boone ▼ Colfax ▲ Nance ▼ Platte ▼
Mental health was not good 14 or more of the past 30 days (ECD) ▼ Ever told they have depression (ECD) ▼ Binge drinking (ECD) ▼ Without health insurance
Boone ▼ Colfax ▼ Nance ▼ Platte ▼
Up to date on colon cancer screenings (50-75) (ECD) ▲ Infant Mortality
Boone ▲ Colfax ▼ Nance ▼ Platte ▼
Single parent family household (ECD) ▼ Adult smoking rate (ECD) ▼ Smokeless tobacco use (ECD) ▼ Highschool graduation rate (ECD) ▲ Food insecurity ▲

20
Socio-Economic Status Economics According to the American Community Survey five-year estimate (2015-2019), the median household income for Nebraska was $59,724, and the median household income for the ECDHD region was $54,675. Platte County had a median household income slightly higher than other counties in the ECDHD district and the state. There is a disparity in the median household income among Hispanic earners when compared to non-Hispanic, White earners in every county (ranging from $3,000 to $12,200) within ECDHD region except in Colfax County where the population ratio of Hispanic to non-Hispanic, White residents is 1:1.
Figure 12. Median Household Income, ECDHD District
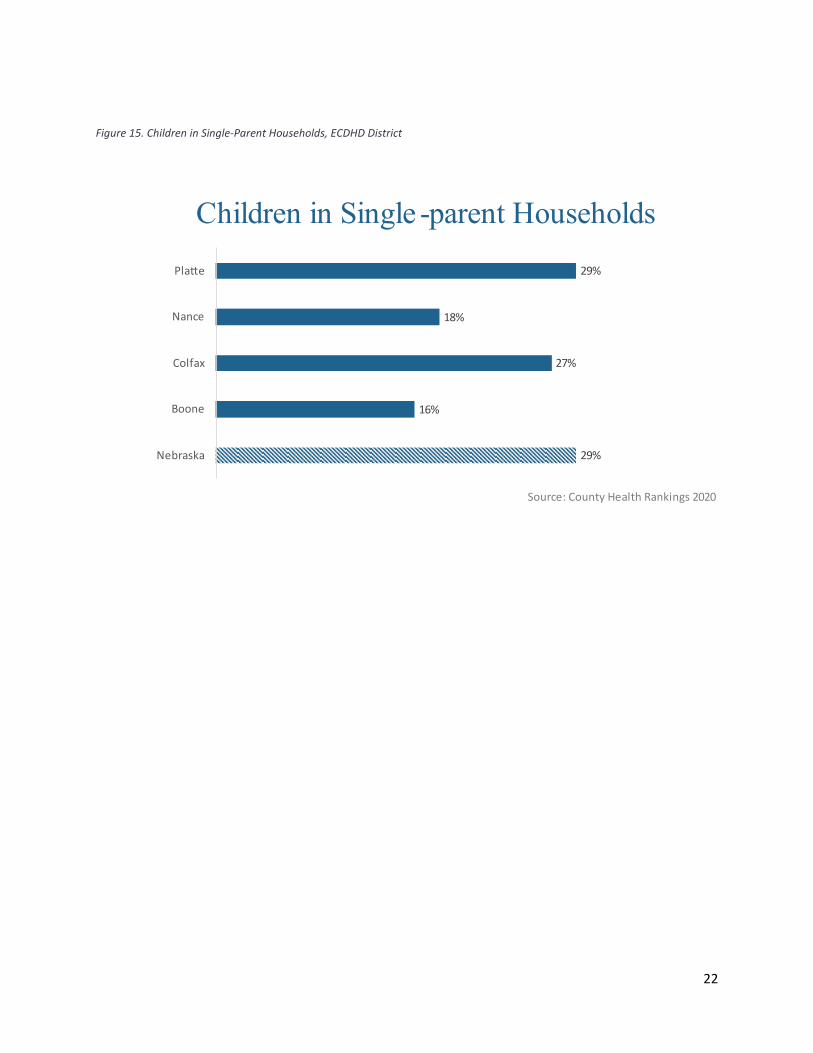
Nearly 1 in 4 children were from single family homes across the ECDHD region, which was less than the state average of 29%.xxxviii
xxxix Thirteen percent (13%) of children were living in poverty across all counties
within the ECDHD region, which is the same as the state (13%). ECDHD regional unemployment rate was 2.5%xl, slightly less than the state (2.8%). Despite the low unemployment rate across the ECDHD region, families still struggled to make ends meet.
Table 4. Economic Indicators, ECDHD District
Economic Indicators ECDHD region Nebraska Median Household Incomexli $54,675 $59,724 Children in Single-parent Householdsxlii 23% 29% Percentage of children under age 18 in povertyxliii 13% 13% Unemploymentxliv 2.5% 2.8%
$59,724 Nebraska
$54,675 ECDHD
$54,675 is the Median Household Income in the ECDHD District
Source: CHRR 2020
Boone Colfax Nance Pla�eOverall $51,900 $55,800 $47,300 $63,700Hispanic $47,500 $57,800 $43,600 $52,400White $54,100 $56,900 $46,600 $64,600
$-
$10,000
$20,000
$30,000
$40,000
$50,000
$60,000
$70,000
Overall Hispanic White

21
Figure 13. Poverty, ECDHD District
Figure 14. Access to food—% of population who lack adequate access to food, ECDHD District
Poverty in ECDHD District
Sources : Tota l popula�on: ACS 2013-2017; Chi ldren: County Heal th Rankings 2020
13% 13%14%
11%
13%
10%
8%
10%
9%10%
0%
2%
4%
6%
8%
10%
12%
14%
16%
Boone Col fax Nance Pla�e Nebraska
% chi ldren in poverty % tota l popula�on
Lacks adequate access to food
ECDHD
Source: CHRR 2020
10%
5%
11%
9%
12%
0%
2%
4%
6%
8%
10%
12%
14%
Boone Colfax Nance Pla�e Nebraska
22
Figure 15. Children in Single-Parent Households, ECDHD District
Children in Single -parent Households
Source: County Health Rankings 2020
29%
16%
27%
18%
29%
Nebraska
Boone
Colfax
Nance
Pla�e

23
Figure 16. Average Residential Value, ECDHD District
Figure 17. Percentage of Homes Occupied by Owner, ECDHD District
Average Residential Value
Source: NE Dept of Revenue, 2017 Annual Report of the Property Assessment Division
$137,300
$104,400
$93,100
$81,600
$131,200
NE
Boone
Colfax
Nance
Pla�e
% of Homes Occupied by the Owner
Source: US Census Bureau, 2012 -2016 American Community Survey 5-Year Es�mate
78%
72%
78%
72%
66%
Boone Colfax Nance Pla�e NE

24
Housing problems as an indicator is designed to understand the housing needs of low-income households. Figure 18 above is based on the percentage of households with at least 1 of 4 housing problems: overcrowding, high housing costs, or lack of kitchen or plumbing facilities. While at least 1 in 10 households in each county within the ECDHD region experienced housing problems, all counties fall at or below the state rate (13%).
Figure 18. Percentage of Households with Severe Housing Problems, ECDHD District
% of Households with Severe Housing Problems
Source: US Dept of Housing and Urban Development, Comprehensive Housing Affordability Strategy, 2018
11%
13%
9%
12%13%
0%
2%
4%
6%
8%
10%
12%
14%
16%
Boone Colfax Nance Pla�e NE
25
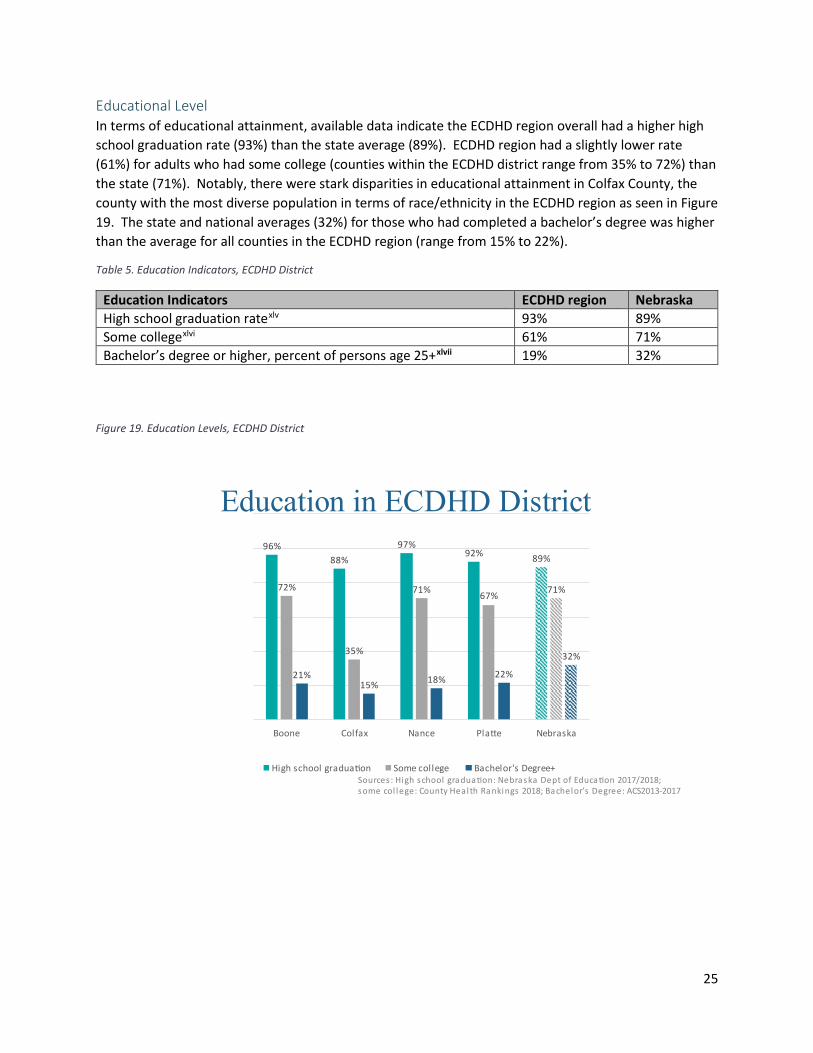
Educational Level In terms of educational attainment, available data indicate the ECDHD region overall had a higher high school graduation rate (93%) than the state average (89%). ECDHD region had a slightly lower rate (61%) for adults who had some college (counties within the ECDHD district range from 35% to 72%) than the state (71%). Notably, there were stark disparities in educational attainment in Colfax County, the county with the most diverse population in terms of race/ethnicity in the ECDHD region as seen in Figure 19. The state and national averages (32%) for those who had completed a bachelor’s degree was higher than the average for all counties in the ECDHD region (range from 15% to 22%).
Table 5. Education Indicators, ECDHD District
Education Indicators ECDHD region Nebraska High school graduation ratexlv 93% 89% Some collegexlvi 61% 71% Bachelor’s degree or higher, percent of persons age 25+xlvii 19% 32%
Figure 19. Education Levels, ECDHD District
Education in ECDHD District
Sources : High school gradua�on: Nebraska Dept of Educa�on 2017/2018; some col lege: County Heal th Rankings 2018; Bachelor’s Degree: ACS 2013-2017
96%88%
97%92% 89%
72%
35%
71% 67% 71%
21%15% 18% 22%
32%
Boone Colfax Nance Pla�e Nebraska
High school gradua�on Some college Bachelor's Degree+

26
Health Outcomes The aforementioned social and economic factors, along with health behaviors, clinical care, and physical environment—otherwise known as modifiable health factors, directly impact how well and how long an individual lives. Furthermore, health outcomes (quality and length of life) are compounded by the presence or the absence of policies and programs that promote health and longevity.
Leading Causes of Death Across the ECDHD district, cancer and heart disease were the leading causes of death, similar to state and national trends.
Table 6. Leading Causes of Death, Nebraska & US
Leading Causes of Death Nebraskaxlviii United Statesxlix
1. Cancer 2. Heart disease 3. Chronic lung diseases 4. Accidents 5. Cerebrovascular diseases
1. Heart disease 2. Cancer 3. Accidents (unintentional injuries) 4. Chronic lower respiratory diseases 5. Stroke (cerebrovascular diseases)
Figure 20 illustrates the leading causes of death by county within the ECDHD region.l In most cases, counties within the ECDHD region have higher rates of death due to cancer, unintentional injuries/accidents and cerebrovascular diseases than does the state. Across all counties within the ECDHD region, Colfax County suffered higher death rates from all these chronic diseases (see Figure 20) than the state, with the exception of cancer (150.3 and 154.8 per 100,000 population, respectively) and chronic lung disease (33.4 and 44.7 per 100,000 population, respectively). Nance County was the only county within the ECDHD region that suffered higher death rates from chronic lung disease (75 per 100,000 population) than the state (44.7 per 100,000 population), nearly 70% higher than the state. While all counties within the ECDHD experienced higher death rates from unintentional injuries/accidents, Colfax and Nance counties experienced over 2 times as many deaths than the state (80, 89.4 and 37.2 per 100,000 population, respectively). Furthermore, Colfax County was the only county within the ECDHD region that experienced higher death rates from diabetes than the state (23 and 23.7 per 100,000 population, respectively). Most all of these leading causes of death are associated with the conditions in which individuals thrive, i.e. social, economic, and educational factors. These leading causes of death can be influenced by implementing evidence-based public health strategies that include healthy eating and active living, not smoking, wearing a seatbelt, and limiting alcohol consumption, and by removing barriers that prevent individuals and communities from accessing a healthy lifestyle.

27
Figure 20. Leading Causes of Death, ECDHD District
An indicator that helps communities focus on prevention is the Years of Potential Life Lost (YPLL), which is a measurement of premature death (mortality). YPLL is an estimate of the average years a person would have lived if he/she had not died prematurely—typically before the age of 75. YPLL emphasizes deaths of younger persons, whereas statistics that include all mortality are dominated by deaths of the elderly.li From available data, Figure 21lii illustrates the average Years of Potential Life Lost for each county within the ECDHD region compared to the state in 2000.
Colfax County had a higher YPLL than the state and other counties in the ECDHD district, which may be due to having had higher death rates than the state and other counties in the ECDHD district.
Boone Col fax Nance Pla�e Nebraska*Heart Disease 136.1 151.1 132.1 128.5 143Cancer 166.3 150.3 166.6 159.1 154.8Chronic Lung Disease 27.2 33.4 75 31 44.7Uninten�onal Injury (Accidents ) 52.1 80 89.4 36.9 37.2Cerebrovascular Disease 45.1 36.3 41.2 32 33.6Diabetes 5.8 23 18.1 16.3 21.6Alzheimer's Disease 22.1 37.5 18.9 33.2 23.7
0
50
100
150
200
*Nebraska rates (age-adjusted to 2000 US popula�on) Source: NEDHHS Vi ta l Sta�s�cs Report 2016
Leading Causes of Death age-adjusted rate per 100,000 population (2012 -2016)

28
Figure 21. Years of Potential Life Lost (YPLL), ECDHD District
Years of Potential Life Lost (YPLL)
Source: County Health Rankings 2020
N/A
6,303
N/A
5,280
6,093
Boone
Colfax
Nance
Pla�e
Nebraska
29
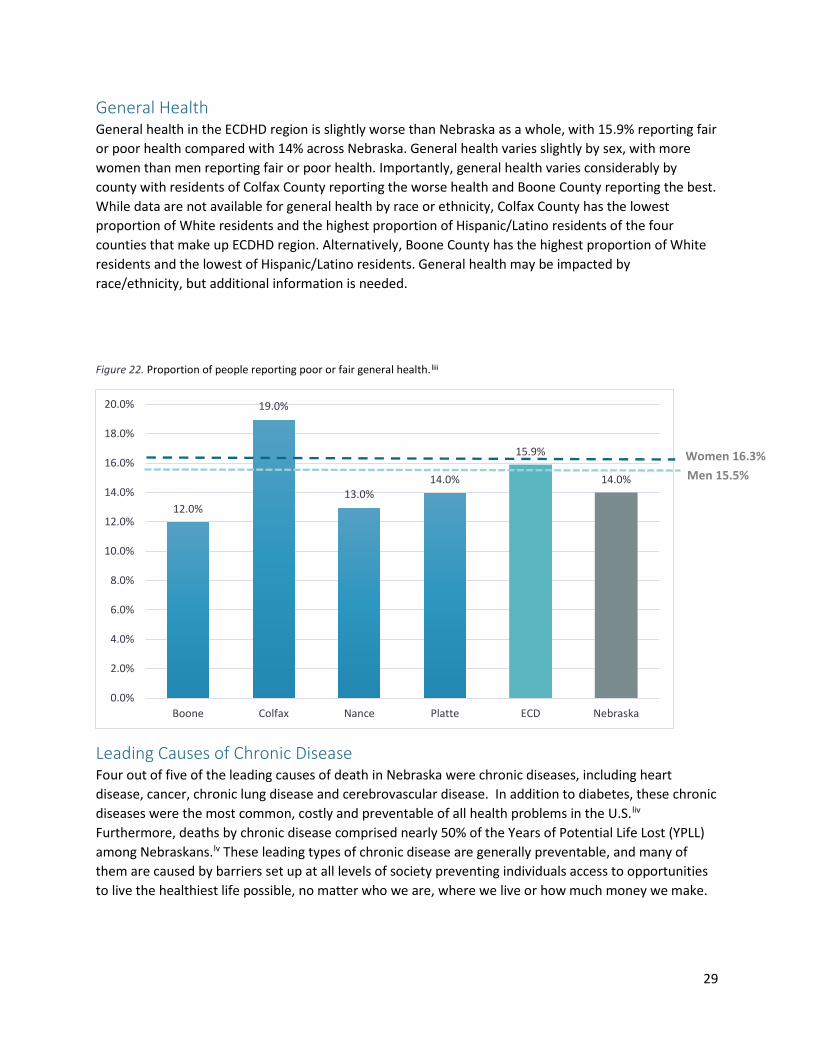
General Health General health in the ECDHD region is slightly worse than Nebraska as a whole, with 15.9% reporting fair or poor health compared with 14% across Nebraska. General health varies slightly by sex, with more women than men reporting fair or poor health. Importantly, general health varies considerably by county with residents of Colfax County reporting the worse health and Boone County reporting the best. While data are not available for general health by race or ethnicity, Colfax County has the lowest proportion of White residents and the highest proportion of Hispanic/Latino residents of the four counties that make up ECDHD region. Alternatively, Boone County has the highest proportion of White residents and the lowest of Hispanic/Latino residents. General health may be impacted by race/ethnicity, but additional information is needed.
Figure 22. Proportion of people reporting poor or fair general health.liii
Leading Causes of Chronic Disease Four out of five of the leading causes of death in Nebraska were chronic diseases, including heart disease, cancer, chronic lung disease and cerebrovascular disease. In addition to diabetes, these chronic diseases were the most common, costly and preventable of all health problems in the U.S.liv Furthermore, deaths by chronic disease comprised nearly 50% of the Years of Potential Life Lost (YPLL) among Nebraskans.lv These leading types of chronic disease are generally preventable, and many of them are caused by barriers set up at all levels of society preventing individuals access to opportunities to live the healthiest life possible, no matter who we are, where we live or how much money we make.
12.0%
19.0%
13.0%14.0%
15.9%
14.0%
0.0%
2.0%
4.0%
6.0%
8.0%
10.0%
12.0%
14.0%
16.0%
18.0%
20.0%
Boone Colfax Nance Platte ECD Nebraska
Women 16.3% Men 15.5%

30
Cancer Cancer is a leading cause of death in the ECDHD district and across the state. Four of the most common cancers are breast, colorectal, lung, and prostate. In the ECDHD region, female breast cancer was the leading type of cancer diagnosed (94.6/100,000 population), especially in Boone County (162.4/100,000 population) which was a 30% increase over the state rate (124.6/100,000 population). Prostate cancer followed as a close second for ECDHD district (80.5/100,000 population), especially in Platte (119.9/100,000 population) and Boone counties (114.5/100,000 population) which were higher than the state rate (111.2/100,000 population). Colorectal cancer (54.2/100,000 population) in the ECDHD region, specifically in Boone and Nance counties (50.1 and 84.0/100,000 population) was higher than the state rate (43.0/100,000 population). Of note, colorectal cancer in Nance County was nearly double the state rate (84.0/100,000 population).
Figure 23. Incidence of Common Cancers per 100,000 people.
Across the ECDHD, 10% of people have ever been told they have cancer. This rate is slightly higher for women (11%) than for men (9%). The rate of people being diagnosed with cancer each year is slightly lower in Colfax County than the other three counties within the ECDHD region. Additionally, fewer people in Colfax County die of cancer each year.
Source: State Cancer Profiles , 2012-2016
Boone Colfax Nance Pla�e ECDHD (averagerate) NE
Prostate 114.5 87.7 0.0 119.9 80.5 111.2Female breast 162.4 111.4 0.0 104.6 94.6 124.6Lung 43.3 45.1 72.9 54.0 53.8 57.7Colorectal 50.1 29.3 84.0 53.3 54.2 43.0
0
20
40
60
80
100
120
140
160
180
Leading Cancer Incidence Rates, By Site

31
Figure 24. Overall Cancer Rates—Incidence and Death, ECDHD District.
Cancer mortality data by race and ethnicity was not readily available for the ECDHD district. Native Americans, African Americans and Whites across Nebraska had cancer mortality rates in excess of the state target of 145.2/100,000 population (see Figure 25).
Figure 25. Cancer Mortality Rates--Nebraska Racial/Ethnic Comparison (per 100,000 population), ECDHD District
*NH = Non-Hispanic
Source: State Cancer Profiles , 2012-2016
Overall Cancer RatesPer 100,000 population, (age -adjusted, 2012 -2016)
169.2
112.8169
207.9156.94
458.2411
460.2 444.6 451.6
-50
50
150
250
350
450
550
650
750
Boone Colfax Nance Pla�e Nebraska
Death Rate Incidence Rate
0 50 100 150 200 250
White NH
African American NH
Native American NH
Asian/Pacific Islander NH*
Hispanic NE Target 145.2

32
Female breast cancer was the leading type of cancer diagnosed in the ECDHD district (see Figure 23).lvi Monthly breast exams and regular mammograms are key to catching female breast cancer early and preventing death from female breast cancer.
Figure 26. Breast cancer screening rates, ages 50-75-- ECDHD District
Figure 27. Breast cancer screening rates, ages 65-74-- ECDHD District
Source: BRFSS 2011 -2019
1 in 4 women ages 50-75 in ECDHD are NOT up-to-date on Breast Cancer Screening
2012 2014 2016 2018ECDHD 79% 75% 75% 81%NE 75% 76% 73% 75%
68%
70%
72%
74%
76%
78%
80%
82%
% w
ho a
re u
p-to
-dat
e w
ith s
cree
ning ECDHD
Nebraska
Source: CHRR 2020
1 in 2 women ages 65-74 in ECDHD are NOT up-to-date on Breast Cancer Screening
Boone Colfax Nance Pla�e Nebraska% with Annual Mammogram(medicare enrollees ages 65-74 that received an annualmammography screening
58% 47% 41% 55% 48%
58%
47%41%
55%48%
0%
10%
20%
30%
40%
50%
60%
70%
% w
ho a
re u
p-to-
date
on
scre
enin
g
Medicare enrollees

33
Figure 28. Cervical cancer screening rates, ages 21-65-- ECDHD District
Figure 29. Colon cancer screening rates, ages 50-75-- ECDHD District
Source: BRFSS 2011 -2019
1 in 6 women aged 21-65 in ECDHD are NOT up-to-date on Cervical Cancer Screening
2012 2014 2016 2018ECDHD 85% 82% 82% 86%NE 84% 82% 78% 81%
72%
74%
76%
78%
80%
82%
84%
86%
88%%
who
are
up-
to-d
ate
with
scr
eeni
ng ECDHD
Nebraska
Source: BRFSS 2011 -2019
1 in 3 50-75 year oldsin ECDHD are NOT up-to-date on Colon Cancer Screening
2012 2013 2014 2015 2016 2017 2018ECDHD 56% 64% 58% 57% 58% 68% 68%NE 61% 63% 64% 65% 66% 68% 69%
0%
10%
20%
30%
40%
50%
60%
70%
80%
% w
ho a
re u
p-to
-dat
e on
scr
eeni
ng
ECDHD
Nebraska

34
Tobacco and Nicotine Product Usage Tobacco smoking remains the leading cause of lung cancer, responsible for about 80% of lung cancer deaths. Other causes include exposure to secondhand smoke and radon.
lviii
lvii Cigarette smoking is the leading cause of preventable disease and death in the US. According to the CDC, the smoking rate among adults in the US has dropped from 20.9% in 2005 to 15.5% in 2016. According to the County Health Rankings, the smoking rate among adults in the ECDHD region was 15%lix, similar to the state smoking rate (see Figure 30); however, the smoking rate in ECDHD region remains higher than the Healthy People 2020 target (12%).
Figure 30. Tobacco Use—Adult Smoking Rates, ECDHD District
Smoking Rates% of adults
Source: CHRR 2020
14% 15% 15% 15% 15%
0%
5%
10%
15%
20%
25%
30%
35%
40%
45%
50%
Boone Colfax Nance Pla�e Nebraska

35
Figure 31. Tobacco Use—Adult Smoking Rates over time, ECDHD District
Figure 32. Tobacco Use--Smoking Rates by gender, ECDHD District
Adult Smoking Rates
Source: BRFSS 2011 -2019
2011 2012 2013 2014 2015 2016 2017 2018 2019ECDHD 14% 18% 17% 15% 17% 14% 17% 12% 15%NE 20% 20% 19% 17% 17% 17% 15% 16% 15%HP 2020 Target 12% 12% 12% 12% 12% 12% 12% 12% 12%
0%
5%
10%
15%
20%
25%
30%
Adult Smoking Ratesby Gender in ECDHD
Source: BRFSS 2011 -2019
2011 2012 2013 2014 2015 2016 2017 2018 2019HP 2020 Target 12% 12% 12% 12% 12% 12% 12% 12% 12%Men 15% 22% 16% 16% 18% 16% 19% 15% 15%Women 14% 14% 18% 13% 17% 11% 15% 10% 14%
0%
5%
10%
15%
20%
25%
30%
Women
Men
Healthy People 2020 TARGET

36
While Nebraska has a clean indoor air ordinance prohibiting smoking in all government and private workplaces, schools, childcare facilities, restaurants, bars, casinos/gaming establishments, retail stores and recreational/cultural facilities, tobacco products are relatively easy to access and inexpensive. Nebraska’s tobacco tax is $0.64 per pack, $1.09 lower than the national average, ranking Nebraska 42nd in the US for its cigarette taxlx.
The most commonly used tobacco product among youth was e-cigarettes, and e-cigarette usage among youth increased more than any other age group in recent years (see Figures 33, 34, 35, and 36). E-cigarettes are devices that heat liquid solution to produce an aerosol that is inhaled. E-cigarettes contain varying amounts of nicotine depending on the type of e-cigarette; and although considered less harmful to individual health than inhaling smoke from combustible tobacco, still deliver harmful chemicals. E-cigarettes can be addictive due to the nicotine content.lxi E-cigarettes are marketed to youth with strategies that have been heavily regulated to reduce youth consumption of combustible cigarettes, i.e., kid-friendly flavors, scholarship opportunities for school, online/mobile and TV ads.lxii Nebraska has experienced marked increases in e-cigarette use among youth.
Figure 33. Tobacco Use--Youth E-Cigarette Use Rate, Nebraska
Figure 34. Tobacco Use--Youth E-Cigarette Use Rate, over time, Nebraska
36%
42%
2017 Nebraska State Average United States
Youth E-Cigarette Use Rate (Statewide Data Only)
Source: 2017 YRBS

37
Figure 35. Tobacco Use—Other Tobacco Product Use Rate, Nebraska
Figure 36. Tobacco and Alcohol Use—Youth Use Rate, ECDHD Districtlxiii
Alcohol and Tobacco Use of Youth in ECDHD District Grades 8, 10, and 12
Source: 2018 Results from Nebraska Risk & Protec�ve Factor Student Survey

38
Heart Disease Heart disease is one of the top two leading causes of death in the ECDHD district and across the state. In addition to environmental changes, leading a healthy lifestyle, including active living, healthy eating, not smoking and limiting alcohol use, and/or managing other medical conditions, high cholesterol, high blood pressure, or diabetes, reduces the risk of heart-related diseases, including heart attack and stroke. In Nebraska, non-Hispanic, White (81.1/100,000), African American (93.9/100,000), and Native American (94.6/100,000) populations have a higher rate of death due to heart disease than the state (77.4/100,000).lxiv
In terms of high blood pressure, an indicator of heart disease, adults living in Nance County experienced a higher rate of high blood pressure than adults living in other counties within the ECDHD region or in Nebraska (25%). Additionally, more females than men living in ECDHD region have been told they have high blood pressure, are taking blood pressure medications and have higher cholesterol levels (see Table 7). According to Good Neighbor Patient Data (2020), non-Hispanic adults experience higher rates than Hispanic adults, similarly, men experience higher rates of high blood pressure than women (see Figure 38).
Figure 37. Blood Pressure Rates by County, ECDHD Districtlxv
Table 7. Heart Disease Indicators, ECDHD District-BRFSS 2011-2019
Heart Disease Indicatorslxvi NE ECDHD Region Overall Female Male
Ever told they have high blood pressure (excluding pregnancy) 31% 31% 34% 29% Currently taking blood pressure medication, among those ever told they have high BP 78% 83% 87% 80%
Ever told they have high cholesterol, among those who have ever had it checked
31% 32% 34% 29%
22% 20%
32%25% 25%
0%
10%
20%
30%
40%
50%
Boone Colfax Nance Platte Nebraska
Rates of High Blood Pressure

39
Figure 38. Blood Pressure Rates by Race/Ethnicity/Gender, ECDHD District, Good Neighbor Clinic data
Figure 39. Blood Pressure Rates by County, ECDHD District, Good Neighbor Clinic data
9.7% Hispanic/Latino9.03%
Black12.11%
Female8.63%
Not Hispanic/Latino10.42% White
9.64%
Male11.04%
Other8.2%
0
2
4
6
8
10
12
14
All Patients Ethnicity Race Sex
22.30%20.40%
31.50%
24.70% 25.40%
0.00%
5.00%
10.00%
15.00%
20.00%
25.00%
30.00%
35.00%
Boone Colfax Nance Platte Nebraska
40
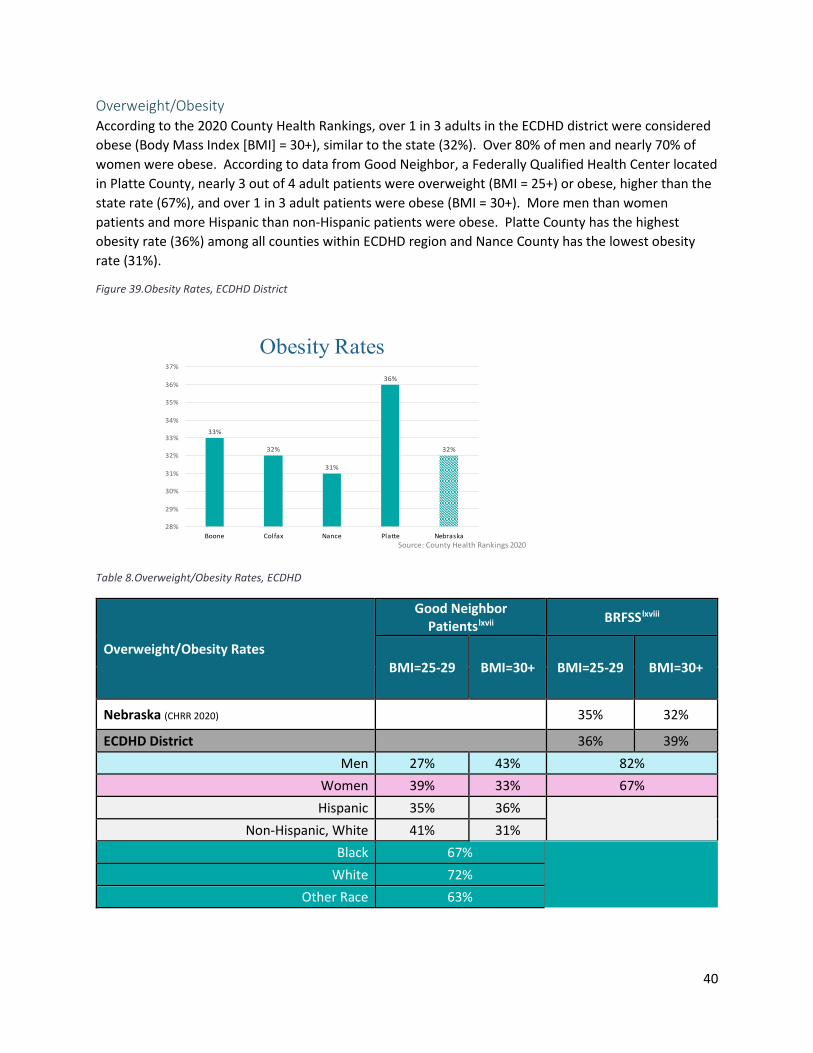
Overweight/Obesity According to the 2020 County Health Rankings, over 1 in 3 adults in the ECDHD district were considered obese (Body Mass Index [BMI] = 30+), similar to the state (32%). Over 80% of men and nearly 70% of women were obese. According to data from Good Neighbor, a Federally Qualified Health Center located in Platte County, nearly 3 out of 4 adult patients were overweight (BMI = 25+) or obese, higher than the state rate (67%), and over 1 in 3 adult patients were obese (BMI = 30+). More men than women patients and more Hispanic than non-Hispanic patients were obese. Platte County has the highest obesity rate (36%) among all counties within ECDHD region and Nance County has the lowest obesity rate (31%).
Figure 39.Obesity Rates, ECDHD District
Table 8.Overweight/Obesity Rates, ECDHD
Overweight/Obesity Rates
Good Neighbor Patientslxvii BRFSSlxviii
BMI=25-29 BMI=30+ BMI=25-29 BMI=30+
Nebraska (CHRR 2020) 35% 32%
ECDHD District 36% 39% Men 27% 43% 82%
Women 39% 33% 67% Hispanic 35% 36%
Non-Hispanic, White 41% 31%
Black 67% White 72%
Other Race 63%
Source: County Health Rankings 2020
Obesity Rates
33%
32%
31%
36%
32%
28%
29%
30%
31%
32%
33%
34%
35%
36%
37%
Boone Colfax Nance Pla�e Nebraska
41
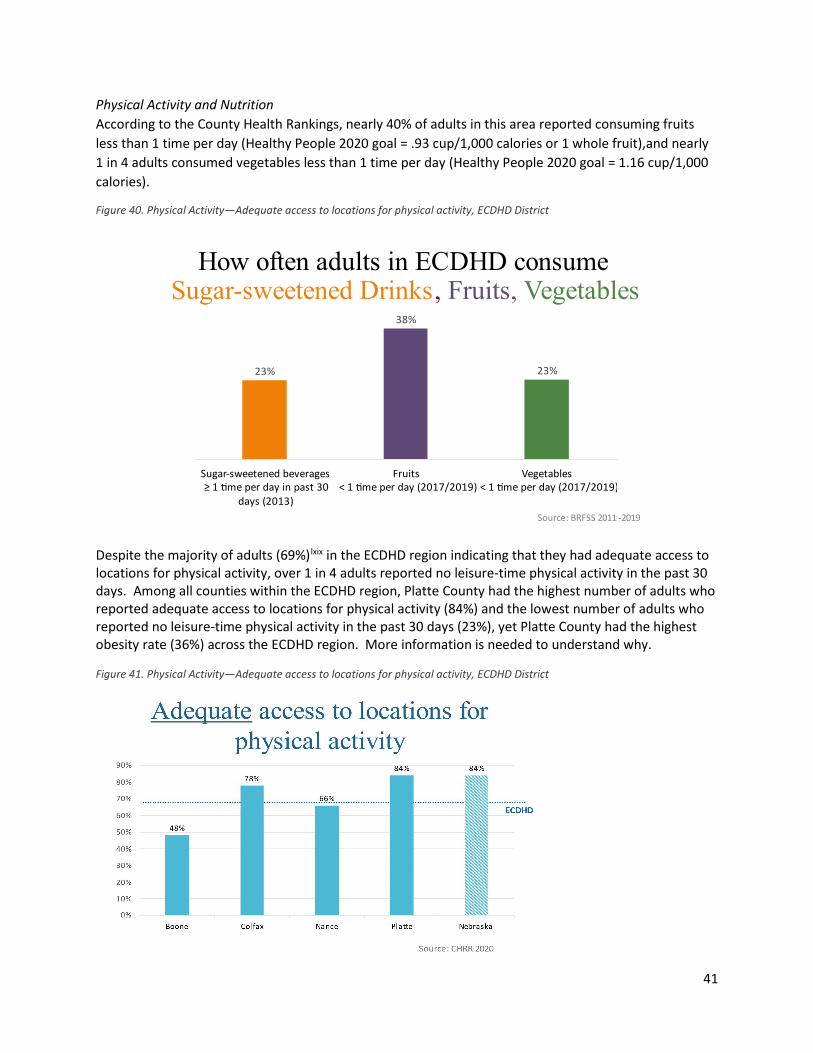
Physical Activity and Nutrition According to the County Health Rankings, nearly 40% of adults in this area reported consuming fruits less than 1 time per day (Healthy People 2020 goal = .93 cup/1,000 calories or 1 whole fruit),and nearly 1 in 4 adults consumed vegetables less than 1 time per day (Healthy People 2020 goal = 1.16 cup/1,000 calories).
Figure 40. Physical Activity—Adequate access to locations for physical activity, ECDHD District
Despite the majority of adults (69%)lxix in the ECDHD region indicating that they had adequate access to locations for physical activity, over 1 in 4 adults reported no leisure-time physical activity in the past 30 days. Among all counties within the ECDHD region, Platte County had the highest number of adults who reported adequate access to locations for physical activity (84%) and the lowest number of adults who reported no leisure-time physical activity in the past 30 days (23%), yet Platte County had the highest obesity rate (36%) across the ECDHD region. More information is needed to understand why.
Figure 41. Physical Activity—Adequate access to locations for physical activity, ECDHD District
Source: BRFSS 2011 -2019
How often adults in ECDHD consume Sugar-sweetened Drinks, Fruits, Vegetables
23%
38%
23%
Sugar-sweetened beverages≥ 1 �me per day in past 30
days (2013)
Fruits< 1 �me per day (2017/2019)
Vegetables< 1 �me per day (2017/2019)

42
Figure 42. Physical Activity—No Leisure-Time, ECDHD District
Figure 43. Physical Activity—At Least Some Leisure-Time, ECDHD District
Over 50% of people in the ECDHD region did not meet the aerobic physical activity recommendations (at least 150 minutes of moderate-intensity physical activity per week—such as brisk walking or 75 minutes of vigorous physical activity per week). Healthy eating and active living are key to preventing chronic disease.
“No leisure-time physical activityin past 30 days."
Healthy People 2020 TARGET
ECDHD
Nebraska
Source: CHRR 2020
31%29%
27%
23%
0%
5%
10%
15%
20%
25%
30%
35%
Boone Colfax Nance Pla�e
Reported At Least Some Leisure -time Physical Activity in Past 30 Days
Nebraska
ECDHD
Healthy People 2020 TARGET
2011 2012 2013 2014 2015 2016 2017 2018 2019ECDHD 72% 78% 74% 78% 70% 78% 70% 73% 68%NE 74% 79% 75% 79% 75% 78% 75% 76% 73%HP 2020 Target 67% 67% 67% 67% 67% 67% 67% 67% 67%
60%
62%
64%
66%
68%
70%
72%
74%
76%
78%
80%
Source: BRFSS 2011 -2019

43
Figure 44. Physical Activity—Met Recommendations, ECDHD District
Active living and access to foods, namely healthy foods, are keys to preventing chronic disease. While lower than the state rate, nearly 1 in 10 residents in ECDHD are food insecure, lacking adequate access to food. Likewise, nearly 1 in 12 low-income residents do not live close to a grocery store in the ECDHD region making access to healthy foods challenging.
Figure 45. Access to healthy foods—limited access, ECDHD District
2011 2013 2015 2017 2019ECDHD 47.70% 49.10% 44.40% 47.70% 45.00%NE 49.00% 50.10% 51.30% 49.40% 48.00%HP 2020 Target 47.90% 47.90% 47.90% 47.90% 47.90%
43.00%
44.00%
45.00%
46.00%
47.00%
48.00%
49.00%
50.00%
51.00%
52.00%
53.00%
Met Aerobic Physical Activity Recommendation
Healthy People 2020 TARGET
ECDHD
Nebraska
Source: BRFSS 2011 -2019
Limited access to healthy foods% of population who are low-income and do not live close to a grocery store
ECDHD
Source: CHRR 2020
10%
5%
11%
9%
12%
0%
2%
4%
6%
8%
10%
12%
14%
Boone Colfax Nance Pla�e Nebraska

44
Diabetes Diabetes is a chronic disease that impacts how a body gets energy from food. Diabetes is the 7th leading cause of death in the US with more than 88 million US adults diagnosed with diabetes. Over the past 20 years, the number of adults diagnosed with diabetes has more than doubled. Overweight/obesity and age are factors that impact the risk of diabetes.lxx Often times, diabetes and heart disease are co-occurring. A person with diabetes is 2 times more likely to have heart disease or stroke, the leading causes of death.lxxi Generally, diabetes rates in ECDHD region are similar to the state rate. However, Boone and Nance counties experience a slightly higher diabetes rate than the other counties within ECDHD perhaps due to a higher proportion of an aging population in these two counties.
Figure 46. Diabetes rates—by county, ECDHD District
There are racial/ethnic disparities when looking at the state diabetes rates with African American/Black (15%), American Indian/Alaskan Native (16%) and Hispanic (14%) populations who experience higher rates of diabetes than non-Hispanic, Whites across the state. While we do not have race/ethnicity data for diabetes by county, racial/ethnic groups experience higher rates of diabetes in ECDHD according to Good Neighbor Patient data (a FQHC located in Platte County that serves ECDHD residents), see Figure 47. In ECDHD, men generally have higher diabetes rates than women.
Source: County Health Rankings 2020
Diabetes Rates
11%
7%
11%
9% 9%
0%
2%
4%
6%
8%
10%
12%
14%
16%
18%
20%
Boone Colfax Nance Pla�e Nebraska

45
Figure 47. Diabetes rates—by race and ethnicity, NE and ECDHD District
Table 9. Diabetes rates—by gender, ECDHD District
Diabetes Rates
Good Neighbor Patient Data (2020) BRFSSlxxii
Nebraska (CHRR 2020) 9% ECDHD District 7% 9%
Men 8% 12% Women 7% 8%
Diabetes by Race/Ethnicity% of adults aged 18 and over who have ever been told by a doctor or other health
professional that they have diabetes (excluding pregnancy)
*NH = Non-Hispanic**Source: Good Neighbor Pa�ent Data, 2020
*** Source: NeDHHS, Office of Health Dispari�es and Health Equity, Diabetes Dashboard 2013-2017, combined, age-adjusted
8%
15%16%
10%
0%
14%
7%8%
0% 0%
7% 8%
0%
2%
4%
6%
8%
10%
12%
14%
16%
18%
White NH* African AmericanNH*
Na�ve AmericanNH*
Asian/PacificIslander NH*
Other Race Hispanic
Nebraska*** Good Neighbor Pa�ent Data**
US Rate (2013) 9.6%

46
Leading Causes of Injury Deaths by injury comprised approximately 20% of the total YPLL among Nebraskans.lxxiii
Table 10. Leading causes of injury, Nebraska
Leading causes of death by injury in Nebraska (2009-2013)
Leading causes of hospitalizations due to injury in Nebraska (2009-2013)
1. Motor vehicle crashes 2. Suicide 3. Unintentional falls 4. Unintentional poisoning
1. Unintentional falls 2. Unintentional injuries due to motor
vehicle traffic 3. Self-inflicted injuries
In the ECDHD district, all counties experienced higher rates of death by injury than the state. While specific county-level data is not readily available around the leading causes of death, of particular note, the death by injury rate in Boone County was about 50% higher than the state (see Figure 48lxxiv).
Figure 48. Injury Death Rate (per 100,000), ECDHD District
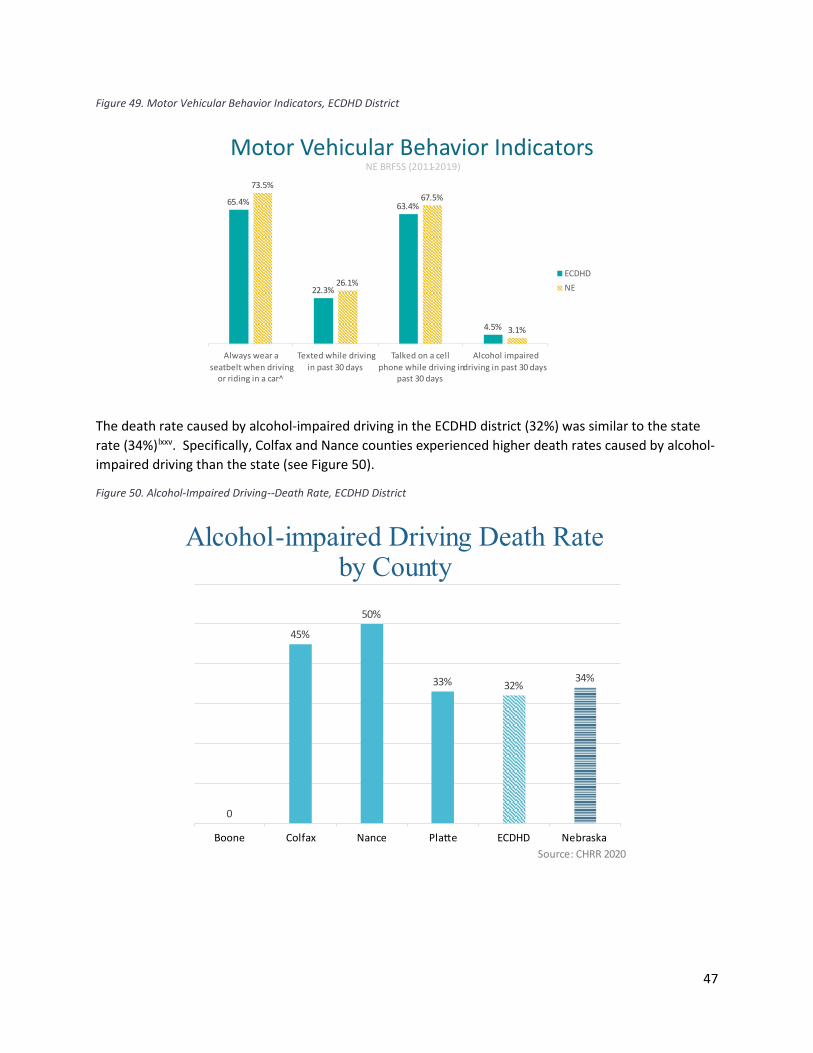
According to the Behavioral Risk Factor Surveillance System (BRFSS) 2019, over 4% of adults in the ECDHD reported driving under the influence of alcohol in the past 30 days, higher than the state rate (3%). Other risky behaviors while driving a vehicle in the ECDHD district did not surpass the state average; however, 1 in 4 ECDHD adults reported texting while driving a vehicle, 2 of 3 ECDHD adults did not always wear a seatbelt when driving or riding in a car and nearly 2 of 3 adults in the ECDHD district talked on a cell phone while driving in the past 30 days.
Injury Death RatePer 100,000 population
ECDHD
Source: CHRR 2020
94.0
72.0
89.0
61.0 59.0
Boone Colfax Nance Pla�e Nebraska
47
Figure 49. Motor Vehicular Behavior Indicators, ECDHD District
The death rate caused by alcohol-impaired driving in the ECDHD district (32%) was similar to the state rate (34%)lxxv. Specifically, Colfax and Nance counties experienced higher death rates caused by alcohol-impaired driving than the state (see Figure 50).
Figure 50. Alcohol-Impaired Driving--Death Rate, ECDHD District
Motor Vehicular Behavior IndicatorsNE BRFSS (2011-2019)
65.4%
22.3%
63.4%
4.5%
73.5%
26.1%
67.5%
3.1%
Always wear aseatbelt when driving
or riding in a car^
Texted while drivingin past 30 days
Talked on a cellphone while driving in
past 30 days
Alcohol impaireddriving in past 30 days
ECDHDNE
Alcohol-impaired Driving Death Rate by County
Source: CHRR 2020
0
45%
50%
33% 32%34%
Boone Colfax Nance Pla�e ECDHD Nebraska

48
Behavioral/Mental Health and Related Risk Factors Mental health impacts a person’s ability to maintain good physical health and vice versa. Mental health is strongly associated with the risk, prevalence, progression, outcome, treatment and recovery of chronic diseases, including diabetes, heart disease and cancer. Good mental health is essential for a person to live a healthy and productive life. lxxvi
According to the Nebraska Behavioral Health Needs Assessment in 2016, mental health illness was a common health problem in Nebraska. One in five Nebraskans reported any mental illness—defined as any diagnosable mental, behavioral or emotional disorder other than substance use disorder. Nebraska’s rate is similar to the US rate (18.13%). Concerning, although less common, 4%-7% of Nebraskans reported having serious thoughts of suicide, a major depressive episode, or serious mental illness—defined as a mental disorder causing significant interference with one or major life activity.
Table 11 below summarizes key mental health indicators for Nebraska and the ECDHD district from the 2020 County Health Rankings. Compared to the state, as a whole, ECDHD is relatively aligned across all three indicators with the exception of Colfax County, which reported an increased percentage of adults who stated their general health was fair to poor.
Table 11. Mental Health indicators in ECDHD District (CHRR 2020)
General health fair or poor
Average days mental health was not good in past 30 days
Mental health was not good on 14 or more of the past 30 days (i.e., frequent mental distress)
Nebraska 14% 3.5 10% ECDHD District 15% 3.3 10%
Boone 12% 3.3 9% Colfax 19% 3.3 10% Nance 13% 3.4 10% Platte 14% 3.3 9%
Table 12 below summarizes additional mental health indicators for Nebraska and the ECDHD district from BRFSS by gender. Compared to the state, as a whole, adults in ECDHD experience slightly lower rates of depression and average days with limited activities due to poor mental/physical health. When looking at these three indicators by gender in ECDHD, twice as many females experience depression than males.

49
Table 12. Mental Health (additional) indicators in ECDHD District by Gender: Based on 2011-2019 Behavioral Health Risk Factor Surveillance System Data
Ever told they have depression (%)
Average days poor physical or mental health limited usual activities in past 30 days
Poor physical or mental health limited usual activities on 14 or more of the past 30 days
Nebraska 18% 2.0 6% ECDHD District 14% 1.7 5%
Male 9% 1.6 5% Female 18% 1.8 5%
According to the Nebraska Youth Risk Behavior Survey (YRBS) 2018, on average 1 of 3 ECDHD youth self-reported feeling depressed and over 1 of 6 youth considered attempting suicide (see Figure 51).lxxvii
lxxviii
Approximately 1 in 4 Nebraska high school youth reported feeling depressed compared to nearly 1 in 3 youth nationwide (24.1% vs 29.9%). Female students in Nebraska had a significantly higher rate of depression (31.4% vs. 17.1%), of considering a suicide attempt (18.0% vs. 11.3%) and of making a suicide plan (17.0% vs. 9.8%) compared to male students.

50
Figure 51. Mental Health among youth—NRPFSS, ECDHD District
Source: 2018 Results from Nebraska Risk & Protec�ve Factor Student Survey
Mental Health Among Youth in ECDHD District Grades 8, 10, and 12

51
Suicide Risk In Nebraska, the rate of suicide across all ages was similar to the rate of suicide for the US (13.05 vs. 13.42—per 100,000 population). Suicide is the 10th leading cause of death in Nebraska, and the second leading cause of death for ages 15-34.lxxix All counties within the ECDHD region were at higher risk for youth suicide ideation and attempts. Of particular note, youth in Boone, Platte, and Colfax counties were at very high risk of suicide ideation and attempts. Figure 52 shows this risk for each county across the state based on the average responses to two questions on the Nebraska Risk and Protective Factors Surveillance System in 2016: 1) “During the past 12 months did you ever seriously consider attempting suicide?” and 2) “During the past 12 months, did you actually attempt suicide?”
Figure 52. Risk level for youth suicide ideation and attempts by county based on the 2016 results from the Nebraska Risk and Protective Factors Surveillance System
Veterans are at higher risk for several negative behavioral health outcomes – most alarmingly, suicide. Data from the 2016 Behavioral Risk Factor Surveillance System (BRFSS) show that veteran families are also impacted. Statewide, when compared to other demographic groups, Nebraska's Veteran spouses and partners report having more poor mental health days and are more likely to have been told that they have depression.lxxx
Adverse Childhood Experiences Adverse childhood experiences (ACEs) are one of the most accurate predictors of lifelong health and well-being.lxxxi lxxxii ACEs are stressful or traumatic events that occur before age 18 and can include things such as a child experiencing abuse and neglect; family effects of struggling to get by financially;
52
seeing/hearing violence in the home; witnessing and/or being the target of neighborhood violence; living with anyone mentally ill, suicidal, or depressed; living with anyone with alcohol or drug problems; experiencing parents who are divorced/separated or serving jail time.lxxxiii
lxxxiv
lxxxv
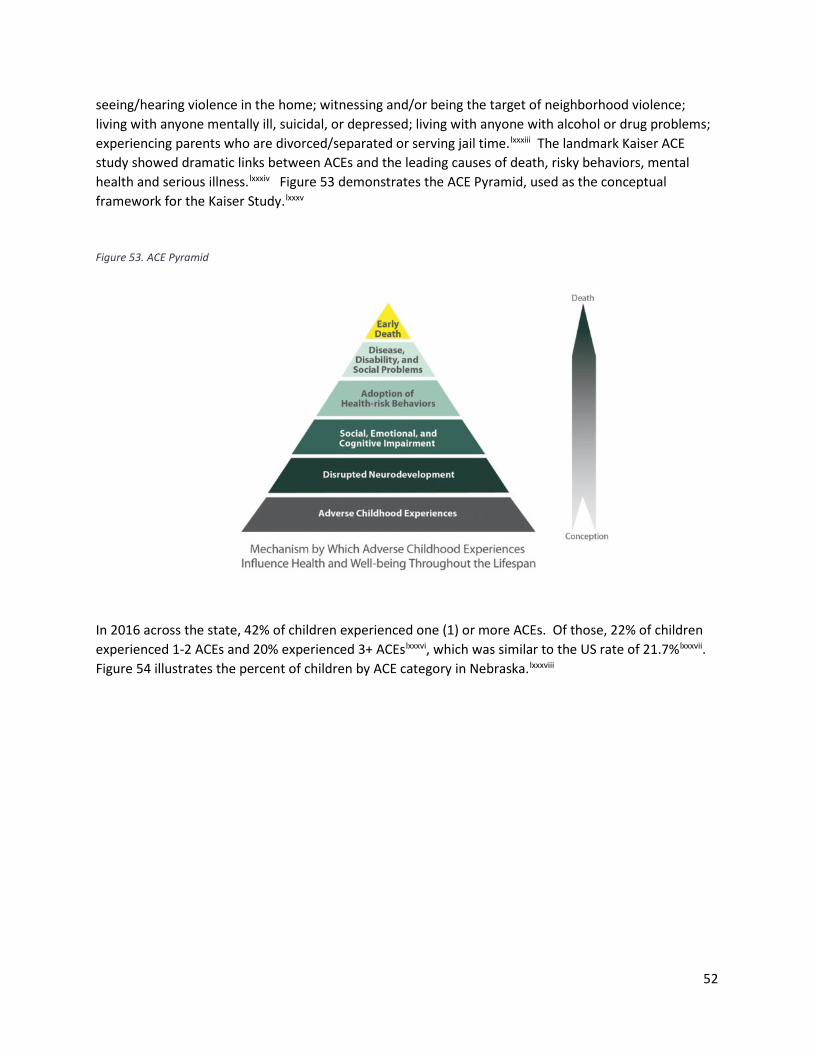
The landmark Kaiser ACE study showed dramatic links between ACEs and the leading causes of death, risky behaviors, mental health and serious illness. Figure 53 demonstrates the ACE Pyramid, used as the conceptual framework for the Kaiser Study.
Figure 53. ACE Pyramid
In 2016 across the state, 42% of children experienced one (1) or more ACEs. Of those, 22% of children experienced 1-2 ACEs and 20% experienced 3+ ACEslxxxvi, which was similar to the US rate of 21.7%lxxxvii
lxxxviii.
Figure 54 illustrates the percent of children by ACE category in Nebraska.
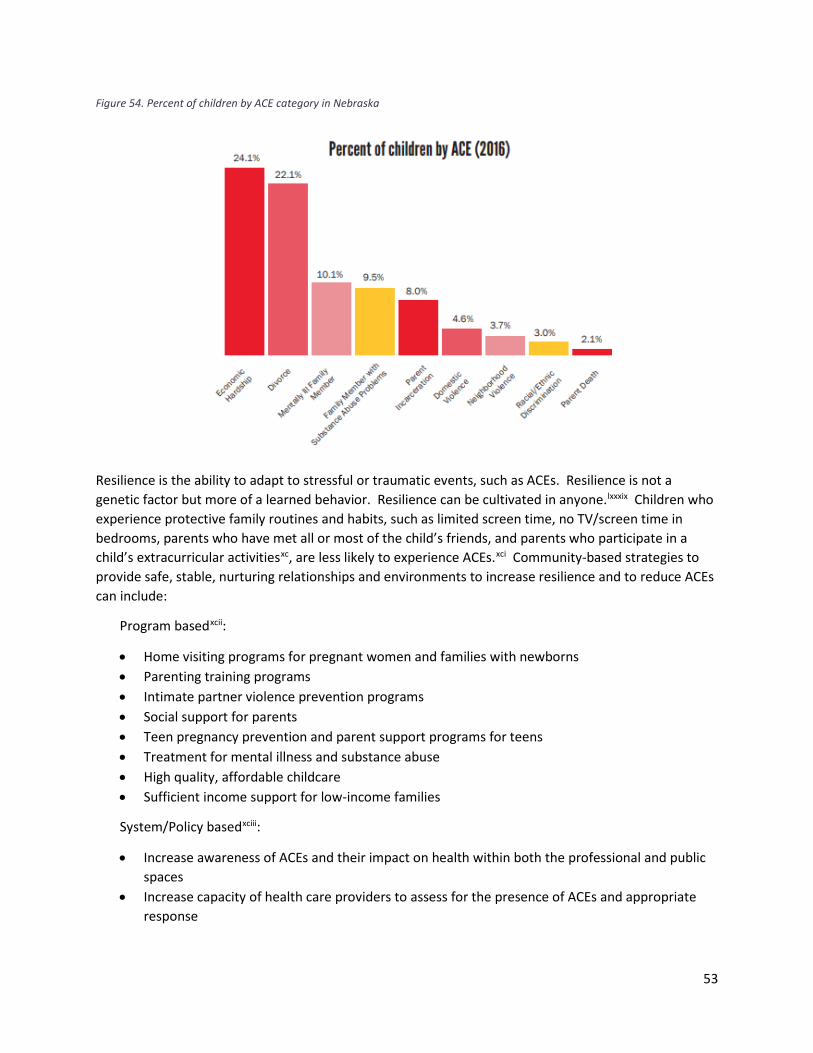
53
Figure 54. Percent of children by ACE category in Nebraska
Resilience is the ability to adapt to stressful or traumatic events, such as ACEs. Resilience is not a genetic factor but more of a learned behavior. Resilience can be cultivated in anyone.lxxxix Children who experience protective family routines and habits, such as limited screen time, no TV/screen time in bedrooms, parents who have met all or most of the child’s friends, and parents who participate in a child’s extracurricular activitiesxc, are less likely to experience ACEs.xci Community-based strategies to provide safe, stable, nurturing relationships and environments to increase resilience and to reduce ACEs can include:
Program basedxcii:
• Home visiting programs for pregnant women and families with newborns • Parenting training programs • Intimate partner violence prevention programs • Social support for parents • Teen pregnancy prevention and parent support programs for teens • Treatment for mental illness and substance abuse • High quality, affordable childcare • Sufficient income support for low-income families
System/Policy basedxciii:
• Increase awareness of ACEs and their impact on health within both the professional and public spaces
• Increase capacity of health care providers to assess for the presence of ACEs and appropriate response
54
• Enhance the capacity of communities to prevent and respond to ACEs through investment in evidence-based prevention programming, trauma interventions and increased access to needed mental health and substance abuse services
• Increased funding for ACE-specific surveys in order to increase their utility and scope

55
Substance Use Disorders Like mental health, substance use disorders are among the top causes of disability in the US and can make daily activities hard to accomplish.xciv Furthermore, substance use and addiction can advance the development of mental illness due to the effects of substances in changing the brain in ways that make a person more likely to develop a mental illness. Likewise, mental illness can lead to drug use and substance use disorders.xcv
Alcohol Use In 2015, Nebraska ranked 47th in the nation for the prevalence of binge drinking (20.3%), a stark difference when compared to West Virginia (ranked 1st, less than 10%).
xcvii
xcvi Excessive alcohol consumption, in either the form of binge drinking (more than 4 drinks on one occasion for men or more than 3 drinks on one occasion for women) or heavy drinking (drinking more than 14 drinks per week for men or more than 7 drinks per week for women), is associated with an increased risk of many health problems. The 2020 County Health Rankings indicated 1 in 5 adults in the ECDHD region reported binge drinking in the past 30 days and heavy drinking in the past 30 days, which was similar to the state rate (22%).
Figure 55. Alcohol Use, ECDHD District
Binge Drinking and Heavy Drinkingby County
Source: CHRR 2020
22% 21% 20% 21% 21% 22%
0%
5%
10%
15%
20%
25%
30%
35%
40%
45%
50%
Boone Colfax Nance Pla�e ECDHD Nebraska

56
Figure 56. Alcohol Use, ECDHD District
Alcohol Use
Source: BRFSS 2011 -2019
Any alcohol consump�onin past 30 days Binge drank in past 30 days Heavy drinking in past 30
daysDistrict 60% 22% 7%NE 60% 21% 7%US 0 17% 6%
0%
10%
20%
30%
40%
50%
60%
70%

57
Maternal and Perinatal Outcomes Health outcomes around pregnancy and birth are important as they can be an indicator of access to and use of prenatal care. Infant mortality (death of an infant before his/her first birthday) is an indicator of maternal and child health within a community. More importantly, this indicator is a marker of overall health of a community due to the associations between the causes of infant death and other factors that are likely to influence health—such as social and economic factors, general living conditions and other quality of life factors.xcviii
The infant mortality rate (the number of infant deaths per 1,000 live births in the same year) in the US was 5.9 in 2016.xcix Nebraska fairs a little bit better than the US with an infant mortality rate of 5.c Infant mortality ranges from 0 infant deaths per 1,000 births in Boone County to 8.9 infant deaths per 1,000 births in Colfax County.
Figure 57. Infant Mortality per 1,000 Births.ci
The rate of low-birthweight infants is similar across counties, with Boone, Nance, and Platte Counties reporting 6% of births as low-weight and Colfax County reporting 5%. When births in Colfax and Platte counties are looked at by ethnicity, slight differences are seen between Hispanic or Latino residents and non-Hispanic White residents. However, the differences are not consistent with Hispanic or Latino residents having a higher rate of low-weight births in Colfax County and a lower rate in Platte County.
Figure 58. Rate of Low-Birthweight Infantscii
0
8.9
5
6.25.7
0
1
2
3
4
5
6
7
8
9
10
Boone Colfax Nance Platte Nebraska

58
Births to teens age 15-19 show a stark disparity between Hispanic or Latino residents and non-Hispanic White residents. In Colfax and Platte counties, Hispanic or Latino teenagers give birth at much higher rates than non-Hispanic White teenagers.
Figure 59. Births per 1,000 female population ages 15-19.ciii
Table 13 provides an overview of the birth statistics, maternal and child health indicators. Notably, the teen birth rate in Colfax County was almost two times the rate of other counties in the ECDHD district and higher than the state rate (an average of 25 and 21, respectively).
6%
5%
6% 6%
7%
6%
5%
4%
6%
0%
1%
2%
3%
4%
5%
6%
7%
8%
Boone Colfax Nance Platte Nebraska
All Hispanic/Latino Non-Hispanic White
15
42
14
27
21
62
50
13
20
0
10
20
30
40
50
60
70
Boone Colfax Nance Platte Nebraska
All Hispanic/Latino Non-Hispanic White

59
Table 13. Maternal and Child Health Indicators, ECDHD District
Maternal and Child Health Indicators Boone Colfax Nance Platte
ECDHD District NE
Birth rateciv 10.5 11.2 13.5 13.3 12.1 13.9 Teen birth ratecv 15 42 14 27 25 21 Low birthweightcvi 6% 5% 7% 6% 0 7%

60
Healthcare Access and Utilization Healthcare Insurance Coverage According to the Nebraska BRFSS (7-year average; see Table 14), nearly one in five adults aged 18-64 in the ECDHD district did not have health care coverage.
Table 14. No health care coverage, 18–64-year-olds, ECDHD District
Health Care Access Indicatorscvii (BRFSS, 2011-2019) NE ECDHD Region Overall Male Female No health care coverage, 18-64-year olds 16% 18% 18% 17%
To provide a county snapshot for uninsured among the population under age 65, the latest County Health Rankings (using 2017 data; see Figure 58) reported that adults under age 65 in the ECDHD district were insured more than the state average (12%), with the exception of Colfax County where uninsured adults were almost 2 times the state rate. The rate of uninsured children in ECDHD district (7%) was higher than the state rate (5%), noting that Colfax County had the highest rate (9%) of uninsured children of all counties within the ECDHD district.
Figure 60. Uninsured Rates—ECDHD District
NE 5%
Uninsured by County
10%
21%
10%12%
13%
Boone Colfax Nance Pla�e ECDHDAverage
Adults under age 65
7%
9%
6% 6%7%
Boone Colfax Nance Pla�e ECDHDAverage
Children under age 19
NE 12%

61
Healthcare Providers While lack of health insurance, cost of health care services and age of clientele may be contributing factors for not accessing health care, health professional shortages can compound the issue. According to the Health Resources and Services Administration (HRSA), some counties and areas within counties that comprise the ECDHD district were designated as Medically Underserved Areas (MUA). MUAs are “counties, a group of counties or civil divisions, or a group of urban census tracts in which residents have a shortage of personal health services.” The following map (Figure 61) illustrates the federal health professional shortage area for primary care across the state in 2018. Notably, all of Boone County and parts of Colfax, Nance, and Platte Counties were designated as MUA/MUPs for primary care.
Figure 61. Primary Care, Federally Designated Medically Underserved Areas/Populations
Generally, emergency rooms and primary care offices are the most common place where people with behavioral health needs seek care. Often clinicians in these settings do not have the resources and/or training to appropriately respond to behavioral health needs. Overall, 66% of primary care providers report that they are unable to respond to people with behavioral health needs due to a shortage of mental health providers and to insurance barriers.cviii
Most all counties in the state are designated as mental health professional shortage areas (see Figure 62). In the ECDHD district, there were an average of 2,875 people for every one mental health provider (range: 1310:1 to 5,440:1), and nearly 7 times as many people to mental health provider as the state and US averages (420:1, 470:1 respectively).cix According to the 2016 Nebraska Behavioral Health Needs Assessment, only 47% of adults in Nebraska with any mental illness received treatment. Additionally, only 43% of youth in Nebraska with depression received treatment. Furthermore, only 11% of persons aged 12 or older in Nebraska with illicit drug dependence or abuse received treatment. Even with ECDHD’s known mental health professional shortage area designation, access to behavioral health care

62
may be further complicated by other barriers, including lack of insurance coverage and stigma often associated with mental illness.cx
Figure 62. Mental Health Care, State-Designated Shortage Areas
In other health professional care, including dentistry and pharmacy, counties within ECDHD were designated as shortage areas. Figures 63, 64, and Table 15 illustrate these shortages.

63
Figure 63. Dentistry, State-Designated Shortage Areas
Figure 64. Pharmacist, State-Designated Shortage Areas

64
Table 15. Ratio of Population per Type of Provider, ECDHD District

65
Health Care and Prevention Assets In the ECDHD district, health care providers and services include 4 area hospitals/health systems—Boone County Health Center located in Albion (Boone County), CHI Health Schuyler located in Schuyler (Colfax County), Genoa Community Hospital located in Genoa (Nance County) and Columbus Community Hospital (Platte County). The area also has one Federally Qualified Health Center (FQHC; Good Neighbor in Columbus, Platte County) and several other medical clinics all of which provide primary care, dental, health prevention and promotion and emergency care services. Many medical clinics in the ECDHD district are open during traditional business hours (from 8:00am to 5:00pm, Monday through Friday). Additionally, ECDHD district has dental clinics, located in Boone, Colfax, Nance, and Platte Counties, and EMS service providers, urgent care (Platte County). Providers offering specialty services travel to these medical clinics from outside of the ECDHD district and hold office hours from weekly to once monthly at select medical clinics/hospitals. Air Methods, stationed at Columbus Community Hospital, offers air ambulance services to the surrounding communities of Columbus, Fremont, Albion, Central City, Schuyler, David City and Aurora.
Boone County Health Center, located in Albion, Nebraska, is a recognized leader in providing a continuum of healthcare to the 10,000 rural residents in Boone, Antelope, Greeley, western Madison and Platte, Nance, and Wheeler Counties. The Health Center is a county hospital, twenty-five bed, five nursery facility, that sees over 70,000 outpatient visits and over 30,000 clinic visits on an annual basis and is the primary source of healthcare for the rural communities it serves in the towns of Albion, Spalding, Newman Grove, Fullerton, and Elgin. With eight physicians and four physician assistants, a well-rounded medical staff is present to meet the needs of the patients and their families. In addition, two affiliate physician clinics are in St. Edward and Cedar Rapids. Services provided by the 250 employees at the Health Center include; cardiac rehab, physical therapy, occupational therapy, speech therapy, radiology (ultrasound, digital mammography, nuclear medicine, CT, open MRI, DEXA scanner, fluoroscopy and general x-ray), full laboratory services, oncology, aesthetics care, full OB services, home health and mental health services. In addition to the services provided by our local staff, a full range of seventeen specialty clinics are scheduled throughout the month to allow patients the ability to obtain these services at home. CHI Health Schuyler, located in Schuyler, Nebraska, is a 25-bed Critical Access Hospital. The physicians, nurses, and other associates at this faith-based community hospital are committed to delivering personalized, compassionate care to approximately 10,441 individuals that reside in Colfax County. Such care takes many forms - technologically advanced medical services, quality health education, health screenings, and more. Beyond the hospital walls, Memorial Hospital works closely with businesses, community groups, churches, schools, social service agencies, and others to build a healthier community. Acute care and outpatient services include general medical-surgical care, skilled nursing care, home health care, outpatient specialty care that includes general surgery, cardiology, urology, gastrointestinal, orthopedic, gynecology, otolaryngology, nephrology, and podiatry services. Restorative services such as physical therapy and cardiac rehabilitation are also available. A full complement of diagnostic services are offered for the laboratory and radiology which include: CT, MRI, mammography, ultrasound, nuclear medicine, echocardiograms, and vascular exams. Columbus Community Hospital is a community-owned, not-for-profit hospital. The facility opened its doors at its new location in August 2002 and is located on 60 acres in the northwest part of Columbus, NE. The Hospital is a 47-bed acute care facility (certified for swing beds), with 4 skilled nursing beds and 14 ambulatory outpatient beds, all private rooms. Columbus Community Hospital is licensed by the

66
Nebraska State Board of Health and is accredited through The Joint Commission. The Hospital is also a member of the Nebraska Hospital Association (NHA), American Hospital Association (AHA), Voluntary Hospital Association (VHA) and Heartland Health Alliance (HHA). Columbus Community Hospital’s success can be measured in the quality of its facilities and the commitment of volunteers, staff, board, and physicians. Leadership consists of an 11-member Board of Directors, President/CEO, 4 Vice-Presidents, 38 members of the Medical Staff, over 550 employees, and 300+ volunteers. In October 2010, the Hospital expanded services in the Emergency Department, increase patient privacy in the registration area and create a women’s imaging center.
Genoa Medical Facilities (GMF) is the sole health care facility in Nance County, Nebraska, located in the city of Genoa, NE. GMF is comprised of the hospital, long-term care, and assisted living facilities. The hospital is a 19-bed, critical access, city-owned, non-profit facility. GMF provides healthcare for a community of almost 5,000 people within a 10-mile radius. The 35-bed long-term care unit and the 20-unit assisted living facility provide a home for those whose needs include additional living care. Most importantly, GMF provides care for the people of the community. Although the care people receive here pales by comparison to the services available at large facilities, this hospital is critical to the area and plays an important role in providing access to care in the region. For this reason, the community is uniquely supportive of the hospital's mission, which is to be “Champions for Rural Healthcare.” Good Neighbor Community Health Center in Columbus is one of seven Federally Qualified Health Centers in Nebraska. Federally Qualified Health Centers are an integral part of the nation's health delivery system, providing cost effective, community oriented, and comprehensive primary health care services. Offering payment options on a sliding scale for patients who would be otherwise unable to afford health care, a Federally Qualified Health Center serves medically underserved areas and/or populations and receives Public Health Service funds. Access for Aging Populations Multiple nursing homes are available in the ECDHD district offering assisted living and around the clock nursing care for residents. Home-health professionals and agencies are present in the ECDHD district. Additionally, senior centers and the Area Agency on Aging offer older adult prevention programming, such as activities, assistance and referrals to resources.
Access for Veteran Populations Multiple agencies in the ECDHD district offer services for Veterans and their families. Support services for Veterans and their families are offered by agencies such as local churches, local Veterans of Foreign Wars (VFW) posts, American Legions, County Veteran Service Officers and the Department of Labor.
In addition to these services, ECDHD spearheads the VetSET program in the district. The VetSET program focuses on building systems of whole community support by connecting cross-sector partners for Veterans and their families. ECDHD staff and partners have been trained in the No Wrong Door training, a day-long deep dive into military culture and life where participants learn about military experiences and how they influence emotions and behaviors by hearing from Veterans, their families and experts in the field.

67
Preventative Screenings Nearly 40% of adults in the ECDHD district did not receive a routine checkup in the past year. While the majority of the adult population in the recommended age groups across the ECDHD district received appropriate preventative screenings such as breast, cervical and colon cancer screenings, the trend over a seven-year period showed an upward swing in 2018 rebounding from a downward trend since 2012.
Female breast cancer was the leading type of cancer diagnosed in the ECDHD region, especially in Boone County which has the highest proportion of adults who fall within the 65-74 age range of all counties in the ECDHD region, yet only half of women who were Medicare enrollees and aged 65-74 in the ECDHD district received breast cancer screening, especially in Boone County (58%).
Table 16. Preventative Health Screening Indicators, ECDHD District
Preventative Health Screening Indicatorscxi (BRFSS, 2011-2019) NE ECDHD Region Overall Male Female Preventative Screenings Heart Disease Had cholesterol checked in past 5 years 84% 85% 81% 88% Cancer Up to date on colon cancer screening, ages 50-75 65% 62% 60% 62% Up to date on breast cancer screening, female ages 50-74 75% 78% 78% Up to date on breast cancer screening, female ages 65-74 (CHRR 2020) 48% 50% 50%
Up to date on cervical cancer screening, female ages 21-65 81% 84% 84% Routine Checkups Had a routine checkup in past year 63% 62% 56% 68%
According to the BRFSS (2011-2019), an average of 78% of women ages 50-75 across the ECDHD district received breast cancer screening. The colorectal cancer incident rate in the ECDHD district is higher than across the state (54.2 and 43/100,000, respectively), with the highest incident rate in Nance County (84/100,000). A third of ECDHD residents were not up-to-date on colon cancer screenings.
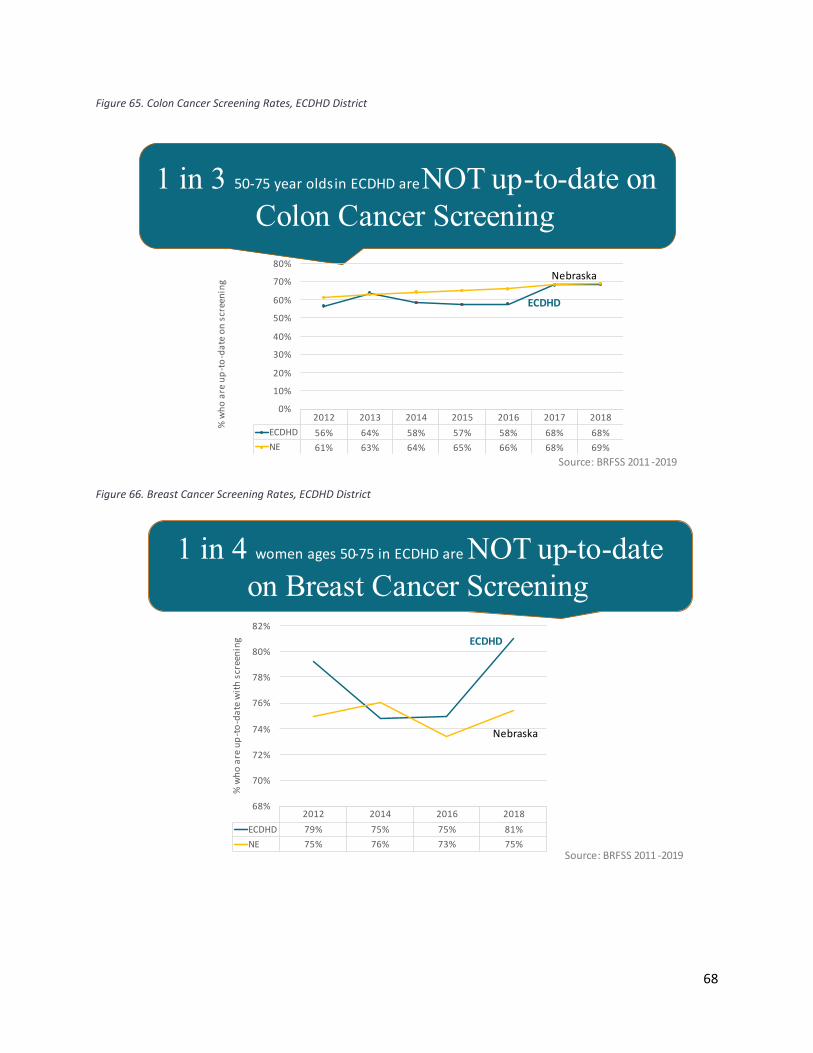
68
Figure 65. Colon Cancer Screening Rates, ECDHD District
Figure 66. Breast Cancer Screening Rates, ECDHD District
Source: BRFSS 2011 -2019
1 in 3 50-75 year oldsin ECDHD are NOT up-to-date on Colon Cancer Screening
2012 2013 2014 2015 2016 2017 2018ECDHD 56% 64% 58% 57% 58% 68% 68%NE 61% 63% 64% 65% 66% 68% 69%
0%
10%
20%
30%
40%
50%
60%
70%
80%
% w
ho a
re u
p-to
-dat
e on
scr
eeni
ng
ECDHD
Nebraska
Source: BRFSS 2011 -2019
1 in 4 women ages 50-75 in ECDHD are NOT up-to-date on Breast Cancer Screening
2012 2014 2016 2018ECDHD 79% 75% 75% 81%NE 75% 76% 73% 75%
68%
70%
72%
74%
76%
78%
80%
82%
% w
ho a
re u
p-to
-dat
e w
ith s
cree
ning ECDHD
Nebraska

69
Figure 67. Cervical Cancer Screening Rates, ECDHD District
Source: BRFSS 2011 -2019
1 in 6 women aged 21-65 in ECDHD are NOT up-to-date on Cervical Cancer Screening
2012 2014 2016 2018ECDHD 85% 82% 82% 86%NE 84% 82% 78% 81%
72%
74%
76%
78%
80%
82%
84%
86%
88%%
who
are
up-
to-d
ate
with
scr
eeni
ng ECDHD
Nebraska

70
Barriers to Accessing Health Care Accessing health care is complicated by multiple factors, such as the ability to travel to care locations, location and number of healthcare providers, types and costs of services offered, insurance coverage, etc. The area hospitals are located in different parts of the district and have multiple clinic locations, keeping driving distance fairly low. However, inclement weather, especially snow, can impact accessibility to healthcare services. There is also some variability in the maintenance of roads with main highways receiving the most attention and gravel roads receiving less attention after a significant snowfall which can delay travel to any service. Many residents in ECDHD district live on gravel roads that experience this variability in the maintenance of those roads. Mass transportation is very limited throughout the ECDHD district. The cost of healthcare services can be another barrier to care for ECDHD residents. In the ECDHD region, over 1 in 10 adults aged 18-64 had no health care coverage, and Colfax County had 2 times the rate of uninsured adults than ECDHD as a whole.
cxiii
cxii Though data are not available for ECDHD by race/ethnicity, Hispanics had the highest uninsured rates of any racial or ethnic group across the state (57.7%) and nation.cxiv In the US, Medicare provides universal health coverage to adults 65 and older; however, cost-sharing and premium contributions continue to be a serious burden for many.cxv
Healthcare professional shortages are still other barriers to care for ECDHD residents. Furthermore, across the state, nearly 1 in 2 Hispanic residents and 65% of Native American’s reported not having a personal doctor or health care provider.cxvi Nearly 1 in 5 adults in the ECDHD do not have a personal doctor or health care provider and over 1 in 10 adults needed to see a doctor but could not due to cost.
Table 17. Other health care access indicators, ECDHD District
Health Care Access Indicatorscxvii (BRFSS, 2011-2019) NE ECDHD Region Overall No personal doctor or health care provider 20% 19% Needed to see a doctor but could not due to cost in past year 12% 11%

71
Community Themes and Strengths ECDHD developed a Community Survey and worked with partners to deliver the survey to residents through the district. The survey was made up of a Likert-scale, ranking and open-ended questions. The goal of the survey was to assess the communities’ perception regarding the issues that are important to their health and wellbeing and the quality of life in their respective communities. This survey was available in English and Spanish, in print and online.
There were 259 complete responses (see Appendix C for full details on the demographics of survey respondents), of which the majority of survey respondents self-identified as female, white, middle to upper-middle class, college-educated and had health insurance. The survey revealed the following:
Figure 68. Top 5 Concerns, ECDHD District

72
Figure 69. Top 5 Behaviors that negatively impact overall health in the community, ECDHD District
While not representative of the population of the region as a whole, many of the survey responses are supportive of the other data collected as part of this Health Status Assessment and with anecdotal input from key stakeholder (from the focus groups) who are connected to many of the diverse community groups not directly represented in survey responses.
Four virtual focus groups were held in Boone, Colfax, Nance, and Platte counties to gather input from key stakeholders from various sectors of the counties, including but not limited to local hospitals, early childhood organizations, non-profit organizations, and local government. Given the stark differences between the demographics and population sizes of the four counties, the focus groups were set up so that community members of Platte and Colfax counties were together and Boone and Nance counties were together. Given the pandemic, the focus groups were offered a few times for each target community.
Table 18. Focus group characteristics
Date Counties Number of Participants Participant’s Gender Time of Day
February 10, 2021 Platte and Colfax 8 2 Men 6 Women 12-1PM CST
February 10, 2021 Platte and Colfax 5 1 Man 4 Women 6-7PM CST
February 19, 2021 Boone and Nance 3 1 Men 2 Women 3-4PM CST
February 19, 2021 Platte and Colfax 3 1 Men 2 Women 4-5PM CST

73
Focus groups lasted for one hour. In each of the focus groups, focus group participants reviewed preliminary survey response data from the community health survey (administered by ECDHD and their partners in the four-county area). Specifically, the group considered survey respondents’ 1) top 5 concerns in the community and 2) top 5 behaviors that have a negative impact on community health (see Appendix A for the survey results reviewed).
The emerging themes from the focus groups included:
Platte and Colfax counties highlights: • Givens clustered mainly within the clinical care and social/economic domains. Mental health,
mainly as a source of other top health behaviors and concerns (i.e. alcohol and drug-misuse/abuse), access to affordable and safe housing, and lack of wellness checks/preventative health maintenance were noted by participants. Participants thought that mental health as a top health behavior/concern could be high given the pandemic. Despite having a number of low-income slots available for housing from on-going, continuous efforts, the demand still exceeds the supply. Participants noted that bullying and cyberbullying were new as a concern from previous CHAs. Participants also noted the demographics of who completed the survey highlights the need to make sure the community is accurately represented in the CHIP overall.
• Unknowns were in learning more about metrics—specifically in relation to how to measure improvement given previous CHIPs have included work around these top concerns/health behavior, cyberbullying/bullying—specifically what has changed to elevate this issue and if this adult or youth, and where food insecurity falls in this prioritization given the impact of the pandemic on employment and stability.
• Strengths lie within the clinical care, economic and social domains—specifically a good number of healthcare providers (such as physicians, pharmacists, dentists, optometrists, emergency medical services) and well-appointed local healthcare facilities; a good sense of community and community pride among residents; local commerce for everyday needs (such as grocery stores, hardware stores, etc.); collaboration among public-private partnerships with community referrals and programming to assist with mental health, housing and food accessibility/insecurity; partners leverage existing relationships to create funding sustainability for programming.
Emerging themes for opportunities across these focus groups included:
• Aligning strategic missions of diverse community organizations into an overarching community plan with clear and measurable metrics.
• Increasing the accessibility to bilingual providers and interpreters for medical and other services. • Enhancing care through technologies that remove barriers to accessing care, i.e.
virtual/telehealth visits. • Streamlining work processes to plan and respond to emerging issues by implementing new ways
of working created by the pandemic. • Integration of care model (mental, medical, social, and emotional) to understand what is driving
behaviors. • Implementing an upstream approach to problems and issues.

74
• Addressing systems/infrastructure to address public health issues in a culturally competent, inclusive, and equitable way.
Boone and Nance counties highlights: • Givens focused mainly on how mental health was on each county list as a top concern and that
it is a root issue of many of the other issues, the need for a spectrum of partners to play a public health role in building a healthy community; to revitalize the 2 counties in order to retain and recruit younger professionals; to address transportation needs, specifically one that the community relies on the hospital to fill; health issues in these counties are perceived from partners as the responsibility of the hospitals and local health department.
• Unknowns included the need for childcare, specifically quality and affordable childcare, and transportation needs, which partners think is the hospital’s responsibility to assist yet is a community responsibility impacting health.
• Strengths lie within having a hospital with local healthcare facilities; working in new/different ways given the pandemic.
Emerging themes for opportunities across this focus group included:
• Maintaining and enhancing the momentum and collaboration of different partners working together to maximize efforts for public health issues. Examples included:
o Forming additional CHIP working groups to focus on community public health needs, i.e. transportation, which is a huge need that is often left to the hospital to deal with.
o Collaborating with schools, law enforcement and EMS groups, etc. to increase public health impact. For example, utilizing newly-hired substance use/abuse expertise at the hospital for school programming/presentations around substance use prevention.

75
Health Summary: ECDHD District The majority of the adult population within the ECDHD district reported their general health was good or better. However, nearly 1 in 12 people within the ECDHD district indicated they experienced frequent mental distress. Table 19 summarizes the general health of the adult population within the ECDHD district.
Table 19. General Health Indicators, ECDHD District
General Health Indicatorscxviii ECDHD District
NE
General health fair or poor 16% 14% Average number of days physical health was not good in past 30 days 3.0 3.2 Physical health was not good on 14 or more of the past 30 days 9% 10% Average number of days mental health was not good in past 30 days 2.7 3.2 Mental health was not good on 14 or more of the past 30 days (i.e., frequent mental distress) 8% 10%
Average days poor physical or mental health limited usual activities in past 30 days 1.7 2.0
Poor physical or mental health limited usual activities on 14 or more of the past 30 days 5% 6%
Not unlike the state, the ECDHD district experienced primary care and mental health professional shortages, reducing access to needed health services. The Years of Potential Life Lost (YPLL), a measurement of preventable deaths, in the ECDHD district Colfax County’s YPLL rate was higher than the state rate. Multiple factors impact how well and how long we live. Things like education, availability of jobs, access to healthy foods, social connectedness, and housing conditions all impact our health outcomes. Conditions in which we live, work and play have an enormous impact on our health, long before we ever see a doctor. It is imperative to build a culture of health where getting healthy, staying healthy and making sure our kids grow up healthy are top priorities.

76
Appendices Appendix A: List of Tables Table 1. Health Literacy Indicators, ECDHD District ...................................................................................... 9 Table 2. Veteran Status, ECDHD District ....................................................................................................... 9 Table 3. Health issue status change from 2018 to 2021, ECDHD District ................................................... 19 Table 4. Economic Indicators, ECDHD District ............................................................................................ 20 Table 5. Education Indicators, ECDHD District ............................................................................................ 25 Table 6. Leading Causes of Death, Nebraska & US .................................................................................... 26 Table 7. Heart Disease Indicators, ECDHD District-BRFSS 2011-2019 ........................................................ 38 Table 8.Overweight/Obesity Rates, ECDHD ................................................................................................ 40 Table 9. Diabetes rates—by gender, ECDHD District .................................................................................. 45 Table 10. Leading causes of injury, Nebraska ............................................................................................. 46 Table 11. Mental Health indicators in ECDHD District (CHRR 2020) ........................................................... 48 Table 12. Mental Health (additional) indicators in ECDHD District by Gender: Based on 2011-2019 Behavioral Health Risk Factor Surveillance System Data ............................................................................ 49 Table 13. Maternal and Child Health Indicators, ECDHD District ............................................................... 59 Table 14. No health care coverage, 18–64-year-olds, ECDHD District ....................................................... 60 Table 15. Ratio of Population per Type of Provider, ECDHD District .......................................................... 64 Table 16. Preventative Health Screening Indicators, ECDHD District ......................................................... 67 Table 17. Other health care access indicators, ECDHD District .................................................................. 70 Table 18. Focus group characteristics ......................................................................................................... 72 Table 19. General Health Indicators, ECDHD District.................................................................................. 75

53
Appendix B: List of Figures Figure 1. County Health Rankings and Roadmaps Framework ..................................................................... 6 Figure 2. Proportion of Residents with Limited English Proficiency in East Central District, By County ...... 8 Figure 3. Overall Population Trend, ECDHD (1970-2019) ........................................................................... 11 Figure 4. Hispanic Origin, ECDHD District ................................................................................................... 12 Figure 5. Race by county, ECDHD District ................................................................................................... 12 Figure 6. Age Distribution, ECDHD District by county ................................................................................. 13 Figure 7. Percent Population Aged 65+, ECDHD District............................................................................. 14 Figure 8. Proportion of Hispanic or Latino Residents of East Central District, Boone County. .................. 15 Figure 9. Proportion of Hispanic or Latino Residents of East Central District, Colfax County. ................... 16 Figure 10. Proportion of Hispanic or Latino Residents of East Central District, Nance County .................. 17 Figure 11. Proportion of Hispanic or Latino Residents of East Central District, Platte County. .................. 18 Figure 12. Median Household Income, ECDHD District .............................................................................. 20 Figure 13. Poverty, ECDHD District ............................................................................................................. 21 Figure 14. Access to food—% of population who lack adequate access to food, ECDHD District ............. 21 Figure 15. Children in Single-Parent Households, ECDHD District .............................................................. 22 Figure 16. Average Residential Value, ECDHD District ................................................................................ 23 Figure 17. Percentage of Homes Occupied by Owner, ECDHD District ...................................................... 23 Figure 18. Percentage of Households with Severe Housing Problems, ECDHD District ............................. 24 Figure 19. Education Levels, ECDHD District ............................................................................................... 25 Figure 20. Leading Causes of Death, ECDHD District .................................................................................. 27 Figure 21. Years of Potential Life Lost (YPLL), ECDHD District .................................................................... 28 Figure 22. Proportion of people reporting poor or fair general health. ..................................................... 29 Figure 23. Incidence of Common Cancers per 100,000 people. ................................................................. 30 Figure 24. Overall Cancer Rates—Incidence and Death, ECDHD District. .................................................. 31 Figure 25. Cancer Mortality Rates--Nebraska Racial/Ethnic Comparison (per 100,000 population), ECDHD District ......................................................................................................................................................... 31 Figure 26. Breast cancer screening rates, ages 50-75-- ECDHD District ..................................................... 32 Figure 27. Breast cancer screening rates, ages 65-74-- ECDHD District ..................................................... 32 Figure 28. Cervical cancer screening rates, ages 21-65-- ECDHD District ................................................... 33 Figure 29. Colon cancer screening rates, ages 50-75-- ECDHD District ...................................................... 33 Figure 30. Tobacco Use—Adult Smoking Rates, ECDHD District ................................................................ 34 Figure 31. Tobacco Use—Adult Smoking Rates over time, ECDHD District ................................................ 35 Figure 32. Tobacco Use--Smoking Rates by gender, ECDHD District .......................................................... 35 Figure 33. Tobacco Use--Youth E-Cigarette Use Rate, Nebraska ................................................................ 36 Figure 34. Tobacco Use--Youth E-Cigarette Use Rate, over time, Nebraska .............................................. 36 Figure 35. Tobacco Use—Other Tobacco Product Use Rate, Nebraska ..................................................... 37 Figure 36. Tobacco and Alcohol Use—Youth Use Rate, ECDHD District ..................................................... 37 Figure 37. Blood Pressure Rates by County, ECDHD District ...................................................................... 38 Figure 38. Blood Pressure Rates by Race/Ethnicity/Gender, ECDHD District, Good Neighbor Clinic data 39 Figure 39.Obesity Rates, ECDHD District .................................................................................................... 40 Figure 40. Physical Activity—Adequate access to locations for physical activity, ECDHD District ............. 41 Figure 41. Physical Activity—Adequate access to locations for physical activity, ECDHD District ............. 41 Figure 42. Physical Activity—No Leisure-Time, ECDHD District .................................................................. 42
54
Figure 43. Physical Activity—At Least Some Leisure-Time, ECDHD District ............................................... 42 Figure 44. Physical Activity—Met Recommendations, ECDHD District ...................................................... 43 Figure 45. Access to healthy foods—limited access, ECDHD District ......................................................... 43 Figure 46. Diabetes rates—by county, ECDHD District ............................................................................... 44 Figure 47. Diabetes rates—by race and ethnicity, NE and ECDHD District ................................................ 45 Figure 48. Injury Death Rate (per 100,000), ECDHD District ....................................................................... 46 Figure 49. Motor Vehicular Behavior Indicators, ECDHD District ............................................................... 47 Figure 50. Alcohol-Impaired Driving--Death Rate, ECDHD District ............................................................. 47 Figure 51. Mental Health among youth—NRPFSS, ECDHD District ............................................................ 50 Figure 52. Risk level for youth suicide ideation and attempts by county based on the 2016 results from the Nebraska Risk and Protective Factors Surveillance System ................................................................. 51 Figure 53. ACE Pyramid ............................................................................................................................... 52 Figure 54. Percent of children by ACE category in Nebraska ...................................................................... 53 Figure 55. Alcohol Use, ECDHD District....................................................................................................... 55 Figure 56. Alcohol Use, ECDHD District....................................................................................................... 56 Figure 57. Infant Mortality per 1,000 Births. .............................................................................................. 57 Figure 58. Rate of Low-Birthweight Infants ................................................................................................ 57 Figure 59. Births per 1,000 female population ages 15-19. ........................................................................ 58 Figure 60. Uninsured Rates—ECDHD District ............................................................................................. 60 Figure 61. Primary Care, Federally Designated Medically Underserved Areas/Populations ...................... 61 Figure 62. Mental Health Care, State-Designated Shortage Areas ............................................................. 62 Figure 63. Dentistry, State-Designated Shortage Areas ............................................................................. 63 Figure 64. Pharmacist, State-Designated Shortage Areas .......................................................................... 63 Figure 65. Colon Cancer Screening Rates, ECDHD District .......................................................................... 68 Figure 66. Breast Cancer Screening Rates, ECDHD District ......................................................................... 68 Figure 67. Cervical Cancer Screening Rates, ECDHD District ...................................................................... 69 Figure 68. Top 5 Concerns, ECDHD District ................................................................................................. 71 Figure 69. Top 5 Behaviors that negatively impact overall health in the community, ECDHD District ...... 72
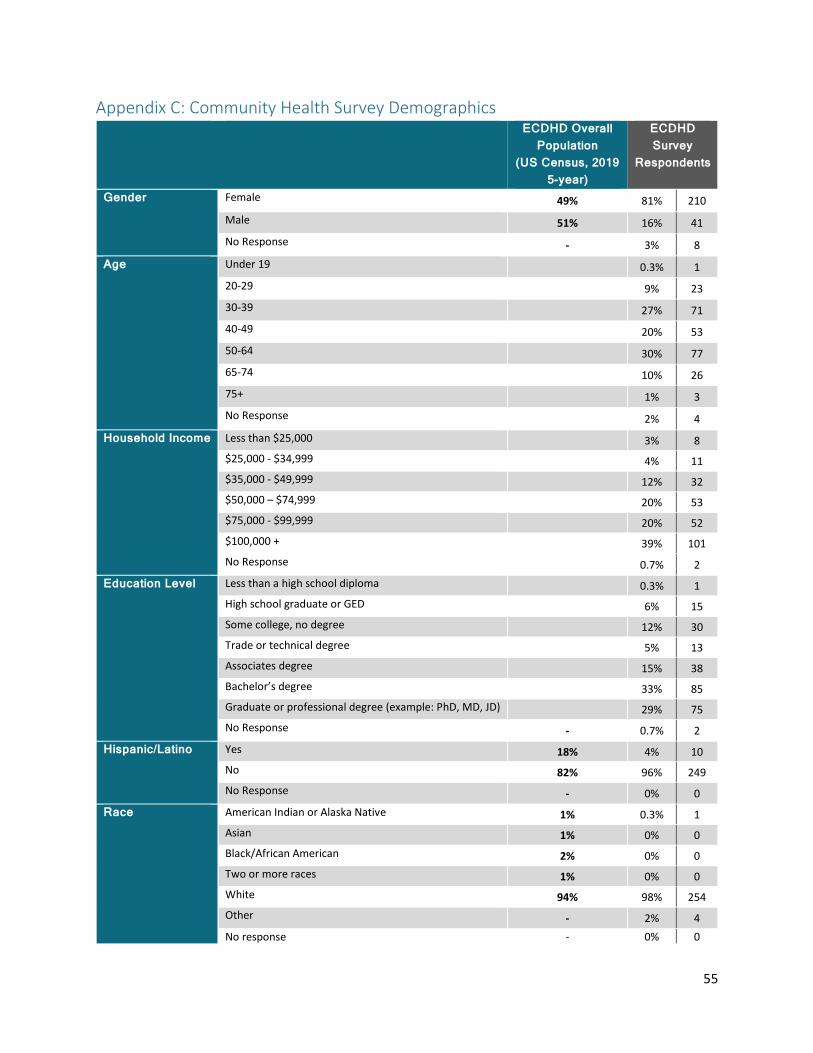
55
Appendix C: Community Health Survey Demographics ECDHD Overall
Population (US Census, 2019
5-year)
ECDHD Survey
Respondents
Gender Female 49% 81% 210
Male 51% 16% 41 No Response - 3% 8
Age Under 19 0.3% 1 20-29 9% 23 30-39 27% 71 40-49 20% 53 50-64 30% 77 65-74 10% 26 75+ 1% 3 No Response 2% 4
Household Income Less than $25,000 3% 8 $25,000 - $34,999 4% 11 $35,000 - $49,999 12% 32 $50,000 – $74,999 20% 53 $75,000 - $99,999 20% 52 $100,000 + 39% 101 No Response 0.7% 2
Education Level Less than a high school diploma 0.3% 1 High school graduate or GED 6% 15 Some college, no degree 12% 30 Trade or technical degree 5% 13 Associates degree 15% 38 Bachelor’s degree 33% 85 Graduate or professional degree (example: PhD, MD, JD) 29% 75 No Response - 0.7% 2
Hispanic/Latino Yes 18% 4% 10 No 82% 96% 249 No Response - 0% 0
Race American Indian or Alaska Native 1% 0.3% 1 Asian 1% 0% 0 Black/African American 2% 0% 0 Two or more races 1% 0% 0 White 94% 98% 254 Other - 2% 4 No response - 0% 0

56
Appendix D: References
i US Census Bureau, 2015-2019 American Community Survey 5-year estimates ii US DHHS, HRSA, Rural Health Information Hub. 2019. Am I rural tool iii Public Health Foundation. Becoming a Community Chief Health Strategist. Retrieved 10/17/2020 at http://www.phf.org/consulting/Pages/Becoming_the_Community_Chief_Health_Strategist.aspx iv Bennett, KJ, Olatosi, B, Probst, JC. 2008. Health Disparities—A Rural-Urban Chartbook. 2008. South Carolina Rural Health Research Center. v Meit, M., Knudson, A., Gilbert, T., Yu, A. T. C., Tanenbaum, E., Ormson, E., & Popat, M. S. (2014). The 2014 update of the rural-urban chartbook. Rural Health Reform Policy Research Center. vi US Dept of Education. National Center for Health Statistics. (2006). The health literacy of America’s adults: Results from the 2003 national assessment of adult literacy. vii Indian Health Service Health Literacy Workgroup. (2017, July 17). Indian Health Service: White Paper on Health Litracy. page 2 viii USDHHS, Office of Minority Health. Profile: Hispanic/Latino Americans. 2019 ix Ngelay, B. and Sanders, S. 2016. Profile of the Karenni Community in Nebraska. x US Census Bureau, American Community Survey, 2013-2017 via CARES xi Nebraska Behavioral Risk Factor Surveillance System (BRFSS), years 2011-2019 combined, published January 2021 xii Ross, P. T., Ravindranath, D., Clay, M., & Lypson, M. L. (2015). A Greater Mission: Understanding Military Culture as a Tool for Serving Those Who Have Served. Journal of graduate medical education, 7(4), 519–522. doi:10.4300/JGME-D-14-00568.1 xiii US Census Bureau, 2015-2019 American Community Survey 5-year estimates xiv US Census Bureau, 2015-2019 American Community Survey 5-year estimates xv US Census Bureau, Quick Facts, 2019 xvi County Health Rankings and Roadmaps, 2020 xvii University of Nebraska Omaha, Office of Latino/Latin American Studies, “Latinos and the Economic Downturn in Nebraska”, July 2016 https://www.unomaha.edu/college-of-arts-and-sciences/ollas/_files/pdfs/publications-presentations/report-latinos-and-the-economic-downturn-2016.pdf, page 1 xviii US Census Bureau, Quickfacts, 2019 xix County Health Rankings and Roadmaps, 2020 xx Nebraska Legislative Research Office, (2018), Nebraska Counties at-a-glance research report xxi County Health Rankings and Roadmaps, 2020 xxii US Census Bureau, American Community Survey, 2013-2017 via CARES xxiii US Census Bureau, Quickfacts, 2019 xxiv County Health Rankings and Roadmaps, 2020 xxv Nebraska Legislative Research Office, (2018), Nebraska Counties at-a-glance research report xxvi County Health Rankings and Roadmaps, 2020 xxvii US Census Bureau, American Community Survey, 2013-2017 via CARES xxviii US Census Bureau, Quickfacts, 2019 xxix County Health Rankings and Roadmaps, 2020 xxx Nebraska Legislative Research Office, (2018), Nebraska Counties at-a-glance research report xxxi County Health Rankings and Roadmaps, 2020 xxxii US Census Bureau, American Community Survey, 2013-2017 via CARES xxxiii US Census Bureau, Quickfacts, 2019 xxxiv County Health Rankings and Roadmaps, 2020 xxxv Nebraska Legislative Research Office, (2018), Nebraska Counties at-a-glance research report xxxvi County Health Rankings and Roadmaps, 2020 xxxvii US Census Bureau, American Community Survey, 2013-2017 via CARES xxxviii County Health Rankings and Roadmaps, 2020 xxxix County Health Rankings and Roadmaps, 2020 xl US Census Bureau, 2015-2019 American Community Survey 5-year estimates xli US Census Bureau, 2015-2019 American Community Survey 5-year estimates xlii County Health Rankings and Roadmaps, 2020 xliii County Health Rankings and Roadmaps, 2020 xliv Nebraska Legislative Research Office, (2018), Nebraska Counties at-a-glance research report xlv Nebraska Department of Education, School Profile Data 2017/2018 xlvi County Health Rankings and Roadmaps, 2020 xlvii US Census Bureau, 2015-2019 American Community Survey 5-year estimates

57
xlviii Nebraska DHHS, 2016, Vital Statistics Report xlix Heron, M. Deaths: Leading Causes for 2016. National Vital Statistics Reports; vol 67 no 6. Hyattsville, MD: National Center for Health Statistics, 2018. l Nebraska DHHS, 2016, Vital Statistics Report li County Health Rankings and Roadmaps, 2020 lii County Health Rankings and Roadmaps, 2020 liii County Health Rankings and Roadmaps, 2020 liv Nebraska DHHS, Chronic Disease Surveillance Report, 2011 lv Nebraska DHHS, Injury in Nebraska Report 2009-2013 lvi State Cancer Profiles, 2012-2016 lvii American Cancer Society, 2019, What causes non-small cell lung cancer? lviii CDC, National Center for Chronic Disease Prevention and Health Promotion, Office on Smoking and Health, 2019, Current cigarette smoking among adults in the United States. lix County Health Rankings and Roadmaps, 2020 lx Truth Initiative, 2019, Tobacco use in Nebraska 2019 lxi Truth Initiative, 2018, E-cigarettes: Facts, stats and regulations lxii Truth Initiative, 2018, E-cigarettes: Facts, stats and regulations lxiii Nebraska DHHS, Division of Behavioral Health, Nebraska Risk and Protective Factor Student Survey, 2018, East Central District Health Department Profile Report. lxiv Nebraska DHHS, Office of Health Disparities and Health Equity, Heart Disease and Stroke Dashboard lxv Centers for Disease Control and Prevention, Behavioral Risk Factor Surveillance System, 2006-2012 via CARES lxvi Nebraska Behavioral Risk Factor Surveillance System (BRFSS), years 2011-2017 combined, published January 2018 lxvii Good Neighbor Clinic Data, 2020 lxviii Nebraska Behavioral Risk Factor Surveillance System (BRFSS) 2019 lxix County Health Rankings and Roadmaps, 2020 lxx Centers for Disease Control and Prevention, Diabetes basics-quick facts, retrieved from: https://www.cdc.gov/diabetes/basics/quick-facts.html lxxi Centers for Disease Control and Prevention, Diabetes and Your Heart, retrieved from: https://www.cdc.gov/diabetes/library/features/diabetes-and-heart.html lxxii County Health Rankings and Roadmaps, 2020 lxxiii Nebraska DHHS, Injury in Nebraska Report 2009-2013 lxxiv Nebraska DHHS, Nebraska 2016 Vital Statistics Report lxxv County Health Rankings and Roadmaps, 2020 lxxvi CDC, Office of Disease Prevention and Health Promotion, 2019, Healthy People 2020: Mental health: Overview and Impact lxxvii Nebraska DHHS, Division of Behavioral Health, Nebraska Risk and Protective Factor Student Survey, 2018, East Central District Health Department Profile Report. lxxviii Watanabe-Galloway, S., et al. 2016. Nebraska Behavioral Health Needs Assessment. University of Nebraska Medical Center, Omaha, NE. lxxix American Foundation for Suicide Prevention. Suicide: Nebraska 2016 facts and figures. lxxx NALHD, VetSET: http://nalhd.org/our-work/vetset/building-military-cultural-competence.html lxxxi CDC. Adverse Childhood Experiences: looking at how ACEs affect our lives and society. lxxxii US Department of Health and Human Services. (2018) Adverse Childhood Experiences. Retrieved 1/23/19 from https://www.childwelfare.gov/topics/preventing/preventionmonth/resources/ace/ lxxxiii ACEs Connection. 2017 Nebraska fact sheet. lxxxiv CDC, Adverse Childhood Experiences: looking at how ACEs affect our lives and society. lxxxv CDC, 2019, CDC-Kaiser ACE Study. lxxxvi Voices for Children in Nebraska, 2017, The Kids Count in Nebraska 2017 Report lxxxvii ACEs Connection, 2017, 2017 Nebraska fact sheet lxxxviii Voices for Children in Nebraska, The Kids Count in Nebraska 2017 Report, Page 37 lxxxix American Psychological Association, 2019, The road to resilience. xc Data Resource Center for Child & Adolescent Health, 2016, National Survey of Children’s Health: Indicator 6.28. xci America’s Health Rankings, 2018, Public Health Impact: Adverse Childhood Experiences xcii America’s Health Rankings, 2018, Public Health Impact: Adverse Childhood Experiences xciii America’s Health Rankings, 2018, Public Health Impact: Adverse Childhood Experiences xciv SAMHSA, 2019, Substance Abuse and Mental Illness Prevention xcv NIH, National Institutes on drug abuse, Comorbidity: Substance use disorders and other mental illnesses, August 2018

58
xcvi Watanabe-Galloway, S., et al. 2016. Nebraska Behavioral Health Needs Assessment. University of Nebraska Medical Center, Omaha, NE. xcvii CDC, National Center for Chronic Disease Prevention and Health Promotion, Division of Population Health, 2018, https://www.cdc.gov/alcohol/data-stats.htm xcviii Reidpath DD, Allotey P. Infant mortality rate as an indicator of population health. Journal of Epidemiology & Community Health 2003; 57:344-346. xcix CDC, National Center for Chronic Disease Prevention and Health Promotion, Division of Reproductive Health, 2016, Infant Mortality c County Health Rankings and Roadmaps, 2020 ci US Department of Health & Human Services, Health Resources and Services Administration, Area Health Resource File, 2006-10 via CARES cii County Health Rankings and Roadmaps, 2020 ciii County Health Rankings and Roadmaps, 2020 civ Nebraska DHHS, Vital Statistics Report, 2016: The number of resident live births per 1,000 population cv County Health Rankings and Roadmaps, 2020 cvi County Health Rankings and Roadmaps, 2020 cvii Nebraska Behavioral Risk Factor Surveillance System (BRFSS), years 2011-2017 combined, published January 2018 cviii Alliance for Health Policy, 2017, The Sourcebook: Essentials of Health Policy. Chapter 8-Mental Health and Substance Abuse. cix County Health Rankings and Roadmaps, 2020 cx Alliance for Health Policy, 2017, The Sourcebook: Essentials of Health Policy. Chapter 8-Mental Health and Substance Abuse cxi Nebraska Behavioral Risk Factor Surveillance System (BRFSS), years 2011-2017 combined, published January 2018 cxii County Health Rankings and Roadmaps, 2020 cxiii Nebraska DHHS, Office of Health Disparities and Health Equity, Access to Health Services Dashboard cxiv USDHHS, Office of Minority Health. 2019. Profile: Hispanic/Latino Americans. cxv The Commonwealth Fund. 2017. Older Americans Were Sicker and Faced More Financial Barriers to Health Care Than Counterparts in Other Countries. cxvi Nebraska DHHS, Office of Health Disparities and Health Equity, Access to Health Services Dashboard cxvii Nebraska Behavioral Risk Factor Surveillance System (BRFSS), years 2011-2019 combined, published January 2021 cxviii Nebraska Behavioral Risk Factor Surveillance System (BRFSS), years 2011-2019 combined, published January 2021