Embed Size (px)
Citation preview
2021 City of Sterling Heights Residential Survey
Findings Report
Presented to the City of Sterling Heights, Michigan
September 2021
Contents
Executive Summary .................................................................... i
Section 1: Charts and Graphs .................................................. 1
Section 2: Benchmarking Analysis .................................... 49
Section 3: Importance-Satisfaction Analysis .................. 59
Section 4: Tabular Data ........................................................ 67
Section 5: Survey Instrument ............................................ 109

Executive Summary
2021 City of Sterling Heights Residential Survey: Findings Report
ETC Institute (2021) Page i
ETC Institute (2021) Page ii
2021 City of Sterling Heights Residential Survey Executive Summary
Purpose and Methodology
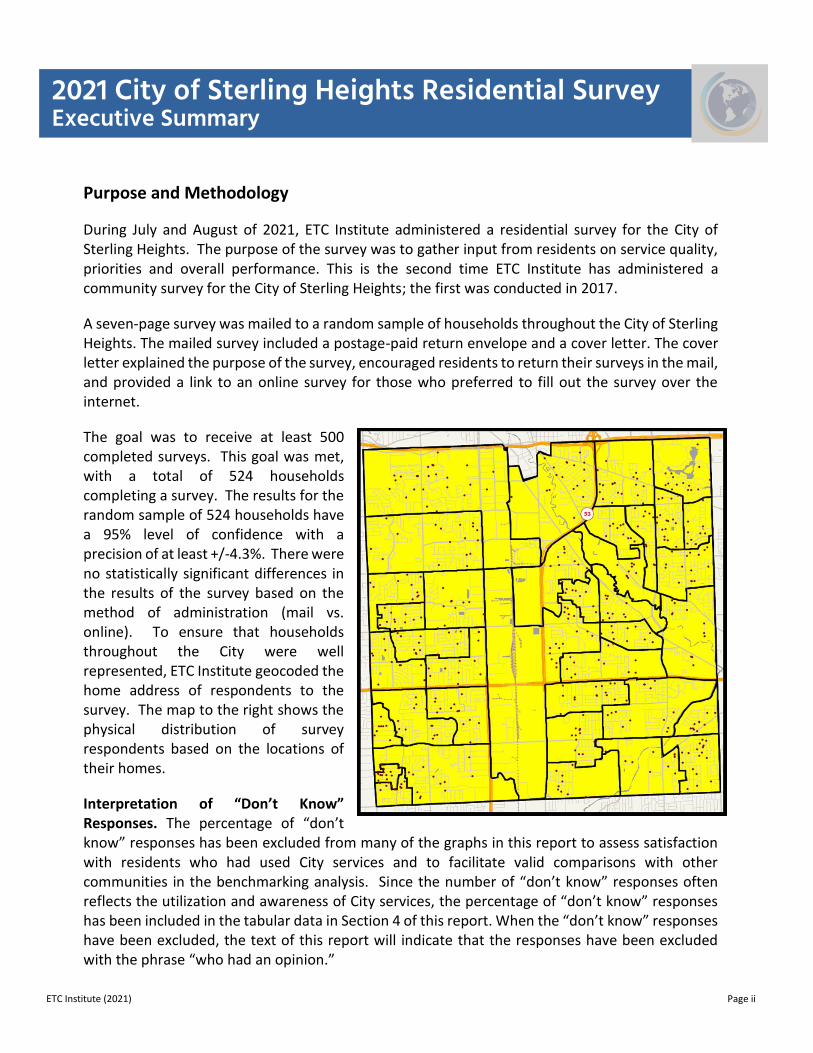
During July and August of 2021, ETC Institute administered a residential survey for the City of Sterling Heights. The purpose of the survey was to gather input from residents on service quality, priorities and overall performance. This is the second time ETC Institute has administered a community survey for the City of Sterling Heights; the first was conducted in 2017.
A seven-page survey was mailed to a random sample of households throughout the City of Sterling Heights. The mailed survey included a postage-paid return envelope and a cover letter. The cover letter explained the purpose of the survey, encouraged residents to return their surveys in the mail, and provided a link to an online survey for those who preferred to fill out the survey over the internet.
The goal was to receive at least 500 completed surveys. This goal was met, with a total of 524 households completing a survey. The results for the random sample of 524 households have a 95% level of confidence with a precision of at least +/-4.3%. There were no statistically significant differences in the results of the survey based on the method of administration (mail vs. online). To ensure that households throughout the City were well represented, ETC Institute geocoded the home address of respondents to the survey. The map to the right shows the physical distribution of survey respondents based on the locations of their homes.
Interpretation of “Don’t Know” Responses. The percentage of “don’t know” responses has been excluded from many of the graphs in this report to assess satisfaction with residents who had used City services and to facilitate valid comparisons with other communities in the benchmarking analysis. Since the number of “don’t know” responses often reflects the utilization and awareness of City services, the percentage of “don’t know” responses has been included in the tabular data in Section 4 of this report. When the “don’t know” responses have been excluded, the text of this report will indicate that the responses have been excluded with the phrase “who had an opinion.”
ETC Institute (2021) Page iii
2021 City of Sterling Heights Residential Survey Executive Summary
This report contains:
• a summary of the methodology for administering the survey and major findings
• charts showing the overall results for the survey and trends from 2017 (Section 1)
• benchmarking data that show how the results for the City of Sterling Heights compare toother U.S. communities (Section 2)
• Importance-Satisfaction analysis that identifies priorities for investment (Section 3)
• tabular data showing the overall results for all questions on the survey (Section 4)
• a copy of the cover letter and survey instrument (Section 5)
Major Findings
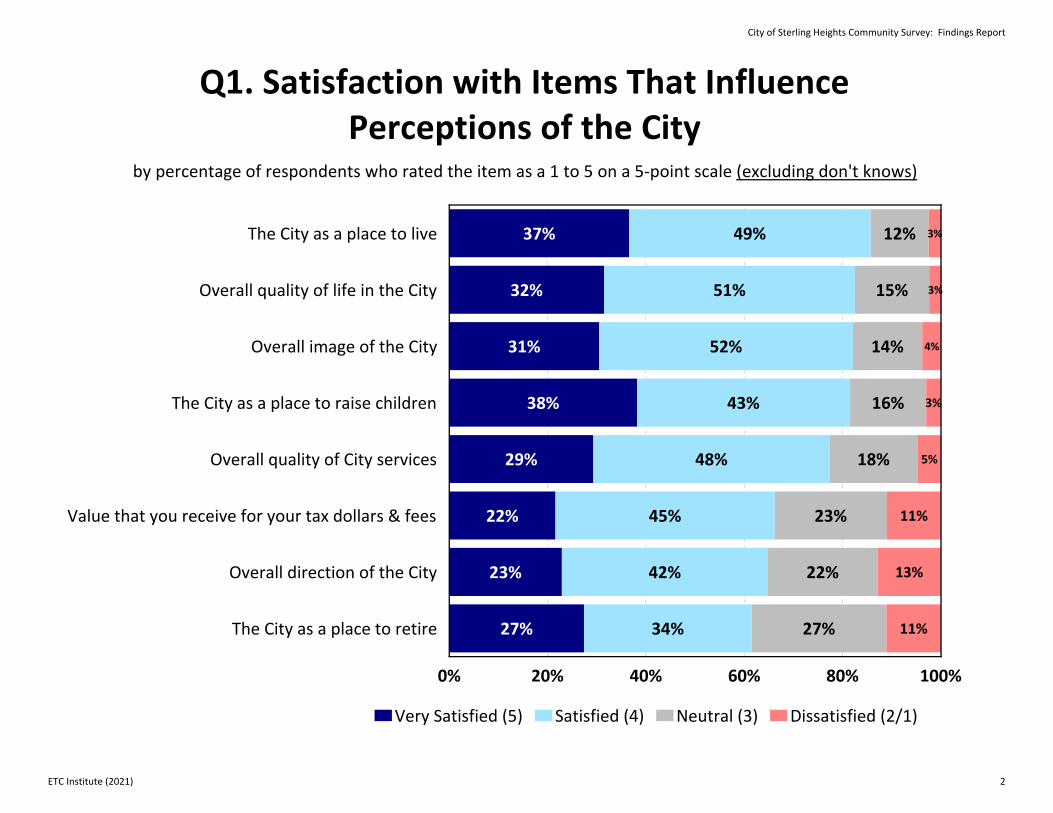
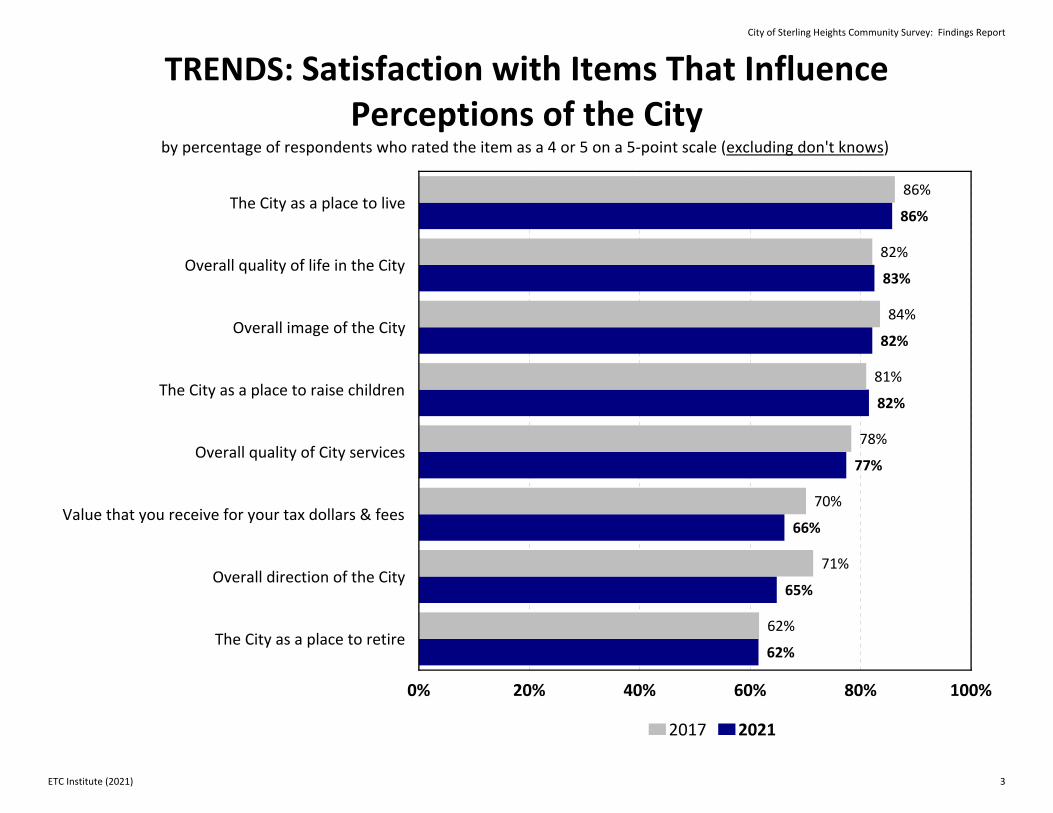
Satisfaction with Items That Influence Perceptions of the City. Eighty-six percent (86%) of respondents, who had an opinion, were satisfied (rating of 4 or 5 on a 5-point scale) with the City of Sterling Heights as a place to live; 83% were satisfied with the overall quality of life in the City, and 82% were satisfied with the overall image of the City. Residents were least satisfied with the City as a place to retire (62%).
Seventy-seven percent (77%) of respondents were satisfied with the overall quality of City services. This is significantly higher than the regional average of 54%, and the national average of 59%. In addition, 66% of respondents were satisfied with the value they receive for tax dollars and fees, which is significantly higher than the regional average of 41%, and the national average of 44%.
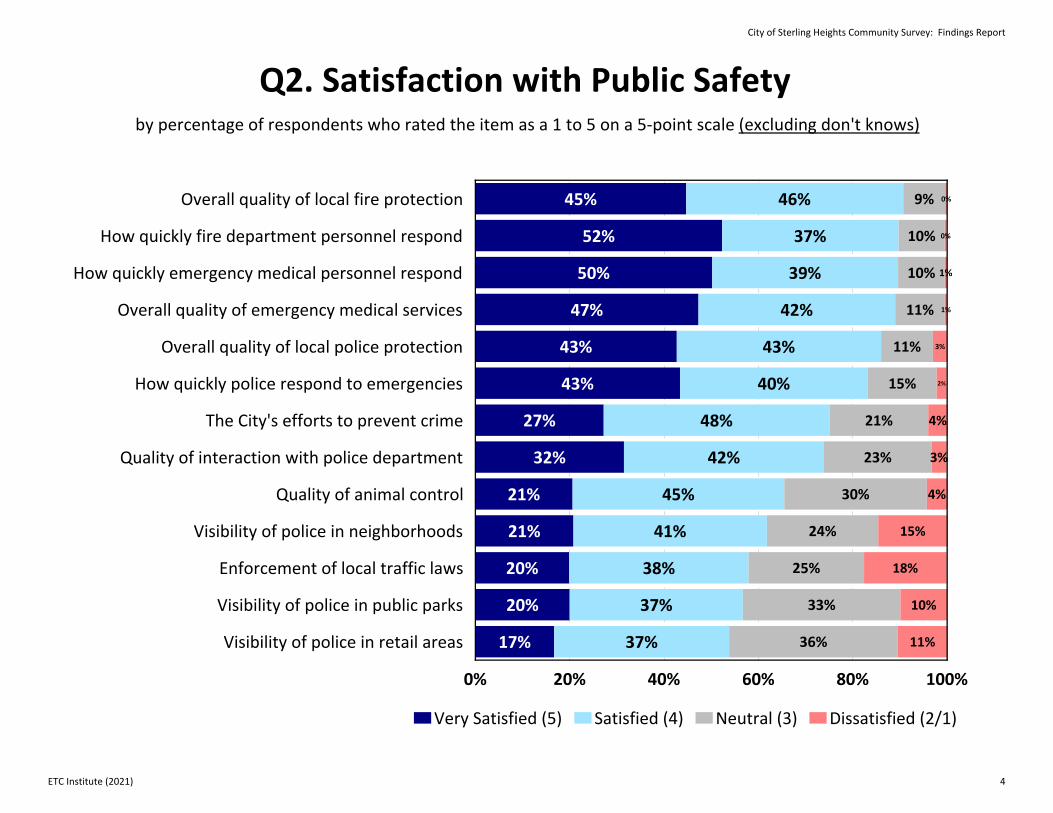
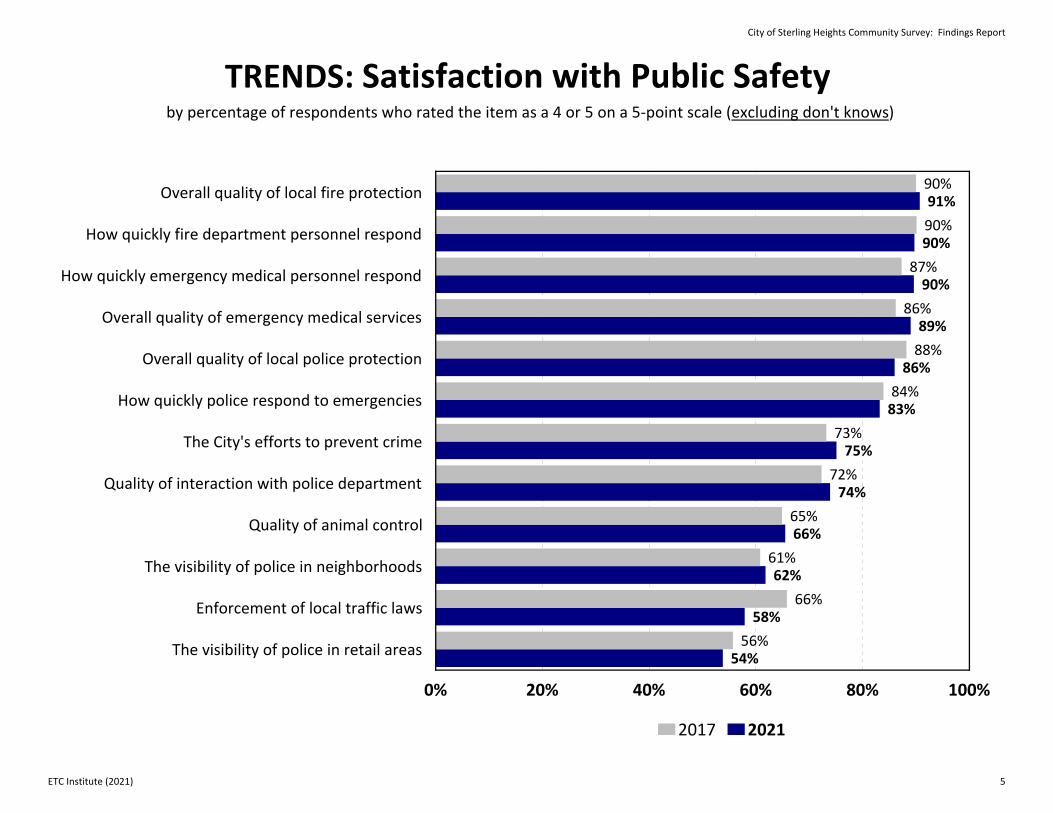
Public Safety. Ninety-one percent (91%) of respondents, who had an opinion, were satisfied (rating of 4 or 5 on a 5-point scale) with the overall quality of local fire protection; 90% were satisfied with how quickly fire department personnel respond to emergencies; 90% were satisfied with how quickly emergency medical personnel respond to emergencies, and 89% were satisfied with the overall quality of emergency medical services. Ninety-seven percent (97%) of respondents feel safe in their neighborhood during the day, and 86% are satisfied with the quality of police protection. Notwithstanding these very high satisfaction levels, respondents would like to see more visibility of police in neighborhoods and retail areas. Residents were least satisfied with the visibility of police in retail areas (54%).
ETC Institute (2021) Page iv
2021 City of Sterling Heights Residential Survey Executive Summary
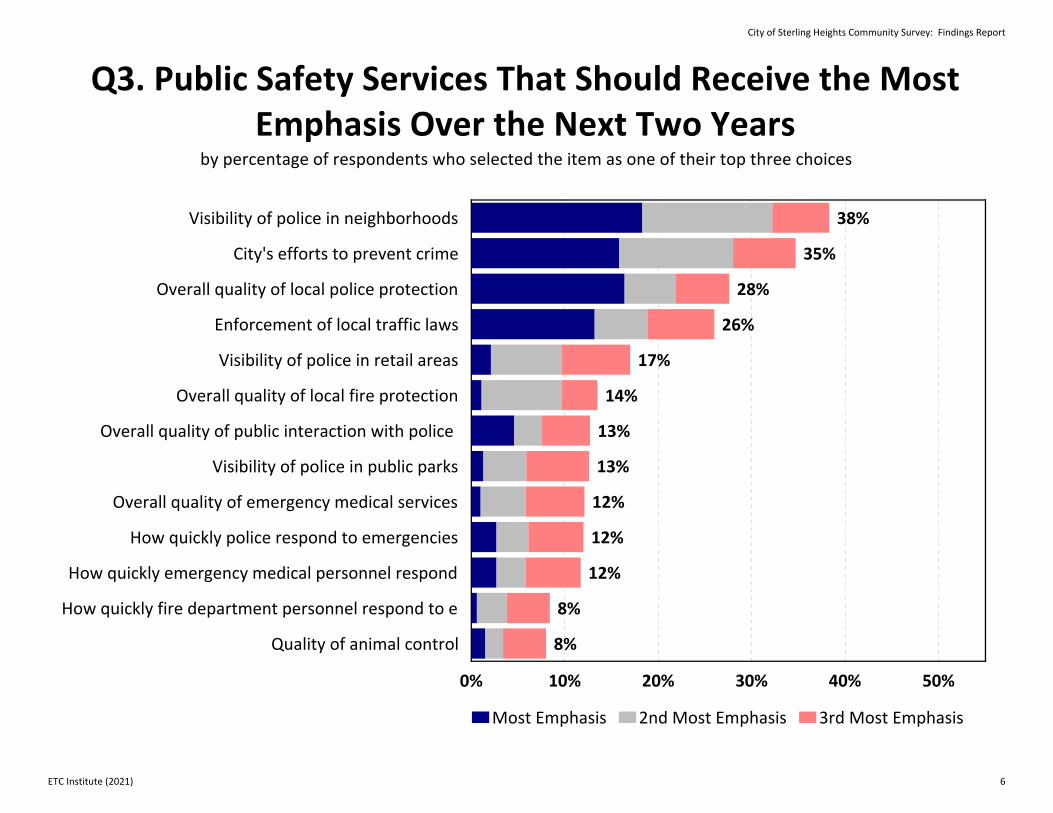
Public Safety Services That Should Receive the Most Emphasis. Based on the sum of their top three choices, the public safety services that respondents feel are most important for the City to emphasize over the next two years are: 1) the visibility of police in neighborhoods, 2) the City’s efforts to prevent crime, and 3) the overall quality of local police protection.
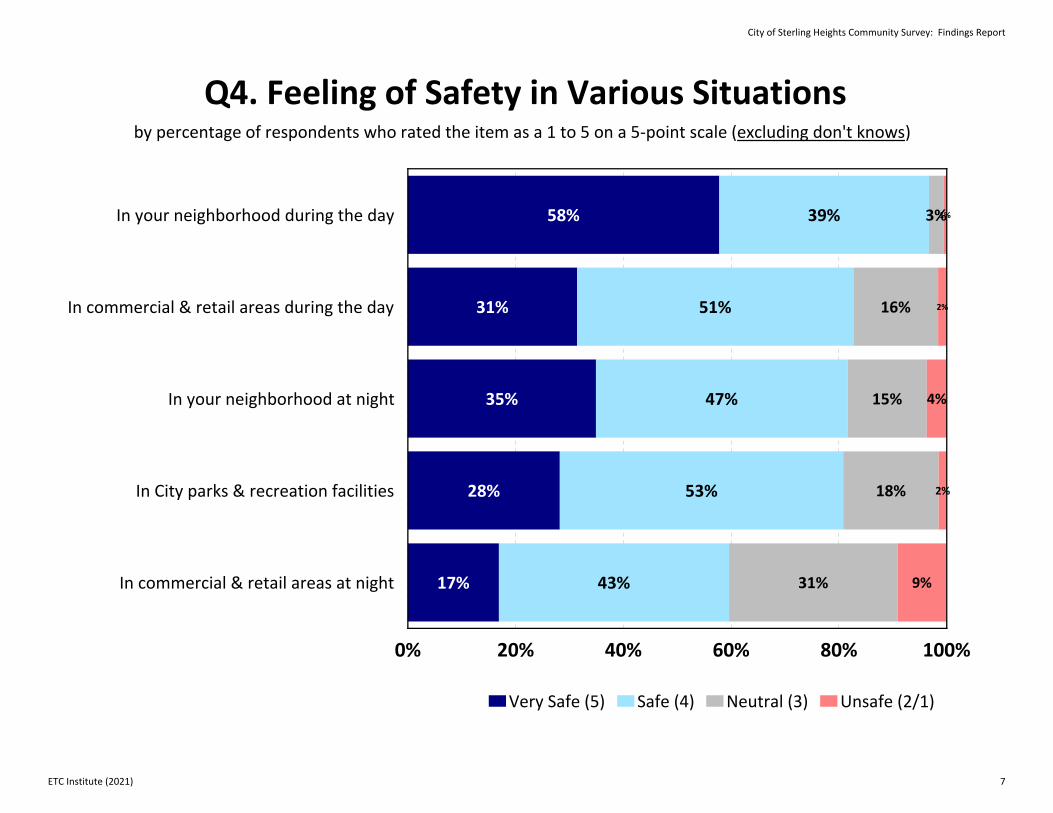
Perceptions of Safety. Most (97%) of the respondents, who had an opinion, felt “very safe” or “safe” in their neighborhood during the day, and 83% felt safe in commercial and retail areas of Sterling Heights during the day.
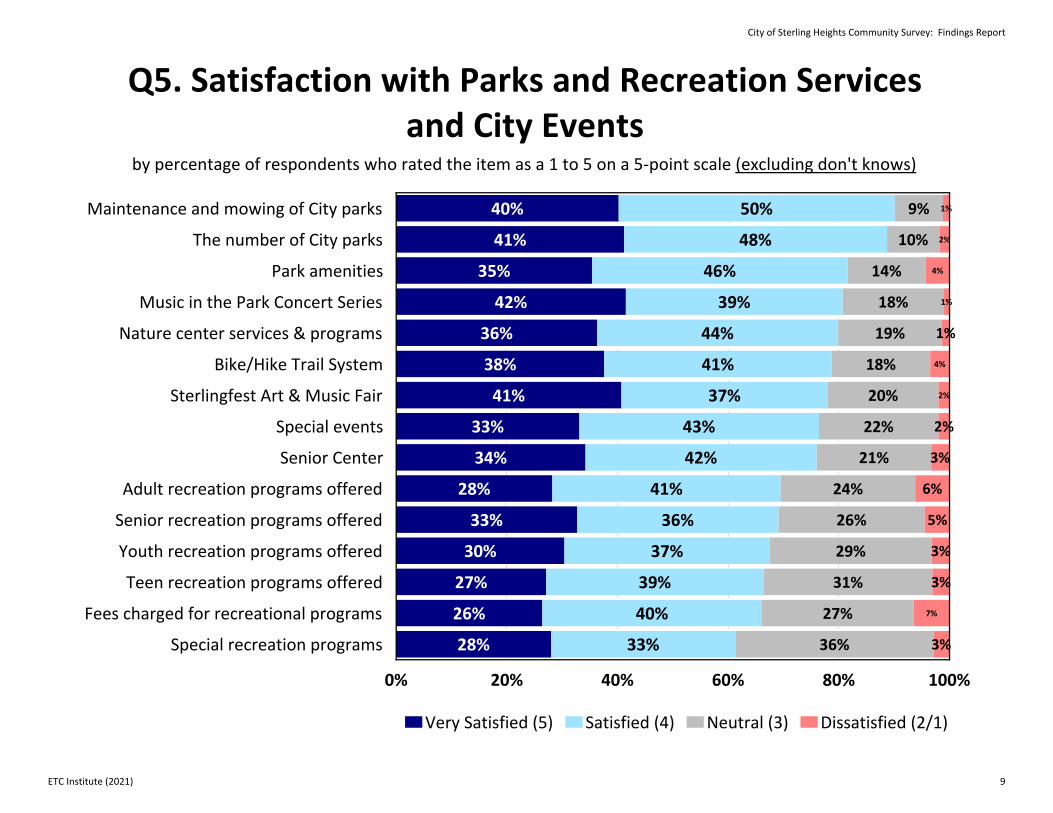
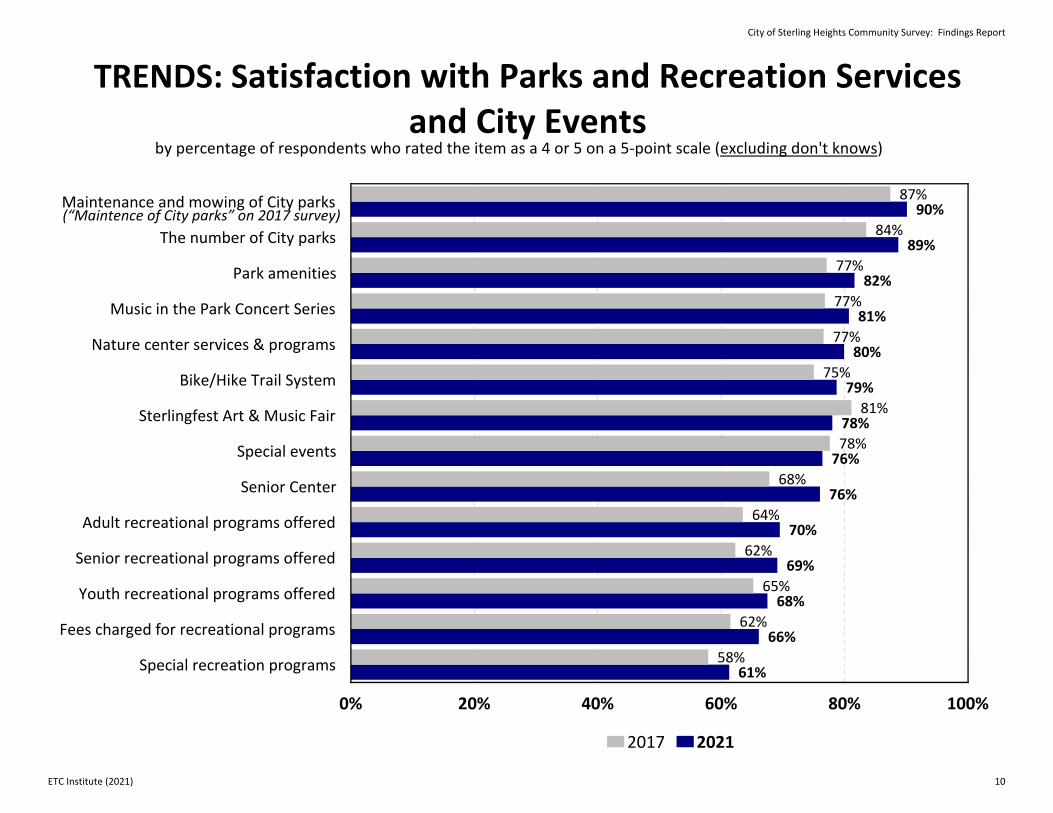
Parks and Recreation Services and City Events. Ninety percent (90%) of respondents, who had an opinion, were satisfied (rating of 4 or 5 on a 5-point scale) with the maintenance and mowing of City parks; 89% were satisfied with the number of City parks; 82% were satisfied with park amenities; 81% were satisfied with the Music in the Park Concert Series, and 80% were satisfied with Nature Center services and programs. Residents were least satisfied with special recreation programs (61%).
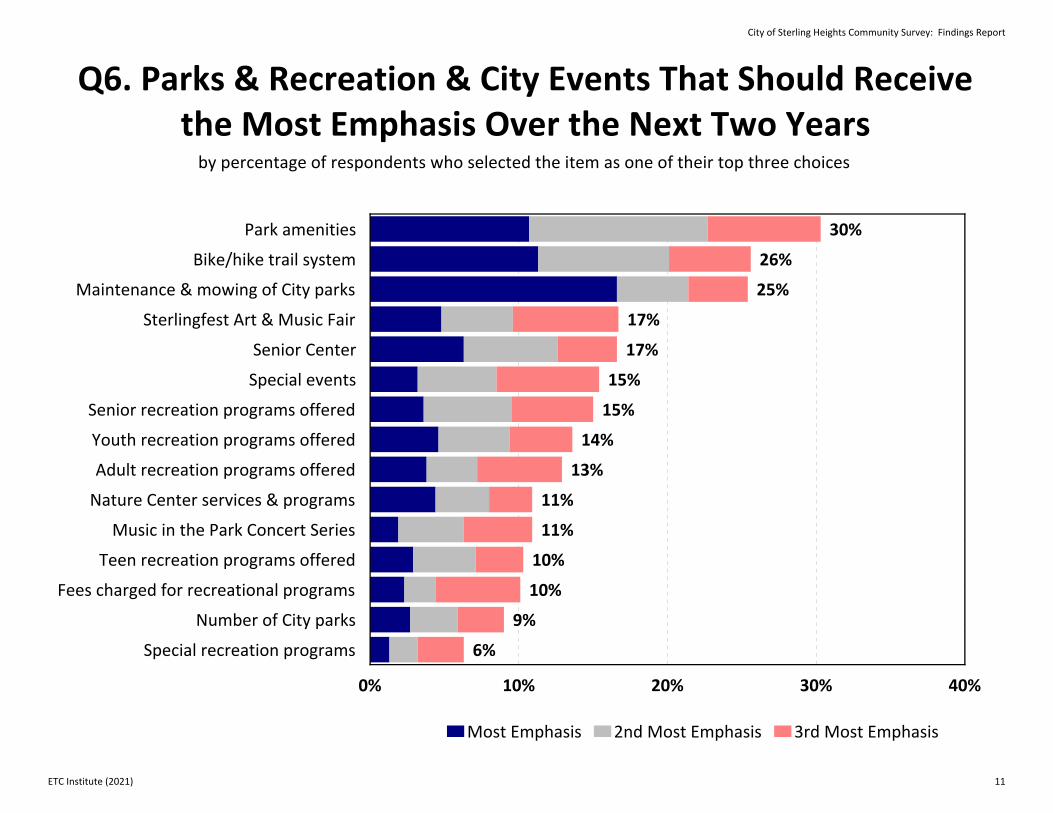
Parks and Recreation Services/City Events That Should Receive the Most Emphasis. Based on the sum of their top three choices, the parks and recreation services/City events that respondents feel are most important for the City to emphasize over the next two years are: 1) park amenities, 2) Bike/Hike Trail System, and 3) maintenance and mowing of City parks.
Public Library Services. Seventy-three percent (73%) of respondents, who had an opinion, were satisfied (rating of 4 or 5 on a 5-point scale) with print collections at the public library; 70% were satisfied with reference services, and 68% were satisfied with audio/video collections. Residents were least satisfied with homebound/home delivery services (56%).
Public Library Services That Should Receive the Most Emphasis. Based on the sum of their top two choices, the public library services that respondents feel are most important for the City to emphasize over the next two years are: 1) programs for children and 2) homebound/home delivery services.
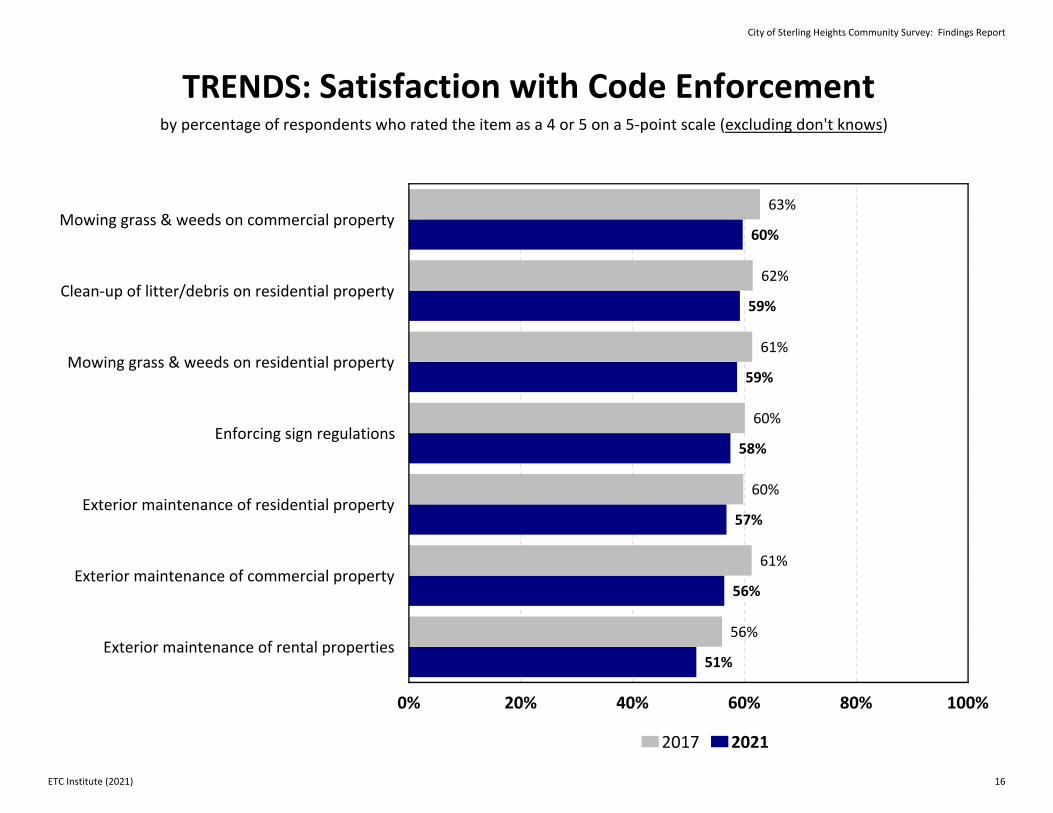
Code Enforcement. Sixty percent (60%) of the respondents, who had an opinion, were satisfied (rating of 4 or 5 on a 5-point scale) with enforcing the mowing of grass and weeds on commercial property; 59% were satisfied with enforcing the clean-up of litter/debris on residential property, and 59% were satisfied with enforcing the mowing of grass and weeds on residential property. Residents were least satisfied with enforcing exterior maintenance of rental properties (51%).
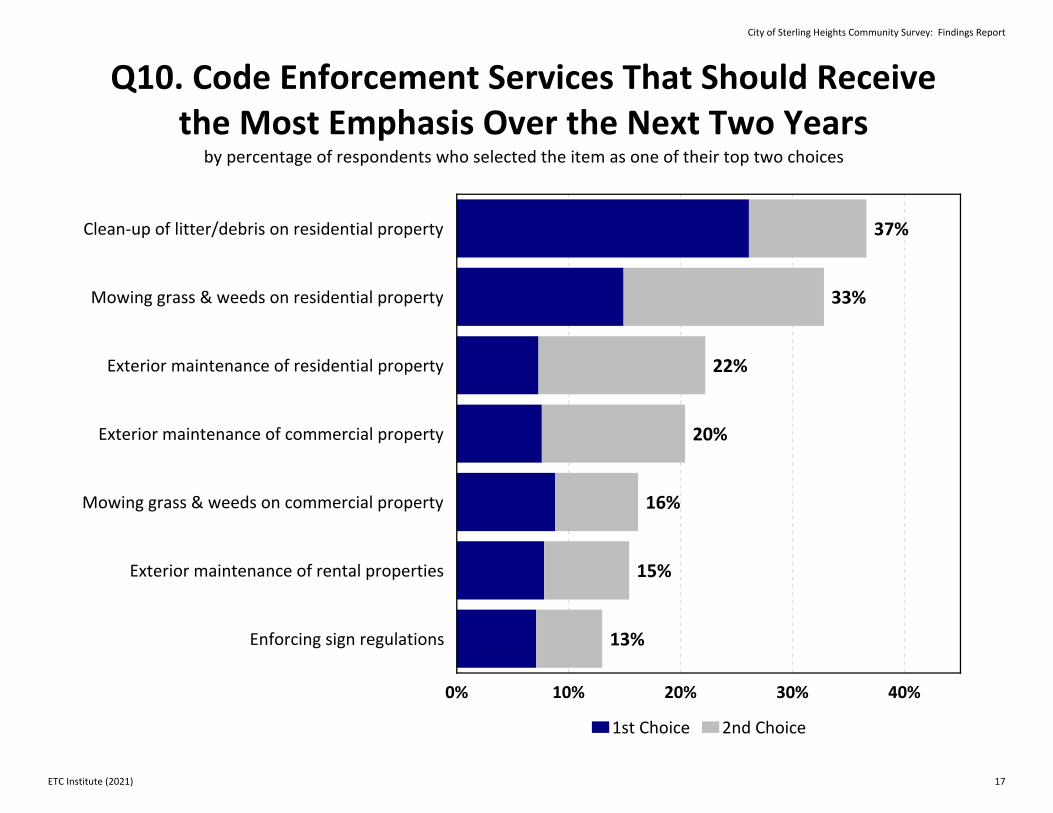
Code Enforcement Services That Should Receive the Most Emphasis. Based on the sum of their top two choices, the code enforcement services that respondents feel are most important for the City to emphasize over the next two years are: 1) enforcing clean-up of litter/debris on residential property and 2) enforcing mowing of grass and weed on residential property.
ETC Institute (2021) Page v
2021 City of Sterling Heights Residential Survey Executive Summary
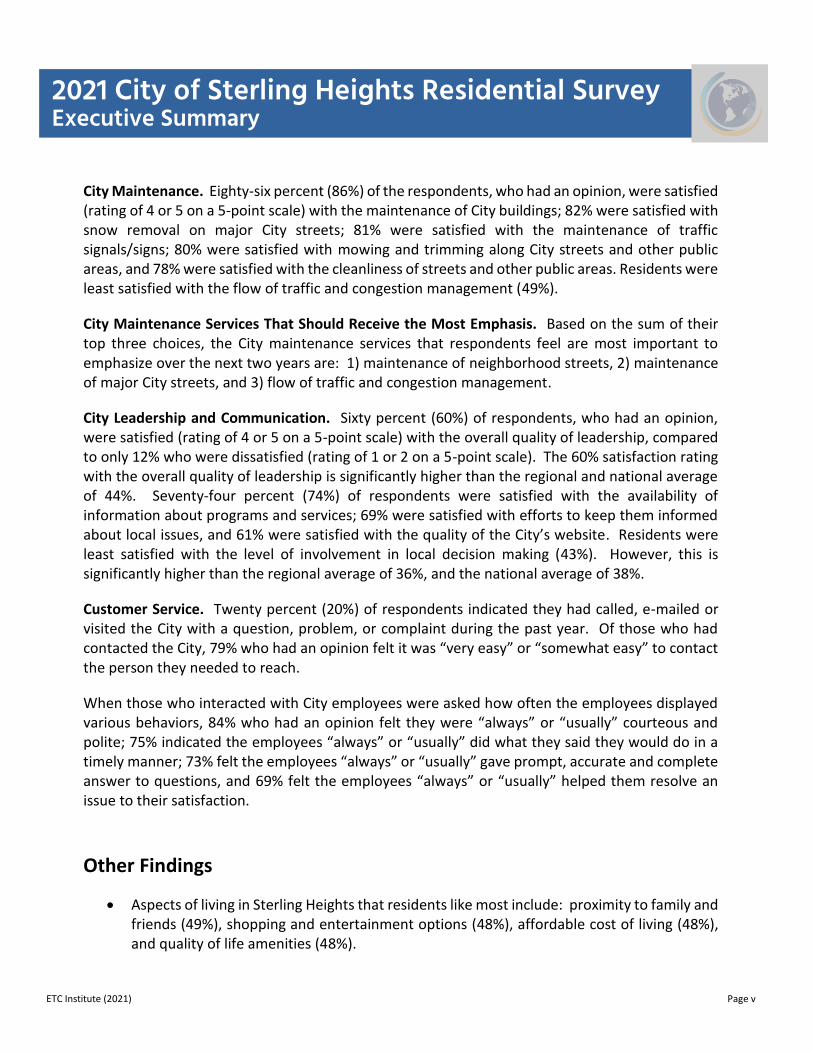
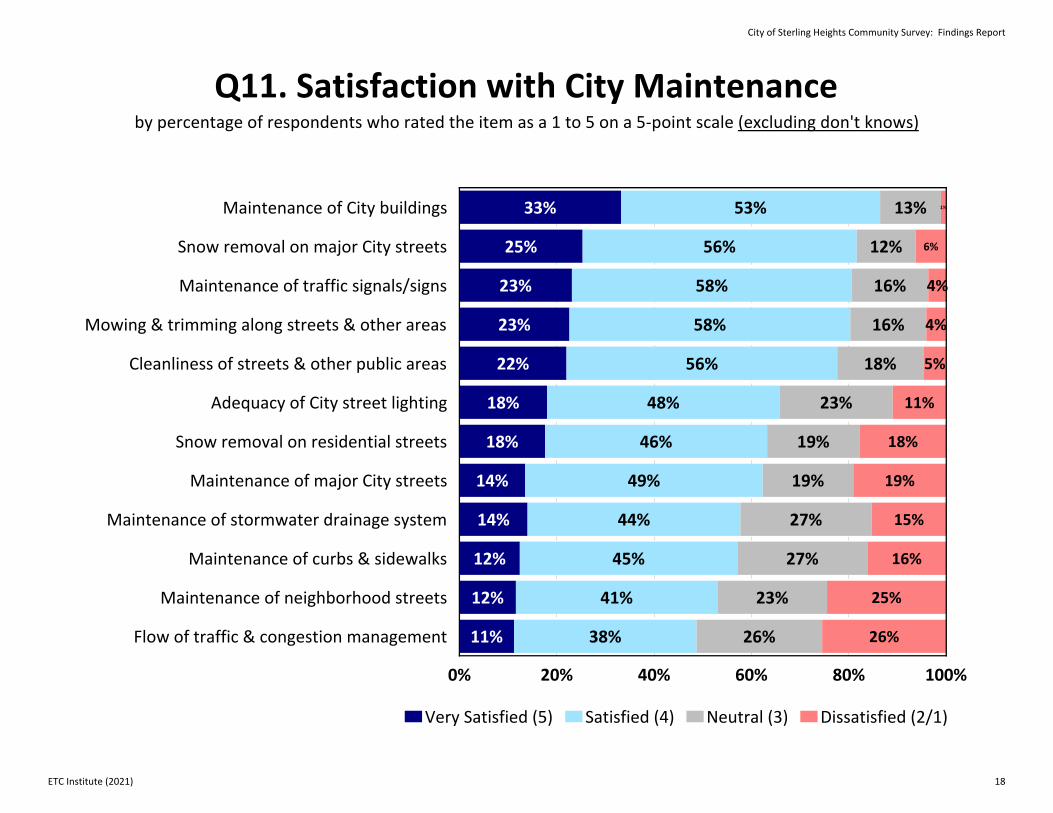
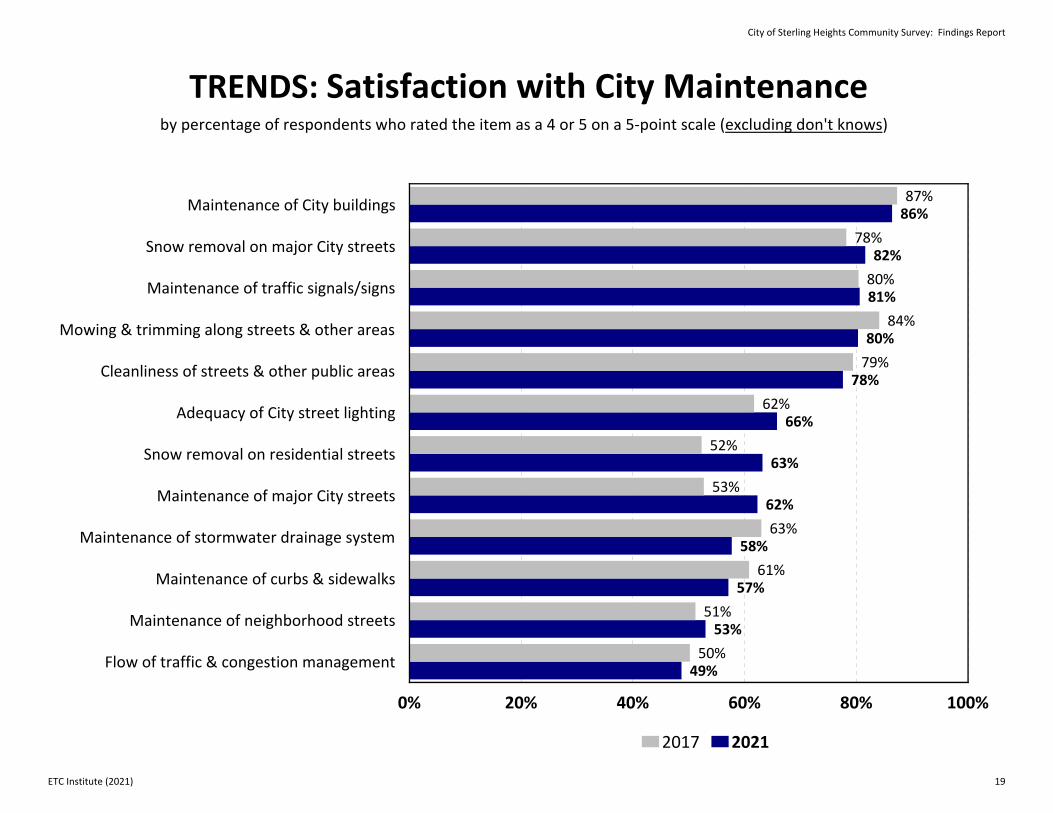
City Maintenance. Eighty-six percent (86%) of the respondents, who had an opinion, were satisfied (rating of 4 or 5 on a 5-point scale) with the maintenance of City buildings; 82% were satisfied with snow removal on major City streets; 81% were satisfied with the maintenance of traffic signals/signs; 80% were satisfied with mowing and trimming along City streets and other public areas, and 78% were satisfied with the cleanliness of streets and other public areas. Residents were least satisfied with the flow of traffic and congestion management (49%).
City Maintenance Services That Should Receive the Most Emphasis. Based on the sum of their top three choices, the City maintenance services that respondents feel are most important to emphasize over the next two years are: 1) maintenance of neighborhood streets, 2) maintenance of major City streets, and 3) flow of traffic and congestion management.
City Leadership and Communication. Sixty percent (60%) of respondents, who had an opinion, were satisfied (rating of 4 or 5 on a 5-point scale) with the overall quality of leadership, compared to only 12% who were dissatisfied (rating of 1 or 2 on a 5-point scale). The 60% satisfaction rating with the overall quality of leadership is significantly higher than the regional and national average of 44%. Seventy-four percent (74%) of respondents were satisfied with the availability of information about programs and services; 69% were satisfied with efforts to keep them informed about local issues, and 61% were satisfied with the quality of the City’s website. Residents were least satisfied with the level of involvement in local decision making (43%). However, this is significantly higher than the regional average of 36%, and the national average of 38%.
Customer Service. Twenty percent (20%) of respondents indicated they had called, e-mailed or visited the City with a question, problem, or complaint during the past year. Of those who had contacted the City, 79% who had an opinion felt it was “very easy” or “somewhat easy” to contact the person they needed to reach.
When those who interacted with City employees were asked how often the employees displayed various behaviors, 84% who had an opinion felt they were “always” or “usually” courteous and polite; 75% indicated the employees “always” or “usually” did what they said they would do in a timely manner; 73% felt the employees “always” or “usually” gave prompt, accurate and complete answer to questions, and 69% felt the employees “always” or “usually” helped them resolve an issue to their satisfaction.
Other Findings
• Aspects of living in Sterling Heights that residents like most include: proximity to family and friends (49%), shopping and entertainment options (48%), affordable cost of living (48%), and quality of life amenities (48%).
ETC Institute (2021) Page vi
2021 City of Sterling Heights Residential Survey Executive Summary
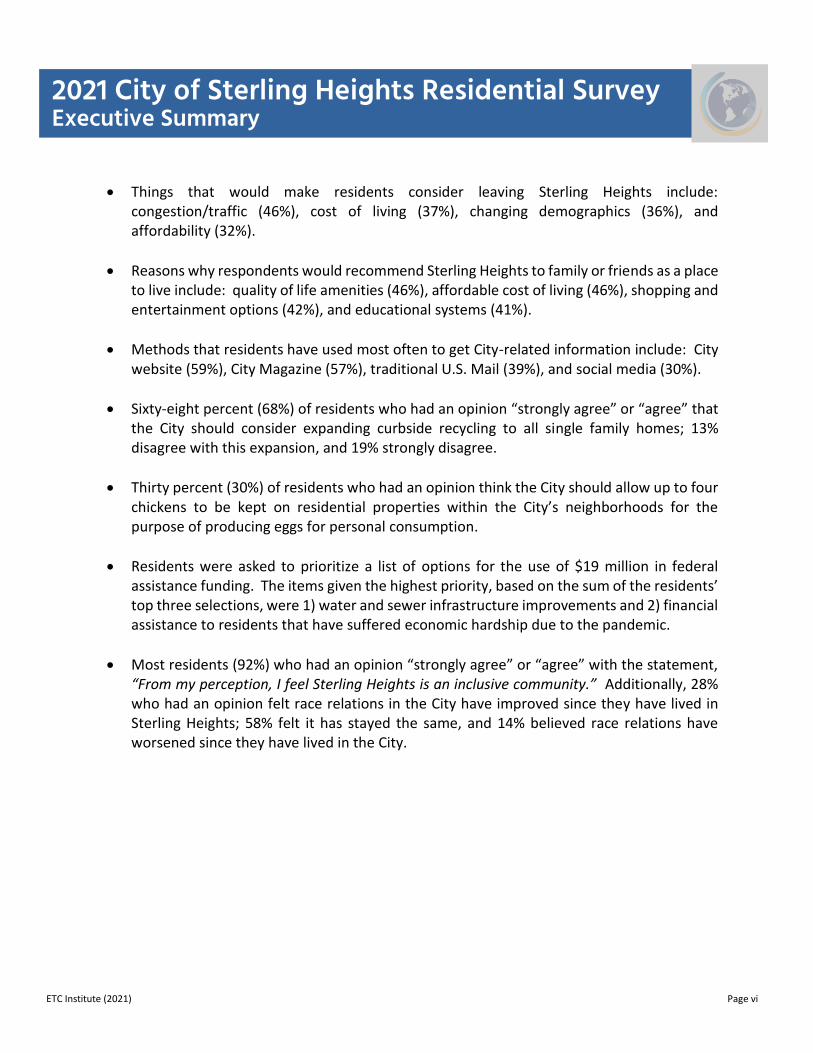
• Things that would make residents consider leaving Sterling Heights include: congestion/traffic (46%), cost of living (37%), changing demographics (36%), and affordability (32%).
• Reasons why respondents would recommend Sterling Heights to family or friends as a place to live include: quality of life amenities (46%), affordable cost of living (46%), shopping and entertainment options (42%), and educational systems (41%).
• Methods that residents have used most often to get City-related information include: City website (59%), City Magazine (57%), traditional U.S. Mail (39%), and social media (30%).
• Sixty-eight percent (68%) of residents who had an opinion “strongly agree” or “agree” that the City should consider expanding curbside recycling to all single family homes; 13% disagree with this expansion, and 19% strongly disagree.
• Thirty percent (30%) of residents who had an opinion think the City should allow up to four chickens to be kept on residential properties within the City’s neighborhoods for the purpose of producing eggs for personal consumption.
• Residents were asked to prioritize a list of options for the use of $19 million in federal assistance funding. The items given the highest priority, based on the sum of the residents’ top three selections, were 1) water and sewer infrastructure improvements and 2) financial assistance to residents that have suffered economic hardship due to the pandemic.
• Most residents (92%) who had an opinion “strongly agree” or “agree” with the statement, “From my perception, I feel Sterling Heights is an inclusive community.” Additionally, 28% who had an opinion felt race relations in the City have improved since they have lived in Sterling Heights; 58% felt it has stayed the same, and 14% believed race relations have worsened since they have lived in the City.
ETC Institute (2021) Page vii
2021 City of Sterling Heights Residential Survey Executive Summary
How Sterling Heights Compares to the North Central Region
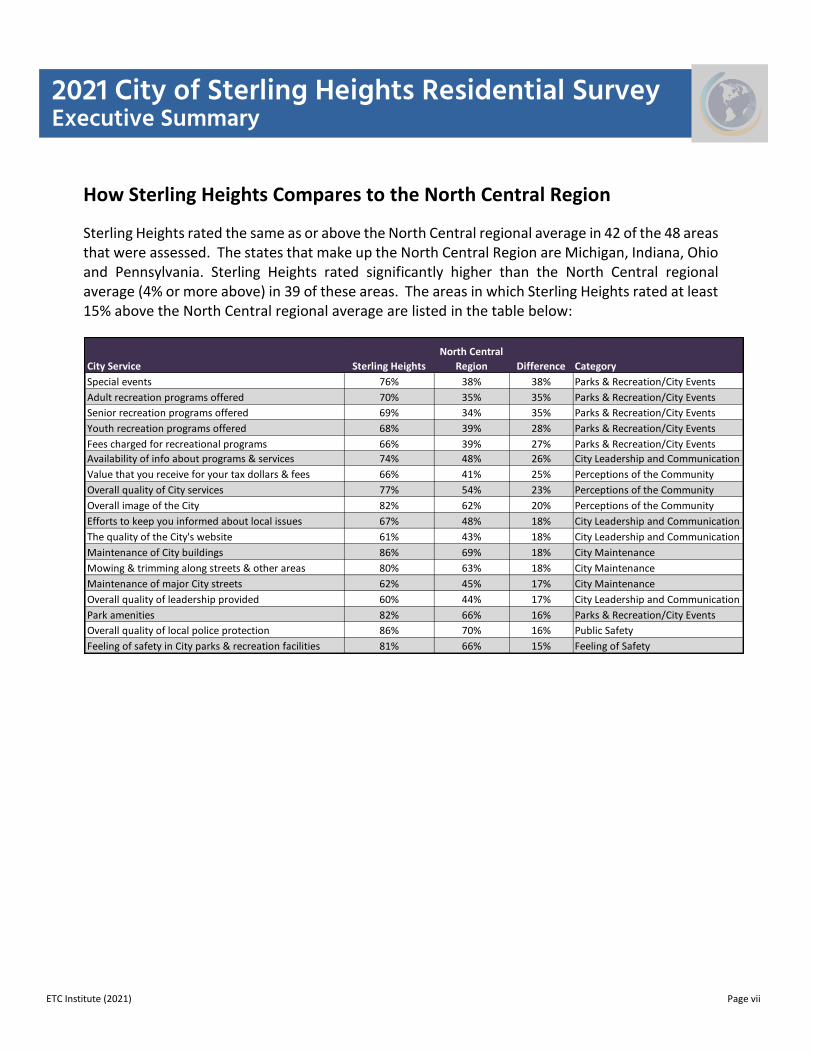
Sterling Heights rated the same as or above the North Central regional average in 42 of the 48 areas that were assessed. The states that make up the North Central Region are Michigan, Indiana, Ohio and Pennsylvania. Sterling Heights rated significantly higher than the North Central regional average (4% or more above) in 39 of these areas. The areas in which Sterling Heights rated at least 15% above the North Central regional average are listed in the table below:
City Service Sterling Heights
North Central
Region Difference Category
Special events 76% 38% 38% Parks & Recreation/City Events
Adult recreation programs offered 70% 35% 35% Parks & Recreation/City Events
Senior recreation programs offered 69% 34% 35% Parks & Recreation/City Events
Youth recreation programs offered 68% 39% 28% Parks & Recreation/City Events
Fees charged for recreational programs 66% 39% 27% Parks & Recreation/City Events
Availability of info about programs & services 74% 48% 26% City Leadership and Communication
Value that you receive for your tax dollars & fees 66% 41% 25% Perceptions of the Community
Overall quality of City services 77% 54% 23% Perceptions of the Community
Overall image of the City 82% 62% 20% Perceptions of the Community
Efforts to keep you informed about local issues 67% 48% 18% City Leadership and Communication
The quality of the City's website 61% 43% 18% City Leadership and Communication
Maintenance of City buildings 86% 69% 18% City Maintenance
Mowing & trimming along streets & other areas 80% 63% 18% City Maintenance
Maintenance of major City streets 62% 45% 17% City Maintenance
Overall quality of leadership provided 60% 44% 17% City Leadership and Communication
Park amenities 82% 66% 16% Parks & Recreation/City Events
Overall quality of local police protection 86% 70% 16% Public Safety
Feeling of safety in City parks & recreation facilities 81% 66% 15% Feeling of Safety
ETC Institute (2021) Page viii
2021 City of Sterling Heights Residential Survey Executive Summary
How Sterling Heights Compares to the National Average
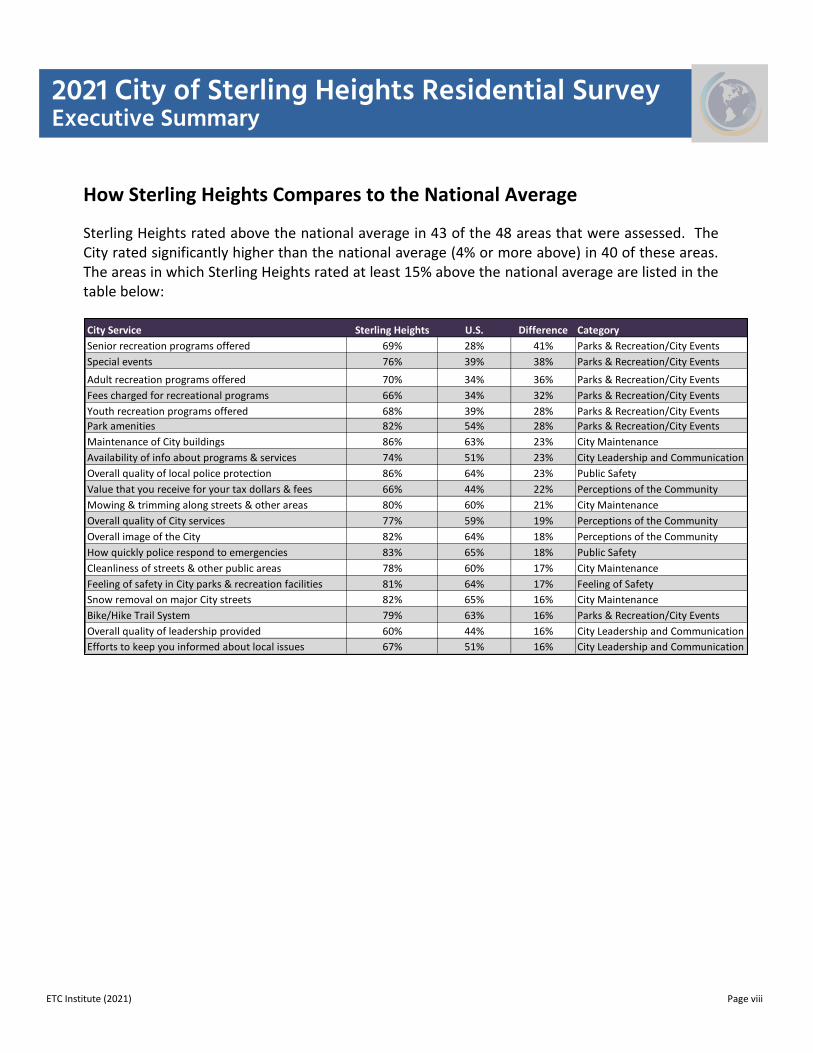
Sterling Heights rated above the national average in 43 of the 48 areas that were assessed. The City rated significantly higher than the national average (4% or more above) in 40 of these areas. The areas in which Sterling Heights rated at least 15% above the national average are listed in the table below:
City Service Sterling Heights U.S. Difference Category
Senior recreation programs offered 69% 28% 41% Parks & Recreation/City Events
Special events 76% 39% 38% Parks & Recreation/City Events
Adult recreation programs offered 70% 34% 36% Parks & Recreation/City Events
Fees charged for recreational programs 66% 34% 32% Parks & Recreation/City Events
Youth recreation programs offered 68% 39% 28% Parks & Recreation/City Events
Park amenities 82% 54% 28% Parks & Recreation/City Events
Maintenance of City buildings 86% 63% 23% City Maintenance
Availability of info about programs & services 74% 51% 23% City Leadership and Communication
Overall quality of local police protection 86% 64% 23% Public Safety
Value that you receive for your tax dollars & fees 66% 44% 22% Perceptions of the Community
Mowing & trimming along streets & other areas 80% 60% 21% City Maintenance
Overall quality of City services 77% 59% 19% Perceptions of the Community
Overall image of the City 82% 64% 18% Perceptions of the Community
How quickly police respond to emergencies 83% 65% 18% Public Safety
Cleanliness of streets & other public areas 78% 60% 17% City Maintenance
Feeling of safety in City parks & recreation facilities 81% 64% 17% Feeling of Safety
Snow removal on major City streets 82% 65% 16% City Maintenance
Bike/Hike Trail System 79% 63% 16% Parks & Recreation/City Events
Overall quality of leadership provided 60% 44% 16% City Leadership and Communication
Efforts to keep you informed about local issues 67% 51% 16% City Leadership and Communication
ETC Institute (2021) Page ix
2021 City of Sterling Heights Residential Survey Executive Summary
Investment Priorities
Recommended Priorities for the Next Two Years. In order to help the City identify investment
priorities for the next two years, ETC Institute conducted an Importance-Satisfaction (I-S) analysis.
This analysis examined the importance that residents placed on each City service and the level of
satisfaction with each service.
By identifying services of high importance and low satisfaction, the analysis identified which
services will have the most impact on overall satisfaction with City services over the next two years.
If the City wants to improve its overall satisfaction rating, it should prioritize investments in services
with the highest Importance Satisfaction (I-S) ratings. Details regarding the methodology for the
analysis are provided in the Section 3 of this report.
• Priorities within Departments/Specific Areas: This analysis was conducted to help departmental managers set priorities for their department. Based on the results of this analysis, the services that are recommended as the top priorities within each department/area over the next two years are listed below:
o Public Safety: visibility of police in neighborhoods and enforcement of local traffic
laws
o Parks and Recreation and City Events: none of the parks and recreation and City
events items were selected as a “high priority” for improvement
o Public Library Services: none of the public library services were selected as a “high
priority” for improvement
o Code Enforcement: enforcing clean-up of litter/debris on residential property and
enforcing mowing of grass and weeds on residential property
o City Maintenance: maintenance of neighborhood streets and flow of traffic and
congestion management
1 Charts and Graphs:
City of Sterling Heights Community Survey: Findings Report
ETC Institute (2021) 1
37%
32%
31%
38%
29%
22%
23%
27%
49%
51%
52%
43%
48%
45%
42%
34%
12%
15%
14%
16%
18%
23%
22%
27%
3%
3%
4%
3%
5%
11%
13%
11%
The City as a place to live
Overall quality of life in the City
Overall image of the City
The City as a place to raise children
Overall quality of City services
Value that you receive for your tax dollars & fees
Overall direction of the City
The City as a place to retire
0% 20% 40% 60% 80% 100%
Very Satisfied (5) Satisfied (4) Neutral (3) Dissatisfied (2/1)
Q1. Satisfaction with Items That Influence Perceptions of the City
by percentage of respondents who rated the item as a 1 to 5 on a 5‐point scale (excluding don't knows)
City of Sterling Heights Community Survey: Findings Report
ETC Institute (2021) 2
86%
82%
84%
81%
78%
70%
71%
62%
86%
83%
82%
82%
77%
66%
65%
62%
The City as a place to live
Overall quality of life in the City
Overall image of the City
The City as a place to raise children
Overall quality of City services
Value that you receive for your tax dollars & fees
Overall direction of the City
The City as a place to retire
0% 20% 40% 60% 80% 100%
2017 2021
TRENDS: Satisfaction with Items That Influence Perceptions of the City
by percentage of respondents who rated the item as a 4 or 5 on a 5‐point scale (excluding don't knows)
City of Sterling Heights Community Survey: Findings Report
ETC Institute (2021) 3
45%
52%
50%
47%
43%
43%
27%
32%
21%
21%
20%
20%
17%
46%
37%
39%
42%
43%
40%
48%
42%
45%
41%
38%
37%
37%
9%
10%
10%
11%
11%
15%
21%
23%
30%
24%
25%
33%
36%
0%
0%
1%
1%
3%
2%
4%
3%
4%
15%
18%
10%
11%
Overall quality of local fire protection
How quickly fire department personnel respond
How quickly emergency medical personnel respond
Overall quality of emergency medical services
Overall quality of local police protection
How quickly police respond to emergencies
The City's efforts to prevent crime
Quality of interaction with police department
Quality of animal control
Visibility of police in neighborhoods
Enforcement of local traffic laws
Visibility of police in public parks
Visibility of police in retail areas
0% 20% 40% 60% 80% 100%
Very Satisfied (5) Satisfied (4) Neutral (3) Dissatisfied (2/1)
by percentage of respondents who rated the item as a 1 to 5 on a 5‐point scale (excluding don't knows)
Q2. Satisfaction with Public SafetyCity of Sterling Heights Community Survey: Findings Report
ETC Institute (2021) 4
90%
90%
87%
86%
88%
84%
73%
72%
65%
61%
66%
56%
91%
90%
90%
89%
86%
83%
75%
74%
66%
62%
58%
54%
Overall quality of local fire protection
How quickly fire department personnel respond
How quickly emergency medical personnel respond
Overall quality of emergency medical services
Overall quality of local police protection
How quickly police respond to emergencies
The City's efforts to prevent crime
Quality of interaction with police department
Quality of animal control
The visibility of police in neighborhoods
Enforcement of local traffic laws
The visibility of police in retail areas
0% 20% 40% 60% 80% 100%
2017 2021
TRENDS: Satisfaction with Public Safetyby percentage of respondents who rated the item as a 4 or 5 on a 5‐point scale (excluding don't knows)
City of Sterling Heights Community Survey: Findings Report
ETC Institute (2021) 5
38%
35%
28%
26%
17%
14%
13%
13%
12%
12%
12%
8%
8%
Visibility of police in neighborhoods
City's efforts to prevent crime
Overall quality of local police protection
Enforcement of local traffic laws
Visibility of police in retail areas
Overall quality of local fire protection
Overall quality of public interaction with police
Visibility of police in public parks
Overall quality of emergency medical services
How quickly police respond to emergencies
How quickly emergency medical personnel respond
How quickly fire department personnel respond to e
Quality of animal control
0% 10% 20% 30% 40% 50%
Most Emphasis 2nd Most Emphasis 3rd Most Emphasis
Q3. Public Safety Services That Should Receive the Most Emphasis Over the Next Two Years
by percentage of respondents who selected the item as one of their top three choices
City of Sterling Heights Community Survey: Findings Report
ETC Institute (2021) 6
58%
31%
35%
28%
17%
39%
51%
47%
53%
43%
3%
16%
15%
18%
31%
1%
2%
4%
2%
9%
In your neighborhood during the day
In commercial & retail areas during the day
In your neighborhood at night
In City parks & recreation facilities
In commercial & retail areas at night
0% 20% 40% 60% 80% 100%
Very Safe (5) Safe (4) Neutral (3) Unsafe (2/1)
Q4. Feeling of Safety in Various Situationsby percentage of respondents who rated the item as a 1 to 5 on a 5‐point scale (excluding don't knows)
City of Sterling Heights Community Survey: Findings Report
ETC Institute (2021) 7
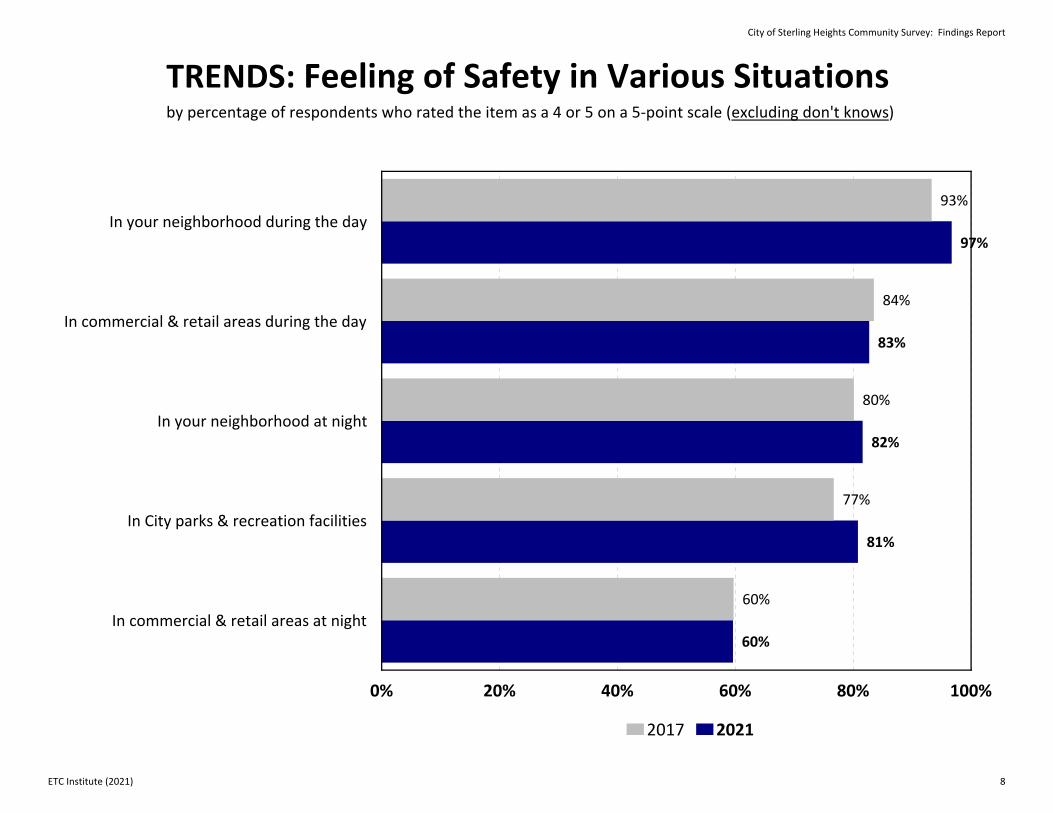
93%
84%
80%
77%
60%
97%
83%
82%
81%
60%
In your neighborhood during the day
In commercial & retail areas during the day
In your neighborhood at night
In City parks & recreation facilities
In commercial & retail areas at night
0% 20% 40% 60% 80% 100%
2017 2021
TRENDS: Feeling of Safety in Various Situationsby percentage of respondents who rated the item as a 4 or 5 on a 5‐point scale (excluding don't knows)
City of Sterling Heights Community Survey: Findings Report
ETC Institute (2021) 8
40%
41%
35%
42%
36%
38%
41%
33%
34%
28%
33%
30%
27%
26%
28%
50%
48%
46%
39%
44%
41%
37%
43%
42%
41%
36%
37%
39%
40%
33%
9%
10%
14%
18%
19%
18%
20%
22%
21%
24%
26%
29%
31%
27%
36%
1%
2%
4%
1%
1%
4%
2%
2%
3%
6%
5%
3%
3%
7%
3%
Maintenance and mowing of City parks
The number of City parks
Park amenities
Music in the Park Concert Series
Nature center services & programs
Bike/Hike Trail System
Sterlingfest Art & Music Fair
Special events
Senior Center
Adult recreation programs offered
Senior recreation programs offered
Youth recreation programs offered
Teen recreation programs offered
Fees charged for recreational programs
Special recreation programs
0% 20% 40% 60% 80% 100%
Very Satisfied (5) Satisfied (4) Neutral (3) Dissatisfied (2/1)
Q5. Satisfaction with Parks and Recreation Servicesand City Events
by percentage of respondents who rated the item as a 1 to 5 on a 5‐point scale (excluding don't knows)
City of Sterling Heights Community Survey: Findings Report
ETC Institute (2021) 9
87%
84%
77%
77%
77%
75%
81%
78%
68%
64%
62%
65%
62%
58%
90%
89%
82%
81%
80%
79%
78%
76%
76%
70%
69%
68%
66%
61%
Maintenance and mowing of City parks
The number of City parks
Park amenities
Music in the Park Concert Series
Nature center services & programs
Bike/Hike Trail System
Sterlingfest Art & Music Fair
Special events
Senior Center
Adult recreational programs offered
Senior recreational programs offered
Youth recreational programs offered
Fees charged for recreational programs
Special recreation programs
0% 20% 40% 60% 80% 100%
2017 2021
TRENDS: Satisfaction with Parks and Recreation Servicesand City Events
by percentage of respondents who rated the item as a 4 or 5 on a 5‐point scale (excluding don't knows)
(“Maintence of City parks” on 2017 survey)
City of Sterling Heights Community Survey: Findings Report
ETC Institute (2021) 10
30%
26%
25%
17%
17%
15%
15%
14%
13%
11%
11%
10%
10%
9%
6%
Park amenities
Bike/hike trail system
Maintenance & mowing of City parks
Sterlingfest Art & Music Fair
Senior Center
Special events
Senior recreation programs offered
Youth recreation programs offered
Adult recreation programs offered
Nature Center services & programs
Music in the Park Concert Series
Teen recreation programs offered
Fees charged for recreational programs
Number of City parks
Special recreation programs
0% 10% 20% 30% 40%
Most Emphasis 2nd Most Emphasis 3rd Most Emphasis
Q6. Parks & Recreation & City Events That Should Receive the Most Emphasis Over the Next Two Years by percentage of respondents who selected the item as one of their top three choices
City of Sterling Heights Community Survey: Findings Report
ETC Institute (2021) 11
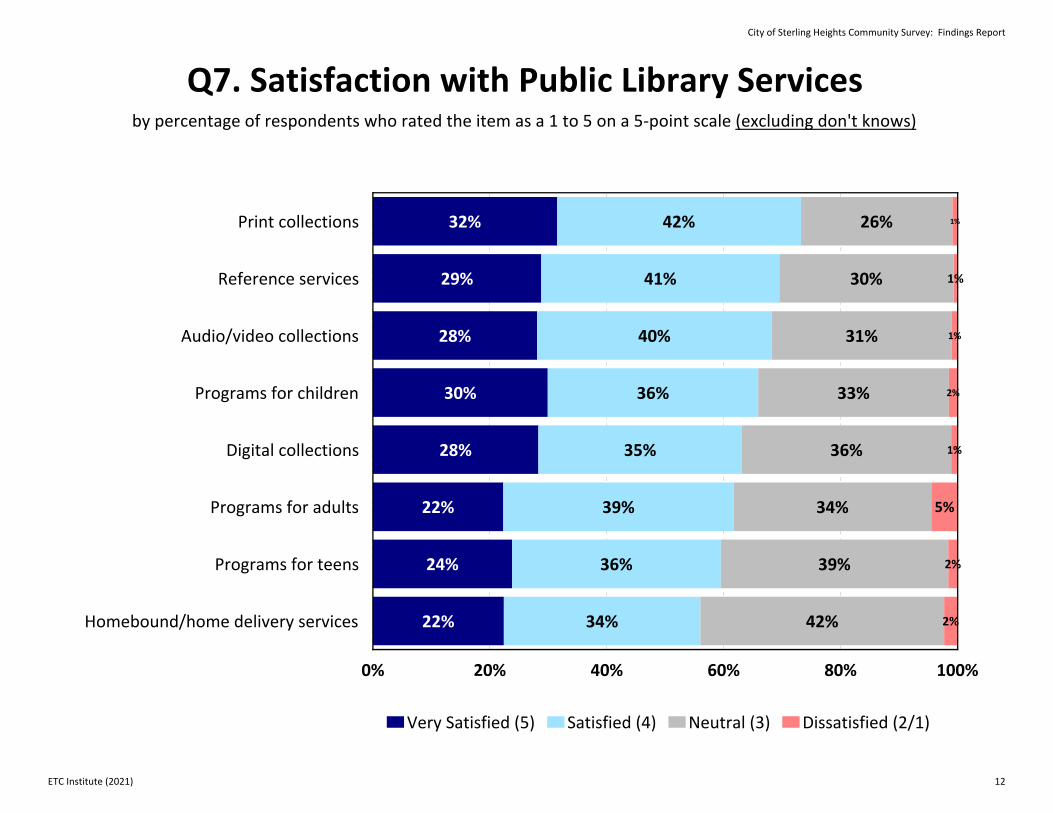
32%
29%
28%
30%
28%
22%
24%
22%
42%
41%
40%
36%
35%
39%
36%
34%
26%
30%
31%
33%
36%
34%
39%
42%
1%
1%
1%
2%
1%
5%
2%
2%
Print collections
Reference services
Audio/video collections
Programs for children
Digital collections
Programs for adults
Programs for teens
Homebound/home delivery services
0% 20% 40% 60% 80% 100%
Very Satisfied (5) Satisfied (4) Neutral (3) Dissatisfied (2/1)
Q7. Satisfaction with Public Library Servicesby percentage of respondents who rated the item as a 1 to 5 on a 5‐point scale (excluding don't knows)
City of Sterling Heights Community Survey: Findings Report
ETC Institute (2021) 12
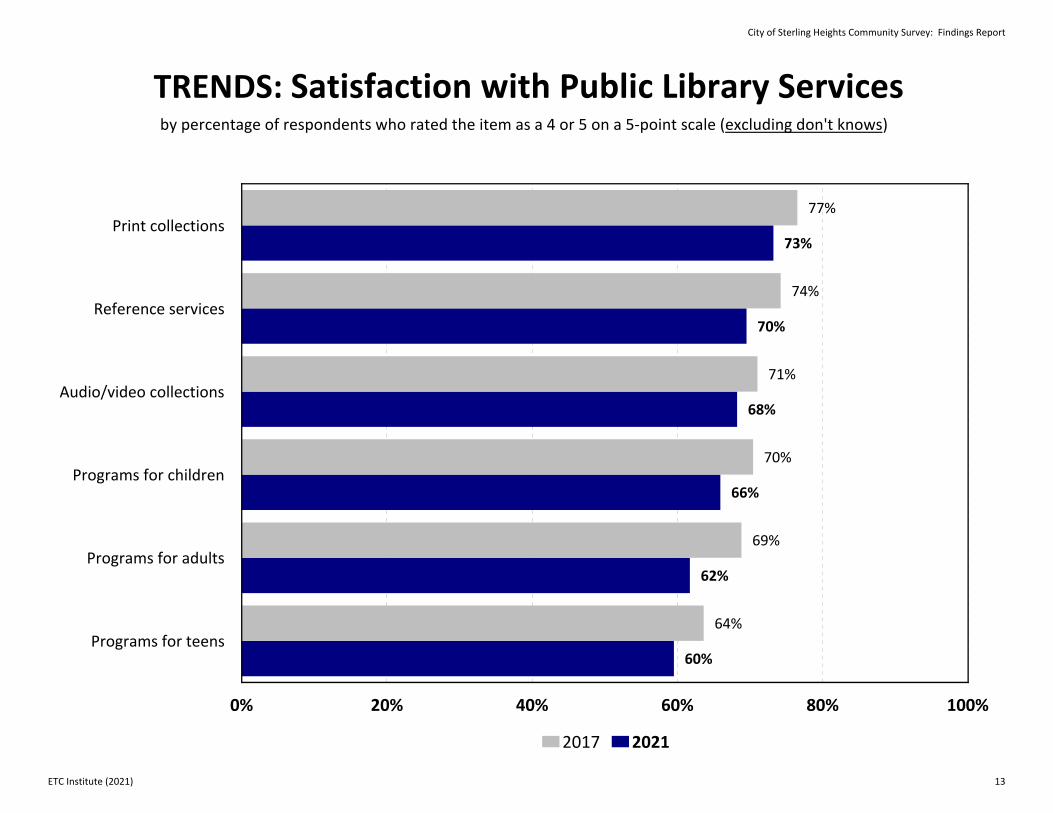
77%
74%
71%
70%
69%
64%
73%
70%
68%
66%
62%
60%
Print collections
Reference services
Audio/video collections
Programs for children
Programs for adults
Programs for teens
0% 20% 40% 60% 80% 100%
2017 2021
TRENDS: Satisfaction with Public Library Servicesby percentage of respondents who rated the item as a 4 or 5 on a 5‐point scale (excluding don't knows)
City of Sterling Heights Community Survey: Findings Report
ETC Institute (2021) 13
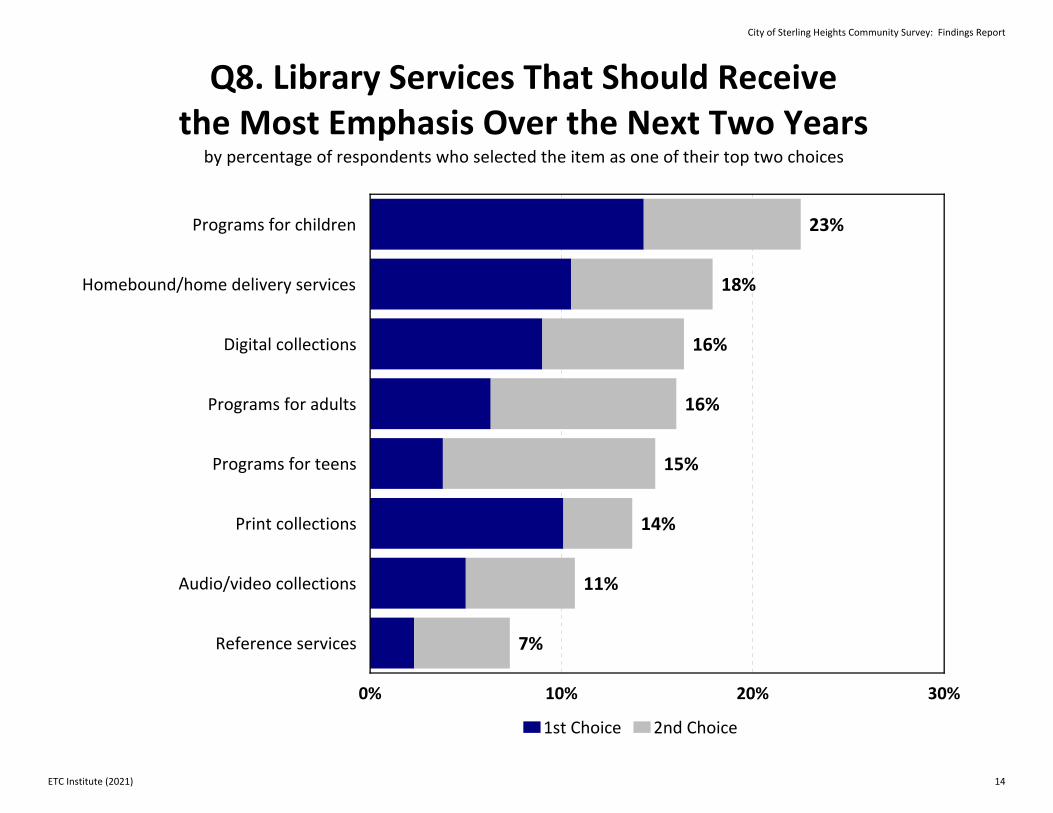
23%
18%
16%
16%
15%
14%
11%
7%
Programs for children
Homebound/home delivery services
Digital collections
Programs for adults
Programs for teens
Print collections
Audio/video collections
Reference services
0% 10% 20% 30%
1st Choice 2nd Choice
Q8. Library Services That Should Receive the Most Emphasis Over the Next Two Years
by percentage of respondents who selected the item as one of their top two choices
City of Sterling Heights Community Survey: Findings Report
ETC Institute (2021) 14
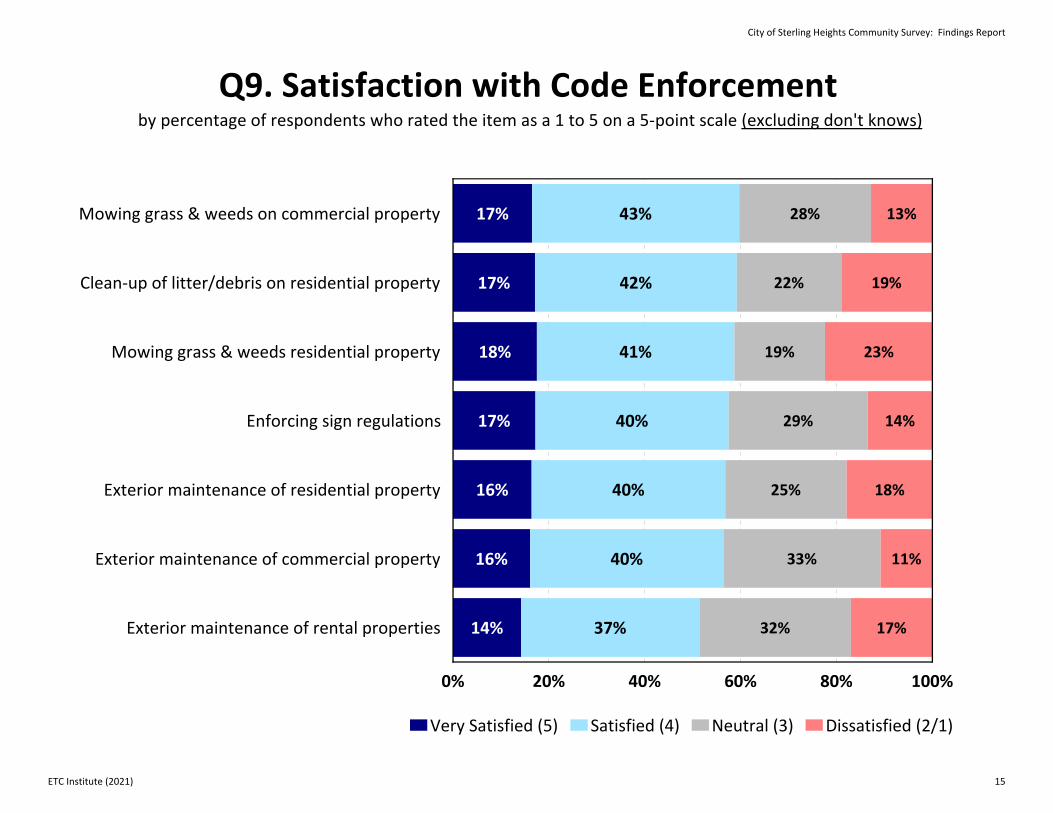
17%
17%
18%
17%
16%
16%
14%
43%
42%
41%
40%
40%
40%
37%
28%
22%
19%
29%
25%
33%
32%
13%
19%
23%
14%
18%
11%
17%
Mowing grass & weeds on commercial property
Clean‐up of litter/debris on residential property
Mowing grass & weeds residential property
Enforcing sign regulations
Exterior maintenance of residential property
Exterior maintenance of commercial property
Exterior maintenance of rental properties
0% 20% 40% 60% 80% 100%
Very Satisfied (5) Satisfied (4) Neutral (3) Dissatisfied (2/1)
by percentage of respondents who rated the item as a 1 to 5 on a 5‐point scale (excluding don't knows)
Q9. Satisfaction with Code Enforcement
City of Sterling Heights Community Survey: Findings Report
ETC Institute (2021) 15
63%
62%
61%
60%
60%
61%
56%
60%
59%
59%
58%
57%
56%
51%
Mowing grass & weeds on commercial property
Clean‐up of litter/debris on residential property
Mowing grass & weeds on residential property
Enforcing sign regulations
Exterior maintenance of residential property
Exterior maintenance of commercial property
Exterior maintenance of rental properties
0% 20% 40% 60% 80% 100%
2017 2021
TRENDS: Satisfaction with Code Enforcementby percentage of respondents who rated the item as a 4 or 5 on a 5‐point scale (excluding don't knows)
City of Sterling Heights Community Survey: Findings Report
ETC Institute (2021) 16
37%
33%
22%
20%
16%
15%
13%
Clean‐up of litter/debris on residential property
Mowing grass & weeds on residential property
Exterior maintenance of residential property
Exterior maintenance of commercial property
Mowing grass & weeds on commercial property
Exterior maintenance of rental properties
Enforcing sign regulations
0% 10% 20% 30% 40%
1st Choice 2nd Choice
Q10. Code Enforcement Services That Should Receive the Most Emphasis Over the Next Two Years
by percentage of respondents who selected the item as one of their top two choices
City of Sterling Heights Community Survey: Findings Report
ETC Institute (2021) 17
33%
25%
23%
23%
22%
18%
18%
14%
14%
12%
12%
11%
53%
56%
58%
58%
56%
48%
46%
49%
44%
45%
41%
38%
13%
12%
16%
16%
18%
23%
19%
19%
27%
27%
23%
26%
1%
6%
4%
4%
5%
11%
18%
19%
15%
16%
25%
26%
Maintenance of City buildings
Snow removal on major City streets
Maintenance of traffic signals/signs
Mowing & trimming along streets & other areas
Cleanliness of streets & other public areas
Adequacy of City street lighting
Snow removal on residential streets
Maintenance of major City streets
Maintenance of stormwater drainage system
Maintenance of curbs & sidewalks
Maintenance of neighborhood streets
Flow of traffic & congestion management
0% 20% 40% 60% 80% 100%
Very Satisfied (5) Satisfied (4) Neutral (3) Dissatisfied (2/1)
by percentage of respondents who rated the item as a 1 to 5 on a 5‐point scale (excluding don't knows)
Q11. Satisfaction with City Maintenance
City of Sterling Heights Community Survey: Findings Report
ETC Institute (2021) 18
87%
78%
80%
84%
79%
62%
52%
53%
63%
61%
51%
50%
86%
82%
81%
80%
78%
66%
63%
62%
58%
57%
53%
49%
Maintenance of City buildings
Snow removal on major City streets
Maintenance of traffic signals/signs
Mowing & trimming along streets & other areas
Cleanliness of streets & other public areas
Adequacy of City street lighting
Snow removal on residential streets
Maintenance of major City streets
Maintenance of stormwater drainage system
Maintenance of curbs & sidewalks
Maintenance of neighborhood streets
Flow of traffic & congestion management
0% 20% 40% 60% 80% 100%
2017 2021
TRENDS: Satisfaction with City Maintenanceby percentage of respondents who rated the item as a 4 or 5 on a 5‐point scale (excluding don't knows)
City of Sterling Heights Community Survey: Findings Report
ETC Institute (2021) 19
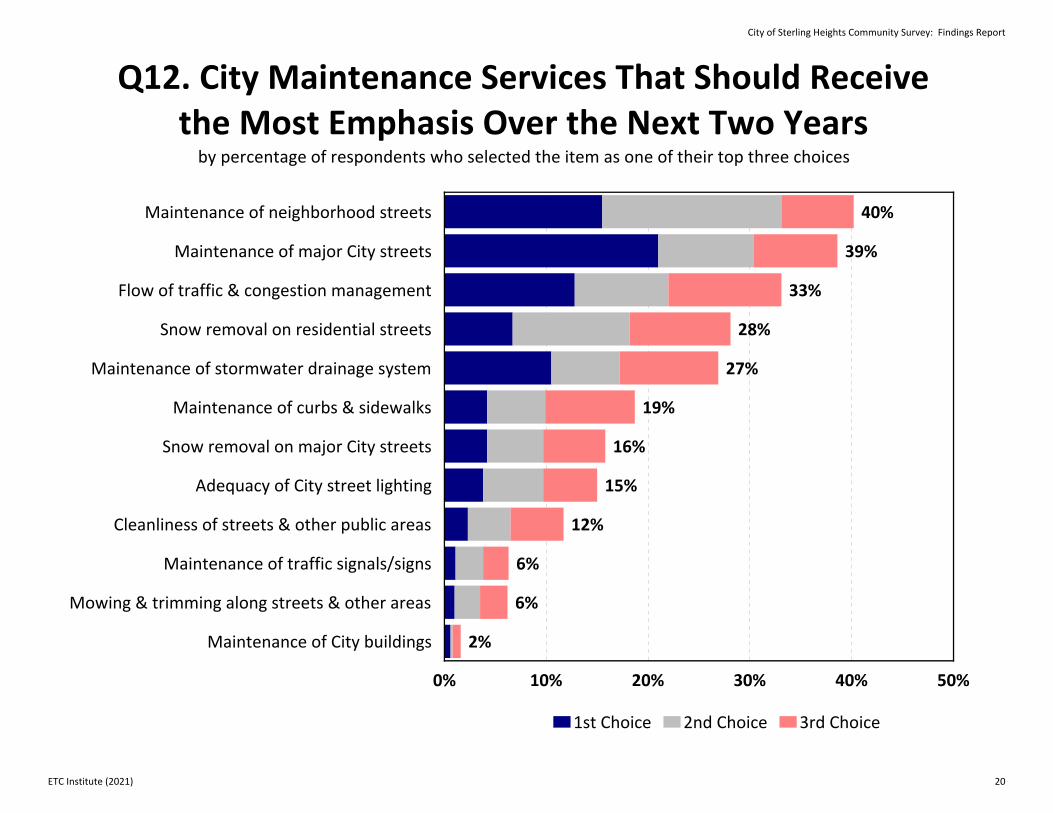
40%
39%
33%
28%
27%
19%
16%
15%
12%
6%
6%
2%
Maintenance of neighborhood streets
Maintenance of major City streets
Flow of traffic & congestion management
Snow removal on residential streets
Maintenance of stormwater drainage system
Maintenance of curbs & sidewalks
Snow removal on major City streets
Adequacy of City street lighting
Cleanliness of streets & other public areas
Maintenance of traffic signals/signs
Mowing & trimming along streets & other areas
Maintenance of City buildings
0% 10% 20% 30% 40% 50%
1st Choice 2nd Choice 3rd Choice
Q12. City Maintenance Services That Should Receive the Most Emphasis Over the Next Two Years
by percentage of respondents who selected the item as one of their top three choices
City of Sterling Heights Community Survey: Findings Report
ETC Institute (2021) 20
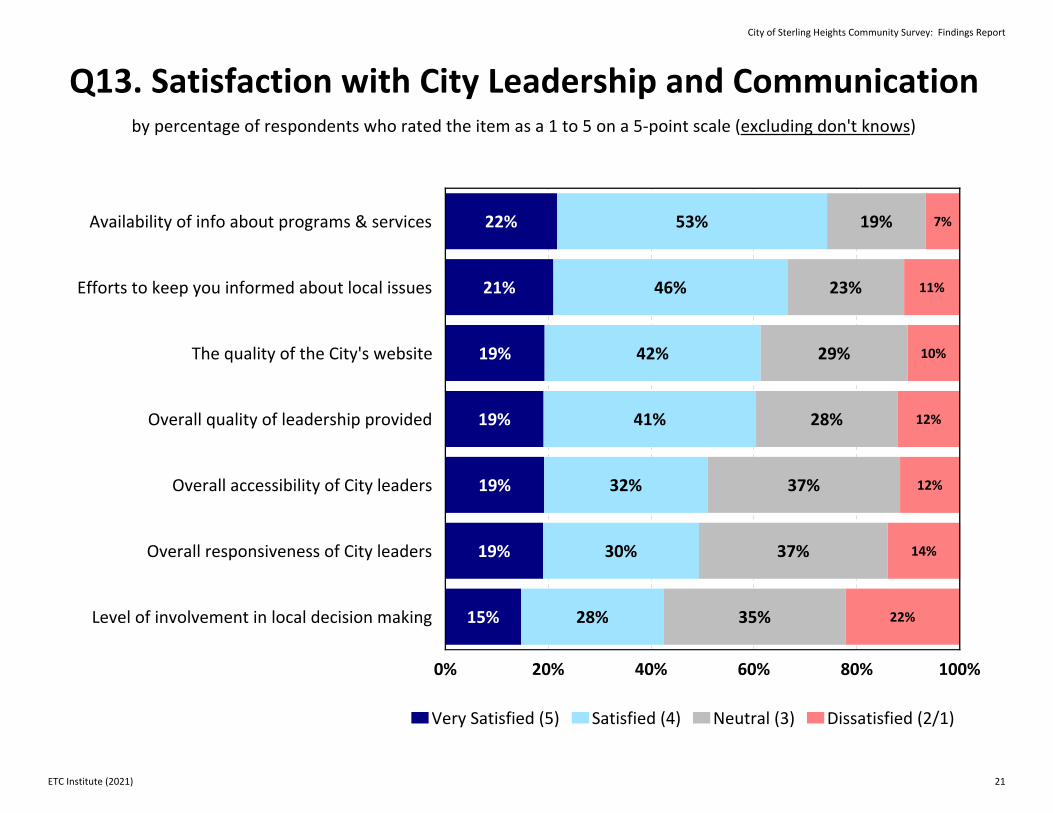
22%
21%
19%
19%
19%
19%
15%
53%
46%
42%
41%
32%
30%
28%
19%
23%
29%
28%
37%
37%
35%
7%
11%
10%
12%
12%
14%
22%
Availability of info about programs & services
Efforts to keep you informed about local issues
The quality of the City's website
Overall quality of leadership provided
Overall accessibility of City leaders
Overall responsiveness of City leaders
Level of involvement in local decision making
0% 20% 40% 60% 80% 100%
Very Satisfied (5) Satisfied (4) Neutral (3) Dissatisfied (2/1)
Q13. Satisfaction with City Leadership and Communicationby percentage of respondents who rated the item as a 1 to 5 on a 5‐point scale (excluding don't knows)
City of Sterling Heights Community Survey: Findings Report
ETC Institute (2021) 21
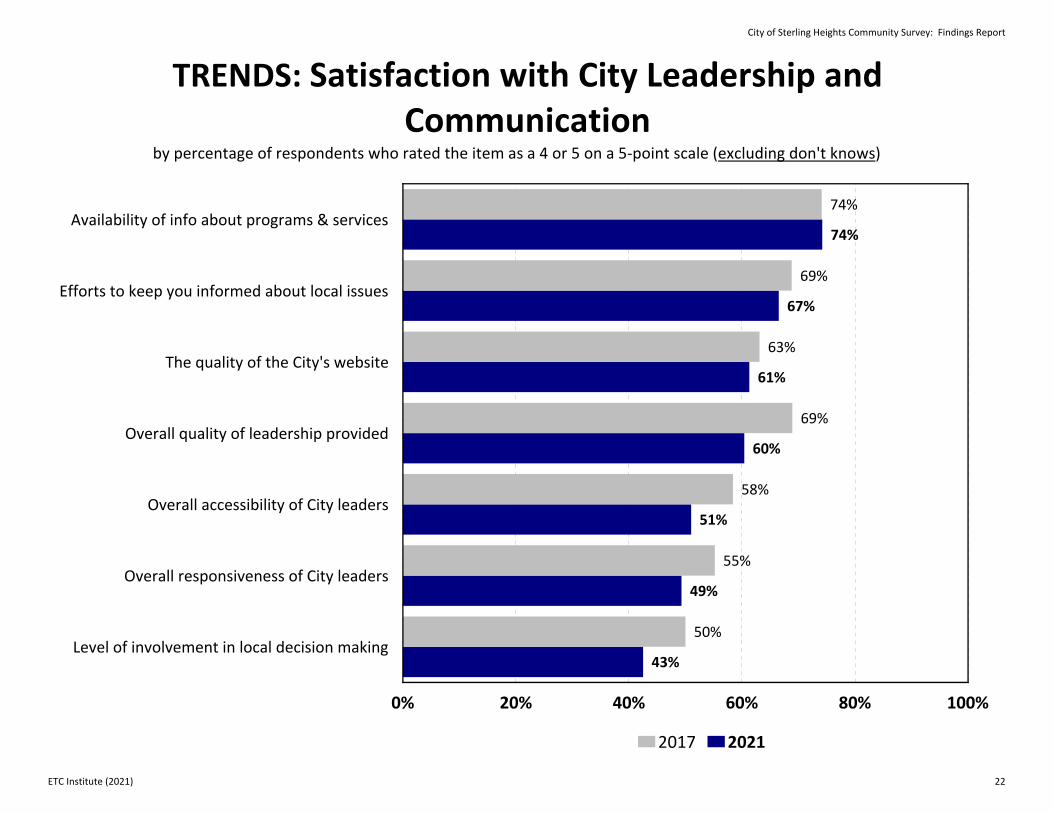
74%
69%
63%
69%
58%
55%
50%
74%
67%
61%
60%
51%
49%
43%
Availability of info about programs & services
Efforts to keep you informed about local issues
The quality of the City's website
Overall quality of leadership provided
Overall accessibility of City leaders
Overall responsiveness of City leaders
Level of involvement in local decision making
0% 20% 40% 60% 80% 100%
2017 2021
TRENDS: Satisfaction with City Leadership and Communication
by percentage of respondents who rated the item as a 4 or 5 on a 5‐point scale (excluding don't knows)
City of Sterling Heights Community Survey: Findings Report
ETC Institute (2021) 22
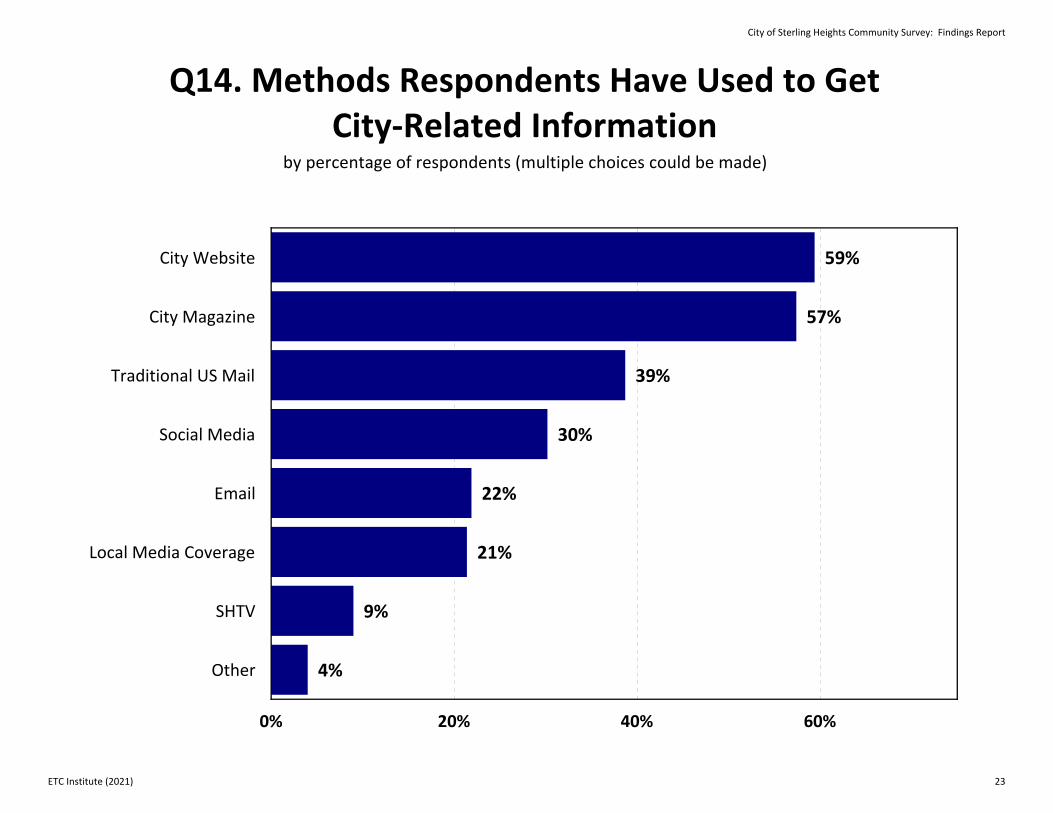
59%
57%
39%
30%
22%
21%
9%
4%
City Website
City Magazine
Traditional US Mail
Social Media
Local Media Coverage
SHTV
Other
0% 20% 40% 60%
Q14. Methods Respondents Have Used to Get City‐Related Information
by percentage of respondents (multiple choices could be made)
City of Sterling Heights Community Survey: Findings Report
ETC Institute (2021) 23
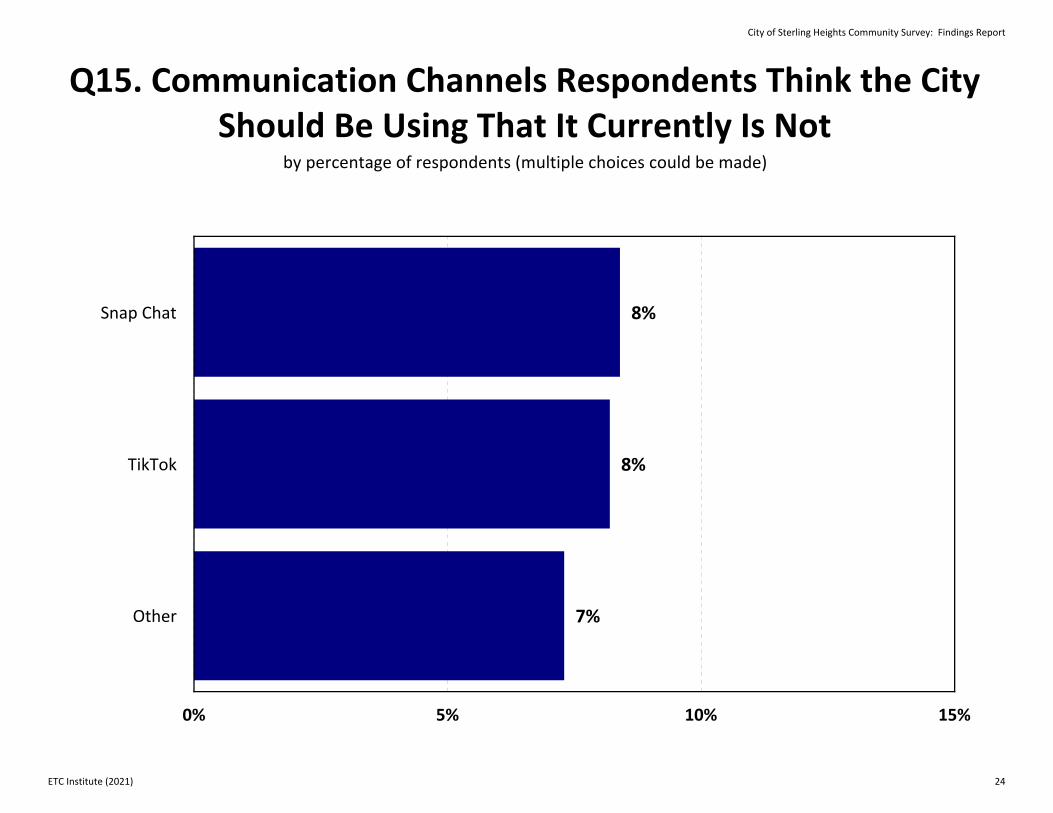
8%
8%
7%
Snap Chat
TikTok
Other
0% 5% 10% 15%
Q15. Communication Channels Respondents Think the City Should Be Using That It Currently Is Not
by percentage of respondents (multiple choices could be made)
City of Sterling Heights Community Survey: Findings Report
ETC Institute (2021) 24
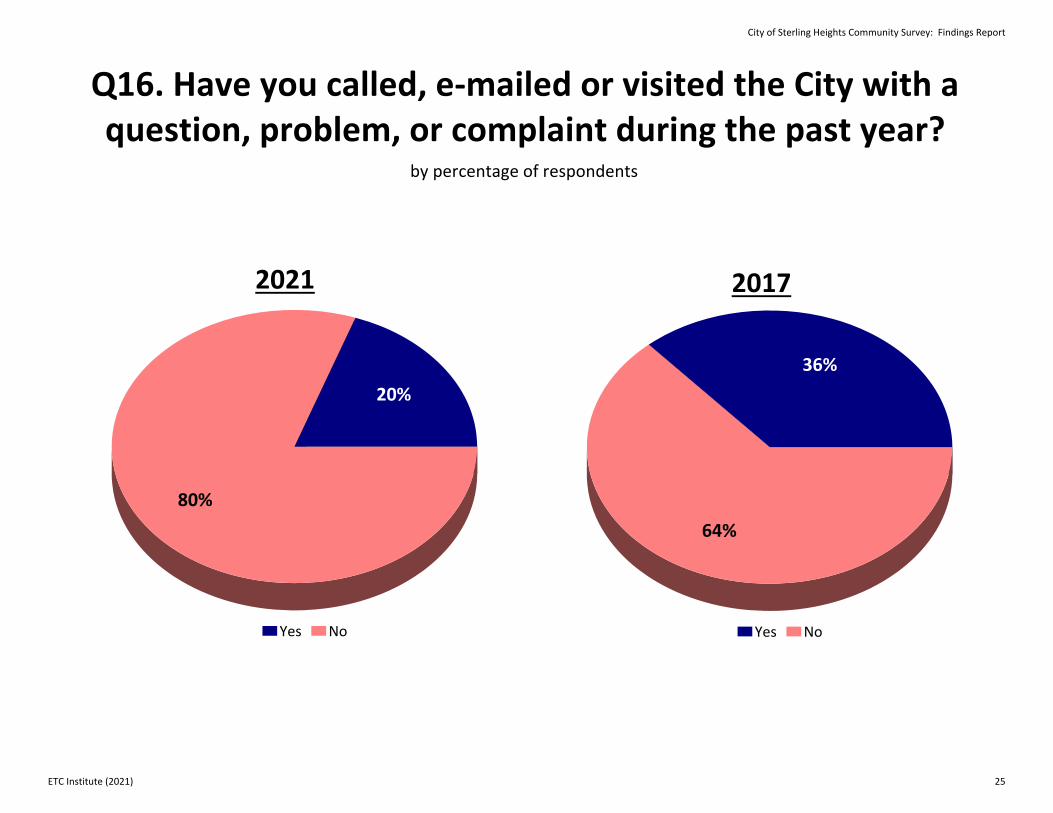
Q16. Have you called, e‐mailed or visited the City with a question, problem, or complaint during the past year?
by percentage of respondents
20%
80%
Yes No
36%
64%
Yes No
2021 2017
City of Sterling Heights Community Survey: Findings Report
ETC Institute (2021) 25
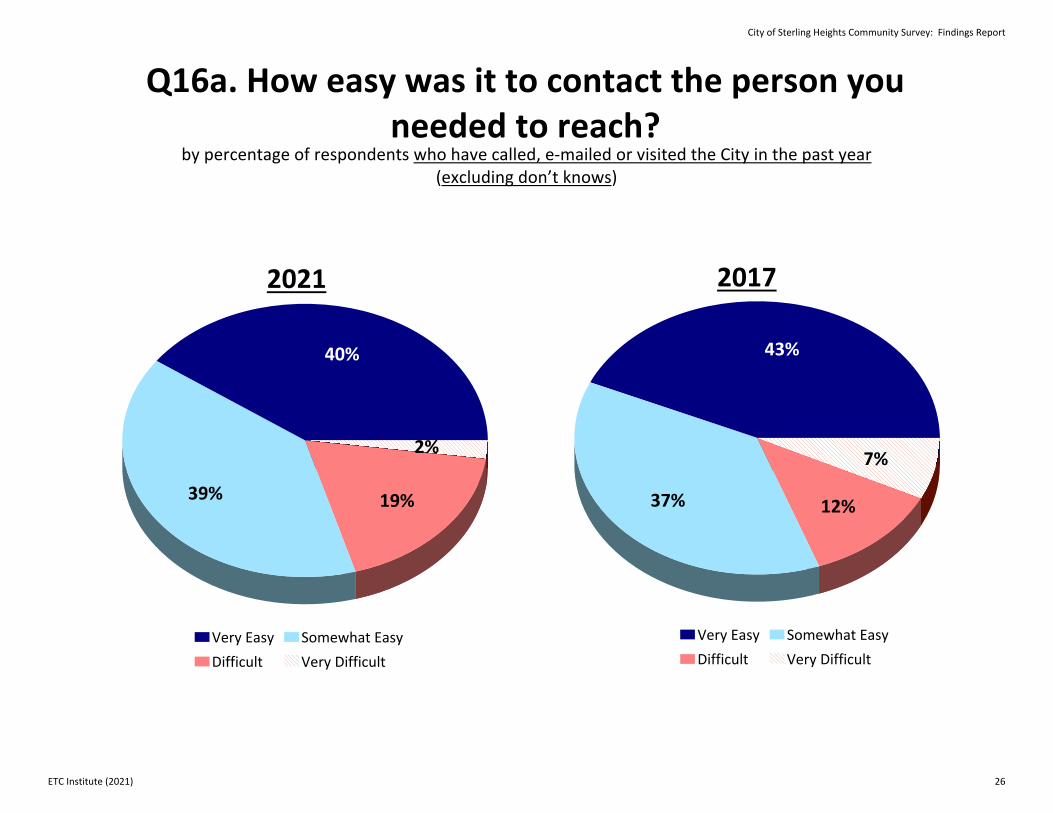
Q16a. How easy was it to contact the person you needed to reach?
by percentage of respondents who have called, e‐mailed or visited the City in the past year(excluding don’t knows)
40%
39% 19%
2%
Very Easy Somewhat EasyDifficult Very Difficult
43%
37% 12%
7%
Very Easy Somewhat EasyDifficult Very Difficult
20172021
City of Sterling Heights Community Survey: Findings Report
ETC Institute (2021) 26
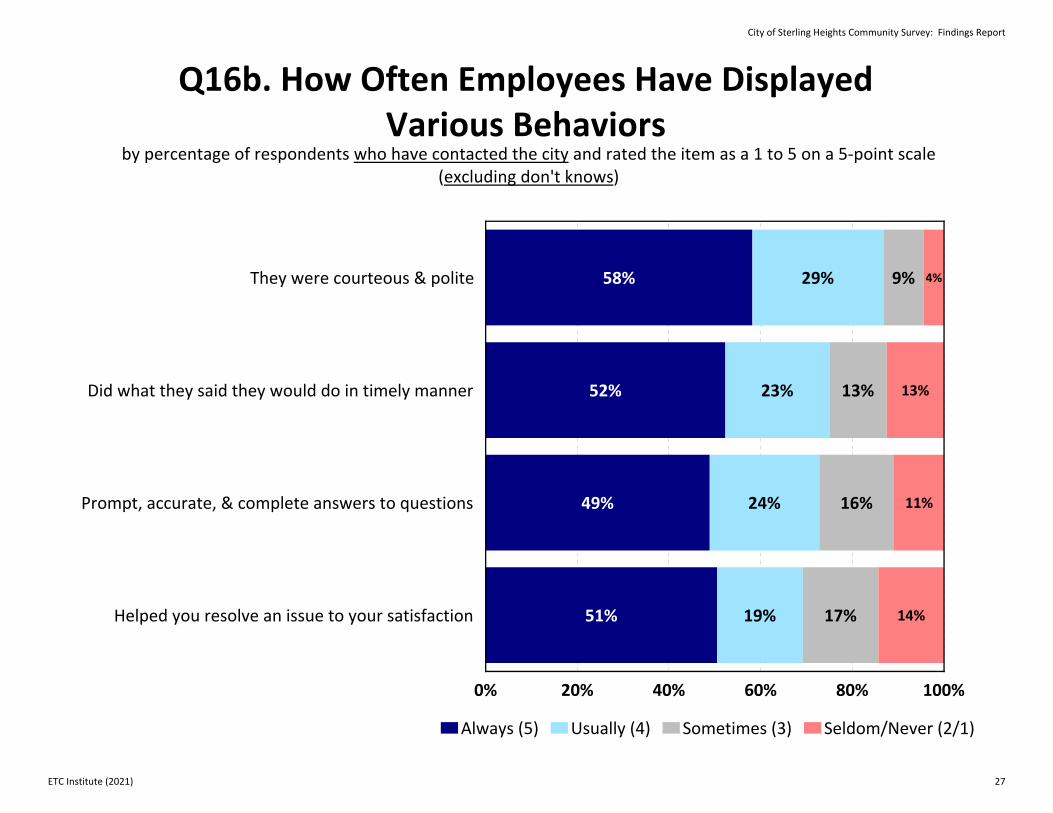
58%
52%
49%
51%
29%
23%
24%
19%
9%
13%
16%
17%
4%
13%
11%
14%
They were courteous & polite
Did what they said they would do in timely manner
Prompt, accurate, & complete answers to questions
Helped you resolve an issue to your satisfaction
0% 20% 40% 60% 80% 100%
Always (5) Usually (4) Sometimes (3) Seldom/Never (2/1)
by percentage of respondents who have contacted the city and rated the item as a 1 to 5 on a 5‐point scale (excluding don't knows)
Q16b. How Often Employees Have Displayed Various Behaviors
City of Sterling Heights Community Survey: Findings Report
ETC Institute (2021) 27
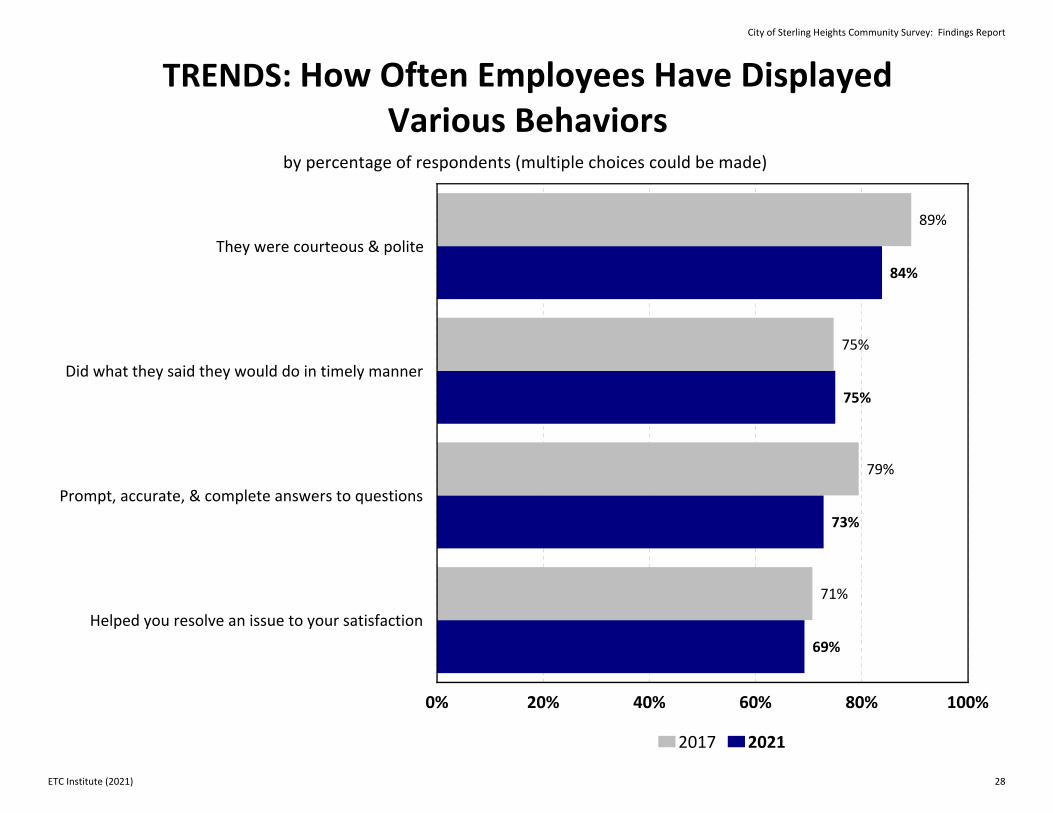
89%
75%
79%
71%
84%
75%
73%
69%
They were courteous & polite
Did what they said they would do in timely manner
Prompt, accurate, & complete answers to questions
Helped you resolve an issue to your satisfaction
0% 20% 40% 60% 80% 100%
2017 2021
TRENDS: How Often Employees Have Displayed Various Behaviors
by percentage of respondents (multiple choices could be made)
City of Sterling Heights Community Survey: Findings Report
ETC Institute (2021) 28
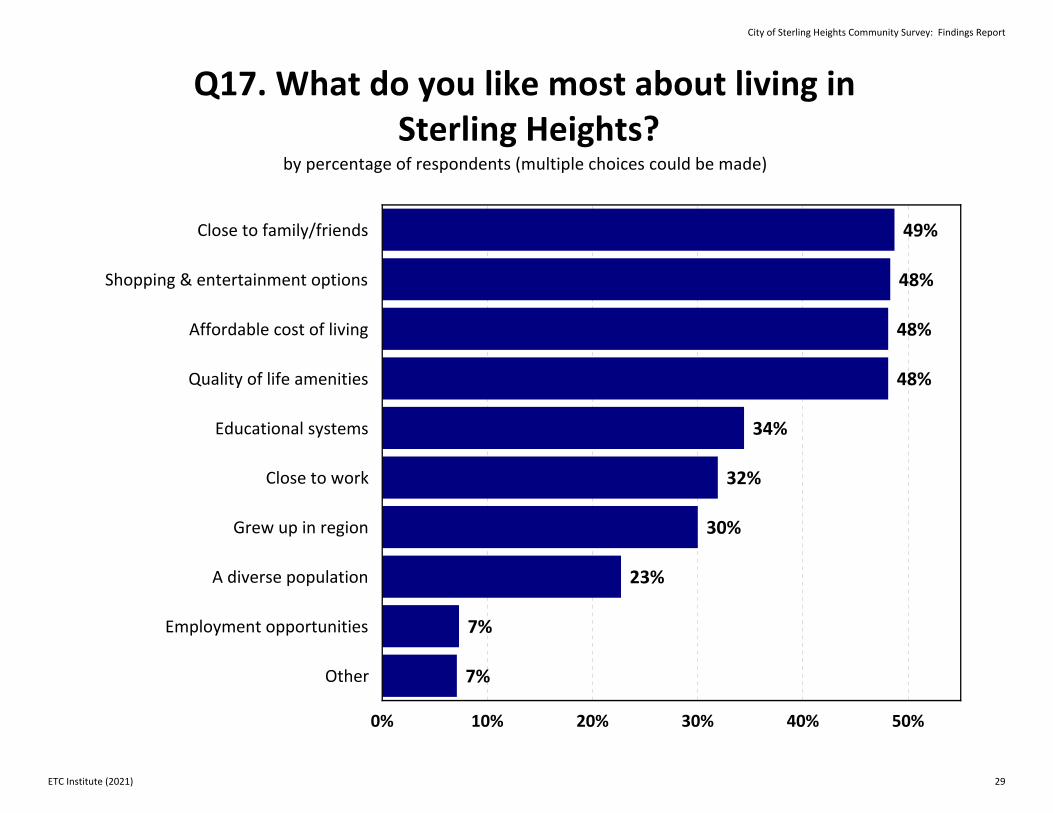
49%
48%
48%
48%
34%
32%
30%
23%
7%
7%
Close to family/friends
Shopping & entertainment options
Affordable cost of living
Quality of life amenities
Educational systems
Close to work
Grew up in region
A diverse population
Employment opportunities
Other
0% 10% 20% 30% 40% 50%
Q17. What do you like most about living in Sterling Heights?
by percentage of respondents (multiple choices could be made)
City of Sterling Heights Community Survey: Findings Report
ETC Institute (2021) 29
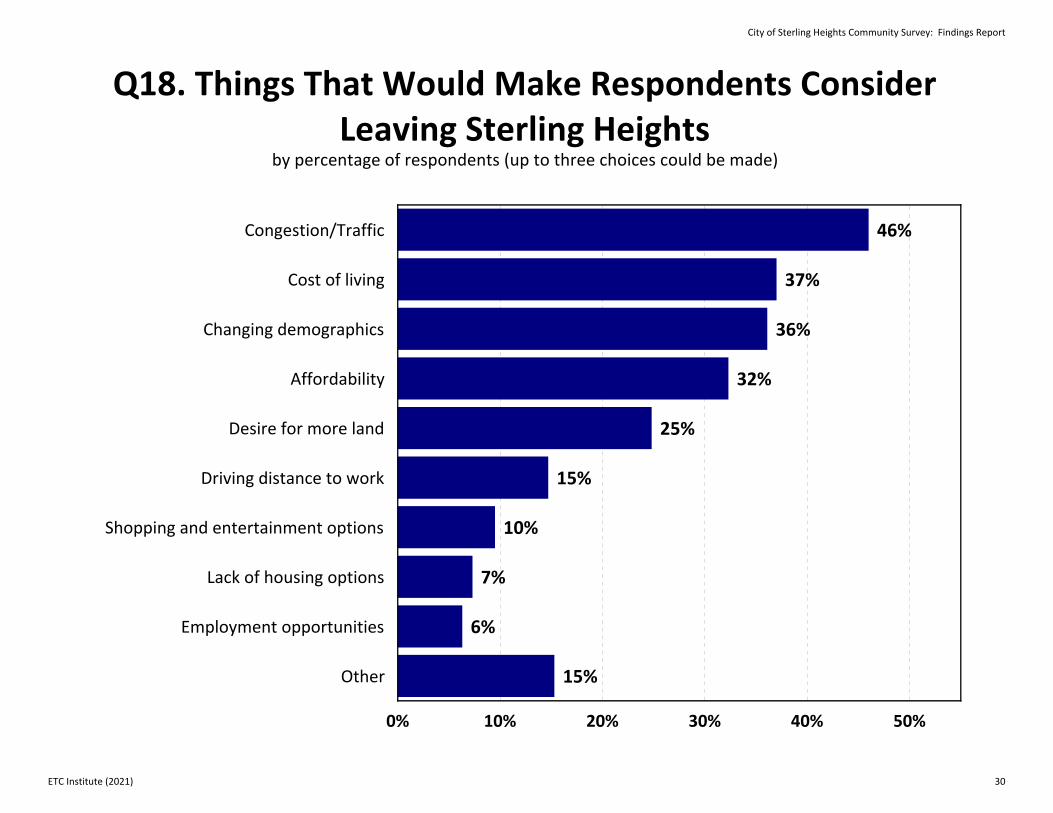
46%
37%
36%
32%
25%
15%
10%
7%
6%
15%
Congestion/Traffic
Cost of living
Changing demographics
Affordability
Desire for more land
Driving distance to work
Shopping and entertainment options
Lack of housing options
Employment opportunities
Other
0% 10% 20% 30% 40% 50%
Q18. Things That Would Make Respondents Consider Leaving Sterling Heights
by percentage of respondents (up to three choices could be made)
City of Sterling Heights Community Survey: Findings Report
ETC Institute (2021) 30
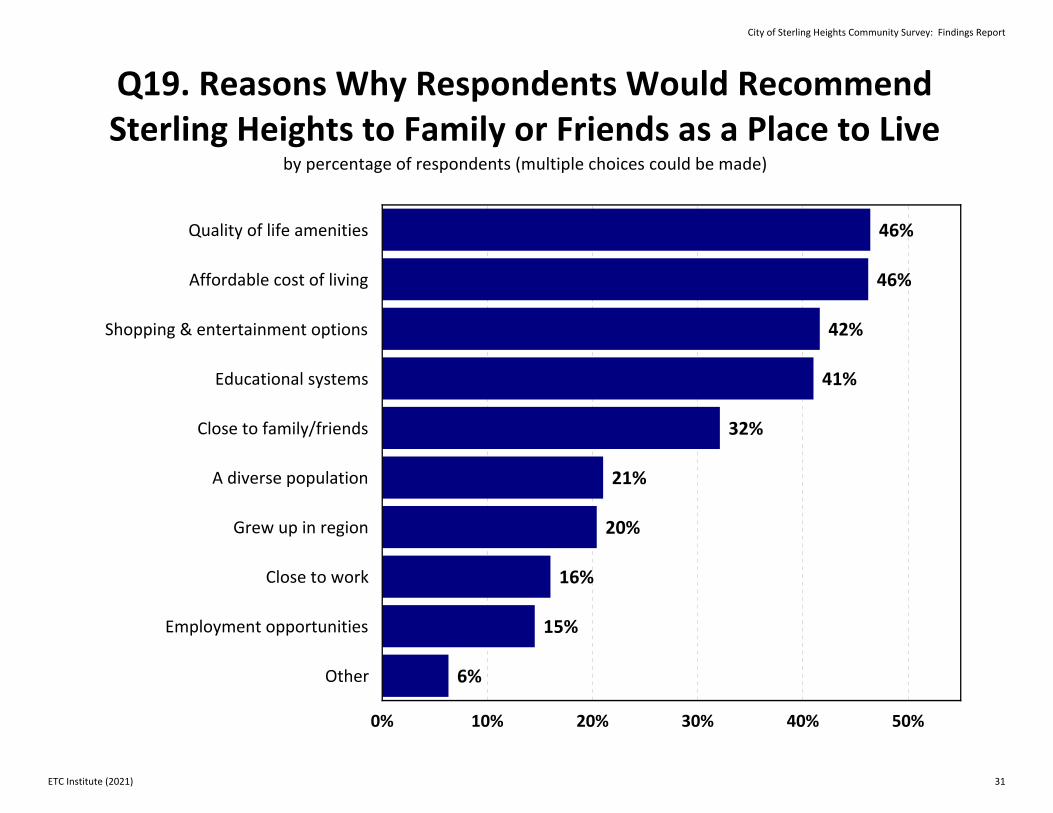
46%
46%
42%
41%
32%
21%
20%
16%
15%
6%
Quality of life amenities
Affordable cost of living
Shopping & entertainment options
Educational systems
Close to family/friends
A diverse population
Grew up in region
Close to work
Employment opportunities
Other
0% 10% 20% 30% 40% 50%
Q19. Reasons Why Respondents Would Recommend Sterling Heights to Family or Friends as a Place to Live
by percentage of respondents (multiple choices could be made)
City of Sterling Heights Community Survey: Findings Report
ETC Institute (2021) 31
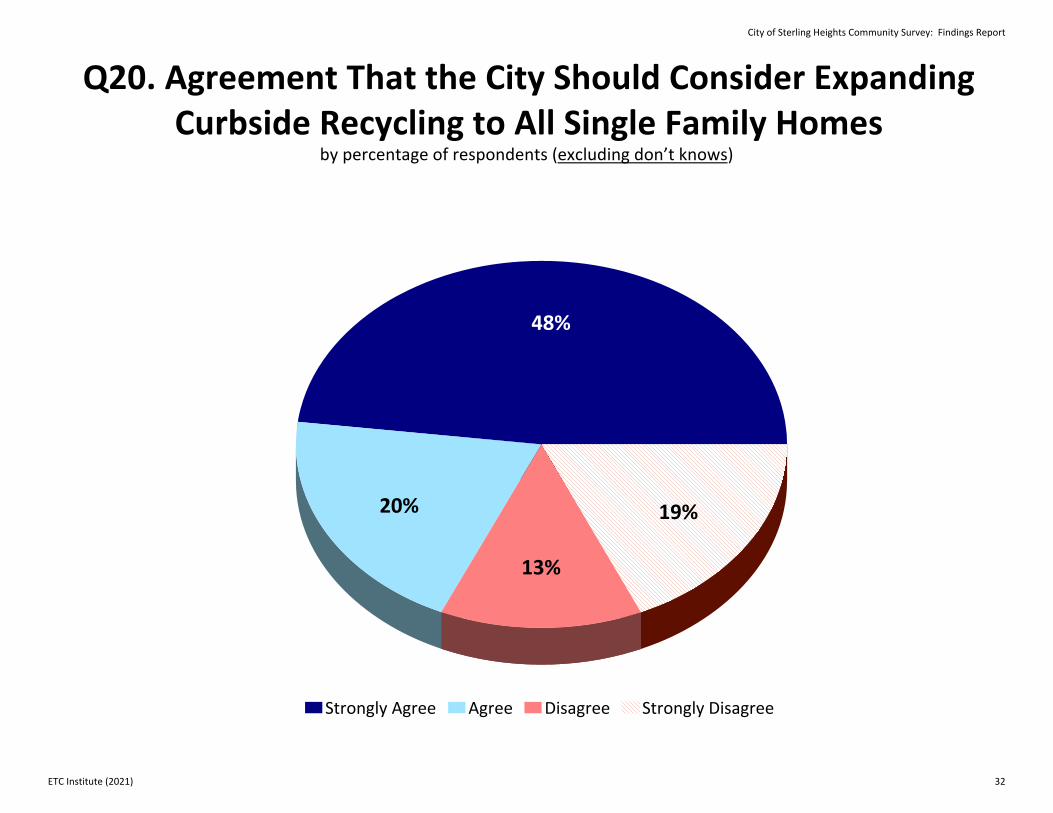
Q20. Agreement That the City Should Consider Expanding Curbside Recycling to All Single Family Homes
48%
20%
13%
19%
Strongly Agree Agree Disagree Strongly Disagree
by percentage of respondents (excluding don’t knows)
City of Sterling Heights Community Survey: Findings Report
ETC Institute (2021) 32
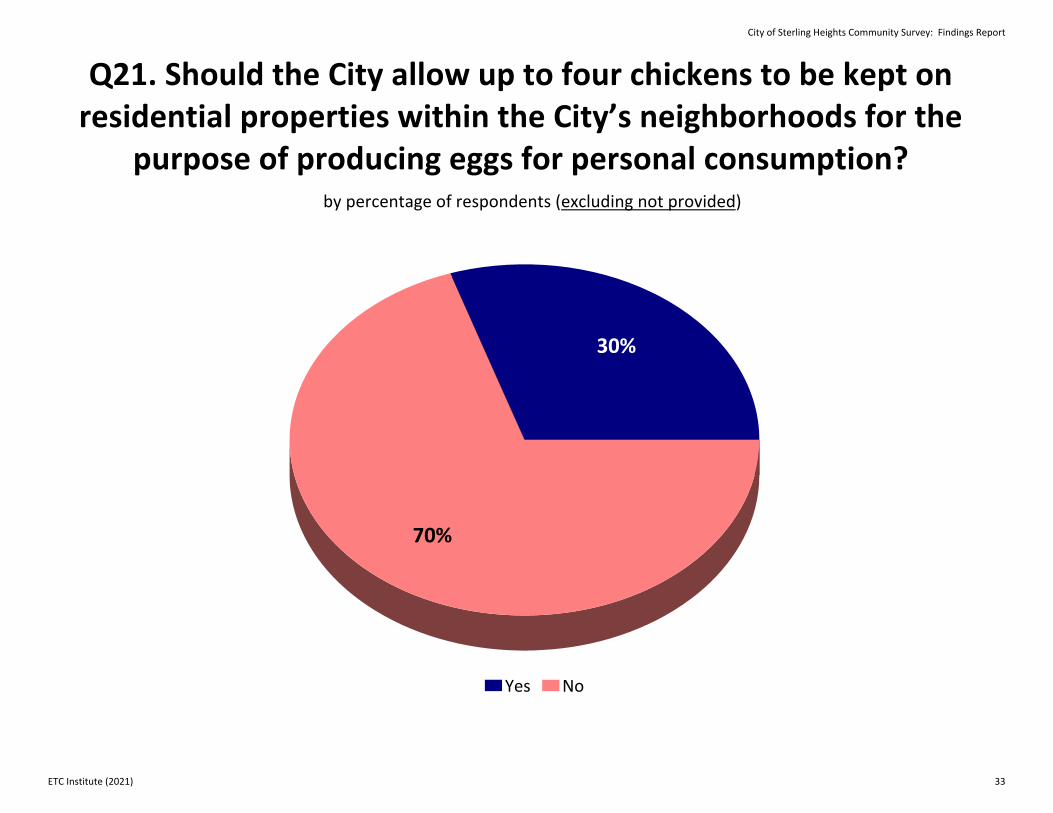
Q21. Should the City allow up to four chickens to be kept on residential properties within the City’s neighborhoods for the
purpose of producing eggs for personal consumption?
30%
70%
Yes No
by percentage of respondents (excluding not provided)
City of Sterling Heights Community Survey: Findings Report
ETC Institute (2021) 33
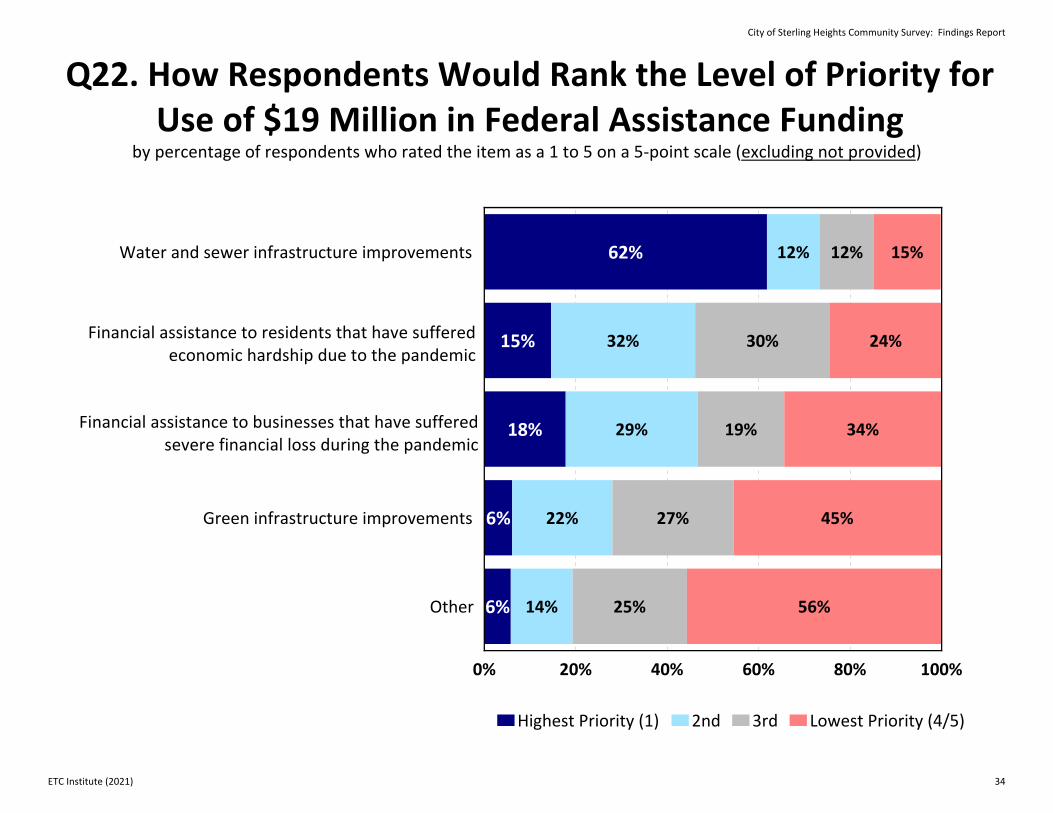
62%
15%
18%
6%
6%
12%
32%
29%
22%
14%
12%
30%
19%
27%
25%
15%
24%
34%
45%
56%
Water and sewer infrastructure improvements
Green infrastructure improvements
Other
0% 20% 40% 60% 80% 100%
Highest Priority (1) 2nd 3rd Lowest Priority (4/5)
Q22. How Respondents Would Rank the Level of Priority for Use of $19 Million in Federal Assistance Funding
by percentage of respondents who rated the item as a 1 to 5 on a 5‐point scale (excluding not provided)
Financial assistance to businesses that have suffered severe financial loss during the pandemic
Financial assistance to residents that have sufferedeconomic hardship due to the pandemic
City of Sterling Heights Community Survey: Findings Report
ETC Institute (2021) 34
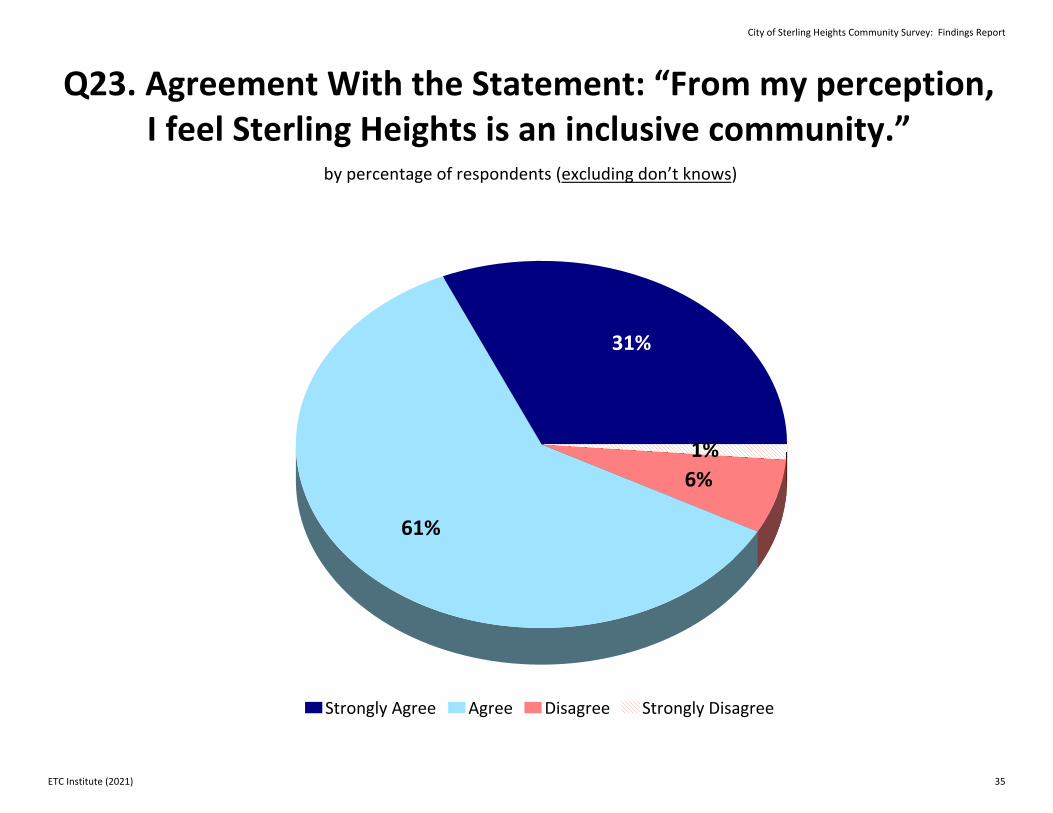
Q23. Agreement With the Statement: “From my perception, I feel Sterling Heights is an inclusive community.”
31%
61%
6%1%
Strongly Agree Agree Disagree Strongly Disagree
by percentage of respondents (excluding don’t knows)
City of Sterling Heights Community Survey: Findings Report
ETC Institute (2021) 35
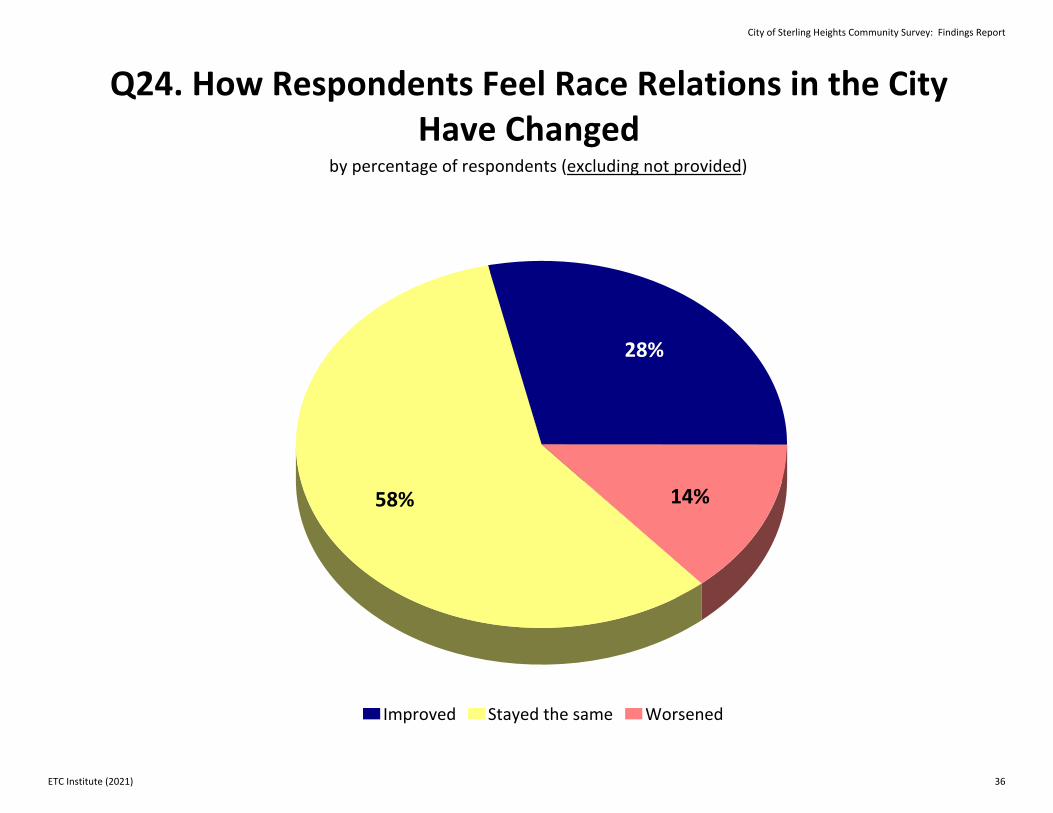
Q24. How Respondents Feel Race Relations in the City Have Changed
28%
58% 14%
Improved Stayed the same Worsened
by percentage of respondents (excluding not provided)
City of Sterling Heights Community Survey: Findings Report
ETC Institute (2021) 36
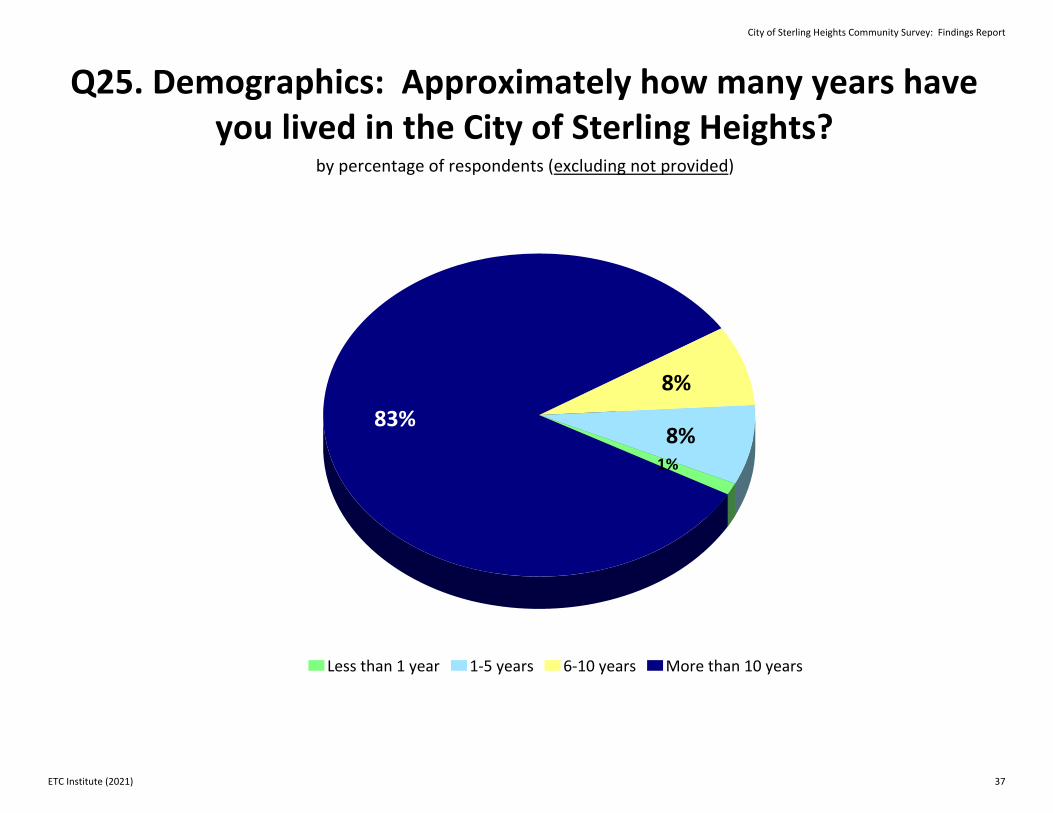
Q25. Demographics: Approximately how many years have you lived in the City of Sterling Heights?
by percentage of respondents (excluding not provided)
1%8%
8%83%
Less than 1 year 1‐5 years 6‐10 years More than 10 years
City of Sterling Heights Community Survey: Findings Report
ETC Institute (2021) 37
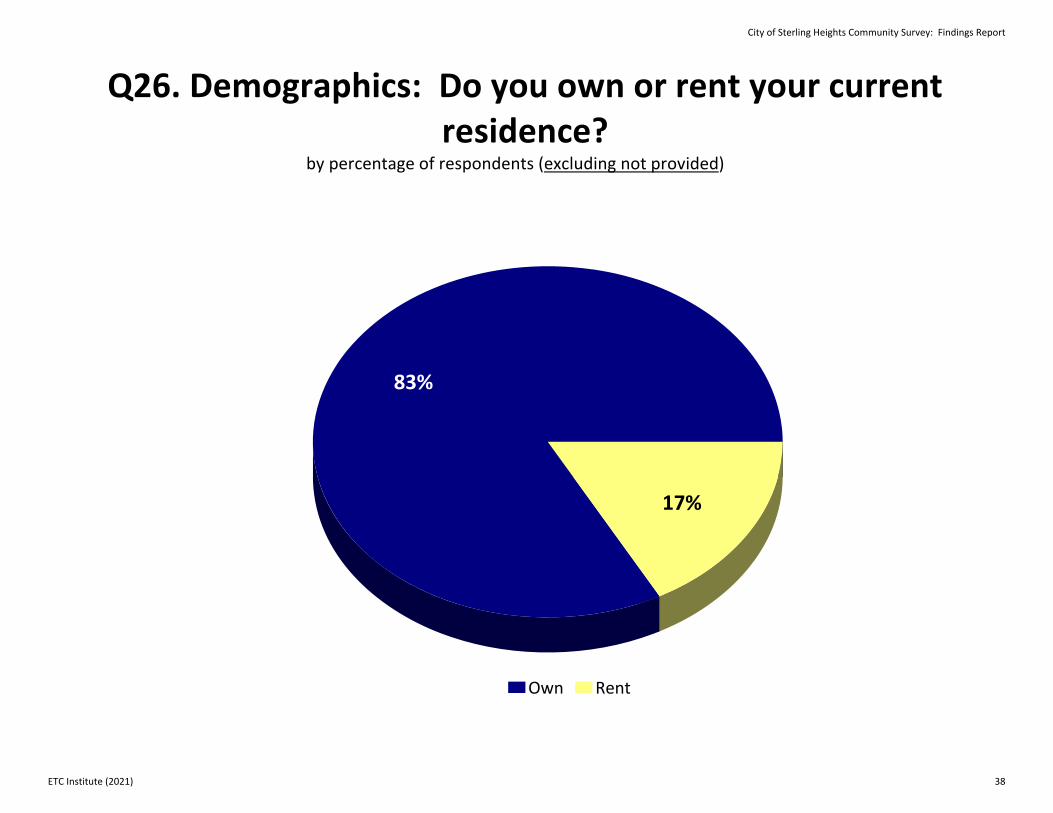
Q26. Demographics: Do you own or rent your current residence?
by percentage of respondents (excluding not provided)
83%
17%
Own Rent
City of Sterling Heights Community Survey: Findings Report
ETC Institute (2021) 38
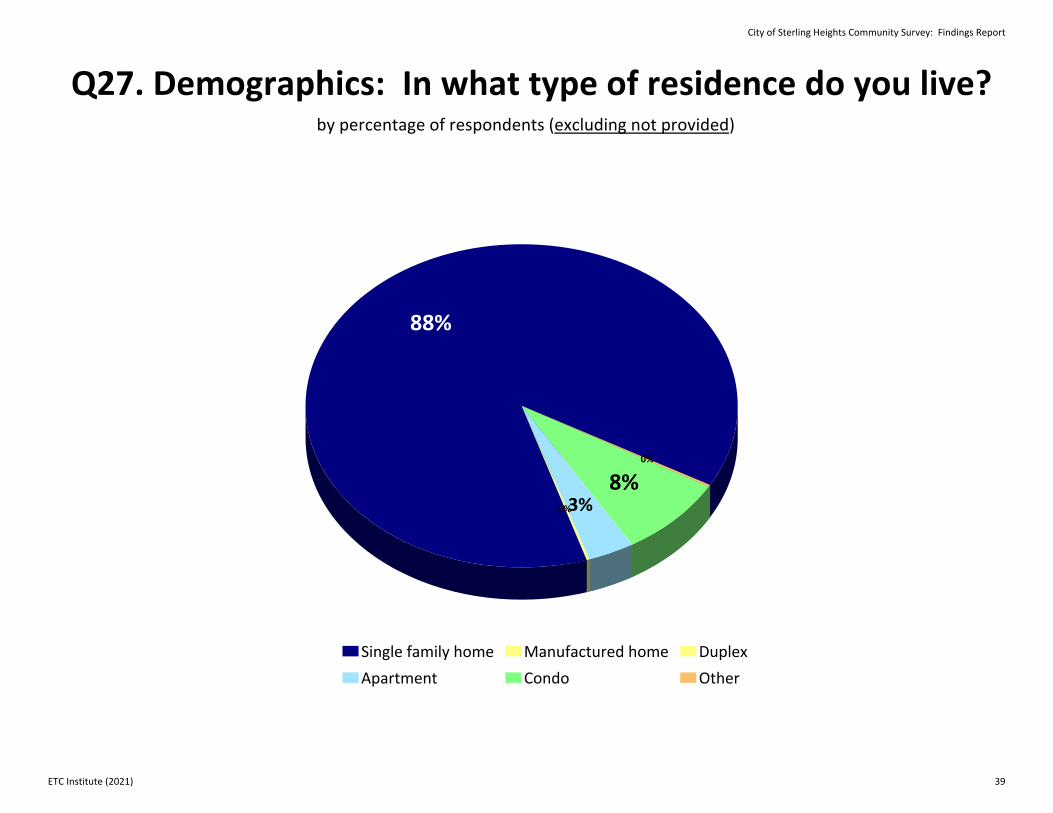
Q27. Demographics: In what type of residence do you live?by percentage of respondents (excluding not provided)
88%
0%3%8%
0%
Single family home Manufactured home DuplexApartment Condo Other
City of Sterling Heights Community Survey: Findings Report
ETC Institute (2021) 39
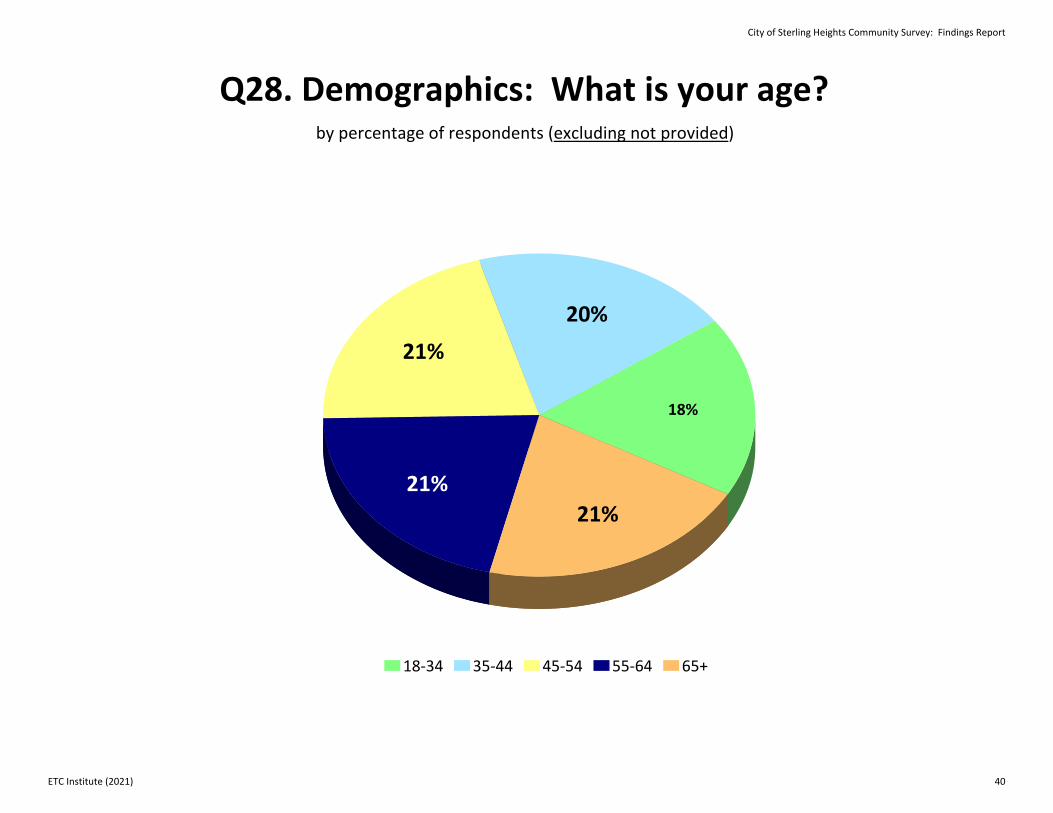
Q28. Demographics: What is your age?by percentage of respondents (excluding not provided)
18%
20%
21%
21%21%
18‐34 35‐44 45‐54 55‐64 65+
City of Sterling Heights Community Survey: Findings Report
ETC Institute (2021) 40
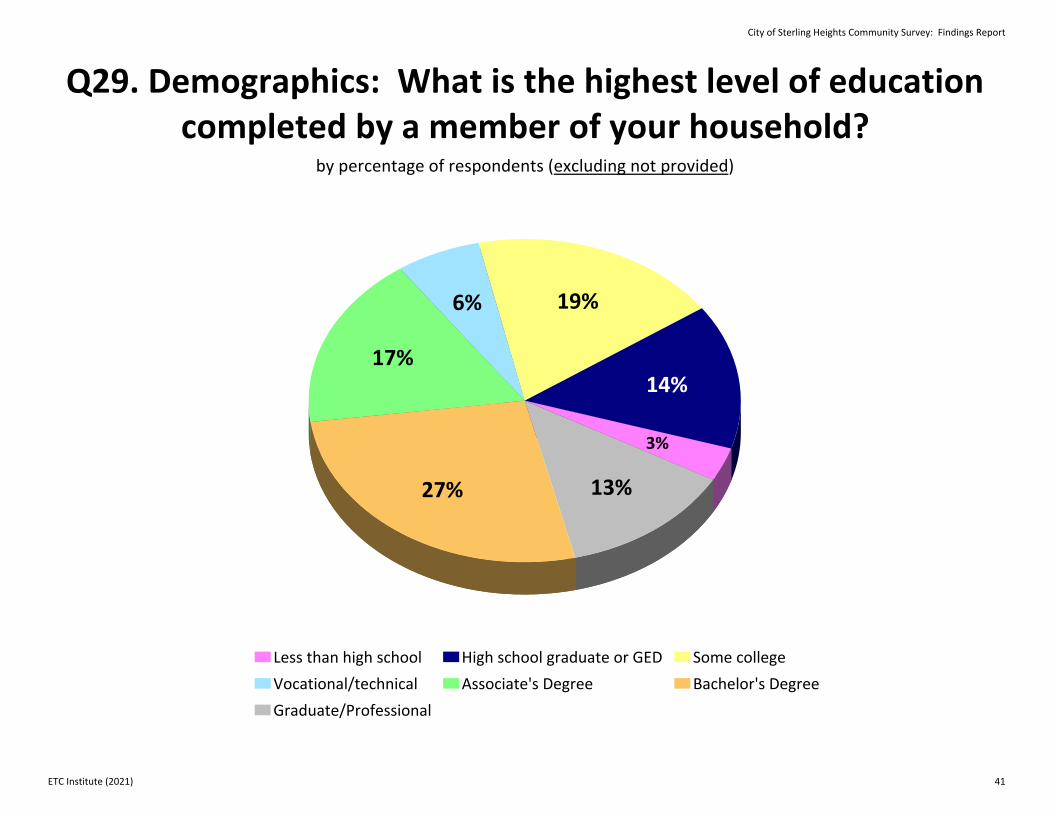
Q29. Demographics: What is the highest level of education completed by a member of your household?
by percentage of respondents (excluding not provided)
3%
14%
19%6%
17%
27% 13%
Less than high school High school graduate or GED Some collegeVocational/technical Associate's Degree Bachelor's DegreeGraduate/Professional
City of Sterling Heights Community Survey: Findings Report
ETC Institute (2021) 41
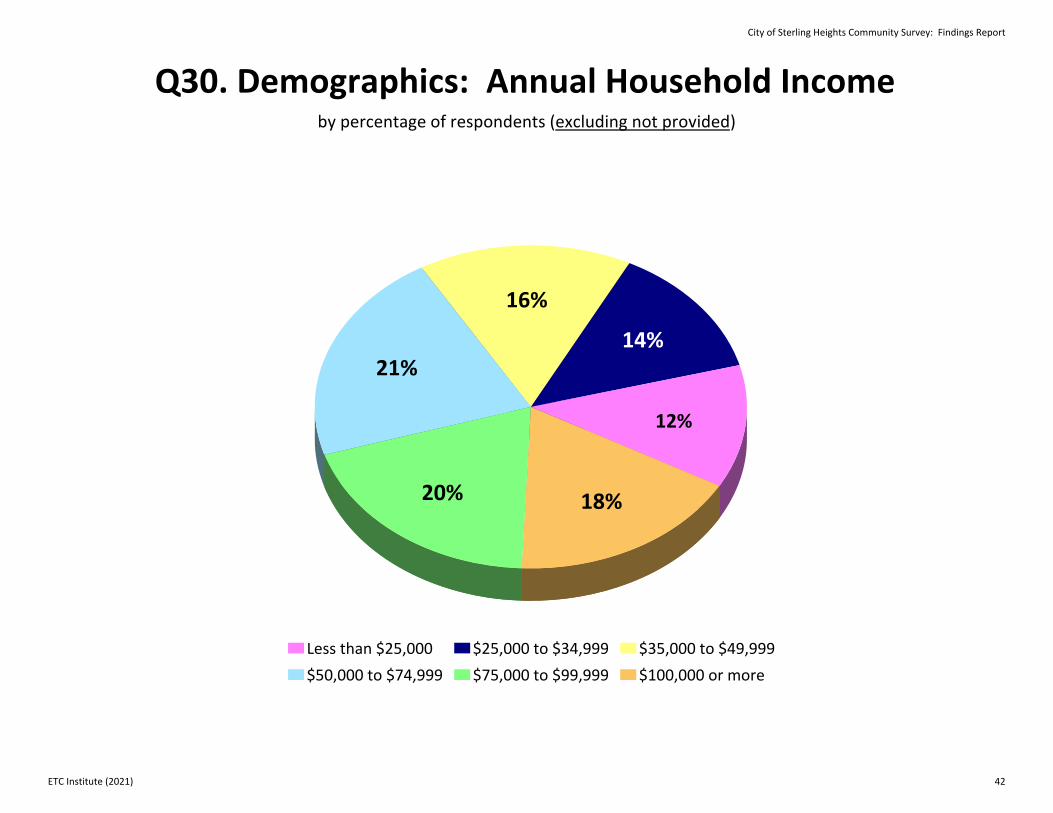
Q30. Demographics: Annual Household Incomeby percentage of respondents (excluding not provided)
12%
14%
16%
21%
20% 18%
Less than $25,000 $25,000 to $34,999 $35,000 to $49,999$50,000 to $74,999 $75,000 to $99,999 $100,000 or more
City of Sterling Heights Community Survey: Findings Report
ETC Institute (2021) 42
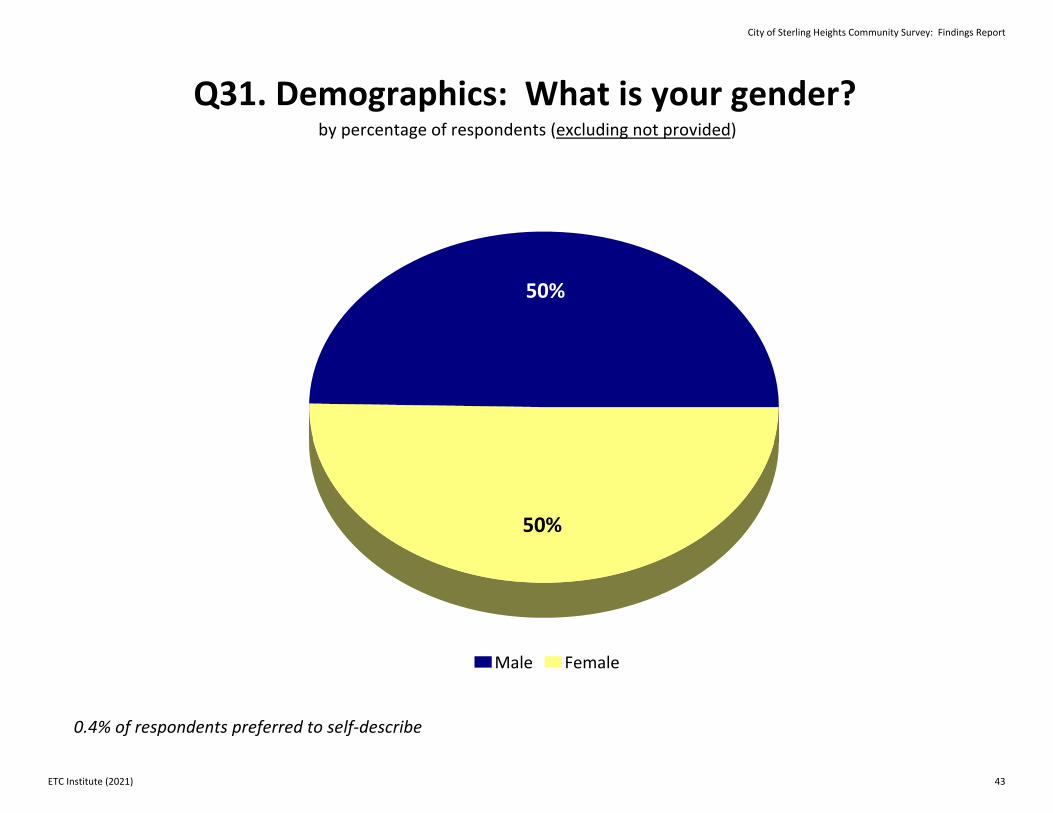
Q31. Demographics: What is your gender?by percentage of respondents (excluding not provided)
50%
50%
Male Female
0.4% of respondents preferred to self‐describe
City of Sterling Heights Community Survey: Findings Report
ETC Institute (2021) 43
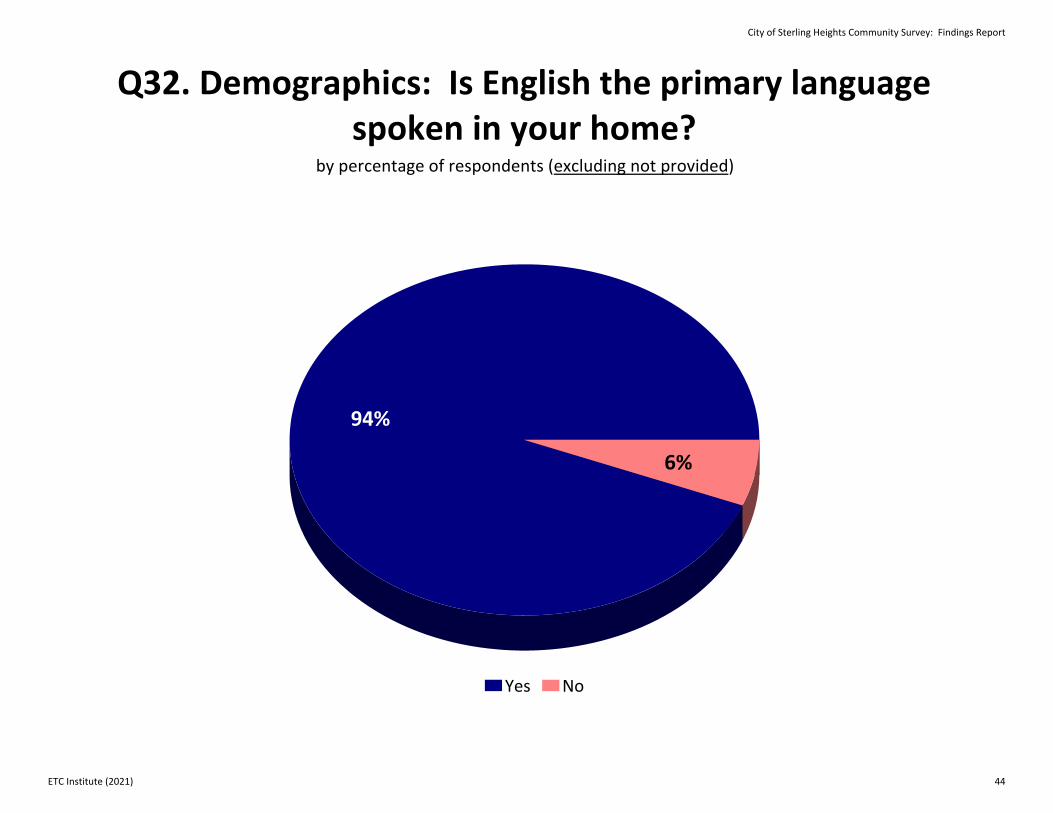
Q32. Demographics: Is English the primary language spoken in your home?
by percentage of respondents (excluding not provided)
94%
6%
Yes No
City of Sterling Heights Community Survey: Findings Report
ETC Institute (2021) 44
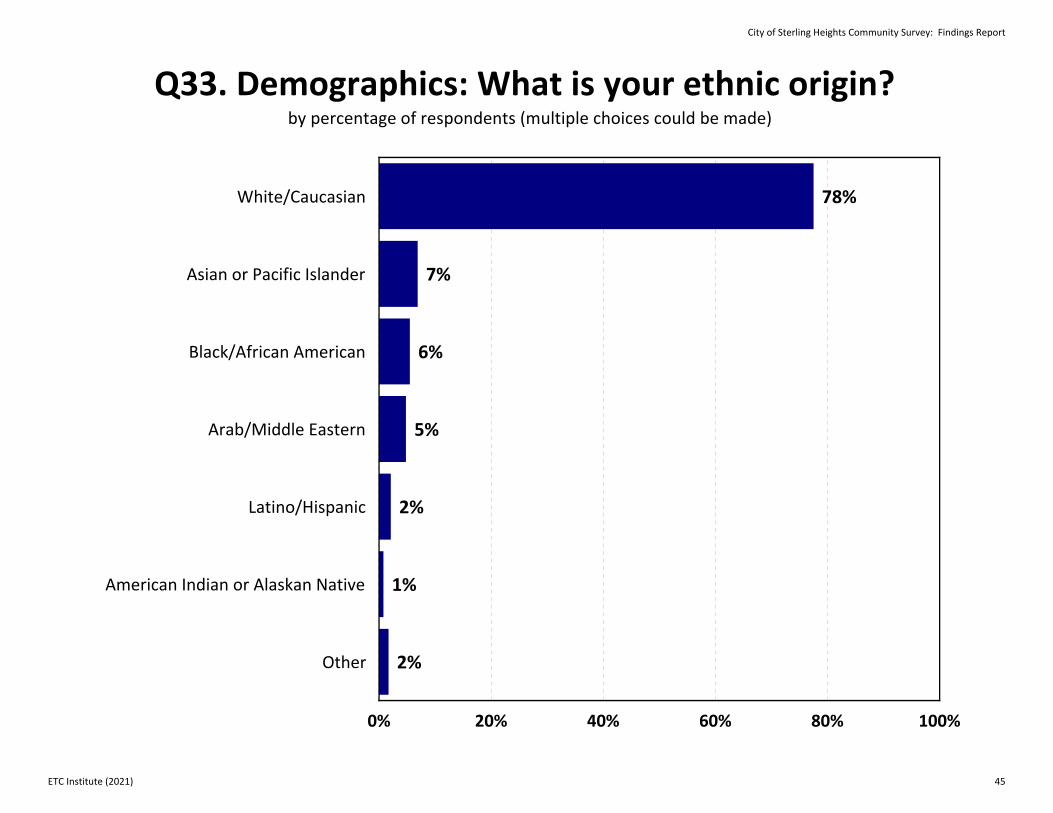
78%
7%
6%
5%
2%
1%
2%
White/Caucasian
Asian or Pacific Islander
Black/African American
Arab/Middle Eastern
Latino/Hispanic
American Indian or Alaskan Native
Other
0% 20% 40% 60% 80% 100%
Q33. Demographics: What is your ethnic origin?by percentage of respondents (multiple choices could be made)
City of Sterling Heights Community Survey: Findings Report
ETC Institute (2021) 45
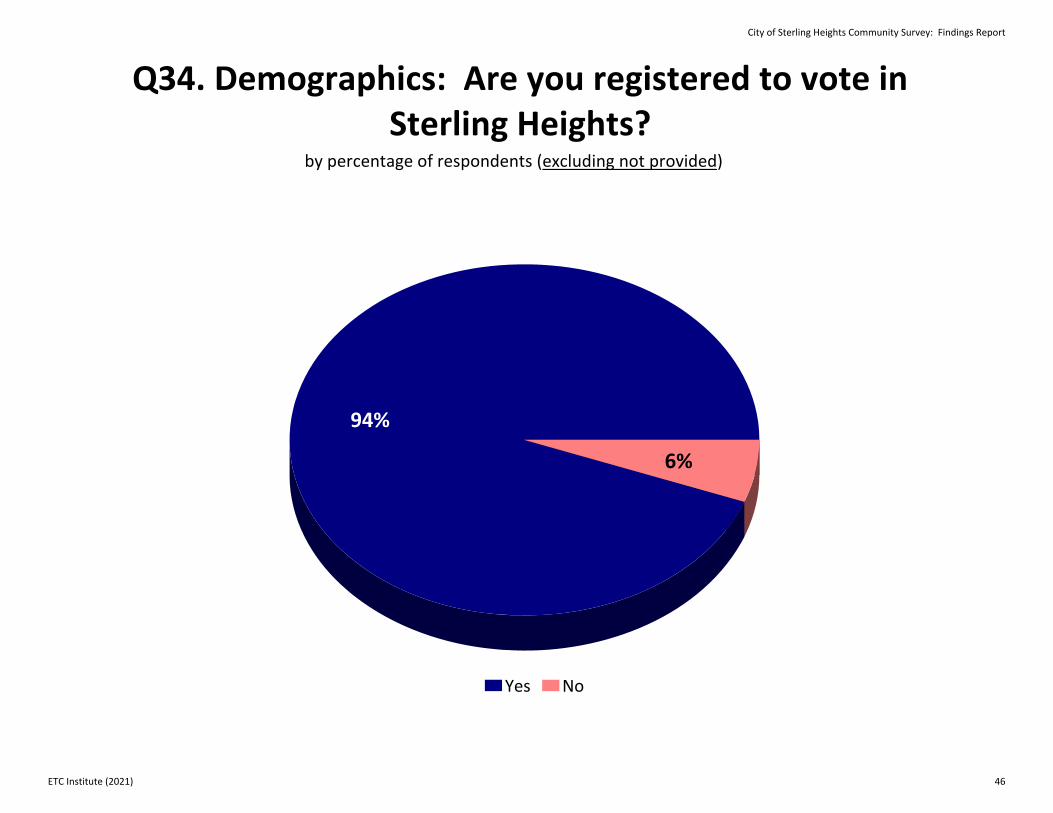
Q34. Demographics: Are you registered to vote in Sterling Heights?
by percentage of respondents (excluding not provided)
94%
6%
Yes No
City of Sterling Heights Community Survey: Findings Report
ETC Institute (2021) 46
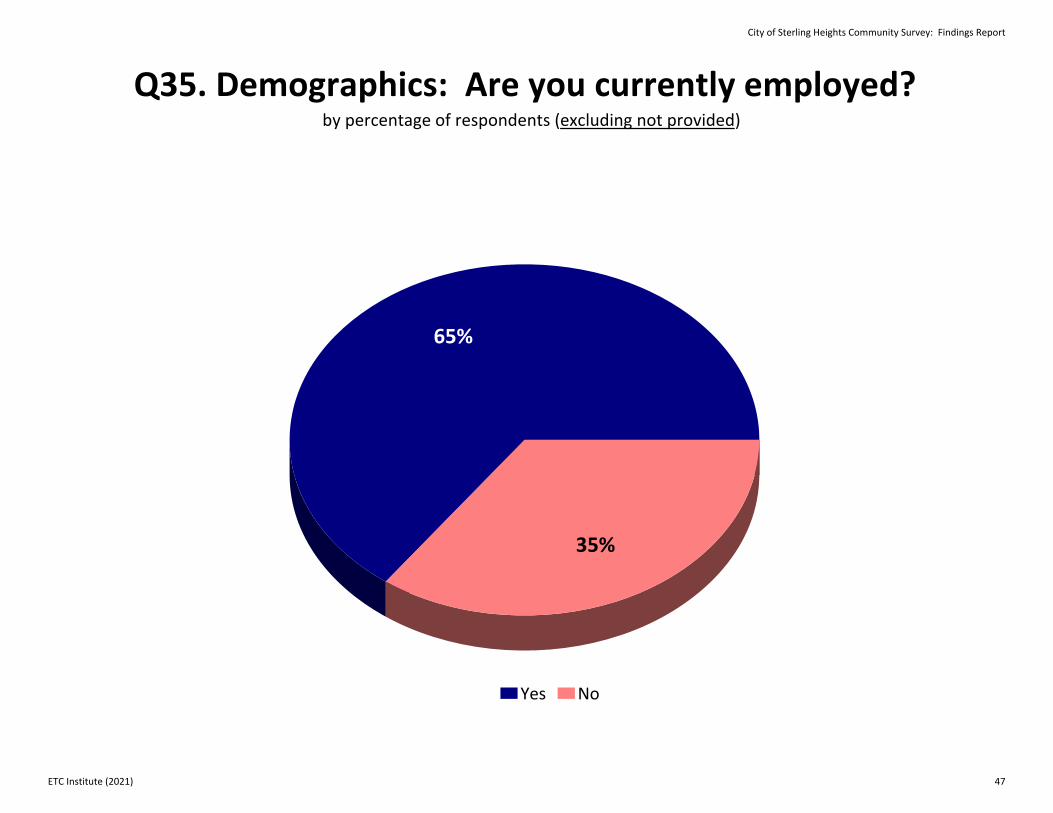
Q35. Demographics: Are you currently employed?by percentage of respondents (excluding not provided)
65%
35%
Yes No
City of Sterling Heights Community Survey: Findings Report
ETC Institute (2021) 47
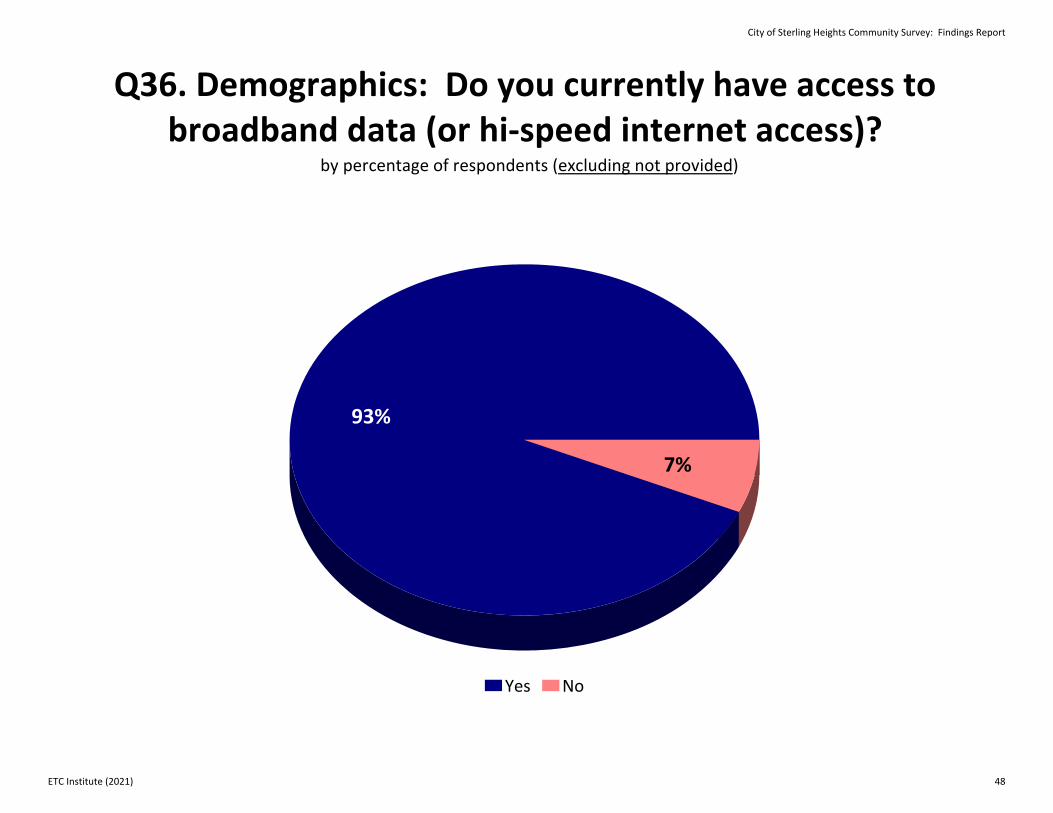
Q36. Demographics: Do you currently have access to broadband data (or hi‐speed internet access)?
by percentage of respondents (excluding not provided)
93%
7%
Yes No
City of Sterling Heights Community Survey: Findings Report
ETC Institute (2021) 48
2 Benchmarking Analysis
City of Sterling Heights Community Survey: Findings Report
ETC Institute (2021) 49
Overview
ETC Institute's DirectionFinder® program was originally developed in 1999 to help community leaders across the United States use statistically valid community survey data as a tool for making better decisions. Since November of 1999, the survey has been administered in more than 500 communities in 50 states. Most participating communities conduct the survey on an annual or biennial basis. This report contains benchmarking data from two sources: (1) a national survey that was administered by ETC Institute during the summer of 2020 to a random sample of more than 5,000 residents across the United States, and (2) a regional survey administered during the summer of 2020 to a random sample of over 400 residents in the North Central Region of the United States. The North Central Region includes the states of Michigan, Indiana, Ohio, and Pennsylvania.
Interpreting the Charts
The charts on the following pages show how the overall results for Sterling Heights compare to the national and regional averages based on the results of the 2020 survey that was administered by ETC Institute. The “National Average” shown in the charts reflects the overall results of ETC Institute’s national survey of more than 5,000 residents, and the “North Central Region” reflects the results of the survey of more than 400 residents in the states listed above.
City of Sterling Heights Community Survey: Findings Report
ETC Institute (2021) 50
National Benchmarks
Note: The benchmarking data contained in this report is protected intellectual property. Any reproduction of the benchmarking
information in this report by persons or organizations not directly affiliated with the City of Sterling Heights, Michigan is not authorized
without written consent from ETC Institute.
City of Sterling Heights Community Survey: Findings Report
ETC Institute (2021) 51
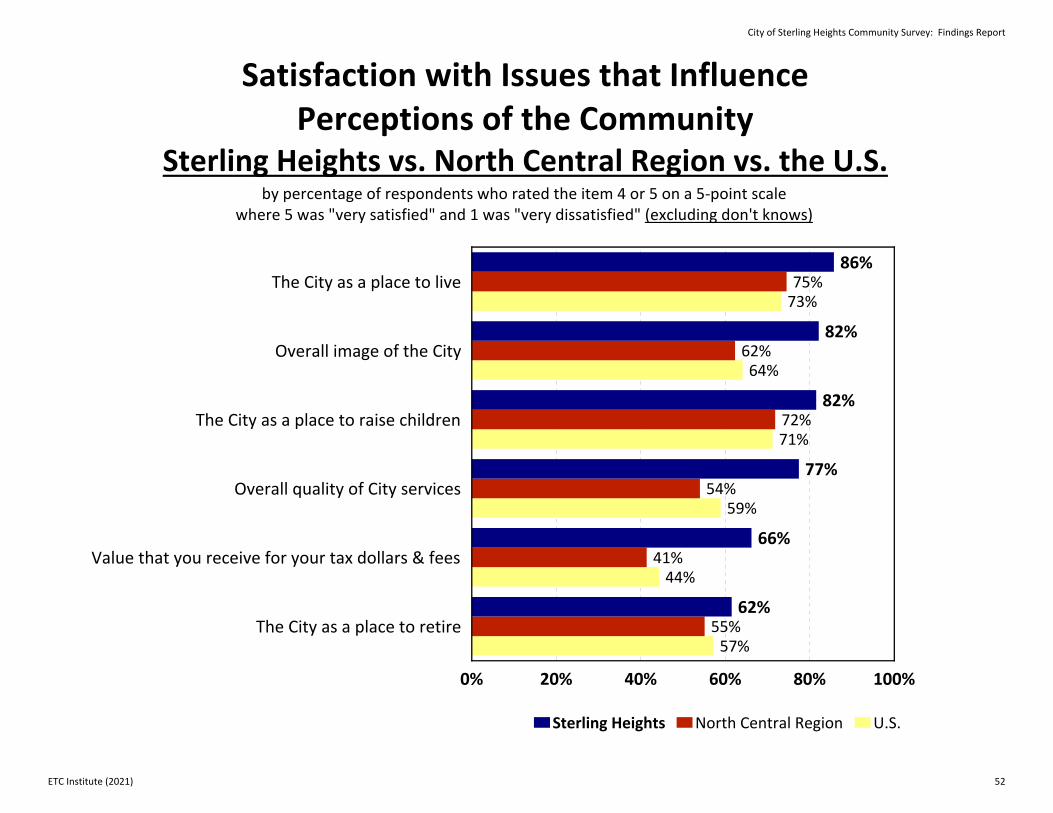
86%
82%
82%
77%
66%
62%
75%
62%
72%
54%
41%
55%
73%
64%
71%
59%
44%
57%
The City as a place to live
Overall image of the City
The City as a place to raise children
Overall quality of City services
Value that you receive for your tax dollars & fees
The City as a place to retire
0% 20% 40% 60% 80% 100%
Sterling Heights North Central Region U.S.
by percentage of respondents who rated the item 4 or 5 on a 5‐point scalewhere 5 was "very satisfied" and 1 was "very dissatisfied" (excluding don't knows)
Satisfaction with Issues that Influence Perceptions of the Community
Sterling Heights vs. North Central Region vs. the U.S.
City of Sterling Heights Community Survey: Findings Report
ETC Institute (2021) 52
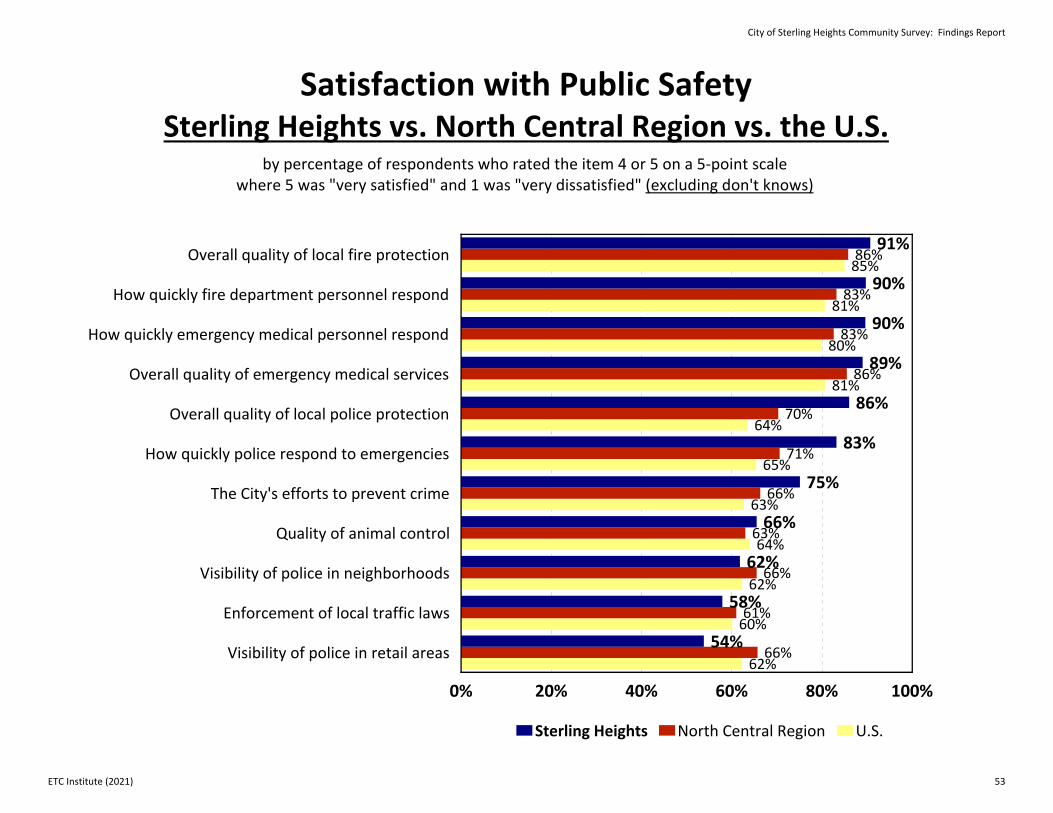
91%
90%
90%
89%
86%
83%
75%
66%
62%
58%
54%
86%
83%
83%
86%
70%
71%
66%
63%
66%
61%
66%
85%
81%
80%
81%
64%
65%
63%
64%
62%
60%
62%
Overall quality of local fire protection
How quickly fire department personnel respond
How quickly emergency medical personnel respond
Overall quality of emergency medical services
Overall quality of local police protection
How quickly police respond to emergencies
The City's efforts to prevent crime
Quality of animal control
Visibility of police in neighborhoods
Enforcement of local traffic laws
Visibility of police in retail areas
0% 20% 40% 60% 80% 100%
Sterling Heights North Central Region U.S.
Satisfaction with Public SafetySterling Heights vs. North Central Region vs. the U.S.
by percentage of respondents who rated the item 4 or 5 on a 5‐point scalewhere 5 was "very satisfied" and 1 was "very dissatisfied" (excluding don't knows)
City of Sterling Heights Community Survey: Findings Report
ETC Institute (2021) 53
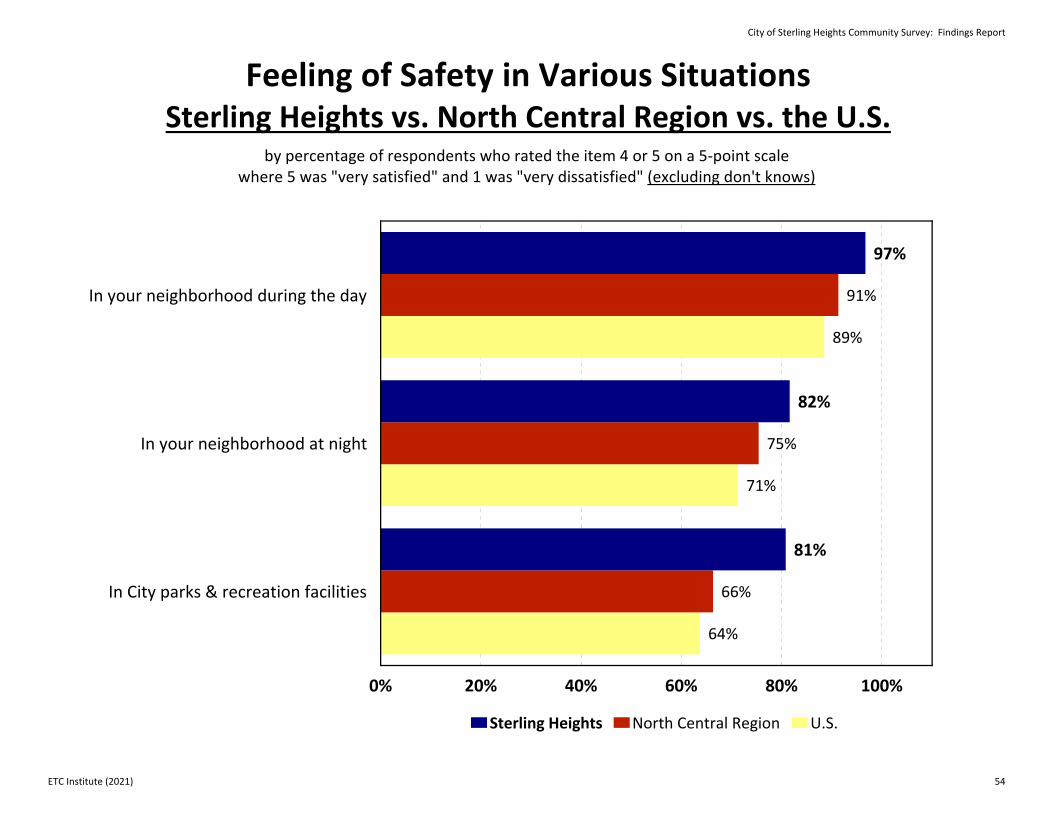
97%
82%
81%
91%
75%
66%
89%
71%
64%
In your neighborhood during the day
In your neighborhood at night
In City parks & recreation facilities
0% 20% 40% 60% 80% 100%
Sterling Heights North Central Region U.S.
Feeling of Safety in Various SituationsSterling Heights vs. North Central Region vs. the U.S.
by percentage of respondents who rated the item 4 or 5 on a 5‐point scalewhere 5 was "very satisfied" and 1 was "very dissatisfied" (excluding don't knows)
City of Sterling Heights Community Survey: Findings Report
ETC Institute (2021) 54
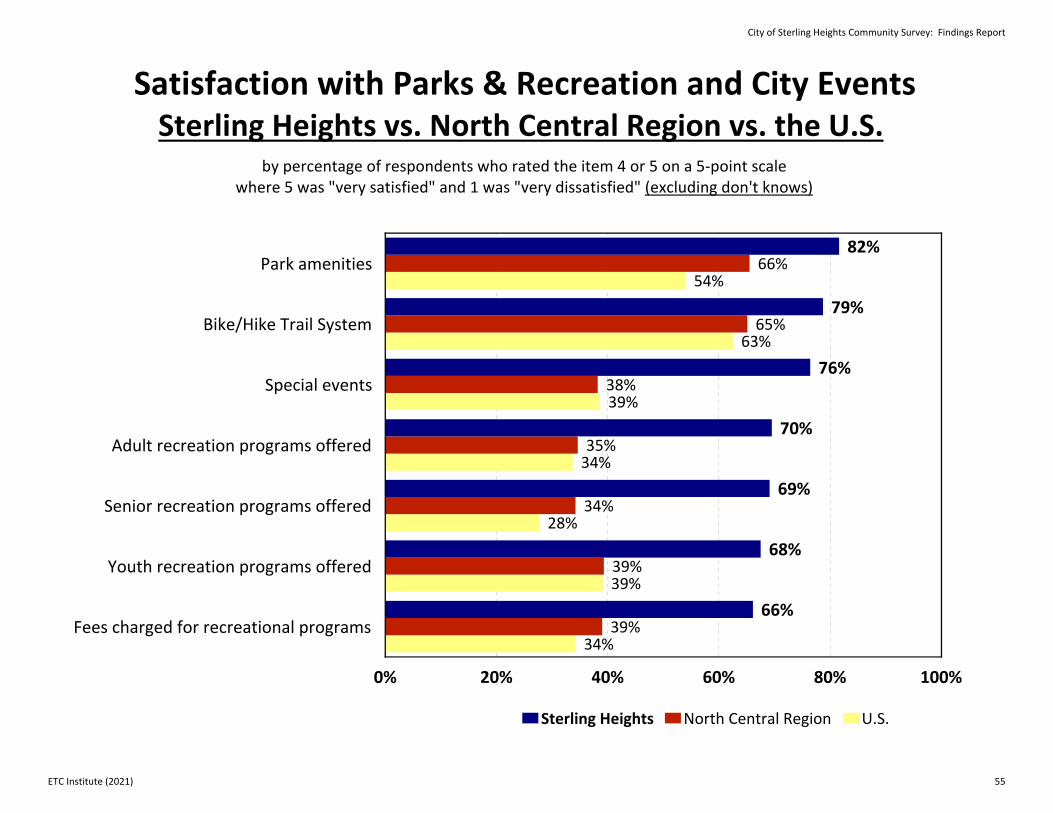
82%
79%
76%
70%
69%
68%
66%
66%
65%
38%
35%
34%
39%
39%
54%
63%
39%
34%
28%
39%
34%
Park amenities
Bike/Hike Trail System
Special events
Adult recreation programs offered
Senior recreation programs offered
Youth recreation programs offered
Fees charged for recreational programs
0% 20% 40% 60% 80% 100%
Sterling Heights North Central Region U.S.
Satisfaction with Parks & Recreation and City EventsSterling Heights vs. North Central Region vs. the U.S.
by percentage of respondents who rated the item 4 or 5 on a 5‐point scalewhere 5 was "very satisfied" and 1 was "very dissatisfied" (excluding don't knows)
City of Sterling Heights Community Survey: Findings Report
ETC Institute (2021) 55
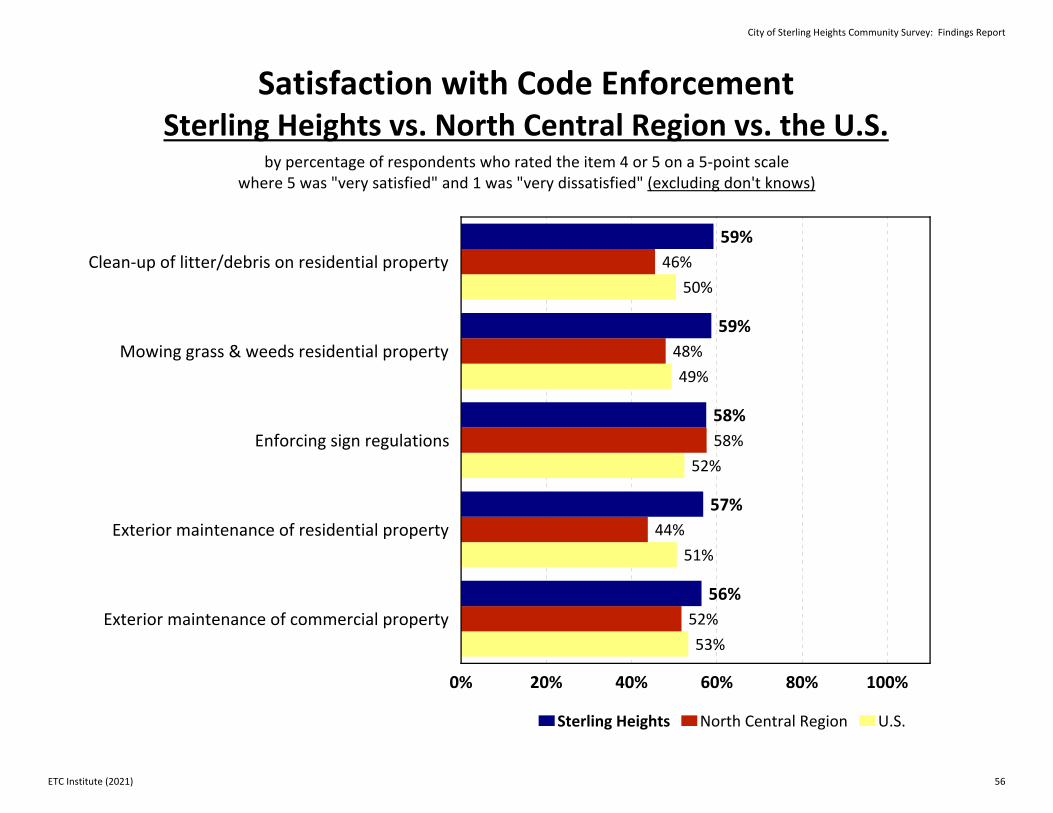
59%
59%
58%
57%
56%
46%
48%
58%
44%
52%
50%
49%
52%
51%
53%
Clean‐up of litter/debris on residential property
Mowing grass & weeds residential property
Enforcing sign regulations
Exterior maintenance of residential property
Exterior maintenance of commercial property
0% 20% 40% 60% 80% 100%
Sterling Heights North Central Region U.S.
Satisfaction with Code EnforcementSterling Heights vs. North Central Region vs. the U.S.
by percentage of respondents who rated the item 4 or 5 on a 5‐point scalewhere 5 was "very satisfied" and 1 was "very dissatisfied" (excluding don't knows)
City of Sterling Heights Community Survey: Findings Report
ETC Institute (2021) 56
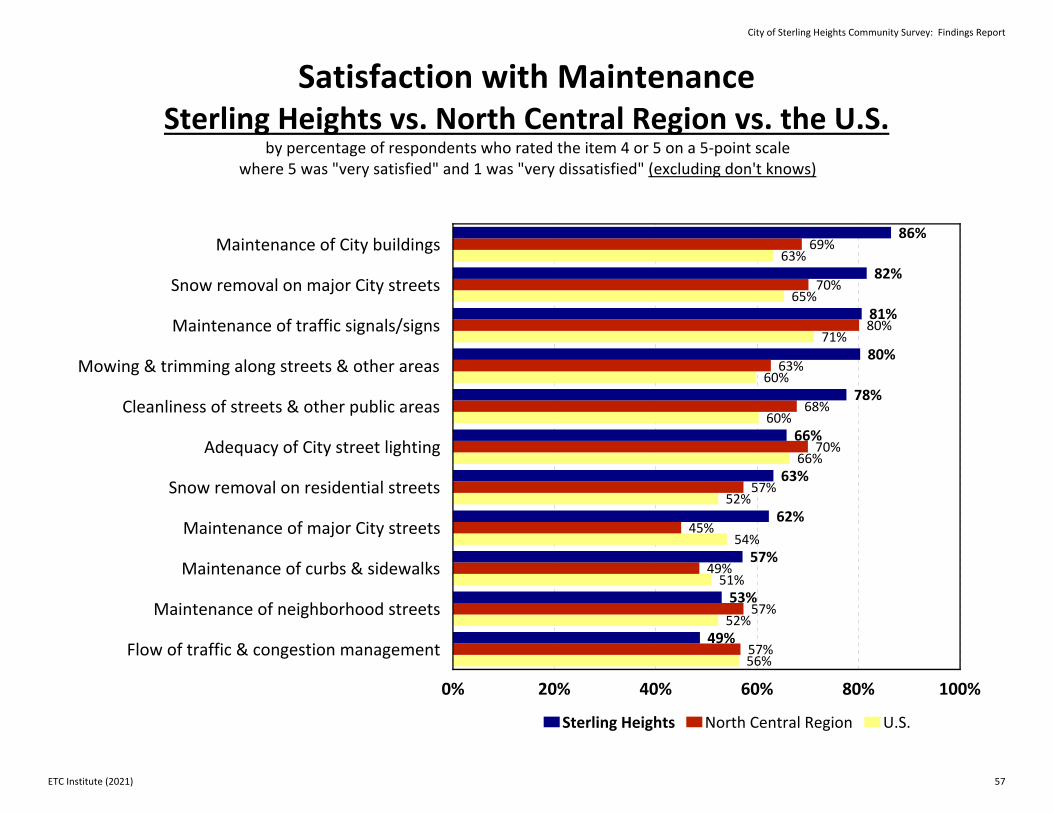
86%
82%
81%
80%
78%
66%
63%
62%
57%
53%
49%
69%
70%
80%
63%
68%
70%
57%
45%
49%
57%
57%
63%
65%
71%
60%
60%
66%
52%
54%
51%
52%
56%
Maintenance of City buildings
Snow removal on major City streets
Maintenance of traffic signals/signs
Mowing & trimming along streets & other areas
Cleanliness of streets & other public areas
Adequacy of City street lighting
Snow removal on residential streets
Maintenance of major City streets
Maintenance of curbs & sidewalks
Maintenance of neighborhood streets
Flow of traffic & congestion management
0% 20% 40% 60% 80% 100%
Sterling Heights North Central Region U.S.
Satisfaction with MaintenanceSterling Heights vs. North Central Region vs. the U.S.
by percentage of respondents who rated the item 4 or 5 on a 5‐point scalewhere 5 was "very satisfied" and 1 was "very dissatisfied" (excluding don't knows)
City of Sterling Heights Community Survey: Findings Report
ETC Institute (2021) 57
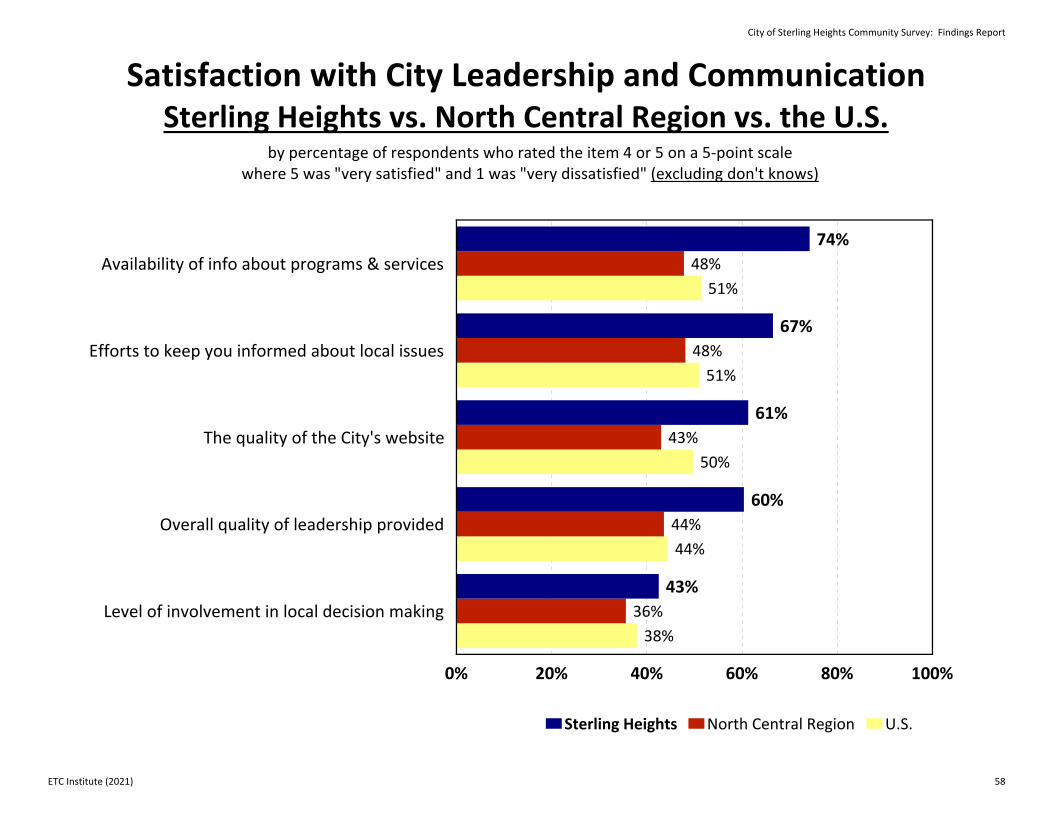
74%
67%
61%
60%
43%
48%
48%
43%
44%
36%
51%
51%
50%
44%
38%
Availability of info about programs & services
Efforts to keep you informed about local issues
The quality of the City's website
Overall quality of leadership provided
Level of involvement in local decision making
0% 20% 40% 60% 80% 100%
Sterling Heights North Central Region U.S.
Satisfaction with City Leadership and CommunicationSterling Heights vs. North Central Region vs. the U.S.
by percentage of respondents who rated the item 4 or 5 on a 5‐point scalewhere 5 was "very satisfied" and 1 was "very dissatisfied" (excluding don't knows)
City of Sterling Heights Community Survey: Findings Report
ETC Institute (2021) 58
3 Importance-Satisfaction Analysis
City of Sterling Heights Community Survey: Findings Report
ETC Institute (2021) 59
Overview
Today, community leaders have limited resources which need to be targeted to activities that are of the most benefit to their citizens. Two of the most important criteria for decision making are (1) to target resources toward services of the highest importance to citizens; and (2) to target resources toward those services where citizens are the least satisfied.
The Importance‐Satisfaction (I‐S) rating is a unique tool that allows public officials to better understand both of these highly important decision‐making criteria for each of the services they are providing. The Importance‐Satisfaction (I‐S) rating is based on the concept that public agencies will maximize overall customer satisfaction by emphasizing improvements in those areas where the level of satisfaction is relatively low, and the perceived importance of the service is relatively high.
The rating is calculated by summing the percentage of responses for items selected as the first, second, and third most important services for the City to provide. The sum is then multiplied by 1 minus the percentage of respondents who indicated they were positively satisfied with the City’s performance in the related area (the sum of the ratings of 4 and 5 on a 5‐point scale excluding “don’t know” responses). “Don’t know” responses are excluded from the calculation to ensure the satisfaction ratings among service categories are comparable.
I-S Rating = Importance x (1-Satisfaction)
Example of the Calculation
Respondents were asked to identify the public safety services that were most important to their household. More than one‐third (38.3%) of the respondent households selected “visibility of police in neighborhoods” as one of the most important services to emphasize over the next two years.
With regard to satisfaction, 61.8% of respondents surveyed rated “visibility of police in neighborhoods” as a “4” or “5” on a 5‐point scale (where “5” means “Very Satisfied”), excluding “don’t know” responses. The I‐S rating was calculated by multiplying the sum of the most important percentages by one minus the sum of the satisfaction percentages. In this example, 38.3% was multiplied by 38.2% (1‐0.618). This calculation yielded an I‐S rating of 0.1463, which ranked first out of thirteen categories of public safety services analyzed.
City of Sterling Heights Community Survey: Findings Report
ETC Institute (2021) 60
The maximum rating is 1.00 and would be achieved when 100% of the respondents select an item as one of their top three choices of importance and 0% indicate they are positively satisfied with the delivery of the service. The lowest rating is 0.00 and could be achieved under either of the following two situations:
• If 100% of the respondents were positively satisfied with the delivery of the service • If none (0%) of the respondents selected the service as one of the three most important
areas.
Interpreting the Ratings
Ratings that are greater than or equal to 0.20 identify areas that should receive significantly more emphasis over the next two years. Ratings from 0.10 to 0.20 identify service areas that should receive increased emphasis. Ratings less than 0.10 should continue to receive the current level of emphasis.
• Definitely Increase Emphasis (I‐S > 0.20) • Increase Current Emphasis (I‐S = 0.10 ‐ 0.20) • Maintain Current Emphasis (I‐S < 0.10)
The results for the City of Sterling Heights are provided on the following pages.
City of Sterling Heights Community Survey: Findings Report
ETC Institute (2021) 61
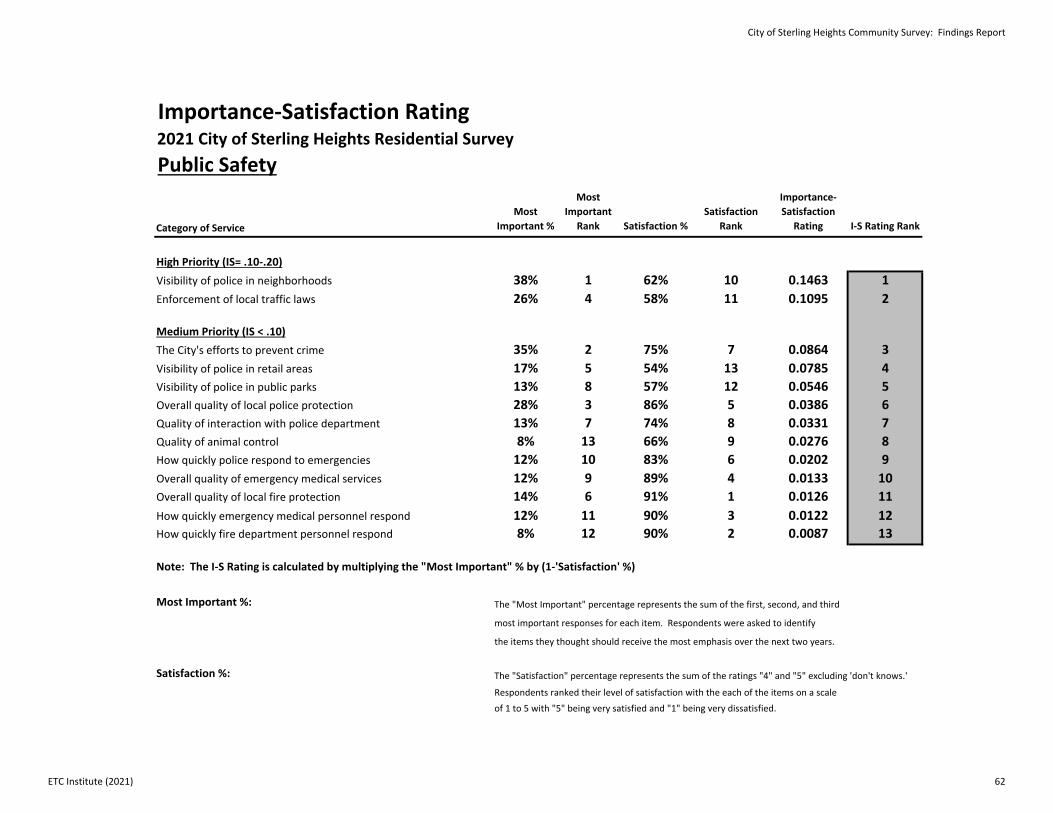
Importance‐Satisfaction Rating2021 City of Sterling Heights Residential Survey Public Safety
Category of ServiceMost
Important %
Most Important
Rank Satisfaction %Satisfaction
Rank
Importance‐Satisfaction
Rating I‐S Rating Rank
High Priority (IS= .10‐.20)Visibility of police in neighborhoods 38% 1 62% 10 0.1463 1Enforcement of local traffic laws 26% 4 58% 11 0.1095 2
Medium Priority (IS < .10)The City's efforts to prevent crime 35% 2 75% 7 0.0864 3Visibility of police in retail areas 17% 5 54% 13 0.0785 4Visibility of police in public parks 13% 8 57% 12 0.0546 5Overall quality of local police protection 28% 3 86% 5 0.0386 6Quality of interaction with police department 13% 7 74% 8 0.0331 7Quality of animal control 8% 13 66% 9 0.0276 8How quickly police respond to emergencies 12% 10 83% 6 0.0202 9Overall quality of emergency medical services 12% 9 89% 4 0.0133 10Overall quality of local fire protection 14% 6 91% 1 0.0126 11How quickly emergency medical personnel respond 12% 11 90% 3 0.0122 12How quickly fire department personnel respond 8% 12 90% 2 0.0087 13
Note: The I‐S Rating is calculated by multiplying the "Most Important" % by (1‐'Satisfaction' %)
Most Important %: The "Most Important" percentage represents the sum of the first, second, and third
most important responses for each item. Respondents were asked to identify
the items they thought should receive the most emphasis over the next two years.
Satisfaction %: The "Satisfaction" percentage represents the sum of the ratings "4" and "5" excluding 'don't knows.'
Respondents ranked their level of satisfaction with the each of the items on a scale
of 1 to 5 with "5" being very satisfied and "1" being very dissatisfied.
City of Sterling Heights Community Survey: Findings Report
ETC Institute (2021) 62
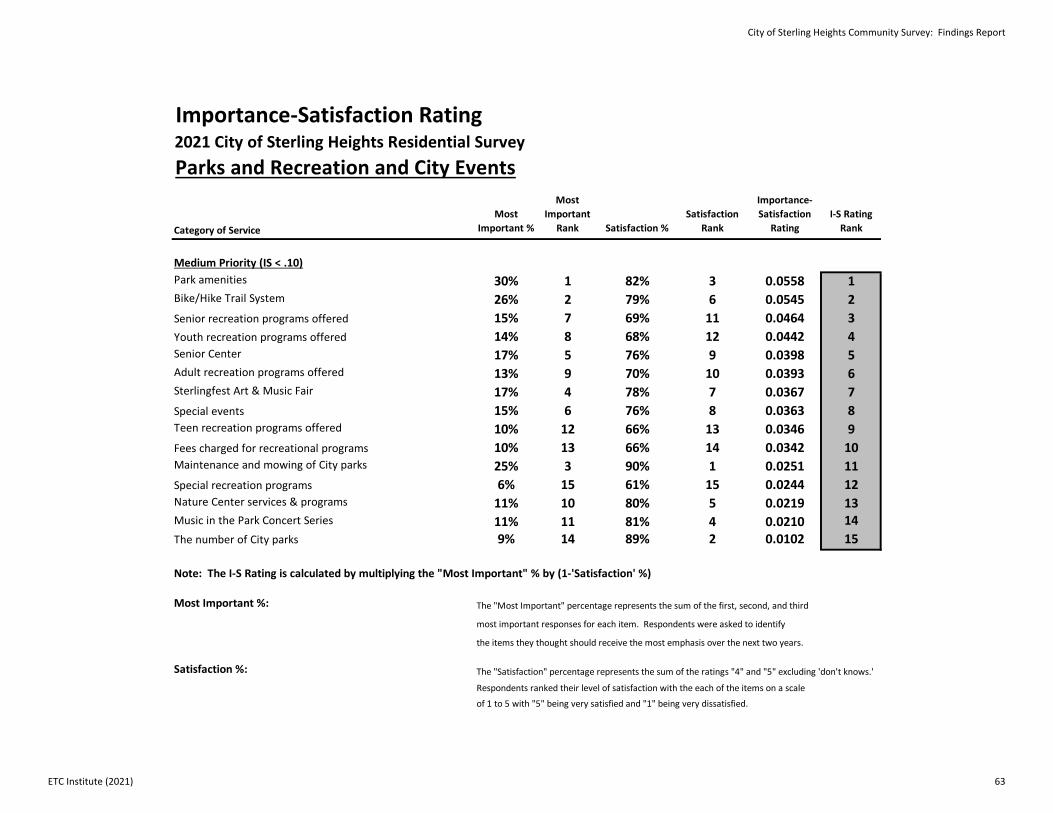
Importance‐Satisfaction Rating2021 City of Sterling Heights Residential Survey Parks and Recreation and City Events
Category of ServiceMost
Important %
Most Important
Rank Satisfaction %Satisfaction
Rank
Importance‐Satisfaction
RatingI‐S Rating Rank
Medium Priority (IS < .10)Park amenities 30% 1 82% 3 0.0558 1Bike/Hike Trail System 26% 2 79% 6 0.0545 2Senior recreation programs offered 15% 7 69% 11 0.0464 3Youth recreation programs offered 14% 8 68% 12 0.0442 4Senior Center 17% 5 76% 9 0.0398 5Adult recreation programs offered 13% 9 70% 10 0.0393 6Sterlingfest Art & Music Fair 17% 4 78% 7 0.0367 7Special events 15% 6 76% 8 0.0363 8Teen recreation programs offered 10% 12 66% 13 0.0346 9Fees charged for recreational programs 10% 13 66% 14 0.0342 10Maintenance and mowing of City parks 25% 3 90% 1 0.0251 11Special recreation programs 6% 15 61% 15 0.0244 12Nature Center services & programs 11% 10 80% 5 0.0219 13Music in the Park Concert Series 11% 11 81% 4 0.0210 14The number of City parks 9% 14 89% 2 0.0102 15
Note: The I‐S Rating is calculated by multiplying the "Most Important" % by (1‐'Satisfaction' %)
Most Important %: The "Most Important" percentage represents the sum of the first, second, and third
most important responses for each item. Respondents were asked to identify
the items they thought should receive the most emphasis over the next two years.
Satisfaction %: The "Satisfaction" percentage represents the sum of the ratings "4" and "5" excluding 'don't knows.'
Respondents ranked their level of satisfaction with the each of the items on a scale
of 1 to 5 with "5" being very satisfied and "1" being very dissatisfied.
City of Sterling Heights Community Survey: Findings Report
ETC Institute (2021) 63
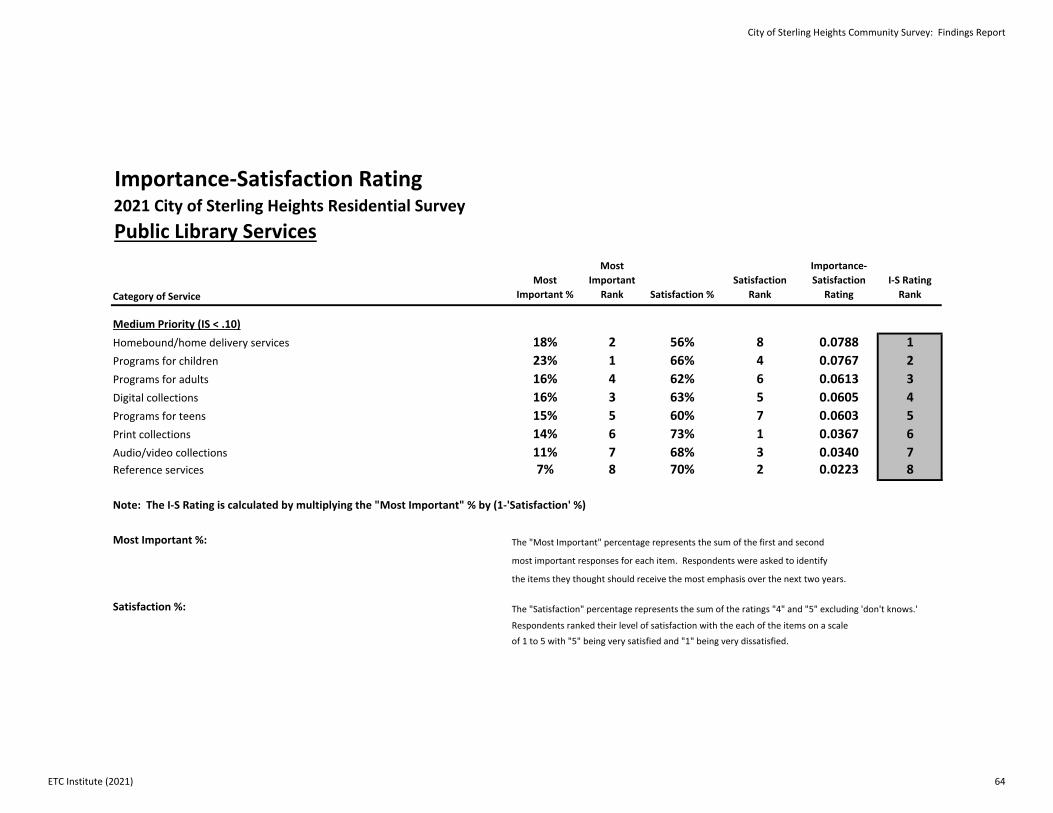
Importance‐Satisfaction Rating2021 City of Sterling Heights Residential Survey Public Library Services
Category of ServiceMost
Important %
Most Important
Rank Satisfaction %Satisfaction
Rank
Importance‐Satisfaction
RatingI‐S Rating Rank
Medium Priority (IS < .10)Homebound/home delivery services 18% 2 56% 8 0.0788 1Programs for children 23% 1 66% 4 0.0767 2Programs for adults 16% 4 62% 6 0.0613 3Digital collections 16% 3 63% 5 0.0605 4Programs for teens 15% 5 60% 7 0.0603 5Print collections 14% 6 73% 1 0.0367 6Audio/video collections 11% 7 68% 3 0.0340 7Reference services 7% 8 70% 2 0.0223 8
Note: The I‐S Rating is calculated by multiplying the "Most Important" % by (1‐'Satisfaction' %)
Most Important %: The "Most Important" percentage represents the sum of the first and second
most important responses for each item. Respondents were asked to identify
the items they thought should receive the most emphasis over the next two years.
Satisfaction %: The "Satisfaction" percentage represents the sum of the ratings "4" and "5" excluding 'don't knows.'
Respondents ranked their level of satisfaction with the each of the items on a scale
of 1 to 5 with "5" being very satisfied and "1" being very dissatisfied.
City of Sterling Heights Community Survey: Findings Report
ETC Institute (2021) 64
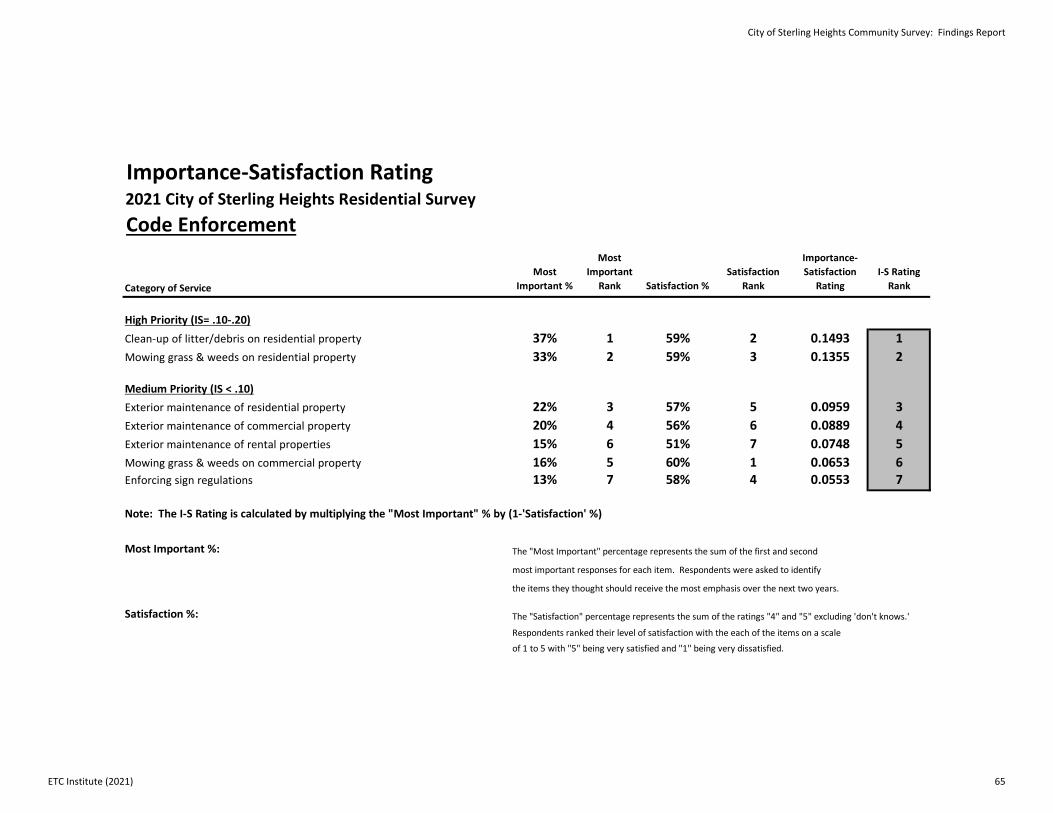
Importance‐Satisfaction Rating2021 City of Sterling Heights Residential Survey Code Enforcement
Category of ServiceMost
Important %
Most Important
Rank Satisfaction %Satisfaction
Rank
Importance‐Satisfaction
RatingI‐S Rating Rank
High Priority (IS= .10‐.20)Clean‐up of litter/debris on residential property 37% 1 59% 2 0.1493 1Mowing grass & weeds on residential property 33% 2 59% 3 0.1355 2
Medium Priority (IS < .10)Exterior maintenance of residential property 22% 3 57% 5 0.0959 3Exterior maintenance of commercial property 20% 4 56% 6 0.0889 4Exterior maintenance of rental properties 15% 6 51% 7 0.0748 5Mowing grass & weeds on commercial property 16% 5 60% 1 0.0653 6Enforcing sign regulations 13% 7 58% 4 0.0553 7
Note: The I‐S Rating is calculated by multiplying the "Most Important" % by (1‐'Satisfaction' %)
Most Important %: The "Most Important" percentage represents the sum of the first and second
most important responses for each item. Respondents were asked to identify
the items they thought should receive the most emphasis over the next two years.
Satisfaction %: The "Satisfaction" percentage represents the sum of the ratings "4" and "5" excluding 'don't knows.'
Respondents ranked their level of satisfaction with the each of the items on a scale
of 1 to 5 with "5" being very satisfied and "1" being very dissatisfied.
City of Sterling Heights Community Survey: Findings Report
ETC Institute (2021) 65
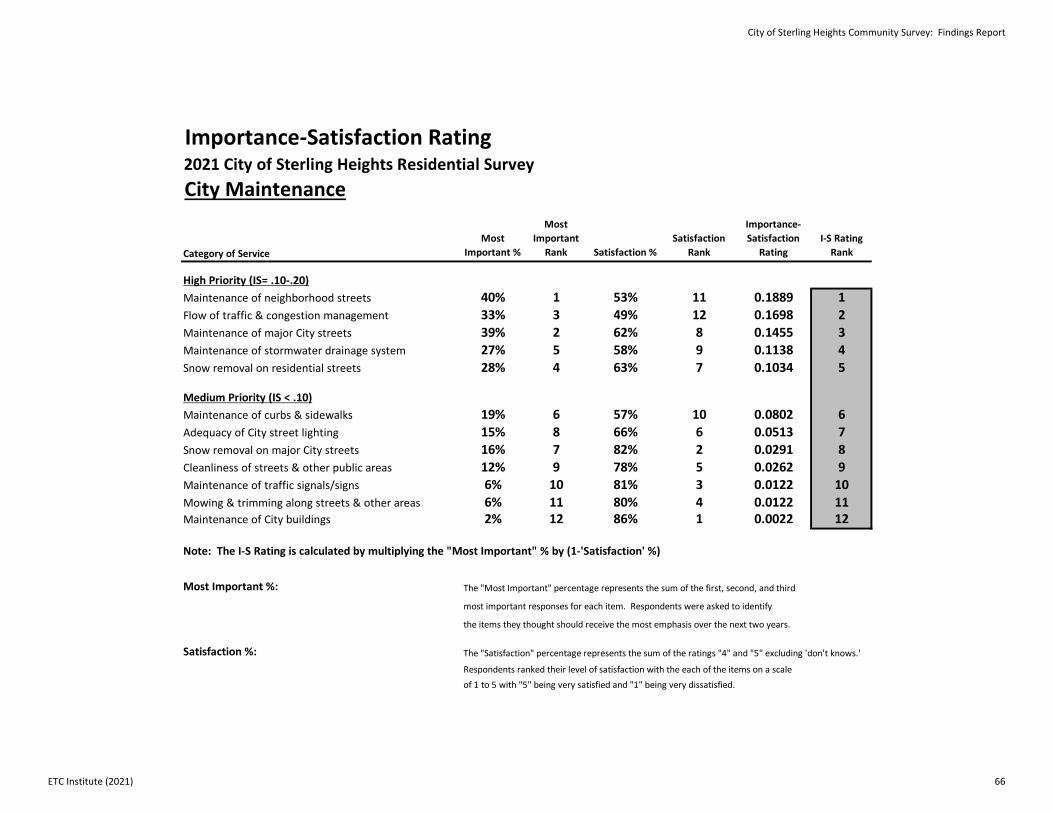
Importance‐Satisfaction Rating2021 City of Sterling Heights Residential Survey City Maintenance
Category of ServiceMost
Important %
Most Important
Rank Satisfaction %Satisfaction
Rank
Importance‐Satisfaction
RatingI‐S Rating Rank
High Priority (IS= .10‐.20)Maintenance of neighborhood streets 40% 1 53% 11 0.1889 1Flow of traffic & congestion management 33% 3 49% 12 0.1698 2Maintenance of major City streets 39% 2 62% 8 0.1455 3Maintenance of stormwater drainage system 27% 5 58% 9 0.1138 4Snow removal on residential streets 28% 4 63% 7 0.1034 5
Medium Priority (IS < .10)Maintenance of curbs & sidewalks 19% 6 57% 10 0.0802 6Adequacy of City street lighting 15% 8 66% 6 0.0513 7Snow removal on major City streets 16% 7 82% 2 0.0291 8Cleanliness of streets & other public areas 12% 9 78% 5 0.0262 9Maintenance of traffic signals/signs 6% 10 81% 3 0.0122 10Mowing & trimming along streets & other areas 6% 11 80% 4 0.0122 11Maintenance of City buildings 2% 12 86% 1 0.0022 12
Note: The I‐S Rating is calculated by multiplying the "Most Important" % by (1‐'Satisfaction' %)
Most Important %: The "Most Important" percentage represents the sum of the first, second, and third
most important responses for each item. Respondents were asked to identify
the items they thought should receive the most emphasis over the next two years.
Satisfaction %: The "Satisfaction" percentage represents the sum of the ratings "4" and "5" excluding 'don't knows.'
Respondents ranked their level of satisfaction with the each of the items on a scaleof 1 to 5 with "5" being very satisfied and "1" being very dissatisfied.
City of Sterling Heights Community Survey: Findings Report
ETC Institute (2021) 66

Tabular Data 4
City of Sterling Heights Community Survey: Findings Report
ETC Institute (2021) 67
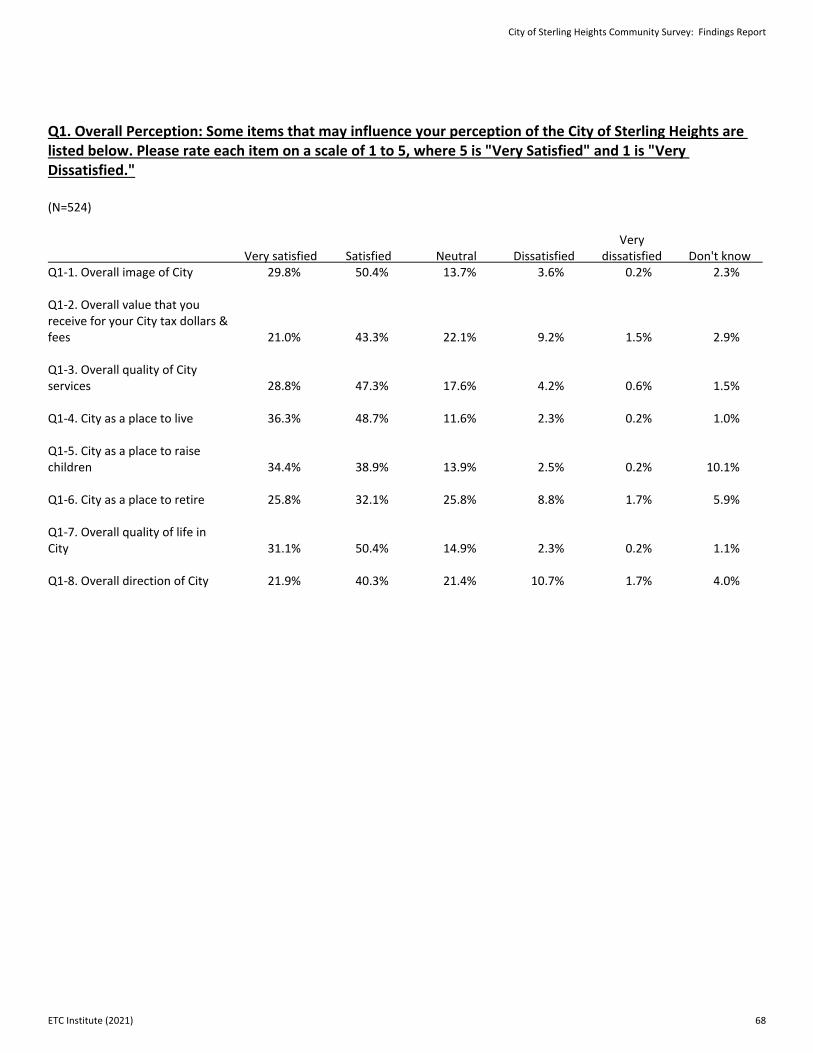
Q1. Overall Perception: Some items that may influence your perception of the City of Sterling Heights are listed below. Please rate each item on a scale of 1 to 5, where 5 is "Very Satisfied" and 1 is "Very Dissatisfied." (N=524) Very Very satisfied Satisfied Neutral Dissatisfied dissatisfied Don't know Q1-1. Overall image of City 29.8% 50.4% 13.7% 3.6% 0.2% 2.3% Q1-2. Overall value that you receive for your City tax dollars & fees 21.0% 43.3% 22.1% 9.2% 1.5% 2.9% Q1-3. Overall quality of City services 28.8% 47.3% 17.6% 4.2% 0.6% 1.5% Q1-4. City as a place to live 36.3% 48.7% 11.6% 2.3% 0.2% 1.0% Q1-5. City as a place to raise children 34.4% 38.9% 13.9% 2.5% 0.2% 10.1% Q1-6. City as a place to retire 25.8% 32.1% 25.8% 8.8% 1.7% 5.9% Q1-7. Overall quality of life in City 31.1% 50.4% 14.9% 2.3% 0.2% 1.1% Q1-8. Overall direction of City 21.9% 40.3% 21.4% 10.7% 1.7% 4.0%
City of Sterling Heights Community Survey: Findings Report
ETC Institute (2021) 68
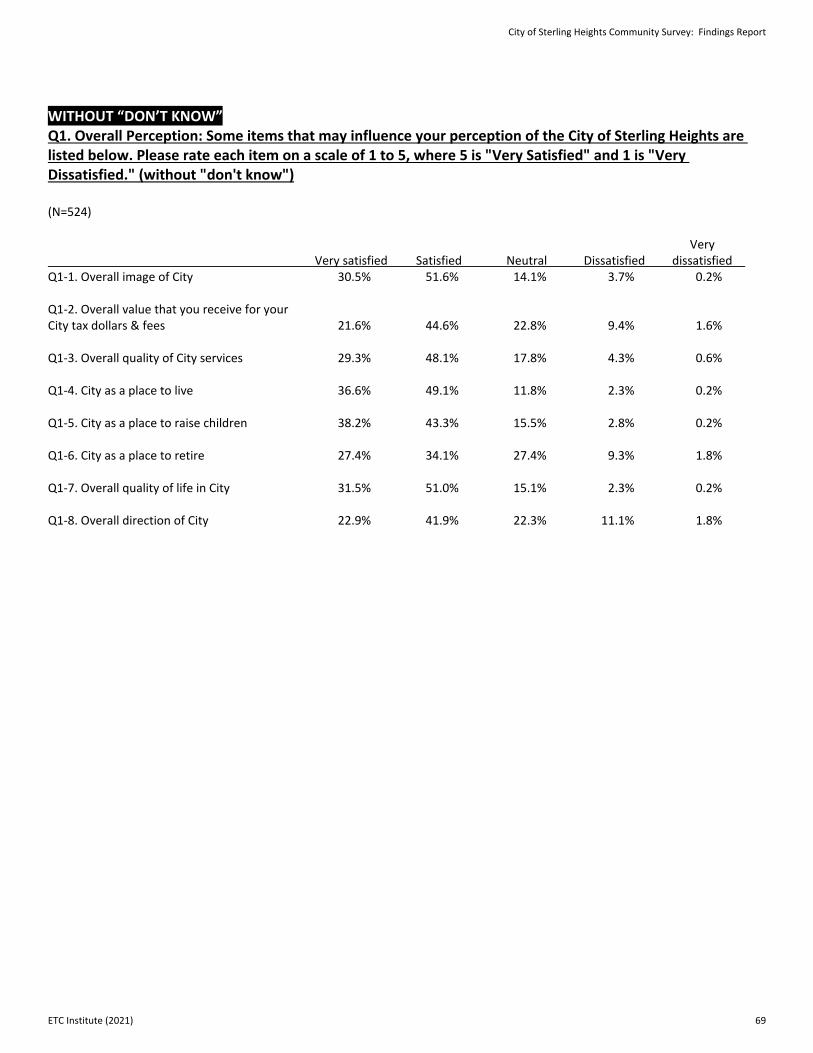
WITHOUT “DON’T KNOW” Q1. Overall Perception: Some items that may influence your perception of the City of Sterling Heights are listed below. Please rate each item on a scale of 1 to 5, where 5 is "Very Satisfied" and 1 is "Very Dissatisfied." (without "don't know") (N=524) Very Very satisfied Satisfied Neutral Dissatisfied dissatisfied Q1-1. Overall image of City 30.5% 51.6% 14.1% 3.7% 0.2% Q1-2. Overall value that you receive for your City tax dollars & fees 21.6% 44.6% 22.8% 9.4% 1.6% Q1-3. Overall quality of City services 29.3% 48.1% 17.8% 4.3% 0.6% Q1-4. City as a place to live 36.6% 49.1% 11.8% 2.3% 0.2% Q1-5. City as a place to raise children 38.2% 43.3% 15.5% 2.8% 0.2% Q1-6. City as a place to retire 27.4% 34.1% 27.4% 9.3% 1.8% Q1-7. Overall quality of life in City 31.5% 51.0% 15.1% 2.3% 0.2% Q1-8. Overall direction of City 22.9% 41.9% 22.3% 11.1% 1.8%
City of Sterling Heights Community Survey: Findings Report
ETC Institute (2021) 69
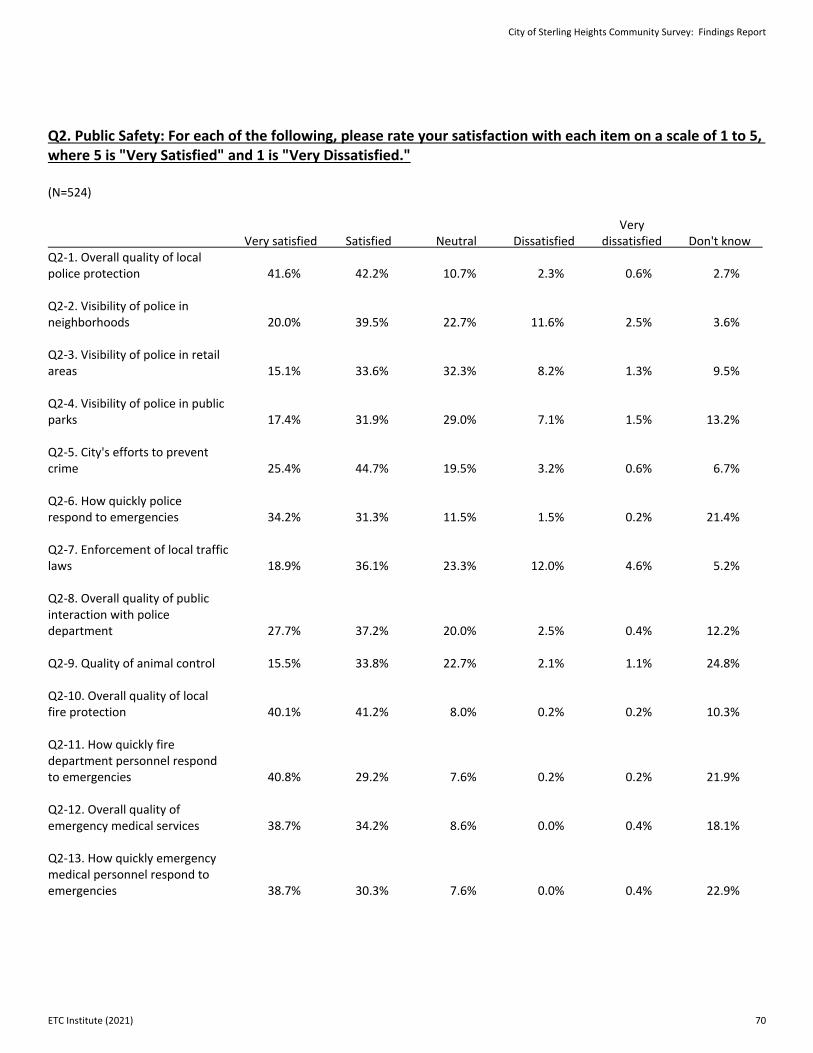
Q2. Public Safety: For each of the following, please rate your satisfaction with each item on a scale of 1 to 5, where 5 is "Very Satisfied" and 1 is "Very Dissatisfied." (N=524) Very Very satisfied Satisfied Neutral Dissatisfied dissatisfied Don't know Q2-1. Overall quality of local police protection 41.6% 42.2% 10.7% 2.3% 0.6% 2.7% Q2-2. Visibility of police in neighborhoods 20.0% 39.5% 22.7% 11.6% 2.5% 3.6% Q2-3. Visibility of police in retail areas 15.1% 33.6% 32.3% 8.2% 1.3% 9.5% Q2-4. Visibility of police in public parks 17.4% 31.9% 29.0% 7.1% 1.5% 13.2% Q2-5. City's efforts to prevent crime 25.4% 44.7% 19.5% 3.2% 0.6% 6.7% Q2-6. How quickly police respond to emergencies 34.2% 31.3% 11.5% 1.5% 0.2% 21.4% Q2-7. Enforcement of local traffic laws 18.9% 36.1% 23.3% 12.0% 4.6% 5.2% Q2-8. Overall quality of public interaction with police department 27.7% 37.2% 20.0% 2.5% 0.4% 12.2% Q2-9. Quality of animal control 15.5% 33.8% 22.7% 2.1% 1.1% 24.8% Q2-10. Overall quality of local fire protection 40.1% 41.2% 8.0% 0.2% 0.2% 10.3% Q2-11. How quickly fire department personnel respond to emergencies 40.8% 29.2% 7.6% 0.2% 0.2% 21.9% Q2-12. Overall quality of emergency medical services 38.7% 34.2% 8.6% 0.0% 0.4% 18.1% Q2-13. How quickly emergency medical personnel respond to emergencies 38.7% 30.3% 7.6% 0.0% 0.4% 22.9%
City of Sterling Heights Community Survey: Findings Report
ETC Institute (2021) 70
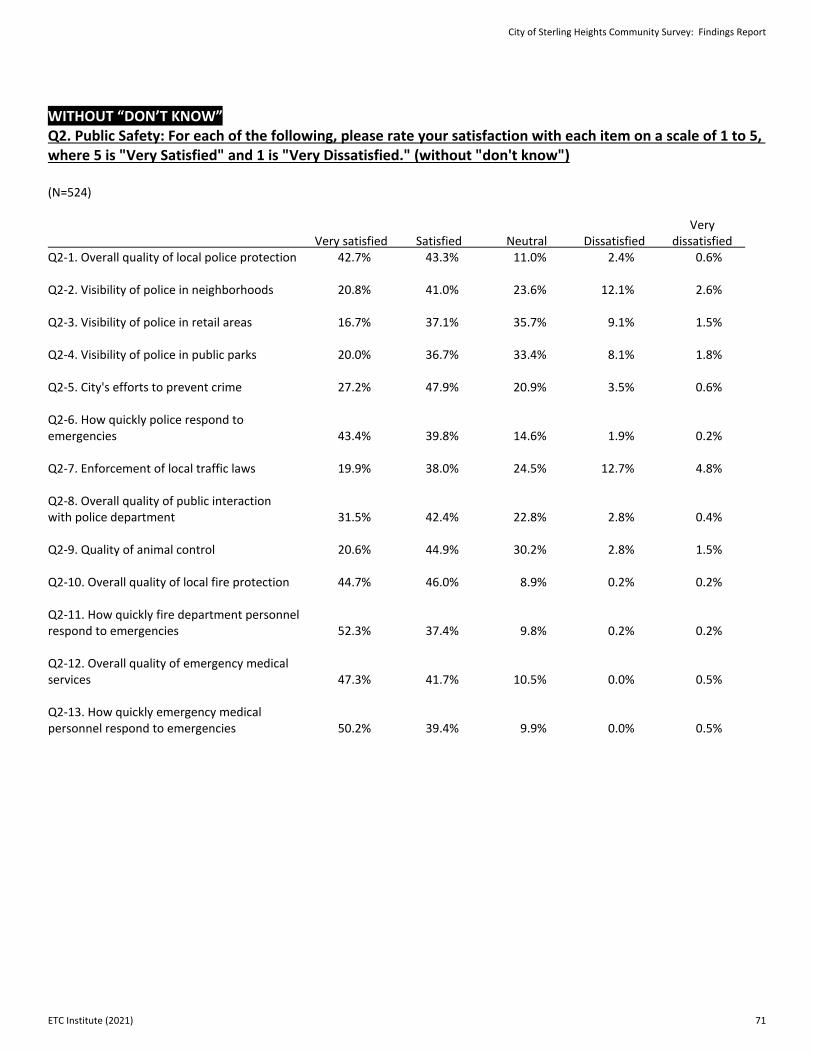
WITHOUT “DON’T KNOW” Q2. Public Safety: For each of the following, please rate your satisfaction with each item on a scale of 1 to 5, where 5 is "Very Satisfied" and 1 is "Very Dissatisfied." (without "don't know") (N=524) Very Very satisfied Satisfied Neutral Dissatisfied dissatisfied Q2-1. Overall quality of local police protection 42.7% 43.3% 11.0% 2.4% 0.6% Q2-2. Visibility of police in neighborhoods 20.8% 41.0% 23.6% 12.1% 2.6% Q2-3. Visibility of police in retail areas 16.7% 37.1% 35.7% 9.1% 1.5% Q2-4. Visibility of police in public parks 20.0% 36.7% 33.4% 8.1% 1.8% Q2-5. City's efforts to prevent crime 27.2% 47.9% 20.9% 3.5% 0.6% Q2-6. How quickly police respond to emergencies 43.4% 39.8% 14.6% 1.9% 0.2% Q2-7. Enforcement of local traffic laws 19.9% 38.0% 24.5% 12.7% 4.8% Q2-8. Overall quality of public interaction with police department 31.5% 42.4% 22.8% 2.8% 0.4% Q2-9. Quality of animal control 20.6% 44.9% 30.2% 2.8% 1.5% Q2-10. Overall quality of local fire protection 44.7% 46.0% 8.9% 0.2% 0.2% Q2-11. How quickly fire department personnel respond to emergencies 52.3% 37.4% 9.8% 0.2% 0.2% Q2-12. Overall quality of emergency medical services 47.3% 41.7% 10.5% 0.0% 0.5% Q2-13. How quickly emergency medical personnel respond to emergencies 50.2% 39.4% 9.9% 0.0% 0.5%
City of Sterling Heights Community Survey: Findings Report
ETC Institute (2021) 71
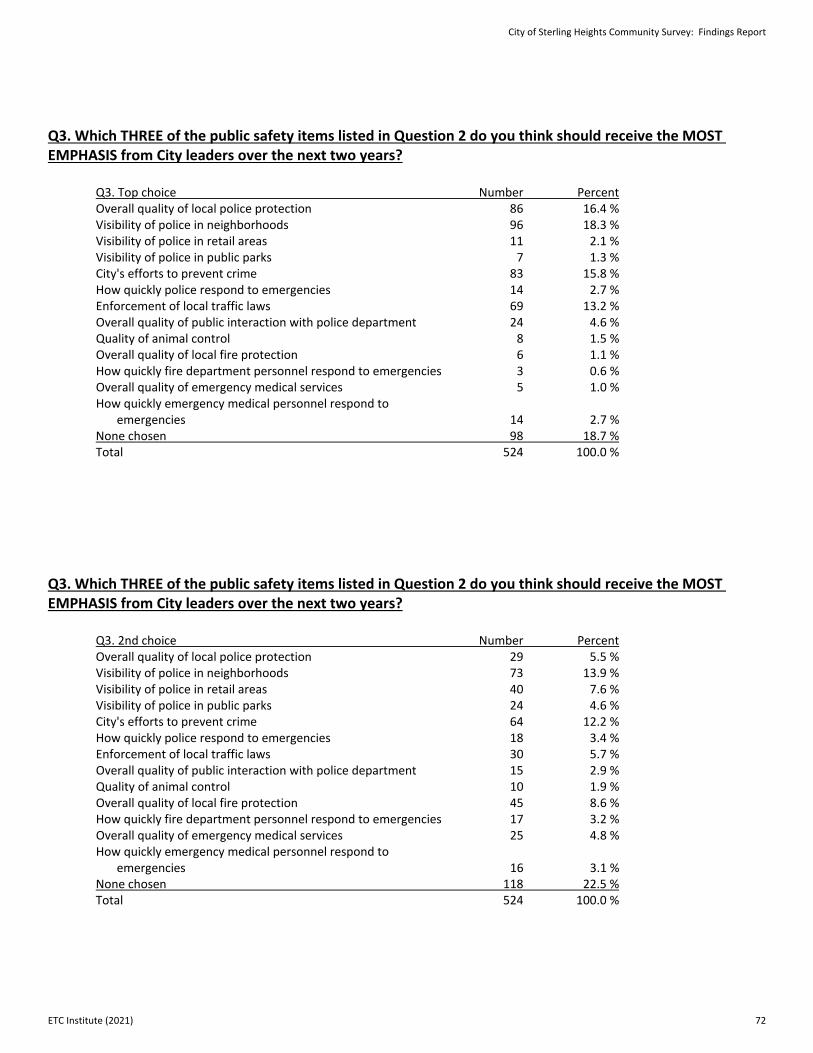
Q3. Which THREE of the public safety items listed in Question 2 do you think should receive the MOST EMPHASIS from City leaders over the next two years? Q3. Top choice Number Percent Overall quality of local police protection 86 16.4 % Visibility of police in neighborhoods 96 18.3 % Visibility of police in retail areas 11 2.1 % Visibility of police in public parks 7 1.3 % City's efforts to prevent crime 83 15.8 % How quickly police respond to emergencies 14 2.7 % Enforcement of local traffic laws 69 13.2 % Overall quality of public interaction with police department 24 4.6 % Quality of animal control 8 1.5 % Overall quality of local fire protection 6 1.1 % How quickly fire department personnel respond to emergencies 3 0.6 % Overall quality of emergency medical services 5 1.0 % How quickly emergency medical personnel respond to emergencies 14 2.7 % None chosen 98 18.7 % Total 524 100.0 % Q3. Which THREE of the public safety items listed in Question 2 do you think should receive the MOST EMPHASIS from City leaders over the next two years? Q3. 2nd choice Number Percent Overall quality of local police protection 29 5.5 % Visibility of police in neighborhoods 73 13.9 % Visibility of police in retail areas 40 7.6 % Visibility of police in public parks 24 4.6 % City's efforts to prevent crime 64 12.2 % How quickly police respond to emergencies 18 3.4 % Enforcement of local traffic laws 30 5.7 % Overall quality of public interaction with police department 15 2.9 % Quality of animal control 10 1.9 % Overall quality of local fire protection 45 8.6 % How quickly fire department personnel respond to emergencies 17 3.2 % Overall quality of emergency medical services 25 4.8 % How quickly emergency medical personnel respond to emergencies 16 3.1 % None chosen 118 22.5 % Total 524 100.0 %
City of Sterling Heights Community Survey: Findings Report
ETC Institute (2021) 72
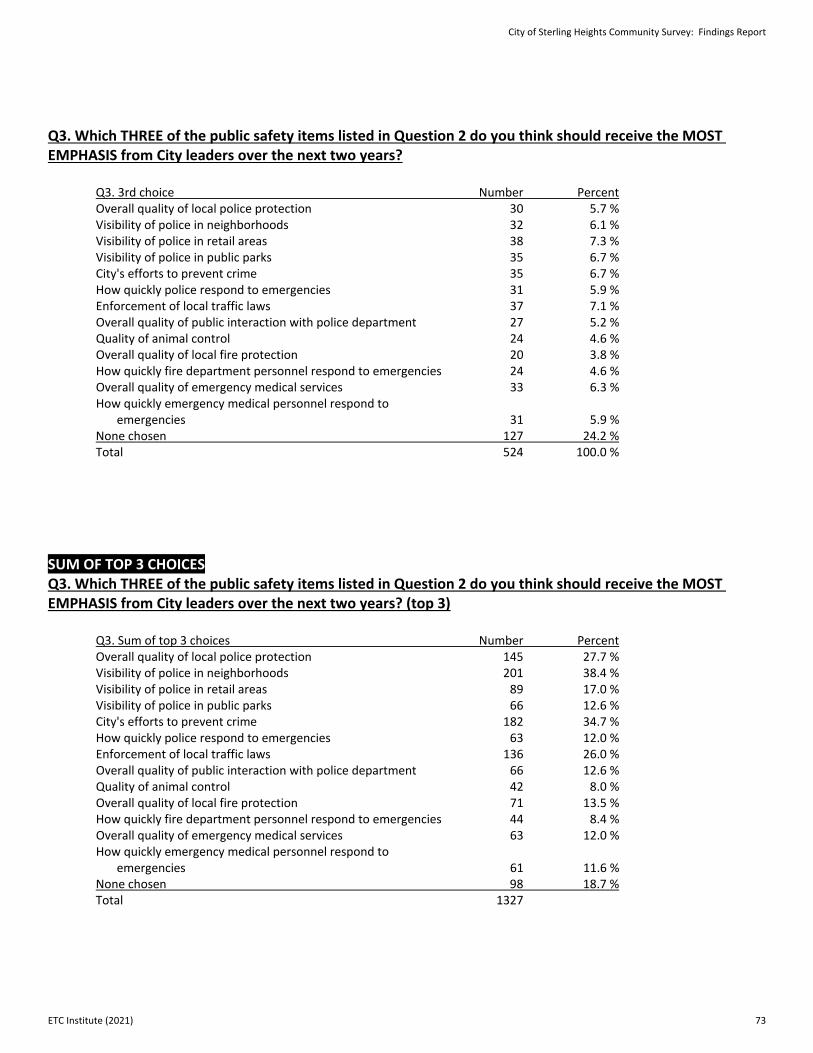
Q3. Which THREE of the public safety items listed in Question 2 do you think should receive the MOST EMPHASIS from City leaders over the next two years? Q3. 3rd choice Number Percent Overall quality of local police protection 30 5.7 % Visibility of police in neighborhoods 32 6.1 % Visibility of police in retail areas 38 7.3 % Visibility of police in public parks 35 6.7 % City's efforts to prevent crime 35 6.7 % How quickly police respond to emergencies 31 5.9 % Enforcement of local traffic laws 37 7.1 % Overall quality of public interaction with police department 27 5.2 % Quality of animal control 24 4.6 % Overall quality of local fire protection 20 3.8 % How quickly fire department personnel respond to emergencies 24 4.6 % Overall quality of emergency medical services 33 6.3 % How quickly emergency medical personnel respond to emergencies 31 5.9 % None chosen 127 24.2 % Total 524 100.0 % SUM OF TOP 3 CHOICES Q3. Which THREE of the public safety items listed in Question 2 do you think should receive the MOST EMPHASIS from City leaders over the next two years? (top 3) Q3. Sum of top 3 choices Number Percent Overall quality of local police protection 145 27.7 % Visibility of police in neighborhoods 201 38.4 % Visibility of police in retail areas 89 17.0 % Visibility of police in public parks 66 12.6 % City's efforts to prevent crime 182 34.7 % How quickly police respond to emergencies 63 12.0 % Enforcement of local traffic laws 136 26.0 % Overall quality of public interaction with police department 66 12.6 % Quality of animal control 42 8.0 % Overall quality of local fire protection 71 13.5 % How quickly fire department personnel respond to emergencies 44 8.4 % Overall quality of emergency medical services 63 12.0 % How quickly emergency medical personnel respond to emergencies 61 11.6 % None chosen 98 18.7 % Total 1327
City of Sterling Heights Community Survey: Findings Report
ETC Institute (2021) 73
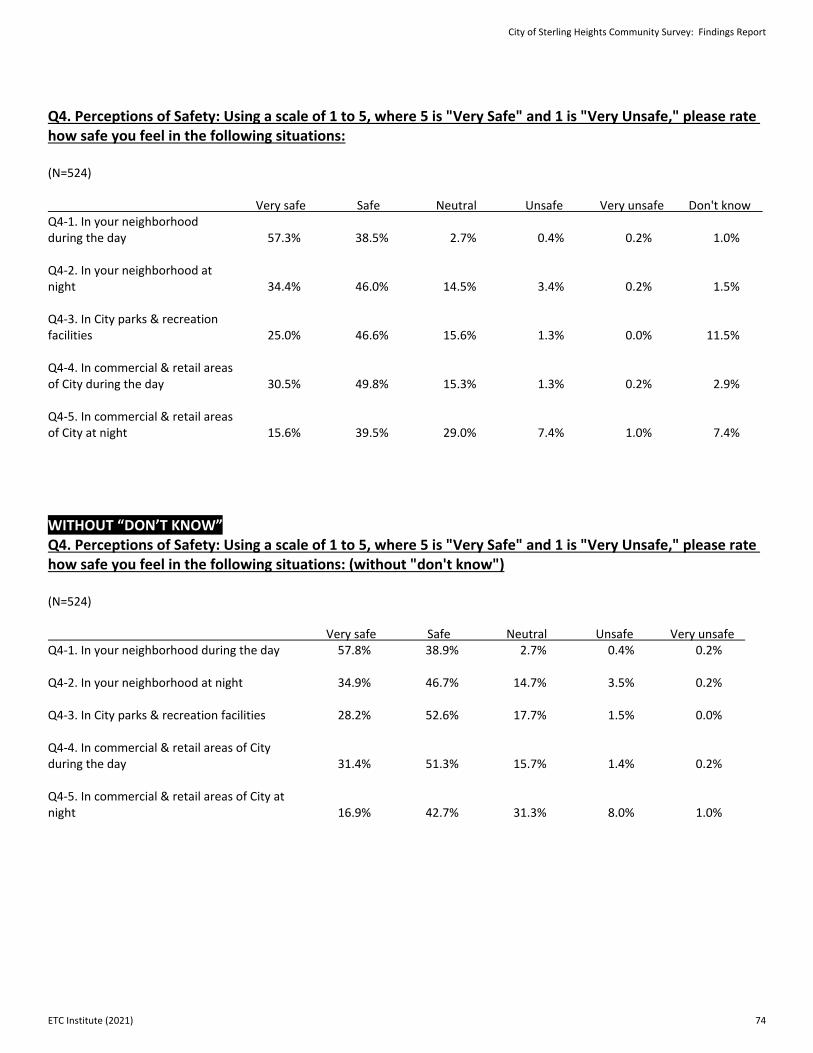
Q4. Perceptions of Safety: Using a scale of 1 to 5, where 5 is "Very Safe" and 1 is "Very Unsafe," please rate how safe you feel in the following situations: (N=524) Very safe Safe Neutral Unsafe Very unsafe Don't know Q4-1. In your neighborhood during the day 57.3% 38.5% 2.7% 0.4% 0.2% 1.0% Q4-2. In your neighborhood at night 34.4% 46.0% 14.5% 3.4% 0.2% 1.5% Q4-3. In City parks & recreation facilities 25.0% 46.6% 15.6% 1.3% 0.0% 11.5% Q4-4. In commercial & retail areas of City during the day 30.5% 49.8% 15.3% 1.3% 0.2% 2.9% Q4-5. In commercial & retail areas of City at night 15.6% 39.5% 29.0% 7.4% 1.0% 7.4%
WITHOUT “DON’T KNOW” Q4. Perceptions of Safety: Using a scale of 1 to 5, where 5 is "Very Safe" and 1 is "Very Unsafe," please rate how safe you feel in the following situations: (without "don't know") (N=524) Very safe Safe Neutral Unsafe Very unsafe Q4-1. In your neighborhood during the day 57.8% 38.9% 2.7% 0.4% 0.2% Q4-2. In your neighborhood at night 34.9% 46.7% 14.7% 3.5% 0.2% Q4-3. In City parks & recreation facilities 28.2% 52.6% 17.7% 1.5% 0.0% Q4-4. In commercial & retail areas of City during the day 31.4% 51.3% 15.7% 1.4% 0.2% Q4-5. In commercial & retail areas of City at night 16.9% 42.7% 31.3% 8.0% 1.0%
City of Sterling Heights Community Survey: Findings Report
ETC Institute (2021) 74
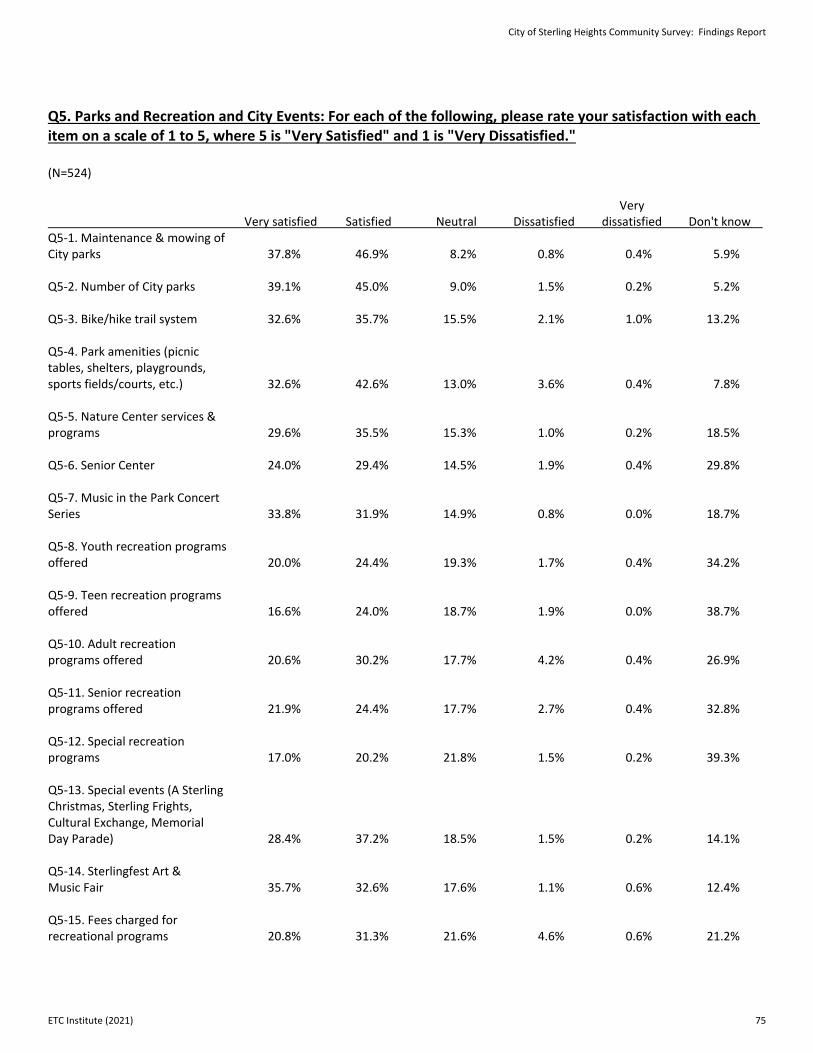
Q5. Parks and Recreation and City Events: For each of the following, please rate your satisfaction with each item on a scale of 1 to 5, where 5 is "Very Satisfied" and 1 is "Very Dissatisfied." (N=524) Very Very satisfied Satisfied Neutral Dissatisfied dissatisfied Don't know Q5-1. Maintenance & mowing of City parks 37.8% 46.9% 8.2% 0.8% 0.4% 5.9% Q5-2. Number of City parks 39.1% 45.0% 9.0% 1.5% 0.2% 5.2% Q5-3. Bike/hike trail system 32.6% 35.7% 15.5% 2.1% 1.0% 13.2% Q5-4. Park amenities (picnic tables, shelters, playgrounds, sports fields/courts, etc.) 32.6% 42.6% 13.0% 3.6% 0.4% 7.8% Q5-5. Nature Center services & programs 29.6% 35.5% 15.3% 1.0% 0.2% 18.5% Q5-6. Senior Center 24.0% 29.4% 14.5% 1.9% 0.4% 29.8% Q5-7. Music in the Park Concert Series 33.8% 31.9% 14.9% 0.8% 0.0% 18.7% Q5-8. Youth recreation programs offered 20.0% 24.4% 19.3% 1.7% 0.4% 34.2% Q5-9. Teen recreation programs offered 16.6% 24.0% 18.7% 1.9% 0.0% 38.7% Q5-10. Adult recreation programs offered 20.6% 30.2% 17.7% 4.2% 0.4% 26.9% Q5-11. Senior recreation programs offered 21.9% 24.4% 17.7% 2.7% 0.4% 32.8% Q5-12. Special recreation programs 17.0% 20.2% 21.8% 1.5% 0.2% 39.3% Q5-13. Special events (A Sterling Christmas, Sterling Frights, Cultural Exchange, Memorial Day Parade) 28.4% 37.2% 18.5% 1.5% 0.2% 14.1% Q5-14. Sterlingfest Art & Music Fair 35.7% 32.6% 17.6% 1.1% 0.6% 12.4% Q5-15. Fees charged for recreational programs 20.8% 31.3% 21.6% 4.6% 0.6% 21.2%
City of Sterling Heights Community Survey: Findings Report
ETC Institute (2021) 75
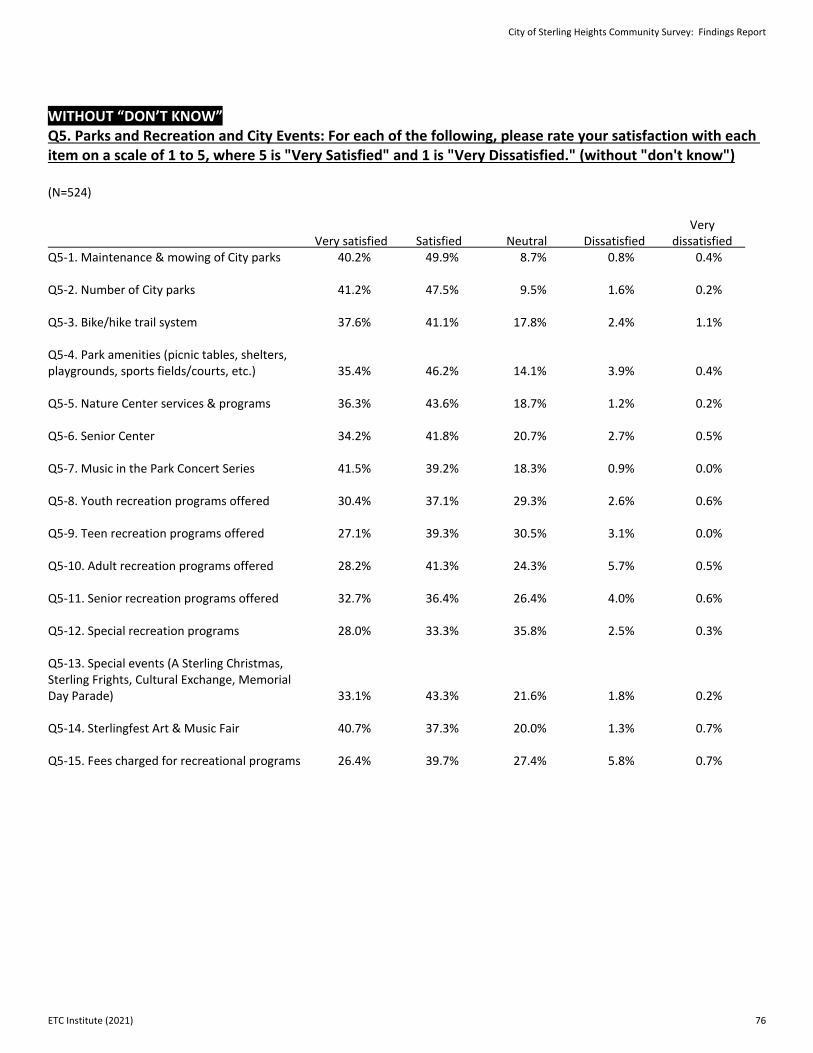
WITHOUT “DON’T KNOW” Q5. Parks and Recreation and City Events: For each of the following, please rate your satisfaction with each item on a scale of 1 to 5, where 5 is "Very Satisfied" and 1 is "Very Dissatisfied." (without "don't know") (N=524) Very Very satisfied Satisfied Neutral Dissatisfied dissatisfied Q5-1. Maintenance & mowing of City parks 40.2% 49.9% 8.7% 0.8% 0.4% Q5-2. Number of City parks 41.2% 47.5% 9.5% 1.6% 0.2% Q5-3. Bike/hike trail system 37.6% 41.1% 17.8% 2.4% 1.1% Q5-4. Park amenities (picnic tables, shelters, playgrounds, sports fields/courts, etc.) 35.4% 46.2% 14.1% 3.9% 0.4% Q5-5. Nature Center services & programs 36.3% 43.6% 18.7% 1.2% 0.2% Q5-6. Senior Center 34.2% 41.8% 20.7% 2.7% 0.5% Q5-7. Music in the Park Concert Series 41.5% 39.2% 18.3% 0.9% 0.0% Q5-8. Youth recreation programs offered 30.4% 37.1% 29.3% 2.6% 0.6% Q5-9. Teen recreation programs offered 27.1% 39.3% 30.5% 3.1% 0.0% Q5-10. Adult recreation programs offered 28.2% 41.3% 24.3% 5.7% 0.5% Q5-11. Senior recreation programs offered 32.7% 36.4% 26.4% 4.0% 0.6% Q5-12. Special recreation programs 28.0% 33.3% 35.8% 2.5% 0.3% Q5-13. Special events (A Sterling Christmas, Sterling Frights, Cultural Exchange, Memorial Day Parade) 33.1% 43.3% 21.6% 1.8% 0.2% Q5-14. Sterlingfest Art & Music Fair 40.7% 37.3% 20.0% 1.3% 0.7% Q5-15. Fees charged for recreational programs 26.4% 39.7% 27.4% 5.8% 0.7%
City of Sterling Heights Community Survey: Findings Report
ETC Institute (2021) 76
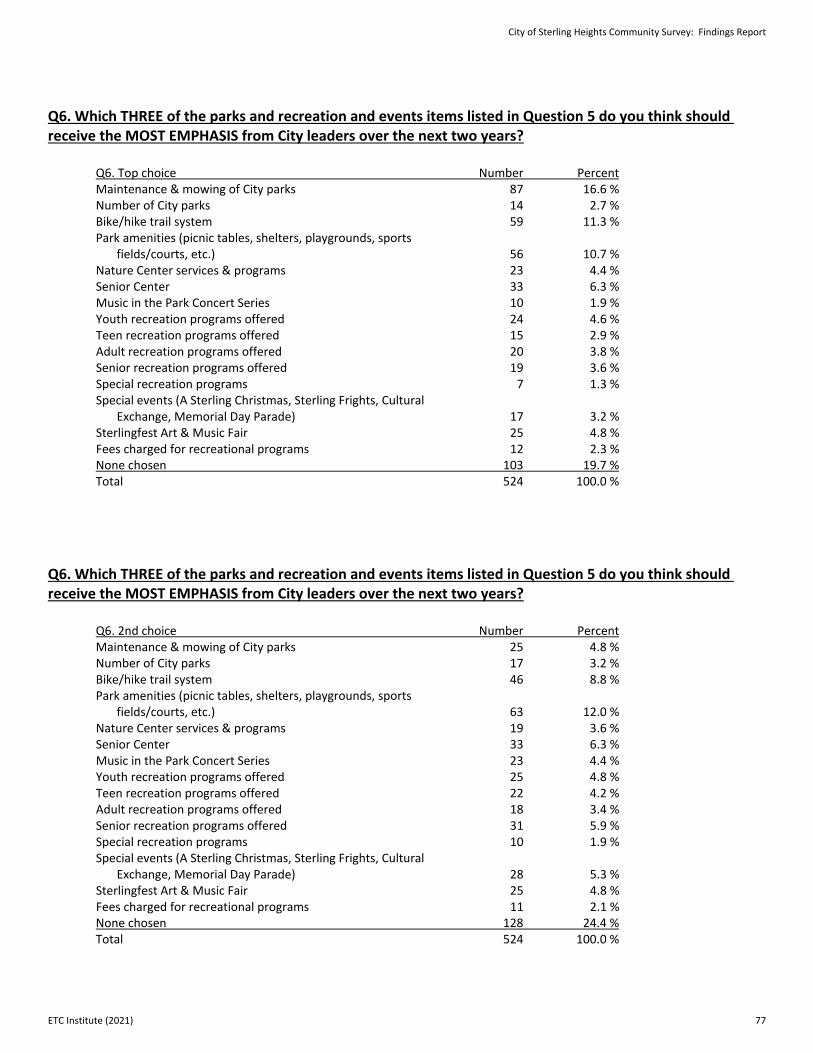
Q6. Which THREE of the parks and recreation and events items listed in Question 5 do you think should receive the MOST EMPHASIS from City leaders over the next two years? Q6. Top choice Number Percent Maintenance & mowing of City parks 87 16.6 % Number of City parks 14 2.7 % Bike/hike trail system 59 11.3 % Park amenities (picnic tables, shelters, playgrounds, sports fields/courts, etc.) 56 10.7 % Nature Center services & programs 23 4.4 % Senior Center 33 6.3 % Music in the Park Concert Series 10 1.9 % Youth recreation programs offered 24 4.6 % Teen recreation programs offered 15 2.9 % Adult recreation programs offered 20 3.8 % Senior recreation programs offered 19 3.6 % Special recreation programs 7 1.3 % Special events (A Sterling Christmas, Sterling Frights, Cultural Exchange, Memorial Day Parade) 17 3.2 % Sterlingfest Art & Music Fair 25 4.8 % Fees charged for recreational programs 12 2.3 % None chosen 103 19.7 % Total 524 100.0 % Q6. Which THREE of the parks and recreation and events items listed in Question 5 do you think should receive the MOST EMPHASIS from City leaders over the next two years? Q6. 2nd choice Number Percent Maintenance & mowing of City parks 25 4.8 % Number of City parks 17 3.2 % Bike/hike trail system 46 8.8 % Park amenities (picnic tables, shelters, playgrounds, sports fields/courts, etc.) 63 12.0 % Nature Center services & programs 19 3.6 % Senior Center 33 6.3 % Music in the Park Concert Series 23 4.4 % Youth recreation programs offered 25 4.8 % Teen recreation programs offered 22 4.2 % Adult recreation programs offered 18 3.4 % Senior recreation programs offered 31 5.9 % Special recreation programs 10 1.9 % Special events (A Sterling Christmas, Sterling Frights, Cultural Exchange, Memorial Day Parade) 28 5.3 % Sterlingfest Art & Music Fair 25 4.8 % Fees charged for recreational programs 11 2.1 % None chosen 128 24.4 % Total 524 100.0 %
City of Sterling Heights Community Survey: Findings Report
ETC Institute (2021) 77
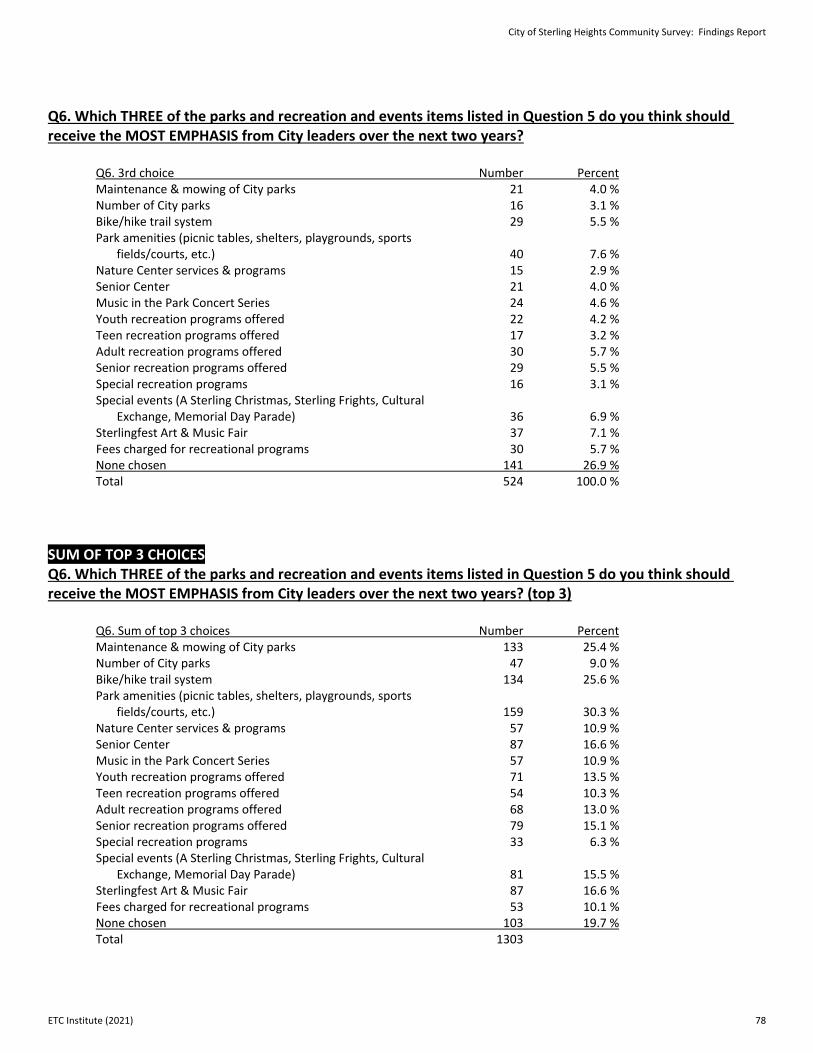
Q6. Which THREE of the parks and recreation and events items listed in Question 5 do you think should receive the MOST EMPHASIS from City leaders over the next two years? Q6. 3rd choice Number Percent Maintenance & mowing of City parks 21 4.0 % Number of City parks 16 3.1 % Bike/hike trail system 29 5.5 % Park amenities (picnic tables, shelters, playgrounds, sports fields/courts, etc.) 40 7.6 % Nature Center services & programs 15 2.9 % Senior Center 21 4.0 % Music in the Park Concert Series 24 4.6 % Youth recreation programs offered 22 4.2 % Teen recreation programs offered 17 3.2 % Adult recreation programs offered 30 5.7 % Senior recreation programs offered 29 5.5 % Special recreation programs 16 3.1 % Special events (A Sterling Christmas, Sterling Frights, Cultural Exchange, Memorial Day Parade) 36 6.9 % Sterlingfest Art & Music Fair 37 7.1 % Fees charged for recreational programs 30 5.7 % None chosen 141 26.9 % Total 524 100.0 % SUM OF TOP 3 CHOICES Q6. Which THREE of the parks and recreation and events items listed in Question 5 do you think should receive the MOST EMPHASIS from City leaders over the next two years? (top 3) Q6. Sum of top 3 choices Number Percent Maintenance & mowing of City parks 133 25.4 % Number of City parks 47 9.0 % Bike/hike trail system 134 25.6 % Park amenities (picnic tables, shelters, playgrounds, sports fields/courts, etc.) 159 30.3 % Nature Center services & programs 57 10.9 % Senior Center 87 16.6 % Music in the Park Concert Series 57 10.9 % Youth recreation programs offered 71 13.5 % Teen recreation programs offered 54 10.3 % Adult recreation programs offered 68 13.0 % Senior recreation programs offered 79 15.1 % Special recreation programs 33 6.3 % Special events (A Sterling Christmas, Sterling Frights, Cultural Exchange, Memorial Day Parade) 81 15.5 % Sterlingfest Art & Music Fair 87 16.6 % Fees charged for recreational programs 53 10.1 % None chosen 103 19.7 % Total 1303
City of Sterling Heights Community Survey: Findings Report
ETC Institute (2021) 78
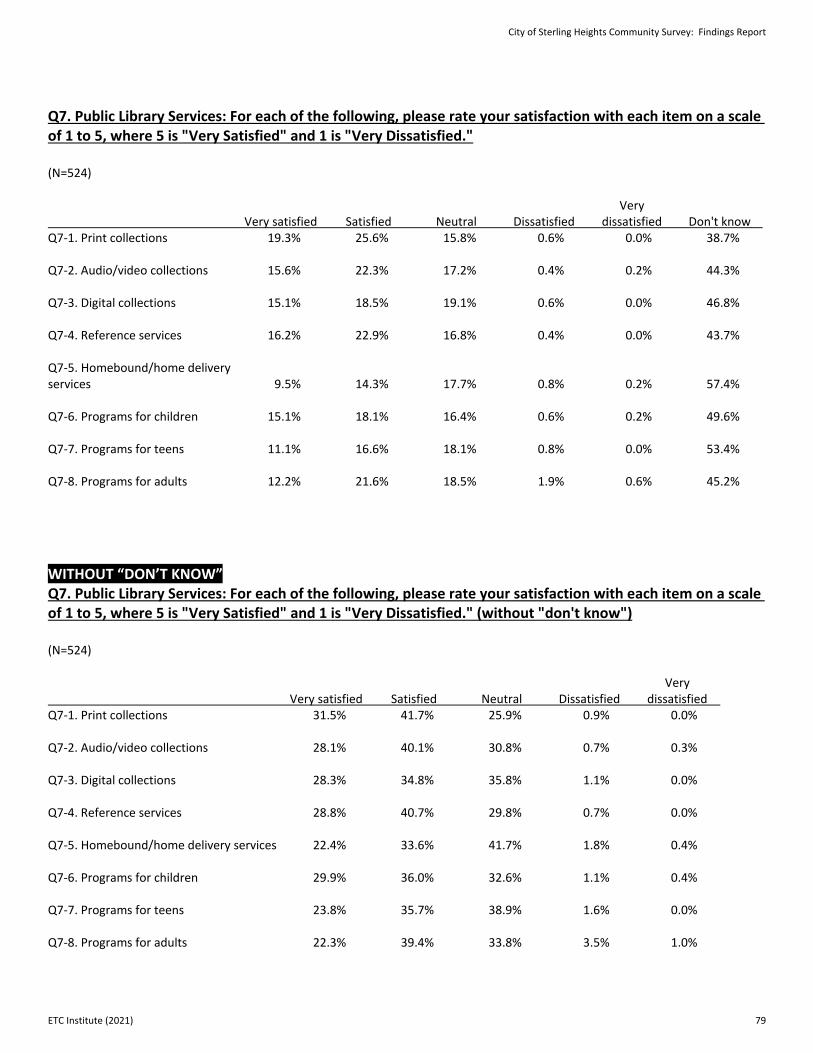
Q7. Public Library Services: For each of the following, please rate your satisfaction with each item on a scale of 1 to 5, where 5 is "Very Satisfied" and 1 is "Very Dissatisfied." (N=524) Very Very satisfied Satisfied Neutral Dissatisfied dissatisfied Don't know Q7-1. Print collections 19.3% 25.6% 15.8% 0.6% 0.0% 38.7% Q7-2. Audio/video collections 15.6% 22.3% 17.2% 0.4% 0.2% 44.3% Q7-3. Digital collections 15.1% 18.5% 19.1% 0.6% 0.0% 46.8% Q7-4. Reference services 16.2% 22.9% 16.8% 0.4% 0.0% 43.7% Q7-5. Homebound/home delivery services 9.5% 14.3% 17.7% 0.8% 0.2% 57.4% Q7-6. Programs for children 15.1% 18.1% 16.4% 0.6% 0.2% 49.6% Q7-7. Programs for teens 11.1% 16.6% 18.1% 0.8% 0.0% 53.4% Q7-8. Programs for adults 12.2% 21.6% 18.5% 1.9% 0.6% 45.2%
WITHOUT “DON’T KNOW” Q7. Public Library Services: For each of the following, please rate your satisfaction with each item on a scale of 1 to 5, where 5 is "Very Satisfied" and 1 is "Very Dissatisfied." (without "don't know") (N=524) Very Very satisfied Satisfied Neutral Dissatisfied dissatisfied Q7-1. Print collections 31.5% 41.7% 25.9% 0.9% 0.0% Q7-2. Audio/video collections 28.1% 40.1% 30.8% 0.7% 0.3% Q7-3. Digital collections 28.3% 34.8% 35.8% 1.1% 0.0% Q7-4. Reference services 28.8% 40.7% 29.8% 0.7% 0.0% Q7-5. Homebound/home delivery services 22.4% 33.6% 41.7% 1.8% 0.4% Q7-6. Programs for children 29.9% 36.0% 32.6% 1.1% 0.4% Q7-7. Programs for teens 23.8% 35.7% 38.9% 1.6% 0.0% Q7-8. Programs for adults 22.3% 39.4% 33.8% 3.5% 1.0%
City of Sterling Heights Community Survey: Findings Report
ETC Institute (2021) 79
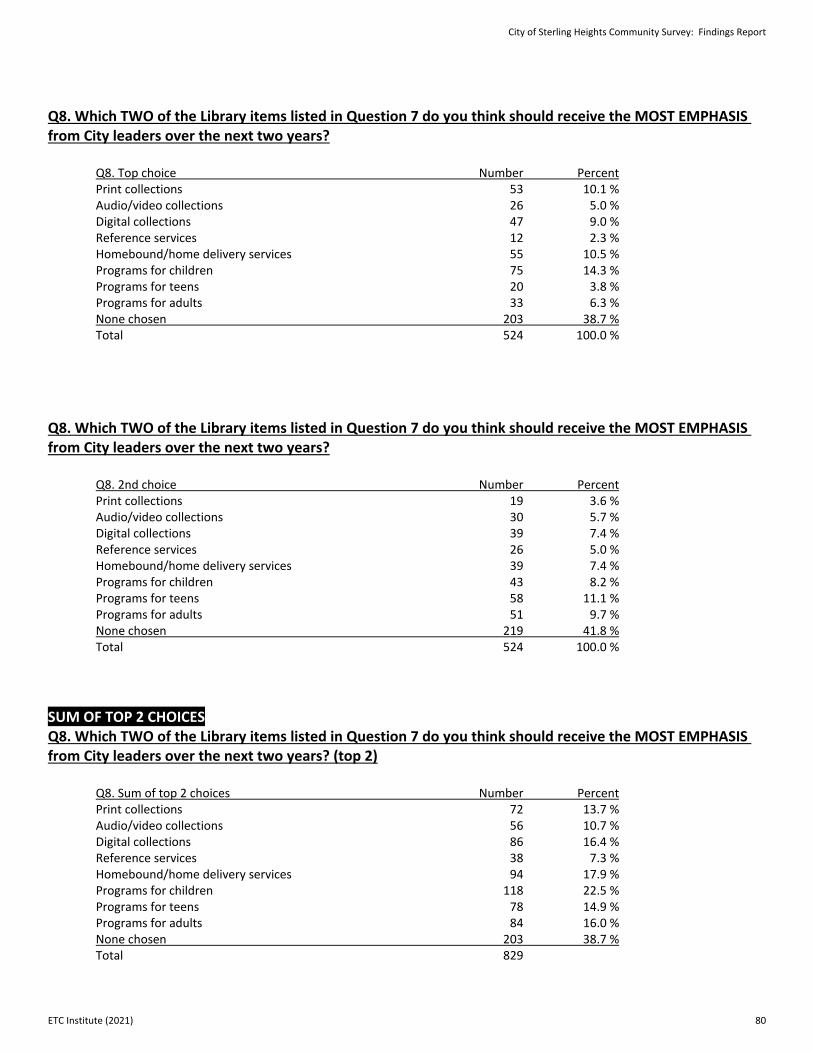
Q8. Which TWO of the Library items listed in Question 7 do you think should receive the MOST EMPHASIS from City leaders over the next two years? Q8. Top choice Number Percent Print collections 53 10.1 % Audio/video collections 26 5.0 % Digital collections 47 9.0 % Reference services 12 2.3 % Homebound/home delivery services 55 10.5 % Programs for children 75 14.3 % Programs for teens 20 3.8 % Programs for adults 33 6.3 % None chosen 203 38.7 % Total 524 100.0 % Q8. Which TWO of the Library items listed in Question 7 do you think should receive the MOST EMPHASIS from City leaders over the next two years? Q8. 2nd choice Number Percent Print collections 19 3.6 % Audio/video collections 30 5.7 % Digital collections 39 7.4 % Reference services 26 5.0 % Homebound/home delivery services 39 7.4 % Programs for children 43 8.2 % Programs for teens 58 11.1 % Programs for adults 51 9.7 % None chosen 219 41.8 % Total 524 100.0 % SUM OF TOP 2 CHOICES Q8. Which TWO of the Library items listed in Question 7 do you think should receive the MOST EMPHASIS from City leaders over the next two years? (top 2) Q8. Sum of top 2 choices Number Percent Print collections 72 13.7 % Audio/video collections 56 10.7 % Digital collections 86 16.4 % Reference services 38 7.3 % Homebound/home delivery services 94 17.9 % Programs for children 118 22.5 % Programs for teens 78 14.9 % Programs for adults 84 16.0 % None chosen 203 38.7 % Total 829
City of Sterling Heights Community Survey: Findings Report
ETC Institute (2021) 80
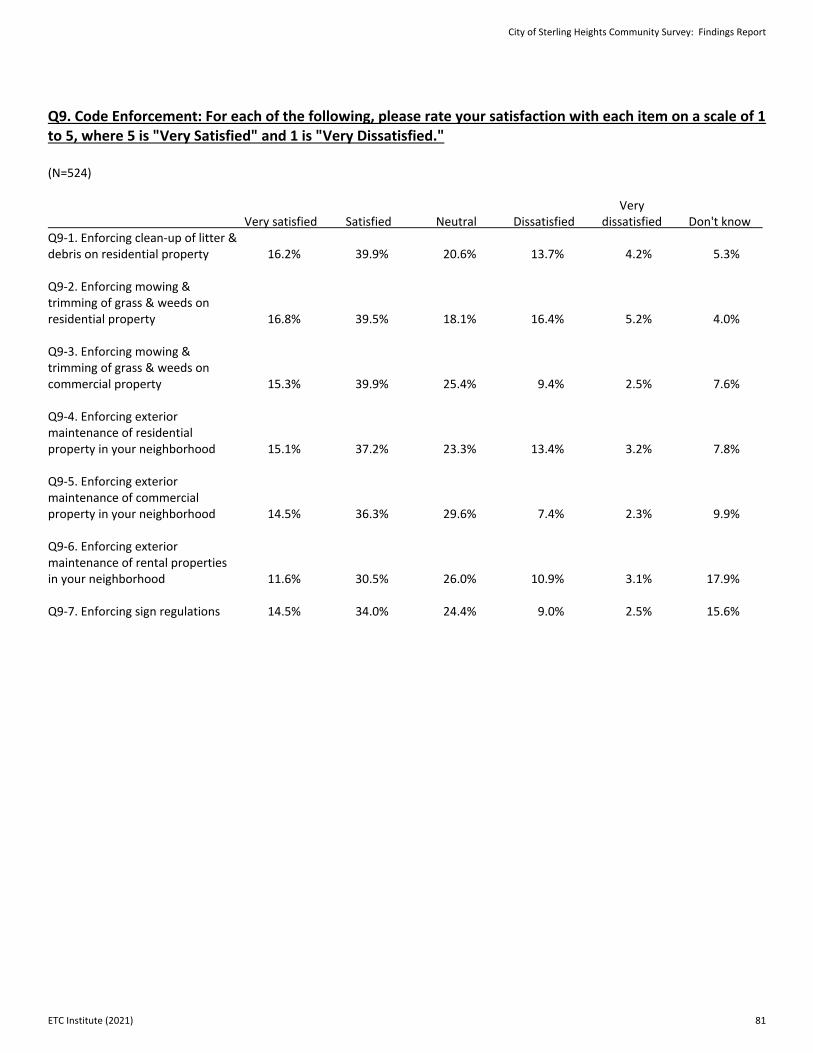
Q9. Code Enforcement: For each of the following, please rate your satisfaction with each item on a scale of 1 to 5, where 5 is "Very Satisfied" and 1 is "Very Dissatisfied." (N=524) Very Very satisfied Satisfied Neutral Dissatisfied dissatisfied Don't know Q9-1. Enforcing clean-up of litter & debris on residential property 16.2% 39.9% 20.6% 13.7% 4.2% 5.3% Q9-2. Enforcing mowing & trimming of grass & weeds on residential property 16.8% 39.5% 18.1% 16.4% 5.2% 4.0% Q9-3. Enforcing mowing & trimming of grass & weeds on commercial property 15.3% 39.9% 25.4% 9.4% 2.5% 7.6% Q9-4. Enforcing exterior maintenance of residential property in your neighborhood 15.1% 37.2% 23.3% 13.4% 3.2% 7.8% Q9-5. Enforcing exterior maintenance of commercial property in your neighborhood 14.5% 36.3% 29.6% 7.4% 2.3% 9.9% Q9-6. Enforcing exterior maintenance of rental properties in your neighborhood 11.6% 30.5% 26.0% 10.9% 3.1% 17.9% Q9-7. Enforcing sign regulations 14.5% 34.0% 24.4% 9.0% 2.5% 15.6%
City of Sterling Heights Community Survey: Findings Report
ETC Institute (2021) 81
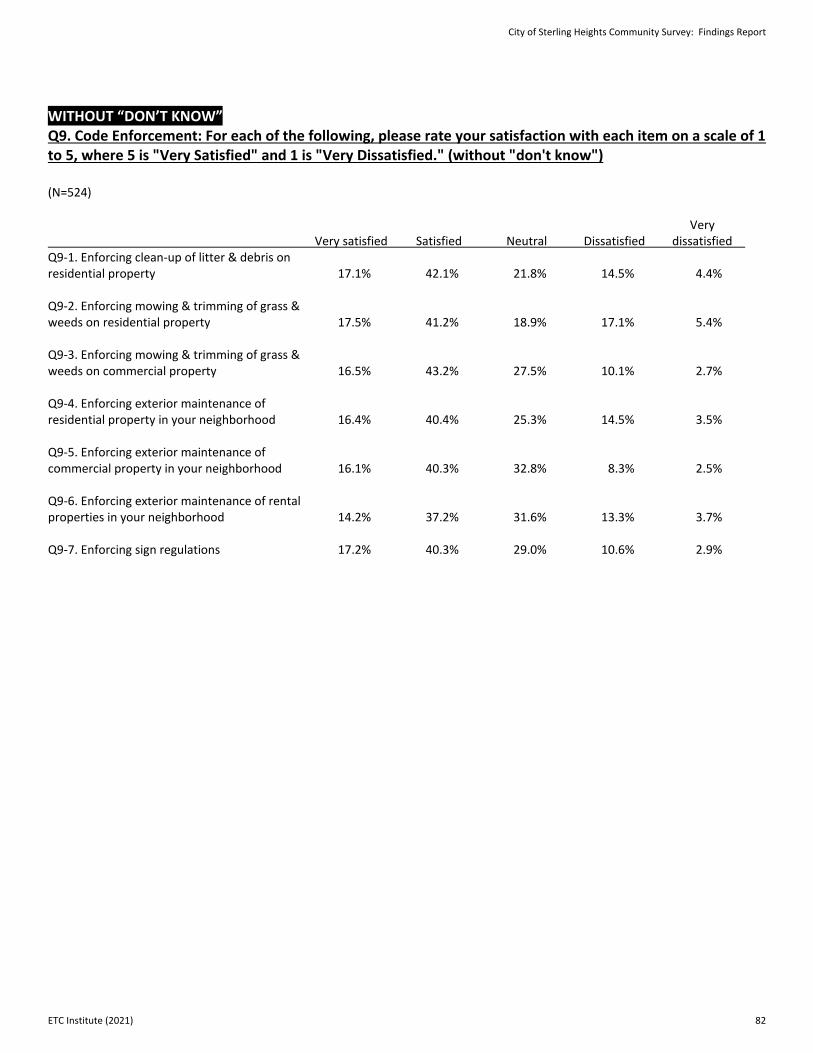
WITHOUT “DON’T KNOW” Q9. Code Enforcement: For each of the following, please rate your satisfaction with each item on a scale of 1 to 5, where 5 is "Very Satisfied" and 1 is "Very Dissatisfied." (without "don't know") (N=524) Very Very satisfied Satisfied Neutral Dissatisfied dissatisfied Q9-1. Enforcing clean-up of litter & debris on residential property 17.1% 42.1% 21.8% 14.5% 4.4% Q9-2. Enforcing mowing & trimming of grass & weeds on residential property 17.5% 41.2% 18.9% 17.1% 5.4% Q9-3. Enforcing mowing & trimming of grass & weeds on commercial property 16.5% 43.2% 27.5% 10.1% 2.7% Q9-4. Enforcing exterior maintenance of residential property in your neighborhood 16.4% 40.4% 25.3% 14.5% 3.5% Q9-5. Enforcing exterior maintenance of commercial property in your neighborhood 16.1% 40.3% 32.8% 8.3% 2.5% Q9-6. Enforcing exterior maintenance of rental properties in your neighborhood 14.2% 37.2% 31.6% 13.3% 3.7% Q9-7. Enforcing sign regulations 17.2% 40.3% 29.0% 10.6% 2.9%
City of Sterling Heights Community Survey: Findings Report
ETC Institute (2021) 82
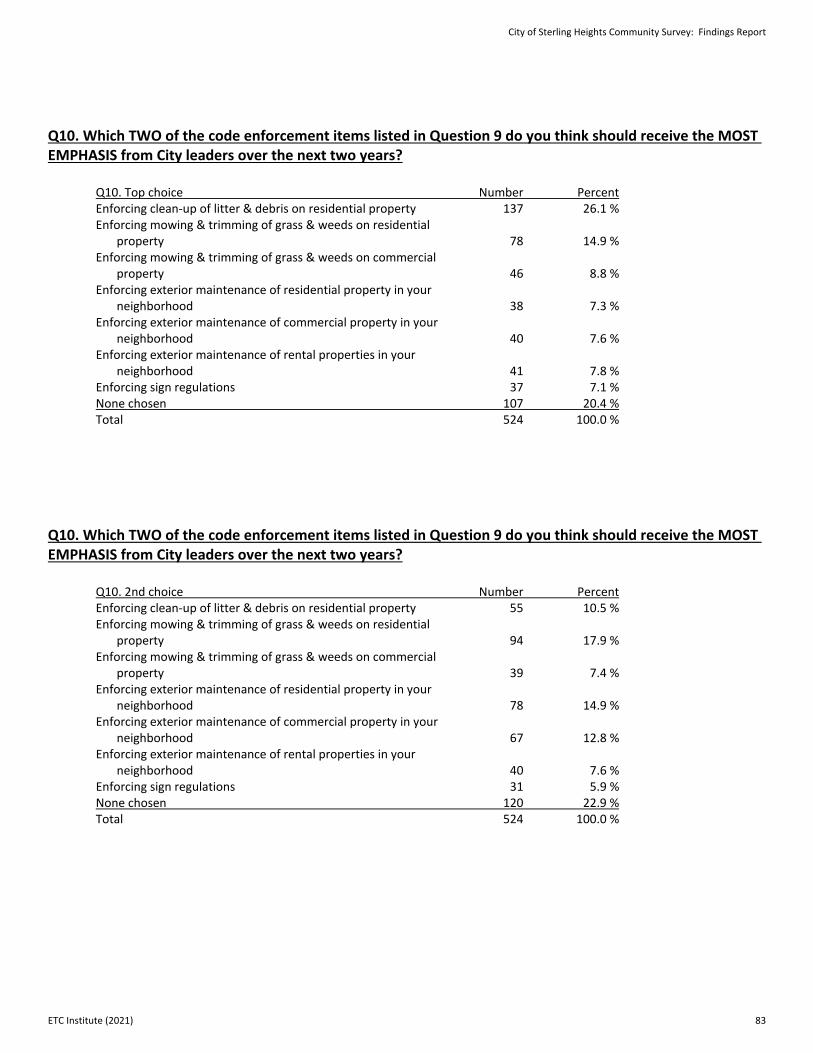
Q10. Which TWO of the code enforcement items listed in Question 9 do you think should receive the MOST EMPHASIS from City leaders over the next two years? Q10. Top choice Number Percent Enforcing clean-up of litter & debris on residential property 137 26.1 % Enforcing mowing & trimming of grass & weeds on residential property 78 14.9 % Enforcing mowing & trimming of grass & weeds on commercial property 46 8.8 % Enforcing exterior maintenance of residential property in your neighborhood 38 7.3 % Enforcing exterior maintenance of commercial property in your neighborhood 40 7.6 % Enforcing exterior maintenance of rental properties in your neighborhood 41 7.8 % Enforcing sign regulations 37 7.1 % None chosen 107 20.4 % Total 524 100.0 %
Q10. Which TWO of the code enforcement items listed in Question 9 do you think should receive the MOST EMPHASIS from City leaders over the next two years? Q10. 2nd choice Number Percent Enforcing clean-up of litter & debris on residential property 55 10.5 % Enforcing mowing & trimming of grass & weeds on residential property 94 17.9 % Enforcing mowing & trimming of grass & weeds on commercial property 39 7.4 % Enforcing exterior maintenance of residential property in your neighborhood 78 14.9 % Enforcing exterior maintenance of commercial property in your neighborhood 67 12.8 % Enforcing exterior maintenance of rental properties in your neighborhood 40 7.6 % Enforcing sign regulations 31 5.9 % None chosen 120 22.9 % Total 524 100.0 %
City of Sterling Heights Community Survey: Findings Report
ETC Institute (2021) 83
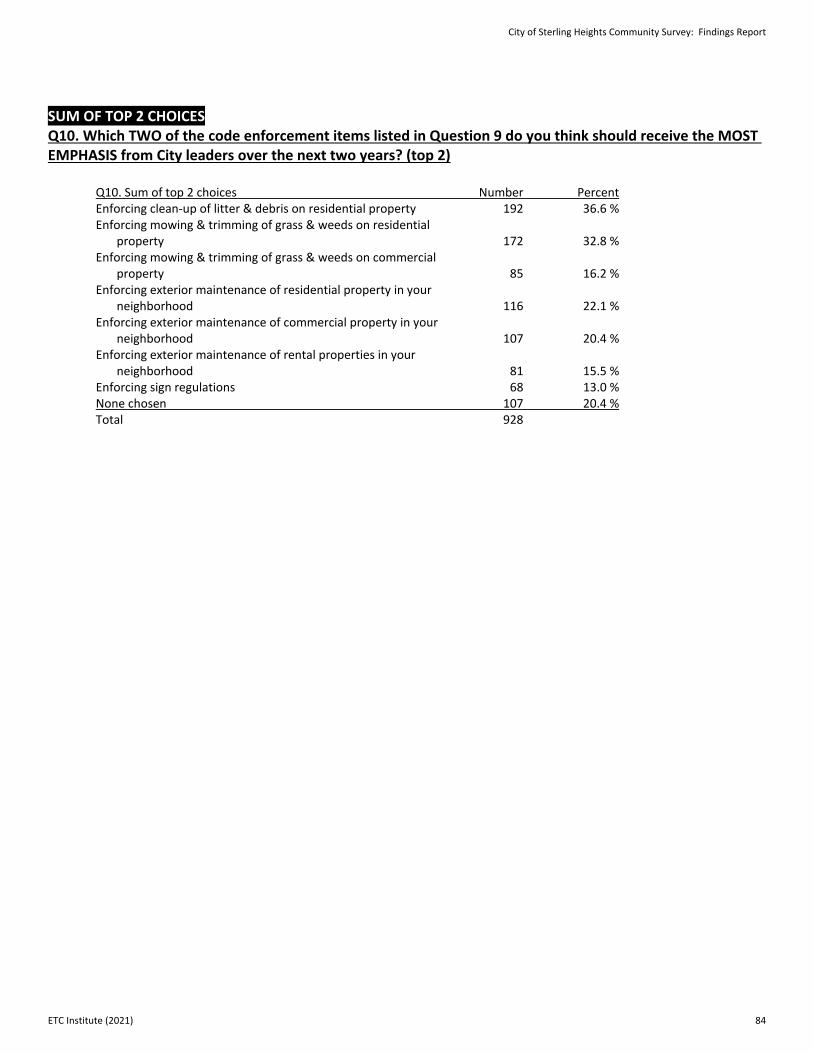
SUM OF TOP 2 CHOICES Q10. Which TWO of the code enforcement items listed in Question 9 do you think should receive the MOST EMPHASIS from City leaders over the next two years? (top 2) Q10. Sum of top 2 choices Number Percent Enforcing clean-up of litter & debris on residential property 192 36.6 % Enforcing mowing & trimming of grass & weeds on residential property 172 32.8 % Enforcing mowing & trimming of grass & weeds on commercial property 85 16.2 % Enforcing exterior maintenance of residential property in your neighborhood 116 22.1 % Enforcing exterior maintenance of commercial property in your neighborhood 107 20.4 % Enforcing exterior maintenance of rental properties in your neighborhood 81 15.5 % Enforcing sign regulations 68 13.0 % None chosen 107 20.4 % Total 928
City of Sterling Heights Community Survey: Findings Report
ETC Institute (2021) 84
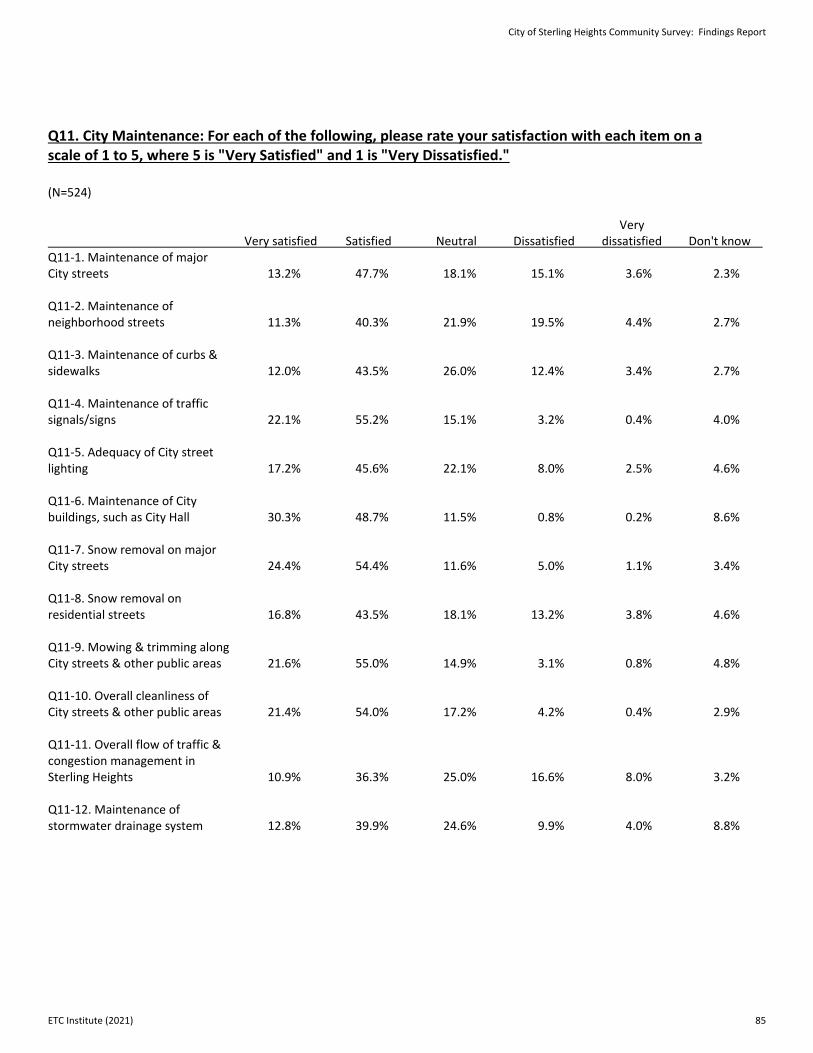
Q11. City Maintenance: For each of the following, please rate your satisfaction with each item on a scale of 1 to 5, where 5 is "Very Satisfied" and 1 is "Very Dissatisfied." (N=524) Very Very satisfied Satisfied Neutral Dissatisfied dissatisfied Don't know Q11-1. Maintenance of major City streets 13.2% 47.7% 18.1% 15.1% 3.6% 2.3% Q11-2. Maintenance of neighborhood streets 11.3% 40.3% 21.9% 19.5% 4.4% 2.7% Q11-3. Maintenance of curbs & sidewalks 12.0% 43.5% 26.0% 12.4% 3.4% 2.7% Q11-4. Maintenance of traffic signals/signs 22.1% 55.2% 15.1% 3.2% 0.4% 4.0% Q11-5. Adequacy of City street lighting 17.2% 45.6% 22.1% 8.0% 2.5% 4.6% Q11-6. Maintenance of City buildings, such as City Hall 30.3% 48.7% 11.5% 0.8% 0.2% 8.6% Q11-7. Snow removal on major City streets 24.4% 54.4% 11.6% 5.0% 1.1% 3.4% Q11-8. Snow removal on residential streets 16.8% 43.5% 18.1% 13.2% 3.8% 4.6% Q11-9. Mowing & trimming along City streets & other public areas 21.6% 55.0% 14.9% 3.1% 0.8% 4.8% Q11-10. Overall cleanliness of City streets & other public areas 21.4% 54.0% 17.2% 4.2% 0.4% 2.9% Q11-11. Overall flow of traffic & congestion management in Sterling Heights 10.9% 36.3% 25.0% 16.6% 8.0% 3.2% Q11-12. Maintenance of stormwater drainage system 12.8% 39.9% 24.6% 9.9% 4.0% 8.8%
City of Sterling Heights Community Survey: Findings Report
ETC Institute (2021) 85
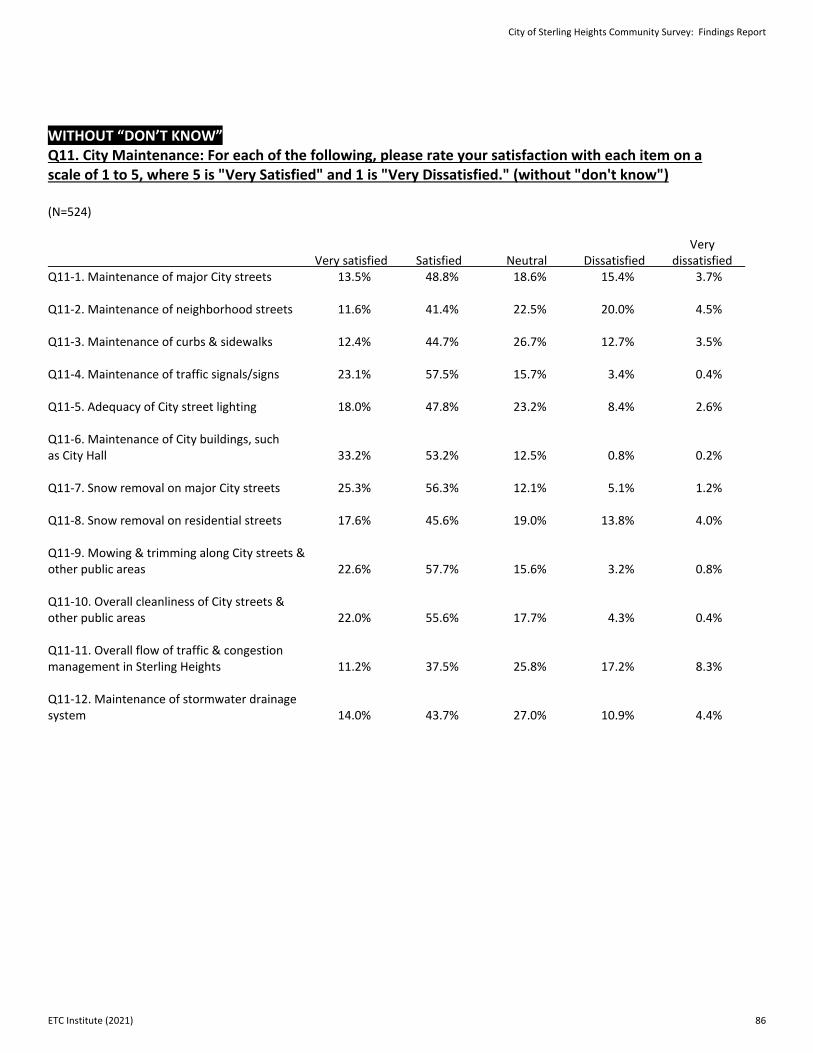
WITHOUT “DON’T KNOW” Q11. City Maintenance: For each of the following, please rate your satisfaction with each item on a scale of 1 to 5, where 5 is "Very Satisfied" and 1 is "Very Dissatisfied." (without "don't know") (N=524) Very Very satisfied Satisfied Neutral Dissatisfied dissatisfied Q11-1. Maintenance of major City streets 13.5% 48.8% 18.6% 15.4% 3.7% Q11-2. Maintenance of neighborhood streets 11.6% 41.4% 22.5% 20.0% 4.5% Q11-3. Maintenance of curbs & sidewalks 12.4% 44.7% 26.7% 12.7% 3.5% Q11-4. Maintenance of traffic signals/signs 23.1% 57.5% 15.7% 3.4% 0.4% Q11-5. Adequacy of City street lighting 18.0% 47.8% 23.2% 8.4% 2.6% Q11-6. Maintenance of City buildings, such as City Hall 33.2% 53.2% 12.5% 0.8% 0.2% Q11-7. Snow removal on major City streets 25.3% 56.3% 12.1% 5.1% 1.2% Q11-8. Snow removal on residential streets 17.6% 45.6% 19.0% 13.8% 4.0% Q11-9. Mowing & trimming along City streets & other public areas 22.6% 57.7% 15.6% 3.2% 0.8% Q11-10. Overall cleanliness of City streets & other public areas 22.0% 55.6% 17.7% 4.3% 0.4% Q11-11. Overall flow of traffic & congestion management in Sterling Heights 11.2% 37.5% 25.8% 17.2% 8.3% Q11-12. Maintenance of stormwater drainage system 14.0% 43.7% 27.0% 10.9% 4.4%
City of Sterling Heights Community Survey: Findings Report
ETC Institute (2021) 86
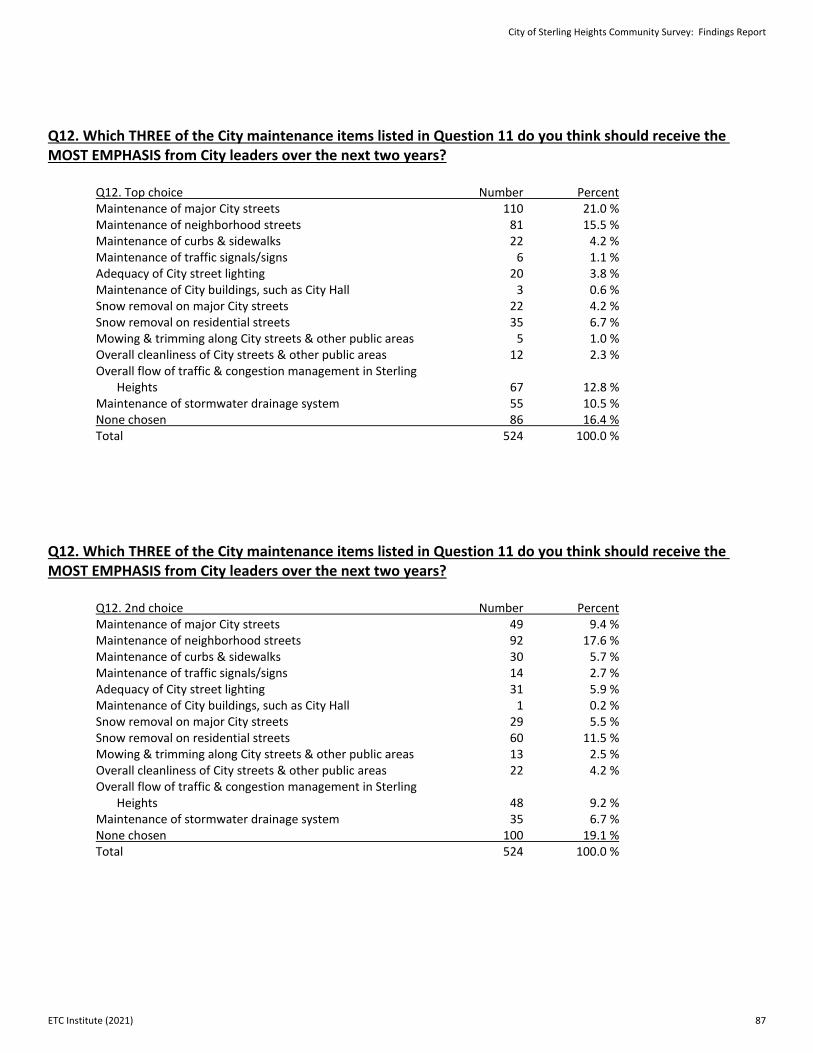
Q12. Which THREE of the City maintenance items listed in Question 11 do you think should receive the MOST EMPHASIS from City leaders over the next two years? Q12. Top choice Number Percent Maintenance of major City streets 110 21.0 % Maintenance of neighborhood streets 81 15.5 % Maintenance of curbs & sidewalks 22 4.2 % Maintenance of traffic signals/signs 6 1.1 % Adequacy of City street lighting 20 3.8 % Maintenance of City buildings, such as City Hall 3 0.6 % Snow removal on major City streets 22 4.2 % Snow removal on residential streets 35 6.7 % Mowing & trimming along City streets & other public areas 5 1.0 % Overall cleanliness of City streets & other public areas 12 2.3 % Overall flow of traffic & congestion management in Sterling Heights 67 12.8 % Maintenance of stormwater drainage system 55 10.5 % None chosen 86 16.4 % Total 524 100.0 %
Q12. Which THREE of the City maintenance items listed in Question 11 do you think should receive the MOST EMPHASIS from City leaders over the next two years? Q12. 2nd choice Number Percent Maintenance of major City streets 49 9.4 % Maintenance of neighborhood streets 92 17.6 % Maintenance of curbs & sidewalks 30 5.7 % Maintenance of traffic signals/signs 14 2.7 % Adequacy of City street lighting 31 5.9 % Maintenance of City buildings, such as City Hall 1 0.2 % Snow removal on major City streets 29 5.5 % Snow removal on residential streets 60 11.5 % Mowing & trimming along City streets & other public areas 13 2.5 % Overall cleanliness of City streets & other public areas 22 4.2 % Overall flow of traffic & congestion management in Sterling Heights 48 9.2 % Maintenance of stormwater drainage system 35 6.7 % None chosen 100 19.1 % Total 524 100.0 %
City of Sterling Heights Community Survey: Findings Report
ETC Institute (2021) 87
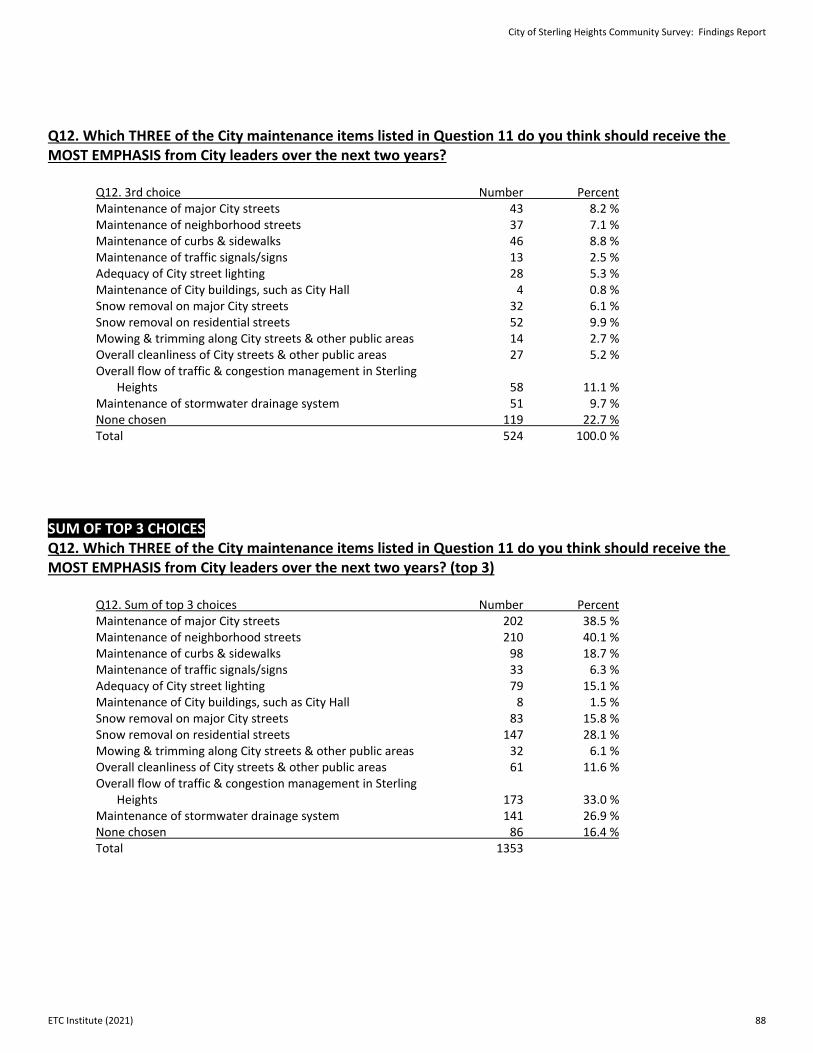
Q12. Which THREE of the City maintenance items listed in Question 11 do you think should receive the MOST EMPHASIS from City leaders over the next two years? Q12. 3rd choice Number Percent Maintenance of major City streets 43 8.2 % Maintenance of neighborhood streets 37 7.1 % Maintenance of curbs & sidewalks 46 8.8 % Maintenance of traffic signals/signs 13 2.5 % Adequacy of City street lighting 28 5.3 % Maintenance of City buildings, such as City Hall 4 0.8 % Snow removal on major City streets 32 6.1 % Snow removal on residential streets 52 9.9 % Mowing & trimming along City streets & other public areas 14 2.7 % Overall cleanliness of City streets & other public areas 27 5.2 % Overall flow of traffic & congestion management in Sterling Heights 58 11.1 % Maintenance of stormwater drainage system 51 9.7 % None chosen 119 22.7 % Total 524 100.0 % SUM OF TOP 3 CHOICES Q12. Which THREE of the City maintenance items listed in Question 11 do you think should receive the MOST EMPHASIS from City leaders over the next two years? (top 3) Q12. Sum of top 3 choices Number Percent Maintenance of major City streets 202 38.5 % Maintenance of neighborhood streets 210 40.1 % Maintenance of curbs & sidewalks 98 18.7 % Maintenance of traffic signals/signs 33 6.3 % Adequacy of City street lighting 79 15.1 % Maintenance of City buildings, such as City Hall 8 1.5 % Snow removal on major City streets 83 15.8 % Snow removal on residential streets 147 28.1 % Mowing & trimming along City streets & other public areas 32 6.1 % Overall cleanliness of City streets & other public areas 61 11.6 % Overall flow of traffic & congestion management in Sterling Heights 173 33.0 % Maintenance of stormwater drainage system 141 26.9 % None chosen 86 16.4 % Total 1353
City of Sterling Heights Community Survey: Findings Report
ETC Institute (2021) 88
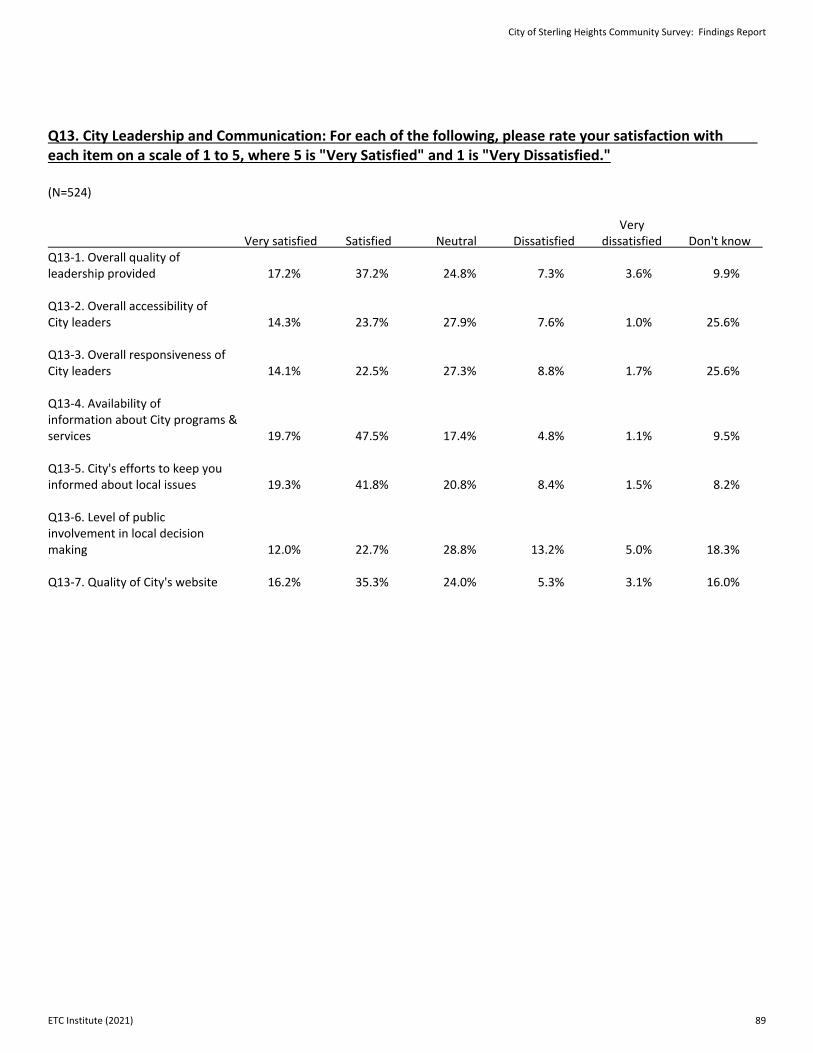
Q13. City Leadership and Communication: For each of the following, please rate your satisfaction with each item on a scale of 1 to 5, where 5 is "Very Satisfied" and 1 is "Very Dissatisfied." (N=524) Very Very satisfied Satisfied Neutral Dissatisfied dissatisfied Don't know Q13-1. Overall quality of leadership provided 17.2% 37.2% 24.8% 7.3% 3.6% 9.9% Q13-2. Overall accessibility of City leaders 14.3% 23.7% 27.9% 7.6% 1.0% 25.6% Q13-3. Overall responsiveness of City leaders 14.1% 22.5% 27.3% 8.8% 1.7% 25.6% Q13-4. Availability of information about City programs & services 19.7% 47.5% 17.4% 4.8% 1.1% 9.5% Q13-5. City's efforts to keep you informed about local issues 19.3% 41.8% 20.8% 8.4% 1.5% 8.2% Q13-6. Level of public involvement in local decision making 12.0% 22.7% 28.8% 13.2% 5.0% 18.3% Q13-7. Quality of City's website 16.2% 35.3% 24.0% 5.3% 3.1% 16.0%
City of Sterling Heights Community Survey: Findings Report
ETC Institute (2021) 89
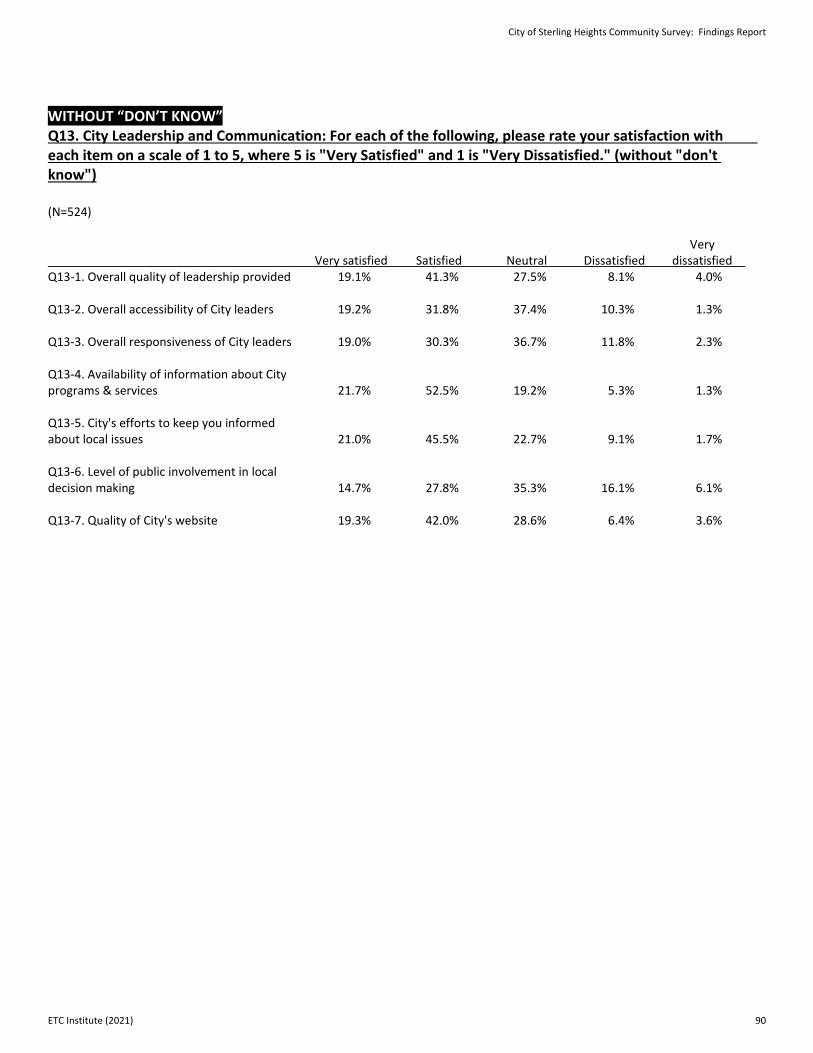
WITHOUT “DON’T KNOW” Q13. City Leadership and Communication: For each of the following, please rate your satisfaction with each item on a scale of 1 to 5, where 5 is "Very Satisfied" and 1 is "Very Dissatisfied." (without "don't know") (N=524) Very Very satisfied Satisfied Neutral Dissatisfied dissatisfied Q13-1. Overall quality of leadership provided 19.1% 41.3% 27.5% 8.1% 4.0% Q13-2. Overall accessibility of City leaders 19.2% 31.8% 37.4% 10.3% 1.3% Q13-3. Overall responsiveness of City leaders 19.0% 30.3% 36.7% 11.8% 2.3% Q13-4. Availability of information about City programs & services 21.7% 52.5% 19.2% 5.3% 1.3% Q13-5. City's efforts to keep you informed about local issues 21.0% 45.5% 22.7% 9.1% 1.7% Q13-6. Level of public involvement in local decision making 14.7% 27.8% 35.3% 16.1% 6.1% Q13-7. Quality of City's website 19.3% 42.0% 28.6% 6.4% 3.6%
City of Sterling Heights Community Survey: Findings Report
ETC Institute (2021) 90
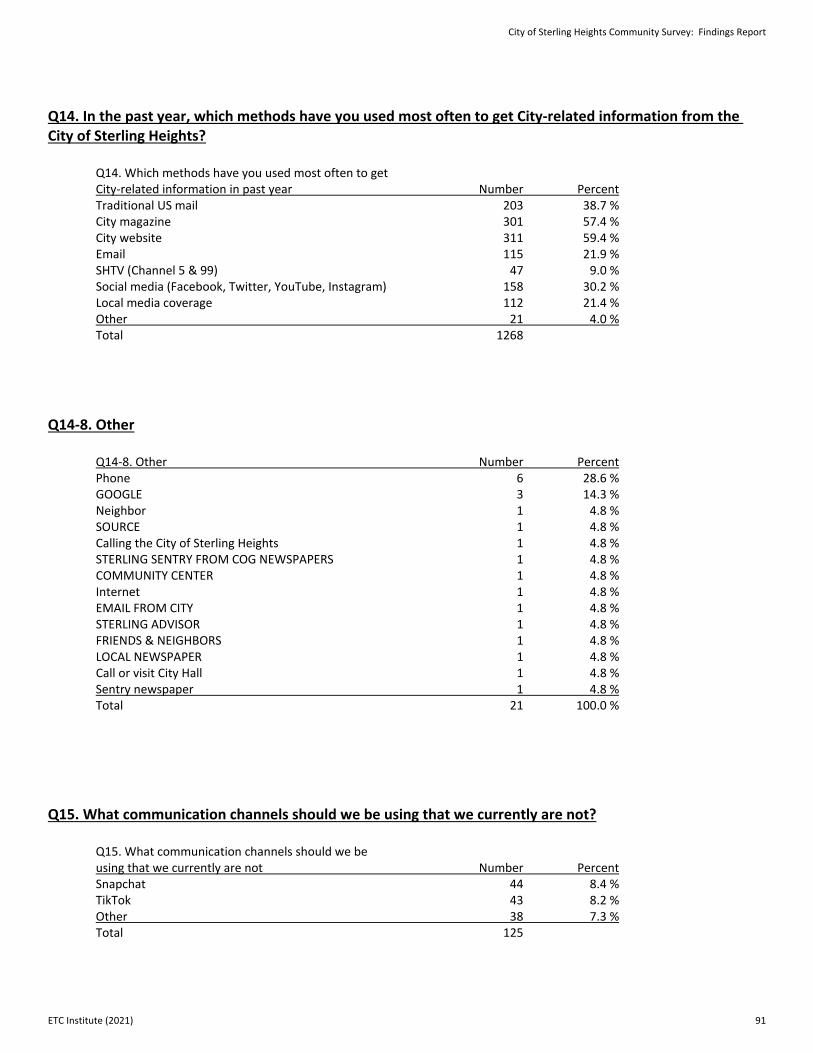
Q14. In the past year, which methods have you used most often to get City-related information from the City of Sterling Heights? Q14. Which methods have you used most often to get City-related information in past year Number Percent Traditional US mail 203 38.7 % City magazine 301 57.4 % City website 311 59.4 % Email 115 21.9 % SHTV (Channel 5 & 99) 47 9.0 % Social media (Facebook, Twitter, YouTube, Instagram) 158 30.2 % Local media coverage 112 21.4 % Other 21 4.0 % Total 1268 Q14-8. Other Q14-8. Other Number Percent Phone 6 28.6 % GOOGLE 3 14.3 % Neighbor 1 4.8 % SOURCE 1 4.8 % Calling the City of Sterling Heights 1 4.8 % STERLING SENTRY FROM COG NEWSPAPERS 1 4.8 % COMMUNITY CENTER 1 4.8 % Internet 1 4.8 % EMAIL FROM CITY 1 4.8 % STERLING ADVISOR 1 4.8 % FRIENDS & NEIGHBORS 1 4.8 % LOCAL NEWSPAPER 1 4.8 % Call or visit City Hall 1 4.8 % Sentry newspaper 1 4.8 % Total 21 100.0 %
Q15. What communication channels should we be using that we currently are not? Q15. What communication channels should we be using that we currently are not Number Percent Snapchat 44 8.4 % TikTok 43 8.2 % Other 38 7.3 % Total 125
City of Sterling Heights Community Survey: Findings Report
ETC Institute (2021) 91
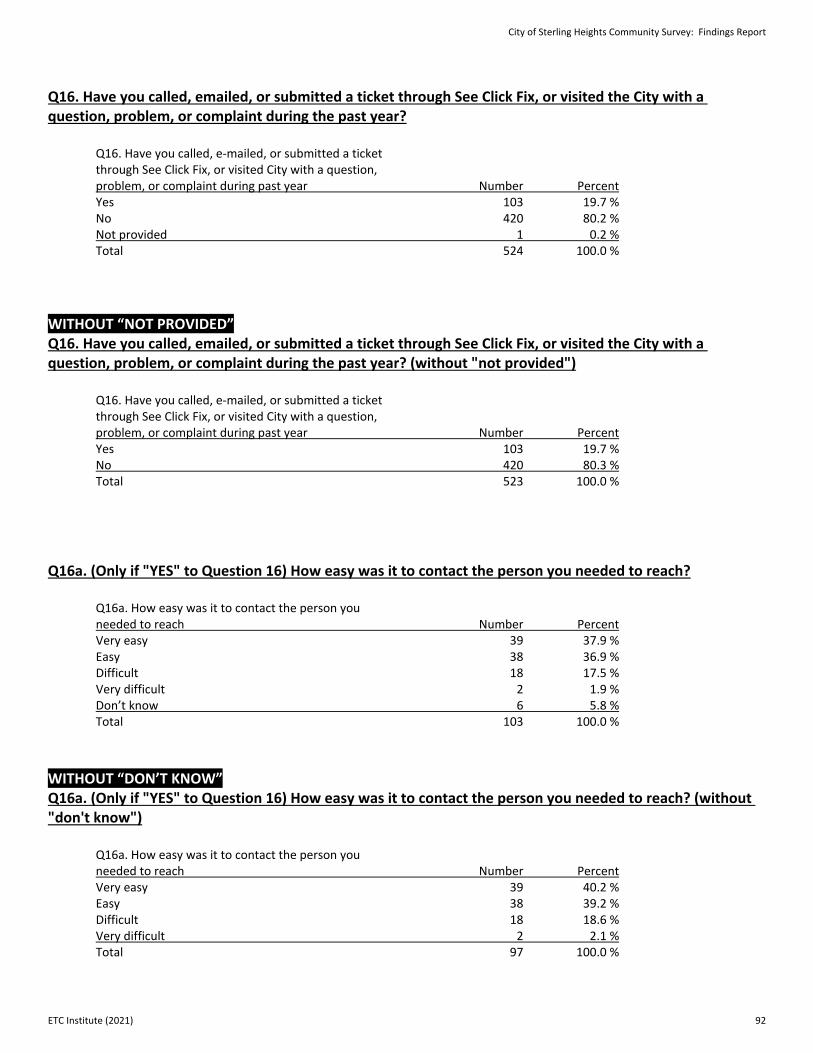
Q16. Have you called, emailed, or submitted a ticket through See Click Fix, or visited the City with a question, problem, or complaint during the past year? Q16. Have you called, e-mailed, or submitted a ticket through See Click Fix, or visited City with a question, problem, or complaint during past year Number Percent Yes 103 19.7 % No 420 80.2 % Not provided 1 0.2 % Total 524 100.0 % WITHOUT “NOT PROVIDED” Q16. Have you called, emailed, or submitted a ticket through See Click Fix, or visited the City with a question, problem, or complaint during the past year? (without "not provided") Q16. Have you called, e-mailed, or submitted a ticket through See Click Fix, or visited City with a question, problem, or complaint during past year Number Percent Yes 103 19.7 % No 420 80.3 % Total 523 100.0 %
Q16a. (Only if "YES" to Question 16) How easy was it to contact the person you needed to reach? Q16a. How easy was it to contact the person you needed to reach Number Percent Very easy 39 37.9 % Easy 38 36.9 % Difficult 18 17.5 % Very difficult 2 1.9 % Don’t know 6 5.8 % Total 103 100.0 % WITHOUT “DON’T KNOW” Q16a. (Only if "YES" to Question 16) How easy was it to contact the person you needed to reach? (without "don't know") Q16a. How easy was it to contact the person you needed to reach Number Percent Very easy 39 40.2 % Easy 38 39.2 % Difficult 18 18.6 % Very difficult 2 2.1 % Total 97 100.0 %
City of Sterling Heights Community Survey: Findings Report
ETC Institute (2021) 92
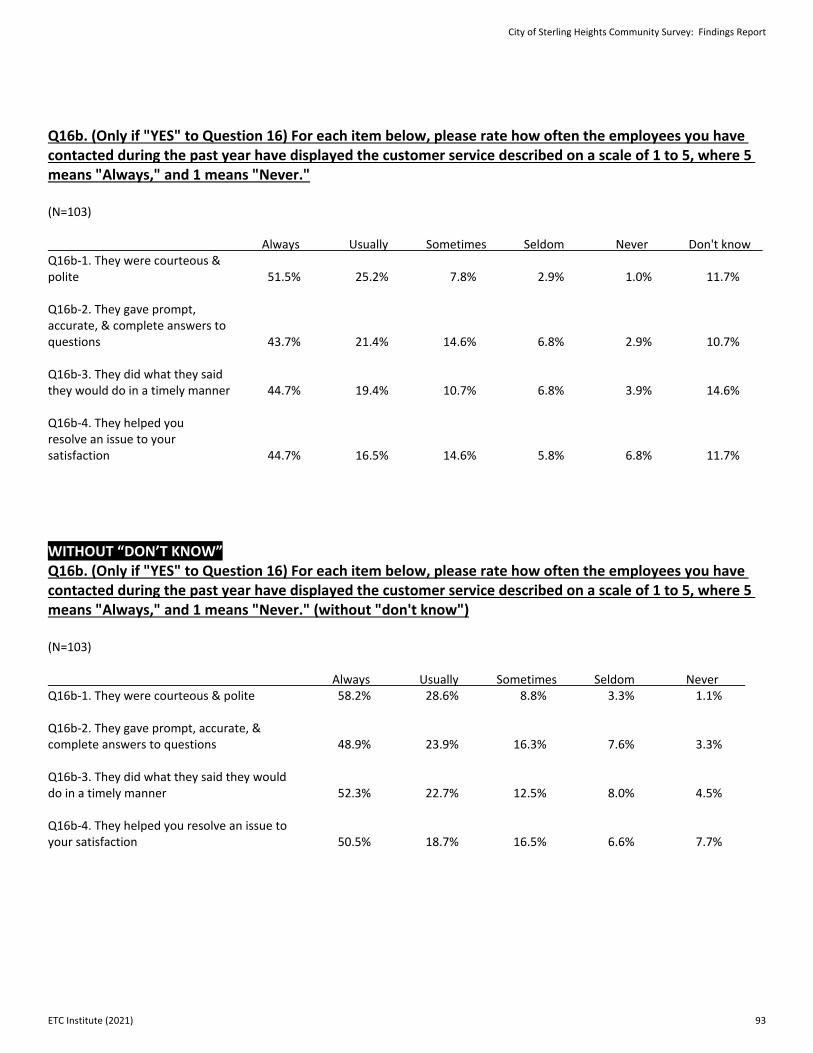
Q16b. (Only if "YES" to Question 16) For each item below, please rate how often the employees you have contacted during the past year have displayed the customer service described on a scale of 1 to 5, where 5 means "Always," and 1 means "Never." (N=103) Always Usually Sometimes Seldom Never Don't know Q16b-1. They were courteous & polite 51.5% 25.2% 7.8% 2.9% 1.0% 11.7% Q16b-2. They gave prompt, accurate, & complete answers to questions 43.7% 21.4% 14.6% 6.8% 2.9% 10.7% Q16b-3. They did what they said they would do in a timely manner 44.7% 19.4% 10.7% 6.8% 3.9% 14.6% Q16b-4. They helped you resolve an issue to your satisfaction 44.7% 16.5% 14.6% 5.8% 6.8% 11.7%
WITHOUT “DON’T KNOW” Q16b. (Only if "YES" to Question 16) For each item below, please rate how often the employees you have contacted during the past year have displayed the customer service described on a scale of 1 to 5, where 5 means "Always," and 1 means "Never." (without "don't know") (N=103) Always Usually Sometimes Seldom Never Q16b-1. They were courteous & polite 58.2% 28.6% 8.8% 3.3% 1.1% Q16b-2. They gave prompt, accurate, & complete answers to questions 48.9% 23.9% 16.3% 7.6% 3.3% Q16b-3. They did what they said they would do in a timely manner 52.3% 22.7% 12.5% 8.0% 4.5% Q16b-4. They helped you resolve an issue to your satisfaction 50.5% 18.7% 16.5% 6.6% 7.7%
City of Sterling Heights Community Survey: Findings Report
ETC Institute (2021) 93
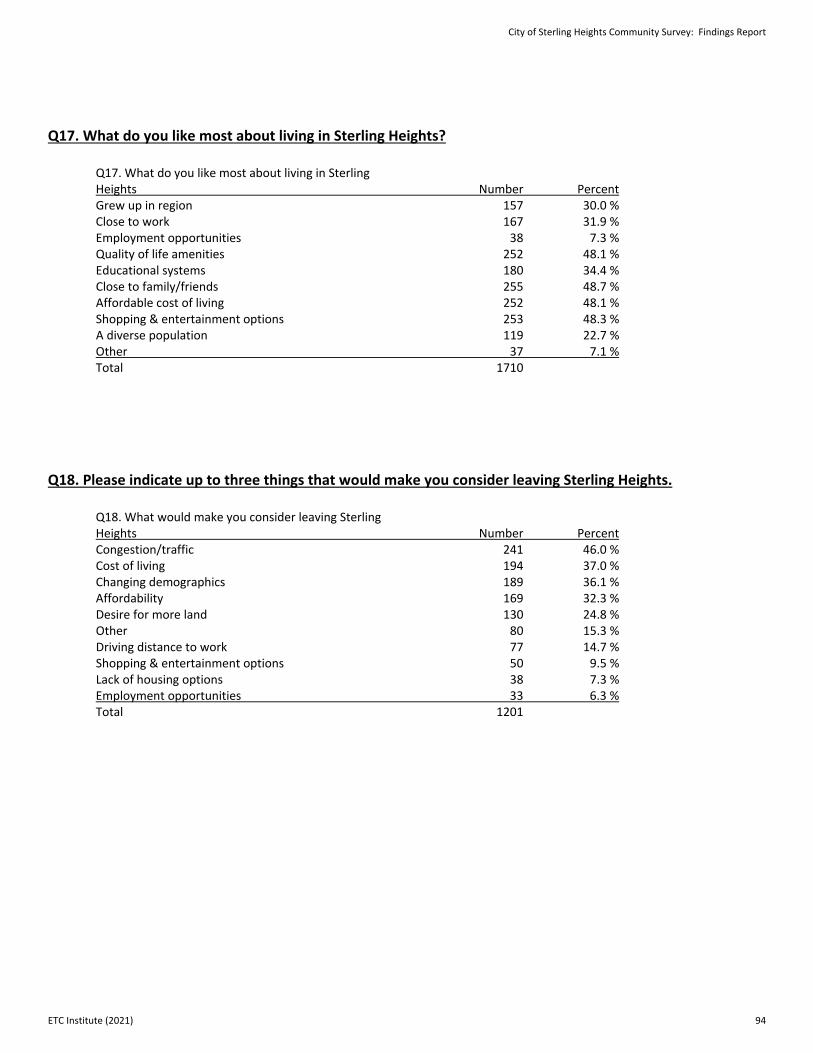
Q17. What do you like most about living in Sterling Heights? Q17. What do you like most about living in Sterling Heights Number Percent Grew up in region 157 30.0 % Close to work 167 31.9 % Employment opportunities 38 7.3 % Quality of life amenities 252 48.1 % Educational systems 180 34.4 % Close to family/friends 255 48.7 % Affordable cost of living 252 48.1 % Shopping & entertainment options 253 48.3 % A diverse population 119 22.7 % Other 37 7.1 % Total 1710 Q18. Please indicate up to three things that would make you consider leaving Sterling Heights. Q18. What would make you consider leaving Sterling Heights Number Percent Congestion/traffic 241 46.0 % Cost of living 194 37.0 % Changing demographics 189 36.1 % Affordability 169 32.3 % Desire for more land 130 24.8 % Other 80 15.3 % Driving distance to work 77 14.7 % Shopping & entertainment options 50 9.5 % Lack of housing options 38 7.3 % Employment opportunities 33 6.3 % Total 1201
City of Sterling Heights Community Survey: Findings Report
ETC Institute (2021) 94
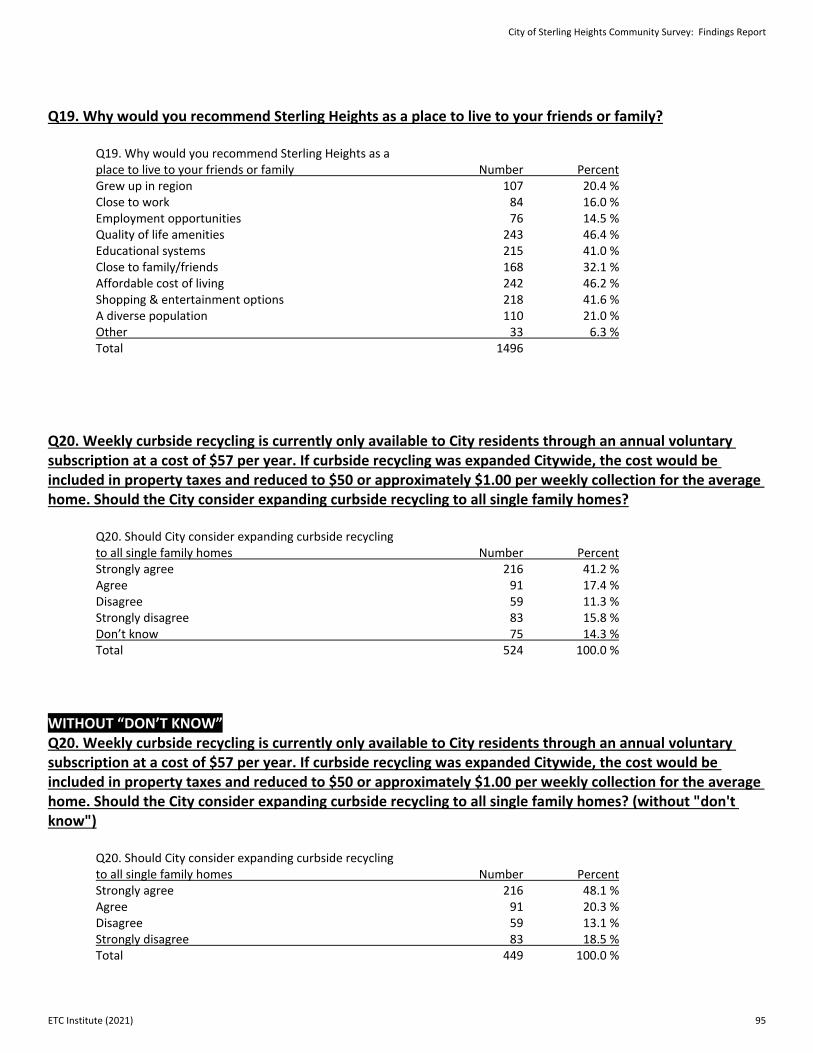
Q19. Why would you recommend Sterling Heights as a place to live to your friends or family? Q19. Why would you recommend Sterling Heights as a place to live to your friends or family Number Percent Grew up in region 107 20.4 % Close to work 84 16.0 % Employment opportunities 76 14.5 % Quality of life amenities 243 46.4 % Educational systems 215 41.0 % Close to family/friends 168 32.1 % Affordable cost of living 242 46.2 % Shopping & entertainment options 218 41.6 % A diverse population 110 21.0 % Other 33 6.3 % Total 1496 Q20. Weekly curbside recycling is currently only available to City residents through an annual voluntary subscription at a cost of $57 per year. If curbside recycling was expanded Citywide, the cost would be included in property taxes and reduced to $50 or approximately $1.00 per weekly collection for the average home. Should the City consider expanding curbside recycling to all single family homes? Q20. Should City consider expanding curbside recycling to all single family homes Number Percent Strongly agree 216 41.2 % Agree 91 17.4 % Disagree 59 11.3 % Strongly disagree 83 15.8 % Don’t know 75 14.3 % Total 524 100.0 % WITHOUT “DON’T KNOW” Q20. Weekly curbside recycling is currently only available to City residents through an annual voluntary subscription at a cost of $57 per year. If curbside recycling was expanded Citywide, the cost would be included in property taxes and reduced to $50 or approximately $1.00 per weekly collection for the average home. Should the City consider expanding curbside recycling to all single family homes? (without "don't know") Q20. Should City consider expanding curbside recycling to all single family homes Number Percent Strongly agree 216 48.1 % Agree 91 20.3 % Disagree 59 13.1 % Strongly disagree 83 18.5 % Total 449 100.0 %
City of Sterling Heights Community Survey: Findings Report
ETC Institute (2021) 95
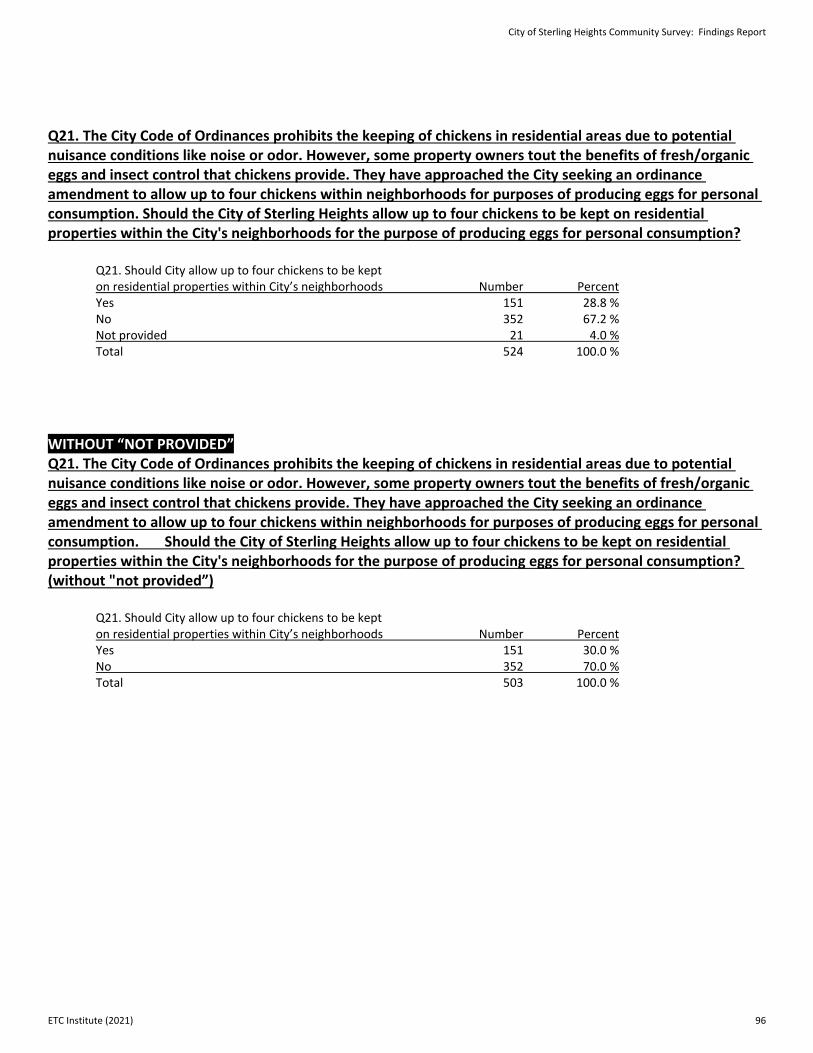
Q21. The City Code of Ordinances prohibits the keeping of chickens in residential areas due to potential nuisance conditions like noise or odor. However, some property owners tout the benefits of fresh/organic eggs and insect control that chickens provide. They have approached the City seeking an ordinance amendment to allow up to four chickens within neighborhoods for purposes of producing eggs for personal consumption. Should the City of Sterling Heights allow up to four chickens to be kept on residential properties within the City's neighborhoods for the purpose of producing eggs for personal consumption? Q21. Should City allow up to four chickens to be kept on residential properties within City’s neighborhoods Number Percent Yes 151 28.8 % No 352 67.2 % Not provided 21 4.0 % Total 524 100.0 % WITHOUT “NOT PROVIDED” Q21. The City Code of Ordinances prohibits the keeping of chickens in residential areas due to potential nuisance conditions like noise or odor. However, some property owners tout the benefits of fresh/organic eggs and insect control that chickens provide. They have approached the City seeking an ordinance amendment to allow up to four chickens within neighborhoods for purposes of producing eggs for personal consumption. Should the City of Sterling Heights allow up to four chickens to be kept on residential properties within the City's neighborhoods for the purpose of producing eggs for personal consumption? (without "not provided”) Q21. Should City allow up to four chickens to be kept on residential properties within City’s neighborhoods Number Percent Yes 151 30.0 % No 352 70.0 % Total 503 100.0 %
City of Sterling Heights Community Survey: Findings Report
ETC Institute (2021) 96
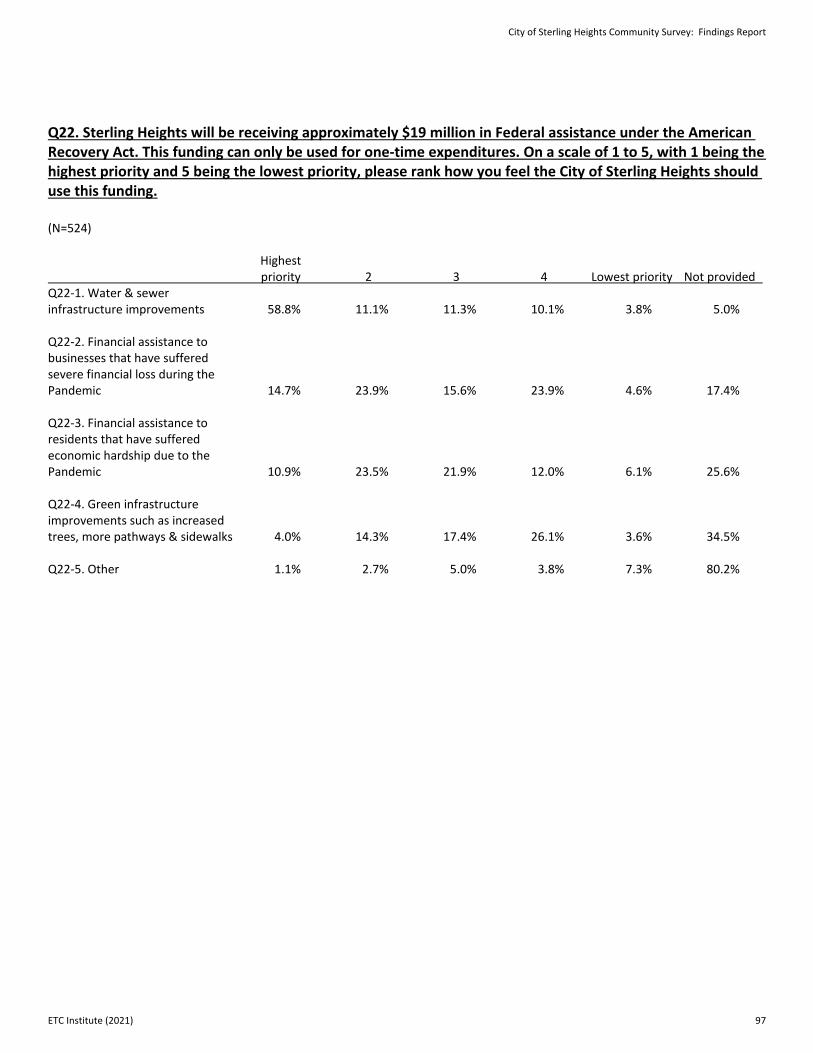
Q22. Sterling Heights will be receiving approximately $19 million in Federal assistance under the American Recovery Act. This funding can only be used for one-time expenditures. On a scale of 1 to 5, with 1 being the highest priority and 5 being the lowest priority, please rank how you feel the City of Sterling Heights should use this funding. (N=524) Highest priority 2 3 4 Lowest priority Not provided Q22-1. Water & sewer infrastructure improvements 58.8% 11.1% 11.3% 10.1% 3.8% 5.0% Q22-2. Financial assistance to businesses that have suffered severe financial loss during the Pandemic 14.7% 23.9% 15.6% 23.9% 4.6% 17.4% Q22-3. Financial assistance to residents that have suffered economic hardship due to the Pandemic 10.9% 23.5% 21.9% 12.0% 6.1% 25.6% Q22-4. Green infrastructure improvements such as increased trees, more pathways & sidewalks 4.0% 14.3% 17.4% 26.1% 3.6% 34.5% Q22-5. Other 1.1% 2.7% 5.0% 3.8% 7.3% 80.2%
City of Sterling Heights Community Survey: Findings Report
ETC Institute (2021) 97
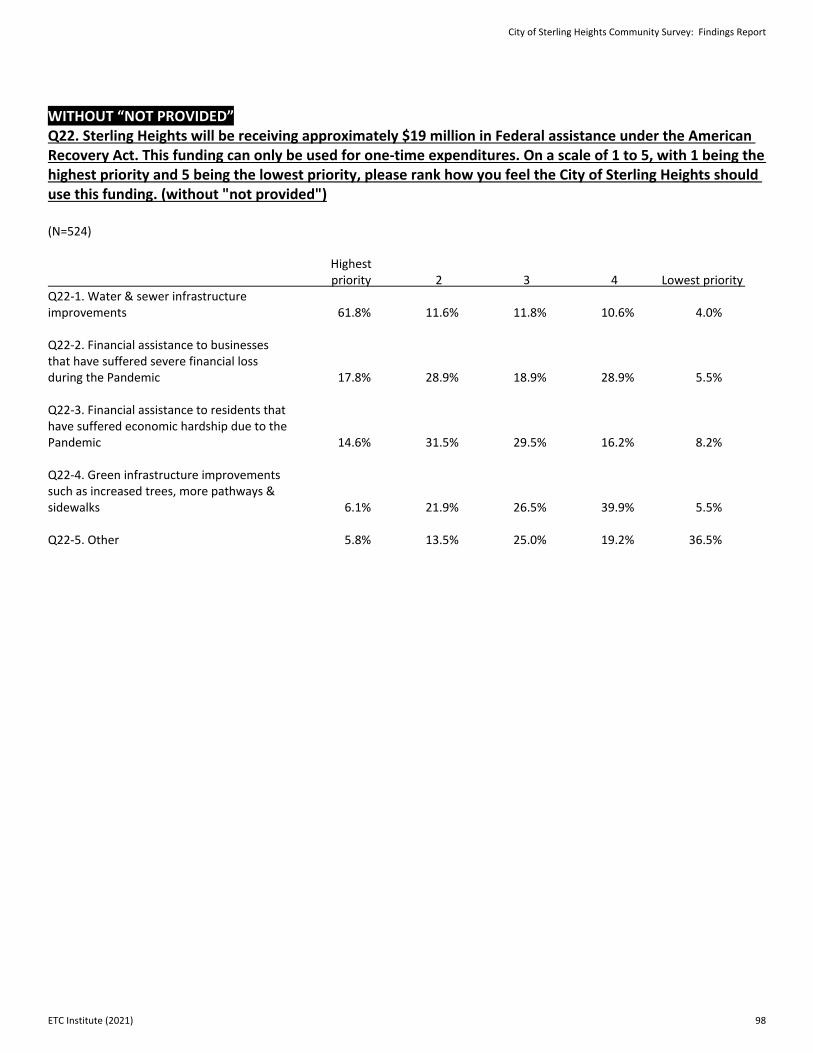
WITHOUT “NOT PROVIDED” Q22. Sterling Heights will be receiving approximately $19 million in Federal assistance under the American Recovery Act. This funding can only be used for one-time expenditures. On a scale of 1 to 5, with 1 being the highest priority and 5 being the lowest priority, please rank how you feel the City of Sterling Heights should use this funding. (without "not provided") (N=524) Highest priority 2 3 4 Lowest priority Q22-1. Water & sewer infrastructure improvements 61.8% 11.6% 11.8% 10.6% 4.0% Q22-2. Financial assistance to businesses that have suffered severe financial loss during the Pandemic 17.8% 28.9% 18.9% 28.9% 5.5% Q22-3. Financial assistance to residents that have suffered economic hardship due to the Pandemic 14.6% 31.5% 29.5% 16.2% 8.2% Q22-4. Green infrastructure improvements such as increased trees, more pathways & sidewalks 6.1% 21.9% 26.5% 39.9% 5.5% Q22-5. Other 5.8% 13.5% 25.0% 19.2% 36.5%
City of Sterling Heights Community Survey: Findings Report
ETC Institute (2021) 98
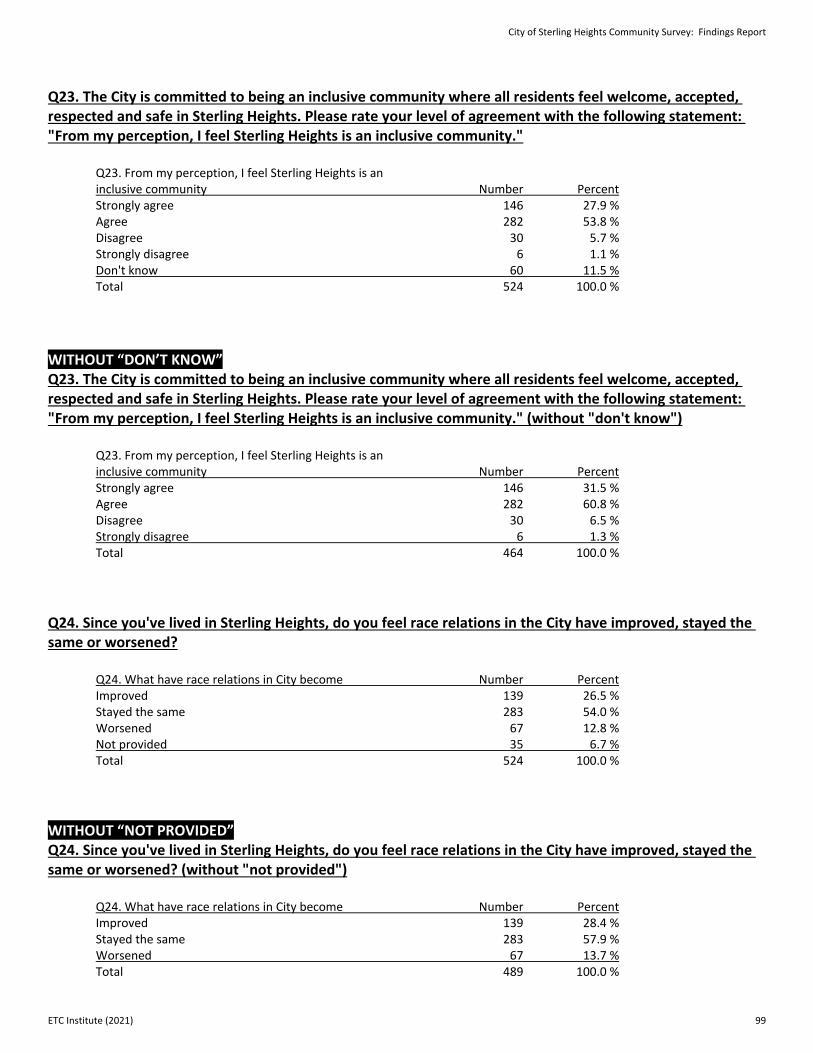
Q23. The City is committed to being an inclusive community where all residents feel welcome, accepted, respected and safe in Sterling Heights. Please rate your level of agreement with the following statement: "From my perception, I feel Sterling Heights is an inclusive community." Q23. From my perception, I feel Sterling Heights is an inclusive community Number Percent Strongly agree 146 27.9 % Agree 282 53.8 % Disagree 30 5.7 % Strongly disagree 6 1.1 % Don't know 60 11.5 % Total 524 100.0 % WITHOUT “DON’T KNOW” Q23. The City is committed to being an inclusive community where all residents feel welcome, accepted, respected and safe in Sterling Heights. Please rate your level of agreement with the following statement: "From my perception, I feel Sterling Heights is an inclusive community." (without "don't know") Q23. From my perception, I feel Sterling Heights is an inclusive community Number Percent Strongly agree 146 31.5 % Agree 282 60.8 % Disagree 30 6.5 % Strongly disagree 6 1.3 % Total 464 100.0 % Q24. Since you've lived in Sterling Heights, do you feel race relations in the City have improved, stayed the same or worsened? Q24. What have race relations in City become Number Percent Improved 139 26.5 % Stayed the same 283 54.0 % Worsened 67 12.8 % Not provided 35 6.7 % Total 524 100.0 % WITHOUT “NOT PROVIDED” Q24. Since you've lived in Sterling Heights, do you feel race relations in the City have improved, stayed the same or worsened? (without "not provided") Q24. What have race relations in City become Number Percent Improved 139 28.4 % Stayed the same 283 57.9 % Worsened 67 13.7 % Total 489 100.0 %
City of Sterling Heights Community Survey: Findings Report
ETC Institute (2021) 99
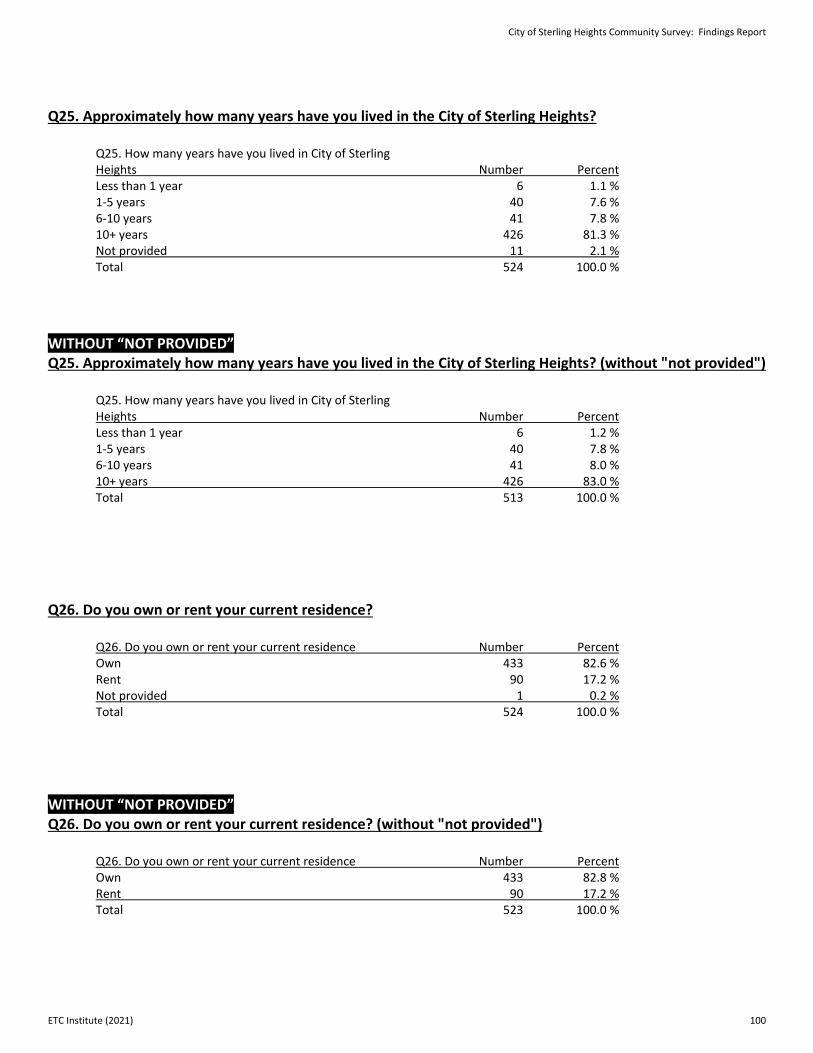
Q25. Approximately how many years have you lived in the City of Sterling Heights? Q25. How many years have you lived in City of Sterling Heights Number Percent Less than 1 year 6 1.1 % 1-5 years 40 7.6 % 6-10 years 41 7.8 % 10+ years 426 81.3 % Not provided 11 2.1 % Total 524 100.0 %
WITHOUT “NOT PROVIDED” Q25. Approximately how many years have you lived in the City of Sterling Heights? (without "not provided") Q25. How many years have you lived in City of Sterling Heights Number Percent Less than 1 year 6 1.2 % 1-5 years 40 7.8 % 6-10 years 41 8.0 % 10+ years 426 83.0 % Total 513 100.0 %
Q26. Do you own or rent your current residence? Q26. Do you own or rent your current residence Number Percent Own 433 82.6 % Rent 90 17.2 % Not provided 1 0.2 % Total 524 100.0 %
WITHOUT “NOT PROVIDED” Q26. Do you own or rent your current residence? (without "not provided") Q26. Do you own or rent your current residence Number Percent Own 433 82.8 % Rent 90 17.2 % Total 523 100.0 %
City of Sterling Heights Community Survey: Findings Report
ETC Institute (2021) 100
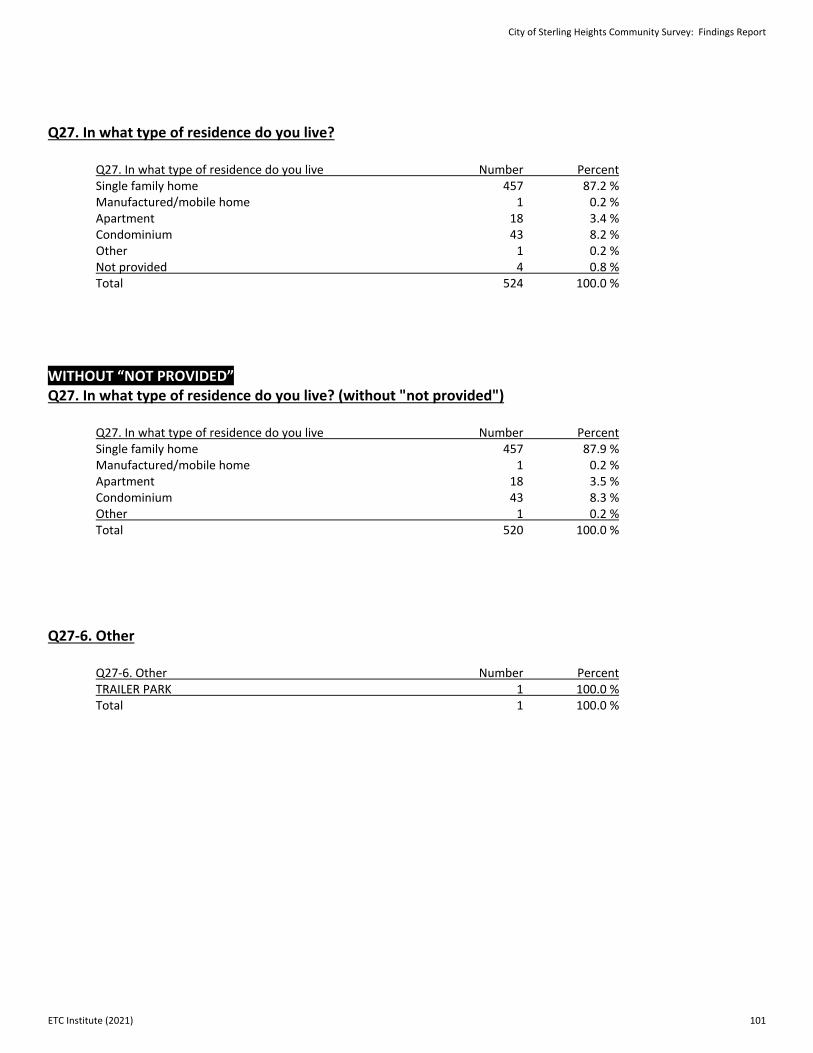
Q27. In what type of residence do you live? Q27. In what type of residence do you live Number Percent Single family home 457 87.2 % Manufactured/mobile home 1 0.2 % Apartment 18 3.4 % Condominium 43 8.2 % Other 1 0.2 % Not provided 4 0.8 % Total 524 100.0 % WITHOUT “NOT PROVIDED” Q27. In what type of residence do you live? (without "not provided") Q27. In what type of residence do you live Number Percent Single family home 457 87.9 % Manufactured/mobile home 1 0.2 % Apartment 18 3.5 % Condominium 43 8.3 % Other 1 0.2 % Total 520 100.0 % Q27-6. Other Q27-6. Other Number Percent TRAILER PARK 1 100.0 % Total 1 100.0 %
City of Sterling Heights Community Survey: Findings Report
ETC Institute (2021) 101
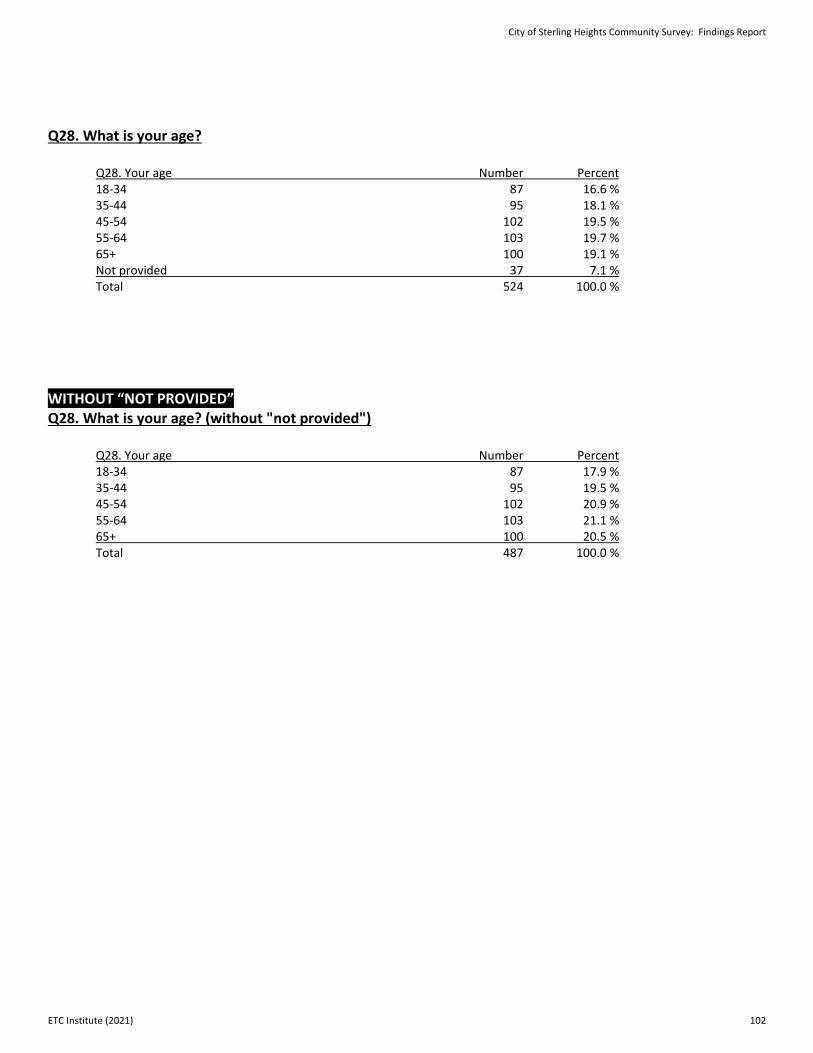
Q28. What is your age? Q28. Your age Number Percent 18-34 87 16.6 % 35-44 95 18.1 % 45-54 102 19.5 % 55-64 103 19.7 % 65+ 100 19.1 % Not provided 37 7.1 % Total 524 100.0 % WITHOUT “NOT PROVIDED” Q28. What is your age? (without "not provided") Q28. Your age Number Percent 18-34 87 17.9 % 35-44 95 19.5 % 45-54 102 20.9 % 55-64 103 21.1 % 65+ 100 20.5 % Total 487 100.0 %
City of Sterling Heights Community Survey: Findings Report
ETC Institute (2021) 102
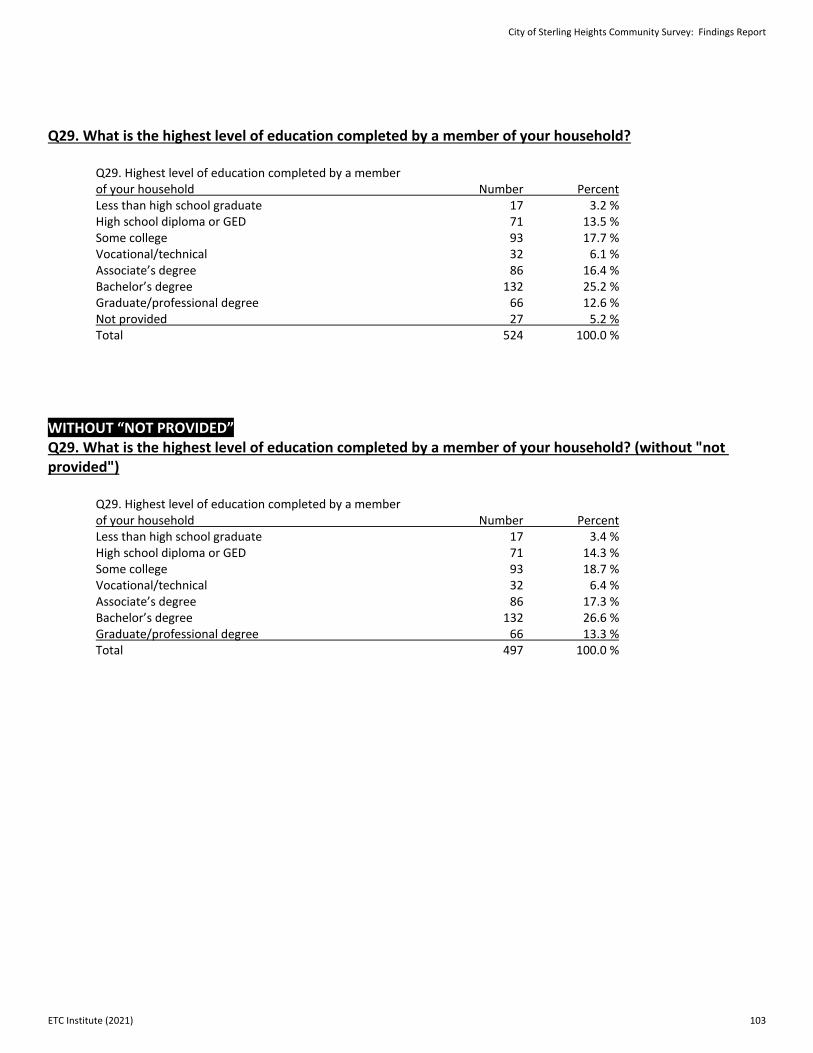
Q29. What is the highest level of education completed by a member of your household? Q29. Highest level of education completed by a member of your household Number Percent Less than high school graduate 17 3.2 % High school diploma or GED 71 13.5 % Some college 93 17.7 % Vocational/technical 32 6.1 % Associate’s degree 86 16.4 % Bachelor’s degree 132 25.2 % Graduate/professional degree 66 12.6 % Not provided 27 5.2 % Total 524 100.0 % WITHOUT “NOT PROVIDED” Q29. What is the highest level of education completed by a member of your household? (without "not provided") Q29. Highest level of education completed by a member of your household Number Percent Less than high school graduate 17 3.4 % High school diploma or GED 71 14.3 % Some college 93 18.7 % Vocational/technical 32 6.4 % Associate’s degree 86 17.3 % Bachelor’s degree 132 26.6 % Graduate/professional degree 66 13.3 % Total 497 100.0 %
City of Sterling Heights Community Survey: Findings Report
ETC Institute (2021) 103
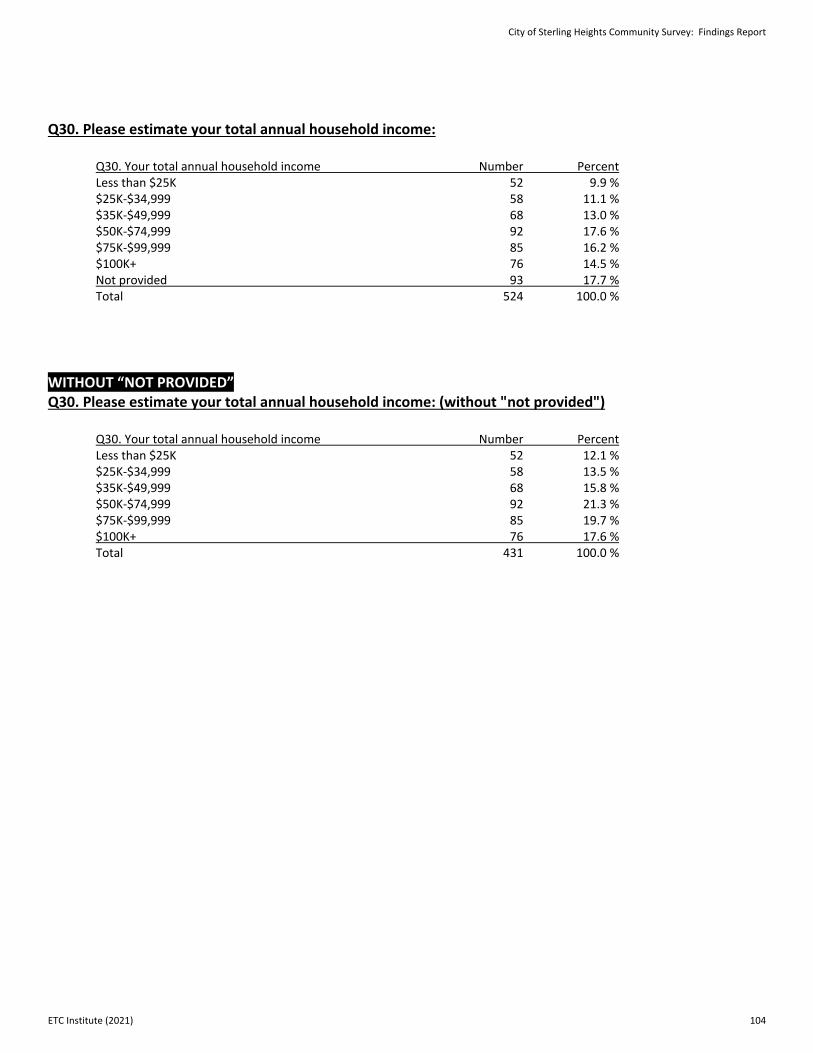
Q30. Please estimate your total annual household income: Q30. Your total annual household income Number Percent Less than $25K 52 9.9 % $25K-$34,999 58 11.1 % $35K-$49,999 68 13.0 % $50K-$74,999 92 17.6 % $75K-$99,999 85 16.2 % $100K+ 76 14.5 % Not provided 93 17.7 % Total 524 100.0 % WITHOUT “NOT PROVIDED” Q30. Please estimate your total annual household income: (without "not provided") Q30. Your total annual household income Number Percent Less than $25K 52 12.1 % $25K-$34,999 58 13.5 % $35K-$49,999 68 15.8 % $50K-$74,999 92 21.3 % $75K-$99,999 85 19.7 % $100K+ 76 17.6 % Total 431 100.0 %
City of Sterling Heights Community Survey: Findings Report
ETC Institute (2021) 104
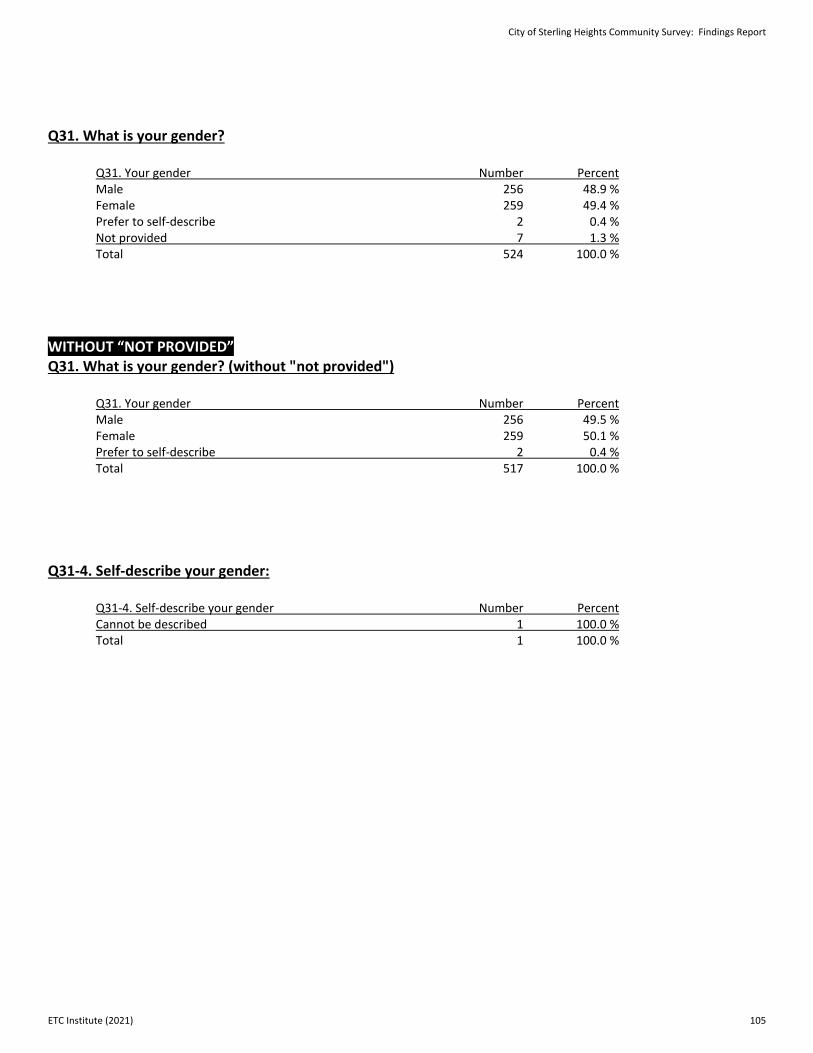
Q31. What is your gender? Q31. Your gender Number Percent Male 256 48.9 % Female 259 49.4 % Prefer to self-describe 2 0.4 % Not provided 7 1.3 % Total 524 100.0 % WITHOUT “NOT PROVIDED” Q31. What is your gender? (without "not provided") Q31. Your gender Number Percent Male 256 49.5 % Female 259 50.1 % Prefer to self-describe 2 0.4 % Total 517 100.0 % Q31-4. Self-describe your gender: Q31-4. Self-describe your gender Number Percent Cannot be described 1 100.0 % Total 1 100.0 %
City of Sterling Heights Community Survey: Findings Report
ETC Institute (2021) 105
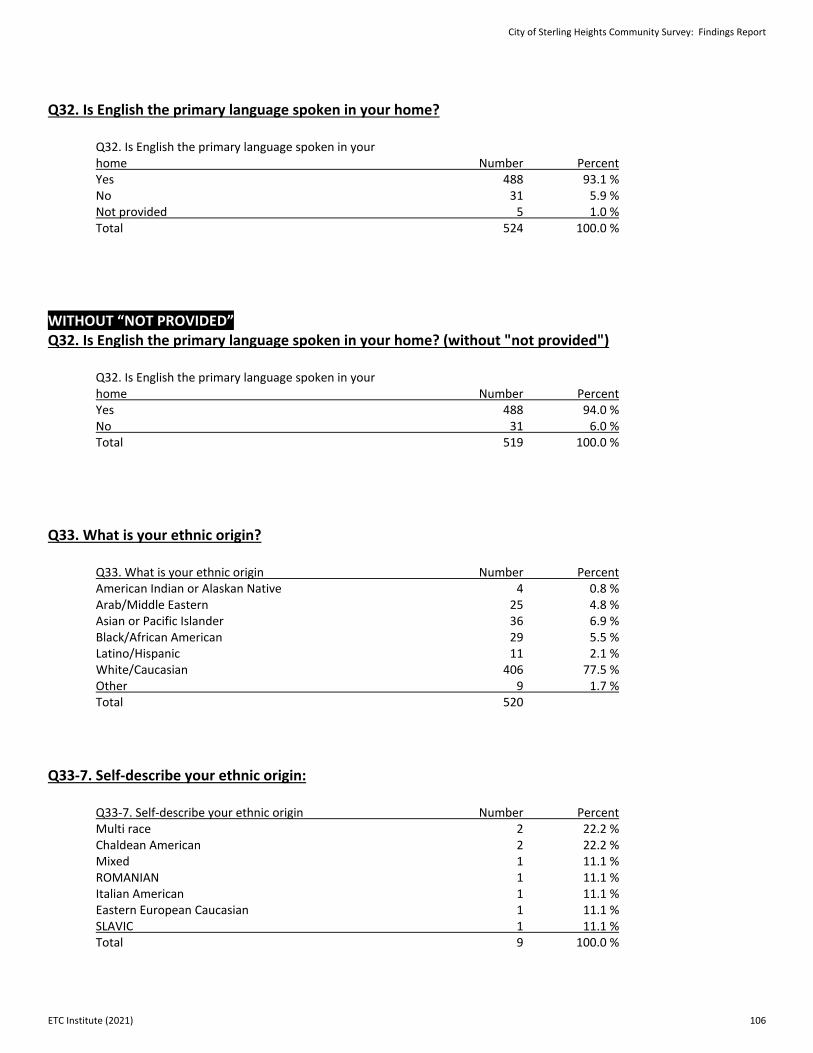
Q32. Is English the primary language spoken in your home? Q32. Is English the primary language spoken in your home Number Percent Yes 488 93.1 % No 31 5.9 % Not provided 5 1.0 % Total 524 100.0 %
WITHOUT “NOT PROVIDED” Q32. Is English the primary language spoken in your home? (without "not provided") Q32. Is English the primary language spoken in your home Number Percent Yes 488 94.0 % No 31 6.0 % Total 519 100.0 % Q33. What is your ethnic origin? Q33. What is your ethnic origin Number Percent American Indian or Alaskan Native 4 0.8 % Arab/Middle Eastern 25 4.8 % Asian or Pacific Islander 36 6.9 % Black/African American 29 5.5 % Latino/Hispanic 11 2.1 % White/Caucasian 406 77.5 % Other 9 1.7 % Total 520 Q33-7. Self-describe your ethnic origin: Q33-7. Self-describe your ethnic origin Number Percent Multi race 2 22.2 % Chaldean American 2 22.2 % Mixed 1 11.1 % ROMANIAN 1 11.1 % Italian American 1 11.1 % Eastern European Caucasian 1 11.1 % SLAVIC 1 11.1 % Total 9 100.0 %
City of Sterling Heights Community Survey: Findings Report
ETC Institute (2021) 106
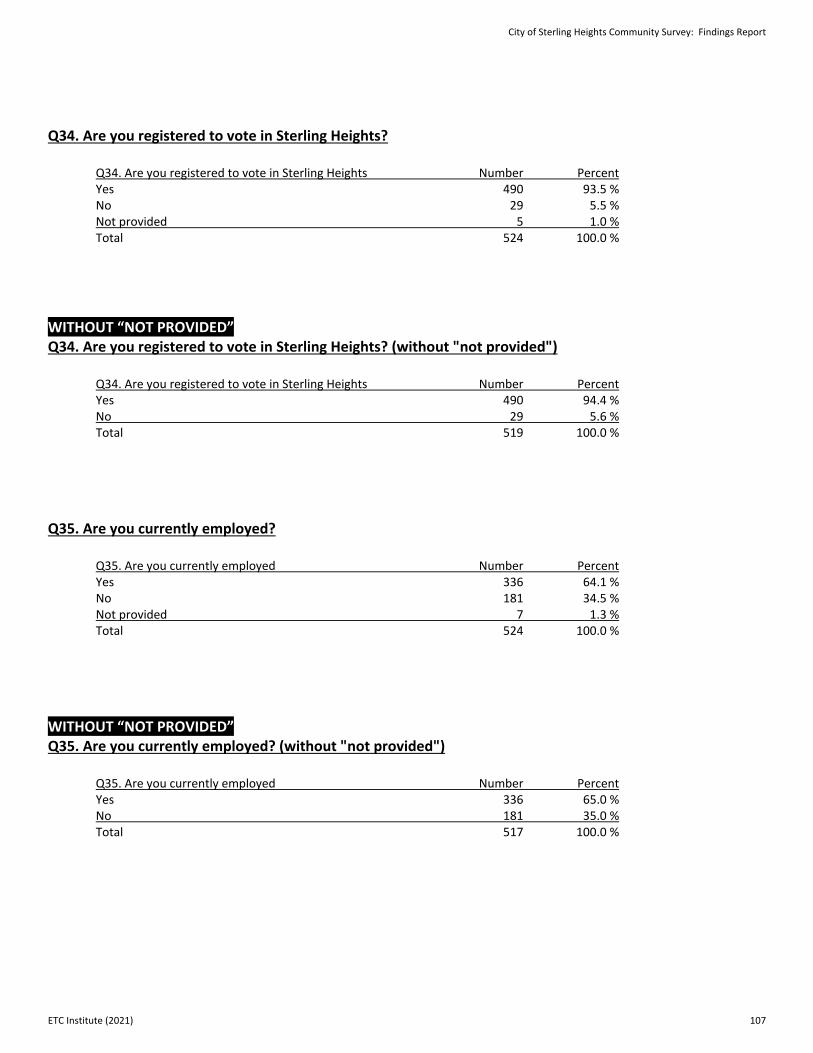
Q34. Are you registered to vote in Sterling Heights? Q34. Are you registered to vote in Sterling Heights Number Percent Yes 490 93.5 % No 29 5.5 % Not provided 5 1.0 % Total 524 100.0 % WITHOUT “NOT PROVIDED” Q34. Are you registered to vote in Sterling Heights? (without "not provided") Q34. Are you registered to vote in Sterling Heights Number Percent Yes 490 94.4 % No 29 5.6 % Total 519 100.0 %
Q35. Are you currently employed? Q35. Are you currently employed Number Percent Yes 336 64.1 % No 181 34.5 % Not provided 7 1.3 % Total 524 100.0 %
WITHOUT “NOT PROVIDED” Q35. Are you currently employed? (without "not provided") Q35. Are you currently employed Number Percent Yes 336 65.0 % No 181 35.0 % Total 517 100.0 %
City of Sterling Heights Community Survey: Findings Report
ETC Institute (2021) 107
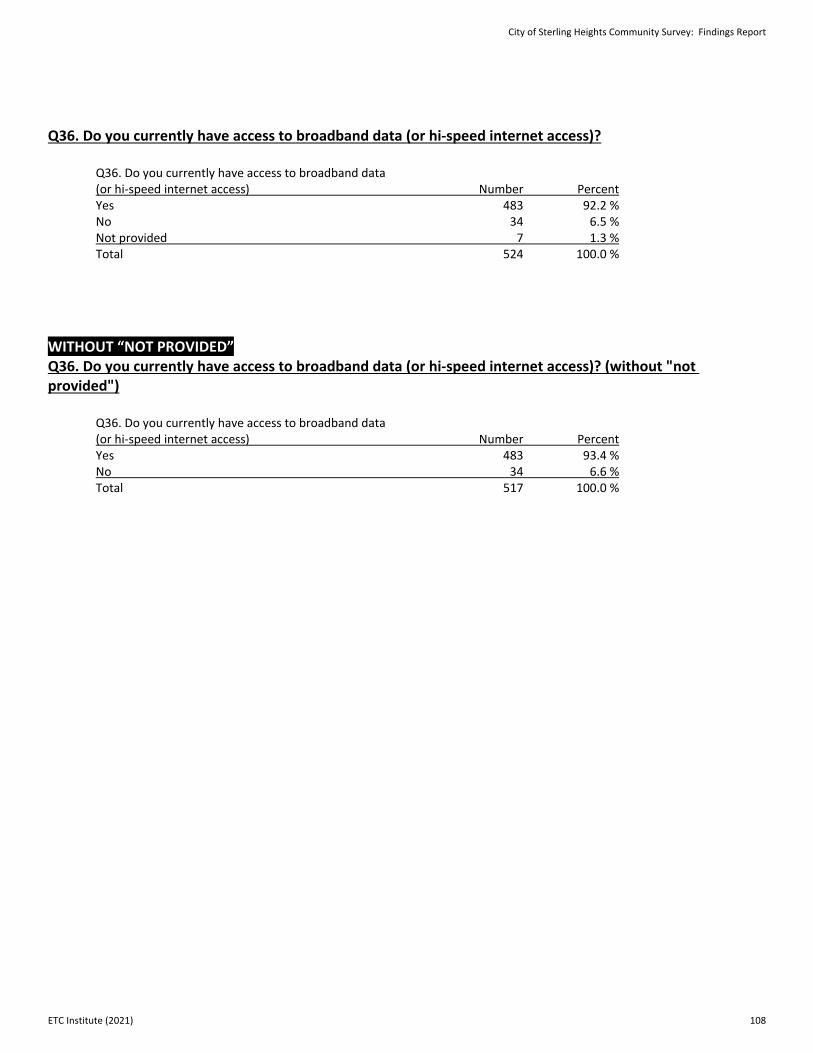
Q36. Do you currently have access to broadband data (or hi-speed internet access)? Q36. Do you currently have access to broadband data (or hi-speed internet access) Number Percent Yes 483 92.2 % No 34 6.5 % Not provided 7 1.3 % Total 524 100.0 % WITHOUT “NOT PROVIDED” Q36. Do you currently have access to broadband data (or hi-speed internet access)? (without "not provided") Q36. Do you currently have access to broadband data (or hi-speed internet access) Number Percent Yes 483 93.4 % No 34 6.6 % Total 517 100.0 %
City of Sterling Heights Community Survey: Findings Report
ETC Institute (2021) 108
Survey Instrument 5
City of Sterling Heights Community Survey: Findings Report
ETC Institute (2021) 109
July 2021 Dear Sterling Heights Resident: Your input on the enclosed survey is extremely important. We believe it is crucial to ask our residents whether or not they are satisfied with the services we provide. In order to ensure that the City’s priorities are aligned with the needs of our residents, we need to know what you think. Your household was one of a limited number selected at random to receive this survey, and your participation is necessary to make the survey a success. We greatly appreciate your time. We realize that this survey takes some time to complete, but every question is essential. The time you invest in this survey will influence dozens of decisions that will be made about the City’s future. Your responses will also help the City Council gauge the success of its efforts to carry out the community’s vision for the City of Sterling Heights and to address the many opportunities and challenges facing our community. Please return your survey or complete it online sometime during the next week. We have selected ETC Institute to administer this survey. ETC Institute will present the results to the City in September. Your responses will remain confidential. Please return your survey in the enclosed postage-paid envelope addressed to ETC Institute, 725 W. Frontier Circle, Olathe, Kansas, 66061 or go to sterlingheightscitizensurvey.org to complete the survey online. If you have any questions, please contact Community Relations at (586) 446-2470 or email [email protected]. Thanks again for taking the time to let your voice be heard. Sincerely,
Michael C. Taylor, Mayor City of Sterling Heights
Si tiene preguntas acerca de la encuesta y no habla Ingles, por favor llame al 1-844-811-0411. Gracias
.هاتفك ورقم اسمك وترك 8190-247-844-1 بالرقم الاتصال ير�� العر�ية، باللغة الاستطلاع �� للمشاركة
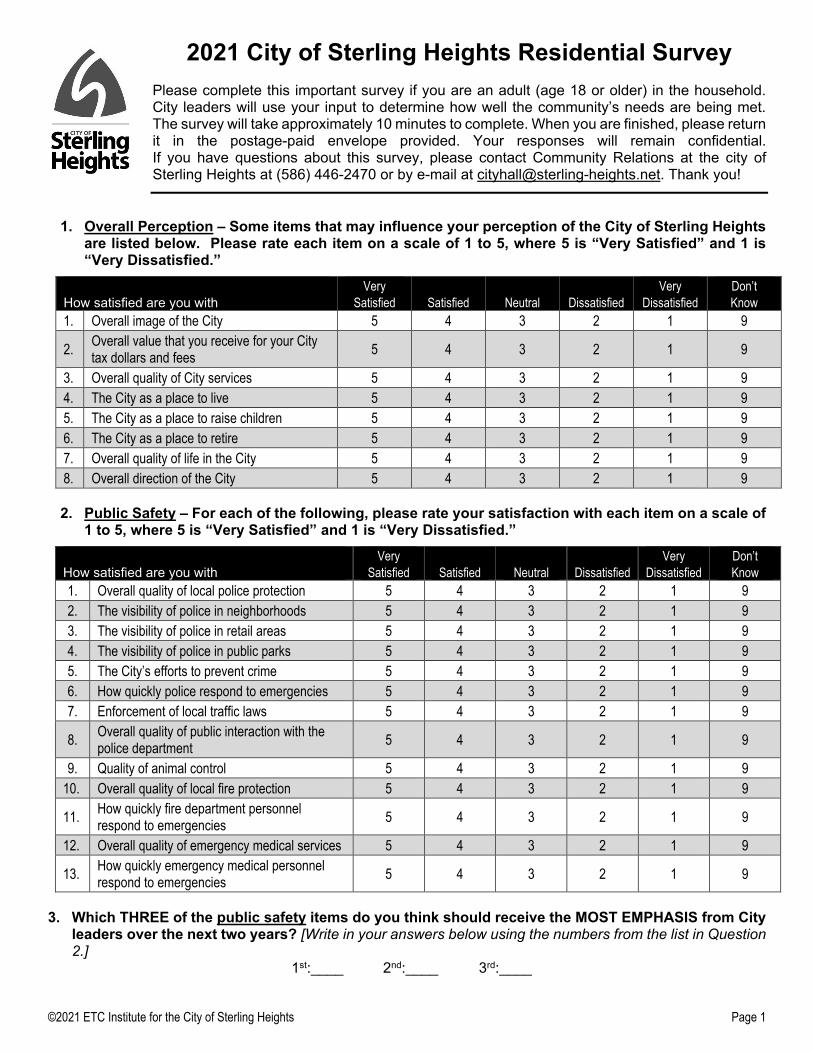
©2021 ETC Institute for the City of Sterling Heights Page 1
2021 City of Sterling Heights Residential Survey Please complete this important survey if you are an adult (age 18 or older) in the household. City leaders will use your input to determine how well the community’s needs are being met. The survey will take approximately 10 minutes to complete. When you are finished, please return it in the postage-paid envelope provided. Your responses will remain confidential. If you have questions about this survey, please contact Community Relations at the city of Sterling Heights at (586) 446-2470 or by e-mail at [email protected]. Thank you!
1. Overall Perception – Some items that may influence your perception of the City of Sterling Heights are listed below. Please rate each item on a scale of 1 to 5, where 5 is “Very Satisfied” and 1 is “Very Dissatisfied.”
How satisfied are you with
Very Satisfied Satisfied Neutral Dissatisfied
Very Dissatisfied
Don’t Know
1. Overall image of the City 5 4 3 2 1 9
2. Overall value that you receive for your City tax dollars and fees 5 4 3 2 1 9
3. Overall quality of City services 5 4 3 2 1 9 4. The City as a place to live 5 4 3 2 1 9 5. The City as a place to raise children 5 4 3 2 1 9 6. The City as a place to retire 5 4 3 2 1 9 7. Overall quality of life in the City 5 4 3 2 1 9 8. Overall direction of the City 5 4 3 2 1 9
2. Public Safety – For each of the following, please rate your satisfaction with each item on a scale of 1 to 5, where 5 is “Very Satisfied” and 1 is “Very Dissatisfied.”
How satisfied are you with
Very Satisfied Satisfied Neutral Dissatisfied
Very Dissatisfied
Don’t Know
1. Overall quality of local police protection 5 4 3 2 1 9 2. The visibility of police in neighborhoods 5 4 3 2 1 9 3. The visibility of police in retail areas 5 4 3 2 1 9 4. The visibility of police in public parks 5 4 3 2 1 9 5. The City’s efforts to prevent crime 5 4 3 2 1 9 6. How quickly police respond to emergencies 5 4 3 2 1 9 7. Enforcement of local traffic laws 5 4 3 2 1 9
8. Overall quality of public interaction with the police department 5 4 3 2 1 9
9. Quality of animal control 5 4 3 2 1 9 10. Overall quality of local fire protection 5 4 3 2 1 9
11. How quickly fire department personnel respond to emergencies 5 4 3 2 1 9
12. Overall quality of emergency medical services 5 4 3 2 1 9
13. How quickly emergency medical personnel respond to emergencies 5 4 3 2 1 9
3. Which THREE of the public safety items do you think should receive the MOST EMPHASIS from City
leaders over the next two years? [Write in your answers below using the numbers from the list in Question 2.] 1st:____ 2nd:____ 3rd:____
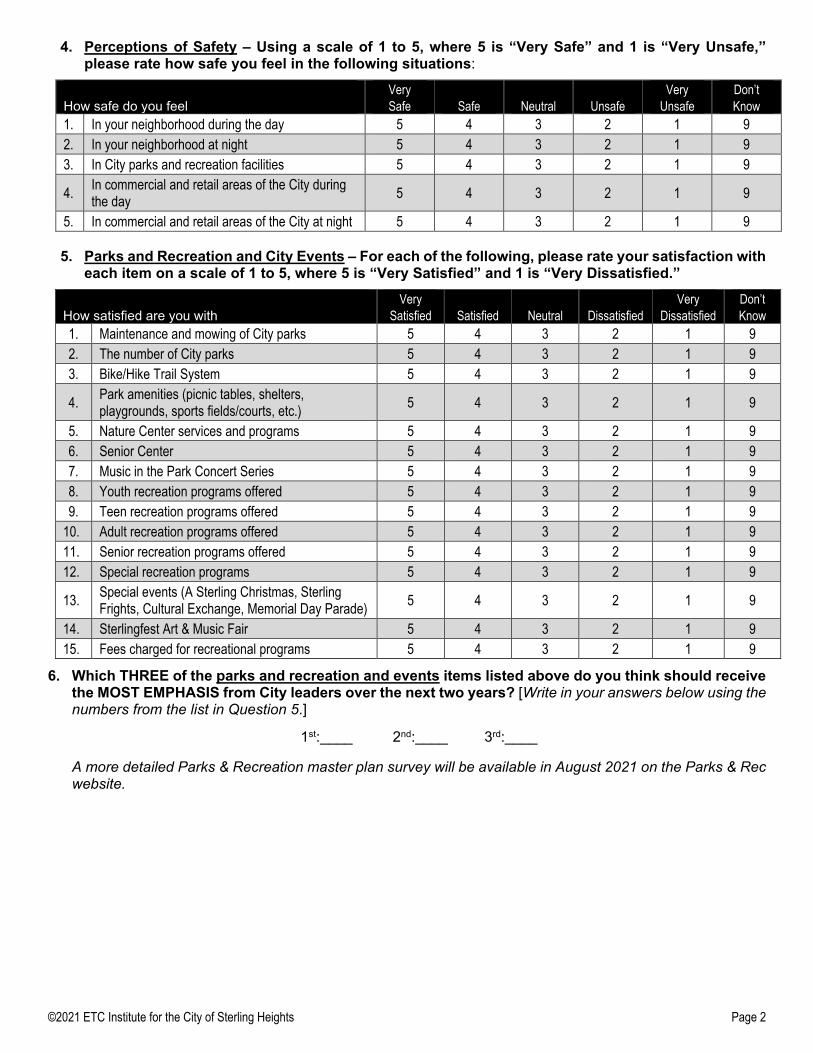
©2021 ETC Institute for the City of Sterling Heights Page 2
4. Perceptions of Safety – Using a scale of 1 to 5, where 5 is “Very Safe” and 1 is “Very Unsafe,” please rate how safe you feel in the following situations:
How safe do you feel
Very Safe Safe Neutral Unsafe
Very Unsafe
Don’t Know
1. In your neighborhood during the day 5 4 3 2 1 9 2. In your neighborhood at night 5 4 3 2 1 9 3. In City parks and recreation facilities 5 4 3 2 1 9
4. In commercial and retail areas of the City during the day 5 4 3 2 1 9
5. In commercial and retail areas of the City at night 5 4 3 2 1 9
5. Parks and Recreation and City Events – For each of the following, please rate your satisfaction with each item on a scale of 1 to 5, where 5 is “Very Satisfied” and 1 is “Very Dissatisfied.”
How satisfied are you with
Very Satisfied Satisfied Neutral Dissatisfied
Very Dissatisfied
Don’t Know
1. Maintenance and mowing of City parks 5 4 3 2 1 9 2. The number of City parks 5 4 3 2 1 9 3. Bike/Hike Trail System 5 4 3 2 1 9
4. Park amenities (picnic tables, shelters, playgrounds, sports fields/courts, etc.) 5 4 3 2 1 9
5. Nature Center services and programs 5 4 3 2 1 9 6. Senior Center 5 4 3 2 1 9 7. Music in the Park Concert Series 5 4 3 2 1 9 8. Youth recreation programs offered 5 4 3 2 1 9 9. Teen recreation programs offered 5 4 3 2 1 9
10. Adult recreation programs offered 5 4 3 2 1 9 11. Senior recreation programs offered 5 4 3 2 1 9 12. Special recreation programs 5 4 3 2 1 9
13. Special events (A Sterling Christmas, Sterling Frights, Cultural Exchange, Memorial Day Parade) 5 4 3 2 1 9
14. Sterlingfest Art & Music Fair 5 4 3 2 1 9 15. Fees charged for recreational programs 5 4 3 2 1 9
6. Which THREE of the parks and recreation and events items listed above do you think should receive the MOST EMPHASIS from City leaders over the next two years? [Write in your answers below using the numbers from the list in Question 5.]
1st:____ 2nd:____ 3rd:____
A more detailed Parks & Recreation master plan survey will be available in August 2021 on the Parks & Rec website.
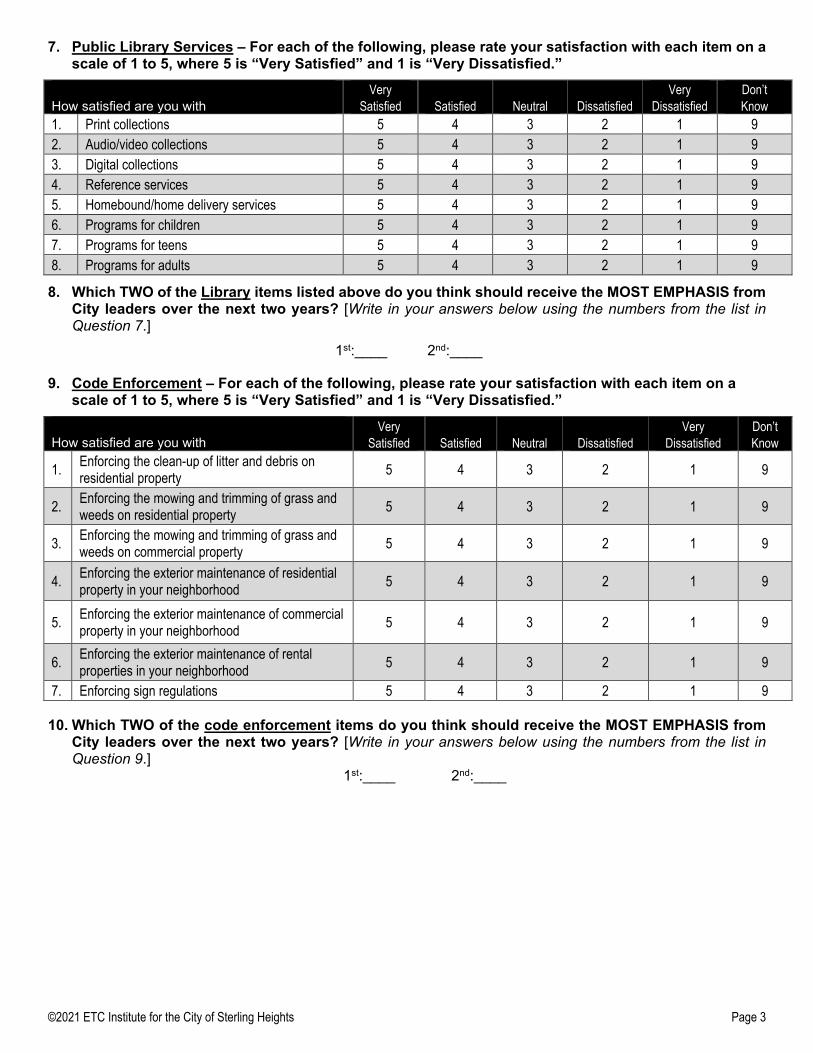
©2021 ETC Institute for the City of Sterling Heights Page 3
7. Public Library Services – For each of the following, please rate your satisfaction with each item on a scale of 1 to 5, where 5 is “Very Satisfied” and 1 is “Very Dissatisfied.”
How satisfied are you with
Very Satisfied Satisfied Neutral Dissatisfied
Very Dissatisfied
Don’t Know
1. Print collections 5 4 3 2 1 9 2. Audio/video collections 5 4 3 2 1 9 3. Digital collections 5 4 3 2 1 9 4. Reference services 5 4 3 2 1 9 5. Homebound/home delivery services 5 4 3 2 1 9 6. Programs for children 5 4 3 2 1 9 7. Programs for teens 5 4 3 2 1 9 8. Programs for adults 5 4 3 2 1 9
8. Which TWO of the Library items listed above do you think should receive the MOST EMPHASIS from City leaders over the next two years? [Write in your answers below using the numbers from the list in Question 7.]
1st:____ 2nd:____
9. Code Enforcement – For each of the following, please rate your satisfaction with each item on a scale of 1 to 5, where 5 is “Very Satisfied” and 1 is “Very Dissatisfied.”
How satisfied are you with
Very Satisfied Satisfied Neutral Dissatisfied
Very Dissatisfied
Don’t Know
1. Enforcing the clean-up of litter and debris on residential property 5 4 3 2 1 9
2. Enforcing the mowing and trimming of grass and weeds on residential property 5 4 3 2 1 9
3. Enforcing the mowing and trimming of grass and weeds on commercial property 5 4 3 2 1 9
4. Enforcing the exterior maintenance of residential property in your neighborhood 5 4 3 2 1 9
5. Enforcing the exterior maintenance of commercial property in your neighborhood 5 4 3 2 1 9
6. Enforcing the exterior maintenance of rental properties in your neighborhood 5 4 3 2 1 9
7. Enforcing sign regulations 5 4 3 2 1 9
10. Which TWO of the code enforcement items do you think should receive the MOST EMPHASIS from City leaders over the next two years? [Write in your answers below using the numbers from the list in Question 9.] 1st:____ 2nd:____
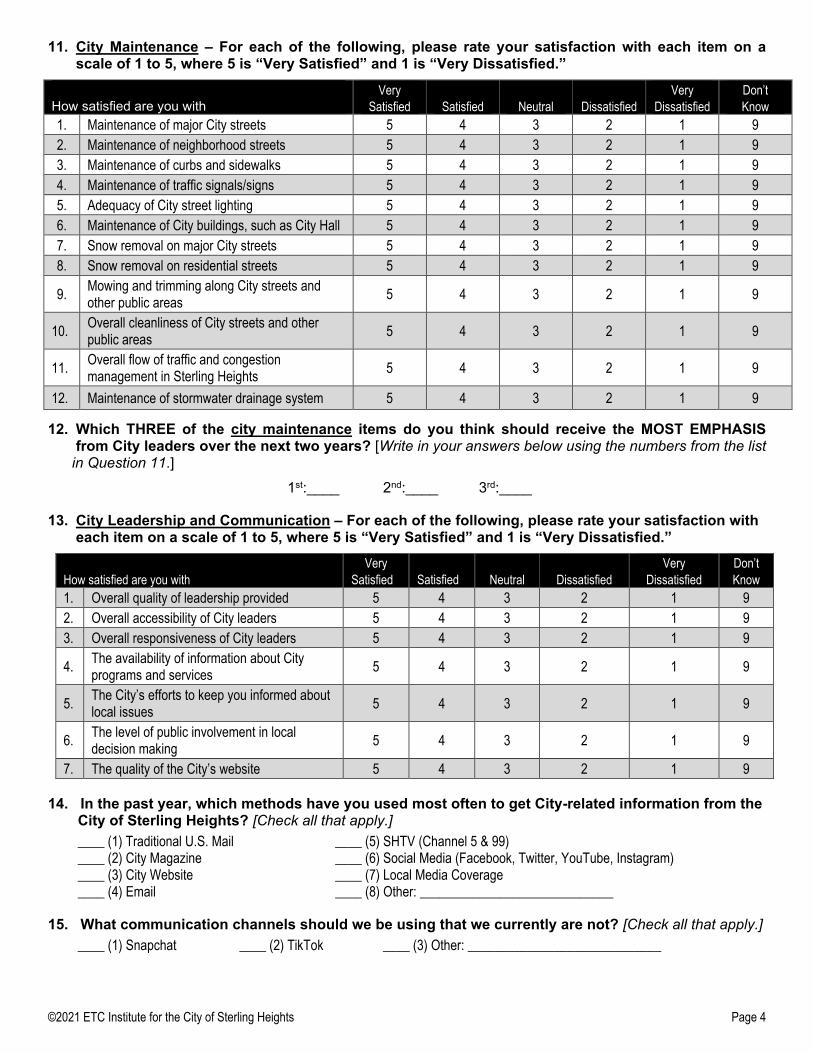
©2021 ETC Institute for the City of Sterling Heights Page 4
11. City Maintenance – For each of the following, please rate your satisfaction with each item on a scale of 1 to 5, where 5 is “Very Satisfied” and 1 is “Very Dissatisfied.”
How satisfied are you with
Very Satisfied Satisfied Neutral Dissatisfied
Very Dissatisfied
Don’t Know
1. Maintenance of major City streets 5 4 3 2 1 9 2. Maintenance of neighborhood streets 5 4 3 2 1 9 3. Maintenance of curbs and sidewalks 5 4 3 2 1 9 4. Maintenance of traffic signals/signs 5 4 3 2 1 9 5. Adequacy of City street lighting 5 4 3 2 1 9 6. Maintenance of City buildings, such as City Hall 5 4 3 2 1 9 7. Snow removal on major City streets 5 4 3 2 1 9 8. Snow removal on residential streets 5 4 3 2 1 9
9. Mowing and trimming along City streets and other public areas 5 4 3 2 1 9
10. Overall cleanliness of City streets and other public areas 5 4 3 2 1 9
11. Overall flow of traffic and congestion management in Sterling Heights 5 4 3 2 1 9
12. Maintenance of stormwater drainage system 5 4 3 2 1 9
12. Which THREE of the city maintenance items do you think should receive the MOST EMPHASIS from City leaders over the next two years? [Write in your answers below using the numbers from the list in Question 11.] 1st:____ 2nd:____ 3rd:____
13. City Leadership and Communication – For each of the following, please rate your satisfaction with each item on a scale of 1 to 5, where 5 is “Very Satisfied” and 1 is “Very Dissatisfied.”
How satisfied are you with
Very Satisfied
Satisfied Neutral Dissatisfied
Very Dissatisfied
Don’t Know
1. Overall quality of leadership provided 5 4 3 2 1 9 2. Overall accessibility of City leaders 5 4 3 2 1 9 3. Overall responsiveness of City leaders 5 4 3 2 1 9
4. The availability of information about City programs and services 5 4 3 2 1 9
5. The City’s efforts to keep you informed about local issues 5 4 3 2 1 9
6. The level of public involvement in local decision making 5 4 3 2 1 9
7. The quality of the City’s website 5 4 3 2 1 9
14. In the past year, which methods have you used most often to get City-related information from the City of Sterling Heights? [Check all that apply.]
____ (1) Traditional U.S. Mail ____ (5) SHTV (Channel 5 & 99) ____ (2) City Magazine ____ (6) Social Media (Facebook, Twitter, YouTube, Instagram) ____ (3) City Website ____ (7) Local Media Coverage ____ (4) Email ____ (8) Other: _____________________________
15. What communication channels should we be using that we currently are not? [Check all that apply.] ____ (1) Snapchat ____ (2) TikTok ____ (3) Other: _____________________________
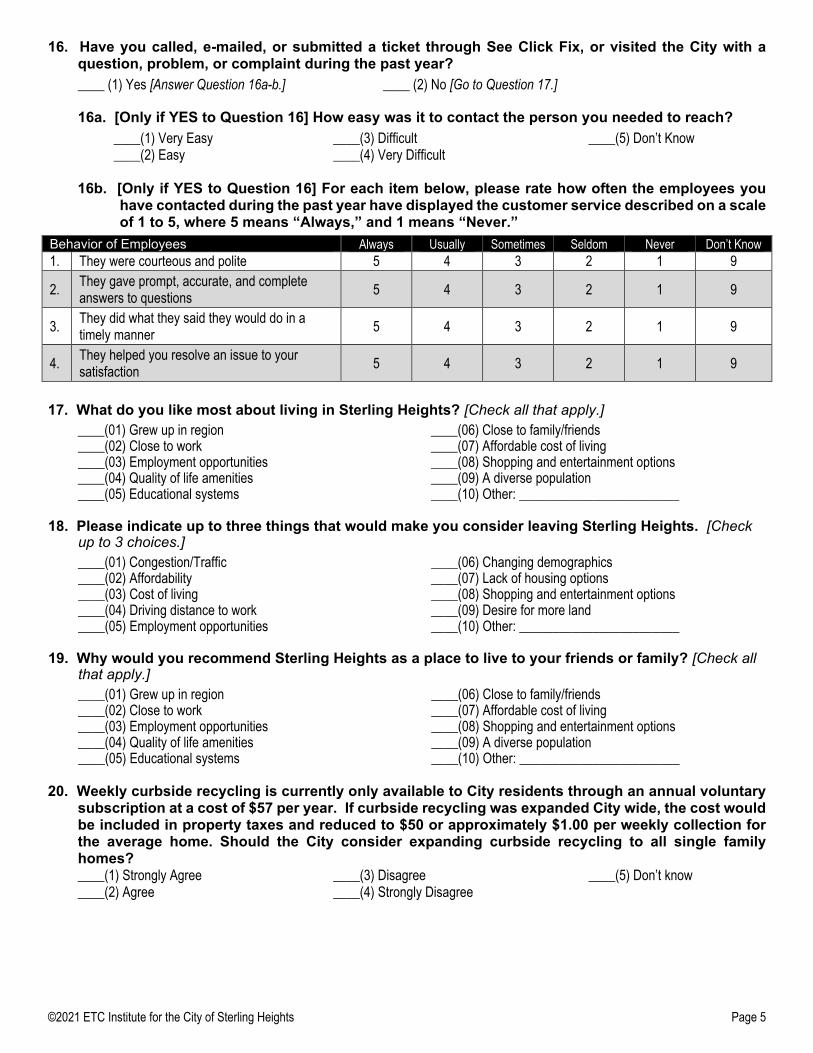
©2021 ETC Institute for the City of Sterling Heights Page 5
16. Have you called, e-mailed, or submitted a ticket through See Click Fix, or visited the City with a question, problem, or complaint during the past year? ____ (1) Yes [Answer Question 16a-b.] ____ (2) No [Go to Question 17.]
16a. [Only if YES to Question 16] How easy was it to contact the person you needed to reach?
____(1) Very Easy ____(2) Easy
____(3) Difficult ____(4) Very Difficult
____(5) Don’t Know
16b. [Only if YES to Question 16] For each item below, please rate how often the employees you
have contacted during the past year have displayed the customer service described on a scale of 1 to 5, where 5 means “Always,” and 1 means “Never.”
Behavior of Employees Always Usually Sometimes Seldom Never Don’t Know 1. They were courteous and polite 5 4 3 2 1 9
2. They gave prompt, accurate, and complete answers to questions 5 4 3 2 1 9
3. They did what they said they would do in a timely manner 5 4 3 2 1 9
4. They helped you resolve an issue to your satisfaction 5 4 3 2 1 9
17. What do you like most about living in Sterling Heights? [Check all that apply.] ____(01) Grew up in region ____(02) Close to work ____(03) Employment opportunities ____(04) Quality of life amenities ____(05) Educational systems
____(06) Close to family/friends ____(07) Affordable cost of living ____(08) Shopping and entertainment options ____(09) A diverse population ____(10) Other: ________________________
18. Please indicate up to three things that would make you consider leaving Sterling Heights. [Check
up to 3 choices.] ____(01) Congestion/Traffic ____(02) Affordability ____(03) Cost of living ____(04) Driving distance to work ____(05) Employment opportunities
____(06) Changing demographics ____(07) Lack of housing options ____(08) Shopping and entertainment options ____(09) Desire for more land ____(10) Other: ________________________
19. Why would you recommend Sterling Heights as a place to live to your friends or family? [Check all
that apply.] ____(01) Grew up in region ____(02) Close to work ____(03) Employment opportunities ____(04) Quality of life amenities ____(05) Educational systems
____(06) Close to family/friends ____(07) Affordable cost of living ____(08) Shopping and entertainment options ____(09) A diverse population ____(10) Other: ________________________
20. Weekly curbside recycling is currently only available to City residents through an annual voluntary
subscription at a cost of $57 per year. If curbside recycling was expanded City wide, the cost would be included in property taxes and reduced to $50 or approximately $1.00 per weekly collection for the average home. Should the City consider expanding curbside recycling to all single family homes?
____(1) Strongly Agree ____(2) Agree
____(3) Disagree ____(4) Strongly Disagree
____(5) Don’t know
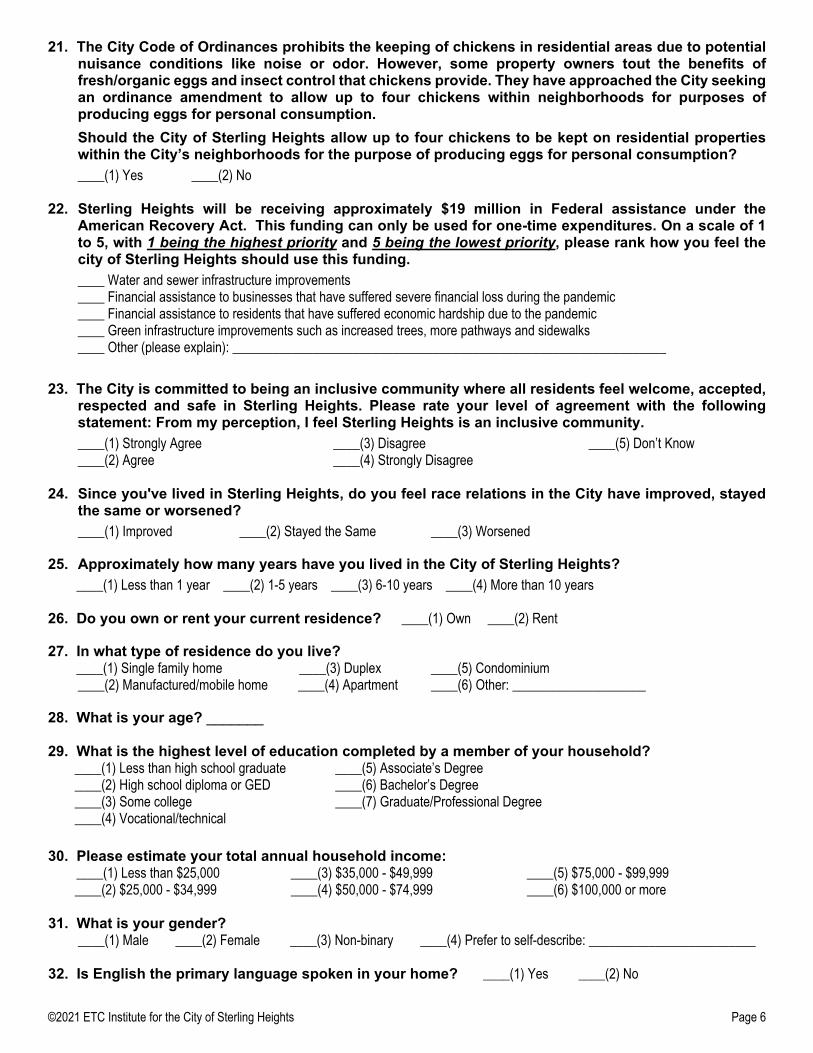
©2021 ETC Institute for the City of Sterling Heights Page 6
21. The City Code of Ordinances prohibits the keeping of chickens in residential areas due to potential nuisance conditions like noise or odor. However, some property owners tout the benefits of fresh/organic eggs and insect control that chickens provide. They have approached the City seeking an ordinance amendment to allow up to four chickens within neighborhoods for purposes of producing eggs for personal consumption. Should the City of Sterling Heights allow up to four chickens to be kept on residential properties within the City’s neighborhoods for the purpose of producing eggs for personal consumption?
____(1) Yes ____(2) No
22. Sterling Heights will be receiving approximately $19 million in Federal assistance under the American Recovery Act. This funding can only be used for one-time expenditures. On a scale of 1 to 5, with 1 being the highest priority and 5 being the lowest priority, please rank how you feel the city of Sterling Heights should use this funding. ____ Water and sewer infrastructure improvements ____ Financial assistance to businesses that have suffered severe financial loss during the pandemic ____ Financial assistance to residents that have suffered economic hardship due to the pandemic ____ Green infrastructure improvements such as increased trees, more pathways and sidewalks ____ Other (please explain): _________________________________________________________________
23. The City is committed to being an inclusive community where all residents feel welcome, accepted,
respected and safe in Sterling Heights. Please rate your level of agreement with the following statement: From my perception, I feel Sterling Heights is an inclusive community.
____(1) Strongly Agree ____(2) Agree
____(3) Disagree ____(4) Strongly Disagree
____(5) Don’t Know
24. Since you've lived in Sterling Heights, do you feel race relations in the City have improved, stayed
the same or worsened? ____(1) Improved ____(2) Stayed the Same ____(3) Worsened
25. Approximately how many years have you lived in the City of Sterling Heights? ____(1) Less than 1 year ____(2) 1-5 years ____(3) 6-10 years ____(4) More than 10 years 26. Do you own or rent your current residence? ____(1) Own ____(2) Rent
27. In what type of residence do you live? ____(1) Single family home ____(3) Duplex ____(5) Condominium ____(2) Manufactured/mobile home ____(4) Apartment ____(6) Other: ____________________
28. What is your age? _______ 29. What is the highest level of education completed by a member of your household? ____(1) Less than high school graduate ____(5) Associate’s Degree ____(2) High school diploma or GED ____(6) Bachelor’s Degree ____(3) Some college ____(7) Graduate/Professional Degree ____(4) Vocational/technical
30. Please estimate your total annual household income: ____(1) Less than $25,000 ____(3) $35,000 - $49,999 ____(5) $75,000 - $99,999 ____(2) $25,000 - $34,999 ____(4) $50,000 - $74,999 ____(6) $100,000 or more 31. What is your gender? ____(1) Male ____(2) Female ____(3) Non-binary ____(4) Prefer to self-describe: _________________________ 32. Is English the primary language spoken in your home? ____(1) Yes ____(2) No
©2021 ETC Institute for the City of Sterling Heights Page 7
33. What is your ethnic origin? [Check all that apply.] ____(1) American Indian or Alaskan Native ____(5) Latino/Hispanic
____(2) Arab/Middle Eastern ____(6) White/Caucasian ____(3) Asian or Pacific Islander ____(7) Other: ___________________________ ____(4) Black/African American
34. Are you registered to vote in Sterling Heights? ____ (1) Yes ____ (2) No 35. Are you currently employed? ____ (1) Yes ____ (2) No 36. Do you currently have access to broadband data (or hi-speed internet access)? ____ (1) Yes ____ (2) No
This concludes the survey. Thank you for your time! Please return your completed survey in the enclosed postage paid envelope addressed to:
ETC Institute, 725 W. Frontier Circle, Olathe, KS 66061
Your responses will remain completely confidential. The information printed to the right will ONLY be used to help identify the level of satisfaction with City services in your area. If your address is not correct, please provide the correct information. Thank you.