Embed Size (px)
Citation preview

North Beach Corpus Christi, TX
1
2021 Citi One-on-One Midstream/Energy Infrastructure Conference
August 18-19, 2021

22
Forward-Looking Statements
Statements contained in this presentation other than statements of historical fact are forward-looking
statements. While these forward-looking statements, and any assumptions upon which they are based, are
made in good faith and reflect our current judgment regarding the direction of our business, actual results will
likely vary, sometimes materially, from any estimates, predictions, projections, assumptions or other future
performance presented or suggested in this presentation. These forward-looking statements can generally be
identified by the words "anticipates," "believes," "expects," "plans," "intends," "estimates," "forecasts," "budgets,"
"projects," "could," "should," "may" and similar expressions. These statements reflect our current views with regard
to future events and are subject to various risks, uncertainties and assumptions.
We undertake no duty to update any forward-looking statement to conform the statement to actual results or
changes in the company’s expectations. For more information concerning factors that could cause actual
results to differ from those expressed or forecasted, see NuStar Energy L.P.’s annual report on Form 10-K and
quarterly reports on Form 10-Q, filed with the SEC and available on NuStar’s website at www.nustarenergy.com.
We use financial measures in this presentation that are not calculated in accordance with generally accepted
accounting principles (“non-GAAP”) and our reconciliations of non-GAAP financial measures to GAAP financial
measures are located in the appendix to this presentation. These non-GAAP financial measures should not be
considered an alternative to GAAP financial measures.
West Coast Renewable Fuel Network
33
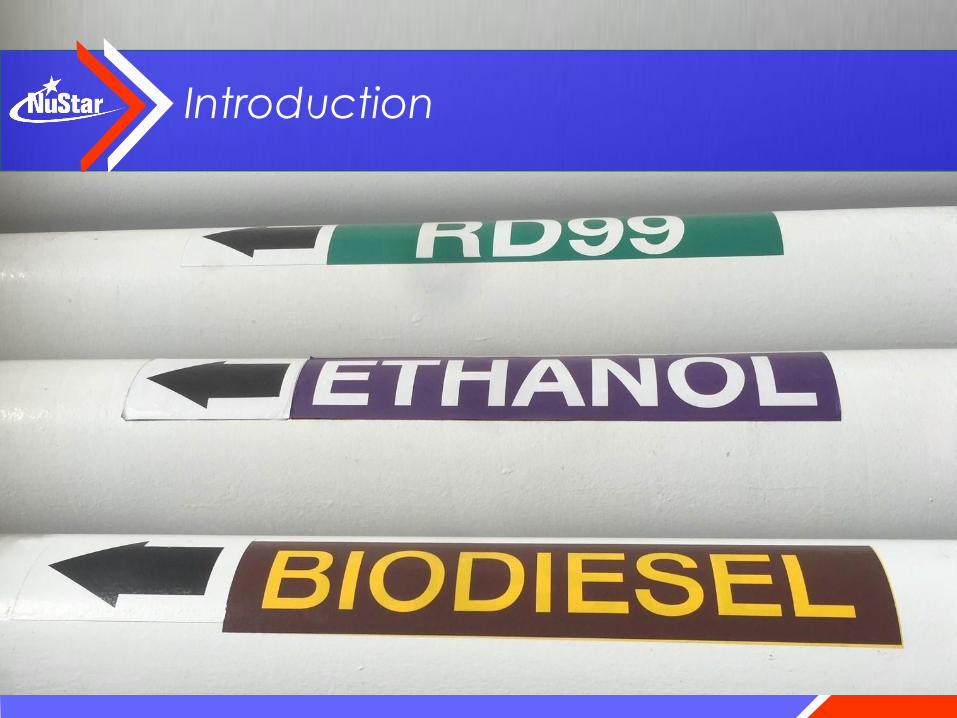
Introduction

44
During Second Quarter, We Continued to Focus on Our 2021 Strategic Priorities
Funding All of Our Spending From Internally
Generated Cash Flows
Continuing to Improve Our Debt Metrics
Promoting NuStar’s
Sustainability Excellence

55
Once Again, Our Strong Second Quarter 2021 Results Demonstrated, the Strength and Resilience of Our Business…
1 - Please see Appendix for reconciliations of non-GAAP financial measures to their most directly comparable GAAP measures
Pipeline Throughputs
EBITDA1 DCF1Q2
2021
Q1
2021

66
…And Our Recently Announced Asset Sale Demonstrates Our Commitment to Strengthening Our Balance Sheet
★ We recently agreed to sell nine terminals in the Northeast, Illinois and Florida to
Sunoco LP for $250 million, and we expect to close in Q4
★ With this sale, we will have divested non-core assets for a total of $876 million in
proceeds, in each case, at an attractive multiple
★ We deployed the proceeds from the 2018, 2019 and 2020 sales to improve our
debt metrics and to fund our project spending, and we intend to use the proceeds
from this Q4 2021 sale to lower our leverage
★ In addition to improving our debt metrics, the sale will also:
❑ Lower our reliability spending
❑ Reduce our operating expenses -
2018-Europe
Operations
2019-St.
Eustatius Facility
2020-Texas City Terminal
Q4 2021-Terminal
Asset Sale
$876MM Total
Proceeds

77
We Expect the Impact of the Asset Sale, Combined With the Financial Strength and Flexibility We Have Built Over Time, to Drive Strong Results for Full-Year 2021
Full-year 2021Results
Adjusted EBITDA $680-710MM*
Expect to Fund All NuStar’s 2021
Spending From Our Internally Generated
Cash Flows
*- After taking into account sale of terminals in the Northeast, Illinois and Florida, which we expect to close Q4 2021. Please see Appendix for reconciliations of non-GAAP financial measures to their most directly comparable GAAP measures.
DCF Coverage ~2.0x*
Debt-to-EBITDA Ratio ~4.0x*

88
We are Positioned to Focus 100% of Our Resources on Our Core Strategic Asset Footprint, Comprised of Refined Product, Crude Supply/Export and Renewable Fuels Logistics, as the Economy Recovers
Crude Supply/Export
Renewable Fuels
Refined Products
• St. James Terminal
• Permian System
• Corpus Christi Crude
System
• Midcontinent
• Texas
• Northern Mexico
• Established:
• West Coast Network
• Ethanol & bio-diesel
blending
• Developing:
• Ammonia System
Total Estimated
2021Strategic
Spending:
140-170MM
West Coast Renewable Fuels
Storage(~$50MM in 2021)
Permian Crude Pipeline System
(~$45MM in 2021)

99
U.S. Gasoline and Diesel Demand Have Continued to Rebound in 2021
★ In the second
quarter of 2020, U.S.
refined products
demand dropped
by 21% compared
to January 2020,
but by 2022,
gasoline and diesel
demand are
expected to
recover to pre-
Covid demand
levels
Source: EIA, Wells Fargo
95%
75%
90%87%
90%
97% 98%95%94%
87%91%
95%94%
99% 98%101% 100%
0%
20%
40%
60%
80%
100%
1Q20 2Q20 3Q20 4Q20 1Q21 2Q21 3Q21 4Q21 2022
U.S. Gasoline & Diesel Demand (as a % of Pre-Covid Demand)
Gasoline Diesel
Refined Products

1010
NuStar’s Refined Products Systems Serve Key Markets Across the Midcontinent and Texas…
Refined Products
Midcontinent Systems-
CENTRAL EAST: A 2,500-mile open pipeline system
with multiple delivery options❑ East Pipeline – This system serves important markets across the
Midwest/West, with flexible refined product supply from refineries
in McPherson, Kansas, El Dorado, Kansas and Ponca City,
Oklahoma
❑ North Pipeline – System flows from North Dakota to the Twin Cities,
serving both rural markets and large cities with refined product
supply from Mandan, North Dakota refinery
CENTRAL WEST: Comprised of over 2,200 miles of
pipeline with structural exclusivity, serving markets in
Texas and nearby states supplied from the McKee,
Texas refinery
South Texas Systems-
Around 700 miles of pipeline with structural
exclusivity, primarily serving markets in Texas and
northern Mexico supplied from refineries located in
Corpus Christi and Three Rivers, Texas

1111
… Which Have Been Resilient and Where We Expect to Continue to See Strong, Consistent Demand for Our Services
1 - Comparison of year-over-year demand; includes on-road product demand in our storage system2 – Comparison of 2Q 2019 versus 2Q 2021; includes on-road product demand in our storage system
★ Our refined product throughputs are up 34% over 2Q 2020 and up a strong 7% over 2Q 2019★ We are expecting 100% of our early 2020 (pre-Covid) levels for the remainder of the year
90%90%
65%
90%
75%
100%
95% 105%
80%
Refined Products
1
12

1212
The Outlook for U.S. Refinery Utilization has Improved
2019 2020 2021
96% 79% 85%U.S.
94% 64% 71%
PADD 1
96% 80%
PADD 3
101% 88% 94%
PADD 2
93% 82% 87%
PADD 4
87% 66% 75%
PADD 5
85%
Source: ESAI
U.S. Refinery Utilization (Average by PADD, 2019-2021)
NS Refined Products Pipeline
NS Crude Pipeline
NS Terminal
Refinery
★ U.S. refineries in all
PADDs are seeing
utilization higher
than their 2020
rates, but still
below their Pre-
Covid 2019 rates
★ By the end of 2021,
however, U.S.
refinery utilization is
expected to climb
to 85%
Refined Products Crude Supply/Export

1313
Improved Demand Should Drive Continued Steady Progress Toward Shale Production Growth
U.S. Shale
Production
Growth
Higher
Crude
Prices
Crude
Demand
Recovery
Increased
Refinery
Utilization
Refined Product
Demand
Rebound
2020
2021-22
Crude Supply/Export

1414
The Permian Basin is Leading U.S. Shale Rebound, With Our Permian System Continuing to Outperform
★ Because of its superior geology and low breakeven costs, the Permian Basin’s
production: ❑ Exited 2020 at 3.9
MMBPD, representing approximately 52% of the nation’s total shale output
❑ Projected to exit 2021 at 4.3 MMBPD; higher than both 2019 and 2020
❑ Is expected to return to stronger growth in 2022
Source: EIA Drilling Productivity Report (August 2021), Rystad, ESAI
-
3.7 3.9 4.0 4.5
0
2
4
2019 2020 2021 2022
MMBPD
Permian Basin Production
Outlook
(Avg as of August 2021)
★ Our system’s throughput volumes are now up 35% above Covid lows, while the rest of the Permian is up 19% from the Covid low
★ We continue to expect to exit 2021at 500 MBPD
286%
102%
0%
40%
80%
120%
160%
200%
240%
280%
Cu
mu
lative
Mo
nth
ly G
row
th (
%)
NuStar's System Throughput Growth & Recovery is
Outpacing the Permian Basin
NS Growth Permian Growth
0
5
10
MM
BP
D
Permian Oil Production
(2018-2025)
WTI @ $40 WTI @ $60
WTI @ $80
Crude Supply/Export

1515
$7$12$14$12
$19
$27$27$23
$31$35
$39$38$33
$38$33
$37$43
139159
187211
266314
327349
370395
435453
400423418402450
0
100
200
300
400
500
$0
$10
$20
$30
$402
Q1
7
3Q
17
4Q
17
1Q
18
2Q
18
3Q
18
4Q
18
1Q
19
2Q
19
3Q
19
4Q
19
1Q
20
2Q
20
3Q
20
4Q
20
1Q
21
2Q
21
EBITDA ($MM) System Receipts (Avg MBPD)1 – June 30, 2021 YTD
2 – June 30, 2021 MTD
3 – As of August 10, 2021
Please see Appendix for reconciliations of non-GAAP financial measures to their most directly comparable GAAP measures
Our “Core of the Core” Location has Attracted Top-Tier Customers With Activity to Support Steady Improvement in 2021and Beyond
25%
40%
35%
Major
Private
Other
Public
Highest-Quality “Rock”
Attracts Creditworthy,
Diverse Producers
…That Apply the Most
Advanced Technology
…And Produce Efficient
Growth Across Cycles
★ The quality of geological formations underlying our system attracts the strongest customers
❑ Our creditworthy customers include majors and the most prolific E&Ps, both private and public, in the basin, as
well as large independent refiners and marketers
❑ ~72% of our system’s revenue is generated from investment-grade (IG) rated and Non-IG BB-rated entities1
NS System Producer-type2
(% Average Daily Volume)
Producer Average Cost of Debt, Weighted by
Acreage:
4.1%3
★ We averaged 450 MBPD in 2Q21(comparable to
record breaking Pre-Covid average in 1Q20)
and continue to expect to exit 2021 at ~500
MBPD
★ Our producers have averaged around 20 rigs
throughout 2021 and have over 25% of the total
Permian drilled-uncompleted (DUCs) wells on
the system, which provide an important
platform for growth
NS Permian Crude System
Performance
(by Quarter)* Adjusted
*
July Average:
481MBPD
Crude Supply/Export

1616
May 2017 Current
System Capacity 220,000 700,000
Receipt Points 122 313
Pipeline Miles ~600 ~960
Storage (bbls) 900M 1.6MM
Third-Party Connections
NuStar Truck Unloading Facilities
NuStar Terminals
• PAA SUNRISE II
• PAA BASIN
• BRIDGETEX
• SUNOCO PE & WTG
CENTURION SCR
STATION
SUNOCO MIDKIFF
SUNPET
ENTERPRISE
CENTURION
PIPELINE
PAA
DELEK BIG SPRING
REFINERY
EPIC
NS STANTON
TERMINAL
NS BIG SPRING
TERMINAL
Borden
Glasscock
ReaganUpton
Midlan
d
Martin
Howard
Mitchell
Scurry
Dedicated Acres 500,000
AMI 5,000,000Colorado
City
Midland
NS CO CITY
TERMINAL
Our Mainline System was Complete in 2019, and Our Spending is Now to Keep Pace With Our Producers’ Gathering
Crude Supply/Export

1717
0
500
1,000
1,500
2,000
2,500
3,000
3,500
4,000
Ja
n-1
9
Fe
b-1
9
Ma
r-19
Ap
r-1
9
Ma
y-1
9
Ju
n-1
9
Ju
l-1
9
Au
g-1
9
Se
p-1
9
Oc
t-1
9
No
v-1
9
De
c-1
9
Ja
n-2
0
Fe
b-2
0
Ma
r-20
Ap
r-2
0
Ma
y-2
0
Ju
n-2
0
Ju
l-2
0
Au
g-2
0
Se
p-2
0
Oc
t-2
0
No
v-2
0
De
c-2
0
Ja
n-2
1
Fe
b-2
1
Ma
r-21
Ap
r-2
1
Ma
y-2
1
Ju
n-2
1
Ju
l-2
1
Ex
po
rts
(MB
PD
)
U.S. Gulf Coast Crude Exports by Hub
Corpus Christi Houston Beaumont Louisiana
★ Corpus Christi, historically a regional refinery and domestic marine delivery hub, has
evolved into a significant U.S. crude oil export hub❑ Currently, over half of the total ~3.0 MMBPD of Gulf Coast crude exports exit through Corpus
Christi ❑ Corpus Christi’s share of Gulf Coast crude exports remained steady- in 2020 and so far in 2021❑ The Port of Corpus Christi may see some growth as global crude demand recovers in early 2022
Source: RBN Energy
Corpus Christi
exports
have grown
from 0.4MMBPD
in mid-2019
to an average
of 1.5MMBPD
since January
2020
Gulf Coast Exports Held Up Well in 2020, and Corpus Christi Exports are Expected to Return to Growth in 2022
Crude Supply/Export

1818
69%67% 68%
56%
31%
33%32%
44%
0
200
400
3Q
2020
4Q
2020
1Q
2021
2Q
2021
2023
CCCS Refinery
Throughputs
CCCS Dock
Throughputs
CCCS MVCs
NuStar’s Corpus Christi Crude System(Average Throughputs/Quarter)MBPD
380
Our Corpus Christi Crude System’s MVCs- for Export and Local Refinery Supply- Provide Strength & Stability
In-bound Capacity Storage Capacity Out-bound Capacity
★ Unlike most other midstream
operators in the Port of Corpus
Christi, NuStar provides
unparalleled optionality for marine
exports and connectivity to local
refineries
★ U.S. shale production growth and
improving global demand will
drive the recovery and growth in
our CCCS volumes
TOTAL: 3.9MMbbl• Potential expansion
0.4MMbbl
TOTAL: 1.2MMBPD • South Texas Crude System 16”
Pipeline - 240MBPD• Taft 30”- 720MBPD and
expandable• Harvest 16” Pipeline - 240MBPD
TOTAL: 1.2MMBPD• EXPORT DOCKS- 750MBPD to
1.0MMBPD• REFINERY SUPPLY- 220MBPD
377
298321 312
Crude Supply/Export
★ The heart of our Corpus Christi Crude System is our North Beach Terminal, which receives barrels from
our South Texas Crude Oil Pipeline System, our 12” Three Rivers Supply Pipeline and our 30” pipeline from
Taft, as well as from third-party pipeline connections

1919
❑ We have customer commitments for 30MBPD through April 2022, and we are currently negotiating renewals that include unit train optionality
Our St. James Facility’s Storage and Extensive Connectivity- Pipeline, Marine and Rail- Position NuStar for Growth in the Future
❑ U.S. shale production growth and improving global demand will drive increased export opportunities
❑ We expect to be able to expand to 34MBPH with modest capital spend
❑ In 2019, Bayou Bridge began bringing WTI light, Bakken and Canadian barrels
❑ In January 2022, Capline owners plan to reverse its service to bring heavy Canadian (and potentially Bakken) crude for use in regional refineries and export
Pipeline Marine Rail
Connections:o 48” LOCAP – 2.0MMBPD
o 40” Capline Reversal (1Q 2022) –
600MBPD
o 24” Bayou Bridge – 456MBPD
o 20” Ship Shoal – 360MBPD
o 18” Zydeco – 360MBPD
o 16” Crimson Bonefish – 108MBPD
o 30” Marathon Garyville – 530MBPD
o 24” Maurepas Pipeline – 380MBPD
o 24” XOM Baton Rouge – 350MBPD
o 16” XOM North Line – 150MBPD
Three Docks (expandable):o Dock 1 – inland barge
dock (bi-directional)
o Dock 2 – ship dock (bi-
directional) Aframax
capable
o Dock 5 – ship dock
(receipt only)Light-
Loaded Suezmax
capable
Two Unit Train Facilities:o 240 unloading spots with
track to store four additional
unit trains
o Capable of unloading light,
sweet crude oil at 18MBPH
and heavy diluted crude oil
at 8MBPH
o Strong customer interest in
developing steam to
facilitate unloading different
grades of oil
Crude Supply/Export

2020
Carbon Emissions Reduction Goals, in the U.S. and Canada, Generate Growing Demand and Dislocations, Offer Opportunities for Well-positioned Midstream Logistics, Like NuStar’s
Stockton
Selby
Wilmington
Gulf Coast Supply
Singapore
Supply
Exports
to
Canada
Tacoma
Portland
★ Regulatory priorities on the West Coast and in
Canada continue to dramatically increase demand for renewable fuels in the region
★ At the same time, obtaining permits for greenfield projects in the region is difficult, which increases the value of existing assets
★ Our terminals have the access to facilities necessary to receive renewable fuels from outside the region and distribute renewable fuels across the West Coast
0
50
100
150
200
250
2020 2021 2022 2023 2024 2025 2026 2027 2028 2029 2030
Die
sel V
olu
me,
MB
PD
Fossil Diesel Biomass-Based + Renewable DieselSource: IHS Markit 2021
California’s Transportation Fuel Supply With Low -
Carbon Fuel Standard Compliance From
Petroleum Diesel Alternatives
Renewable Fuels

2121
We Already Handle and Store a Significant Proportion of the Total Renewable Fuels Volumes in California, the Largest Driving State in the Nation
★ We expect these percentages to continue to grow, along with associated
EBITDA, as we complete additional projects, under construction or in
development
BIODIESEL ETHANOL RENEWABLE
DIESEL
5% 18% 27%
NuStar’s Proportionate Share of
California’s Renewable Fuels Market
(First Quarter 2021 Total Volume1)
1 – Most recent available data Source: California Air Resource Board (CARB)
Renewable Fuels

2222
… And We Continue to Partner With Key Customers to Develop Our Renewable Fuels Network Across Our Footprint, as LCFS Mandates Proliferate to Additional Markets
Complete
PortlandConvert 36,000 bbls to biodiesel
Convert 57,000 bbls to renewable diesel
Selby
Construct truck-loading for renewable diesel
Multimodal shipment of renewable jet fuel
Convert 208,000 bbls to renewable jet fuel
Modify rail to handle renewable feedstockoffloading
Stockton
Convert 30,000 bbls to biodiesel
Convert 73,000 bbls to renewable diesel and expand renewable diesel handling to all 15 rail spots
Convert 151,000 bbls to renewable diesel 2H21 Est.
Connect to railcar ethanol offload facility 1H22 Est.
Wilmington
Convert 160,000 bbls to renewable diesel
Reconfigure dock for enhanced marine capability
1H25 Est.
22
★ We have established ourselves as an early mover in the renewable fuels transportation market by developing and
completing a number of renewable fuels projects
★ These projects, in partnership with our customers on the West Coast, have allowed NuStar to capture market share
and build on relationships with key global producers
❑ Our facilities are positioned to benefit from new production and conversion supply projects for renewable diesel,
renewable jet, ethanol and other renewable fuels as the renewable fuels market continues to grow
* Includes Biodiesel, Renewable Diesel and Ethanol
** June 2021 YTD - annualized
0
1,000
2,000
3,000
4,000
5,000
6,000
Portland Selby Stockton Wilmington
Mbpy
NuStar’s West Coast
Renewable
Fuels Volumes*2017
2018
2019
2020
2021E**
Renewable Fuels

2323
★Our Ammonia Pipeline is the
longest and only ammonia pipeline
in the country
❑ Spans over 2,000 miles from
Louisiana, north up through the
Midcontinent along the Mississippi
and beyond
❑ Today, the ammonia we transport
is used primarily for fertilizing crops
by farmers in our nation’s
“breadbasket”
❑We have capacity available to
transport “blue” or “green”
Ammonia
Renewable Fuels
In Addition to LCFS, We are Developing Near- and Long-term Renewables Opportunities for Our Ammonia System

2424
Gray Ammonia for which by-product
CO2 has been captured and stored,
reducing climate impact
Derived from natural gas, nearly all of
the world’s production made utilizing
the Haber-Bosch process
“Gray,” “Blue” and “Green” Ammonia Offer Actionable Positive Near-term Opportunities for Our Customers and Our Ammonia System
Sources: CF, Royal Society
Gray Ammonia Blue Ammonia Green Ammonia
Produced with hydrogen from
water electrolysis powered by
renewable energy
Renewable Fuels
Technology exists today to use LOWER- or ZERO-CARBON AMMONIA to reduce CO
2:
✓ By simply replacing conventional ammonia in existing uses, which is one of the most
widely used industrial chemicals on the planet
✓ As a fuel for
✓ Electricity generation to power remote telecommunication towers or to provide
electricity to back up supporting intermittent renewable power generation, like
wind and solar
✓ “Greening” maritime transportation
✓ Decarbonizing heating and cooling
✓ Internal combustion engines, turbines and batteries
✓ As a safe, efficient mode for hydrogen transport
CO2

South Texas Crude System
2525
APPENDIX

2626
NuStar By-the-numbers
NY
SE:
NS
•Common Unit Price(1): $16.04
•Distribution/CU/Year: $1.60
•Yield(1): 10.0%
•Market Cap(1): ~$2 billion
•Credit Ratings:
➢ Moody’s: Ba3 (Stable)
➢ S&P: BB- (Stable)
➢ Fitch: BB- (Stable)
•Enterprise Value: ~$7 billion
•Total Assets: ~$6 billion
•Pipeline Miles: ~10,000
•Pipeline Volumes(2): 1.9MMBPD
•Storage Capacity: ~72MMB
•Storage Throughput Volumes(2): 386MBPD
1. As of August 16, 20212. Average daily volume for the quarter ended June 30, 2021

2727
Long-term Commitments From Creditworthy Customers
44%
12%
44%
Investment-Grade
Large Private or International (Not rated)
Other
NuStar Investment-Grade (IG) Customers(% 2021 Revenues)
Pipeline Segment ~60% IG
Storage Segment ~59% IG
37% 40%
23%
Take-or-pay
Contracts
Structurally
Exclusive
Other
Pipeline Segment Contracted1 Revenues(% 2021 Projections)
64%
36%
Take-or-pay
Contracts
Other
Storage Segment Contracted Revenues(% 2021 Projections2)
1 - committed through take or pay contracts or through structural exclusivity (uncommitted lines serving refinery customers with no competition)
2 - after taking into account revenues from terminals in the Northeast, Illinois and Florida, expected to be sold early in the fourth quarter of 2021

2828
$185 $250
$600 $500
$550 $600
$322 $403 $74
$810
$24
$0
$250
$500
$750
$1,000
Liquidity 2021 2022 2023 2024 2025 2026 2027 2028-
2029
2030 2038-
2041
2043
Receivables Financing
Sub Notes
GO Zone Financing
Senior Unsecured Notes
Revolver
$834
$259
LIQUIDITY($MM)1
Liquidity and Debt Maturity Schedule
★ In March 2020, we extended our revolver term through October 2023
★ In September 2020, we issued two $600 million tranches of five-year and 10-year senior unsecured notes maturing
in 2025 and 2030
❑ We utilized the proceeds to repay our debt
★ We utilized cash flows and our revolver to pay-off our February 2021 bond maturities, and we plan to utilize our
liquidity to pay-off our February 2022 bond maturities as well
Debt Maturities(As of 6/30/2021)
($MM)
1 – Liquidity as of June 30, 2021

2929
Capital Structure as of June 30, 2021 ($ in Millions)
$1.0B Credit Facility $ 185
NuStar Logistics Notes (4.75%) 250
NuStar Logistics Notes (5.625%) 550
NuStar Logistics Notes (5.75%) 600
NuStar Logistics Notes (6.00%) 500
NuStar Logistics Notes (6.375%) 600
NuStar Logistics Sub Notes 403
GO Zone Bonds 322
Receivables Financing 74
Finance Lease Liability 57
Other (40)
Total Debt $3,501
Common Equity and AOCI $431
Series A, B and C Preferred Units $756
Series D Preferred Units $608
Total Equity1 1,795
Total Capitalization $5,296
★ As of June 30, 2021:
❑ Credit facility availability ~$810MM
❑ Debt-to-EBITDA ratio2 4.27x
1 - Total Equity includes Partners’ Equity and Mezzanine Equity (Series D Preferred Units)
2 - Please see Appendix for reconciliations of non-GAAP financial measures to their most directly comparable GAAP measures

3030
Reconciliation of Non-GAAP Financial Information

3131
Reconciliation of Non-GAAP Financial Information (continued)

3232
Reconciliation of Non-GAAP Financial Information (continued)

3333
Reconciliation of Non-GAAP Financial Information (continued)

3434
Reconciliation of Non-GAAP Financial Information (continued)

3535
NuStar Contact Information
INVESTOR RELATIONS
For additional information about corporate sustainability at NuStar, visithttp://www.NuStarEnergy.com/Sustainability
SUSTAINABILITY
(210) 918-INVR (4687)

Susta inabi l i tyJ u l y 1 9 , 2 0 2 1
R e s p o n s i b l y R e s i l i e n t

Forward-looking Statements
Statements contained in this presentation other than statements of historical fact are forward-looking statements.
While these forward-looking statements, and any assumptions upon which they are based, are made in good faith
and reflect our current judgment regarding the direction of our business, actual results will likely vary, sometimes
materially, from any estimates, predictions, projections, assumptions or other future performance presented or
suggested in this presentation. These forward-looking statements can generally be identified by the words
"anticipates," "believes," "expects," "plans," "intends," "estimates," "forecasts," "budgets," "projects," "could,"
"should," "may" and similar expressions. These statements reflect our current views with regard to future events
and are subject to various risks, uncertainties and assumptions.
We undertake no duty to update any forward-looking statement to conform the statement to actual results or
changes in the company’s expectations. For more information concerning factors that could cause actual results to
differ from those expressed or forecasted, see NuStar Energy L.P.’s annual report on Form 10-K and quarterly
reports on Form 10-Q, filed with the SEC and available on NuStar’s website at www.nustarenergy.com. We use
financial measures in this presentation that are not calculated in accordance with generally accepted accounting
principles (“non-GAAP”) and our reconciliations of non-GAAP financial measures to GAAP financial measures are
located in the appendix to this presentation. These non-GAAP financial measures should not be considered an
alternative to GAAP financial measures.
R e s p o n s i b l y R e s i l i e n t 2

4INTRODUCTION: Building on 20 Years of Sustainability Excellence
10 ENVIRONMENTAL: Protecting People & the Planet
22SOCIAL: Engaging Our Employees & Building Our Communities
29GOVERNANCE: Assuring Responsive Management
R e s p o n s i b l y R e s i l i e n t 3
TABLE OF CONTENTS

INTRODUCTIONBuilding on 20 Years of Sustainability Excellence
R e s p o n s i b l y R e s i l i e n t 4

O U R S U S T A I N A B I L I T Y C O M M I T M E N T
Brad BarronPresident & Chief Executive Officer, NuStar Energy L.P.
Doing the right thing for the right reasons is deeply ingrained in NuStar’sculture of responsibility, caring and sharing and has been since NuStar wasestablished 20 years ago. In fact, long before ESG became a common term,one of the things that made NuStar such a great place to work was our strongcorporate culture, which was created by our Chairman, Bill Greehey. In ourculture, we treat everyone with respect, we give back to our communities, weprotect the environment, and we demand that all of our employees holdthemselves and each other to the highest ethical standards.
We are proud of our record of responsible operations, and we are committedto maintaining excellence and continuing to take care of one another and ourplanet. We are also proud of the resilience and strength our business hasshown, across economic cycles and our footprint.
We are focused on nurturing that resilience and strength to ensure NuStarcontinues to prosper as the Nation’s and the World’s growing energy needsevolve, and we are already demonstrating our ability to do just that throughthe success of our West Coast renewable fuels logistics network, which bothgenerates solid returns for our investors and helps lower carbon emissions incommunities across the region.
We are also focused on continuing to do the right thing, across our operations,every day of every week: to protect the environment, our communities andour employees, to ensure safe, reliable energy service to our customers and tobuild value for our investors.
R e s p o n s i b l y R e s i l i e n t 5
We are Committed to Maintaining Excellence and Taking Care of Each Other and Our Planet, now and in the Future

O U R S U S T A I N A B I L I T Y P R I O R I T I E S
Protecting People & the
Planet
SOCIAL
AssuringResponsive
Management
GOVERNANCE
Engaging Our Employees &
Building Our Communities
ENVIRONMENTAL
R e s p o n s i b l y R e s i l i e n t 6

NuStar Transports and Stores Crude Oil, Petroleum Products, Ammonia and Renewable Fuels in Markets Across North America
O U R B A L A N C E D M I D S T R E A M A S S E T S
10,000pipeline miles
72 MMbarrels of storage
capacity
73terminal facilities
645 MMbarrels transported in 2020
172 MMbarrels
throughput in 2020
1.8 MMbpdaverage daily volume in 2020
Pipelines: Terminals:
7R e s p o n s i b l y R e s i l i e n t

O U R S T R E N G T H & R E S I L I E N C E I N 2 0 2 0
• Ensured reliable, uninterrupted delivery of essential energy services• Maintained safety and environmental stewardship, again outperforming
our industry peers in 2020• Prioritized employee health & protection throughout response across our
assets• Implemented physical distancing, restricted facility access & established
cleaning protocols at all worksites• Invested in ventilation and air-handling improvements• Provided free COVID-19 testing and vaccines• Maintained frequent leadership communication• Pledged over $1MM to community COVID-19 relief funds2
Even Through 2020’s Challenges, We Maintained Safe, Reliable Operations, Protected Our Employees, as Well as Their Families and Communities, and Generated Solid Results
R e s p o n s i b l y R e s i l i e n t 8
Adjusted EBITDA1
$723 MM
2020 Results
1 - Please see Appendix for reconciliations of non-GAAP financial measures to their most directly comparable GAAP measures
2 – Includes pledges from company and chairman

Community investment
(including employee contributions to
United Way)
$5.5MILLION
Distributions to
investors
$321MILLION
Employee compensation & benefits for our
1,408 employees1
~$230MILLION
O U R E C O N O M I C I M P A C T I N 2 0 2 0
R e s p o n s i b l y R e s i l i e n t
In 2020, We Also Contributed to Our Communities’ and Our Employees’ Economic Health
9
1 – As of December 31, 2020

ENVIRONMENTALProtecting People & the Planet
R e s p o n s i b l y R e s i l i e n t 10

COMMITTED TO ASSURING SAFE, RELIABLE ACCESS TO ENERGY AND MAINTAINING EXCELLENCE ACROSS OUR BUSINESS
DEVELOPING solutions to respond to growth and evolution of energy needs in the markets we serve, as
we have through our West Coast renewable fuels
logistics network, which FACILITATES
cleanRENEWABLE FUELS
to improve air quality on theWest Coast and beyond
• MAINTAINING our industry-leading health and safety record
• ASSURING safety and reliability through inspection and monitoring
• INCREASING our energy efficiency • LOWERING our emissions• PREPARING for emergencies• PROTECTING our business and our
communities with a robust cybersecurity program
OPERATING RESPONSIBLYBUILDING RESILIENCE
R e s p o n s i b l y R e s i l i e n t 11
We are Committed to:

0
50
100
150
200
250
300
2020 2021 2022 2023 2024 2025 2026 2027 2028 2029 2030
Die
sel V
olu
me,
MB
PD
Fossil Diesel Biomass-Based + Renewable Diesel
Source: IHS Markit © 2021 IHS Markit
BUILDING RESILIENCE: DECARBONIZING DRIVING ON THE WEST COAST
• Regulatory priorities on the West Coast are dramatically increasing demand for renewable fuels in the region
• At the same time, obtaining permits for greenfield projects in the region is difficult, which increases the value and importance of existing assets
• Our terminals have the access to facilities necessary to receive bio-fuels from outside the region and to provide a base for distribution of renewable fuels across the West Coast
Transportation Fuel Supply With Low-Carbon Fuel Standard Compliance From Petroleum Diesel
Alternatives
Wilmington
Tacoma
Portland
Stockton
Selby
Gulf Coast
Supply
International Exports
Singapore Supply
Our West Coast Renewable Fuels Logistics Network is Playing an Integral Role in Significant Reductions in Carbon Emissions
R e s p o n s i b l y R e s i l i e n t 12

BUILDING RESILIENCE: RENEWABLE FUELS HANDLING LEADER
• We expect these percentages to increase through 2023, along with associated EBITDA, as we complete additional projects currently in planning stages or under construction
BIODIESEL ETHANOL RENEWABLE DIESEL
7% 18% 28%
NuStar Now Handles a Significant Proportion of California’s Growing Renewable Fuels Market
1 – Most recent available data
Source: California Air Resource Board (CARB)
R e s p o n s i b l y R e s i l i e n t 13
NuStar’s Share of California’s Renewable Fuels Market(Full-Year 2020 Total Volume1)

BUILDING RESILIENCE: LOW-CARBON MANDATE OPPORTUNITY
The Success of California’s Program is Driving Action Well Beyond the “Golden State” That Will Drive Midstream Opportunities
R e s p o n s i b l y R e s i l i e n t 14
20States
CONSIDERING Programs
7
2
2
8
3
5
5
64
1
10
9
11
LCFS in-place
LCFS plan proposed
LCFS under consideration
Notable Announced U.S. Renewables Conversion Projects1: Marathon Dickinson Refinery Conversion – 2020
(in-service)2: Ryze Renewables Las Vegas / Reno – 20213: Diamond Green Diesel Expansion – 20214: CVR Wynnewood Refinery Conversion – 20225: HollyFrontier Cheyenne / Artesia Refinery
Conversions – 20226: GCEH Bakersfield – 20227: P66 Rodeo Refinery Conversion – 2021 (partial),
2024 (full)8: Marathon Martinez Refinery Conversion – 20239: Heartwell Renewables (Hastings, NE) – 202310: Diamond Green Diesel Port Arthur – 2H 202311: Vertex Mobile – 2023

BUILDING RESILIENCE: PIPELINES ARE THE SAFEST, MOST ENERGY-EFFICIENT CHOICE
Pipelines are the Best Alternative for Fuel Transportation, Whether Conventional or Renewable
Pipelines have the
LOWEST Greenhouse Gas Emissions (GHGs):
Sources: “Pipelines are Safest for Transportation of Oil and Gas” Manhattan Institute for Policy Research 2013 “The Permian Basin’s Demand for Crude Oil Tanker Trucks Could Quadruple in Q2” Freightwaves 2019Association of Oil Pipe Lines (AOPL) and Reuters
• Trucks are 34 times more likely than liquid pipelines to experience an incident
Pipelines are the
SAFEST Mode of Energy Transportation:
Transporting the Volume
NuStar Moves in ONE DAY Would Require:
~2,500 Rail cars
~9,500 Trucks
• Trucks emit 467% more than pipelines
R e s p o n s i b l y R e s i l i e n t 15
or

RESPONSIBLE OPERATIONS: MAINTAINING OUR STRONG SAFETY CULTURE & RECORD
3 year
0.69
3 yearAverage(1):
0.70
Our Industry-leading Record Demonstrates the Fact That NuStar’s #1 Priority is the Health and Safety of Our Workforce and Our Communities
1 – Industry averages derived from 2018-2019 Bureau of Labor Statistics (BLS) Data. 2019 averages carried forward to 2020 for illustration purposes.
Safety Excellence Award10-time recipient
85% of eligible facilities
7.5Xbetter
2Xbetter
• In 2020, as in years past, our health and safety record was substantially better than our peers✓ Over 7.5 times better than the Bureau of Labor Statistics (BLS) comparison data for the Bulk Terminals Industry✓ And 2 times better than the BLS data for the Pipeline Transportation Industry
• NuStar has received the International Liquids Terminals Association’s (ILTA) Safety Excellence Award 10 times, which is awarded based in part on OSHA safety reports
• We participate in the OSHA Voluntary Protection Program (VPP), which promotes effective worksite safety and health✓ 85% of our eligible U.S. terminals are VPP-certified
• We work every day of every year to prevent any releases ✓ In 2020, we released less than 0.00016% of our total barrels moved
R e s p o n s i b l y R e s i l i e n t 16

RESPONSIBLE OPERATIONS: ASSURING SAFETY AND RELIABILITY THROUGH
INSPECTION
70 Internal &
369 External
Inspections
R e s p o n s i b l y R e s i l i e n t
71 API
Internal &
369 External
Inspections
Inspected
Over 2,000Miles of
Pipeline
Inspected
Over 250Water-
Crossings
20,000+ LDAR (Leak detection and repair)
Component Inspection Program
Nearly 300
Agency Inspections
Completed
Over 2,000 Aerial Inspections & Over 350,000
Miles
26% of Total
Barrels of Storage
23% of Total DOT Pipeline
Miles
17Statistics are for 2020 unless otherwise noted
In 2020, We Continued to Execute on Our Rigorous Inspection Program Across Our Assets
RESPONSIBLE OPERATIONS: ASSURING SAFETY AND RELIABILITY
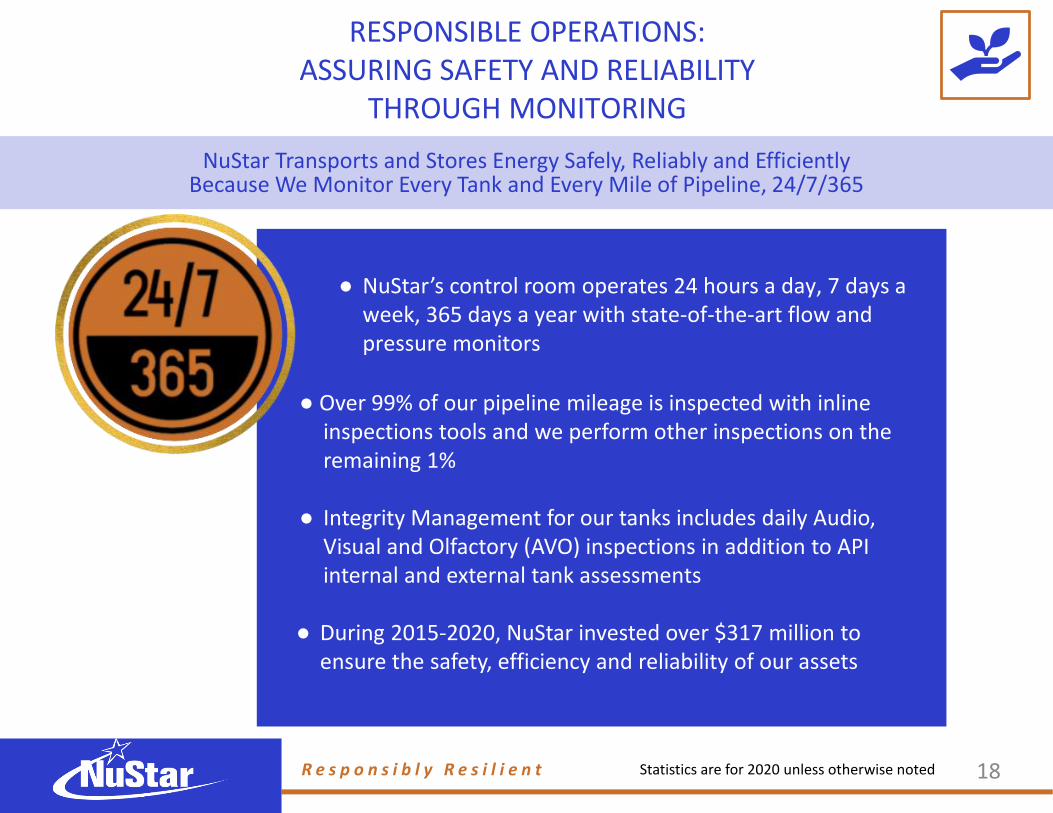
THROUGH MONITORING
NuStar Transports and Stores Energy Safely, Reliably and Efficiently Because We Monitor Every Tank and Every Mile of Pipeline, 24/7/365
70 Internal &
369 External
Inspections$____Invested on
integrity programs 2015-2020
R e s p o n s i b l y R e s i l i e n t 18Statistics are for 2020 unless otherwise noted
● NuStar’s control room operates 24 hours a day, 7 days a week, 365 days a year with state-of-the-art flow and pressure monitors
● Over 99% of our pipeline mileage is inspected with inline inspections tools and we perform other inspections on the remaining 1%
● Integrity Management for our tanks includes daily Audio, Visual and Olfactory (AVO) inspections in addition to API internal and external tank assessments
● During 2015-2020, NuStar invested over $317 million to ensure the safety, efficiency and reliability of our assets

RESPONSIBLE OPERATIONS:INCREASING EFFICIENCY AND LOWERING EMISSIONS
R e s p o n s i b l y R e s i l i e n t
NuStar’s Goal is to Reduce Emission Intensity in Relation to Volume of Product Handled as We Continue to Grow Our Operations
19
We are exploring further investments
in lower emission and low-carbon fuels
including hydrogen and renewables
Emission Reductions Actions Include:
• Switching diesel pumps to electric and pursuing wind and solar power sources
• Upgraded to LED lighting at 60 facilities, with more to come
• Using drag reducing agent (DRA) and variable frequency drives (VFDs) on our pipelines to increase our energy efficiency
• Obtaining emission offsets for renewable fuels and other projects
• Operating and maintaining vapor recovery and combustor systems, many of them over 99% efficient
We are always looking for ways to
optimize our systems to reduce energy use
and increase
energy efficiency
NuStar facilities meet or exceed the Clean Air Act, state air laws and their
emission regulations
NuStar facilities meet or exceed air emission permits,
including for operations and modifications

RESPONSIBLE OPERATIONS: PREPARING FOR EMERGENCIES
● We perform joint drills and exercises with regulatory agencies and jurisdictions to ensure that our plans are robust
● We also perform internal terminal and pipeline training exercises that include:
✓ Full-scale personnel deployment
✓ Tabletop exercises ✓ Equipment
deployment ✓ Unannounced
preparedness exercises
These exercises enhance NuStar’s ability to respond to a large-scale incident beyond the
response capacity of a single region or business unit
We Regularly Review, Audit, Update and Test Our Response Plan and Conduct Drills
R e s p o n s i b l y R e s i l i e n t
We maintain a dedicated Emergency
Operations Center
We have Emergency Response
Teams at key facilities
We completed more than 14,000
hours of emergency response,
environmental and safety training
Despite COVID-19 restrictions, NuStar still performed over 400 drills & exercises
NuStar responded to more than 90,000 Call Before You Dig
requests
We held more than 180 in person public safety meetings and distributed almost
700,000 safety brochures
Annual Multi-Party Exercises
NuStar team membersparticipated in
multiple stakeholder emergency exercises
with over 350 participants, including several governmental
agencies
Statistics are for 2020
20

RESPONSIBLE OPERATIONS: CYBERSECURITY ACROSS THE COMPANY
As an Operator of Critical Energy Infrastructure, We Recognize the Importance of Cybersecurity, and We Have Built and Continue to Test and Improve a Robust Program to Prevent, Detect and Respond to Potential Threats
Composed of representatives from across the company,
our Cyber Risk Governance Committee oversees the
effectiveness of our Cybersecurity Program and reports to
our Board and executive management
• Participation in industry and peer cybersecurity groups
• Vulnerability scanning, patch management, andpenetration tests across our systems
• Cyber Incident Response Planand cross-organizational tabletop exercises
• Regular risk assessments
• Annual cybersecurity trainingfor all employees with ‘refresher’ activities throughout the year
NuStar’s Cybersecurity Program includes:
Cyber Risk Governance Committee
Information Services
Internal Audit
Legal
Controller/SOX
Operations
R e s p o n s i b l y R e s i l i e n t 21
Human Resources

SOCIALEngaging Our Employees & Building Our Communities
R e s p o n s i b l y R e s i l i e n t 22

We Have Been Recognized for Our Safe, Responsible Operations and Our Commitment to Our Employees and Diversity
O U R A W A R D S & R E C O G N I T I O N S
Safety Excellence Award10-time recipient
12times
R e s p o n s i b l y R e s i l i e n t 23
5 times

COMMITTED TO NURTURING DIVERSITY
from 2018
+2.9from 2018
from 20 18
We are Focused on Assuring NuStar is a Positive, Inclusive and Rewarding Workplace With a Diverse, Representative Workforce, at Every Level, From Rank and File to Upper Management
R e s p o n s i b l y R e s i l i e n t 24
of our Senior Executive Team are women & minorities
50%49%42%
of our Corporate HQ employees who are managers+ are women & minorities
of our U.S. employees are women & minorities

COMMITTED TO COMMUNITY ENGAGEMENT
We Invest in Our Communities: Partnering With Local Organizations and Helping to Build Safe,Vibrant Communities
• Our employees take great pride in giving back and building a brighter future for our neighbors by contributing time, talent, money and other resources to hundreds of community initiatives each year
• NuStar maintains local volunteer councils in each community in which we operate to contribute to the charitable and civic causes unique to that local community
R e s p o n s i b l y R e s i l i e n t 25
Over 80board positions
held by NuStar employees on
non-profit boards

• We are proud to provide our employees with one of the best health & welfare benefits packages in the industry* and other resources tosupport our employees’ well-being
• We provide leadership and development opportunities through: ✓ Clearly defined career paths✓ Professional training✓ Educational reimbursement ✓ Internship program across our
organization✓ Scholarships for higher
education2
COMMITTED TO INVESTING IN OUR EMPLOYEES
from 2018
18
We Invest in Our Employees’ Well-being and Development, and That Investment has Provided Great Returns Demonstrated by Our Low 2.5% Voluntary Turnover Rate
2.5%
VoluntaryTurnover Rate1
12times
We believe that if you take care of the employees, the
employees will take care of the company, our unitholders and our communities.
-Bill GreeheyChairman of the Board, NuStar Energy L.P.
R e s p o n s i b l y R e s i l i e n t 26
* According to McGriff1 - Excludes retirements2 - For employees’ dependents
We provide benefits valued at
36%of an employee’s salary

COMMITTED TO INVESTING IN OUR COMMUNITIES THROUGH GIVING
We Focus on Addressing Critical Needs in Our Communities
• In 2020, 99.9% of our U.S. employees contributed to our record-breaking United Way campaign
• Thanks to our employees' and our directors' generous gifts and our company match, we pledged a record $4.7 million to United Way in 2020
• Also in 2020, our pledge was the highest average per capita contribution in the United States
99.9% United Way participation
in 2020
$4.7MMPledged to United Way
in 2020
R e s p o n s i b l y R e s i l i e n t 27

COMMITTED TO FIGHTING HOMELESSNESS THROUGH OUR SUPPORT OF HAVEN FOR HOPE
Proudly Supporting the Effort to Transform the Lives of Homeless Men, Women and Children
• Bill Greehey, NuStar’s Chairman of the Board, founded Haven for Hope and continues to serve as the organization’s Chairman
• Haven for Hope’s transformational campus provides comprehensive social services for single men and women and families with children, including:
✓ Short-term residential housing on-campus✓ Substance abuse and mental health
treatment✓ Employment, education and legal services✓ Life-skills training✓ Healthcare✓ Childcare
• Each year, NuStar hosts the annual NuHope Golf Classic to support Haven
✓ The tournament has raised nearly $48 million for Haven over the past 13 years
R e s p o n s i b l y R e s i l i e n t 28
1 –From homelessness to permanent or supportive housing
Haven has
assisted nearly
15,000 individuals
with
housing1

GOVERNANCEAssuring Responsive Management
R e s p o n s i b l y R e s i l i e n t 29
BB: “lots of empty chairs” + “can we get a better photo” + circled the photoshop work

SUSTAINABILITY & RISK MANAGEMENT
BOARD OF DIRECTORS
Our Board is responsible for identifying and understanding ourprincipal business risks,
including sustainability risks, andoverseeing management’s efforts in monitoring, managing and
mitigating those risks
Our Board Takes a Comprehensive Approach to Oversight of Environmental, Social and GovernanceMatters With Accountabilities Designated Across all Board Committees
Board
CEO
Executive Committee
Sustainability Committee
• Management is responsible for day-to-day assessment and management of enterprise-level risk
• The Board interfaces regularly with management and receives periodic reports that include updates on:✓ Health, safety & environmental program✓ Financial performance✓ Employee wellness✓ Diversity & inclusion✓ Community investment
• At least once annually, the Board meets to focus on strategic planning, including identifying and addressing:✓ Strategic risks✓ Potential opportunities
R e s p o n s i b l y R e s i l i e n t 30
✓ Legal matters✓ Cybersecurity✓ Operational results✓ Internal controls

BOARD OVERSIGHT & EXECUTIVE MANAGEMENT
Our Board of Directors:• Is composed of a majority of independent directors
✓ Bill Greehey, Chairman of the Board✓ Brad Barron, President & CEO
Dan Bates✓ Bill Burnett✓ Fully Clingman✓ Dan Hill✓ Jelynne LeBlanc-Burley✓ Bob Munch✓ Grady Rosier
• Bring diverse perspectives, expertise and experience from:✓ Energy & commodities✓ Financial & banking✓ Government✓ Healthcare
• Evaluate the Board and its committees each year
• Participate in compensation, audit and nominating/governance committees comprised solely of independent directors
age
Our Diverse and Experienced Board of Directors Provides Effective Oversight While Our Dedicated Executives Ensure Safe Day-to-day Operations
R e s p o n s i b l y R e s i l i e n t 31
78%Independent
Our Senior Executive Team:• Brad Barron, President & CEO• Mary Rose Brown, EVP & CAO• Danny Oliver, EVP- Business Development &
Engineering• Amy Perry, EVP- Strategic Development & GC• Tom Shoaf, EVP & CFO• Jorge del Alamo, SVP & Controller• Manish Kapoor, SVP & CIO• Mark Trexler, SVP- Operations & HSE
✓ Mental health & wellness✓ Technology✓ Transportation
50%Women & Minorities
• Dan Bates• Bill Burnett• Fully Clingman• Dan Hill• Jelynne LeBlanc-Burley• Bob Munch• Grady Rosier

• Our philosophy for compensating our executive officers is based on the belief that a significant portion of executive compensation should be incentive-based and determined by both the performance of NuStar Energy, as well as each executive's individual performance
• Our executive compensation programs are designed to accomplish the following long-term objectives:
✓ Increase value to unitholders, while practicing good corporate governance✓ Support our business strategy and business plan✓ Provide flexibility to respond to the continually changing environment✓ Align executive incentive compensation with short- and long-term results✓ Provide market-competitive compensation and benefits to attract/retain top talent
31%19%
19%
19%
50%62%
Other NEOs CEO
Base Salary
Short-TermIncentives
Long-TermIncentives
Our Executive Compensation Program is Focused on Pay-for-performance to Align NuStar’sStrategic Priorities With Those of Our Investors
EXECUTIVE COMPENSATION
R e s p o n s i b l y R e s i l i e n t 32
40%
40%
10%
10%
2020 Annual Incentive Bonus Performance Measures (% weight)
Adjusted EBITDA
Adjusted DCF
Adjusted operating and general& administrative expense
Safety and environmentalperformance
69%Compensation
at risk
81%Compensation
at risk
1 –Named Executive Officers 1

Our Board of Directors and Our Executives are Invested in NuStar’s Future Through Their Ownership of NuStar Units
OUR BOARD AND OUR EXECUTIVES ARE ALSO INVESTORS
0 1 2 3 4
CEO/President
EVP
SVP
Multiple of base salary
Senior Executive Team:Required NuStar Energy Unit Ownership
Our independent directors are each
required to acquire and hold NuStar units with an aggregate value of
2Xtheir annual
cash retainer
R e s p o n s i b l y R e s i l i e n t 33

INVESTOR RELATIONS
For additional information about corporate sustainability at NuStar, visithttp://www.NuStarEnergy.com/Sustainability
CONTACT INFORMATION
CORPORATE SECRETARY
CORPORATE COMMUNICATIONS
SUSTAINABILITY
R e s p o n s i b l y R e s i l i e n t 34
(210) 918-INVR (4687) [email protected]
(210) [email protected]

APPENDIX: RECONCILATION OF NON-GAAP FINANCIAL INFORMATION
R e s p o n s i b l y R e s i l i e n t 35

APPENDIX: RECONCILATION OF NON-GAAP FINANCIAL INFORMATION (CONTINUED)
R e s p o n s i b l y R e s i l i e n t 36