Embed Size (px)
Citation preview
August 2014
Citi MLP/Midstream Infrastructure Conference
Forward Looking Statement Disclaimer
The following information contains, or may be deemed to contain, forward-looking statements. By their nature, forward-looking statements involve risks and uncertainties because they relate to events and depend on circumstances that may or may not occur in the future. The future results of the partnership may vary from the results expressed in, or implied by, the following information, possibly to a material degree. The partnership assumes no obligation to update the information contained herein. For a discussion of some of the important factors that could cause the partnership’s results to differ from those expressed in, or implied by, the following information, as well as a discussion of certain other risks, uncertainties and factors, please see the sections “Item 1. Business - Risk Factors” in the Form 10-K of Ferrellgas Partners, L.P., Ferrellgas Partners Finance Corp., Ferrellgas, L.P. and Ferrellgas Finance Corp. for the fiscal year ended July 31, 2013, and our Form 10-Q for the fiscal quarter ended April 30, 2014.
2
Executive Management Team
Steve WamboldPresident and Chief Executive Officer
Ryan VanWinkleExecutive Vice President & Chief Financial Officer,
President – Midstream Operations
Boyd McGatheyExecutive Vice President &
Chief Operating Officer
Tod BrownExecutive Vice President &
President, Blue Rhino
3
Presentation Review
4
Partnership Overview
Midstream Operations
Propane Operations
Financial Performance
Partnership Overview
5
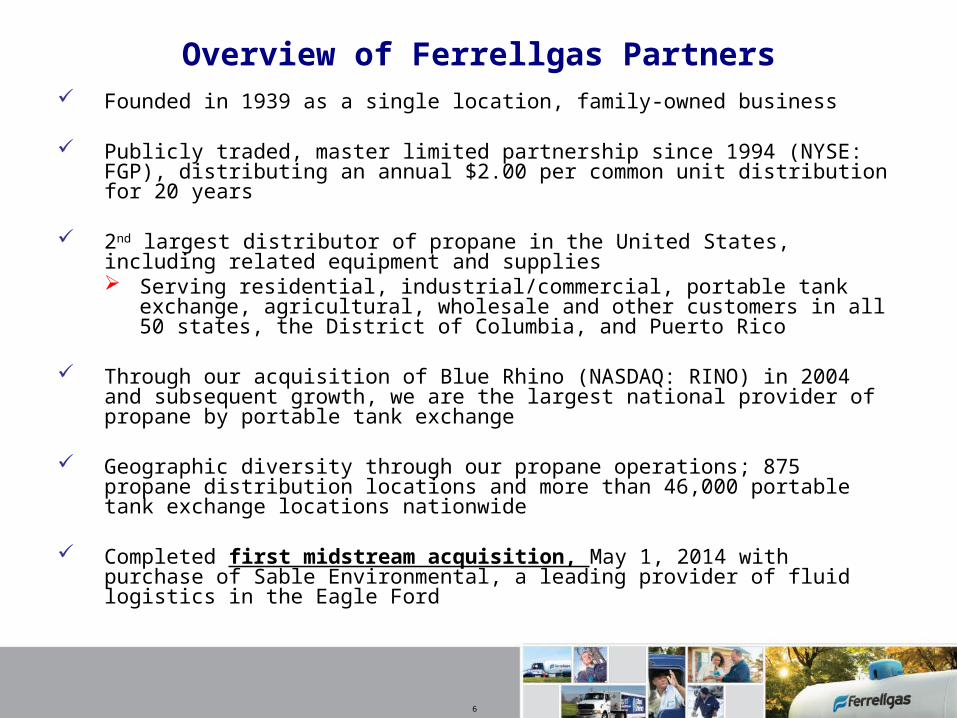
Overview of Ferrellgas Partners Founded in 1939 as a single location, family-owned business
Publicly traded, master limited partnership since 1994 (NYSE: FGP), distributing an annual $2.00 per common unit distribution for 20 years
2nd largest distributor of propane in the United States, including related equipment and supplies Serving residential, industrial/commercial, portable tank exchange,
agricultural, wholesale and other customers in all 50 states, the District of Columbia, and Puerto Rico
Through our acquisition of Blue Rhino (NASDAQ: RINO) in 2004 and subsequent growth, we are the largest national provider of propane by portable tank exchange
Geographic diversity through our propane operations; 875 propane distribution locations and more than 46,000 portable tank exchange locations nationwide
Completed first midstream acquisition, May 1, 2014 with purchase of Sable Environmental, a leading provider of fluid logistics in the Eagle Ford
6
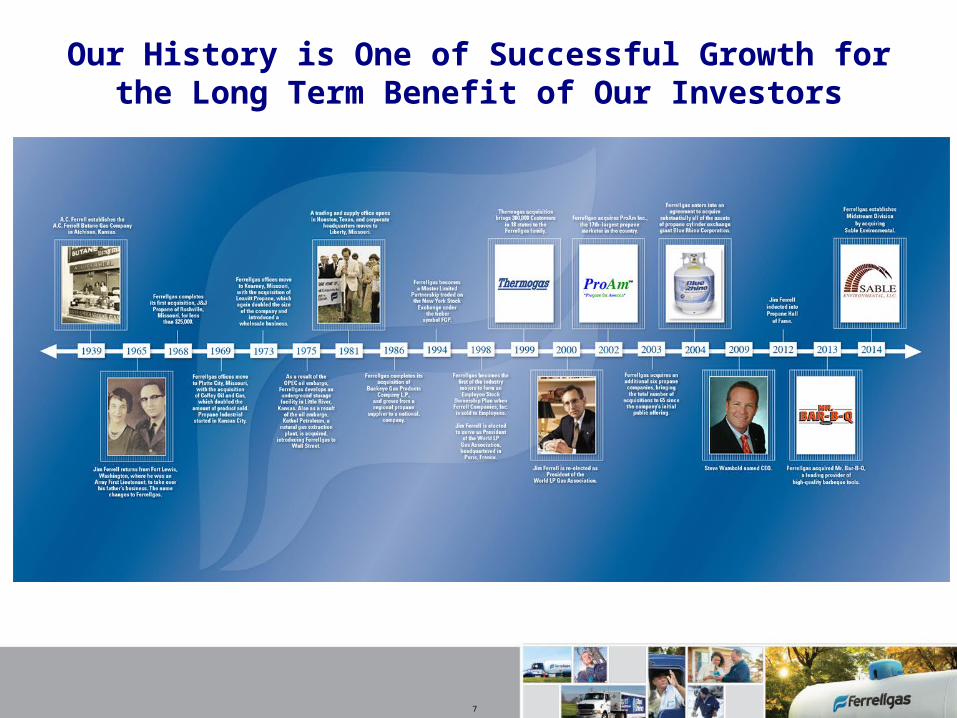
Our History is One of Successful Growth for the Long Term Benefit of Our Investors
7
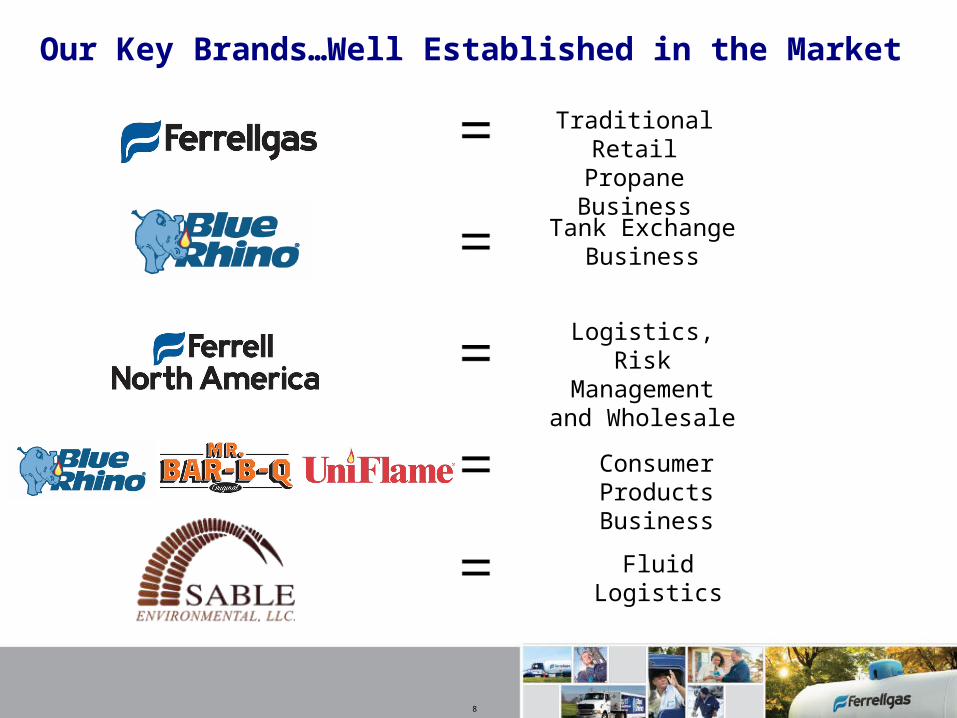
Our Key Brands…Well Established in the Market
Traditional Retail Propane Business
Tank Exchange Business
Logistics, Risk Management and
Wholesale
Consumer Products Business
8
Fluid Logistics
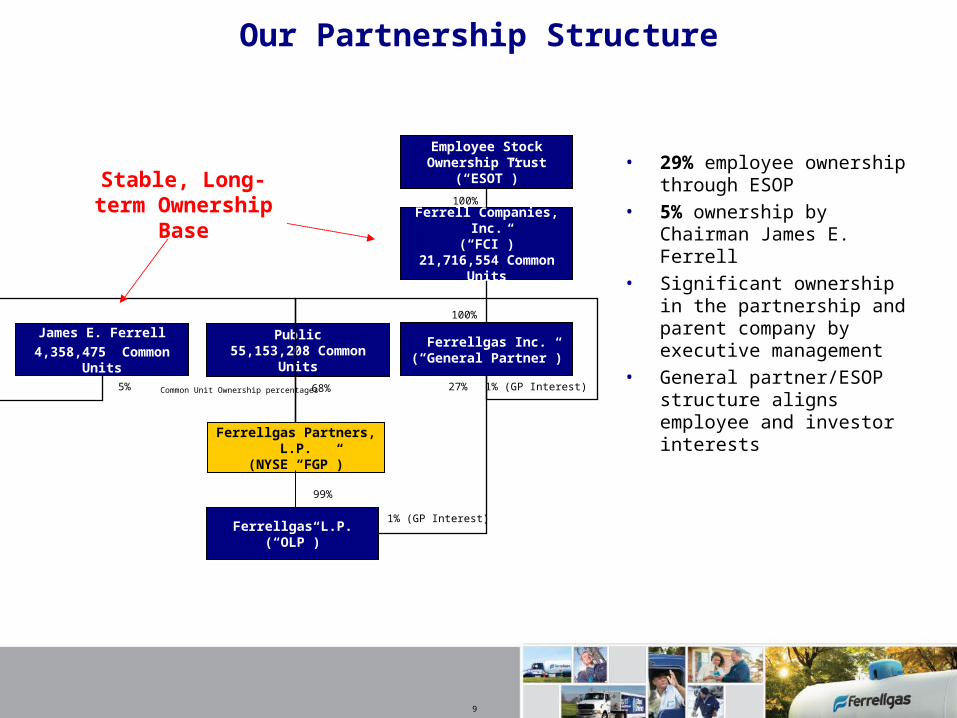
Our Partnership Structure
• 29% employee ownership through ESOP
• 5% ownership by Chairman James E. Ferrell
• Significant ownership in the partnership and parent company by executive management
• General partner/ESOP structure aligns employee and investor interests
Public55,153,208 Common Units
James E. Ferrell
4,358,475 Common Units
Ferrellgas Partners, L.P.(NYSE “FGP”)
Ferrellgas Inc.(“General Partner”)
Employee StockOwnership Trust
(“ESOT”)
100%
100%
1% (GP Interest)
Ferrellgas L.P.(“OLP”)
1% (GP Interest)
99%
Ferrell Companies, Inc.(“FCI”)
21,716,554 Common Units
27%68%5%
Stable, Long-term Ownership Base
Common Unit Ownership percentages
9
Ferrellgas, L.P. (the Operating Limited Partnership or “OLP”) Owns all of the operating assets/cash flow Maintains working capital facility and other subordinated high yield bonds
totaling approximately $1,098 million as of April 30, 2014 Maintains an AR Securitization facility with $155 million borrowed as of April
30, 2014
Ferrellgas Partners, L.P. (the Master Limited Partnership or “MLP”, together with the OLP it is referred to as the “Partnership”) Publicly traded on the New York Stock Exchange under ticker symbol FGP Owns all the limited partner interests of the OLP ~$2.1 billion equity market cap – approximately ~81 million common units $182 million of high yield bonds outstanding (not guaranteed by OLP)
Ferrellgas, Inc. General Partner of the MLP and OLP Manages and controls the operations of the partnership Ferrellgas employees work for this entity
Ferrell Companies, Inc. (FCI) Owns 100% of Ferrellgas, Inc. Owns approximately a 29% interest in the partnership (including GP interest)
Ferrellgas Partnership Structure (cont.)
10
Keys To Continued Success
Capitalize on organic growth
Expand through disciplined acquisitions
Capitalize on national presence and economies of scale
Achieve operating efficiencies through technology
Align employee interest with investors through employee ownership; only MLP with significant company-wide ESOP ownership
11
Recent Financial Highlights
Adjusted EBITDA and gross profit for our quarter ended April 30, 2014 were $99.8 million and $230.5 million, respectively
Both were records for the quarter
TTM Adjusted EBITDA and gross profit through April 30, 2014 were $288.6 million and $783.3 million, respectively
Distributable Cash Flow coverage of 1.2x as of April 30, 2014 At 1.2x DCF coverage, we generated $31.8 million of excess cash flow over the
last 12 months to fund growth/reduce debt
At April 30, 2014, pro forma for financings, we had $413.5 million of availability to fund growth projects and acquisitions
Our equity cost of capital has materially improved over the last 12 months – now approx. 7.4%
Credit/outlook upgrades from both Moody’s and Standard & Poor’s Moody’s OLP debt rating of “B1” (“stable” outlook) S&P’s OLP debt rating of “B+” (“stable” outlook)
12
Recent Capital Market Activity
13
In October 2013, completed a $325 million, 6.75% note offering, due January 2022
Note offering to refinance $300 million, 9.125% senior notes due 2017 Offering both extended maturity and materially reduced interest expense
Added an additional $150 million onto the above referenced notes in June 2014 at an effective interest rate of 5.877%
Proceeds used to partially fund the acquisition of Sable Environmental and provide additional capital for future growth investments
Issued $50 million of FGP equity in conjunction with the acquisition of Sable Environmental
Selling shareholders acquired the equity at the close of the transaction at $24.50 per common unit
Amended our bank funded credit facility, primarily increasing borrowing capacity and terms to allow for additional midstream growth
Exercised accordion option to increase credit facility by $100 million from $500 million to $600 million
Midstream Operations
14
Ferrellgas acquired Sable Environmental, LLC (“Sable”) on May 1, 2014 Purchase price of $124.7 million, representing a ~6.25x purchase multiple Subsequent to the May 1st transaction, we acquired a competitor’s SWD well
lowering the all-in acquisition multiple to 5.1x Estimated 2015 EBITDA of ~$25 million Established Midstream segment
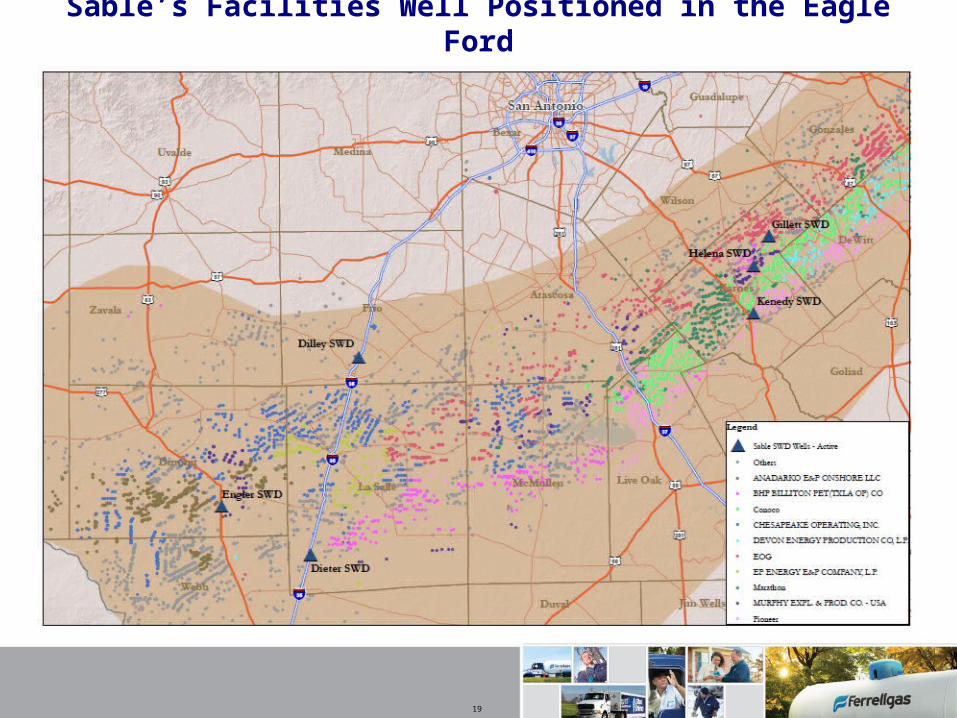
Sable is a leading provider of salt water disposal (“SWD”) services in the Eagle Ford region of Texas for produced and flowback water generated as part of the oil and gas production process
Currently owns and operates six SWD facilities in three counties within the Eagle Ford
Additional SWD facilities in permitting, development or acquisition process
Key customers include major oil and gas producers and transportation companies
Overview of Sable Environmental
15
Sable Asset Overview
Headquartered in Corpus Christi, Texas, Sable currently owns and operates six SWD sites in Karnes, Dimmitt and Frio Counties in Texas
Sable has approved or pending permits for additional SWD locations and are evaluating other locations for feasibility to construct additional facilities
Each of the six existing wells has permitted capacity of 25,000 barrels per day (“Bpd”) and have functional capacity between 8,000 Bpd and 10,000 Bpd
Sable does not own or operate any trucks
In certain cases, Sable arranges transportation for major customers utilizing third-party trucks and drivers
Sable operates on both a contracted and spot basis with leading E&P and transportation companies
16
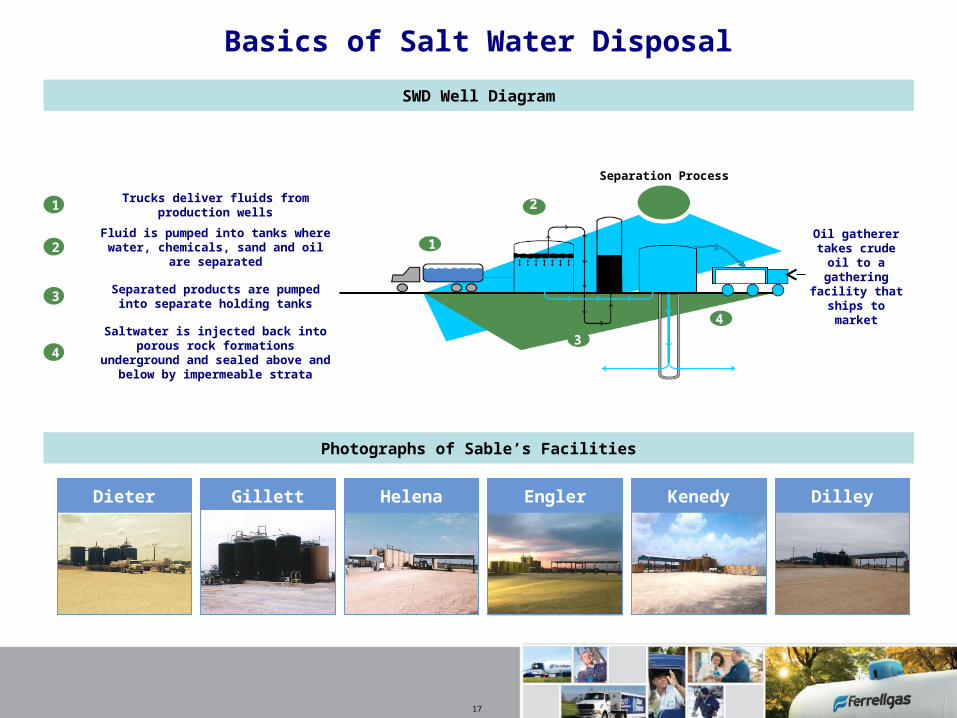
Basics of Salt Water Disposal
SWD Well Diagram
1
2
1
4
Separation Process
Trucks deliver fluids from production wells1
Fluid is pumped into tanks where water, chemicals, sand and oil are
separated2
Separated products are pumped into separate holding tanks3
Saltwater is injected back into porous rock formations
underground and sealed above and below by impermeable strata
4
Oil gatherer takes crude
oil to a gathering
facility that ships to market
Gillett
Photographs of Sable’s Facilities
Helena Engler Kenedy Dilley
17
3
2
Dieter
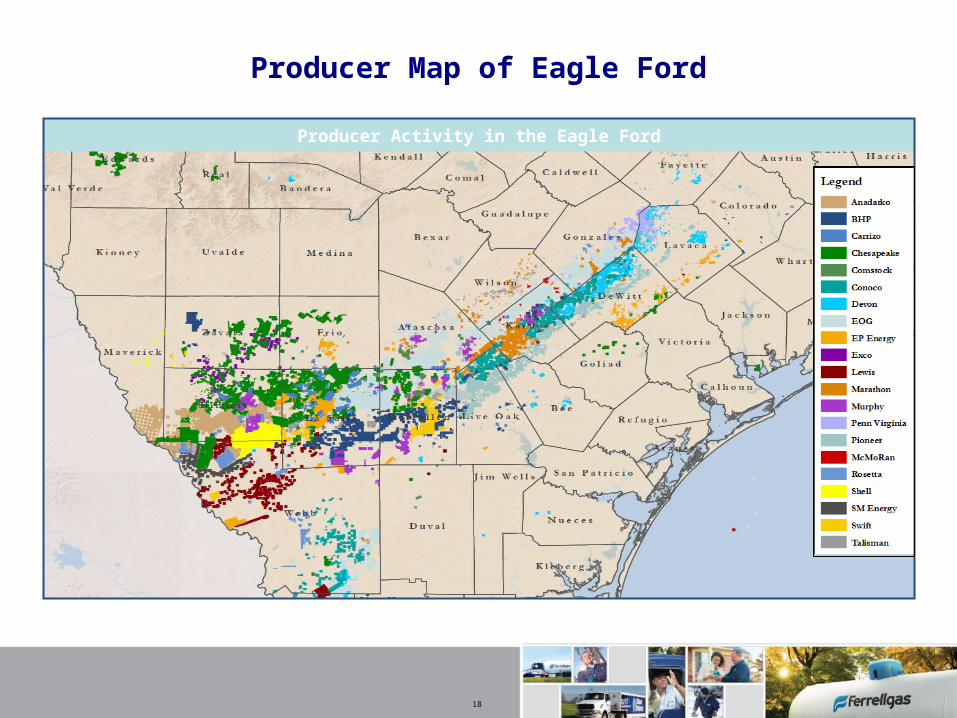
Producer Map of Eagle Ford
Producer Activity in the Eagle Ford
18
19
Sable’s Facilities Well Positioned in the Eagle Ford
Propane Operations
20
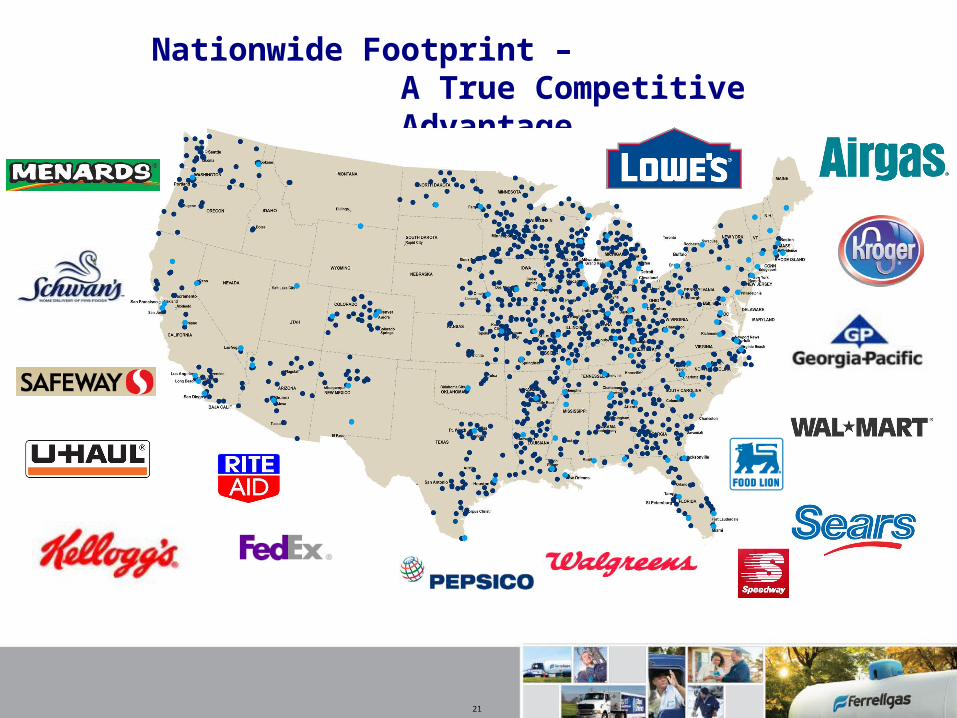
Nationwide Footprint – A True Competitive Advantage
21
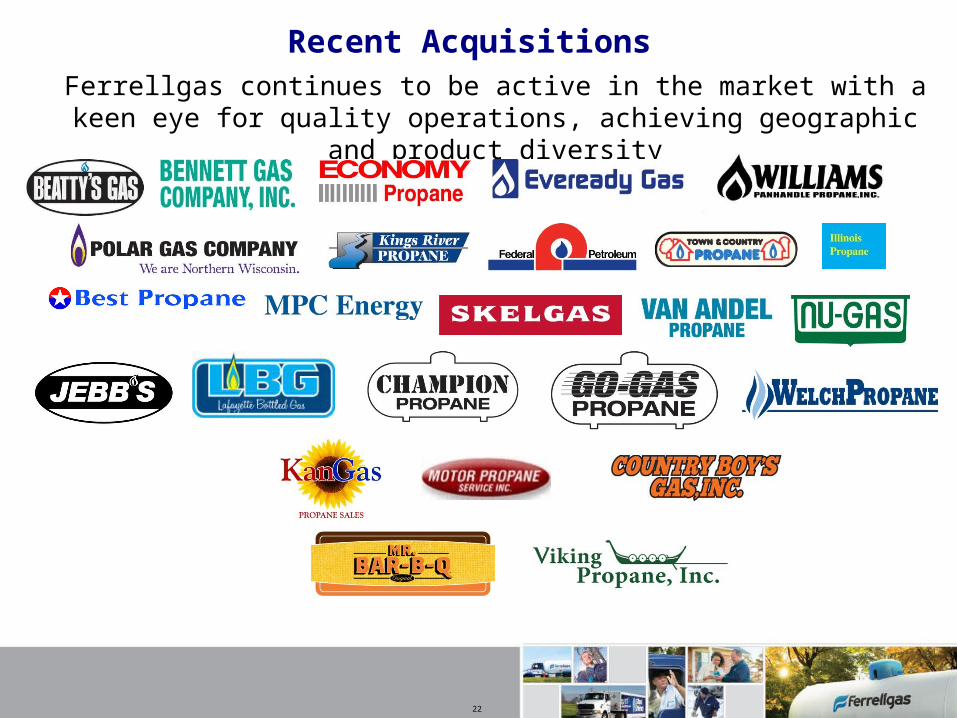
Recent Acquisitions Ferrellgas continues to be active in the market with a keen eye
for quality operations, achieving geographic and product diversity
22
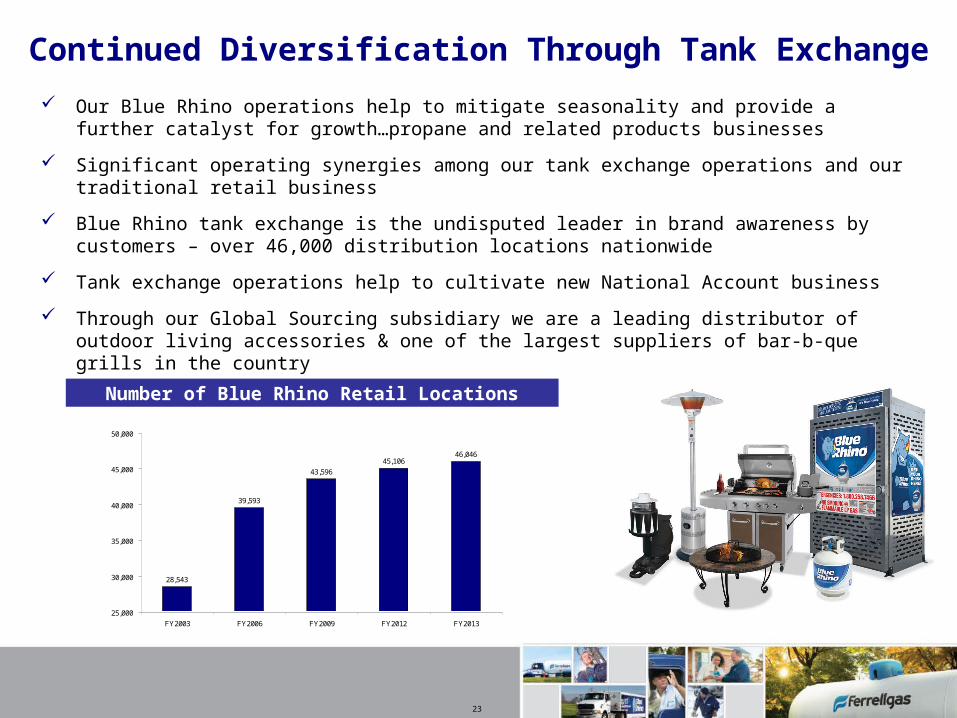
Our Blue Rhino operations help to mitigate seasonality and provide a further catalyst for growth…propane and related products businesses
Significant operating synergies among our tank exchange operations and our traditional retail business
Blue Rhino tank exchange is the undisputed leader in brand awareness by customers – over 46,000 distribution locations nationwide
Tank exchange operations help to cultivate new National Account business
Through our Global Sourcing subsidiary we are a leading distributor of outdoor living accessories & one of the largest suppliers of bar-b-que grills in the country
Continued Diversification Through Tank Exchange
Number of Blue Rhino Retail Locations
28,543
39,593
43,596
45,10646,046
25,000
30,000
35,000
40,000
45,000
50,000
FY2003 FY2006 FY2009 FY2012 FY2013
23
Financial Performance
24
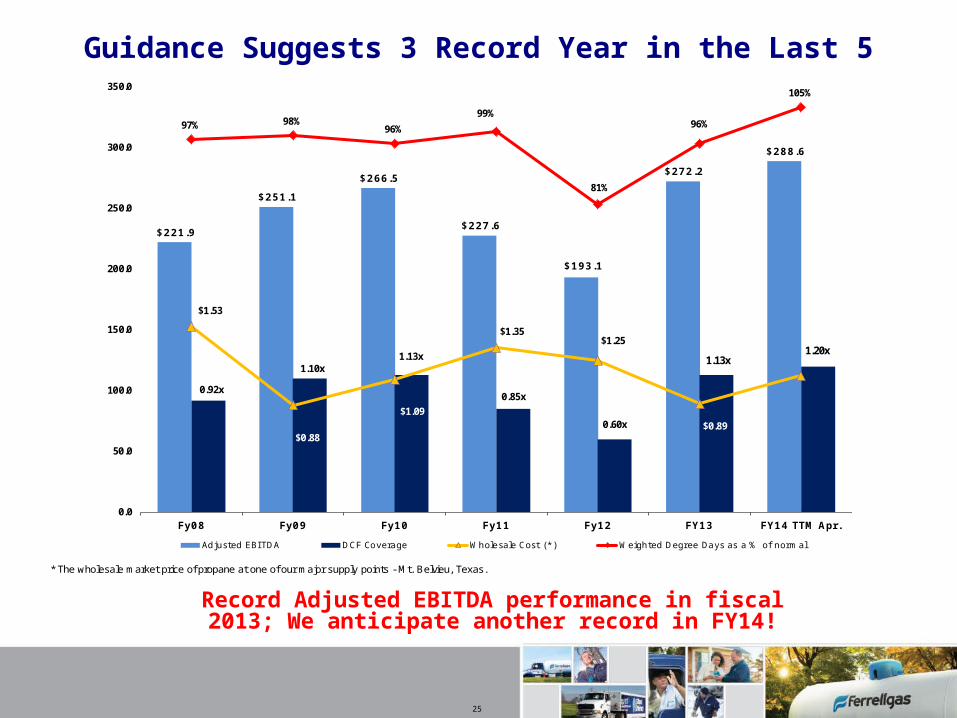
Guidance Suggests 3 Record Year in the Last 5
Record Adjusted EBITDA performance in fiscal 2013; We anticipate another record in FY14!
25
* The wholesale market price of propane at one of our major supply points - Mt. Belvieu, Texas.
$221.9
$251.1
$266.5
$227.6
$193.1
$272.2
$288.6
97% 98%96%
99%
81%
96%
105%
0.0
50.0
100.0
150.0
200.0
250.0
300.0
350.0
Fy08 Fy09 Fy10 Fy11 Fy12 FY13 FY14 TTM Apr.
Adjusted EBI TDA DCF Coverage Wholesale Cost (* ) Weighted Degree Days as a % of normal
1.10x1.13x
0.60x
0.85x
$0.88
$1.09
$1.35$1.25
1.20x
0.92x
$0.89
$1.53
1.13x
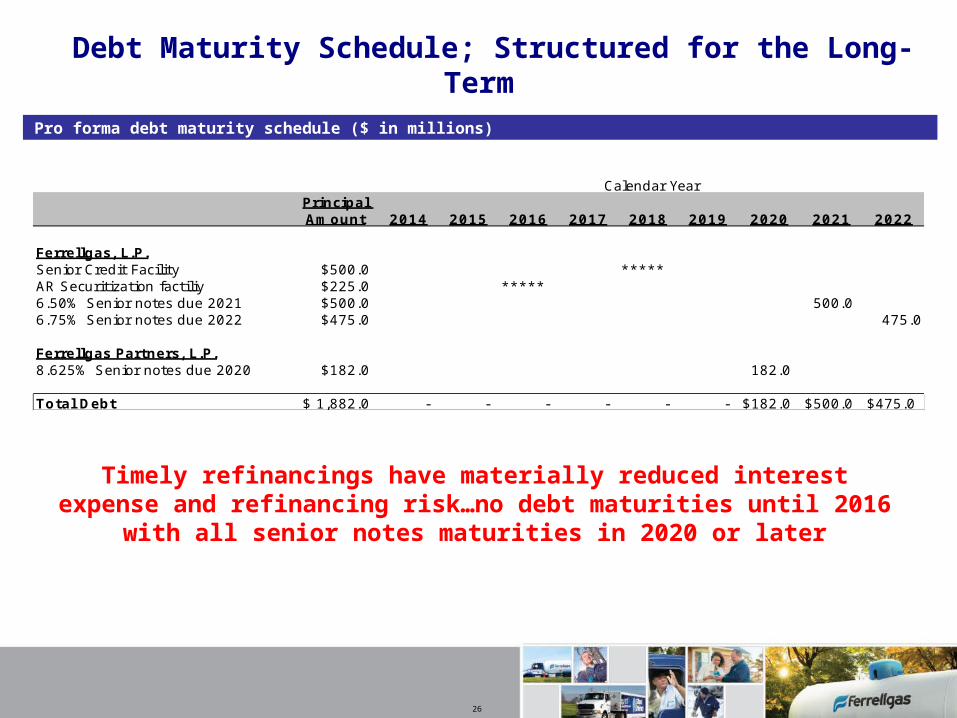
Debt Maturity Schedule; Structured for the Long-Term
Pro forma debt maturity schedule ($ in millions)
26
Timely refinancings have materially reduced interest expense and refinancing risk…no debt maturities until 2016 with all senior notes
maturities in 2020 or later
Calendar YearPrincipal Amount 2014 2015 2016 2017 2018 2019 2020 2021 2022
Ferrellgas, L.P.Senior Credit Facility $500.0 *****AR Securitization factiliy $225.0 *****6.50% Senior notes due 2021 $500.0 500.06.75% Senior notes due 2022 $475.0 475.0
Ferrellgas Partners, L.P.8.625% Senior notes due 2020 $182.0 182.0
Total Debt 1,882.0$ - - - - - - $182.0 $500.0 $475.0
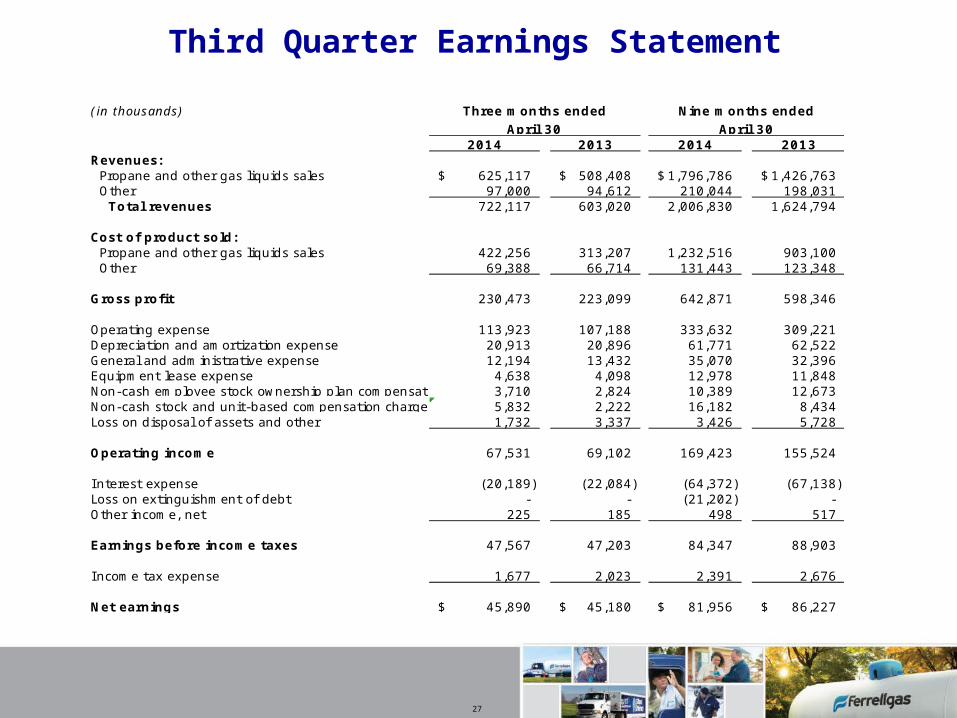
(in thousands)
2014 2013 2014 2013Revenues: Propane and other gas liquids sales 625,117$ 508,408$ 1,796,786$ 1,426,763$ Other 97,000 94,612 210,044 198,031 Total revenues 722,117 603,020 2,006,830 1,624,794
Cost of product sold: Propane and other gas liquids sales 422,256 313,207 1,232,516 903,100 Other 69,388 66,714 131,443 123,348
Gross profit 230,473 223,099 642,871 598,346
Operating expense 113,923 107,188 333,632 309,221Depreciation and amortization expense 20,913 20,896 61,771 62,522General and administrative expense 12,194 13,432 35,070 32,396Equipment lease expense 4,638 4,098 12,978 11,848Non-cash employee stock ownership plan compensation charge3,710 2,824 10,389 12,673Non-cash stock and unit-based compensation charge 5,832 2,222 16,182 8,434Loss on disposal of assets and other 1,732 3,337 3,426 5,728
Operating income 67,531 69,102 169,423 155,524
I nterest expense (20,189) (22,084) (64,372) (67,138)Loss on extinguishment of debt - - (21,202) - Other income, net 225 185 498 517
Earnings before income taxes 47,567 47,203 84,347 88,903
I ncome tax expense 1,677 2,023 2,391 2,676
Net earnings 45,890$ 45,180$ 81,956$ 86,227$
April 30 April 30
Three months ended Nine months ended
Third Quarter Earnings Statement
27