Embed Size (px)
Citation preview
2020 ANNUAL REPORT
THE PNC FINANCIAL SERVICES GROUP
7227_CVR_Singles_C1.indd 17227_CVR_Singles_C1.indd 1 3/1/21 9:41 AM3/1/21 9:41 AM
The PNC Financial Services Group, Inc.
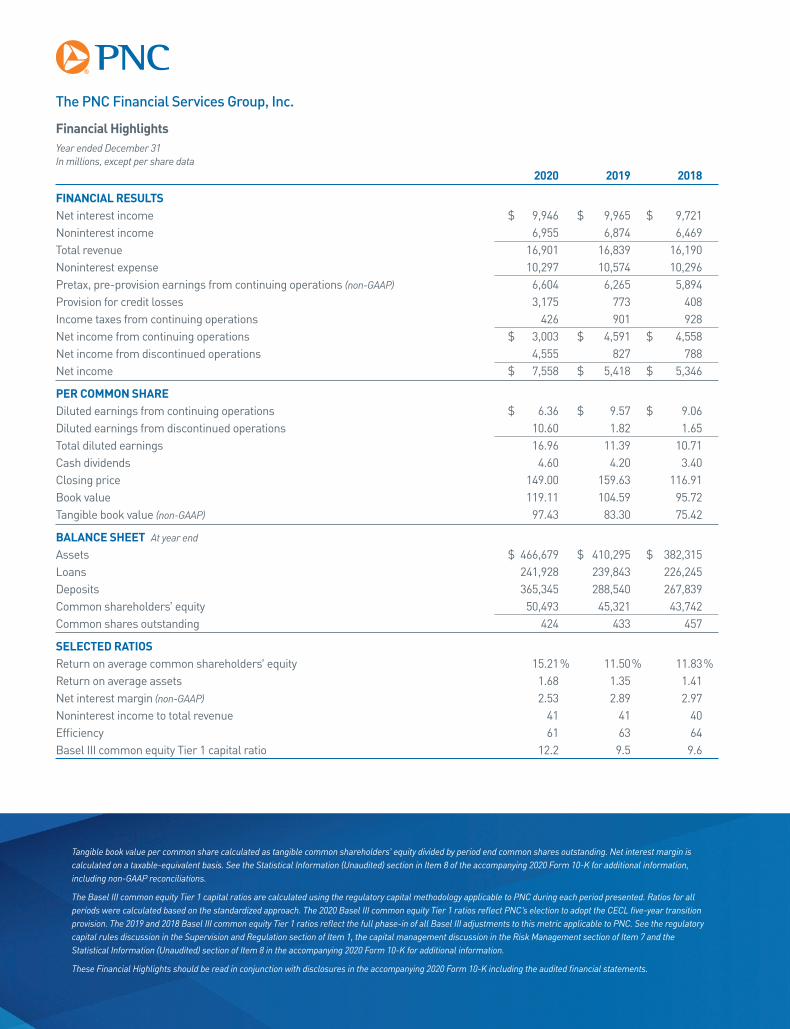
Financial HighlightsYear ended December 31 In millions, except per share data 2020 2019 2018
FINANCIAL RESULTSNet interest income $ 9,946 $ 9,965 $ 9,721Noninterest income 6,955 6,874 6,469Total revenue 16,901 16,839 16,190Noninterest expense 10,297 10,574 10,296Pretax, pre-provision earnings from continuing operations (non-GAAP) 6,604 6,265 5,894Provision for credit losses 3,175 773 408Income taxes from continuing operations 426 901 928Net income from continuing operations $ 3,003 $ 4,591 $ 4,558Net income from discontinued operations 4,555 827 788Net income $ 7,558 $ 5,418 $ 5,346
PER COMMON SHAREDiluted earnings from continuing operations $ 6.36 $ 9.57 $ 9.06Diluted earnings from discontinued operations 10.60 1.82 1.65Total diluted earnings 16.96 11.39 10.71Cash dividends 4.60 4.20 3.40Closing price 149.00 159.63 116.91Book value 119.11 104.59 95.72Tangible book value (non-GAAP) 97.43 83.30 75.42
BALANCE SHEET At year end
Assets $ 466,679 $ 410,295 $ 382,315Loans 241,928 239,843 226,245Deposits 365,345 288,540 267,839Common shareholders’ equity 50,493 45,321 43,742Common shares outstanding 424 433 457
SELECTED RATIOSReturn on average common shareholders’ equity 15.21 % 11.50 % 11.83 %Return on average assets 1.68 1.35 1.41Net interest margin (non-GAAP) 2.53 2.89 2.97Noninterest income to total revenue 41 41 40Efficiency 61 63 64Basel III common equity Tier 1 capital ratio 12.2 9.5 9.6
Tangible book value per common share calculated as tangible common shareholders’ equity divided by period end common shares outstanding. Net interest margin is calculated on a taxable-equivalent basis. See the Statistical Information (Unaudited) section in Item 8 of the accompanying 2020 Form 10-K for additional information, including non-GAAP reconciliations.
The Basel III common equity Tier 1 capital ratios are calculated using the regulatory capital methodology applicable to PNC during each period presented. Ratios for all periods were calculated based on the standardized approach. The 2020 Basel III common equity Tier 1 ratios reflect PNC’s election to adopt the CECL five-year transition provision. The 2019 and 2018 Basel III common equity Tier 1 ratios reflect the full phase-in of all Basel III adjustments to this metric applicable to PNC. See the regulatory capital rules discussion in the Supervision and Regulation section of Item 1, the capital management discussion in the Risk Management section of Item 7 and the Statistical Information (Unaudited) section of Item 8 in the accompanying 2020 Form 10-K for additional information.
These Financial Highlights should be read in conjunction with disclosures in the accompanying 2020 Form 10-K including the audited financial statements.
7227_CVR_Singles_C1.indd 27227_CVR_Singles_C1.indd 2 3/1/21 9:41 AM3/1/21 9:41 AM

Dear Shareholder,When I look back at the past year, I’m reminded of how much we’ve been through as a country, as a company and as individuals. We’ve faced a pandemic, an economic crisis, widespread civil unrest and a contentious U.S. election. All of this, coupled with quickly evolving technology and customer preferences, has amounted to massive change for the banking industry.
2020 ANNUAL REPORT • THE PNC FINANCIAL SERVICES GROUP | 1
WILLIAM S. DEMCHAKChairman, President and Chief Executive Officer
Notwithstanding this change, our company continued to move forward, focused on making the next right decision and fulfilling our obligations to our colleagues, our customers, our communities and to all of you. We adapted to a new operating environment and remained focused on our strategic priorities, including accelerating our national expansion with our agreement to acquire BBVA USA, a transformational step that will reflect a strategic redeployment of proceeds from the sale of our BlackRock investment.
This acquisition, which is subject to regulatory approval, demonstrates the strength from which we have navigated unprecedented challenges. This strength positioned us to monetize our passive stake in BlackRock and capitalize on an attractive investment opportunity that will allow us to grow our franchise for years to come. This strength, fueled by the investments we’ve made in talent and technology, also enabled us to quickly transition more than 30,000 employees to a remote work environment and modify our branch operations so that we could serve customers while keeping our employees safe. And this strength
allowed us to grant $14.8 billion in loan modifications and provide billions of dollars of credit to our customers, including approximately $13 billion through the first round of the Federal government’s Paycheck Protection Program (PPP).
We can also attribute our success in weathering last year’s crises to our unwavering commitment to look out for the best interests of our constituencies. This commitment, supported by our focus on philanthropy, employee wellness, community development, diversity and inclusion, and environmental, social and governance (ESG) issues, has proven to be more critical than ever before. It has guided our decisions and actions and helped us stay true to our purpose, which in its simplest form is to help make a difference for all we serve, during one of the most challenging times in our history.
In the face of unprecedented challenges, we did what we said we were going to do by focusing on the things that were within our control. We took steps to position our company for long-term growth, all while supporting our employees, customers and communities. I am
In the face of unprecedented challenges, we did what we said we were going to do by focusing on the things that were within our control. We took steps to position our company for long-term growth, all while supporting our employees, customers and communities.
proud of what we accomplished and grateful that we ended 2020 in a better place as a company than where we started.
While the banking industry evolves and the race toward a digital world accelerates, I am excited about PNC’s future. With the continued execution of our strategic priorities and the planned addition of BBVA USA, I am confident that we are well-positioned to compete and deliver for all of our stakeholders in 2021 and beyond.
FINANCIAL PERFORMANCEAmidst a volatile operating environment, we achieved solid financial results for the year, as PNC reported total net income of $7.6 billion, or $16.96 per diluted
7227_NAR.indd 17227_NAR.indd 1 2/26/21 3:07 PM2/26/21 3:07 PM
2 | FROM THE CEO | MARCH 1, 2021
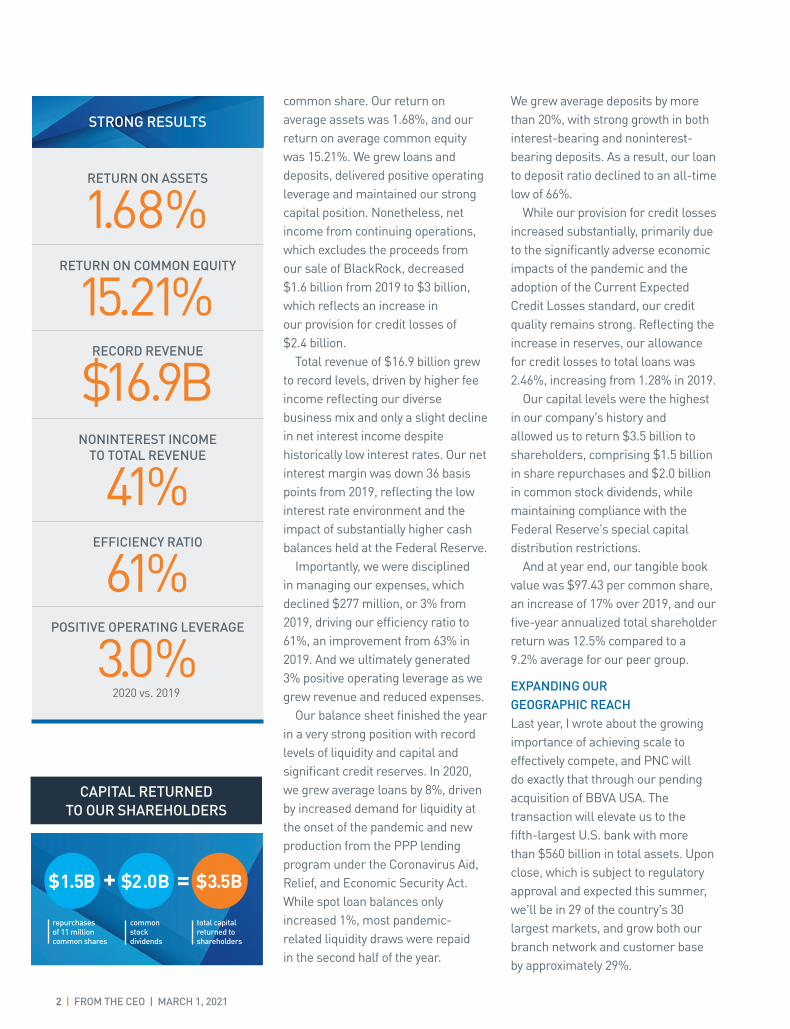
RETURN ON ASSETS
1.68%RETURN ON COMMON EQUITY
15.21%RECORD REVENUE
$16.9B
EFFICIENCY RATIO
61%POSITIVE OPERATING LEVERAGE
3.0%
NONINTEREST INCOME TO TOTAL REVENUE
41%
2020 vs. 2019
STRONG RESULTS
$1.5B $2.0B+ =
repurchases of 11 million common shares
common stockdividends
$3.5B
CAPITAL RETURNED TO OUR SHAREHOLDERS
total capital returned to shareholders
common share. Our return on average assets was 1.68%, and our return on average common equity was 15.21%. We grew loans and deposits, delivered positive operating leverage and maintained our strong capital position. Nonetheless, net income from continuing operations, which excludes the proceeds from our sale of BlackRock, decreased $1.6 billion from 2019 to $3 billion, which reflects an increase in our provision for credit losses of $2.4 billion.
Total revenue of $16.9 billion grew to record levels, driven by higher fee income reflecting our diverse business mix and only a slight decline in net interest income despite historically low interest rates. Our net interest margin was down 36 basis points from 2019, reflecting the low interest rate environment and the impact of substantially higher cash balances held at the Federal Reserve.
Importantly, we were disciplined in managing our expenses, which declined $277 million, or 3% from 2019, driving our efficiency ratio to 61%, an improvement from 63% in 2019. And we ultimately generated 3% positive operating leverage as we grew revenue and reduced expenses.
Our balance sheet finished the year in a very strong position with record levels of liquidity and capital and significant credit reserves. In 2020, we grew average loans by 8%, driven by increased demand for liquidity at the onset of the pandemic and new production from the PPP lending program under the Coronavirus Aid, Relief, and Economic Security Act. While spot loan balances only increased 1%, most pandemic- related liquidity draws were repaid in the second half of the year.
We grew average deposits by more than 20%, with strong growth in both interest-bearing and noninterest- bearing deposits. As a result, our loan to deposit ratio declined to an all-time low of 66%.
While our provision for credit losses increased substantially, primarily due to the significantly adverse economic impacts of the pandemic and the adoption of the Current Expected Credit Losses standard, our credit quality remains strong. Reflecting the increase in reserves, our allowance for credit losses to total loans was 2.46%, increasing from 1.28% in 2019.
Our capital levels were the highest in our company’s history and allowed us to return $3.5 billion to shareholders, comprising $1.5 billion in share repurchases and $2.0 billion in common stock dividends, while maintaining compliance with the Federal Reserve’s special capital distribution restrictions.
And at year end, our tangible book value was $97.43 per common share, an increase of 17% over 2019, and our five-year annualized total shareholder return was 12.5% compared to a 9.2% average for our peer group.
EXPANDING OUR GEOGRAPHIC REACHLast year, I wrote about the growing importance of achieving scale to effectively compete, and PNC will do exactly that through our pending acquisition of BBVA USA. The transaction will elevate us to the fifth-largest U.S. bank with more than $560 billion in total assets. Upon close, which is subject to regulatory approval and expected this summer, we’ll be in 29 of the country’s 30 largest markets, and grow both our branch network and customer base by approximately 29%.
7227_NAR.indd 27227_NAR.indd 2 2/26/21 3:08 PM2/26/21 3:08 PM
2020 ANNUAL REPORT • THE PNC FINANCIAL SERVICES GROUP | 3
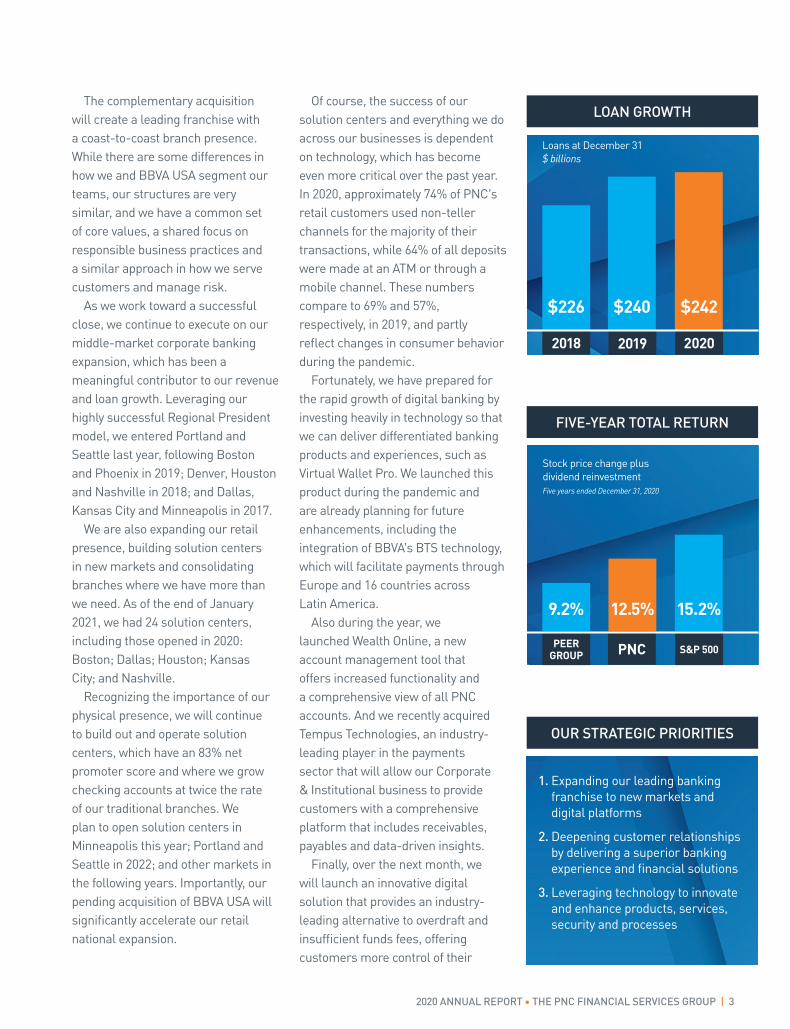
LOAN GROWTH
Loans at December 31$ billions
2018
$226 $240 $242
2019 2020
PEER GROUP PNC
FIVE-YEAR TOTAL RETURN
Stock price change plus dividend reinvestmentFive years ended December 31, 2020
S&P 500
9.2% 12.5% 15.2%
The complementary acquisition will create a leading franchise with a coast-to-coast branch presence. While there are some differences in how we and BBVA USA segment our teams, our structures are very similar, and we have a common set of core values, a shared focus on responsible business practices and a similar approach in how we serve customers and manage risk.
As we work toward a successful close, we continue to execute on our middle-market corporate banking expansion, which has been a meaningful contributor to our revenue and loan growth. Leveraging our highly successful Regional President model, we entered Portland and Seattle last year, following Boston and Phoenix in 2019; Denver, Houston and Nashville in 2018; and Dallas, Kansas City and Minneapolis in 2017.
We are also expanding our retail presence, building solution centers in new markets and consolidating branches where we have more than we need. As of the end of January 2021, we had 24 solution centers, including those opened in 2020: Boston; Dallas; Houston; Kansas City; and Nashville.
Recognizing the importance of our physical presence, we will continue to build out and operate solution centers, which have an 83% net promoter score and where we grow checking accounts at twice the rate of our traditional branches. We plan to open solution centers in Minneapolis this year; Portland and Seattle in 2022; and other markets in the following years. Importantly, our pending acquisition of BBVA USA will significantly accelerate our retail national expansion.
Of course, the success of our solution centers and everything we do across our businesses is dependent on technology, which has become even more critical over the past year. In 2020, approximately 74% of PNC’s retail customers used non-teller channels for the majority of their transactions, while 64% of all deposits were made at an ATM or through a mobile channel. These numbers compare to 69% and 57%, respectively, in 2019, and partly reflect changes in consumer behavior during the pandemic.
Fortunately, we have prepared for the rapid growth of digital banking by investing heavily in technology so that we can deliver differentiated banking products and experiences, such as Virtual Wallet Pro. We launched this product during the pandemic and are already planning for future enhancements, including the integration of BBVA’s BTS technology, which will facilitate payments through Europe and 16 countries across Latin America.
Also during the year, we launched Wealth Online, a new account management tool that offers increased functionality and a comprehensive view of all PNC accounts. And we recently acquired Tempus Technologies, an industry- leading player in the payments sector that will allow our Corporate & Institutional business to provide customers with a comprehensive platform that includes receivables, payables and data-driven insights.
Finally, over the next month, we will launch an innovative digital solution that provides an industry- leading alternative to overdraft and insufficient funds fees, offering customers more control of their
1. Expanding our leading bankingfranchise to new markets anddigital platforms
2. Deepening customer relationshipsby delivering a superior bankingexperience and financial solutions
3. Leveraging technology to innovateand enhance products, services,security and processes
OUR STRATEGIC PRIORITIES
7227_NAR.indd 37227_NAR.indd 3 2/26/21 3:11 PM2/26/21 3:11 PM
finances while potentially alleviating the challenges these fees can create. It’s true to our brand, will differentiate us in the market, and is consistent with our commitment to helping all move forward financially.
to help ensure their safety. First, we implemented a work-from-home strategy for more than 30,000 employees whose jobs can be performed remotely. For team members who must be onsite, we instituted safeguards, including a temporary adjustment to our retail branch model in which we operated primarily in drive-up–only mode; social distancing policies; air filtration enhancements; face covering requirements; symptom and temperature checks; and two-week, split-team rotations for frontline and operations employees, who received paid time off for the two-week periods when they were not onsite.
I look forward to bringing employees back to the office once it is safe to do so. In the meantime, we are working closely with our chief medical advisor and carefully monitoring caseloads in the cities where we operate to help ensure that we are doing everything we can to keep our employees and customers safe.
At the same time that we are taking care of our employees and customers, we are looking out for people in our communities. Last year, our regional presidents and the PNC Foundation worked diligently to deploy $30 million in support of coronavirus relief efforts, primarily directed toward basic needs and hardship relief programs, across our footprint. This funding provided meals and shelter, doubled the capacity for a summer reading program for children from low- and moderate-income families, and supported artists whose livelihoods were significantly impacted by the pandemic.
In addition to providing COVID-19 relief, we continued to invest in early childhood education through PNC Grow Up Great, our more than $500 million philanthropic program that supports children from low- and moderate-income families from birth to age 5. As studies show that learning disruptions and school closures disproportionately impact disadvantaged children, our investments, which totaled nearly $19 million in 2020, are more critical than ever before. Over the past 16 years, we have supported approximately 7 million kids through early childhood education initiatives. And while employee volunteerism looked a little different this year, we were able to find creative opportunities for our employees to volunteer virtually in support of high-quality early education.
PNC’s community support also came through in our efforts to help address systemic racism. Amid widespread social unrest and an increasingly divisive political environment, our focus on diversity, equity and inclusion has become even more important. Notwithstanding our significant progress over the past few years, we have an opportunity — and a responsibility — to do more to help drive meaningful change.
In June 2020, PNC committed more than $1 billion to help address systemic racism and support economic empowerment of Black Americans and low- and moderate- income communities. To bring this commitment to life, we are focusing on three areas where we believe we can have the greatest impact: economic empowerment, education and entrepreneurship. In addition, we are engaging with community-based
4 | FROM THE CEO | MARCH 1, 2021
In 2020, PNC committed more than $1 billion to help address systemic racism and support economic empowerment of Black Americans and low- and moderate-income communities. To bring this commitment to life, we are focusing on three areas where we believe we can have the greatest impact: economic empowerment, education and entrepreneurship.
LIVING OUR VALUESPNC’s success in navigating last year’s crises would not be possible without our 51,000 employees whose support for one another, our customers and our communities has been nothing short of extraordinary. Throughout the pandemic, these employees waived fees, granted loan modifications and worked around the clock to register more than 70,000 small business loans through the first round of the federal government’s Paycheck Protection Program. Others funneled critical resources into our communities that were disproportionately impacted by the pandemic.
To help ensure that our employees could continue to provide this support during the pandemic, we took steps
7227_NAR.indd 47227_NAR.indd 4 2/26/21 3:11 PM2/26/21 3:11 PM
leaders from around the country to help inform our community engagement and investment strategy in BBVA USA markets. These local, state and national leaders are helping us understand their respective communities’ challenges and opportunities.
Leading PNC’s $1 billion commitment is Richard Bynum, who was appointed as the company’s first corporate responsibility officer last year. Richard’s organization, which includes Diversity and Inclusion, Community Development Banking, Community Affairs, and Environmental, Social and Governance, will also play a critical role in improving racial equity inside of PNC. And recognizing the magnitude of our commitment, PNC’s board recently formed a Special Committee on Equity and Inclusion, which is overseeing the deployment of our resources to positively impact our company and communities.
Most recently, this committee played a critical role in our decision to sponsor Empowerment & Inclusion Capital I, a special purpose acquisition company (SPAC) focused on acquiring a diverse-led business or a business focused on promoting an inclusive economy and society. This SPAC is unique in that all proceeds from PNC’s sponsor interest will be donated to the PNC Foundation to support PNC’s ongoing efforts to help end systemic racism and drive economic empowerment for Black Americans and low- and moderate-income communities. Also significant is the SPAC’s all-diverse board of directors.
On a related note, I am proud to share that we have the most diverse board and Executive Committee in PNC’s history. Thirty-three percent
and 25% of our independent board directors are gender and racially diverse, respectively, while a majority of our Executive Committee members, all of whom report to me, are gender and racially diverse. And as part of our efforts to be even more transparent around our workforce demographic data, we will begin publishing our Equal Employment Opportunity data later this year. While we have made significant progress, we have an opportunity to better recruit, develop and retain diverse talent. We can absolutely make a difference, and we have a responsibility to make a difference. It’s good for our company, good for our community and good for our country.
Also important are the many ongoing ESG issues that we have monitored and reported on over time. Managing climate risk, enabling sustainable finance and supporting quality early childhood education — among other matters — remain a priority.
In 2020, PNC continued to engage with stakeholders on ESG issues, actively manage risk at both the transaction and portfolio levels and demonstrate transparency around climate risk.
In keeping with our commitment to transparency, we formally endorsed the recommendations of the Task Force on Climate-Related Financial Disclosures (TCFD) in 2019 and spent the last year determining how to integrate the recommendations into our business operations. We are excited to share that we will be publishing our first TCFD report in the second quarter of this year. This report will focus on our risk management strategy related to
2020 ANNUAL REPORT • THE PNC FINANCIAL SERVICES GROUP | 5
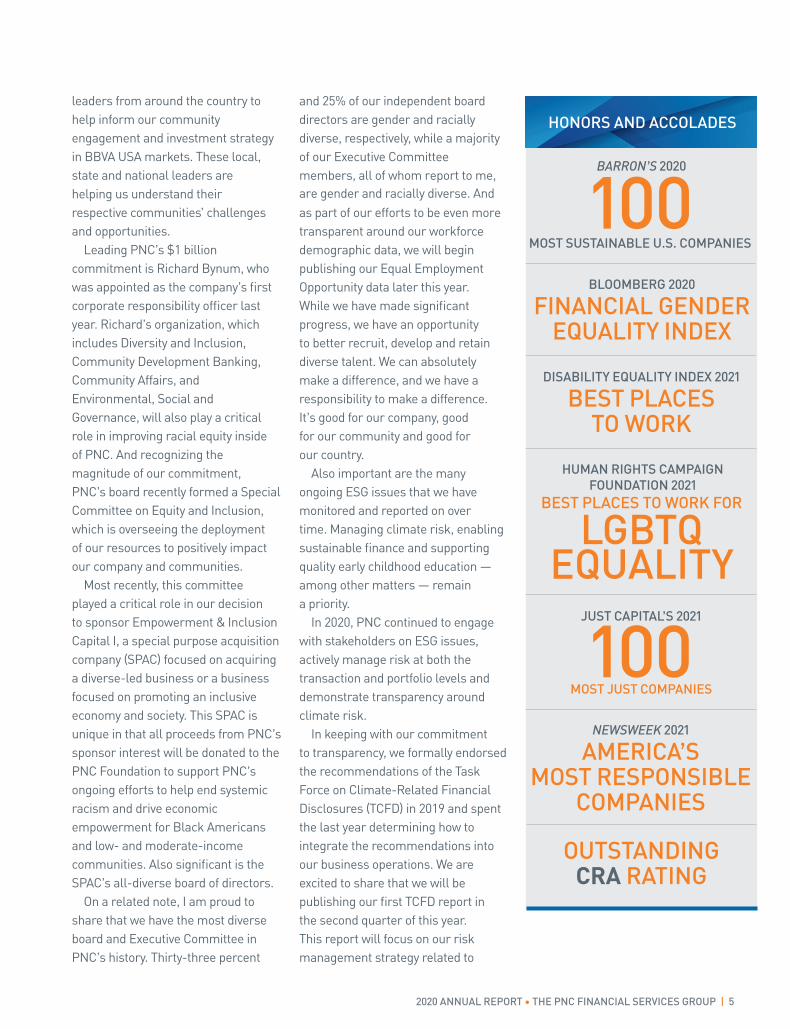
MOST SUSTAINABLE U.S. COMPANIES
BARRON’S 2020
100
HUMAN RIGHTS CAMPAIGN FOUNDATION 2021
BLOOMBERG 2020
FINANCIAL GENDER EQUALITY INDEX
BEST PLACES TO WORK FOR
LGBTQ EQUALITY
HONORS AND ACCOLADES
DISABILITY EQUALITY INDEX 2021
BEST PLACES TO WORK
JUST CAPITAL’S 2021
MOST JUST COMPANIES100NEWSWEEK 2021
AMERICA’S MOST RESPONSIBLE
COMPANIES
OUTSTANDING CRA RATING
7227_NAR_C1.indd 57227_NAR_C1.indd 5 3/1/21 10:21 AM3/1/21 10:21 AM
6 | FROM THE CEO | MARCH 1, 2021
For more information regarding certain factors that could cause future results to differ, possibly materially, from historical performance or from those anticipated in forward-looking statements, see the Cautionary Statement in Item 7 of our 2020 Form 10-K, which accompanies this letter. For additional information regarding PNC’s Peer Group, see Item 5 of the accompanying 2020 Form 10-K, and for additional information on PNC’s fee income net interest margin, and tangible book value, which are non-GAAP financial measures, see the Statistical Information (Unaudited) section in Item 8 of the accompanying 2020 Form 10-K.
all of whom were promoted to PNC’s Executive Committee.
This recognition also led us to strengthen our focus on the mobility of diverse talent. One of the best examples of this intensive effort was the creation of the Black Leaders Forum, a group of 130 leaders from across the company that advises PNC on how to better recruit, advance and retain Black leaders and employees. While this forum is uniquely focused on Black talent, it supports PNC’s broader objective to create a more equitable and inclusive culture for all employees.
Equally important to creating an inclusive culture and attracting and retaining diverse talent is our commitment to pay equity. PNC regularly reviews our pay practices to ensure that employees are being compensated fairly and consistently across roles. We are proud that, on average among our employees, women are paid 99% of what men are paid and minorities are paid 100% of what non-minorities are paid within like roles. Our pay analysis accounts for factors such as time in job, performance and geography.
LOOKING AHEADAs our country continues to battle the pandemic, systemic racism and political division, it is clear to me that the challenges we faced in 2020 will be with us for some time. While these challenges translate to a tough environment for banks, we have a massive opportunity and the talent, strategy and momentum to do really well.
WILLIAM S. DEMCHAKChairman, President and Chief Executive Officer
Notwithstanding uncertainty on many fronts, I am certain of our ability to execute, to perform both in the short and long term, and to deliver increased shareholder value.
I would like to express my gratitude and appreciation for our employees, who are committed to delivering a superior banking experience for every customer and focused on creating long-term value for our shareholders. I would like to thank our customers for continuing to trust PNC to help them achieve financial well-being. I also would like to thank our board of directors for their ongoing counsel and support. In February, we mourned the loss of Richard Kelson, a PNC director from 2002 through 2020. Rick was an extraordinary individual whose leadership and vision helped to shape our strategic direction, guide our execution and drive our growth throughout his 18 years of service on our board.
Finally, I would like to thank you for your confidence in our company and for your continued support as we work to deliver for our shareholders, customers, employees and communities.
climate change and include the carbon intensity scores of different sectors across our portfolio. This will mark the first time we’ve published these scores, which essentially will be used as a high-level benchmarking and portfolio trend tool.
Recognizing the growing demand among our clients to address their ESG goals with sustainable finance solutions, we named our first head of Sustainable Finance. This milestone follows PNC’s inaugural Green Bond issuance in 2019 and adoption of the Green Bond principles in 2016. Our progress in this space will continue to be critical as we work to support the transition to a low-carbon economy and make a difference for our clients and other key stakeholders.
Finally, we recognize that our ability to live our values and make a difference for our constituencies relies on talent. In 2020, this recognition led us to develop stronger talent pipelines, mentorship programs, training and leadership tools, and feedback systems that help us listen carefully to our employees’ needs. It led us to enhance our leadership culture to drive greater accountability and ensure transparency. And it led us to fill 62% of open requisitions at our first-level and above career bands with internal candidates, including Richard Bynum, chief corporate responsibility officer; Carole Brown, head of Asset Management; Debbie Guild, chief security officer and head of Enterprise Technology; Ganesh Krishnan, enterprise chief information officer; and Kieran Fallon, chief risk officer,
7227_NAR_C1.indd 67227_NAR_C1.indd 6 3/1/21 10:21 AM3/1/21 10:21 AM
UNITED STATESSECURITIES AND EXCHANGE COMMISSION
Washington, DC 20549
FORM 10-K
☒ ANNUAL REPORT PURSUANT TO SECTION 13 OR 15(d) OF THE SECURITIES EXCHANGE ACT OF 1934For the fiscal year ended December 31, 2020
or
☐ TRANSITION REPORT PURSUANT TO SECTION 13 OR 15(d) OF THE SECURITIES EXCHANGE ACT OF 1934For the transition period from toCommission file number 001-09718
THE PNC FINANCIAL SERVICES GROUP, INC.(Exact name of registrant as specified in its charter)
Pennsylvania 25-1435979(State or other jurisdiction of incorporation or organization) (I.R.S. Employer Identification No.)
The Tower at PNC Plaza, 300 Fifth Avenue, Pittsburgh, Pennsylvania 15222-2401(Address of principal executive offices, including zip code)
Registrant’s telephone number, including area code - (888) 762-2265
Securities registered pursuant to Section 12(b) of the Act:
Title of Each ClassTradingSymbol(s)
Name of Each Exchangeon Which Registered
Common Stock, par value $5.00 PNC New York Stock ExchangeDepositary Shares Each Representing a 1/4,000 Interest in a Share of Fixed-to-Floating Rate Non-Cumulative Perpetual Preferred Stock, Series P PNC P
New York Stock Exchange
Securities registered pursuant to Section 12(g) of the Act:$1.80 Cumulative Convertible Preferred Stock - Series B, par value $1.00
Indicate by check mark if the registrant is a well-known seasoned issuer, as defined in Rule 405 of the Securities Act. Yes☒ No☐Indicate by check mark if the registrant is not required to file reports pursuant to Section 13 or Section 15(d) of the Act. Yes☐ No☒Indicate by check mark whether the registrant: (1) has filed all reports required to be filed by Section 13 or 15(d) of the Securities Exchange Act of 1934during the preceding 12 months (or for such shorter period that the registrant was required to file such reports), and (2) has been subject to such filingrequirements for the past 90 days. Yes☒ No☐Indicate by check mark whether the registrant has submitted electronically every Interactive Data File required to be submitted pursuant to Rule 405 ofRegulation S-T (§232.405 of this chapter) during the preceding 12 months (or for such shorter period that the registrant was required to submit suchfiles). Yes ☒ No☐Indicate by check mark whether the registrant is a large accelerated filer, an accelerated filer, a non-accelerated filer, a smaller reporting company, or anemerging growth company. See the definitions of “large accelerated filer,” “accelerated filer,” “smaller reporting company,” and “emerging growth company”in Rule 12b-2 of the Exchange Act.
Large accelerated filer ☒ Accelerated filer ☐ Emerging growth company ☐Non-accelerated filer ☐ Smaller reporting company ☐
If an emerging growth company, indicate by check mark if the registrant has elected not to use the extended transition period for complying with any new orrevised financial accounting standards provided pursuant to Section 13(a) of the Exchange Act. ☐Indicate by check mark whether the registrant has filed a report on and attestation to its management's assessment of the effectiveness of its internal controlover financial reporting under Section 404(b) of the Sarbanes-Oxley Act (15 U.S.C. 7262(b)) by the registered public accounting firm that prepared or issuedits audit report.☒Indicate by check mark whether the registrant is a shell company (as defined in Rule 12b-2 of the Act). Yes☐ No☒The aggregate market value of the registrant’s outstanding voting common stock held by nonaffiliates on June 30, 2020, determined using the per shareclosing price on that date on the New York Stock Exchange of $105.21, was approximately $44.5 billion. There is no non-voting common equity of theregistrant outstanding.
Number of shares of registrant’s common stock outstanding at February 5, 2021: 424,020,492
DOCUMENTS INCORPORATED BY REFERENCE
Portions of the definitive Proxy Statement of The PNC Financial Services Group, Inc. to be filed pursuant to Regulation 14A for the 2021 annual meeting ofshareholders (Proxy Statement) are incorporated by reference into Part III of this Form 10-K.
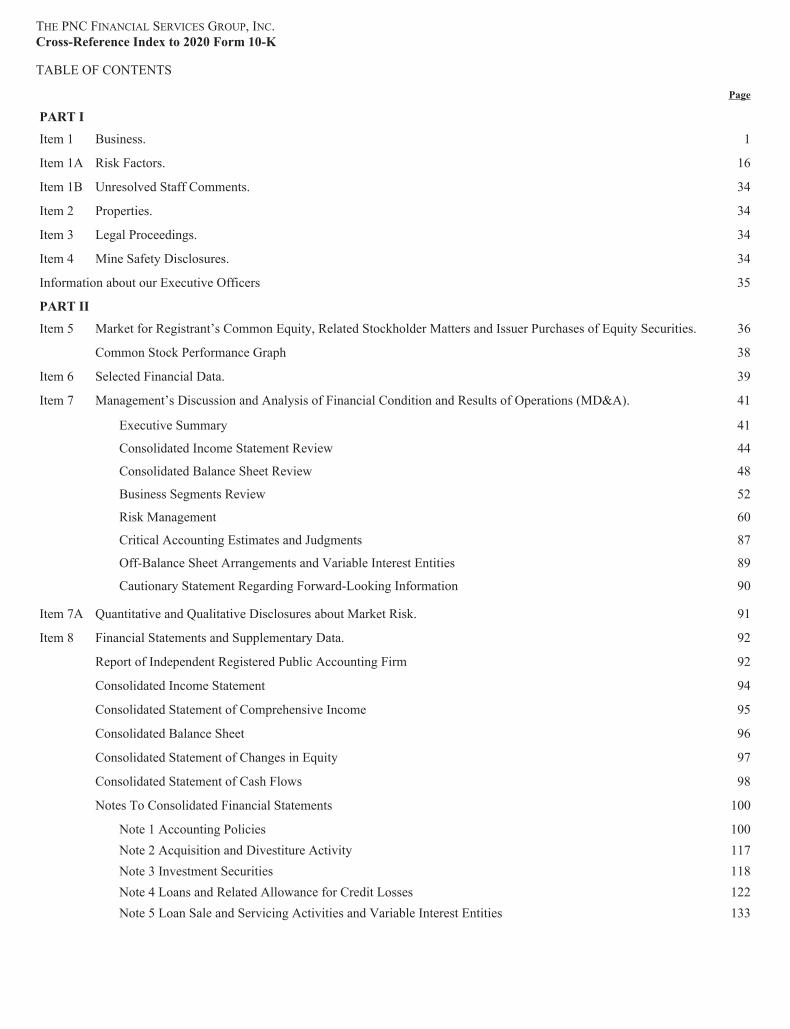
THE PNC FINANCIAL SERVICES GROUP, INC.Cross-Reference Index to 2020 Form 10-K
TABLE OF CONTENTS
Page
PART I
Item 1 Business. 1
Item 1A Risk Factors. 16
Item 1B Unresolved Staff Comments. 34
Item 2 Properties. 34
Item 3 Legal Proceedings. 34
Item 4 Mine Safety Disclosures. 34
Information about our Executive Officers 35
PART II
Item 5 Market for Registrant’s Common Equity, Related Stockholder Matters and Issuer Purchases of Equity Securities. 36
Common Stock Performance Graph 38
Item 6 Selected Financial Data. 39
Item 7 Management’s Discussion and Analysis of Financial Condition and Results of Operations (MD&A). 41
Executive Summary 41
Consolidated Income Statement Review 44
Consolidated Balance Sheet Review 48
Business Segments Review 52
Risk Management 60
Critical Accounting Estimates and Judgments 87
Off-Balance Sheet Arrangements and Variable Interest Entities 89
Cautionary Statement Regarding Forward-Looking Information 90
Item 7A Quantitative and Qualitative Disclosures about Market Risk. 91
Item 8 Financial Statements and Supplementary Data. 92
Report of Independent Registered Public Accounting Firm 92
Consolidated Income Statement 94
Consolidated Statement of Comprehensive Income 95
Consolidated Balance Sheet 96
Consolidated Statement of Changes in Equity 97
Consolidated Statement of Cash Flows 98
Notes To Consolidated Financial Statements 100
Note 1 Accounting Policies 100Note 2 Acquisition and Divestiture Activity 117Note 3 Investment Securities 118Note 4 Loans and Related Allowance for Credit Losses 122Note 5 Loan Sale and Servicing Activities and Variable Interest Entities 133
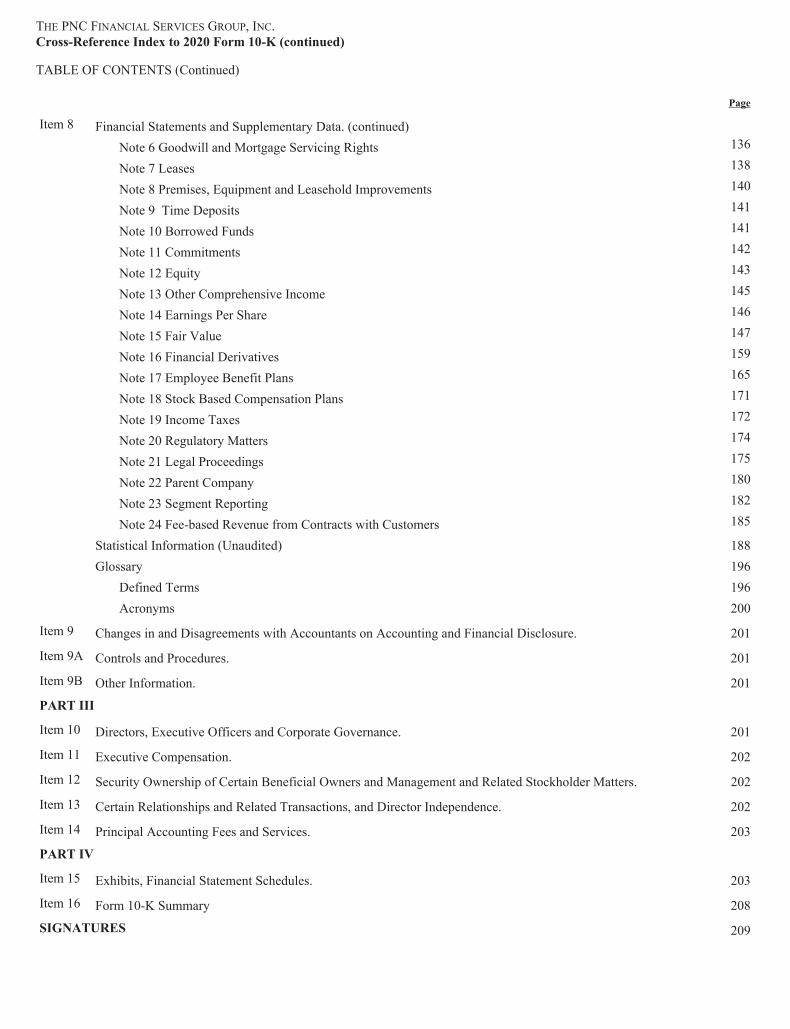
THE PNC FINANCIAL SERVICES GROUP, INC.Cross-Reference Index to 2020 Form 10-K (continued)
TABLE OF CONTENTS (Continued)
Page
Item 8 Financial Statements and Supplementary Data. (continued)Note 6 Goodwill and Mortgage Servicing Rights 136
Note 7 Leases 138
Note 8 Premises, Equipment and Leasehold Improvements 140
Note 9 Time Deposits 141
Note 10 Borrowed Funds 141
Note 11 Commitments 142
Note 12 Equity 143
Note 13 Other Comprehensive Income 145
Note 14 Earnings Per Share 146
Note 15 Fair Value 147
Note 16 Financial Derivatives 159
Note 17 Employee Benefit Plans 165
Note 18 Stock Based Compensation Plans 171
Note 19 Income Taxes 172
Note 20 Regulatory Matters 174
Note 21 Legal Proceedings 175
Note 22 Parent Company 180
Note 23 Segment Reporting 182
Note 24 Fee-based Revenue from Contracts with Customers 185
Statistical Information (Unaudited) 188Glossary 196
Defined Terms 196Acronyms 200
Item 9 Changes in and Disagreements with Accountants on Accounting and Financial Disclosure. 201
Item 9A Controls and Procedures. 201
Item 9B Other Information. 201
PART III
Item 10 Directors, Executive Officers and Corporate Governance. 201
Item 11 Executive Compensation. 202
Item 12 Security Ownership of Certain Beneficial Owners and Management and Related Stockholder Matters. 202
Item 13 Certain Relationships and Related Transactions, and Director Independence. 202
Item 14 Principal Accounting Fees and Services. 203
PART IV
Item 15 Exhibits, Financial Statement Schedules. 203
Item 16 Form 10-K Summary 208
SIGNATURES 209
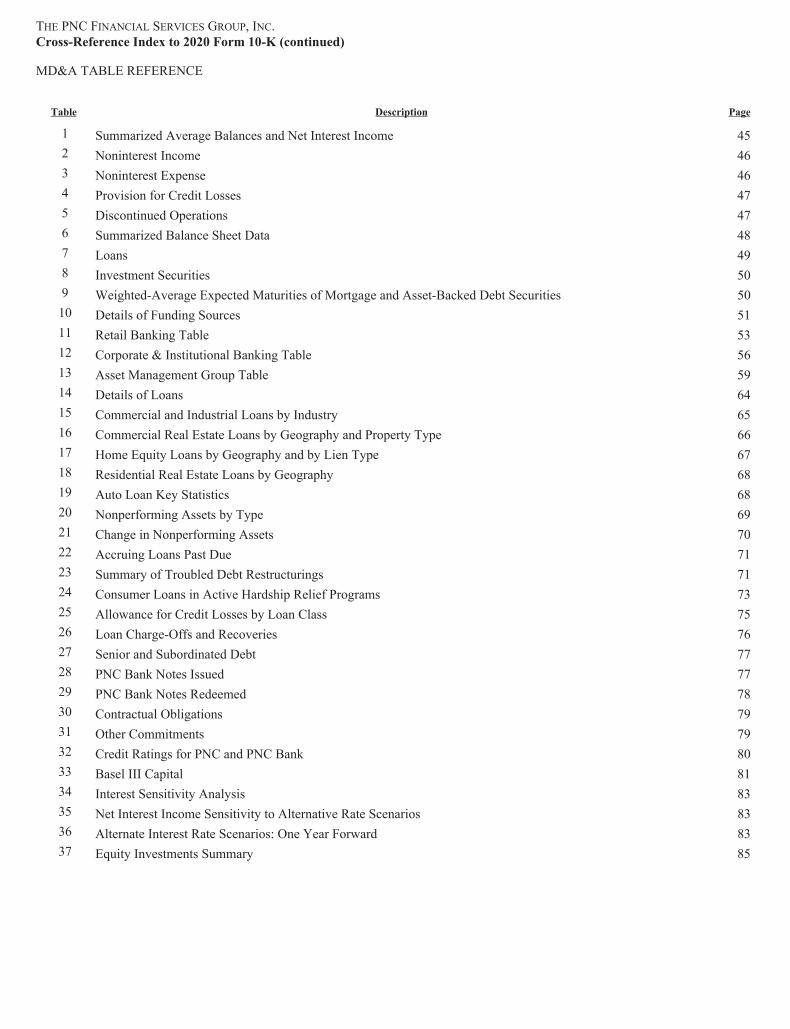
THE PNC FINANCIAL SERVICES GROUP, INC.Cross-Reference Index to 2020 Form 10-K (continued)
MD&A TABLE REFERENCE
Table Description Page
1 Summarized Average Balances and Net Interest Income 452 Noninterest Income 463 Noninterest Expense 464 Provision for Credit Losses 475 Discontinued Operations 476 Summarized Balance Sheet Data 487 Loans 498 Investment Securities 509 Weighted-Average Expected Maturities of Mortgage and Asset-Backed Debt Securities 5010 Details of Funding Sources 5111 Retail Banking Table 5312 Corporate & Institutional Banking Table 5613 Asset Management Group Table 5914 Details of Loans 6415 Commercial and Industrial Loans by Industry 6516 Commercial Real Estate Loans by Geography and Property Type 6617 Home Equity Loans by Geography and by Lien Type 6718 Residential Real Estate Loans by Geography 6819 Auto Loan Key Statistics 6820 Nonperforming Assets by Type 6921 Change in Nonperforming Assets 7022 Accruing Loans Past Due 7123 Summary of Troubled Debt Restructurings 7124 Consumer Loans in Active Hardship Relief Programs 7325 Allowance for Credit Losses by Loan Class 7526 Loan Charge-Offs and Recoveries 7627 Senior and Subordinated Debt 7728 PNC Bank Notes Issued 7729 PNC Bank Notes Redeemed 7830 Contractual Obligations 7931 Other Commitments 7932 Credit Ratings for PNC and PNC Bank 8033 Basel III Capital 8134 Interest Sensitivity Analysis 8335 Net Interest Income Sensitivity to Alternative Rate Scenarios 8336 Alternate Interest Rate Scenarios: One Year Forward 8337 Equity Investments Summary 85
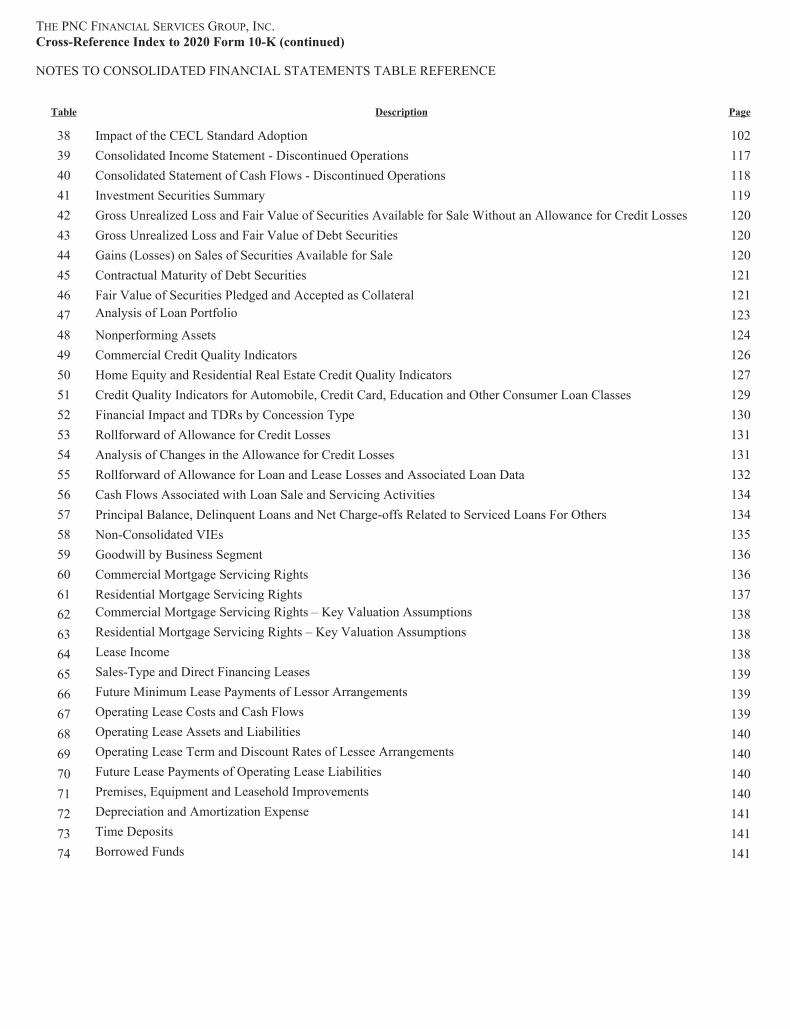
THE PNC FINANCIAL SERVICES GROUP, INC.Cross-Reference Index to 2020 Form 10-K (continued)
NOTES TO CONSOLIDATED FINANCIAL STATEMENTS TABLE REFERENCE
Table Description Page
38 Impact of the CECL Standard Adoption 10239 Consolidated Income Statement - Discontinued Operations 11740 Consolidated Statement of Cash Flows - Discontinued Operations 11841 Investment Securities Summary 11942 Gross Unrealized Loss and Fair Value of Securities Available for Sale Without an Allowance for Credit Losses 12043 Gross Unrealized Loss and Fair Value of Debt Securities 12044 Gains (Losses) on Sales of Securities Available for Sale 12045 Contractual Maturity of Debt Securities 12146 Fair Value of Securities Pledged and Accepted as Collateral 12147 Analysis of Loan Portfolio 12348 Nonperforming Assets 12449 Commercial Credit Quality Indicators 12650 Home Equity and Residential Real Estate Credit Quality Indicators 12751 Credit Quality Indicators for Automobile, Credit Card, Education and Other Consumer Loan Classes 12952 Financial Impact and TDRs by Concession Type 13053 Rollforward of Allowance for Credit Losses 13154 Analysis of Changes in the Allowance for Credit Losses 13155 Rollforward of Allowance for Loan and Lease Losses and Associated Loan Data 13256 Cash Flows Associated with Loan Sale and Servicing Activities 13457 Principal Balance, Delinquent Loans and Net Charge-offs Related to Serviced Loans For Others 13458 Non-Consolidated VIEs 13559 Goodwill by Business Segment 13660 Commercial Mortgage Servicing Rights 13661 Residential Mortgage Servicing Rights 13762 Commercial Mortgage Servicing Rights – Key Valuation Assumptions 13863 Residential Mortgage Servicing Rights – Key Valuation Assumptions 13864 Lease Income 13865 Sales-Type and Direct Financing Leases 13966 Future Minimum Lease Payments of Lessor Arrangements 13967 Operating Lease Costs and Cash Flows 13968 Operating Lease Assets and Liabilities 14069 Operating Lease Term and Discount Rates of Lessee Arrangements 14070 Future Lease Payments of Operating Lease Liabilities 14071 Premises, Equipment and Leasehold Improvements 14072 Depreciation and Amortization Expense 14173 Time Deposits 14174 Borrowed Funds 141
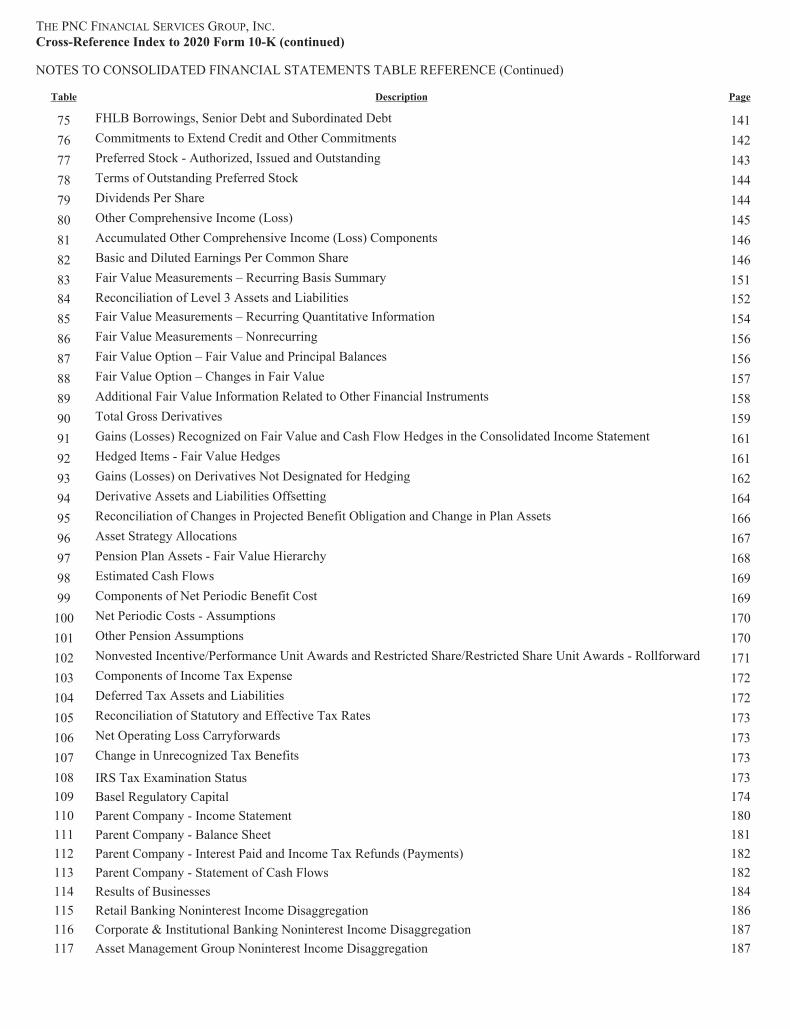
THE PNC FINANCIAL SERVICES GROUP, INC.Cross-Reference Index to 2020 Form 10-K (continued)
NOTES TO CONSOLIDATED FINANCIAL STATEMENTS TABLE REFERENCE (Continued)
Table Description Page
75 FHLB Borrowings, Senior Debt and Subordinated Debt 14176 Commitments to Extend Credit and Other Commitments 14277 Preferred Stock - Authorized, Issued and Outstanding 14378 Terms of Outstanding Preferred Stock 14479 Dividends Per Share 14480 Other Comprehensive Income (Loss) 14581 Accumulated Other Comprehensive Income (Loss) Components 14682 Basic and Diluted Earnings Per Common Share 14683 Fair Value Measurements – Recurring Basis Summary 15184 Reconciliation of Level 3 Assets and Liabilities 15285 Fair Value Measurements – Recurring Quantitative Information 15486 Fair Value Measurements – Nonrecurring 15687 Fair Value Option – Fair Value and Principal Balances 15688 Fair Value Option – Changes in Fair Value 15789 Additional Fair Value Information Related to Other Financial Instruments 15890 Total Gross Derivatives 15991 Gains (Losses) Recognized on Fair Value and Cash Flow Hedges in the Consolidated Income Statement 16192 Hedged Items - Fair Value Hedges 16193 Gains (Losses) on Derivatives Not Designated for Hedging 16294 Derivative Assets and Liabilities Offsetting 16495 Reconciliation of Changes in Projected Benefit Obligation and Change in Plan Assets 16696 Asset Strategy Allocations 16797 Pension Plan Assets - Fair Value Hierarchy 16898 Estimated Cash Flows 16999 Components of Net Periodic Benefit Cost 169100 Net Periodic Costs - Assumptions 170101 Other Pension Assumptions 170102 Nonvested Incentive/Performance Unit Awards and Restricted Share/Restricted Share Unit Awards - Rollforward 171103 Components of Income Tax Expense 172104 Deferred Tax Assets and Liabilities 172105 Reconciliation of Statutory and Effective Tax Rates 173106 Net Operating Loss Carryforwards 173107 Change in Unrecognized Tax Benefits 173108 IRS Tax Examination Status 173109 Basel Regulatory Capital 174110 Parent Company - Income Statement 180111 Parent Company - Balance Sheet 181112 Parent Company - Interest Paid and Income Tax Refunds (Payments) 182113 Parent Company - Statement of Cash Flows 182114 Results of Businesses 184115 Retail Banking Noninterest Income Disaggregation 186116 Corporate & Institutional Banking Noninterest Income Disaggregation 187117 Asset Management Group Noninterest Income Disaggregation 187

PART IForward-Looking Statements: From time to time, The PNC Financial Services Group, Inc. has made and may continue to makewritten or oral forward-looking statements regarding our outlook for earnings, revenues, expenses, capital and liquidity levels andratios, asset levels, asset quality, financial position and other matters regarding or affecting us and our future business and operationsor the impact of legal, regulatory or supervisory matters on our business operations or performance. This Annual Report on Form 10-K (the Report or Form 10-K) also includes forward-looking statements. With respect to all such forward-looking statements, youshould review our Risk Factors discussion in Item 1A, our Risk Management, Critical Accounting Estimates and Judgments, andCautionary Statement Regarding Forward-Looking Information sections included in Item 7, and Note 21 Legal Proceedings in theNotes To Consolidated Financial Statements included in Item 8 of this Report. In this Report, “PNC”, “we”, “us”, “the Company” or“the Corporation” refers to The PNC Financial Services Group, Inc. and its subsidiaries on a consolidated basis (except whenreferring to PNC as a public company, its common stock or other securities issued by PNC, which just refer to The PNC FinancialServices Group, Inc.). References to The PNC Financial Services Group, Inc. or to any of its subsidiaries are specifically made whereapplicable.
See page 196 for a glossary of certain terms and acronyms used in this Report.
ITEM 1 – BUSINESS
Business Overview
Headquartered in Pittsburgh, Pennsylvania, we are one of the largest diversified financial services companies in the U.S. We havebusinesses engaged in retail banking, including residential mortgage, corporate and institutional banking and asset management,providing many of our products and services nationally. Our retail branch network is located primarily in markets across the Mid-Atlantic, Midwest and Southeast. We also have strategic international offices in four countries outside the U.S. At December 31, 2020,our consolidated total assets, total deposits and total shareholders’ equity were $466.7 billion, $365.3 billion and $54.0 billion,respectively.
We were incorporated under the laws of the Commonwealth of Pennsylvania in 1983 with the consolidation of Pittsburgh NationalCorporation and Provident National Corporation. Since 1983, we have diversified our geographical presence, business mix andproduct capabilities through organic growth, strategic bank and non-bank acquisitions and equity investments, and the formation ofvarious non-banking subsidiaries.
Pending Acquisition of BBVA USA Bancshares, Inc.
On November 16, 2020, PNC announced a definitive agreement with BBVA, S.A. to acquire BBVA, a U.S. financial holdingcompany conducting its business operations primarily through its U.S. banking subsidiary, BBVA USA, for a fixed purchase price of$11.6 billion in cash. BBVA USA has over 600 branches in Texas, Alabama, Arizona, California, Florida, Colorado and New Mexico.The transaction is expected to add approximately $102 billion in total assets, $86 billion of deposits and $66 billion of loans to PNC’sConsolidated Balance Sheet and to close in mid-2021, subject to customary closing conditions, including receipt of regulatoryapprovals. Note 2 Acquisition and Divestiture Activity in the Notes to Consolidated Financial Statements in Item 8 of this Report andour Current Reports on Form 8-K dated November 16, 2020 and November 19, 2020 contain additional information regarding thispending acquisition.
Second Quarter Sale of Equity Investment in BlackRock, Inc.
In the second quarter of 2020, PNC divested its entire 22.4% equity investment in BlackRock. Net proceeds from the sale were$14.2 billion. The after-tax gain on the sale of $4.3 billion, and donation expense and BlackRock’s historical results for all periodspresented, are reported as discontinued operations. For additional details on the divestiture of our equity investment in BlackRock, seeNote 2 Acquisition and Divestiture Activity in the Notes to Consolidated Financial Statements in Item 8 of this Report.
Coronavirus (COVID-19) Pandemic
The COVID-19 pandemic and public health response to contain it led to a severe recession in the first half of 2020, after the U.S.economy reached a peak in economic activity in February 2020. There is still a great deal of uncertainty about the length and severityof the pandemic and the strength or reversal of the economic rebound, including whether there will be additional fiscal stimulus fromthe federal government and, if so, its size, scope and effectiveness.
PNC is committed to putting our resources to work to support our customers, communities and the broader financial system. PNCparticipated in funding PPP loans under the CARES Act and, at December 31, 2020, had $12.0 billion of PPP loans outstanding, downfrom the $13.7 billion funded during the second quarter of 2020 as a result of loan forgiveness and repayments. PNC also isparticipating in funding new and second draw PPP loans in 2021 under the Consolidated Appropriations Act. PNC continues to grant
The PNC Financial Services Group, Inc. – 2020 Form 10-K 1
loan modifications for customers in need through various hardship relief programs. We analyze and make decisions on thesemodifications based on each individual borrower’s situation. PNC is also assisting customers with the PPP loan forgiveness process.See the Troubled Debt Restructurings and Loan Modifications in the Credit Risk Management portion of the Risk Managementsection of Item 7 for details on our commercial and consumer loan modifications.
Our retail branches have largely reopened as we continue to prioritize the safety and well-being of our customers and employees,while complying with all state and local health mandates and managing in accordance with Center for Disease Control guidelines. Asof February 16, 2021, approximately 98% of PNC branch lobbies were fully opened.
Our technology infrastructure and systems are designed for business resiliency and security. We have leveraged these capabilities andour business continuity plans to execute a work-from-home strategy, which has resulted in many of our employees working fromhome during 2020 and into 2021. PNC has also implemented various strategies that are designed to promote the health and safety ofour employees who need to be on-site to execute their job responsibilities.
See the Supervision and Regulation section of this Item 1 for additional detail on the CARES Act and other governmental responses tothe pandemic and its economic and financial impacts. Also see Risk Factors in Item 1A of this Report for a description of theassociated risks related to the COVID-19 pandemic.
Subsidiaries
Our corporate legal structure at December 31, 2020 consisted of one domestic subsidiary bank, including its subsidiaries, and 51 activenon-bank subsidiaries, in addition to various affordable housing investments and historic rehabilitation investments. Our banksubsidiary is PNC Bank, a national bank headquartered in Pittsburgh, Pennsylvania. For additional information on certain of oursubsidiaries, see Exhibit 21 to this Report.
Statistical Disclosure By Bank Holding Companies
The following statistical information is included on the indicated pages of this Report and is incorporated herein by reference:
Form 10-K pageAverage Consolidated Balance Sheet And Net Interest Analysis 189Analysis Of Year-To-Year Changes In Net Interest Income 190Book Values Of Securities 50 and 118-121Maturities And Weighted-Average Yield Of Securities 50 and 121Loan Types 49, 64, 123-124 and 191Selected Loan Maturities And Interest Sensitivity 192Nonaccrual, Past Due And Restructured Loans And Other Nonperforming Assets 64-76, 104-111, 122-132 and 191Potential Problem Loans 64-76 and 126Summary Of Loan Loss Experience 73-76, 131-132 and 193Allocation Of Allowance For Loan And Lease Losses 73-76 and 193Average Amount And Average Rate Paid On Deposits 189Time Deposits Of $100,000 Or More 194Selected Consolidated Financial Data 39-41Short-term Borrowings – not included as average balances during 2020, 2019 and 2018 were less than 30% oftotal shareholders’ equity at the end of each period.
Supervision and Regulation
The PNC Financial Services Group, Inc. is a BHC registered under the BHC Act and a financial holding company under the GLB Act.
We are subject to numerous governmental regulations, some of which are highlighted below. See Note 20 Regulatory Matters in theNotes To Consolidated Financial Statements in Item 8 of this Report for additional information regarding our regulatory matters.Applicable laws and regulations restrict our permissible activities and investments, impose conditions and requirements on theproducts and services we offer and the manner in which they are offered and sold, and require compliance with protections for loan,deposit, brokerage, fiduciary, investment management and other customers, among other things. They also restrict our ability torepurchase stock or pay dividends, or to receive dividends from our bank subsidiary, and impose capital adequacy and liquidityrequirements. The consequences of noncompliance with these, or other applicable laws or regulations, can include substantialmonetary and nonmonetary sanctions.
In addition, we are subject to comprehensive supervision and periodic examination by, among other regulatory bodies, the FederalReserve and the OCC. These examinations consider not only compliance with applicable laws, regulations and supervisory policies of
2 The PNC Financial Services Group, Inc. – 2020 Form 10-K
the agency, but also capital levels, asset quality, risk management effectiveness, the ability and performance of management and theboard of directors, the effectiveness of internal controls and internal audit function, earnings, liquidity and various other factors.
The results of examination activity by any of our federal bank regulators potentially can result in the imposition of significantlimitations on our activities and growth. These regulatory agencies generally have broad discretion to impose restrictions andlimitations on the operations of a regulated entity and take enforcement action, including the imposition of substantial monetarypenalties and nonmonetary requirements, against a regulated entity where the relevant agency determines, among other things, that theoperations of the regulated entity or any of its subsidiaries fail to comply with applicable law or regulations, are conducted in anunsafe or unsound manner, or represent an unfair or deceptive act or practice. This supervisory framework, including the examinationreports and supervisory ratings (which are not publicly available) of the agencies, could materially impact the conduct, growth andprofitability of our operations.
The CFPB is responsible for examining us for compliance with most federal consumer financial protection laws, including the lawsrelating to fair lending and prohibiting unfair, deceptive or abusive acts or practices in connection with the offer, sale or provision ofconsumer financial products or services, and for enforcing such laws with respect to PNC Bank and its affiliates. The results of theCFPB’s examinations (which are not publicly available) also can result in restrictions or limitations on the operations of a regulatedentity as well as enforcement actions against a regulated entity, including the imposition of substantial monetary penalties andnonmonetary requirements.
We also are subject to regulation by the SEC by virtue of our status as a public company and by the SEC and the CFTC due to thenature of some of our businesses. Our businesses with operations outside the U.S. also are subject to regulation by appropriateauthorities in the foreign jurisdictions in which they do business.
As a regulated financial services firm, our relationships and good standing with regulators are of fundamental importance to theoperation and growth of our businesses. The Federal Reserve, OCC, CFPB, SEC, CFTC and other domestic and foreign regulatorshave broad enforcement powers, and certain of the regulators have the power to approve, deny, or refuse to act upon our applicationsor notices to conduct new activities, acquire or divest businesses, assets or deposits, expand our operations geographically, orreconfigure existing operations.
Among the areas that have been receiving a high level of regulatory focus are compliance with the BSA and anti-money launderinglaws, capital and liquidity management (including stress testing), the structure and effectiveness of enterprise risk managementframeworks, the management of risks associated with the COVID-19 pandemic, the protection of confidential customer information,cyber security, the oversight of arrangements with third-party vendors and suppliers, and compliance with fair lending and otherconsumer protection laws and regulations, including those governing retail sales practices, fee disclosures, unfair, deceptive or abusiveacts or practices, collection practices, and protections for military service members and individuals in bankruptcy.
New legislation, changes in rules promulgated by federal financial regulators, other federal and state regulatory authorities and self-regulatory organizations, or changes in the interpretation or enforcement of existing laws and rules, may directly affect the operationsand profitability of our businesses. We anticipate new legislative and regulatory initiatives over the next several years, focusedspecifically on banking and other financial services in which we are engaged. Legislative and regulatory developments to date, as wellas those that come in the future, have had and are likely to continue to have an impact on the conduct of our business. The moredetailed description of the significant regulations to which we are subject included in this Report is based on current laws andregulations and is subject to potentially material change. See also the additional information included as Risk Factors in Item 1A ofthis Report discussing the impact of financial regulatory initiatives on the regulatory environment for us and the financial servicesindustry.
The profitability of our businesses could also be affected by rules and regulations that impact the business and financial sectors ingeneral, including changes to the laws governing taxation, antitrust regulation, electronic commerce, data security and privacy.
There are numerous rules governing the regulation of financial services institutions and their holding companies. Accordingly, thefollowing discussion is general in nature and does not purport to be complete or to describe all of the laws, regulations and policiesthat apply to us. To a substantial extent, the purpose of the regulation and supervision of financial services institutions and theirholding companies is not to protect our shareholders and our non-customer creditors, but rather to protect our customers (includingdepositors) and the financial markets and financial system in general.
The PNC Financial Services Group, Inc. – 2020 Form 10-K 3
COVID-19 ReliefSince the outbreak of COVID-19, the U.S. Government has taken a wide variety of actions in order to aid businesses and consumersfinancially impacted by COVID-19, facilitate the orderly functioning of financial markets, and assist banking organizations in beingable to meet the credit and other banking needs of their customers and communities.
The CARES Act, as subsequently amended by the PPP and Health Care Enhancement Act and the Consolidated Appropriations Act,authorizes the SBA and the Treasury Department to expend up to $943 billion to support the issuance by SBA-approved lenders offirst-draw loans of up to $10 million and second-draw loans of up to $2 million to small and medium-sized businesses that meetcertain size and other eligibility requirements under the PPP. Borrowers may use the proceeds of a PPP loan only for specifiedpurposes (such as meeting payroll) and borrowers can have the loan partially or fully forgiven (and repaid by the SBA) to the extentthe borrower expends funds during a limited period following receipt of the loan proceeds for payroll costs or other specifiedexpenses. Eligible businesses may apply for a first-or second-draw PPP loan until March 31, 2021. Borrowers and lenders are requiredto provide certain certifications and documentation, and conduct certain reviews, in connection with PPP loan applications as specifiedin the PPP rules and associated guidance, which are subject to change and further clarification by the SBA and Treasury. PNC Bank isparticipating in the PPP.
The CARES Act also permits residential and multifamily mortgage borrowers with federally backed mortgages to request paymentforbearance for up to six months or 30 days, respectively, under a streamlined process if the borrower is experiencing a financialhardship due to the COVID-19 national emergency. The borrower may request an extension of these forbearance periods, for up to anadditional six months for residential borrowers and 60 days for multifamily borrowers. Residential mortgage borrowers with federallybacked mortgages, and tenants of multifamily borrowers that receive forbearance under these provisions, also benefit from certainforeclosure and eviction protections. For these purposes, federally backed mortgages include those guaranteed or insured by theFNMA, FHLMC, FHA or VA. Under revised Federal Housing Finance Agency policies, servicers of FNMA and FHLMC-guaranteedresidential mortgages, such as PNC Bank, will no longer have an obligation to advance scheduled payments on a mortgage loan that isin a mortgage-backed security once the servicer has advanced four months of missed payments on the loan. Various states andmunicipalities also have imposed new foreclosure and eviction limitations of varying scope and degree in response to the COVID-19pandemic. The CARES Act also provides consumers certain temporary protections up to 120 days after the termination of theCOVID-19 national emergency against the reporting of negative credit information to a credit reporting agency as a result of loanaccommodations provided.
The CARES Act, as modified by the Consolidated Appropriations Act, permits financial institutions to temporarily suspend therequirements under GAAP to categorize loan modifications related to the COVID-19 pandemic as a TDR through the earlier of 60days after the national emergency termination or January 2, 2022, and the determination of such a loan modification as being a TDR.The federal banking agencies, along with the CFPB and the National Credit Union Administration, and separately the FFIEC, releasedstatements that, among other things, clarify the agencies’ and FFIEC’s views on TDRs, including the interaction between agencyguidance on TDRs and the CARES Act, and prudent risk management and consumer protection principles. We are following theprovisions within the CARES Act, as amended, and the agencies’ and FFIEC’s statements when evaluating our COVID-19 relatedloan modification requests.
Federal Reserve Liquidity Facilities. To help promote the flow of credit and the orderly functioning of financial markets, the FederalReserve in 2020 established a number of new lending or liquidity facilities using its emergency lending authority under section 13(3)of the Federal Reserve Act. Many of these facilities are or were supported by funding provided by the Treasury Department, eitherfrom the Emergency Stabilization Fund or under the CARES Act. Certain of these facilities (the Primary Market Corporate CreditFacility, Secondary Market Corporate Credit Facility, Municipal Liquidity Facility, Term Asset-Backed Securities Loan Facility andMain Street Lending Facility) have ceased making or purchasing new extensions of credit. The following emergency facilitiescontinue to make or purchase new extensions of credit:
• Commercial Paper Funding Facility, which purchases highly rated unsecured and asset-backed commercial paper issued byeligible U.S. issuers;
• Paycheck Protection Program Lending Facility, which provides lenders funding secured by SBA-guaranteed loans madeunder the PPP described above;
• Primary Dealer Credit Facility, which provides secured funding to broker-dealers that are registered as primary dealers withthe Federal Reserve in exchange for a broad range of collateral; and
• Money Market Mutual Fund Liquidity Facility, which provides liquidity to money market mutual funds by lending to U.S.banking entities in exchange for highly-rated collateral acquired from money market mutual funds.
In October 2020, the Federal banking agencies finalized rules to encourage banking organizations to use the Money Market MutualFund Liquidity Facility and Paycheck Protection Program Liquidity Facility. Under the rules, banking organizations may exclude fromleverage and risk-based capital requirements any eligible assets sold or pledged to the Federal Reserve on a non-recourse basis as partof these programs, and they are required to neutralize the effect under the LCR of participating in these programs. The banking
4 The PNC Financial Services Group, Inc. – 2020 Form 10-K
agencies also clarified that, consistent with the CARES Act, covered loans originated by a banking organization under the PPP willreceive a zero percent risk weight for regulatory capital purposes, even if not pledged to the Federal Reserve.
In addition, in March 2020, the Federal Reserve announced changes to its discount window lending for insured depository institutions,such as PNC Bank. These changes permit insured depository institutions to borrow from the discount window, on a fully collateralizedbasis, for periods of up to 90 days, with such loans being prepayable and renewable by the borrowing institution on a daily basis.These changes, which will remain in effect until the Federal Reserve announces otherwise, provide insured depository institutionsadditional tools for managing their liquidity profile, including for purposes of the LCR. The Federal Reserve must publicly disclosethe details (including the name of the borrower or counterparty) of discount window transactions and transactions conducted byfacilities established by the Federal Reserve on a delayed basis.
The Federal banking agencies, CFPB, SEC, and CFTC have issued other rules, guidance, statements, orders or other actions to, amongother things, facilitate the continued provision of financial services, encourage financial institutions to work with customers affectedby the pandemic, and reduce operational or regulatory challenges resulting from the pandemic and the private-sector and governmentalactions designed to mitigate its effects. These actions and statements, among others, clarified when appraisals or evaluations arerequired for real estate-secured transactions and allowed required appraisals and evaluations to be deferred in certain circumstances,encouraged banking organizations to use their capital and liquidity buffers to continue to provide credit to customers and support thesmooth functioning of markets, and encouraged financial institutions to make available small-dollar loans to consumers and smallbusinesses affected by COVID-19.
Banking Regulation and SupervisionRegulatory Capital Requirements, Stress Testing and Capital Planning. PNC and PNC Bank are subject to the regulatory capitalrequirements established by the Federal Reserve and the OCC, respectively. The foundation of the agencies’ regulatory capital rules isthe international regulatory capital framework developed by the Basel Committee, the international body responsible for developingglobal regulatory standards for banking organizations for consideration and adoption by national jurisdictions. The regulatory capitalrules establish minimum requirements for the ratio of a banking organization’s regulatory capital to its risk-weighted assets, referred toas risk-based capital requirements, as well as for the ratio of its regulatory capital to measures of assets and other exposures, referredto as leverage capital requirements. The agencies’ regulatory capital rules have undergone significant change since 2013, when theagencies adopted final rules to implement the Basel Committee’s international regulatory capital framework, known as “Basel III”, aswell as certain provisions of the Dodd-Frank Act.
In 2019, the federal banking agencies adopted rules to better tailor the application of their capital, liquidity and enhanced prudentialrequirements for banking organizations to the asset size and risk profile (as measured by certain regulatory metrics) of the bankingorganization (the “2019 Tailoring Rules”). Effective January 1, 2020, the agencies’ capital and liquidity rules classify all BHCs with$100 billion or more in total assets into one of four categories (Category I, Category II, Category III and Category IV), with the moststringent capital and liquidity requirements applying to Category I firms and the least restrictive requirements applying to Category IVfirms. The classification of any bank subsidiary of a BHC generally follows that of its parent BHC. PNC and PNC Bank currently areCategory III firms because PNC (i) has more than $250 billion, but less than $700 billion, in consolidated total assets, (ii) is notdesignated as a GSIB, and (iii) has less than $75 billion in cross-jurisdictional activity. PNC and PNC Bank would become a CategoryI or II institution, and subject to more stringent capital and liquidity standards, if PNC were at some point in the future to have $700billion or more in total consolidated assets, be designated as a GSIB, or have $75 billion or more in cross-jurisdictional activity. As ofDecember 31, 2020, PNC had cross-jurisdictional activities for these purposes of $13.3 billion. PNC does not expect the pendingacquisition of BBVA, if consummated, would affect its classification as a Category III institution.
The regulatory capital rules generally divide regulatory capital into three components: CET1 capital, additional Tier 1 capital (which,together with CET1 capital, comprises Tier 1 capital) and Tier 2 capital. CET1 capital is generally common stock, retained earnings,and qualifying minority interest less required deductions. Prior to January 1, 2020, CET1 capital for PNC and PNC Bank also includedAOCI related to both available for sale securities and pension and other post-retirement plans. Effective January 1, 2020, and aspermitted by the 2019 Tailoring Rules, PNC and PNC Bank elected to exclude AOCI related to these items from CET1 capital.Additional Tier 1 capital generally includes, among other things, perpetual preferred stock and qualifying minority interests, lessrequired deductions. Tier 2 capital generally comprises qualifying subordinated debt and, subject to certain quantitative limits, ACL,less any required deductions from Tier 2 capital. The regulatory capital rules limit the extent to which minority interests inconsolidated subsidiaries may be included in regulatory capital. Total capital is the sum of Tier 1 capital and Tier 2 capital, less thedeductions required from Total capital.
Under the regulatory capital rules effective as of January 1, 2020, PNC and PNC Bank must deduct investments in unconsolidatedfinancial institutions, MSRs and deferred tax assets (in each case, net of associated deferred tax liabilities) from CET1 capital to theextent such items individually exceed 25% of the institution’s adjusted CET1 capital. As of December 31, 2020, PNC and PNCBank’s investments in unconsolidated financial institutions, MSRs and deferred tax assets did not exceed this threshold.
The PNC Financial Services Group, Inc. – 2020 Form 10-K 5
The agencies’ capital rules also permit banking organizations to elect to phase-in, on a straight-line basis over a three-year period, theday-one regulatory capital effects of implementing the FASB’s ASU 2016-13 Financial Instruments - Credit Losses (Topic 326),commonly referred to as the CECL standard. PNC implemented the CECL standard effective January 1, 2020, but elected not toimplement the phase-in of the day-one regulatory capital effects of the standard. See Note 1 Accounting Policies in the Notes toConsolidated Financial Statements in Item 8 of this Report for more detail on the CECL standard. Separately, the Federal bankingagencies adopted a rule that permits banking organizations that are subject to CECL during 2020 to delay CECL’s estimated impact onCET1 capital. CECL’s estimated impact on CET1 capital is the change in retained earnings at adoption plus or minus 25% of thechange in CECL ACL at the balance sheet date compared to CECL ACL at transition. For institutions electing to utilize this CECLtransition rule for regulatory capital, the estimated CECL impact is added to CET1 through December 31, 2021, then phased-out overthe following three years. PNC and PNC Bank have elected this five-year transition period effective March 31, 2020, which impactsregulatory capital ratios disclosed in this Report.
PNC and PNC Bank are required to use the standardized approach for determining a banking organization’s risk-weighted assets forpurposes of calculating the risk-based capital ratios. The standardized approach for risk-weighted assets takes into account credit andmarket risk. To calculate risk-weighted assets under the standardized approach for credit risk, the nominal dollar amounts of assets andcredit equivalent amounts of off-balance sheet items are generally multiplied by risk weights set forth in the rules, with the riskweights increasing as the perceived credit risk of the relevant asset or exposure increases. For certain types of exposures, such assecuritization exposures, the standardized approach establishes one or more methodologies that are to be used to calculate the risk-weighted asset amount for the exposure. High volatility commercial real estate, past due, securitization and equity exposures, as wellas MSRs and deferred tax assets that are not deducted from capital, are generally subject to higher risk weights than other types ofexposures. Under the market risk capital rule, risk-weighted asset amounts for covered trading positions are determined based on thecalculation of VAR (including stressed value-at-risk), specific risk, incremental risk and comprehensive risk amounts, as specified inthe capital rules.
We refer to the capital ratios calculated using the definition of capital under the agencies’ Basel III capital rules and, for the risk-basedratios, standardized risk-weighted assets, as our Basel III regulatory capital ratios.
The risk-based capital rules establish certain minimum standards for the capital ratios of banking organizations, including PNC andPNC Bank. Banking organizations must maintain a minimum CET1 ratio of 4.5%, a Tier 1 capital ratio of 6.0%, and a Total capitalratio of 8.0%, in each case in relation to risk-weighted assets, to be considered “adequately capitalized.” In 2020, the Federal Reserveintroduced a CET1 SCB for BHCs subject to the Federal Reserve’s CCAR process, such as PNC. The SCB is calculated based on thedifference between a firm’s starting and minimum CET1 ratio (as projected by the Federal Reserve) in the Supervisory SeverelyAdverse scenario during the CCAR process, plus four quarters of the organization’s planned common stock dividends (expressed as apercentage of risk-weighted assets), subject to a floor of 2.5%. Based on PNC’s performance under the Federal Reserve’s supervisorystress tests as part of CCAR 2020, PNC’s SCB for the period from the fourth quarter of 2020 through the third quarter of 2021 was setat 2.5%. While PNC Bank is not subject to a SCB, PNC Bank is required to maintain a capital conservation buffer in the form ofCET1 equal to a fixed 2.5% of risk-weighted assets.
PNC and PNC Bank must maintain risk-based capital above the minimum risk-based capital ratio requirements plus its SCB (in thecase of PNC) or capital conservation buffer (in the case of PNC Bank) in order to avoid limitations on capital distributions, includingdividends and repurchases of any Tier 1 capital instrument, such as common and qualifying preferred stock, and certain discretionaryincentive compensation payments. As a result, PNC and PNC Bank must maintain a CET1 capital ratio of at least 7.0%, a Tier 1capital ratio of at least 8.5%, and a Total capital ratio of at least 10.5% to avoid limitations on capital distributions and certaindiscretionary incentive compensation payments. Because PNC’s SCB is established as part of the CCAR process, and is based onPNC’s projected performance (as determined by the Federal Reserve) under the relevant Supervisory Severely Adverse scenario(which can change, potentially materially, from stress test to stress test), PNC’s SCB may vary, potentially materially, over time and,thus, PNC may be required to maintain capital above these levels to avoid limitations on capital distributions and certain discretionaryincentive compensation payments. In addition, while a firm’s SCB is typically determined as part of the Federal Reserve’s annualCCAR process, the Federal Reserve has reserved the right to conduct supervisory stress tests, require a firm to submit a revised capitalplan, and calculate a firm’s SCB, more frequently. BHCs subject to a SCB, such as PNC, generally may increase their capitaldistributions without seeking prior Federal Reserve approval, provided the BHC otherwise complies with its SCB and any otherapplicable capital or capital distribution requirements. However, in light of ongoing economic uncertainty related to the COVID-19pandemic, the Federal Reserve has imposed special limitations on dividends and share repurchases by CCAR-participating BHCsduring the first quarter of 2021 and these restrictions may be continued in future quarters, potentially in modified form.
For Category III banking organizations (such as PNC and PNC Bank), these higher SCB or capital conservation buffer levels abovethe regulatory minimums could be supplemented by a countercyclical capital buffer of up to an additional 2.5% of risk-weightedassets. This buffer is currently set at zero in the U.S. A Federal Reserve policy statement establishes the framework and factors theFederal Reserve would use in setting and adjusting the amount of the U.S. countercyclical capital buffer. Covered banking
6 The PNC Financial Services Group, Inc. – 2020 Form 10-K
organizations would generally have 12 months after the announcement of any increase in the countercyclical capital buffer to meet theincreased buffer requirement, unless the Federal Reserve determines to establish an earlier effective date. If the full countercyclicalbuffer amount is implemented, PNC and PNC Bank would be required to maintain a CET1 capital ratio of at least 9.5%, a Tier 1capital ratio of at least 11%, and a Total capital ratio of at least 13% to avoid limitations on capital distributions and certaindiscretionary incentive compensation payments.
The regulatory capital rules also require that banking organizations maintain a minimum amount of Tier 1 capital as compared toaverage consolidated assets, referred to as the leverage ratio, and require Category III banking organizations to maintain a minimumamount of Tier 1 capital as compared to total leverage exposure, referred to as the SLR. Total leverage exposure takes into account on-balance sheet assets as well as certain off-balance sheet items, including loan commitments and potential future exposure underderivative contracts. Banking organizations are required to maintain a minimum leverage ratio of Tier 1 capital to total assets of 4.0%,and Category III banking organizations must maintain a minimum SLR of 3.0%. As of December 31, 2020, the leverage and SLRratios of PNC and PNC Bank were above the required minimum level.
PNC and PNC Bank are not subject to the additional CET1 capital surcharge, minimum long-term debt requirement, minimum TLAC,or enhanced SLR requirements that apply to U.S. GSIBs.
Failure to meet applicable capital requirements could subject a banking organization to a variety of enforcement remedies available tothe federal banking agencies, including a limitation on the ability to pay dividends or repurchase shares, the issuance of a capitaldirective to increase capital and, in severe cases, the termination of deposit insurance by the FDIC and the appointment of aconservator or receiver. In some cases, the extent of these powers depends upon whether the institution in question is considered “wellcapitalized,” “adequately capitalized,” “undercapitalized,” “significantly undercapitalized” or “critically undercapitalized.” Thethresholds at which an insured depository institution is considered “well capitalized,” “adequately capitalized,” “undercapitalized,”“significantly undercapitalized” or “critically undercapitalized” are based on (i) the institution’s CET1, Tier 1 and total risk-basedcapital ratios; (ii) the institution’s leverage ratio; and (iii) for the definitions of “adequately capitalized” and “undercapitalized”, theinstitution’s SLR (if applicable). Generally, the smaller an institution’s capital base in relation to its risk-weighted or total assets, thegreater the scope and severity of the agencies’ powers. Business activities may also be affected by an institution’s capitalclassification. For example, as a financial holding company, PNC and PNC Bank must remain “well capitalized.”
At December 31, 2020, PNC and PNC Bank exceeded the required ratios for classification as “well capitalized.” For additionaldiscussion of capital adequacy requirements, including the levels of capital required to be considered “well capitalized,” see theLiquidity and Capital Management portion of the Risk Management section of Item 7 of this Report and Note 20 Regulatory Mattersin the Notes To Consolidated Financial Statements in Item 8 of this Report.
In addition to regulatory capital requirements, we are subject to the Federal Reserve’s capital plan rule, capital stress testingrequirements and CCAR process, as well as the DFAST requirements of the Federal Reserve and the OCC.
As part of the CCAR process, the Federal Reserve undertakes a supervisory assessment of the capital planning process of BHCs,including PNC, that have $100 billion or more in total consolidated assets. For us, this capital planning assessment is based on areview of a comprehensive capital plan submitted to the Federal Reserve that describes the company’s planned capital actions, such asplans to pay or increase common stock dividends, engage in common stock repurchase programs, or issue or redeem preferred stock orother regulatory capital instruments, during the nine quarter review period, as well as the results of stress tests conducted by both thecompany and the Federal Reserve under different hypothetical macro-economic scenarios, including a supervisory severely adversescenario provided by the Federal Reserve. The Federal Reserve’s capital plan rule provides that a BHC must resubmit a new capitalplan prior to the next annual submission date if, among other things, there has been or will be a material change in the BHC’s riskprofile, financial condition or corporate structure since its last capital plan submission. In light of the economic uncertainty presentedby the COVID-19 pandemic, the Federal Reserve required large BHCs like PNC to resubmit their capital plans and additional stresstest results in December 2020. The Federal Reserve has indicated that it expects to complete the review of these resubmitted capitalplans in early 2021.
In evaluating PNC’s capital plan, the Federal Reserve also considers a number of qualitative factors. In assessing a BHC’s capitalplanning and stress testing processes, the Federal Reserve considers whether the BHC has sound and effective governance to overseethese processes. The Federal Reserve’s evaluation focuses on whether a BHC’s capital planning and stress testing processes aresupported by a strong risk management framework to identify, measure and assess material risks and that provides a strong foundationto capital planning. The Federal Reserve also considers the comprehensiveness of a BHC’s control framework and evaluates a BHC’spolicy guidelines for capital planning and assessing capital adequacy. A BHC’s stress testing scenario design processes andapproaches for estimating the impact of stress on its capital position, including stress testing models and non-model qualitativeapproaches, are comprehensively reviewed to ensure that projections reflect the impact of appropriately stressful conditions, as well asrisks idiosyncratic to the BHC, on its capital position. Significant deficiencies in a BHC’s capital planning and stress testing processes
The PNC Financial Services Group, Inc. – 2020 Form 10-K 7
may result in supervisory directives that require the firm to address the identified deficiencies and, potentially, a downgrade in theBHC’s supervisory capital positions and planning rating.
In connection with the 2021 CCAR exercise, we must file our capital plan and stress testing results using financial data as ofDecember 31, 2020, with the Federal Reserve by April 6, 2021. We expect to receive the Federal Reserve’s response to the capitalplan submitted as part of the 2021 CCAR, as well as PNC’s preliminary SCB for the period from the fourth quarter of 2021 throughthe third quarter of 2022, in June 2021. The Federal Reserve must provide firms their final SCB for this period by August 31, 2021,which would reflect any changes made to the firm’s planned common stock dividends to remain in compliance with the firm’s SCB.
As part of the annual CCAR and DFAST processes, the Federal Reserve releases certain revenue, loss and capital results for eachparticipating firm from its supervisory stress testing exercises. As a Category III institution, PNC must conduct a company-runDFAST stress test biennially in even numbered years and release PNC’s projections of certain revenue, loss and capital results fromthe exercise under the agencies’ hypothetical supervisory severely adverse macro-economic scenario and applying the agencies’DFAST capital action assumptions.
Regulatory Liquidity Standards and Liquidity Risk Management Requirements. The Basel Committee’s Basel III framework alsoincludes short-term liquidity standards (LCR) and long-term funding standards (NSFR).
The U.S. banking agencies’ LCR rules are designed to ensure that covered banking organizations maintain an adequate level of cashand HQLA to meet estimated net liquidity needs in a short-term stress scenario using liquidity inflow and outflow assumptionsprescribed in the rules (net cash outflow). A company’s LCR is the amount of its HQLA, as calculated in accordance with the haircutsand limitations in the rule, divided by its net cash outflows, with the quotient expressed as a percentage. The regulatory minimum LCRthat covered banking organizations are required to maintain is 100%. PNC and PNC Bank are required to calculate the LCR on a dailybasis. If either institution’s LCR is below the minimum requirement for three consecutive business days, the institution must promptlyprovide its regulator with a plan for achieving compliance with the minimum LCR requirement. At December 31, 2020, the LCR forPNC and PNC Bank exceeded the required minimum levels.
The NSFR is designed to promote a stable maturity structure of assets and liabilities of banking organizations over a one-year timehorizon. In 2020, the federal banking agencies finalized rules that would implement the NSFR in the U.S., which become effectiveJuly 1, 2021. The rules require a covered BHC to calculate its NSFR as the ratio of its ASF to its RSF amount over a one-year horizon.The regulatory minimum ratio for all covered banking organizations (expressed as a percentage) is 100%. PNC and PNC Bank arerequired to calculate the NSFR on an ongoing basis. If either institution’s NSFR falls, or is likely to fall below, the minimumrequirement, the institution must provide its regulator with a plan for achieving compliance with the minimum NSFR requirement. Weexpect PNC and PNC Bank to be in compliance with the NSFR when it becomes effective.
As Category III institutions with less than $75 billion in weighted short-term wholesale funding, PNC and PNC Bank are subject toreduced LCR and NSFR requirements, with each company’s LCR net outflows and RSF (as calculated under the rules) reduced by15%, thereby reducing the amount of HQLA or ASF each institution must hold to meet the LCR and NSFR minimum requirements,respectively. As of December 31, 2020, PNC had weighted short-term wholesale funding for these purposes of $31.4 billion.
The Federal Reserve requires large BHCs, including PNC, to publicly disclose certain quantitative and qualitative measures of theirLCR- and NSFR-related liquidity profile. These disclosures include major components used to calculate the LCR and NSFR (e.g.,HQLA, cash outflows and inflows for the LCR, and ASF and RSF for the NSFR, at the consolidated parent company), and aqualitative discussion of the BHC’s LCR and NSFR results, including, among other things, key drivers of the results, composition ofHQLA and ASF, and concentration of funding sources.
As a Category III institution, PNC also is subject to Federal Reserve rules that require PNC to, among other things, conduct internalliquidity stress tests over a range of time horizons, maintain a buffer of highly liquid assets sufficient to meet projected net outflowsunder the BHC’s 30-day liquidity stress test, and maintain a contingency funding plan that meets certain requirements.
For additional discussion of regulatory liquidity requirements, refer to the Liquidity and Capital Management portion of the RiskManagement section of Item 7 of this Report.
Source of Parent Company Liquidity and Dividends. The principal source of our liquidity at the parent company level is dividendsfrom PNC Bank. PNC Bank is subject to various restrictions on its ability to pay dividends to PNC Bancorp, Inc., its direct parent,which is a wholly-owned direct subsidiary of The PNC Financial Services Group, Inc. PNC Bank is also subject to federal lawslimiting extensions of credit to its parent holding company and non-bank affiliates as discussed in Note 20 Regulatory Matters in the
8 The PNC Financial Services Group, Inc. – 2020 Form 10-K
Notes To Consolidated Financial Statements in Item 8 of this Report. Further information on bank level liquidity and parent companyliquidity is also available in the Liquidity and Capital Management portion of the Risk Management section of Item 7 of this Report.
Federal Reserve rules provide that a BHC is expected to serve as a source of financial strength to its subsidiary banks and to commitresources to support such banks if necessary. Dodd-Frank requires that the Federal Reserve jointly adopt new rules with the OCC andthe FDIC to implement this source of strength requirement. These joint rules have not yet been proposed. Consistent with this sourceof strength policy for subsidiary banks, the Federal Reserve has stated that, as a matter of prudent banking, a BHC generally shouldnot maintain a rate of cash dividends unless its net income available to common shareholders has been sufficient to fully fund thedividends and the prospective rate of earnings retention appears to be consistent with the corporation’s capital needs, asset quality andoverall financial condition. Further, in providing guidance to the large BHCs participating in the CCAR exercise, discussed above, theFederal Reserve has expected capital plans to reflect conservative dividend payout ratios.
Enhanced Prudential Requirements. Under Federal Reserve rules, PNC and other BHCs with total consolidated assets of $100 billionor more are subject to various enhanced prudential standards related to liquidity risk management and overall risk management. ForPNC, these rules, among other things, establish liquidity stress testing requirements (discussed above), limitations on PNC’s aggregatenet credit exposures to any single, unaffiliated company (referred to as the SCCL), and certain oversight and governanceresponsibilities for PNC’s Chief Risk Officer, the Board of Directors, and the Risk Committee of the Board of Directors. Under theFederal Reserve’s SCCL rules, PNC’s aggregate net credit exposure (including exposure resulting from, among other transactions,extensions of credit, repurchase and reverse repurchase transactions, investments in securities and derivative transactions) to anyunaffiliated counterparty may not exceed 25% of PNC’s Tier 1 capital.
The Federal Reserve is required to impose a maximum 15-to-1 debt to equity ratio on a BHC if the federal agencies that comprise theFSOC determine that the company poses a grave threat to the financial stability of the U.S. and that the imposition of such a debt-to-equity requirement would mitigate such risk. The Federal Reserve also is required to establish early remediation requirements forBHCs with more than $250 billion in total assets and continues to work towards finalizing these requirements.
The Federal Reserve may continue to develop the set of enhanced prudential standards that apply to large BHCs in order to furtherpromote the resiliency of such firms and the U.S. financial system. For additional information, see Item 1A Risk Factors of thisReport.
Additional Powers Under the GLB Act. The GLB Act permits a qualifying BHC, such as PNC, to become a “financial holdingcompany” and thereby engage in, or affiliate with companies engaging in, a broader range of financial activities than would otherwisebe permitted for a BHC. Permitted affiliates include securities underwriters and dealers, insurance companies, insurance agents andcompanies engaged in other activities that are determined by the Federal Reserve, in consultation with the Secretary of the Treasury, tobe “financial in nature or incidental thereto” or are determined by the Federal Reserve unilaterally to be “complementary” to financialactivities. We became a financial holding company in 2000. A BHC qualifies to become a financial holding company if the BHC andits subsidiary depository institutions are “well capitalized” and “well managed” and its subsidiary depository institutions have a ratingunder the CRA of Satisfactory or better. Among other activities, we currently rely on our status as a financial holding company toconduct merchant banking activities and securities underwriting and dealing activities. As subsidiaries of a financial holding companyunder the GLB Act, our non-bank subsidiaries are generally allowed to conduct new financial activities, and we generally arepermitted to acquire non-bank financial companies that have less than $10 billion in assets, with after-the-fact notice to the FederalReserve.
In addition, the GLB Act permits qualifying national banks to engage in expanded activities through a “financial subsidiary.” PNCBank has filed a financial subsidiary certification with the OCC and currently engages in insurance agency activities through financialsubsidiaries. PNC Bank may also generally engage through a financial subsidiary in any activity that is determined to be financial innature or incidental to a financial activity by the Secretary of the Treasury, in consultation with the Federal Reserve (other thaninsurance underwriting activities, insurance company investment activities and merchant banking). In order to establish a financialsubsidiary, a national bank and each of its depository institution affiliates must be “well capitalized” and “well managed” and thenational bank and each of its depository institution affiliates must have a CRA rating of Satisfactory or better.
If a financial holding company or a national bank with a financial subsidiary fails to continue to meet the applicable “well capitalized”or “well managed” criteria, the financial holding company or national bank must enter into an agreement with the Federal Reserve orthe OCC, respectively, that, among other things, identifies how the capital or management deficiencies will be corrected. Until suchdeficiencies are corrected, the relevant agency may impose limits or conditions on the activities of the company or bank, and thecompany or bank may not engage in, or acquire a company engaged in, the types of expanded activities only permissible for afinancial holding company or financial subsidiary without prior approval of the relevant agency.
The PNC Financial Services Group, Inc. – 2020 Form 10-K 9
In addition, a financial holding company generally may not engage in a new financial activity authorized by the GLB Act, or acquire acompany engaged in such a new activity, if any of its insured depository institutions receives a CRA rating of less than Satisfactory. Anational bank’s financial subsidiary generally may not engage in a new financial activity authorized by the GLB Act, or acquire acompany engaged in such a new financial activity, if the national bank or any of its insured depository institution affiliates received aCRA rating of less than Satisfactory. At December 31, 2020, PNC Bank had an Outstanding rating with respect to CRA.
In 2020, the OCC finalized rules to modernize its regulations implementing the CRA. The rules significantly alter what activities by abank qualify for CRA credit, where such activities must be conducted to receive credit, how the agencies measure a bank’s CRAperformance, and how a bank must document and report its CRA qualifying activities. The new rules would go into effect for PNCBank on January 1, 2023.
Volcker Rule. The Volcker Rule and its implementing regulations prohibit banking entities from engaging in short-term trading asprincipal and having certain ownership interests in and relationships with hedge funds, private equity funds, and certain other privatefunds (together, “covered funds”), unless an exemption or exception applies. For example, the exemptions under the Volcker Ruleallow banking entities to trade as principal for securities underwriting, market making and risk-mitigating hedging purposes, subject toa variety of conditions. As a result of rule changes adopted in 2019, PNC and PNC Bank are subject to simplified and tailoredcompliance program requirements because each entity has trading assets and liabilities of less than $20 billion.
To date, the prohibitions under the final Volcker Rule regulations have not had a material effect on our businesses or revenue;however it is possible that the regulations may be modified in the future. Moreover, the conditions for engaging in exempted tradingactivities and having permissible relationships with a private fund under the regulations could, depending on the agencies’ approach tointerpreting them, cause us to forego engaging in hedging or other transactions that we would otherwise undertake in the ordinarycourse of business and, thus, to some extent, may limit our ability to most effectively hedge our risks, manage our balance sheet orprovide products or services to our customers. We also have divested prohibited investments in covered funds and received extensionsallowing an extended conformance period for our remaining $0.1 billion interests in illiquid covered funds.
Other Federal Reserve and OCC Regulation and Supervision. The federal banking agencies possess broad powers to take correctiveaction as deemed appropriate based on the actions, operations or risk management programs of a BHC, an insured depositoryinstitution or their subsidiaries, and the Federal Reserve and the OCC have the ability to take enforcement action against PNC andPNC Bank, respectively, to prevent and remedy acts and practices that the agencies determine to be unfair or deceptive. A finding thatwe have engaged in a deceptive act or practice may have collateral consequences on our ability to rely on certain exemptions, or takeadvantage of certain provisions of, the securities laws absent a government waiver of such restrictions.
Moreover, less than satisfactory examination ratings, lower capital ratios than peer group institutions, or regulatory concerns regardingmanagement, controls, assets, operations or other factors can all potentially result in practical limitations on the ability of a bank orBHC to engage in new activities, grow, acquire new businesses, repurchase its stock or pay dividends, or continue to conduct existingactivities. Furthermore, the OCC has established certain heightened risk management and governance standards for large banks,including PNC Bank. The guidelines, among other things, establish minimum standards for the design and implementation of a riskgovernance framework, describe the appropriate risk management roles and responsibilities of front line units, independent riskmanagement, internal audit, and the board of directors, and provide that a covered bank should have a comprehensive writtenstatement that articulates its risk appetite and serves as a basis for the framework. If the OCC determines that a covered national bankis not in compliance with these or other enforceable guidelines (including guidelines relating to information security standards), theOCC may require the bank to submit a corrective action plan and may initiate enforcement action against the bank if an acceptableplan is not submitted or the bank fails to comply with an approved plan.
Sections 23A and 23B of the Federal Reserve Act and the Federal Reserve’s implementing regulation, Regulation W, placequantitative and qualitative restrictions on covered transactions between a bank and its affiliates (for example between PNC Bank, onthe one hand, and The PNC Financial Services Group, Inc. and its nonbank subsidiaries, on the other hand). In general, Section 23Aand Regulation W limit the total amount of covered transactions between a bank and any single affiliate to 10% of the bank’s capitalstock and surplus, limit the total amount of covered transactions between a bank and all its affiliates to 20% of the bank’s capital stockand surplus, prohibit a bank from purchasing low-quality assets from an affiliate, and require certain covered transactions to besecured with prescribed amounts of collateral. Section 23B generally requires that transactions between a bank and its affiliates be onterms that are at least as favorable to the bank as the terms that would apply in comparable transactions between the bank and a thirdparty. Dodd-Frank amended Section 23A of the Federal Reserve Act to include as a covered transaction the credit exposure of a bankto an affiliate arising from a derivative transaction with the affiliate. The Federal Reserve has yet to propose rules to implement theserevisions.
10 The PNC Financial Services Group, Inc. – 2020 Form 10-K
The Federal Reserve Act and Federal Reserve regulations also place quantitative limitations and conditions on extensions of credit bya bank to its executive officers, directors, or principal shareholders and their related interests (including any company controlled bysuch persons). Generally, extensions of credit by a bank to such individuals, companies, and related interests must comply with certainindividual and aggregate lending limits, as well as procedural and qualitative requirements. As a result of the amount of PNC commonstock held by its advised mutual funds and other accounts, the Vanguard Group is considered a principal shareholder of PNC Bank forpurposes of these regulations. The federal banking agencies have issued an interagency statement addressing the application of theseinsider lending restrictions to the other portfolio companies owned or controlled by the advised funds and accounts of a fund complexthat could be considered a principal shareholder of a bank, which is effective through January 1, 2022.
The Federal Reserve and the OCC have provided guidance regarding incentive and other elements of compensation provided toexecutives and other employees at banking organizations they regulate, both as general industry-wide guidance and guidance specificto select larger companies, including PNC. These guidelines are intended to ensure that the incentive compensation practices ofcovered banking organizations do not encourage excessive risk-taking. Dodd-Frank requires the Federal Reserve, the OCC, the FDIC,the SEC and two other regulatory agencies to adopt regulations governing incentive compensation provided by regulated financialservices companies to their executives and other employees. These agencies jointly proposed regulations in 2011 and again in 2016 toimplement these requirements. Final regulations have not been adopted.
The trust, investment advisory and other fiduciary activities conducted by PNC Bank also are subject to the OCC’s regulationsgoverning the fiduciary activities of national banks, as well as applicable state fiduciary laws. The OCC’s regulations, among otherthings, set standards for the administration of fiduciary accounts, prohibit or govern potential conflicts of interests, and establishrecordkeeping requirements for fiduciary accounts.
The Federal Reserve’s prior approval is required whenever we propose to acquire all or substantially all of the assets of any bank, toacquire direct or indirect ownership or control of more than 5% of any class of voting securities of any bank or BHC, or to merge orconsolidate with any other BHC. The BHC Act and other federal law enumerates the factors the Federal Reserve must consider whenreviewing the merger of BHCs, the acquisition of banks or the acquisition of voting securities of a bank or BHC. These factors includethe competitive effects of the proposal in the relevant geographic markets; the financial and managerial resources and future prospectsof the companies and banks involved in the transaction; the effect of the transaction on the financial stability of the U.S.; theorganizations’ compliance with anti-money laundering laws and regulations; the convenience and needs of the communities to beserved; and the records of performance under the CRA of the insured depository institutions involved in the transaction.
The Federal Reserve’s prior approval also is required, and similar factors are considered, for a BHC to acquire direct or indirectownership or control of more than 5% of any class of voting securities of a savings association or savings and loan holding company,or to merge or consolidate with a savings and loan holding company. In cases involving interstate bank acquisitions, the FederalReserve also must consider the concentration of deposits nationwide and in certain individual states. A BHC is generally prohibitedfrom merging or consolidating with, or acquiring, another company or bank if upon consummation the resulting company wouldcontrol 10% or more of deposits in the U.S. or a state, or if the resulting company’s liabilities would exceed 10% of the aggregateliabilities of the U.S. financial sector (including the U.S. liabilities of foreign financial companies). In extraordinary cases, the FSOC,in conjunction with the Federal Reserve, could order the break-up of financial firms that are deemed to present a grave threat to thefinancial stability of the U.S.
OCC prior approval is required for PNC Bank to acquire another insured bank or savings association by merger or to acquire depositsor substantially all of the assets of such institutions. In deciding whether to approve such a transaction, the OCC is required to considerfactors similar to those that must be considered by the Federal Reserve in connection with the acquisition of a bank or BHC. Approvalof the OCC and the FDIC is required to merge a nonbank entity into PNC Bank. PNC and PNC Bank have requested the priorapproval of the Federal Reserve and the OCC, respectively, to acquire BBVA and BBVA USA, and to merge BBVA with and intoPNC and BBVA USA with and into PNC Bank.
In 2020, the Federal Reserve finalized rules governing when a BHC is presumed to “control” another company for purposes of theBHC Act, thereby causing the company to be considered a subsidiary for purposes of the BHC Act. The rules establish a set ofpresumptions identifying when a BHC would be deemed to control another company, with the nature and scope of relationships aBHC may have with a non-controlled company (e.g., director or officer representatives, scope of business relationships, etc.) decliningas the BHC’s voting ownership percentage in the company increases.
FDIC Insurance and Related Matters. PNC Bank is insured by the FDIC and subject to deposit premium assessments. Regulatorymatters could increase the cost of FDIC deposit insurance premiums to an insured bank as FDIC deposit insurance premiums are “riskbased.” Therefore, higher fee percentages would be charged to banks that have lower capital ratios or higher risk profiles. These riskprofiles take into account, among other things, weaknesses that are found by the primary federal banking regulator through its
The PNC Financial Services Group, Inc. – 2020 Form 10-K 11
examination and supervision of the bank and the bank’s holdings of assets or liabilities classified as higher risk by the FDIC, includingbrokered deposits. A negative evaluation by the FDIC or a bank’s primary federal banking regulator could increase the costs to a bankand result in an aggregate cost of deposit funds higher than that of competing banks in a lower risk category.
PNC Bank is subject to certain enhanced deposit insurance recordkeeping requirements adopted by the FDIC, which are designed toassist the FDIC to promptly determine whether, or to what extent, a large bank’s deposits are covered by deposit insurance if the bankwere to fail. These requirements became effective on April 1, 2020. Banks may request an extension of this compliance date in certaincircumstances for up to one year.
Federal banking laws and regulations also apply a variety of requirements or restrictions on insured depository institutions with respectto brokered deposits. For instance, only a “well capitalized” insured depository institution may accept brokered deposits without priorregulatory approval. In addition, brokered deposits are generally subject to higher outflow assumptions than other types of deposits forpurposes of the LCR. In December 2020, the FDIC finalized rules that establish a new framework for determining whether depositsare considered “brokered.”
Resolution and Recovery Planning. BHCs that have $100 billion or more in assets, such as PNC, are required to periodically submit tothe Federal Reserve and the FDIC a resolution plan (including a public summary) that includes, among other things, an analysis ofhow the company could be resolved in a rapid and orderly fashion if the company were to fail or experience material financial distress.The Federal Reserve and the FDIC may jointly impose restrictions on a covered BHC, including additional capital requirements orlimitations on growth, if the agencies jointly determine that the company’s plan is not credible or would not facilitate a rapid andorderly resolution of the company under the U.S. Bankruptcy Code (or other applicable resolution framework), and additionally couldrequire the company to divest assets or take other actions if the company did not submit an acceptable resolution plan within two yearsafter any such restrictions were imposed. PNC generally must file a resolution plan with the Federal Reserve and FDIC at least onceeach three-year period, with submissions alternating between a full plan and a plan targeted on certain areas or subjects identified bythe agencies.
PNC’s next resolution plan is scheduled to be a targeted plan and is due to be filed by December 17, 2021. The agencies, however,have reserved the ability to alter the scheduled filing date for a covered company, request an interim update before a coveredcompany’s next scheduled filing date and require a covered company to submit a full resolution plan in lieu of a scheduled targetedplan.
The FDIC also requires large insured depository institutions, including PNC Bank, to periodically submit a resolution plan (includinga public summary) to the FDIC that includes, among other things, an analysis of how the institution could be resolved under the FDIAct in a manner that protects depositors and limits losses or costs to creditors of the bank in accordance with the FDI Act. In January2021, the FDIC lifted the moratorium that it had instituted on resolution plan filings by insured depository institutions, but it is unclearat this time when PNC Bank’s next resolution plan will be due. Depending on how the agencies conduct their review of the resolutionplans submitted by PNC and PNC Bank, these requirements could affect the ways in which PNC structures and conducts its businessand result in higher compliance and operating costs.
PNC Bank also is subject to OCC guidelines that establish standards for recovery planning. These guidelines require a covered bank todevelop and maintain a recovery plan that is evaluated and updated annually that, among other things, identifies a range of options thatcould be undertaken by the covered bank to restore its financial strength and viability should identified triggering events occur. Therecovery plan guidelines are enforceable in the same manner as the other guidelines the OCC has established.
CFPB Regulation and Supervision. The CFPB examines PNC and PNC Bank for compliance with a broad range of federal consumerfinancial laws and regulations, including the laws and regulations that relate to deposit products, credit card, mortgage, automobile,student and other consumer loans, and other consumer financial products and services that we offer. The consumer financial protectionlaws that are subject to the CFPB’s supervision and enforcement powers include, among others, the Truth in Lending Act, Truth inSavings Act, Home Mortgage Disclosure Act, Fair Credit Reporting Act, Electronic Funds Transfer Act, Real Estate SettlementProcedures Act, Fair Debt Collections Practices Act, Equal Credit Opportunity Act and Fair Housing Act. The CFPB also hasauthority to take enforcement actions to prevent and remedy acts and practices relating to consumer financial products and servicesthat it deems to be unfair, deceptive or abusive, and to impose new disclosure requirements for any consumer financial product orservice.
The CFPB may issue regulations that impact products and services offered by PNC or PNC Bank. The regulations could reduce thefees that we receive, require that we provide additional consumer disclosures, alter the way we provide our products and services,impair our ability to compete with other providers of financial products or services, or expose us to greater risk of private litigation orregulatory enforcement action. The CFPB has engaged in rulemakings that affect, among other things, consumer remittance transfers,the qualified mortgage definition under the Truth in Lending Act, the Home Mortgage Disclosure Act, the Fair Debt Collection
12 The PNC Financial Services Group, Inc. – 2020 Form 10-K
Practices Act, and payday, vehicle title, and certain high-cost installment loans and may establish, or modify, rules governing otheraspects of consumer financial products or services in the future.
Securities and Derivatives RegulationOur registered broker-dealer and investment adviser subsidiaries are subject to the Exchange Act, and the Investment Advisers Act of1940, respectively, and related rules and regulations promulgated by the SEC. These rules, for example, require that broker-dealersand investment advisers act in a customer’s best interest when making investment recommendations to retail customers, whichincludes managing conflicts of interest, providing required disclosures and exercising a duty of care in making investmentrecommendations. FINRA is the primary self-regulatory organization for our registered broker-dealer subsidiaries. Our broker-dealerand investment adviser subsidiaries also are subject to additional regulation by states or local jurisdictions.
The SEC and FINRA have active enforcement functions that oversee broker-dealers and investment advisers and can bring actions thatresult in fines, restitution, a limitation on permitted activities, disqualification to continue to conduct certain activities and an inabilityto rely on certain favorable exemptions. Certain types of infractions and violations also can affect our ability to expeditiously issuenew securities into the capital markets. In addition, certain changes in the activities of a broker-dealer require approval from FINRA,and FINRA takes into account a variety of considerations in acting upon applications for such approval, including internal controls,capital levels, management experience and quality, prior enforcement and disciplinary history and supervisory concerns.
PNC Bank is provisionally registered as swap dealer with the CFTC. Because of the limited volume of our security-based swapdealing activities, PNC Bank has not registered (and currently does not intend to register) with the SEC as a security-based swapdealer.
PNC Bank’s derivatives and foreign exchange businesses are subject to the regulations and requirements imposed on CFTC-registeredswap dealers, and the CFTC (and for certain delegated responsibilities, the National Futures Association) has a meaningfulsupervisory role with respect to PNC Bank’s derivatives and foreign exchange businesses. The CFTC’s comprehensive and significantregulations are intended to (i) address systemic risk issues, (ii) bring greater transparency to the derivatives and foreign exchangemarkets, (iii) provide enhanced disclosures and protections to customers and (iv) promote market integrity. Among other things, theseregulations (i) require that, absent certain specified exemptions, most standardized swaps be centrally cleared through a regulatedclearing house and be traded on a centralized exchange or swap execution facility; (ii) subject PNC Bank to capital requirements inexcess of historical practice; (iii) subject PNC Bank to comprehensive recordkeeping, regulatory reporting and real-time publicreporting requirements; (iv) subject PNC Bank to various business conduct requirements, including the provision of daily marks tocounterparties and disclosing to counterparties (pre-execution) the material risks, material incentives, and any conflicts of interestassociated with their swap; (v) impose special duties on PNC Bank when transacting a swap with a “special entity” (e.g.,governmental agency (federal, state or local) or political subdivision thereof, pension plan or endowment); and (vi) impose marginrequirements on certain swaps that are not centrally cleared through a regulated clearing house.
The regulations and requirements applicable to PNC Bank, as a provisionally registered CFTC swap dealer, have and will continue toimpose compliance burdens on PNC Bank and introduce additional legal risks (including as a result of applicable anti-fraud and anti-manipulation provisions and private rights of action). In addition, failure to comply with the “pay-to-play” regulations that govern ourswap and municipal securities businesses could result in limitations on PNC Bank’s ability to conduct swap and municipal securitiesbusiness with state or local governments and their authorities.
Regulations of Other AgenciesIn addition to regulations issued by the federal banking, securities and derivatives regulators, we also are subject to regulations issuedby other federal agencies with respect to certain financial products and services we offer. For example, certain of our fiduciary,brokerage and investment management activities are subject to regulations issued by the Department of Labor under ERISA andrelated provisions of the Internal Revenue Code and certain of our student lending and servicing activities are subject to regulation bythe Department of Education.
Competition
We are subject to intense competition from other regulated banking organizations, as well as various other types of financialinstitutions and non-bank entities that can offer a number of similar products and services without being subject to bank regulatorysupervision and restrictions.
PNC Bank competes for deposits and/or loans with:• Other commercial banks,• Savings banks,• Credit unions,• Consumer finance companies,
The PNC Financial Services Group, Inc. – 2020 Form 10-K 13
• Leasing companies,• Other non-bank lenders,• Financial technology companies,• Treasury management service companies,• Insurance companies, and• Issuers of commercial paper and other securities, including mutual funds.
In providing asset management services, our businesses compete with:• Investment management firms,• Large banks and other financial institutions,• Brokerage firms,• Financial technology companies,• Mutual fund complexes, and• Insurance companies.
Our various non-bank businesses engaged in investment banking and alternative investment activities compete with:• Commercial banks,• Investment banking firms,• Collateralized loan obligation managers,• Hedge funds,• Mutual fund complexes,• Merchant banks,• Insurance companies,• Private equity firms, and• Other investment vehicles.
Competition is based on a number of factors including pricing, product structure, the range of products and services offered and thequality of customer service. Loan pricing, structure and credit standards are extremely important as we seek to achieve appropriaterisk-adjusted returns. Deposit-taking activities are also subject to pricing pressures and to customer migration as a result of intensecompetition for deposits and investments. Competitors may seek to compete with us through traditional channels such as physicallocations or through digital channels such as the internet or mobile applications. We include here by reference the additionalinformation regarding competition and factors affecting our competitive position included in Item 1A Risk Factors of this Report.
Human Capital
Employees totaled 51,257 at December 31, 2020. This total included 49,549 full-time and 1,708 part-time employees, of which 27,621full-time and 1,611 part-time employees were employed in our Retail Banking business.
Part of PNC’s ability to compete effectively depends on our ability to attract new employees and retain and develop our existingemployees. In support of our employees, our strategic human capital goals include:
• Advancing PNC’s talent-focused culture by developing strong leaders who exemplify our Leadership Standards, a set ofstandards designed to hold managers accountable for intentional inclusion, living our Corporate Values, enabling change,achieving results and developing the best talent and providing them with the tools and insights to effectively manage ourpeople.
• Focusing on the development and retention of diverse, high performing talent and providing employees with opportunities forprofessional growth, career mobility and health and financial wellness.
• Supporting a strong, ethical culture anchored in our Corporate Values and doing the right thing for our employees, customersand shareholders.
• Continuing to focus on improving workforce diversity and creating an equitable and inclusive work place.
In managing our employees, we focus on these key factors:• Recruiting, developing and retaining talent. We believe recruiting, developing and retaining talent starts with our leaders and
we measure our managers against our Leadership Standards. Our talent acquisition priority is to invest in the development ofour internal talent and to provide career advancement opportunities to our employees. We measure how many openrequisitions we fill with internal candidates, participation in early career development programs and turnover. At our first-level and above career bands we fill approximately 62% of our open requisitions with internal candidates, which has a directimpact on our ability to retain and develop our people. In addition, we hire approximately 500 interns and 500 full-timedevelopment program associates each year from our 11 early career development programs that support each of our lines ofbusiness and support areas.
14 The PNC Financial Services Group, Inc. – 2020 Form 10-K
• Diversity, equity and inclusion. We focus on attracting, developing and retaining a diverse workforce that reflects and isequipped to meet the needs of our diverse customer base. We measure representation of LGBTQ+, people with disabilities,veterans, women and across all races and certain ethnicities as self-disclosed by our employees. As of December 31, 2020,approximately 59% of PNC’s workforce and 50% of PNC’s employees in managerial roles were women. People of colorrepresented approximately 29% of PNC’s workforce, including 22% of our employees in managerial roles, as of December31, 2020.
• Total rewards. We design our compensation and benefits programs to focus on three key aspects of employee well-being:health, money and quality of life. These programs include competitive base salaries and, depending on eligibility, cashincentive or stock-based award opportunities, an Employee Stock Purchase Plan, a 401(k) Plan with employer match, apension plan, healthcare, life insurance and disability benefits, health savings and dependent care flexible spending accounts,paid time off, paid maternity and parental leave, family care resources, flexible work schedules, a robust wellness programwith incentives, adoption assistance, employee assistance programs, educational assistance and on-site health care and childcare services, among others. Additionally, we conduct pay equity analyses to determine if employees are being compensatedfairly and consistently across roles.
• Employee engagement. Twice a year, PNC conducts employee surveys to measure employee engagement because we believethat engaged employees have lower attrition rates and improved customer outcomes.
PNC continues to recognize the impacts that the COVID-19 pandemic has had and will likely continue to have on our Human Capital.For more information on COVID-19 related impacts to our Human Capital, see the "Coronavirus (COVID-19) Pandemic" section ofthis Item 1.
SEC Reports and Corporate Governance Information
We are subject to the informational requirements of the Exchange Act and, in accordance with the Exchange Act, we file annual,quarterly and current reports, proxy statements, and other information with the SEC. Our SEC File Number is 001-09718.
The SEC maintains a website at www.sec.gov that contains reports, including exhibits, proxy and information statements, and otherinformation about issuers, like us, who file electronically with the SEC. You can also inspect reports, proxy statements and otherinformation about us at the offices of the New York Stock Exchange, 20 Broad Street, New York, New York 10005.
We make our Annual Report on Form 10-K, Quarterly Reports on Form 10-Q, Current Reports on Form 8-K, and amendments tothose reports filed with or furnished to the SEC pursuant to Section 13(a) or 15(d) of the Exchange Act available free of charge on ourinternet website as soon as reasonably practicable after we electronically file such material with, or furnish it to, the SEC. Ourcorporate internet address is www.pnc.com and you can find this information at www.pnc.com/secfilings. Shareholders andbondholders may obtain copies of these filings without charge by contacting Shareholder Services at 800-982-7652 or via the onlinecontact form at www.computershare.com/contactus for copies without exhibits, or via e-mail to [email protected] for copiesof exhibits, including financial statement and schedule exhibits where applicable. The interactive data file (XBRL) exhibit is onlyavailable electronically.
Information about our Board of Directors and its committees and corporate governance, including our PNC Code of Business Conductand Ethics (as amended from time to time), is available on our corporate website at www.pnc.com/corporategovernance. In addition,any future waivers from a provision of the PNC Code of Business Conduct and Ethics covering any of our directors or executiveofficers (including our principal executive officer, principal financial officer, and principal accounting officer or controller) will beposted at this internet address.
Shareholders who would like to request printed copies of the PNC Code of Business Conduct and Ethics or our Corporate GovernanceGuidelines or the charters of our Board’s Audit, Nominating and Governance, Personnel and Compensation, or Risk Committees (allof which are posted on our corporate website at www.pnc.com/corporategovernance) may do so by sending their requests to ourCorporate Secretary at corporate headquarters at The Tower at PNC Plaza, 300 Fifth Avenue, Pittsburgh, Pennsylvania 15222-2401.Copies will be provided without charge.
Internet Information
The PNC Financial Services Group, Inc.’s financial reports and information about its products and services are available on theinternet at www.pnc.com. We provide information for investors on our corporate website under “About Us – Investor Relations.” Weuse our Twitter account, @pncnews, as an additional way of disseminating to the public information that may be relevant to investors.
We generally post the following under “About Us – Investor Relations” shortly before or promptly following its first use or release:financially-related press releases, including earnings releases and supplemental financial information, various SEC filings, includingannual, quarterly and current reports and proxy statements, presentation materials associated with earnings and other investorconference calls or events, and access to live and recorded audio from earnings and other investor conference calls or events. In some
The PNC Financial Services Group, Inc. – 2020 Form 10-K 15
cases, we may post the presentation materials for other investor conference calls or events several days prior to the call or event. Forearnings and other conference calls or events, we generally include in our posted materials a cautionary statement regarding forward-looking and non-GAAP financial information, and we provide GAAP reconciliations when we include non-GAAP financialinformation. Such GAAP reconciliations may be in materials for the applicable presentation, in materials for prior presentations or inour annual, quarterly or current reports.
When warranted, we will also use our website to expedite public access to time-critical information regarding PNC instead of using apress release or a filing with the SEC for first disclosure of the information. In some circumstances, the information may be relevant toinvestors but directed at customers, in which case it may be accessed directly through the home page rather than “About Us - InvestorRelations.”
We are required to provide additional public disclosure regarding estimated income, losses and pro forma regulatory capital ratiosunder supervisory and PNC-developed hypothetical severely adverse economic scenarios, as well as information concerning ourcapital stress testing processes, pursuant to the stress testing regulations adopted by the Federal Reserve and the OCC. We are alsorequired to make certain additional regulatory capital-related public disclosures about our capital structure, risk exposures, riskassessment processes, risk-weighted assets and overall capital adequacy, including market risk-related disclosures, under theregulatory capital rules adopted by the Federal banking agencies. Similarly, the Federal Reserve’s rules require quantitative andqualitative disclosures about our LCR and, beginning in 2023, our NSFR. Under these regulations, we may satisfy these requirementsthrough postings on our website, and we have done so and expect to continue to do so without also providing disclosure of thisinformation through filings with the SEC.
Other information posted on our corporate website that may not be available in our filings with the SEC includes information relatingto our corporate governance and annual communications from our chairman to shareholders.
Where we have included internet addresses in this Report, such as our internet address and the internet address of the SEC, we haveincluded those internet addresses as inactive textual references only. Except as specifically incorporated by reference into this Report,information on those websites is not part hereof.
ITEM 1A – RISK FACTORSWe are subject to a number of risks potentially impacting our business, financial condition, results of operations and cash flows. As afinancial services company, certain elements of risk are inherent in what we do and the business decisions we make. Thus, weencounter risk as part of the normal course of our business, and we design risk management processes to help manage these risks.
Our success is dependent on our ability to identify, understand and manage the risks presented by our business activities so that we canappropriately balance revenue generation and profitability. We discuss our principal risk management oversight and processes and, inappropriate places, related historical performance and other metrics in the Risk Management section included in Item 7 of this Report.
The following are the material risk factors that affect us of which we are currently aware. Any one or more of these risk factors couldhave a material adverse impact on our business, financial condition, results of operations or cash flows. In addition, these risks presentother possible adverse consequences, including those described below. These risk factors and other risks we face are also discussedfurther in other sections of this Report. Thus, the risk factors below should not be considered a complete list of potential risks that wemay face.
Summary
The following is a summary of the Risk Factors disclosure in this Item 1A:• The COVID-19 pandemic has had and is likely to continue to have an adverse effect, possibly materially, on our overall
business and financial performance.• Our business and financial performance are vulnerable to the impact of adverse economic conditions.• The policies of the Federal Reserve and other governmental agencies and the impact of government legislation, regulation
and policy and other political factors on the economy, interest rates, overall financial market performance and bankingorganizations could have an adverse effect on our business and financial performance and our ability to pay dividends orotherwise return capital to shareholders.
• The likely discontinuance of the submission of rates for the calculation of LIBOR presents risks to the financial instrumentsoriginated, held or serviced by PNC that use LIBOR as a reference rate.
• Societal responses to climate change could adversely affect our business and performance, including indirectly throughimpacts on our customers.
• We are subject to risks related to the use of technology which is critical to our ability to maintain or enhance thecompetitiveness of our businesses and is dependent on having the right to use the underlying intellectual property. We could
16 The PNC Financial Services Group, Inc. – 2020 Form 10-K
also suffer a material adverse impact from interruptions in the effective operation of our information systems and othertechnology, including as a result of third party breaches of data security either at PNC or at third parties handling PNCinformation.
• Our business and financial results are subject to risks associated with the creditworthiness of our customers andcounterparties, by market interest rates and movements in those rates and changes in the values of financial assets.
• We are subject to risks related to inaccurate estimates and assumptions, such as those used in our asset and liability valuationsand the determination of the amount of loss allowances and impairments, and to risks related to poorly designed andimplemented models that are extensively used in our business.
• We operate in a highly competitive environment and our success depends on our ability to attract and retain customers andtalented employees and we are at risk for an adverse impact on our business due to damage to our reputation.
• We are subject to operational risks as a result of our dependence on the effectiveness and integrity of our employees and onthird party vendors, service providers and other counterparties over whom we do not have direct control.
• We are subject to risks related to growing our business in part by acquiring other financial services business from time totime as these acquisitions, including the pending acquisition of BBVA, present a number of risks and uncertainties relatedboth to the acquisition transactions themselves and to the integration of the acquired businesses into PNC after closing.
Risks Related to the COVID-19 Pandemic
The COVID-19 pandemic has had and is likely to continue to have an adverse effect, possibly materially, on our overall businessand financial performance.
Starting in early 2020 and continuing into 2021, federal, state and local governments have responded to the COVID-19 pandemic byenacting a variety of measures to manage the related public health effects, including restricting travel, limiting the conduct ofbusinesses and controlling individual interactions such as through required social distancing measures. Collectively, these measures,together with voluntary changes in behavior, led to a substantial decrease in economic activity and a dramatic increase inunemployment in the second quarter of 2020. Governmental bodies also enacted laws designed to stabilize the economy and providerelief to businesses and individuals to mitigate the consequences of COVID-19 and the policies restricting the operation of businessesand the movement of individuals.
While economic conditions have improved, economic activity remains below its pre-pandemic level, with the partial recoveryinconsistent across different geographic regions, sectors, companies and individuals and subject to setbacks as conditions related to thepandemic fluctuate. If efforts to contain COVID-19 are unsuccessful and restrictions on businesses and activities continue in place forextended periods or are increased, the recovery would likely be much weaker and the economy could fall back into recession. Whileseveral vaccines have been approved for use and others remain in development or clinical trials, significant uncertainty remainsregarding the speed with which effective vaccines can be manufactured and widely distributed and the willingness of individuals to getvaccinated. As a result, there is still a great deal of uncertainty about the length and severity of the pandemic and the strength orreversal of the economic rebound, including whether there will be additional fiscal stimulus from the federal government and, if so, itssize, scope and effectiveness. Accordingly, the outbreak and its consequences, including responsive measures to manage it, had andare likely to continue to have an adverse effect, possibly materially, on our overall business and financial performance. The longer thepublic health crisis lasts and the greater its severity, the greater the likely adverse impact on the economy, our customers and ourbusiness and financial performance. The following are examples of the most likely impacts on PNC:
• The deterioration of national and global economic conditions and elevated levels of unemployment have negatively affectedand are likely to continue to negatively affect, possibly materially, our financial performance and operations. The followingare the key factors contributing to this risk:
◦ There is a greater likelihood that more of our commercial and consumer customers or counterparties will becomedelinquent on their loans or other obligations to us, which, in turn, will result in a higher level of non-performingloans and net charge-offs, particularly in the sectors most adversely impacted by the pandemic. Even if a loanreturns to full performing status, it may be on modified terms that result in, for example, a term extension, interestrate reduction or principal deferral or forgiveness. Increases in loan delinquencies or modifications will also result inincreased administrative costs. In addition, given the uncertainty about the length and severity of the pandemic andthe strength or reversal of the economic rebound, our provision for credit losses may be more volatile period-to-period with a corresponding increase in period-to-period volatility in our net income.
◦ There has been and there is likely to continue to be a decrease in the demand for certain of our products and serviceswhich could be further exacerbated if customers lose confidence due to concerns regarding the economy. We havealso waived certain fees associated with our products and services for customers affected by the pandemic and maycontinue to do so. In addition, while customer deposits have grown aiding our liquidity, future changes in behaviorresulting in declining deposit balances would likely increase our funding costs and reduce our net interest incomeand liquidity resources.
◦ These rapidly changing and unprecedented market conditions have impacted and may continue to impact thevaluation of assets as reported within our consolidated financial statements, as well as causing substantial reductions
The PNC Financial Services Group, Inc. – 2020 Form 10-K 17
in the value of our assets under management, all with the possible effects described in the Risk Factor headed “Ourbusiness and financial performance are vulnerable to the impact of changes in the values of financial assets.”
◦ Although PNC’s capital levels continue to be strong, the degradation in economic conditions also has and is likely tocontinue to negatively affect our capital position, possibly materially, which is critical to our ability to operate andgrow our business. In addition, continued or accelerated disruption and volatility in the financial markets or long-lasting or deeper recessionary conditions may diminish our access to the capital markets or result in or contribute todowngrades of our credit ratings. We have suspended our discretionary common share repurchase program and maytake further actions that would limit a return of capital to shareholders, including potentially a reduction orsuspension of the dividend payable to common shareholders, as a result of these conditions and their effect on ourfinancial performance and position or as a result of regulatory guidance.
• Some of the legislation responsive to the outbreak, including the CARES Act and the Consolidated Appropriations Act,provides for certain commercial and consumer protections which have altered and may continue to alter the profitability ofthe transactions in which we engage, such as by allowing borrowers to delay payments on loans or other obligations andimposing other costs on us. These laws have also delayed and restricted and may continue to delay or restrict our ability torealize the value of collateral by, for example, providing temporary foreclosure protection and eviction protection even whencustomers are in breach of their obligations to us. These laws may be extended or increased in scope, and other laws may beenacted in response to the pandemic that have similar or broader effects on us. We may also be limited in our ability to realizethe value of collateral as a result of court closures and related delays. Moreover, collateral may be liquidated at pricesinsufficient to recover the full amount of exposure to us as a result of deteriorating economic conditions and volatile markets.See Supervision and Regulation in Item 1 of this Report for more information on PNC’s implementation of these programs.
• Other laws related to employee benefits and the treatment of employees have negatively impacted and may continue tonegatively impact us by increasing administrative, compensation and benefits costs by, for example, mandating coverage ofcertain COVID-19 related testing and treatment or mandating additional paid or unpaid leave. Further governmental actionthat is taken to mitigate the economic effects of the pandemic, as well as additional compensation or benefit actions taken byPNC, could adversely affect our financial condition and results of operations, possibly materially, in other ways that are notknown now.
• In response to the outbreak and its economic consequences, the Federal Reserve lowered its target for the federal funds rate toa range of 0% to 0.25% and has signaled that it expects to keep interest rates at a low level for through at least 2023. As aresult of the high percentage of our assets and liabilities that are in the form of interest-bearing or interest-related instruments,this change in interest rates has had and likely will continue to have a negative impact on our net interest income and netinterest margin, which could be material and which could materially adversely affect our profitability. The effects of a lowinterest rate environment are further described in the Risk Factor headed “Our business and financial performance areimpacted significantly by market interest rates and movements in those rates.”
• To protect our employees, customers and the communities in which we operate, we modified the operations of many of ourretail branches, including temporarily closing some branches, limiting operations to drive-through only in other locations, andotherwise implemented work-from-home policies for a significant portion of our workforce. While our retail operations havelargely re-opened, we cannot guarantee that our branches will continue to remain open if the outbreak worsens or there is anincrease in governmental restrictions. Our non-branch based workforce continues to work primarily remotely. We believe weare capable of substantially meeting the needs of our customers despite these modifications. However, these efforts mayresult in the loss of customers, impede our ability to perform certain transactions, and impair our ability to effectivelyidentify, manage and control risk. For example, customers may be unwilling or unable to conduct transactions with us viaonline channels or through a local branch that is operating only in a drive-through mode. Another example is theinfrastructure needed to provide products and services via online channels or to work effectively in a work-from-homeenvironment, such as internet, telecommunications and internal information technology systems, may fail to perform asanticipated, resulting in our inability to deliver products or services or effectively manage the risks arising from ourbusinesses. In addition, we rely on our employees, third party vendors and service providers and other counterparties, bothdomestically and abroad, to support many aspects of our business. Reduced workforces which may be caused by, but notlimited to, illness, quarantine, stay at home or other government mandates, or difficulties transitioning back to an in officeenvironment, could result in an adverse impact to our operations and financial performance. Redeployment of employeesfrom current positions and of technology from current uses to support products and services responsive to the outbreak mayfurther adversely impact our operations. Further, third party vendors, service providers and other counterparties, bothdomestically and abroad, face access, connectivity or other challenges operating within a work-from-home virtualenvironment.
• In support of our employees, customers and communities, we may take steps beyond or in addition to those required bygovernmental or regulatory minimums which may further adversely impact our profitability. For example, we have providedand may continue to provide additional relief or forbearance to customers, health and wellness benefits to employees(including significant company approved leave) or financial support for community initiatives to assist those in need as aresult of the outbreak. The actual or perceived failure to provide sufficient services, support or relief to those businesses orindividuals in need or properly implement legislation responsive to the outbreak or our voluntary commitments couldnegatively impact our reputation with adverse consequences to our business. In addition, such actual or perceived failure, or
18 The PNC Financial Services Group, Inc. – 2020 Form 10-K
operational and other issues that arise in connection with the implementation of government-mandated or other financialassistance or relief programs present elevated levels of legal and reputational risk, including governmental and regulatoryinquiries, investigations and enforcement actions, as well as private lawsuits. Participation by PNC in governmental programsdesigned to provide liquidity to the financial system or impacted businesses, such as borrowing through the Federal Reservediscount window or borrowing from, or selling financial assets to, facilities established by the Federal Reserve orparticipation in programs under the CARES Act and the Consolidated Appropriations Act, such as the PPP, also haveexposed and may continue to expose us to governmental investigation and action or public scrutiny and criticism, either at thetime we participate in the program or subsequently.
Refer to our other Risk Factors in this Item 1A for information regarding other factors that have and are likely to continue to affect ourbusiness and financial performance as a result of the pandemic.
Risks Related to the Economy and Other External Factors, Including Regulation
Our business and financial performance are vulnerable to the impact of adverse economic conditions.
As a financial services company, our business and overall financial performance are affected to a significant extent by economicconditions, primarily in the U.S.
Declining or adverse economic conditions and adverse changes in investor, consumer, and business sentiment generally result inreduced business activity, which may decrease the demand for our products and services or reduce the number of creditworthyborrowers. The ability of borrowers to repay loans is often weakened as a result of economic downturns and higher unemployment.Such economic conditions also may lead to turmoil and volatility in financial markets, often with at least some financial assetcategories losing value. Any of these effects would likely have an adverse impact on financial institutions such as PNC, with thesignificance of the impact generally depending on the nature and severity of the adverse economic conditions.
Even when economic conditions are relatively good or stable, specific economic factors can negatively affect our business andperformance. This can be especially true when the factors relate to particular segments of the economy. For example, shiftingconsumer behavior with respect to retail purchases being made over the internet rather than in physical stores has negatively impactedperformance by some retailers. This likely decreases demand for financial services in that sector, possibly harming thecreditworthiness of some shopping mall operators, retail companies and others with whom we do business. As another example,dislocations in international trade, such as increased tariffs and interruptions in international supply chains likely adversely affectcompanies that are relatively dependent on imports or exports, impacting prices and demand for goods or services. Affectedcompanies may experience lower levels of business and possible declining creditworthiness as compared to companies less dependenton international trade.
Given the geographic scope of our business and operations, we are most exposed to issues within the U.S. economy and financialmarkets. Within the U.S., we are currently most exposed to issues primarily within markets located in the Mid-Atlantic, Midwest andSoutheast. Following the proposed acquisition of BBVA, including its U.S. banking subsidiary, BBVA USA, this footprint willexpand particularly to include a larger presence in the Southwest and West Coast, thereby increasing our exposure to regionaleconomic issues in those areas.
Our foreign business activities continue to be a relatively small part of our overall business. As a result, the direct impact on ourbusiness and performance from economic conditions outside the U.S. is not likely to be significant, although the impact wouldincrease if we expand our foreign business more than nominally. We are, however, susceptible to the risk that such economicconditions could negatively affect our business and financial performance. Primarily, this risk results from the possibility that pooreconomic conditions or financial market disruptions affecting other major economies would also affect the U.S.
Throughout the remainder of this Risk Factors section, we address specific ways in which economic issues could create risk for us andresult in adverse impacts on our business and financial performance. In particular, the COVID-19 pandemic has led to economic issuesof the types described here and presents the risk of further such impacts. See the immediately preceding Risk Factor for a discussion ofrisks associated with the COVID-19 pandemic.
The impact of government legislation, regulation and policy and other political factors on the economy could have an adverseeffect on our business and financial performance.
Changes in law or governmental policy affecting the economy, business activity, or personal spending, investing or saving activitiesmay cause consumers and businesses to alter behavior in ways that impact demand for our products and services. Such changes mayalso alter the profitability of the transactions in which we engage or result in increased regulatory burden and associated costs. PNCmay alter the types or terms of the products and services we offer to reflect such changes. Uncertainty regarding future law or policymay have similar impacts. The recent election of a new U.S. President, together with some changes in the membership of Congress,
The PNC Financial Services Group, Inc. – 2020 Form 10-K 19
including change in control of the Senate, will likely lead to changes in law or policy, including the level of regulation of financialinstitutions and the enforcement environment. Moreover, a change in regulatory practices that increases the time frames to obtainregulatory approvals for acquisitions and other activities or makes them more difficult to obtain could affect our ability to makeacquisitions or introduce new products and services.
Concern regarding the ability of Congress and the President, which increases to the extent government is divided, collectively to reachagreement on federal budgetary matters (including the debt ceiling), or prolonged stalemates leading to total or partial governmentalshutdowns, also can have adverse economic consequences and create the risk of economic instability or market volatility, withpotential adverse consequences to our business and financial performance.
The policies of the Federal Reserve and other governmental agencies have a significant impact on interest rates and overallfinancial market performance, which are important to our business and financial performance.
The monetary policies of the Federal Reserve have a significant impact on interest rates and overall financial market performance.These policies can thus affect the activities and results of operations of financial companies such as PNC. An important function of theFederal Reserve is to monitor the national supply of bank credit and set certain interest rates. The actions of the Federal Reserveinfluence the rates of interest that we charge on loans and that we pay on borrowings and interest-bearing deposits. Rates of interestcan also affect the value of our on-balance sheet and off-balance sheet financial instruments. We cannot predict the nature or timing offuture changes in monetary policies or the precise effects that they may have on our activities and financial results.
In addition, monetary policy actions by governmental authorities in the European Union or other countries could have an impact onglobal interest rates, which could affect rates in the U.S. as well as rates on instruments denominated in currencies other than the U.S.dollar, any of which could have one or more of the potential effects on us described above.
Some of the potential impacts on our business and results of governmental monetary policy are described in Risk Factors under theheading “Risks Related to the Business of Banking.” The Federal Reserve has lowered its benchmark rates to historically low levels asa result of the COVID-19 pandemic. See the Risk Factor headed “The COVID-19 pandemic has had and is likely to continue to havean adverse effect, possibly materially, on our overall business and financial performance.”
As a regulated financial services firm, we are subject to numerous governmental regulations and comprehensive oversight by avariety of regulatory agencies and enforcement authorities. These regulations and the manner in which they are implemented canhave a significant impact on our businesses and operations and our ability to grow and expand.
The PNC Financial Services Group, Inc. is a BHC and a financial holding company, with the Federal Reserve as its primary regulator.PNC Bank is a federally chartered bank, with the OCC as its primary regulator. In addition, our businesses are subject to regulation bymultiple other banking, consumer protection, securities and derivatives regulatory bodies. We are also subject to the jurisdiction ofcriminal and civil enforcement authorities.
As a result, we are subject to numerous laws and regulations involving both our business and organization, with multiple regulators oragencies having supervisory or enforcement oversight over aspects of our business. These laws, regulations and supervisory activitiesare intended to promote the safety and soundness of financial institutions, financial market stability, the transparency and liquidity offinancial markets, and consumer and investor protection and prevent money laundering and terrorist financing. In addition toregulation in the U.S., we are also subject to foreign regulation to a limited extent as a result of our business activities outside the U.S.
Applicable laws and regulations restrict our permissible activities and investments and require compliance with provisions designed toprotect loan, deposit, brokerage, fiduciary, and other customers, and for the protection of customer information, among other things.We also are subject to laws and regulations designed to combat money laundering, terrorist financing, and transactions with persons,companies or foreign governments designated by U.S. authorities.
Over time, the scope of the laws and regulations affecting our businesses, as well as the number of requirements or limitationsimposed by legislative or regulatory actions, has increased, and we expect to continue to face substantial regulatory oversight and newor revised regulatory requirements or initiatives. Legislative or regulatory actions can result in increased compliance costs, reducedbusiness opportunities, or new requirements and limitations on how we conduct our business.
The Federal Reserve requires a BHC to act as a source of financial and managerial strength for its subsidiary banks. The FederalReserve could require PNC to commit resources to PNC Bank when doing so is not otherwise in the interests of PNC or itsshareholders or creditors.
The results of routine and non-routine supervisory or examination activities by our regulators, including actual or perceivedcompliance failures, could result in limitations on our ability to enter into certain transactions, engage in new activities, expandgeographically, make acquisitions, or obtain necessary regulatory approvals in connection therewith. These activities also could result
20 The PNC Financial Services Group, Inc. – 2020 Form 10-K
in significant fines, penalties, or required corrective actions, some of which could be expensive and difficult to implement. As weexpand our product and service offerings into additional states or countries, either through organic growth or acquisition, we will faceincreases in state or foreign regulation affecting our operations. Different approaches to regulation by different jurisdictions couldmaterially increase our compliance costs or risks of non-compliance.
A failure to comply, or to have adequate policies and procedures designed to comply, with regulatory requirements and expectationsexposes us to the risk of damages, fines and regulatory penalties and other regulatory or enforcement actions or consequences, such aslimitations on activities otherwise permissible for us or additional requirements for engaging in new activities, and could also injureour reputation with customers and others with whom we do business.
See the immediately following Risk Factor for a discussion of risks associated with capital and liquidity regulation. Also seeSupervision and Regulation in Item 1 of this Report for more information concerning the regulation of PNC, including those areas thathave been receiving a high level of regulatory focus. Note 20 Regulatory Matters in the Notes To Consolidated Financial Statementsin Item 8 of this Report also discusses some of the regulation applicable to us.
We are subject to regulatory capital and liquidity standards that affect our business, operations and ability to pay dividends orotherwise return capital to shareholders.
PNC and PNC Bank are subject to regulatory capital and liquidity requirements established by the Federal Reserve and the OCC,respectively. These regulatory capital and liquidity requirements are typically developed at an international level by the BaselCommittee and then applied, with adjustments, in each country by the appropriate domestic regulatory bodies. Domestic regulatoryagencies have the ability to apply stricter capital and liquidity standards than those developed by Basel Committee. In severalinstances, the U.S. banking agencies have done so with respect to U.S. banking organizations.
Requirements to maintain specified levels of capital and liquidity, and regulatory expectations as to the quality of our capital andliquidity, impact our business activities and may prevent us from taking advantage of opportunities in the best interest of shareholdersor force us to take actions contrary to their interests. For example, PNC’s ability to pay or increase dividends or otherwise returncapital to shareholders is subject to PNC’s compliance with its SCB, which is determined at least annually through the FederalReserve’s CCAR process. The Federal Reserve also has imposed additional limitations on capital distributions through the first quarterof 2021 by CCAR participating BHCs (including PNC) and may extend these limitations, potentially in modified form. In addition,capital and liquidity requirements may impact the amount and type of loans we make. We may be constrained in our ability to expand,either organically or through acquisitions. We may be forced to sell or refrain from acquiring assets where the capital requirementsappear inconsistent with the assets’ underlying risks. In addition, liquidity standards require us to maintain holdings of highly liquidshort-term investments, thereby reducing our ability to invest in longer-term or less liquid assets, even if more desirable from anearnings, balance sheet or interest rate risk management perspective.
The Basel Committee continues to engage in capital- and liquidity-related initiatives. For example, the Basel Committee in 2017finalized additional, significant changes to the international capital framework for banking organizations. See the Supervision andRegulation section included in Item 1 of this Report. As it is unclear, at this time, whether or how these initiatives will be implementedin the U.S., we are unable to estimate what potential impact such initiatives may have on us.
In 2020, the regulatory agencies issued a rule permitting banks to delay the estimated impact on regulatory capital stemming fromimplementing the CECL accounting standard. PNC elected to adopt this optional transition provision effective March 31, 2020. As aresult, our regulatory capital does not currently reflect the full impact of CECL.
Regulatory capital and liquidity requirements are subject to regular review and revision by the Basel Committee and the U.S. bankingagencies. Future changes to the capital and liquidity rules may require PNC or PNC Bank to maintain more or higher quality capital orgreater liquidity, which would likely increase some of the potential adverse effects described above.
The regulatory capital and liquidity frameworks as well as certain other prudential requirements and standards that are applicable toPNC are discussed in the Supervision and Regulation section included in Item 1 of this Report and the Liquidity and CapitalManagement portion of the Risk Management section of Item 7 of this Report.
The likely discontinuance of the submission of rates for the calculation of LIBOR presents risks to the financial instrumentsoriginated, held or serviced by PNC that use LIBOR as a reference rate.
As a large financial institution, a significant portion of our transactions involve variable or adjusting interest rates that are calculatedby adding a contractually defined credit spread to a base or reference rate. For many years, LIBOR has been used as a reference ratefor a substantial majority of our transactions involving variable or adjustable interest, including those in which we lend money, issuesecurities, or purchase and sell securities issued by others, as well as many derivative transactions that we enter into to manage our orour customers’ risk. We also service financial instruments entered into by others that use LIBOR as the reference rate.
The PNC Financial Services Group, Inc. – 2020 Form 10-K 21
LIBOR is derived from the rates at which LIBOR panel banks borrow from other global banks. LIBOR is accordingly viewed as a“credit-sensitive” rate as the rates submitted by panel banks on which LIBOR is based reflect the credit risk associated with thesubmitting banks.
We currently anticipate that non-USD LIBOR will cease to be available after year end 2021 and that the most widely used USDLIBOR tenor settings will cease after June 30, 2023. The Federal Reserve and other official sector representatives have alsocommunicated guidance that supervised institutions should stop entering into new USD LIBOR contracts no later than year end 2021.Accordingly, we are preparing for the likelihood of LIBOR cessation.
At present, SOFR is expected to be the alternative reference rate that will replace LIBOR for most types of transactions.
SOFR is viewed as a “riskless rate” as it is derived from rates on overnight U.S. Treasury repurchase transactions, which areessentially overnight loans secured by U.S. Treasury securities, which are largely viewed as not presenting credit risk. Because SOFRis an overnight rate derived from observations of actual transactions, the rate can be volatile, especially if there are disruptions in theunderlying repurchase market, but any daily volatility historically does not create volatility when rates are cumulatively measured overcustomary LIBOR terms (e.g., one month or three months).
Changing to SOFR or another riskless rate could result in a value transfer between contracting parties to instruments originally basedon LIBOR. Historically, in periods of economic or financial industry stress, riskless rates that are analogous to SOFR have beenrelatively stable. In contrast, LIBOR, which is designed to reflect the credit risk of banks, has widened relative to riskless rates,reflecting increased uncertainty regarding the credit-worthiness of banks. Accordingly, assuming that SOFR will behave like itshistorical analogs, an instrument that transitions from LIBOR to SOFR may not yield identical economic outcomes for eachcontracting party to an instrument had the instrument continued to reference LIBOR. Similarly, SOFR, because it is riskless, tends tobe a lower rate than LIBOR. To address these differences between LIBOR and SOFR, certain industry recommended LIBOR fallbackprovisions include a concept of an adjustment spread that is applied when a LIBOR-based contract falls back to SOFR and that iscalculated based on a five-year median look-back of the historical spot difference between the applicable LIBOR tenor and theapplicable SOFR tenor. However, because any such adjustment spread will be based on a historical median, it is likely that theadjustment spread may not reflect the spot difference between LIBOR and SOFR at certain points in time and there may be a valuetransfer between the contracting parties over the life of the instrument because the all-in rate applied to a contract, even taking intoaccount the spread adjustment, might have behaved differently over the life of the instrument in the absence of LIBOR cessation.
Any value transfer could be financially adverse or beneficial to us or to our other contracting parties to that instrument (such as aborrower, derivative counterparty, or bond holder). Impacts from a change in reference rate would likely include changes to the yieldon, and value of, loans or securities held by us, amounts paid on securities we have issued, amounts received and paid on derivativeinstruments we have entered into and the trading market for LIBOR-based securities. Any theoretical benefit to us could result incounterparty dissatisfaction, which, in turn could lead to litigation, potentially as class actions, or other adverse consequences,including dissatisfied customers or impaired relationships with financial institution counterparties resulting in loss of business. As aresult, over the life of a transaction that transitions from LIBOR to a new reference rate, our monetary obligations to our counterparty(or their obligations to us) and the yield we receive (or pay) from the transaction with that counterparty may change from that whichwould have resulted from a continuation of LIBOR.
Another set of risks associated with LIBOR cessation relates to how the transition from LIBOR to another rate will be effected. Forsome instruments, the method of transitioning to a new reference rate may be challenging, especially where the contract does notprovide for a transition upon LIBOR cessation or the relevant contractual language relating to a potential transition is ambiguous orinadequate under the circumstances.
For example, the vast majority of LIBOR-based interest rate derivative contracts executed prior to January 25, 2021, do not includeadequate fallbacks for LIBOR cessation. In response, the industry trade group for derivatives (ISDA), published a protocol pursuant towhich industry participants can agree with any other industry participant that adheres to the protocol to include ISDA’s new LIBORfallback provisions into legacy derivatives contracts. Although we have adhered to the ISDA protocol, it is possible that many “endusers” of swaps, i.e., our borrowers who have hedged their interest rate payment obligations, may not adhere. In addition, there aredifferences between the new ISDA fallback provisions and the fallback provisions that have been proposed for loans, whichdifferences could result in a mismatch between the reference rate or other economics in our borrowers’ legacy derivatives contractsand their loans for which such derivatives contracts are intended as a hedge. For these end-user counterparties, one-on-one negotiationwith each counterparty will be necessary in order to amend legacy swaps to adequately address LIBOR cessation. If we are unable toagree to appropriate LIBOR cessation provisions with these swaps counterparties, there will be uncertainty as to how to value andeffect our rights and obligations under our legacy swap contracts. Although legislative solutions to address LIBOR cessation inderivative contracts have been proposed, there is no assurance such solutions will be implemented, and we may seek to negotiate withimpacted counterparties or, if not possible, effect reference rate transition through other means. Addressing transition under thesecircumstances may be challenging or ineffective, could result in litigation, and in some cases may involve concession on our part thathas the effect of reducing the value of the instrument to us.
22 The PNC Financial Services Group, Inc. – 2020 Form 10-K
We have other contracts that do contemplate LIBOR cessation but do so in a manner that may create other risks. For example, somecontracts provide for selecting replacement rates in a manner that presents significant challenges (such as by assuming that therewould be a rate calculated substantially in the same manner as LIBOR is) or that gives us or another party absolute discretion to selecta rate. Some provide for determination of a reference rate without providing for adjustment of the credit spread. In these types ofcases, there will likely be uncertainty surrounding transition, with all of the risks described in this Risk Factor.
Transitioning from LIBOR to alternative rates also may result in operational errors during the transition such that the replacement rateis not applied in a timely manner or is incorrectly applied. This is particularly true given the volume of contracts that will requiretransition and the diversity of potential approaches to transition and given the possibility that the period during which the transitionwill need to take place may have a short duration.
Similarly, our failure to successfully implement transition from LIBOR to alternative rates could result in regulatory scrutiny andactions by our regulators including fines and other supervisory sanctions.
It is also possible that LIBOR quotes will become unavailable prior to the currently anticipated cessation dates. In that case, the risksassociated with the transition to an alternative reference rate will be accelerated and magnified. These risks may also be increased dueto the shorter time for preparing for the transition.
In order to address LIBOR cessation and the associated risks, we have established an enterprise LIBOR transition program, describedin the Market Risk Management portion of the Risk Management section in Item 7 of this Report. Any failure of this program toappropriately assess and mitigate risk and deliver in a timely manner on operationalizing our ability to transition from LIBOR couldmagnify the risks previously outlined.
New customer privacy initiatives will impose additional operational burdens on PNC, may limit our ability to pursue desirablebusiness initiatives and increase the risks associated with any future use of customer data.
Recently there has been an increase in legislative and regulatory efforts to protect the privacy of consumer data. Significant examplesinclude the General Data Protection Regulation of the European Union and the California Consumer Privacy Act. These initiatives,among other things, limit how companies can use customer data and impose obligations on companies in their management of suchdata. Financial services companies such as PNC necessarily gather, maintain and use a significant amount of customer data. Thesetypes of initiatives increase compliance complexity and related costs, result in significant financial penalties for compliance failures,and limit our ability to develop new products or respond to technological changes. Such legal requirements also could heighten thereputational impact of perceived misuses of customer data by us, our vendors, or others who gain unauthorized access to our customerdata. Other jurisdictions may adopt similar requirements that impose different and potentially inconsistent compliance burdens. Theimpacts will be greater to the extent requirements vary across jurisdictions.
Societal responses to climate change could adversely affect our business and performance, including indirectly through impacts onour customers.
Concerns over the long-term impacts of climate change have led and will continue to lead to governmental efforts around the world tomitigate those impacts. Consumers and businesses also are changing their behavior as a result of these concerns. PNC and itscustomers will need to respond to new laws and regulations as well as consumer and business preferences resulting from climatechange concerns. We and our customers may face cost increases, asset value reductions, operating process changes, and the like as aresult of governmental actions or societal responses to climate change. The impact on our customers will likely vary depending ontheir specific attributes, including their reliance on or role in carbon intensive activities as well as their exposure to the effects ofclimate change. Among the impacts to PNC could be a drop in demand for our products and services, particularly in certain sectors. Inaddition, we could face reductions in creditworthiness on the part of some customers or in the value of assets securing loans, pressurefrom individuals or groups to cease doing business with certain companies or sectors, or additional regulatory restrictions or costsassociated with providing products or services to certain companies or sectors. The Risk Factor headed “We are at risk for an adverseimpact on our business due to damage to our reputation” has further discussion of risks associated with activist pressure. Our efforts totake these risks into account in making lending and other decisions, including by increasing our business with climate-friendlycompanies, may not be effective in protecting us from the negative impact of new laws and regulations or changes in consumer orbusiness behavior, including those resulting from activist pressure.
Risks Related to the Use of Technology
The use of technology is critical to our ability to maintain or enhance the competitiveness of our businesses.
As a large financial services company, we handle a substantial volume of customer and other financial transactions. As a result, werely heavily on information systems to conduct our business and to process, record and monitor our transactions and those of ourcustomers. Over time, we have seen more customer usage of technological solutions for financial needs as well as higher expectationsof customers and regulators regarding effective and safe systems operation. In many cases, the effective use of technology increases
The PNC Financial Services Group, Inc. – 2020 Form 10-K 23
efficiency and enables financial institutions to better serve customers. As a result of these factors, the financial services industry isundergoing rapid technological change with frequent introductions of new technology-driven products and services. Examples includeexpanded use of cloud computing, artificial intelligence and machine learning, virtual and augmented reality, biometric authentication,voice and natural language, and data protection enhancements, as well as increased online and mobile device interaction withcustomers. We expect these trends to continue for the foreseeable future. Change is coming both from traditional banking companiesand non-bank financial technology companies offering financial products and services, particularly payment services and lending. Ourability to succeed is dependent on the technologies we employ and offer our customers and the extent to which we at least keep pacewith, if not exceed, our competitors’ progress and our customers’ needs and expectations.
In response to actual and anticipated customer behavior and expectations, as well as competitive pressures, we have been investing intechnology and connectivity. We are seeking to automate functions previously performed manually, facilitate the ability of customersto engage in financial transactions, and otherwise enhance the customer experience with respect to our products and services. Thiseffort has involved the expenditure of considerable amounts of funds and other resources. A failure to maintain or enhance ourcompetitive position with respect to technology, whether because we fail to anticipate customer expectations or because ourtechnological developments fail to perform as desired or are not rolled out in a timely manner or because we fail to keep pace with ourcompetitors, would likely cause us to lose market share or incur additional expense. Our ability to maintain or enhance our relativetechnological position is in part dependent on our ability to attract and retain talented employees in these fields, which, due to overalldemand, is increasingly difficult.
Our use of technology is dependent on having the right to use the underlying intellectual property.
In some cases, we develop internally the intellectual property embedded in the technology we use. In others, we or our vendors licenseit from others. Regardless of the source of the intellectual property, if another person or entity were deemed to own intellectualproperty rights infringed by our activities, we could be responsible for significant damages covering past activities and substantial feesto continue to engage in these types of activities. It also is possible that we could be prevented from using technology important to ourbusiness for at least a period of time. In such a circumstance, there may be no alternative technology for us to use or an appropriatealternative technology might be expensive to obtain. Protections offered by those from whom we license technology against theserisks may be inadequate to cover fully any losses. Over time, there have been instances where technology used by PNC and otherfinancial institutions has been alleged to have infringed patents held by others, and in some cases we, as well as other financialinstitutions, have suffered related losses.
We could suffer a material adverse impact from interruptions in the effective operation of our information systems and othertechnology.
The need to ensure proper functioning and resiliency of our information systems and other technology has become more important andmore challenging, and the costs involved in that effort continue to be high. The risks of operational failures in the use of these systemsresult from a variety of factors. We are vulnerable to the impact of failures of our systems to operate as needed or intended. Failuresleading to materially adverse impacts could include those resulting from human error, unexpected transaction volumes, or overalldesign or performance issues. In addition, our ability to use our technology effectively could be impacted due to bad weather,disasters, bad actors, terrorism and the like. Such events could affect our systems directly or limit our ability to use our technology dueto effects on key underlying infrastructure. In some cases, the risk results from the potential for bad acts on the part of others,discussed in more detail in the Risk Factor headed “We are vulnerable to the risk of third party breaches of data security affecting thefunctioning of systems or the confidentiality of information, either at PNC or at third parties handling PNC information.”
We also rely on information systems maintained by other companies. We use other companies both to provide products and servicesdirectly to us and to assist in providing products and services to our customers. Others provide the infrastructure that supports, forexample, communications, payment, clearing and settlement systems, or information processing and storage. These companies rangefrom those providing highly sophisticated information processing to those that provide fundamental services, such as electric powerand telecommunications. In some cases, these other companies themselves utilize third parties to support their delivery of products andservices to us and our customers. Systems maintained by or for these other companies are generally subject to many of the same riskswe face with respect to our systems and thus their issues could have a negative impact on PNC. We necessarily have less ability toprovide oversight over other companies’ information systems.
A number of our customers choose to use financial applications (apps) that allow them to view banking and other financial accountinformation, often held at different financial institutions, on a single platform, to monitor the performance of their investments, tocompare financial and investment products, to make payments or transfer funds, and otherwise to help manage their finances andinvestments. Financial apps often ask users to provide their secure banking log-in information and credentials (username andpassword) so the apps can link to users’ accounts at financial institutions. Companies offering these apps frequently use third-partydata aggregators – behind-the-scenes technology companies that serve as a data-gathering service provider – to deliver customerfinancial data that is used by the financial apps. To do this, data aggregators are provided with customers’ log-in information andcredentials, which allows the aggregators to access the customers’ online account and “scrape” the customers’ data, often on a daily oreven more frequent basis. That same information has the potential to facilitate fraud if it is not properly protected. In fact, the Directorof the FinCEN has stated that FinCEN has seen high incidences of fraud, including ACH fraud, credit card fraud, and wire fraud,
24 The PNC Financial Services Group, Inc. – 2020 Form 10-K

enabled through the use of synthetic identities and through account takeovers via these platforms. In some cases, cybercriminalsappear to be using such data aggregators and integrators to facilitate account takeovers and fraudulent wires. PNC has and maycontinue to face increased financial exposure due to fraudulent activity associated with the increased use of these apps and dataaggregators. Even where PNC does not have responsibility for fraud losses associated with these apps and data aggregators, PNCcould suffer increased reputational harm when such losses occur.
Although we regularly update and replace systems that we depend on as our needs evolve and technology improves, we continue toutilize some older systems that may not be as reliable as newer ones. In addition, the implementation of and transition to new orupdated systems creates risks related to associated timing and costs, disruptions in functionality for customers and longer term failuresto achieve desired improvements.
The occurrence of any failure, interruption or security breach of any of our information or communications systems, or the systems ofother companies on which we rely, could result in a wide variety of adverse consequences to us. This risk is greater if the issue iswidespread, extends for a significant period of time, or results in financial losses to our customers. The consequences of failures tooperate systems properly can include disruptions to our ability to use our accounting, deposit, loan, payment and other systems. Suchevents could also cause errors in transactions or impair system functionality with customers, vendors or other parties. Possible adverseconsequences also include damage to our reputation or a loss of customer business, which could occur even if the negative impact oncustomers was de minimis. We also could face litigation or additional regulatory scrutiny. This in turn could lead to liability or othersanctions, including fines and penalties or reimbursement of adversely affected customers. Even if we do not suffer any materialadverse consequences as a result of events affecting us directly, information systems issues at other financial institutions could lead toa general loss of customer confidence in financial institutions, including us. Also, system problems, including those resulting fromthird party attacks, whether at PNC or at our competitors, would likely broadly increase legislative, regulatory and customer concernsregarding the functioning, safety and security of such systems. In that case, we would expect to incur even higher levels of costs withrespect to prevention and mitigation of these risks.
We are vulnerable to the risk of third party breaches of data security affecting the functioning of systems or the confidentiality ofinformation, either at PNC or at third parties handling PNC information.
We are faced with ongoing, bordering on continual, efforts by others to breach data security at financial institutions or with respect tofinancial transactions. Some of these involve efforts to enter our systems directly by going through or around our security protections.Others involve the use of social engineering schemes to gain access to confidential information from our employees, customers orvendors. Most corporate and commercial transactions are now handled electronically, and our retail customers increasingly use onlineaccess and mobile devices to bank with us. The ability to conduct business with us in this manner depends on the transmission andstorage of confidential information in electronic form. As a result, efforts by bad actors to engage in various types of cyber attackspose serious risks to our business and reputation. The same risks are presented by attacks potentially affecting information held bythird parties on our behalf or accessed by third parties, including those offering financial apps, on behalf of our customers.
In the ordinary course, we maintain and process vast amounts of information about us, our customers and our employees. Thisinformation tends to be confidential or proprietary and much of it is highly sensitive. The highly sensitive information includesinformation sufficient to support identity theft and personal health information, as well as information regarding business plans andfinancial performance that has not been made public. One way in which bad actors attempt to harm us is by seeking access to some ofthis confidential or proprietary information, often with the intent of stealing from or defrauding us or our customers. In other cases,they seek to disrupt our ability to conduct our business, including by destroying or impairing our access to information maintained byus.
Our customers often use their own devices, such as computers, smartphones and tablets, to do business with us and may provide theirPNC customer information (including passwords) to a third party in connection with obtaining services from the third party, includingthose offering financial apps. Although we take steps to provide safety and security for our customers’ transactions with us and theircustomer information to the extent they are utilizing their own devices or providing third parties access to their accounts, our ability toassure such safety and security is necessarily limited.
As our customers regularly use PNC-issued credit and debit cards to pay for transactions with retailers and other businesses, there isalso the risk of data security breaches at those other businesses covering PNC account information. When our customers use PNCissued cards to make purchases from those businesses, card account information often is provided to the business. If the business’ssystems that process or store card account information are subject to a data security breach, holders of our cards who have madepurchases from that business may experience fraud on their card accounts. We can be responsible for reimbursing our customers forsuch fraudulent transactions on customers’ card accounts, as well as for other costs related to data security compromise events, such asreplacing cards associated with compromised card accounts, but to date such losses have not been material to us. In addition, weprovide card transaction processing services to some merchant customers under agreements we have with payment networks such asVisa and Mastercard. Under these agreements, we may be responsible for certain losses and penalties if one of our merchant customerssuffers a data security breach. Over the last few years, several large companies disclosed that they had suffered substantial datasecurity breaches compromising millions of user accounts and credentials. To date, our losses and costs related to these types ofbreaches, including those where some of the accounts affected were with PNC, have not been material. Other similar events in the
The PNC Financial Services Group, Inc. – 2020 Form 10-K 25

future could be more significant to us. Moreover, to the extent more consumer confidential information becomes available to badactors through the cumulative effect of data breaches at companies generally, bad actors may find it easier to use such information togain access to our customer accounts.
Other cyber attacks are not focused on gaining access to credit card or user credential information, but instead seek access to a rangeof other types of confidential information, such as internal emails and other forms of customer financial information. Ransomwareattacks have sought to deny access to data and possibly shut down systems and devices maintained by target companies. In aransomware attack, system data is encrypted or access is otherwise denied, accompanied by a demand for ransom to restore access tothe data. To date, our losses and costs related to these types of attacks have not been material, but ransomware attacks have increasedin recent years and there is no guarantee that future attacks will not be successful.
A number of companies have fallen victim to BEC scams in recent years. BEC scams involve using social engineering to causeemployees to wire funds to the perpetrators in the mistaken belief that the requests were made by a company executive or establishedvendor. While we have not experienced material losses from BEC scams to date, some of our commercial customers have beenvictimized. Attacks on our customers may put these relationships at risk, particularly if customers’ ability to continue operations isimpaired due to the losses suffered.
Other attacks in recent years have included DDoS attacks, in which individuals or organizations flood commercial websites withextraordinarily high volumes of traffic with the goal of disrupting the ability of commercial enterprises to process transactions andpossibly making their websites unavailable to customers for extended periods of time. We (as well as other financial servicescompanies) have been subject to such attacks.
In addition to threats from external sources, insider threats represent a significant risk to us. Insiders, including those having legitimateaccess to our systems and the information contained in them, have the easiest opportunity to make inappropriate use of the systemsand information. Addressing that risk requires understanding not only how to protect us from unauthorized use and disclosure of data,but also how to engage behavioral analytics and other tools to identify potential internal threats before any damage is done.
To date, none of these types of attacks have had a material impact on us. Nonetheless, we cannot entirely block efforts by bad actors toharm us. And our efforts to prevent significant harm from attacks may be insufficient. While we maintain insurance coverage that maycover certain aspects of cyber risks, such insurance coverage may be insufficient to cover all losses. As a result, we could suffermaterial financial and reputational losses in the future from any of these or other types of attacks or the public perception that such anattack on our systems has been successful, whether or not this perception is correct. Attacks on others, some of which have led toserious adverse consequences, demonstrate the risks posed by new and evolving types of cyber attacks. Our ability to protectconfidential or proprietary information is even more limited with respect to information held by third parties. We may sufferreputational damage or legal liability for unauthorized access to customer information held by third parties, even if we were in fact notresponsible for preventing such access and had no reasonable way of preventing it.
We need effective programs to limit the risk of failures or breaches occurring in our information systems and to mitigate theimpact when they do.
We have policies, procedures and systems (including cyber security and business continuity programs) designed to prevent or limit theeffect of possible failures, interruptions or breaches in security of information systems. In recent years, we have devoted significantresources towards improving the reliability of our systems and their security against external and internal threats and expect tocontinue to do so in the future. We design our business continuity and other information and technology risk management programs tomanage our capabilities to provide services in the case of an event resulting in material disruptions of business activities affecting ouremployees, facilities, technology or suppliers. We cannot guarantee the effectiveness of our policies, procedures and systems toprotect us in any particular future situation, nor the effectiveness of our oversight of risk at third parties. Our ability to implementpolicies, procedures and systems designed to prevent or limit the effect of possible failures, interruptions or breaches in security ofinformation systems with respect to third party systems and the financial services industry infrastructure is necessarily limited. Shouldan adverse event affecting another company’s systems occur, we may not have financial protection from the other company sufficientto compensate us or otherwise protect us from the consequences.
Methods used by others to attack information systems change frequently (with generally increasing sophistication). A new method ofattack often is not recognized until launched against a target. Attacks in some cases appear to be supported by foreign governments orother well-financed entities and often originate from less regulated and remote areas around the world. As a result, we may be unableto implement adequate preventive measures to address these methods in advance of attacks.
Even with our proactive and defensive measures in place, adverse events are likely to occur and there remains the risk that one or moresuch events would be material to PNC. Our ability to mitigate the adverse consequences of such occurrences is in part dependent onthe quality of our business continuity planning, our ability to understand threats to us from a holistic perspective, and our ability toanticipate the timing and nature of any such event that occurs, with novel or unusual events posing a greater risk. It is also the case thatan adverse event can go undetected for a period of time, with the adverse consequences likely greater the longer it takes to discover the
26 The PNC Financial Services Group, Inc. – 2020 Form 10-K
problem. In many cases, it also depends on the preparedness and responses of national or regional governments, including emergencyresponders, or on the part of other organizations and businesses with which we deal.
Risks Related to the Business of Banking
Our business and financial results are subject to risks associated with the creditworthiness of our customers and counterparties.
Credit risk is inherent in the financial services business. It results from, among other things, extending credit to customers, purchasingsecurities, and entering into financial derivative transactions and certain guarantee contracts. Credit risk is one of our most significantrisks, particularly given the high percentage of our assets represented directly or indirectly by loans and securities and the importanceof lending activity to our overall business. We manage credit risk by assessing and monitoring the creditworthiness of our customersand counterparties, by diversifying our loan portfolio and by investing primarily in high quality securities.
A borrower’s ability to repay a loan can be adversely affected by many factors. Individual borrowers can be affected, for example, bydeclines in income, job losses, health issues or family issues. Commercial borrowers can be affected, for example, by poor businessperformance, changes in customer behavior or catastrophic losses. Weakness in the economy or in financial markets would typicallyadversely impact the ability of our borrowers to repay outstanding loans. We are exposed to increased credit risk if we fail to evaluateproperly at origination the likely ability of a borrower to repay a loan. Properly estimating the current and potential value of anycollateral pledged to support the loan also is critical to effectively managing credit risk. A failure to identify declining creditworthinessof a borrower or declining collateral value at a time when remedial actions could reduce our exposure also increases credit risk. Anydecrease in our borrowers’ ability to repay loans would result in higher levels of nonperforming loans, net charge-offs, provision forcredit losses and valuation adjustments on loans held for sale. Managing credit risk effectively also relies on forecasts of future overalleconomic conditions, which are inherently imperfect.
In addition to credit risk associated with our lending activities, we have credit risk arising from many other types of businessrelationships. Routine transactions give us credit exposure to brokers and dealers, commercial banks, investment banks, mutual andhedge funds, other institutional clients, as well as vendors and other non-financial entities.
In the ordinary course of business, we often have heightened credit exposure to a particular industry, region or financial market. As anexample, loans secured by commercial and residential real estate typically represent a significant percentage of our overall creditportfolio. They also represent a portion of the assets underlying our investment securities. Although there are limitations on the extentof total exposure to an individual or business borrower, we may have outsized exposure to a particular borrower experiencing financialdistress. Events adversely affecting specific customers or counterparties, industries, regions or financial markets, including a decline intheir creditworthiness or a worsening overall risk profile, could materially and adversely affect us. Declining economic conditions alsomay impact commercial borrowers more than consumer borrowers, or vice versa. Thus, the concentration and mix of our loanportfolio may affect the severity of the impact of a recession on us.
Our credit risk may be exacerbated when collateral held by us to secure obligations to us cannot be realized upon, including as a resultof legal or regulatory changes, or is liquidated at prices that are not sufficient to recover the full amount of the loan or derivativeexposure due us.
We reserve for credit losses on our loan and lease portfolio through our ACL estimated under CECL. Under CECL, the ACL reflectsexpected lifetime losses, which could lead to volatility in the allowance and the provision for credit losses as economic forecasts,actual credit performance and other factors used in the loss estimating process change. We also have reserves for unfunded loancommitments and letters of credit. Changes are reflected in net income through provision for credit losses. An increase in credit riskwould likely lead to an increase in provision for credit losses with a resulting reduction in our net income and would increase ourallowance. An improvement of economic conditions or our economic outlook, particularly following a period of poor economicconditions, has and could continue to result in a recapture of provision for credit losses for a period of time with a resulting increase inour net income and decrease in our allowance that is not likely to be sustained.
The COVID-19 pandemic has adversely impacted both commercial borrowers and consumers. In addition, the declines in GDP andincreases in unemployment associated with the pandemic, and responsive measures to manage it, have significantly impacted theeconomic and qualitative factors used for purposes of our estimation of credit losses under CECL. For a discussion of the increasedcredit risk arising from the pandemic and its impact to our estimation of credit losses, see the Risk Factor headed “The COVID-19pandemic has had and is likely to continue to have an adverse effect, possibly materially, on our overall business and financialperformance.”
The PNC Financial Services Group, Inc. – 2020 Form 10-K 27
Our business and financial performance are impacted significantly by market interest rates and movements in those rates.
As a result of the high percentage of our assets and liabilities that are in the form of interest-bearing or interest-related instruments,changes in interest rates, in the shape of the yield curve, or in spreads between different market interest rates can have a material effecton our business, our profitability and the value of our financial assets and liabilities. For example:
• Changes in interest rates or interest rate spreads affect the difference between the interest that we earn on assets and theinterest that we pay on liabilities, which impacts our overall net interest income and margin as well as our profitability.
• Such changes can affect the ability of borrowers to meet obligations under variable or adjustable rate loans and other debtinstruments, and can, in turn, increase our credit losses on those assets.
• Such changes can decrease the demand for interest rate-based products and services, including loans and deposit accounts.• Such changes affect our hedging of various forms of market and interest rate risk and may decrease the effectiveness of
those hedges in helping to manage such risks.• Movements in interest rates also affect mortgage prepayment speeds and could result in impairments of mortgage
servicing assets or otherwise affect the profitability of such assets.• Increases in interest rates likely lower the price we would receive on fixed-rate customer obligations if we were to sell
them.
We may also experience spread compression by offering higher than expected deposit rates in order to attract and maintain deposits asa result of increased competition.
The rates on some interest-bearing instruments adjust promptly in accordance with changes in market rates, while others adjust onlyperiodically or are fixed throughout a defined term. As a result, the impact of changes in interest rates can be either increased ordiluted due to differences in the relative variability of the rates paid on our liabilities in relation to the rates received on our assets. Theextent to which we have elected to hedge interest rate risk through interest rate swaps also affects the impact of rate changes. Weattempt to manage the balance sheet to increase our benefit or reduce negative impacts from future movements in interest rates, butfailures to anticipate actual movements may have the opposite result.
While in general higher interest rates enhance our ability to grow our net interest income, there are risks associated with a risinginterest rate environment. As a general matter, increasing rates tend to decrease the value of fixed-rate financial instruments held onour balance sheet, as discussed in the Risk Factor headed “Our business and financial performance are vulnerable to the impact ofchanges in the values of financial assets.” Also, customers may be less willing overall to borrow at higher rates. Higher interest ratesmay indirectly affect the value of asset classes such as real estate typically financed through secured loans, with a resulting negativeeffect on collateral securing such loans. As another example, there may be increased competitive pressures as rates on deposit productsrise. The benefits of higher interest rates are best achieved if we can increase the rates on loans and other assets faster than the rates ondeposits and other liabilities increase. We may not be able to achieve this result in a rising rate environment.
On the other hand, lower interest rates tend to have a negative impact on our net interest margin, and, unless offset by higher earningassets, on our net interest income. Moreover, a negative interest rate environment, in which interest rates drop below zero eitherbroadly or for some types of instruments, could reduce our net interest margin and net interest income due to a likely decline in theinterest we could earn on loans and other earning assets, while also likely requiring us to pay to maintain our deposits with the FederalReserve Bank. In addition, our systems may not be able to handle adequately a negative interest rate environment and not all variablerate instruments are designed for such a circumstance. The current very low interest rate environment increases the potential fornegative interest rates to occur.
We discuss the impact of governmental monetary policy on interest rates in the Risk Factors headed “The policies of the FederalReserve and other governmental agencies have a significant impact on interest rates and overall financial market performance, whichare important to our business and financial performance” and “The COVID-19 pandemic has had and is likely to continue to have anadverse effect, possibly materially, on our overall business and financial performance.”
Our business and financial performance are vulnerable to the impact of changes in the values of financial assets.
As a financial institution, a substantial majority of our assets and liabilities are financial in nature. Examples include loans, securities,servicing rights, deposits and borrowings. Such assets and liabilities will fluctuate in value, often significantly, due to movements inthe financial markets or market volatility as well as developments specific to the asset or liability in question. Credit-based assets andliabilities will fluctuate in value due to changes in the perceived creditworthiness of borrowers or other counterparties and also due tochanges in market interest rates.
Changes in loan prepayment speeds, which often occur when interest rates change, impact the value of our mortgage servicing rights,possibly adversely. Also, the underlying value of assets under lease or securing an obligation generally decreases due to increases insupply or decreases in demand for the asset or deterioration in the condition of the asset. This could negatively impact the ability tocollect fully on the secured obligation.
28 The PNC Financial Services Group, Inc. – 2020 Form 10-K
In many cases, we mark our assets and liabilities to market and recognize such changes either through net income or OCI. Thus, gainsor losses on these assets and liabilities can have a direct impact on our results of operations, unless we have effectively hedged ourexposures. We may need to record losses in the value of financial assets even where our expectation of realizing the face value of theunderlying instrument has not changed. Other assets and liabilities are not marked to market. As a result, our balance sheet does notprecisely represent the fair market value of our financial assets and liabilities.
In addition, asset management revenue is earned primarily based on a percentage of the value of the assets being managed and thus isimpacted by general changes in market valuations. Thus, although we are not directly impacted by changes in the value of such assets,decreases in the value of those assets would affect related Noninterest income.
For a discussion of the risks presented by the COVID-19 pandemic to the values of financial assets, see the Risk Factor headed “TheCOVID-19 pandemic has had and is likely to continue to have an adverse effect, possibly materially, on our overall business andfinancial performance.”
Risks Related to Estimates and Assumptions
Our asset and liability valuations and the determination of the amount of loss allowances and impairments taken on our assets arehighly subjective. Inaccurate estimates could materially impact our results of operations or financial position.
We must use estimates, assumptions and judgments when assets and liabilities are measured and reported at fair value. Assets andliabilities carried at fair value inherently result in a higher degree of financial statement volatility. Changes in underlying factors orassumptions in any of the areas underlying our estimates could materially impact our future financial condition and results ofoperations. During periods of market disruption, it would be difficult to value certain assets if trading becomes less frequent and/ormarket data becomes less observable. There may be certain asset classes that were historically traded in active markets with significantobservable data that rapidly become illiquid due to market volatility, a loss in market confidence or other factors. In addition, we haveassets and liabilities carried at fair value that are estimated using unobservable inputs that are significant to the fair value of the assetsor liabilities. The valuation of any asset or liability substantially based on unobservable inputs is necessarily less reliable than thosebased on active trading markets. Further, rapidly changing and unprecedented market conditions in any particular market couldmaterially impact the valuation of assets as reported within our consolidated financial statements. Our ability to hedge exposure is inpart dependent on our ability to value the related assets or liabilities.
The determination of the amount of loss allowances and asset impairments varies by asset type and is based upon our periodicevaluation and assessment of known and inherent risks associated with the respective asset class. Management updates its evaluationsregularly and reflects changes in allowances and impairments in operations as such evaluations are revised. Although we have policiesand procedures in place to determine loss allowance and asset impairments, due to the subjective nature of this area, the level ofimpairments taken and allowances reflected in our financial statements may not accurately reflect the actual level of risk and theamount of future losses.
There are risks resulting from the extensive use of models in our business.
We rely on quantitative models to measure risks and to estimate many financial values. We use models throughout much of ourbusiness, relying on them for much of our decision making. Examples of areas we use models include determining the pricing ofvarious products, grading loans and extending credit, measuring interest rate and other market risks, predicting or estimating losses,assessing capital adequacy, and calculating economic and regulatory capital levels. We also use models to estimate the value offinancial instruments and balance sheet items. In particular, we depend significantly on complex models for credit loss accountingunder CECL, many of which have only been in use for a relatively short period of time.
Models generally evaluate the performance of various factors under anticipated future conditions, relying on historical data to helpbuild the model and in part on assumptions as to the future, often with respect to macro-economic conditions, in order to generate theoutput. Poorly designed or implemented models, including in the choice of relevant historical data or future-looking assumptions,present the risk that our business decisions based on information incorporating model output will be adversely affected due to theinadequacy of that information. Also, information we provide to the public or to our regulators based on poorly designed orimplemented models could be inaccurate or misleading. Some of the decisions that our regulators make, including those related tocapital distributions to our shareholders, would likely be affected adversely if they perceive that the quality of the relevant modelsused is insufficient.
Risks Related to Our Need for Customers
Our success depends on our ability to attract and retain customers for our products and services.
Our performance is subject to risks associated with declines in customer demand for our products and services. As a result of thenature of those products and services, we are particularly at risk for losses of economic confidence or customer trust in us. For a
The PNC Financial Services Group, Inc. – 2020 Form 10-K 29
discussion of the risks related to declines in demand for our products and services as a result of the COVID-19 pandemic, see the RiskFactor headed “The COVID-19 pandemic has had and is likely to continue to have an adverse effect, possibly materially, on ouroverall business and financial performance.”
Economic and market developments may affect consumer and business confidence levels. If customers lose confidence due toconcerns regarding the economy, the demand for our products and services could suffer. We may also fail to attract or retaincustomers if we are unable to develop and market products and services that meet evolving customer needs or demands or if we areunable to deliver them effectively and securely to our customers. This is particularly true to the extent that our competitors are betterable to do so.
If we fail to attract and retain customers, demand for our loans and other financial products and services could decrease and we couldexperience adverse changes in payment patterns. We could lose interest income from a decline in credit usage and noninterest incomefrom a decline in product sales, investments and other transactions.
Our customers could remove money from checking, savings or other types of deposit accounts with us in favor of other banks or othertypes of investment products. Deposits are a low cost source of funds for us. Therefore, losing deposits could increase our fundingcosts and reduce our net interest income.
Our ability to attract and retain customer deposits is impacted by the levels of interest rates, as customers balance the benefits of bankaccounts such as deposit insurance and some of the convenience associated with more traditional banking products against thepossibility of higher yields from other investments. In general, if the spread between the rates we offer and those offered byalternatives to bank accounts widens, customers are often willing to forego the benefits of bank accounts for higher returns elsewhere.In such circumstances, we would need either to increase rates to levels that are seen as competitive or lose customers, in either casewith a negative impact to net interest income. Loss of customers could also harm noninterest income by decreasing fee-bearingtransaction volume. In addition, when rates are higher, customers tend to shift deposits from noninterest-bearing accounts to interest-bearing ones, thereby negatively impacting net interest income.
Our customers increasingly use third party financial applications that are expected to interface with their PNC accounts. This use leadsto the risk that issues with respect to the effective functioning of that interface, regardless of cause, could result in a loss of customersas they seek banking relationships that work better with these other applications.
News or other publicity that harms our reputation, or harms the reputation of our industry generally, also could cause a loss ofcustomers or a reduction in the extent to which customers do business with us. This is described further in the Risk Factor headed “Weare at risk for an adverse impact on our business due to damage to our reputation.”
In our asset management business, investment performance is an important factor influencing the level of assets that we manage. Poorinvestment advice or performance could hurt revenue and growth as existing clients might withdraw funds in favor of betterperforming products. Additionally, the ability to attract funds from existing and new clients might diminish. Overall economicconditions may limit the amount that customers are able or willing to invest as well as the value of the assets they do invest. Thefailure or negative performance of products of other financial institutions could lead to a loss of confidence in similar products offeredby us without regard to the performance of our products. Such a negative contagion could lead to withdrawals, redemptions andliquidity issues in such products and have an adverse impact on our assets under management and asset management revenues andearnings.
We are at risk for an adverse impact on our business due to damage to our reputation.
Our ability to compete effectively, to attract and retain customers and employees, and to grow our business is dependent onmaintaining our reputation and having the trust of our customers and employees. Many types of developments, if publicized, cannegatively impact a company’s reputation with adverse consequences to its business.
Financial services companies are highly vulnerable to reputational damage when they are found to have harmed customers,particularly retail customers, through conduct that is seen as illegal, unfair, deceptive, abusive, manipulative or otherwise wrongful.There also may be reputational damage from human error or systems failures viewed as having harmed customers but not involvingmisconduct, including negative perceptions regarding our ability to maintain the security of our technology systems and protect clientdata. The reputational impact is likely greater to the extent that the bad conduct, error or failure are pervasive, long-standing or affect asignificant number of customers, particularly retail consumers. The negative impact of such reputational damage on our business maybe disproportionate to the actual harm caused to customers. It may be severe even if we fully remediate any harm suffered by ourcustomers. Furthermore, because we conduct most of our businesses under the “PNC” brand, negative public opinion about onebusiness could also affect our other businesses. In addition, we could suffer reputational harm and a loss of customer trust as a resultof conduct of others in the industry even where we have not engaged in the conduct. We use third parties to help in many aspects ofour business, with the risk that their conduct can affect our reputation regardless of the degree to which we are responsible for it.
30 The PNC Financial Services Group, Inc. – 2020 Form 10-K
To an increasing extent, financial services companies, including PNC, are facing criticism from social and environmental activists,with accompanying reputational risk. Activists target companies in our industry, including PNC, for engaging in business with specificcustomers or with customers in particular industries, where the customers’ activities, even if legal, are perceived as having harmfulimpacts on matters such as environment, consumer health and safety, or society at large. In addition, other activists target companiesin our industry, including PNC, seeking increased transparency and action with respect to diversity and inclusion (including payequity) and political activities. Activist criticism has come in many forms, including protests at PNC facilities. PNC, together withmany other financial services companies, have in recent years been criticized for financing companies engaged in, for example,extraction and distribution of fossil fuels, manufacture of nuclear and other weapons (including personal firearms), private prisons, andborder control activities. Many of these issues are divisive without broad agreement as to the appropriate steps a company such asPNC should take and often with strong feelings on both sides. As a result, however we respond to such criticism, we expose ourselvesto the risks that current or potential customers decline to do business with us or current or potential employees refuse to work for us.This can be true regardless of whether we are perceived by some as not having done enough to address activist concerns or by othersas having inappropriately yielded to activist pressures. Activist pressure can also be a factor in decisions as to which businessopportunities and customers we pursue, potentially resulting in foregone profit opportunities. The OCC has requested comment on aproposed rule that would prohibit large national banks, such as PNC Bank, from declining to provide credit or other products orservices to customers engaged in lawful activities except for documented, pre-approved risk-related reasons. The rule, if adopted,could cause some customers to switch their business to other banks that are not subject to these restrictions or have other negativeconsequences on PNC’s businesses, operations and risk management activities.
The speed with which information now moves through social media and non-mainstream news sources on the internet means thatnegative information about PNC can rapidly have a broadly adverse impact on our reputation. This is true whether or not theinformation is accurate. Once information has gone viral, it can be hard to counter it effectively, either by correcting inaccuracies orcommunicating remedial steps taken for actual issues. The potential impact of negative information going viral means that materialreputational harm can result from a single discrete or isolated incident.
We are also subject to the risk of reputational harm resulting from conduct of persons identified as our employees but acting outside ofthe scope of their employment, including through their activities on personal social media.
We operate in a highly competitive environment in terms of the products and services we offer and the geographic markets inwhich we conduct business, as well as the labor markets where we compete for talented employees.
We are subject to intense competition both from other financial institutions and from non-bank entities, including financial technologycompanies (often referred to as FinTech). In many cases, non-bank entities can engage in many activities similar to ours without beingsubject to the same types of regulation, supervision and restrictions as are applicable to banks. The competition we face is described inItem 1 of this Report under “Competition.”
Consolidation in our industry, including among smaller banks combining to form more competitive larger ones and between banks andnon-bank entities, could result in PNC facing more intense competition, particularly in impacted regions or with respect to particularproducts.
Another increasingly competitive factor in the financial services industry is the ability to attract and retain talented and diverseemployees across many of our businesses and support areas. This factor presents greater risk when we are expanding into newmarkets, developing new product lines, or significantly enhancing staffing in certain areas, particularly technology. This competitionleads to increased expenses in affected business areas. In addition, the transition to increased work-from-home, which is likely tosurvive the COVID-19 pandemic for many companies, may exacerbate the challenges of attracting and retaining talented and diverseemployees as job markets may be less constrained by physical geography. Limitations on the manner in which regulated financialinstitutions can compensate their officers and employees, including those contained in pending rule proposals implementingrequirements of Dodd-Frank, may make it more difficult for regulated financial institutions, including PNC, to compete withunregulated companies for talent.
A failure to adequately address the competitive pressures we face could make it harder for us to attract and retain customers across ourbusinesses. On the other hand, meeting these competitive pressures could require us to incur significant additional expense or to acceptrisk beyond what we would otherwise view as desirable under the circumstances. In addition, in our interest rate sensitive businesses,competitive pressures to increase rates on deposits or decrease rates on loans could reduce our net interest margin, negativelyimpacting our net interest income.
Risks Related to Other Operational Issues
We depend on the effectiveness and integrity of employees, and the systems and controls for which they are responsible, to manageoperational risks.
We are a large company that offers a wide variety of products and services to a broad and diverse group of customers. We rely on ouremployees to design, manage, and operate our systems and controls to assure that we properly enter into, record and manage
The PNC Financial Services Group, Inc. – 2020 Form 10-K 31
processes, transactions and other relationships with customers, suppliers and other parties with whom we do business. In some cases,we rely on employees of third parties to perform these tasks. We also depend on employees and the systems and controls for whichthey are responsible to assure that we identify and mitigate the risks that are inherent in our relationships and activities. Theseconcerns are increased when we change processes or procedures, introduce new products or services, or implement new technologies,as we may fail to adequately identify or manage operational risks resulting from such changes.
As a result of our necessary reliance on employees, whether ours or those of third parties, to perform these tasks and manage resultingrisks, we are thus subject to human vulnerabilities. These range from innocent human error to misconduct or malfeasance, potentiallyleading to operational breakdowns or other failures. Our controls may not be adequate to prevent problems resulting from humaninvolvement in our business, including risks associated with the design, operation and monitoring of automated systems. We may alsofail to adequately develop a culture of risk management among our employees.
Errors by our employees or others responsible for systems and controls on which we depend and any resulting failures of thosesystems and controls could result in significant harm to PNC. This could include customer remediation costs, regulatory fines orpenalties, litigation or enforcement actions, or limitations on our business activities. We could also suffer damage to our reputation, asdescribed under “We are at risk for an adverse impact on our business due to damage to our reputation.”
We use automation, machine learning, artificial intelligence and robotic process automation tools to help reduce some risks of humanerror. Nonetheless, we continue to rely on many manual processes to conduct our business and manage our risks. In addition, use ofautomation tools does not eliminate the need for effective design and monitoring of their operation to make sure they operate asintended. Enhanced use of automation may present its own risks. These tools are dependent on the quality of the data used by the toolto learn and enhance the process for which it is responsible. Not only bad or missing data but also anomalous data can adversely affectthe functioning of such tools. It is possible that humans in some cases are better able than highly automated tools to identify thatanomalous data is being used or that results are themselves anomalous.
We rely on third party vendors, service providers and other counterparties to help support many aspects of our business. When wedo so, our direct control of activities related to our business is reduced, which could introduce risk.
Our use of third parties to support our business needs typically means that we do not directly control the activities we are having themperform. Risks can arise through greater complexity and inadequate performance by the third party, specifically where thatperformance could affect us or our customers. Many of the kinds of risks presented by activities performed by third parties aredescribed elsewhere in these Risk Factors. For example, we use outside companies to assist us in processing some confidentialcustomer or employee information. In such a case, a cyber attack on such a company may result in access to our customers’ oremployees’ information. We are also vulnerable, including to regulatory penalties, where an outside company fails to comply withlegal requirements relevant to its work on our behalf. We may in any such circumstance suffer financial losses, legal consequences andinjury to our reputation. Even if the other company makes us whole for financial losses, which is not necessarily the case, it is unlikelythat it would be able to restore any injury to our reputation. As a result, the use of third parties to assist in our business activitiesheightens the risks to us inherent in those activities.
Other Key Risks
We are at risk for the impact of adverse results in legal proceedings.
Many aspects of our business involve substantial risk of legal liability. We have been named or threatened to be named as defendantsin various lawsuits arising from our business activities. In addition, we are regularly the subject of governmental investigations andother forms of regulatory inquiry. We also are at risk when we have agreed to indemnify others for losses related to legal proceedingsthey face, such as in connection with the sale of a business or assets by us. The results of these legal proceedings could lead tosignificant monetary damages or penalties, restrictions on the way in which we conduct our business, or reputational harm.
Although we establish accruals for legal proceedings when information related to the loss contingencies represented by those mattersindicates both that a loss is probable and that the amount of loss can be reasonably estimated, we do not have accruals for all legalproceedings where we face a risk of loss. In addition, due to the inherent subjectivity of the assessments and unpredictability of theoutcome of legal proceedings, amounts accrued often do not represent the ultimate loss to us from the legal proceedings in question.Thus, our ultimate future losses may be higher, and possibly significantly so, than the amounts accrued for legal loss contingencies.We discuss further the unpredictability of legal proceedings and describe certain of our pending legal proceedings in Note 21 LegalProceedings in the Notes To Consolidated Financial Statements in Item 8 of this Report.
32 The PNC Financial Services Group, Inc. – 2020 Form 10-K
We grow our business in part by acquiring other financial services businesses from time to time. Sometimes these are businesseswith technologies or other assets valuable to us even if they do not themselves provide financial services to customers. Theseacquisitions present a number of risks and uncertainties related both to the acquisition transactions themselves and to theintegration of the acquired businesses into PNC after closing.
Acquisitions of other companies or of financial assets and related deposits and other liabilities present risks and uncertainties to us inaddition to those presented by the nature of the business acquired. These risks and uncertainties are found in the pending acquisition ofBBVA, including its U.S. banking subsidiary, BBVA USA, and its integration into PNC following closing.
Acquisitions may be substantially more expensive or take longer to complete than anticipated. This risk includes unanticipated costsincurred in connection with the integration of the acquired business. Anticipated benefits (such as cost savings from synergies orstrategic gains from being able to offer enhanced product sets) may take longer or require greater resources to achieve. In some cases,it may prove impossible to realize them in their entirety. The success of an acquisition generally is at least partially dependent on ourability to retain and expand upon the acquired company’s customer base. It is also frequently subject to risks related to human capital,including, if being retained, the quality of leadership of the acquired company.
Specific factors that can affect the ultimate results from acquisitions include, depending on the nature of the business acquired, thefollowing:
• If the acquisition includes loan portfolios, the extent of actual credit losses and the required allowance for credit lossesfollowing completion of the acquisition.
• If a significant aspect of the value of an acquired business is intellectual property, the extent to which the intellectualproperty may be protected and commercialized by PNC following the acquisition.
• If the acquisition involves entering into new businesses or geographic or other markets, potential limitations on our abilityto take advantage of these opportunities as a result of our inexperience with respect to them.
• The results of litigation and governmental investigations that may be pending at the time of the acquisition or be filed orcommenced thereafter, as a result of an acquisition or otherwise. It is often hard to predict the results of such legalproceedings. It may also be hard to anticipate what legal proceedings may be started following an acquisition based on theprior activities of the acquired company (and its predecessors).
• If the acquired company depends on models for, among other things, capital planning and credit loss accounting, we mayhave to rely on the acquired company’s models for a period of time post-closing prior to integrating the acquiredcompany’s data into PNC’s models. The acquired company’s models may be designed or implemented in a mannerdifferent than the models used by PNC. As a result, incorporation of the acquired company’s data into our models couldmaterially impact our results of operations or financial position to the extent that our estimates based on the acquiredcompany’s models prove to be inaccurate.
• The acquired company may operate under enterprise risk management systems, policies and procedures that are differentand less mature than those of PNC, and we may need to rely on the acquired company’s enterprise risk managementsystems policies and procedures for a period of time after acquisition, which might limit PNC’s ability to identify,monitor, manage and report risks for a period of time.
Our ability to analyze the risks presented by prospective acquisitions, as well as our ability to prepare in advance of closing forintegration, depends, in part, on the information we can gather with respect to the business we are acquiring. We may not have accessto all of the information that would be desirable. Our pre-acquisition review of the business also impacts our ability to prepare for andexecute on the integration of an acquired business. An acquired company’s financial and business information and data may not bemaintained at the level of detail or comprehensiveness to meet all of our post-acquisition needs.
Prospective acquisition targets are also subject to their own risks that we cannot manage or control prior to closing and that mayimpact their business, financial condition, results of operations and cash flows. As a result, our business, financial condition, results ofoperations and cash flows could be adversely affected after closing to the extent that any such risks result in non-indemnified lossesfor which we are responsible.
Completing attractive acquisition opportunities generally requires various governmental and regulatory approvals and consents prior toclosing. These authorities have broad discretion, and regulatory approvals could be delayed, restrictively conditioned or denied,including due to regulatory issues we (or the target company) have, or may have, under any of the numerous governmental regulationsto which we (or they) are subject. Moreover, as a condition to approval, governmental authorities may impose requirements, requiredivestitures or place restrictions on the conduct of the business of the combined company, which could limit the benefits of theacquisition or result in delay or the failure to close the acquisition. Significant acquisitions by large banks also often attract publicscrutiny, which may result in negative publicity that adversely affects our reputation. Our ability to make large acquisitions may benegatively impacted as well by changes in leadership at the regulatory agencies responsible for reviewing or approving the transaction,changes in regulatory rules or standards or the application of those rules or standards, or future regulatory initiatives designed to limitsystemic risk and the potential for a financial institution to become “too big to fail.”
The PNC Financial Services Group, Inc. – 2020 Form 10-K 33
Our business and financial performance could be adversely affected, directly or indirectly, by disasters, natural or otherwise, byterrorist activities, by international hostilities or by domestic civil unrest.
Neither the occurrence nor the potential impact of disasters (whether caused naturally or by human conduct), pandemics, terroristactivities, international hostilities and domestic civil unrest can be predicted. However, these occurrences could adversely impact us,for example, by causing significant damage to our facilities or preventing us from conducting our business in the ordinary course.Also, their impact on our borrowers, depositors, other customers, suppliers or other counterparties could result in indirect adverseeffects on us. Other indirect adverse consequences from disasters, pandemics, terrorist activities, international hostilities or domesticcivil unrest could result from impacts to the financial markets, the economy in general or in any particular region, or key parts of theinfrastructure (such as the power grid) on which we and our customers rely. These types of indirect effects, whether specific to ourcounterparties or more generally applicable, could lead, for example, to an increase in delinquencies, bankruptcies or defaults thatcould result in our experiencing higher levels of nonperforming assets, net charge-offs and provisions for credit losses. They couldalso cause a reduction in demand for lending or other services that we provide. To the extent that climate change increases thefrequency or severity of adverse weather conditions, the impact from these types of natural disasters on us or our customers would beworse. The specific risks associated with the COVID-19 pandemic are discussed in the Risk Factor headed “The COVID-19 pandemichas had and is likely to continue to have an adverse effect, possibly materially, on our overall business and financial performance.”
Our ability to mitigate the adverse consequences of such occurrences is in part dependent on the quality of our resiliency planning.This includes our ability to anticipate the nature of any such event that might occur. The adverse impact of disasters, pandemics,terrorist activities, international hostilities or domestic civil unrest also could be increased to the extent that there is a lack ofpreparedness on the part of national or regional emergency responders or on the part of other organizations and businesses that we dealwith, many of which we depend on but have limited or no control over.
ITEM 1B – UNRESOLVED STAFF COMMENTS
There are no SEC staff comments regarding PNC’s periodic or current reports under the Exchange Act that are pending resolution.
ITEM 2 – PROPERTIES
Our executive and primary administrative offices are currently located at The Tower at PNC Plaza, Pittsburgh, Pennsylvania. The 33-story structure is owned by PNC Bank, National Association.
We own or lease numerous other premises for use in conducting business activities, including operations centers, offices, and branchesand other facilities. We consider the facilities owned or occupied under lease by our subsidiaries to be adequate for the purposes of ourbusiness operations. We include here by reference the additional information regarding our properties in Note 7 Leases and Note 8Premises, Equipment and Leasehold Improvements in the Notes To Consolidated Financial Statements in Item 8 of this Report.
ITEM 3 – LEGAL PROCEEDINGS
See the information set forth in Note 21 Legal Proceedings in the Notes To Consolidated Financial Statements in Item 8 of this Report,which is incorporated here by reference.
ITEM 4 – MINE SAFETY DISCLOSURES
Not applicable
34 The PNC Financial Services Group, Inc. – 2020 Form 10-K
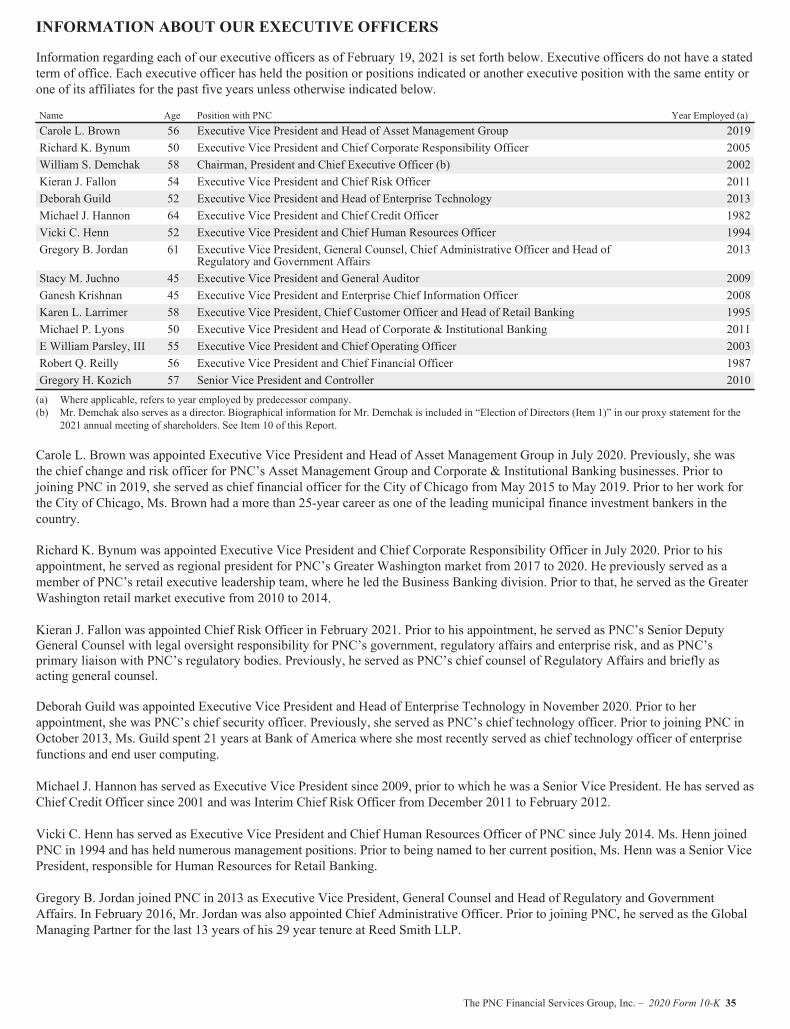
INFORMATION ABOUT OUR EXECUTIVE OFFICERS
Information regarding each of our executive officers as of February 19, 2021 is set forth below. Executive officers do not have a statedterm of office. Each executive officer has held the position or positions indicated or another executive position with the same entity orone of its affiliates for the past five years unless otherwise indicated below.
Name Age Position with PNC Year Employed (a)Carole L. Brown 56 Executive Vice President and Head of Asset Management Group 2019Richard K. Bynum 50 Executive Vice President and Chief Corporate Responsibility Officer 2005William S. Demchak 58 Chairman, President and Chief Executive Officer (b) 2002Kieran J. Fallon 54 Executive Vice President and Chief Risk Officer 2011Deborah Guild 52 Executive Vice President and Head of Enterprise Technology 2013Michael J. Hannon 64 Executive Vice President and Chief Credit Officer 1982Vicki C. Henn 52 Executive Vice President and Chief Human Resources Officer 1994Gregory B. Jordan 61 Executive Vice President, General Counsel, Chief Administrative Officer and Head of
Regulatory and Government Affairs2013
Stacy M. Juchno 45 Executive Vice President and General Auditor 2009Ganesh Krishnan 45 Executive Vice President and Enterprise Chief Information Officer 2008Karen L. Larrimer 58 Executive Vice President, Chief Customer Officer and Head of Retail Banking 1995Michael P. Lyons 50 Executive Vice President and Head of Corporate & Institutional Banking 2011E William Parsley, III 55 Executive Vice President and Chief Operating Officer 2003Robert Q. Reilly 56 Executive Vice President and Chief Financial Officer 1987Gregory H. Kozich 57 Senior Vice President and Controller 2010(a) Where applicable, refers to year employed by predecessor company.(b) Mr. Demchak also serves as a director. Biographical information for Mr. Demchak is included in “Election of Directors (Item 1)” in our proxy statement for the
2021 annual meeting of shareholders. See Item 10 of this Report.
Carole L. Brown was appointed Executive Vice President and Head of Asset Management Group in July 2020. Previously, she wasthe chief change and risk officer for PNC’s Asset Management Group and Corporate & Institutional Banking businesses. Prior tojoining PNC in 2019, she served as chief financial officer for the City of Chicago from May 2015 to May 2019. Prior to her work forthe City of Chicago, Ms. Brown had a more than 25-year career as one of the leading municipal finance investment bankers in thecountry.
Richard K. Bynum was appointed Executive Vice President and Chief Corporate Responsibility Officer in July 2020. Prior to hisappointment, he served as regional president for PNC’s Greater Washington market from 2017 to 2020. He previously served as amember of PNC’s retail executive leadership team, where he led the Business Banking division. Prior to that, he served as the GreaterWashington retail market executive from 2010 to 2014.
Kieran J. Fallon was appointed Chief Risk Officer in February 2021. Prior to his appointment, he served as PNC’s Senior DeputyGeneral Counsel with legal oversight responsibility for PNC’s government, regulatory affairs and enterprise risk, and as PNC’sprimary liaison with PNC’s regulatory bodies. Previously, he served as PNC’s chief counsel of Regulatory Affairs and briefly asacting general counsel.
Deborah Guild was appointed Executive Vice President and Head of Enterprise Technology in November 2020. Prior to herappointment, she was PNC’s chief security officer. Previously, she served as PNC’s chief technology officer. Prior to joining PNC inOctober 2013, Ms. Guild spent 21 years at Bank of America where she most recently served as chief technology officer of enterprisefunctions and end user computing.
Michael J. Hannon has served as Executive Vice President since 2009, prior to which he was a Senior Vice President. He has served asChief Credit Officer since 2001 and was Interim Chief Risk Officer from December 2011 to February 2012.
Vicki C. Henn has served as Executive Vice President and Chief Human Resources Officer of PNC since July 2014. Ms. Henn joinedPNC in 1994 and has held numerous management positions. Prior to being named to her current position, Ms. Henn was a Senior VicePresident, responsible for Human Resources for Retail Banking.
Gregory B. Jordan joined PNC in 2013 as Executive Vice President, General Counsel and Head of Regulatory and GovernmentAffairs. In February 2016, Mr. Jordan was also appointed Chief Administrative Officer. Prior to joining PNC, he served as the GlobalManaging Partner for the last 13 years of his 29 year tenure at Reed Smith LLP.
The PNC Financial Services Group, Inc. – 2020 Form 10-K 35
Stacy M. Juchno has served as Executive Vice President and General Auditor of PNC since April 2014 and previously served asSenior Vice President and Finance Governance and Oversight Director.
Ganesh Krishnan was appointed Executive Vice President and Enterprise Chief Information Officer in November 2020. Prior to beingnamed to his current role, he was chief information officer for PNC’s Corporate & Institutional Banking business and Staff ServiceTechnology starting in 2017. Mr. Krishnan joined PNC in 2008 as a Technology Infrastructure Services manager and has held avariety of technology leadership roles with PNC.
Karen L. Larrimer was appointed Executive Vice President in 2013 and became head of Retail Banking in 2016. She has also servedas Chief Customer Officer since April 2014, prior to which she served as Chief Marketing Officer.
Michael P. Lyons has been an Executive Vice President since 2011 and is head of Corporate & Institutional Banking. Prior to joiningPNC in October 2011, from May 2010 until October 2011, Mr. Lyons was head of corporate development and strategic planning forBank of America.
E William Parsley, III has served as Executive Vice President since 2009 and was appointed Chief Operating Officer in February2018. Previously, he served as Treasurer and Chief Investment Officer starting in 2004 and head of Consumer Lending starting in thespring of 2016.
Robert Q. Reilly was appointed Chief Financial Officer in 2013. He served as the head of PNC’s Asset Management Group from 2005until April 2013. Previously, he held numerous management roles in both Corporate Banking and Asset Management. He wasappointed Executive Vice President in 2009.
Gregory H. Kozich has served as Controller of PNC since 2011. He was appointed as Senior Vice President in 2010. Prior to joiningPNC in 2010, Mr. Kozich was with the Federal National Mortgage Association from 2005 until late 2010, most recently serving as itscorporate controller.
PART II
ITEM 5 – MARKET FOR REGISTRANT’S COMMON EQUITY, RELATED STOCKHOLDERMATTERS AND ISSUER PURCHASES OF EQUITY SECURITIES
Our common stock is listed on the New York Stock Exchange and is traded under the symbol “PNC.” At the close of business onFebruary 12, 2021, there were 49,295 common shareholders of record.
Holders of PNC common stock are entitled to receive dividends when declared by our Board of Directors out of funds legallyavailable for this purpose. Our Board of Directors may not pay or set apart dividends on the common stock until dividends for all pastdividend periods on any series of outstanding preferred stock and certain outstanding capital securities issued by the parent companyhave been paid or declared and set apart for payment. The Board of Directors presently intends to continue the policy of payingquarterly cash dividends. The amount of any future dividends will depend on economic and market conditions, our financial conditionand operating results, and other factors, including contractual restrictions and applicable government regulations and policies (such asthose relating to the ability of bank and non-bank subsidiaries to pay dividends to the parent company and regulatory capitallimitations). PNC’s ability to pay or increase dividends or otherwise return capital to shareholders is subject to PNC’s compliance withits SCB, which is determined at least annually through the Federal Reserve’s CCAR process as described in the Supervision andRegulation section in Item 1 of this Report. The Federal Reserve also has imposed additional limitations on capital distributionsthrough the first quarter of 2021 by CCAR participating bank holding companies (including PNC) and may extend these limitations,potentially in modified form. PNC announced on March 16, 2020 a temporary suspension of our common stock repurchase program inconjunction with the Federal Reserve's effort to support the U.S. economy during the pandemic and we continued the suspensionthrough the fourth quarter of 2020, with the exception of employee benefit-related purchases in the third quarter. In 2021, our plan isto refrain from share repurchases, excluding employee benefit-related purchases, during the period leading up to our pending BBVAtransaction close date.
For further information concerning dividend restrictions and other factors that could limit our ability to pay dividends, as well asrestrictions on loans, dividends or advances from bank subsidiaries to the parent company, see the Supervision and Regulation sectionin Item 1, Item 1A Risk Factors, the Liquidity and Capital Management portion of the Risk Management section in Item 7, and Note10 Borrowed Funds, Note 12 Equity and Note 20 Regulatory Matters in the Notes To Consolidated Financial Statements in Item 8 ofthis Report, which we include here by reference.
36 The PNC Financial Services Group, Inc. – 2020 Form 10-K

We include here by reference the information regarding our compensation plans under which PNC equity securities are authorized forissuance as of December 31, 2020 in the table (with introductory paragraph and notes) in Item 12 of this Report.
Our stock transfer agent and registrar is:Computershare462 South 4th Street, Suite 1600Louisville, KY 40202800-982-7652www.computershare.com/pnc
Registered shareholders may contact Computershare regarding dividends and other shareholder services.
We include here by reference the information that appears under the Common Stock Performance Graph caption at the end of thisItem 5.
Unregistered Sales of Equity Securities
None.
Equity Security Repurchases
Details of our repurchases of PNC common stock during the fourth quarter of 2020 are included in the following table:
In thousands, except per share data
2020 period Total shares purchased (a)Average pricepaid per share
Total shares purchased as part ofpublicly announced programs (b)
Maximum number of shares that may yet bepurchased under the programs (b)
October 1 – 31 9 $ 111.63 75,109November 1 – 30 75,109December 1 – 31 75,109Total 9 $ 111.63
(a) Includes PNC common stock purchased in connection with our various employee benefit plans generally related to forfeitures of unvested restricted stock awards and sharesused to cover employee payroll tax withholding requirements. Note 17 Employee Benefit Plans and Note 18 Stock Based Compensation Plans in the Notes To ConsolidatedFinancial Statements in Item 8 of this Report include additional information regarding our employee benefit and equity compensation plans that use PNC common stock.
(b) On April 4, 2019, our Board of Directors approved the establishment of a new stock repurchase program authorization in the amount of 100 million shares of PNC commonstock, effective July 1, 2019. Under this authorization, repurchases may be made in open market or privately negotiated transactions, with the timing and exact amount ofcommon stock repurchases depending on a number of factors including, among others, market and general economic conditions, regulatory capital considerations, alternativeuses of capital, the potential impact on our credit ratings, and contractual and regulatory limitations, including the results of the supervisory assessment of capital adequacyand capital planning processes undertaken by the Federal Reserve as part of the CCAR process. In June 2019, we announced share repurchase programs of up to $4.3 billionfor the four quarter period beginning with the third quarter of 2019, in accordance with PNC’s 2019 capital plan. In January 2020, we announced an increase to theseprograms to repurchase up to an additional $1.0 billion in common shares through the end of the second quarter of 2020. PNC announced on March 16, 2020 a temporarysuspension of our common stock repurchase program in conjunction with the Federal Reserve’s effort to support the U.S. economy during the pandemic. We continued thesuspension through the fourth quarter of 2020, with the exception of employee benefit-related purchases in the third quarter, consistent with the extension of the FederalReserve’s special capital distribution restrictions. Under these programs we repurchased 11.0 million shares in 2020 and 25.9 million shares in 2019. A maximum amount of75.1 million shares remained available for repurchase under the new stock program authorization at December 31, 2020. In 2021, our plan is to refrain from sharerepurchases, excluding employee benefit-related purchases, during the period leading up to our pending BBVA transaction close date.
The PNC Financial Services Group, Inc. – 2020 Form 10-K 37
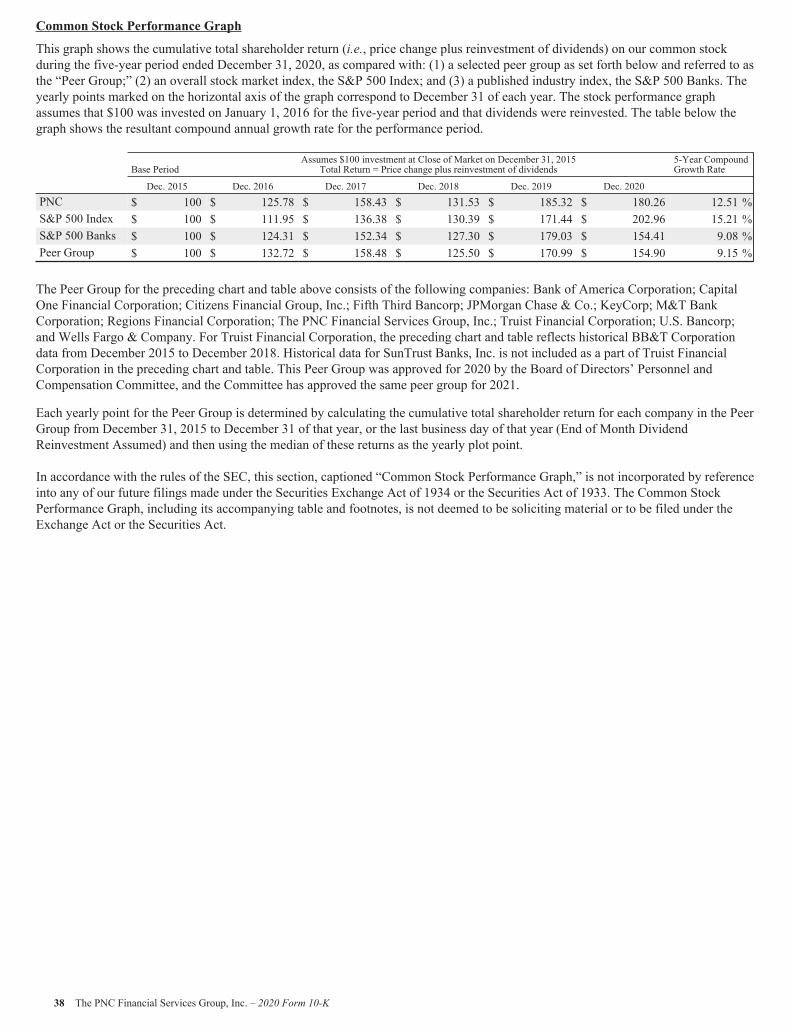
Common Stock Performance Graph
This graph shows the cumulative total shareholder return (i.e., price change plus reinvestment of dividends) on our common stockduring the five-year period ended December 31, 2020, as compared with: (1) a selected peer group as set forth below and referred to asthe “Peer Group;” (2) an overall stock market index, the S&P 500 Index; and (3) a published industry index, the S&P 500 Banks. Theyearly points marked on the horizontal axis of the graph correspond to December 31 of each year. The stock performance graphassumes that $100 was invested on January 1, 2016 for the five-year period and that dividends were reinvested. The table below thegraph shows the resultant compound annual growth rate for the performance period.
Base PeriodAssumes $100 investment at Close of Market on December 31, 2015
Total Return = Price change plus reinvestment of dividends5-Year CompoundGrowth Rate
Dec. 2015 Dec. 2016 Dec. 2017 Dec. 2018 Dec. 2019 Dec. 2020PNC $ 100 $ 125.78 $ 158.43 $ 131.53 $ 185.32 $ 180.26 12.51 %S&P 500 Index $ 100 $ 111.95 $ 136.38 $ 130.39 $ 171.44 $ 202.96 15.21 %S&P 500 Banks $ 100 $ 124.31 $ 152.34 $ 127.30 $ 179.03 $ 154.41 9.08 %Peer Group $ 100 $ 132.72 $ 158.48 $ 125.50 $ 170.99 $ 154.90 9.15 %
The Peer Group for the preceding chart and table above consists of the following companies: Bank of America Corporation; CapitalOne Financial Corporation; Citizens Financial Group, Inc.; Fifth Third Bancorp; JPMorgan Chase & Co.; KeyCorp; M&T BankCorporation; Regions Financial Corporation; The PNC Financial Services Group, Inc.; Truist Financial Corporation; U.S. Bancorp;and Wells Fargo & Company. For Truist Financial Corporation, the preceding chart and table reflects historical BB&T Corporationdata from December 2015 to December 2018. Historical data for SunTrust Banks, Inc. is not included as a part of Truist FinancialCorporation in the preceding chart and table. This Peer Group was approved for 2020 by the Board of Directors’ Personnel andCompensation Committee, and the Committee has approved the same peer group for 2021.
Each yearly point for the Peer Group is determined by calculating the cumulative total shareholder return for each company in the PeerGroup from December 31, 2015 to December 31 of that year, or the last business day of that year (End of Month DividendReinvestment Assumed) and then using the median of these returns as the yearly plot point.
In accordance with the rules of the SEC, this section, captioned “Common Stock Performance Graph,” is not incorporated by referenceinto any of our future filings made under the Securities Exchange Act of 1934 or the Securities Act of 1933. The Common StockPerformance Graph, including its accompanying table and footnotes, is not deemed to be soliciting material or to be filed under theExchange Act or the Securities Act.
38 The PNC Financial Services Group, Inc. – 2020 Form 10-K
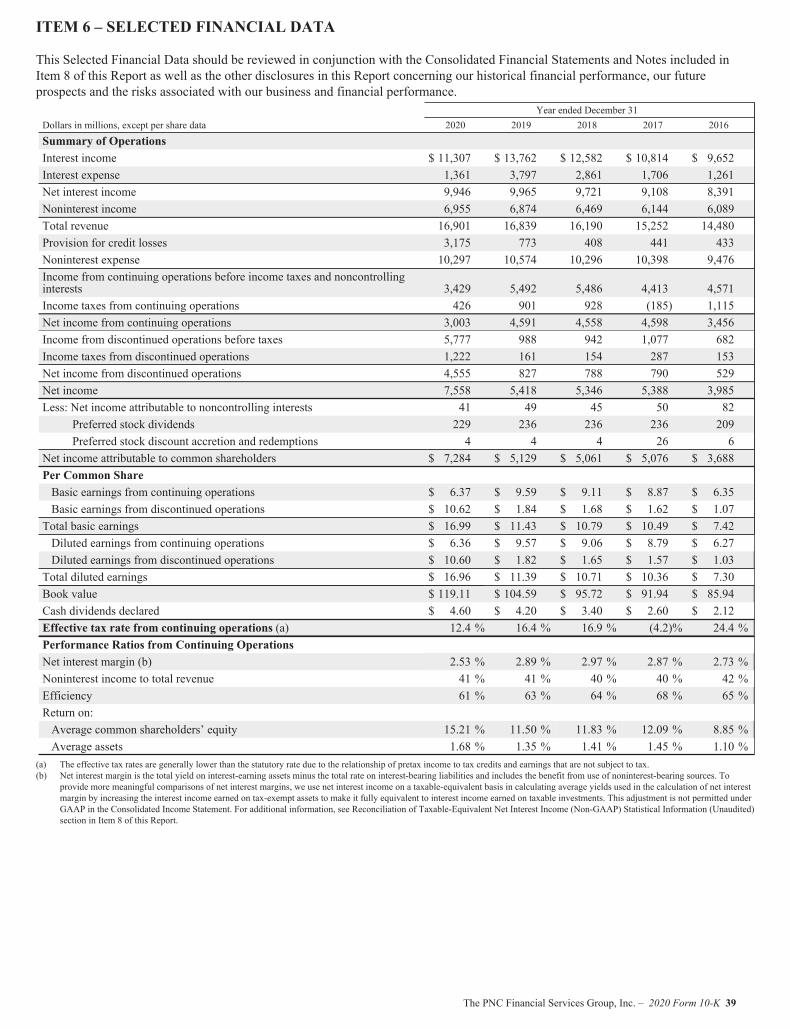
ITEM 6 – SELECTED FINANCIAL DATA
This Selected Financial Data should be reviewed in conjunction with the Consolidated Financial Statements and Notes included inItem 8 of this Report as well as the other disclosures in this Report concerning our historical financial performance, our futureprospects and the risks associated with our business and financial performance.
Year ended December 31Dollars in millions, except per share data 2020 2019 2018 2017 2016
Summary of OperationsInterest income $ 11,307 $ 13,762 $ 12,582 $ 10,814 $ 9,652Interest expense 1,361 3,797 2,861 1,706 1,261Net interest income 9,946 9,965 9,721 9,108 8,391Noninterest income 6,955 6,874 6,469 6,144 6,089Total revenue 16,901 16,839 16,190 15,252 14,480Provision for credit losses 3,175 773 408 441 433Noninterest expense 10,297 10,574 10,296 10,398 9,476Income from continuing operations before income taxes and noncontrollinginterests 3,429 5,492 5,486 4,413 4,571Income taxes from continuing operations 426 901 928 (185) 1,115Net income from continuing operations 3,003 4,591 4,558 4,598 3,456Income from discontinued operations before taxes 5,777 988 942 1,077 682Income taxes from discontinued operations 1,222 161 154 287 153Net income from discontinued operations 4,555 827 788 790 529Net income 7,558 5,418 5,346 5,388 3,985Less: Net income attributable to noncontrolling interests 41 49 45 50 82
Preferred stock dividends 229 236 236 236 209Preferred stock discount accretion and redemptions 4 4 4 26 6
Net income attributable to common shareholders $ 7,284 $ 5,129 $ 5,061 $ 5,076 $ 3,688Per Common ShareBasic earnings from continuing operations $ 6.37 $ 9.59 $ 9.11 $ 8.87 $ 6.35Basic earnings from discontinued operations $ 10.62 $ 1.84 $ 1.68 $ 1.62 $ 1.07Total basic earnings $ 16.99 $ 11.43 $ 10.79 $ 10.49 $ 7.42Diluted earnings from continuing operations $ 6.36 $ 9.57 $ 9.06 $ 8.79 $ 6.27Diluted earnings from discontinued operations $ 10.60 $ 1.82 $ 1.65 $ 1.57 $ 1.03Total diluted earnings $ 16.96 $ 11.39 $ 10.71 $ 10.36 $ 7.30Book value $ 119.11 $ 104.59 $ 95.72 $ 91.94 $ 85.94Cash dividends declared $ 4.60 $ 4.20 $ 3.40 $ 2.60 $ 2.12Effective tax rate from continuing operations (a) 12.4 % 16.4 % 16.9 % (4.2)% 24.4 %Performance Ratios from Continuing OperationsNet interest margin (b) 2.53 % 2.89 % 2.97 % 2.87 % 2.73 %Noninterest income to total revenue 41 % 41 % 40 % 40 % 42 %Efficiency 61 % 63 % 64 % 68 % 65 %Return on:Average common shareholders’ equity 15.21 % 11.50 % 11.83 % 12.09 % 8.85 %Average assets 1.68 % 1.35 % 1.41 % 1.45 % 1.10 %
(a) The effective tax rates are generally lower than the statutory rate due to the relationship of pretax income to tax credits and earnings that are not subject to tax.(b) Net interest margin is the total yield on interest-earning assets minus the total rate on interest-bearing liabilities and includes the benefit from use of noninterest-bearing sources. To
provide more meaningful comparisons of net interest margins, we use net interest income on a taxable-equivalent basis in calculating average yields used in the calculation of net interestmargin by increasing the interest income earned on tax-exempt assets to make it fully equivalent to interest income earned on taxable investments. This adjustment is not permitted underGAAP in the Consolidated Income Statement. For additional information, see Reconciliation of Taxable-Equivalent Net Interest Income (Non-GAAP) Statistical Information (Unaudited)section in Item 8 of this Report.
The PNC Financial Services Group, Inc. – 2020 Form 10-K 39

Year ended December 31
Dollars in millions, except as noted 2020 2019 2018 2017 2016
Balance Sheet HighlightsAssets $466,679 $410,295 $382,315 $380,768 $366,380Loans $241,928 $239,843 $226,245 $220,458 $210,833Allowance for loan and lease losses (a) $ 5,361 $ 2,742 $ 2,629 $ 2,611 $ 2,589Interest-earning deposits with banks (b) $ 85,173 $ 23,413 $ 10,893 $ 28,595 $ 25,711Investment securities $ 88,799 $ 86,824 $ 82,701 $ 76,131 $ 75,947Loans held for sale $ 1,597 $ 1,083 $ 994 $ 2,655 $ 2,504Equity investments $ 6,052 $ 5,176 $ 4,878 $ 3,816 $ 3,842Asset held for sale (c) $ 8,558 $ 8,016 $ 7,576 $ 6,886Mortgage servicing rights $ 1,242 $ 1,644 $ 1,983 $ 1,832 $ 1,758Goodwill $ 9,233 $ 9,233 $ 9,218 $ 9,173 $ 9,103Other assets $ 30,999 $ 32,202 $ 34,408 $ 27,894 $ 27,506Noninterest-bearing deposits $112,637 $ 72,779 $ 73,960 $ 79,864 $ 80,230Interest-bearing deposits $252,708 $215,761 $193,879 $185,189 $176,934Total deposits $365,345 $288,540 $267,839 $265,053 $257,164Borrowed funds (d) $ 37,195 $ 60,263 $ 57,419 $ 59,088 $ 52,706Allowance for unfunded lending related commitments (a) $ 584 $ 318 $ 285 $ 297 $ 301Total shareholders’ equity $ 54,010 $ 49,314 $ 47,728 $ 47,513 $ 45,699Common shareholders’ equity $ 50,493 $ 45,321 $ 43,742 $ 43,530 $ 41,723Accumulated other comprehensive income (loss) $ 2,770 $ 799 $ (725) $ (148) $ (265)Period-end common shares outstanding (millions) 424 433 457 473 485Loans to deposits 66 % 83 % 84 % 83 % 82 %Client Assets (billions)Discretionary client assets under management $ 170 $ 154 $ 148 $ 151 $ 137Nondiscretionary client assets under administration 154 143 124 131 120Total client assets under administration 324 297 272 282 257Brokerage account client assets 59 54 47 49 44Total $ 383 $ 351 $ 319 $ 331 $ 301Capital Ratios (e) (f)Basel IIICommon equity Tier 1 12.2 % 9.5 % 9.6 % 9.8 % 10.0 %Common equity Tier 1 fully implemented (g) 11.8 % N/A N/A N/A N/ATier 1 risk-based 13.2 % 10.7 % 10.8 % N/A N/ATotal capital risk-based (h) 15.6 % 12.7 % 13.0 % N/A N/ALeverage 9.5 % 9.1 % 9.4 % 9.6 % 9.8 %Supplementary leverage 9.9 % 7.6 % 7.8 % 8.0 % 8.3 %
Other Selected Ratios
Dividend payout 27.2 % 36.7 % 31.5 % 24.7 % 29.0 %
Common shareholders’ equity to total assets 10.8 % 11.0 % 11.4 % 11.4 % 11.4 %Average common shareholders’ equity to average assets 10.7 % 11.1 % 11.3 % 11.3 % 11.5 %Selected StatisticsEmployees 51,257 51,918 53,063 52,906 52,006Retail Banking branches 2,162 2,296 2,372 2,459 2,520ATMs 8,900 9,091 9,162 9,051 9,024(a) Amounts at December 31, 2020 reflect the impact of adopting ASU 2016-13, Financial Instruments - Credit Losses, which is commonly referred to as the CECL standard and our
transition from an incurred loss methodology for these reserves to an expected credit loss methodology. Refer to Note 1 Accounting Policies in the Notes To Consolidated FinancialStatements in Item 8 of this Report for additional detail on the adoption of this standard.
(b) Includes balances held with the Federal Reserve Bank of Cleveland of $84.9 billion, $23.2 billion, $10.5 billion, $28.3 billion and $25.1 billion as of December 31, 2020, 2019, 2018,2017 and 2016, respectively.
(c) Represents our held for sale investment in BlackRock. In the second quarter of 2020, PNC divested its entire investment in BlackRock. Prior period BlackRock investment balances havebeen reclassified to the Asset held for sale line in accordance with ASC 205-20, Presentation of Financial Statements - Discontinued Operations. Refer to Note 1 Accounting Policies andNote 2 Acquisition and Divestiture Activity in the Notes To Consolidated Financial Statements in Item 8 of this Report for additional details.
(d) Includes long-term borrowings of $29.3 billion, $33.2 billion, $37.4 billion, $43.1 billion and $38.3 billion for 2020, 2019, 2018, 2017 and 2016, respectively. Borrowings which maturemore than one year after December 31, 2020 are considered to be long-term.
(e) See capital ratios discussion in the Supervision and Regulation section of Item 1 and in the Liquidity and Capital Management portion of the Risk Management section in Item 7 of thisReport for additional discussion of these capital ratios.
(f) All ratios are calculated using the regulatory capital methodology applicable to PNC during each period presented, except for the 2016 and 2017 Basel III Common equity Tier 1 ratios,which are fully phased-in Basel III ratios and are presented as pro forma estimates. Ratios for all periods were calculated based on the standardized approach. Additional information on
40 The PNC Financial Services Group, Inc. – 2020 Form 10-K
the 2016 and 2017 fully phased-in ratios is included in the Transitional Basel III and Fully Phased-In Basel III Common Equity Tier 1 Capital Ratios (Non-GAAP) Statistical Information(Unaudited) section in Item 8 of this Report.
(g) The 2020 fully implemented CET1 ratio is calculated to reflect the full impact of CECL and excludes the benefits of the five-year transition provision.(h) The 2020, 2019 and 2018 Basel III Total capital risk-based ratios include nonqualifying trust preferred capital securities of $40 million, $60 million, and $80 million, respectively, that
are subject to a phase-out period that runs through 2021.
ITEM 7 – MANAGEMENT’S DISCUSSION AND ANALYSIS OF FINANCIAL CONDITION ANDRESULTS OF OPERATIONS (MD&A)
EXECUTIVE SUMMARY
Key Strategic Goals
At PNC we manage our company for the long term. We are focused on the fundamentals of growing customers, loans, deposits andrevenue and improving profitability, while investing for the future and managing risk, expenses and capital. We continue to invest inour products, markets and brand, and embrace our commitments to our customers, shareholders, employees and the communitieswhere we do business.
We strive to serve our customers and expand and deepen relationships by offering a broad range of deposit, credit and fee-basedproducts and services. We are focused on delivering those products and services to our customers with the goal of addressing theirfinancial objectives and putting customers’ needs first. Our business model is built on customer loyalty and engagement,understanding our customers’ financial goals and offering our diverse products and services to help them achieve financial well-being.Our approach is concentrated on organically growing and deepening client relationships across our businesses that meet our risk/returnmeasures.
We are focused on our strategic priorities, which are designed to enhance value over the long term, and consist of:• Expanding our leading banking franchise to new markets and digital platforms,• Deepening customer relationships by delivering a superior banking experience and financial solutions, and• Leveraging technology to innovate and enhance products, services, security and processes.
Our capital priorities are to support customers and business investment, maintain appropriate capital in light of economic conditions,the Basel III framework and other regulatory expectations, and return excess capital to shareholders. For more detail, see theSupervision and Regulation section in Item 1 Business, the Capital Highlights portion of this Executive Summary and the Liquidityand Capital Management portion of the Risk Management section in this Item 7.
Key Factors Affecting Financial Performance
We face a variety of risks that may impact various aspects of our risk profile from time to time. The extent of such impacts may varydepending on factors such as the current business and economic conditions, political and regulatory environment and operationalchallenges. Many of these risks and our risk management strategies are described in more detail elsewhere in this Report.
Our success will depend upon, among other things, the following factors that we manage or control:• Effectively managing capital and liquidity including:
• Continuing to maintain and grow our deposit base as a low-cost stable funding source,• Prudent liquidity and capital management to meet evolving regulatory capital, capital planning, stress testing and
liquidity standards, and• Actions we take within the capital and other financial markets.
• Execution of our strategic priorities,• Management of credit risk in our portfolio,• Our ability to manage and implement strategic business objectives within the changing regulatory environment,• The impact of legal and regulatory-related contingencies,• The appropriateness of reserves needed for critical accounting estimates and related contingencies, and• The closing of the pending BBVA acquisition and integration of its business into PNC after closing.
Our financial performance is also substantially affected by a number of external factors outside of our control, including the following:• Global and domestic economic conditions, including the length and extent of the economic impacts of the pandemic,• The actions by the Federal Reserve, U.S. Treasury and other government agencies, including those that impact money supply
and market interest rates,• The level of, and direction, timing and magnitude of movement in, interest rates and the shape of the interest rate yield curve,• The functioning and other performance of, and availability of liquidity in, U.S. and global financial markets, including capital
markets,• The impact of tariffs and other trade policies of the U.S. and its global trading partners,
The PNC Financial Services Group, Inc. – 2020 Form 10-K 41
• Changes in the competitive and regulatory landscape,• The impact of the results of the recent U.S. elections on the regulatory landscape, capital markets, and the response to and
management of the pandemic,• The impact of market credit spreads on asset valuations,• The ability of customers, counterparties and issuers to perform in accordance with contractual terms, and the resulting impact
on our asset quality,• Loan demand, utilization of credit commitments and standby letters of credit, and• The impact on customers and changes in customer behavior due to changing business and economic conditions or regulatory
or legislative initiatives.
For additional information on the risks we face, see the Cautionary Statement Regarding Forward-Looking Information section in thisItem 7 and Item 1A Risk Factors in this Report.
Second Quarter Sale of Equity Investment in BlackRock, Inc.
In the second quarter of 2020, PNC divested its entire 22.4% equity investment in BlackRock. Net proceeds from the sale were $14.2billion. The after-tax gain on the sale of $4.3 billion, and donation expense and BlackRock’s historical results for all periods presented,are reported as discontinued operations. For additional details on the divestiture of our equity investment in BlackRock, see Note 2Acquisition and Divestiture Activity in the Notes to Consolidated Financial Statements in Item 8 of this Report.
Pending Acquisition of BBVA USA Bancshares, Inc.
On November 16, 2020 PNC announced a definitive agreement to acquire BBVA, including its U.S. banking subsidiary BBVA USA,from the Spanish financial group BBVA, S.A for a fixed purchase price of $11.6 billion in cash. BBVA USA operates over 600branches in Texas, Alabama, Arizona, California, Florida, Colorado and New Mexico. The transaction is expected to close in mid-2021and add approximately $102 billion in total assets, $86 billion of deposits and $66 billion of loans, creating the fifth largest bank byassets and a PNC presence in 29 of the 30 largest markets in the U.S. See Note 2 Acquisition and Divestiture Activity in the Notes toConsolidated Financial Statements in Item 8 of this Report for details on the pending acquisition.
Income Statement Highlights
Net income from continuing operations for 2020 was $3.0 billion, or $6.36 per diluted common share, a decrease of 35% compared tonet income from continuing operations of $4.6 billion, or $9.57 per diluted common share, for 2019.
• Total revenue increased $62 million to $16.9 billion.• Net interest income decreased $19 million to $9.9 billion.
• Net interest margin decreased to 2.53% for 2020 compared to 2.89% for 2019.• Noninterest income increased $81 million, or 1%, to $7.0 billion.
• Provision for credit losses of $3.2 billion in 2020, calculated under the CECL accounting standard adopted January 1, 2020,increased $2.4 billion compared to $0.8 billion for 2019, reflecting changes due to the adoption of CECL, together with thesignificantly adverse economic impacts of the pandemic and its resulting effects on loan portfolio credit quality and loangrowth.
• Noninterest expense decreased $277 million, or 3%, to $10.3 billion.• We generated positive operating leverage in 2020 of 3%.
For additional detail, see the Consolidated Income Statement Review section of this Item 7.
Balance Sheet Highlights
Our balance sheet was strong and well positioned at December 31, 2020 and 2019. In comparison to December 31, 2019:• Total assets increased $56.4 billion, or 14%, to $466.7 billion.• Total loans increased $2.1 billion, or 1%, to $241.9 billion.
• Total commercial loans grew $6.6 billion, or 4%, to $167.2 billion.• Total consumer loans decreased $4.5 billion, or 6%, to $74.7 billion.
• Investment securities increased $2.0 billion, or 2%, to $88.8 billion.• Interest earning deposits with banks, primarily with the Federal Reserve Bank, increased $61.8 billion to $85.2 billion due to
higher liquidity from deposit growth and proceeds from the sale of our equity investment in BlackRock.• Total deposits increased $76.8 billion, or 27%, to $365.3 billion, due to growth in commercial deposits reflecting pandemic-
related accumulation of liquidity by customers and higher consumer deposits driven by government stimulus payments andlower consumer spending.
• Borrowed funds of $37.2 billion decreased $23.1 billion, or 38%, reflecting use of liquidity from deposit growth and proceedsfrom the sale of our equity investment in BlackRock.
42 The PNC Financial Services Group, Inc. – 2020 Form 10-K
For additional detail, see the Consolidated Balance Sheet Review section of this Item 7.
Credit Quality Highlights
Credit quality metrics in 2020 reflected a challenging economic environment.• At December 31, 2020 compared to December 31, 2019:
• Nonperforming assets of $2.3 billion increased $585 million, or 33%, primarily due to the significantly adverseeconomic impacts of the pandemic.
• Overall loan delinquencies of $1.4 billion decreased $141 million, or 9%, reflecting CARES Act and otherforbearance and extension treatments.
• Net charge-offs of $832 million, or 0.33% of average loans, in 2020 increased 30% compared to net charge-offs of $642million, or 0.27% of average loans, for 2019. Commercial loan net charge-offs increased $175 million, primarily in industriesadversely impacted by the pandemic, and consumer loan net charge-offs increased $15 million compared to 2019.
• The ACL related to loans increased to $5.9 billion, or 2.46% of total loans, at December 31, 2020, calculated under the CECLaccounting standard adopted January 1, 2020, compared to $3.1 billion, or 1.28% of total loans, at December 31, 2019. Theincrease was due to the transition impact from the adoption of the CECL standard along with the significantly adverseeconomic impacts of the pandemic and its resulting effects on loan portfolio credit quality and loan growth.
For additional detail, see the Credit Risk Management portion of the Risk Management section of this Item 7.
Capital Highlights
We maintained a strong capital position during 2020.• The Basel III CET1 capital ratio was 12.2% at December 31, 2020 compared with 9.5% at December 31, 2019.
• The December 31, 2020 ratio reflects higher capital due in part to the gain from the sale of our equity investment inBlackRock and changes under the Tailoring Rules, effective January 1, 2020 for PNC, partially offset by the impactof the CECL accounting standard.
• Additionally, capital benefited from our election of a five-year transition period for CECL’s estimated impact onCET1 capital. CECL’s estimated impact on CET1 capital is defined as the change in retained earnings at adoptionplus or minus 25% of the change in CECL ACL at the balance sheet date compared to CECL ACL at transition. Theestimated CECL impact is added to CET1 capital through December 31, 2021, then phased-out over the followingthree years.
• Common shareholder’s equity increased 11% to $50.5 billion at December 31, 2020, compared to $45.3 billion at December31, 2019.
• On January 5, 2021, the PNC board of directors declared a quarterly cash dividend on common stock of $1.15 per sharepayable on February 5, 2021.
• PNC announced on March 16, 2020 a temporary suspension of our common stock repurchase program in conjunction with theFederal Reserve’s effort to support the U.S. economy during the pandemic, and continued the suspension through the fourthquarter of 2020, consistent with the extension of the Federal Reserve’s special capital distribution restrictions. Werepurchased $99 million of common shares in the third quarter to offset the effects of employee benefit plan-related issuancesin 2020 as permitted by guidance from the Federal Reserve. In 2021, our plan is to refrain from share repurchases, excludingemployee benefit-related purchases, during the period leading up to our pending BBVA transaction close date.
PNC’s ability to take certain capital actions, including returning capital to shareholders, is subject to PNC meeting or exceeding astress capital buffer established by the Federal Reserve Board in connection with the Federal Reserve Board’s CCAR process. TheFederal Reserve also has imposed additional limitations on capital distributions through the first quarter of 2021 by CCAR-participating bank holding companies and may extend these limitations, potentially in modified form. See additional discussion of theCCAR process in the Supervision and Regulation section of Item 1 Business and Item 1A Risk Factors of this Report.
See the Liquidity and Capital Management portion of the Risk Management section of this Item 7 for more detail on our 2020 capitaland liquidity actions as well as our capital ratios.
Business Outlook
Statements regarding our business outlook are forward-looking within the meaning of the Private Securities Litigation Reform Act of1995. Our forward-looking financial statements are subject to the risk that economic and financial market conditions will besubstantially different than those we are currently expecting and do not take into account potential legal and regulatory contingencies.These statements are based on our view that:
• The U.S. economy is in an economic recovery, following a very severe but very short economic contraction in the first half of2020 due to the COVID-19 pandemic and public health measures to contain it.
The PNC Financial Services Group, Inc. – 2020 Form 10-K 43
• Despite the improvement in the economy since the spring of 2020, economic activity remains far below its prepandemic leveland unemployment remains elevated.
• Growth will be much weaker in early 2021 because of record COVID-19 cases and continued government restrictions ofeconomic activity. Growth should then pick up in the spring of 2021 as vaccines are more widely available and the federalgovernment provides aid to households and small and medium-sized businesses. PNC does not expect real GDP to return toits pre-pandemic level until late 2021, and does not expect employment to return to its pre-pandemic level until at least 2023.
• PNC expects the FOMC to keep the fed funds rate in its current range of 0.00% to 0.25% through at least mid-2024.
See the Cautionary Statement Regarding Forward-Looking Information section in this Item 7 and Item 1A Risk Factors in this Reportfor other factors that could cause future events to differ, perhaps materially, from those anticipated in these forward-lookingstatements.
For information on financial results for the fourth quarter of 2020, see the Selected Quarterly Financial Data section in the StatisticalInformation (Unaudited) section of Item 8 of this Report.
For the PNC standalone full year 2021, excluding one-time costs related to the BBVA transaction, compared to full year 2020 whereappropriate, we expect:
• Average loan growth to be down in the low-single digits range, and spot loan growth to be up in the low single-digits range,on a percentage basis,
• Revenue growth to be stable, which includes net interest income down modestly,• Noninterest expense to remain stable, and• The effective tax rate to be approximately 17%.
Assuming a mid-2021 close date and excluding one-time integration costs, we expect the pending BBVA acquisition to beapproximately $600 million accretive to PNC’s 2021 pre-provision net revenue.
For the first quarter of 2021, compared to the fourth quarter of 2020 where appropriate, we expect:• Average loans to be stable to down modestly, with PPP loans to be up approximately $2 billion,• Net interest income to decline approximately 1%, which includes the impact of two fewer days in the quarter,
◦ Excluding the impact of PPP, net interest income to decline approximately 3%.• Noninterest income to decline mid-single digits, on a percentage basis, with other noninterest income to be between $275
million and $325 million,• Noninterest expense to be down in the mid-single digit range, on a percentage basis, and• Net loan charge-offs to be between $200 million and $250 million.
CONSOLIDATED INCOME STATEMENT REVIEW
Our Consolidated Income Statement is presented in Item 8 of this Report. For the comparison of 2019 over 2018, see the ConsolidatedIncome Statement Review section in our 2019 Form 10-K.
Net income from continuing operations for 2020 was $3.0 billion, or $6.36 per diluted common share, a decrease of $1.6 billioncompared with net income from continuing operations of $4.6 billion, or $9.57 per diluted common share, for 2019. The decrease wasprimarily driven by a $2.4 billion increase in the provision for credit losses reflecting changes due to the adoption of CECL, togetherwith the significantly adverse economic impacts of the pandemic and its resulting effects on loan portfolio credit quality and loangrowth, partially offset by lower noninterest expense.
44 The PNC Financial Services Group, Inc. – 2020 Form 10-K
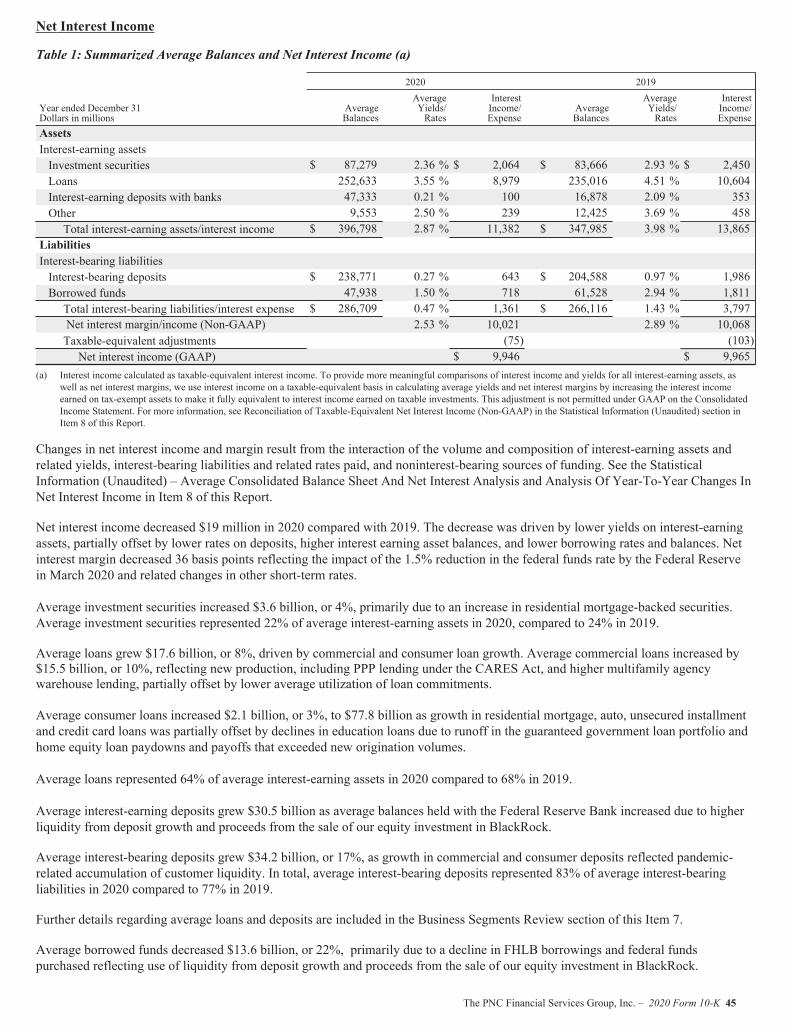
Net Interest Income
Table 1: Summarized Average Balances and Net Interest Income (a)
2020 2019
Year ended December 31Dollars in millions
AverageBalances
AverageYields/Rates
InterestIncome/Expense
AverageBalances
AverageYields/Rates
InterestIncome/Expense
AssetsInterest-earning assetsInvestment securities $ 87,279 2.36 % $ 2,064 $ 83,666 2.93 % $ 2,450Loans 252,633 3.55 % 8,979 235,016 4.51 % 10,604Interest-earning deposits with banks 47,333 0.21 % 100 16,878 2.09 % 353Other 9,553 2.50 % 239 12,425 3.69 % 458Total interest-earning assets/interest income $ 396,798 2.87 % 11,382 $ 347,985 3.98 % 13,865
LiabilitiesInterest-bearing liabilitiesInterest-bearing deposits $ 238,771 0.27 % 643 $ 204,588 0.97 % 1,986Borrowed funds 47,938 1.50 % 718 61,528 2.94 % 1,811Total interest-bearing liabilities/interest expense $ 286,709 0.47 % 1,361 $ 266,116 1.43 % 3,797Net interest margin/income (Non-GAAP) 2.53 % 10,021 2.89 % 10,068Taxable-equivalent adjustments (75) (103)Net interest income (GAAP) $ 9,946 $ 9,965
(a) Interest income calculated as taxable-equivalent interest income. To provide more meaningful comparisons of interest income and yields for all interest-earning assets, aswell as net interest margins, we use interest income on a taxable-equivalent basis in calculating average yields and net interest margins by increasing the interest incomeearned on tax-exempt assets to make it fully equivalent to interest income earned on taxable investments. This adjustment is not permitted under GAAP on the ConsolidatedIncome Statement. For more information, see Reconciliation of Taxable-Equivalent Net Interest Income (Non-GAAP) in the Statistical Information (Unaudited) section inItem 8 of this Report.
Changes in net interest income and margin result from the interaction of the volume and composition of interest-earning assets andrelated yields, interest-bearing liabilities and related rates paid, and noninterest-bearing sources of funding. See the StatisticalInformation (Unaudited) – Average Consolidated Balance Sheet And Net Interest Analysis and Analysis Of Year-To-Year Changes InNet Interest Income in Item 8 of this Report.
Net interest income decreased $19 million in 2020 compared with 2019. The decrease was driven by lower yields on interest-earningassets, partially offset by lower rates on deposits, higher interest earning asset balances, and lower borrowing rates and balances. Netinterest margin decreased 36 basis points reflecting the impact of the 1.5% reduction in the federal funds rate by the Federal Reservein March 2020 and related changes in other short-term rates.
Average investment securities increased $3.6 billion, or 4%, primarily due to an increase in residential mortgage-backed securities.Average investment securities represented 22% of average interest-earning assets in 2020, compared to 24% in 2019.
Average loans grew $17.6 billion, or 8%, driven by commercial and consumer loan growth. Average commercial loans increased by$15.5 billion, or 10%, reflecting new production, including PPP lending under the CARES Act, and higher multifamily agencywarehouse lending, partially offset by lower average utilization of loan commitments.
Average consumer loans increased $2.1 billion, or 3%, to $77.8 billion as growth in residential mortgage, auto, unsecured installmentand credit card loans was partially offset by declines in education loans due to runoff in the guaranteed government loan portfolio andhome equity loan paydowns and payoffs that exceeded new origination volumes.
Average loans represented 64% of average interest-earning assets in 2020 compared to 68% in 2019.
Average interest-earning deposits grew $30.5 billion as average balances held with the Federal Reserve Bank increased due to higherliquidity from deposit growth and proceeds from the sale of our equity investment in BlackRock.
Average interest-bearing deposits grew $34.2 billion, or 17%, as growth in commercial and consumer deposits reflected pandemic-related accumulation of customer liquidity. In total, average interest-bearing deposits represented 83% of average interest-bearingliabilities in 2020 compared to 77% in 2019.
Further details regarding average loans and deposits are included in the Business Segments Review section of this Item 7.
Average borrowed funds decreased $13.6 billion, or 22%, primarily due to a decline in FHLB borrowings and federal fundspurchased reflecting use of liquidity from deposit growth and proceeds from the sale of our equity investment in BlackRock.
The PNC Financial Services Group, Inc. – 2020 Form 10-K 45
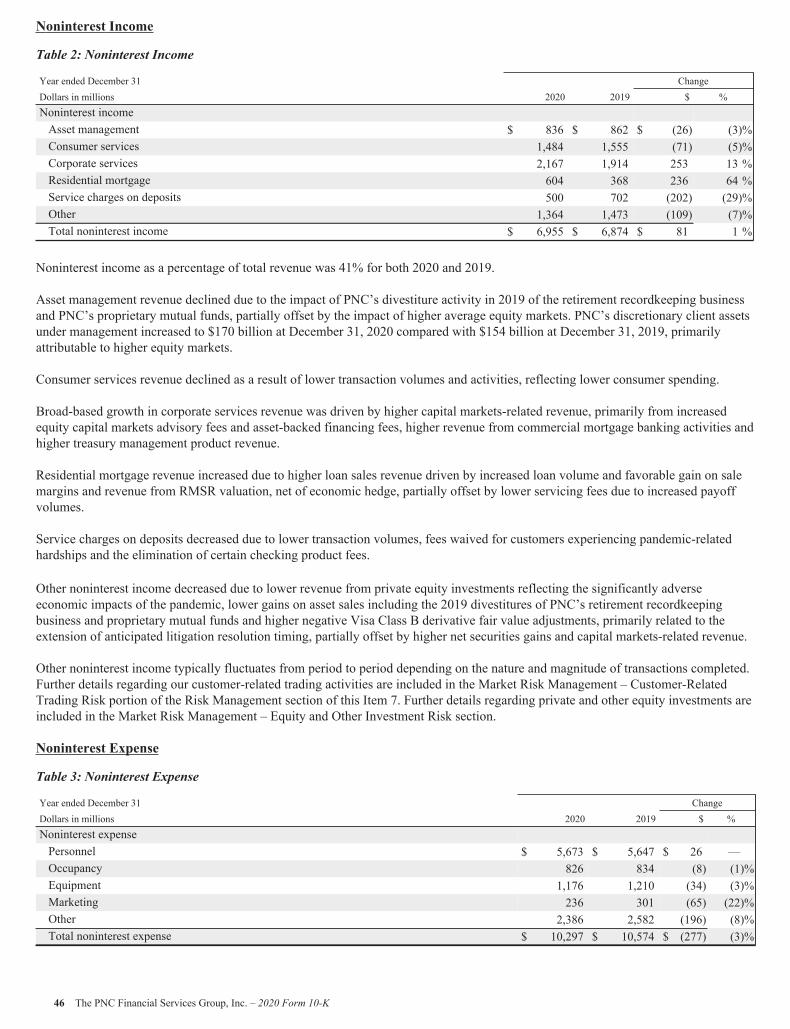
Noninterest Income
Table 2: Noninterest Income
Year ended December 31 ChangeDollars in millions 2020 2019 $ %Noninterest incomeAsset management $ 836 $ 862 $ (26) (3)%Consumer services 1,484 1,555 (71) (5)%Corporate services 2,167 1,914 253 13 %Residential mortgage 604 368 236 64 %Service charges on deposits 500 702 (202) (29)%Other 1,364 1,473 (109) (7)%Total noninterest income $ 6,955 $ 6,874 $ 81 1 %
Noninterest income as a percentage of total revenue was 41% for both 2020 and 2019.
Asset management revenue declined due to the impact of PNC’s divestiture activity in 2019 of the retirement recordkeeping businessand PNC’s proprietary mutual funds, partially offset by the impact of higher average equity markets. PNC’s discretionary client assetsunder management increased to $170 billion at December 31, 2020 compared with $154 billion at December 31, 2019, primarilyattributable to higher equity markets.
Consumer services revenue declined as a result of lower transaction volumes and activities, reflecting lower consumer spending.
Broad-based growth in corporate services revenue was driven by higher capital markets-related revenue, primarily from increasedequity capital markets advisory fees and asset-backed financing fees, higher revenue from commercial mortgage banking activities andhigher treasury management product revenue.
Residential mortgage revenue increased due to higher loan sales revenue driven by increased loan volume and favorable gain on salemargins and revenue from RMSR valuation, net of economic hedge, partially offset by lower servicing fees due to increased payoffvolumes.
Service charges on deposits decreased due to lower transaction volumes, fees waived for customers experiencing pandemic-relatedhardships and the elimination of certain checking product fees.
Other noninterest income decreased due to lower revenue from private equity investments reflecting the significantly adverseeconomic impacts of the pandemic, lower gains on asset sales including the 2019 divestitures of PNC’s retirement recordkeepingbusiness and proprietary mutual funds and higher negative Visa Class B derivative fair value adjustments, primarily related to theextension of anticipated litigation resolution timing, partially offset by higher net securities gains and capital markets-related revenue.
Other noninterest income typically fluctuates from period to period depending on the nature and magnitude of transactions completed.Further details regarding our customer-related trading activities are included in the Market Risk Management – Customer-RelatedTrading Risk portion of the Risk Management section of this Item 7. Further details regarding private and other equity investments areincluded in the Market Risk Management – Equity and Other Investment Risk section.
Noninterest Expense
Table 3: Noninterest Expense
Year ended December 31 ChangeDollars in millions 2020 2019 $ %Noninterest expensePersonnel $ 5,673 $ 5,647 $ 26 —Occupancy 826 834 (8) (1)%Equipment 1,176 1,210 (34) (3)%Marketing 236 301 (65) (22)%Other 2,386 2,582 (196) (8)%Total noninterest expense $ 10,297 $ 10,574 $ (277) (3)%
46 The PNC Financial Services Group, Inc. – 2020 Form 10-K
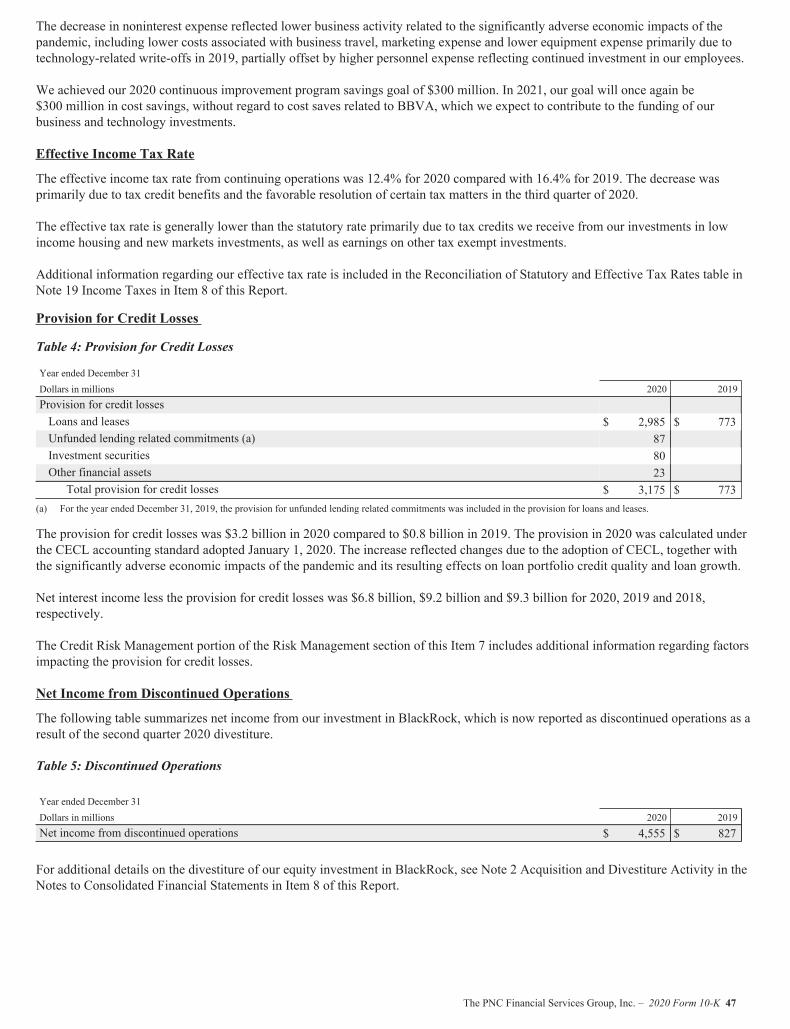
The decrease in noninterest expense reflected lower business activity related to the significantly adverse economic impacts of thepandemic, including lower costs associated with business travel, marketing expense and lower equipment expense primarily due totechnology-related write-offs in 2019, partially offset by higher personnel expense reflecting continued investment in our employees.
We achieved our 2020 continuous improvement program savings goal of $300 million. In 2021, our goal will once again be$300 million in cost savings, without regard to cost saves related to BBVA, which we expect to contribute to the funding of ourbusiness and technology investments.
Effective Income Tax Rate
The effective income tax rate from continuing operations was 12.4% for 2020 compared with 16.4% for 2019. The decrease wasprimarily due to tax credit benefits and the favorable resolution of certain tax matters in the third quarter of 2020.
The effective tax rate is generally lower than the statutory rate primarily due to tax credits we receive from our investments in lowincome housing and new markets investments, as well as earnings on other tax exempt investments.
Additional information regarding our effective tax rate is included in the Reconciliation of Statutory and Effective Tax Rates table inNote 19 Income Taxes in Item 8 of this Report.
Provision for Credit Losses
Table 4: Provision for Credit Losses
Year ended December 31Dollars in millions 2020 2019Provision for credit lossesLoans and leases $ 2,985 $ 773Unfunded lending related commitments (a) 87Investment securities 80Other financial assets 23Total provision for credit losses $ 3,175 $ 773
(a) For the year ended December 31, 2019, the provision for unfunded lending related commitments was included in the provision for loans and leases.
The provision for credit losses was $3.2 billion in 2020 compared to $0.8 billion in 2019. The provision in 2020 was calculated underthe CECL accounting standard adopted January 1, 2020. The increase reflected changes due to the adoption of CECL, together withthe significantly adverse economic impacts of the pandemic and its resulting effects on loan portfolio credit quality and loan growth.
Net interest income less the provision for credit losses was $6.8 billion, $9.2 billion and $9.3 billion for 2020, 2019 and 2018,respectively.
The Credit Risk Management portion of the Risk Management section of this Item 7 includes additional information regarding factorsimpacting the provision for credit losses.
Net Income from Discontinued Operations
The following table summarizes net income from our investment in BlackRock, which is now reported as discontinued operations as aresult of the second quarter 2020 divestiture.
Table 5: Discontinued Operations
Year ended December 31Dollars in millions 2020 2019Net income from discontinued operations $ 4,555 $ 827
For additional details on the divestiture of our equity investment in BlackRock, see Note 2 Acquisition and Divestiture Activity in theNotes to Consolidated Financial Statements in Item 8 of this Report.
The PNC Financial Services Group, Inc. – 2020 Form 10-K 47
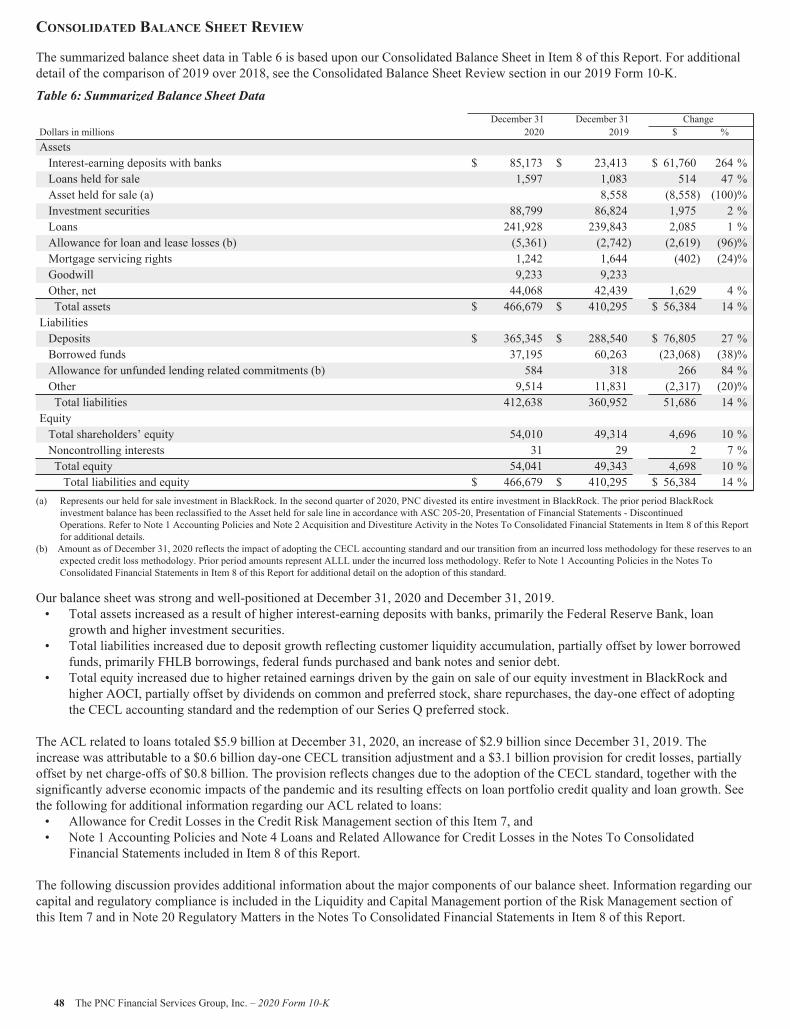
CONSOLIDATED BALANCE SHEET REVIEW
The summarized balance sheet data in Table 6 is based upon our Consolidated Balance Sheet in Item 8 of this Report. For additionaldetail of the comparison of 2019 over 2018, see the Consolidated Balance Sheet Review section in our 2019 Form 10-K.
Table 6: Summarized Balance Sheet Data
December 31 December 31 ChangeDollars in millions 2020 2019 $ %AssetsInterest-earning deposits with banks $ 85,173 $ 23,413 $ 61,760 264 %Loans held for sale 1,597 1,083 514 47 %Asset held for sale (a) 8,558 (8,558) (100)%Investment securities 88,799 86,824 1,975 2 %Loans 241,928 239,843 2,085 1 %Allowance for loan and lease losses (b) (5,361) (2,742) (2,619) (96)%Mortgage servicing rights 1,242 1,644 (402) (24)%Goodwill 9,233 9,233Other, net 44,068 42,439 1,629 4 %Total assets $ 466,679 $ 410,295 $ 56,384 14 %
LiabilitiesDeposits $ 365,345 $ 288,540 $ 76,805 27 %Borrowed funds 37,195 60,263 (23,068) (38)%Allowance for unfunded lending related commitments (b) 584 318 266 84 %Other 9,514 11,831 (2,317) (20)%Total liabilities 412,638 360,952 51,686 14 %
EquityTotal shareholders’ equity 54,010 49,314 4,696 10 %Noncontrolling interests 31 29 2 7 %Total equity 54,041 49,343 4,698 10 %Total liabilities and equity $ 466,679 $ 410,295 $ 56,384 14 %
(a) Represents our held for sale investment in BlackRock. In the second quarter of 2020, PNC divested its entire investment in BlackRock. The prior period BlackRockinvestment balance has been reclassified to the Asset held for sale line in accordance with ASC 205-20, Presentation of Financial Statements - DiscontinuedOperations. Refer to Note 1 Accounting Policies and Note 2 Acquisition and Divestiture Activity in the Notes To Consolidated Financial Statements in Item 8 of this Reportfor additional details.
(b) Amount as of December 31, 2020 reflects the impact of adopting the CECL accounting standard and our transition from an incurred loss methodology for these reserves to anexpected credit loss methodology. Prior period amounts represent ALLL under the incurred loss methodology. Refer to Note 1 Accounting Policies in the Notes ToConsolidated Financial Statements in Item 8 of this Report for additional detail on the adoption of this standard.
Our balance sheet was strong and well-positioned at December 31, 2020 and December 31, 2019.• Total assets increased as a result of higher interest-earning deposits with banks, primarily the Federal Reserve Bank, loan
growth and higher investment securities.• Total liabilities increased due to deposit growth reflecting customer liquidity accumulation, partially offset by lower borrowed
funds, primarily FHLB borrowings, federal funds purchased and bank notes and senior debt.• Total equity increased due to higher retained earnings driven by the gain on sale of our equity investment in BlackRock and
higher AOCI, partially offset by dividends on common and preferred stock, share repurchases, the day-one effect of adoptingthe CECL accounting standard and the redemption of our Series Q preferred stock.
The ACL related to loans totaled $5.9 billion at December 31, 2020, an increase of $2.9 billion since December 31, 2019. Theincrease was attributable to a $0.6 billion day-one CECL transition adjustment and a $3.1 billion provision for credit losses, partiallyoffset by net charge-offs of $0.8 billion. The provision reflects changes due to the adoption of the CECL standard, together with thesignificantly adverse economic impacts of the pandemic and its resulting effects on loan portfolio credit quality and loan growth. Seethe following for additional information regarding our ACL related to loans:• Allowance for Credit Losses in the Credit Risk Management section of this Item 7, and• Note 1 Accounting Policies and Note 4 Loans and Related Allowance for Credit Losses in the Notes To Consolidated
Financial Statements included in Item 8 of this Report.
The following discussion provides additional information about the major components of our balance sheet. Information regarding ourcapital and regulatory compliance is included in the Liquidity and Capital Management portion of the Risk Management section ofthis Item 7 and in Note 20 Regulatory Matters in the Notes To Consolidated Financial Statements in Item 8 of this Report.
48 The PNC Financial Services Group, Inc. – 2020 Form 10-K
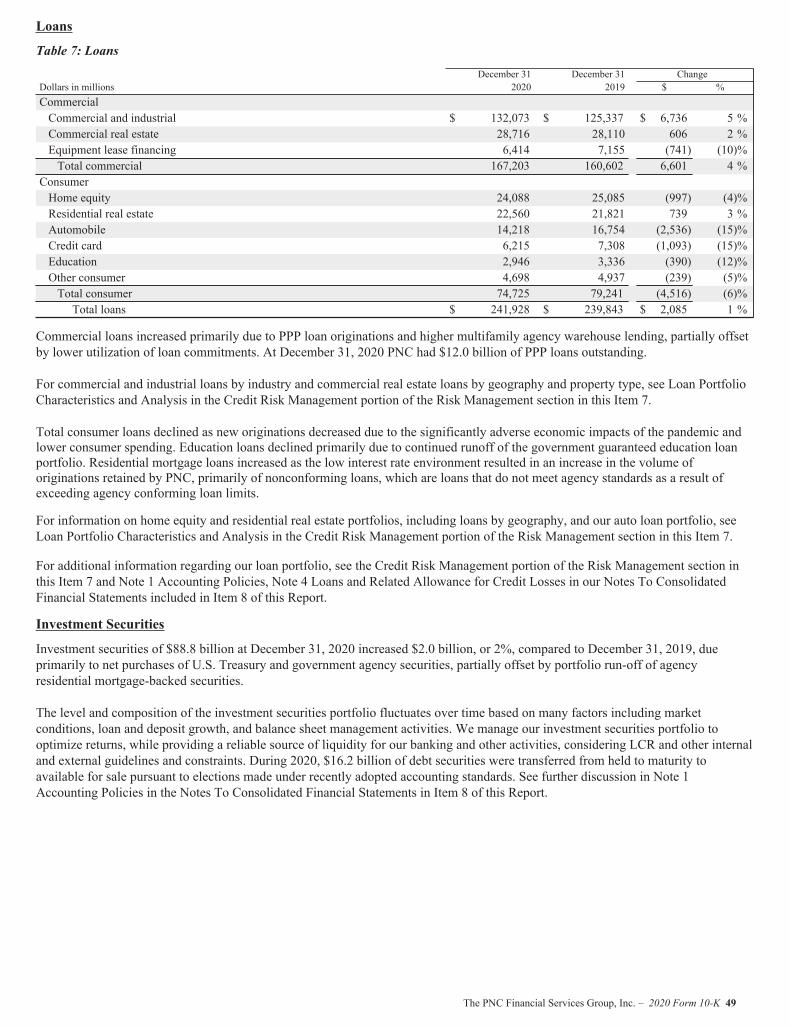
Loans
Table 7: Loans
December 31 December 31 ChangeDollars in millions 2020 2019 $ %CommercialCommercial and industrial $ 132,073 $ 125,337 $ 6,736 5 %Commercial real estate 28,716 28,110 606 2 %Equipment lease financing 6,414 7,155 (741) (10)%Total commercial 167,203 160,602 6,601 4 %
ConsumerHome equity 24,088 25,085 (997) (4)%Residential real estate 22,560 21,821 739 3 %Automobile 14,218 16,754 (2,536) (15)%Credit card 6,215 7,308 (1,093) (15)%Education 2,946 3,336 (390) (12)%Other consumer 4,698 4,937 (239) (5)%Total consumer 74,725 79,241 (4,516) (6)%Total loans $ 241,928 $ 239,843 $ 2,085 1 %
Commercial loans increased primarily due to PPP loan originations and higher multifamily agency warehouse lending, partially offsetby lower utilization of loan commitments. At December 31, 2020 PNC had $12.0 billion of PPP loans outstanding.
For commercial and industrial loans by industry and commercial real estate loans by geography and property type, see Loan PortfolioCharacteristics and Analysis in the Credit Risk Management portion of the Risk Management section in this Item 7.
Total consumer loans declined as new originations decreased due to the significantly adverse economic impacts of the pandemic andlower consumer spending. Education loans declined primarily due to continued runoff of the government guaranteed education loanportfolio. Residential mortgage loans increased as the low interest rate environment resulted in an increase in the volume oforiginations retained by PNC, primarily of nonconforming loans, which are loans that do not meet agency standards as a result ofexceeding agency conforming loan limits.
For information on home equity and residential real estate portfolios, including loans by geography, and our auto loan portfolio, seeLoan Portfolio Characteristics and Analysis in the Credit Risk Management portion of the Risk Management section in this Item 7.
For additional information regarding our loan portfolio, see the Credit Risk Management portion of the Risk Management section inthis Item 7 and Note 1 Accounting Policies, Note 4 Loans and Related Allowance for Credit Losses in our Notes To ConsolidatedFinancial Statements included in Item 8 of this Report.
Investment Securities
Investment securities of $88.8 billion at December 31, 2020 increased $2.0 billion, or 2%, compared to December 31, 2019, dueprimarily to net purchases of U.S. Treasury and government agency securities, partially offset by portfolio run-off of agencyresidential mortgage-backed securities.
The level and composition of the investment securities portfolio fluctuates over time based on many factors including marketconditions, loan and deposit growth, and balance sheet management activities. We manage our investment securities portfolio tooptimize returns, while providing a reliable source of liquidity for our banking and other activities, considering LCR and other internaland external guidelines and constraints. During 2020, $16.2 billion of debt securities were transferred from held to maturity toavailable for sale pursuant to elections made under recently adopted accounting standards. See further discussion in Note 1Accounting Policies in the Notes To Consolidated Financial Statements in Item 8 of this Report.
The PNC Financial Services Group, Inc. – 2020 Form 10-K 49
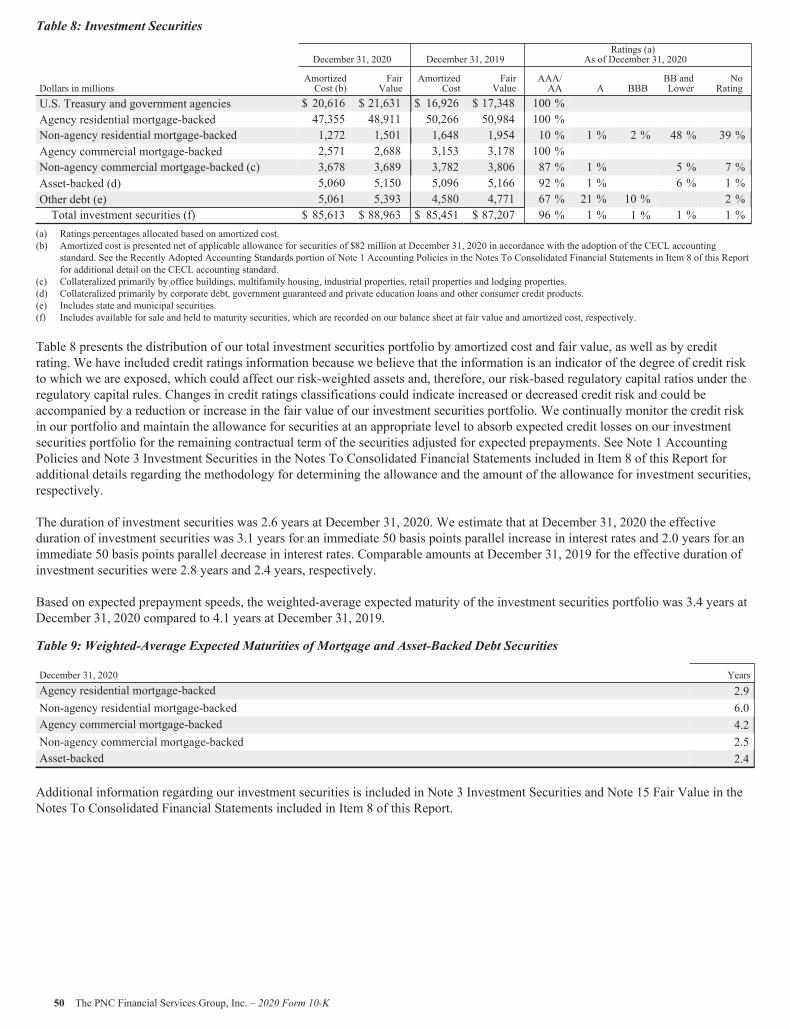
Table 8: Investment Securities
December 31, 2020 December 31, 2019Ratings (a)
As of December 31, 2020
Dollars in millionsAmortizedCost (b)
FairValue
AmortizedCost
FairValue
AAA/AA A BBB
BB andLower
NoRating
U.S. Treasury and government agencies $ 20,616 $ 21,631 $ 16,926 $ 17,348 100 %Agency residential mortgage-backed 47,355 48,911 50,266 50,984 100 %Non-agency residential mortgage-backed 1,272 1,501 1,648 1,954 10 % 1 % 2 % 48 % 39 %Agency commercial mortgage-backed 2,571 2,688 3,153 3,178 100 %Non-agency commercial mortgage-backed (c) 3,678 3,689 3,782 3,806 87 % 1 % 5 % 7 %Asset-backed (d) 5,060 5,150 5,096 5,166 92 % 1 % 6 % 1 %Other debt (e) 5,061 5,393 4,580 4,771 67 % 21 % 10 % 2 %Total investment securities (f) $ 85,613 $ 88,963 $ 85,451 $ 87,207 96 % 1 % 1 % 1 % 1 %
(a) Ratings percentages allocated based on amortized cost.(b) Amortized cost is presented net of applicable allowance for securities of $82 million at December 31, 2020 in accordance with the adoption of the CECL accounting
standard. See the Recently Adopted Accounting Standards portion of Note 1 Accounting Policies in the Notes To Consolidated Financial Statements in Item 8 of this Reportfor additional detail on the CECL accounting standard.
(c) Collateralized primarily by office buildings, multifamily housing, industrial properties, retail properties and lodging properties.(d) Collateralized primarily by corporate debt, government guaranteed and private education loans and other consumer credit products.(e) Includes state and municipal securities.(f) Includes available for sale and held to maturity securities, which are recorded on our balance sheet at fair value and amortized cost, respectively.
Table 8 presents the distribution of our total investment securities portfolio by amortized cost and fair value, as well as by creditrating. We have included credit ratings information because we believe that the information is an indicator of the degree of credit riskto which we are exposed, which could affect our risk-weighted assets and, therefore, our risk-based regulatory capital ratios under theregulatory capital rules. Changes in credit ratings classifications could indicate increased or decreased credit risk and could beaccompanied by a reduction or increase in the fair value of our investment securities portfolio. We continually monitor the credit riskin our portfolio and maintain the allowance for securities at an appropriate level to absorb expected credit losses on our investmentsecurities portfolio for the remaining contractual term of the securities adjusted for expected prepayments. See Note 1 AccountingPolicies and Note 3 Investment Securities in the Notes To Consolidated Financial Statements included in Item 8 of this Report foradditional details regarding the methodology for determining the allowance and the amount of the allowance for investment securities,respectively.
The duration of investment securities was 2.6 years at December 31, 2020. We estimate that at December 31, 2020 the effectiveduration of investment securities was 3.1 years for an immediate 50 basis points parallel increase in interest rates and 2.0 years for animmediate 50 basis points parallel decrease in interest rates. Comparable amounts at December 31, 2019 for the effective duration ofinvestment securities were 2.8 years and 2.4 years, respectively.
Based on expected prepayment speeds, the weighted-average expected maturity of the investment securities portfolio was 3.4 years atDecember 31, 2020 compared to 4.1 years at December 31, 2019.
Table 9: Weighted-Average Expected Maturities of Mortgage and Asset-Backed Debt Securities
December 31, 2020 YearsAgency residential mortgage-backed 2.9Non-agency residential mortgage-backed 6.0Agency commercial mortgage-backed 4.2Non-agency commercial mortgage-backed 2.5Asset-backed 2.4
Additional information regarding our investment securities is included in Note 3 Investment Securities and Note 15 Fair Value in theNotes To Consolidated Financial Statements included in Item 8 of this Report.
50 The PNC Financial Services Group, Inc. – 2020 Form 10-K
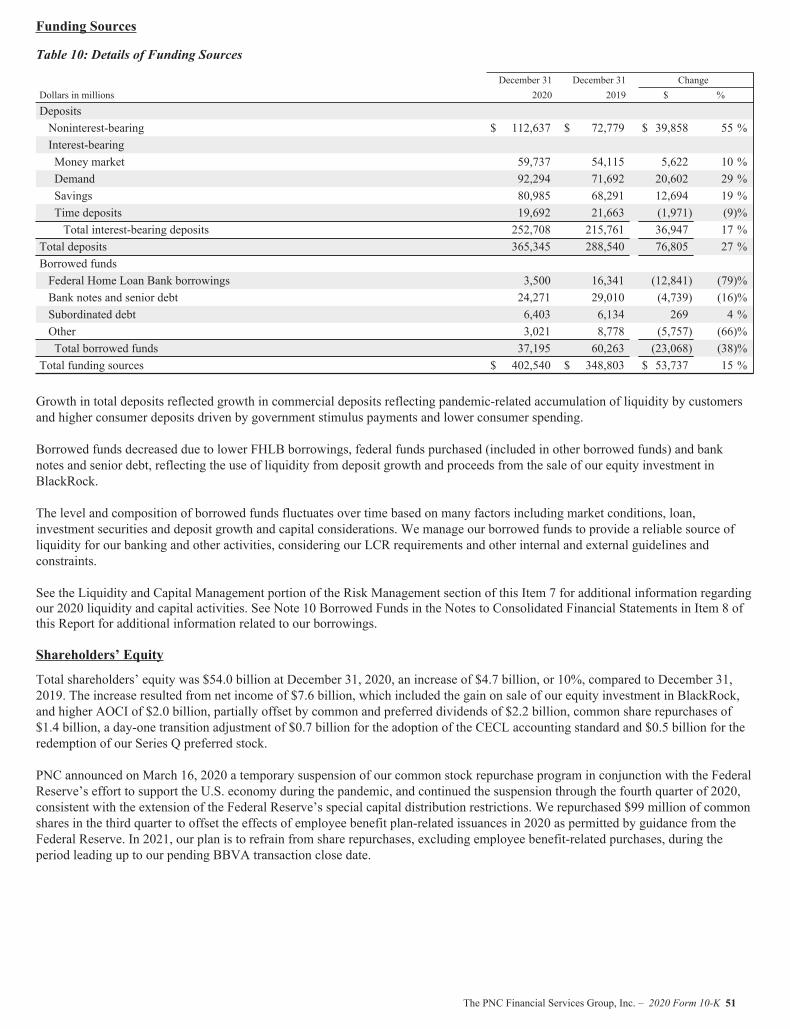
Funding Sources
Table 10: Details of Funding Sources
December 31 December 31 ChangeDollars in millions 2020 2019 $ %
DepositsNoninterest-bearing $ 112,637 $ 72,779 $ 39,858 55 %Interest-bearingMoney market 59,737 54,115 5,622 10 %Demand 92,294 71,692 20,602 29 %Savings 80,985 68,291 12,694 19 %Time deposits 19,692 21,663 (1,971) (9)%Total interest-bearing deposits 252,708 215,761 36,947 17 %
Total deposits 365,345 288,540 76,805 27 %Borrowed fundsFederal Home Loan Bank borrowings 3,500 16,341 (12,841) (79)%Bank notes and senior debt 24,271 29,010 (4,739) (16)%Subordinated debt 6,403 6,134 269 4 %Other 3,021 8,778 (5,757) (66)%Total borrowed funds 37,195 60,263 (23,068) (38)%
Total funding sources $ 402,540 $ 348,803 $ 53,737 15 %
Growth in total deposits reflected growth in commercial deposits reflecting pandemic-related accumulation of liquidity by customersand higher consumer deposits driven by government stimulus payments and lower consumer spending.
Borrowed funds decreased due to lower FHLB borrowings, federal funds purchased (included in other borrowed funds) and banknotes and senior debt, reflecting the use of liquidity from deposit growth and proceeds from the sale of our equity investment inBlackRock.
The level and composition of borrowed funds fluctuates over time based on many factors including market conditions, loan,investment securities and deposit growth and capital considerations. We manage our borrowed funds to provide a reliable source ofliquidity for our banking and other activities, considering our LCR requirements and other internal and external guidelines andconstraints.
See the Liquidity and Capital Management portion of the Risk Management section of this Item 7 for additional information regardingour 2020 liquidity and capital activities. See Note 10 Borrowed Funds in the Notes to Consolidated Financial Statements in Item 8 ofthis Report for additional information related to our borrowings.
Shareholders’ Equity
Total shareholders’ equity was $54.0 billion at December 31, 2020, an increase of $4.7 billion, or 10%, compared to December 31,2019. The increase resulted from net income of $7.6 billion, which included the gain on sale of our equity investment in BlackRock,and higher AOCI of $2.0 billion, partially offset by common and preferred dividends of $2.2 billion, common share repurchases of$1.4 billion, a day-one transition adjustment of $0.7 billion for the adoption of the CECL accounting standard and $0.5 billion for theredemption of our Series Q preferred stock.
PNC announced on March 16, 2020 a temporary suspension of our common stock repurchase program in conjunction with the FederalReserve’s effort to support the U.S. economy during the pandemic, and continued the suspension through the fourth quarter of 2020,consistent with the extension of the Federal Reserve’s special capital distribution restrictions. We repurchased $99 million of commonshares in the third quarter to offset the effects of employee benefit plan-related issuances in 2020 as permitted by guidance from theFederal Reserve. In 2021, our plan is to refrain from share repurchases, excluding employee benefit-related purchases, during theperiod leading up to our pending BBVA transaction close date.
The PNC Financial Services Group, Inc. – 2020 Form 10-K 51
BUSINESS SEGMENTS REVIEW
We have three reportable business segments:• Retail Banking• Corporate & Institutional Banking• Asset Management Group
Business segment results and a description of each business are included in Note 23 Segment Reporting in the Notes To ConsolidatedFinancial Statements in Item 8 of this Report. Certain amounts included in this Business Segments Review differ from those amountsshown in Note 23, primarily due to the presentation in this Item 7 of business net interest income on a taxable-equivalent basis. Note23 presents results of businesses for 2020, 2019 and 2018.
During the second quarter of 2020, we divested our entire 22.4% investment in BlackRock, which had previously been reported as aseparate business segment. See Note 2 Acquisition and Divestiture Activity in the Notes To Consolidated Financial Statementsincluded in Item 8 of this Report for additional information on the sale and details on our results and cash flows for 2020, 2019 and2018.
Net interest income in business segment results reflects our internal funds transfer pricing methodology. Assets receive a fundingcharge and liabilities and capital receive a funding credit based on a transfer pricing methodology that incorporates product repricingcharacteristics, tenor and other factors.
Total business segment financial results differ from total consolidated net income. The impact of these differences is reflected in the“Other” category as shown in Table 114 in Note 23 Segment Reporting in the Notes To Consolidated Financial Statements included inItem 8 of this Report. “Other” includes residual activities that do not meet the criteria for disclosure as a separate reportable business,such as asset and liability management activities including net securities gains or losses, ACL for investment securities, certain tradingactivities, certain runoff consumer loan portfolios, private equity investments, intercompany eliminations, certain corporate overhead,tax adjustments that are not allocated to business segments, exited businesses, and differences between business segment performancereporting and financial statement reporting (GAAP).
See the Executive Summary of this Item 7 for our discussion of the impact of pandemic-related developments on our business andoperations, including pandemic relief efforts for our customers. We have granted loan modifications through various hardship reliefprograms to assist our customers in need during the pandemic. See Loan Modifications in the Troubled Debt Restructurings and LoanModifications section of Credit Risk Management for details on these programs.
52 The PNC Financial Services Group, Inc. – 2020 Form 10-K
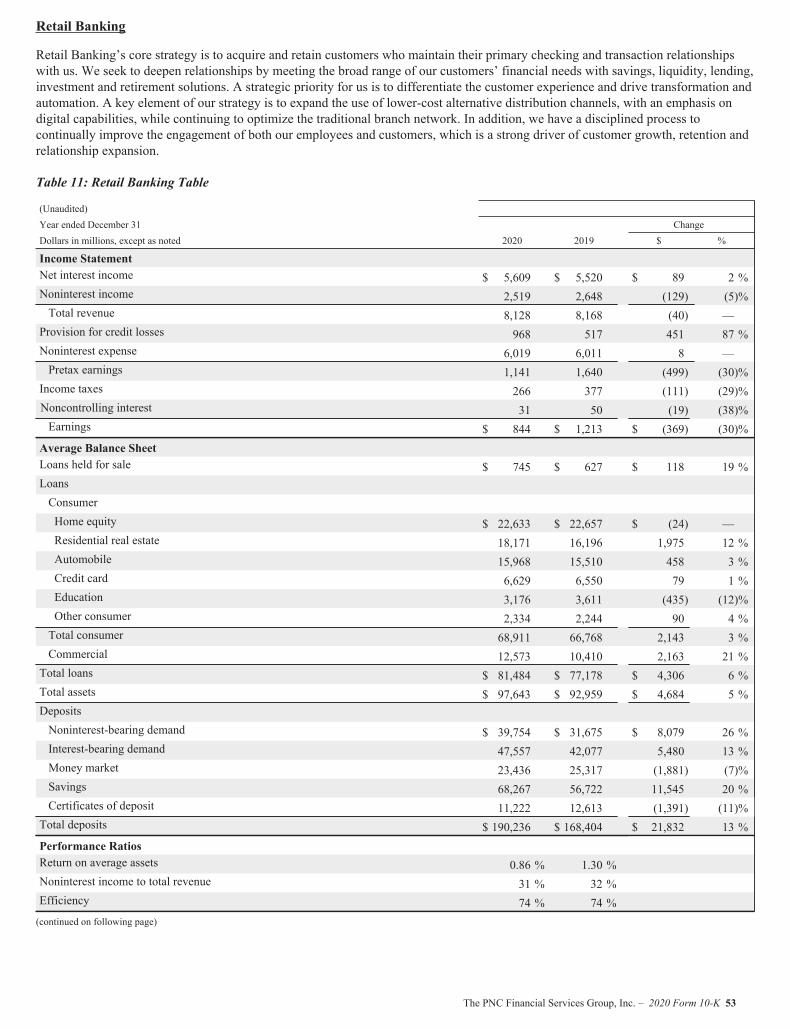
Retail Banking
Retail Banking’s core strategy is to acquire and retain customers who maintain their primary checking and transaction relationshipswith us. We seek to deepen relationships by meeting the broad range of our customers’ financial needs with savings, liquidity, lending,investment and retirement solutions. A strategic priority for us is to differentiate the customer experience and drive transformation andautomation. A key element of our strategy is to expand the use of lower-cost alternative distribution channels, with an emphasis ondigital capabilities, while continuing to optimize the traditional branch network. In addition, we have a disciplined process tocontinually improve the engagement of both our employees and customers, which is a strong driver of customer growth, retention andrelationship expansion.
Table 11: Retail Banking Table
(Unaudited)Year ended December 31 ChangeDollars in millions, except as noted 2020 2019 $ %
Income StatementNet interest income $ 5,609 $ 5,520 $ 89 2 %Noninterest income 2,519 2,648 (129) (5)%Total revenue 8,128 8,168 (40) —Provision for credit losses 968 517 451 87 %Noninterest expense 6,019 6,011 8 —Pretax earnings 1,141 1,640 (499) (30)%Income taxes 266 377 (111) (29)%Noncontrolling interest 31 50 (19) (38)%Earnings $ 844 $ 1,213 $ (369) (30)%Average Balance SheetLoans held for sale $ 745 $ 627 $ 118 19 %LoansConsumerHome equity $ 22,633 $ 22,657 $ (24) —Residential real estate 18,171 16,196 1,975 12 %Automobile 15,968 15,510 458 3 %Credit card 6,629 6,550 79 1 %Education 3,176 3,611 (435) (12)%Other consumer 2,334 2,244 90 4 %Total consumer 68,911 66,768 2,143 3 %Commercial 12,573 10,410 2,163 21 %Total loans $ 81,484 $ 77,178 $ 4,306 6 %Total assets $ 97,643 $ 92,959 $ 4,684 5 %DepositsNoninterest-bearing demand $ 39,754 $ 31,675 $ 8,079 26 %Interest-bearing demand 47,557 42,077 5,480 13 %Money market 23,436 25,317 (1,881) (7)%Savings 68,267 56,722 11,545 20 %Certificates of deposit 11,222 12,613 (1,391) (11)%Total deposits $ 190,236 $ 168,404 $ 21,832 13 %Performance RatiosReturn on average assets 0.86 % 1.30 %Noninterest income to total revenue 31 % 32 %Efficiency 74 % 74 %(continued on following page)
The PNC Financial Services Group, Inc. – 2020 Form 10-K 53
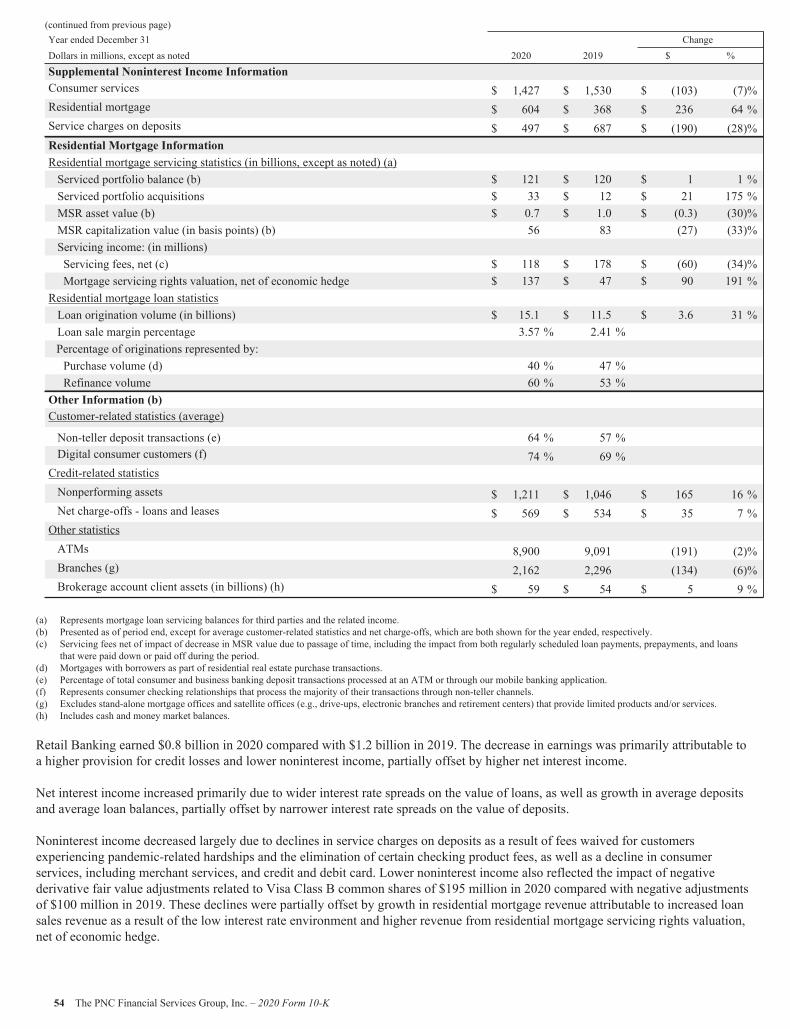
(continued from previous page)Year ended December 31 ChangeDollars in millions, except as noted 2020 2019 $ %
Supplemental Noninterest Income InformationConsumer services $ 1,427 $ 1,530 $ (103) (7)%Residential mortgage $ 604 $ 368 $ 236 64 %Service charges on deposits $ 497 $ 687 $ (190) (28)%Residential Mortgage InformationResidential mortgage servicing statistics (in billions, except as noted) (a)Serviced portfolio balance (b) $ 121 $ 120 $ 1 1 %Serviced portfolio acquisitions $ 33 $ 12 $ 21 175 %MSR asset value (b) $ 0.7 $ 1.0 $ (0.3) (30)%MSR capitalization value (in basis points) (b) 56 83 (27) (33)%Servicing income: (in millions)Servicing fees, net (c) $ 118 $ 178 $ (60) (34)%Mortgage servicing rights valuation, net of economic hedge $ 137 $ 47 $ 90 191 %
Residential mortgage loan statisticsLoan origination volume (in billions) $ 15.1 $ 11.5 $ 3.6 31 %Loan sale margin percentage 3.57 % 2.41 %Percentage of originations represented by:Purchase volume (d) 40 % 47 %Refinance volume 60 % 53 %
Other Information (b)Customer-related statistics (average)
Non-teller deposit transactions (e) 64 % 57 %Digital consumer customers (f) 74 % 69 %Credit-related statisticsNonperforming assets $ 1,211 $ 1,046 $ 165 16 %Net charge-offs - loans and leases $ 569 $ 534 $ 35 7 %Other statisticsATMs 8,900 9,091 (191) (2)%Branches (g) 2,162 2,296 (134) (6)%Brokerage account client assets (in billions) (h) $ 59 $ 54 $ 5 9 %
(a) Represents mortgage loan servicing balances for third parties and the related income.(b) Presented as of period end, except for average customer-related statistics and net charge-offs, which are both shown for the year ended, respectively.(c) Servicing fees net of impact of decrease in MSR value due to passage of time, including the impact from both regularly scheduled loan payments, prepayments, and loans
that were paid down or paid off during the period.(d) Mortgages with borrowers as part of residential real estate purchase transactions.(e) Percentage of total consumer and business banking deposit transactions processed at an ATM or through our mobile banking application.(f) Represents consumer checking relationships that process the majority of their transactions through non-teller channels.(g) Excludes stand-alone mortgage offices and satellite offices (e.g., drive-ups, electronic branches and retirement centers) that provide limited products and/or services.(h) Includes cash and money market balances.
Retail Banking earned $0.8 billion in 2020 compared with $1.2 billion in 2019. The decrease in earnings was primarily attributable toa higher provision for credit losses and lower noninterest income, partially offset by higher net interest income.
Net interest income increased primarily due to wider interest rate spreads on the value of loans, as well as growth in average depositsand average loan balances, partially offset by narrower interest rate spreads on the value of deposits.
Noninterest income decreased largely due to declines in service charges on deposits as a result of fees waived for customersexperiencing pandemic-related hardships and the elimination of certain checking product fees, as well as a decline in consumerservices, including merchant services, and credit and debit card. Lower noninterest income also reflected the impact of negativederivative fair value adjustments related to Visa Class B common shares of $195 million in 2020 compared with negative adjustmentsof $100 million in 2019. These declines were partially offset by growth in residential mortgage revenue attributable to increased loansales revenue as a result of the low interest rate environment and higher revenue from residential mortgage servicing rights valuation,net of economic hedge.
54 The PNC Financial Services Group, Inc. – 2020 Form 10-K

Provision for credit losses increased in 2020 compared to 2019 reflecting changes due to the adoption of the CECL accountingstandard, together with the significantly adverse economic impacts of the pandemic.
Noninterest expense increased marginally, primarily as a result of higher personnel, branch-related expenses due in part to the impactsof the pandemic, equipment, and technology costs, partially offset by lower advertising and marketing.
The deposit strategy of Retail Banking is to remain disciplined on pricing and focused on growing and retaining relationship-basedbalances, executing on market-specific deposit growth strategies and providing a source of low-cost funding and liquidity to PNC. In2020, average total deposits increased compared to 2019 primarily driven by growth in demand and savings deposits which benefitedfrom the impact of government stimulus payments and lower consumer spending due to the pandemic. Savings and demand depositsalso increased due, in part, to a shift from money market deposits to relationship-based savings products.
Retail Banking average total loans grew in 2020 compared with 2019:• Average commercial loans increased primarily due to PPP loans.• Average residential real estate loans increased primarily as a result of growth in nonconforming residential mortgages and a
robust refinance market driven by historically low interest rates.• Average auto loan balances in 2020 grew at a lower rate than in recent years due to the impacts of the pandemic on auto
sales.• Average other consumer loans in 2020 increased at a lower rate than in 2019 as growth in the first quarter of 2020 primarily
driven by unsecured installment loan originations through digital channels was muted for the remainder of the year asoriginations declined in part due to effects of the pandemic and customer behavior.
• Average credit card balances increased marginally in 2020 as balance growth in the first quarter of 2020 was largely offset bylower consumer spending for the remainder of the year due to the effects of the pandemic.
• Average education loans decreased driven by a decline in the runoff portfolio of government guaranteed education loans.• Average home equity loans decreased as paydowns and payoffs exceeded new originated volume.
In 2018, we launched our national expansion strategy designed to grow customers with digitally-led banking and a thin branchnetwork in markets outside of our existing retail branch network and began offering our digital high yield savings deposit product andopened our first solution center in Kansas City. Solution centers are an emerging branch operating model with a distinctive layout,where routine transactions are supported through a combination of technology and skilled banker assistance to create personalizedcustomer experiences. The primary focus of the solution center is to bring a community element to our digital banking capabilities.The solution center provides a collaborative environment that connects our customers with our digital solutions and services, beyonddeposits and withdrawals. Following the first solution center opening in 2018, four additional solution centers opened in 2019 with asecond in Kansas City and three in the Dallas/Fort Worth market. In 2020, we expanded into three new markets, Boston, Houston andNashville and opened seventeen new solution centers. We also offer digital unsecured installment and small business loans in theexpansion markets. Beginning in mid-2021, we expect the BBVA acquisition will accelerate our Retail National expansion efforts tobecome a coast-to-coast Retail Bank.
Retail Banking continues to enhance the customer experience with refinements to product and service offerings that drive value forconsumers and small businesses. We are focused on meeting the financial needs of our customers by providing a broad range ofliquidity, banking and investment products. Retail Banking continued to execute on its strategy of transforming the customerexperience through transaction channel migration, branch network and home lending process transformations and multi-channelengagement and service strategies. We are also continually assessing our current branch network for optimization opportunities asusage of alternative channels has increased and have closed 162 branches in 2020.
• Approximately 74% of consumer customers used non-teller channels for the majority of their transactions in 2020 comparedwith 69% in 2019, in part reflecting consumer transaction behavior changes during the pandemic.
• Deposit transactions via ATM and mobile channels increased to 64% of total deposit transactions in 2020 from 57% in 2019,in part reflecting consumer transaction behavior changes during the pandemic.
Retail Banking continues to make progress on its multi-year initiative to redesign the home lending process, including integratingmortgage and home equity lending into a common platform. Technology enhancements supported increased residential mortgageorigination volume. In addition, we enhanced the home equity origination process to make it easier and to reach additional customersby offering the product in new states. The enhanced product is currently available in forty-three states and we are moving towardoffering the product in most of the remaining states in 2021. Additional improvements for both mortgage and home equity are plannedto continue throughout 2021.
The PNC Financial Services Group, Inc. – 2020 Form 10-K 55
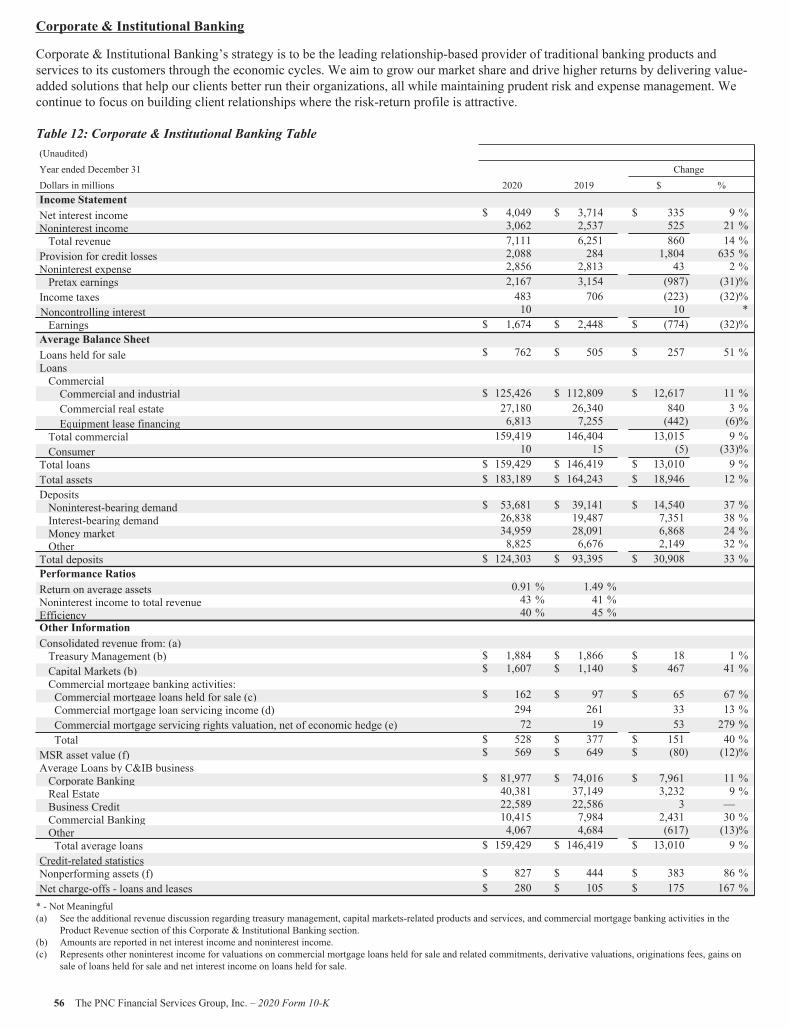
Corporate & Institutional Banking
Corporate & Institutional Banking’s strategy is to be the leading relationship-based provider of traditional banking products andservices to its customers through the economic cycles. We aim to grow our market share and drive higher returns by delivering value-added solutions that help our clients better run their organizations, all while maintaining prudent risk and expense management. Wecontinue to focus on building client relationships where the risk-return profile is attractive.
Table 12: Corporate & Institutional Banking Table(Unaudited)Year ended December 31 ChangeDollars in millions 2020 2019 $ %Income StatementNet interest income $ 4,049 $ 3,714 $ 335 9 %Noninterest income 3,062 2,537 525 21 %Total revenue 7,111 6,251 860 14 %
Provision for credit losses 2,088 284 1,804 635 %Noninterest expense 2,856 2,813 43 2 %Pretax earnings 2,167 3,154 (987) (31)%
Income taxes 483 706 (223) (32)%Noncontrolling interest 10 10 *Earnings $ 1,674 $ 2,448 $ (774) (32)%
Average Balance SheetLoans held for sale $ 762 $ 505 $ 257 51 %LoansCommercialCommercial and industrial $ 125,426 $ 112,809 $ 12,617 11 %Commercial real estate 27,180 26,340 840 3 %Equipment lease financing 6,813 7,255 (442) (6)%
Total commercial 159,419 146,404 13,015 9 %Consumer 10 15 (5) (33)%
Total loans $ 159,429 $ 146,419 $ 13,010 9 %Total assets $ 183,189 $ 164,243 $ 18,946 12 %DepositsNoninterest-bearing demand $ 53,681 $ 39,141 $ 14,540 37 %Interest-bearing demand 26,838 19,487 7,351 38 %Money market 34,959 28,091 6,868 24 %Other 8,825 6,676 2,149 32 %
Total deposits $ 124,303 $ 93,395 $ 30,908 33 %Performance RatiosReturn on average assets 0.91 % 1.49 %Noninterest income to total revenue 43 % 41 %Efficiency 40 % 45 %Other InformationConsolidated revenue from: (a)Treasury Management (b) $ 1,884 $ 1,866 $ 18 1 %Capital Markets (b) $ 1,607 $ 1,140 $ 467 41 %Commercial mortgage banking activities:Commercial mortgage loans held for sale (c) $ 162 $ 97 $ 65 67 %Commercial mortgage loan servicing income (d) 294 261 33 13 %Commercial mortgage servicing rights valuation, net of economic hedge (e) 72 19 53 279 %Total $ 528 $ 377 $ 151 40 %
MSR asset value (f) $ 569 $ 649 $ (80) (12)%Average Loans by C&IB businessCorporate Banking $ 81,977 $ 74,016 $ 7,961 11 %Real Estate 40,381 37,149 3,232 9 %Business Credit 22,589 22,586 3 —Commercial Banking 10,415 7,984 2,431 30 %Other 4,067 4,684 (617) (13)%Total average loans $ 159,429 $ 146,419 $ 13,010 9 %
Credit-related statisticsNonperforming assets (f) $ 827 $ 444 $ 383 86 %Net charge-offs - loans and leases $ 280 $ 105 $ 175 167 %* - Not Meaningful(a) See the additional revenue discussion regarding treasury management, capital markets-related products and services, and commercial mortgage banking activities in the
Product Revenue section of this Corporate & Institutional Banking section.(b) Amounts are reported in net interest income and noninterest income.(c) Represents other noninterest income for valuations on commercial mortgage loans held for sale and related commitments, derivative valuations, originations fees, gains on
sale of loans held for sale and net interest income on loans held for sale.
56 The PNC Financial Services Group, Inc. – 2020 Form 10-K
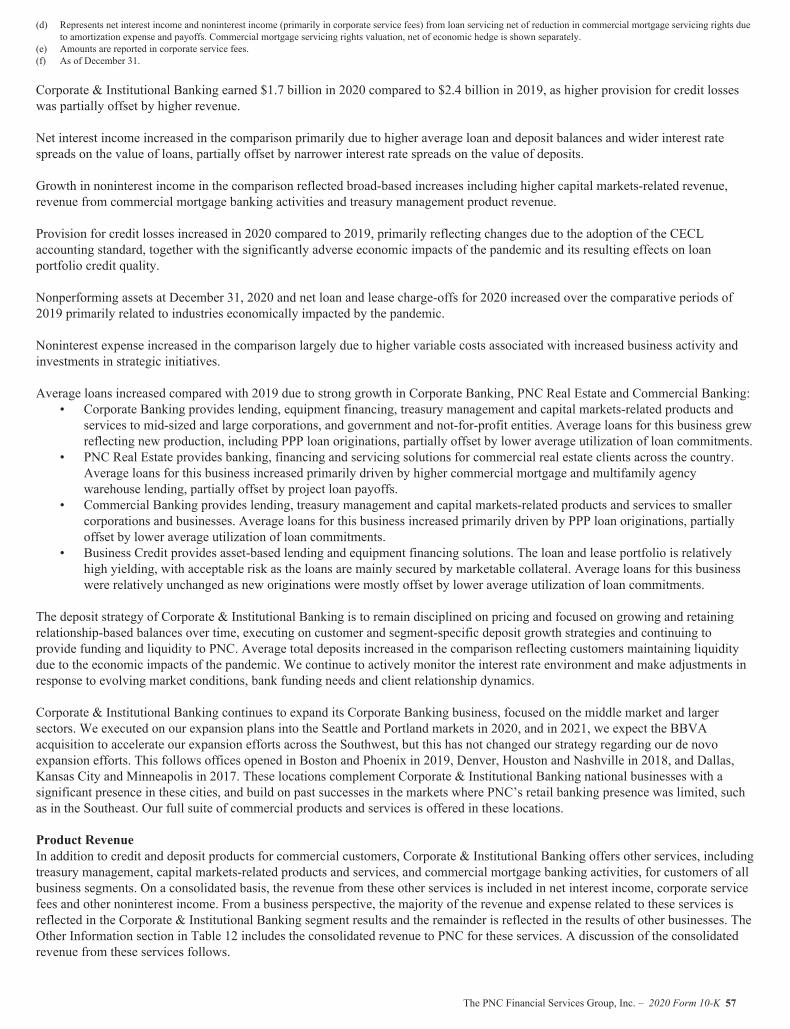
(d) Represents net interest income and noninterest income (primarily in corporate service fees) from loan servicing net of reduction in commercial mortgage servicing rights dueto amortization expense and payoffs. Commercial mortgage servicing rights valuation, net of economic hedge is shown separately.
(e) Amounts are reported in corporate service fees.(f) As of December 31.
Corporate & Institutional Banking earned $1.7 billion in 2020 compared to $2.4 billion in 2019, as higher provision for credit losseswas partially offset by higher revenue.
Net interest income increased in the comparison primarily due to higher average loan and deposit balances and wider interest ratespreads on the value of loans, partially offset by narrower interest rate spreads on the value of deposits.
Growth in noninterest income in the comparison reflected broad-based increases including higher capital markets-related revenue,revenue from commercial mortgage banking activities and treasury management product revenue.
Provision for credit losses increased in 2020 compared to 2019, primarily reflecting changes due to the adoption of the CECLaccounting standard, together with the significantly adverse economic impacts of the pandemic and its resulting effects on loanportfolio credit quality.
Nonperforming assets at December 31, 2020 and net loan and lease charge-offs for 2020 increased over the comparative periods of2019 primarily related to industries economically impacted by the pandemic.
Noninterest expense increased in the comparison largely due to higher variable costs associated with increased business activity andinvestments in strategic initiatives.
Average loans increased compared with 2019 due to strong growth in Corporate Banking, PNC Real Estate and Commercial Banking:• Corporate Banking provides lending, equipment financing, treasury management and capital markets-related products and
services to mid-sized and large corporations, and government and not-for-profit entities. Average loans for this business grewreflecting new production, including PPP loan originations, partially offset by lower average utilization of loan commitments.
• PNC Real Estate provides banking, financing and servicing solutions for commercial real estate clients across the country.Average loans for this business increased primarily driven by higher commercial mortgage and multifamily agencywarehouse lending, partially offset by project loan payoffs.
• Commercial Banking provides lending, treasury management and capital markets-related products and services to smallercorporations and businesses. Average loans for this business increased primarily driven by PPP loan originations, partiallyoffset by lower average utilization of loan commitments.
• Business Credit provides asset-based lending and equipment financing solutions. The loan and lease portfolio is relativelyhigh yielding, with acceptable risk as the loans are mainly secured by marketable collateral. Average loans for this businesswere relatively unchanged as new originations were mostly offset by lower average utilization of loan commitments.
The deposit strategy of Corporate & Institutional Banking is to remain disciplined on pricing and focused on growing and retainingrelationship-based balances over time, executing on customer and segment-specific deposit growth strategies and continuing toprovide funding and liquidity to PNC. Average total deposits increased in the comparison reflecting customers maintaining liquiditydue to the economic impacts of the pandemic. We continue to actively monitor the interest rate environment and make adjustments inresponse to evolving market conditions, bank funding needs and client relationship dynamics.
Corporate & Institutional Banking continues to expand its Corporate Banking business, focused on the middle market and largersectors. We executed on our expansion plans into the Seattle and Portland markets in 2020, and in 2021, we expect the BBVAacquisition to accelerate our expansion efforts across the Southwest, but this has not changed our strategy regarding our de novoexpansion efforts. This follows offices opened in Boston and Phoenix in 2019, Denver, Houston and Nashville in 2018, and Dallas,Kansas City and Minneapolis in 2017. These locations complement Corporate & Institutional Banking national businesses with asignificant presence in these cities, and build on past successes in the markets where PNC’s retail banking presence was limited, suchas in the Southeast. Our full suite of commercial products and services is offered in these locations.
Product RevenueIn addition to credit and deposit products for commercial customers, Corporate & Institutional Banking offers other services, includingtreasury management, capital markets-related products and services, and commercial mortgage banking activities, for customers of allbusiness segments. On a consolidated basis, the revenue from these other services is included in net interest income, corporate servicefees and other noninterest income. From a business perspective, the majority of the revenue and expense related to these services isreflected in the Corporate & Institutional Banking segment results and the remainder is reflected in the results of other businesses. TheOther Information section in Table 12 includes the consolidated revenue to PNC for these services. A discussion of the consolidatedrevenue from these services follows.
The PNC Financial Services Group, Inc. – 2020 Form 10-K 57

The Treasury Management business provides payables, receivables, deposit and account services, liquidity and investments, andonline and mobile banking products and services to our clients. Treasury management revenue is reported in noninterest income andnet interest income. Noninterest income includes treasury management product revenue less earnings credits provided to customers oncompensating deposit balances used to pay for products and services. Net interest income primarily includes revenue from all treasurymanagement customer deposit balances. Compared with 2019, treasury management revenue increased primarily due to higher depositbalances and product revenue, partially offset by narrower interest rate spreads on the value of deposits.
Capital markets-related products and services include foreign exchange, derivatives, securities underwriting, loan syndications,mergers and acquisitions advisory and equity capital markets advisory related services. The increase in capital markets-related revenuein the comparison was broad-based across most products and services and included higher credit valuations and fees on customer-related derivatives activities, underwriting fees, equity capital market advisory fees and asset-backed financing fees.
Commercial mortgage banking activities include revenue derived from commercial mortgage servicing (both net interest income andnoninterest income) and revenue derived from commercial mortgage loans held for sale and related hedges. Total revenue fromcommercial mortgage banking activities increased in the comparison due to higher revenue across all activities.
58 The PNC Financial Services Group, Inc. – 2020 Form 10-K
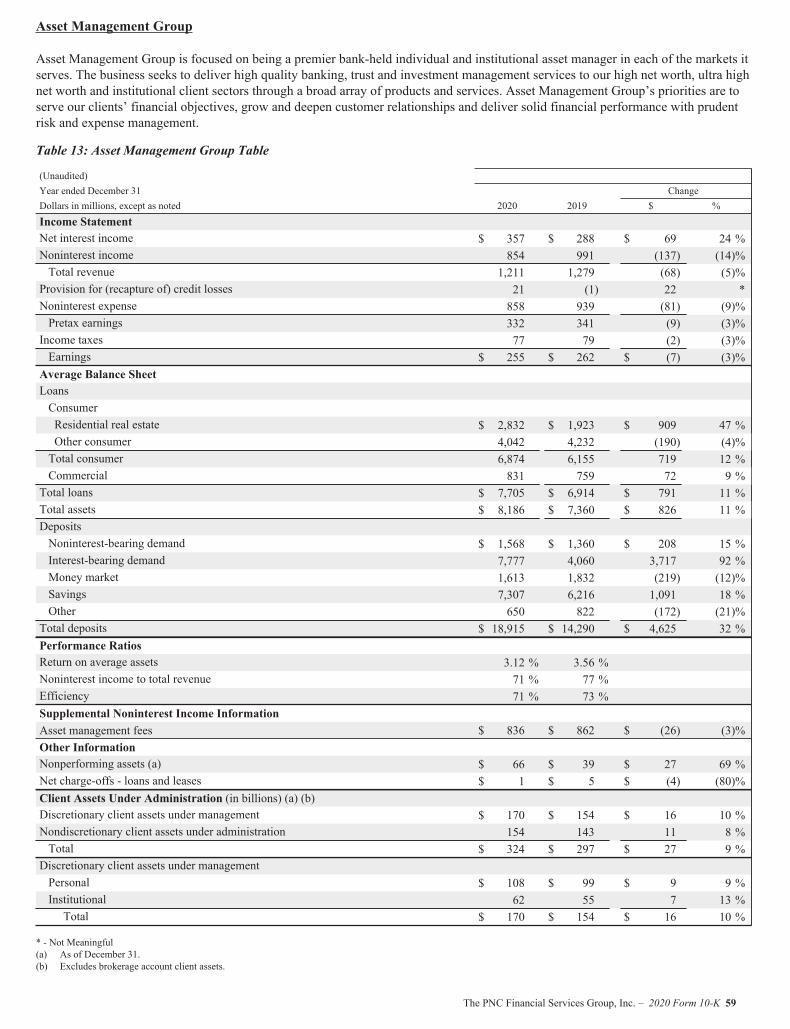
Asset Management Group
Asset Management Group is focused on being a premier bank-held individual and institutional asset manager in each of the markets itserves. The business seeks to deliver high quality banking, trust and investment management services to our high net worth, ultra highnet worth and institutional client sectors through a broad array of products and services. Asset Management Group’s priorities are toserve our clients’ financial objectives, grow and deepen customer relationships and deliver solid financial performance with prudentrisk and expense management.
Table 13: Asset Management Group Table
(Unaudited)Year ended December 31 ChangeDollars in millions, except as noted 2020 2019 $ %
Income StatementNet interest income $ 357 $ 288 $ 69 24 %Noninterest income 854 991 (137) (14)%Total revenue 1,211 1,279 (68) (5)%Provision for (recapture of) credit losses 21 (1) 22 *Noninterest expense 858 939 (81) (9)%Pretax earnings 332 341 (9) (3)%Income taxes 77 79 (2) (3)%Earnings $ 255 $ 262 $ (7) (3)%Average Balance SheetLoansConsumerResidential real estate $ 2,832 $ 1,923 $ 909 47 %Other consumer 4,042 4,232 (190) (4)%Total consumer 6,874 6,155 719 12 %Commercial 831 759 72 9 %Total loans $ 7,705 $ 6,914 $ 791 11 %Total assets $ 8,186 $ 7,360 $ 826 11 %DepositsNoninterest-bearing demand $ 1,568 $ 1,360 $ 208 15 %Interest-bearing demand 7,777 4,060 3,717 92 %Money market 1,613 1,832 (219) (12)%Savings 7,307 6,216 1,091 18 %Other 650 822 (172) (21)%Total deposits $ 18,915 $ 14,290 $ 4,625 32 %Performance RatiosReturn on average assets 3.12 % 3.56 %Noninterest income to total revenue 71 % 77 %Efficiency 71 % 73 %Supplemental Noninterest Income InformationAsset management fees $ 836 $ 862 $ (26) (3)%Other InformationNonperforming assets (a) $ 66 $ 39 $ 27 69 %Net charge-offs - loans and leases $ 1 $ 5 $ (4) (80)%Client Assets Under Administration (in billions) (a) (b)Discretionary client assets under management $ 170 $ 154 $ 16 10 %Nondiscretionary client assets under administration 154 143 11 8 %Total $ 324 $ 297 $ 27 9 %Discretionary client assets under managementPersonal $ 108 $ 99 $ 9 9 %Institutional 62 55 7 13 %Total $ 170 $ 154 $ 16 10 %
* - Not Meaningful(a) As of December 31.(b) Excludes brokerage account client assets.
The PNC Financial Services Group, Inc. – 2020 Form 10-K 59
Asset Management Group earned $255 million in 2020 compared with $262 million in 2019. Earnings decreased primarily due tolower revenue and an increase in provision for credit losses, partially offset by a decrease in noninterest expense.
Net interest income increased due to growth in average loan and deposit balances and wider interest rate spreads on loans, partiallyoffset by narrower interest rate spreads on the value of deposits.
Noninterest income decreased due to lower asset management fees resulting from the impact of 2019 divestiture activities and thegains recognized on the retirement recordkeeping and the PNC Capital Advisors investment management business divestitures in theprior period. This decline was partially offset by increases in the average equity markets.
Noninterest expense decreased in the comparison and was primarily attributable to the impact of the 2019 divestitures and lowervariable costs.
Provision for credit losses increased reflecting changes due to the adoption of the CECL accounting standard, together with thesignificantly adverse economic impacts of the pandemic.
Asset Management Group’s discretionary client assets under management increased in comparison to the prior year primarilyattributable to higher equity markets as of December 31, 2020.
The Asset Management Group strives to be the leading relationship-based provider of investment, planning, banking and fiduciaryservices to wealthy individuals and institutions by proactively delivering value-added ideas, solutions and exceptional service.
Wealth Management and Hawthorn have nearly 100 offices operating in six out of the ten most affluent states in the U.S. with amajority co-located with retail banking branches. The businesses provide customized investments, planning, trust and estateadministration and private banking solutions to affluent individuals and ultra-affluent families.
Institutional Asset Management provides outsourced chief investment officer, custody, private real estate, cash and fixed income clientsolutions, and fiduciary retirement advisory services to institutional clients including corporations, healthcare systems, insurancecompanies, unions, municipalities, and non-profits.
We expect that the BBVA acquisition will allow meaningful opportunities to grow the Asset Management Group segment by enteringinto new markets for both the Wealth Management and Institutional Asset Management businesses.
RISK MANAGEMENT
Enterprise Risk Management
We encounter risk as part of the normal course of operating our business. Accordingly, we design our risk governance framework,referred to as the (ERM) Framework, and risk management processes to help manage this risk. We manage risk in light of our riskappetite to optimize long-term shareholder value while supporting our employees, customers and communities.
Our ERM Framework is structurally aligned with enhanced prudential standards and heightened standards which establish minimumrequirements for the design and implementation of a risk governance framework. This Risk Management section describes our ERMFramework which consists of seven core components that provide executive management and the Board of Directors with anaggregate view of significant risks impacting the organization. The seven core components are risk culture, enterprise strategy(including risk appetite, strategic planning, capital planning and stress testing), risk governance and oversight, risk identification, riskassessments, risk controls and monitoring, and risk aggregation and reporting (see the figure below). The overall Risk Managementsection of this Item 7 also provides an analysis of the firm’s Capital Management and our key areas of risk, which include but are notlimited to Credit, Market, Liquidity and Operational (including Compliance and Information Security). Our use of financialderivatives as part of our overall asset and liability risk management process is also addressed within this Risk Management section.
We operate within a rapidly evolving regulatory environment. Accordingly, we are actively focused on the timely adoption ofapplicable regulatory pronouncements within our ERM Framework.
60 The PNC Financial Services Group, Inc. – 2020 Form 10-K
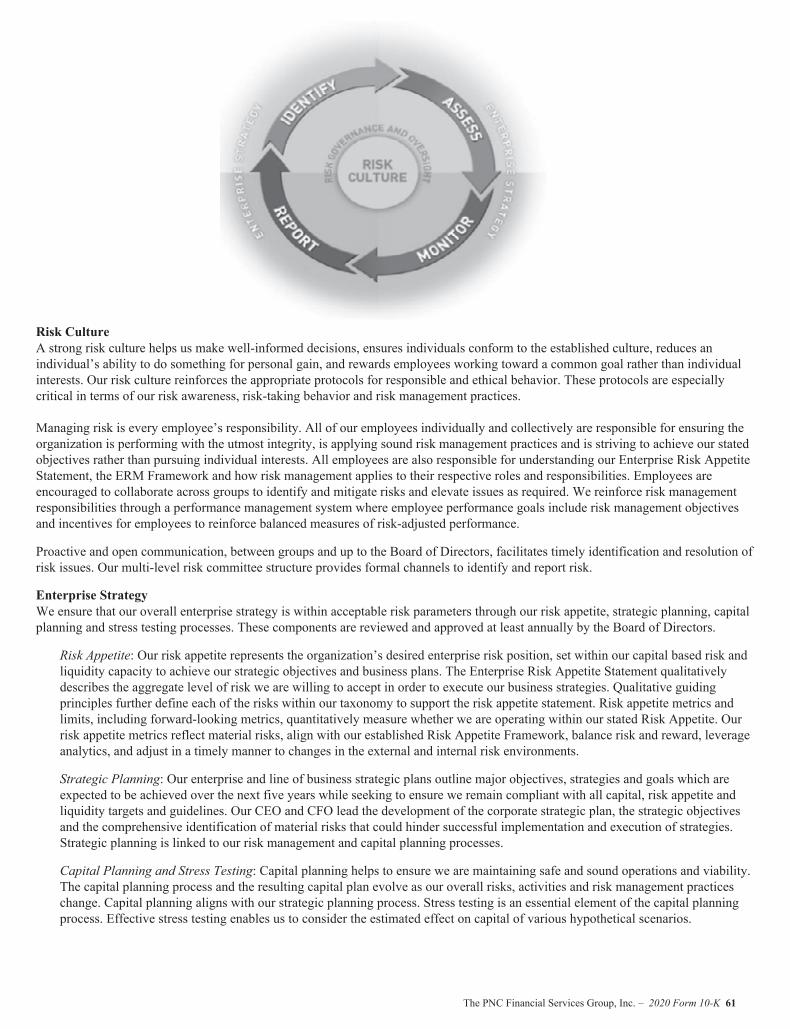
Risk CultureA strong risk culture helps us make well-informed decisions, ensures individuals conform to the established culture, reduces anindividual’s ability to do something for personal gain, and rewards employees working toward a common goal rather than individualinterests. Our risk culture reinforces the appropriate protocols for responsible and ethical behavior. These protocols are especiallycritical in terms of our risk awareness, risk-taking behavior and risk management practices.
Managing risk is every employee’s responsibility. All of our employees individually and collectively are responsible for ensuring theorganization is performing with the utmost integrity, is applying sound risk management practices and is striving to achieve our statedobjectives rather than pursuing individual interests. All employees are also responsible for understanding our Enterprise Risk AppetiteStatement, the ERM Framework and how risk management applies to their respective roles and responsibilities. Employees areencouraged to collaborate across groups to identify and mitigate risks and elevate issues as required. We reinforce risk managementresponsibilities through a performance management system where employee performance goals include risk management objectivesand incentives for employees to reinforce balanced measures of risk-adjusted performance.
Proactive and open communication, between groups and up to the Board of Directors, facilitates timely identification and resolution ofrisk issues. Our multi-level risk committee structure provides formal channels to identify and report risk.
Enterprise StrategyWe ensure that our overall enterprise strategy is within acceptable risk parameters through our risk appetite, strategic planning, capitalplanning and stress testing processes. These components are reviewed and approved at least annually by the Board of Directors.
Risk Appetite: Our risk appetite represents the organization’s desired enterprise risk position, set within our capital based risk andliquidity capacity to achieve our strategic objectives and business plans. The Enterprise Risk Appetite Statement qualitativelydescribes the aggregate level of risk we are willing to accept in order to execute our business strategies. Qualitative guidingprinciples further define each of the risks within our taxonomy to support the risk appetite statement. Risk appetite metrics andlimits, including forward-looking metrics, quantitatively measure whether we are operating within our stated Risk Appetite. Ourrisk appetite metrics reflect material risks, align with our established Risk Appetite Framework, balance risk and reward, leverageanalytics, and adjust in a timely manner to changes in the external and internal risk environments.
Strategic Planning: Our enterprise and line of business strategic plans outline major objectives, strategies and goals which areexpected to be achieved over the next five years while seeking to ensure we remain compliant with all capital, risk appetite andliquidity targets and guidelines. Our CEO and CFO lead the development of the corporate strategic plan, the strategic objectivesand the comprehensive identification of material risks that could hinder successful implementation and execution of strategies.Strategic planning is linked to our risk management and capital planning processes.
Capital Planning and Stress Testing: Capital planning helps to ensure we are maintaining safe and sound operations and viability.The capital planning process and the resulting capital plan evolve as our overall risks, activities and risk management practiceschange. Capital planning aligns with our strategic planning process. Stress testing is an essential element of the capital planningprocess. Effective stress testing enables us to consider the estimated effect on capital of various hypothetical scenarios.
The PNC Financial Services Group, Inc. – 2020 Form 10-K 61
Risk Governance and OversightWe employ a comprehensive risk management governance framework to help ensure that risks are identified, balanced decisions aremade that consider risk and return, and risks are adequately monitored and managed. Risk committees established within this riskgovernance and oversight framework provide oversight for risk management activities at the Board of Directors, executive, corporateand business levels. Committee composition is designed to provide effective oversight balanced across the three lines of defense inaccordance with the OCC’s Heightened Risk Management and Governance Standards and Guidelines and the Federal Reserve Board'sEnhanced Prudential Standards rules. See the Supervision and Regulation section in Item 1 of this Report for more information.
To ensure the appropriate risks are being taken and effectively managed and controlled, risk is managed across three lines of defense.The Board of Directors’ and each line of defense’s responsibilities are detailed below:
Board of Directors – The Board of Directors oversees our risk-taking activities, holds management accountable for adhering tothe ERM Framework and is responsible for exercising sound, independent judgment when assessing risk.
First line of defense – The front line units are accountable for identifying, owning and managing risks to within acceptable levelswhile adhering to the ERM Framework. Our businesses strive to enhance risk management and internal control processes withintheir areas. Integrated and comprehensive processes are designed to adequately manage the business’ risk profile and risk appetitethrough identifying, assessing, monitoring and reporting risks which may significantly impact each business.
Second line of defense – The second line of defense is independent from the first line of defense and is responsible for establishingthe risk governance framework and the standards by each independent risk area for identifying, measuring, monitoring,controlling and reporting aggregate risks. As the second line of defense, the independent risk areas monitor the risks generated bythe first line of defense, review and challenge the implementation of effective risk management practices, and report any issues orexceptions. The risk areas help to ensure processes and controls owned by the businesses are designed and operating as intended,and they may intervene directly in modifying and developing first line of defense risk processes and controls.
Third line of defense – As the third line of defense, Internal Audit is independent from the first and second lines of defense.Internal Audit provides the Board of Directors and executive management comprehensive assurance on the effectiveness of theERM Framework and the risk management practices across the organization.
Within the three lines of defense, the independent risk organization has sufficient authority to influence material decisions. Ourbusiness oversight and decision-making is supported through a governance structure at the Board of Directors and management level.Specific responsibilities include:
Board of Directors – Our Board of Directors oversees our business and affairs as managed by our officers and employees. TheBoard of Directors may receive assistance in carrying out its duties and may delegate authority through the following standingcommittees:• Audit Committee: monitors the integrity of our consolidated financial statements; monitors internal control over financial
reporting; monitors compliance with our code of ethics; evaluates and monitors the qualifications and independence of ourindependent auditors; and evaluates and monitors the performance of our Internal Audit function and our independentauditors.
• Nominating and Governance Committee: oversees the implementation of sound corporate governance principles and practiceswhile promoting our best interests and those of our shareholders.
• Personnel and Compensation Committee: oversees the compensation of our executive officers and other specifiedresponsibilities related to personnel and compensation matters affecting us. The committee is also responsible for evaluatingthe relationship between risk-taking activities and incentive compensation plans.
• Risk Committee: oversees enterprise-wide risk structure and the processes established to identify, measure, monitor andmanage the organization’s risks and evaluates and approves our risk governance framework. The Risk Committee has formeda Technology Subcommittee and a Compliance Subcommittee to facilitate Board-level oversight of risk management in theseareas.
In 2020, the Board created the Special Committee on Equity & Inclusion, which assists the Board in its oversight ofmanagement’s equity and inclusion efforts, internally and externally, focusing on our systemic processes (including for employeesand suppliers); low and moderate income communities (including community development banking, and product offerings andfinancial support for such communities); and advocacy (including partnerships with leading organizations, and advocacy fornecessary structural changes to help provide greater access to the banking system and end systemic racism).
Management Level Executive Committee – The Management Level Executive Committee is responsible for guiding the creationand execution of our business strategy across the company. With this responsibility, the Management Level Executive Committeeexecutes various strategic approval and review activities, with a focus on capital deployment, business performance and riskmanagement. This Committee also helps ensure PNC is staffed with sufficient resources and talent to operate within its riskappetite.
62 The PNC Financial Services Group, Inc. – 2020 Form 10-K
Corporate Committees – The Corporate Committees generally operate based on the delegated approval authority from a Board-level Committee, the Management Level Executive Committee or other Corporate Committees. These Committees operate at thesenior management level and are designed to facilitate the review, evaluation, oversight and approval of key risk activities.
Working Committees – The Working Committees generally operate on delegated approval authority from a Corporate Committee,other Working Committees or provide oversight of regulatory/legal matters. Working Committees are intended to assist in theimplementation of key enterprise-level activities within a business or function and support the oversight of the businesses key riskactivities.
Transactional Committees – Transactional Committees generally operate based on delegated approval authority from a Corporateor Working Committee to approve individual transactions, transactional related activities or movements on the organization'sbalance sheet.
Policies and Procedures – We have established risk management Policies and Procedures to support our ERM Framework,articulate our risk culture, define the parameters and processes within which employees are to manage risk and conduct ourbusiness activities and to provide direction, guidance and clarity on roles and responsibilities to management and the Board ofDirectors. These Policies and Procedures are organized in a multi-tiered framework and require periodic review and approval byrelevant Committees or management.
Risk IdentificationRisk identification takes place across a variety of risk types throughout the organization. These risk types include, but are not limitedto, credit, liquidity and capital, market, operational and compliance. Risks are identified based on a balanced use of analytical toolsand management judgment for both on- and off-balance sheet exposures. Our governance structure supports risk identification byfacilitating assessment of key risk issues, emerging risks and idiosyncratic risks and implementation of mitigation strategies asappropriate. These risks are prioritized based on quantitative and qualitative analysis and assessed against the risk appetite. Multipletools and approaches are used to help identify and prioritize risks, including Risk Appetite Metrics, Key Risk Indicators, KeyPerformance Indicators, Risk Control and Self-Assessments, scenario analysis, stress testing and special investigations.
Risks are aggregated and assessed within and across risk functions or businesses. The aggregated risk information is reviewed andreported at an enterprise level for adherence to the Risk Appetite Framework and approved by the Board of Directors or by appropriatecommittees. This enterprise aggregation and reporting approach promotes the identification and appropriate escalation of materialrisks across the organization and supports an understanding of the cumulative impact of risk in relation to our risk appetite.
Risk AssessmentOnce risks are identified, they are evaluated based on quantitative and qualitative analysis to determine whether they are material. Riskassessments support the overall management of an effective ERM Framework and allow us to control and monitor our actual risk leveland risk management effectiveness through the use of risk measures. Comprehensive, accurate and timely assessments of risk areessential to an effective ERM Framework. Effective risk measurement practices will uncover recurring risks that have beenexperienced in the past; make the known risks easy to monitor, understand, compare and report; and reveal unanticipated risks thatmay not be easy to understand or predict.
Risk Controls and MonitoringOur ERM Framework consists of policies, processes, personnel and control systems. Risk controls and limits provide the linkage fromour Risk Appetite Statement and associated guiding principles to the risk-taking activities of our businesses. In addition to risk appetitelimits, a system of more detailed internal controls exists which oversees and monitors our various processes and functions. Thesecontrol systems measure performance, help employees make correct decisions, help ensure information is accurate and reliable anddocument compliance with laws and regulations.
We design our monitoring and evaluation of risks and controls to provide assurance that policies, procedures and controls are effectiveand also to result in the identification of control improvement recommendations. Risk monitoring is a daily, ongoing process used byboth the first and second line of defense to ensure compliance with our ERM Framework. Risk monitoring is accomplished in manyways, including performing risk assessments at the prime process and risk assessment unit level, monitoring an area’s key controls, thetimely reporting of issues, and establishing a quality control and/or quality assurance function, as applicable.
Risk Aggregation and ReportingRisk reporting is a comprehensive way to: (i) aggregate risks; (ii) identify concentrations; (iii) help ensure we remain within ourestablished risk appetite; (iv) serve as a basis for monitoring our risk profile in relation to our risk appetite and (v) communicate risksto the Board of Directors and executive management.
Risk reports are produced at the line of business, functional risk and enterprise levels. The enterprise level risk report aggregates risksidentified in the risk area reports and in the business reports to define the enterprise risk profile. The enterprise risk profile is a point-in-time assessment of enterprise risk and represents our overall risk position in relation to the desired enterprise risk appetite. The
The PNC Financial Services Group, Inc. – 2020 Form 10-K 63
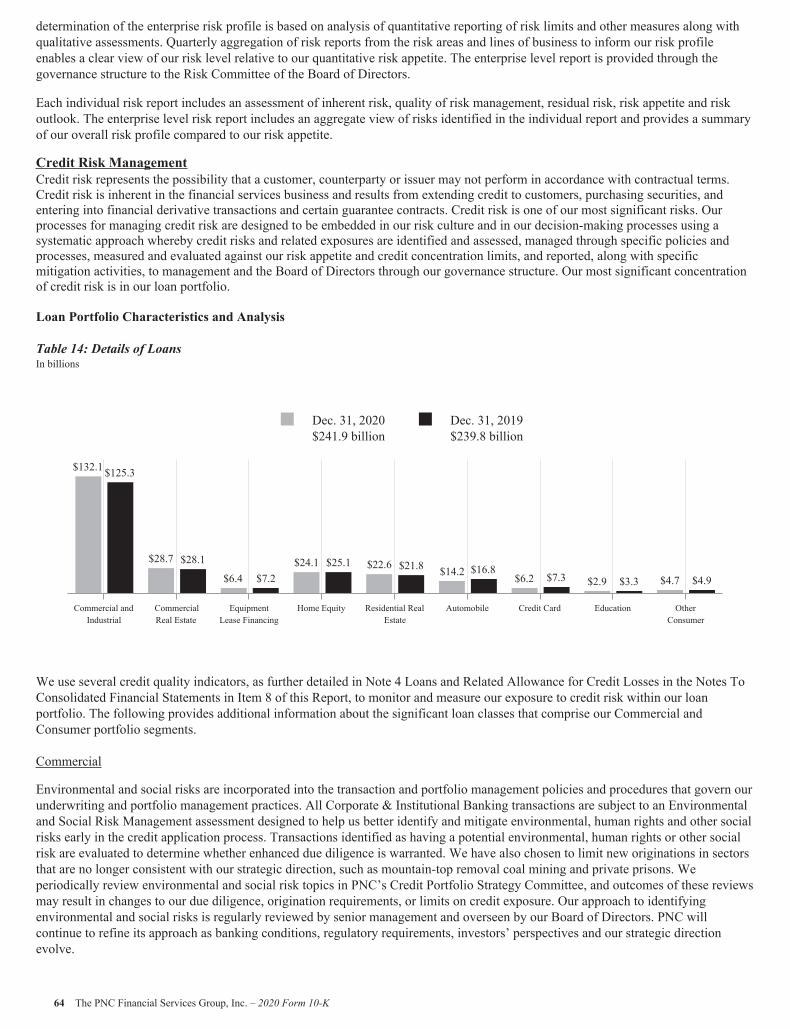
determination of the enterprise risk profile is based on analysis of quantitative reporting of risk limits and other measures along withqualitative assessments. Quarterly aggregation of risk reports from the risk areas and lines of business to inform our risk profileenables a clear view of our risk level relative to our quantitative risk appetite. The enterprise level report is provided through thegovernance structure to the Risk Committee of the Board of Directors.
Each individual risk report includes an assessment of inherent risk, quality of risk management, residual risk, risk appetite and riskoutlook. The enterprise level risk report includes an aggregate view of risks identified in the individual report and provides a summaryof our overall risk profile compared to our risk appetite.
Credit Risk ManagementCredit risk represents the possibility that a customer, counterparty or issuer may not perform in accordance with contractual terms.Credit risk is inherent in the financial services business and results from extending credit to customers, purchasing securities, andentering into financial derivative transactions and certain guarantee contracts. Credit risk is one of our most significant risks. Ourprocesses for managing credit risk are designed to be embedded in our risk culture and in our decision-making processes using asystematic approach whereby credit risks and related exposures are identified and assessed, managed through specific policies andprocesses, measured and evaluated against our risk appetite and credit concentration limits, and reported, along with specificmitigation activities, to management and the Board of Directors through our governance structure. Our most significant concentrationof credit risk is in our loan portfolio.
Loan Portfolio Characteristics and Analysis
Table 14: Details of LoansIn billions
$132.1
$28.7
$6.4$24.1 $22.6 $14.2 $6.2 $2.9 $4.7
$125.3
$28.1
$7.2$25.1 $21.8 $16.8
$7.3 $3.3 $4.9
Dec. 31, 2020$241.9 billion
Dec. 31, 2019$239.8 billion
Commercial andIndustrial
CommercialReal Estate
EquipmentLease Financing
Home Equity Residential RealEstate
Automobile Credit Card Education OtherConsumer
We use several credit quality indicators, as further detailed in Note 4 Loans and Related Allowance for Credit Losses in the Notes ToConsolidated Financial Statements in Item 8 of this Report, to monitor and measure our exposure to credit risk within our loanportfolio. The following provides additional information about the significant loan classes that comprise our Commercial andConsumer portfolio segments.
Commercial
Environmental and social risks are incorporated into the transaction and portfolio management policies and procedures that govern ourunderwriting and portfolio management practices. All Corporate & Institutional Banking transactions are subject to an Environmentaland Social Risk Management assessment designed to help us better identify and mitigate environmental, human rights and other socialrisks early in the credit application process. Transactions identified as having a potential environmental, human rights or other socialrisk are evaluated to determine whether enhanced due diligence is warranted. We have also chosen to limit new originations in sectorsthat are no longer consistent with our strategic direction, such as mountain-top removal coal mining and private prisons. Weperiodically review environmental and social risk topics in PNC’s Credit Portfolio Strategy Committee, and outcomes of these reviewsmay result in changes to our due diligence, origination requirements, or limits on credit exposure. Our approach to identifyingenvironmental and social risks is regularly reviewed by senior management and overseen by our Board of Directors. PNC willcontinue to refine its approach as banking conditions, regulatory requirements, investors’ perspectives and our strategic directionevolve.
64 The PNC Financial Services Group, Inc. – 2020 Form 10-K
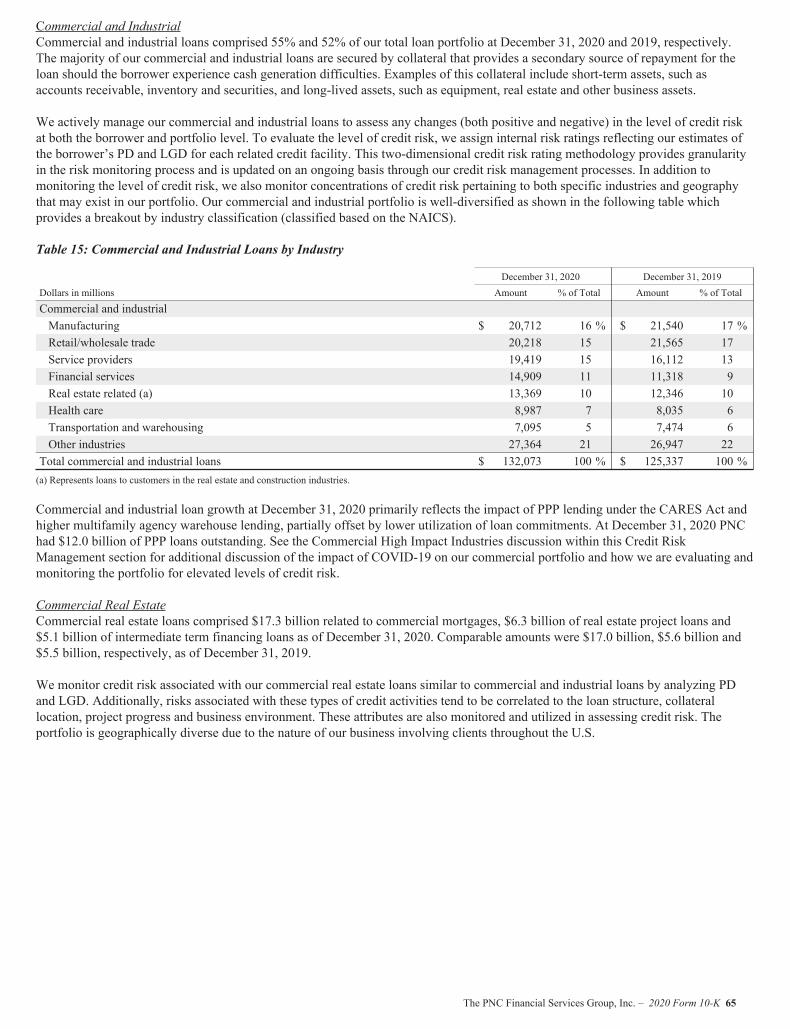
Commercial and IndustrialCommercial and industrial loans comprised 55% and 52% of our total loan portfolio at December 31, 2020 and 2019, respectively.The majority of our commercial and industrial loans are secured by collateral that provides a secondary source of repayment for theloan should the borrower experience cash generation difficulties. Examples of this collateral include short-term assets, such asaccounts receivable, inventory and securities, and long-lived assets, such as equipment, real estate and other business assets.
We actively manage our commercial and industrial loans to assess any changes (both positive and negative) in the level of credit riskat both the borrower and portfolio level. To evaluate the level of credit risk, we assign internal risk ratings reflecting our estimates ofthe borrower’s PD and LGD for each related credit facility. This two-dimensional credit risk rating methodology provides granularityin the risk monitoring process and is updated on an ongoing basis through our credit risk management processes. In addition tomonitoring the level of credit risk, we also monitor concentrations of credit risk pertaining to both specific industries and geographythat may exist in our portfolio. Our commercial and industrial portfolio is well-diversified as shown in the following table whichprovides a breakout by industry classification (classified based on the NAICS).
Table 15: Commercial and Industrial Loans by Industry
December 31, 2020 December 31, 2019Dollars in millions Amount % of Total Amount % of Total
Commercial and industrialManufacturing $ 20,712 16 % $ 21,540 17 %Retail/wholesale trade 20,218 15 21,565 17Service providers 19,419 15 16,112 13Financial services 14,909 11 11,318 9Real estate related (a) 13,369 10 12,346 10Health care 8,987 7 8,035 6Transportation and warehousing 7,095 5 7,474 6Other industries 27,364 21 26,947 22Total commercial and industrial loans $ 132,073 100 % $ 125,337 100 %(a) Represents loans to customers in the real estate and construction industries.
Commercial and industrial loan growth at December 31, 2020 primarily reflects the impact of PPP lending under the CARES Act andhigher multifamily agency warehouse lending, partially offset by lower utilization of loan commitments. At December 31, 2020 PNChad $12.0 billion of PPP loans outstanding. See the Commercial High Impact Industries discussion within this Credit RiskManagement section for additional discussion of the impact of COVID-19 on our commercial portfolio and how we are evaluating andmonitoring the portfolio for elevated levels of credit risk.
Commercial Real EstateCommercial real estate loans comprised $17.3 billion related to commercial mortgages, $6.3 billion of real estate project loans and$5.1 billion of intermediate term financing loans as of December 31, 2020. Comparable amounts were $17.0 billion, $5.6 billion and$5.5 billion, respectively, as of December 31, 2019.
We monitor credit risk associated with our commercial real estate loans similar to commercial and industrial loans by analyzing PDand LGD. Additionally, risks associated with these types of credit activities tend to be correlated to the loan structure, collaterallocation, project progress and business environment. These attributes are also monitored and utilized in assessing credit risk. Theportfolio is geographically diverse due to the nature of our business involving clients throughout the U.S.
The PNC Financial Services Group, Inc. – 2020 Form 10-K 65
The following table presents our commercial real estate loans by geography and property type:
Table 16: Commercial Real Estate Loans by Geography and Property Type
December 31, 2020 December 31, 2019Dollars in millions Amount % of Total Amount % of TotalGeography (a)California $ 4,458 16 % $ 4,393 16 %Florida 2,991 10 2,557 9Texas 2,031 7 1,717 6Maryland 1,770 6 1,889 7Virginia 1,586 6 1,547 6Pennsylvania 1,425 5 1,310 4Ohio 1,247 4 1,307 4New Jersey 1,117 4 1,106 4Illinois 900 3 1,001 4Georgia 859 3 876 3Other 10,332 36 10,407 37Total commercial real estate loans $ 28,716 100 % $ 28,110 100 %Property TypeMultifamily $ 9,617 33 % $ 9,003 32 %Office 7,691 27 7,641 27Retail 3,490 12 3,702 13Industrial/warehouse 1,999 7 2,003 7Hotel/motel 1,954 7 1,813 7Seniors housing 1,417 5 1,123 4Mixed use 835 3 943 3Other 1,713 6 1,882 7Total commercial real estate loans $ 28,716 100 % $ 28,110 100 %(a) Presented in descending order based on loan balances at December 31, 2020.
Commercial High Impact IndustriesIn light of the current economic circumstances related to COVID-19, we are evaluating and monitoring our entire commercialportfolio for elevated levels of credit risk; however, the industry sectors that have been and we believe will continue to be most likelyimpacted by the effects of the pandemic are:
• Non-real estate related• Leisure recreation: restaurants, casinos, hotels, convention centers• Non-essential retail: retail excluding auto, gas, staples• Healthcare facilities: elective, private practices• Consumer services: religious organizations, childcare• Leisure travel: cruise, airlines, other travel/transportation• Other impacted areas: shipping, senior living, specialty education
• Real estate related• Non-essential retail and restaurants: malls, lifestyle centers, outlets, restaurants• Hotel: full service, limited service, extended stay• Seniors housing: assisted living, independent living
As of December 31, 2020, our outstanding loan balances in these industries totaled $17.2 billion, or approximately 7% of our totalloan portfolio, while additional unfunded loan commitments totaled $11.2 billion. We continue to carefully monitor and manage theseloans, and while we have not yet experienced material charge-offs in these industries, we do expect to see further stress.
In our non-real estate related category we have $9.7 billion in loans outstanding, $1.9 billion of which are funded through the PPP andguaranteed by the SBA under the CARES Act. Nonperforming loans in these industries totaled $0.1 billion, or 1% of total loansoutstanding in the non-real estate related category, while criticized assets totaled $1.3 billion at December 31, 2020 with the greateststress seen in the leisure recreation and leisure travel sectors.
Within the real estate related category we have $7.5 billion in loans outstanding, which includes real estate projects of $5.0 billion andunsecured real estate of $2.5 billion. Nonperforming loans in this category totaled $0.2 billion at December 31, 2020, or 3% of total
66 The PNC Financial Services Group, Inc. – 2020 Form 10-K
loans outstanding in the commercial real estate related category, driven primarily by loans related to two real estate investment trusts.In this category, we continue to see substantial stress in the non-essential retail and hotel segments.
Oil and Gas Loan PortfolioWe are also monitoring our oil and gas portfolio closely for elevated levels of credit risk given the continued pressures on the energyindustry. As of December 31, 2020, our outstanding loans in the oil and gas sector totaled $3.4 billion, or 1% of total loans, whichincluded $0.1 billion funded through the PPP and guaranteed by the SBA under the CARES Act. This portfolio comprisedapproximately $1.6 billion in the midstream and downstream sectors, $0.9 billion of oil services companies and $0.9 billion related toexploration and production companies. Of the oil services category, approximately $0.2 billion is not asset-based or investment grade.Nonperforming loans in the oil and gas sector as of December 31, 2020 totaled $0.2 billion, or 6% of total loans outstanding in thissector. Additional unfunded loan commitments for the oil and gas portfolio totaled $7.1 billion at December 31, 2020.
Consumer
Home EquityHome equity loans comprised $12.6 billion of primarily variable-rate home equity lines of credit and $11.5 billion of closed-end homeequity installment loans at December 31, 2020. Comparable amounts were $13.9 billion and $11.2 billion, as of December 31, 2019,respectively.
We track borrower performance monthly, including obtaining original LTVs, updated FICO scores at least quarterly, updated LTVs atleast quarterly, and other credit metrics at least quarterly, including the historical performance of any related mortgage loans regardlessof whether we hold the lien. We also segment the population into pools based on product type (e.g., home equity loans, brokered homeequity loans, home equity lines of credit, brokered home equity lines of credit). This information is used for internal reporting and riskmanagement. As part of our overall risk analysis and monitoring, we also segment the portfolio based upon the loan delinquency,nonperforming status, modification and bankruptcy status, FICO scores, LTV, lien position and geographic concentration.
The credit quality of newly originated loans in 2020 was strong overall with a weighted-average LTV on originations of 67% and aweighted-average FICO score of 776.
The credit performance of the majority of the home equity portfolio where we hold the first lien position is superior to the portion ofthe portfolio where we hold the second lien position, but do not hold the first lien. Lien position information is generally determined atthe time of origination and monitored on an ongoing basis for risk management purposes. We use an industry-leading third-partyservice provider to obtain updated loan information, including lien and collateral data that is aggregated from public and privatesources.
The following table presents our home equity loans by geography and lien type:
Table 17: Home Equity Loans by Geography and by Lien Type
December 31, 2020 December 31, 2019Dollars in millions Amount % of Total Amount % of Total
Geography (a)Pennsylvania $ 5,602 23 % $ 5,812 23 %New Jersey 3,462 14 3,728 15Ohio 2,753 11 2,899 12Florida 1,536 6 1,340 5Illinois 1,411 6 1,544 6Michigan 1,398 6 1,371 5Maryland 1,332 6 1,420 6North Carolina 1,043 4 1,092 4Kentucky 922 4 990 4Indiana 813 3 820 3Other 3,816 17 4,069 17Total home equity loans $ 24,088 100 % $ 25,085 100 %Lien type1st lien 63 % 59 %2nd lien 37 41Total 100 % 100 %(a) Presented in descending order based on loan balances at December 31, 2020.
The PNC Financial Services Group, Inc. – 2020 Form 10-K 67
Residential Real EstateResidential real estate loans primarily consisted of residential mortgage loans at both December 31, 2020 and 2019.
We track borrower performance of this portfolio monthly similarly to home equity loans. We also segment the mortgage portfolio intopools based on product type (e.g., nonconforming, conforming). This information is used for internal reporting and risk management.As part of our overall risk analysis and monitoring, we also segment the portfolio based upon loan delinquency, nonperforming status,modification and bankruptcy status, FICO scores, LTV and geographic concentrations. Loan performance is evaluated by sourceoriginators and loan servicers.
The credit quality of newly originated loans that we retained on our balance sheet in 2020 was strong overall as evidenced by aweighted-average LTV on originations of 67% and a weighted-average FICO score of 775.
The following table presents our residential real estate loans by geography:
Table 18: Residential Real Estate Loans by Geography
December 31, 2020 December 31, 2019Dollars in millions Amount % of Total Amount % of Total
Geography (a)California $ 7,828 35 % $ 6,800 31 %New Jersey 1,635 7 1,779 8Florida 1,620 7 1,580 7Washington 1,104 5 646 3Illinois 1,039 5 1,118 5Pennsylvania 1,036 5 1,113 5New York 1,020 5 1,008 5Virginia 864 4 868 4Maryland 857 4 923 4North Carolina 796 4 877 4Other 4,761 19 5,109 24Total residential real estate loans $ 22,560 100 % $ 21,821 100 %(a) Presented in descending order based on loan balances at December 31, 2020.
We originate residential mortgage loans nationwide through our national mortgage business as well as within our branch network.Residential mortgage loans underwritten to agency standards, including conforming loan amount limits, are typically sold withservicing retained by us. We also originate nonconforming residential mortgage loans that do not meet agency standards, which weretain on our balance sheet. The originated nonconforming residential mortgage portfolio had strong credit quality at December 31,2020 with an average original LTV of 69% and an average original FICO score of 775. Our portfolio of originated nonconformingresidential mortgage loans totaled $17.9 billion at December 31, 2020 with 41% located in California.
AutomobileWithin auto loans, $12.7 billion resided in the indirect auto portfolio while $1.5 billion were in the direct auto portfolio as ofDecember 31, 2020. Comparable amounts as of December 31, 2019 were $15.1 billion and $1.7 billion, respectively. The indirect autoportfolio pertains to loans originated through franchised dealers, including from expansion into new markets. This business isstrategically aligned with our core retail banking business.
The following table presents certain key statistics related to our indirect and direct auto portfolios:
Table 19: Auto Loan Key StatisticsDecember 31, 2020 December 31, 2019
Weighted-average loan origination FICO score (a)Indirect auto 784 757Direct auto 768 769Weighted-average term of loan originations - in months (a)Indirect auto 72 74Direct auto 62 63(a) Weighted-averages calculated for the years ended December 31, 2020 and 2019.
68 The PNC Financial Services Group, Inc. – 2020 Form 10-K
We continue to focus on borrowers with strong credit profiles as evidenced by the weighted-average loan origination FICO scoresnoted in Table 19. We offer both new and used auto financing to customers through our various channels. At December 31, 2020, theportfolio balance was composed of 56% new vehicle loans and 44% used vehicle loans. Comparable amounts at December 31, 2019were 55% and 45%, respectively.
The auto loan portfolio’s performance is measured monthly, including updated collateral values that are obtained monthly and updatedFICO scores that are obtained at least quarterly. For internal reporting and risk management, we analyze the portfolio by productchannel and product type and regularly evaluate default and delinquency experience. As part of our overall risk analysis andmonitoring, we segment the portfolio by loan structure, collateral attributes and credit metrics which include FICO score, LTV andterm.
Nonperforming Assets and Loan Delinquencies
Nonperforming AssetsNonperforming assets include nonperforming loans and leases for which ultimate collectability of the full amount of contractualprincipal and interest is not probable and include nonperforming TDRs, OREO and foreclosed assets. Loans held for sale, certaingovernment insured or guaranteed loans and loans accounted for under the fair value option are excluded from nonperforming loans.Amounts as of December 31, 2019 also excluded purchased impaired loans as we were accreting interest income over the expected lifeof the loans. In connection with the adoption of the CECL standard, nonperforming loans as of December 31, 2020 include PCD loanswhich meet the criteria to be classified as nonperforming. See Note 1 Accounting Policies in the Notes To Consolidated FinancialStatements in Item 8 of this Report for details on our nonaccrual policies and additional information related to the adoption of theCECL standard, including the discontinuation of purchased impaired loan accounting.
The following table presents a summary of nonperforming assets by major category:
Table 20: Nonperforming Assets by Type
December 312020
December 312019
ChangeDollars in millions $ %
Nonperforming loansCommercial $ 923 $ 501 $ 422 84%Consumer (a) 1,363 1,134 229 20%Total nonperforming loans 2,286 1,635 651 40%OREO and foreclosed assets 51 117 (66) (56)%Total nonperforming assets $ 2,337 $ 1,752 $ 585 33%TDRs included in nonperforming loans $ 902 $ 843 $ 59 7%Percentage of total nonperforming loans 39 % 52 %Nonperforming loans to total loans 0.94 % 0.68 %Nonperforming assets to total loans, OREO and foreclosed assets 0.97 % 0.73 %Nonperforming assets to total assets 0.50 % 0.43 %Allowance for loan and lease losses to nonperforming loans (b) 235 % 168 %(a) Excludes most unsecured consumer loans and lines of credit, which are charged off after 120 to 180 days past due and are not placed on nonperforming status.(b) Ratio at December 31, 2020 reflects the changes in ALLL methodology due to the adoption of the CECL accounting standard on January 1, 2020, along with increases in
reserves during 2020 due to the significantly adverse economic impacts of the pandemic and its resulting effects on loan portfolio credit quality and loan growth.
The increase in nonperforming assets at December 31, 2020 was primarily attributable to higher nonperforming commercial loans inindustries adversely impacted by the pandemic and the energy industry and an increase in residential real estate nonperforming loansprimarily related to borrowers exiting forbearance and deferring payments to the end of the loan term, partially offset by the decline inOREO and foreclosed assets due to asset sales and the suspension of pandemic-related foreclosures. See the discussion of CommercialHigh Impact Industries and the Oil and Gas Loan Portfolio within this Credit Risk Management section for further detail on theseindustries.
The PNC Financial Services Group, Inc. – 2020 Form 10-K 69
The following table provides details on the change in nonperforming assets for the years ended December 31, 2020 and 2019:
Table 21: Change in Nonperforming Assets
In millions 2020 2019January 1 $ 1,752 $ 1,808New nonperforming assets 1,947 1,342Charge-offs and valuation adjustments (421) (664)Principal activity, including paydowns and payoffs (603) (472)Asset sales and transfers to loans held for sale (82) (95)Returned to performing status (256) (167)December 31 $ 2,337 $ 1,752
As of December 31, 2020, approximately 97% of total nonperforming loans were secured by collateral which lessened reserverequirements and is expected to reduce credit losses. As of December 31, 2020, commercial nonperforming loans were carried atapproximately 83% of their unpaid principal balance, due to charge-offs and interest applied to principal, before consideration of theALLL.
Within consumer nonperforming loans, residential real estate TDRs comprised 47% of total residential real estate nonperformingloans, while home equity TDRs comprised 41% of home equity nonperforming loans at December 31, 2020. Comparable amounts atDecember 31, 2019 were 79% and 49%, respectively. TDRs generally remain in nonperforming status until a borrower has made atleast six consecutive months of both principal and interest payments under the modified terms or ultimate resolution occurs. Loanswhere borrowers have been discharged from personal liability through Chapter 7 bankruptcy and have not formally reaffirmed theirloan obligations to us and loans to borrowers not currently obligated to make both principal and interest payments under therestructured terms are not returned to accrual status. Loans that have been restructured for COVID-19 related hardships and meetcertain criteria under the CARES Act are not identified as TDRs. Refer to the Troubled Debt Restructurings and Loan Modificationsdiscussion in this Credit Risk Management section for more information on the treatment of loan modifications under the CARES Act.
At December 31, 2020, our largest nonperforming asset was $141 million in the Real Estate and Rental and Leasing industry and theten largest individual nonperforming assets represented 19% of total nonperforming assets.
Loan DelinquenciesWe regularly monitor the level of loan delinquencies and believe these levels may be a key indicator of credit quality in our loanportfolio. Measurement of delinquency status is based on the contractual terms of each loan. Loans that are 30 days or more past duein terms of payment are considered delinquent. Loan delinquencies include government insured or guaranteed loans and loansaccounted for under the fair value option, and at December 31, 2020 also include PCD loans. Amounts exclude loans held for sale,while amounts as of December 31, 2019 also excluded purchased impaired loans.
Pursuant to the interagency guidance issued in April 2020 and in connection with the credit reporting rules from the CARES Act, theDecember 31, 2020 delinquency status of loans modified due to COVID-19 related hardships aligns with the rules set forth for banksto report delinquency status to the credit agencies. These rules require that COVID-19 related loan modifications be reported asfollows:
• if current at the time of modification, the loan remains current throughout the modification period,• if delinquent at the time of modification and the borrower was not made current as part of the modification, the loan
maintains its reported delinquent status during the modification period, or• if delinquent at the time of modification and the borrower was made current as part of the modification or became current
during the modification period, the loan is reported as current.
As a result, certain loans modified due to COVID-19 related hardships are not being reported as past due as of December 31, 2020based on the contractual terms of the loan, even where borrowers may not be making payments on their loans during the modificationperiod. Loan modifications due to COVID-19 related hardships that permanently reduce either the contractual interest rate or theprincipal balance of a loan do not qualify for TDR relief under the CARES Act or the interagency guidance. See the COVID-19 Reliefsection in Item 1 of this Report for more information on the CARES Act and the related interagency guidance.
70 The PNC Financial Services Group, Inc. – 2020 Form 10-K
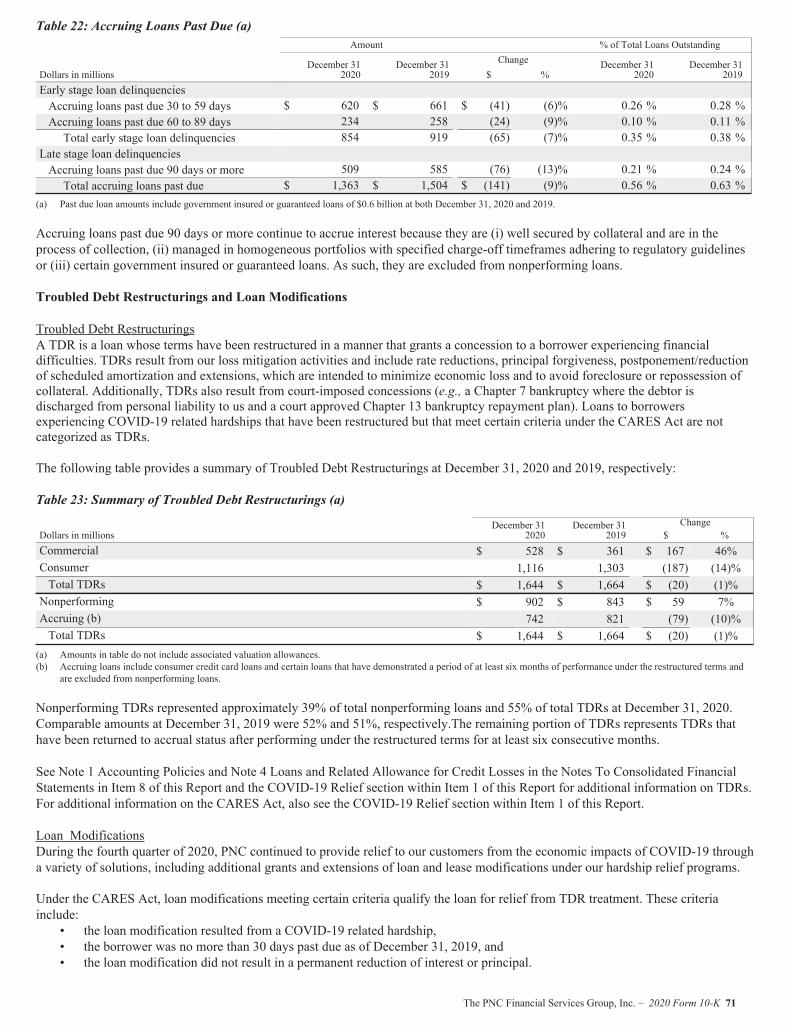
Table 22: Accruing Loans Past Due (a)Amount % of Total Loans Outstanding
December 312020
December 312019
Change December 312020
December 312019Dollars in millions $ %
Early stage loan delinquenciesAccruing loans past due 30 to 59 days $ 620 $ 661 $ (41) (6)% 0.26 % 0.28 %Accruing loans past due 60 to 89 days 234 258 (24) (9)% 0.10 % 0.11 %Total early stage loan delinquencies 854 919 (65) (7)% 0.35 % 0.38 %
Late stage loan delinquenciesAccruing loans past due 90 days or more 509 585 (76) (13)% 0.21 % 0.24 %Total accruing loans past due $ 1,363 $ 1,504 $ (141) (9)% 0.56 % 0.63 %
(a) Past due loan amounts include government insured or guaranteed loans of $0.6 billion at both December 31, 2020 and 2019.
Accruing loans past due 90 days or more continue to accrue interest because they are (i) well secured by collateral and are in theprocess of collection, (ii) managed in homogeneous portfolios with specified charge-off timeframes adhering to regulatory guidelinesor (iii) certain government insured or guaranteed loans. As such, they are excluded from nonperforming loans.
Troubled Debt Restructurings and Loan Modifications
Troubled Debt RestructuringsA TDR is a loan whose terms have been restructured in a manner that grants a concession to a borrower experiencing financialdifficulties. TDRs result from our loss mitigation activities and include rate reductions, principal forgiveness, postponement/reductionof scheduled amortization and extensions, which are intended to minimize economic loss and to avoid foreclosure or repossession ofcollateral. Additionally, TDRs also result from court-imposed concessions (e.g., a Chapter 7 bankruptcy where the debtor isdischarged from personal liability to us and a court approved Chapter 13 bankruptcy repayment plan). Loans to borrowersexperiencing COVID-19 related hardships that have been restructured but that meet certain criteria under the CARES Act are notcategorized as TDRs.
The following table provides a summary of Troubled Debt Restructurings at December 31, 2020 and 2019, respectively:
Table 23: Summary of Troubled Debt Restructurings (a)
December 312020
December 312019
ChangeDollars in millions $ %Commercial $ 528 $ 361 $ 167 46%Consumer 1,116 1,303 (187) (14)%Total TDRs $ 1,644 $ 1,664 $ (20) (1)%Nonperforming $ 902 $ 843 $ 59 7%Accruing (b) 742 821 (79) (10)%Total TDRs $ 1,644 $ 1,664 $ (20) (1)%
(a) Amounts in table do not include associated valuation allowances.(b) Accruing loans include consumer credit card loans and certain loans that have demonstrated a period of at least six months of performance under the restructured terms and
are excluded from nonperforming loans.
Nonperforming TDRs represented approximately 39% of total nonperforming loans and 55% of total TDRs at December 31, 2020.Comparable amounts at December 31, 2019 were 52% and 51%, respectively.The remaining portion of TDRs represents TDRs thathave been returned to accrual status after performing under the restructured terms for at least six consecutive months.
See Note 1 Accounting Policies and Note 4 Loans and Related Allowance for Credit Losses in the Notes To Consolidated FinancialStatements in Item 8 of this Report and the COVID-19 Relief section within Item 1 of this Report for additional information on TDRs.For additional information on the CARES Act, also see the COVID-19 Relief section within Item 1 of this Report.
Loan ModificationsDuring the fourth quarter of 2020, PNC continued to provide relief to our customers from the economic impacts of COVID-19 througha variety of solutions, including additional grants and extensions of loan and lease modifications under our hardship relief programs.
Under the CARES Act, loan modifications meeting certain criteria qualify the loan for relief from TDR treatment. These criteriainclude:
• the loan modification resulted from a COVID-19 related hardship,• the borrower was no more than 30 days past due as of December 31, 2019, and• the loan modification did not result in a permanent reduction of interest or principal.
The PNC Financial Services Group, Inc. – 2020 Form 10-K 71

Loans that do not meet the criteria for TDR relief under the CARES Act may be evaluated under interagency guidance, which allowsbanks to not designate certain short-term modifications as TDRs for borrowers with COVID-19 hardships who were current on theirpayments prior to the modification. Loan modifications related to COVID-19 hardships that permanently reduce either the contractualinterest rate and/or principal balance of the loan are designated as TDRs. For additional information on the CARES Act andinteragency guidance, see the COVID-19 Relief section within Item 1 of this Report.
The impact of these modifications was considered within the quarterly reserve determination. See the Allowance for Credit Lossesdiscussion within the Critical Accounting Estimates and Judgments section for additional information. Refer to the LoanDelinquencies discussion in this Credit Risk Management section for information on how these hardship related loan modifications arereported from a delinquency perspective as of December 31, 2020.
Commercial Loan and Lease Modifications Under COVID-19 Hardship Relief ProgramsDuring the fourth quarter of 2020, PNC continued to selectively grant temporary loan and lease modifications to our commercialclients although the volume of this activity declined significantly from earlier in the year. Modifications made were in the form ofprincipal and/or interest (payment) deferrals, covenant waivers and other types of modifications, including term extensions, and werebased on each individual borrower’s situation.
Commercial accounts in active assistance under COVID-19 hardship relief payment deferral programs totaled $0.1 billion, or 0.1% oftotal commercial loans at December 31, 2020.
We are monitoring the delinquency status of loans exiting assistance as a measure to assess credit risk. As of December 31, 2020,approximately 99% of the accruing commercial loans that have exited COVID-19 payment deferral programs were current or less than30 days past due.
Consumer Loan Modifications Under Hardship Relief ProgramsOur consumer loan modification programs are being granted in response to customer hardships that extended beyond the initial reliefperiod. These loan and line modifications include all hardship related modifications, and the primary offerings as of December 31,2020 are described in the following matrix.
Modification Type Home EquityResidentialReal Estate Automobile Credit Card Education
OtherConsumer
Extensions - Defers current payments and moves them to theend of the loan by extending the loan’s maturity or theextension re-amortizes the remaining principal balance. a a a aForbearance - Part or all of the payments are deferred andmoved to the end of the forbearance period. Balance is due atthe end of the forbearance period, but payment options maybe available to repay the forborne amount, including for manyborrowers an option to delay payment until the payoff ormaturity of the loan. a aMinimum payment suspension - Reduces required minimumpayment to $0 for a period of time. a a aNew loan terms - Sets loan terms to a new monthly paymentof principal and interest based on customer’s financialsituation. a a aReduced payments - Allows the customer to make a lowerpayment for a period of time, with any deferred balance beingmoved to the end of the loan term or extending the loan’smaturity. a aRepayment plan - Allows reduced payment and interest ratefor a period of time. a a
Interest continues to accrue during the relief period for loans modified in these programs unless the loan was designated as anonperforming TDR or was on nonaccrual at the date of modification. The method of collection of the accrued interest is dependent onthe product type and modification offered.
During the fourth quarter of 2020, we continued to see a reduction in the number of consumers requesting hardship assistance from thepeak in the summer of 2020, which has led to additional declines in loans under modification that present credit risk to PNC atDecember 31, 2020.
72 The PNC Financial Services Group, Inc. – 2020 Form 10-K
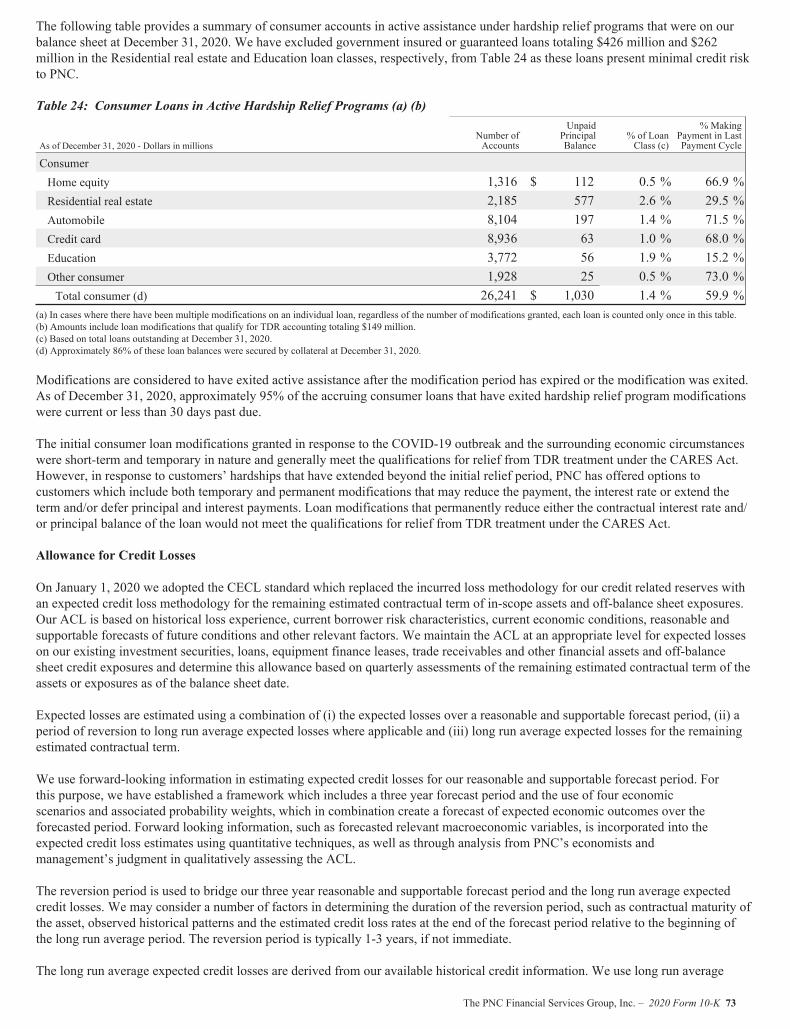
The following table provides a summary of consumer accounts in active assistance under hardship relief programs that were on ourbalance sheet at December 31, 2020. We have excluded government insured or guaranteed loans totaling $426 million and $262million in the Residential real estate and Education loan classes, respectively, from Table 24 as these loans present minimal credit riskto PNC.
Table 24: Consumer Loans in Active Hardship Relief Programs (a) (b)
As of December 31, 2020 - Dollars in millionsNumber ofAccounts
UnpaidPrincipalBalance
% of LoanClass (c)
% MakingPayment in LastPayment Cycle
ConsumerHome equity 1,316 $ 112 0.5 % 66.9 %Residential real estate 2,185 577 2.6 % 29.5 %Automobile 8,104 197 1.4 % 71.5 %Credit card 8,936 63 1.0 % 68.0 %Education 3,772 56 1.9 % 15.2 %Other consumer 1,928 25 0.5 % 73.0 %Total consumer (d) 26,241 $ 1,030 1.4 % 59.9 %
(a) In cases where there have been multiple modifications on an individual loan, regardless of the number of modifications granted, each loan is counted only once in this table.(b) Amounts include loan modifications that qualify for TDR accounting totaling $149 million.(c) Based on total loans outstanding at December 31, 2020.(d) Approximately 86% of these loan balances were secured by collateral at December 31, 2020.
Modifications are considered to have exited active assistance after the modification period has expired or the modification was exited.As of December 31, 2020, approximately 95% of the accruing consumer loans that have exited hardship relief program modificationswere current or less than 30 days past due.
The initial consumer loan modifications granted in response to the COVID-19 outbreak and the surrounding economic circumstanceswere short-term and temporary in nature and generally meet the qualifications for relief from TDR treatment under the CARES Act.However, in response to customers’ hardships that have extended beyond the initial relief period, PNC has offered options tocustomers which include both temporary and permanent modifications that may reduce the payment, the interest rate or extend theterm and/or defer principal and interest payments. Loan modifications that permanently reduce either the contractual interest rate and/or principal balance of the loan would not meet the qualifications for relief from TDR treatment under the CARES Act.
Allowance for Credit Losses
On January 1, 2020 we adopted the CECL standard which replaced the incurred loss methodology for our credit related reserves withan expected credit loss methodology for the remaining estimated contractual term of in-scope assets and off-balance sheet exposures.Our ACL is based on historical loss experience, current borrower risk characteristics, current economic conditions, reasonable andsupportable forecasts of future conditions and other relevant factors. We maintain the ACL at an appropriate level for expected losseson our existing investment securities, loans, equipment finance leases, trade receivables and other financial assets and off-balancesheet credit exposures and determine this allowance based on quarterly assessments of the remaining estimated contractual term of theassets or exposures as of the balance sheet date.
Expected losses are estimated using a combination of (i) the expected losses over a reasonable and supportable forecast period, (ii) aperiod of reversion to long run average expected losses where applicable and (iii) long run average expected losses for the remainingestimated contractual term.
We use forward-looking information in estimating expected credit losses for our reasonable and supportable forecast period. Forthis purpose, we have established a framework which includes a three year forecast period and the use of four economicscenarios and associated probability weights, which in combination create a forecast of expected economic outcomes over theforecasted period. Forward looking information, such as forecasted relevant macroeconomic variables, is incorporated into theexpected credit loss estimates using quantitative techniques, as well as through analysis from PNC’s economists andmanagement’s judgment in qualitatively assessing the ACL.
The reversion period is used to bridge our three year reasonable and supportable forecast period and the long run average expectedcredit losses. We may consider a number of factors in determining the duration of the reversion period, such as contractual maturity ofthe asset, observed historical patterns and the estimated credit loss rates at the end of the forecast period relative to the beginning ofthe long run average period. The reversion period is typically 1-3 years, if not immediate.
The long run average expected credit losses are derived from our available historical credit information. We use long run average
The PNC Financial Services Group, Inc. – 2020 Form 10-K 73
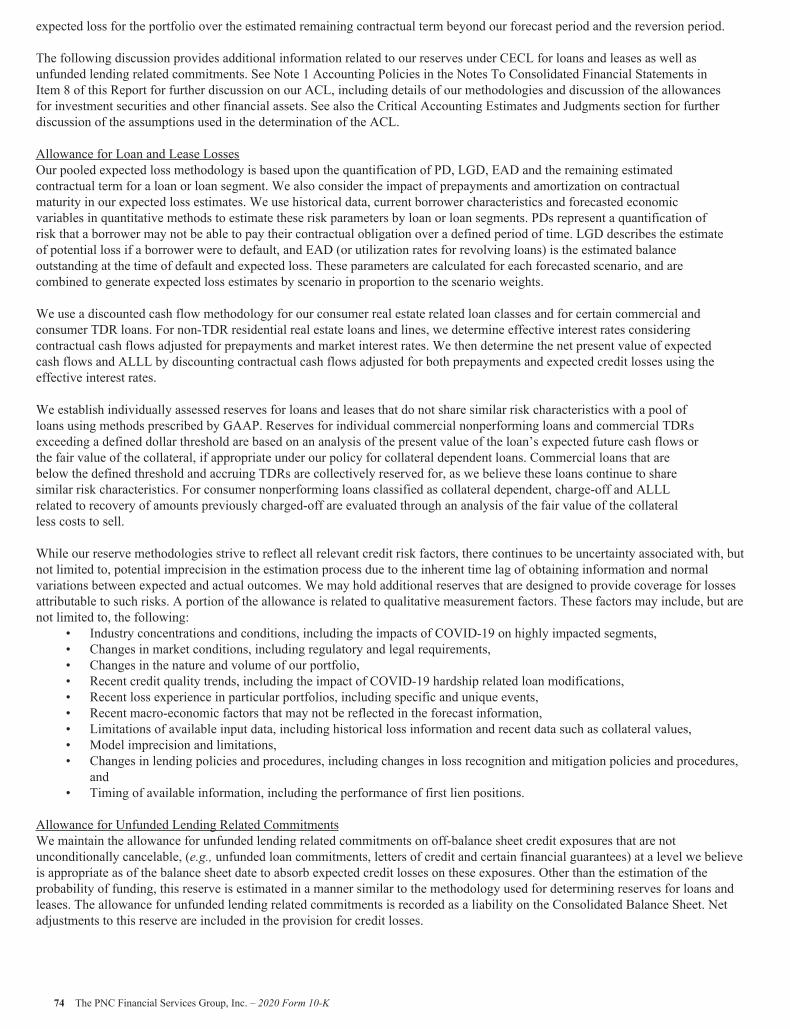
expected loss for the portfolio over the estimated remaining contractual term beyond our forecast period and the reversion period.
The following discussion provides additional information related to our reserves under CECL for loans and leases as well asunfunded lending related commitments. See Note 1 Accounting Policies in the Notes To Consolidated Financial Statements inItem 8 of this Report for further discussion on our ACL, including details of our methodologies and discussion of the allowancesfor investment securities and other financial assets. See also the Critical Accounting Estimates and Judgments section for furtherdiscussion of the assumptions used in the determination of the ACL.
Allowance for Loan and Lease LossesOur pooled expected loss methodology is based upon the quantification of PD, LGD, EAD and the remaining estimatedcontractual term for a loan or loan segment. We also consider the impact of prepayments and amortization on contractualmaturity in our expected loss estimates. We use historical data, current borrower characteristics and forecasted economicvariables in quantitative methods to estimate these risk parameters by loan or loan segments. PDs represent a quantification ofrisk that a borrower may not be able to pay their contractual obligation over a defined period of time. LGD describes the estimateof potential loss if a borrower were to default, and EAD (or utilization rates for revolving loans) is the estimated balanceoutstanding at the time of default and expected loss. These parameters are calculated for each forecasted scenario, and arecombined to generate expected loss estimates by scenario in proportion to the scenario weights.
We use a discounted cash flow methodology for our consumer real estate related loan classes and for certain commercial andconsumer TDR loans. For non-TDR residential real estate loans and lines, we determine effective interest rates consideringcontractual cash flows adjusted for prepayments and market interest rates. We then determine the net present value of expectedcash flows and ALLL by discounting contractual cash flows adjusted for both prepayments and expected credit losses using theeffective interest rates.
We establish individually assessed reserves for loans and leases that do not share similar risk characteristics with a pool ofloans using methods prescribed by GAAP. Reserves for individual commercial nonperforming loans and commercial TDRsexceeding a defined dollar threshold are based on an analysis of the present value of the loan’s expected future cash flows orthe fair value of the collateral, if appropriate under our policy for collateral dependent loans. Commercial loans that arebelow the defined threshold and accruing TDRs are collectively reserved for, as we believe these loans continue to sharesimilar risk characteristics. For consumer nonperforming loans classified as collateral dependent, charge-off and ALLLrelated to recovery of amounts previously charged-off are evaluated through an analysis of the fair value of the collateralless costs to sell.
While our reserve methodologies strive to reflect all relevant credit risk factors, there continues to be uncertainty associated with, butnot limited to, potential imprecision in the estimation process due to the inherent time lag of obtaining information and normalvariations between expected and actual outcomes. We may hold additional reserves that are designed to provide coverage for lossesattributable to such risks. A portion of the allowance is related to qualitative measurement factors. These factors may include, but arenot limited to, the following:
• Industry concentrations and conditions, including the impacts of COVID-19 on highly impacted segments,• Changes in market conditions, including regulatory and legal requirements,• Changes in the nature and volume of our portfolio,• Recent credit quality trends, including the impact of COVID-19 hardship related loan modifications,• Recent loss experience in particular portfolios, including specific and unique events,• Recent macro-economic factors that may not be reflected in the forecast information,• Limitations of available input data, including historical loss information and recent data such as collateral values,• Model imprecision and limitations,• Changes in lending policies and procedures, including changes in loss recognition and mitigation policies and procedures,
and• Timing of available information, including the performance of first lien positions.
Allowance for Unfunded Lending Related CommitmentsWe maintain the allowance for unfunded lending related commitments on off-balance sheet credit exposures that are notunconditionally cancelable, (e.g., unfunded loan commitments, letters of credit and certain financial guarantees) at a level we believeis appropriate as of the balance sheet date to absorb expected credit losses on these exposures. Other than the estimation of theprobability of funding, this reserve is estimated in a manner similar to the methodology used for determining reserves for loans andleases. The allowance for unfunded lending related commitments is recorded as a liability on the Consolidated Balance Sheet. Netadjustments to this reserve are included in the provision for credit losses.
74 The PNC Financial Services Group, Inc. – 2020 Form 10-K
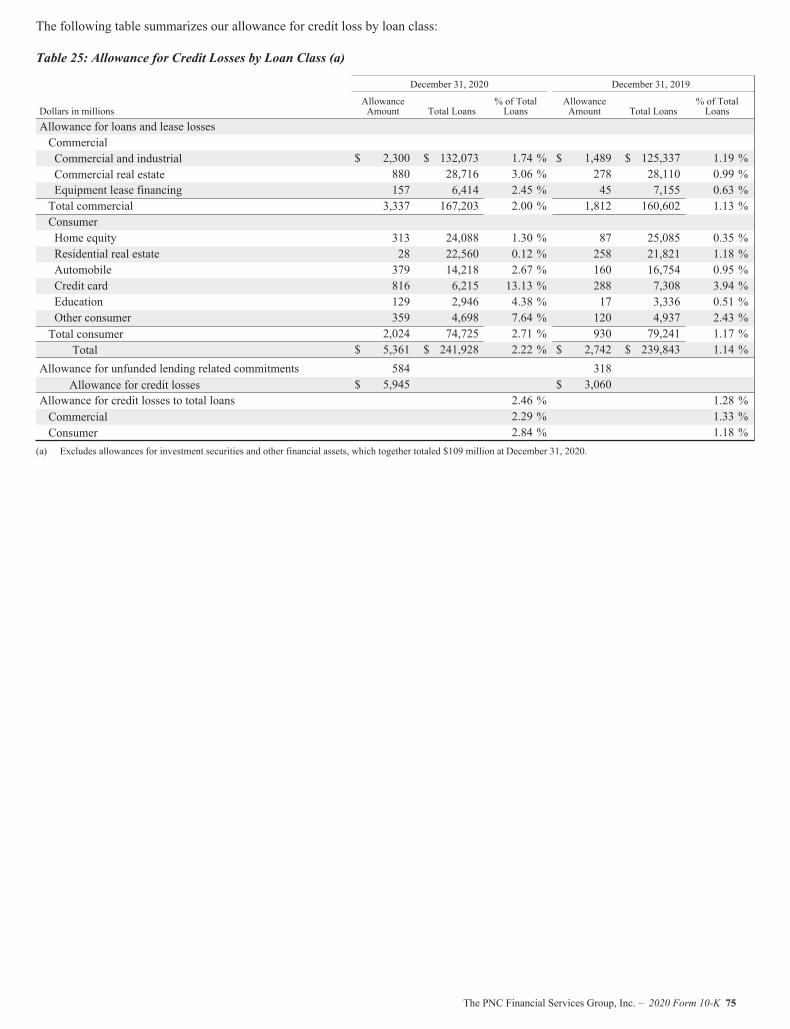
The following table summarizes our allowance for credit loss by loan class:
Table 25: Allowance for Credit Losses by Loan Class (a)
December 31, 2020 December 31, 2019
Dollars in millionsAllowanceAmount Total Loans
% of TotalLoans
AllowanceAmount Total Loans
% of TotalLoans
Allowance for loans and lease lossesCommercialCommercial and industrial $ 2,300 $ 132,073 1.74 % $ 1,489 $ 125,337 1.19 %Commercial real estate 880 28,716 3.06 % 278 28,110 0.99 %Equipment lease financing 157 6,414 2.45 % 45 7,155 0.63 %Total commercial 3,337 167,203 2.00 % 1,812 160,602 1.13 %ConsumerHome equity 313 24,088 1.30 % 87 25,085 0.35 %Residential real estate 28 22,560 0.12 % 258 21,821 1.18 %Automobile 379 14,218 2.67 % 160 16,754 0.95 %Credit card 816 6,215 13.13 % 288 7,308 3.94 %Education 129 2,946 4.38 % 17 3,336 0.51 %Other consumer 359 4,698 7.64 % 120 4,937 2.43 %Total consumer 2,024 74,725 2.71 % 930 79,241 1.17 %
Total $ 5,361 $ 241,928 2.22 % $ 2,742 $ 239,843 1.14 %Allowance for unfunded lending related commitments 584 318
Allowance for credit losses $ 5,945 $ 3,060Allowance for credit losses to total loans 2.46 % 1.28 %Commercial 2.29 % 1.33 %Consumer 2.84 % 1.18 %
(a) Excludes allowances for investment securities and other financial assets, which together totaled $109 million at December 31, 2020.
The PNC Financial Services Group, Inc. – 2020 Form 10-K 75
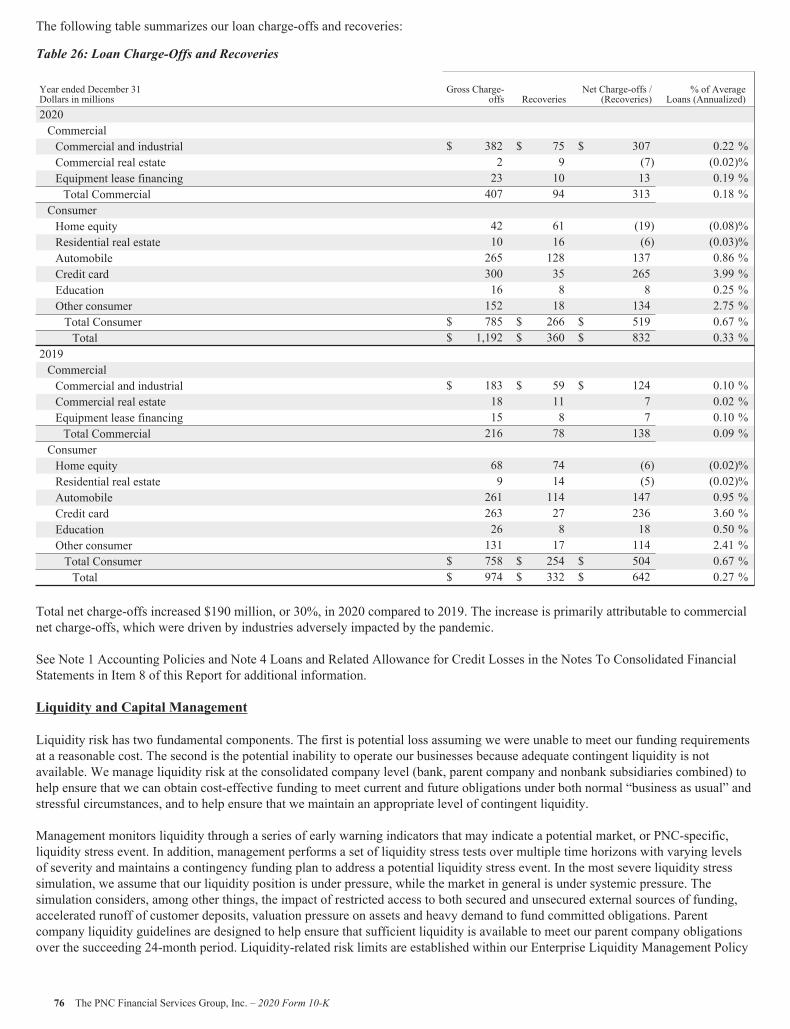
The following table summarizes our loan charge-offs and recoveries:
Table 26: Loan Charge-Offs and Recoveries
Year ended December 31Dollars in millions
Gross Charge-offs Recoveries
Net Charge-offs /(Recoveries)
% of AverageLoans (Annualized)
2020CommercialCommercial and industrial $ 382 $ 75 $ 307 0.22 %Commercial real estate 2 9 (7) (0.02)%Equipment lease financing 23 10 13 0.19 %Total Commercial 407 94 313 0.18 %
ConsumerHome equity 42 61 (19) (0.08)%Residential real estate 10 16 (6) (0.03)%Automobile 265 128 137 0.86 %Credit card 300 35 265 3.99 %Education 16 8 8 0.25 %Other consumer 152 18 134 2.75 %Total Consumer $ 785 $ 266 $ 519 0.67 %Total $ 1,192 $ 360 $ 832 0.33 %
2019CommercialCommercial and industrial $ 183 $ 59 $ 124 0.10 %Commercial real estate 18 11 7 0.02 %Equipment lease financing 15 8 7 0.10 %Total Commercial 216 78 138 0.09 %
ConsumerHome equity 68 74 (6) (0.02)%Residential real estate 9 14 (5) (0.02)%Automobile 261 114 147 0.95 %Credit card 263 27 236 3.60 %Education 26 8 18 0.50 %Other consumer 131 17 114 2.41 %Total Consumer $ 758 $ 254 $ 504 0.67 %Total $ 974 $ 332 $ 642 0.27 %
Total net charge-offs increased $190 million, or 30%, in 2020 compared to 2019. The increase is primarily attributable to commercialnet charge-offs, which were driven by industries adversely impacted by the pandemic.
See Note 1 Accounting Policies and Note 4 Loans and Related Allowance for Credit Losses in the Notes To Consolidated FinancialStatements in Item 8 of this Report for additional information.
Liquidity and Capital Management
Liquidity risk has two fundamental components. The first is potential loss assuming we were unable to meet our funding requirementsat a reasonable cost. The second is the potential inability to operate our businesses because adequate contingent liquidity is notavailable. We manage liquidity risk at the consolidated company level (bank, parent company and nonbank subsidiaries combined) tohelp ensure that we can obtain cost-effective funding to meet current and future obligations under both normal “business as usual” andstressful circumstances, and to help ensure that we maintain an appropriate level of contingent liquidity.
Management monitors liquidity through a series of early warning indicators that may indicate a potential market, or PNC-specific,liquidity stress event. In addition, management performs a set of liquidity stress tests over multiple time horizons with varying levelsof severity and maintains a contingency funding plan to address a potential liquidity stress event. In the most severe liquidity stresssimulation, we assume that our liquidity position is under pressure, while the market in general is under systemic pressure. Thesimulation considers, among other things, the impact of restricted access to both secured and unsecured external sources of funding,accelerated runoff of customer deposits, valuation pressure on assets and heavy demand to fund committed obligations. Parentcompany liquidity guidelines are designed to help ensure that sufficient liquidity is available to meet our parent company obligationsover the succeeding 24-month period. Liquidity-related risk limits are established within our Enterprise Liquidity Management Policy
76 The PNC Financial Services Group, Inc. – 2020 Form 10-K
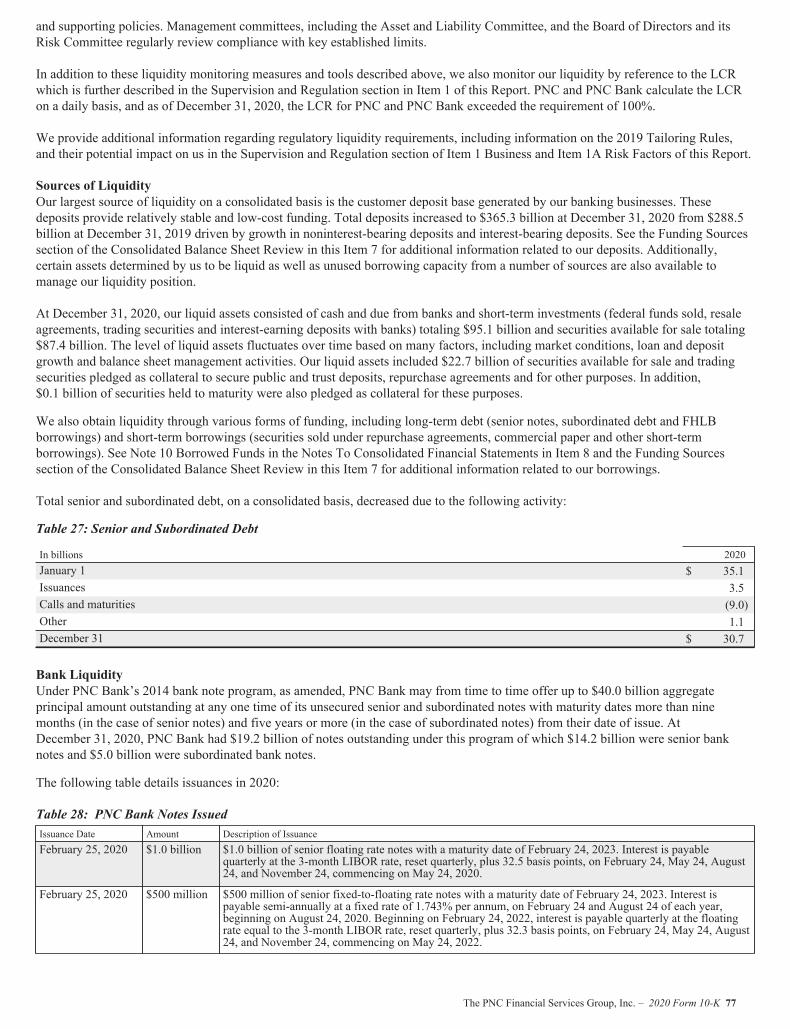
and supporting policies. Management committees, including the Asset and Liability Committee, and the Board of Directors and itsRisk Committee regularly review compliance with key established limits.
In addition to these liquidity monitoring measures and tools described above, we also monitor our liquidity by reference to the LCRwhich is further described in the Supervision and Regulation section in Item 1 of this Report. PNC and PNC Bank calculate the LCRon a daily basis, and as of December 31, 2020, the LCR for PNC and PNC Bank exceeded the requirement of 100%.
We provide additional information regarding regulatory liquidity requirements, including information on the 2019 Tailoring Rules,and their potential impact on us in the Supervision and Regulation section of Item 1 Business and Item 1A Risk Factors of this Report.
Sources of LiquidityOur largest source of liquidity on a consolidated basis is the customer deposit base generated by our banking businesses. Thesedeposits provide relatively stable and low-cost funding. Total deposits increased to $365.3 billion at December 31, 2020 from $288.5billion at December 31, 2019 driven by growth in noninterest-bearing deposits and interest-bearing deposits. See the Funding Sourcessection of the Consolidated Balance Sheet Review in this Item 7 for additional information related to our deposits. Additionally,certain assets determined by us to be liquid as well as unused borrowing capacity from a number of sources are also available tomanage our liquidity position.
At December 31, 2020, our liquid assets consisted of cash and due from banks and short-term investments (federal funds sold, resaleagreements, trading securities and interest-earning deposits with banks) totaling $95.1 billion and securities available for sale totaling$87.4 billion. The level of liquid assets fluctuates over time based on many factors, including market conditions, loan and depositgrowth and balance sheet management activities. Our liquid assets included $22.7 billion of securities available for sale and tradingsecurities pledged as collateral to secure public and trust deposits, repurchase agreements and for other purposes. In addition,$0.1 billion of securities held to maturity were also pledged as collateral for these purposes.
We also obtain liquidity through various forms of funding, including long-term debt (senior notes, subordinated debt and FHLBborrowings) and short-term borrowings (securities sold under repurchase agreements, commercial paper and other short-termborrowings). See Note 10 Borrowed Funds in the Notes To Consolidated Financial Statements in Item 8 and the Funding Sourcessection of the Consolidated Balance Sheet Review in this Item 7 for additional information related to our borrowings.
Total senior and subordinated debt, on a consolidated basis, decreased due to the following activity:
Table 27: Senior and Subordinated Debt
In billions 2020January 1 $ 35.1Issuances 3.5Calls and maturities (9.0)Other 1.1December 31 $ 30.7
Bank LiquidityUnder PNC Bank’s 2014 bank note program, as amended, PNC Bank may from time to time offer up to $40.0 billion aggregateprincipal amount outstanding at any one time of its unsecured senior and subordinated notes with maturity dates more than ninemonths (in the case of senior notes) and five years or more (in the case of subordinated notes) from their date of issue. AtDecember 31, 2020, PNC Bank had $19.2 billion of notes outstanding under this program of which $14.2 billion were senior banknotes and $5.0 billion were subordinated bank notes.
The following table details issuances in 2020:
Table 28: PNC Bank Notes IssuedIssuance Date Amount Description of IssuanceFebruary 25, 2020 $1.0 billion $1.0 billion of senior floating rate notes with a maturity date of February 24, 2023. Interest is payable
quarterly at the 3-month LIBOR rate, reset quarterly, plus 32.5 basis points, on February 24, May 24, August24, and November 24, commencing on May 24, 2020.
February 25, 2020 $500 million $500 million of senior fixed-to-floating rate notes with a maturity date of February 24, 2023. Interest ispayable semi-annually at a fixed rate of 1.743% per annum, on February 24 and August 24 of each year,beginning on August 24, 2020. Beginning on February 24, 2022, interest is payable quarterly at the floatingrate equal to the 3-month LIBOR rate, reset quarterly, plus 32.3 basis points, on February 24, May 24, August24, and November 24, commencing on May 24, 2022.
The PNC Financial Services Group, Inc. – 2020 Form 10-K 77
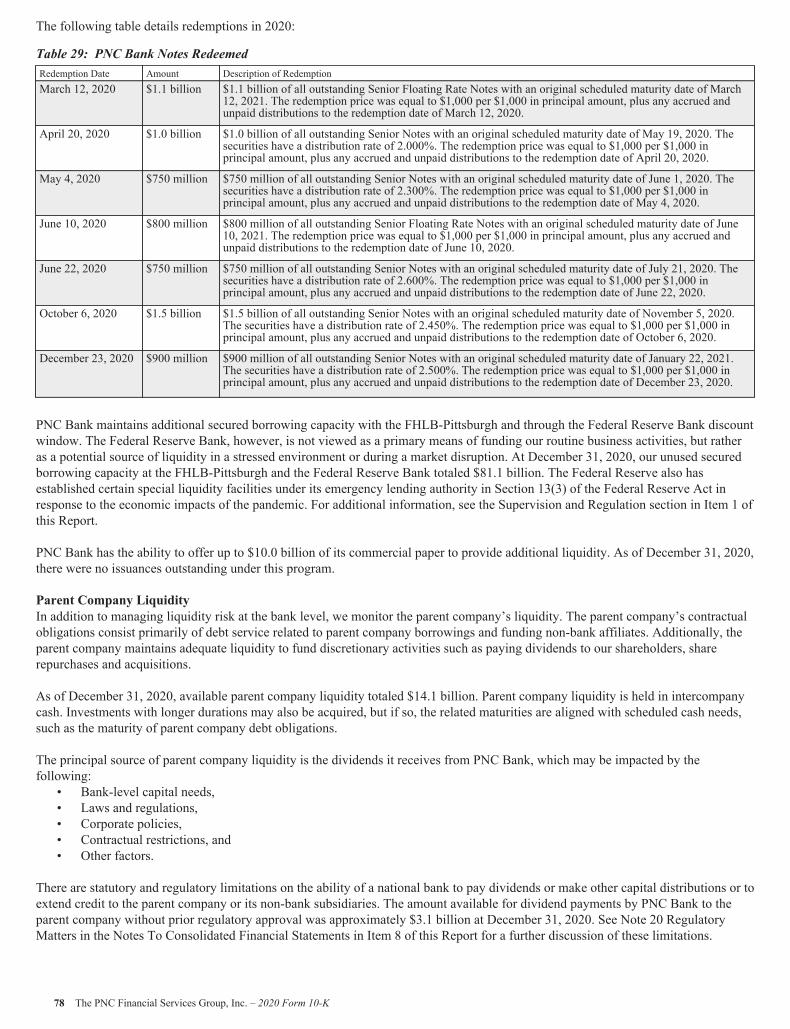
The following table details redemptions in 2020:
Table 29: PNC Bank Notes RedeemedRedemption Date Amount Description of RedemptionMarch 12, 2020 $1.1 billion $1.1 billion of all outstanding Senior Floating Rate Notes with an original scheduled maturity date of March
12, 2021. The redemption price was equal to $1,000 per $1,000 in principal amount, plus any accrued andunpaid distributions to the redemption date of March 12, 2020.
April 20, 2020 $1.0 billion $1.0 billion of all outstanding Senior Notes with an original scheduled maturity date of May 19, 2020. Thesecurities have a distribution rate of 2.000%. The redemption price was equal to $1,000 per $1,000 inprincipal amount, plus any accrued and unpaid distributions to the redemption date of April 20, 2020.
May 4, 2020 $750 million $750 million of all outstanding Senior Notes with an original scheduled maturity date of June 1, 2020. Thesecurities have a distribution rate of 2.300%. The redemption price was equal to $1,000 per $1,000 inprincipal amount, plus any accrued and unpaid distributions to the redemption date of May 4, 2020.
June 10, 2020 $800 million $800 million of all outstanding Senior Floating Rate Notes with an original scheduled maturity date of June10, 2021. The redemption price was equal to $1,000 per $1,000 in principal amount, plus any accrued andunpaid distributions to the redemption date of June 10, 2020.
June 22, 2020 $750 million $750 million of all outstanding Senior Notes with an original scheduled maturity date of July 21, 2020. Thesecurities have a distribution rate of 2.600%. The redemption price was equal to $1,000 per $1,000 inprincipal amount, plus any accrued and unpaid distributions to the redemption date of June 22, 2020.
October 6, 2020 $1.5 billion $1.5 billion of all outstanding Senior Notes with an original scheduled maturity date of November 5, 2020.The securities have a distribution rate of 2.450%. The redemption price was equal to $1,000 per $1,000 inprincipal amount, plus any accrued and unpaid distributions to the redemption date of October 6, 2020.
December 23, 2020 $900 million $900 million of all outstanding Senior Notes with an original scheduled maturity date of January 22, 2021.The securities have a distribution rate of 2.500%. The redemption price was equal to $1,000 per $1,000 inprincipal amount, plus any accrued and unpaid distributions to the redemption date of December 23, 2020.
PNC Bank maintains additional secured borrowing capacity with the FHLB-Pittsburgh and through the Federal Reserve Bank discountwindow. The Federal Reserve Bank, however, is not viewed as a primary means of funding our routine business activities, but ratheras a potential source of liquidity in a stressed environment or during a market disruption. At December 31, 2020, our unused securedborrowing capacity at the FHLB-Pittsburgh and the Federal Reserve Bank totaled $81.1 billion. The Federal Reserve also hasestablished certain special liquidity facilities under its emergency lending authority in Section 13(3) of the Federal Reserve Act inresponse to the economic impacts of the pandemic. For additional information, see the Supervision and Regulation section in Item 1 ofthis Report.
PNC Bank has the ability to offer up to $10.0 billion of its commercial paper to provide additional liquidity. As of December 31, 2020,there were no issuances outstanding under this program.
Parent Company LiquidityIn addition to managing liquidity risk at the bank level, we monitor the parent company’s liquidity. The parent company’s contractualobligations consist primarily of debt service related to parent company borrowings and funding non-bank affiliates. Additionally, theparent company maintains adequate liquidity to fund discretionary activities such as paying dividends to our shareholders, sharerepurchases and acquisitions.
As of December 31, 2020, available parent company liquidity totaled $14.1 billion. Parent company liquidity is held in intercompanycash. Investments with longer durations may also be acquired, but if so, the related maturities are aligned with scheduled cash needs,such as the maturity of parent company debt obligations.
The principal source of parent company liquidity is the dividends it receives from PNC Bank, which may be impacted by thefollowing:
• Bank-level capital needs,• Laws and regulations,• Corporate policies,• Contractual restrictions, and• Other factors.
There are statutory and regulatory limitations on the ability of a national bank to pay dividends or make other capital distributions or toextend credit to the parent company or its non-bank subsidiaries. The amount available for dividend payments by PNC Bank to theparent company without prior regulatory approval was approximately $3.1 billion at December 31, 2020. See Note 20 RegulatoryMatters in the Notes To Consolidated Financial Statements in Item 8 of this Report for a further discussion of these limitations.
78 The PNC Financial Services Group, Inc. – 2020 Form 10-K
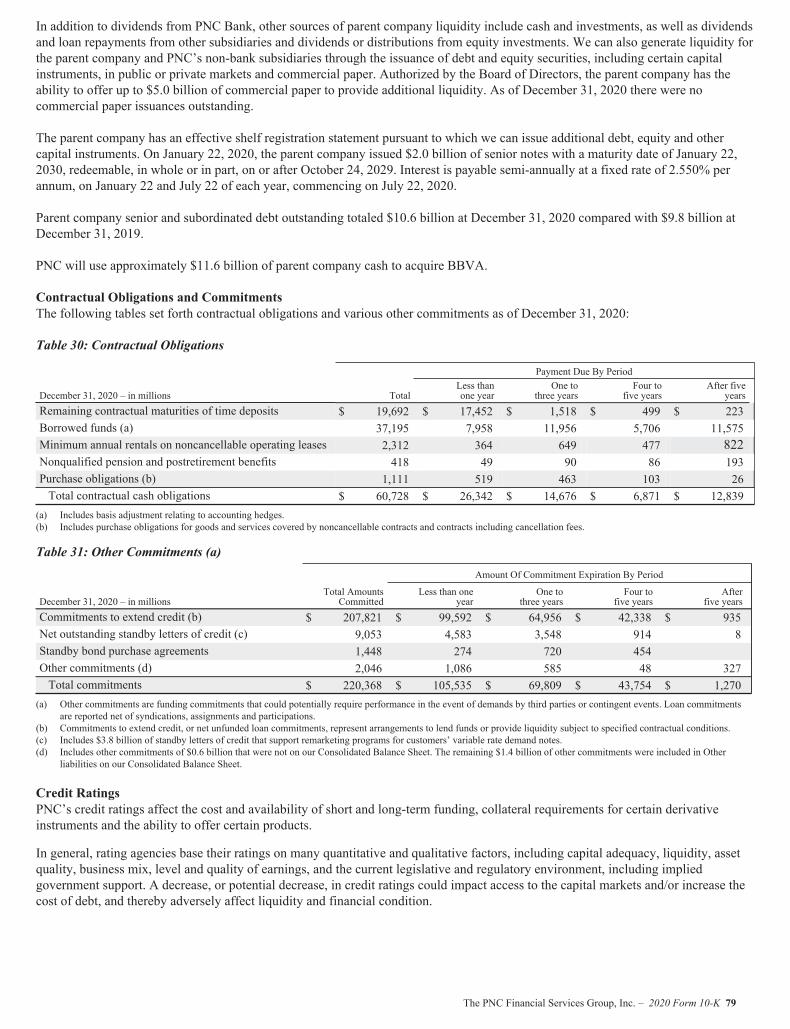
In addition to dividends from PNC Bank, other sources of parent company liquidity include cash and investments, as well as dividendsand loan repayments from other subsidiaries and dividends or distributions from equity investments. We can also generate liquidity forthe parent company and PNC’s non-bank subsidiaries through the issuance of debt and equity securities, including certain capitalinstruments, in public or private markets and commercial paper. Authorized by the Board of Directors, the parent company has theability to offer up to $5.0 billion of commercial paper to provide additional liquidity. As of December 31, 2020 there were nocommercial paper issuances outstanding.
The parent company has an effective shelf registration statement pursuant to which we can issue additional debt, equity and othercapital instruments. On January 22, 2020, the parent company issued $2.0 billion of senior notes with a maturity date of January 22,2030, redeemable, in whole or in part, on or after October 24, 2029. Interest is payable semi-annually at a fixed rate of 2.550% perannum, on January 22 and July 22 of each year, commencing on July 22, 2020.
Parent company senior and subordinated debt outstanding totaled $10.6 billion at December 31, 2020 compared with $9.8 billion atDecember 31, 2019.
PNC will use approximately $11.6 billion of parent company cash to acquire BBVA.
Contractual Obligations and CommitmentsThe following tables set forth contractual obligations and various other commitments as of December 31, 2020:
Table 30: Contractual Obligations
Payment Due By Period
December 31, 2020 – in millions TotalLess thanone year
One tothree years
Four tofive years
After fiveyears
Remaining contractual maturities of time deposits $ 19,692 $ 17,452 $ 1,518 $ 499 $ 223Borrowed funds (a) 37,195 7,958 11,956 5,706 11,575Minimum annual rentals on noncancellable operating leases 2,312 364 649 477 822Nonqualified pension and postretirement benefits 418 49 90 86 193Purchase obligations (b) 1,111 519 463 103 26Total contractual cash obligations $ 60,728 $ 26,342 $ 14,676 $ 6,871 $ 12,839
(a) Includes basis adjustment relating to accounting hedges.(b) Includes purchase obligations for goods and services covered by noncancellable contracts and contracts including cancellation fees.
Table 31: Other Commitments (a)Amount Of Commitment Expiration By Period
December 31, 2020 – in millionsTotal AmountsCommitted
Less than oneyear
One tothree years
Four tofive years
Afterfive years
Commitments to extend credit (b) $ 207,821 $ 99,592 $ 64,956 $ 42,338 $ 935Net outstanding standby letters of credit (c) 9,053 4,583 3,548 914 8Standby bond purchase agreements 1,448 274 720 454Other commitments (d) 2,046 1,086 585 48 327Total commitments $ 220,368 $ 105,535 $ 69,809 $ 43,754 $ 1,270
(a) Other commitments are funding commitments that could potentially require performance in the event of demands by third parties or contingent events. Loan commitmentsare reported net of syndications, assignments and participations.
(b) Commitments to extend credit, or net unfunded loan commitments, represent arrangements to lend funds or provide liquidity subject to specified contractual conditions.(c) Includes $3.8 billion of standby letters of credit that support remarketing programs for customers’ variable rate demand notes.(d) Includes other commitments of $0.6 billion that were not on our Consolidated Balance Sheet. The remaining $1.4 billion of other commitments were included in Other
liabilities on our Consolidated Balance Sheet.
Credit RatingsPNC’s credit ratings affect the cost and availability of short and long-term funding, collateral requirements for certain derivativeinstruments and the ability to offer certain products.
In general, rating agencies base their ratings on many quantitative and qualitative factors, including capital adequacy, liquidity, assetquality, business mix, level and quality of earnings, and the current legislative and regulatory environment, including impliedgovernment support. A decrease, or potential decrease, in credit ratings could impact access to the capital markets and/or increase thecost of debt, and thereby adversely affect liquidity and financial condition.
The PNC Financial Services Group, Inc. – 2020 Form 10-K 79
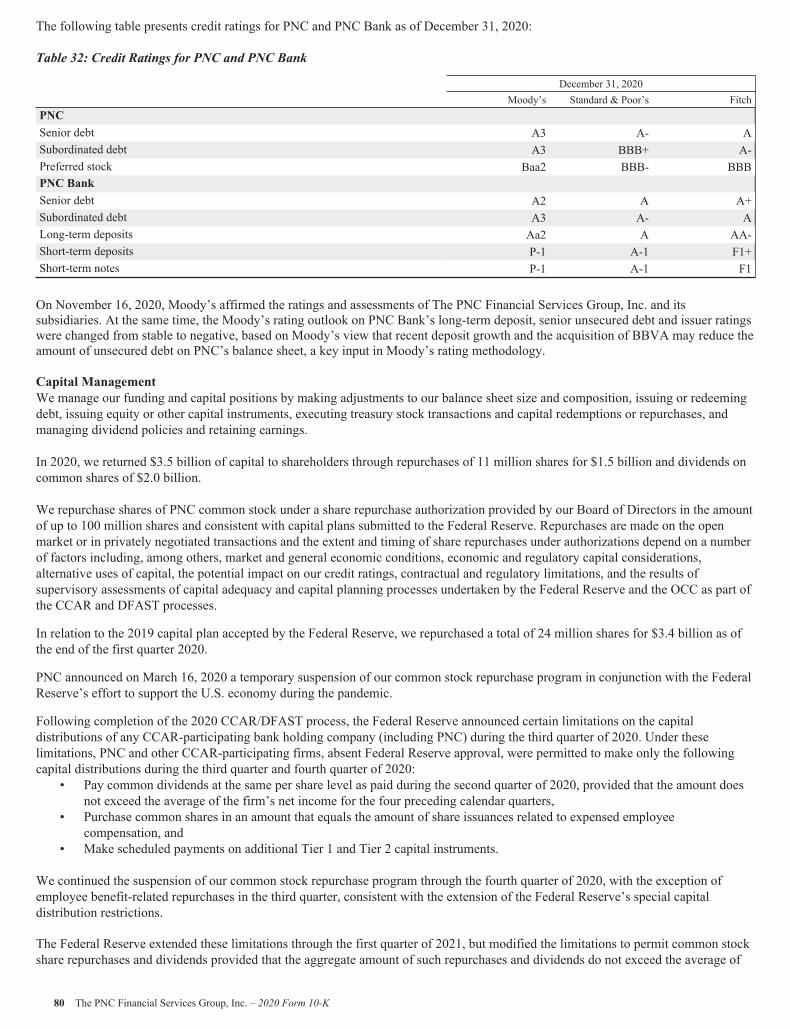
The following table presents credit ratings for PNC and PNC Bank as of December 31, 2020:
Table 32: Credit Ratings for PNC and PNC Bank
December 31, 2020Moody’s Standard & Poor’s Fitch
PNCSenior debt A3 A- ASubordinated debt A3 BBB+ A-Preferred stock Baa2 BBB- BBBPNC BankSenior debt A2 A A+Subordinated debt A3 A- ALong-term deposits Aa2 A AA-Short-term deposits P-1 A-1 F1+Short-term notes P-1 A-1 F1
On November 16, 2020, Moody’s affirmed the ratings and assessments of The PNC Financial Services Group, Inc. and itssubsidiaries. At the same time, the Moody’s rating outlook on PNC Bank’s long-term deposit, senior unsecured debt and issuer ratingswere changed from stable to negative, based on Moody’s view that recent deposit growth and the acquisition of BBVA may reduce theamount of unsecured debt on PNC’s balance sheet, a key input in Moody’s rating methodology.
Capital ManagementWe manage our funding and capital positions by making adjustments to our balance sheet size and composition, issuing or redeemingdebt, issuing equity or other capital instruments, executing treasury stock transactions and capital redemptions or repurchases, andmanaging dividend policies and retaining earnings.
In 2020, we returned $3.5 billion of capital to shareholders through repurchases of 11 million shares for $1.5 billion and dividends oncommon shares of $2.0 billion.
We repurchase shares of PNC common stock under a share repurchase authorization provided by our Board of Directors in the amountof up to 100 million shares and consistent with capital plans submitted to the Federal Reserve. Repurchases are made on the openmarket or in privately negotiated transactions and the extent and timing of share repurchases under authorizations depend on a numberof factors including, among others, market and general economic conditions, economic and regulatory capital considerations,alternative uses of capital, the potential impact on our credit ratings, contractual and regulatory limitations, and the results ofsupervisory assessments of capital adequacy and capital planning processes undertaken by the Federal Reserve and the OCC as part ofthe CCAR and DFAST processes.
In relation to the 2019 capital plan accepted by the Federal Reserve, we repurchased a total of 24 million shares for $3.4 billion as ofthe end of the first quarter 2020.
PNC announced on March 16, 2020 a temporary suspension of our common stock repurchase program in conjunction with the FederalReserve’s effort to support the U.S. economy during the pandemic.
Following completion of the 2020 CCAR/DFAST process, the Federal Reserve announced certain limitations on the capitaldistributions of any CCAR-participating bank holding company (including PNC) during the third quarter of 2020. Under theselimitations, PNC and other CCAR-participating firms, absent Federal Reserve approval, were permitted to make only the followingcapital distributions during the third quarter and fourth quarter of 2020:
• Pay common dividends at the same per share level as paid during the second quarter of 2020, provided that the amount doesnot exceed the average of the firm’s net income for the four preceding calendar quarters,
• Purchase common shares in an amount that equals the amount of share issuances related to expensed employeecompensation, and
• Make scheduled payments on additional Tier 1 and Tier 2 capital instruments.
We continued the suspension of our common stock repurchase program through the fourth quarter of 2020, with the exception ofemployee benefit-related repurchases in the third quarter, consistent with the extension of the Federal Reserve’s special capitaldistribution restrictions.
The Federal Reserve extended these limitations through the first quarter of 2021, but modified the limitations to permit common stockshare repurchases and dividends provided that the aggregate amount of such repurchases and dividends do not exceed the average of
80 The PNC Financial Services Group, Inc. – 2020 Form 10-K
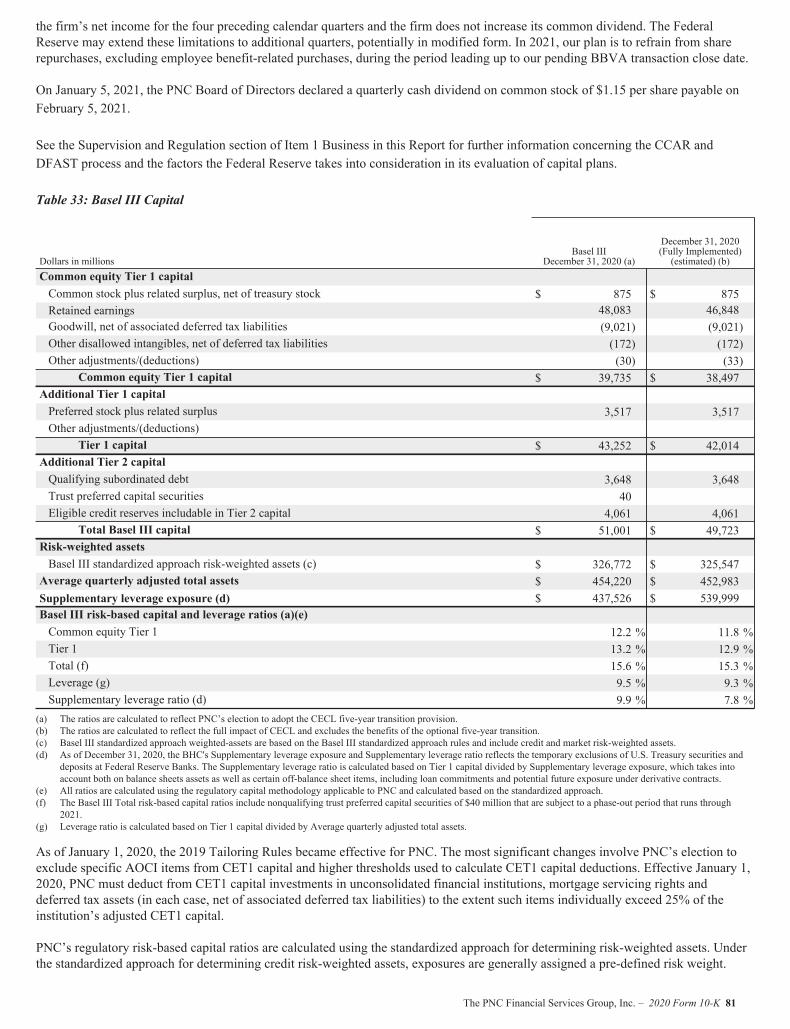
the firm’s net income for the four preceding calendar quarters and the firm does not increase its common dividend. The FederalReserve may extend these limitations to additional quarters, potentially in modified form. In 2021, our plan is to refrain from sharerepurchases, excluding employee benefit-related purchases, during the period leading up to our pending BBVA transaction close date.
On January 5, 2021, the PNC Board of Directors declared a quarterly cash dividend on common stock of $1.15 per share payable onFebruary 5, 2021.
See the Supervision and Regulation section of Item 1 Business in this Report for further information concerning the CCAR andDFAST process and the factors the Federal Reserve takes into consideration in its evaluation of capital plans.
Table 33: Basel III Capital
Dollars in millionsBasel III
December 31, 2020 (a)
December 31, 2020(Fully Implemented)(estimated) (b)
Common equity Tier 1 capitalCommon stock plus related surplus, net of treasury stock $ 875 $ 875Retained earnings 48,083 46,848Goodwill, net of associated deferred tax liabilities (9,021) (9,021)Other disallowed intangibles, net of deferred tax liabilities (172) (172)Other adjustments/(deductions) (30) (33)
Common equity Tier 1 capital $ 39,735 $ 38,497Additional Tier 1 capitalPreferred stock plus related surplus 3,517 3,517Other adjustments/(deductions)
Tier 1 capital $ 43,252 $ 42,014Additional Tier 2 capitalQualifying subordinated debt 3,648 3,648Trust preferred capital securities 40Eligible credit reserves includable in Tier 2 capital 4,061 4,061
Total Basel III capital $ 51,001 $ 49,723Risk-weighted assetsBasel III standardized approach risk-weighted assets (c) $ 326,772 $ 325,547Average quarterly adjusted total assets $ 454,220 $ 452,983Supplementary leverage exposure (d) $ 437,526 $ 539,999Basel III risk-based capital and leverage ratios (a)(e)Common equity Tier 1 12.2 % 11.8 %Tier 1 13.2 % 12.9 %Total (f) 15.6 % 15.3 %Leverage (g) 9.5 % 9.3 %Supplementary leverage ratio (d) 9.9 % 7.8 %
(a) The ratios are calculated to reflect PNC’s election to adopt the CECL five-year transition provision.(b) The ratios are calculated to reflect the full impact of CECL and excludes the benefits of the optional five-year transition.(c) Basel III standardized approach weighted-assets are based on the Basel III standardized approach rules and include credit and market risk-weighted assets.(d) As of December 31, 2020, the BHC's Supplementary leverage exposure and Supplementary leverage ratio reflects the temporary exclusions of U.S. Treasury securities and
deposits at Federal Reserve Banks. The Supplementary leverage ratio is calculated based on Tier 1 capital divided by Supplementary leverage exposure, which takes intoaccount both on balance sheets assets as well as certain off-balance sheet items, including loan commitments and potential future exposure under derivative contracts.
(e) All ratios are calculated using the regulatory capital methodology applicable to PNC and calculated based on the standardized approach.(f) The Basel III Total risk-based capital ratios include nonqualifying trust preferred capital securities of $40 million that are subject to a phase-out period that runs through
2021.(g) Leverage ratio is calculated based on Tier 1 capital divided by Average quarterly adjusted total assets.
As of January 1, 2020, the 2019 Tailoring Rules became effective for PNC. The most significant changes involve PNC’s election toexclude specific AOCI items from CET1 capital and higher thresholds used to calculate CET1 capital deductions. Effective January 1,2020, PNC must deduct from CET1 capital investments in unconsolidated financial institutions, mortgage servicing rights anddeferred tax assets (in each case, net of associated deferred tax liabilities) to the extent such items individually exceed 25% of theinstitution’s adjusted CET1 capital.
PNC’s regulatory risk-based capital ratios are calculated using the standardized approach for determining risk-weighted assets. Underthe standardized approach for determining credit risk-weighted assets, exposures are generally assigned a pre-defined risk weight.
The PNC Financial Services Group, Inc. – 2020 Form 10-K 81
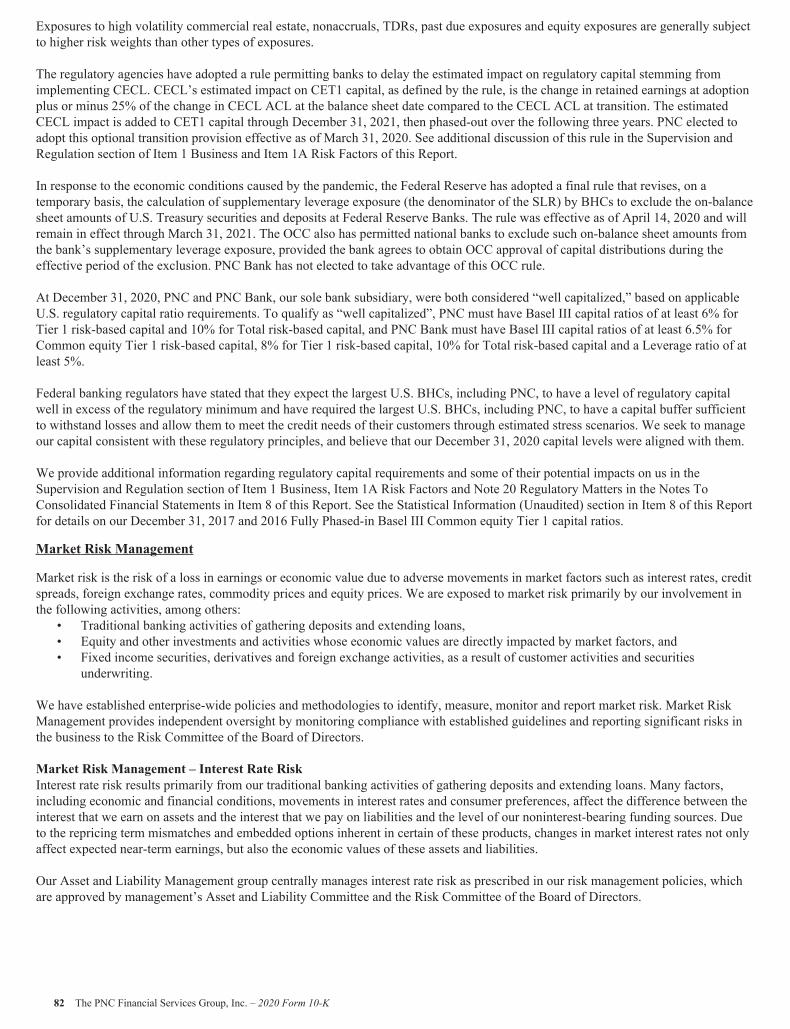
Exposures to high volatility commercial real estate, nonaccruals, TDRs, past due exposures and equity exposures are generally subjectto higher risk weights than other types of exposures.
The regulatory agencies have adopted a rule permitting banks to delay the estimated impact on regulatory capital stemming fromimplementing CECL. CECL’s estimated impact on CET1 capital, as defined by the rule, is the change in retained earnings at adoptionplus or minus 25% of the change in CECL ACL at the balance sheet date compared to the CECL ACL at transition. The estimatedCECL impact is added to CET1 capital through December 31, 2021, then phased-out over the following three years. PNC elected toadopt this optional transition provision effective as of March 31, 2020. See additional discussion of this rule in the Supervision andRegulation section of Item 1 Business and Item 1A Risk Factors of this Report.
In response to the economic conditions caused by the pandemic, the Federal Reserve has adopted a final rule that revises, on atemporary basis, the calculation of supplementary leverage exposure (the denominator of the SLR) by BHCs to exclude the on-balancesheet amounts of U.S. Treasury securities and deposits at Federal Reserve Banks. The rule was effective as of April 14, 2020 and willremain in effect through March 31, 2021. The OCC also has permitted national banks to exclude such on-balance sheet amounts fromthe bank’s supplementary leverage exposure, provided the bank agrees to obtain OCC approval of capital distributions during theeffective period of the exclusion. PNC Bank has not elected to take advantage of this OCC rule.
At December 31, 2020, PNC and PNC Bank, our sole bank subsidiary, were both considered “well capitalized,” based on applicableU.S. regulatory capital ratio requirements. To qualify as “well capitalized”, PNC must have Basel III capital ratios of at least 6% forTier 1 risk-based capital and 10% for Total risk-based capital, and PNC Bank must have Basel III capital ratios of at least 6.5% forCommon equity Tier 1 risk-based capital, 8% for Tier 1 risk-based capital, 10% for Total risk-based capital and a Leverage ratio of atleast 5%.
Federal banking regulators have stated that they expect the largest U.S. BHCs, including PNC, to have a level of regulatory capitalwell in excess of the regulatory minimum and have required the largest U.S. BHCs, including PNC, to have a capital buffer sufficientto withstand losses and allow them to meet the credit needs of their customers through estimated stress scenarios. We seek to manageour capital consistent with these regulatory principles, and believe that our December 31, 2020 capital levels were aligned with them.
We provide additional information regarding regulatory capital requirements and some of their potential impacts on us in theSupervision and Regulation section of Item 1 Business, Item 1A Risk Factors and Note 20 Regulatory Matters in the Notes ToConsolidated Financial Statements in Item 8 of this Report. See the Statistical Information (Unaudited) section in Item 8 of this Reportfor details on our December 31, 2017 and 2016 Fully Phased-in Basel III Common equity Tier 1 capital ratios.
Market Risk Management
Market risk is the risk of a loss in earnings or economic value due to adverse movements in market factors such as interest rates, creditspreads, foreign exchange rates, commodity prices and equity prices. We are exposed to market risk primarily by our involvement inthe following activities, among others:
• Traditional banking activities of gathering deposits and extending loans,• Equity and other investments and activities whose economic values are directly impacted by market factors, and• Fixed income securities, derivatives and foreign exchange activities, as a result of customer activities and securities
underwriting.
We have established enterprise-wide policies and methodologies to identify, measure, monitor and report market risk. Market RiskManagement provides independent oversight by monitoring compliance with established guidelines and reporting significant risks inthe business to the Risk Committee of the Board of Directors.
Market Risk Management – Interest Rate RiskInterest rate risk results primarily from our traditional banking activities of gathering deposits and extending loans. Many factors,including economic and financial conditions, movements in interest rates and consumer preferences, affect the difference between theinterest that we earn on assets and the interest that we pay on liabilities and the level of our noninterest-bearing funding sources. Dueto the repricing term mismatches and embedded options inherent in certain of these products, changes in market interest rates not onlyaffect expected near-term earnings, but also the economic values of these assets and liabilities.
Our Asset and Liability Management group centrally manages interest rate risk as prescribed in our risk management policies, whichare approved by management’s Asset and Liability Committee and the Risk Committee of the Board of Directors.
82 The PNC Financial Services Group, Inc. – 2020 Form 10-K
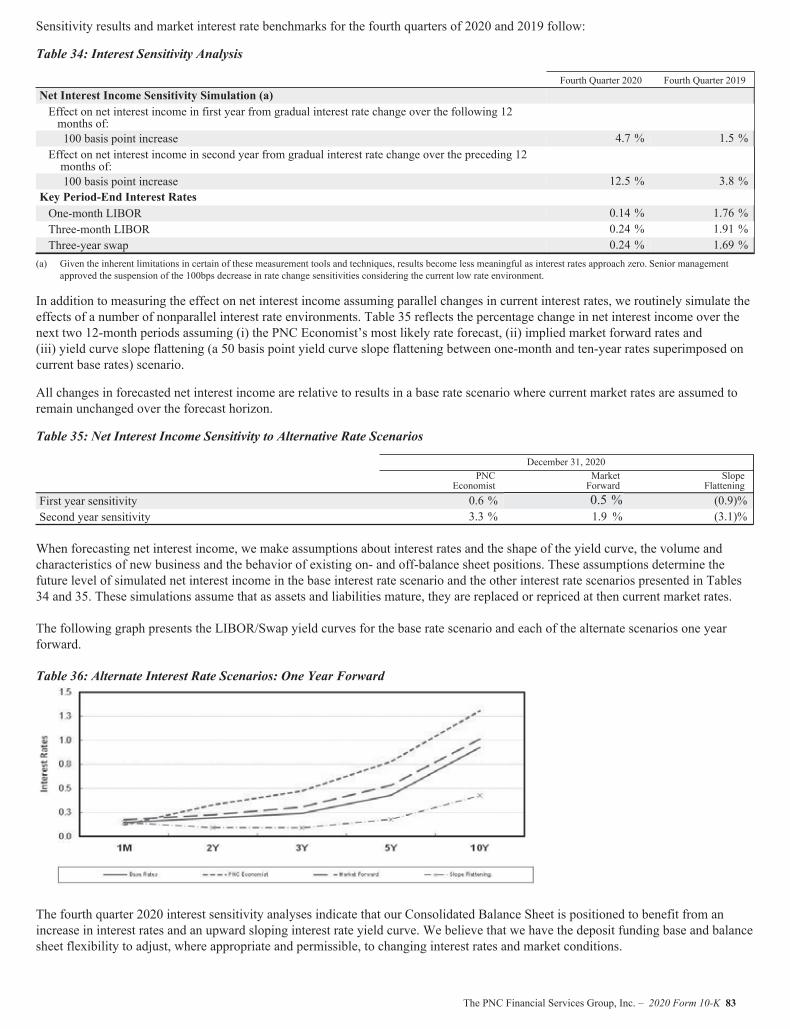
Sensitivity results and market interest rate benchmarks for the fourth quarters of 2020 and 2019 follow:
Table 34: Interest Sensitivity Analysis
Fourth Quarter 2020 Fourth Quarter 2019Net Interest Income Sensitivity Simulation (a)Effect on net interest income in first year from gradual interest rate change over the following 12months of:100 basis point increase 4.7 % 1.5 %
Effect on net interest income in second year from gradual interest rate change over the preceding 12months of:100 basis point increase 12.5 % 3.8 %
Key Period-End Interest RatesOne-month LIBOR 0.14 % 1.76 %Three-month LIBOR 0.24 % 1.91 %Three-year swap 0.24 % 1.69 %
(a) Given the inherent limitations in certain of these measurement tools and techniques, results become less meaningful as interest rates approach zero. Senior managementapproved the suspension of the 100bps decrease in rate change sensitivities considering the current low rate environment.
In addition to measuring the effect on net interest income assuming parallel changes in current interest rates, we routinely simulate theeffects of a number of nonparallel interest rate environments. Table 35 reflects the percentage change in net interest income over thenext two 12-month periods assuming (i) the PNC Economist’s most likely rate forecast, (ii) implied market forward rates and(iii) yield curve slope flattening (a 50 basis point yield curve slope flattening between one-month and ten-year rates superimposed oncurrent base rates) scenario.
All changes in forecasted net interest income are relative to results in a base rate scenario where current market rates are assumed toremain unchanged over the forecast horizon.
Table 35: Net Interest Income Sensitivity to Alternative Rate Scenarios
December 31, 2020PNC
EconomistMarketForward
SlopeFlattening
First year sensitivity 0.6 % 0.5 % (0.9)%Second year sensitivity 3.3 % 1.9 % (3.1)%
When forecasting net interest income, we make assumptions about interest rates and the shape of the yield curve, the volume andcharacteristics of new business and the behavior of existing on- and off-balance sheet positions. These assumptions determine thefuture level of simulated net interest income in the base interest rate scenario and the other interest rate scenarios presented in Tables34 and 35. These simulations assume that as assets and liabilities mature, they are replaced or repriced at then current market rates.
The following graph presents the LIBOR/Swap yield curves for the base rate scenario and each of the alternate scenarios one yearforward.
Table 36: Alternate Interest Rate Scenarios: One Year Forward
The fourth quarter 2020 interest sensitivity analyses indicate that our Consolidated Balance Sheet is positioned to benefit from anincrease in interest rates and an upward sloping interest rate yield curve. We believe that we have the deposit funding base and balancesheet flexibility to adjust, where appropriate and permissible, to changing interest rates and market conditions.
The PNC Financial Services Group, Inc. – 2020 Form 10-K 83
As discussed in Item 1A Risk Factors, the planned discontinuance of the requirement that banks submit rates for the calculation ofLIBOR after 2023 presents risks to the financial instruments originated, held or serviced by PNC that use LIBOR as a reference rate.PNC holds instruments and services its instruments and instruments owned by others that may be impacted by the likelydiscontinuance of LIBOR, including loans, investments, hedging products, floating-rate obligations, and other financial instrumentsthat use LIBOR as a reference rate. The transition from LIBOR as an interest rate benchmark will subject PNC, like other financialparticipants, to financial, legal, operational, and reputational risks.
In order to address LIBOR cessation and the associated risks, PNC has established a cross-functional governance structure to overseethe overall strategy for the transition from LIBOR and mitigate risks associated with the transition. An initial LIBOR impact and riskassessment has been performed, which identified the associated risks across products, systems, models, and processes. PNC alsoestablished an enterprise-level program, which is actively monitoring PNC’s overall firm-wide exposure to LIBOR and using theseresults to plan transitional strategies and track progress versus these goals. Program workstreams were formed by Line of Business toensure accountability and alignment with the appropriate operational, technology, and customer-facing stakeholders, whileestablishing a centralized Program Management Office to ensure consistency in execution and communication. Project plans andestablished milestones have been developed and have continued to evolve and be refined in line with industry developments andinternal decisions and progress. PNC is also involved in industry discussions, preparing milestones for readiness and assessingprogress against those milestones, along with developing and delivering on internal and external LIBOR cessation communicationplans.
Key efforts in 2020 included:• Enhancing fallback language in new contracts and reviewing existing legal contracts/agreements to assess fallback language
impacts,• Making preparations for internal operational readiness,• Making necessary enhancements to PNC’s infrastructure, including systems, models, valuation tools and processes,• Developing and delivering on internal and external LIBOR cessation communication plans,• Engaging with PNC clients, industry working groups and regulators, and• Monitoring developments associated with LIBOR alternatives and industry practices related to LIBOR-indexed instruments.
PNC also has been an active participant in efforts with the Federal Reserve and other regulatory agencies to explore the potential needfor a credit-sensitive rate or add-on to SOFR for use in commercial loans. Those efforts led to the formation of the Credit SensitiveGroup, which has held a series of workshops to assess how a credit-sensitive rate or add-on to SOFR might be constructed and discussassociated implementation issues.
In addition, in the third quarter of 2020, PNC began offering conforming ARMs using SOFR instead of USD LIBOR in line withFannie Mae and Freddie Mac requirements. Plans are in place to begin offering private student loans and portfolio loans using non-LIBOR rates in the second quarter of 2021. PNC has provided regular updates to Federal Reserve, OCC and FDIC examination staffregarding its LIBOR cessation and transition plans.
Market Risk Management – Customer-Related Trading RiskWe engage in fixed income securities, derivatives and foreign exchange transactions to support our customers’ investing and hedgingactivities. These transactions, related hedges and the credit valuation adjustment related to our customer derivatives portfolio aremarked-to-market daily and reported as customer-related trading activities. We do not engage in proprietary trading of these products.
We use VaR as the primary means to measure and monitor market risk in customer-related trading activities. VaR is used to estimatethe probability of portfolio losses based on the statistical analysis of historical market risk factors. A diversified VaR reflects empiricalcorrelations across different asset classes. We calculate a diversified VaR at a 95% confidence interval and the results for 2020 and2019 were within our acceptable limits.
To help ensure the integrity of the models used to calculate VaR for each portfolio and enterprise-wide, we use a process known asbacktesting. The backtesting process consists of comparing actual observations of gains or losses against the VaR levels that werecalculated at the close of the prior day. Our VaR measure assumes that exposures remain constant and that recent market variability isa good predictor of future variability. Actual observations include customer related revenue and intraday hedging which helps toreduce losses and can reduce the number of instances actual losses exceed the prior day VaR measure. There were minimal instancesduring 2020 and 2019 under our diversified VaR measure where actual losses exceeded the prior day VaR measure and those losseswere insignificant. Our portfolio and enterprise-wide VaR models utilize a historical approach with a 500 day look back period.
Customer-related trading revenue was $466 million in 2020 compared with $285 million in 2019 and is recorded in Other noninterestincome and Other interest income on our Consolidated Income Statement. The increase was primarily due to the impact of the changesin credit valuations for customer-related derivative activities and higher derivative client sales revenues.
Market Risk Management – Equity And Other Investment RiskEquity investment risk is the risk of potential losses associated with investing in both private and public equity markets. In addition toextending credit, taking deposits, underwriting securities and trading financial instruments, we make and manage direct investments in
84 The PNC Financial Services Group, Inc. – 2020 Form 10-K
a variety of transactions, including management buyouts, recapitalizations and growth financings in a variety of industries. We alsohave investments in affiliated and non-affiliated funds that make similar investments in private equity. The economic and/or bookvalue of these investments and other assets are directly affected by changes in market factors.
Various PNC business units manage our equity and other investment activities. Our businesses are responsible for making investmentdecisions within the approved policy limits and associated guidelines.
A summary of our equity investments follows:
Table 37: Equity Investments Summary
Dollars in millionsDecember 31
2020December 31
2019Change
$ %Tax credit investments $ 2,870 $ 2,218 $ 652 29 %Private equity and other 3,182 2,958 224 8 %Total $ 6,052 $ 5,176 $ 876 17 %
Tax Credit InvestmentsIncluded in our equity investments are direct tax credit investments and equity investments held by consolidated entities. These taxcredit investment balances included unfunded commitments totaling $1.4 billion and $1.0 billion at December 31, 2020 and 2019,respectively. These unfunded commitments are included in Other liabilities on our Consolidated Balance Sheet.
Note 5 Loan Sale and Servicing Activities and Variable Interest Entities in the Notes To Consolidated Financial Statements in Item 8of this Report has further information on tax credit investments.
Private Equity and OtherThe majority of our other equity investments consists of our private equity portfolio. The private equity portfolio is an illiquidportfolio consisting of mezzanine and equity investments that vary by industry, stage and type of investment. Private equityinvestments carried at estimated fair value totaled $1.5 billion at both December 31, 2020 and 2019. As of December 31, 2020,$1.3 billion was invested directly in a variety of companies and $0.2 billion was invested indirectly through various private equityfunds. See the Supervision and Regulation section in Item 1 of this Report for discussion of the potential impacts of the Volcker Ruleon our interests in and of private funds covered by the Volcker Rule.
Included in our other equity investments are Visa Class B common shares, which are recorded at cost. Visa Class B common sharesthat we own are transferable only under limited circumstances until they can be converted into shares of the publicly-traded Class Acommon shares, which cannot happen until the resolution of the pending interchange litigation. Based upon the December 31, 2020per share closing price of $218.73 for a Visa Class A common share, the estimated value of our total investment in the Class Bcommon shares was approximately $1.2 billion at the current conversion rate of Visa B shares to Visa A shares, while our cost basiswas not significant. See Note 15 Fair Value and Note 21 Legal Proceedings in the Notes To Consolidated Financial Statements in Item8 of this Report for additional information regarding our Visa agreements. The estimated value does not represent fair value of theVisa B common shares given the shares’ limited transferability and the lack of observable transactions in the marketplace.
We also have certain other equity investments, the majority of which represent investments in affiliated and non-affiliated funds withboth traditional and alternative investment strategies. Net gains related to these investments were not significant during 2020 and2019.
Impact of InflationOur assets and liabilities are primarily financial in nature and typically have varying maturity dates. Accordingly, future changes inprices do not affect the obligations to pay or receive fixed and determinable amounts of money. However, during periods of inflation,there may be a subsequent impact affecting certain fixed costs or expenses, an erosion of consumer and customer purchasing power,and fluctuations in the need or demand for our products and services. Should significant levels of inflation occur, our business couldpotentially be impacted by, among other things, reducing our tolerance for extending credit or causing us to incur additional creditlosses resulting from possible increased default rates.
Financial DerivativesWe use a variety of financial derivatives as part of the overall asset and liability risk management process to help manage exposure tomarket (primarily interest rate) and credit risk inherent in our business activities. We also enter into derivatives with customers tofacilitate their risk management activities.
The PNC Financial Services Group, Inc. – 2020 Form 10-K 85
Financial derivatives involve, to varying degrees, market and credit risk. Derivatives represent contracts between parties that usuallyrequire little or no initial net investment and result in one party delivering cash or another type of asset to the other party based on anotional and an underlying as specified in the contract. Therefore, cash requirements and exposure to credit risk are significantly lessthan the notional amount on these instruments.
Further information on our financial derivatives is presented in Note 1 Accounting Policies, Note 15 Fair Value and Note 16 FinancialDerivatives in the Notes To Consolidated Financial Statements in Item 8 of this Report.
Not all elements of market and credit risk are addressed through the use of financial derivatives, and such instruments may beineffective for their intended purposes due to unanticipated market changes, among other reasons.
Operational Risk Management
Operational risk is the risk to the current or projected financial condition and resilience arising from inadequate or failed internalprocesses or systems, human errors or misconduct, or adverse external events. Operational risk is inherent to the entire organization.
Operational risk management is embedded in our culture and decision-making processes through a systematic approach wherebyoperational risks and exposures are: 1) identified and assessed; 2) managed through the design and implementation of controls; 3)measured and evaluated against our risk tolerance limits; and 4) appropriately reported to management and the Risk Committee.Strong operational risk management and well-informed risk-based decisions benefit us by improving the customer experience,enhancing compliance, reducing reputational risk, minimizing losses and establishing an appropriate amount of required operationalrisk capital held by us.
The Operational Risk Management Framework is designed to provide effective and consistent management of operational risk. Theprimary purpose of the framework is to enable us to understand our operational risks and manage them to the desired risk profile, inline with our Risk Appetite. Additionally, the guidance established within the framework enables management to make well-informedrisk-based business decisions.
The framework provides a disciplined and structured process for us to manage operational risk across eight operational risk domains.These domains provide a comprehensive view of operational risk and allow us to discuss operational risk in a standard way,facilitating reporting and ongoing risk mitigation.
The operational risk domains are:• Operations: Risk resulting from inadequate or failed internal processes, misconduct or errors of people or fraud.• Compliance: Risk of legal or regulatory sanctions, financial loss, or damage to reputation resulting from failure to comply
with laws, regulations, rules, self-regulatory standards, or other regulatory requirements.• Data Management: Risk associated with incomplete or inaccurate data.• Model: Risk associated with the design, implementation, and ongoing use and management of a model.• Technology and Systems: Risk associated with the use, operation, and adoption of technology.• Information Security: Risk resulting from the failure to protect information and ensure appropriate access to, and use and
handling of information assets.• Business Continuity: Risk of potential disruptive events to business activities.• Third Party: Risk arising from failure of third party providers to conduct activity in a safe and sound manner and in
compliance with contract provisions and applicable laws and regulations.
We utilize operational risk management programs within the framework, including Risk Control and Self-Assessments, scenarioanalysis, and internal and external loss event review and analysis, to assess existing risks, determine potential/emerging risks andevaluate the effectiveness of internal controls. The program tools and methodology enable our business managers to identify potentialrisks and control gaps.
Lines of business are responsible for identifying, owning, managing and monitoring the operational risks and controls associated withits business activities and product or service offerings to within acceptable levels. Centralized functions, such as Business Continuity,Enterprise Third Party Management, and Information Security, are responsible for the development, implementation and managementof their individual programs and for the development and maintenance of the policies, procedures, methodologies, tools andtechnology utilized across the enterprise to identify, assess, monitor and report program risks. Additionally, independent riskmanagement reviews and challenges line of business adherence to the framework to ensure proper controls are in place andappropriate risk mitigation plans are established as necessary.
Conduct, Reputational and Strategic RiskPNC’s risk culture seeks to reinforce the appropriate protocols for responsible and ethical behavior through sound processes andcontrols. In order to promote a robust risk culture, the Board and executive management establish code of conduct and professional
86 The PNC Financial Services Group, Inc. – 2020 Form 10-K
standards to which all employees must adhere. A strong risk culture discourages misconduct and supports Conduct risk management atPNC. Conduct risk is defined as the risk that employees fail to comply with the ethical standards expected of them. Strong Conductrisk management is important in supporting PNC’s reputation and PNC maintains a corporate culture that emphasizes complying withlaws, regulations, and managing reputational risks. Reputational risk is the risk to the franchise and/or shareholder value based on anegative perception of PNC by its stakeholders and/or the changing expectations of its stakeholders. While managing PNC’sreputation preserves PNC’s brand value, Strategic risk is another component of the ERM Framework that is also critical to optimizingshareholder returns. Strategic risk is the risk to earnings that may arise from adverse business decisions, improper implementation ofbusiness decisions and/or inadequate response to changes in the business environment. Strategic risk is considered and assessed by ourbusinesses in the annual strategic planning processes and monitored on an on-going basis as those plans are carried out.
Compliance RiskEnterprise Compliance is responsible for oversight of compliance risk for the organization. Compliance issues are identified andtracked through enterprise-wide monitoring and testing activities. Compliance risk issues are escalated through a comprehensive riskreporting process at both a business and enterprise level and incorporated, as appropriate, into the development and assessment of ouroperational risk profile. A management committee, co-chaired by the Chief Compliance Officer and the Chief BSA/AML Officer, isresponsible for oversight of compliance and fiduciary risk management programs across PNC. Enterprise Compliance, through theRegulatory Change Program, helps PNC understand and proactively address emerging regulatory topics and risks as well as respond tochanges in applicable laws and regulations. To understand emerging issues impacting the industry, Enterprise Compliancecommunicates regularly with various regulators having supervisory or regulatory responsibilities with respect to us, our subsidiaries,or businesses and participates in forums focused on regulatory and compliance matters in the financial services industry.
Information Security RiskThe Information Security component of our Operational Risk Management Framework is responsible for protecting information assetsto achieve business objectives, which includes cyber security. PNC’s cyber security program is designed to identify risks to sensitiveinformation, protect that information, detect threats and events, and maintain an appropriate response and recovery capability to helpensure resilience against information security incidents. The program includes, among other things, annual security and privacytraining for all PNC employees and quarterly phishing exercises to raise employee awareness. Our security program is also regularlyexamined by federal regulators for compliance with financial regulations and standards. The program also establishes expectations forinformation asset management, system development security, identity and access management, incident management, threat andvulnerability management, security operations management, and third and fourth party security.
CRITICAL ACCOUNTING ESTIMATES AND JUDGMENTS
Our consolidated financial statements are prepared by applying certain accounting policies. Note 1 Accounting Policies in the NotesTo Consolidated Financial Statements in Item 8 of this Report describes the most significant accounting policies that we use. Certainof these policies require us to make estimates or economic assumptions that may vary under different assumptions or conditions, andsuch variations may significantly affect our reported results and financial position for the period or in future periods.
Allowance for Credit Losses
On January 1, 2020, we adopted ASU 2016-13 - Credit Losses, commonly referred to as the CECL standard. The following discussionrelates to our ACL, post implementation of CECL. For additional information on our allowances for loan and lease losses andunfunded loan commitments and letters of credit prior to this adoption see Note 1 Accounting Policies and Critical AccountingEstimates and Judgments in our 2019 Form 10-K.
We maintain the ACL at levels that we believe to be appropriate as of the balance sheet date to absorb expected credit losses on ourexisting investment securities, loans, equipment finance leases (including residual values), other financial assets and unfunded lendingrelated commitments, for the remaining contractual term of the assets or exposures, taking into consideration expected prepayments.Our determination of the ACL is based on historical loss experience, current borrower characteristics, current economic conditions,reasonable and supportable forecasts of future conditions and other relevant factors. We use methods sensitive to changes in economicconditions to interpret these factors to estimate expected credit losses. We evaluate and, when appropriate, enhance the quality of ourdata and models and other methods used to estimate ACL on an ongoing basis. We apply qualitative factors to reflect in the ACL ourbest estimate of amounts that we do not expect to collect because of, among other things, idiosyncratic risk factors, changes ineconomic conditions that may not be reflected in forecasted results, or other potential methodology weaknesses. The ACL estimatesare therefore susceptible to various factors, including, but not limited to, the following major factors:
• Current economic conditions and borrower quality: Our forecast of expected losses depends on conditions and portfolioquality as of the estimation date. As current conditions evolve, forecasted losses could be materially affected.
• Scenario weights and design: Our loss estimates are sensitive to the shape and severity of macroeconomic forecasts and thusvary significantly between upside and downside scenarios. Change to probability weights assigned to these scenarios andtiming of peak business cycles reflected by the scenarios could materially affect our loss estimates.
The PNC Financial Services Group, Inc. – 2020 Form 10-K 87
• Portfolio volume and mix: Changes to portfolio volume and mix could materially affect our estimates, as CECL reserveswould be recognized upon origination or acquisition.
For all assets and unfunded lending related commitments within the scope of the CECL standard, the applicable ACL is composed ofone or a combination of the following components: (i) collectively assessed or pooled reserves, (ii) individually assessed reserves, and(iii) qualitative (judgmental) reserves. Our methodologies and key assumptions for each of these components are discussed in Note 1Accounting Policies in the Notes To Consolidated Financial Statements in Item 8 of this Report.
Reasonable and Supportable Economic ForecastUnder CECL, we are required to consider reasonable and supportable forecasts in estimating expected credit losses. For this purpose,we have established a framework which includes a three year forecast period and the use of four economic scenarios with associatedprobability weights, which in combination create a forecast of expected economic outcomes over our reasonable and supportableforecast period. Credit losses estimated in our reasonable and supportable forecast period are sensitive to the shape and severity of thescenarios used and weights assigned to them.
To generate the four economic forecast scenarios we use a combination of quantitative macroeconomic models, other measures ofeconomic activity and forward-looking expert judgment to forecast the distribution of economic outcomes over the reasonable andsupportable forecast period. Each scenario is then given an associated probability (weight) in order to represent our current expectationwithin that distribution over the forecast period. This process is informed by current economic conditions, expected business cycleevolution and the expert judgment of PNC’s CECL RAC. This approach seeks to provide a reasonable representation of the forecast ofexpected economic outcomes and is used to estimate expected credit losses across a variety of loans and securities. Each quarter thescenarios are presented for approval to PNC’s CECL RAC, and the committee determines and approves CECL scenarios’ weights foruse for the current reporting period.
The scenarios used for the period ended December 31, 2020 were designed to reflect the economic recovery that began in May, whichconsistently outpaced market expectations and remained strong through the end of the year, but has begun to show signs of animpending slowdown. We used a number of economic variables in our scenarios, with the most significant drivers being GDP andunemployment rate measures. Using the weighted-average of our four economic forecast scenarios, we estimated that GDP grew 3.0%in the fourth quarter of 2020 finishing the year down 2.8% from fourth quarter 2019 levels with 2.3% growth in 2021, recovering topre-recession peak levels in the first quarter of 2022. The weighted-average unemployment rate was estimated to rise to 7.8% in thefirst quarter of 2021, with the labor market beginning to recover again in third quarter 2021, and ending 2021 at 6.8%. Theunemployment rate was estimated to reach 5.7% and 5.0% by the end of 2022 and 2023, respectively. One of the scenarios included inour weighted-average is our baseline prediction of the most likely economic outcome; which includes estimated GDP recovering topre-pandemic levels in late 2021 with unemployment not expected to return to its pre-pandemic level until at least 2023. See ourBusiness Outlook and the Cautionary Statement Regarding Forward-Looking Information in this Item 7 for additional discussion onour baseline prediction of the most likely economic outcome. While the economy saw significant recovery from the onset of thepandemic in national level macroeconomic indicators, considerable uncertainty remains regarding overall lifetime loss content for bothour commercial and consumer portfolios, specifically as it relates to our customers that are less likely to benefit from the economicrecovery currently underway. For commercial borrowers, there are substantial concerns around industries that are dependent on in-person gatherings, hospitality and tourism. For consumer borrowers, payment behavior once the CARES Act stimulus wanes is alsodifficult to predict but we believe the highest uncertainty is concentrated within consumer borrowers who have been affordedaccommodation as it relates to payment deferral/forbearance. As such, for both our commercial and consumer loan portfolios, PNCidentified and performed significant analysis around these key, highly impacted segments to ensure our reserves were adequate in lightof the improved economic environment. We believe that the economic assumptions used in the scenarios for the fourth quarter of2020, in combination with increased reserves for borrowers in segments most adversely impacted by the pandemic, sufficiently reflectthe life of loan losses in the current portfolio.
For internal analytical purposes, we considered what our capital ratios would be if we had an ACL at December 31, 2020 equal to theFederal Reserve’s estimated nine quarter credit losses for PNC under the 2020 CCAR supervisory severely adverse scenario of $12.1billion, increasing the reserves by approximately $6.0 billion at year end. This analysis resulted in a CET1 ratio of approximately10.6% at December 31, 2020, a level well above 7.0%, which is our regulatory minimum of 4.5% plus our SCB of 2.5%. This scenariowas not our expectation at December 31, 2020 and does not reflect our current expectation, nor does it capture all the potentialunknown variables, but it provides an approximation of a possible outcome under hypothetical severe conditions. The CECLmethodology inherently requires a high degree of judgment. As a result, it is possible that we may, at another point in time, reachdifferent conclusions regarding our credit loss estimates.
Residential and Commercial Mortgage Servicing Rights
We elect to measure our MSRs at fair value. This election was made to be consistent with our risk management strategy to hedgechanges in the fair value of these assets. The fair value of our MSRs is estimated by using a discounted cash flow valuation model
88 The PNC Financial Services Group, Inc. – 2020 Form 10-K
which calculates the present value of estimated future net servicing cash flows, taking into consideration actual and expected mortgageloan prepayment rates, discount rates, servicing costs, and other factors which are determined based on current market conditions.
We employ risk management strategies designed to protect the value of MSRs from changes in interest rates and related marketfactors. The values of the MSRs are economically hedged with securities and derivatives, including interest-rate swaps, options, andforward mortgage-backed and futures contracts. As interest rates change, these financial instruments are expected to have changes infair value negatively correlated to the change in fair value of the hedged MSR portfolios. The hedge relationships are activelymanaged in response to changing market conditions over the life of the MSRs. Selecting appropriate financial instruments toeconomically hedge residential or commercial MSRs requires significant management judgment to assess how mortgage rates andprepayment speeds could affect the future values of MSRs. Hedging results can frequently be less predictable in the short term, butover longer periods of time are expected to protect the economic value of the MSRs.
For additional information on our residential and commercial MSRs, see Note 1 Accounting Policies, Note 6 Goodwill and MortgageServicing Rights and Note 15 Fair Value in the Notes To Consolidated Financial Statements in Item 8 of this Report.
Fair Value Measurements
We must use estimates, assumptions and judgments when assets and liabilities are required to be recorded at, or adjusted to reflect, fairvalue. Assets and liabilities carried at fair value inherently result in a higher degree of financial statement volatility. Fair values andthe information used to record valuation adjustments for certain assets and liabilities are based on either quoted market prices or areprovided by independent third-party sources, including appraisers and valuation specialists, when available. When such third-partyinformation is not available, we estimate fair value primarily by using cash flow and other financial modeling techniques. Changes inunderlying factors, assumptions, or estimates in any of these areas could materially impact our future financial condition and results ofoperations.
We apply ASC 820 – Fair Value Measurements. This guidance defines fair value as the price that would be received to sell a financialasset or paid to transfer a financial liability in an orderly transaction between market participants at the measurement date. Thisguidance requires a three level hierarchy for disclosure of assets and liabilities recorded at fair value. The classification of assets andliabilities within the hierarchy is based on whether the inputs to the valuation methodology used in the measurement are observable orunobservable. Level 3 assets and liabilities are those where the fair value is estimated using significant unobservable inputs.
For additional information on fair value measurements, see Note 15 Fair Value in the Notes To Consolidated Financial Statements inItem 8 of this Report.
Recently Adopted Accounting Pronouncements
See Note 1 Accounting Policies in the Notes To Consolidated Financial Statements in Item 8 of this Report regarding the impact ofnew accounting pronouncements which we have adopted.
OFF-BALANCE SHEET ARRANGEMENTS ANDVARIABLE INTEREST ENTITIESWe engage in a variety of activities that involve entities that are not consolidated or otherwise reflected in our Consolidated BalanceSheet that are generally referred to as “off-balance sheet arrangements.” Additional information on these types of activities is includedin the following sections of this Report:
• Contractual Obligations and Commitments included within the Risk Management section of this Item 7, and• Note 5 Loan Sale and Servicing Activities and Variable Interest Entities,• Note 10 Borrowed Funds,• Note 11 Commitments, and• Note 12 Equity, all of which are in the Notes To Consolidated Financial Statements included in Item 8 of this Report.
A summary and further description of VIEs as of December 31, 2020 and 2019 is included in Note 1 Accounting Policies and Note 5Loan Sale and Servicing and Variable Interest Entities in the Notes To Consolidated Financial Statements included in Item 8 of thisReport.
Trust Preferred Securities
See Note 10 Borrowed Funds in the Notes To Consolidated Financial Statements in Item 8 of this Report for additional information ontrust preferred securities issued by PNC Capital Trust C including information on contractual limitations potentially imposed onpayments (including dividends) with respect to PNC’s equity securities.
The PNC Financial Services Group, Inc. – 2020 Form 10-K 89
CAUTIONARY STATEMENT REGARDING FORWARD-LOOKING INFORMATIONWe make statements in this Report, and we may from time to time make other statements, regarding our outlook for earnings,revenues, expenses, tax rates, capital and liquidity levels and ratios, asset levels, asset quality, financial position, and other mattersregarding or affecting us and our future business and operations that are forward-looking statements within the meaning of the PrivateSecurities Litigation Reform Act. Forward-looking statements are typically identified by words such as “believe,” “plan,” “expect,”“anticipate,” “see,” “look,” “intend,” “outlook,” “project,” “forecast,” “estimate,” “goal,” “will,” “should” and other similar words andexpressions.
Forward-looking statements are necessarily subject to numerous assumptions, risks and uncertainties, which change over time. Futureevents or circumstances may change our outlook and may also affect the nature of the assumptions, risks and uncertainties to whichour forward-looking statements are subject. Forward-looking statements speak only as of the date made. We do not assume any dutyand do not undertake to update forward-looking statements. Actual results or future events could differ, possibly materially, fromthose anticipated in forward-looking statements, as well as from historical performance. As a result, we caution against placing unduereliance on any forward-looking statements.
Our forward-looking statements are subject to the following principal risks and uncertainties.▪ Our businesses, financial results and balance sheet values are affected by business and economic conditions, including the
following:– Changes in interest rates and valuations in debt, equity and other financial markets,– Disruptions in the U.S. and global financial markets,– Actions by the Federal Reserve Board, U.S. Treasury and other government agencies, including those that impact money
supply and market interest rates,– Changes in customer behavior due to changing business and economic conditions or legislative or regulatory initiatives,– Changes in customers’, suppliers’ and other counterparties’ performance and creditworthiness,– Impacts of tariffs and other trade policies of the U.S. and its global trading partners,– The length and extent of the economic impacts of the COVID-19 pandemic,– The impact of the results of the recent U.S. elections on the regulatory landscape, capital markets, and the response to
and management of the COVID-19 pandemic, including whether there will be additional fiscal stimulus from the federalgovernment and, if so, its size, scope and effectiveness, and
– Commodity price volatility.▪ Our forward-looking financial statements are subject to the risk that economic and financial market conditions will be
substantially different than those we are currently expecting and do not take into account potential legal and regulatorycontingencies. These statements are based on our views that:– The U.S. economy is in an economic recovery, following a very severe but very short economic contraction in the first
half of 2020 due to the COVID-19 pandemic and public health measures to contain it.– Despite the improvement in the economy since the spring of 2020, economic activity remains far below its pre-pandemic
level and unemployment remains elevated.– Growth will be much weaker in early 2021 because of record COVID-19 cases and continued government restrictions of
economic activity. Growth should then pick up in the spring of 2021 as vaccines are more widely available and thefederal government provides aid to households and small and medium-sized businesses. PNC does not expect real GDPto return to its pre-pandemic level until late 2021, and does not expect employment to return to its pre-pandemic leveluntil at least 2023.
– PNC expects the FOMC to keep the fed funds rate in its current range of 0.00% to 0.25% through at least mid-2024.• PNC’s ability to take certain capital actions, including returning capital to shareholders, is subject to PNC meeting or
exceeding a stress capital buffer established by the Federal Reserve Board in connection with the Federal Reserve Board’sCCAR process. The Federal Reserve also has imposed additional limitations on capital distributions through the first quarterof 2021 by CCAR-participating bank holding companies and may extend these limitations, potentially in modified form.
• PNC’s regulatory capital ratios in the future will depend on, among other things, the company’s financial performance, thescope and terms of final capital regulations then in effect and management actions affecting the composition of PNC’sbalance sheet. In addition, PNC’s ability to determine, evaluate and forecast regulatory capital ratios, and to take actions(such as capital distributions) based on actual or forecasted capital ratios, will be dependent at least in part on thedevelopment, validation and regulatory review of related models.
• Legal and regulatory developments could have an impact on our ability to operate our businesses, financial condition, resultsof operations, competitive position, reputation, or pursuit of attractive acquisition opportunities. Reputational impacts couldaffect matters such as business generation and retention, liquidity, funding, and ability to attract and retain management.These developments could include:– Changes to laws and regulations, including changes affecting oversight of the financial services industry, consumer
protection, bank capital and liquidity standards, pension, bankruptcy and other industry aspects, and changes inaccounting policies and principles.
90 The PNC Financial Services Group, Inc. – 2020 Form 10-K
– Unfavorable resolution of legal proceedings or other claims and regulatory and other governmental investigations orother inquiries. These matters may result in monetary judgments or settlements or other remedies, including fines,penalties, restitution or alterations in our business practices, and in additional expenses and collateral costs, and maycause reputational harm to PNC.
– Results of the regulatory examination and supervision process, including our failure to satisfy requirements ofagreements with governmental agencies.
– Impact on business and operating results of any costs associated with obtaining rights in intellectual property claimed byothers and of adequacy of our intellectual property protection in general.
• Business and operating results are affected by our ability to identify and effectively manage risks inherent in our businesses,including, where appropriate, through effective use of systems and controls, third-party insurance, derivatives, and capitalmanagement techniques, and to meet evolving regulatory capital and liquidity standards.
• Our planned acquisition of BBVA presents us with risks and uncertainties related both to the acquisition transaction itself andto the integration of the acquired business into PNC after closing:– The business of BBVA, including its U.S. banking subsidiary, BBVA USA, going forward may not perform as we
currently project or in a manner consistent with historical performance. As a result, the anticipated benefits, includingestimated cost savings, of the transaction may be significantly harder or take longer to achieve than expected or may notbe achieved in their entirety as a result of unexpected factors or events, including those that are outside of our control.
– The combination of BBVA, including its U.S. banking subsidiary, BBVA USA, with that of PNC and PNC Bank may bemore difficult to achieve than anticipated or have unanticipated adverse results relating to BBVA, including its U.S.banking subsidiary, BBVA USA, or our existing businesses.
– Completion of the transaction is dependent on the satisfaction of customary closing conditions, which cannot be assured.The timing of completion of the transaction is dependent on various factors that cannot be predicted with precision at thispoint.
• In addition to the planned BBVA transaction, we grow our business in part through acquisitions and new strategic initiatives.Risks and uncertainties include those presented by the nature of the business acquired and strategic initiative, including insome cases those associated with our entry into new businesses or new geographic or other markets and risks resulting fromour inexperience in those new areas, as well as risks and uncertainties related to the acquisition transactions themselves,regulatory issues, and the integration of the acquired businesses into PNC after closing.
• Competition can have an impact on customer acquisition, growth and retention and on credit spreads and product pricing,which can affect market share, deposits and revenues. Our ability to anticipate and respond to technological changes can alsoimpact our ability to respond to customer needs and meet competitive demands.
• Business and operating results can also be affected by widespread natural and other disasters, pandemics, dislocations,terrorist activities, system failures, security breaches, cyberattacks or international hostilities through impacts on the economyand financial markets generally or on us or our counterparties specifically.
We provide greater detail regarding these as well as other factors in this Report, including in Item 1A Risk Factors, the RiskManagement section of Item 7, and Note 11 Commitments and Note 21 Legal Proceedings in the Notes To Consolidated FinancialStatements in Item 8 of this Report. Our forward-looking statements may also be subject to other risks and uncertainties, includingthose discussed elsewhere in this Report or in our other filings with the SEC.
ITEM 7A – QUANTITATIVE AND QUALITATIVE DISCLOSURES ABOUT MARKET RISKThis information is set forth in the Risk Management section of Item 7 and in Note 1 Accounting Policies, Note 15 Fair Value andNote 16 Financial Derivatives in the Notes To Consolidated Financial Statements in Item 8 of this Report.
The PNC Financial Services Group, Inc. – 2020 Form 10-K 91
ITEM 8 – FINANCIAL STATEMENTS AND SUPPLEMENTARY DATA
REPORT OF INDEPENDENT REGISTERED PUBLIC ACCOUNTING FIRMTo the Board of Directors and Shareholders of The PNC Financial Services Group, Inc.
Opinions on the Financial Statements and Internal Control over Financial Reporting
We have audited the accompanying consolidated balance sheets of The PNC Financial Services Group, Inc. and its subsidiaries (the“Company”) as of December 31, 2020 and 2019, and the related consolidated statements of income, comprehensive income, changesin equity and cash flows for each of the three years in the period ended December 31, 2020, including the related notes (collectivelyreferred to as the “consolidated financial statements”). We also have audited the Company's internal control over financial reporting asof December 31, 2020, based on criteria established in Internal Control - Integrated Framework (2013) issued by the Committee ofSponsoring Organizations of the Treadway Commission (COSO).
In our opinion, the consolidated financial statements referred to above present fairly, in all material respects, the financial position ofthe Company as of December 31, 2020 and 2019, and the results of its operations and its cash flows for each of the three years in theperiod ended December 31, 2020 in conformity with accounting principles generally accepted in the United States of America. Also inour opinion, the Company maintained, in all material respects, effective internal control over financial reporting as of December 31,2020, based on criteria established in Internal Control - Integrated Framework (2013) issued by the COSO.
Change in Accounting Principle
As discussed in Note 1 to the consolidated financial statements, the Company changed the manner in which it accounts for theallowance for credit losses in 2020.
Basis for Opinions
The Company's management is responsible for these consolidated financial statements, for maintaining effective internal control overfinancial reporting, and for its assessment of the effectiveness of internal control over financial reporting, included in Management’sReport on Internal Control over Financial Reporting appearing under Item 9A. Our responsibility is to express opinions on theCompany’s consolidated financial statements and on the Company's internal control over financial reporting based on our audits. Weare a public accounting firm registered with the Public Company Accounting Oversight Board (United States) (PCAOB) and arerequired to be independent with respect to the Company in accordance with the U.S. federal securities laws and the applicable rulesand regulations of the Securities and Exchange Commission and the PCAOB.
We conducted our audits in accordance with the standards of the PCAOB. Those standards require that we plan and perform the auditsto obtain reasonable assurance about whether the consolidated financial statements are free of material misstatement, whether due toerror or fraud, and whether effective internal control over financial reporting was maintained in all material respects.
Our audits of the consolidated financial statements included performing procedures to assess the risks of material misstatement of theconsolidated financial statements, whether due to error or fraud, and performing procedures that respond to those risks. Suchprocedures included examining, on a test basis, evidence regarding the amounts and disclosures in the consolidated financialstatements. Our audits also included evaluating the accounting principles used and significant estimates made by management, as wellas evaluating the overall presentation of the consolidated financial statements. Our audit of internal control over financial reportingincluded obtaining an understanding of internal control over financial reporting, assessing the risk that a material weakness exists, andtesting and evaluating the design and operating effectiveness of internal control based on the assessed risk. Our audits also includedperforming such other procedures as we considered necessary in the circumstances. We believe that our audits provide a reasonablebasis for our opinions.
Definition and Limitations of Internal Control over Financial Reporting
A company’s internal control over financial reporting is a process designed to provide reasonable assurance regarding the reliability offinancial reporting and the preparation of financial statements for external purposes in accordance with generally accepted accountingprinciples. A company’s internal control over financial reporting includes those policies and procedures that (i) pertain to themaintenance of records that, in reasonable detail, accurately and fairly reflect the transactions and dispositions of the assets of thecompany; (ii) provide reasonable assurance that transactions are recorded as necessary to permit preparation of financial statements inaccordance with generally accepted accounting principles, and that receipts and expenditures of the company are being made only inaccordance with authorizations of management and directors of the company; and (iii) provide reasonable assurance regardingprevention or timely detection of unauthorized acquisition, use, or disposition of the company’s assets that could have a material effecton the financial statements.
92 The PNC Financial Services Group, Inc. – 2020 Form 10-K
Because of its inherent limitations, internal control over financial reporting may not prevent or detect misstatements. Also, projectionsof any evaluation of effectiveness to future periods are subject to the risk that controls may become inadequate because of changes inconditions, or that the degree of compliance with the policies or procedures may deteriorate.
Critical Audit Matters
The critical audit matter communicated below is a matter arising from the current period audit of the consolidated financial statementsthat was communicated or required to be communicated to the audit committee and that (i) relates to accounts or disclosures that arematerial to the consolidated financial statements and (ii) involved our especially challenging, subjective, or complex judgments. Thecommunication of critical audit matters does not alter in any way our opinion on the consolidated financial statements, taken as awhole, and we are not, by communicating the critical audit matter below, providing a separate opinion on the critical audit matter oron the accounts or disclosures to which it relates.
Allowance for Loans and Lease Losses – Commercial Loans
As described in Notes 1 and 4 to the consolidated financial statements, the allowance for loans and lease losses was approximately$5,361 million as of December 31, 2020, of which $3,337 million relates to commercial loans. For commercial loans, thedetermination of the allowance is based on historical loss experience, current borrower risk characteristics, current economicconditions, reasonable and supportable economic forecasts and other relevant factors. As disclosed by management, the Company hasestablished a framework for developing the reasonable and supportable economic forecasts, which includes the use of four economicforecast scenarios and associated probability weights, which in combination create a forecast of expected economic outcomes. Togenerate the four economic forecast scenarios, the Company uses a combination of quantitative macroeconomic models, othermeasures of economic activity and forward-looking judgment to forecast the distribution of economic outcomes. The economicforecast scenarios which are inputs into the credit loss models, include a number of economic variables with the most significantdrivers being GDP and unemployment rate measures. Also included in the allowance for loan and lease losses for commercial loansare qualitative reserves to cover losses that are expected but, in the Company’s assessment, may not be adequately represented in thequantitative methods or the economic assumptions. For example, qualitative factors that the Company considers include industryconcentration and conditions, changes in market conditions, recent credit quality trends, model imprecision, the impacts of COVID-19on highly impacted segments, and other factors.
The principal considerations for our determination that performing procedures relating to the allowance for loan and lease losses forcommercial loans is a critical audit matter are (i) the significant judgment and estimation by management in developing economicforecast scenarios, determining weighting of each scenario, and estimating qualitative reserves related to the impacts of COVID-19 oncertain highly impacted segments, which in turn led to a high degree of auditor judgment, subjectivity and effort in performingprocedures and in evaluating audit evidence obtained and (ii) the audit effort involved professionals with specialized skill andknowledge.
Addressing the matter involved performing procedures and evaluating audit evidence in connection with forming our overall opinionon the consolidated financial statements. These procedures included testing the effectiveness of controls relating to the allowance forloan and lease losses for commercial loans, including controls over the development and approval of economic forecast scenarios,related weightings, and qualitative reserves. These procedures also included, among others, testing management’s process forestimating the allowance for loan and lease losses for commercial loans, including (i) evaluating the appropriateness and methodologyof certain loss forecasting models (ii) evaluating the reasonableness of certain borrower risk characteristics, (iii) evaluating thereasonableness of certain forecasted economic variables such as GDP and unemployment measures, (iv) evaluating the reasonablenessof management’s weighting of economic forecast scenarios used in the loss forecast models, (v) testing the completeness and accuracyof data used in the estimate, and (vi) evaluating certain qualitative reserves made to the model output results to determine the overallallowance for loan and lease losses for commercial loans. The procedures also included the involvement of professionals withspecialized skill and knowledge to assist in evaluating certain models, model inputs, economic forecasts, and qualitative reserves inthe commercial allowance estimate.
/s/ PricewaterhouseCoopers LLPPittsburgh, PennsylvaniaFebruary 26, 2021
We have served as the Company’s auditor since 2007.
The PNC Financial Services Group, Inc. – 2020 Form 10-K 93
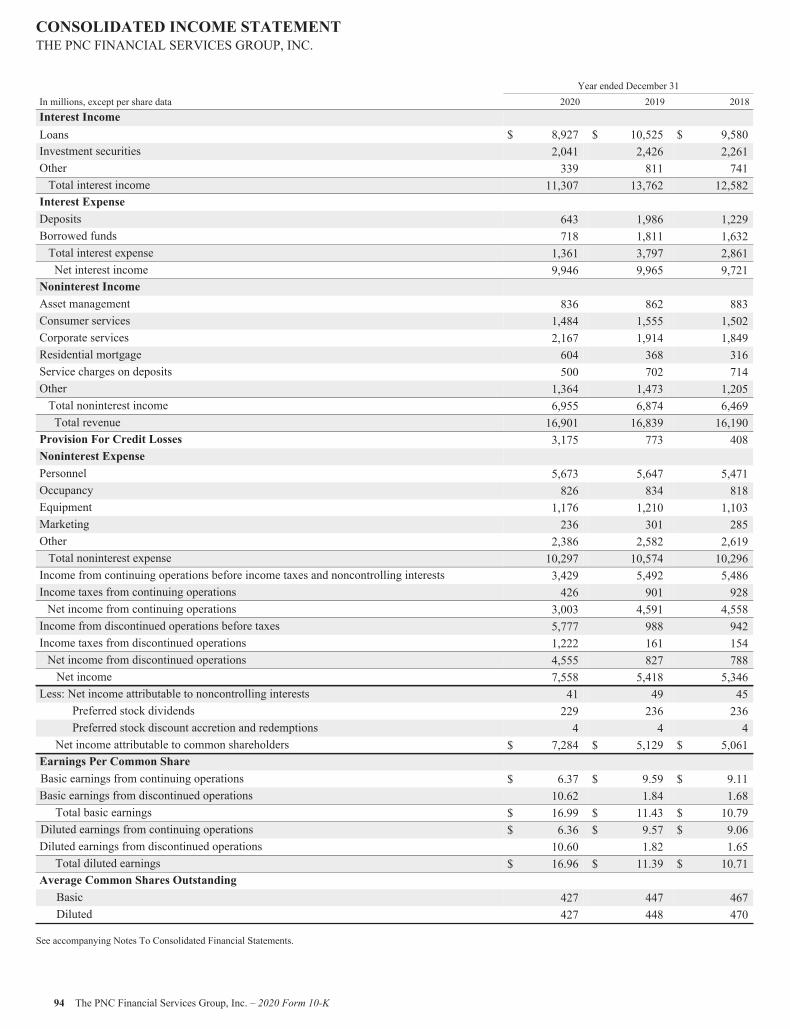
CONSOLIDATED INCOME STATEMENTTHE PNC FINANCIAL SERVICES GROUP, INC.
Year ended December 31In millions, except per share data 2020 2019 2018Interest IncomeLoans $ 8,927 $ 10,525 $ 9,580Investment securities 2,041 2,426 2,261Other 339 811 741Total interest income 11,307 13,762 12,582Interest ExpenseDeposits 643 1,986 1,229Borrowed funds 718 1,811 1,632Total interest expense 1,361 3,797 2,861Net interest income 9,946 9,965 9,721
Noninterest IncomeAsset management 836 862 883Consumer services 1,484 1,555 1,502Corporate services 2,167 1,914 1,849Residential mortgage 604 368 316Service charges on deposits 500 702 714Other 1,364 1,473 1,205Total noninterest income 6,955 6,874 6,469Total revenue 16,901 16,839 16,190
Provision For Credit Losses 3,175 773 408Noninterest ExpensePersonnel 5,673 5,647 5,471Occupancy 826 834 818Equipment 1,176 1,210 1,103Marketing 236 301 285Other 2,386 2,582 2,619Total noninterest expense 10,297 10,574 10,296Income from continuing operations before income taxes and noncontrolling interests 3,429 5,492 5,486Income taxes from continuing operations 426 901 928Net income from continuing operations 3,003 4,591 4,558Income from discontinued operations before taxes 5,777 988 942Income taxes from discontinued operations 1,222 161 154Net income from discontinued operations 4,555 827 788Net income 7,558 5,418 5,346
Less: Net income attributable to noncontrolling interests 41 49 45Preferred stock dividends 229 236 236Preferred stock discount accretion and redemptions 4 4 4
Net income attributable to common shareholders $ 7,284 $ 5,129 $ 5,061Earnings Per Common ShareBasic earnings from continuing operations $ 6.37 $ 9.59 $ 9.11Basic earnings from discontinued operations 10.62 1.84 1.68Total basic earnings $ 16.99 $ 11.43 $ 10.79
Diluted earnings from continuing operations $ 6.36 $ 9.57 $ 9.06Diluted earnings from discontinued operations 10.60 1.82 1.65Total diluted earnings $ 16.96 $ 11.39 $ 10.71
Average Common Shares OutstandingBasic 427 447 467Diluted 427 448 470
See accompanying Notes To Consolidated Financial Statements.
94 The PNC Financial Services Group, Inc. – 2020 Form 10-K
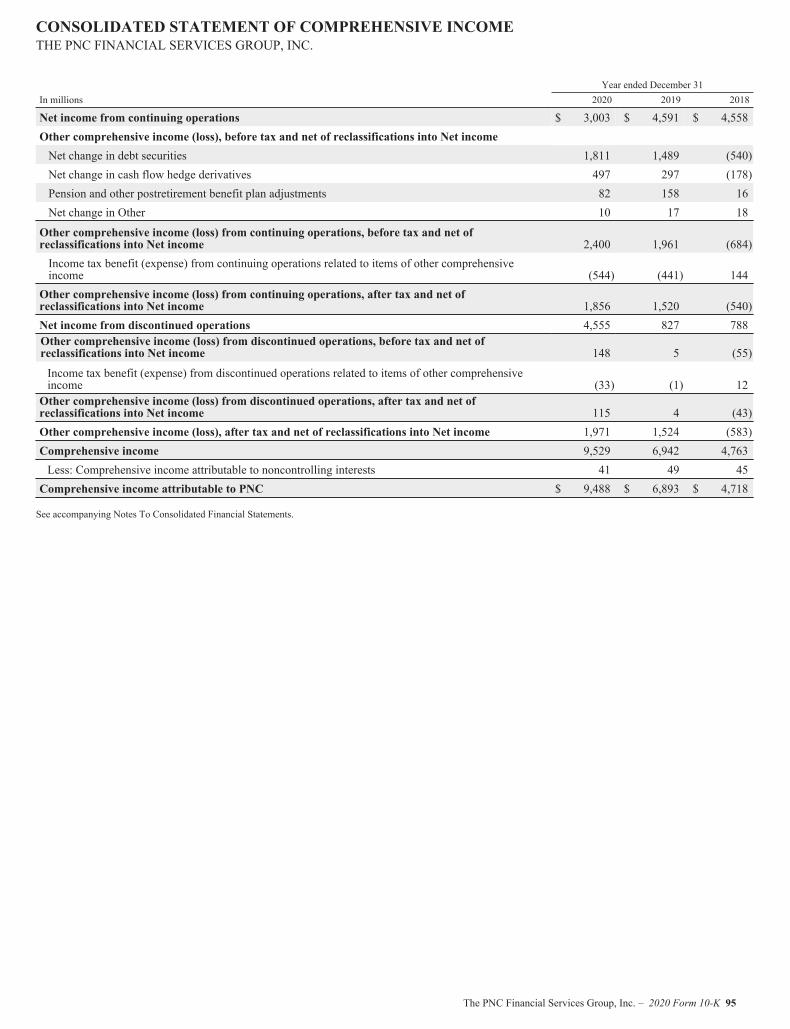
CONSOLIDATED STATEMENT OF COMPREHENSIVE INCOMETHE PNC FINANCIAL SERVICES GROUP, INC.
Year ended December 31In millions 2020 2019 2018
Net income from continuing operations $ 3,003 $ 4,591 $ 4,558Other comprehensive income (loss), before tax and net of reclassifications into Net incomeNet change in debt securities 1,811 1,489 (540)Net change in cash flow hedge derivatives 497 297 (178)Pension and other postretirement benefit plan adjustments 82 158 16Net change in Other 10 17 18
Other comprehensive income (loss) from continuing operations, before tax and net ofreclassifications into Net income 2,400 1,961 (684)Income tax benefit (expense) from continuing operations related to items of other comprehensiveincome (544) (441) 144Other comprehensive income (loss) from continuing operations, after tax and net ofreclassifications into Net income 1,856 1,520 (540)Net income from discontinued operations 4,555 827 788Other comprehensive income (loss) from discontinued operations, before tax and net ofreclassifications into Net income 148 5 (55)
Income tax benefit (expense) from discontinued operations related to items of other comprehensiveincome (33) (1) 12Other comprehensive income (loss) from discontinued operations, after tax and net ofreclassifications into Net income 115 4 (43)Other comprehensive income (loss), after tax and net of reclassifications into Net income 1,971 1,524 (583)Comprehensive income 9,529 6,942 4,763Less: Comprehensive income attributable to noncontrolling interests 41 49 45Comprehensive income attributable to PNC $ 9,488 $ 6,893 $ 4,718
See accompanying Notes To Consolidated Financial Statements.
The PNC Financial Services Group, Inc. – 2020 Form 10-K 95
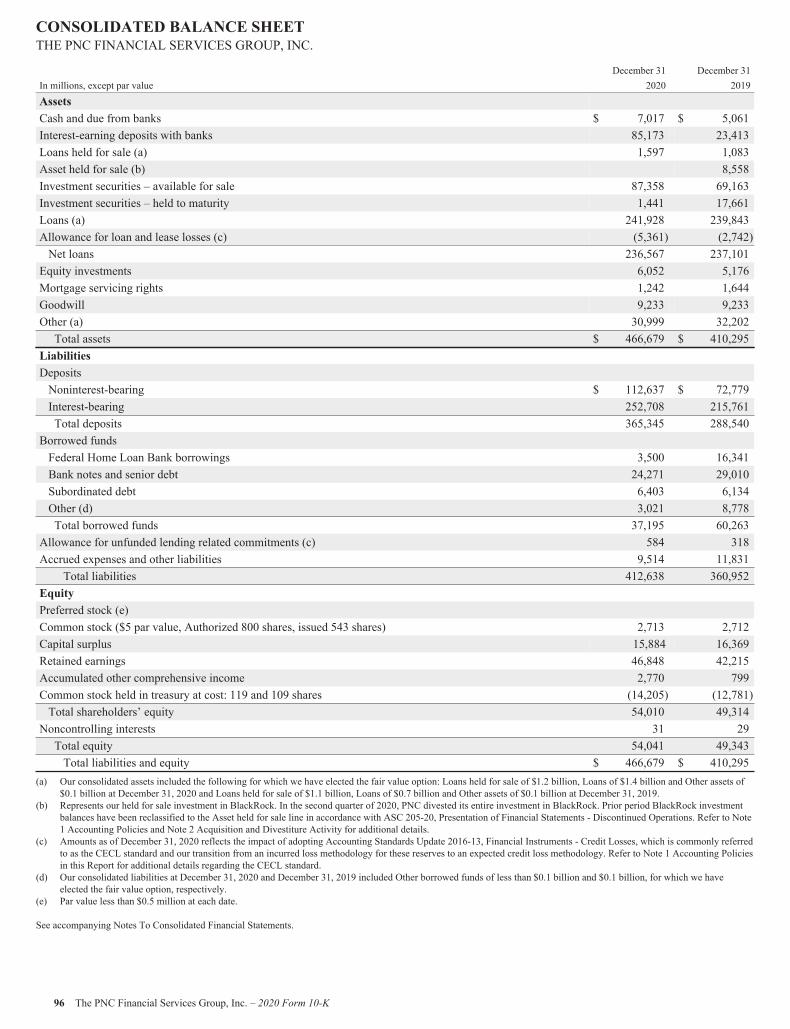
CONSOLIDATED BALANCE SHEETTHE PNC FINANCIAL SERVICES GROUP, INC.
December 31 December 31In millions, except par value 2020 2019
AssetsCash and due from banks $ 7,017 $ 5,061Interest-earning deposits with banks 85,173 23,413Loans held for sale (a) 1,597 1,083Asset held for sale (b) 8,558Investment securities – available for sale 87,358 69,163Investment securities – held to maturity 1,441 17,661Loans (a) 241,928 239,843Allowance for loan and lease losses (c) (5,361) (2,742)Net loans 236,567 237,101Equity investments 6,052 5,176Mortgage servicing rights 1,242 1,644Goodwill 9,233 9,233Other (a) 30,999 32,202Total assets $ 466,679 $ 410,295
LiabilitiesDepositsNoninterest-bearing $ 112,637 $ 72,779Interest-bearing 252,708 215,761Total deposits 365,345 288,540
Borrowed fundsFederal Home Loan Bank borrowings 3,500 16,341Bank notes and senior debt 24,271 29,010Subordinated debt 6,403 6,134Other (d) 3,021 8,778Total borrowed funds 37,195 60,263
Allowance for unfunded lending related commitments (c) 584 318Accrued expenses and other liabilities 9,514 11,831
Total liabilities 412,638 360,952EquityPreferred stock (e)Common stock ($5 par value, Authorized 800 shares, issued 543 shares) 2,713 2,712Capital surplus 15,884 16,369Retained earnings 46,848 42,215Accumulated other comprehensive income 2,770 799Common stock held in treasury at cost: 119 and 109 shares (14,205) (12,781)Total shareholders’ equity 54,010 49,314Noncontrolling interests 31 29Total equity 54,041 49,343Total liabilities and equity $ 466,679 $ 410,295
(a) Our consolidated assets included the following for which we have elected the fair value option: Loans held for sale of $1.2 billion, Loans of $1.4 billion and Other assets of$0.1 billion at December 31, 2020 and Loans held for sale of $1.1 billion, Loans of $0.7 billion and Other assets of $0.1 billion at December 31, 2019.
(b) Represents our held for sale investment in BlackRock. In the second quarter of 2020, PNC divested its entire investment in BlackRock. Prior period BlackRock investmentbalances have been reclassified to the Asset held for sale line in accordance with ASC 205-20, Presentation of Financial Statements - Discontinued Operations. Refer to Note1 Accounting Policies and Note 2 Acquisition and Divestiture Activity for additional details.
(c) Amounts as of December 31, 2020 reflects the impact of adopting Accounting Standards Update 2016-13, Financial Instruments - Credit Losses, which is commonly referredto as the CECL standard and our transition from an incurred loss methodology for these reserves to an expected credit loss methodology. Refer to Note 1 Accounting Policiesin this Report for additional details regarding the CECL standard.
(d) Our consolidated liabilities at December 31, 2020 and December 31, 2019 included Other borrowed funds of less than $0.1 billion and $0.1 billion, for which we haveelected the fair value option, respectively.
(e) Par value less than $0.5 million at each date.
See accompanying Notes To Consolidated Financial Statements.
96 The PNC Financial Services Group, Inc. – 2020 Form 10-K
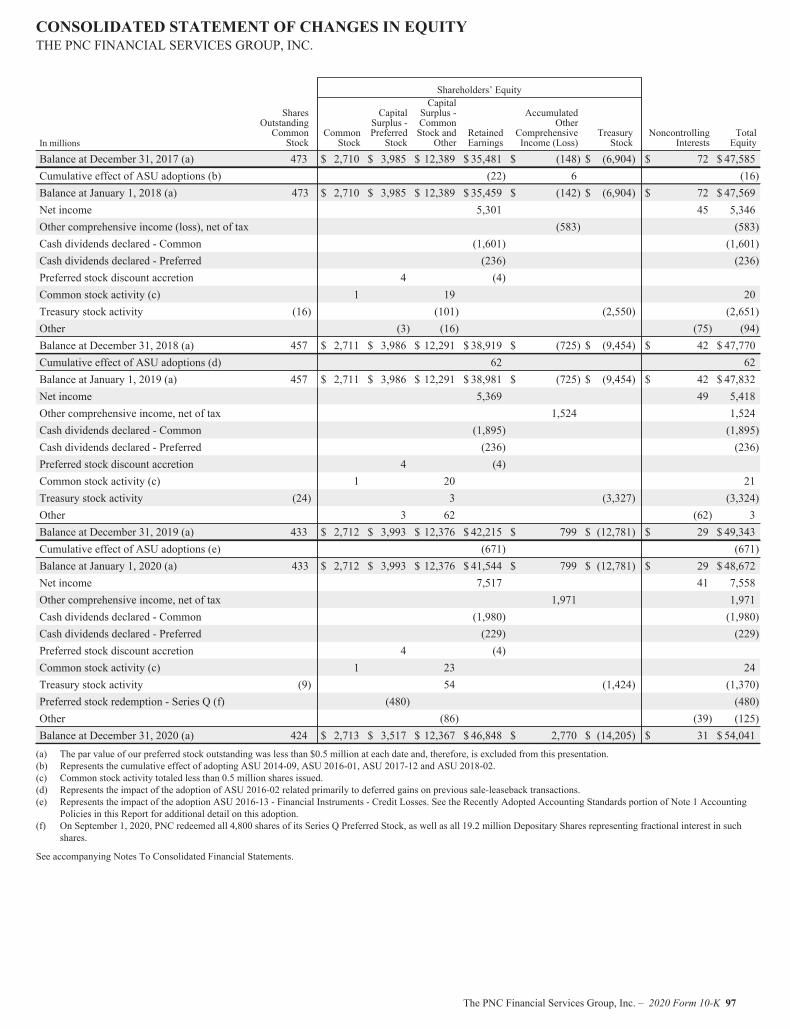
CONSOLIDATED STATEMENT OF CHANGES IN EQUITYTHE PNC FINANCIAL SERVICES GROUP, INC.
Shareholders’ Equity
In millions
SharesOutstandingCommonStock
CommonStock
CapitalSurplus -PreferredStock
CapitalSurplus -CommonStock and
OtherRetainedEarnings
AccumulatedOther
ComprehensiveIncome (Loss)
TreasuryStock
NoncontrollingInterests
TotalEquity
Balance at December 31, 2017 (a) 473 $ 2,710 $ 3,985 $ 12,389 $ 35,481 $ (148) $ (6,904) $ 72 $ 47,585Cumulative effect of ASU adoptions (b) (22) 6 (16)Balance at January 1, 2018 (a) 473 $ 2,710 $ 3,985 $ 12,389 $ 35,459 $ (142) $ (6,904) $ 72 $ 47,569Net income 5,301 45 5,346Other comprehensive income (loss), net of tax (583) (583)Cash dividends declared - Common (1,601) (1,601)Cash dividends declared - Preferred (236) (236)Preferred stock discount accretion 4 (4)Common stock activity (c) 1 19 20Treasury stock activity (16) (101) (2,550) (2,651)Other (3) (16) (75) (94)Balance at December 31, 2018 (a) 457 $ 2,711 $ 3,986 $ 12,291 $ 38,919 $ (725) $ (9,454) $ 42 $ 47,770Cumulative effect of ASU adoptions (d) 62 62Balance at January 1, 2019 (a) 457 $ 2,711 $ 3,986 $ 12,291 $ 38,981 $ (725) $ (9,454) $ 42 $ 47,832Net income 5,369 49 5,418Other comprehensive income, net of tax 1,524 1,524Cash dividends declared - Common (1,895) (1,895)Cash dividends declared - Preferred (236) (236)Preferred stock discount accretion 4 (4)Common stock activity (c) 1 20 21Treasury stock activity (24) 3 (3,327) (3,324)Other 3 62 (62) 3Balance at December 31, 2019 (a) 433 $ 2,712 $ 3,993 $ 12,376 $ 42,215 $ 799 $ (12,781) $ 29 $ 49,343Cumulative effect of ASU adoptions (e) (671) (671)Balance at January 1, 2020 (a) 433 $ 2,712 $ 3,993 $ 12,376 $ 41,544 $ 799 $ (12,781) $ 29 $ 48,672Net income 7,517 41 7,558Other comprehensive income, net of tax 1,971 1,971Cash dividends declared - Common (1,980) (1,980)Cash dividends declared - Preferred (229) (229)Preferred stock discount accretion 4 (4)Common stock activity (c) 1 23 24Treasury stock activity (9) 54 (1,424) (1,370)Preferred stock redemption - Series Q (f) (480) (480)Other (86) (39) (125)Balance at December 31, 2020 (a) 424 $ 2,713 $ 3,517 $ 12,367 $ 46,848 $ 2,770 $ (14,205) $ 31 $ 54,041(a) The par value of our preferred stock outstanding was less than $0.5 million at each date and, therefore, is excluded from this presentation.(b) Represents the cumulative effect of adopting ASU 2014-09, ASU 2016-01, ASU 2017-12 and ASU 2018-02.(c) Common stock activity totaled less than 0.5 million shares issued.(d) Represents the impact of the adoption of ASU 2016-02 related primarily to deferred gains on previous sale-leaseback transactions.(e) Represents the impact of the adoption ASU 2016-13 - Financial Instruments - Credit Losses. See the Recently Adopted Accounting Standards portion of Note 1 Accounting
Policies in this Report for additional detail on this adoption.(f) On September 1, 2020, PNC redeemed all 4,800 shares of its Series Q Preferred Stock, as well as all 19.2 million Depositary Shares representing fractional interest in such
shares.
See accompanying Notes To Consolidated Financial Statements.
The PNC Financial Services Group, Inc. – 2020 Form 10-K 97
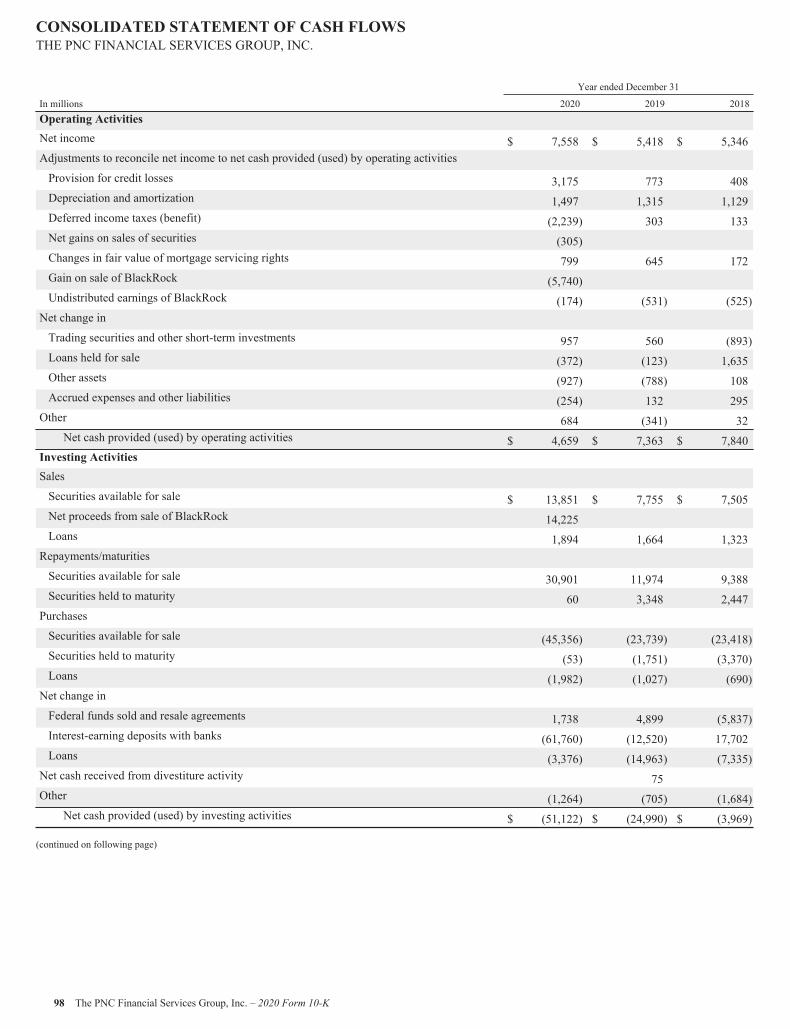
CONSOLIDATED STATEMENT OF CASH FLOWSTHE PNC FINANCIAL SERVICES GROUP, INC.
Year ended December 31
In millions 2020 2019 2018Operating ActivitiesNet income $ 7,558 $ 5,418 $ 5,346Adjustments to reconcile net income to net cash provided (used) by operating activities
Provision for credit losses 3,175 773 408Depreciation and amortization 1,497 1,315 1,129Deferred income taxes (benefit) (2,239) 303 133Net gains on sales of securities (305)Changes in fair value of mortgage servicing rights 799 645 172Gain on sale of BlackRock (5,740)Undistributed earnings of BlackRock (174) (531) (525)Net change in
Trading securities and other short-term investments 957 560 (893)Loans held for sale (372) (123) 1,635Other assets (927) (788) 108Accrued expenses and other liabilities (254) 132 295Other 684 (341) 32
Net cash provided (used) by operating activities $ 4,659 $ 7,363 $ 7,840Investing ActivitiesSales
Securities available for sale $ 13,851 $ 7,755 $ 7,505Net proceeds from sale of BlackRock 14,225Loans 1,894 1,664 1,323Repayments/maturities
Securities available for sale 30,901 11,974 9,388Securities held to maturity 60 3,348 2,447Purchases
Securities available for sale (45,356) (23,739) (23,418)Securities held to maturity (53) (1,751) (3,370)Loans (1,982) (1,027) (690)Net change in
Federal funds sold and resale agreements 1,738 4,899 (5,837)Interest-earning deposits with banks (61,760) (12,520) 17,702Loans (3,376) (14,963) (7,335)Net cash received from divestiture activity 75Other (1,264) (705) (1,684)
Net cash provided (used) by investing activities $ (51,122) $ (24,990) $ (3,969)
(continued on following page)
98 The PNC Financial Services Group, Inc. – 2020 Form 10-K
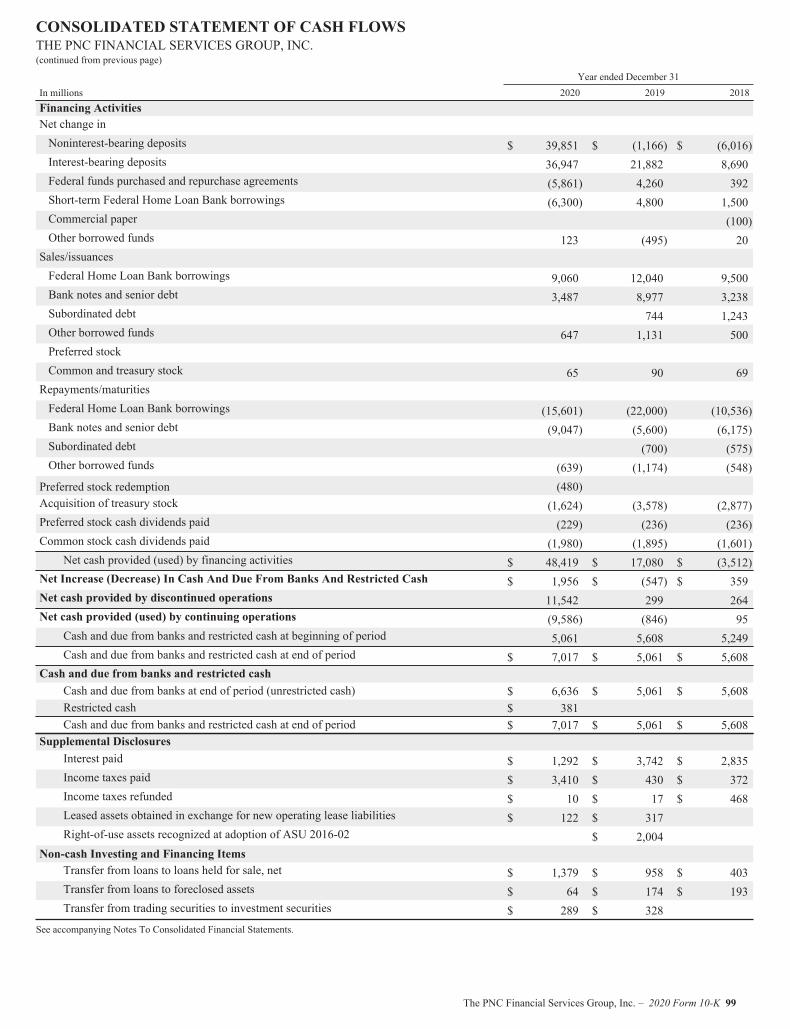
CONSOLIDATED STATEMENT OF CASH FLOWSTHE PNC FINANCIAL SERVICES GROUP, INC.(continued from previous page)
Year ended December 31In millions 2020 2019 2018Financing ActivitiesNet change inNoninterest-bearing deposits $ 39,851 $ (1,166) $ (6,016)Interest-bearing deposits 36,947 21,882 8,690Federal funds purchased and repurchase agreements (5,861) 4,260 392Short-term Federal Home Loan Bank borrowings (6,300) 4,800 1,500Commercial paper (100)Other borrowed funds 123 (495) 20Sales/issuancesFederal Home Loan Bank borrowings 9,060 12,040 9,500Bank notes and senior debt 3,487 8,977 3,238Subordinated debt 744 1,243Other borrowed funds 647 1,131 500Preferred stockCommon and treasury stock 65 90 69Repayments/maturitiesFederal Home Loan Bank borrowings (15,601) (22,000) (10,536)Bank notes and senior debt (9,047) (5,600) (6,175)Subordinated debt (700) (575)Other borrowed funds (639) (1,174) (548)Preferred stock redemption (480)Acquisition of treasury stock (1,624) (3,578) (2,877)Preferred stock cash dividends paid (229) (236) (236)Common stock cash dividends paid (1,980) (1,895) (1,601)
Net cash provided (used) by financing activities $ 48,419 $ 17,080 $ (3,512)Net Increase (Decrease) In Cash And Due From Banks And Restricted Cash $ 1,956 $ (547) $ 359Net cash provided by discontinued operations 11,542 299 264Net cash provided (used) by continuing operations (9,586) (846) 95
Cash and due from banks and restricted cash at beginning of period 5,061 5,608 5,249Cash and due from banks and restricted cash at end of period $ 7,017 $ 5,061 $ 5,608
Cash and due from banks and restricted cashCash and due from banks at end of period (unrestricted cash) $ 6,636 $ 5,061 $ 5,608Restricted cash $ 381Cash and due from banks and restricted cash at end of period $ 7,017 $ 5,061 $ 5,608
Supplemental DisclosuresInterest paid $ 1,292 $ 3,742 $ 2,835Income taxes paid $ 3,410 $ 430 $ 372Income taxes refunded $ 10 $ 17 $ 468Leased assets obtained in exchange for new operating lease liabilities $ 122 $ 317Right-of-use assets recognized at adoption of ASU 2016-02 $ 2,004
Non-cash Investing and Financing ItemsTransfer from loans to loans held for sale, net $ 1,379 $ 958 $ 403Transfer from loans to foreclosed assets $ 64 $ 174 $ 193Transfer from trading securities to investment securities $ 289 $ 328
See accompanying Notes To Consolidated Financial Statements.
The PNC Financial Services Group, Inc. – 2020 Form 10-K 99
NOTES TO CONSOLIDATED FINANCIAL STATEMENTSTHE PNC FINANCIAL SERVICES GROUP, INC.
See the Glossary on page 196 for additional information on certain terms and acronyms used throughout the Financial Statementsand related Notes.
BUSINESSPNC is one of the largest diversified financial services companies in the U.S. and is headquartered in Pittsburgh, Pennsylvania.
We have businesses engaged in retail banking, including residential mortgage, corporate and institutional banking and assetmanagement, providing many of our products and services nationally. Our retail branch network is located primarily in markets acrossthe Mid-Atlantic, Midwest and Southeast. We also have strategic international offices in four countries outside the U.S.
NOTE 1 ACCOUNTING POLICIES
Basis of Financial Statement Presentation
Our consolidated financial statements include the accounts of the parent company and its subsidiaries, most of which are wholly-owned, certain partnership interests and variable interest entities.
We prepared these consolidated financial statements in accordance with GAAP. We have eliminated intercompany accounts andtransactions. We have also reclassified certain prior year amounts to conform to the current period presentation, which did not have amaterial impact on our consolidated financial condition or results of operations.
We have also considered the impact of subsequent events on these consolidated financial statements.
Use of Estimates
We prepared these consolidated financial statements using financial information available at the time of preparation, which requires usto make estimates and assumptions that affect the amounts reported. Our most significant estimates pertain to our fair valuemeasurements and the ACL. Actual results may differ from the estimates and the differences may be material to the consolidatedfinancial statements.
Discontinued Operations
A disposal of an asset or business that meets the criteria for held for sale classification is reported as discontinued operations when thedisposal represents a strategic shift that has had, or will have a major effect on our operating results. We report an asset as held for salewhen management has approved or received approval to sell the asset and is committed to a formal plan, the asset is available forimmediate sale, the asset is being actively marketed, the sale is anticipated to occur during the ensuing year and certain other specifiedcriteria are met. An asset classified as held for sale is recorded at the lower of its carrying amount or estimated fair value less cost tosell. If the carrying amount of the asset exceeds its estimated fair value, the asset is written down to its fair value upon the held for saledesignation. Our BlackRock held for sale asset is recorded at its carrying amount as we accounted for this investment under the equitymethod of accounting and the fair value of the asset exceeded the carrying value at each balance sheet date.
When presenting discontinued operations, assets classified as held for sale are segregated in the Consolidated Balance Sheetcommencing in the period in which the asset meets all of the held for sale criteria described above and prior periods are recast. Theresults of discontinued operations are reported in discontinued operations in the Consolidated Income Statement for current and priorperiods commencing in the period in which the asset or business is either disposed of or is classified as held for sale, including anygain or loss recognized on the sale or adjustment of the carrying amount to fair value less cost to sell.
100 The PNC Financial Services Group, Inc. – 2020 Form 10-K

Recently Adopted Accounting Standards
Accounting StandardsUpdate Description Financial Statement Impact
Credit Losses - ASU2016-13
Issued June 2016
CodificationImprovements - ASU2019-04
Various improvementsrelated to CreditLosses (Topics 1, 2and 5)
Issued April 2019
Targeted TransitionRelief - Credit Losses- ASU 2019-05
Issued May 2019
CodificationImprovements - ASU2019-11
Issued November 2019
•Commonly referred to as the CECL standard.• Replaces measurement, recognition and disclosureguidance for credit related reserves (i.e., ALLL and theallowance for unfunded loan commitments and lettersof credit) and OTTI for debt securities.
• Requires the use of an expected credit loss methodology;specifically, current expected credit losses for theremaining life of the asset will be recognized startingfrom the time of origination or acquisition.
• Methodology applies to loans, net investment in leases,debt securities and certain financial assets notaccounted for at fair value through net income. It alsoapplies to unfunded lending related commitmentsexcept for unconditionally cancellable commitments.
• In-scope assets are presented at the net amount expectedto be collected after the deduction or addition of theACL from the amortized cost basis of the assets.
• Requires inclusion of expected recoveries of previouslycharged-off amounts for in-scope assets.
• Requires enhanced credit quality disclosures includingdisaggregation of credit quality indicators by vintage.
• Requires a modified retrospective approach through acumulative-effect adjustment to retained earnings atadoption.
• Adopted January 1, 2020 under the modified retrospectiveapproach. The cumulative-effect adjustment to retainedearnings totaled $671 million at adoption.
• Amended presentation and disclosures are requiredprospectively. Refer to the disclosures in this Note 1, Note3 Investment Securities and Note 4 Loans and RelatedAllowance for Credit Losses for additional information.
• With the adoption of CECL, we discontinued the accountingfor purchased impaired loans and elected the one-time fairvalue option election for some of these loans and certainresidential real estate collateral dependent loans. Loansthat were previously accounted for as purchased impairedwhere the fair value option election was not made are nowaccounted for as PCD loans.
• There was no impact to the recorded investment of ourinvestment securities or loans, except for our PCD loanportfolio. Accounting for these loans as PCD required anadjustment to the remaining accretable discount andrecorded investment in addition to the impact on ACL dueto the adoption of CECL methodology.
• Refer to Table 38 for a summary of the impact of the CECLstandard adoption.
Accounting StandardsUpdate Description Financial Statement Impact
CodificationImprovements - ASU2019-04
Topic 3: CodificationImprovements to ASU2017-12 and OtherHedging Items
Issued April 2019
• Targeted improvements related to:- Partial-term fair value hedges of interest rate risk- Amortization of fair value hedge basis adjustments- Disclosure of fair value hedge basis adjustments- Consideration of the hedged contractually specifiedinterest rate under the hypothetical derivativemethod
- Application of a first-payments-received cash flowhedging technique to overall cash flows on a groupof variable interest payments
- Update to transition guidance for ASU 2017-12• This ASU permits a one-time transfer out of held tomaturity securities to provide entities the opportunity tohedge fixed rate, prepayable securities under a last oflayer hedging strategy (although an entity is notrequired to hedge such securities subsequent totransfer).
•Adopted January 1, 2020.• As permitted by the eligibility requirements in this guidance,at adoption we elected to transfer debt securities with anamortized cost of $16.2 billion (fair value of $16.5 billion)from held to maturity to the available for sale portfolio.The transfer resulted in a pretax increase to AOCI of $306million. There were no other impacts to PNC’sconsolidated financial statements from the adoption of thisguidance.
The PNC Financial Services Group, Inc. – 2020 Form 10-K 101
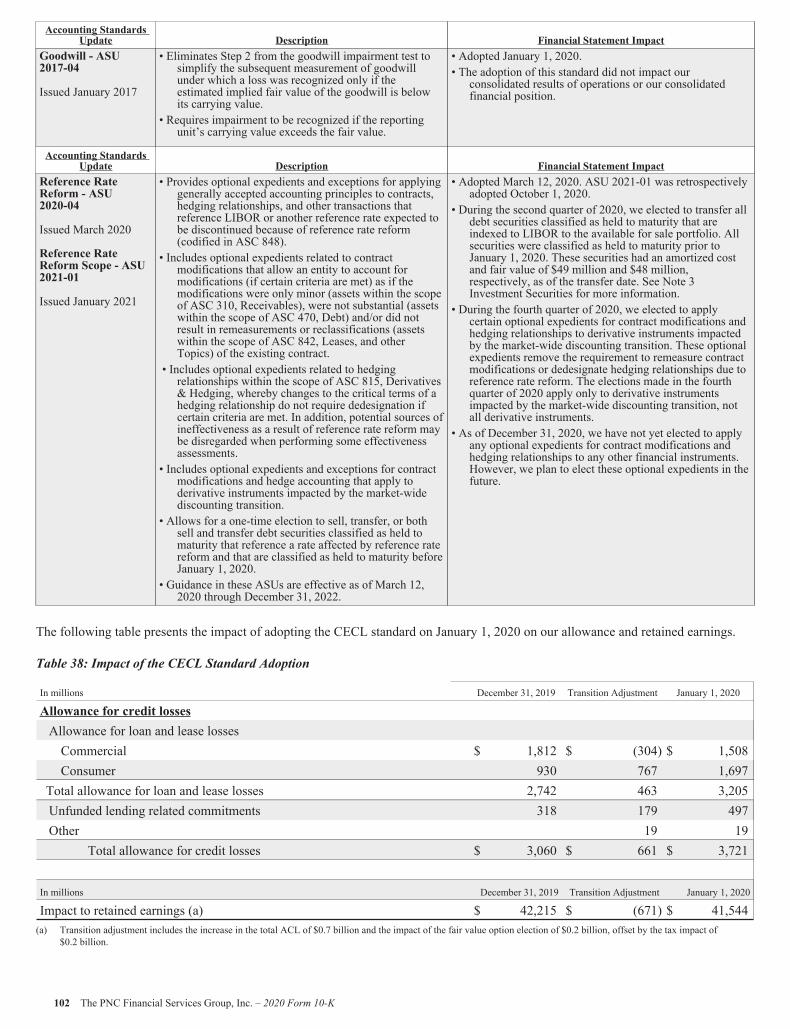
Accounting StandardsUpdate Description Financial Statement Impact
Goodwill - ASU2017-04
Issued January 2017
• Eliminates Step 2 from the goodwill impairment test tosimplify the subsequent measurement of goodwillunder which a loss was recognized only if theestimated implied fair value of the goodwill is belowits carrying value.
• Requires impairment to be recognized if the reportingunit’s carrying value exceeds the fair value.
• Adopted January 1, 2020.• The adoption of this standard did not impact ourconsolidated results of operations or our consolidatedfinancial position.
Accounting StandardsUpdate Description Financial Statement Impact
Reference RateReform - ASU2020-04
Issued March 2020
Reference RateReform Scope - ASU2021-01
Issued January 2021
• Provides optional expedients and exceptions for applyinggenerally accepted accounting principles to contracts,hedging relationships, and other transactions thatreference LIBOR or another reference rate expected tobe discontinued because of reference rate reform(codified in ASC 848).
• Includes optional expedients related to contractmodifications that allow an entity to account formodifications (if certain criteria are met) as if themodifications were only minor (assets within the scopeof ASC 310, Receivables), were not substantial (assetswithin the scope of ASC 470, Debt) and/or did notresult in remeasurements or reclassifications (assetswithin the scope of ASC 842, Leases, and otherTopics) of the existing contract.
• Includes optional expedients related to hedgingrelationships within the scope of ASC 815, Derivatives& Hedging, whereby changes to the critical terms of ahedging relationship do not require dedesignation ifcertain criteria are met. In addition, potential sources ofineffectiveness as a result of reference rate reform maybe disregarded when performing some effectivenessassessments.
• Includes optional expedients and exceptions for contractmodifications and hedge accounting that apply toderivative instruments impacted by the market-widediscounting transition.
• Allows for a one-time election to sell, transfer, or bothsell and transfer debt securities classified as held tomaturity that reference a rate affected by reference ratereform and that are classified as held to maturity beforeJanuary 1, 2020.
• Guidance in these ASUs are effective as of March 12,2020 through December 31, 2022.
• Adopted March 12, 2020. ASU 2021-01 was retrospectivelyadopted October 1, 2020.
• During the second quarter of 2020, we elected to transfer alldebt securities classified as held to maturity that areindexed to LIBOR to the available for sale portfolio. Allsecurities were classified as held to maturity prior toJanuary 1, 2020. These securities had an amortized costand fair value of $49 million and $48 million,respectively, as of the transfer date. See Note 3Investment Securities for more information.
• During the fourth quarter of 2020, we elected to applycertain optional expedients for contract modifications andhedging relationships to derivative instruments impactedby the market-wide discounting transition. These optionalexpedients remove the requirement to remeasure contractmodifications or dedesignate hedging relationships due toreference rate reform. The elections made in the fourthquarter of 2020 apply only to derivative instrumentsimpacted by the market-wide discounting transition, notall derivative instruments.
• As of December 31, 2020, we have not yet elected to applyany optional expedients for contract modifications andhedging relationships to any other financial instruments.However, we plan to elect these optional expedients in thefuture.
The following table presents the impact of adopting the CECL standard on January 1, 2020 on our allowance and retained earnings.
Table 38: Impact of the CECL Standard Adoption
In millions December 31, 2019 Transition Adjustment January 1, 2020
Allowance for credit lossesAllowance for loan and lease lossesCommercial $ 1,812 $ (304) $ 1,508Consumer 930 767 1,697
Total allowance for loan and lease losses 2,742 463 3,205Unfunded lending related commitments 318 179 497Other 19 19
Total allowance for credit losses $ 3,060 $ 661 $ 3,721
In millions December 31, 2019 Transition Adjustment January 1, 2020
Impact to retained earnings (a) $ 42,215 $ (671) $ 41,544(a) Transition adjustment includes the increase in the total ACL of $0.7 billion and the impact of the fair value option election of $0.2 billion, offset by the tax impact of
$0.2 billion.
102 The PNC Financial Services Group, Inc. – 2020 Form 10-K
Cash, Cash Equivalents and Restricted Cash
Cash and due from banks are considered cash and cash equivalents for financial reporting purposes because they represent a primarysource of liquidity. Certain cash balances within Cash and due from banks on our Consolidated Balance Sheet are restricted as towithdrawal or usage by legally binding contractual agreements or regulatory requirements.
Investments
We hold interests in various types of investments. The accounting for these investments is dependent on a number of factors including,but not limited to, items such as:
• Ownership interest,• Our plans for the investment, and• The nature of the investment.
Debt SecuritiesDebt securities are recorded on a trade-date basis. We classify debt securities as either trading, held to maturity, or available for sale.Debt securities that we purchase for certain risk management activities or customer-related trading activities are classified as tradingsecurities, are reported in the Other assets line item on our Consolidated Balance Sheet, and are carried at fair value. Realized andunrealized gains and losses on trading securities are included in Other noninterest income. We classify debt securities as held tomaturity when we have the positive intent and ability to hold the securities to maturity, and carry them at amortized cost, less anyallowance. Debt securities not classified as held to maturity or trading are classified as securities available for sale, and are carried atfair value. Unrealized gains and losses on available for sale securities are included in AOCI net of income taxes.
We include all interest on debt securities, including amortization of premiums and accretion of discounts on investment securities, innet interest income using the constant effective yield method generally calculated over the contractual lives of the securities. Effectiveyields reflect either the effective interest rate implicit in the security at the date of acquisition or, for debt securities where an OTTIwas recorded, the effective interest rate determined based on improved cash flows subsequent to an impairment. We compute gainsand losses realized on the sale of available for sale debt securities on a specific security basis. These securities gains/(losses) areincluded in Other noninterest income on the Consolidated Income Statement.
As discussed in the Recently Adopted Accounting Standards section of this Note 1, we adopted the CECL standard as of January 1,2020, which requires expected credit losses on both held to maturity and available for sale securities to be recognized through avaluation allowance, ACL, instead of as a direct write-down to the amortized cost basis of the security. An available for sale securityis considered impaired if the fair value is less than its amortized cost basis. If any portion of the decline in fair value is related tocredit, the amount of allowance is determined as the portion related to credit, limited to the difference between the amortized costbasis and the fair value of the security. If we have the intent to sell or believe it is more likely than not we will be required to sell animpaired available for sale security before recovery of the amortized cost basis, the credit loss is recorded as a direct write-down of theamortized cost basis. Credit losses on investment securities are recognized through the Provision for credit losses on our ConsolidatedIncome Statement. Declines in the fair value of available for sale securities that are not considered credit related are recognized inAOCI on our Consolidated Balance Sheet. The CECL standard is applied prospectively to debt securities and, as a result, theamortized cost basis of investment securities for which OTTI had previously been recorded did not change upon adoption.
Prior to the adoption of CECL, we reviewed all debt securities that were in an unrealized loss position for OTTI. An investmentsecurity was deemed impaired if the fair value of the investment was less than its amortized cost. After an investment security wasdetermined to be impaired, we evaluated whether the decline in value was other-than-temporary. Declines in the fair value of debtsecurities that were deemed other-than-temporary and were attributable to credit deterioration were recognized in Other noninterestincome on our Consolidated Income Statement in the period in which the determination was made. Declines in fair value which weredeemed other-than-temporary and attributable to factors other than credit deterioration were recognized in AOCI on our ConsolidatedBalance Sheet.
We consider a security to be past due in terms of payment based on its contractual terms. A security may be placed on nonaccrual,with interest no longer recognized until received, when collectability of principal or interest is doubtful. As of December 31, 2020,nonaccrual or past due held-to-maturity securities were immaterial.
A security may be partially or fully charged off against the allowance if it is determined to be uncollectible, including, for an availablefor sale security, if we have the intent to sell or believe it is more likely than not we will be required to sell the security beforerecovery of the amortized cost basis. Recoveries of previously charged-off available for sale securities are recognized when received,while recoveries on held to maturity securities are recognized when expected.
See the Allowance for Credit Losses section of this Note 1 for further discussion regarding the methodologies used to determine the
The PNC Financial Services Group, Inc. – 2020 Form 10-K 103
allowance for investment securities. See Note 3 Investment Securities for additional information about the investment securitiesportfolio and the related ACL.
Equity Securities and Partnership InterestsWe account for equity securities, equity investments, private equity investments, and investments in limited partnerships, limitedliability companies and other investments that are not required to be consolidated under one of the following methods:
• We use the equity method for general and limited partner ownership interests and limited liability companies in which we areconsidered to have significant influence over the operations of the investee. Under the equity method, we record our equityownership share of net income or loss of the investee in Noninterest income and any dividends received on equity methodinvestments are recorded as a reduction to the investment balance. When an equity investment experiences an other-than-temporary decline in value, we may be required to record a loss on the investment.
• We measure equity securities that have a readily determinable fair value at fair value through Net income. Both realized andunrealized gains and losses are included in Noninterest income. Dividend income on these equity securities is included inOther interest income on our Consolidated Income Statement.
• We generally use the practicability exception to fair value measurement for all other investments without a readilydeterminable fair value. When we elect this alternative measurement method, the investment is recorded at cost and thecarrying value is adjusted for impairment, if any, plus or minus changes in value resulting from observable price changes inorderly transactions for identical or similar instruments of the same issuer. These investments are written down to fair value ifa qualitative assessment indicates impairment and the fair value is less than the carrying value. The amount of the write-downis accounted for as a loss included in Noninterest income. Distributions received on these investments are included inNoninterest income.
Investments described above are included in Equity investments on our Consolidated Balance Sheet.
Private Equity InvestmentsWe report private equity investments, which include direct investments in companies, affiliated partnership interests and indirectinvestments in private equity funds, at estimated fair value. These estimates are based on available information and may notnecessarily represent amounts that we will ultimately realize through distribution, sale or liquidation of the investments. Fair values ofpublicly-traded direct investments are determined using quoted market prices and are subject to various discount factors arising fromsecurity level restrictions, when appropriate. The valuation procedures applied to direct investments and indirect investments aredetailed in Note 15 Fair Value. We include all private equity investments within Equity investments on our Consolidated BalanceSheet. Changes in fair value of private equity investments are recognized in Other noninterest income.
We consolidate affiliated partnerships when we have determined that we have control of the partnership or are the primary beneficiaryif the entity is a VIE. The portion we do not own is reflected in Noncontrolling interests on our Consolidated Balance Sheet.
Loans
Loans are classified as held for investment when management has both the intent and ability to hold the loan for the foreseeable future,or until maturity or payoff. Management’s intent and view of the foreseeable future may change based on changes in businessstrategies, the economic environment, market conditions and the availability of government programs.
Measurement of delinquency status is based on the contractual terms of each loan. Loans that are 30 days or more past due in terms ofpayment are considered delinquent. See Note 4 Loans and Related Allowance for Credit Losses for additional information on howCOVID-19 hardship related loan modifications are reported from a delinquency perspective as of December 31, 2020.
Loans held for investment, excluding PCD loans, are recorded at amortized cost basis unless we elect to measure these under the fairvalue option. Amortized cost basis represents principal amounts outstanding, net of unearned income, unamortized deferred fees andcosts on originated loans, premiums or discounts on purchased loans and charge-offs. Amortized cost basis does not include accruedinterest, as we include accrued interest in Other assets on our Consolidated Balance Sheet. Interest on performing loans is accruedbased on the principal amount outstanding and recorded in Interest income as earned using the constant effective yield method. Loanorigination fees, direct loan origination costs, and loan premiums and discounts are deferred and accreted or amortized into Netinterest income using the constant effective yield method, over the contractual life of the loan. The processing fee received for loansoriginated through PPP lending under the CARES Act is deferred and accreted into Net interest income using the effective yieldmethod, over the contractual life of the loan. Loans under the fair value option are reported at their fair value, with any changes to fairvalue reported as Noninterest income on the Consolidated Income Statement, and are excluded from measurement of ALLL.
In addition to originating loans, we also acquire loans through the secondary loan market, portfolio purchases or acquisitions of otherfinancial services companies. Certain acquired loans that have experienced a more-than-insignificant deterioration of credit qualitysince origination (i.e., PCD) are recognized at an amortized cost basis equal to their purchase price plus an ALLL measured at the
104 The PNC Financial Services Group, Inc. – 2020 Form 10-K
acquisition date. Subsequent decreases in expected cash flows that are attributable, at least in part, to credit quality are recognizedthrough a charge to the provision for credit losses resulting in an increase in the ALLL. Subsequent increases in expected cash flowsare recognized as a provision recapture of previously recorded ALLL.
We consider a loan to be collateral dependent when we determine that substantially all of the expected cash flows will be generatedfrom the operation or sale of the collateral underlying the loan, the borrower is experiencing financial difficulty and we have elected tomeasure the loan at the estimated fair value of collateral (less costs to sell if sale or foreclosure of the property is expected).Additionally, we consider a loan to be collateral dependent when foreclosure or liquidation of the underlying collateral is probable.
A TDR is a loan whose terms have been restructured in a manner that grants a concession to a borrower experiencing financialdifficulty. A concession has been granted when we do not expect to collect all amounts due, including original interest accrued at theoriginal contract rate, as a result of the restructuring, or there is a delay in payment that is more than insignificant. TDRs result fromour loss mitigation activities, and include rate reductions, principal forgiveness, postponement/reduction of scheduled amortization,and extensions, which are intended to minimize economic loss and to avoid foreclosure or repossession of collateral. Additionally,TDRs also result from borrowers that have been discharged from personal liability through Chapter 7 bankruptcy and have notformally reaffirmed their loan obligations to us. In those situations where principal is forgiven, the amount of such principalforgiveness is immediately charged off.
Potential incremental losses or recoveries on TDRs have been factored into the ALLL estimates for each loan class under themethodologies described in this Note. Once a loan becomes a TDR, it will continue to be reported as a TDR until it is ultimatelyrepaid in full, the collateral is foreclosed upon or it is fully charged off.
PNC excludes consumer loans held for sale, loans accounted for under the fair value option and certain government insured orguaranteed loans from our TDR population. PCD loans do not require additional considerations and thus are evaluated for inclusion inour TDR population. In addition, PNC has elected not to apply a TDR designation to loans that have been restructured due to aCOVID-19 hardship pursuant to specific criteria under the CARES Act. Since loans restructured due to a COVID-19 related hardshipwere not identified as TDRs, they are not placed on nonaccrual at the time of modification unless payment in full of principal orinterest is not expected. These loans continue to be subject to our existing nonaccrual policy.
See the following for additional information related to loans, including further discussion regarding our policies, the methodologiesand significant inputs used to determine the ALLL and additional details on the composition of our loan portfolio:
• Nonperforming Loans and Leases section of this Note 1,• Allowance for Credit Losses section of this Note 1, and• Note 4 Loans and Related Allowance for Credit Losses.
The PNC Financial Services Group, Inc. – 2020 Form 10-K 105
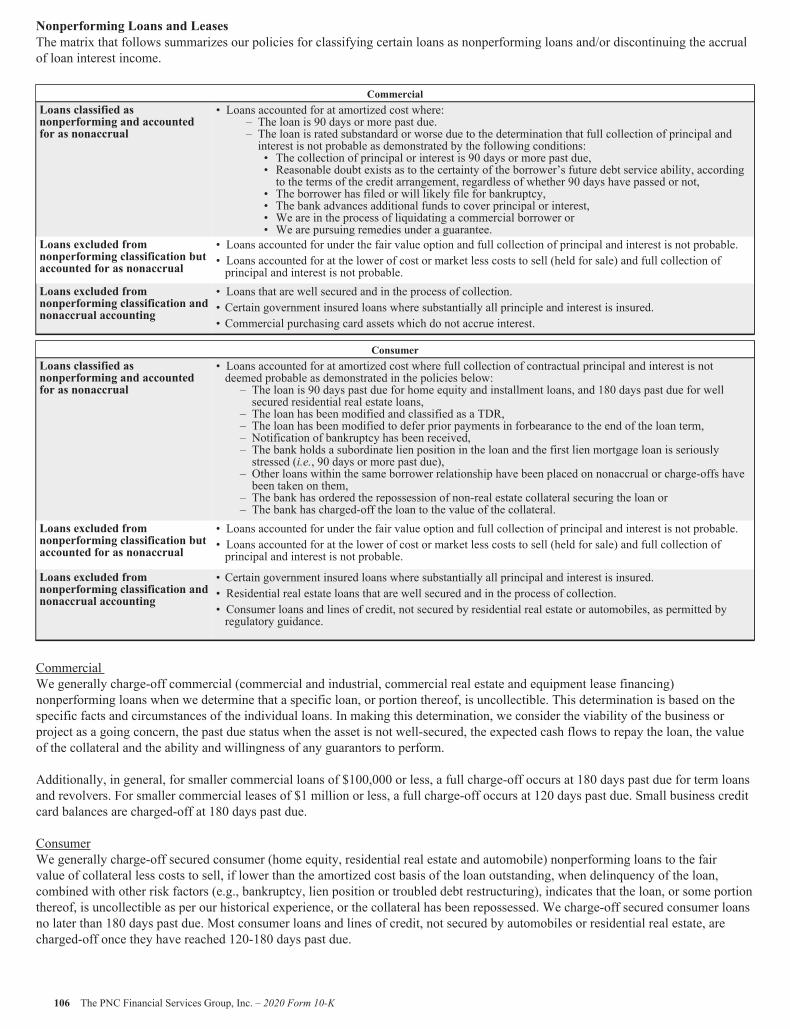
Nonperforming Loans and LeasesThe matrix that follows summarizes our policies for classifying certain loans as nonperforming loans and/or discontinuing the accrualof loan interest income.
CommercialLoans classified asnonperforming and accountedfor as nonaccrual
• Loans accounted for at amortized cost where:– The loan is 90 days or more past due.– The loan is rated substandard or worse due to the determination that full collection of principal andinterest is not probable as demonstrated by the following conditions:• The collection of principal or interest is 90 days or more past due,• Reasonable doubt exists as to the certainty of the borrower’s future debt service ability, accordingto the terms of the credit arrangement, regardless of whether 90 days have passed or not,
• The borrower has filed or will likely file for bankruptcy,• The bank advances additional funds to cover principal or interest,• We are in the process of liquidating a commercial borrower or• We are pursuing remedies under a guarantee.
Loans excluded fromnonperforming classification butaccounted for as nonaccrual
• Loans accounted for under the fair value option and full collection of principal and interest is not probable.• Loans accounted for at the lower of cost or market less costs to sell (held for sale) and full collection ofprincipal and interest is not probable.
Loans excluded fromnonperforming classification andnonaccrual accounting
• Loans that are well secured and in the process of collection.• Certain government insured loans where substantially all principle and interest is insured.• Commercial purchasing card assets which do not accrue interest.
ConsumerLoans classified asnonperforming and accountedfor as nonaccrual
• Loans accounted for at amortized cost where full collection of contractual principal and interest is notdeemed probable as demonstrated in the policies below:– The loan is 90 days past due for home equity and installment loans, and 180 days past due for wellsecured residential real estate loans,
– The loan has been modified and classified as a TDR,– The loan has been modified to defer prior payments in forbearance to the end of the loan term,– Notification of bankruptcy has been received,– The bank holds a subordinate lien position in the loan and the first lien mortgage loan is seriouslystressed (i.e., 90 days or more past due),
– Other loans within the same borrower relationship have been placed on nonaccrual or charge-offs havebeen taken on them,
– The bank has ordered the repossession of non-real estate collateral securing the loan or– The bank has charged-off the loan to the value of the collateral.
Loans excluded fromnonperforming classification butaccounted for as nonaccrual
• Loans accounted for under the fair value option and full collection of principal and interest is not probable.• Loans accounted for at the lower of cost or market less costs to sell (held for sale) and full collection ofprincipal and interest is not probable.
Loans excluded fromnonperforming classification andnonaccrual accounting
• Certain government insured loans where substantially all principal and interest is insured.• Residential real estate loans that are well secured and in the process of collection.• Consumer loans and lines of credit, not secured by residential real estate or automobiles, as permitted byregulatory guidance.
CommercialWe generally charge-off commercial (commercial and industrial, commercial real estate and equipment lease financing)nonperforming loans when we determine that a specific loan, or portion thereof, is uncollectible. This determination is based on thespecific facts and circumstances of the individual loans. In making this determination, we consider the viability of the business orproject as a going concern, the past due status when the asset is not well-secured, the expected cash flows to repay the loan, the valueof the collateral and the ability and willingness of any guarantors to perform.
Additionally, in general, for smaller commercial loans of $100,000 or less, a full charge-off occurs at 180 days past due for term loansand revolvers. For smaller commercial leases of $1 million or less, a full charge-off occurs at 120 days past due. Small business creditcard balances are charged-off at 180 days past due.
ConsumerWe generally charge-off secured consumer (home equity, residential real estate and automobile) nonperforming loans to the fairvalue of collateral less costs to sell, if lower than the amortized cost basis of the loan outstanding, when delinquency of the loan,combined with other risk factors (e.g., bankruptcy, lien position or troubled debt restructuring), indicates that the loan, or some portionthereof, is uncollectible as per our historical experience, or the collateral has been repossessed. We charge-off secured consumer loansno later than 180 days past due. Most consumer loans and lines of credit, not secured by automobiles or residential real estate, arecharged-off once they have reached 120-180 days past due.
106 The PNC Financial Services Group, Inc. – 2020 Form 10-K
For secured collateral dependent loans, collateral values are updated at least annually and subsequent declines in collateral values arecharged-off resulting in incremental provision for credit loss. Subsequent increases in collateral values may be reflected as anadjustment to the ALLL to reflect the expectation of recoveries in an amount greater than previously expected, limited to amountspreviously charged-off.
Accounting for Nonperforming Assets and Leases and Other Nonaccrual LoansFor nonaccrual loans, interest income accrual and deferred fee/cost recognition is discontinued. Additionally, the current year accruedand uncollected interest is reversed through Net interest income and prior year accrued and uncollected interest is charged-off, exceptfor credit cards, where we reverse any accrued interest through Net interest income at the time of charge-off, as per industry standardpractice. Nonaccrual loans that are also collateral dependent may be charged-off to reduce the basis to the fair value of collateral lesscosts to sell.
If payment is received on a nonaccrual loan, generally the payment is first applied to the remaining principal balance; payments arethen applied to recover any charged-off amounts related to the loan. Finally, if both principal balance and any charge-offs have beenrecovered, then the payment will be recorded as fee and interest income. For certain consumer loans, the receipt of interest payments isrecognized as interest income on a cash basis. Cash basis income recognition is applied if a loan’s amortized cost basis is deemed fullycollectible and the loan has performed for at least six months.
For TDRs, payments are applied based upon their contractual terms unless the related loan is deemed non-performing. TDRs aregenerally included in nonperforming and nonaccrual loans. However, after a reasonable period of time, generally six months, in whichthe loan performs under restructured terms and meets other performance indicators, it is returned to performing/accruing status. Thisreturn to performing/accruing status demonstrates that the bank expects to collect all of the loan’s remaining contractual principal andinterest. TDRs resulting from (i) borrowers that have been discharged from personal liability through Chapter 7 bankruptcy and havenot formally reaffirmed their loan obligations to us, and (ii) borrowers that are not currently obligated to make both principal andinterest payments under the restructured terms are not returned to accrual status.
Other nonaccrual loans are generally not returned to accrual status until the borrower has performed in accordance with the contractualterms and other performance indicators for at least six months, the period of time which was determined to demonstrate the expectedcollection of the loan’s remaining contractual principal and interest. Nonaccrual loans with partially charged-off principal are notreturned to accrual. When a nonperforming loan is returned to accrual status, it is then considered a performing loan.
Foreclosed assets consist of any asset seized or property acquired through a foreclosure proceeding or acceptance of a deed-in-lieu offoreclosure. OREO comprises principally commercial and residential real estate properties obtained in partial or total satisfaction ofloan obligations. After obtaining a foreclosure judgment, or in some jurisdictions the initiation of proceedings under a power of sale inthe loan instruments, the property will be sold. When we are awarded title or completion of deed-in-lieu of foreclosure, we transfer theloan to foreclosed assets included in Other assets on our Consolidated Balance Sheet. Property obtained in satisfaction of a loan isinitially recorded at estimated fair value less cost to sell. Based upon the estimated fair value less cost to sell, the amortized cost basisof the loan is adjusted and a charge-off/recovery is recognized to the ALLL. We estimate fair values primarily based on appraisals, orsales agreements with third parties. Subsequently, foreclosed assets are valued at the lower of the amount recorded at acquisition dateor estimated fair value less cost to sell. Valuation adjustments on these assets and gains or losses realized from disposition of suchproperty are reflected in Other noninterest expense.
For certain mortgage loans that have a government guarantee, we establish a separate other receivable upon foreclosure. Thereceivable is measured based on the loan balance (inclusive of principal and interest) that is expected to be recovered from theguarantor.
See Note 4 Loans and Related Allowance for Credit Losses in this Report for additional information on nonperforming assets, TDRsand credit quality indicators related to our loan portfolio.
Allowance for Credit Losses
Our ACL, in accordance with the CECL standard, is based on historical loss experience, current borrower risk characteristics, currenteconomic conditions, reasonable and supportable forecasts of future conditions and other relevant factors. We maintain the ACL at anappropriate level for expected losses on our existing investment securities, loans, equipment finance leases (including residual values),other financial assets and unfunded lending related commitments, for the estimated contractual term of the assets or exposures as ofthe balance sheet date. The remaining contractual term of assets in scope of CECL is estimated considering contractual maturity dates,prepayment expectations, utilization or draw expectations and any embedded extension options that do not allow us to unilaterallycancel the extension options. For products without a fixed contractual maturity date (e.g., credit cards), we rely on historical paymentbehavior to determine the length of the paydown or default time period.
We estimate expected losses on a pooled basis using a combination of (i) the expected losses over a reasonable and supportableforecast period, (ii) a period of reversion to long run average expected losses where applicable and (iii) the long run average expected
The PNC Financial Services Group, Inc. – 2020 Form 10-K 107
losses for the remaining estimated contractual term. For all assets and unfunded lending related commitments in the scope of CECL,the ACL also includes individually assessed reserves and qualitative reserves, as applicable.We use forward-looking information in estimating expected credit losses for our reasonable and supportable forecast period. For thispurpose, we use forecasted scenarios produced by PNC’s Economics Team, which are designed to reflect business cycles and theirrelated estimated probabilities. The forecast length that we have determined to be reasonable and supportable is three years. As notedin the methodology discussions that follow, forward-looking information is incorporated into the expected credit loss estimates. Suchforward looking information includes forecasted relevant macroeconomic variables, which are estimated using quantitative techniques,analysis from PNC economists and management judgment.
The reversion period is used to bridge our three year reasonable and supportable forecast period and the long run average expectedcredit losses. We may consider a number of factors in determining the duration of the reversion period, such as contractual maturity ofthe asset, observed historical patterns and the estimated credit loss rates at the end of the forecast period relative to the beginning ofthe long run average period. The reversion period is typically 1-3 years, if not immediate.
The long run average expected credit losses are derived from long run historical credit loss information adjusted for the credit qualityof the current portfolio, and therefore do not consider current and forecasted economic conditions.
See the following sections related to investment securities, loans, trade receivables, other financial assets and unfunded lending relatedcommitments for details about specific methodologies.
Allowance for Investment SecuritiesA significant portion of our investment securities are issued or guaranteed by either the U.S. government (U.S. Treasury or GNMA) ora government-sponsored agency (FNMA or FHLMC). Taking into consideration historical information and current and forecastedconditions, we do not expect to incur any credit losses on these securities.
Investment securities that are not issued or guaranteed by the U.S. government or a government-sponsored agency consist of bothsecuritized products, such as non-agency mortgage and asset-backed securities, as well as non-securitized products, such as corporateand municipal debt securities. A discounted cash flow approach is primarily used to determine the amount of the allowance required.The estimates of expected cash flows are determined using macroeconomic sensitive models taking into consideration the reasonableand supportable forecast period and scenarios discussed above. Additional factors unique to a specific security may also be taken intoconsideration when estimating expected cash flows. The cash flows expected to be collected, after considering expected prepayments,are discounted at the effective interest rate. For an available-for-sale security, the amount of the allowance is limited to the differencebetween the amortized cost basis of the security and its estimated fair value.
See Note 3 Investment Securities in this Report for additional information about the investment securities portfolio.
Allowance for Loan and Lease LossesOur pooled expected loss methodology is based upon the quantification of risk parameters, such as PD, LGD and EAD for a loan orloan segment. We also consider the impact of prepayments and amortization on contractual maturity in our expected loss estimates.We use historical credit loss information, current borrower risk characteristics and forecasted economic variables for the reasonableand supportable forecast period, coupled with analytical methods, to estimate these risk parameters by loan or loan segments. PD,LGD and EAD parameters are calculated for each forecasted scenario and the long run average period, and combined to generateexpected loss estimates by scenario. The following matrix provides key credit risk characteristics that we use to estimate these riskparameters.
108 The PNC Financial Services Group, Inc. – 2020 Form 10-K
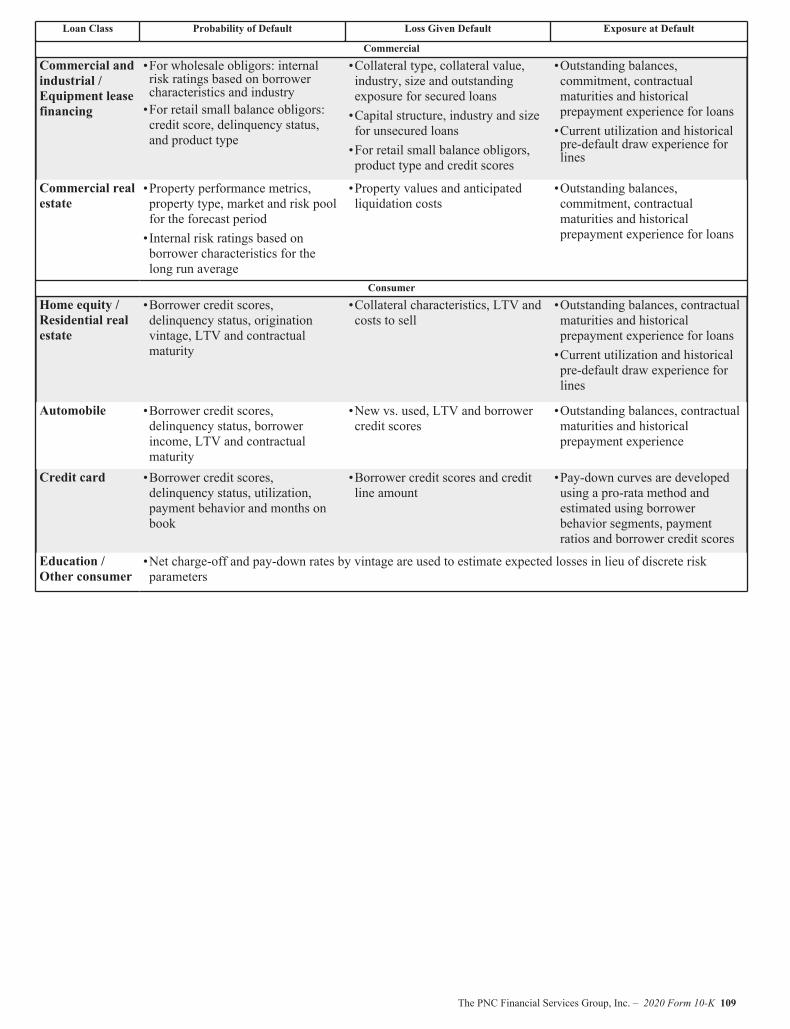
Loan Class Probability of Default Loss Given Default Exposure at Default
Commercial
Commercial andindustrial /Equipment leasefinancing
•For wholesale obligors: internalrisk ratings based on borrowercharacteristics and industry•For retail small balance obligors:credit score, delinquency status,and product type
•Collateral type, collateral value,industry, size and outstandingexposure for secured loans•Capital structure, industry and sizefor unsecured loans•For retail small balance obligors,product type and credit scores
•Outstanding balances,commitment, contractualmaturities and historicalprepayment experience for loans•Current utilization and historicalpre-default draw experience forlines
Commercial realestate
•Property performance metrics,property type, market and risk poolfor the forecast period•Internal risk ratings based onborrower characteristics for thelong run average
•Property values and anticipatedliquidation costs
•Outstanding balances,commitment, contractualmaturities and historicalprepayment experience for loans
Consumer
Home equity /Residential realestate
•Borrower credit scores,delinquency status, originationvintage, LTV and contractualmaturity
•Collateral characteristics, LTV andcosts to sell
•Outstanding balances, contractualmaturities and historicalprepayment experience for loans•Current utilization and historicalpre-default draw experience forlines
Automobile •Borrower credit scores,delinquency status, borrowerincome, LTV and contractualmaturity
•New vs. used, LTV and borrowercredit scores
•Outstanding balances, contractualmaturities and historicalprepayment experience
Credit card •Borrower credit scores,delinquency status, utilization,payment behavior and months onbook
•Borrower credit scores and creditline amount
•Pay-down curves are developedusing a pro-rata method andestimated using borrowerbehavior segments, paymentratios and borrower credit scores
Education /Other consumer
•Net charge-off and pay-down rates by vintage are used to estimate expected losses in lieu of discrete riskparameters
The PNC Financial Services Group, Inc. – 2020 Form 10-K 109
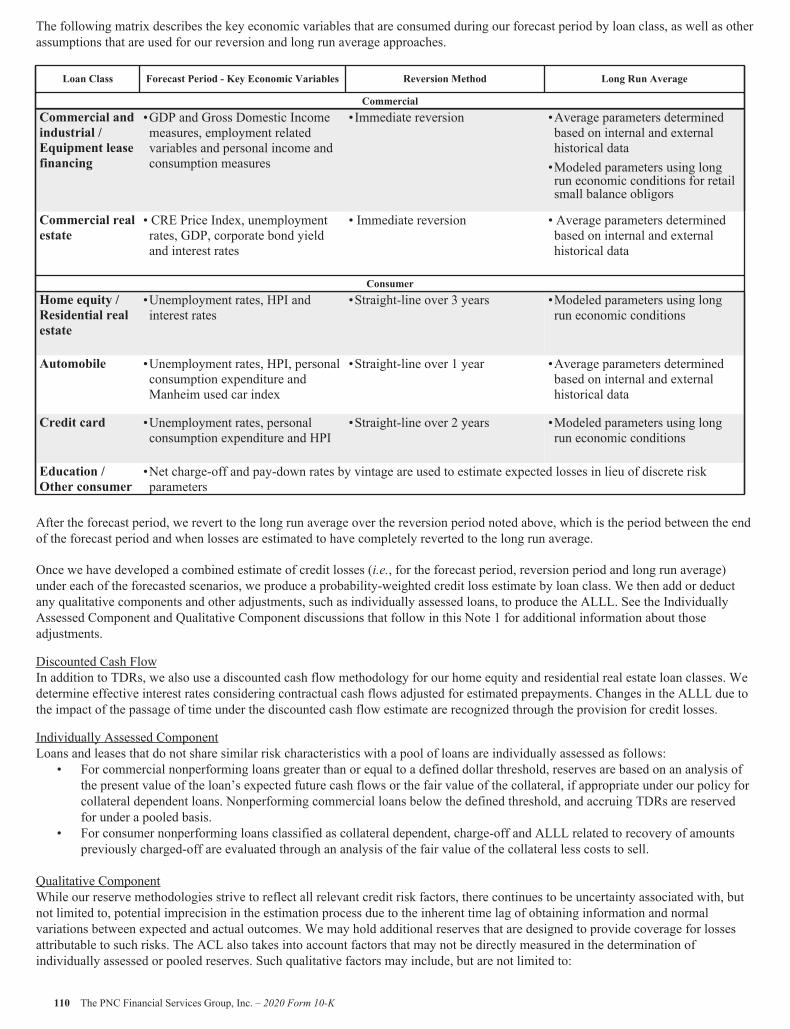
The following matrix describes the key economic variables that are consumed during our forecast period by loan class, as well as otherassumptions that are used for our reversion and long run average approaches.
Loan Class Forecast Period - Key Economic Variables Reversion Method Long Run Average
CommercialCommercial andindustrial /Equipment leasefinancing
•GDP and Gross Domestic Incomemeasures, employment relatedvariables and personal income andconsumption measures
•Immediate reversion •Average parameters determinedbased on internal and externalhistorical data•Modeled parameters using longrun economic conditions for retailsmall balance obligors
Commercial realestate
• CRE Price Index, unemploymentrates, GDP, corporate bond yieldand interest rates
• Immediate reversion • Average parameters determinedbased on internal and externalhistorical data
ConsumerHome equity /Residential realestate
•Unemployment rates, HPI andinterest rates
•Straight-line over 3 years •Modeled parameters using longrun economic conditions
Automobile •Unemployment rates, HPI, personalconsumption expenditure andManheim used car index
•Straight-line over 1 year •Average parameters determinedbased on internal and externalhistorical data
Credit card •Unemployment rates, personalconsumption expenditure and HPI
•Straight-line over 2 years •Modeled parameters using longrun economic conditions
Education /Other consumer
•Net charge-off and pay-down rates by vintage are used to estimate expected losses in lieu of discrete riskparameters
After the forecast period, we revert to the long run average over the reversion period noted above, which is the period between the endof the forecast period and when losses are estimated to have completely reverted to the long run average.
Once we have developed a combined estimate of credit losses (i.e., for the forecast period, reversion period and long run average)under each of the forecasted scenarios, we produce a probability-weighted credit loss estimate by loan class. We then add or deductany qualitative components and other adjustments, such as individually assessed loans, to produce the ALLL. See the IndividuallyAssessed Component and Qualitative Component discussions that follow in this Note 1 for additional information about thoseadjustments.
Discounted Cash FlowIn addition to TDRs, we also use a discounted cash flow methodology for our home equity and residential real estate loan classes. Wedetermine effective interest rates considering contractual cash flows adjusted for estimated prepayments. Changes in the ALLL due tothe impact of the passage of time under the discounted cash flow estimate are recognized through the provision for credit losses.
Individually Assessed ComponentLoans and leases that do not share similar risk characteristics with a pool of loans are individually assessed as follows:
• For commercial nonperforming loans greater than or equal to a defined dollar threshold, reserves are based on an analysis ofthe present value of the loan’s expected future cash flows or the fair value of the collateral, if appropriate under our policy forcollateral dependent loans. Nonperforming commercial loans below the defined threshold, and accruing TDRs are reservedfor under a pooled basis.
• For consumer nonperforming loans classified as collateral dependent, charge-off and ALLL related to recovery of amountspreviously charged-off are evaluated through an analysis of the fair value of the collateral less costs to sell.
Qualitative ComponentWhile our reserve methodologies strive to reflect all relevant credit risk factors, there continues to be uncertainty associated with, butnot limited to, potential imprecision in the estimation process due to the inherent time lag of obtaining information and normalvariations between expected and actual outcomes. We may hold additional reserves that are designed to provide coverage for lossesattributable to such risks. The ACL also takes into account factors that may not be directly measured in the determination ofindividually assessed or pooled reserves. Such qualitative factors may include, but are not limited to:
110 The PNC Financial Services Group, Inc. – 2020 Form 10-K
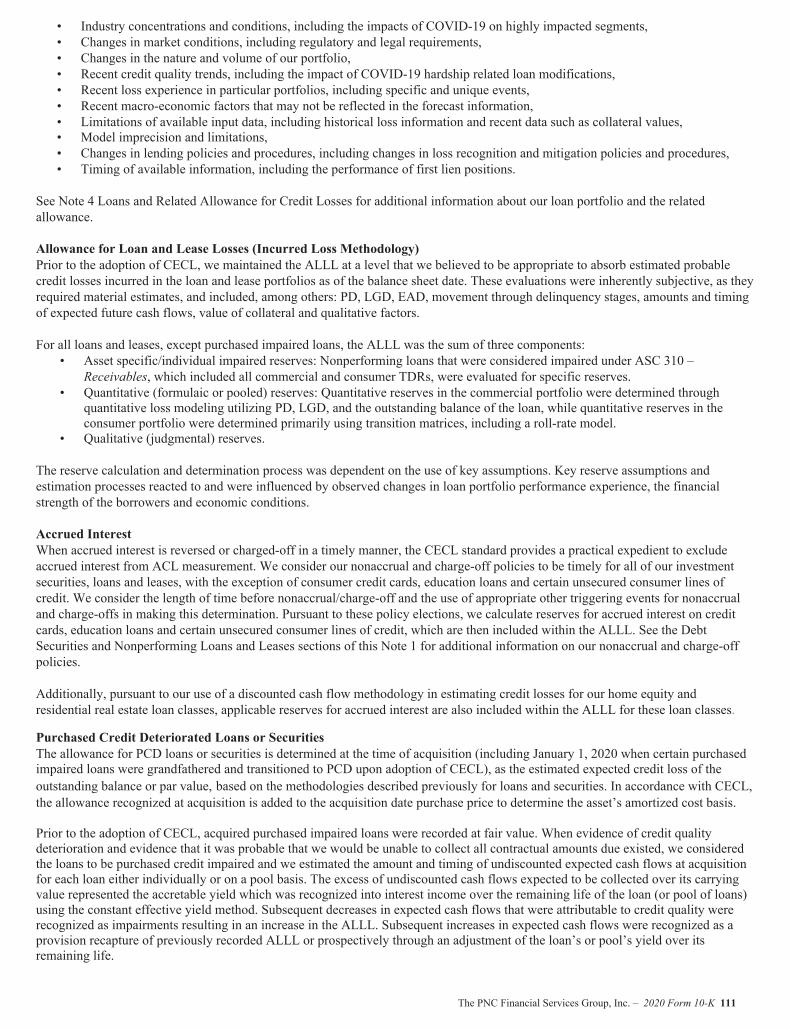
• Industry concentrations and conditions, including the impacts of COVID-19 on highly impacted segments,• Changes in market conditions, including regulatory and legal requirements,• Changes in the nature and volume of our portfolio,• Recent credit quality trends, including the impact of COVID-19 hardship related loan modifications,• Recent loss experience in particular portfolios, including specific and unique events,• Recent macro-economic factors that may not be reflected in the forecast information,• Limitations of available input data, including historical loss information and recent data such as collateral values,• Model imprecision and limitations,• Changes in lending policies and procedures, including changes in loss recognition and mitigation policies and procedures,• Timing of available information, including the performance of first lien positions.
See Note 4 Loans and Related Allowance for Credit Losses for additional information about our loan portfolio and the relatedallowance.
Allowance for Loan and Lease Losses (Incurred Loss Methodology)Prior to the adoption of CECL, we maintained the ALLL at a level that we believed to be appropriate to absorb estimated probablecredit losses incurred in the loan and lease portfolios as of the balance sheet date. These evaluations were inherently subjective, as theyrequired material estimates, and included, among others: PD, LGD, EAD, movement through delinquency stages, amounts and timingof expected future cash flows, value of collateral and qualitative factors.
For all loans and leases, except purchased impaired loans, the ALLL was the sum of three components:• Asset specific/individual impaired reserves: Nonperforming loans that were considered impaired under ASC 310 –
Receivables, which included all commercial and consumer TDRs, were evaluated for specific reserves.• Quantitative (formulaic or pooled) reserves: Quantitative reserves in the commercial portfolio were determined through
quantitative loss modeling utilizing PD, LGD, and the outstanding balance of the loan, while quantitative reserves in theconsumer portfolio were determined primarily using transition matrices, including a roll-rate model.
• Qualitative (judgmental) reserves.
The reserve calculation and determination process was dependent on the use of key assumptions. Key reserve assumptions andestimation processes reacted to and were influenced by observed changes in loan portfolio performance experience, the financialstrength of the borrowers and economic conditions.
Accrued InterestWhen accrued interest is reversed or charged-off in a timely manner, the CECL standard provides a practical expedient to excludeaccrued interest from ACL measurement. We consider our nonaccrual and charge-off policies to be timely for all of our investmentsecurities, loans and leases, with the exception of consumer credit cards, education loans and certain unsecured consumer lines ofcredit. We consider the length of time before nonaccrual/charge-off and the use of appropriate other triggering events for nonaccrualand charge-offs in making this determination. Pursuant to these policy elections, we calculate reserves for accrued interest on creditcards, education loans and certain unsecured consumer lines of credit, which are then included within the ALLL. See the DebtSecurities and Nonperforming Loans and Leases sections of this Note 1 for additional information on our nonaccrual and charge-offpolicies.
Additionally, pursuant to our use of a discounted cash flow methodology in estimating credit losses for our home equity andresidential real estate loan classes, applicable reserves for accrued interest are also included within the ALLL for these loan classes.
Purchased Credit Deteriorated Loans or SecuritiesThe allowance for PCD loans or securities is determined at the time of acquisition (including January 1, 2020 when certain purchasedimpaired loans were grandfathered and transitioned to PCD upon adoption of CECL), as the estimated expected credit loss of theoutstanding balance or par value, based on the methodologies described previously for loans and securities. In accordance with CECL,the allowance recognized at acquisition is added to the acquisition date purchase price to determine the asset’s amortized cost basis.
Prior to the adoption of CECL, acquired purchased impaired loans were recorded at fair value. When evidence of credit qualitydeterioration and evidence that it was probable that we would be unable to collect all contractual amounts due existed, we consideredthe loans to be purchased credit impaired and we estimated the amount and timing of undiscounted expected cash flows at acquisitionfor each loan either individually or on a pool basis. The excess of undiscounted cash flows expected to be collected over its carryingvalue represented the accretable yield which was recognized into interest income over the remaining life of the loan (or pool of loans)using the constant effective yield method. Subsequent decreases in expected cash flows that were attributable to credit quality wererecognized as impairments resulting in an increase in the ALLL. Subsequent increases in expected cash flows were recognized as aprovision recapture of previously recorded ALLL or prospectively through an adjustment of the loan’s or pool’s yield over itsremaining life.
The PNC Financial Services Group, Inc. – 2020 Form 10-K 111
Allowance for Unfunded Lending Related CommitmentsWe maintain the allowance for unfunded lending related commitments on off-balance sheet credit exposures that are notunconditionally cancelable (e.g., unfunded loan commitments, letters of credit and certain financial guarantees), at a level we believeis appropriate as of the balance sheet date to absorb expected credit losses on these exposures. Other than the estimation of theprobability of funding, this reserve is estimated in a manner similar to the methodology used for determining reserves for loans andleases. See the Allowance for Loan and Lease Losses section of this Note 1 for the key credit risk characteristics for unfunded lendingrelated commitments. The allowance for unfunded lending related commitments is recorded as a liability on the Consolidated BalanceSheet. Net adjustments to this reserve are included in the provision for credit losses.
See Note 4 Loans and Related Allowance for Credit Losses for additional information about this allowance.
Prior to the adoption of CECL, we maintained the allowance for unfunded loan commitments and letters of credit at a level webelieved was appropriate to absorb estimated probable credit losses incurred as of the balance sheet date. We determined theallowance based on periodic evaluations of the unfunded credit facilities, including an assessment of the probability of commitmentusage, credit risk factors, and, solely for commercial lending, the terms and expiration dates of the unfunded credit facilities. Otherthan the estimation of the probability of funding, the reserve for unfunded loan commitments was estimated in a manner similar to themethodology used for determining reserves for funded exposures. The allowance for unfunded loan commitments and letters of creditwas recorded as a liability on the Consolidated Balance Sheet. Net adjustments to the allowance for unfunded loan commitments andletters of credit were included in the provision for credit losses.
Allowance for Other Financial AssetsWe determine the allowance for other financial assets (e.g., trade receivables, servicing advances on PNC-owned loans, balances withbanks) considering historical loss information and other available indicators. In certain cases where there are no historical, current orforecast indicators of an expected credit loss, we may estimate the reserve to be close to zero. As of December 31, 2020, the allowancefor other financial assets was immaterial.
Loans Held for Sale
We designate loans as held for sale when we have the intent and ability to sell them. At the time of designation to held for sale, anyallowance is reversed, and a valuation allowance for the shortfall between the amortized cost basis and the net realizable value isrecognized, excluding the amounts already charged off. Similarly, when loans are no longer considered held for sale, the valuationallowance (net of writedowns) is reversed, and an allowance for credit losses is established, excluding the amounts already charged-off. Write-downs on these loans (if required) are recorded as charge-offs through the valuation allowance. Adjustments to thevaluation allowance on held for sale loans are recognized in Other noninterest income.
We have elected to account for certain commercial and residential mortgage loans held for sale at fair value. The changes in the fairvalue of the commercial mortgage loans are measured and recorded in Other noninterest income while such changes for the residentialmortgage loans are measured and recorded in Residential mortgage noninterest income each period. See Note 15 Fair Value foradditional information.
Interest income with respect to loans held for sale is accrued based on the principal amount outstanding and the loan’s contractualinterest rate.
In certain circumstances, loans designated as held for sale may be transferred to held for investment based on a change in strategy. Wetransfer these loans at the lower of cost or estimated fair value; however, any loans originated or purchased for the held for saleportfolio and for which the fair value option has been elected remain at fair value for the life of the loan.
Loan Sales, Loan Securitizations and Retained Interests
We recognize the sale of loans or other financial assets when the transferred assets are legally isolated from our creditors and theappropriate accounting criteria are met. We have sold mortgage and other loans through securitization transactions. In a securitization,financial assets are transferred into trusts or to SPEs in transactions to effectively legally isolate the assets from us.
In a securitization, the trust or SPE issues beneficial interests in the form of senior and subordinated securities backed or collateralizedby the assets sold to the trust. The senior classes of the asset-backed securities typically receive investment grade credit ratings at thetime of issuance. These ratings are generally achieved through the creation of lower-rated subordinated classes of asset-backedsecurities, as well as subordinated or residual interests. In certain cases, we may retain a portion or all of the securities issued, interest-only strips, one or more subordinated tranches, servicing rights and, in some cases, cash reserve accounts. Securitized loans areremoved from the balance sheet and a net gain or loss is recognized in Noninterest income at the time of initial sale. Gains or lossesrecognized on the sale of the loans depend on the fair value of the loans sold and the retained interests at the date of sale. We generallyestimate the fair value of the retained interests based on the present value of future expected cash flows using assumptions as todiscount rates, interest rates, prepayment speeds, credit losses and servicing costs, if applicable.
112 The PNC Financial Services Group, Inc. – 2020 Form 10-K
With the exception of loan sales to certain U.S. government-chartered entities, our loan sales and securitizations are generallystructured without recourse to us except for representations and warranties and with no restrictions on the retained interests. Weoriginate, sell and service commercial mortgage loans under the FNMA DUS program. Under the provisions of the DUS program, weparticipate in a loss-sharing arrangement with FNMA. When we are obligated for loss-sharing or recourse, our policy is to record suchliabilities initially at fair value and subsequently reserve for estimated losses in accordance with guidance contained in applicableGAAP.
Variable Interest Entities
A VIE is a corporation, partnership, limited liability company, or any other legal structure used to conduct activities or hold assetsgenerally that either:
• Does not have equity investors with voting rights that can directly or indirectly make decisions about the entity’s mostsignificant economic activities through those voting rights or similar rights, or
• Has equity investors that do not provide sufficient equity for the entity to finance its activities without additional subordinatedfinancial support.
A VIE often holds financial assets, including loans or receivables, real estate or other property.
VIEs are assessed for consolidation under ASC 810 – Consolidation when we hold a variable interest in these entities. We consolidatea VIE if we are its primary beneficiary. The primary beneficiary of a VIE is determined to be the party that meets both of thefollowing criteria: (i) has the power to make decisions that most significantly affect the economic performance of the VIE; and (ii) hasthe obligation to absorb losses or the right to receive benefits that in either case could potentially be significant to the VIE. Uponconsolidation of a VIE, we recognize all of the VIE’s assets, liabilities and noncontrolling interests on our Consolidated BalanceSheet. On a quarterly basis, we determine whether any changes occurred requiring a reassessment of whether we are the primarybeneficiary of an entity.
See Note 5 Loan Sale and Servicing Activities and Variable Interest Entities for information about VIEs that we consolidate as well asthose that we do not consolidate but in which we hold a significant variable interest.
Mortgage Servicing Rights
We provide servicing under various loan servicing contracts for commercial and residential loans. These contracts are either purchasedin the open market or retained as part of a loan securitization or loan sale. All acquired or originated servicing rights are measured atfair value. Fair value is based on the present value of the expected future net cash flows, including assumptions as to:
• Deposit balances and interest rates for escrow and commercial reserve earnings,• Discount rates,• Estimated prepayment speeds, and• Estimated servicing costs.
We measure commercial and residential MSRs at fair value in order to reduce any potential measurement mismatch between oureconomic hedges and the MSRs. We manage the risk by hedging the fair value of MSRs with derivatives and securities which areexpected to increase in value when the value of the servicing right declines. Changes in the fair value of MSRs are recognized asgains/(losses). The fair value of these servicing rights is estimated by using a discounted cash flow valuation model which calculatesthe present value of estimated future net servicing cash flows, taking into consideration actual and expected mortgage loan prepaymentrates, discount rates, servicing costs and other factors which are determined based on current market conditions. See Note 6 Goodwilland Mortgage Servicing Rights for additional information.
Goodwill
Goodwill arising from business acquisitions represents the value attributable to unidentifiable intangible elements in the businessacquired. At least annually, in the fourth quarter, or more frequently if events occur or circumstances have changed significantly fromthe annual test date, management performs the goodwill impairment test at a reporting unit level.
The PNC Financial Services Group, Inc. – 2020 Form 10-K 113
PNC may first perform a qualitative analysis to evaluate whether it is more-likely-than-not that the fair value of a reporting unit is lessthan its carrying amount. If, after considering all relevant events and circumstances, PNC determines it is not more-likely-than-not thatthe fair value of a reporting unit is less than its carrying amount, then performing a quantitative impairment test is not necessary. IfPNC elects to bypass the qualitative analysis, or concludes via qualitative analysis that it is more-likely-than-not that the fair value of areporting unit is less than its carrying amount, a quantitative goodwill impairment test is performed. Inputs are generated and used incalculating the fair value of the reporting unit, which is compared to its carrying amount. The fair value of our reporting units isdetermined by using discounted cash flows and/or market comparability methodologies. If the fair value is greater than the carryingamount, then the reporting unit’s goodwill is deemed not to be impaired. If the fair value is less than the carrying amount, an entityshould recognize an impairment charge for the amount by which the carrying amount of goodwill exceeds the reporting unit’s fairvalue. The loss recognized should not exceed the total amount of goodwill allocated to that reporting unit. See Note 6 Goodwill andMortgage Servicing Rights for additional information.
Leases
Lessor ArrangementsWe provide financing for various types of equipment, including aircraft, energy and power systems and vehicles through a variety oflease arrangements. Finance leases are carried at the aggregate of lease payments plus estimated residual value of the leasedequipment, less unearned income. Leveraged leases, a form of financing leases, are carried net of nonrecourse debt. We recognizeincome over the term of the lease using the constant effective yield method. Lease residual values are reviewed for impairment at leastannually. Gains or losses on the sale of leased assets are included in Other noninterest income. Valuation adjustments on operatinglease residuals are included in Other noninterest expense while valuation adjustments on the net investment of a direct financing orsales-type lease are included in Provision for credit losses. Prior to the adoption of CECL, valuation adjustments on lease residualswere included in Other noninterest expense.
Lessee ArrangementsWe lease retail branches, datacenters, office space, land and equipment under operating and finance leases. At adoption of ASU2016-02 on January 1, 2019, we elected the practical expedient to account for the lease and nonlease components of existing realestate leases and leases of advertising assets, such as signage, as a single lease component. Effective January 1, 2019, lease andnonlease components of new lease agreements are accounted for separately. Lease components consist of fixed payments includingrent, real estate taxes and insurance costs and nonlease components consist of common-area maintenance costs. In addition, we electedthe practical expedient to not apply the recognition requirements under the standard to short-term leases. Leases with an initial term of12 months or less are not recorded on the balance sheet, as we recognize lease expense for these leases on a straight-line basis over thelease term. Generally, we have elected to use the Overnight Indexed Swap rate corresponding to the term of the lease at the leasemeasurement date as our incremental borrowing rate to measure the right-of-use-asset and lease liability.
See Note 7 Leases for additional information on our leasing arrangements.
Depreciation and Amortization
For financial reporting purposes, we depreciate premises and equipment, net of salvage value, principally using the straight-linemethod over their estimated useful lives.
We use estimated useful lives for furniture and equipment ranging from one to 10 years, and depreciate buildings over an estimateduseful life of up to 40 years. We amortize leasehold improvements over their estimated useful lives of up to 15 years or the respectivelease terms, whichever is shorter.
We purchase, as well as internally develop and customize, certain software to enhance or perform internal business functions.Software development costs incurred in the planning and post-development project stages are charged to Noninterest expense. Costsassociated with designing software configuration and interfaces, installation, coding programs and testing systems are capitalized andamortized using the straight-line method over periods ranging from one to 10 years.
We review the remaining useful lives and carrying values of premises and equipment to determine whether an event has occurred thatwould indicate a change in useful life is warranted or if any impairment exists.
Other Comprehensive Income
Other comprehensive income, on an after-tax basis, primarily consists of unrealized gains or losses on debt securities, unrealized gainsor losses on derivatives designated as cash flow hedges, and changes in pension and other postretirement benefit plan liabilityadjustments. Details of each component are included in Note 13 Other Comprehensive Income.
114 The PNC Financial Services Group, Inc. – 2020 Form 10-K

Treasury Stock
We record common stock purchased for treasury at cost. At the date of subsequent reissue, the treasury stock account is reduced by thecost of such stock on the first-in, first-out basis.
Earnings Per Common Share
Basic earnings per common share is calculated using the two-class method to determine income attributable to common shareholders.Unvested share-based payment awards that contain nonforfeitable rights to dividends or dividend equivalents are consideredparticipating securities under the two-class method. Distributed dividends and dividend equivalents related to participating securitiesand an allocation of undistributed net income to participating securities reduce the amount of income attributable to commonshareholders. In a period with a loss, no allocation will be made to the participating securities, as they do not have a contractualobligation to absorb losses. Income attributable to common shareholders is then divided by the weighted-average common sharesoutstanding for the period.
Diluted earnings per common share is calculated under the more dilutive of either the treasury method or the two-class method. Forthe diluted calculation, we increase the weighted-average number of shares of common stock outstanding by the assumed conversionof outstanding convertible preferred stock from the beginning of the year or date of issuance, if later, and the number of shares ofcommon stock that would be issued assuming the exercise of stock options and warrants and the issuance of incentive shares using thetreasury stock method. These adjustments to the weighted-average number of shares of common stock outstanding are made onlywhen such adjustments will dilute earnings per common share. For periods in which there is a loss from continuing operations, anypotential dilutive shares will be anti-dilutive. In this scenario, no potential dilutive shares will be included in the continuing operations,discontinued operations or total earnings per common share calculations, even if overall net income is reported. See Note 14 EarningsPer Share for additional information.
Fair Value of Financial Instruments
The fair value of financial instruments and the methods and assumptions used in estimating fair value amounts and financial assets andliabilities for which fair value was elected are detailed in Note 15 Fair Value.
Derivative Instruments and Hedging Activities
We use a variety of financial derivatives to both mitigate exposure to market (primarily interest rate) and credit risks inherent in ourbusiness activities, as well as to facilitate customer risk management activities. We manage these risks as part of our asset and liabilitymanagement process and through credit policies and procedures.
We recognize all derivative instruments at fair value as either Other assets or Other liabilities on the Consolidated Balance Sheet andthe related cash flows in the Operating Activities section of the Consolidated Statement of Cash Flows. Adjustments for counterpartycredit risk are included in the determination of fair value. The accounting for changes in the fair value of a derivative instrumentdepends on whether it has been designated and qualifies as part of a cash flow or net investment hedging relationship. For all otherderivatives, changes in fair value are recognized in earnings.
We utilize a net presentation for derivative instruments on the Consolidated Balance Sheet taking into consideration the effects oflegally enforceable master netting agreements. Cash collateral exchanged with counterparties is also netted against the applicablederivative exposures by offsetting obligations to return, or general rights to reclaim, cash collateral against the fair values of the netderivatives being collateralized.
For those derivative instruments that are designated and qualify as accounting hedges, we designate the hedging instrument, based onthe exposure being hedged, as a fair value hedge, a cash flow hedge or a hedge of the net investment in a foreign operation.
We formally document the relationship between the hedging instruments and hedged items, as well as the risk management objectiveand strategy, before undertaking an accounting hedge. To qualify for hedge accounting, the derivatives and related hedged items mustbe designated as a hedge at inception of the hedge relationship. In addition, a derivative must be highly effective at reducing the riskassociated with the exposure being hedged. For accounting hedge relationships, we formally assess, both at the inception of the hedgeand on an ongoing basis, if the derivatives are highly effective in offsetting designated changes in the fair value or cash flows of thehedged item. If it is determined that the derivative instrument is not highly effective, hedge accounting is discontinued. We assesseffectiveness using statistical regression analysis. Where the critical terms of the derivative and hedged item match, effectiveness maybe assessed qualitatively.
For derivatives that are designated as fair value hedges (i.e., hedging the exposure to changes in the fair value of an asset or a liabilityattributable to a particular risk, such as changes in LIBOR), changes in the fair value of the hedging instrument are recognized inearnings and offset by also recognizing in earnings the changes in the fair value of the hedged item attributable to the hedged risk. To
The PNC Financial Services Group, Inc. – 2020 Form 10-K 115

the extent the change in fair value of the derivative does not offset the change in fair value of the hedged item, the difference isreflected in the Consolidated Income Statement in the same income statement line as the hedged item.
For derivatives designated as cash flow hedges (i.e., hedging the exposure to variability in expected future cash flows), the gain or losson derivatives is reported as a component of AOCI and subsequently reclassified to income in the same period or periods during whichthe hedged cash flows affect earnings and recorded in the same income statement line item as the hedged cash flows. For derivativesdesignated as a hedge of net investment in a foreign operation, the gain or loss on the derivatives is reported as a component of AOCI.
We discontinue hedge accounting when it is determined that the derivative no longer qualifies as an effective hedge; the derivativeexpires or is sold, terminated or exercised; or the derivative is de-designated as a fair value or cash flow hedge or, for a cash flowhedge, it is no longer probable that the forecasted transaction will occur by the end of the originally specified time period.We purchase or originate financial instruments that contain an embedded derivative. For financial instruments not measured at fairvalue with changes in fair value reported in earnings, we assess, at inception of the transaction, if the economic characteristics of theembedded derivative are clearly and closely related to the economic characteristics of the host contract, and whether a separateinstrument with the same terms as the embedded derivative would be a derivative. If the embedded derivative is not clearly and closelyrelated to the host contract and meets the definition of a derivative, the embedded derivative is recorded separately from the hostcontract with changes in fair value recorded in earnings, unless we elect to account for the hybrid instrument at fair value.
We enter into commitments to originate residential and commercial mortgage loans for sale. We also enter into commitments topurchase or sell commercial and residential real estate loans. These commitments are accounted for as free-standing derivatives whichare recorded at fair value in Other assets or Other liabilities on the Consolidated Balance Sheet. Any gain or loss from the change infair value after the inception of the commitment is recognized in Noninterest income.
See Note 16 Financial Derivatives for additional information.
Income Taxes
We account for income taxes under the asset and liability method. Deferred tax assets and liabilities are determined based ondifferences between the financial reporting and tax bases of assets and liabilities and are measured using the enacted tax rates and lawsthat we expect will apply at the time when we believe the differences will reverse. Changes in tax rates and tax law are accounted forin the period of enactment. Thus, at the enactment date, deferred taxes are remeasured and the change is recognized in Income Taxexpense. The recognition of deferred tax assets requires an assessment to determine the realization of such assets. Realization refers tothe incremental benefit achieved through the reduction in future taxes payable or refunds receivable from the deferred tax assets,assuming that the underlying deductible differences and carryforwards are the last items to enter into the determination of futuretaxable income. We establish a valuation allowance for tax assets when it is more likely than not that they will not be realized, basedupon all available positive and negative evidence.
We use the deferral method of accounting on investments that generate investment tax credits. Under this method, the investment taxcredits are recognized as a reduction to the related asset.
Revenue Recognition
We earn interest and noninterest income from various sources, including:• Lending,• Securities portfolio,• Asset management,• Loan sales, loan securitizations, and servicing,• Brokerage services,• Sale of loans and securities,• Certain private equity activities, and• Securities, derivatives and foreign exchange activities.
In addition, we earn fees and commissions from:• Issuing loan commitments, standby letters of credit and financial guarantees,• Deposit account services,• Merchant services,• Selling various insurance products,• Providing treasury management services,• Providing merger and acquisition advisory and related services,• Debit and credit card transactions, and• Participating in certain capital markets transactions.
116 The PNC Financial Services Group, Inc. – 2020 Form 10-K

Service charges on deposit accounts are recognized when earned. Brokerage fees and gains and losses on the sale of securities andcertain derivatives are recognized on a trade-date basis.
We record private equity income or loss based on changes in the valuation of the underlying investments or when we dispose of ourinterest.
We recognize gain/(loss) on changes in the fair value of certain financial instruments where we have elected the fair value option.These financial instruments include certain commercial and residential mortgage loans originated for sale, certain residential mortgageportfolio loans and resale agreements. We also recognize gain/(loss) on changes in the fair value of residential and commercial MSRs.
We recognize revenue from servicing residential mortgages, commercial mortgages and other consumer loans for others as earnedbased on the specific contractual terms. These revenues are reported on the Consolidated Income Statement in the line itemsResidential mortgage, Corporate services and Consumer services. We recognize revenue from securities, derivatives and foreignexchange customer-related trading, as well as securities underwriting activities, as these transactions occur or as services are provided.We generally recognize gains from the sale of loans upon meeting the derecognition criteria for transfers of financial assets. Mortgagerevenue recognized is reported net of mortgage repurchase reserves.
For the fee-based revenue within the scope of ASC 606 - Revenue from Contracts with Customers, revenue is recognized when or asthose services are transferred to the customer. See Note 24 Fee-Based Revenue from Contracts with Customers for additionalinformation related to revenue within the scope of ASC 606.
NOTE 2 ACQUISITION ANDDIVESTITUREACTIVITY
Pending Acquisition of BBVA USA Bancshares, Inc.
On November 16, 2020, we announced a definitive agreement with BBVA, S.A. to acquire BBVA including its U.S. bankingsubsidiary, BBVA USA, for a fixed purchase price of $11.6 billion in cash.
BBVA USA has over 600 branches in Texas, Alabama, Arizona, California, Florida, Colorado and New Mexico. The transaction isexpected to add approximately $102 billion in total assets, $86 billion of deposits and $66 billion of loans to PNC’s ConsolidatedBalance Sheet and to close in mid-2021, subject to customary closing conditions, including receipt of regulatory approvals.
Sale of Equity Investment in Blackrock, Inc.
In May 2020, PNC completed the sale of its 31.6 million shares of BlackRock, Inc., common and preferred stock through a registeredsecondary offering at a price of $420 per share. In addition, BlackRock repurchased 2.65 million shares from PNC at a price of$414.96 per share. The total proceeds from the sale were $14.2 billion in cash, net of $0.2 billion in expenses, and resulted in a gain onsale of $4.3 billion. Additionally, PNC contributed 500,000 BlackRock shares to the PNC Foundation.
Following the sale and donation, PNC has divested its entire investment in BlackRock and only holds shares of BlackRock stock in afiduciary capacity for clients of PNC.
The following table summarizes the results from the discontinued operations of BlackRock included in the Consolidated IncomeStatement:
Table 39: Consolidated Income Statement - Discontinued Operations
Year ended December 31
In millions 2020 2019 2018
Noninterest income $ 5,777 $ 988 $ 942
Total revenue 5,777 988 942
Income from discontinued operations before income taxes 5,777 988 942
Income taxes 1,222 161 154
Net income from discontinued operations $ 4,555 $ 827 $ 788
The PNC Financial Services Group, Inc. – 2020 Form 10-K 117
The following table summarizes the cash flows of discontinued operations of BlackRock included in the Consolidated Statement ofCash Flows:
Table 40: Consolidated Statement of Cash Flows - Discontinued Operations
Year ended December 31
In millions 2020 2019 2018
Cash flows from discontinued operations
Net cash provided (used) by operating activities of discontinued operations $ (2,683) $ 299 $ 264
Net cash provided by investing activities of discontinued operations $ 14,225
NOTE 3 INVESTMENT SECURITIES
With the adoption of the CECL standard on January 1, 2020, credit losses on investment securities are required to be recognizedthrough an allowance, instead of as a direct write-down to the amortized cost basis of the security. The amortized cost basis ofinvestment securities for which impairment had previously been recorded did not change upon adoption.
We maintain the allowance for investment securities at levels that we believe to be appropriate as of the balance sheet date to absorbexpected credit losses on our portfolio. As of December 31, 2020, the allowance for investment securities was $82 million andprimarily related to non-agency commercial mortgage-backed securities in the available for sale portfolio and other debt securities inthe held to maturity portfolio. The provision for credit losses on investment securities totaled $80 million for the year endedDecember 31, 2020.
In the first quarter of 2020, upon the adoption of ASU 2019-04, we elected to transfer debt securities with an amortized cost of$16.2 billion and a fair value of $16.5 billion from the held to maturity to the available for sale portfolio. During the second quarter of2020, pursuant to the guidance in ASU 2020-04, we elected to transfer debt securities with an amortized cost of $49 million and a fairvalue of $48 million from the held to maturity to the available for sale portfolio.
See Note 1 Accounting Policies for additional information related to the adoption of the CECL standard, including the methodologiesused to determine the allowance for investment securities, and the adoption of ASU 2019-04 and ASU 2020-04.
118 The PNC Financial Services Group, Inc. – 2020 Form 10-K
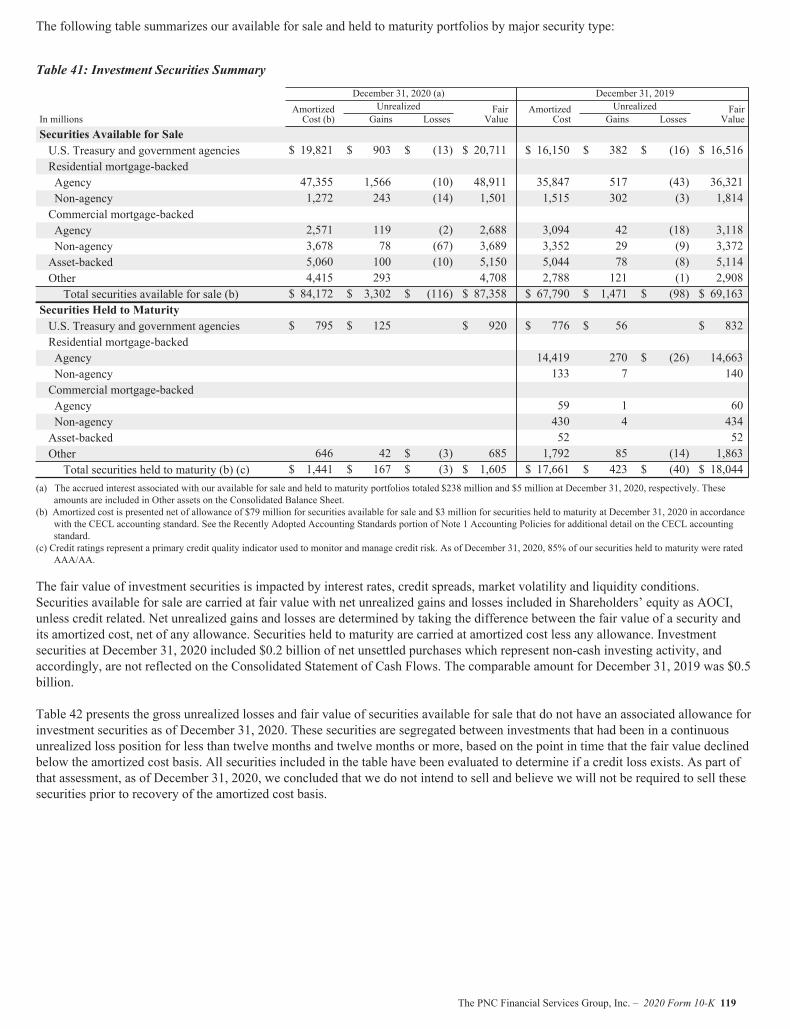
The following table summarizes our available for sale and held to maturity portfolios by major security type:
Table 41: Investment Securities Summary
December 31, 2020 (a) December 31, 2019
In millionsAmortizedCost (b)
Unrealized FairValue
AmortizedCost
Unrealized FairValueGains Losses Gains Losses
Securities Available for SaleU.S. Treasury and government agencies $ 19,821 $ 903 $ (13) $ 20,711 $ 16,150 $ 382 $ (16) $ 16,516Residential mortgage-backedAgency 47,355 1,566 (10) 48,911 35,847 517 (43) 36,321Non-agency 1,272 243 (14) 1,501 1,515 302 (3) 1,814Commercial mortgage-backedAgency 2,571 119 (2) 2,688 3,094 42 (18) 3,118Non-agency 3,678 78 (67) 3,689 3,352 29 (9) 3,372Asset-backed 5,060 100 (10) 5,150 5,044 78 (8) 5,114Other 4,415 293 4,708 2,788 121 (1) 2,908Total securities available for sale (b) $ 84,172 $ 3,302 $ (116) $ 87,358 $ 67,790 $ 1,471 $ (98) $ 69,163
Securities Held to MaturityU.S. Treasury and government agencies $ 795 $ 125 $ 920 $ 776 $ 56 $ 832Residential mortgage-backedAgency 14,419 270 $ (26) 14,663Non-agency 133 7 140Commercial mortgage-backedAgency 59 1 60Non-agency 430 4 434Asset-backed 52 52Other 646 42 $ (3) 685 1,792 85 (14) 1,863Total securities held to maturity (b) (c) $ 1,441 $ 167 $ (3) $ 1,605 $ 17,661 $ 423 $ (40) $ 18,044
(a) The accrued interest associated with our available for sale and held to maturity portfolios totaled $238 million and $5 million at December 31, 2020, respectively. Theseamounts are included in Other assets on the Consolidated Balance Sheet.
(b) Amortized cost is presented net of allowance of $79 million for securities available for sale and $3 million for securities held to maturity at December 31, 2020 in accordancewith the CECL accounting standard. See the Recently Adopted Accounting Standards portion of Note 1 Accounting Policies for additional detail on the CECL accountingstandard.
(c) Credit ratings represent a primary credit quality indicator used to monitor and manage credit risk. As of December 31, 2020, 85% of our securities held to maturity were ratedAAA/AA.
The fair value of investment securities is impacted by interest rates, credit spreads, market volatility and liquidity conditions.Securities available for sale are carried at fair value with net unrealized gains and losses included in Shareholders’ equity as AOCI,unless credit related. Net unrealized gains and losses are determined by taking the difference between the fair value of a security andits amortized cost, net of any allowance. Securities held to maturity are carried at amortized cost less any allowance. Investmentsecurities at December 31, 2020 included $0.2 billion of net unsettled purchases which represent non-cash investing activity, andaccordingly, are not reflected on the Consolidated Statement of Cash Flows. The comparable amount for December 31, 2019 was $0.5billion.
Table 42 presents the gross unrealized losses and fair value of securities available for sale that do not have an associated allowance forinvestment securities as of December 31, 2020. These securities are segregated between investments that had been in a continuousunrealized loss position for less than twelve months and twelve months or more, based on the point in time that the fair value declinedbelow the amortized cost basis. All securities included in the table have been evaluated to determine if a credit loss exists. As part ofthat assessment, as of December 31, 2020, we concluded that we do not intend to sell and believe we will not be required to sell thesesecurities prior to recovery of the amortized cost basis.
The PNC Financial Services Group, Inc. – 2020 Form 10-K 119
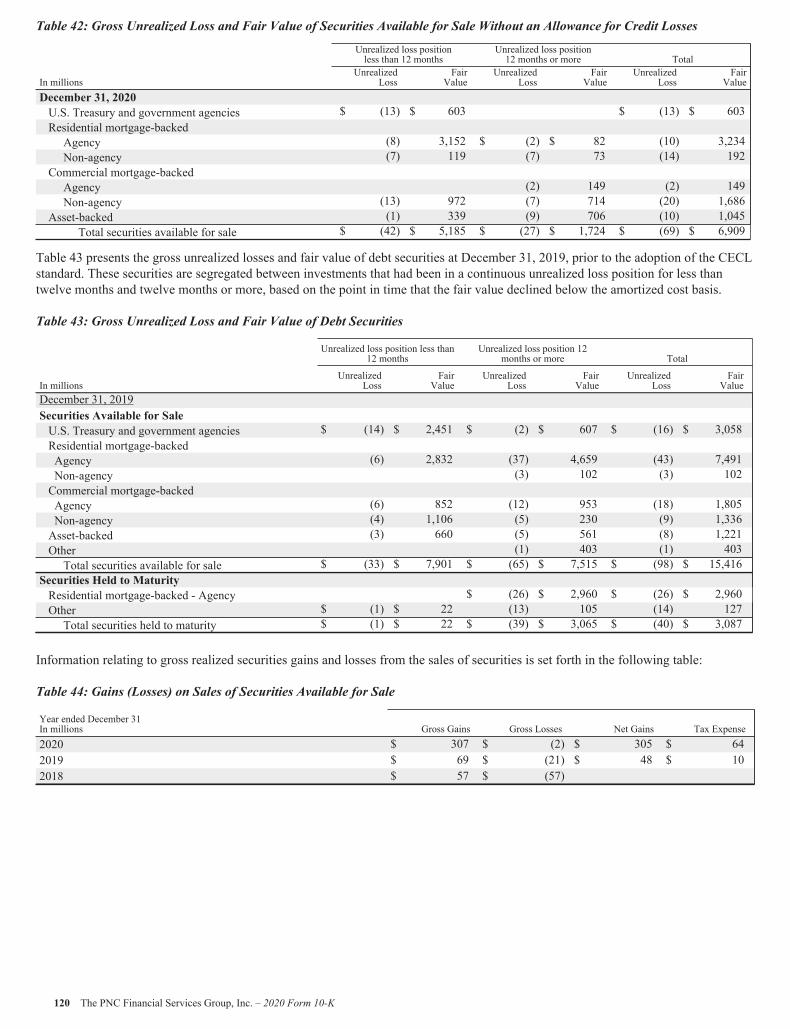
Table 42: Gross Unrealized Loss and Fair Value of Securities Available for Sale Without an Allowance for Credit Losses
Unrealized loss positionless than 12 months
Unrealized loss position12 months or more Total
In millionsUnrealized
LossFairValue
UnrealizedLoss
FairValue
UnrealizedLoss
FairValue
December 31, 2020U.S. Treasury and government agencies $ (13) $ 603 $ (13) $ 603Residential mortgage-backedAgency (8) 3,152 $ (2) $ 82 (10) 3,234Non-agency (7) 119 (7) 73 (14) 192
Commercial mortgage-backedAgency (2) 149 (2) 149Non-agency (13) 972 (7) 714 (20) 1,686
Asset-backed (1) 339 (9) 706 (10) 1,045Total securities available for sale $ (42) $ 5,185 $ (27) $ 1,724 $ (69) $ 6,909
Table 43 presents the gross unrealized losses and fair value of debt securities at December 31, 2019, prior to the adoption of the CECLstandard. These securities are segregated between investments that had been in a continuous unrealized loss position for less thantwelve months and twelve months or more, based on the point in time that the fair value declined below the amortized cost basis.
Table 43: Gross Unrealized Loss and Fair Value of Debt Securities
Unrealized loss position less than12 months
Unrealized loss position 12months or more Total
In millionsUnrealized
LossFairValue
UnrealizedLoss
FairValue
UnrealizedLoss
FairValue
December 31, 2019Securities Available for SaleU.S. Treasury and government agencies $ (14) $ 2,451 $ (2) $ 607 $ (16) $ 3,058Residential mortgage-backedAgency (6) 2,832 (37) 4,659 (43) 7,491Non-agency (3) 102 (3) 102Commercial mortgage-backedAgency (6) 852 (12) 953 (18) 1,805Non-agency (4) 1,106 (5) 230 (9) 1,336Asset-backed (3) 660 (5) 561 (8) 1,221Other (1) 403 (1) 403Total securities available for sale $ (33) $ 7,901 $ (65) $ 7,515 $ (98) $ 15,416
Securities Held to MaturityResidential mortgage-backed - Agency $ (26) $ 2,960 $ (26) $ 2,960Other $ (1) $ 22 (13) 105 (14) 127Total securities held to maturity $ (1) $ 22 $ (39) $ 3,065 $ (40) $ 3,087
Information relating to gross realized securities gains and losses from the sales of securities is set forth in the following table:
Table 44: Gains (Losses) on Sales of Securities Available for Sale
Year ended December 31In millions Gross Gains Gross Losses Net Gains Tax Expense2020 $ 307 $ (2) $ 305 $ 642019 $ 69 $ (21) $ 48 $ 102018 $ 57 $ (57)
120 The PNC Financial Services Group, Inc. – 2020 Form 10-K
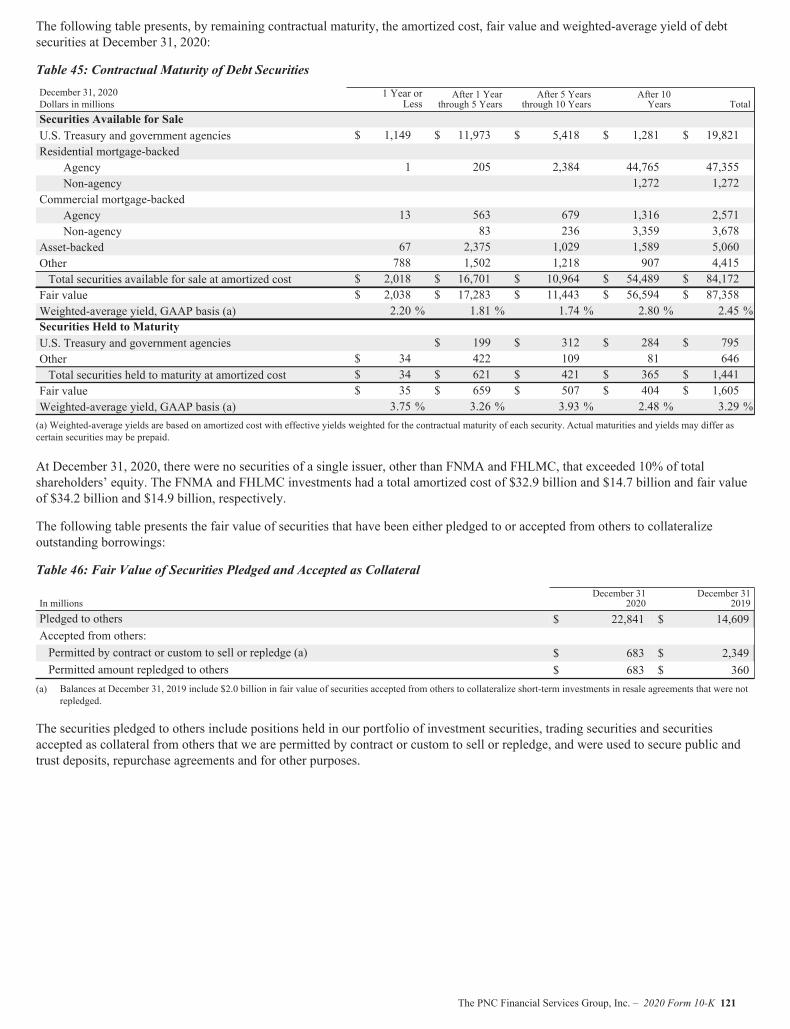
The following table presents, by remaining contractual maturity, the amortized cost, fair value and weighted-average yield of debtsecurities at December 31, 2020:
Table 45: Contractual Maturity of Debt SecuritiesDecember 31, 2020 1 Year or
LessAfter 1 Year
through 5 YearsAfter 5 Years
through 10 YearsAfter 10Years TotalDollars in millions
Securities Available for SaleU.S. Treasury and government agencies $ 1,149 $ 11,973 $ 5,418 $ 1,281 $ 19,821Residential mortgage-backed
Agency 1 205 2,384 44,765 47,355Non-agency 1,272 1,272
Commercial mortgage-backedAgency 13 563 679 1,316 2,571Non-agency 83 236 3,359 3,678
Asset-backed 67 2,375 1,029 1,589 5,060Other 788 1,502 1,218 907 4,415Total securities available for sale at amortized cost $ 2,018 $ 16,701 $ 10,964 $ 54,489 $ 84,172Fair value $ 2,038 $ 17,283 $ 11,443 $ 56,594 $ 87,358Weighted-average yield, GAAP basis (a) 2.20 % 1.81 % 1.74 % 2.80 % 2.45 %Securities Held to MaturityU.S. Treasury and government agencies $ 199 $ 312 $ 284 $ 795Other $ 34 422 109 81 646Total securities held to maturity at amortized cost $ 34 $ 621 $ 421 $ 365 $ 1,441Fair value $ 35 $ 659 $ 507 $ 404 $ 1,605Weighted-average yield, GAAP basis (a) 3.75 % 3.26 % 3.93 % 2.48 % 3.29 %(a) Weighted-average yields are based on amortized cost with effective yields weighted for the contractual maturity of each security. Actual maturities and yields may differ ascertain securities may be prepaid.
At December 31, 2020, there were no securities of a single issuer, other than FNMA and FHLMC, that exceeded 10% of totalshareholders’ equity. The FNMA and FHLMC investments had a total amortized cost of $32.9 billion and $14.7 billion and fair valueof $34.2 billion and $14.9 billion, respectively.
The following table presents the fair value of securities that have been either pledged to or accepted from others to collateralizeoutstanding borrowings:
Table 46: Fair Value of Securities Pledged and Accepted as Collateral
In millionsDecember 31
2020December 31
2019Pledged to others $ 22,841 $ 14,609Accepted from others:Permitted by contract or custom to sell or repledge (a) $ 683 $ 2,349Permitted amount repledged to others $ 683 $ 360
(a) Balances at December 31, 2019 include $2.0 billion in fair value of securities accepted from others to collateralize short-term investments in resale agreements that were notrepledged.
The securities pledged to others include positions held in our portfolio of investment securities, trading securities and securitiesaccepted as collateral from others that we are permitted by contract or custom to sell or repledge, and were used to secure public andtrust deposits, repurchase agreements and for other purposes.
The PNC Financial Services Group, Inc. – 2020 Form 10-K 121
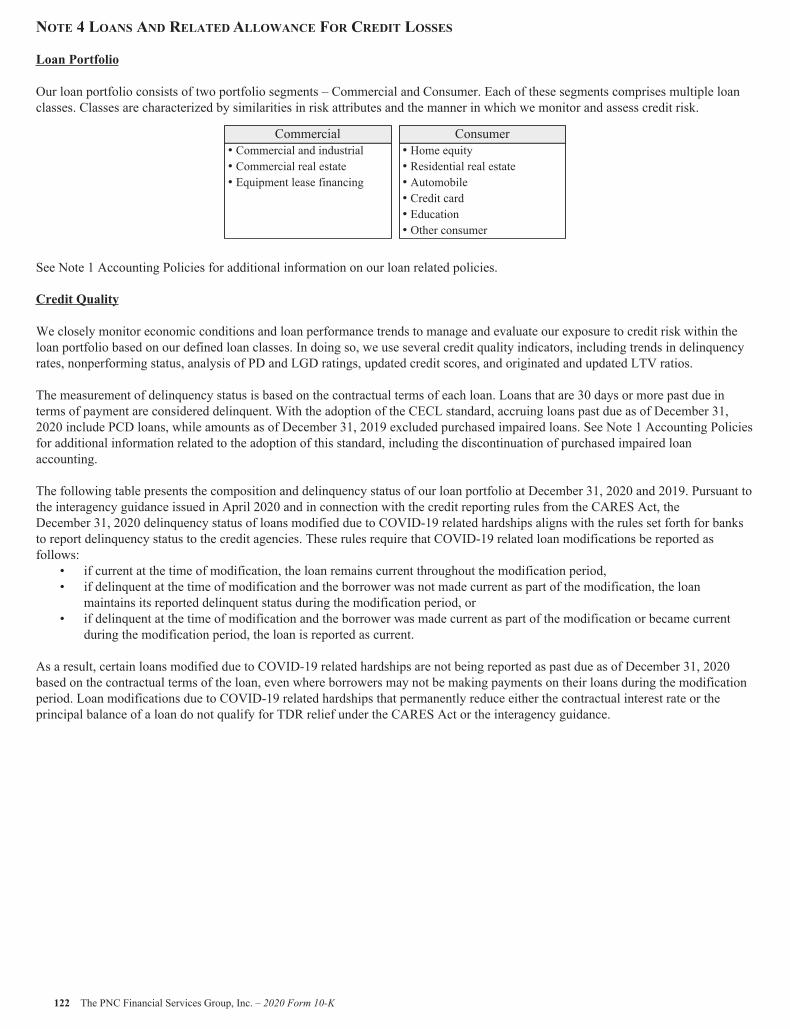
NOTE 4 LOANS AND RELATEDALLOWANCE FOR CREDIT LOSSES
Loan Portfolio
Our loan portfolio consists of two portfolio segments – Commercial and Consumer. Each of these segments comprises multiple loanclasses. Classes are characterized by similarities in risk attributes and the manner in which we monitor and assess credit risk.
Commercial Consumer• Commercial and industrial • Home equity• Commercial real estate • Residential real estate• Equipment lease financing • Automobile
• Credit card• Education• Other consumer
See Note 1 Accounting Policies for additional information on our loan related policies.
Credit Quality
We closely monitor economic conditions and loan performance trends to manage and evaluate our exposure to credit risk within theloan portfolio based on our defined loan classes. In doing so, we use several credit quality indicators, including trends in delinquencyrates, nonperforming status, analysis of PD and LGD ratings, updated credit scores, and originated and updated LTV ratios.
The measurement of delinquency status is based on the contractual terms of each loan. Loans that are 30 days or more past due interms of payment are considered delinquent. With the adoption of the CECL standard, accruing loans past due as of December 31,2020 include PCD loans, while amounts as of December 31, 2019 excluded purchased impaired loans. See Note 1 Accounting Policiesfor additional information related to the adoption of this standard, including the discontinuation of purchased impaired loanaccounting.
The following table presents the composition and delinquency status of our loan portfolio at December 31, 2020 and 2019. Pursuant tothe interagency guidance issued in April 2020 and in connection with the credit reporting rules from the CARES Act, theDecember 31, 2020 delinquency status of loans modified due to COVID-19 related hardships aligns with the rules set forth for banksto report delinquency status to the credit agencies. These rules require that COVID-19 related loan modifications be reported asfollows:
• if current at the time of modification, the loan remains current throughout the modification period,• if delinquent at the time of modification and the borrower was not made current as part of the modification, the loan
maintains its reported delinquent status during the modification period, or• if delinquent at the time of modification and the borrower was made current as part of the modification or became current
during the modification period, the loan is reported as current.
As a result, certain loans modified due to COVID-19 related hardships are not being reported as past due as of December 31, 2020based on the contractual terms of the loan, even where borrowers may not be making payments on their loans during the modificationperiod. Loan modifications due to COVID-19 related hardships that permanently reduce either the contractual interest rate or theprincipal balance of a loan do not qualify for TDR relief under the CARES Act or the interagency guidance.
122 The PNC Financial Services Group, Inc. – 2020 Form 10-K
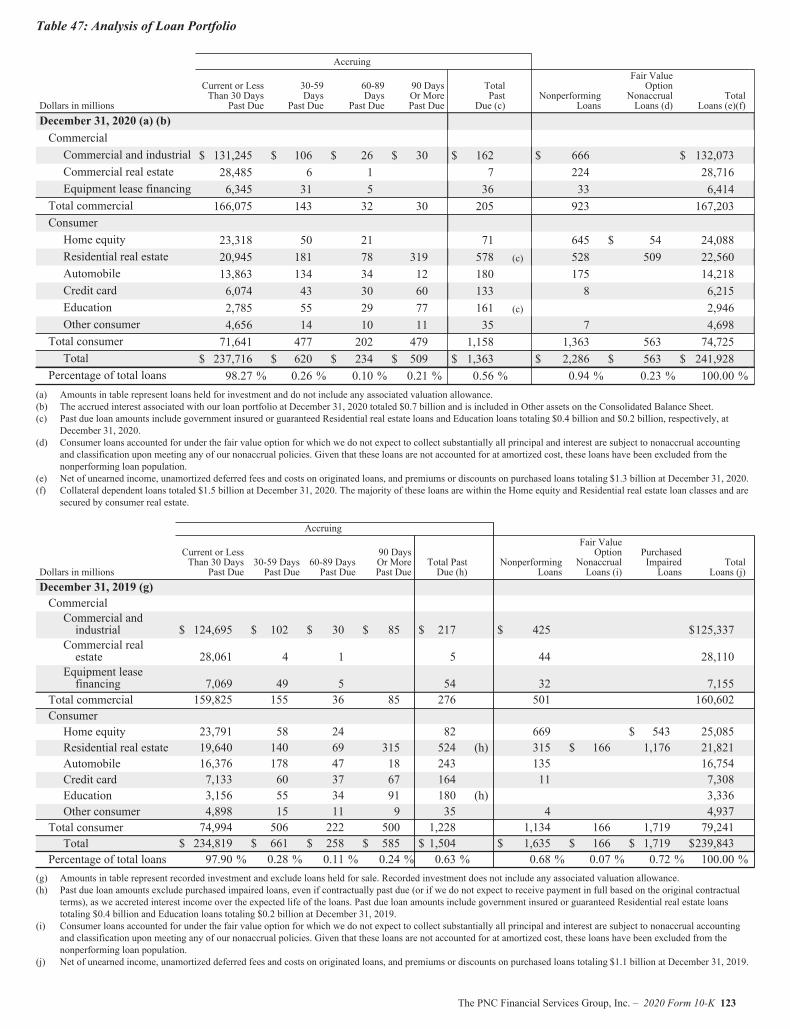
Table 47: Analysis of Loan Portfolio
Accruing
Dollars in millions
Current or LessThan 30 Days
Past Due
30-59Days
Past Due
60-89Days
Past Due
90 DaysOr MorePast Due
TotalPast
Due (c)Nonperforming
Loans
Fair ValueOption
NonaccrualLoans (d)
TotalLoans (e)(f)
December 31, 2020 (a) (b)CommercialCommercial and industrial $ 131,245 $ 106 $ 26 $ 30 $ 162 $ 666 $ 132,073Commercial real estate 28,485 6 1 7 224 28,716Equipment lease financing 6,345 31 5 36 33 6,414
Total commercial 166,075 143 32 30 205 923 167,203ConsumerHome equity 23,318 50 21 71 645 $ 54 24,088Residential real estate 20,945 181 78 319 578 (c) 528 509 22,560Automobile 13,863 134 34 12 180 175 14,218Credit card 6,074 43 30 60 133 8 6,215Education 2,785 55 29 77 161 (c) 2,946Other consumer 4,656 14 10 11 35 7 4,698
Total consumer 71,641 477 202 479 1,158 1,363 563 74,725Total $ 237,716 $ 620 $ 234 $ 509 $ 1,363 $ 2,286 $ 563 $ 241,928
Percentage of total loans 98.27 % 0.26 % 0.10 % 0.21 % 0.56 % 0.94 % 0.23 % 100.00 %(a) Amounts in table represent loans held for investment and do not include any associated valuation allowance.(b) The accrued interest associated with our loan portfolio at December 31, 2020 totaled $0.7 billion and is included in Other assets on the Consolidated Balance Sheet.(c) Past due loan amounts include government insured or guaranteed Residential real estate loans and Education loans totaling $0.4 billion and $0.2 billion, respectively, at
December 31, 2020.(d) Consumer loans accounted for under the fair value option for which we do not expect to collect substantially all principal and interest are subject to nonaccrual accounting
and classification upon meeting any of our nonaccrual policies. Given that these loans are not accounted for at amortized cost, these loans have been excluded from thenonperforming loan population.
(e) Net of unearned income, unamortized deferred fees and costs on originated loans, and premiums or discounts on purchased loans totaling $1.3 billion at December 31, 2020.(f) Collateral dependent loans totaled $1.5 billion at December 31, 2020. The majority of these loans are within the Home equity and Residential real estate loan classes and are
secured by consumer real estate.
Accruing
Dollars in millions
Current or LessThan 30 Days
Past Due30-59 DaysPast Due
60-89 DaysPast Due
90 DaysOr MorePast Due
Total PastDue (h)
NonperformingLoans
Fair ValueOption
NonaccrualLoans (i)
PurchasedImpairedLoans
TotalLoans (j)
December 31, 2019 (g)CommercialCommercial andindustrial $ 124,695 $ 102 $ 30 $ 85 $ 217 $ 425 $125,337
Commercial realestate 28,061 4 1 5 44 28,110
Equipment leasefinancing 7,069 49 5 54 32 7,155
Total commercial 159,825 155 36 85 276 501 160,602ConsumerHome equity 23,791 58 24 82 669 $ 543 25,085Residential real estate 19,640 140 69 315 524 (h) 315 $ 166 1,176 21,821Automobile 16,376 178 47 18 243 135 16,754Credit card 7,133 60 37 67 164 11 7,308Education 3,156 55 34 91 180 (h) 3,336Other consumer 4,898 15 11 9 35 4 4,937
Total consumer 74,994 506 222 500 1,228 1,134 166 1,719 79,241Total $ 234,819 $ 661 $ 258 $ 585 $ 1,504 $ 1,635 $ 166 $ 1,719 $239,843
Percentage of total loans 97.90 % 0.28 % 0.11 % 0.24 % 0.63 % 0.68 % 0.07 % 0.72 % 100.00 %(g) Amounts in table represent recorded investment and exclude loans held for sale. Recorded investment does not include any associated valuation allowance.(h) Past due loan amounts exclude purchased impaired loans, even if contractually past due (or if we do not expect to receive payment in full based on the original contractual
terms), as we accreted interest income over the expected life of the loans. Past due loan amounts include government insured or guaranteed Residential real estate loanstotaling $0.4 billion and Education loans totaling $0.2 billion at December 31, 2019.
(i) Consumer loans accounted for under the fair value option for which we do not expect to collect substantially all principal and interest are subject to nonaccrual accountingand classification upon meeting any of our nonaccrual policies. Given that these loans are not accounted for at amortized cost, these loans have been excluded from thenonperforming loan population.
(j) Net of unearned income, unamortized deferred fees and costs on originated loans, and premiums or discounts on purchased loans totaling $1.1 billion at December 31, 2019.
The PNC Financial Services Group, Inc. – 2020 Form 10-K 123
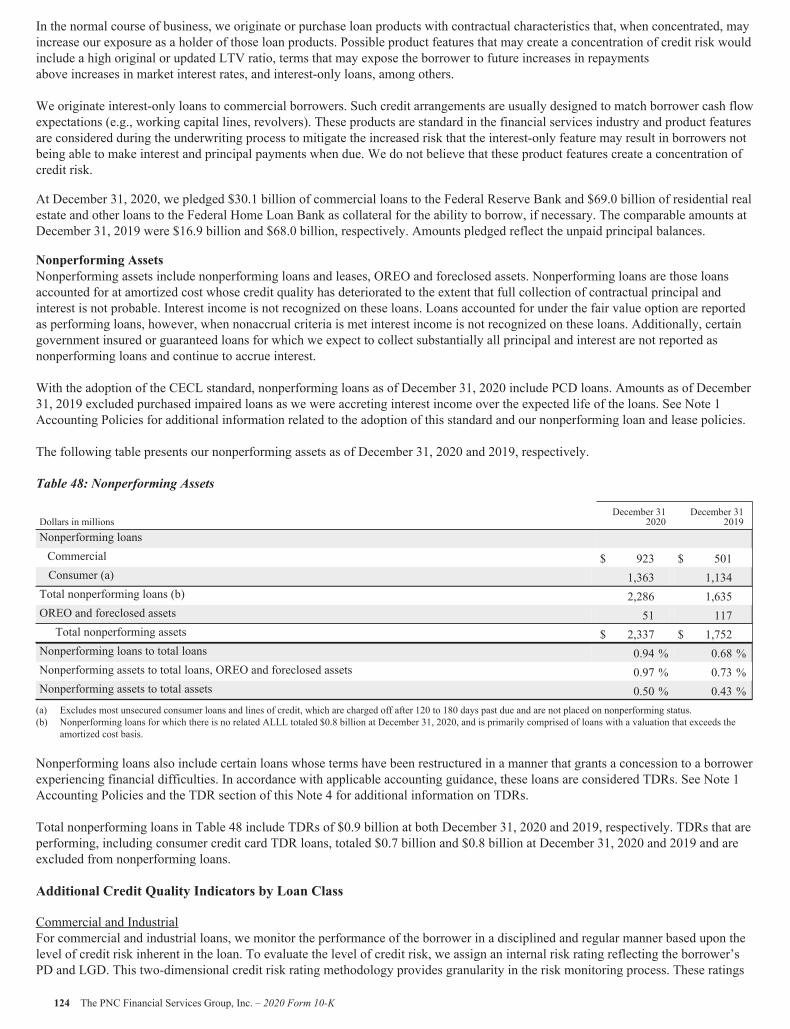
In the normal course of business, we originate or purchase loan products with contractual characteristics that, when concentrated, mayincrease our exposure as a holder of those loan products. Possible product features that may create a concentration of credit risk wouldinclude a high original or updated LTV ratio, terms that may expose the borrower to future increases in repaymentsabove increases in market interest rates, and interest-only loans, among others.
We originate interest-only loans to commercial borrowers. Such credit arrangements are usually designed to match borrower cash flowexpectations (e.g., working capital lines, revolvers). These products are standard in the financial services industry and product featuresare considered during the underwriting process to mitigate the increased risk that the interest-only feature may result in borrowers notbeing able to make interest and principal payments when due. We do not believe that these product features create a concentration ofcredit risk.
At December 31, 2020, we pledged $30.1 billion of commercial loans to the Federal Reserve Bank and $69.0 billion of residential realestate and other loans to the Federal Home Loan Bank as collateral for the ability to borrow, if necessary. The comparable amounts atDecember 31, 2019 were $16.9 billion and $68.0 billion, respectively. Amounts pledged reflect the unpaid principal balances.
Nonperforming AssetsNonperforming assets include nonperforming loans and leases, OREO and foreclosed assets. Nonperforming loans are those loansaccounted for at amortized cost whose credit quality has deteriorated to the extent that full collection of contractual principal andinterest is not probable. Interest income is not recognized on these loans. Loans accounted for under the fair value option are reportedas performing loans, however, when nonaccrual criteria is met interest income is not recognized on these loans. Additionally, certaingovernment insured or guaranteed loans for which we expect to collect substantially all principal and interest are not reported asnonperforming loans and continue to accrue interest.
With the adoption of the CECL standard, nonperforming loans as of December 31, 2020 include PCD loans. Amounts as of December31, 2019 excluded purchased impaired loans as we were accreting interest income over the expected life of the loans. See Note 1Accounting Policies for additional information related to the adoption of this standard and our nonperforming loan and lease policies.
The following table presents our nonperforming assets as of December 31, 2020 and 2019, respectively.
Table 48: Nonperforming Assets
Dollars in millionsDecember 31
2020December 31
2019Nonperforming loansCommercial $ 923 $ 501Consumer (a) 1,363 1,134Total nonperforming loans (b) 2,286 1,635OREO and foreclosed assets 51 117Total nonperforming assets $ 2,337 $ 1,752
Nonperforming loans to total loans 0.94 % 0.68 %Nonperforming assets to total loans, OREO and foreclosed assets 0.97 % 0.73 %Nonperforming assets to total assets 0.50 % 0.43 %(a) Excludes most unsecured consumer loans and lines of credit, which are charged off after 120 to 180 days past due and are not placed on nonperforming status.(b) Nonperforming loans for which there is no related ALLL totaled $0.8 billion at December 31, 2020, and is primarily comprised of loans with a valuation that exceeds the
amortized cost basis.
Nonperforming loans also include certain loans whose terms have been restructured in a manner that grants a concession to a borrowerexperiencing financial difficulties. In accordance with applicable accounting guidance, these loans are considered TDRs. See Note 1Accounting Policies and the TDR section of this Note 4 for additional information on TDRs.
Total nonperforming loans in Table 48 include TDRs of $0.9 billion at both December 31, 2020 and 2019, respectively. TDRs that areperforming, including consumer credit card TDR loans, totaled $0.7 billion and $0.8 billion at December 31, 2020 and 2019 and areexcluded from nonperforming loans.
Additional Credit Quality Indicators by Loan Class
Commercial and IndustrialFor commercial and industrial loans, we monitor the performance of the borrower in a disciplined and regular manner based upon thelevel of credit risk inherent in the loan. To evaluate the level of credit risk, we assign an internal risk rating reflecting the borrower’sPD and LGD. This two-dimensional credit risk rating methodology provides granularity in the risk monitoring process. These ratings
124 The PNC Financial Services Group, Inc. – 2020 Form 10-K

are reviewed and updated, generally at least once per year. For small balance homogeneous pools of commercial and industrial loansand leases, we apply scoring techniques to assist in determining the PD. The combination of the PD and LGD ratings assigned tocommercial and industrial loans, capturing both the combination of expectations of default and loss severity in the event of default,reflects credit quality characteristics as of the reporting date and are used as inputs into our loss forecasting process.
Based upon the amount of the lending arrangement and our risk rating assessment, we follow a formal schedule of written periodicreviews. Quarterly, we conduct formal reviews of a market’s or business unit’s loan portfolio, focusing on those loans which weperceive to be of higher risk, based upon PDs and LGDs, or loans for which credit quality is weakening. If circumstances warrant, it isour practice to review any customer obligation and its level of credit risk more frequently. We attempt to proactively manage our loansby using various procedures that are customized to the risk of a given loan, including ongoing outreach, contact, and assessment ofobligor financial conditions, collateral inspection and appraisal.
Commercial Real EstateWe manage credit risk associated with our commercial real estate projects and commercial mortgages similar to commercial andindustrial loans by evaluating PD and LGD. Risks associated with commercial real estate projects and commercial mortgage activitiestend to be correlated to the loan structure and collateral location, project progress and business environment. As a result, theseattributes are also monitored and utilized in assessing credit risk.
As with the commercial and industrial loan class, a formal schedule of periodic reviews is also performed to assess market/geographicrisk and business unit/industry risk. Often as a result of these overviews, more in-depth reviews and increased scrutiny are placed onareas of higher risk, such as adverse changes in risk ratings, deteriorating operating trends, and/or areas that concern management.These reviews are designed to assess risk and facilitate actions to mitigate such risks.
Equipment Lease FinancingWe manage credit risk associated with our equipment lease financing loan class similar to commercial and industrial loans byanalyzing PD and LGD.
Based upon the dollar amount of the lease and the level of credit risk, we follow a formal schedule of periodic reviews. Generally, thisoccurs quarterly, although we have established practices to review such credit risk more frequently if circumstances warrant. Ourreview process entails analysis of the following factors: equipment value/residual value, exposure levels, jurisdiction risk, industryrisk, guarantor requirements, and regulatory compliance as applicable.
The PNC Financial Services Group, Inc. – 2020 Form 10-K 125
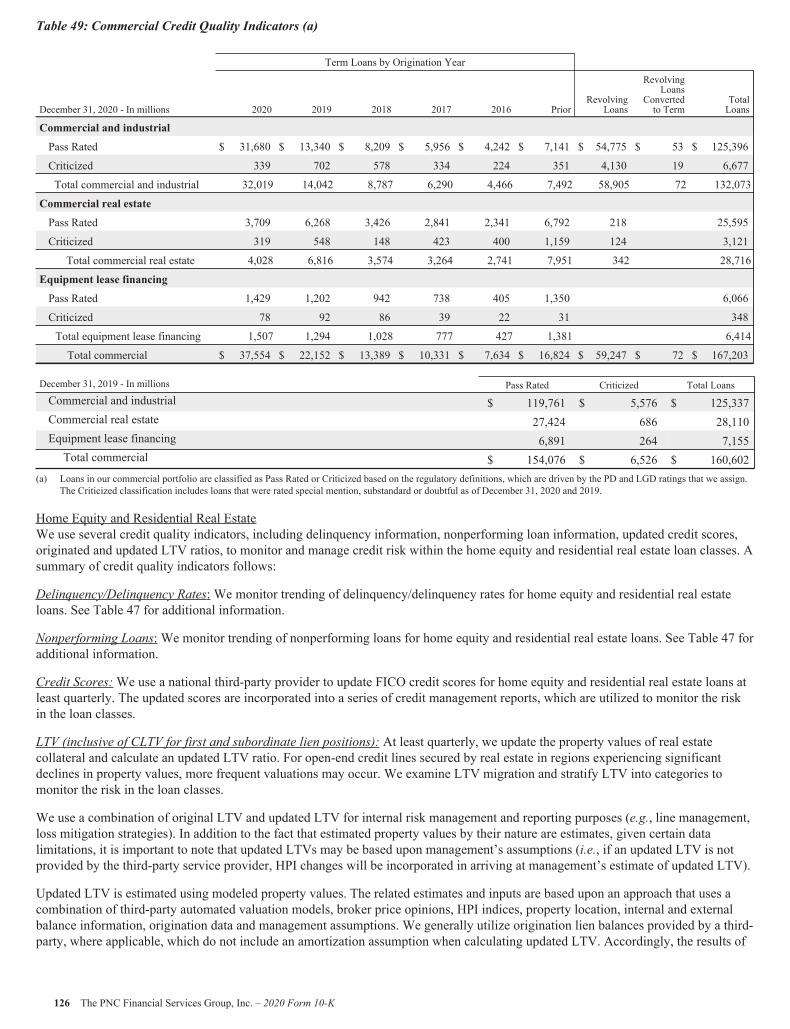
Table 49: Commercial Credit Quality Indicators (a)
Term Loans by Origination Year
December 31, 2020 - In millions 2020 2019 2018 2017 2016 PriorRevolving
Loans
RevolvingLoans
Convertedto Term
TotalLoans
Commercial and industrial
Pass Rated $ 31,680 $ 13,340 $ 8,209 $ 5,956 $ 4,242 $ 7,141 $ 54,775 $ 53 $ 125,396
Criticized 339 702 578 334 224 351 4,130 19 6,677
Total commercial and industrial 32,019 14,042 8,787 6,290 4,466 7,492 58,905 72 132,073
Commercial real estate
Pass Rated 3,709 6,268 3,426 2,841 2,341 6,792 218 25,595
Criticized 319 548 148 423 400 1,159 124 3,121
Total commercial real estate 4,028 6,816 3,574 3,264 2,741 7,951 342 28,716
Equipment lease financing
Pass Rated 1,429 1,202 942 738 405 1,350 6,066
Criticized 78 92 86 39 22 31 348
Total equipment lease financing 1,507 1,294 1,028 777 427 1,381 6,414
Total commercial $ 37,554 $ 22,152 $ 13,389 $ 10,331 $ 7,634 $ 16,824 $ 59,247 $ 72 $ 167,203
December 31, 2019 - In millions Pass Rated Criticized Total LoansCommercial and industrial $ 119,761 $ 5,576 $ 125,337Commercial real estate 27,424 686 28,110Equipment lease financing 6,891 264 7,155Total commercial $ 154,076 $ 6,526 $ 160,602
(a) Loans in our commercial portfolio are classified as Pass Rated or Criticized based on the regulatory definitions, which are driven by the PD and LGD ratings that we assign.The Criticized classification includes loans that were rated special mention, substandard or doubtful as of December 31, 2020 and 2019.
Home Equity and Residential Real EstateWe use several credit quality indicators, including delinquency information, nonperforming loan information, updated credit scores,originated and updated LTV ratios, to monitor and manage credit risk within the home equity and residential real estate loan classes. Asummary of credit quality indicators follows:
Delinquency/Delinquency Rates: We monitor trending of delinquency/delinquency rates for home equity and residential real estateloans. See Table 47 for additional information.
Nonperforming Loans: We monitor trending of nonperforming loans for home equity and residential real estate loans. See Table 47 foradditional information.
Credit Scores:We use a national third-party provider to update FICO credit scores for home equity and residential real estate loans atleast quarterly. The updated scores are incorporated into a series of credit management reports, which are utilized to monitor the riskin the loan classes.
LTV (inclusive of CLTV for first and subordinate lien positions): At least quarterly, we update the property values of real estatecollateral and calculate an updated LTV ratio. For open-end credit lines secured by real estate in regions experiencing significantdeclines in property values, more frequent valuations may occur. We examine LTV migration and stratify LTV into categories tomonitor the risk in the loan classes.
We use a combination of original LTV and updated LTV for internal risk management and reporting purposes (e.g., line management,loss mitigation strategies). In addition to the fact that estimated property values by their nature are estimates, given certain datalimitations, it is important to note that updated LTVs may be based upon management’s assumptions (i.e., if an updated LTV is notprovided by the third-party service provider, HPI changes will be incorporated in arriving at management’s estimate of updated LTV).
Updated LTV is estimated using modeled property values. The related estimates and inputs are based upon an approach that uses acombination of third-party automated valuation models, broker price opinions, HPI indices, property location, internal and externalbalance information, origination data and management assumptions. We generally utilize origination lien balances provided by a third-party, where applicable, which do not include an amortization assumption when calculating updated LTV. Accordingly, the results of
126 The PNC Financial Services Group, Inc. – 2020 Form 10-K
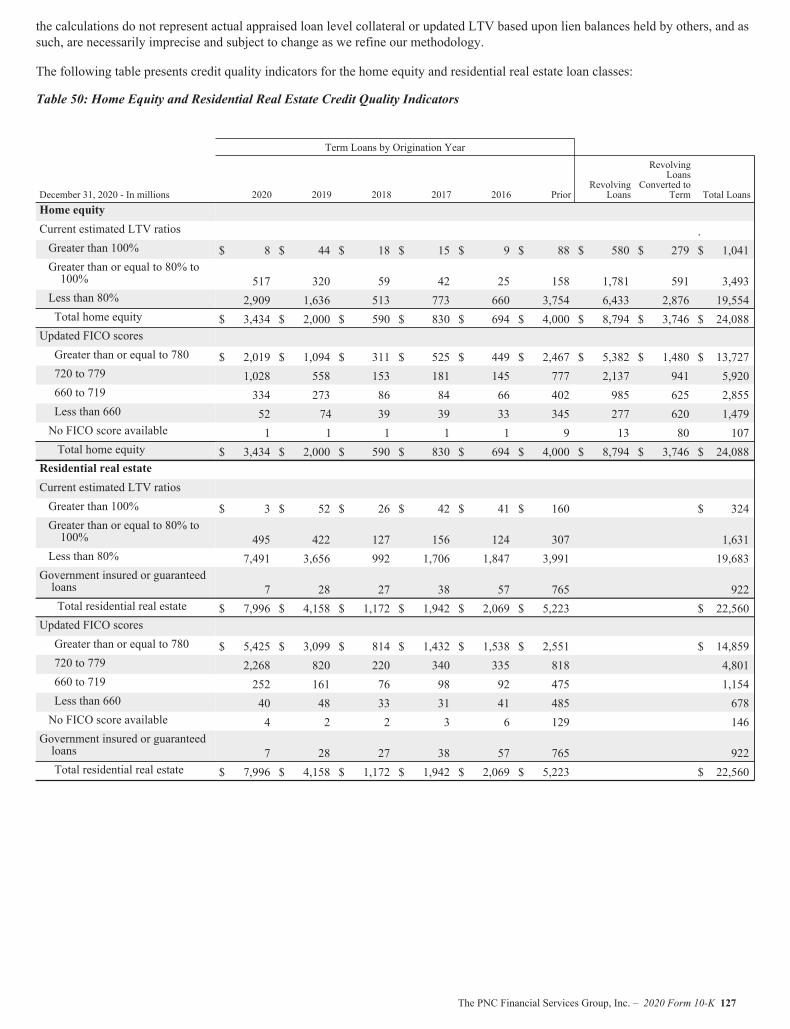
the calculations do not represent actual appraised loan level collateral or updated LTV based upon lien balances held by others, and assuch, are necessarily imprecise and subject to change as we refine our methodology.
The following table presents credit quality indicators for the home equity and residential real estate loan classes:
Table 50: Home Equity and Residential Real Estate Credit Quality Indicators
Term Loans by Origination Year
December 31, 2020 - In millions 2020 2019 2018 2017 2016 PriorRevolving
Loans
RevolvingLoans
Converted toTerm Total Loans
Home equityCurrent estimated LTV ratios .Greater than 100% $ 8 $ 44 $ 18 $ 15 $ 9 $ 88 $ 580 $ 279 $ 1,041Greater than or equal to 80% to100% 517 320 59 42 25 158 1,781 591 3,493
Less than 80% 2,909 1,636 513 773 660 3,754 6,433 2,876 19,554Total home equity $ 3,434 $ 2,000 $ 590 $ 830 $ 694 $ 4,000 $ 8,794 $ 3,746 $ 24,088
Updated FICO scoresGreater than or equal to 780 $ 2,019 $ 1,094 $ 311 $ 525 $ 449 $ 2,467 $ 5,382 $ 1,480 $ 13,727720 to 779 1,028 558 153 181 145 777 2,137 941 5,920660 to 719 334 273 86 84 66 402 985 625 2,855Less than 660 52 74 39 39 33 345 277 620 1,479No FICO score available 1 1 1 1 1 9 13 80 107Total home equity $ 3,434 $ 2,000 $ 590 $ 830 $ 694 $ 4,000 $ 8,794 $ 3,746 $ 24,088
Residential real estateCurrent estimated LTV ratiosGreater than 100% $ 3 $ 52 $ 26 $ 42 $ 41 $ 160 $ 324Greater than or equal to 80% to100% 495 422 127 156 124 307 1,631
Less than 80% 7,491 3,656 992 1,706 1,847 3,991 19,683Government insured or guaranteedloans 7 28 27 38 57 765 922Total residential real estate $ 7,996 $ 4,158 $ 1,172 $ 1,942 $ 2,069 $ 5,223 $ 22,560
Updated FICO scoresGreater than or equal to 780 $ 5,425 $ 3,099 $ 814 $ 1,432 $ 1,538 $ 2,551 $ 14,859720 to 779 2,268 820 220 340 335 818 4,801660 to 719 252 161 76 98 92 475 1,154Less than 660 40 48 33 31 41 485 678No FICO score available 4 2 2 3 6 129 146Government insured or guaranteedloans 7 28 27 38 57 765 922Total residential real estate $ 7,996 $ 4,158 $ 1,172 $ 1,942 $ 2,069 $ 5,223 $ 22,560
The PNC Financial Services Group, Inc. – 2020 Form 10-K 127
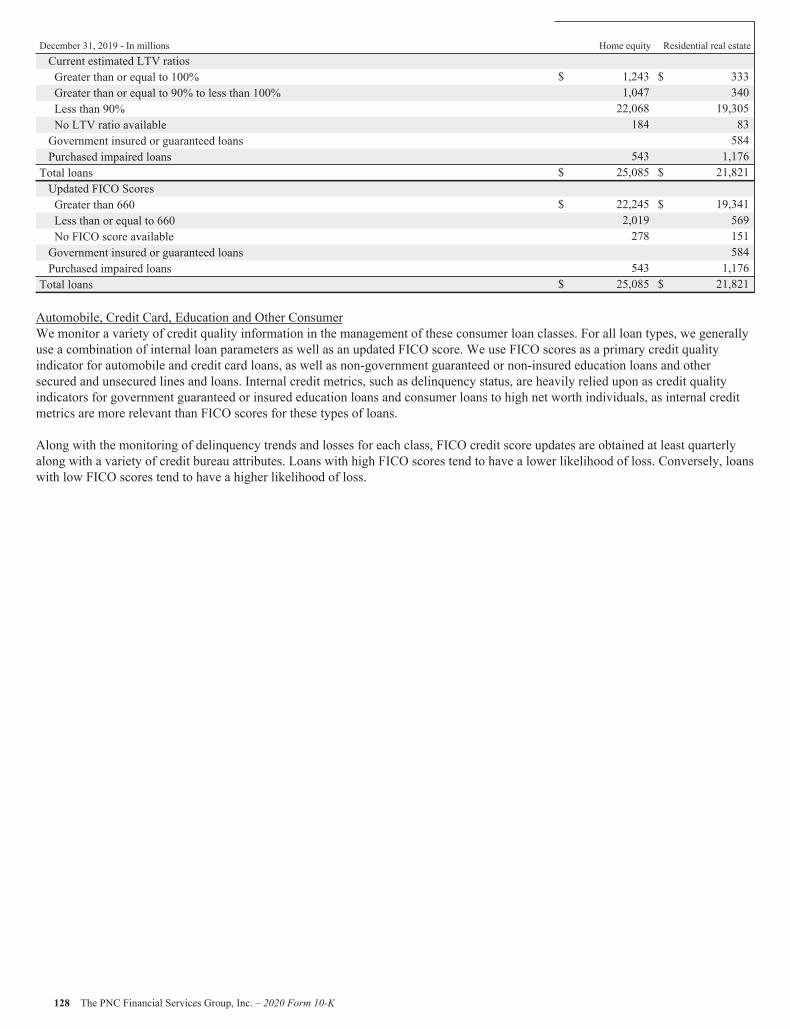
Home equity Residential real estateDecember 31, 2019 - In millionsCurrent estimated LTV ratiosGreater than or equal to 100% $ 1,243 $ 333Greater than or equal to 90% to less than 100% 1,047 340Less than 90% 22,068 19,305No LTV ratio available 184 83Government insured or guaranteed loans 584Purchased impaired loans 543 1,176Total loans $ 25,085 $ 21,821Updated FICO ScoresGreater than 660 $ 22,245 $ 19,341Less than or equal to 660 2,019 569No FICO score available 278 151Government insured or guaranteed loans 584Purchased impaired loans 543 1,176Total loans $ 25,085 $ 21,821
Automobile, Credit Card, Education and Other ConsumerWe monitor a variety of credit quality information in the management of these consumer loan classes. For all loan types, we generallyuse a combination of internal loan parameters as well as an updated FICO score. We use FICO scores as a primary credit qualityindicator for automobile and credit card loans, as well as non-government guaranteed or non-insured education loans and othersecured and unsecured lines and loans. Internal credit metrics, such as delinquency status, are heavily relied upon as credit qualityindicators for government guaranteed or insured education loans and consumer loans to high net worth individuals, as internal creditmetrics are more relevant than FICO scores for these types of loans.
Along with the monitoring of delinquency trends and losses for each class, FICO credit score updates are obtained at least quarterlyalong with a variety of credit bureau attributes. Loans with high FICO scores tend to have a lower likelihood of loss. Conversely, loanswith low FICO scores tend to have a higher likelihood of loss.
128 The PNC Financial Services Group, Inc. – 2020 Form 10-K
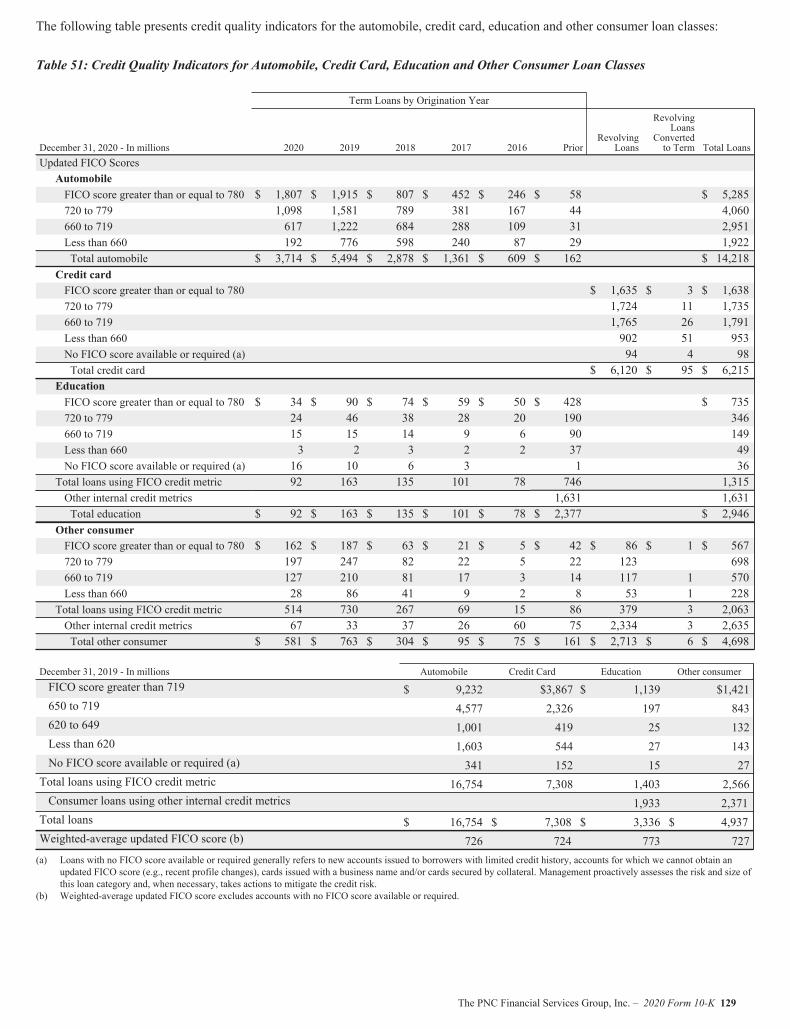
The following table presents credit quality indicators for the automobile, credit card, education and other consumer loan classes:
Table 51: Credit Quality Indicators for Automobile, Credit Card, Education and Other Consumer Loan Classes
Term Loans by Origination Year
December 31, 2020 - In millions 2020 2019 2018 2017 2016 PriorRevolving
Loans
RevolvingLoans
Convertedto Term Total Loans
Updated FICO ScoresAutomobileFICO score greater than or equal to 780 $ 1,807 $ 1,915 $ 807 $ 452 $ 246 $ 58 $ 5,285720 to 779 1,098 1,581 789 381 167 44 4,060660 to 719 617 1,222 684 288 109 31 2,951Less than 660 192 776 598 240 87 29 1,922Total automobile $ 3,714 $ 5,494 $ 2,878 $ 1,361 $ 609 $ 162 $ 14,218
Credit cardFICO score greater than or equal to 780 $ 1,635 $ 3 $ 1,638720 to 779 1,724 11 1,735660 to 719 1,765 26 1,791Less than 660 902 51 953No FICO score available or required (a) 94 4 98Total credit card $ 6,120 $ 95 $ 6,215
EducationFICO score greater than or equal to 780 $ 34 $ 90 $ 74 $ 59 $ 50 $ 428 $ 735720 to 779 24 46 38 28 20 190 346660 to 719 15 15 14 9 6 90 149Less than 660 3 2 3 2 2 37 49No FICO score available or required (a) 16 10 6 3 1 36
Total loans using FICO credit metric 92 163 135 101 78 746 1,315Other internal credit metrics 1,631 1,631Total education $ 92 $ 163 $ 135 $ 101 $ 78 $ 2,377 $ 2,946
Other consumerFICO score greater than or equal to 780 $ 162 $ 187 $ 63 $ 21 $ 5 $ 42 $ 86 $ 1 $ 567720 to 779 197 247 82 22 5 22 123 698660 to 719 127 210 81 17 3 14 117 1 570Less than 660 28 86 41 9 2 8 53 1 228
Total loans using FICO credit metric 514 730 267 69 15 86 379 3 2,063Other internal credit metrics 67 33 37 26 60 75 2,334 3 2,635Total other consumer $ 581 $ 763 $ 304 $ 95 $ 75 $ 161 $ 2,713 $ 6 $ 4,698
December 31, 2019 - In millions Automobile Credit Card Education Other consumerFICO score greater than 719 $ 9,232 $3,867 $ 1,139 $1,421650 to 719 4,577 2,326 197 843620 to 649 1,001 419 25 132Less than 620 1,603 544 27 143No FICO score available or required (a) 341 152 15 27Total loans using FICO credit metric 16,754 7,308 1,403 2,566Consumer loans using other internal credit metrics 1,933 2,371Total loans $ 16,754 $ 7,308 $ 3,336 $ 4,937Weighted-average updated FICO score (b) 726 724 773 727(a) Loans with no FICO score available or required generally refers to new accounts issued to borrowers with limited credit history, accounts for which we cannot obtain an
updated FICO score (e.g., recent profile changes), cards issued with a business name and/or cards secured by collateral. Management proactively assesses the risk and size ofthis loan category and, when necessary, takes actions to mitigate the credit risk.
(b) Weighted-average updated FICO score excludes accounts with no FICO score available or required.
The PNC Financial Services Group, Inc. – 2020 Form 10-K 129
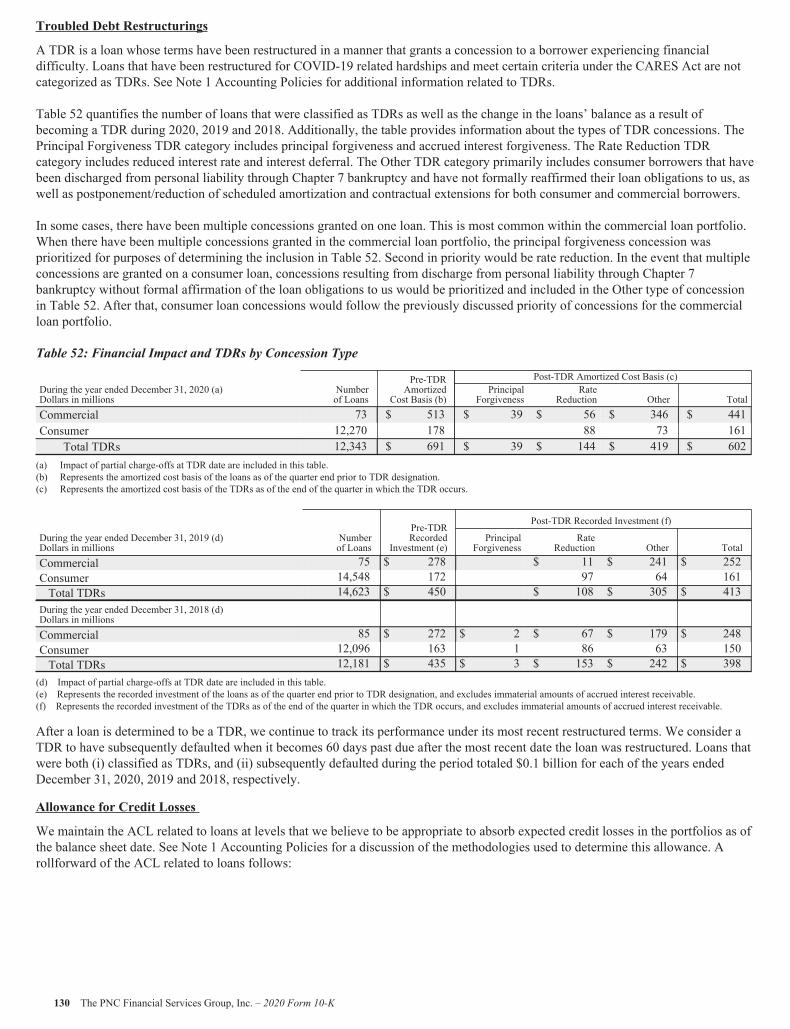
Troubled Debt Restructurings
A TDR is a loan whose terms have been restructured in a manner that grants a concession to a borrower experiencing financialdifficulty. Loans that have been restructured for COVID-19 related hardships and meet certain criteria under the CARES Act are notcategorized as TDRs. See Note 1 Accounting Policies for additional information related to TDRs.
Table 52 quantifies the number of loans that were classified as TDRs as well as the change in the loans’ balance as a result ofbecoming a TDR during 2020, 2019 and 2018. Additionally, the table provides information about the types of TDR concessions. ThePrincipal Forgiveness TDR category includes principal forgiveness and accrued interest forgiveness. The Rate Reduction TDRcategory includes reduced interest rate and interest deferral. The Other TDR category primarily includes consumer borrowers that havebeen discharged from personal liability through Chapter 7 bankruptcy and have not formally reaffirmed their loan obligations to us, aswell as postponement/reduction of scheduled amortization and contractual extensions for both consumer and commercial borrowers.
In some cases, there have been multiple concessions granted on one loan. This is most common within the commercial loan portfolio.When there have been multiple concessions granted in the commercial loan portfolio, the principal forgiveness concession wasprioritized for purposes of determining the inclusion in Table 52. Second in priority would be rate reduction. In the event that multipleconcessions are granted on a consumer loan, concessions resulting from discharge from personal liability through Chapter 7bankruptcy without formal affirmation of the loan obligations to us would be prioritized and included in the Other type of concessionin Table 52. After that, consumer loan concessions would follow the previously discussed priority of concessions for the commercialloan portfolio.
Table 52: Financial Impact and TDRs by Concession Type
Numberof Loans
Pre-TDRAmortized
Cost Basis (b)
Post-TDR Amortized Cost Basis (c)During the year ended December 31, 2020 (a)Dollars in millions
PrincipalForgiveness
RateReduction Other Total
Commercial 73 $ 513 $ 39 $ 56 $ 346 $ 441Consumer 12,270 178 88 73 161
Total TDRs 12,343 $ 691 $ 39 $ 144 $ 419 $ 602(a) Impact of partial charge-offs at TDR date are included in this table.(b) Represents the amortized cost basis of the loans as of the quarter end prior to TDR designation.(c) Represents the amortized cost basis of the TDRs as of the end of the quarter in which the TDR occurs.
Pre-TDRRecorded
Investment (e)
Post-TDR Recorded Investment (f)
During the year ended December 31, 2019 (d)Dollars in millions
Numberof Loans
PrincipalForgiveness
RateReduction Other Total
Commercial 75 $ 278 $ 11 $ 241 $ 252Consumer 14,548 172 97 64 161Total TDRs 14,623 $ 450 $ 108 $ 305 $ 413
During the year ended December 31, 2018 (d)Dollars in millionsCommercial 85 $ 272 $ 2 $ 67 $ 179 $ 248Consumer 12,096 163 1 86 63 150Total TDRs 12,181 $ 435 $ 3 $ 153 $ 242 $ 398
(d) Impact of partial charge-offs at TDR date are included in this table.(e) Represents the recorded investment of the loans as of the quarter end prior to TDR designation, and excludes immaterial amounts of accrued interest receivable.(f) Represents the recorded investment of the TDRs as of the end of the quarter in which the TDR occurs, and excludes immaterial amounts of accrued interest receivable.
After a loan is determined to be a TDR, we continue to track its performance under its most recent restructured terms. We consider aTDR to have subsequently defaulted when it becomes 60 days past due after the most recent date the loan was restructured. Loans thatwere both (i) classified as TDRs, and (ii) subsequently defaulted during the period totaled $0.1 billion for each of the years endedDecember 31, 2020, 2019 and 2018, respectively.
Allowance for Credit Losses
We maintain the ACL related to loans at levels that we believe to be appropriate to absorb expected credit losses in the portfolios as ofthe balance sheet date. See Note 1 Accounting Policies for a discussion of the methodologies used to determine this allowance. Arollforward of the ACL related to loans follows:
130 The PNC Financial Services Group, Inc. – 2020 Form 10-K
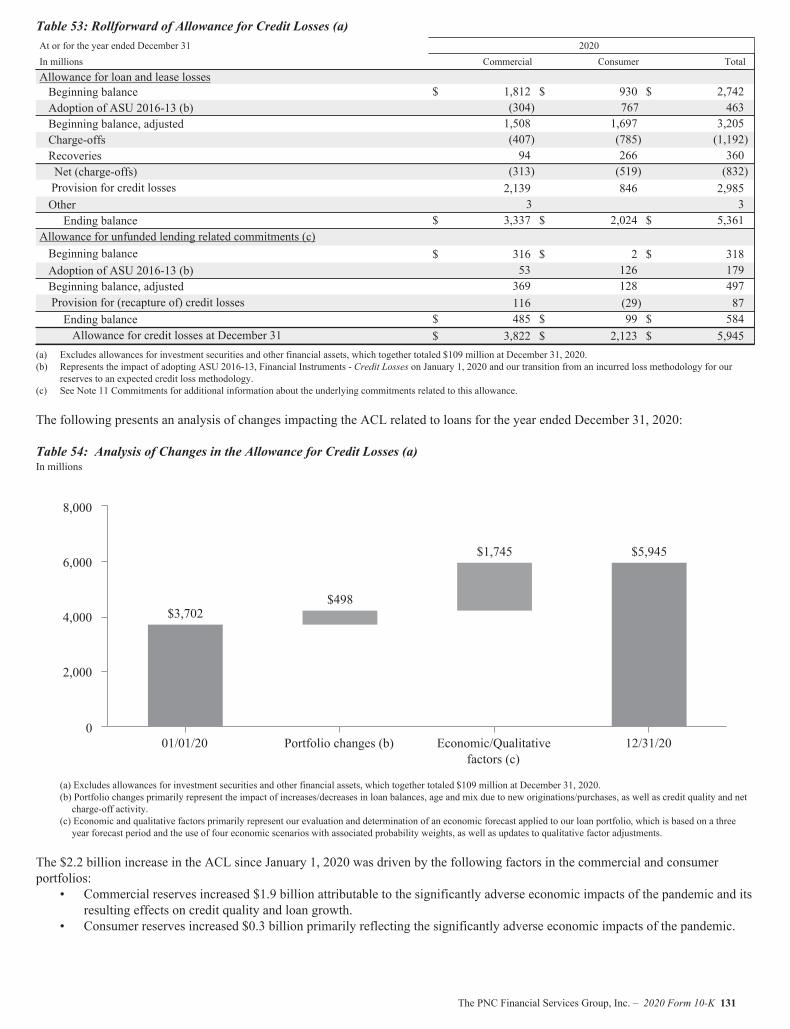
Table 53: Rollforward of Allowance for Credit Losses (a)At or for the year ended December 31 2020In millions Commercial Consumer TotalAllowance for loan and lease lossesBeginning balance $ 1,812 $ 930 $ 2,742Adoption of ASU 2016-13 (b) (304) 767 463Beginning balance, adjusted 1,508 1,697 3,205Charge-offs (407) (785) (1,192)Recoveries 94 266 360Net (charge-offs) (313) (519) (832)Provision for credit losses 2,139 846 2,985Other 3 3Ending balance $ 3,337 $ 2,024 $ 5,361
Allowance for unfunded lending related commitments (c)Beginning balance $ 316 $ 2 $ 318Adoption of ASU 2016-13 (b) 53 126 179Beginning balance, adjusted 369 128 497Provision for (recapture of) credit losses 116 (29) 87Ending balance $ 485 $ 99 $ 584Allowance for credit losses at December 31 $ 3,822 $ 2,123 $ 5,945
(a) Excludes allowances for investment securities and other financial assets, which together totaled $109 million at December 31, 2020.(b) Represents the impact of adopting ASU 2016-13, Financial Instruments - Credit Losses on January 1, 2020 and our transition from an incurred loss methodology for our
reserves to an expected credit loss methodology.(c) See Note 11 Commitments for additional information about the underlying commitments related to this allowance.
The following presents an analysis of changes impacting the ACL related to loans for the year ended December 31, 2020:
Table 54: Analysis of Changes in the Allowance for Credit Losses (a)In millions
$3,702$498
$1,745 $5,945
01/01/20 Portfolio changes (b) Economic/Qualitativefactors (c)
12/31/200
2,000
4,000
6,000
8,000
(a) Excludes allowances for investment securities and other financial assets, which together totaled $109 million at December 31, 2020.(b) Portfolio changes primarily represent the impact of increases/decreases in loan balances, age and mix due to new originations/purchases, as well as credit quality and netcharge-off activity.
(c) Economic and qualitative factors primarily represent our evaluation and determination of an economic forecast applied to our loan portfolio, which is based on a threeyear forecast period and the use of four economic scenarios with associated probability weights, as well as updates to qualitative factor adjustments.
The $2.2 billion increase in the ACL since January 1, 2020 was driven by the following factors in the commercial and consumerportfolios:
• Commercial reserves increased $1.9 billion attributable to the significantly adverse economic impacts of the pandemic and itsresulting effects on credit quality and loan growth.
• Consumer reserves increased $0.3 billion primarily reflecting the significantly adverse economic impacts of the pandemic.
The PNC Financial Services Group, Inc. – 2020 Form 10-K 131
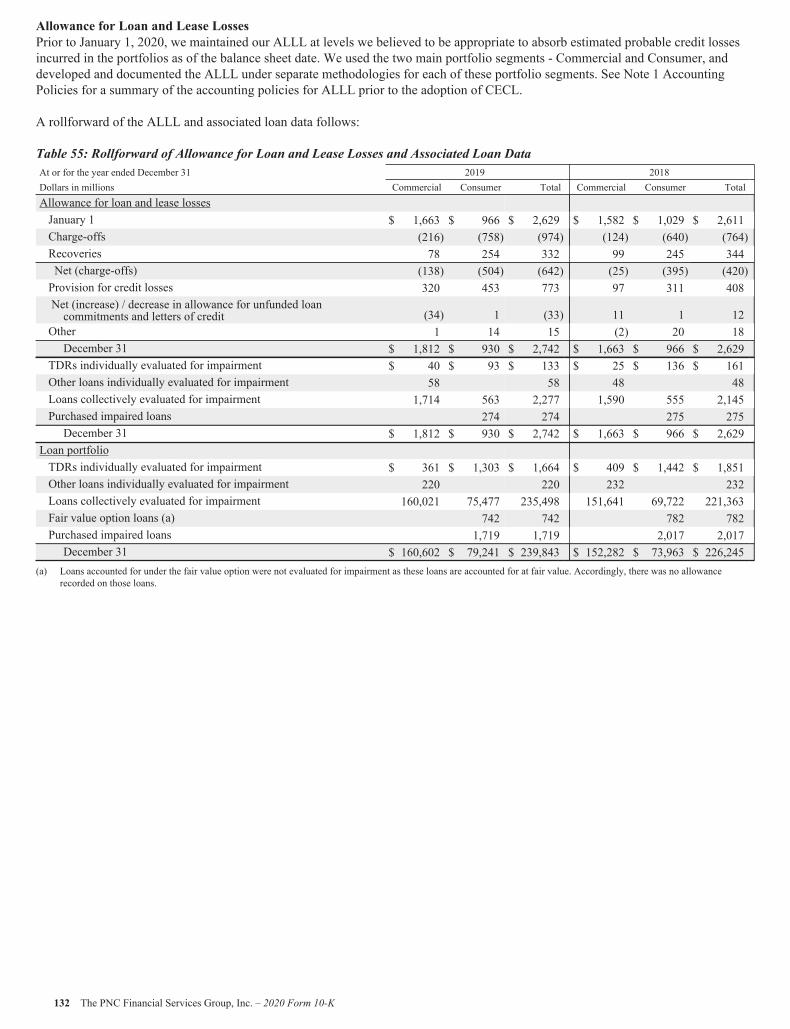
Allowance for Loan and Lease LossesPrior to January 1, 2020, we maintained our ALLL at levels we believed to be appropriate to absorb estimated probable credit lossesincurred in the portfolios as of the balance sheet date. We used the two main portfolio segments - Commercial and Consumer, anddeveloped and documented the ALLL under separate methodologies for each of these portfolio segments. See Note 1 AccountingPolicies for a summary of the accounting policies for ALLL prior to the adoption of CECL.
A rollforward of the ALLL and associated loan data follows:
Table 55: Rollforward of Allowance for Loan and Lease Losses and Associated Loan DataAt or for the year ended December 31 2019 2018Dollars in millions Commercial Consumer Total Commercial Consumer TotalAllowance for loan and lease lossesJanuary 1 $ 1,663 $ 966 $ 2,629 $ 1,582 $ 1,029 $ 2,611Charge-offs (216) (758) (974) (124) (640) (764)Recoveries 78 254 332 99 245 344Net (charge-offs) (138) (504) (642) (25) (395) (420)Provision for credit losses 320 453 773 97 311 408Net (increase) / decrease in allowance for unfunded loancommitments and letters of credit (34) 1 (33) 11 1 12
Other 1 14 15 (2) 20 18December 31 $ 1,812 $ 930 $ 2,742 $ 1,663 $ 966 $ 2,629
TDRs individually evaluated for impairment $ 40 $ 93 $ 133 $ 25 $ 136 $ 161Other loans individually evaluated for impairment 58 58 48 48Loans collectively evaluated for impairment 1,714 563 2,277 1,590 555 2,145Purchased impaired loans 274 274 275 275December 31 $ 1,812 $ 930 $ 2,742 $ 1,663 $ 966 $ 2,629
Loan portfolioTDRs individually evaluated for impairment $ 361 $ 1,303 $ 1,664 $ 409 $ 1,442 $ 1,851Other loans individually evaluated for impairment 220 220 232 232Loans collectively evaluated for impairment 160,021 75,477 235,498 151,641 69,722 221,363Fair value option loans (a) 742 742 782 782Purchased impaired loans 1,719 1,719 2,017 2,017December 31 $ 160,602 $ 79,241 $ 239,843 $ 152,282 $ 73,963 $ 226,245
(a) Loans accounted for under the fair value option were not evaluated for impairment as these loans are accounted for at fair value. Accordingly, there was no allowancerecorded on those loans.
132 The PNC Financial Services Group, Inc. – 2020 Form 10-K
NOTE 5 LOAN SALE AND SERVICING ACTIVITIES AND VARIABLE INTEREST ENTITIESLoan Sale and Servicing Activities
We have transferred residential and commercial mortgage loans in securitization or sales transactions in which we have continuinginvolvement. These transfers have occurred through Agency securitization, Non-agency securitization, and loan sale transactions.Agency securitizations consist of securitization transactions with FNMA, FHLMC and GNMA (collectively, the Agencies). FNMAand FHLMC generally securitize our transferred loans into mortgage-backed securities for sale into the secondary market throughSPEs that they sponsor. As an authorized GNMA issuer/servicer, we pool FHA and Department of VA insured loans into mortgage-backed securities for sale into the secondary market. In Non-agency securitizations, we have transferred loans into securitization SPEs.In other instances, third-party investors have also purchased our loans in loan sale transactions and in certain instances havesubsequently sold these loans into securitization SPEs. Securitization SPEs utilized in the Agency and Non-agency securitizationtransactions are VIEs.
Our continuing involvement in the FNMA, FHLMC, and GNMA securitizations, Non-agency securitizations, and loan saletransactions generally consists of servicing, repurchasing previously transferred loans under certain conditions and loss sharearrangements, and, in limited circumstances, holding of mortgage-backed securities issued by the securitization SPEs.
Depending on the transaction, we may act as the master, primary and/or special servicer to the securitization SPEs or third-partyinvestors. Servicing responsibilities typically consist of collecting and remitting monthly borrower principal and interest payments,maintaining escrow deposits, performing loss mitigation and foreclosure activities, and, in certain instances, funding of servicingadvances. Servicing advances, which are generally reimbursable, are made for principal and interest and collateral protection and arecarried in Other assets at cost.
We earn servicing and other ancillary fees for our role as servicer and, depending on the contractual terms of the servicingarrangement, we can be terminated as servicer with or without cause. At the consummation date of each type of loan transfer where weretain the servicing, we recognize a servicing right at fair value. See Note 6 Goodwill and Mortgage Servicing Rights and Note 15 FairValue for further discussion of our servicing rights.
Certain loans transferred to the Agencies contain ROAPs. Under these ROAPs, we hold an option to repurchase at par individualdelinquent loans that meet certain criteria. In other limited cases, GNMA has granted us the right to repurchase current loans when weintend to modify the borrower’s interest rate under established guidelines. When we have the unilateral ability to repurchase a loan,effective control over the loan has been regained and we recognize an asset (in either Loans or Loans held for sale) and acorresponding liability (in Other borrowed funds) on the balance sheet regardless of our intent to repurchase the loan.
The Agency and Non-agency mortgage-backed securities issued by the securitization SPEs that are purchased and held on our balancesheet are typically purchased in the secondary market. We do not retain any credit risk on our Agency mortgage-backed securitypositions as FNMA, FHLMC and the U.S. Government (for GNMA) guarantee losses of principal and interest.
We also have involvement with certain Agency and Non-agency commercial securitization SPEs where we have not transferredcommercial mortgage loans. These SPEs were sponsored by independent third-parties and the loans held by these entities werepurchased exclusively from other third-parties. Generally, our involvement with these SPEs is as servicer with servicing activitiesconsistent with those described above.
We recognize a liability for our loss exposure associated with contractual obligations to repurchase previously transferred loans due topossible breaches of representations and warranties and also for loss sharing arrangements (recourse obligations) with the Agencies.Other than providing temporary liquidity under servicing advances and our loss exposure associated with our repurchase and recourseobligations, we have not provided nor are we required to provide any type of credit support, guarantees or commitments to thesecuritization SPEs or third-party investors in these transactions.
The PNC Financial Services Group, Inc. – 2020 Form 10-K 133
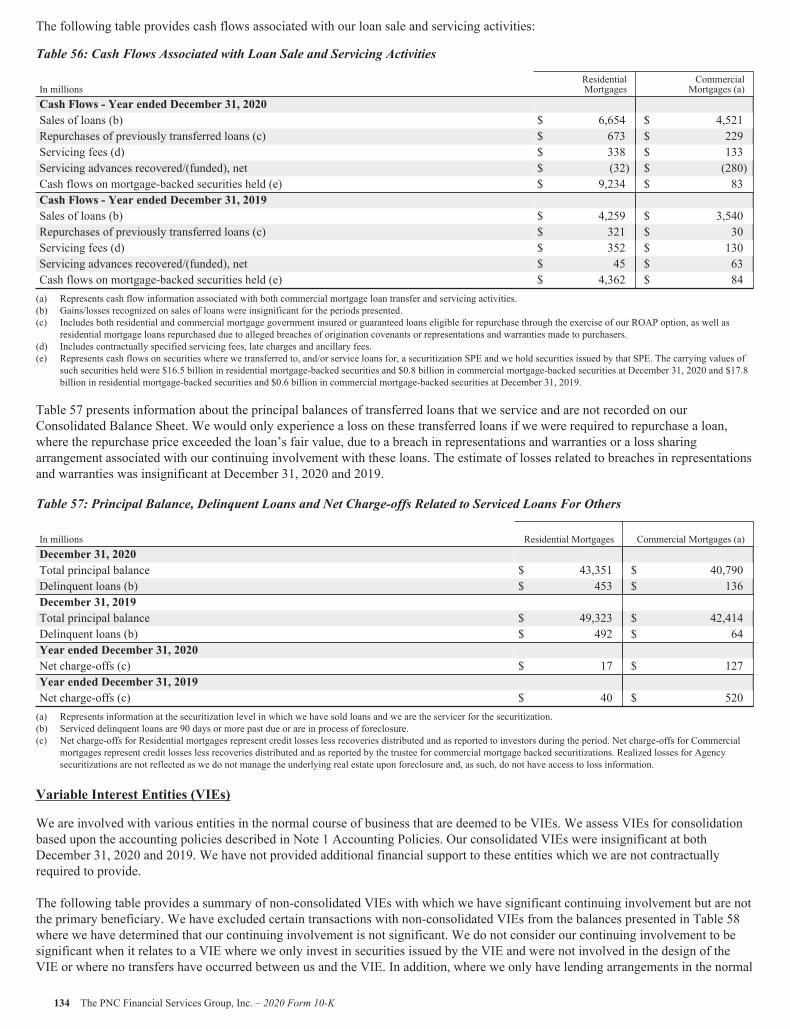
The following table provides cash flows associated with our loan sale and servicing activities:
Table 56: Cash Flows Associated with Loan Sale and Servicing Activities
In millionsResidentialMortgages
CommercialMortgages (a)
Cash Flows - Year ended December 31, 2020Sales of loans (b) $ 6,654 $ 4,521Repurchases of previously transferred loans (c) $ 673 $ 229Servicing fees (d) $ 338 $ 133Servicing advances recovered/(funded), net $ (32) $ (280)Cash flows on mortgage-backed securities held (e) $ 9,234 $ 83Cash Flows - Year ended December 31, 2019Sales of loans (b) $ 4,259 $ 3,540Repurchases of previously transferred loans (c) $ 321 $ 30Servicing fees (d) $ 352 $ 130Servicing advances recovered/(funded), net $ 45 $ 63Cash flows on mortgage-backed securities held (e) $ 4,362 $ 84(a) Represents cash flow information associated with both commercial mortgage loan transfer and servicing activities.(b) Gains/losses recognized on sales of loans were insignificant for the periods presented.(c) Includes both residential and commercial mortgage government insured or guaranteed loans eligible for repurchase through the exercise of our ROAP option, as well as
residential mortgage loans repurchased due to alleged breaches of origination covenants or representations and warranties made to purchasers.(d) Includes contractually specified servicing fees, late charges and ancillary fees.(e) Represents cash flows on securities where we transferred to, and/or service loans for, a securitization SPE and we hold securities issued by that SPE. The carrying values of
such securities held were $16.5 billion in residential mortgage-backed securities and $0.8 billion in commercial mortgage-backed securities at December 31, 2020 and $17.8billion in residential mortgage-backed securities and $0.6 billion in commercial mortgage-backed securities at December 31, 2019.
Table 57 presents information about the principal balances of transferred loans that we service and are not recorded on ourConsolidated Balance Sheet. We would only experience a loss on these transferred loans if we were required to repurchase a loan,where the repurchase price exceeded the loan’s fair value, due to a breach in representations and warranties or a loss sharingarrangement associated with our continuing involvement with these loans. The estimate of losses related to breaches in representationsand warranties was insignificant at December 31, 2020 and 2019.
Table 57: Principal Balance, Delinquent Loans and Net Charge-offs Related to Serviced Loans For Others
In millions Residential Mortgages Commercial Mortgages (a)December 31, 2020Total principal balance $ 43,351 $ 40,790Delinquent loans (b) $ 453 $ 136December 31, 2019Total principal balance $ 49,323 $ 42,414Delinquent loans (b) $ 492 $ 64Year ended December 31, 2020Net charge-offs (c) $ 17 $ 127Year ended December 31, 2019Net charge-offs (c) $ 40 $ 520(a) Represents information at the securitization level in which we have sold loans and we are the servicer for the securitization.(b) Serviced delinquent loans are 90 days or more past due or are in process of foreclosure.(c) Net charge-offs for Residential mortgages represent credit losses less recoveries distributed and as reported to investors during the period. Net charge-offs for Commercial
mortgages represent credit losses less recoveries distributed and as reported by the trustee for commercial mortgage backed securitizations. Realized losses for Agencysecuritizations are not reflected as we do not manage the underlying real estate upon foreclosure and, as such, do not have access to loss information.
Variable Interest Entities (VIEs)
We are involved with various entities in the normal course of business that are deemed to be VIEs. We assess VIEs for consolidationbased upon the accounting policies described in Note 1 Accounting Policies. Our consolidated VIEs were insignificant at bothDecember 31, 2020 and 2019. We have not provided additional financial support to these entities which we are not contractuallyrequired to provide.
The following table provides a summary of non-consolidated VIEs with which we have significant continuing involvement but are notthe primary beneficiary. We have excluded certain transactions with non-consolidated VIEs from the balances presented in Table 58where we have determined that our continuing involvement is not significant. We do not consider our continuing involvement to besignificant when it relates to a VIE where we only invest in securities issued by the VIE and were not involved in the design of theVIE or where no transfers have occurred between us and the VIE. In addition, where we only have lending arrangements in the normal
134 The PNC Financial Services Group, Inc. – 2020 Form 10-K
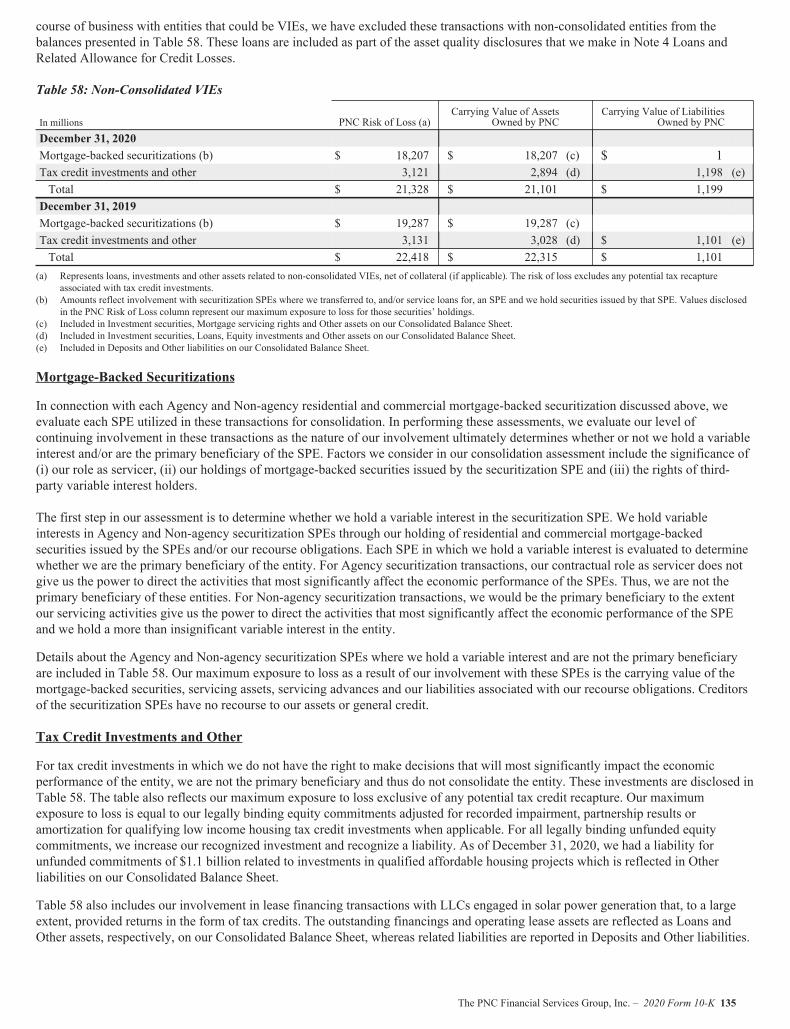
course of business with entities that could be VIEs, we have excluded these transactions with non-consolidated entities from thebalances presented in Table 58. These loans are included as part of the asset quality disclosures that we make in Note 4 Loans andRelated Allowance for Credit Losses.
Table 58: Non-Consolidated VIEs
In millions PNC Risk of Loss (a)Carrying Value of Assets
Owned by PNCCarrying Value of Liabilities
Owned by PNCDecember 31, 2020Mortgage-backed securitizations (b) $ 18,207 $ 18,207 (c) $ 1Tax credit investments and other 3,121 2,894 (d) 1,198 (e)Total $ 21,328 $ 21,101 $ 1,199December 31, 2019Mortgage-backed securitizations (b) $ 19,287 $ 19,287 (c)Tax credit investments and other 3,131 3,028 (d) $ 1,101 (e)Total $ 22,418 $ 22,315 $ 1,101
(a) Represents loans, investments and other assets related to non-consolidated VIEs, net of collateral (if applicable). The risk of loss excludes any potential tax recaptureassociated with tax credit investments.
(b) Amounts reflect involvement with securitization SPEs where we transferred to, and/or service loans for, an SPE and we hold securities issued by that SPE. Values disclosedin the PNC Risk of Loss column represent our maximum exposure to loss for those securities’ holdings.
(c) Included in Investment securities, Mortgage servicing rights and Other assets on our Consolidated Balance Sheet.(d) Included in Investment securities, Loans, Equity investments and Other assets on our Consolidated Balance Sheet.(e) Included in Deposits and Other liabilities on our Consolidated Balance Sheet.
Mortgage-Backed Securitizations
In connection with each Agency and Non-agency residential and commercial mortgage-backed securitization discussed above, weevaluate each SPE utilized in these transactions for consolidation. In performing these assessments, we evaluate our level ofcontinuing involvement in these transactions as the nature of our involvement ultimately determines whether or not we hold a variableinterest and/or are the primary beneficiary of the SPE. Factors we consider in our consolidation assessment include the significance of(i) our role as servicer, (ii) our holdings of mortgage-backed securities issued by the securitization SPE and (iii) the rights of third-party variable interest holders.
The first step in our assessment is to determine whether we hold a variable interest in the securitization SPE. We hold variableinterests in Agency and Non-agency securitization SPEs through our holding of residential and commercial mortgage-backedsecurities issued by the SPEs and/or our recourse obligations. Each SPE in which we hold a variable interest is evaluated to determinewhether we are the primary beneficiary of the entity. For Agency securitization transactions, our contractual role as servicer does notgive us the power to direct the activities that most significantly affect the economic performance of the SPEs. Thus, we are not theprimary beneficiary of these entities. For Non-agency securitization transactions, we would be the primary beneficiary to the extentour servicing activities give us the power to direct the activities that most significantly affect the economic performance of the SPEand we hold a more than insignificant variable interest in the entity.
Details about the Agency and Non-agency securitization SPEs where we hold a variable interest and are not the primary beneficiaryare included in Table 58. Our maximum exposure to loss as a result of our involvement with these SPEs is the carrying value of themortgage-backed securities, servicing assets, servicing advances and our liabilities associated with our recourse obligations. Creditorsof the securitization SPEs have no recourse to our assets or general credit.
Tax Credit Investments and Other
For tax credit investments in which we do not have the right to make decisions that will most significantly impact the economicperformance of the entity, we are not the primary beneficiary and thus do not consolidate the entity. These investments are disclosed inTable 58. The table also reflects our maximum exposure to loss exclusive of any potential tax credit recapture. Our maximumexposure to loss is equal to our legally binding equity commitments adjusted for recorded impairment, partnership results oramortization for qualifying low income housing tax credit investments when applicable. For all legally binding unfunded equitycommitments, we increase our recognized investment and recognize a liability. As of December 31, 2020, we had a liability forunfunded commitments of $1.1 billion related to investments in qualified affordable housing projects which is reflected in Otherliabilities on our Consolidated Balance Sheet.
Table 58 also includes our involvement in lease financing transactions with LLCs engaged in solar power generation that, to a largeextent, provided returns in the form of tax credits. The outstanding financings and operating lease assets are reflected as Loans andOther assets, respectively, on our Consolidated Balance Sheet, whereas related liabilities are reported in Deposits and Other liabilities.
The PNC Financial Services Group, Inc. – 2020 Form 10-K 135
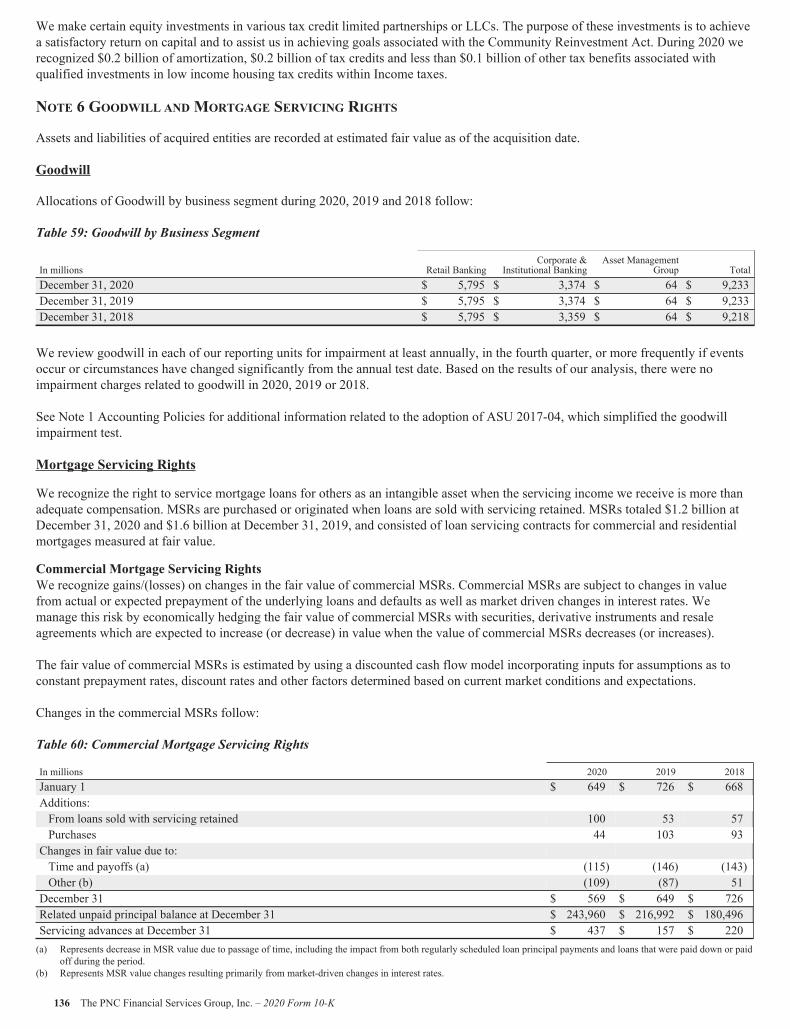
We make certain equity investments in various tax credit limited partnerships or LLCs. The purpose of these investments is to achievea satisfactory return on capital and to assist us in achieving goals associated with the Community Reinvestment Act. During 2020 werecognized $0.2 billion of amortization, $0.2 billion of tax credits and less than $0.1 billion of other tax benefits associated withqualified investments in low income housing tax credits within Income taxes.
NOTE 6 GOODWILL AND MORTGAGE SERVICING RIGHTS
Assets and liabilities of acquired entities are recorded at estimated fair value as of the acquisition date.
Goodwill
Allocations of Goodwill by business segment during 2020, 2019 and 2018 follow:
Table 59: Goodwill by Business Segment
In millions Retail BankingCorporate &
Institutional BankingAsset Management
Group TotalDecember 31, 2020 $ 5,795 $ 3,374 $ 64 $ 9,233December 31, 2019 $ 5,795 $ 3,374 $ 64 $ 9,233December 31, 2018 $ 5,795 $ 3,359 $ 64 $ 9,218
We review goodwill in each of our reporting units for impairment at least annually, in the fourth quarter, or more frequently if eventsoccur or circumstances have changed significantly from the annual test date. Based on the results of our analysis, there were noimpairment charges related to goodwill in 2020, 2019 or 2018.
See Note 1 Accounting Policies for additional information related to the adoption of ASU 2017-04, which simplified the goodwillimpairment test.
Mortgage Servicing Rights
We recognize the right to service mortgage loans for others as an intangible asset when the servicing income we receive is more thanadequate compensation. MSRs are purchased or originated when loans are sold with servicing retained. MSRs totaled $1.2 billion atDecember 31, 2020 and $1.6 billion at December 31, 2019, and consisted of loan servicing contracts for commercial and residentialmortgages measured at fair value.
Commercial Mortgage Servicing RightsWe recognize gains/(losses) on changes in the fair value of commercial MSRs. Commercial MSRs are subject to changes in valuefrom actual or expected prepayment of the underlying loans and defaults as well as market driven changes in interest rates. Wemanage this risk by economically hedging the fair value of commercial MSRs with securities, derivative instruments and resaleagreements which are expected to increase (or decrease) in value when the value of commercial MSRs decreases (or increases).
The fair value of commercial MSRs is estimated by using a discounted cash flow model incorporating inputs for assumptions as toconstant prepayment rates, discount rates and other factors determined based on current market conditions and expectations.
Changes in the commercial MSRs follow:
Table 60: Commercial Mortgage Servicing Rights
In millions 2020 2019 2018January 1 $ 649 $ 726 $ 668Additions:From loans sold with servicing retained 100 53 57Purchases 44 103 93Changes in fair value due to:Time and payoffs (a) (115) (146) (143)Other (b) (109) (87) 51December 31 $ 569 $ 649 $ 726Related unpaid principal balance at December 31 $ 243,960 $ 216,992 $ 180,496Servicing advances at December 31 $ 437 $ 157 $ 220(a) Represents decrease in MSR value due to passage of time, including the impact from both regularly scheduled loan principal payments and loans that were paid down or paid
off during the period.(b) Represents MSR value changes resulting primarily from market-driven changes in interest rates.
136 The PNC Financial Services Group, Inc. – 2020 Form 10-K
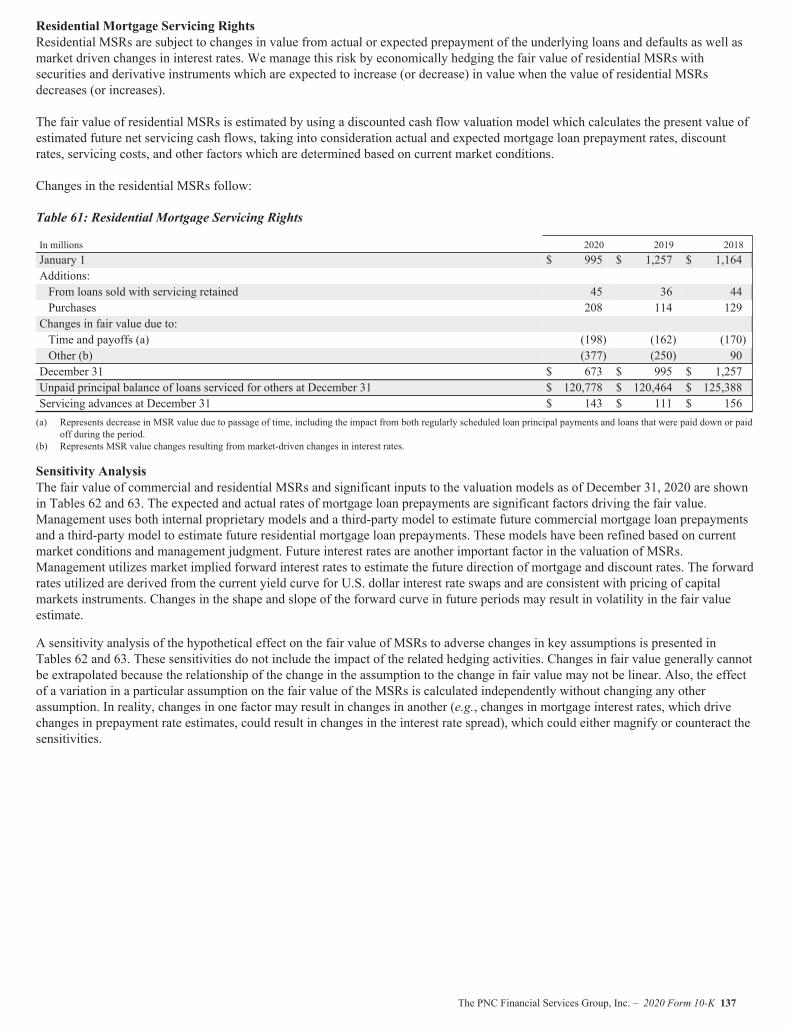
Residential Mortgage Servicing RightsResidential MSRs are subject to changes in value from actual or expected prepayment of the underlying loans and defaults as well asmarket driven changes in interest rates. We manage this risk by economically hedging the fair value of residential MSRs withsecurities and derivative instruments which are expected to increase (or decrease) in value when the value of residential MSRsdecreases (or increases).
The fair value of residential MSRs is estimated by using a discounted cash flow valuation model which calculates the present value ofestimated future net servicing cash flows, taking into consideration actual and expected mortgage loan prepayment rates, discountrates, servicing costs, and other factors which are determined based on current market conditions.
Changes in the residential MSRs follow:
Table 61: Residential Mortgage Servicing Rights
In millions 2020 2019 2018January 1 $ 995 $ 1,257 $ 1,164Additions:From loans sold with servicing retained 45 36 44Purchases 208 114 129Changes in fair value due to:Time and payoffs (a) (198) (162) (170)Other (b) (377) (250) 90December 31 $ 673 $ 995 $ 1,257Unpaid principal balance of loans serviced for others at December 31 $ 120,778 $ 120,464 $ 125,388Servicing advances at December 31 $ 143 $ 111 $ 156(a) Represents decrease in MSR value due to passage of time, including the impact from both regularly scheduled loan principal payments and loans that were paid down or paid
off during the period.(b) Represents MSR value changes resulting from market-driven changes in interest rates.
Sensitivity AnalysisThe fair value of commercial and residential MSRs and significant inputs to the valuation models as of December 31, 2020 are shownin Tables 62 and 63. The expected and actual rates of mortgage loan prepayments are significant factors driving the fair value.Management uses both internal proprietary models and a third-party model to estimate future commercial mortgage loan prepaymentsand a third-party model to estimate future residential mortgage loan prepayments. These models have been refined based on currentmarket conditions and management judgment. Future interest rates are another important factor in the valuation of MSRs.Management utilizes market implied forward interest rates to estimate the future direction of mortgage and discount rates. The forwardrates utilized are derived from the current yield curve for U.S. dollar interest rate swaps and are consistent with pricing of capitalmarkets instruments. Changes in the shape and slope of the forward curve in future periods may result in volatility in the fair valueestimate.
A sensitivity analysis of the hypothetical effect on the fair value of MSRs to adverse changes in key assumptions is presented inTables 62 and 63. These sensitivities do not include the impact of the related hedging activities. Changes in fair value generally cannotbe extrapolated because the relationship of the change in the assumption to the change in fair value may not be linear. Also, the effectof a variation in a particular assumption on the fair value of the MSRs is calculated independently without changing any otherassumption. In reality, changes in one factor may result in changes in another (e.g., changes in mortgage interest rates, which drivechanges in prepayment rate estimates, could result in changes in the interest rate spread), which could either magnify or counteract thesensitivities.
The PNC Financial Services Group, Inc. – 2020 Form 10-K 137

The following tables set forth the fair value of commercial and residential MSRs and the sensitivity analysis of the hypothetical effecton the fair value of MSRs to immediate adverse changes of 10% and 20% in those assumptions:
Table 62: Commercial Mortgage Servicing Rights – Key Valuation Assumptions
Dollars in millionsDecember 31
2020December 31
2019
Fair value $ 569 $ 649Weighted-average life (years) 4.4 4.1Weighted-average constant prepayment rate 4.87 % 4.56 %Decline in fair value from 10% adverse change $ 9 $ 9Decline in fair value from 20% adverse change $ 18 $ 17Effective discount rate 7.33 % 7.91 %Decline in fair value from 10% adverse change $ 15 $ 17Decline in fair value from 20% adverse change $ 31 $ 34
Table 63: Residential Mortgage Servicing Rights – Key Valuation Assumptions
Dollars in millionsDecember 31
2020December 31
2019Fair value $ 673 $ 995Weighted-average life (years) 3.8 5.2Weighted-average constant prepayment rate 21.13 % 13.51 %Decline in fair value from 10% adverse change $ 41 $ 46Decline in fair value from 20% adverse change $ 82 $ 89
Weighted-average option adjusted spread 922 bps 769 bpsDecline in fair value from 10% adverse change $ 20 $ 27Decline in fair value from 20% adverse change $ 38 $ 52
Fees from mortgage loan servicing, which includes contractually specified servicing fees, late fees and ancillary fees were $0.5 billionfor each of 2020, 2019 and 2018. We also generate servicing fees from fee-based activities provided to others for which we do nothave an associated servicing asset. Fees from commercial and residential MSRs are reported within Noninterest income on ourConsolidated Income Statement in Corporate services and Residential mortgage, respectively.
NOTE 7 LEASES
PNC enters into both lessor and lessee arrangements. For more information on lease accounting, see Note 1 Accounting Policies andfor additional details on our equipment lease financing receivables see Note 4 Loans and Related Allowance for Credit Losses.
Lessor ArrangementsPNC’s lessor arrangements primarily consist of direct financing, sales-type and operating leases for equipment. Lease agreements mayinclude options to renew and for the lessee to purchase the leased equipment at the end of the lease term.
The following table provides details on our income from lessor arrangements:
Table 64: Lease Income
Year ended December 31In millions 2020 2019
Sales-type and direct financing leases (a) $ 269 $ 295Operating leases (b) 95 117Lease income $ 364 $ 412
(a) Included in Loan interest income on the Consolidated Income Statement.(b) Included in Corporate services on the Consolidated Income Statement.
138 The PNC Financial Services Group, Inc. – 2020 Form 10-K
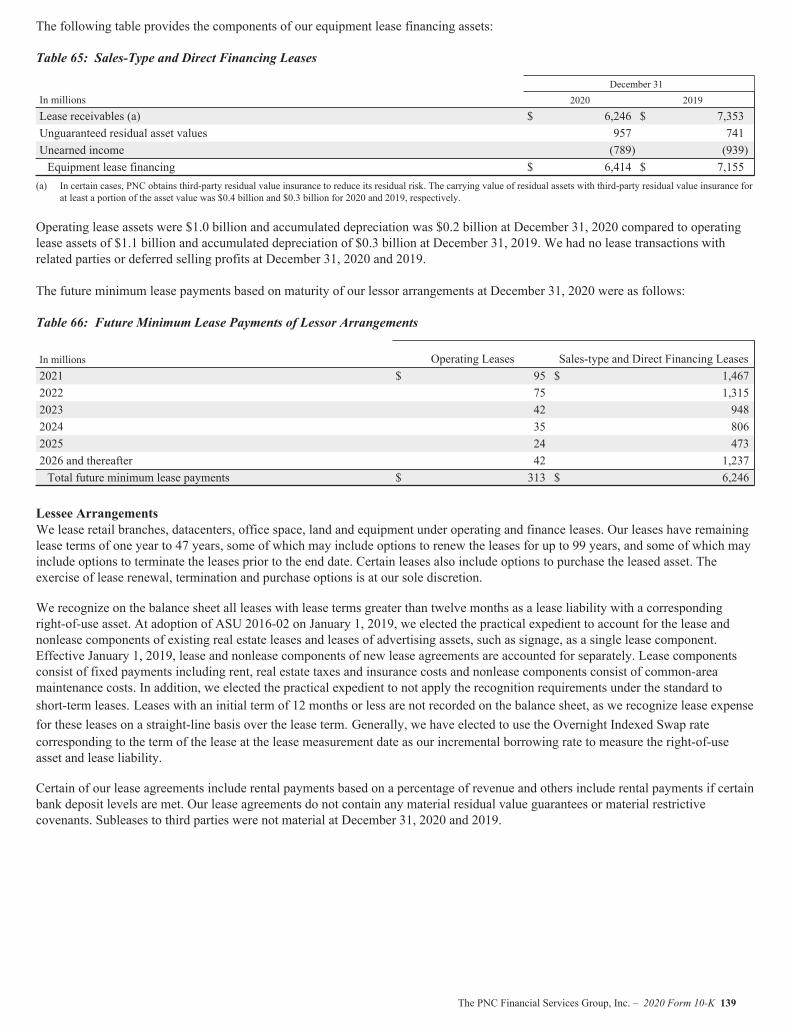
The following table provides the components of our equipment lease financing assets:
Table 65: Sales-Type and Direct Financing Leases
December 31In millions 2020 2019
Lease receivables (a) $ 6,246 $ 7,353Unguaranteed residual asset values 957 741Unearned income (789) (939)Equipment lease financing $ 6,414 $ 7,155
(a) In certain cases, PNC obtains third-party residual value insurance to reduce its residual risk. The carrying value of residual assets with third-party residual value insurance forat least a portion of the asset value was $0.4 billion and $0.3 billion for 2020 and 2019, respectively.
Operating lease assets were $1.0 billion and accumulated depreciation was $0.2 billion at December 31, 2020 compared to operatinglease assets of $1.1 billion and accumulated depreciation of $0.3 billion at December 31, 2019. We had no lease transactions withrelated parties or deferred selling profits at December 31, 2020 and 2019.
The future minimum lease payments based on maturity of our lessor arrangements at December 31, 2020 were as follows:
Table 66: Future Minimum Lease Payments of Lessor Arrangements
In millions Operating Leases Sales-type and Direct Financing Leases2021 $ 95 $ 1,4672022 75 1,3152023 42 9482024 35 8062025 24 4732026 and thereafter 42 1,237Total future minimum lease payments $ 313 $ 6,246
Lessee ArrangementsWe lease retail branches, datacenters, office space, land and equipment under operating and finance leases. Our leases have remaininglease terms of one year to 47 years, some of which may include options to renew the leases for up to 99 years, and some of which mayinclude options to terminate the leases prior to the end date. Certain leases also include options to purchase the leased asset. Theexercise of lease renewal, termination and purchase options is at our sole discretion.
We recognize on the balance sheet all leases with lease terms greater than twelve months as a lease liability with a correspondingright-of-use asset. At adoption of ASU 2016-02 on January 1, 2019, we elected the practical expedient to account for the lease andnonlease components of existing real estate leases and leases of advertising assets, such as signage, as a single lease component.Effective January 1, 2019, lease and nonlease components of new lease agreements are accounted for separately. Lease componentsconsist of fixed payments including rent, real estate taxes and insurance costs and nonlease components consist of common-areamaintenance costs. In addition, we elected the practical expedient to not apply the recognition requirements under the standard toshort-term leases. Leases with an initial term of 12 months or less are not recorded on the balance sheet, as we recognize lease expensefor these leases on a straight-line basis over the lease term. Generally, we have elected to use the Overnight Indexed Swap ratecorresponding to the term of the lease at the lease measurement date as our incremental borrowing rate to measure the right-of-useasset and lease liability.
Certain of our lease agreements include rental payments based on a percentage of revenue and others include rental payments if certainbank deposit levels are met. Our lease agreements do not contain any material residual value guarantees or material restrictivecovenants. Subleases to third parties were not material at December 31, 2020 and 2019.
The PNC Financial Services Group, Inc. – 2020 Form 10-K 139
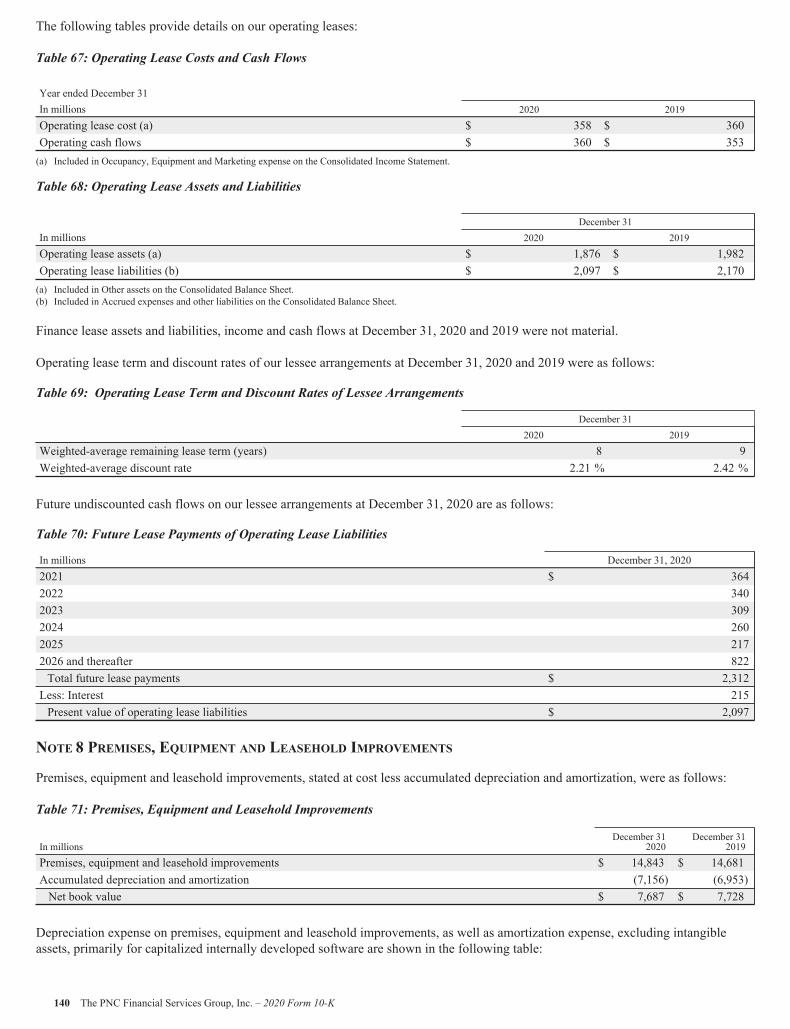
The following tables provide details on our operating leases:
Table 67: Operating Lease Costs and Cash Flows
Year ended December 31In millions 2020 2019
Operating lease cost (a) $ 358 $ 360Operating cash flows $ 360 $ 353(a) Included in Occupancy, Equipment and Marketing expense on the Consolidated Income Statement.
Table 68: Operating Lease Assets and Liabilities
December 31In millions 2020 2019
Operating lease assets (a) $ 1,876 $ 1,982Operating lease liabilities (b) $ 2,097 $ 2,170(a) Included in Other assets on the Consolidated Balance Sheet.(b) Included in Accrued expenses and other liabilities on the Consolidated Balance Sheet.
Finance lease assets and liabilities, income and cash flows at December 31, 2020 and 2019 were not material.
Operating lease term and discount rates of our lessee arrangements at December 31, 2020 and 2019 were as follows:
Table 69: Operating Lease Term and Discount Rates of Lessee Arrangements
December 312020 2019
Weighted-average remaining lease term (years) 8 9Weighted-average discount rate 2.21 % 2.42 %
Future undiscounted cash flows on our lessee arrangements at December 31, 2020 are as follows:
Table 70: Future Lease Payments of Operating Lease Liabilities
In millions December 31, 20202021 $ 3642022 3402023 3092024 2602025 2172026 and thereafter 822Total future lease payments $ 2,312Less: Interest 215Present value of operating lease liabilities $ 2,097
NOTE 8 PREMISES, EQUIPMENT AND LEASEHOLD IMPROVEMENTS
Premises, equipment and leasehold improvements, stated at cost less accumulated depreciation and amortization, were as follows:
Table 71: Premises, Equipment and Leasehold Improvements
In millionsDecember 31
2020December 31
2019
Premises, equipment and leasehold improvements $ 14,843 $ 14,681Accumulated depreciation and amortization (7,156) (6,953)Net book value $ 7,687 $ 7,728
Depreciation expense on premises, equipment and leasehold improvements, as well as amortization expense, excluding intangibleassets, primarily for capitalized internally developed software are shown in the following table:
140 The PNC Financial Services Group, Inc. – 2020 Form 10-K
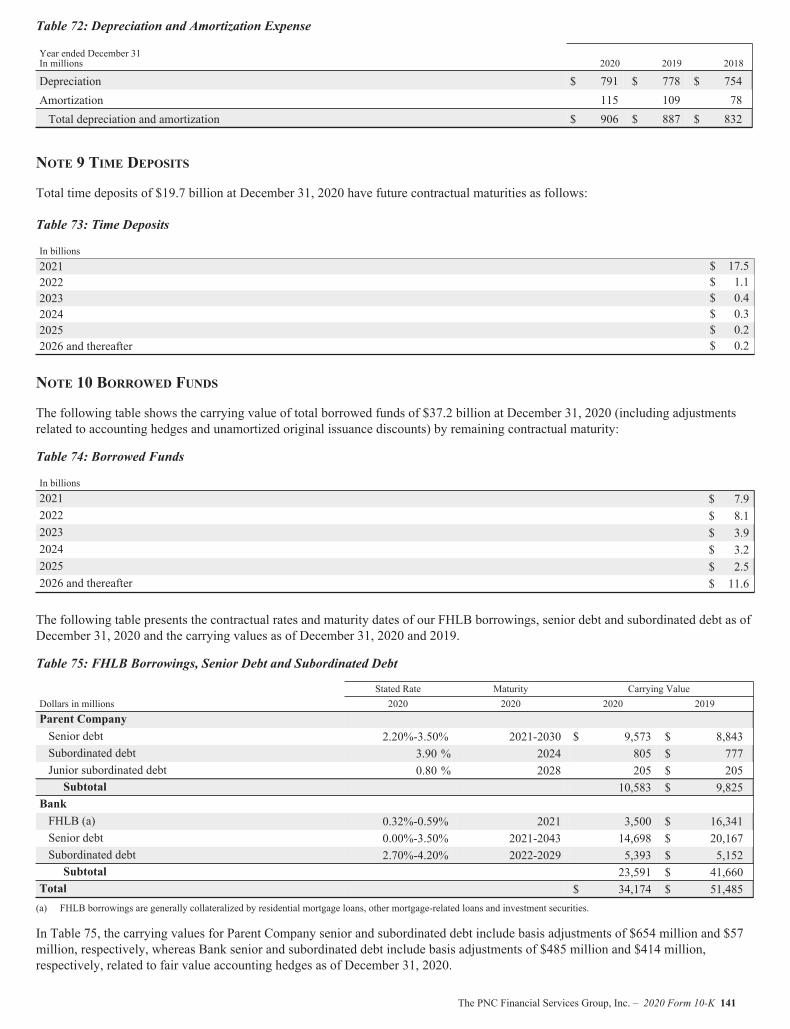
Table 72: Depreciation and Amortization Expense
Year ended December 31In millions 2020 2019 2018
Depreciation $ 791 $ 778 $ 754Amortization 115 109 78Total depreciation and amortization $ 906 $ 887 $ 832
NOTE 9 TIME DEPOSITS
Total time deposits of $19.7 billion at December 31, 2020 have future contractual maturities as follows:
Table 73: Time Deposits
In billions2021 $ 17.52022 $ 1.12023 $ 0.42024 $ 0.32025 $ 0.22026 and thereafter $ 0.2
NOTE 10 BORROWED FUNDS
The following table shows the carrying value of total borrowed funds of $37.2 billion at December 31, 2020 (including adjustmentsrelated to accounting hedges and unamortized original issuance discounts) by remaining contractual maturity:
Table 74: Borrowed Funds
In billions2021 $ 7.92022 $ 8.12023 $ 3.92024 $ 3.22025 $ 2.52026 and thereafter $ 11.6
The following table presents the contractual rates and maturity dates of our FHLB borrowings, senior debt and subordinated debt as ofDecember 31, 2020 and the carrying values as of December 31, 2020 and 2019.
Table 75: FHLB Borrowings, Senior Debt and Subordinated Debt
Stated Rate Maturity Carrying ValueDollars in millions 2020 2020 2020 2019Parent CompanySenior debt 2.20%-3.50% 2021-2030 $ 9,573 $ 8,843Subordinated debt 3.90 % 2024 805 $ 777Junior subordinated debt 0.80 % 2028 205 $ 205Subtotal 10,583 $ 9,825
BankFHLB (a) 0.32%-0.59% 2021 3,500 $ 16,341Senior debt 0.00%-3.50% 2021-2043 14,698 $ 20,167Subordinated debt 2.70%-4.20% 2022-2029 5,393 $ 5,152Subtotal 23,591 $ 41,660
Total $ 34,174 $ 51,485(a) FHLB borrowings are generally collateralized by residential mortgage loans, other mortgage-related loans and investment securities.
In Table 75, the carrying values for Parent Company senior and subordinated debt include basis adjustments of $654 million and $57million, respectively, whereas Bank senior and subordinated debt include basis adjustments of $485 million and $414 million,respectively, related to fair value accounting hedges as of December 31, 2020.
The PNC Financial Services Group, Inc. – 2020 Form 10-K 141
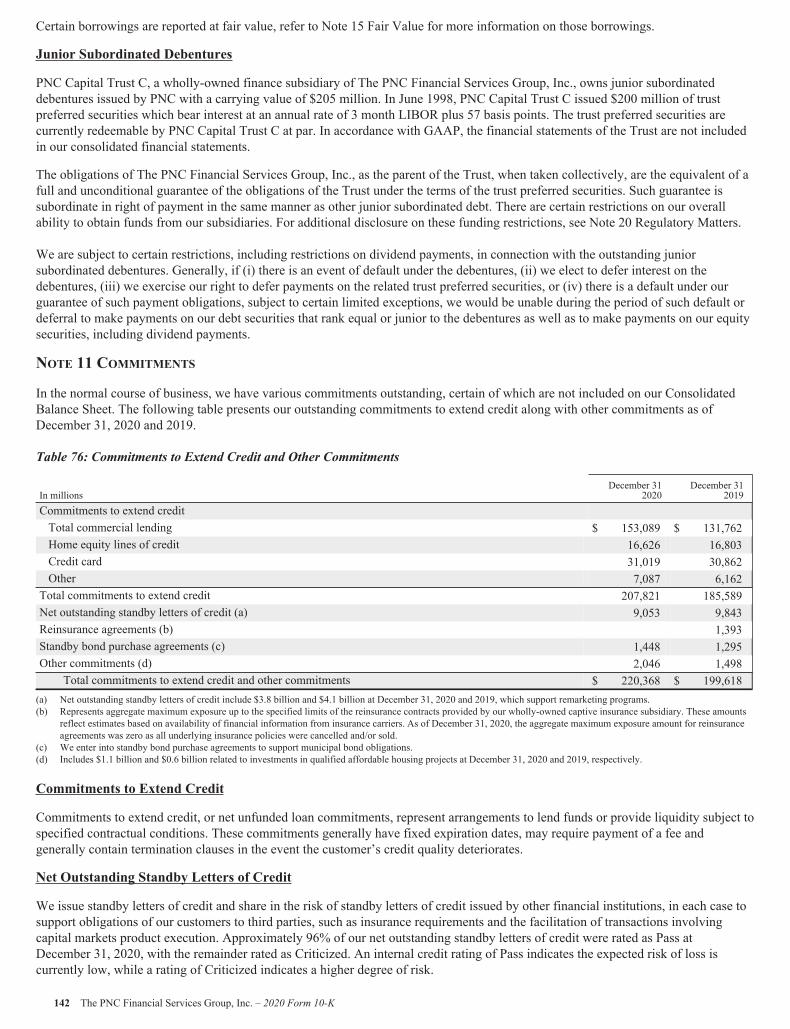
Certain borrowings are reported at fair value, refer to Note 15 Fair Value for more information on those borrowings.
Junior Subordinated Debentures
PNC Capital Trust C, a wholly-owned finance subsidiary of The PNC Financial Services Group, Inc., owns junior subordinateddebentures issued by PNC with a carrying value of $205 million. In June 1998, PNC Capital Trust C issued $200 million of trustpreferred securities which bear interest at an annual rate of 3 month LIBOR plus 57 basis points. The trust preferred securities arecurrently redeemable by PNC Capital Trust C at par. In accordance with GAAP, the financial statements of the Trust are not includedin our consolidated financial statements.
The obligations of The PNC Financial Services Group, Inc., as the parent of the Trust, when taken collectively, are the equivalent of afull and unconditional guarantee of the obligations of the Trust under the terms of the trust preferred securities. Such guarantee issubordinate in right of payment in the same manner as other junior subordinated debt. There are certain restrictions on our overallability to obtain funds from our subsidiaries. For additional disclosure on these funding restrictions, see Note 20 Regulatory Matters.
We are subject to certain restrictions, including restrictions on dividend payments, in connection with the outstanding juniorsubordinated debentures. Generally, if (i) there is an event of default under the debentures, (ii) we elect to defer interest on thedebentures, (iii) we exercise our right to defer payments on the related trust preferred securities, or (iv) there is a default under ourguarantee of such payment obligations, subject to certain limited exceptions, we would be unable during the period of such default ordeferral to make payments on our debt securities that rank equal or junior to the debentures as well as to make payments on our equitysecurities, including dividend payments.
NOTE 11 COMMITMENTS
In the normal course of business, we have various commitments outstanding, certain of which are not included on our ConsolidatedBalance Sheet. The following table presents our outstanding commitments to extend credit along with other commitments as ofDecember 31, 2020 and 2019.
Table 76: Commitments to Extend Credit and Other Commitments
In millionsDecember 31
2020December 31
2019Commitments to extend creditTotal commercial lending $ 153,089 $ 131,762Home equity lines of credit 16,626 16,803Credit card 31,019 30,862Other 7,087 6,162Total commitments to extend credit 207,821 185,589Net outstanding standby letters of credit (a) 9,053 9,843Reinsurance agreements (b) 1,393Standby bond purchase agreements (c) 1,448 1,295Other commitments (d) 2,046 1,498
Total commitments to extend credit and other commitments $ 220,368 $ 199,618(a) Net outstanding standby letters of credit include $3.8 billion and $4.1 billion at December 31, 2020 and 2019, which support remarketing programs.(b) Represents aggregate maximum exposure up to the specified limits of the reinsurance contracts provided by our wholly-owned captive insurance subsidiary. These amounts
reflect estimates based on availability of financial information from insurance carriers. As of December 31, 2020, the aggregate maximum exposure amount for reinsuranceagreements was zero as all underlying insurance policies were cancelled and/or sold.
(c) We enter into standby bond purchase agreements to support municipal bond obligations.(d) Includes $1.1 billion and $0.6 billion related to investments in qualified affordable housing projects at December 31, 2020 and 2019, respectively.
Commitments to Extend Credit
Commitments to extend credit, or net unfunded loan commitments, represent arrangements to lend funds or provide liquidity subject tospecified contractual conditions. These commitments generally have fixed expiration dates, may require payment of a fee andgenerally contain termination clauses in the event the customer’s credit quality deteriorates.
Net Outstanding Standby Letters of Credit
We issue standby letters of credit and share in the risk of standby letters of credit issued by other financial institutions, in each case tosupport obligations of our customers to third parties, such as insurance requirements and the facilitation of transactions involvingcapital markets product execution. Approximately 96% of our net outstanding standby letters of credit were rated as Pass atDecember 31, 2020, with the remainder rated as Criticized. An internal credit rating of Pass indicates the expected risk of loss iscurrently low, while a rating of Criticized indicates a higher degree of risk.
142 The PNC Financial Services Group, Inc. – 2020 Form 10-K
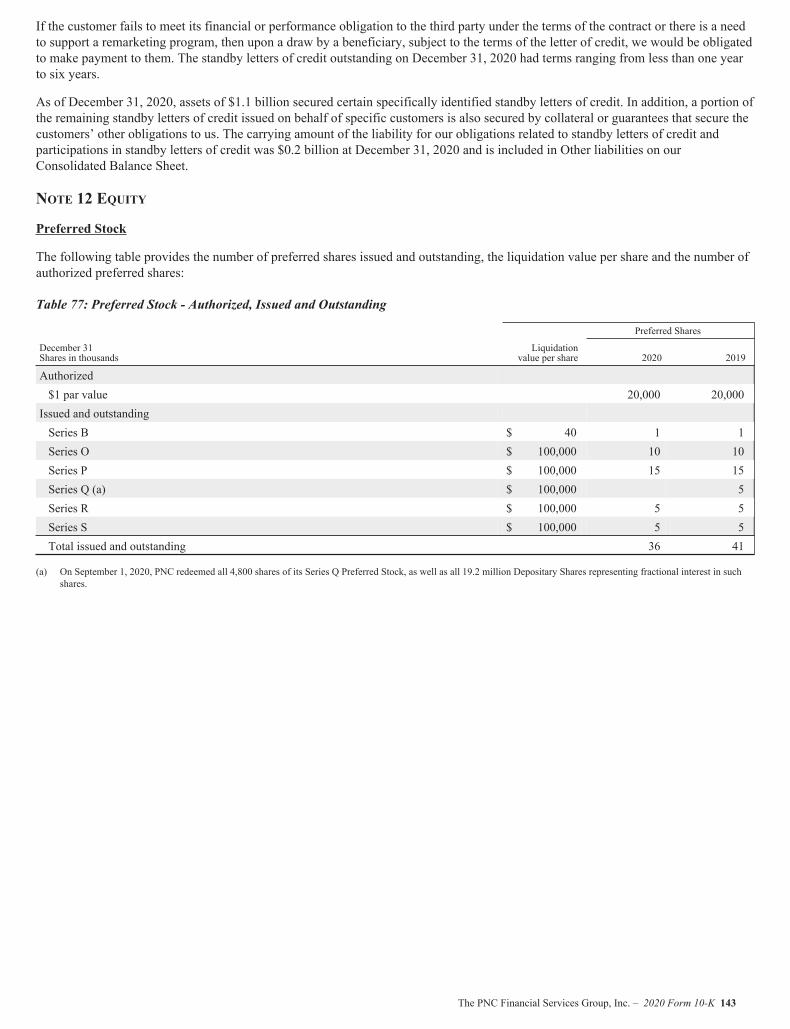
If the customer fails to meet its financial or performance obligation to the third party under the terms of the contract or there is a needto support a remarketing program, then upon a draw by a beneficiary, subject to the terms of the letter of credit, we would be obligatedto make payment to them. The standby letters of credit outstanding on December 31, 2020 had terms ranging from less than one yearto six years.
As of December 31, 2020, assets of $1.1 billion secured certain specifically identified standby letters of credit. In addition, a portion ofthe remaining standby letters of credit issued on behalf of specific customers is also secured by collateral or guarantees that secure thecustomers’ other obligations to us. The carrying amount of the liability for our obligations related to standby letters of credit andparticipations in standby letters of credit was $0.2 billion at December 31, 2020 and is included in Other liabilities on ourConsolidated Balance Sheet.
NOTE 12 EQUITY
Preferred Stock
The following table provides the number of preferred shares issued and outstanding, the liquidation value per share and the number ofauthorized preferred shares:
Table 77: Preferred Stock - Authorized, Issued and Outstanding
Preferred Shares
December 31Shares in thousands
Liquidationvalue per share 2020 2019
Authorized$1 par value 20,000 20,000Issued and outstandingSeries B $ 40 1 1Series O $ 100,000 10 10Series P $ 100,000 15 15Series Q (a) $ 100,000 5Series R $ 100,000 5 5Series S $ 100,000 5 5Total issued and outstanding 36 41
(a) On September 1, 2020, PNC redeemed all 4,800 shares of its Series Q Preferred Stock, as well as all 19.2 million Depositary Shares representing fractional interest in suchshares.
The PNC Financial Services Group, Inc. – 2020 Form 10-K 143
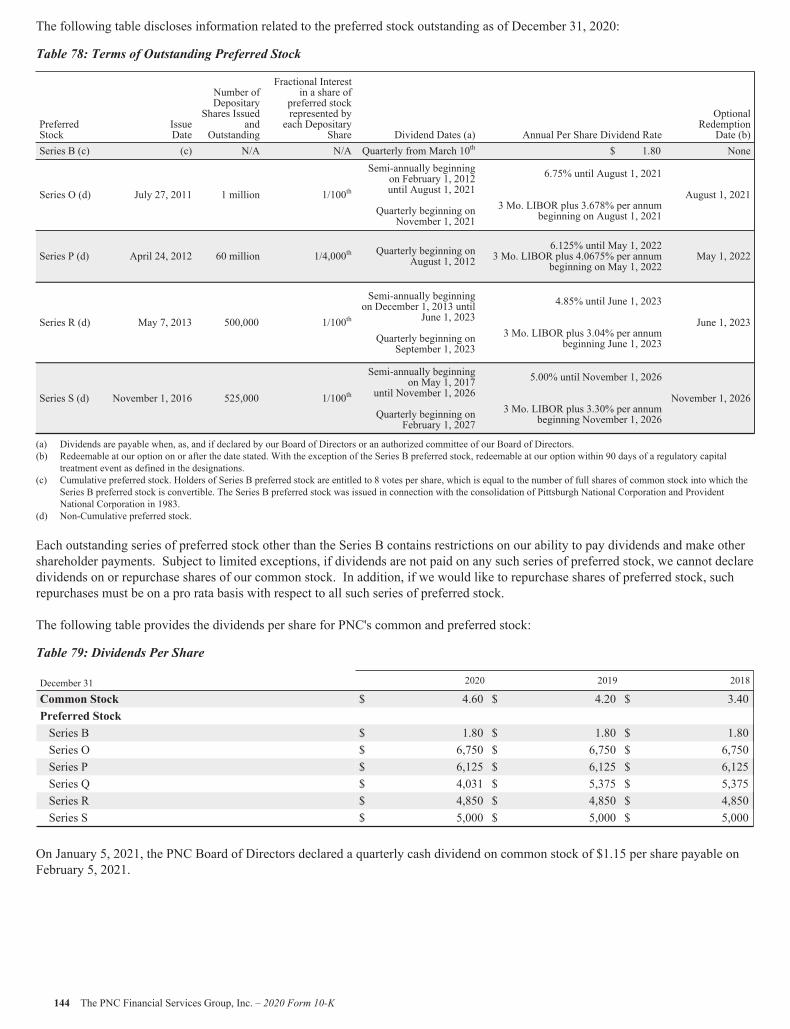
The following table discloses information related to the preferred stock outstanding as of December 31, 2020:
Table 78: Terms of Outstanding Preferred Stock
PreferredStock
IssueDate
Number ofDepositary
Shares Issuedand
Outstanding
Fractional Interestin a share of
preferred stockrepresented byeach Depositary
Share Dividend Dates (a) Annual Per Share Dividend Rate
OptionalRedemption
Date (b)Series B (c) (c) N/A N/A Quarterly from March 10th $ 1.80 None
Series O (d) July 27, 2011 1 million 1/100th
Semi-annually beginningon February 1, 2012until August 1, 2021
Quarterly beginning onNovember 1, 2021
6.75% until August 1, 2021
3 Mo. LIBOR plus 3.678% per annumbeginning on August 1, 2021
August 1, 2021
Series P (d) April 24, 2012 60 million 1/4,000th Quarterly beginning onAugust 1, 2012
6.125% until May 1, 20223 Mo. LIBOR plus 4.0675% per annum
beginning on May 1, 2022May 1, 2022
Series R (d) May 7, 2013 500,000 1/100th
Semi-annually beginningon December 1, 2013 until
June 1, 2023
Quarterly beginning onSeptember 1, 2023
4.85% until June 1, 2023
3 Mo. LIBOR plus 3.04% per annumbeginning June 1, 2023
June 1, 2023
Series S (d) November 1, 2016 525,000 1/100th
Semi-annually beginningon May 1, 2017
until November 1, 2026
Quarterly beginning onFebruary 1, 2027
5.00% until November 1, 2026
3 Mo. LIBOR plus 3.30% per annumbeginning November 1, 2026
November 1, 2026
(a) Dividends are payable when, as, and if declared by our Board of Directors or an authorized committee of our Board of Directors.(b) Redeemable at our option on or after the date stated. With the exception of the Series B preferred stock, redeemable at our option within 90 days of a regulatory capital
treatment event as defined in the designations.(c) Cumulative preferred stock. Holders of Series B preferred stock are entitled to 8 votes per share, which is equal to the number of full shares of common stock into which the
Series B preferred stock is convertible. The Series B preferred stock was issued in connection with the consolidation of Pittsburgh National Corporation and ProvidentNational Corporation in 1983.
(d) Non-Cumulative preferred stock.
Each outstanding series of preferred stock other than the Series B contains restrictions on our ability to pay dividends and make othershareholder payments. Subject to limited exceptions, if dividends are not paid on any such series of preferred stock, we cannot declaredividends on or repurchase shares of our common stock. In addition, if we would like to repurchase shares of preferred stock, suchrepurchases must be on a pro rata basis with respect to all such series of preferred stock.
The following table provides the dividends per share for PNC's common and preferred stock:
Table 79: Dividends Per Share
December 31 2020 2019 2018
Common Stock $ 4.60 $ 4.20 $ 3.40Preferred StockSeries B $ 1.80 $ 1.80 $ 1.80Series O $ 6,750 $ 6,750 $ 6,750Series P $ 6,125 $ 6,125 $ 6,125Series Q $ 4,031 $ 5,375 $ 5,375Series R $ 4,850 $ 4,850 $ 4,850Series S $ 5,000 $ 5,000 $ 5,000
On January 5, 2021, the PNC Board of Directors declared a quarterly cash dividend on common stock of $1.15 per share payable onFebruary 5, 2021.
144 The PNC Financial Services Group, Inc. – 2020 Form 10-K
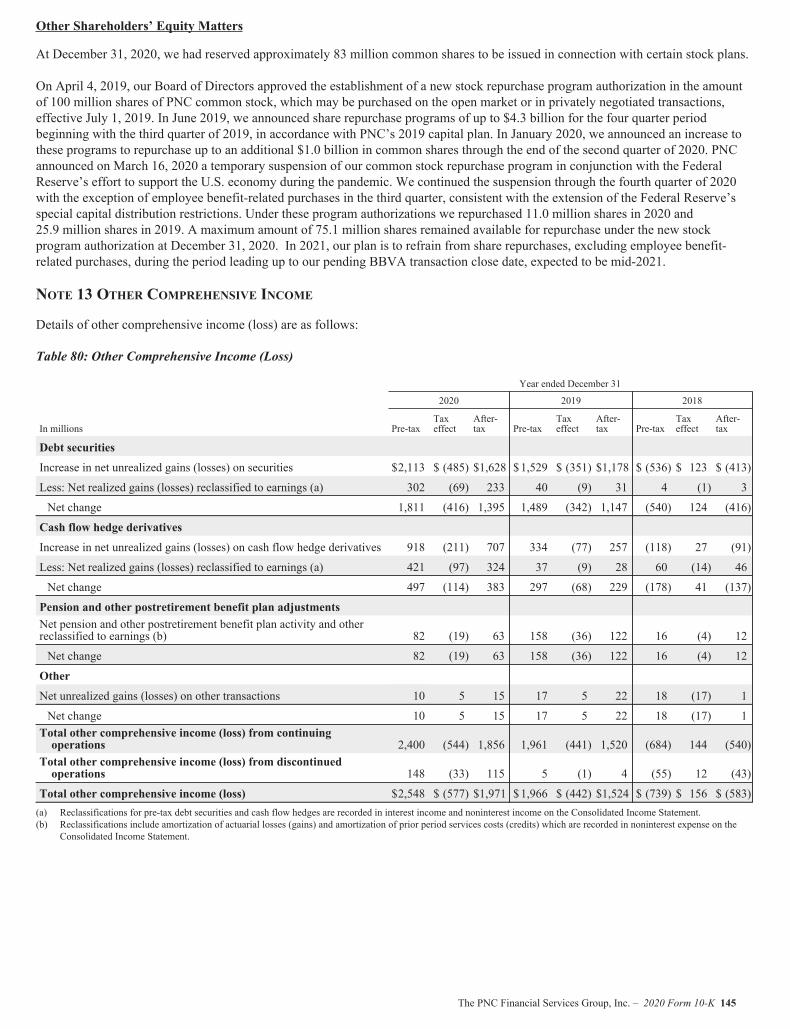
Other Shareholders’ Equity Matters
At December 31, 2020, we had reserved approximately 83 million common shares to be issued in connection with certain stock plans.
On April 4, 2019, our Board of Directors approved the establishment of a new stock repurchase program authorization in the amountof 100 million shares of PNC common stock, which may be purchased on the open market or in privately negotiated transactions,effective July 1, 2019. In June 2019, we announced share repurchase programs of up to $4.3 billion for the four quarter periodbeginning with the third quarter of 2019, in accordance with PNC’s 2019 capital plan. In January 2020, we announced an increase tothese programs to repurchase up to an additional $1.0 billion in common shares through the end of the second quarter of 2020. PNCannounced on March 16, 2020 a temporary suspension of our common stock repurchase program in conjunction with the FederalReserve’s effort to support the U.S. economy during the pandemic. We continued the suspension through the fourth quarter of 2020with the exception of employee benefit-related purchases in the third quarter, consistent with the extension of the Federal Reserve’sspecial capital distribution restrictions. Under these program authorizations we repurchased 11.0 million shares in 2020 and25.9 million shares in 2019. A maximum amount of 75.1 million shares remained available for repurchase under the new stockprogram authorization at December 31, 2020. In 2021, our plan is to refrain from share repurchases, excluding employee benefit-related purchases, during the period leading up to our pending BBVA transaction close date, expected to be mid-2021.
NOTE 13 OTHER COMPREHENSIVE INCOME
Details of other comprehensive income (loss) are as follows:
Table 80: Other Comprehensive Income (Loss)
Year ended December 31
2020 2019 2018
In millions Pre-taxTaxeffect
After-tax Pre-tax
Taxeffect
After-tax Pre-tax
Taxeffect
After-tax
Debt securities
Increase in net unrealized gains (losses) on securities $2,113 $ (485) $1,628 $1,529 $ (351) $1,178 $ (536) $ 123 $ (413)
Less: Net realized gains (losses) reclassified to earnings (a) 302 (69) 233 40 (9) 31 4 (1) 3
Net change 1,811 (416) 1,395 1,489 (342) 1,147 (540) 124 (416)
Cash flow hedge derivatives
Increase in net unrealized gains (losses) on cash flow hedge derivatives 918 (211) 707 334 (77) 257 (118) 27 (91)
Less: Net realized gains (losses) reclassified to earnings (a) 421 (97) 324 37 (9) 28 60 (14) 46
Net change 497 (114) 383 297 (68) 229 (178) 41 (137)
Pension and other postretirement benefit plan adjustmentsNet pension and other postretirement benefit plan activity and otherreclassified to earnings (b) 82 (19) 63 158 (36) 122 16 (4) 12
Net change 82 (19) 63 158 (36) 122 16 (4) 12
Other
Net unrealized gains (losses) on other transactions 10 5 15 17 5 22 18 (17) 1
Net change 10 5 15 17 5 22 18 (17) 1Total other comprehensive income (loss) from continuingoperations 2,400 (544) 1,856 1,961 (441) 1,520 (684) 144 (540)
Total other comprehensive income (loss) from discontinuedoperations 148 (33) 115 5 (1) 4 (55) 12 (43)
Total other comprehensive income (loss) $2,548 $ (577) $1,971 $1,966 $ (442) $1,524 $ (739) $ 156 $ (583)(a) Reclassifications for pre-tax debt securities and cash flow hedges are recorded in interest income and noninterest income on the Consolidated Income Statement.(b) Reclassifications include amortization of actuarial losses (gains) and amortization of prior period services costs (credits) which are recorded in noninterest expense on the
Consolidated Income Statement.
The PNC Financial Services Group, Inc. – 2020 Form 10-K 145
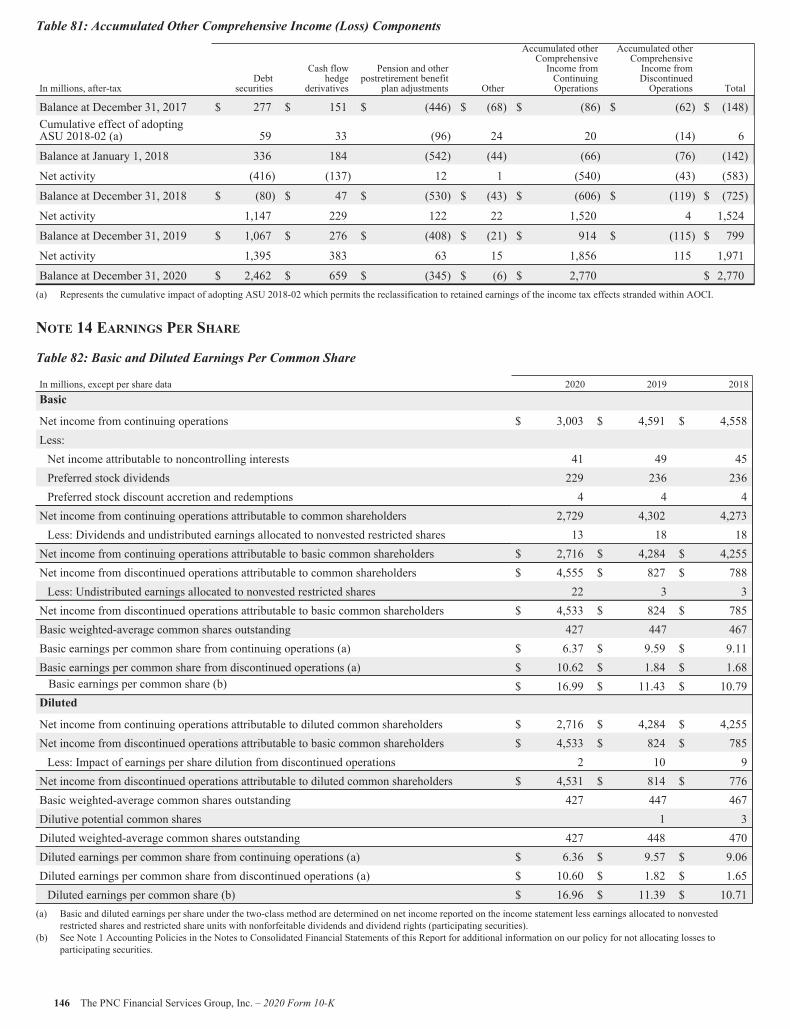
Table 81: Accumulated Other Comprehensive Income (Loss) Components
In millions, after-taxDebt
securities
Cash flowhedge
derivatives
Pension and otherpostretirement benefit
plan adjustments Other
Accumulated otherComprehensiveIncome fromContinuingOperations
Accumulated otherComprehensiveIncome fromDiscontinuedOperations Total
Balance at December 31, 2017 $ 277 $ 151 $ (446) $ (68) $ (86) $ (62) $ (148)Cumulative effect of adoptingASU 2018-02 (a) 59 33 (96) 24 20 (14) 6
Balance at January 1, 2018 336 184 (542) (44) (66) (76) (142)
Net activity (416) (137) 12 1 (540) (43) (583)
Balance at December 31, 2018 $ (80) $ 47 $ (530) $ (43) $ (606) $ (119) $ (725)
Net activity 1,147 229 122 22 1,520 4 1,524
Balance at December 31, 2019 $ 1,067 $ 276 $ (408) $ (21) $ 914 $ (115) $ 799
Net activity 1,395 383 63 15 1,856 115 1,971
Balance at December 31, 2020 $ 2,462 $ 659 $ (345) $ (6) $ 2,770 $ 2,770(a) Represents the cumulative impact of adopting ASU 2018-02 which permits the reclassification to retained earnings of the income tax effects stranded within AOCI.
NOTE 14 EARNINGS PER SHARE
Table 82: Basic and Diluted Earnings Per Common Share
In millions, except per share data 2020 2019 2018Basic
Net income from continuing operations $ 3,003 $ 4,591 $ 4,558Less:Net income attributable to noncontrolling interests 41 49 45Preferred stock dividends 229 236 236Preferred stock discount accretion and redemptions 4 4 4Net income from continuing operations attributable to common shareholders 2,729 4,302 4,273Less: Dividends and undistributed earnings allocated to nonvested restricted shares 13 18 18Net income from continuing operations attributable to basic common shareholders $ 2,716 $ 4,284 $ 4,255Net income from discontinued operations attributable to common shareholders $ 4,555 $ 827 $ 788Less: Undistributed earnings allocated to nonvested restricted shares 22 3 3Net income from discontinued operations attributable to basic common shareholders $ 4,533 $ 824 $ 785Basic weighted-average common shares outstanding 427 447 467Basic earnings per common share from continuing operations (a) $ 6.37 $ 9.59 $ 9.11Basic earnings per common share from discontinued operations (a) $ 10.62 $ 1.84 $ 1.68Basic earnings per common share (b) $ 16.99 $ 11.43 $ 10.79Diluted
Net income from continuing operations attributable to diluted common shareholders $ 2,716 $ 4,284 $ 4,255Net income from discontinued operations attributable to basic common shareholders $ 4,533 $ 824 $ 785Less: Impact of earnings per share dilution from discontinued operations 2 10 9Net income from discontinued operations attributable to diluted common shareholders $ 4,531 $ 814 $ 776Basic weighted-average common shares outstanding 427 447 467Dilutive potential common shares 1 3Diluted weighted-average common shares outstanding 427 448 470Diluted earnings per common share from continuing operations (a) $ 6.36 $ 9.57 $ 9.06Diluted earnings per common share from discontinued operations (a) $ 10.60 $ 1.82 $ 1.65Diluted earnings per common share (b) $ 16.96 $ 11.39 $ 10.71
(a) Basic and diluted earnings per share under the two-class method are determined on net income reported on the income statement less earnings allocated to nonvestedrestricted shares and restricted share units with nonforfeitable dividends and dividend rights (participating securities).
(b) See Note 1 Accounting Policies in the Notes to Consolidated Financial Statements of this Report for additional information on our policy for not allocating losses toparticipating securities.
146 The PNC Financial Services Group, Inc. – 2020 Form 10-K

NOTE 15 FAIR VALUEFair Value Measurement
We measure certain financial assets and liabilities at fair value. Fair value is defined as the price that would be received to sell an assetor the price that would be paid to transfer a liability on the measurement date, and is determined using an exit price in the principal ormost advantageous market for the asset or liability in an orderly transaction between market participants. The fair value hierarchyestablished by GAAP requires us to maximize the use of observable inputs when measuring fair value. The three levels of the fairvalue hierarchy are:
• Level 1: Fair value is determined using a quoted price in an active market for identical assets or liabilities. Level 1 assets andliabilities may include debt securities, equity securities and listed derivative contracts that are traded in an active exchangemarket, and certain U.S. Treasury securities that are actively traded in over-the-counter markets.
• Level 2: Fair value is estimated using inputs other than quoted prices included within Level 1 that are observable for assets orliabilities, either directly or indirectly. The majority of Level 2 assets and liabilities include debt securities and listedderivative contracts with quoted prices that are traded in markets that are not active, and certain debt and equity securities andover-the-counter derivative contracts whose fair value is determined using a pricing model without significant unobservableinputs.
• Level 3: Fair value is estimated using unobservable inputs that are significant to the fair value of the assets or liabilities.Level 3 assets and liabilities include financial instruments whose value is determined using pricing models and discountedcash flow methodologies, or similar techniques for which the significant valuation inputs are not observable and thedetermination of fair value requires significant management judgment or estimation.
We characterize active markets as those where transaction volumes are sufficient to provide objective pricing information, withreasonably narrow bid/ask spreads, and where dealer quotes received do not vary widely and are based on current information.Inactive markets are typically characterized by low transaction volumes, price quotations that vary substantially among marketparticipants or are not based on current information, wide bid/ask spreads, a significant increase in implied liquidity risk premiums,yields, or performance indicators for observed transactions or quoted prices compared to historical periods, a significant decline orabsence of a market for new issuance, or any combination of the above factors. We also consider nonperformance risks, includingcredit risk, as part of our valuation methodology for all assets and liabilities measured at fair value.
Assets and liabilities measured at fair value, by their nature, result in a higher degree of financial statement volatility. Assets andliabilities classified within Level 3 inherently require the use of various assumptions, estimates and judgments when measuring theirfair value. As observable market activity is commonly not available to use when estimating the fair value of Level 3 assets andliabilities, we must estimate fair value using various modeling techniques. These techniques include the use of a variety of inputs/assumptions including credit quality, liquidity, interest rates or other relevant inputs across the entire population of our Level 3 assetsand liabilities. Changes in the significant underlying factors or assumptions (either an increase or a decrease) in any of these areasunderlying our estimates may have resulted in a significant increase/decrease in the Level 3 fair value measurement of a particularasset and/or liability from period to period.
Any models used to determine fair values or to validate dealer quotes are subject to review and independent testing as part of ourmodel validation and internal control testing processes. Our Model Risk Management Group reviews significant models on at least anannual basis. In addition, the Valuation Committee approves valuation methodologies and reviews the results of independent valuationreviews and processes for assets and liabilities measured at fair value on a recurring basis.
Assets and Liabilities Measured at Fair Value on a Recurring Basis
Residential Mortgage Loans Held for SaleWe account for certain residential mortgage loans originated for sale at fair value on a recurring basis. The election of the fair valueoption aligns the accounting for the residential mortgages with the related hedges. Residential mortgage loans are valued based onquoted market prices, where available, prices for other traded mortgage loans with similar characteristics, and purchase commitmentsand bid information received from market participants. The prices are adjusted as necessary to include the embedded servicing valuein the loans and to take into consideration the specific characteristics of certain loans that are priced based on the pricing of similarloans. These adjustments represent unobservable inputs to the valuation but are not considered significant given the relativeinsensitivity of the value to changes in these inputs to the fair value of the loans. Accordingly, the majority of residential mortgageloans held for sale are classified as Level 2.
Commercial Mortgage Loans Held for SaleWe account for certain commercial mortgage loans classified as held for sale in whole loan transactions at fair value. We determinethe fair value of commercial mortgage loans held for sale based upon discounted cash flows. Fair value is determined using salevaluation assumptions that management believes a market participant would use in pricing the loans.
The PNC Financial Services Group, Inc. – 2020 Form 10-K 147
Valuation assumptions may include observable inputs based on the benchmark interest rate swap curve, whole loan sales and agencysales transactions. The significant unobservable input for commercial mortgage loans held for sale, excluding those to be sold toagencies, is management’s assumption of the spread applied to the benchmark rate. The spread over the benchmark curve includesmanagement’s assumptions of the impact of credit and liquidity risk. Significant increases (decreases) in the spread applied to thebenchmark would have resulted in a significantly lower (higher) asset value. The wide range of the spread over the benchmark curve isdue to the varying risk and underlying property characteristics within our portfolio. Based on the significance of the unobservableinput we classified this portfolio as Level 3.
For loans to be sold to agencies with servicing retained, the fair value is adjusted for the estimated servicing cash flows, which is anunobservable input. This adjustment is not considered significant given the relative insensitivity of the value to changes in the input tothe fair value of the loans. Accordingly, commercial mortgage loans held for sale to agencies are classified as Level 2.
Securities Available for Sale and Trading SecuritiesSecurities accounted for at fair value include both the available for sale and trading portfolios. We primarily use prices obtained frompricing services, dealer quotes or recent trades to determine the fair value of securities. The majority of securities were priced by third-party vendors. The third-party vendors use a variety of methods when pricing securities that incorporate relevant market data to arriveat an estimate of what a buyer in the marketplace would pay for a security under current market conditions. We monitor and validatethe reliability of vendor pricing on an ongoing basis through pricing methodology reviews, including detailed reviews of theassumptions and inputs used by the vendor to price individual securities, and through price validation testing. Securities not priced byone of our pricing vendors may be valued using a dealer quote, which are also subject to price validation testing. Price validationtesting is performed independent of the risk-taking function and involves corroborating the prices received from third-party vendorsand dealers with prices from another third party or through other sources, such as internal valuations or sales of similar securities.Security prices are also validated through actual cash settlement upon sale of a security.
Securities are classified within the fair value hierarchy after giving consideration to the activity level in the market for the securitytype and the observability of the inputs used to determine the fair value. When a quoted price in an active market exists for theidentical security, this price is used to determine fair value and the security is classified within Level 1 of the hierarchy. Level 1securities include U.S. Treasury securities.
When a quoted price in an active market for the identical security is not available, fair value is estimated using either an alternativemarket approach, such as a recent trade or matrix pricing, or an income approach, such as a discounted cash flow pricing model. If theinputs to the valuation are based primarily on market observable information, then the security is classified within Level 2 of thehierarchy. Level 2 securities include agency debt securities, agency residential mortgage-backed securities, agency and non-agencycommercial mortgage-backed securities, certain non-agency residential mortgage-backed securities, asset-backed securitiescollateralized by non-mortgage-related corporate and consumer loans, and other debt securities. Level 2 securities are predominantlypriced by third parties, either by a pricing vendor or dealer.
In certain cases where there is limited activity or less transparency around the inputs to the valuation, securities are classified withinLevel 3 of the hierarchy. Securities classified as Level 3 consist primarily of non-agency residential mortgage-backed and asset-backed securities collateralized by first- and second-lien residential mortgage loans. Fair value for these securities is primarilyestimated using pricing obtained from third-party vendors. In some cases, fair value is estimated using a dealer quote, by reference toprices of securities of a similar vintage and collateral type or by reference to recent sales of similar securities. Market activity for thesesecurity types is limited with little price transparency. As a result, these securities are generally valued by the third-party vendor usinga discounted cash flow approach that incorporates significant unobservable inputs and observable market activity where available.Significant inputs to the valuation include prepayment projections and credit loss assumptions (default rate and loss severity) anddiscount rates that are deemed representative of current market conditions. Significant increases (decreases) in any of thoseassumptions in isolation would have resulted in a significantly lower (higher) fair value measurement.
Certain infrequently traded debt securities within Other debt securities available for sale and Trading securities are also classified inLevel 3 and are included in the Insignificant Level 3 assets, net of liabilities line item in Table 85. The significant unobservable inputsused to estimate the fair value of these securities include an estimate of expected credit losses and a discount for liquidity risk. Theseinputs are incorporated into the fair value measurement by either increasing the spread over the benchmark curve or by applying acredit and liquidity discount to the par value of the security. Significant increases (decreases) in credit and/or liquidity risk could haveresulted in a significantly lower (higher) fair value estimate.
LoansLoans accounted for at fair value consist primarily of residential mortgage loans. These loans are generally valued similarly toresidential mortgage loans held for sale and are classified as Level 2. However, similar to residential mortgage loans held for sale, ifthese loans are repurchased and unsalable, they are classified as Level 3. In addition, repurchased VA loans, where only a portion ofthe principal will be reimbursed, are classified as Level 3. The fair value is determined using a discounted cash flow calculation basedon our historical loss rate. We have elected to account for certain home equity lines of credit at fair value. These loans are classified as
148 The PNC Financial Services Group, Inc. – 2020 Form 10-K
Level 3. Significant inputs to the valuation of these loans include credit and liquidity discount, cumulative default rate, loss severityand gross discount rate and are deemed representative of current market conditions. Significant increases (decreases) in any of theseassumptions would have resulted in a significantly lower (higher) fair value measurement.
Equity InvestmentsEquity investments includes money market mutual funds as well as direct and indirect private equity investments. Money marketmutual funds are valued based on quoted prices in active markets for identical securities and classified within Level 1 of the hierarchy.The valuation of direct and indirect private equity investments requires significant management judgment due to the absence of quotedmarket prices, inherent lack of liquidity and the long-term nature of such investments. Various valuation techniques are used for directinvestments, including multiples of adjusted earnings of the entity, independent appraisals, anticipated financing and sale transactionswith third parties, or the pricing used to value the entity in a recent financing transaction. A multiple of adjusted earnings calculation isthe valuation technique utilized most frequently and is the most significant unobservable input used in such calculation. Significantdecreases (increases) in the multiple of earnings could have resulted in a significantly lower (higher) fair value measurement. Directequity investments are classified as Level 3.
Indirect investments are not redeemable; however, we receive distributions over the life of the partnerships from liquidation of theunderlying investments by the investee, which we expect to occur over the next 10 years. We value indirect investments in privateequity funds using the net asset value (NAV) practical expedient as provided in the financial statements that we receive from fundmanagers. Due to the time lag in our receipt of the financial information and based on a review of investments and valuationtechniques applied, adjustments to the manager-provided value are made when available recent portfolio company information ormarket information indicates a significant change in value from that provided by the manager of the fund. Indirect investments valuedusing NAV are not classified in the fair value hierarchy.
Mortgage Servicing Rights (MSRs)MSRs are carried at fair value on a recurring basis. Assumptions incorporated into the MSRs valuation model reflect management’sbest estimate of factors that a market participant would use in valuing the MSRs. Although sales of MSRs do occur and can offer somemarket insight, MSRs do not trade in an active, open market with readily observable prices so the precise terms and conditions of salesare not available.
Residential MSRsAs a benchmark for the reasonableness of our residential MSRs fair value, we obtained opinions of value from independent brokers.These brokers provided a range (+/-10 bps) based upon their own discounted cash flow calculations of our portfolio that reflectconditions in the secondary market and any recently executed servicing transactions. We compare our internally-developed residentialMSRs value to the ranges of values received from the brokers. If our residential MSRs fair value falls outside of the brokers’ ranges,management will assess whether a valuation adjustment is warranted. For the periods presented, our residential MSRs value did notfall outside of the brokers’ ranges. We consider our residential MSRs value to represent a reasonable estimate of fair value.
Due to the nature of the unobservable valuation inputs, residential MSRs are classified as Level 3. The significant unobservable inputsused in the fair value measurement of residential MSRs are constant prepayment rates and spread over the benchmark curve.Significant increases (decreases) in prepayment rates and spread over the benchmark curve would have resulted in lower (higher) fairmarket value of residential MSRs.
Commercial MSRsThe fair value of commercial MSRs is estimated by using a discounted cash flow model incorporating unobservable inputs forassumptions such as constant prepayment rates, discount rates and other factors. Due to the nature of the unobservable valuation inputsand the limited availability of market pricing, commercial MSRs are classified as Level 3. Significant increases (decreases) in constantprepayment rates and discount rates would have resulted in significantly lower (higher) commercial MSR value determined based oncurrent market conditions and expectations.
Financial DerivativesExchange-traded derivatives are valued using quoted market prices and are classified as Level 1. The majority of derivatives that weenter into are executed over-the-counter and are valued using internal models. These derivatives are primarily classified as Level 2, asthe readily observable market inputs to these models are validated to external sources, such as industry pricing services, or arecorroborated through recent trades, dealer quotes, yield curves, implied volatility or other market-related data. Level 2 financialderivatives are primarily estimated using a combination of Eurodollar future prices and observable benchmark interest rate swaps toconstruct projected discounted cash flows.
Financial derivatives that are priced using significant management judgment or assumptions are classified as Level 3. Unobservableinputs related to interest rate contracts include probability of funding of residential mortgage loan commitments and estimatedservicing cash flows of commercial and residential mortgage loan commitments. Probability of default and loss severity are thesignificant unobservable inputs used in the valuation of risk participation agreements. The fair values of Level 3 assets and liabilities
The PNC Financial Services Group, Inc. – 2020 Form 10-K 149

related to these interest rate contract financial derivatives as of December 31, 2020 and 2019 are included in the Insignificant Level 3assets, net of liabilities line item in Table 85 of this Note 15.
In connection with the sales of portions of our Visa Class B common shares, we entered into swap agreements with the purchasers ofthe shares to retain any future risk of decreases in the conversion rate of Class B common shares to Class A common shares resultingfrom increases in the escrow funded by Visa to pay for the costs of resolution of specified litigation (see Note 21 Legal Proceedings).These swaps also require PNC to make periodic payments based on the market price of the Class A common shares at a fixed rate ofinterest (in certain cases subject to step-up provisions) until the Visa litigation is resolved. An increase in the estimated length oflitigation resolution date, a decrease in the estimated conversion rate, or an increase in the estimated growth rate of the Class A shareprice would have had a negative impact on the fair value of the swaps and vice versa.
The fair values of our derivatives include a credit valuation adjustment to reflect our own and our counterparties’ nonperformance risk.Our credit valuation adjustment is computed using credit default swap spreads, in conjunction with internal historical recoveryobservations.
Other Assets and LiabilitiesOther assets held at fair value on a recurring basis primarily include assets related to PNC’s deferred compensation and supplementalincentive savings plans.
The assets related to PNC’s deferred compensation and supplemental incentive savings plans primarily consist of a prepaid forwardcontract referencing an amount of shares of PNC stock, equity mutual funds and fixed income funds, and are valued based on theunderlying investments. These assets are valued either by reference to the market price of PNC’s stock or by using the quoted marketprices for investments other than PNC’s stock and are classified in Levels 1 and 2.
All Level 3 other assets and liabilities are included in the Insignificant Level 3 assets, net of liabilities line item in Table 85 in thisNote 15.
Other Borrowed FundsOther borrowed funds primarily consist of U.S. Treasury securities sold short which are classified as Level 1. Other borrowed fundsalso includes the related liability for certain repurchased loans for which we have elected the fair value option and are classified aseither Level 2 or Level 3, consistent with the level classification of the corresponding loans. All Level 3 amounts are included in theInsignificant Level 3 assets, net of liabilities line item in Table 85 in this Note 15.
150 The PNC Financial Services Group, Inc. – 2020 Form 10-K
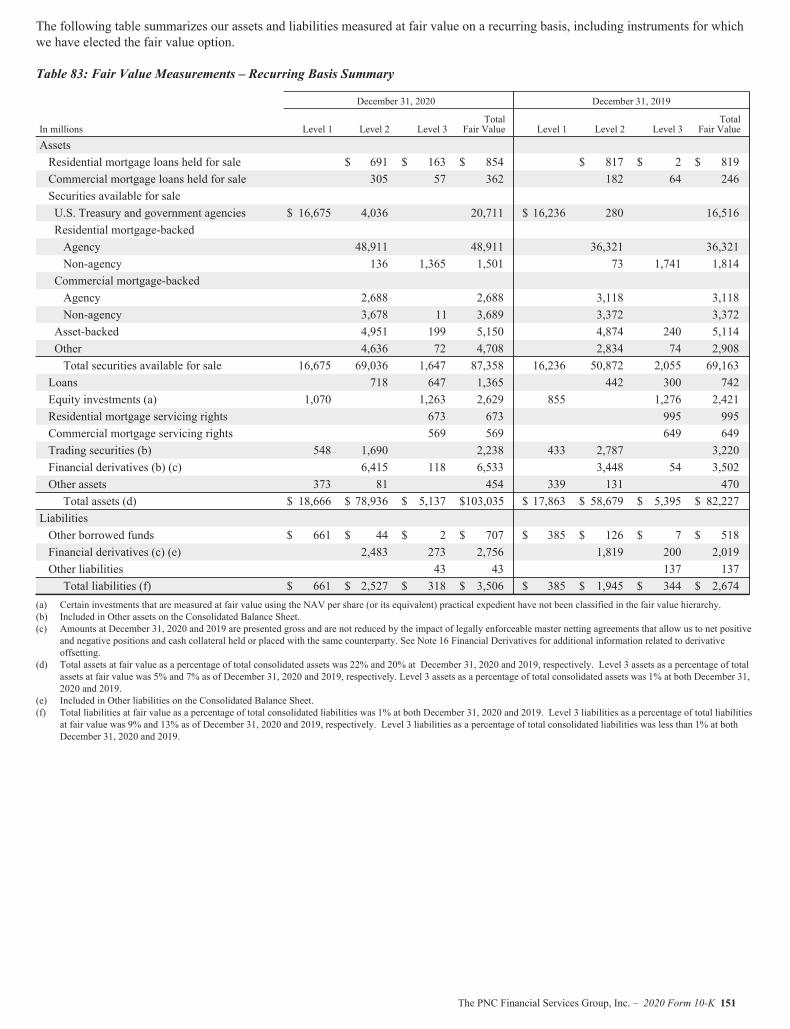
The following table summarizes our assets and liabilities measured at fair value on a recurring basis, including instruments for whichwe have elected the fair value option.
Table 83: Fair Value Measurements – Recurring Basis Summary
December 31, 2020 December 31, 2019
In millions Level 1 Level 2 Level 3Total
Fair Value Level 1 Level 2 Level 3Total
Fair Value
AssetsResidential mortgage loans held for sale $ 691 $ 163 $ 854 $ 817 $ 2 $ 819Commercial mortgage loans held for sale 305 57 362 182 64 246Securities available for saleU.S. Treasury and government agencies $ 16,675 4,036 20,711 $ 16,236 280 16,516Residential mortgage-backedAgency 48,911 48,911 36,321 36,321Non-agency 136 1,365 1,501 73 1,741 1,814Commercial mortgage-backedAgency 2,688 2,688 3,118 3,118Non-agency 3,678 11 3,689 3,372 3,372Asset-backed 4,951 199 5,150 4,874 240 5,114Other 4,636 72 4,708 2,834 74 2,908Total securities available for sale 16,675 69,036 1,647 87,358 16,236 50,872 2,055 69,163
Loans 718 647 1,365 442 300 742Equity investments (a) 1,070 1,263 2,629 855 1,276 2,421Residential mortgage servicing rights 673 673 995 995Commercial mortgage servicing rights 569 569 649 649Trading securities (b) 548 1,690 2,238 433 2,787 3,220Financial derivatives (b) (c) 6,415 118 6,533 3,448 54 3,502Other assets 373 81 454 339 131 470Total assets (d) $ 18,666 $ 78,936 $ 5,137 $103,035 $ 17,863 $ 58,679 $ 5,395 $ 82,227
LiabilitiesOther borrowed funds $ 661 $ 44 $ 2 $ 707 $ 385 $ 126 $ 7 $ 518Financial derivatives (c) (e) 2,483 273 2,756 1,819 200 2,019Other liabilities 43 43 137 137Total liabilities (f) $ 661 $ 2,527 $ 318 $ 3,506 $ 385 $ 1,945 $ 344 $ 2,674
(a) Certain investments that are measured at fair value using the NAV per share (or its equivalent) practical expedient have not been classified in the fair value hierarchy.(b) Included in Other assets on the Consolidated Balance Sheet.(c) Amounts at December 31, 2020 and 2019 are presented gross and are not reduced by the impact of legally enforceable master netting agreements that allow us to net positive
and negative positions and cash collateral held or placed with the same counterparty. See Note 16 Financial Derivatives for additional information related to derivativeoffsetting.
(d) Total assets at fair value as a percentage of total consolidated assets was 22% and 20% at December 31, 2020 and 2019, respectively. Level 3 assets as a percentage of totalassets at fair value was 5% and 7% as of December 31, 2020 and 2019, respectively. Level 3 assets as a percentage of total consolidated assets was 1% at both December 31,2020 and 2019.
(e) Included in Other liabilities on the Consolidated Balance Sheet.(f) Total liabilities at fair value as a percentage of total consolidated liabilities was 1% at both December 31, 2020 and 2019. Level 3 liabilities as a percentage of total liabilities
at fair value was 9% and 13% as of December 31, 2020 and 2019, respectively. Level 3 liabilities as a percentage of total consolidated liabilities was less than 1% at bothDecember 31, 2020 and 2019.
The PNC Financial Services Group, Inc. – 2020 Form 10-K 151
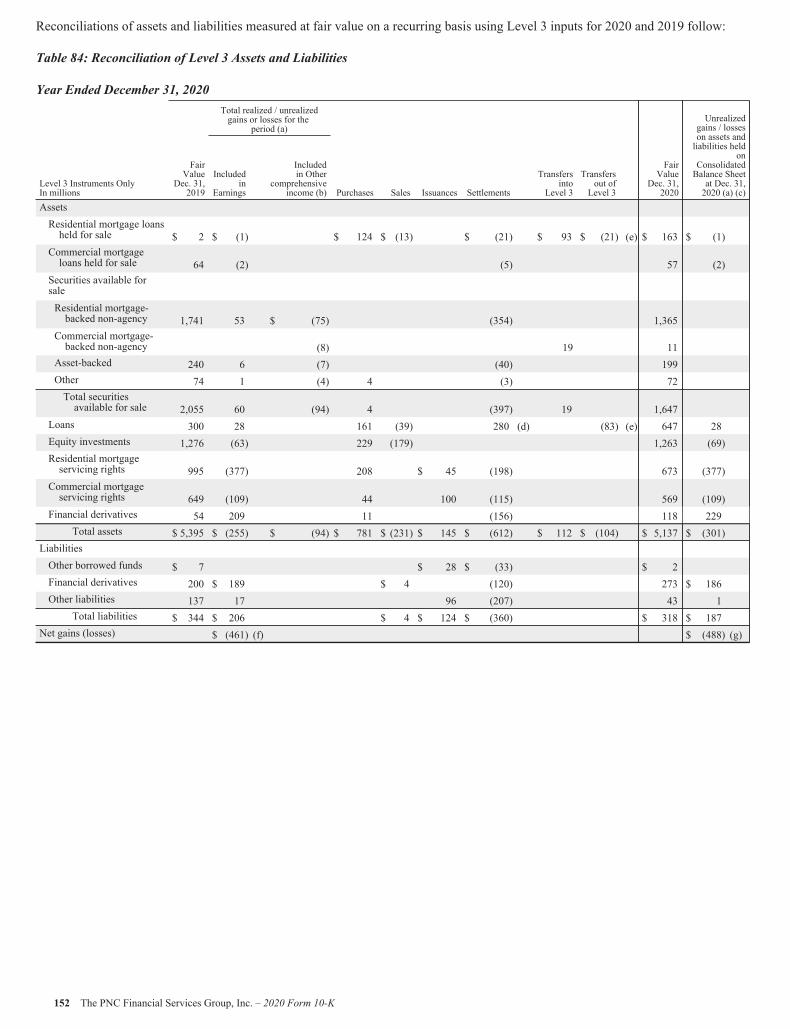
Reconciliations of assets and liabilities measured at fair value on a recurring basis using Level 3 inputs for 2020 and 2019 follow:
Table 84: Reconciliation of Level 3 Assets and Liabilities
Year Ended December 31, 2020Total realized / unrealizedgains or losses for the
period (a)Unrealized
gains / losseson assets andliabilities held
onConsolidatedBalance Sheetat Dec. 31,2020 (a) (c)
Level 3 Instruments OnlyIn millions
FairValue
Dec. 31,2019
Includedin
Earnings
Includedin Other
comprehensiveincome (b) Purchases Sales Issuances Settlements
Transfersinto
Level 3
Transfersout ofLevel 3
FairValue
Dec. 31,2020
AssetsResidential mortgage loansheld for sale $ 2 $ (1) $ 124 $ (13) $ (21) $ 93 $ (21) (e) $ 163 $ (1)
Commercial mortgageloans held for sale 64 (2) (5) 57 (2)
Securities available forsaleResidential mortgage-backed non-agency 1,741 53 $ (75) (354) 1,365
Commercial mortgage-backed non-agency (8) 19 11
Asset-backed 240 6 (7) (40) 199Other 74 1 (4) 4 (3) 72Total securitiesavailable for sale 2,055 60 (94) 4 (397) 19 1,647
Loans 300 28 161 (39) 280 (d) (83) (e) 647 28Equity investments 1,276 (63) 229 (179) 1,263 (69)Residential mortgageservicing rights 995 (377) 208 $ 45 (198) 673 (377)
Commercial mortgageservicing rights 649 (109) 44 100 (115) 569 (109)
Financial derivatives 54 209 11 (156) 118 229Total assets $ 5,395 $ (255) $ (94) $ 781 $ (231) $ 145 $ (612) $ 112 $ (104) $ 5,137 $ (301)
LiabilitiesOther borrowed funds $ 7 $ 28 $ (33) $ 2Financial derivatives 200 $ 189 $ 4 (120) 273 $ 186Other liabilities 137 17 96 (207) 43 1
Total liabilities $ 344 $ 206 $ 4 $ 124 $ (360) $ 318 $ 187Net gains (losses) $ (461) (f) $ (488) (g)
152 The PNC Financial Services Group, Inc. – 2020 Form 10-K
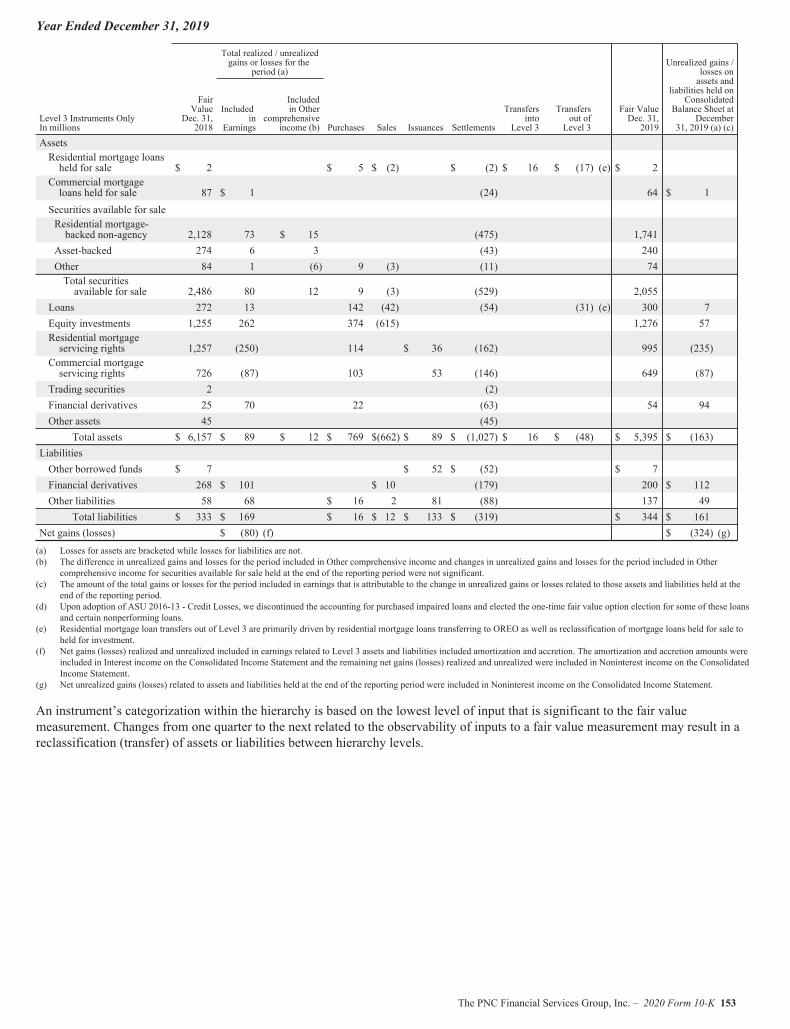
Year Ended December 31, 2019
Total realized / unrealizedgains or losses for the
period (a)Unrealized gains /
losses onassets and
liabilities held onConsolidated
Balance Sheet atDecember
31, 2019 (a) (c)Level 3 Instruments OnlyIn millions
FairValue
Dec. 31,2018
Includedin
Earnings
Includedin Other
comprehensiveincome (b) Purchases Sales Issuances Settlements
Transfersinto
Level 3
Transfersout ofLevel 3
Fair ValueDec. 31,2019
AssetsResidential mortgage loansheld for sale $ 2 $ 5 $ (2) $ (2) $ 16 $ (17) (e) $ 2
Commercial mortgageloans held for sale 87 $ 1 (24) 64 $ 1
Securities available for saleResidential mortgage-backed non-agency 2,128 73 $ 15 (475) 1,741
Asset-backed 274 6 3 (43) 240Other 84 1 (6) 9 (3) (11) 74Total securitiesavailable for sale 2,486 80 12 9 (3) (529) 2,055
Loans 272 13 142 (42) (54) (31) (e) 300 7Equity investments 1,255 262 374 (615) 1,276 57Residential mortgageservicing rights 1,257 (250) 114 $ 36 (162) 995 (235)
Commercial mortgageservicing rights 726 (87) 103 53 (146) 649 (87)
Trading securities 2 (2)Financial derivatives 25 70 22 (63) 54 94Other assets 45 (45)
Total assets $ 6,157 $ 89 $ 12 $ 769 $(662) $ 89 $ (1,027) $ 16 $ (48) $ 5,395 $ (163)LiabilitiesOther borrowed funds $ 7 $ 52 $ (52) $ 7Financial derivatives 268 $ 101 $ 10 (179) 200 $ 112Other liabilities 58 68 $ 16 2 81 (88) 137 49
Total liabilities $ 333 $ 169 $ 16 $ 12 $ 133 $ (319) $ 344 $ 161Net gains (losses) $ (80) (f) $ (324) (g)(a) Losses for assets are bracketed while losses for liabilities are not.(b) The difference in unrealized gains and losses for the period included in Other comprehensive income and changes in unrealized gains and losses for the period included in Other
comprehensive income for securities available for sale held at the end of the reporting period were not significant.(c) The amount of the total gains or losses for the period included in earnings that is attributable to the change in unrealized gains or losses related to those assets and liabilities held at the
end of the reporting period.(d) Upon adoption of ASU 2016-13 - Credit Losses, we discontinued the accounting for purchased impaired loans and elected the one-time fair value option election for some of these loans
and certain nonperforming loans.(e) Residential mortgage loan transfers out of Level 3 are primarily driven by residential mortgage loans transferring to OREO as well as reclassification of mortgage loans held for sale to
held for investment.(f) Net gains (losses) realized and unrealized included in earnings related to Level 3 assets and liabilities included amortization and accretion. The amortization and accretion amounts were
included in Interest income on the Consolidated Income Statement and the remaining net gains (losses) realized and unrealized were included in Noninterest income on the ConsolidatedIncome Statement.
(g) Net unrealized gains (losses) related to assets and liabilities held at the end of the reporting period were included in Noninterest income on the Consolidated Income Statement.
An instrument’s categorization within the hierarchy is based on the lowest level of input that is significant to the fair valuemeasurement. Changes from one quarter to the next related to the observability of inputs to a fair value measurement may result in areclassification (transfer) of assets or liabilities between hierarchy levels.
The PNC Financial Services Group, Inc. – 2020 Form 10-K 153
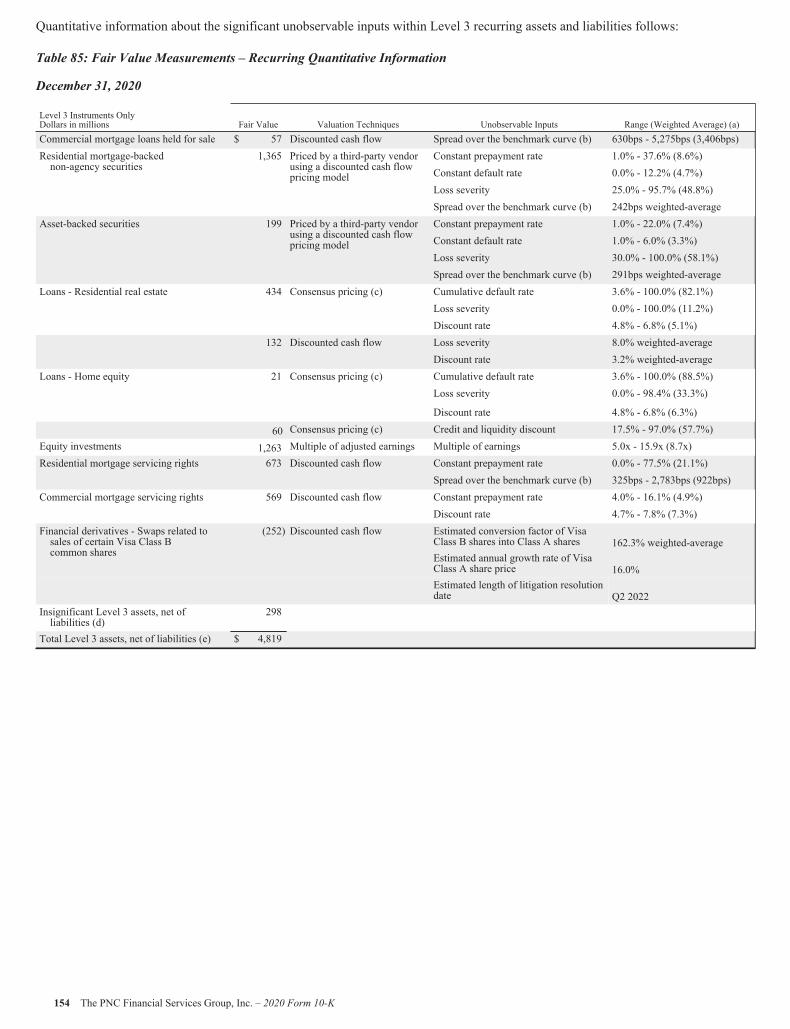
Quantitative information about the significant unobservable inputs within Level 3 recurring assets and liabilities follows:
Table 85: Fair Value Measurements – Recurring Quantitative Information
December 31, 2020
Level 3 Instruments OnlyDollars in millions Fair Value Valuation Techniques Unobservable Inputs Range (Weighted Average) (a)Commercial mortgage loans held for sale $ 57 Discounted cash flow Spread over the benchmark curve (b) 630bps - 5,275bps (3,406bps)Residential mortgage-backednon-agency securities
1,365 Priced by a third-party vendorusing a discounted cash flowpricing model
Constant prepayment rate 1.0% - 37.6% (8.6%)Constant default rate 0.0% - 12.2% (4.7%)Loss severity 25.0% - 95.7% (48.8%)Spread over the benchmark curve (b) 242bps weighted-average
Asset-backed securities 199 Priced by a third-party vendorusing a discounted cash flowpricing model
Constant prepayment rate 1.0% - 22.0% (7.4%)Constant default rate 1.0% - 6.0% (3.3%)Loss severity 30.0% - 100.0% (58.1%)Spread over the benchmark curve (b) 291bps weighted-average
Loans - Residential real estate 434 Consensus pricing (c) Cumulative default rate 3.6% - 100.0% (82.1%)Loss severity 0.0% - 100.0% (11.2%)Discount rate 4.8% - 6.8% (5.1%)
132 Discounted cash flow Loss severity 8.0% weighted-averageDiscount rate 3.2% weighted-average
Loans - Home equity 21 Consensus pricing (c) Cumulative default rate 3.6% - 100.0% (88.5%)Loss severity 0.0% - 98.4% (33.3%)
Discount rate 4.8% - 6.8% (6.3%)
60 Consensus pricing (c) Credit and liquidity discount 17.5% - 97.0% (57.7%)Equity investments 1,263 Multiple of adjusted earnings Multiple of earnings 5.0x - 15.9x (8.7x)Residential mortgage servicing rights 673 Discounted cash flow Constant prepayment rate 0.0% - 77.5% (21.1%)
Spread over the benchmark curve (b) 325bps - 2,783bps (922bps)Commercial mortgage servicing rights 569 Discounted cash flow Constant prepayment rate 4.0% - 16.1% (4.9%)
Discount rate 4.7% - 7.8% (7.3%)Financial derivatives - Swaps related tosales of certain Visa Class Bcommon shares
(252) Discounted cash flow Estimated conversion factor of VisaClass B shares into Class A shares 162.3% weighted-averageEstimated annual growth rate of VisaClass A share price 16.0%Estimated length of litigation resolutiondate Q2 2022
Insignificant Level 3 assets, net ofliabilities (d)
298
Total Level 3 assets, net of liabilities (e) $ 4,819
154 The PNC Financial Services Group, Inc. – 2020 Form 10-K
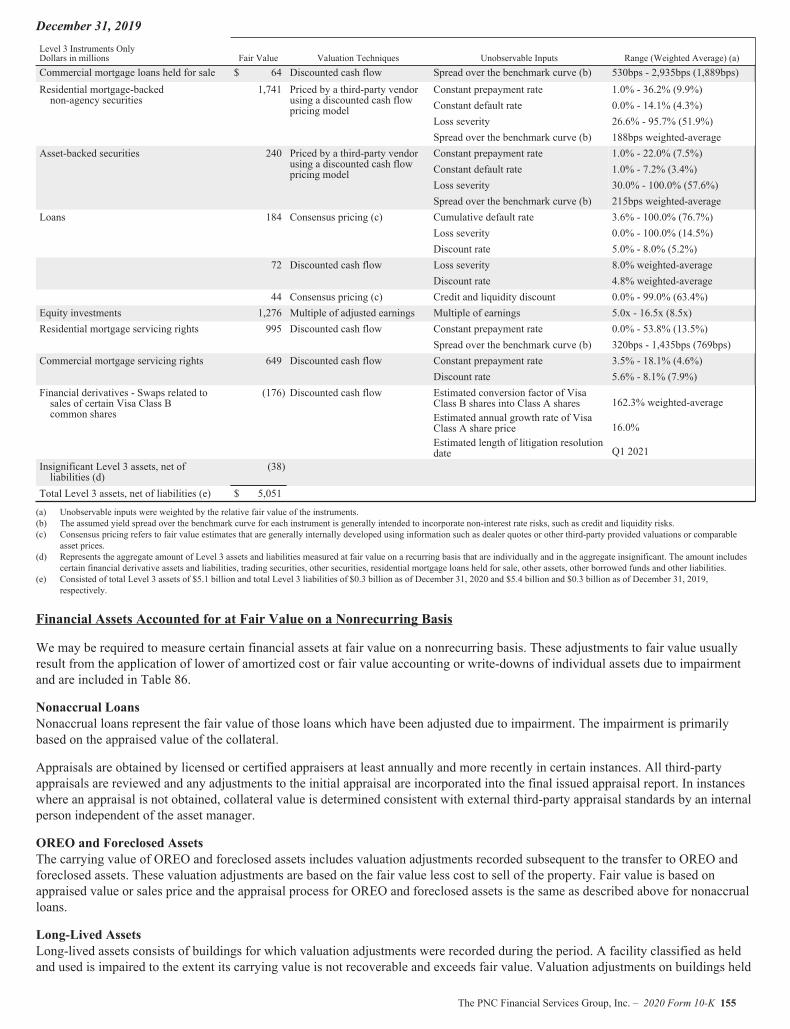
December 31, 2019Level 3 Instruments OnlyDollars in millions Fair Value Valuation Techniques Unobservable Inputs Range (Weighted Average) (a)Commercial mortgage loans held for sale $ 64 Discounted cash flow Spread over the benchmark curve (b) 530bps - 2,935bps (1,889bps)Residential mortgage-backednon-agency securities
1,741 Priced by a third-party vendorusing a discounted cash flowpricing model
Constant prepayment rate 1.0% - 36.2% (9.9%)Constant default rate 0.0% - 14.1% (4.3%)Loss severity 26.6% - 95.7% (51.9%)Spread over the benchmark curve (b) 188bps weighted-average
Asset-backed securities 240 Priced by a third-party vendorusing a discounted cash flowpricing model
Constant prepayment rate 1.0% - 22.0% (7.5%)Constant default rate 1.0% - 7.2% (3.4%)Loss severity 30.0% - 100.0% (57.6%)Spread over the benchmark curve (b) 215bps weighted-average
Loans 184 Consensus pricing (c) Cumulative default rate 3.6% - 100.0% (76.7%)Loss severity 0.0% - 100.0% (14.5%)Discount rate 5.0% - 8.0% (5.2%)
72 Discounted cash flow Loss severity 8.0% weighted-averageDiscount rate 4.8% weighted-average
44 Consensus pricing (c) Credit and liquidity discount 0.0% - 99.0% (63.4%)Equity investments 1,276 Multiple of adjusted earnings Multiple of earnings 5.0x - 16.5x (8.5x)Residential mortgage servicing rights 995 Discounted cash flow Constant prepayment rate 0.0% - 53.8% (13.5%)
Spread over the benchmark curve (b) 320bps - 1,435bps (769bps)Commercial mortgage servicing rights 649 Discounted cash flow Constant prepayment rate 3.5% - 18.1% (4.6%)
Discount rate 5.6% - 8.1% (7.9%)Financial derivatives - Swaps related tosales of certain Visa Class Bcommon shares
(176) Discounted cash flow Estimated conversion factor of VisaClass B shares into Class A shares 162.3% weighted-averageEstimated annual growth rate of VisaClass A share price 16.0%Estimated length of litigation resolutiondate Q1 2021
Insignificant Level 3 assets, net ofliabilities (d)
(38)
Total Level 3 assets, net of liabilities (e) $ 5,051
(a) Unobservable inputs were weighted by the relative fair value of the instruments.(b) The assumed yield spread over the benchmark curve for each instrument is generally intended to incorporate non-interest rate risks, such as credit and liquidity risks.(c) Consensus pricing refers to fair value estimates that are generally internally developed using information such as dealer quotes or other third-party provided valuations or comparable
asset prices.(d) Represents the aggregate amount of Level 3 assets and liabilities measured at fair value on a recurring basis that are individually and in the aggregate insignificant. The amount includes
certain financial derivative assets and liabilities, trading securities, other securities, residential mortgage loans held for sale, other assets, other borrowed funds and other liabilities.(e) Consisted of total Level 3 assets of $5.1 billion and total Level 3 liabilities of $0.3 billion as of December 31, 2020 and $5.4 billion and $0.3 billion as of December 31, 2019,
respectively.
Financial Assets Accounted for at Fair Value on a Nonrecurring Basis
We may be required to measure certain financial assets at fair value on a nonrecurring basis. These adjustments to fair value usuallyresult from the application of lower of amortized cost or fair value accounting or write-downs of individual assets due to impairmentand are included in Table 86.
Nonaccrual LoansNonaccrual loans represent the fair value of those loans which have been adjusted due to impairment. The impairment is primarilybased on the appraised value of the collateral.
Appraisals are obtained by licensed or certified appraisers at least annually and more recently in certain instances. All third-partyappraisals are reviewed and any adjustments to the initial appraisal are incorporated into the final issued appraisal report. In instanceswhere an appraisal is not obtained, collateral value is determined consistent with external third-party appraisal standards by an internalperson independent of the asset manager.
OREO and Foreclosed AssetsThe carrying value of OREO and foreclosed assets includes valuation adjustments recorded subsequent to the transfer to OREO andforeclosed assets. These valuation adjustments are based on the fair value less cost to sell of the property. Fair value is based onappraised value or sales price and the appraisal process for OREO and foreclosed assets is the same as described above for nonaccrualloans.
Long-Lived AssetsLong-lived assets consists of buildings for which valuation adjustments were recorded during the period. A facility classified as heldand used is impaired to the extent its carrying value is not recoverable and exceeds fair value. Valuation adjustments on buildings held
The PNC Financial Services Group, Inc. – 2020 Form 10-K 155
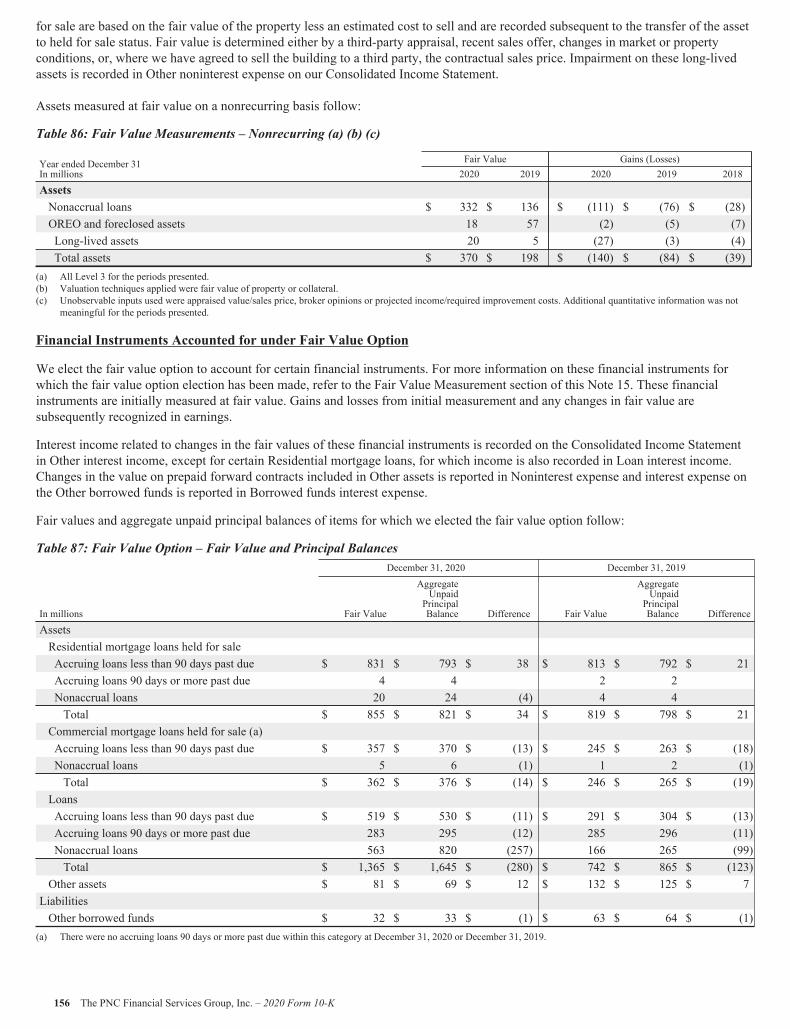
for sale are based on the fair value of the property less an estimated cost to sell and are recorded subsequent to the transfer of the assetto held for sale status. Fair value is determined either by a third-party appraisal, recent sales offer, changes in market or propertyconditions, or, where we have agreed to sell the building to a third party, the contractual sales price. Impairment on these long-livedassets is recorded in Other noninterest expense on our Consolidated Income Statement.
Assets measured at fair value on a nonrecurring basis follow:
Table 86: Fair Value Measurements – Nonrecurring (a) (b) (c)
Year ended December 31In millions
Fair Value Gains (Losses)2020 2019 2020 2019 2018
AssetsNonaccrual loans $ 332 $ 136 $ (111) $ (76) $ (28)OREO and foreclosed assets 18 57 (2) (5) (7)Long-lived assets 20 5 (27) (3) (4)Total assets $ 370 $ 198 $ (140) $ (84) $ (39)
(a) All Level 3 for the periods presented.(b) Valuation techniques applied were fair value of property or collateral.(c) Unobservable inputs used were appraised value/sales price, broker opinions or projected income/required improvement costs. Additional quantitative information was not
meaningful for the periods presented.
Financial Instruments Accounted for under Fair Value Option
We elect the fair value option to account for certain financial instruments. For more information on these financial instruments forwhich the fair value option election has been made, refer to the Fair Value Measurement section of this Note 15. These financialinstruments are initially measured at fair value. Gains and losses from initial measurement and any changes in fair value aresubsequently recognized in earnings.
Interest income related to changes in the fair values of these financial instruments is recorded on the Consolidated Income Statementin Other interest income, except for certain Residential mortgage loans, for which income is also recorded in Loan interest income.Changes in the value on prepaid forward contracts included in Other assets is reported in Noninterest expense and interest expense onthe Other borrowed funds is reported in Borrowed funds interest expense.
Fair values and aggregate unpaid principal balances of items for which we elected the fair value option follow:
Table 87: Fair Value Option – Fair Value and Principal BalancesDecember 31, 2020 December 31, 2019
In millions Fair Value
AggregateUnpaidPrincipalBalance Difference Fair Value
AggregateUnpaidPrincipalBalance Difference
AssetsResidential mortgage loans held for saleAccruing loans less than 90 days past due $ 831 $ 793 $ 38 $ 813 $ 792 $ 21Accruing loans 90 days or more past due 4 4 2 2Nonaccrual loans 20 24 (4) 4 4Total $ 855 $ 821 $ 34 $ 819 $ 798 $ 21
Commercial mortgage loans held for sale (a)Accruing loans less than 90 days past due $ 357 $ 370 $ (13) $ 245 $ 263 $ (18)Nonaccrual loans 5 6 (1) 1 2 (1)Total $ 362 $ 376 $ (14) $ 246 $ 265 $ (19)
LoansAccruing loans less than 90 days past due $ 519 $ 530 $ (11) $ 291 $ 304 $ (13)Accruing loans 90 days or more past due 283 295 (12) 285 296 (11)Nonaccrual loans 563 820 (257) 166 265 (99)Total $ 1,365 $ 1,645 $ (280) $ 742 $ 865 $ (123)
Other assets $ 81 $ 69 $ 12 $ 132 $ 125 $ 7LiabilitiesOther borrowed funds $ 32 $ 33 $ (1) $ 63 $ 64 $ (1)
(a) There were no accruing loans 90 days or more past due within this category at December 31, 2020 or December 31, 2019.
156 The PNC Financial Services Group, Inc. – 2020 Form 10-K

The changes in fair value for items for which we elected the fair value option are as follows:
Table 88: Fair Value Option – Changes in Fair Value (a)
Year ended December 31In millions
Gains (Losses)2020 2019 2018
AssetsResidential mortgage loans held for sale $ 198 $ 84 $ 38Commercial mortgage loans held for sale $ 128 $ 61 $ 67Loans $ 44 $ 23 $ 24Other assets $ (3) $ 40 $ (40)
(a) The impact on earnings of offsetting hedged items or hedging instruments is not reflected in these amounts.
Additional Fair Value Information Related to Financial Instruments Not Recorded at Fair Value
This section presents fair value information for all other financial instruments that are not recorded on the Consolidated Balance Sheetat fair value. We used the following methods and assumptions to estimate the fair value amounts for these financial instruments.
Cash and Due from Banks and Interest-earning Deposits with BanksDue to their short-term nature, the carrying amounts for Cash and due from banks and Interest-earning deposits with banks reported onour Consolidated Balance Sheet approximate fair value.
Securities Held to MaturityWe primarily use prices obtained from pricing services, dealer quotes or recent trades to determine the fair value of securities. Refer tothe Fair Value Measurement section of this Note 15 for additional information relating to our pricing processes and procedures.
Net LoansFair values are estimated based on the discounted value of expected net cash flows incorporating assumptions about prepayment rates,net credit losses and servicing fees. Nonaccrual loans are valued at their estimated recovery value. Loans are presented net of theALLL.
Other AssetsOther assets includes accrued interest receivable, cash collateral, federal funds sold and resale agreements, certain loans held for sale,and FHLB and FRB stock. The aggregate carrying value of our FHLB and FRB stock was $1.1 billion and $1.6 billion atDecember 31, 2020 and 2019, respectively, which approximated fair value at each date.
DepositsFor time deposits, fair values are estimated by discounting contractual cash flows using current market rates for instruments withsimilar maturities. For deposits with no defined maturity, such as noninterest-bearing and interest-bearing demand and interest-bearingmoney market and savings deposits, carrying values approximate fair values.
Borrowed FundsFor short-term borrowed funds, including federal funds purchased, commercial paper, repurchase agreements and certain other short-term borrowings and payables, carrying values approximated fair values. For long-term borrowed funds, quoted market prices areused, when available, to estimate fair value. When quoted market prices are not available, fair value is estimated based on currentmarket interest rates and credit spreads for debt with similar terms and maturities.
Unfunded Lending Related Commitments and Letters of CreditThe fair value of unfunded lending related commitments and letters of credit is determined from a market participant’s view includingthe impact of changes in interest rates and credit. We establish a liability on these facilities related to the creditworthiness of ourcounterparty.
Other LiabilitiesOther liabilities includes interest-bearing cash collateral held related to derivatives and other accrued liabilities. Due to its short-termnature, the carrying value of Other liabilities reported on our Consolidated Balance Sheet approximates fair value.
The PNC Financial Services Group, Inc. – 2020 Form 10-K 157
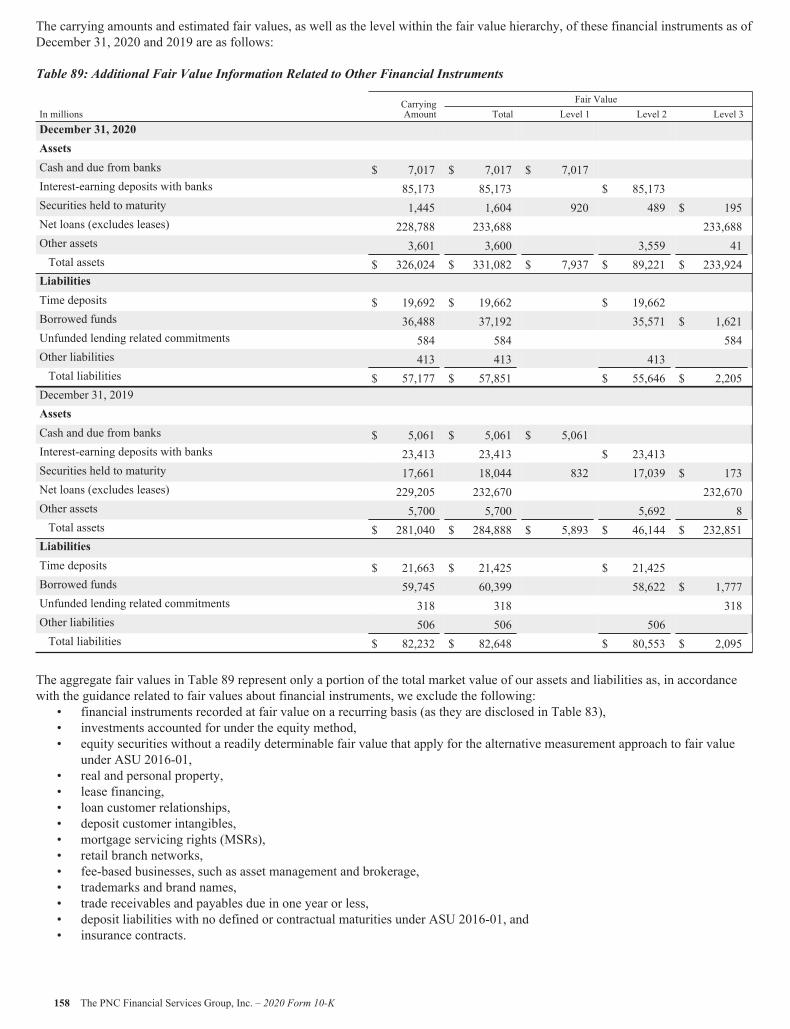
The carrying amounts and estimated fair values, as well as the level within the fair value hierarchy, of these financial instruments as ofDecember 31, 2020 and 2019 are as follows:
Table 89: Additional Fair Value Information Related to Other Financial Instruments
In millionsCarryingAmount
Fair ValueTotal Level 1 Level 2 Level 3
December 31, 2020AssetsCash and due from banks $ 7,017 $ 7,017 $ 7,017Interest-earning deposits with banks 85,173 85,173 $ 85,173Securities held to maturity 1,445 1,604 920 489 $ 195Net loans (excludes leases) 228,788 233,688 233,688Other assets 3,601 3,600 3,559 41Total assets $ 326,024 $ 331,082 $ 7,937 $ 89,221 $ 233,924LiabilitiesTime deposits $ 19,692 $ 19,662 $ 19,662Borrowed funds 36,488 37,192 35,571 $ 1,621Unfunded lending related commitments 584 584 584Other liabilities 413 413 413Total liabilities $ 57,177 $ 57,851 $ 55,646 $ 2,205December 31, 2019AssetsCash and due from banks $ 5,061 $ 5,061 $ 5,061Interest-earning deposits with banks 23,413 23,413 $ 23,413Securities held to maturity 17,661 18,044 832 17,039 $ 173Net loans (excludes leases) 229,205 232,670 232,670Other assets 5,700 5,700 5,692 8Total assets $ 281,040 $ 284,888 $ 5,893 $ 46,144 $ 232,851LiabilitiesTime deposits $ 21,663 $ 21,425 $ 21,425Borrowed funds 59,745 60,399 58,622 $ 1,777Unfunded lending related commitments 318 318 318Other liabilities 506 506 506Total liabilities $ 82,232 $ 82,648 $ 80,553 $ 2,095
The aggregate fair values in Table 89 represent only a portion of the total market value of our assets and liabilities as, in accordancewith the guidance related to fair values about financial instruments, we exclude the following:
• financial instruments recorded at fair value on a recurring basis (as they are disclosed in Table 83),• investments accounted for under the equity method,• equity securities without a readily determinable fair value that apply for the alternative measurement approach to fair value
under ASU 2016-01,• real and personal property,• lease financing,• loan customer relationships,• deposit customer intangibles,• mortgage servicing rights (MSRs),• retail branch networks,• fee-based businesses, such as asset management and brokerage,• trademarks and brand names,• trade receivables and payables due in one year or less,• deposit liabilities with no defined or contractual maturities under ASU 2016-01, and• insurance contracts.
158 The PNC Financial Services Group, Inc. – 2020 Form 10-K
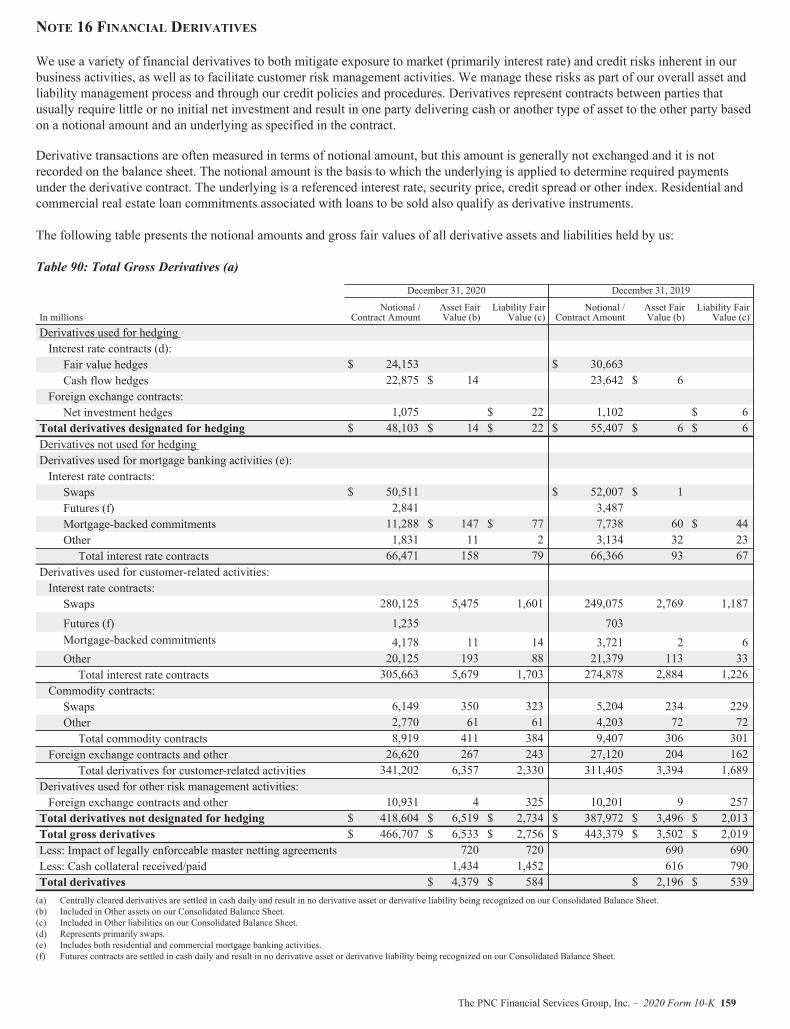
NOTE 16 FINANCIAL DERIVATIVES
We use a variety of financial derivatives to both mitigate exposure to market (primarily interest rate) and credit risks inherent in ourbusiness activities, as well as to facilitate customer risk management activities. We manage these risks as part of our overall asset andliability management process and through our credit policies and procedures. Derivatives represent contracts between parties thatusually require little or no initial net investment and result in one party delivering cash or another type of asset to the other party basedon a notional amount and an underlying as specified in the contract.
Derivative transactions are often measured in terms of notional amount, but this amount is generally not exchanged and it is notrecorded on the balance sheet. The notional amount is the basis to which the underlying is applied to determine required paymentsunder the derivative contract. The underlying is a referenced interest rate, security price, credit spread or other index. Residential andcommercial real estate loan commitments associated with loans to be sold also qualify as derivative instruments.
The following table presents the notional amounts and gross fair values of all derivative assets and liabilities held by us:
Table 90: Total Gross Derivatives (a)
December 31, 2020 December 31, 2019
In millionsNotional /
Contract AmountAsset FairValue (b)
Liability FairValue (c)
Notional /Contract Amount
Asset FairValue (b)
Liability FairValue (c)
Derivatives used for hedgingInterest rate contracts (d):Fair value hedges $ 24,153 $ 30,663Cash flow hedges 22,875 $ 14 23,642 $ 6
Foreign exchange contracts:Net investment hedges 1,075 $ 22 1,102 $ 6
Total derivatives designated for hedging $ 48,103 $ 14 $ 22 $ 55,407 $ 6 $ 6Derivatives not used for hedgingDerivatives used for mortgage banking activities (e):Interest rate contracts:Swaps $ 50,511 $ 52,007 $ 1Futures (f) 2,841 3,487Mortgage-backed commitments 11,288 $ 147 $ 77 7,738 60 $ 44Other 1,831 11 2 3,134 32 23Total interest rate contracts 66,471 158 79 66,366 93 67
Derivatives used for customer-related activities:Interest rate contracts:Swaps 280,125 5,475 1,601 249,075 2,769 1,187
Futures (f) 1,235 703Mortgage-backed commitments 4,178 11 14 3,721 2 6Other 20,125 193 88 21,379 113 33Total interest rate contracts 305,663 5,679 1,703 274,878 2,884 1,226
Commodity contracts:Swaps 6,149 350 323 5,204 234 229Other 2,770 61 61 4,203 72 72Total commodity contracts 8,919 411 384 9,407 306 301
Foreign exchange contracts and other 26,620 267 243 27,120 204 162Total derivatives for customer-related activities 341,202 6,357 2,330 311,405 3,394 1,689
Derivatives used for other risk management activities:Foreign exchange contracts and other 10,931 4 325 10,201 9 257Total derivatives not designated for hedging $ 418,604 $ 6,519 $ 2,734 $ 387,972 $ 3,496 $ 2,013Total gross derivatives $ 466,707 $ 6,533 $ 2,756 $ 443,379 $ 3,502 $ 2,019Less: Impact of legally enforceable master netting agreements 720 720 690 690Less: Cash collateral received/paid 1,434 1,452 616 790Total derivatives $ 4,379 $ 584 $ 2,196 $ 539(a) Centrally cleared derivatives are settled in cash daily and result in no derivative asset or derivative liability being recognized on our Consolidated Balance Sheet.(b) Included in Other assets on our Consolidated Balance Sheet.(c) Included in Other liabilities on our Consolidated Balance Sheet.(d) Represents primarily swaps.(e) Includes both residential and commercial mortgage banking activities.(f) Futures contracts are settled in cash daily and result in no derivative asset or derivative liability being recognized on our Consolidated Balance Sheet.
The PNC Financial Services Group, Inc. – 2020 Form 10-K 159
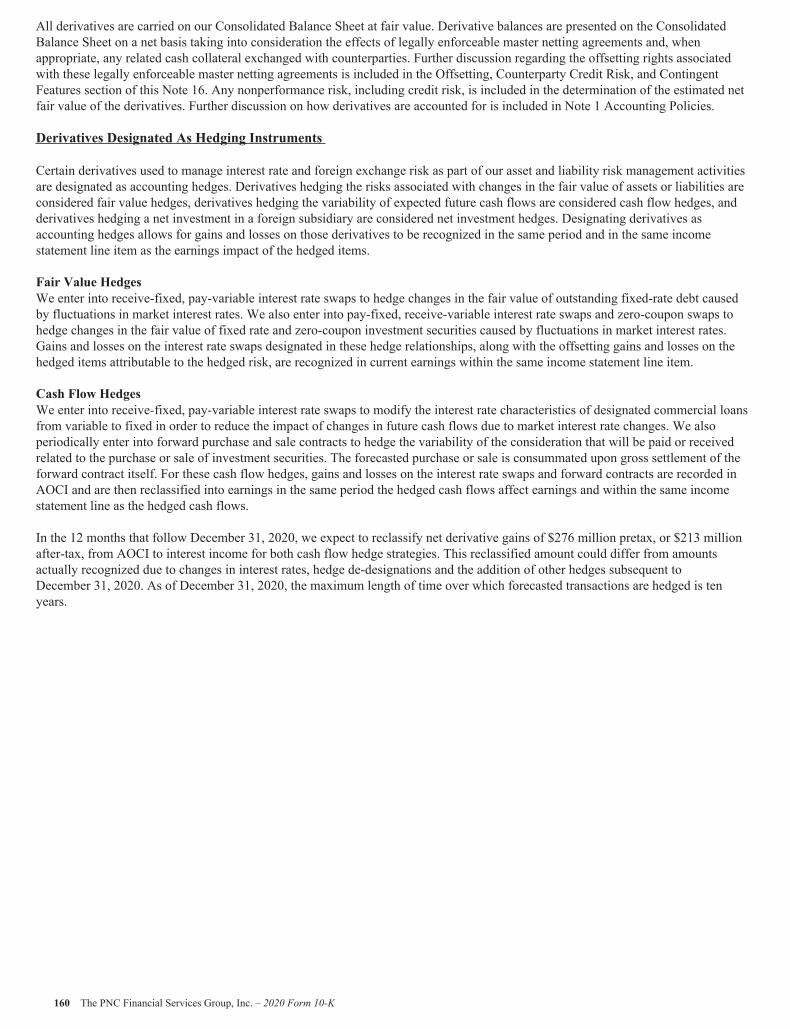
All derivatives are carried on our Consolidated Balance Sheet at fair value. Derivative balances are presented on the ConsolidatedBalance Sheet on a net basis taking into consideration the effects of legally enforceable master netting agreements and, whenappropriate, any related cash collateral exchanged with counterparties. Further discussion regarding the offsetting rights associatedwith these legally enforceable master netting agreements is included in the Offsetting, Counterparty Credit Risk, and ContingentFeatures section of this Note 16. Any nonperformance risk, including credit risk, is included in the determination of the estimated netfair value of the derivatives. Further discussion on how derivatives are accounted for is included in Note 1 Accounting Policies.
Derivatives Designated As Hedging Instruments
Certain derivatives used to manage interest rate and foreign exchange risk as part of our asset and liability risk management activitiesare designated as accounting hedges. Derivatives hedging the risks associated with changes in the fair value of assets or liabilities areconsidered fair value hedges, derivatives hedging the variability of expected future cash flows are considered cash flow hedges, andderivatives hedging a net investment in a foreign subsidiary are considered net investment hedges. Designating derivatives asaccounting hedges allows for gains and losses on those derivatives to be recognized in the same period and in the same incomestatement line item as the earnings impact of the hedged items.
Fair Value HedgesWe enter into receive-fixed, pay-variable interest rate swaps to hedge changes in the fair value of outstanding fixed-rate debt causedby fluctuations in market interest rates. We also enter into pay-fixed, receive-variable interest rate swaps and zero-coupon swaps tohedge changes in the fair value of fixed rate and zero-coupon investment securities caused by fluctuations in market interest rates.Gains and losses on the interest rate swaps designated in these hedge relationships, along with the offsetting gains and losses on thehedged items attributable to the hedged risk, are recognized in current earnings within the same income statement line item.
Cash Flow HedgesWe enter into receive-fixed, pay-variable interest rate swaps to modify the interest rate characteristics of designated commercial loansfrom variable to fixed in order to reduce the impact of changes in future cash flows due to market interest rate changes. We alsoperiodically enter into forward purchase and sale contracts to hedge the variability of the consideration that will be paid or receivedrelated to the purchase or sale of investment securities. The forecasted purchase or sale is consummated upon gross settlement of theforward contract itself. For these cash flow hedges, gains and losses on the interest rate swaps and forward contracts are recorded inAOCI and are then reclassified into earnings in the same period the hedged cash flows affect earnings and within the same incomestatement line as the hedged cash flows.
In the 12 months that follow December 31, 2020, we expect to reclassify net derivative gains of $276 million pretax, or $213 millionafter-tax, from AOCI to interest income for both cash flow hedge strategies. This reclassified amount could differ from amountsactually recognized due to changes in interest rates, hedge de-designations and the addition of other hedges subsequent toDecember 31, 2020. As of December 31, 2020, the maximum length of time over which forecasted transactions are hedged is tenyears.
160 The PNC Financial Services Group, Inc. – 2020 Form 10-K
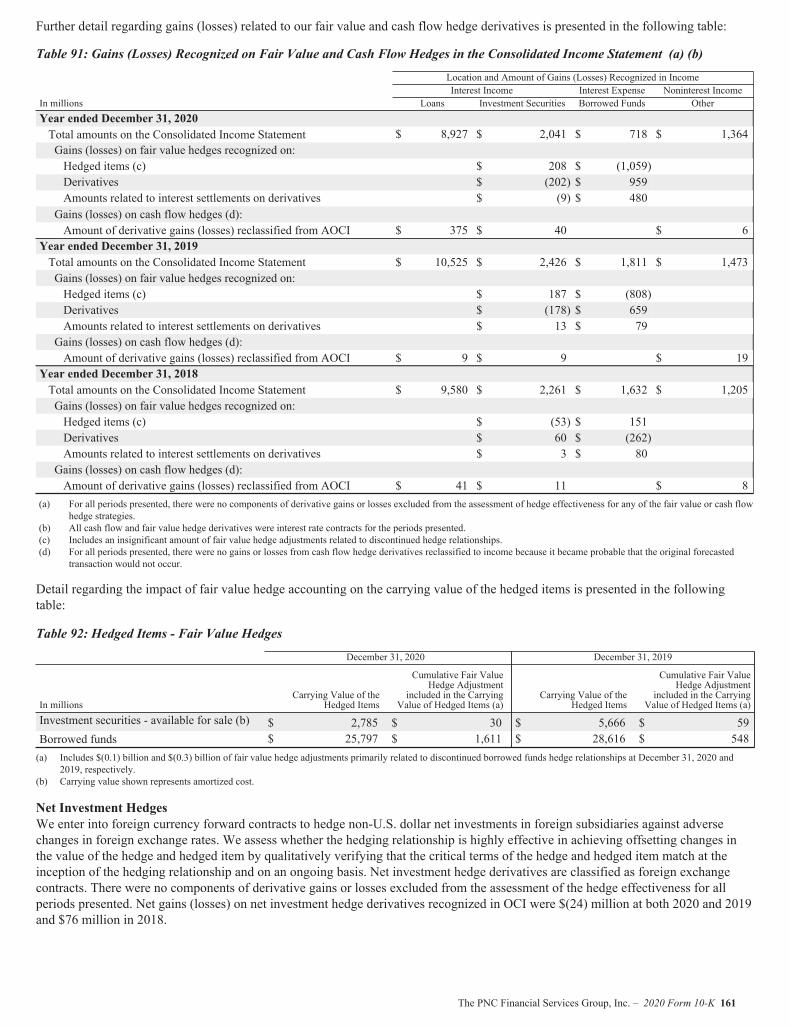
Further detail regarding gains (losses) related to our fair value and cash flow hedge derivatives is presented in the following table:
Table 91: Gains (Losses) Recognized on Fair Value and Cash Flow Hedges in the Consolidated Income Statement (a) (b)
Location and Amount of Gains (Losses) Recognized in IncomeInterest Income Interest Expense Noninterest Income
In millions Loans Investment Securities Borrowed Funds OtherYear ended December 31, 2020Total amounts on the Consolidated Income Statement $ 8,927 $ 2,041 $ 718 $ 1,364Gains (losses) on fair value hedges recognized on:Hedged items (c) $ 208 $ (1,059)Derivatives $ (202) $ 959Amounts related to interest settlements on derivatives $ (9) $ 480Gains (losses) on cash flow hedges (d):Amount of derivative gains (losses) reclassified from AOCI $ 375 $ 40 $ 6
Year ended December 31, 2019Total amounts on the Consolidated Income Statement $ 10,525 $ 2,426 $ 1,811 $ 1,473Gains (losses) on fair value hedges recognized on:Hedged items (c) $ 187 $ (808)Derivatives $ (178) $ 659Amounts related to interest settlements on derivatives $ 13 $ 79Gains (losses) on cash flow hedges (d):Amount of derivative gains (losses) reclassified from AOCI $ 9 $ 9 $ 19
Year ended December 31, 2018Total amounts on the Consolidated Income Statement $ 9,580 $ 2,261 $ 1,632 $ 1,205Gains (losses) on fair value hedges recognized on:Hedged items (c) $ (53) $ 151Derivatives $ 60 $ (262)Amounts related to interest settlements on derivatives $ 3 $ 80Gains (losses) on cash flow hedges (d):Amount of derivative gains (losses) reclassified from AOCI $ 41 $ 11 $ 8
(a) For all periods presented, there were no components of derivative gains or losses excluded from the assessment of hedge effectiveness for any of the fair value or cash flowhedge strategies.
(b) All cash flow and fair value hedge derivatives were interest rate contracts for the periods presented.(c) Includes an insignificant amount of fair value hedge adjustments related to discontinued hedge relationships.(d) For all periods presented, there were no gains or losses from cash flow hedge derivatives reclassified to income because it became probable that the original forecasted
transaction would not occur.
Detail regarding the impact of fair value hedge accounting on the carrying value of the hedged items is presented in the followingtable:
Table 92: Hedged Items - Fair Value Hedges
December 31, 2020 December 31, 2019
In millionsCarrying Value of the
Hedged Items
Cumulative Fair ValueHedge Adjustment
included in the CarryingValue of Hedged Items (a)
Carrying Value of theHedged Items
Cumulative Fair ValueHedge Adjustment
included in the CarryingValue of Hedged Items (a)
Investment securities - available for sale (b) $ 2,785 $ 30 $ 5,666 $ 59Borrowed funds $ 25,797 $ 1,611 $ 28,616 $ 548(a) Includes $(0.1) billion and $(0.3) billion of fair value hedge adjustments primarily related to discontinued borrowed funds hedge relationships at December 31, 2020 and
2019, respectively.(b) Carrying value shown represents amortized cost.
Net Investment HedgesWe enter into foreign currency forward contracts to hedge non-U.S. dollar net investments in foreign subsidiaries against adversechanges in foreign exchange rates. We assess whether the hedging relationship is highly effective in achieving offsetting changes inthe value of the hedge and hedged item by qualitatively verifying that the critical terms of the hedge and hedged item match at theinception of the hedging relationship and on an ongoing basis. Net investment hedge derivatives are classified as foreign exchangecontracts. There were no components of derivative gains or losses excluded from the assessment of the hedge effectiveness for allperiods presented. Net gains (losses) on net investment hedge derivatives recognized in OCI were $(24) million at both 2020 and 2019and $76 million in 2018.
The PNC Financial Services Group, Inc. – 2020 Form 10-K 161
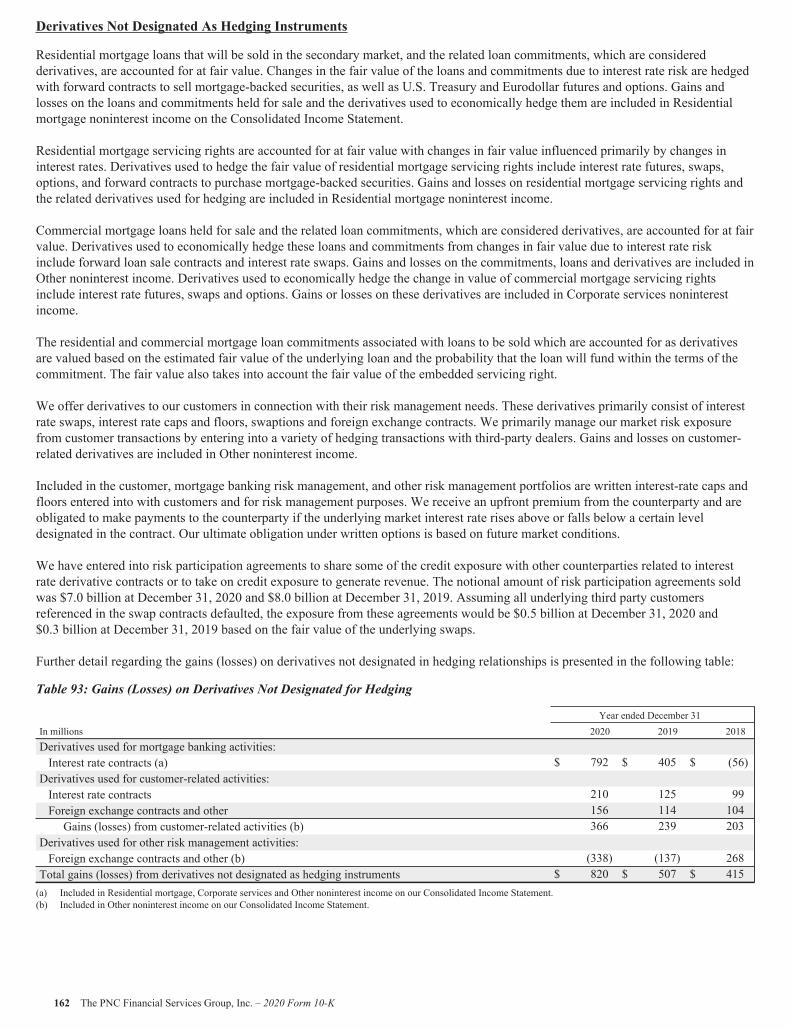
Derivatives Not Designated As Hedging Instruments
Residential mortgage loans that will be sold in the secondary market, and the related loan commitments, which are consideredderivatives, are accounted for at fair value. Changes in the fair value of the loans and commitments due to interest rate risk are hedgedwith forward contracts to sell mortgage-backed securities, as well as U.S. Treasury and Eurodollar futures and options. Gains andlosses on the loans and commitments held for sale and the derivatives used to economically hedge them are included in Residentialmortgage noninterest income on the Consolidated Income Statement.
Residential mortgage servicing rights are accounted for at fair value with changes in fair value influenced primarily by changes ininterest rates. Derivatives used to hedge the fair value of residential mortgage servicing rights include interest rate futures, swaps,options, and forward contracts to purchase mortgage-backed securities. Gains and losses on residential mortgage servicing rights andthe related derivatives used for hedging are included in Residential mortgage noninterest income.
Commercial mortgage loans held for sale and the related loan commitments, which are considered derivatives, are accounted for at fairvalue. Derivatives used to economically hedge these loans and commitments from changes in fair value due to interest rate riskinclude forward loan sale contracts and interest rate swaps. Gains and losses on the commitments, loans and derivatives are included inOther noninterest income. Derivatives used to economically hedge the change in value of commercial mortgage servicing rightsinclude interest rate futures, swaps and options. Gains or losses on these derivatives are included in Corporate services noninterestincome.
The residential and commercial mortgage loan commitments associated with loans to be sold which are accounted for as derivativesare valued based on the estimated fair value of the underlying loan and the probability that the loan will fund within the terms of thecommitment. The fair value also takes into account the fair value of the embedded servicing right.
We offer derivatives to our customers in connection with their risk management needs. These derivatives primarily consist of interestrate swaps, interest rate caps and floors, swaptions and foreign exchange contracts. We primarily manage our market risk exposurefrom customer transactions by entering into a variety of hedging transactions with third-party dealers. Gains and losses on customer-related derivatives are included in Other noninterest income.
Included in the customer, mortgage banking risk management, and other risk management portfolios are written interest-rate caps andfloors entered into with customers and for risk management purposes. We receive an upfront premium from the counterparty and areobligated to make payments to the counterparty if the underlying market interest rate rises above or falls below a certain leveldesignated in the contract. Our ultimate obligation under written options is based on future market conditions.
We have entered into risk participation agreements to share some of the credit exposure with other counterparties related to interestrate derivative contracts or to take on credit exposure to generate revenue. The notional amount of risk participation agreements soldwas $7.0 billion at December 31, 2020 and $8.0 billion at December 31, 2019. Assuming all underlying third party customersreferenced in the swap contracts defaulted, the exposure from these agreements would be $0.5 billion at December 31, 2020 and$0.3 billion at December 31, 2019 based on the fair value of the underlying swaps.
Further detail regarding the gains (losses) on derivatives not designated in hedging relationships is presented in the following table:
Table 93: Gains (Losses) on Derivatives Not Designated for Hedging
Year ended December 31In millions 2020 2019 2018Derivatives used for mortgage banking activities:Interest rate contracts (a) $ 792 $ 405 $ (56)Derivatives used for customer-related activities:Interest rate contracts 210 125 99Foreign exchange contracts and other 156 114 104Gains (losses) from customer-related activities (b) 366 239 203
Derivatives used for other risk management activities:Foreign exchange contracts and other (b) (338) (137) 268Total gains (losses) from derivatives not designated as hedging instruments $ 820 $ 507 $ 415(a) Included in Residential mortgage, Corporate services and Other noninterest income on our Consolidated Income Statement.(b) Included in Other noninterest income on our Consolidated Income Statement.
162 The PNC Financial Services Group, Inc. – 2020 Form 10-K
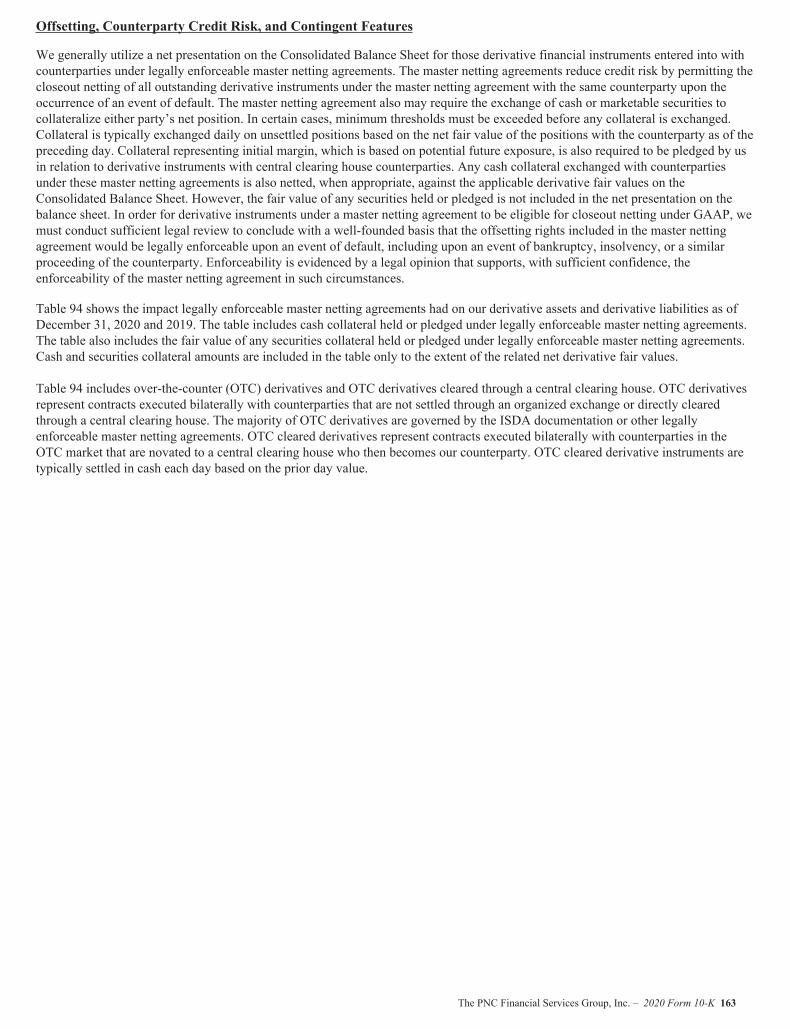
Offsetting, Counterparty Credit Risk, and Contingent Features
We generally utilize a net presentation on the Consolidated Balance Sheet for those derivative financial instruments entered into withcounterparties under legally enforceable master netting agreements. The master netting agreements reduce credit risk by permitting thecloseout netting of all outstanding derivative instruments under the master netting agreement with the same counterparty upon theoccurrence of an event of default. The master netting agreement also may require the exchange of cash or marketable securities tocollateralize either party’s net position. In certain cases, minimum thresholds must be exceeded before any collateral is exchanged.Collateral is typically exchanged daily on unsettled positions based on the net fair value of the positions with the counterparty as of thepreceding day. Collateral representing initial margin, which is based on potential future exposure, is also required to be pledged by usin relation to derivative instruments with central clearing house counterparties. Any cash collateral exchanged with counterpartiesunder these master netting agreements is also netted, when appropriate, against the applicable derivative fair values on theConsolidated Balance Sheet. However, the fair value of any securities held or pledged is not included in the net presentation on thebalance sheet. In order for derivative instruments under a master netting agreement to be eligible for closeout netting under GAAP, wemust conduct sufficient legal review to conclude with a well-founded basis that the offsetting rights included in the master nettingagreement would be legally enforceable upon an event of default, including upon an event of bankruptcy, insolvency, or a similarproceeding of the counterparty. Enforceability is evidenced by a legal opinion that supports, with sufficient confidence, theenforceability of the master netting agreement in such circumstances.
Table 94 shows the impact legally enforceable master netting agreements had on our derivative assets and derivative liabilities as ofDecember 31, 2020 and 2019. The table includes cash collateral held or pledged under legally enforceable master netting agreements.The table also includes the fair value of any securities collateral held or pledged under legally enforceable master netting agreements.Cash and securities collateral amounts are included in the table only to the extent of the related net derivative fair values.
Table 94 includes over-the-counter (OTC) derivatives and OTC derivatives cleared through a central clearing house. OTC derivativesrepresent contracts executed bilaterally with counterparties that are not settled through an organized exchange or directly clearedthrough a central clearing house. The majority of OTC derivatives are governed by the ISDA documentation or other legallyenforceable master netting agreements. OTC cleared derivatives represent contracts executed bilaterally with counterparties in theOTC market that are novated to a central clearing house who then becomes our counterparty. OTC cleared derivative instruments aretypically settled in cash each day based on the prior day value.
The PNC Financial Services Group, Inc. – 2020 Form 10-K 163
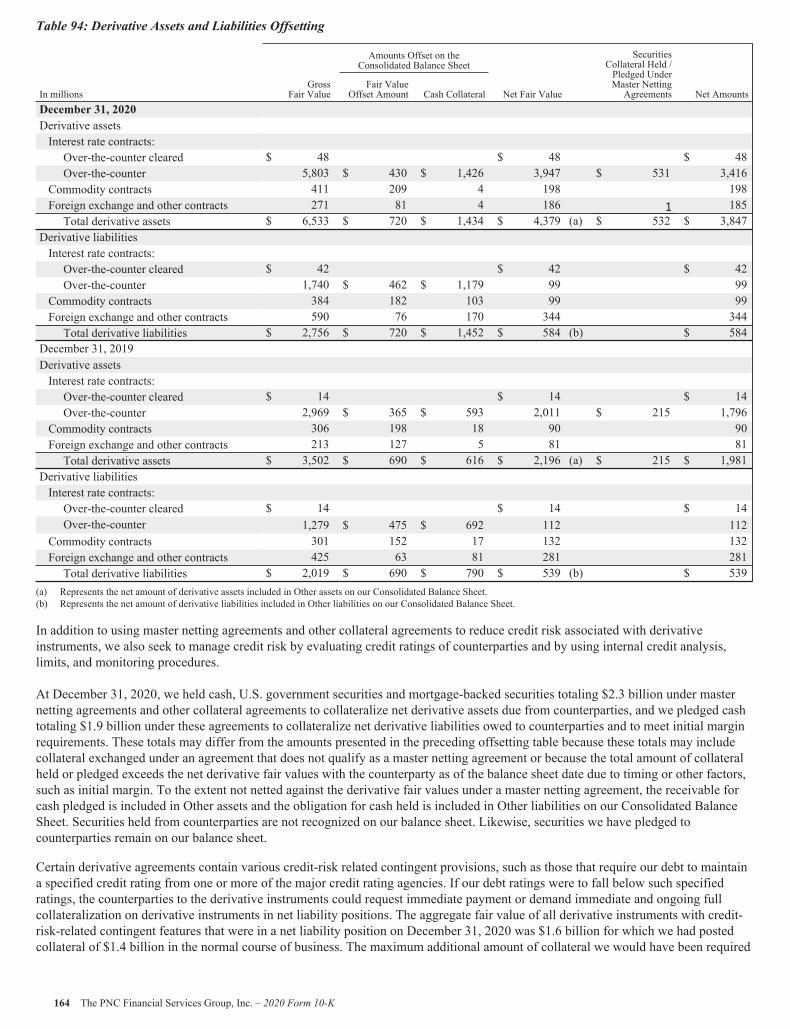
Table 94: Derivative Assets and Liabilities Offsetting
In millionsGross
Fair Value
Amounts Offset on theConsolidated Balance Sheet
Net Fair Value
SecuritiesCollateral Held /Pledged UnderMaster NettingAgreements Net Amounts
Fair ValueOffset Amount Cash Collateral
December 31, 2020Derivative assetsInterest rate contracts:Over-the-counter cleared $ 48 $ 48 $ 48Over-the-counter 5,803 $ 430 $ 1,426 3,947 $ 531 3,416
Commodity contracts 411 209 4 198 198Foreign exchange and other contracts 271 81 4 186 1 185Total derivative assets $ 6,533 $ 720 $ 1,434 $ 4,379 (a) $ 532 $ 3,847
Derivative liabilitiesInterest rate contracts:Over-the-counter cleared $ 42 $ 42 $ 42Over-the-counter 1,740 $ 462 $ 1,179 99 99
Commodity contracts 384 182 103 99 99Foreign exchange and other contracts 590 76 170 344 344Total derivative liabilities $ 2,756 $ 720 $ 1,452 $ 584 (b) $ 584
December 31, 2019Derivative assetsInterest rate contracts:Over-the-counter cleared $ 14 $ 14 $ 14Over-the-counter 2,969 $ 365 $ 593 2,011 $ 215 1,796
Commodity contracts 306 198 18 90 90Foreign exchange and other contracts 213 127 5 81 81Total derivative assets $ 3,502 $ 690 $ 616 $ 2,196 (a) $ 215 $ 1,981
Derivative liabilitiesInterest rate contracts:Over-the-counter cleared $ 14 $ 14 $ 14Over-the-counter 1,279 $ 475 $ 692 112 112
Commodity contracts 301 152 17 132 132Foreign exchange and other contracts 425 63 81 281 281Total derivative liabilities $ 2,019 $ 690 $ 790 $ 539 (b) $ 539
(a) Represents the net amount of derivative assets included in Other assets on our Consolidated Balance Sheet.(b) Represents the net amount of derivative liabilities included in Other liabilities on our Consolidated Balance Sheet.
In addition to using master netting agreements and other collateral agreements to reduce credit risk associated with derivativeinstruments, we also seek to manage credit risk by evaluating credit ratings of counterparties and by using internal credit analysis,limits, and monitoring procedures.
At December 31, 2020, we held cash, U.S. government securities and mortgage-backed securities totaling $2.3 billion under masternetting agreements and other collateral agreements to collateralize net derivative assets due from counterparties, and we pledged cashtotaling $1.9 billion under these agreements to collateralize net derivative liabilities owed to counterparties and to meet initial marginrequirements. These totals may differ from the amounts presented in the preceding offsetting table because these totals may includecollateral exchanged under an agreement that does not qualify as a master netting agreement or because the total amount of collateralheld or pledged exceeds the net derivative fair values with the counterparty as of the balance sheet date due to timing or other factors,such as initial margin. To the extent not netted against the derivative fair values under a master netting agreement, the receivable forcash pledged is included in Other assets and the obligation for cash held is included in Other liabilities on our Consolidated BalanceSheet. Securities held from counterparties are not recognized on our balance sheet. Likewise, securities we have pledged tocounterparties remain on our balance sheet.
Certain derivative agreements contain various credit-risk related contingent provisions, such as those that require our debt to maintaina specified credit rating from one or more of the major credit rating agencies. If our debt ratings were to fall below such specifiedratings, the counterparties to the derivative instruments could request immediate payment or demand immediate and ongoing fullcollateralization on derivative instruments in net liability positions. The aggregate fair value of all derivative instruments with credit-risk-related contingent features that were in a net liability position on December 31, 2020 was $1.6 billion for which we had postedcollateral of $1.4 billion in the normal course of business. The maximum additional amount of collateral we would have been required
164 The PNC Financial Services Group, Inc. – 2020 Form 10-K

to post if the credit-risk related contingent features underlying these agreements had been triggered on December 31, 2020 would be$0.2 billion.
NOTE 17 EMPLOYEE BENEFIT PLANS
Pension and Postretirement Plans
We have a noncontributory, qualified defined benefit pension plan covering eligible employees. Benefits are determined using a cashbalance formula where earnings credits are a percentage of eligible compensation. Earnings credit percentages for those employeeswho were plan participants on December 31, 2009 are frozen at the level earned to that point. Earnings credits for all employees whobecame participants on or after January 1, 2010 are a flat 3% of eligible compensation. All plan participants earn interest credits ontheir cash balances based on 30-year Treasury securities rates with those who were participants at December 31, 2009 earning aminimum rate. New participants on or after January 1, 2010 are not subject to the minimum rate. Beginning in 2018, the plan providesfor a minimum annual earnings credit amount of $2,000, subject to eligibility criteria. Pension contributions to the plan are typicallybased on an actuarially determined amount necessary to fund total benefits payable to plan participants. Assets of the qualified pensionplan are held in a separate Trust.
We also maintain nonqualified supplemental retirement plans for certain employees and provide certain health care and life insurancebenefits for qualifying retired employees (postretirement benefits) through various plans. PNC reserves the right to terminate or makechanges to these plans at any time. The nonqualified pension plan is unfunded. Contributions from PNC and, in the case of thepostretirement benefit plans, participant contributions cover all benefits paid under the nonqualified pension plan and postretirementbenefit plans. The postretirement plan provides benefits to certain retirees that are at least actuarially equivalent to those provided byMedicare Part D and accordingly, we receive a federal subsidy. PNC has established a VEBA to partially fund postretirement medicaland life insurance benefit obligations.
We use a measurement date of December 31 for plan assets and benefit obligations. The qualified pension plan assets and benefitobligation were re-measured as of January 31, 2019 as a result of a plan amendment.
A reconciliation of the changes in the projected benefit obligation for qualified pension, nonqualified pension and postretirementbenefit plans as well as the change in plan assets for the qualified pension plan follows:
The PNC Financial Services Group, Inc. – 2020 Form 10-K 165
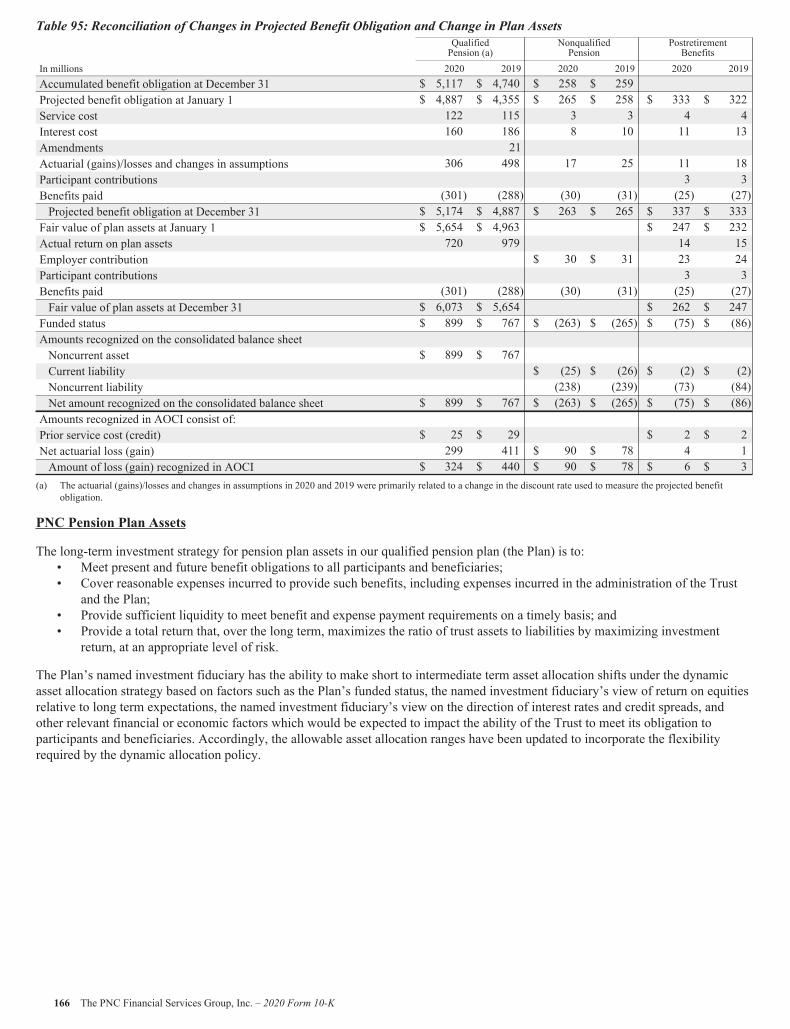
Table 95: Reconciliation of Changes in Projected Benefit Obligation and Change in Plan AssetsQualifiedPension (a)
NonqualifiedPension
PostretirementBenefits
In millions 2020 2019 2020 2019 2020 2019Accumulated benefit obligation at December 31 $ 5,117 $ 4,740 $ 258 $ 259Projected benefit obligation at January 1 $ 4,887 $ 4,355 $ 265 $ 258 $ 333 $ 322Service cost 122 115 3 3 4 4Interest cost 160 186 8 10 11 13Amendments 21Actuarial (gains)/losses and changes in assumptions 306 498 17 25 11 18Participant contributions 3 3Benefits paid (301) (288) (30) (31) (25) (27)Projected benefit obligation at December 31 $ 5,174 $ 4,887 $ 263 $ 265 $ 337 $ 333Fair value of plan assets at January 1 $ 5,654 $ 4,963 $ 247 $ 232Actual return on plan assets 720 979 14 15Employer contribution $ 30 $ 31 23 24Participant contributions 3 3Benefits paid (301) (288) (30) (31) (25) (27)Fair value of plan assets at December 31 $ 6,073 $ 5,654 $ 262 $ 247Funded status $ 899 $ 767 $ (263) $ (265) $ (75) $ (86)Amounts recognized on the consolidated balance sheetNoncurrent asset $ 899 $ 767Current liability $ (25) $ (26) $ (2) $ (2)Noncurrent liability (238) (239) (73) (84)Net amount recognized on the consolidated balance sheet $ 899 $ 767 $ (263) $ (265) $ (75) $ (86)Amounts recognized in AOCI consist of:Prior service cost (credit) $ 25 $ 29 $ 2 $ 2Net actuarial loss (gain) 299 411 $ 90 $ 78 4 1Amount of loss (gain) recognized in AOCI $ 324 $ 440 $ 90 $ 78 $ 6 $ 3
(a) The actuarial (gains)/losses and changes in assumptions in 2020 and 2019 were primarily related to a change in the discount rate used to measure the projected benefitobligation.
PNC Pension Plan Assets
The long-term investment strategy for pension plan assets in our qualified pension plan (the Plan) is to:• Meet present and future benefit obligations to all participants and beneficiaries;• Cover reasonable expenses incurred to provide such benefits, including expenses incurred in the administration of the Trust
and the Plan;• Provide sufficient liquidity to meet benefit and expense payment requirements on a timely basis; and• Provide a total return that, over the long term, maximizes the ratio of trust assets to liabilities by maximizing investment
return, at an appropriate level of risk.
The Plan’s named investment fiduciary has the ability to make short to intermediate term asset allocation shifts under the dynamicasset allocation strategy based on factors such as the Plan’s funded status, the named investment fiduciary’s view of return on equitiesrelative to long term expectations, the named investment fiduciary’s view on the direction of interest rates and credit spreads, andother relevant financial or economic factors which would be expected to impact the ability of the Trust to meet its obligation toparticipants and beneficiaries. Accordingly, the allowable asset allocation ranges have been updated to incorporate the flexibilityrequired by the dynamic allocation policy.
166 The PNC Financial Services Group, Inc. – 2020 Form 10-K
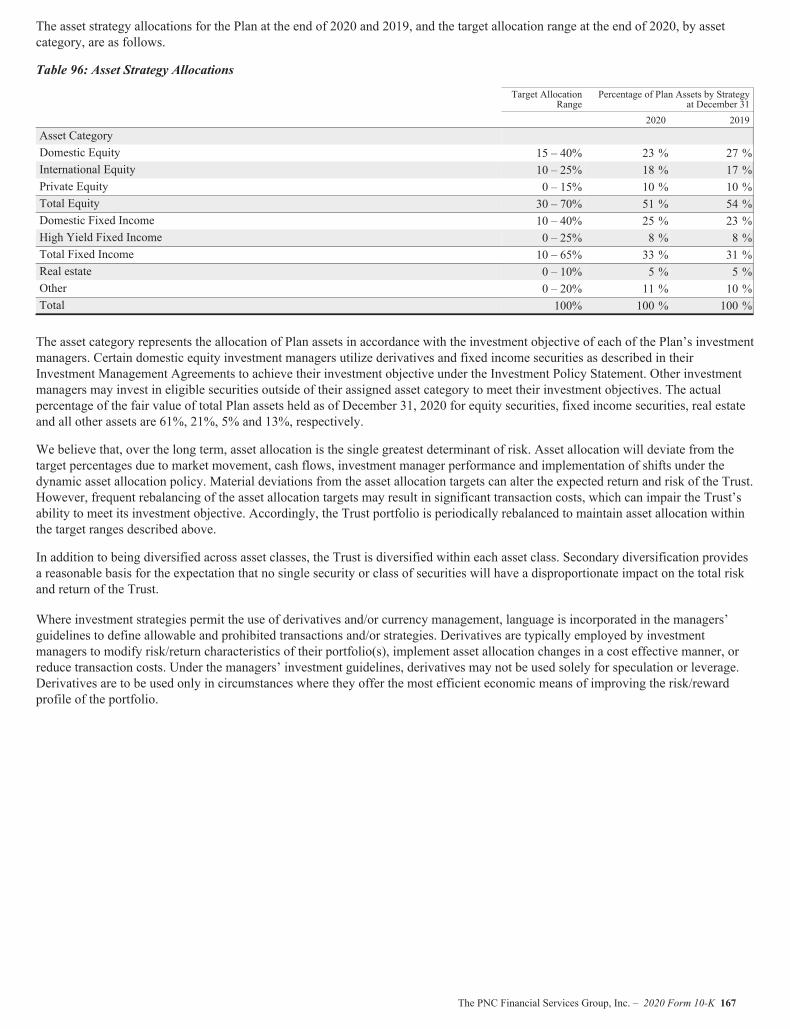
The asset strategy allocations for the Plan at the end of 2020 and 2019, and the target allocation range at the end of 2020, by assetcategory, are as follows.
Table 96: Asset Strategy Allocations
Target AllocationRange
Percentage of Plan Assets by Strategyat December 31
2020 2019Asset CategoryDomestic Equity 15 – 40% 23 % 27 %International Equity 10 – 25% 18 % 17 %Private Equity 0 – 15% 10 % 10 %Total Equity 30 – 70% 51 % 54 %Domestic Fixed Income 10 – 40% 25 % 23 %High Yield Fixed Income 0 – 25% 8 % 8 %Total Fixed Income 10 – 65% 33 % 31 %Real estate 0 – 10% 5 % 5 %Other 0 – 20% 11 % 10 %Total 100% 100 % 100 %
The asset category represents the allocation of Plan assets in accordance with the investment objective of each of the Plan’s investmentmanagers. Certain domestic equity investment managers utilize derivatives and fixed income securities as described in theirInvestment Management Agreements to achieve their investment objective under the Investment Policy Statement. Other investmentmanagers may invest in eligible securities outside of their assigned asset category to meet their investment objectives. The actualpercentage of the fair value of total Plan assets held as of December 31, 2020 for equity securities, fixed income securities, real estateand all other assets are 61%, 21%, 5% and 13%, respectively.
We believe that, over the long term, asset allocation is the single greatest determinant of risk. Asset allocation will deviate from thetarget percentages due to market movement, cash flows, investment manager performance and implementation of shifts under thedynamic asset allocation policy. Material deviations from the asset allocation targets can alter the expected return and risk of the Trust.However, frequent rebalancing of the asset allocation targets may result in significant transaction costs, which can impair the Trust’sability to meet its investment objective. Accordingly, the Trust portfolio is periodically rebalanced to maintain asset allocation withinthe target ranges described above.
In addition to being diversified across asset classes, the Trust is diversified within each asset class. Secondary diversification providesa reasonable basis for the expectation that no single security or class of securities will have a disproportionate impact on the total riskand return of the Trust.
Where investment strategies permit the use of derivatives and/or currency management, language is incorporated in the managers’guidelines to define allowable and prohibited transactions and/or strategies. Derivatives are typically employed by investmentmanagers to modify risk/return characteristics of their portfolio(s), implement asset allocation changes in a cost effective manner, orreduce transaction costs. Under the managers’ investment guidelines, derivatives may not be used solely for speculation or leverage.Derivatives are to be used only in circumstances where they offer the most efficient economic means of improving the risk/rewardprofile of the portfolio.
The PNC Financial Services Group, Inc. – 2020 Form 10-K 167
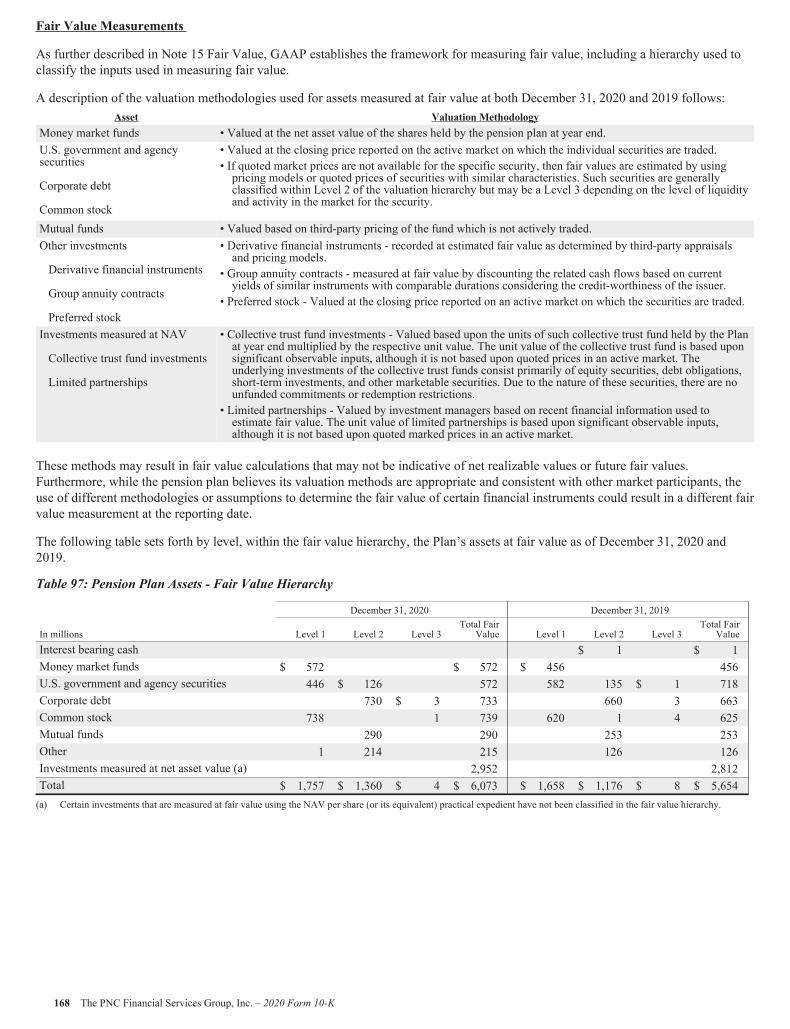
Fair Value Measurements
As further described in Note 15 Fair Value, GAAP establishes the framework for measuring fair value, including a hierarchy used toclassify the inputs used in measuring fair value.
A description of the valuation methodologies used for assets measured at fair value at both December 31, 2020 and 2019 follows:Asset Valuation Methodology
Money market funds • Valued at the net asset value of the shares held by the pension plan at year end.U.S. government and agencysecurities
Corporate debt
Common stock
• Valued at the closing price reported on the active market on which the individual securities are traded.• If quoted market prices are not available for the specific security, then fair values are estimated by usingpricing models or quoted prices of securities with similar characteristics. Such securities are generallyclassified within Level 2 of the valuation hierarchy but may be a Level 3 depending on the level of liquidityand activity in the market for the security.
Mutual funds • Valued based on third-party pricing of the fund which is not actively traded.Other investments
Derivative financial instruments
Group annuity contracts
Preferred stock
• Derivative financial instruments - recorded at estimated fair value as determined by third-party appraisalsand pricing models.
• Group annuity contracts - measured at fair value by discounting the related cash flows based on currentyields of similar instruments with comparable durations considering the credit-worthiness of the issuer.
• Preferred stock - Valued at the closing price reported on an active market on which the securities are traded.
Investments measured at NAV
Collective trust fund investments
Limited partnerships
• Collective trust fund investments - Valued based upon the units of such collective trust fund held by the Planat year end multiplied by the respective unit value. The unit value of the collective trust fund is based uponsignificant observable inputs, although it is not based upon quoted prices in an active market. Theunderlying investments of the collective trust funds consist primarily of equity securities, debt obligations,short-term investments, and other marketable securities. Due to the nature of these securities, there are nounfunded commitments or redemption restrictions.
• Limited partnerships - Valued by investment managers based on recent financial information used toestimate fair value. The unit value of limited partnerships is based upon significant observable inputs,although it is not based upon quoted marked prices in an active market.
These methods may result in fair value calculations that may not be indicative of net realizable values or future fair values.Furthermore, while the pension plan believes its valuation methods are appropriate and consistent with other market participants, theuse of different methodologies or assumptions to determine the fair value of certain financial instruments could result in a different fairvalue measurement at the reporting date.
The following table sets forth by level, within the fair value hierarchy, the Plan’s assets at fair value as of December 31, 2020 and2019.
Table 97: Pension Plan Assets - Fair Value Hierarchy
December 31, 2020 December 31, 2019
In millions Level 1 Level 2 Level 3Total Fair
Value Level 1 Level 2 Level 3Total Fair
ValueInterest bearing cash $ 1 $ 1Money market funds $ 572 $ 572 $ 456 456U.S. government and agency securities 446 $ 126 572 582 135 $ 1 718Corporate debt 730 $ 3 733 660 3 663Common stock 738 1 739 620 1 4 625Mutual funds 290 290 253 253Other 1 214 215 126 126Investments measured at net asset value (a) 2,952 2,812Total $ 1,757 $ 1,360 $ 4 $ 6,073 $ 1,658 $ 1,176 $ 8 $ 5,654(a) Certain investments that are measured at fair value using the NAV per share (or its equivalent) practical expedient have not been classified in the fair value hierarchy.
168 The PNC Financial Services Group, Inc. – 2020 Form 10-K
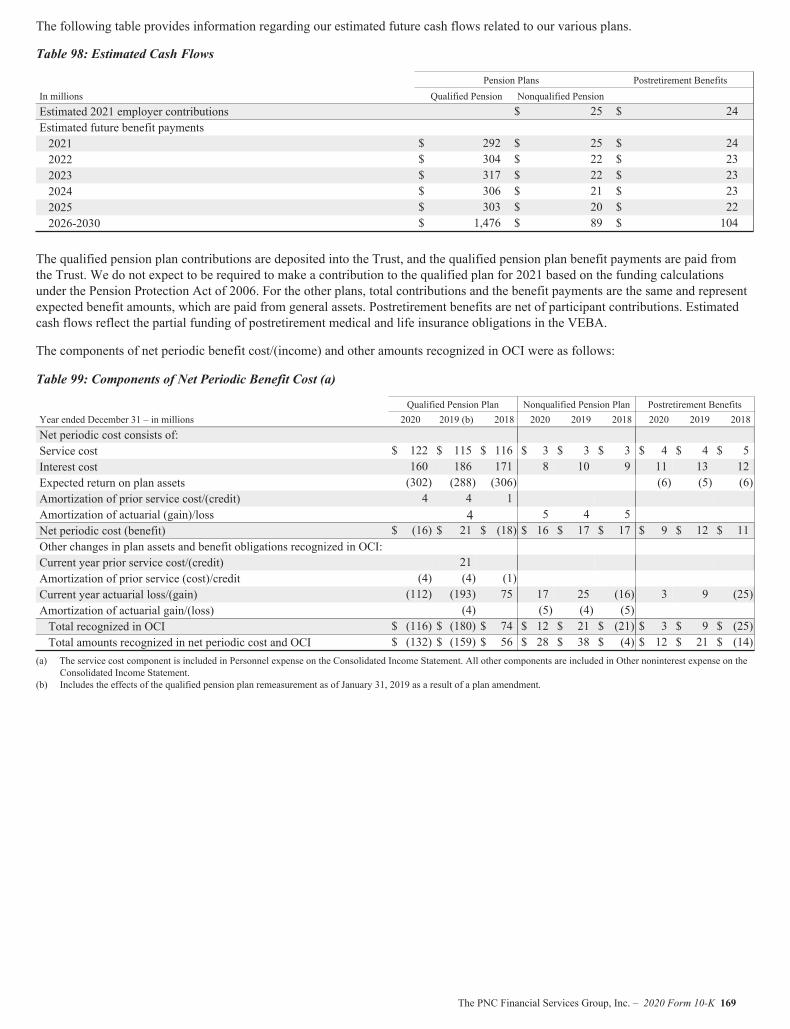
The following table provides information regarding our estimated future cash flows related to our various plans.
Table 98: Estimated Cash Flows
Pension Plans Postretirement BenefitsIn millions Qualified Pension Nonqualified PensionEstimated 2021 employer contributions $ 25 $ 24Estimated future benefit payments2021 $ 292 $ 25 $ 242022 $ 304 $ 22 $ 232023 $ 317 $ 22 $ 232024 $ 306 $ 21 $ 232025 $ 303 $ 20 $ 222026-2030 $ 1,476 $ 89 $ 104
The qualified pension plan contributions are deposited into the Trust, and the qualified pension plan benefit payments are paid fromthe Trust. We do not expect to be required to make a contribution to the qualified plan for 2021 based on the funding calculationsunder the Pension Protection Act of 2006. For the other plans, total contributions and the benefit payments are the same and representexpected benefit amounts, which are paid from general assets. Postretirement benefits are net of participant contributions. Estimatedcash flows reflect the partial funding of postretirement medical and life insurance obligations in the VEBA.
The components of net periodic benefit cost/(income) and other amounts recognized in OCI were as follows:
Table 99: Components of Net Periodic Benefit Cost (a)
Qualified Pension Plan Nonqualified Pension Plan Postretirement BenefitsYear ended December 31 – in millions 2020 2019 (b) 2018 2020 2019 2018 2020 2019 2018Net periodic cost consists of:Service cost $ 122 $ 115 $ 116 $ 3 $ 3 $ 3 $ 4 $ 4 $ 5Interest cost 160 186 171 8 10 9 11 13 12Expected return on plan assets (302) (288) (306) (6) (5) (6)Amortization of prior service cost/(credit) 4 4 1Amortization of actuarial (gain)/loss 4 5 4 5Net periodic cost (benefit) $ (16) $ 21 $ (18) $ 16 $ 17 $ 17 $ 9 $ 12 $ 11Other changes in plan assets and benefit obligations recognized in OCI:Current year prior service cost/(credit) 21Amortization of prior service (cost)/credit (4) (4) (1)Current year actuarial loss/(gain) (112) (193) 75 17 25 (16) 3 9 (25)Amortization of actuarial gain/(loss) (4) (5) (4) (5)Total recognized in OCI $ (116) $ (180) $ 74 $ 12 $ 21 $ (21) $ 3 $ 9 $ (25)Total amounts recognized in net periodic cost and OCI $ (132) $ (159) $ 56 $ 28 $ 38 $ (4) $ 12 $ 21 $ (14)
(a) The service cost component is included in Personnel expense on the Consolidated Income Statement. All other components are included in Other noninterest expense on theConsolidated Income Statement.
(b) Includes the effects of the qualified pension plan remeasurement as of January 31, 2019 as a result of a plan amendment.
The PNC Financial Services Group, Inc. – 2020 Form 10-K 169
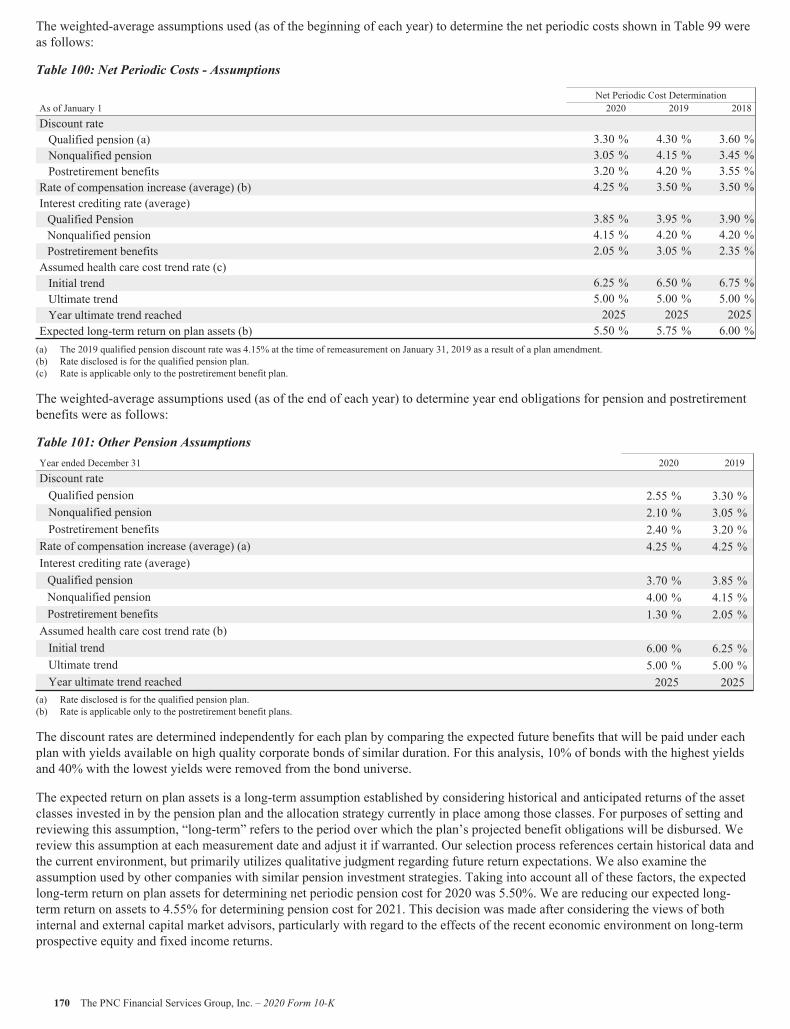
The weighted-average assumptions used (as of the beginning of each year) to determine the net periodic costs shown in Table 99 wereas follows:
Table 100: Net Periodic Costs - Assumptions
Net Periodic Cost DeterminationAs of January 1 2020 2019 2018Discount rateQualified pension (a) 3.30 % 4.30 % 3.60 %Nonqualified pension 3.05 % 4.15 % 3.45 %Postretirement benefits 3.20 % 4.20 % 3.55 %Rate of compensation increase (average) (b) 4.25 % 3.50 % 3.50 %Interest crediting rate (average)Qualified Pension 3.85 % 3.95 % 3.90 %Nonqualified pension 4.15 % 4.20 % 4.20 %Postretirement benefits 2.05 % 3.05 % 2.35 %Assumed health care cost trend rate (c)Initial trend 6.25 % 6.50 % 6.75 %Ultimate trend 5.00 % 5.00 % 5.00 %Year ultimate trend reached 2025 2025 2025Expected long-term return on plan assets (b) 5.50 % 5.75 % 6.00 %(a) The 2019 qualified pension discount rate was 4.15% at the time of remeasurement on January 31, 2019 as a result of a plan amendment.(b) Rate disclosed is for the qualified pension plan.(c) Rate is applicable only to the postretirement benefit plan.
The weighted-average assumptions used (as of the end of each year) to determine year end obligations for pension and postretirementbenefits were as follows:
Table 101: Other Pension AssumptionsYear ended December 31 2020 2019Discount rateQualified pension 2.55 % 3.30 %Nonqualified pension 2.10 % 3.05 %Postretirement benefits 2.40 % 3.20 %Rate of compensation increase (average) (a) 4.25 % 4.25 %Interest crediting rate (average)Qualified pension 3.70 % 3.85 %Nonqualified pension 4.00 % 4.15 %Postretirement benefits 1.30 % 2.05 %Assumed health care cost trend rate (b)Initial trend 6.00 % 6.25 %Ultimate trend 5.00 % 5.00 %Year ultimate trend reached 2025 2025
(a) Rate disclosed is for the qualified pension plan.(b) Rate is applicable only to the postretirement benefit plans.
The discount rates are determined independently for each plan by comparing the expected future benefits that will be paid under eachplan with yields available on high quality corporate bonds of similar duration. For this analysis, 10% of bonds with the highest yieldsand 40% with the lowest yields were removed from the bond universe.
The expected return on plan assets is a long-term assumption established by considering historical and anticipated returns of the assetclasses invested in by the pension plan and the allocation strategy currently in place among those classes. For purposes of setting andreviewing this assumption, “long-term” refers to the period over which the plan’s projected benefit obligations will be disbursed. Wereview this assumption at each measurement date and adjust it if warranted. Our selection process references certain historical data andthe current environment, but primarily utilizes qualitative judgment regarding future return expectations. We also examine theassumption used by other companies with similar pension investment strategies. Taking into account all of these factors, the expectedlong-term return on plan assets for determining net periodic pension cost for 2020 was 5.50%. We are reducing our expected long-term return on assets to 4.55% for determining pension cost for 2021. This decision was made after considering the views of bothinternal and external capital market advisors, particularly with regard to the effects of the recent economic environment on long-termprospective equity and fixed income returns.
170 The PNC Financial Services Group, Inc. – 2020 Form 10-K
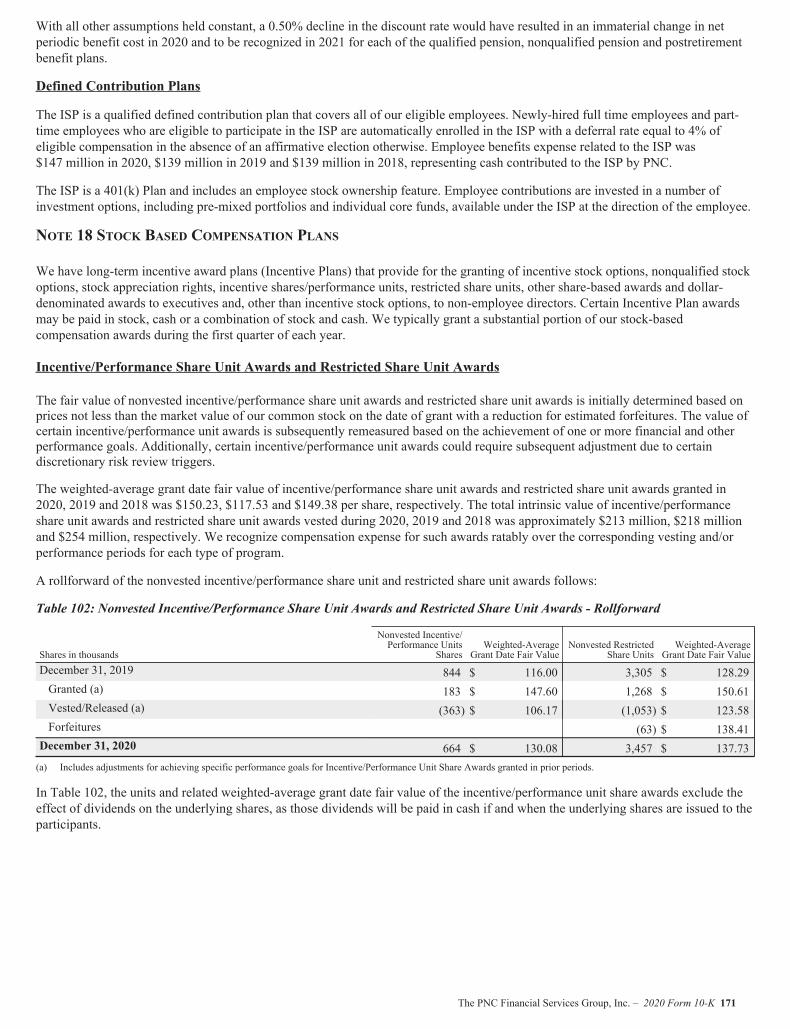
With all other assumptions held constant, a 0.50% decline in the discount rate would have resulted in an immaterial change in netperiodic benefit cost in 2020 and to be recognized in 2021 for each of the qualified pension, nonqualified pension and postretirementbenefit plans.
Defined Contribution Plans
The ISP is a qualified defined contribution plan that covers all of our eligible employees. Newly-hired full time employees and part-time employees who are eligible to participate in the ISP are automatically enrolled in the ISP with a deferral rate equal to 4% ofeligible compensation in the absence of an affirmative election otherwise. Employee benefits expense related to the ISP was$147 million in 2020, $139 million in 2019 and $139 million in 2018, representing cash contributed to the ISP by PNC.
The ISP is a 401(k) Plan and includes an employee stock ownership feature. Employee contributions are invested in a number ofinvestment options, including pre-mixed portfolios and individual core funds, available under the ISP at the direction of the employee.
NOTE 18 STOCK BASED COMPENSATION PLANS
We have long-term incentive award plans (Incentive Plans) that provide for the granting of incentive stock options, nonqualified stockoptions, stock appreciation rights, incentive shares/performance units, restricted share units, other share-based awards and dollar-denominated awards to executives and, other than incentive stock options, to non-employee directors. Certain Incentive Plan awardsmay be paid in stock, cash or a combination of stock and cash. We typically grant a substantial portion of our stock-basedcompensation awards during the first quarter of each year.
Incentive/Performance Share Unit Awards and Restricted Share Unit Awards
The fair value of nonvested incentive/performance share unit awards and restricted share unit awards is initially determined based onprices not less than the market value of our common stock on the date of grant with a reduction for estimated forfeitures. The value ofcertain incentive/performance unit awards is subsequently remeasured based on the achievement of one or more financial and otherperformance goals. Additionally, certain incentive/performance unit awards could require subsequent adjustment due to certaindiscretionary risk review triggers.
The weighted-average grant date fair value of incentive/performance share unit awards and restricted share unit awards granted in2020, 2019 and 2018 was $150.23, $117.53 and $149.38 per share, respectively. The total intrinsic value of incentive/performanceshare unit awards and restricted share unit awards vested during 2020, 2019 and 2018 was approximately $213 million, $218 millionand $254 million, respectively. We recognize compensation expense for such awards ratably over the corresponding vesting and/orperformance periods for each type of program.
A rollforward of the nonvested incentive/performance share unit and restricted share unit awards follows:
Table 102: Nonvested Incentive/Performance Share Unit Awards and Restricted Share Unit Awards - Rollforward
Shares in thousands
Nonvested Incentive/Performance Units
SharesWeighted-Average
Grant Date Fair ValueNonvested Restricted
Share UnitsWeighted-Average
Grant Date Fair ValueDecember 31, 2019 844 $ 116.00 3,305 $ 128.29Granted (a) 183 $ 147.60 1,268 $ 150.61Vested/Released (a) (363) $ 106.17 (1,053) $ 123.58Forfeitures (63) $ 138.41December 31, 2020 664 $ 130.08 3,457 $ 137.73(a) Includes adjustments for achieving specific performance goals for Incentive/Performance Unit Share Awards granted in prior periods.
In Table 102, the units and related weighted-average grant date fair value of the incentive/performance unit share awards exclude theeffect of dividends on the underlying shares, as those dividends will be paid in cash if and when the underlying shares are issued to theparticipants.
The PNC Financial Services Group, Inc. – 2020 Form 10-K 171
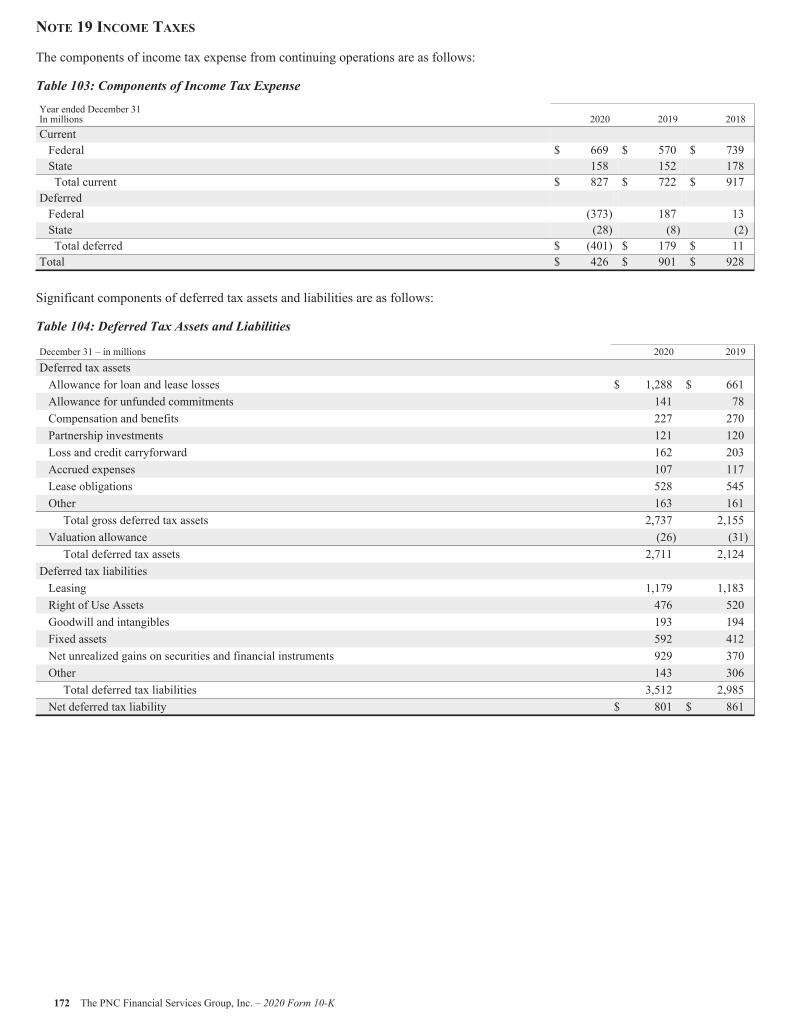
NOTE 19 INCOME TAXES
The components of income tax expense from continuing operations are as follows:
Table 103: Components of Income Tax Expense
Year ended December 31In millions 2020 2019 2018CurrentFederal $ 669 $ 570 $ 739State 158 152 178Total current $ 827 $ 722 $ 917
DeferredFederal (373) 187 13State (28) (8) (2)Total deferred $ (401) $ 179 $ 11
Total $ 426 $ 901 $ 928
Significant components of deferred tax assets and liabilities are as follows:
Table 104: Deferred Tax Assets and Liabilities
December 31 – in millions 2020 2019
Deferred tax assetsAllowance for loan and lease losses $ 1,288 $ 661Allowance for unfunded commitments 141 78Compensation and benefits 227 270Partnership investments 121 120Loss and credit carryforward 162 203Accrued expenses 107 117Lease obligations 528 545Other 163 161Total gross deferred tax assets 2,737 2,155
Valuation allowance (26) (31)Total deferred tax assets 2,711 2,124
Deferred tax liabilitiesLeasing 1,179 1,183Right of Use Assets 476 520Goodwill and intangibles 193 194Fixed assets 592 412Net unrealized gains on securities and financial instruments 929 370Other 143 306Total deferred tax liabilities 3,512 2,985
Net deferred tax liability $ 801 $ 861
172 The PNC Financial Services Group, Inc. – 2020 Form 10-K
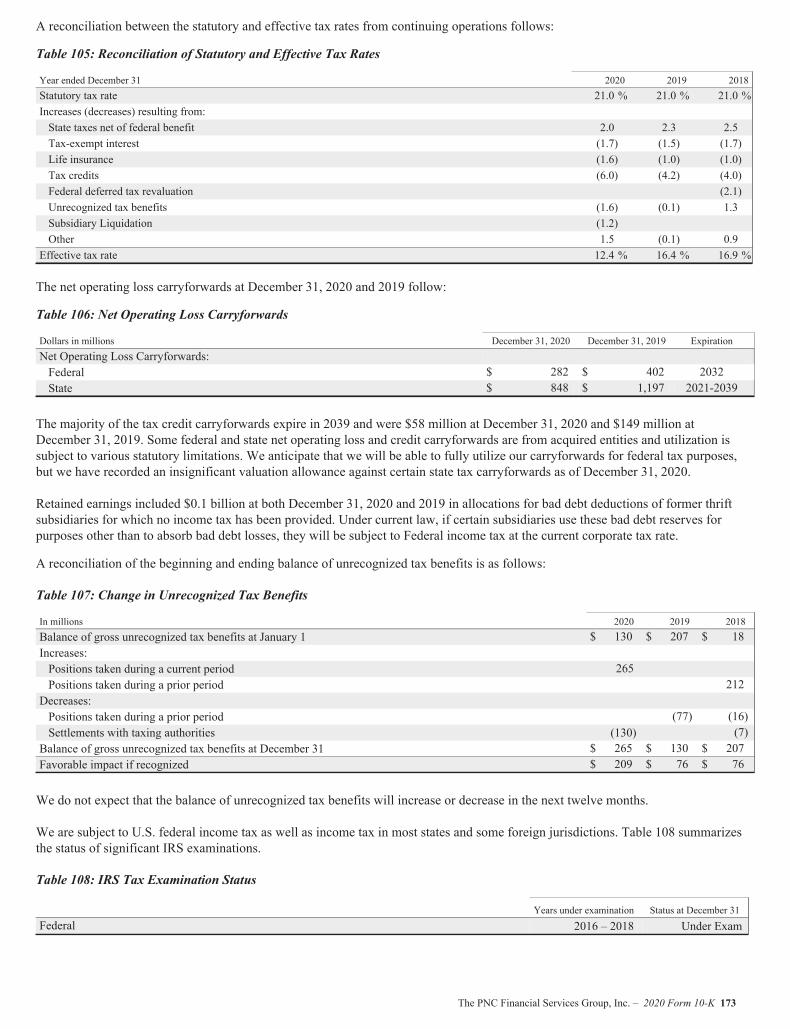
A reconciliation between the statutory and effective tax rates from continuing operations follows:
Table 105: Reconciliation of Statutory and Effective Tax Rates
Year ended December 31 2020 2019 2018Statutory tax rate 21.0 % 21.0 % 21.0 %Increases (decreases) resulting from:State taxes net of federal benefit 2.0 2.3 2.5Tax-exempt interest (1.7) (1.5) (1.7)Life insurance (1.6) (1.0) (1.0)Tax credits (6.0) (4.2) (4.0)Federal deferred tax revaluation (2.1)Unrecognized tax benefits (1.6) (0.1) 1.3Subsidiary Liquidation (1.2)Other 1.5 (0.1) 0.9
Effective tax rate 12.4 % 16.4 % 16.9 %
The net operating loss carryforwards at December 31, 2020 and 2019 follow:
Table 106: Net Operating Loss Carryforwards
Dollars in millions December 31, 2020 December 31, 2019 ExpirationNet Operating Loss Carryforwards:Federal $ 282 $ 402 2032State $ 848 $ 1,197 2021-2039
The majority of the tax credit carryforwards expire in 2039 and were $58 million at December 31, 2020 and $149 million atDecember 31, 2019. Some federal and state net operating loss and credit carryforwards are from acquired entities and utilization issubject to various statutory limitations. We anticipate that we will be able to fully utilize our carryforwards for federal tax purposes,but we have recorded an insignificant valuation allowance against certain state tax carryforwards as of December 31, 2020.
Retained earnings included $0.1 billion at both December 31, 2020 and 2019 in allocations for bad debt deductions of former thriftsubsidiaries for which no income tax has been provided. Under current law, if certain subsidiaries use these bad debt reserves forpurposes other than to absorb bad debt losses, they will be subject to Federal income tax at the current corporate tax rate.
A reconciliation of the beginning and ending balance of unrecognized tax benefits is as follows:
Table 107: Change in Unrecognized Tax Benefits
In millions 2020 2019 2018Balance of gross unrecognized tax benefits at January 1 $ 130 $ 207 $ 18Increases:Positions taken during a current period 265Positions taken during a prior period 212Decreases:Positions taken during a prior period (77) (16)Settlements with taxing authorities (130) (7)Balance of gross unrecognized tax benefits at December 31 $ 265 $ 130 $ 207Favorable impact if recognized $ 209 $ 76 $ 76
We do not expect that the balance of unrecognized tax benefits will increase or decrease in the next twelve months.
We are subject to U.S. federal income tax as well as income tax in most states and some foreign jurisdictions. Table 108 summarizesthe status of significant IRS examinations.
Table 108: IRS Tax Examination Status
Years under examination Status at December 31Federal 2016 – 2018 Under Exam
The PNC Financial Services Group, Inc. – 2020 Form 10-K 173
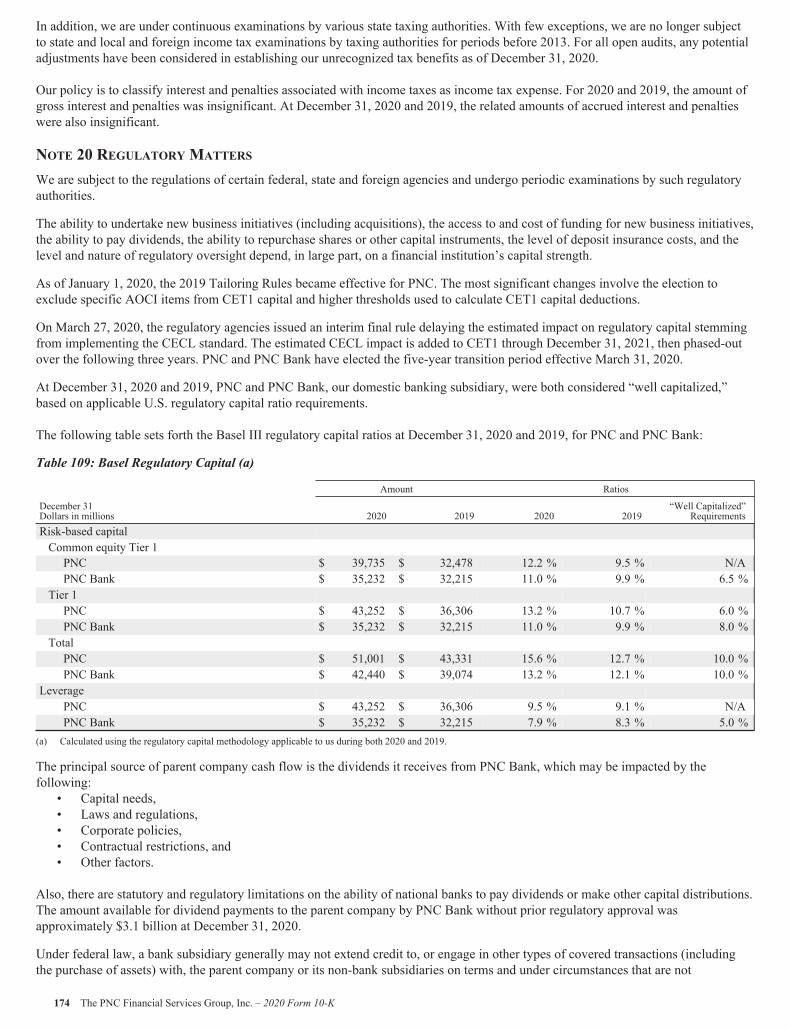
In addition, we are under continuous examinations by various state taxing authorities. With few exceptions, we are no longer subjectto state and local and foreign income tax examinations by taxing authorities for periods before 2013. For all open audits, any potentialadjustments have been considered in establishing our unrecognized tax benefits as of December 31, 2020.
Our policy is to classify interest and penalties associated with income taxes as income tax expense. For 2020 and 2019, the amount ofgross interest and penalties was insignificant. At December 31, 2020 and 2019, the related amounts of accrued interest and penaltieswere also insignificant.
NOTE 20 REGULATORY MATTERS
We are subject to the regulations of certain federal, state and foreign agencies and undergo periodic examinations by such regulatoryauthorities.
The ability to undertake new business initiatives (including acquisitions), the access to and cost of funding for new business initiatives,the ability to pay dividends, the ability to repurchase shares or other capital instruments, the level of deposit insurance costs, and thelevel and nature of regulatory oversight depend, in large part, on a financial institution’s capital strength.
As of January 1, 2020, the 2019 Tailoring Rules became effective for PNC. The most significant changes involve the election toexclude specific AOCI items from CET1 capital and higher thresholds used to calculate CET1 capital deductions.
On March 27, 2020, the regulatory agencies issued an interim final rule delaying the estimated impact on regulatory capital stemmingfrom implementing the CECL standard. The estimated CECL impact is added to CET1 through December 31, 2021, then phased-outover the following three years. PNC and PNC Bank have elected the five-year transition period effective March 31, 2020.
At December 31, 2020 and 2019, PNC and PNC Bank, our domestic banking subsidiary, were both considered “well capitalized,”based on applicable U.S. regulatory capital ratio requirements.
The following table sets forth the Basel III regulatory capital ratios at December 31, 2020 and 2019, for PNC and PNC Bank:
Table 109: Basel Regulatory Capital (a)
Amount Ratios
December 31Dollars in millions 2020 2019 2020 2019
“Well Capitalized”Requirements
Risk-based capitalCommon equity Tier 1PNC $ 39,735 $ 32,478 12.2 % 9.5 % N/APNC Bank $ 35,232 $ 32,215 11.0 % 9.9 % 6.5 %
Tier 1PNC $ 43,252 $ 36,306 13.2 % 10.7 % 6.0 %PNC Bank $ 35,232 $ 32,215 11.0 % 9.9 % 8.0 %
TotalPNC $ 51,001 $ 43,331 15.6 % 12.7 % 10.0 %PNC Bank $ 42,440 $ 39,074 13.2 % 12.1 % 10.0 %
LeveragePNC $ 43,252 $ 36,306 9.5 % 9.1 % N/APNC Bank $ 35,232 $ 32,215 7.9 % 8.3 % 5.0 %
(a) Calculated using the regulatory capital methodology applicable to us during both 2020 and 2019.
The principal source of parent company cash flow is the dividends it receives from PNC Bank, which may be impacted by thefollowing:
• Capital needs,• Laws and regulations,• Corporate policies,• Contractual restrictions, and• Other factors.
Also, there are statutory and regulatory limitations on the ability of national banks to pay dividends or make other capital distributions.The amount available for dividend payments to the parent company by PNC Bank without prior regulatory approval wasapproximately $3.1 billion at December 31, 2020.
Under federal law, a bank subsidiary generally may not extend credit to, or engage in other types of covered transactions (includingthe purchase of assets) with, the parent company or its non-bank subsidiaries on terms and under circumstances that are not
174 The PNC Financial Services Group, Inc. – 2020 Form 10-K
substantially the same as comparable transactions with nonaffiliates. A bank subsidiary may not extend credit to, or engage in acovered transaction with, the parent company or a non-bank subsidiary if the aggregate amount of the bank’s extensions of credit andother covered transactions with the parent company or non-bank subsidiary exceeds 10% of the capital stock and surplus of such banksubsidiary or the aggregate amount of the bank’s extensions of credit and other covered transactions with the parent company and allnon-bank subsidiaries exceeds 20% of the capital stock and surplus of such bank subsidiary. Such extensions of credit, with limitedexceptions, must be at least fully collateralized in accordance with specified collateralization thresholds, with the thresholds varyingbased on the type of assets serving as collateral. In certain circumstances, federal regulatory authorities may impose more restrictivelimitations.
At December 31, 2020, the balance outstanding at the Federal Reserve Bank was $84.9 billion.
NOTE 21 LEGAL PROCEEDINGS
We establish accruals for legal proceedings, including litigation and regulatory and governmental investigations and inquiries, wheninformation related to the loss contingencies represented by those matters indicates both that a loss is probable and that the amount ofloss can be reasonably estimated. Any such accruals are adjusted thereafter as appropriate to reflect changed circumstances. When weare able to do so, we also determine estimates of possible losses or ranges of possible losses, whether in excess of any related accruedliability or where there is no accrued liability, for disclosed legal proceedings (“Disclosed Matters,” which are those matters disclosedin this Note 21). For Disclosed Matters where we are able to estimate such possible losses or ranges of possible losses, as ofDecember 31, 2020, we estimate that it is reasonably possible that we could incur losses in excess of related accrued liabilities, if any,in an aggregate amount less than $100 million. The estimates included in this amount are based on our analysis of currently availableinformation and are subject to significant judgment and a variety of assumptions and uncertainties. As new information is obtained wemay change our estimates. Due to the inherent subjectivity of the assessments and unpredictability of outcomes of legal proceedings,any amounts accrued or included in this aggregate amount may not represent the ultimate loss to us from the legal proceedings inquestion. Thus, our exposure and ultimate losses may be higher, and possibly significantly so, than the amounts accrued or thisaggregate amount.
In our experience, legal proceedings are inherently unpredictable. One or more of the following factors frequently contribute to thisinherent unpredictability: the proceeding is in its early stages; the damages sought are unspecified, unsupported or uncertain; it isunclear whether a case brought as a class action will be allowed to proceed on that basis or, if permitted to proceed as a class action,how the class will be defined; the other party is seeking relief other than or in addition to compensatory damages (including, in thecase of regulatory and governmental investigations and inquiries, the possibility of fines and penalties); the matter presents meaningfullegal uncertainties, including novel issues of law; we have not engaged in meaningful settlement discussions; discovery has not startedor is not complete; there are significant facts in dispute; the possible outcomes may not be amenable to the use of statistical orquantitative analytical tools; predicting possible outcomes depends on making assumptions about future decisions of courts orregulatory bodies or the behavior of other parties; and there are a large number of parties named as defendants (including where it isuncertain how damages or liability, if any, will be shared among multiple defendants). Generally, the less progress that has been madein the proceedings or the broader the range of potential results, the harder it is for us to estimate losses or ranges of losses that it isreasonably possible we could incur.
As a result of these types of factors, we are unable, at this time, to estimate the losses that are reasonably possible to be incurred orranges of such losses with respect to some of the matters disclosed, and the aggregate estimated amount provided above does notinclude an estimate for every Disclosed Matter. Therefore, as the estimated aggregate amount disclosed above does not include all ofthe Disclosed Matters, the amount disclosed above does not represent our maximum reasonably possible loss exposure for all of theDisclosed Matters. The estimated aggregate amount also does not reflect any of our exposure to matters not so disclosed, as discussedbelow under “Other.”
We include in some of the descriptions of individual Disclosed Matters certain quantitative information related to the plaintiff’s claimagainst us as alleged in the plaintiff’s pleadings or other public filings or otherwise publicly available information. While informationof this type may provide insight into the potential magnitude of a matter, it does not necessarily represent our estimate of reasonablypossible loss or our judgment as to any currently appropriate accrual.
Some of our exposure in Disclosed Matters may be offset by applicable insurance coverage. We do not consider the possibleavailability of insurance coverage in determining the amounts of any accruals (although we record the amount of related insurancerecoveries that are deemed probable up to the amount of the accrual) or in determining any estimates of possible losses or ranges ofpossible losses.
The PNC Financial Services Group, Inc. – 2020 Form 10-K 175
Interchange Litigation
Beginning in June 2005, a series of antitrust lawsuits were filed against Visa®, Mastercard®, and several major financial institutions,including cases naming National City (since merged into The PNC Financial Services Group, Inc.) and its subsidiary, National CityBank of Kentucky (since merged into National City Bank which in turn was merged into PNC Bank). The plaintiffs in these cases aremerchants operating commercial businesses throughout the U.S., as well as trade associations. Some of these cases (including thosenaming National City entities) were brought as class actions on behalf of all persons or business entities that have accepted Visa orMastercard. The cases have been consolidated for pre-trial proceedings in the U.S. District Court for the Eastern District of New Yorkunder the caption In re Payment Card Interchange Fee and Merchant-Discount Antitrust Litigation (Master File No. 1:05-md-1720-MKB-JO).
In July 2012, the parties entered into a memorandum of understanding with the class plaintiffs and an agreement in principle withcertain individual plaintiffs with respect to a settlement of these cases, under which the defendants agreed to pay approximately $6.6billion collectively to the class and individual settling plaintiffs and agreed to changes in the terms applicable to their respective cardnetworks (including an eight-month reduction in default credit interchange rates). The parties entered into a definitive agreement withrespect to this settlement in October 2012. The court granted final approval of the settlement in December 2013. Several objectorsappealed the order of approval to the U.S. Court of Appeals for the Second Circuit, which issued an order in June 2016, reversingapproval of the settlement and remanding for further proceedings. In November 2016, the plaintiffs filed a petition for a writ ofcertiorari with the U.S. Supreme Court to challenge the court of appeal’s decision. The Supreme Court denied the petition in March2017.
As a result of the reversal of the approval of the settlement, the class actions have resumed in the district court. In November 2016, thedistrict court appointed separate interim class counsel for a proposed class seeking damages and a proposed class seeking equitable(injunctive) relief. In February 2017, each of these counsel filed a proposed amended and supplemental complaint on behalf of itsrespective proposed class. These complaints make similar allegations, including that the defendants conspired to monopolize and to fixthe prices for general purpose card network services, that the restructuring of Visa and Mastercard, each of which included an initialpublic offering, violated the antitrust laws, and that the defendants otherwise imposed unreasonable restraints on trade, resulting in thepayment of inflated interchange fees and other fees, which also violated the antitrust laws. In their complaints, collectively theplaintiffs seek, among other things, injunctive relief, unspecified damages (trebled under the antitrust laws) and attorneys’ fees. PNC isnamed as a defendant in the complaint seeking damages but is not named as a defendant in the complaint that seeks equitable relief.
In September 2017, the magistrate judge at the district court granted in part and denied in part the plaintiffs’ motions to file theirproposed amended complaints. The dispute over amendment arose in part from the decision in United States v. American Express, Co.,838 F.3d 179 (2d Cir. 2016), in which the court held that the relevant market in a similar complaint against American Express is “two-sided,” i.e., requires consideration of effects on consumers as well as merchants. In June 2018, the U.S. Supreme Court affirmed(under the caption Ohio v. American Express Co.) the court of appeals decision. Previously, the plaintiffs in this litigation had allegeda one-sided market, and, as a result of the court’s decision in American Express, they sought leave to add claims based on a two-sidedmarket. The order allowed the complaint to be amended to include allegations pertaining to a two-sided market only to the extent thoseclaims are not time-barred, but held that the two-sided market allegations do not relate back to the time of the original complaint andare not subject to tolling. In October 2017, the plaintiffs appealed this order to the presiding district court judge. In August 2018, thejudge overruled this decision, finding that the two-sided market allegations do relate back.
In September 2018, the relevant parties entered an amended definitive agreement to resolve the claims of the class seeking damages.In this amended settlement agreement, the parties agreed, among other things, to the following terms:
• An additional settlement payment from all defendants of $900 million, with Visa’s share of the additional settlement paymentbeing $600 million. The additional settlement payment will be added to the approximately $5.3 billion previously paid by thedefendants pursuant to the original 2012 settlement agreement.
• Up to $700 million may be returned to the defendants (with up to $467 million to Visa) if more than 15% of class members(by payment volume) opt out of the class. As more than 15% of class members opted out of the class, $700 million has beenreturned to the defendants ($467 million to Visa).
This amended settlement agreement is subject to court approval. Following preliminary approval in January 2019, and after classnotice, the submission of opt-outs, and the filing of objections, the district court granted final approval of the settlement in December2019. Several objectors have appealed the district court’s order granting final approval to the U.S. Court of Appeals for the SecondCircuit. Some merchants that opted out from the settlement have brought lawsuits against Visa and Mastercard and one or more of theissuing banks. Resolution by Visa of claims by merchants that opted out of the settlement, including those that file lawsuits, have beenor will be paid from the Visa litigation escrow account.
176 The PNC Financial Services Group, Inc. – 2020 Form 10-K

National City and National City Bank entered into judgment and loss sharing agreements with Visa and certain other banks withrespect to all of the above referenced litigation. We were not originally named as defendants in any of the Visa or Mastercard relatedantitrust litigation nor were we initially parties to the judgment or loss sharing agreements. However, we became responsible forNational City’s and National City Bank’s position in the litigation and responsibilities under the agreements through our acquisition ofNational City. In addition, following Visa’s reorganization in 2007 in contemplation of its initial public offering, U.S. Visa membersreceived shares of Class B Visa common stock, convertible upon resolution of specified litigation, including the remaining litigationdescribed above, into shares of Class A Visa common stock, with the conversion rate adjusted to reflect amounts paid or escrowed toresolve the specified litigation, and also remained responsible for indemnifying Visa against the specified litigation. Our Class B Visacommon stock is all subject to this conversion adjustment provision, and we are now responsible for the indemnification obligations ofour predecessors as well as ourselves. We have also entered into a Mastercard Settlement and Judgment Sharing Agreement withMastercard and other financial institution defendants and an Omnibus Agreement Regarding Interchange Litigation Sharing andSettlement Sharing with Visa, Mastercard and other financial institution defendants. The Omnibus Agreement, in substance,apportions resolution of the claims in this litigation into a Visa portion and a Mastercard portion, with the Visa portion being two-thirds and the Mastercard portion being one-third. This apportionment only applies in the case of either a global settlement involvingall defendants or an adverse judgment against the defendants, to the extent that damages either are related to the merchants’ inter-network conspiracy claims or are otherwise not attributed to specific Mastercard or Visa conduct or damages. The Mastercard portion(or any Mastercard-related liability not subject to the Omnibus Agreement) will then be apportioned under the Mastercard Settlementand Judgment Sharing Agreement among Mastercard and PNC and the other financial institution defendants that are parties to thisagreement. The responsibility for the Visa portion (or any Visa-related liability not subject to the Omnibus Agreement) will beapportioned under the pre-existing indemnification responsibilities and judgment and loss sharing agreements.
Residential Mortgage-Backed Securities Indemnification Demands
We have received indemnification demands from several entities sponsoring residential mortgage-backed securities and their affiliateswhere purchasers of the securities, trustees for the securitization trusts, or monoline insurers have asserted claims against the sponsorsand other parties involved in the securitization transactions. National City Mortgage and its predecessors had sold to the sponsors ortheir affiliates whole loans that were allegedly included in certain of these securitization transactions. According to the indemnificationdemands, the claims for which indemnity is being sought are based on alleged misstatements and omissions in the offering documentsfor these transactions or breaches of representations and warranties relating to the loans made in connection with the transactions. Theindemnification demands assert that agreements governing the sale of these loans or the securitization transactions to which NationalCity Mortgage was a party require us to indemnify the sponsors and their affiliates for losses suffered in connection with these claims.
The parties have settled several of these disputes. In February 2020, one of the entities asserting a right to indemnification submitted ademand for our purported share of the settlement amount of claims asserted against it and its affiliates. The portion of the settlementamount, if any, for which we are responsible in the settled cases has not been determined.
Pre-need Funeral Arrangements
National City Bank and PNC Bank are defendants in a lawsuit filed in the U.S. District Court for the Eastern District of Missouriunder the caption Jo Ann Howard and Associates, P.C., et al. v. Cassity, et al. (No. 4:09-CV-1252-ERW) arising out of trusteeservices provided by Allegiant Bank, a National City Bank and PNC Bank predecessor, with respect to Missouri trusts that held pre-need funeral contract assets. Under a pre-need funeral contract, a customer pays an amount up front in exchange for payment offuneral expenses following the customer’s death. In a number of states, including Missouri, pre-need funeral contract sellers arerequired to deposit a portion of the proceeds of the sale of pre-need funeral contracts in a trust account.
The lawsuit was filed in August 2009 by the Special Deputy Receiver for three insolvent affiliated companies, National PrearrangedServices, Inc. a seller of pre-need funeral contracts (NPS), Lincoln Memorial Life Insurance Company (Lincoln), and MemorialService Life Insurance Company (Memorial). Seven individual state life and health insurance guaranty associations, who claim theyare liable under state law for payment of certain benefits under life insurance policies sold by Lincoln and Memorial, and the NationalOrganization of Life & Health Guaranty Associations have also joined the action as plaintiffs. In addition to National City Bank andPNC Bank (added following filing of the lawsuit as successor-in-interest to National City Bank) (the PNC defendants), otherdefendants included members of the Cassity family, who controlled NPS, Lincoln, and Memorial; officers and directors of NPS,Lincoln, and Memorial; auditors and attorneys for NPS, Lincoln, and Memorial; the trustees of each of the trusts that held pre-needfuneral contract assets; and the investment advisor to the Pre-need Trusts. NPS retained several banks to act as trustees for the trustsholding NPS pre-need funeral contract assets (the NPS Trusts), with Allegiant Bank acting as one of these trustees with respect toseven Missouri NPS Trusts. All of the other defendants have settled with the plaintiffs, are otherwise no longer a party to the lawsuit,or are insolvent.
In their Third Amended Complaint, filed in 2012 following the granting by the court in part of motions to dismiss made by the PNCdefendants and the other NPS Trust trustees, the plaintiffs allege that Allegiant Bank breached its fiduciary duties and acted
The PNC Financial Services Group, Inc. – 2020 Form 10-K 177
negligently as the trustee for the Missouri NPS Trusts. In part as a result of these breaches, the plaintiffs allege, members of theCassity family, acting in concert with other defendants, were able to improperly remove millions of dollars from the NPS Trusts,which in turn caused NPS, Lincoln, and Memorial to become insolvent. The complaint alleges $600 million in present and futurelosses to the plaintiffs due to the insolvency of NPS, Lincoln, and Memorial. The lawsuit seeks, among other things, unspecified actualand punitive damages, various equitable remedies including restitution, attorneys’ fees, costs of suit and interest.
In July 2013, five of the six defendants in a parallel federal criminal action, including two members of the Cassity family, entered intoplea agreements with the U.S. to resolve criminal charges arising out of their conduct at NPS, Lincoln and Memorial. In August 2013,after a jury trial, the sixth defendant, the investment advisor to the NPS Trusts, was convicted on all criminal counts against him. Thecriminal charges against the defendants alleged, among other thing, a scheme to defraud Allegiant Bank and the other trustees of theNPS Trusts.
In May 2014, the court granted the plaintiffs’ motion to disallow the PNC defendants’ affirmative defense relating to the plaintiffs’alleged failure to mitigate damages. In July 2014, the PNC defendants’ motion for reconsideration was denied. In September 2014, theplaintiffs filed a motion seeking leave to amend their complaint to reassert aiding and abetting claims, previously dismissed by thecourt in 2012. The court denied this motion in December 2014. Also in December 2014, the court granted in part and denied in partthe PNC defendants’ motion for summary judgment.
In March 2015, following a jury trial, the court entered a judgment against the PNC defendants in the amount of $356 million incompensatory damages and $36 million in punitive damages. In April 2015, the plaintiffs filed motions with the court seeking $179million in pre-judgment interest. Also, in April 2015, the PNC defendants filed motions with the court to reduce the compensatorydamages by the amounts paid in settlement by other defendants, to strike the punitive damages award, for judgment as a matter of law,and for a new trial. In November 2015, the court granted the motion to reduce the compensatory damages by amounts paid insettlement by other defendants and denied the other motions by the PNC defendants, with the judgment being reduced as a result to atotal of $289 million, and also denied the plaintiffs’ motion for pre-judgment interest.
In December 2015, the PNC defendants appealed the judgment to the U.S. Court of Appeals for the Eighth Circuit. Also in December2015, the plaintiffs cross-appealed from the court’s orders reducing the judgment by amounts paid in settlement by other defendants,denying plaintiffs’ motion for pre-judgment interest, and dismissing the plaintiffs’ aiding and abetting claims. In August 2017, thecourt of appeals reversed the judgment to the extent that it was based on tort rather than trust law. The court accordingly held that anydamages awarded to the plaintiff will be limited to losses to the trusts in Missouri caused by Allegiant’s breaches during the time itacted as trustee; plaintiffs cannot recover for damages to the Missouri trusts after Allegiant’s trusteeship or outside of the Missouritrusts, which had been included in the judgment under appeal. The court of appeals otherwise affirmed the judgment, including thedismissal of the aiding and abetting claims, and remanded the case to the district court for further proceedings in light of its decision.
In September 2017, plaintiffs filed a motion for rehearing by the panel solely seeking to remove the prohibition on damages beingsought for the period following Allegiant’s trusteeship. In December 2017, the court denied the petition for rehearing. In July 2019,following a new trial on remand from the court of appeals, the district court awarded the plaintiffs $72 million in compensatorydamages, $15 million in interest, and $15 million in punitive damages. The PNC defendants have appealed this judgment to the courtof appeals, and the plaintiffs cross-appealed. In December 2019, the court reduced the judgment by approximately $2.6 million tocorrect a mathematical error in calculating pre-judgment interest, reducing the total judgment to $99.5 million. In March 2020, thecourt dismissed the plaintiffs’ cross-appeal on the plaintiffs’ motion. In February 2020, the district court awarded $7 million in feesand costs to the plaintiffs, and the PNC defendants have appealed this judgment to the court of appeals. The consolidated appeals ofthe district court’s judgments were argued in January 2021.
USAA Patent Infringement Litigation
In September 2020, a lawsuit (United Services Automobile Association v. PNC Bank N.A., Case No. 2:20-cv-319) was filed in theUnited States District Court for the Eastern District of Texas against PNC Bank for patent infringement. The plaintiff amended itscomplaint in December 2020. As amended, the complaint alleges that PNC’s mobile remote deposit capture systems infringe on fourpatents owned by the plaintiff. The plaintiff seeks, among other things, a judgment that PNC is infringing each of the patents, damagesfor willful infringement, and attorneys’ fees. In December 2020, we filed a motion to dismiss the amended complaint, and in January2021, we filed a motion to transfer the lawsuit to the United States District Court for the Western District of Pennsylvania. Trial in thismatter is presently scheduled to commence on March 7, 2022.
In December 2020, we filed a lawsuit (PNC Bank, N.A. v. United Services Automobile Association, Case No. 2:20-cv-1886) in theUnited States District Court for the Western District of Pennsylvania against USAA seeking declaratory judgment of non-infringementas to two of the patents at issue in the lawsuit pending in the Eastern District of Texas and awarding PNC its fees and costs.
178 The PNC Financial Services Group, Inc. – 2020 Form 10-K
Regulatory and Governmental Inquiries
We are the subject of investigations, audits, examinations and other forms of regulatory and governmental inquiry covering a broadrange of issues in our consumer, mortgage, brokerage, securities and other financial services businesses, as well as other aspects of ouroperations. In some cases, these inquiries are part of reviews of specified activities at multiple industry participants; in others, they aredirected at PNC individually. From time to time, these inquiries have involved and may in the future involve or lead to regulatoryenforcement actions and other administrative proceedings. These inquiries have also led to and may in the future lead to civil orcriminal judicial proceedings. Some of these inquiries result in remedies including fines, penalties, restitution, or alterations in ourbusiness practices, and in additional expenses and collateral costs and other consequences. Such remedies and other consequencestypically have not been material to us from a financial standpoint, but could be in the future. Even if not financially material, they mayresult in significant reputational harm or other adverse consequences.
As has been publicly reported, the U.S. Department of Justice is conducting an inquiry relating to the federal LIHTC program directedat program participants. In connection with that inquiry, the Department of Justice requested information from PNC Bank, and wecooperated in that inquiry.
Our practice is to cooperate fully with regulatory and governmental investigations, audits and other inquiries, including that describedin this Note 21.
Other
In addition to the proceedings or other matters described above, PNC and persons to whom we may have indemnification obligations,in the normal course of business, are subject to various other pending and threatened legal proceedings in which claims for monetarydamages and other relief are asserted. We do not anticipate, at the present time, that the ultimate aggregate liability, if any, arising outof such other legal proceedings will have a material adverse effect on our financial position. However, we cannot now determinewhether or not any claims asserted against us or others to whom we may have indemnification obligations, whether in the proceedingsor other matters described above or otherwise, will have a material adverse effect on our results of operations in any future reportingperiod, which will depend on, among other things, the amount of the loss resulting from the claim and the amount of income otherwisereported for the reporting period.
The PNC Financial Services Group, Inc. – 2020 Form 10-K 179
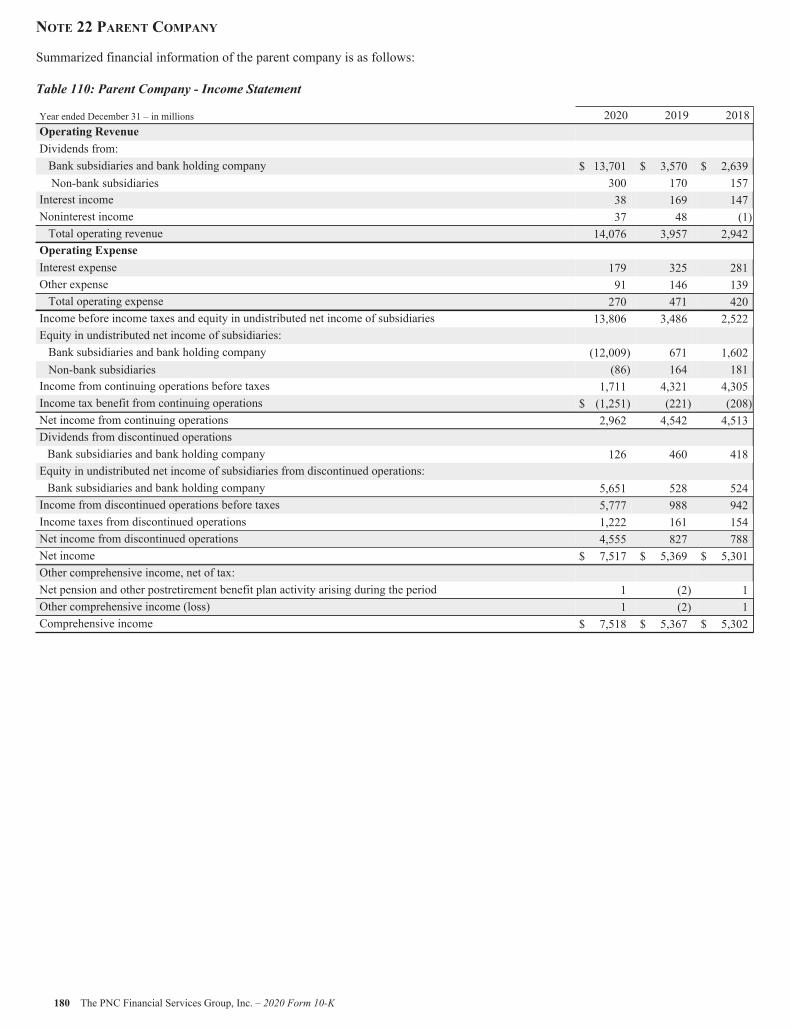
NOTE 22 PARENT COMPANY
Summarized financial information of the parent company is as follows:
Table 110: Parent Company - Income Statement
Year ended December 31 – in millions 2020 2019 2018Operating RevenueDividends from:Bank subsidiaries and bank holding company $ 13,701 $ 3,570 $ 2,639Non-bank subsidiaries 300 170 157
Interest income 38 169 147Noninterest income 37 48 (1)Total operating revenue 14,076 3,957 2,942Operating ExpenseInterest expense 179 325 281Other expense 91 146 139Total operating expense 270 471 420Income before income taxes and equity in undistributed net income of subsidiaries 13,806 3,486 2,522Equity in undistributed net income of subsidiaries:Bank subsidiaries and bank holding company (12,009) 671 1,602Non-bank subsidiaries (86) 164 181Income from continuing operations before taxes 1,711 4,321 4,305Income tax benefit from continuing operations $ (1,251) (221) (208)Net income from continuing operations 2,962 4,542 4,513Dividends from discontinued operationsBank subsidiaries and bank holding company 126 460 418Equity in undistributed net income of subsidiaries from discontinued operations:Bank subsidiaries and bank holding company 5,651 528 524Income from discontinued operations before taxes 5,777 988 942Income taxes from discontinued operations 1,222 161 154Net income from discontinued operations 4,555 827 788Net income $ 7,517 $ 5,369 $ 5,301Other comprehensive income, net of tax:Net pension and other postretirement benefit plan activity arising during the period 1 (2) 1Other comprehensive income (loss) 1 (2) 1Comprehensive income $ 7,518 $ 5,367 $ 5,302
180 The PNC Financial Services Group, Inc. – 2020 Form 10-K
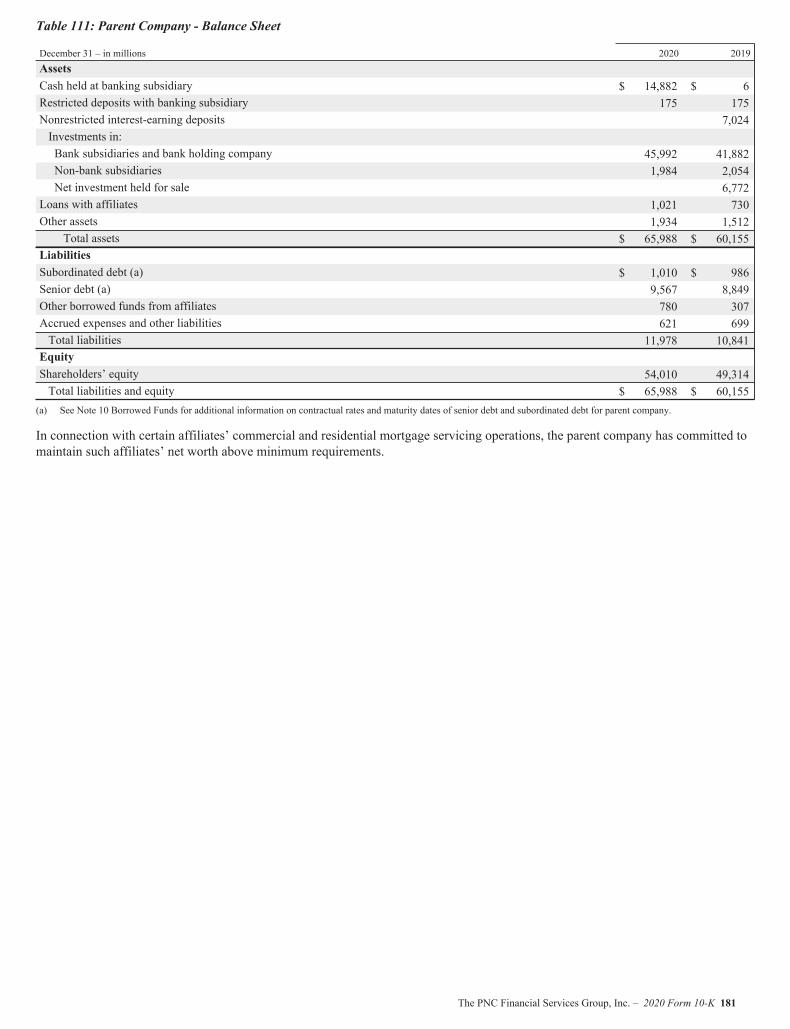
Table 111: Parent Company - Balance Sheet
December 31 – in millions 2020 2019AssetsCash held at banking subsidiary $ 14,882 $ 6Restricted deposits with banking subsidiary 175 175Nonrestricted interest-earning deposits 7,024Investments in:Bank subsidiaries and bank holding company 45,992 41,882Non-bank subsidiaries 1,984 2,054Net investment held for sale 6,772
Loans with affiliates 1,021 730Other assets 1,934 1,512
Total assets $ 65,988 $ 60,155LiabilitiesSubordinated debt (a) $ 1,010 $ 986Senior debt (a) 9,567 8,849Other borrowed funds from affiliates 780 307Accrued expenses and other liabilities 621 699Total liabilities 11,978 10,841EquityShareholders’ equity 54,010 49,314Total liabilities and equity $ 65,988 $ 60,155
(a) See Note 10 Borrowed Funds for additional information on contractual rates and maturity dates of senior debt and subordinated debt for parent company.
In connection with certain affiliates’ commercial and residential mortgage servicing operations, the parent company has committed tomaintain such affiliates’ net worth above minimum requirements.
The PNC Financial Services Group, Inc. – 2020 Form 10-K 181
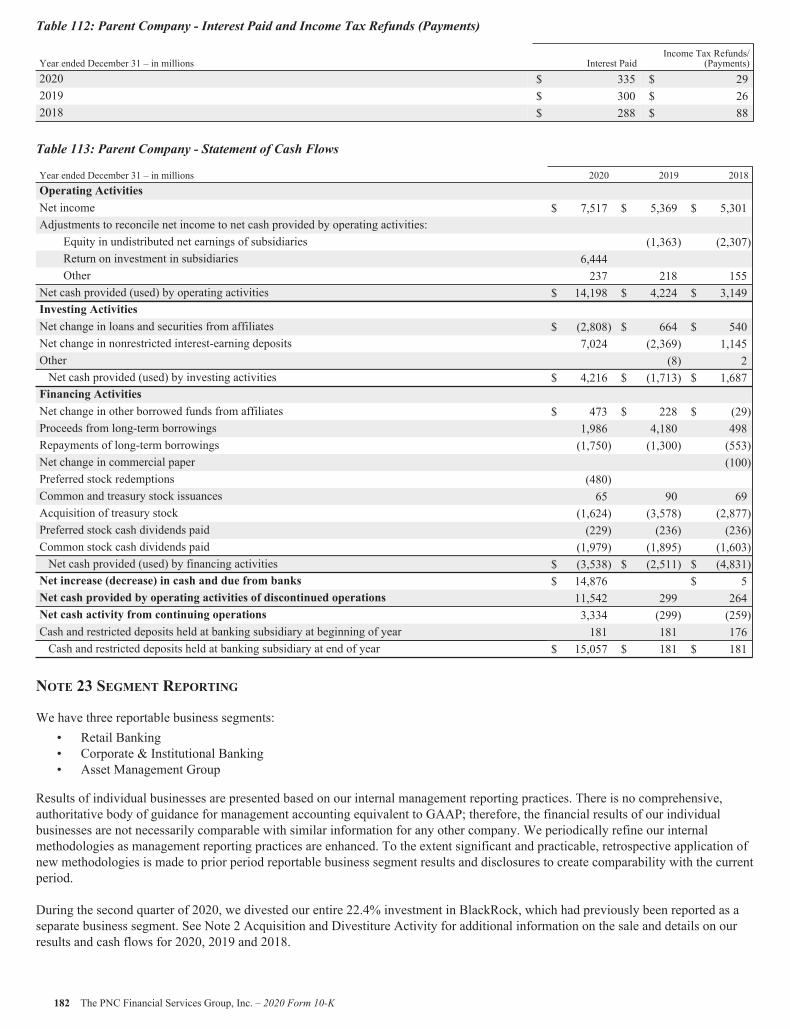
Table 112: Parent Company - Interest Paid and Income Tax Refunds (Payments)
Year ended December 31 – in millions Interest PaidIncome Tax Refunds/
(Payments)2020 $ 335 $ 292019 $ 300 $ 262018 $ 288 $ 88
Table 113: Parent Company - Statement of Cash Flows
Year ended December 31 – in millions 2020 2019 2018Operating ActivitiesNet income $ 7,517 $ 5,369 $ 5,301Adjustments to reconcile net income to net cash provided by operating activities:
Equity in undistributed net earnings of subsidiaries (1,363) (2,307)Return on investment in subsidiaries 6,444Other 237 218 155
Net cash provided (used) by operating activities $ 14,198 $ 4,224 $ 3,149Investing ActivitiesNet change in loans and securities from affiliates $ (2,808) $ 664 $ 540Net change in nonrestricted interest-earning deposits 7,024 (2,369) 1,145Other (8) 2Net cash provided (used) by investing activities $ 4,216 $ (1,713) $ 1,687Financing ActivitiesNet change in other borrowed funds from affiliates $ 473 $ 228 $ (29)Proceeds from long-term borrowings 1,986 4,180 498Repayments of long-term borrowings (1,750) (1,300) (553)Net change in commercial paper (100)Preferred stock redemptions (480)Common and treasury stock issuances 65 90 69Acquisition of treasury stock (1,624) (3,578) (2,877)Preferred stock cash dividends paid (229) (236) (236)Common stock cash dividends paid (1,979) (1,895) (1,603)Net cash provided (used) by financing activities $ (3,538) $ (2,511) $ (4,831)Net increase (decrease) in cash and due from banks $ 14,876 $ 5Net cash provided by operating activities of discontinued operations 11,542 299 264Net cash activity from continuing operations 3,334 (299) (259)Cash and restricted deposits held at banking subsidiary at beginning of year 181 181 176Cash and restricted deposits held at banking subsidiary at end of year $ 15,057 $ 181 $ 181
NOTE 23 SEGMENT REPORTING
We have three reportable business segments:• Retail Banking• Corporate & Institutional Banking• Asset Management Group
Results of individual businesses are presented based on our internal management reporting practices. There is no comprehensive,authoritative body of guidance for management accounting equivalent to GAAP; therefore, the financial results of our individualbusinesses are not necessarily comparable with similar information for any other company. We periodically refine our internalmethodologies as management reporting practices are enhanced. To the extent significant and practicable, retrospective application ofnew methodologies is made to prior period reportable business segment results and disclosures to create comparability with the currentperiod.
During the second quarter of 2020, we divested our entire 22.4% investment in BlackRock, which had previously been reported as aseparate business segment. See Note 2 Acquisition and Divestiture Activity for additional information on the sale and details on ourresults and cash flows for 2020, 2019 and 2018.
182 The PNC Financial Services Group, Inc. – 2020 Form 10-K

Total business segment financial results differ from total consolidated net income. These differences are reflected in the “Other”category in the Table 114. “Other” includes residual activities that do not meet the criteria for disclosure as a separate reportablebusiness, such as asset and liability management activities including net securities gains or losses, ACL for investment securities,certain trading activities, certain runoff consumer loan portfolios, private equity investments, intercompany eliminations, certaincorporate overhead, tax adjustments that are not allocated to business segments, exited businesses, and differences between businesssegment performance reporting and financial statement reporting (GAAP). The “Other” category also includes our BlackRock held forsale asset. Assets, revenue and earnings attributable to foreign activities were not material in the periods presented for comparison.
Financial results are presented, to the extent practicable, as if each business operated on a stand-alone basis. Additionally, we haveaggregated the results for corporate support functions within “Other” for financial reporting purposes.
Net interest income in business segment results reflects our internal funds transfer pricing methodology. Assets receive a fundingcharge and liabilities and capital receive a funding credit based on a transfer pricing methodology that incorporates product repricingcharacteristics, tenor and other factors.
We have allocated ALLL and the allowance for unfunded lending related commitments based on the loan exposures within eachbusiness segment’s portfolio. Key reserve assumptions and estimation processes react to and are influenced by observed changes inloan portfolio performance experience, the financial strength of the borrower and economic conditions. Key reserve assumptions areperiodically updated.
The PNC Financial Services Group, Inc. – 2020 Form 10-K 183
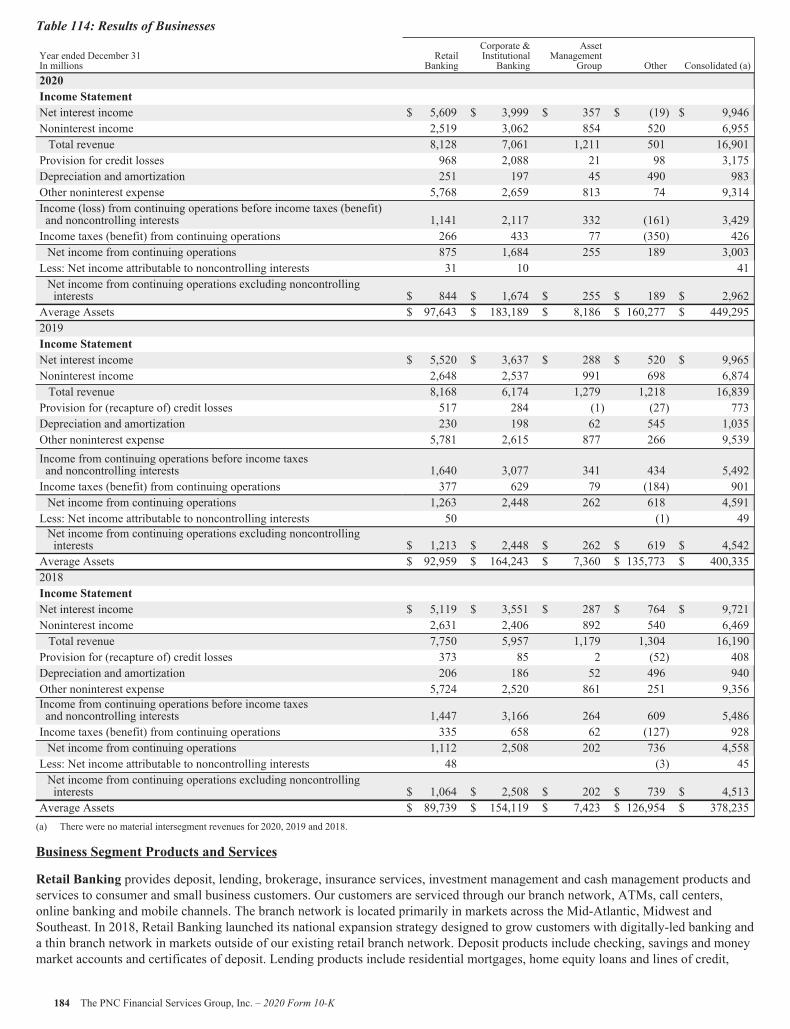
Table 114: Results of Businesses
Year ended December 31In millions
RetailBanking
Corporate &InstitutionalBanking
AssetManagement
Group Other Consolidated (a)2020Income StatementNet interest income $ 5,609 $ 3,999 $ 357 $ (19) $ 9,946Noninterest income 2,519 3,062 854 520 6,955Total revenue 8,128 7,061 1,211 501 16,901Provision for credit losses 968 2,088 21 98 3,175Depreciation and amortization 251 197 45 490 983Other noninterest expense 5,768 2,659 813 74 9,314Income (loss) from continuing operations before income taxes (benefit)and noncontrolling interests 1,141 2,117 332 (161) 3,429Income taxes (benefit) from continuing operations 266 433 77 (350) 426Net income from continuing operations 875 1,684 255 189 3,003Less: Net income attributable to noncontrolling interests 31 10 41Net income from continuing operations excluding noncontrollinginterests $ 844 $ 1,674 $ 255 $ 189 $ 2,962
Average Assets $ 97,643 $ 183,189 $ 8,186 $ 160,277 $ 449,2952019Income StatementNet interest income $ 5,520 $ 3,637 $ 288 $ 520 $ 9,965Noninterest income 2,648 2,537 991 698 6,874Total revenue 8,168 6,174 1,279 1,218 16,839Provision for (recapture of) credit losses 517 284 (1) (27) 773Depreciation and amortization 230 198 62 545 1,035Other noninterest expense 5,781 2,615 877 266 9,539Income from continuing operations before income taxesand noncontrolling interests 1,640 3,077 341 434 5,492Income taxes (benefit) from continuing operations 377 629 79 (184) 901Net income from continuing operations 1,263 2,448 262 618 4,591Less: Net income attributable to noncontrolling interests 50 (1) 49Net income from continuing operations excluding noncontrollinginterests $ 1,213 $ 2,448 $ 262 $ 619 $ 4,542
Average Assets $ 92,959 $ 164,243 $ 7,360 $ 135,773 $ 400,3352018Income StatementNet interest income $ 5,119 $ 3,551 $ 287 $ 764 $ 9,721Noninterest income 2,631 2,406 892 540 6,469Total revenue 7,750 5,957 1,179 1,304 16,190Provision for (recapture of) credit losses 373 85 2 (52) 408Depreciation and amortization 206 186 52 496 940Other noninterest expense 5,724 2,520 861 251 9,356Income from continuing operations before income taxesand noncontrolling interests 1,447 3,166 264 609 5,486Income taxes (benefit) from continuing operations 335 658 62 (127) 928Net income from continuing operations 1,112 2,508 202 736 4,558Less: Net income attributable to noncontrolling interests 48 (3) 45Net income from continuing operations excluding noncontrollinginterests $ 1,064 $ 2,508 $ 202 $ 739 $ 4,513
Average Assets $ 89,739 $ 154,119 $ 7,423 $ 126,954 $ 378,235(a) There were no material intersegment revenues for 2020, 2019 and 2018.
Business Segment Products and Services
Retail Banking provides deposit, lending, brokerage, insurance services, investment management and cash management products andservices to consumer and small business customers. Our customers are serviced through our branch network, ATMs, call centers,online banking and mobile channels. The branch network is located primarily in markets across the Mid-Atlantic, Midwest andSoutheast. In 2018, Retail Banking launched its national expansion strategy designed to grow customers with digitally-led banking anda thin branch network in markets outside of our existing retail branch network. Deposit products include checking, savings and moneymarket accounts and certificates of deposit. Lending products include residential mortgages, home equity loans and lines of credit,
184 The PNC Financial Services Group, Inc. – 2020 Form 10-K
auto loans, credit cards, education loans and personal and small business loans and lines of credit. The residential mortgage loans aredirectly originated within our branch network and nationwide, and are typically underwritten to agency and/or third-party standards,and either sold, servicing retained, or held on our balance sheet. Brokerage, investment management and cash management productsand services include managed, education, retirement and trust accounts.
Corporate & Institutional Banking provides lending, treasury management, and capital markets-related products and services tomid-sized and large corporations, and government and not-for-profit entities. Lending products include secured and unsecured loans,letters of credit and equipment leases. The Treasury Management business provides payables, receivables, deposit and accountservices, liquidity and investments, and online and mobile banking products and services to our clients. Capital markets-relatedproducts and services include foreign exchange, derivatives, securities underwriting, loan syndications, mergers and acquisitionsadvisory and equity capital markets advisory related services. We also provide commercial loan servicing and technology solutions forthe commercial real estate finance industry. Products and services are provided nationally.
Asset Management Group provides personal wealth management for high net worth and ultra high net worth clients and institutionalasset management. The Asset Management group is composed of three distinct operating units:
• Wealth Management provides products and services to individuals and their families including investment and retirementplanning, customized investment management, private banking, and trust management and administration for individuals andtheir families.
• Our Hawthorn unit provides multi-generational family planning including estate, financial, tax planning, fiduciary,investment management and consulting, private banking, personal administrative services, asset custody and customizedperformance reporting to ultra high net worth clients.
• Institutional asset management provides outsourced chief investment officer, custody, private real estate, cash and fixedincome client solutions, and fiduciary retirement advisory services to institutional clients including corporations, healthcaresystems, insurance companies, unions, municipalities and non-profits.
NOTE 24 FEE-BASED REVENUE FROM CONTRACTS WITH CUSTOMERS
A subset of our noninterest income relates to certain fee-based revenue within the scope of ASC Topic 606 - Revenue from Contractswith Customers (Topic 606). The objective of the standard is to clarify the principles for recognizing revenue from contracts withcustomers across all industries and to develop a common revenue standard under GAAP. The standard requires the application of afive-step recognition model to contracts, allocating the amount of consideration we expect to be entitled to across distinct promises inthe contract, called performance obligations, and recognizing revenue when or as those services are transferred to the customer.
Fee-based revenue within the scope of Topic 606 is recognized within our three reportable business segments, Retail Banking,Corporate & Institutional Banking and Asset Management Group. Interest income, income from lease contracts, fair value gains fromfinancial instruments (including derivatives), income from mortgage servicing rights and guarantee products, letter of credit fees, non-refundable fees associated with acquiring or originating a loan and gains from the sale of financial assets are outside of the scope ofTopic 606.
The following tables present noninterest income within the scope of Topic 606 disaggregated by segment. A description of the fee-based revenue and how it is recognized for each segment’s principal services and products follows each table.
The PNC Financial Services Group, Inc. – 2020 Form 10-K 185
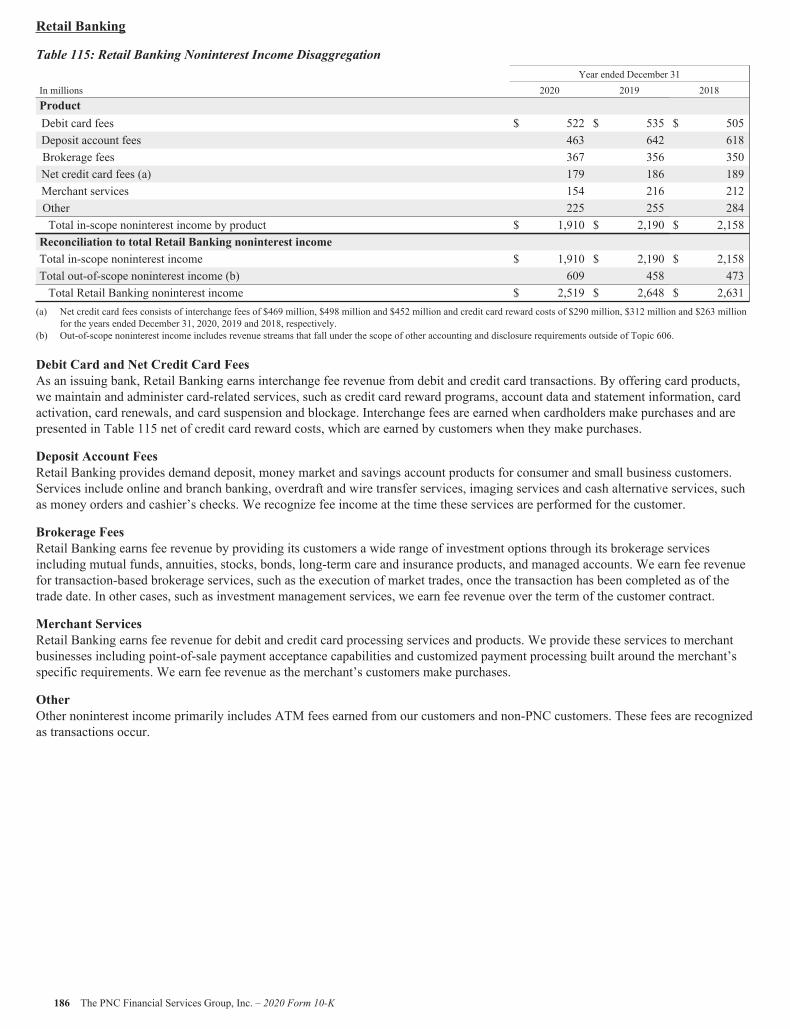
Retail Banking
Table 115: Retail Banking Noninterest Income DisaggregationYear ended December 31
In millions 2020 2019 2018ProductDebit card fees $ 522 $ 535 $ 505Deposit account fees 463 642 618Brokerage fees 367 356 350Net credit card fees (a) 179 186 189Merchant services 154 216 212Other 225 255 284Total in-scope noninterest income by product $ 1,910 $ 2,190 $ 2,158Reconciliation to total Retail Banking noninterest incomeTotal in-scope noninterest income $ 1,910 $ 2,190 $ 2,158Total out-of-scope noninterest income (b) 609 458 473Total Retail Banking noninterest income $ 2,519 $ 2,648 $ 2,631
(a) Net credit card fees consists of interchange fees of $469 million, $498 million and $452 million and credit card reward costs of $290 million, $312 million and $263 millionfor the years ended December 31, 2020, 2019 and 2018, respectively.
(b) Out-of-scope noninterest income includes revenue streams that fall under the scope of other accounting and disclosure requirements outside of Topic 606.
Debit Card and Net Credit Card FeesAs an issuing bank, Retail Banking earns interchange fee revenue from debit and credit card transactions. By offering card products,we maintain and administer card-related services, such as credit card reward programs, account data and statement information, cardactivation, card renewals, and card suspension and blockage. Interchange fees are earned when cardholders make purchases and arepresented in Table 115 net of credit card reward costs, which are earned by customers when they make purchases.
Deposit Account FeesRetail Banking provides demand deposit, money market and savings account products for consumer and small business customers.Services include online and branch banking, overdraft and wire transfer services, imaging services and cash alternative services, suchas money orders and cashier’s checks. We recognize fee income at the time these services are performed for the customer.
Brokerage FeesRetail Banking earns fee revenue by providing its customers a wide range of investment options through its brokerage servicesincluding mutual funds, annuities, stocks, bonds, long-term care and insurance products, and managed accounts. We earn fee revenuefor transaction-based brokerage services, such as the execution of market trades, once the transaction has been completed as of thetrade date. In other cases, such as investment management services, we earn fee revenue over the term of the customer contract.
Merchant ServicesRetail Banking earns fee revenue for debit and credit card processing services and products. We provide these services to merchantbusinesses including point-of-sale payment acceptance capabilities and customized payment processing built around the merchant’sspecific requirements. We earn fee revenue as the merchant’s customers make purchases.
OtherOther noninterest income primarily includes ATM fees earned from our customers and non-PNC customers. These fees are recognizedas transactions occur.
186 The PNC Financial Services Group, Inc. – 2020 Form 10-K
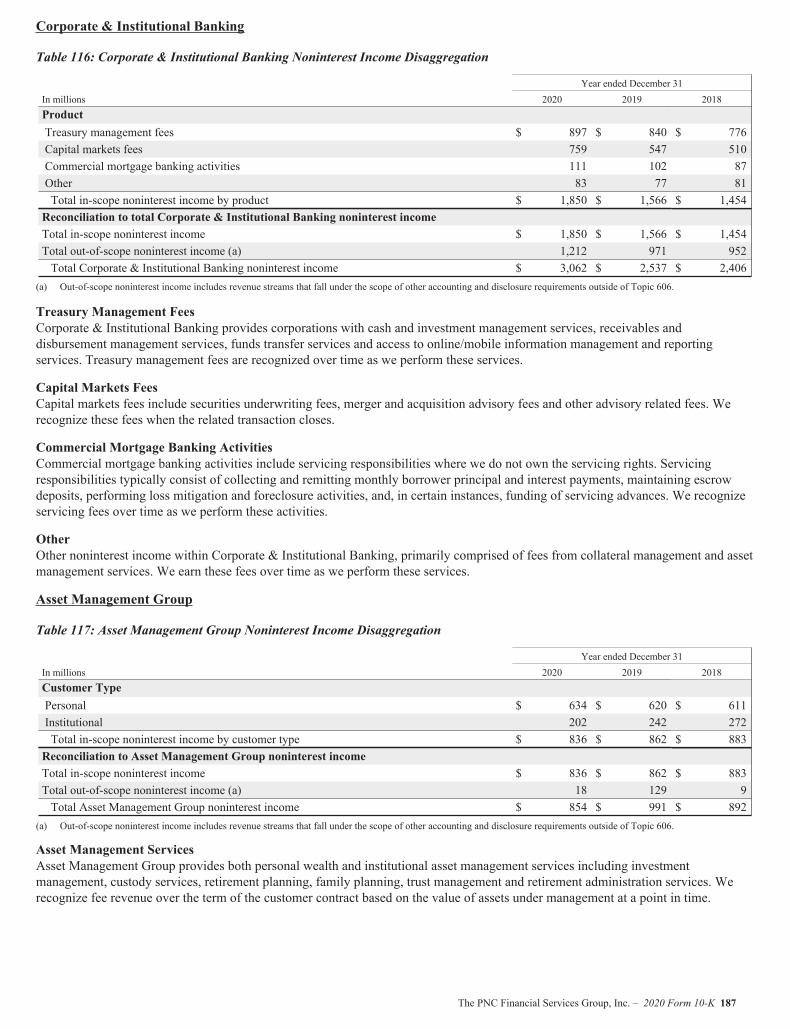
Corporate & Institutional Banking
Table 116: Corporate & Institutional Banking Noninterest Income Disaggregation
Year ended December 31In millions 2020 2019 2018ProductTreasury management fees $ 897 $ 840 $ 776Capital markets fees 759 547 510Commercial mortgage banking activities 111 102 87Other 83 77 81Total in-scope noninterest income by product $ 1,850 $ 1,566 $ 1,454Reconciliation to total Corporate & Institutional Banking noninterest incomeTotal in-scope noninterest income $ 1,850 $ 1,566 $ 1,454Total out-of-scope noninterest income (a) 1,212 971 952Total Corporate & Institutional Banking noninterest income $ 3,062 $ 2,537 $ 2,406
(a) Out-of-scope noninterest income includes revenue streams that fall under the scope of other accounting and disclosure requirements outside of Topic 606.
Treasury Management FeesCorporate & Institutional Banking provides corporations with cash and investment management services, receivables anddisbursement management services, funds transfer services and access to online/mobile information management and reportingservices. Treasury management fees are recognized over time as we perform these services.
Capital Markets FeesCapital markets fees include securities underwriting fees, merger and acquisition advisory fees and other advisory related fees. Werecognize these fees when the related transaction closes.
Commercial Mortgage Banking ActivitiesCommercial mortgage banking activities include servicing responsibilities where we do not own the servicing rights. Servicingresponsibilities typically consist of collecting and remitting monthly borrower principal and interest payments, maintaining escrowdeposits, performing loss mitigation and foreclosure activities, and, in certain instances, funding of servicing advances. We recognizeservicing fees over time as we perform these activities.
OtherOther noninterest income within Corporate & Institutional Banking, primarily comprised of fees from collateral management and assetmanagement services. We earn these fees over time as we perform these services.
Asset Management Group
Table 117: Asset Management Group Noninterest Income Disaggregation
Year ended December 31In millions 2020 2019 2018Customer TypePersonal $ 634 $ 620 $ 611Institutional 202 242 272Total in-scope noninterest income by customer type $ 836 $ 862 $ 883Reconciliation to Asset Management Group noninterest incomeTotal in-scope noninterest income $ 836 $ 862 $ 883Total out-of-scope noninterest income (a) 18 129 9Total Asset Management Group noninterest income $ 854 $ 991 $ 892
(a) Out-of-scope noninterest income includes revenue streams that fall under the scope of other accounting and disclosure requirements outside of Topic 606.
Asset Management ServicesAsset Management Group provides both personal wealth and institutional asset management services including investmentmanagement, custody services, retirement planning, family planning, trust management and retirement administration services. Werecognize fee revenue over the term of the customer contract based on the value of assets under management at a point in time.
The PNC Financial Services Group, Inc. – 2020 Form 10-K 187
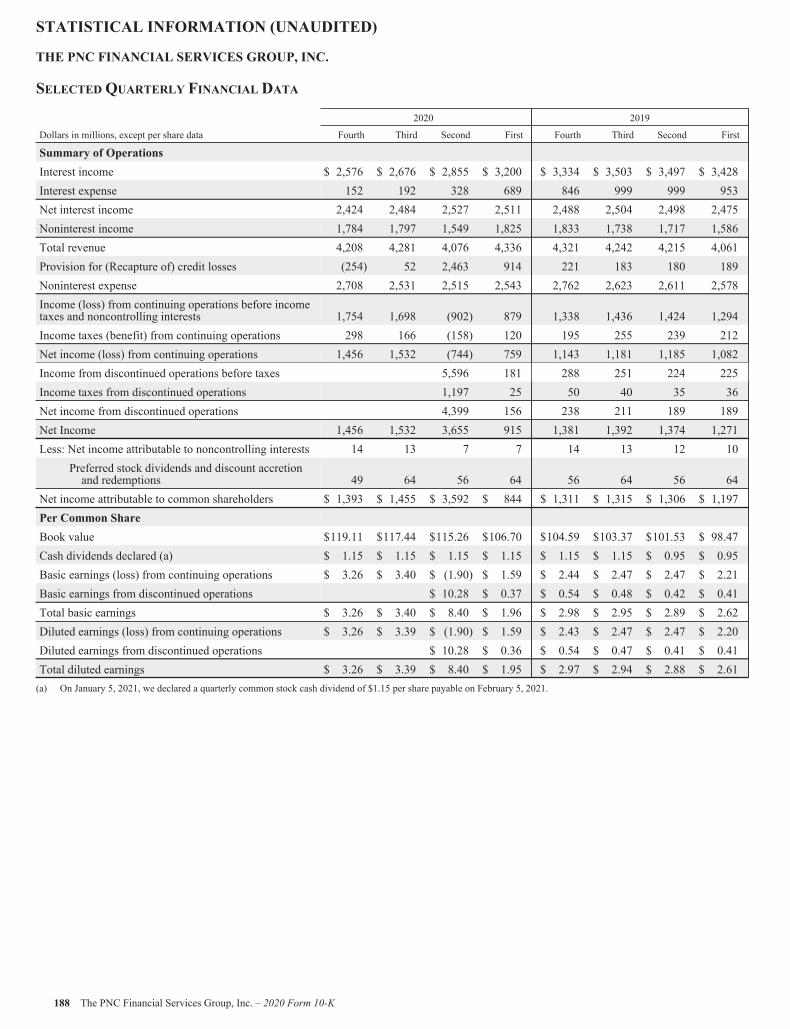
STATISTICAL INFORMATION (UNAUDITED)
THE PNC FINANCIAL SERVICES GROUP, INC.
SELECTED QUARTERLY FINANCIAL DATA
Dollars in millions, except per share data
2020 2019
Fourth Third Second First Fourth Third Second First
Summary of OperationsInterest income $ 2,576 $ 2,676 $ 2,855 $ 3,200 $ 3,334 $ 3,503 $ 3,497 $ 3,428Interest expense 152 192 328 689 846 999 999 953Net interest income 2,424 2,484 2,527 2,511 2,488 2,504 2,498 2,475Noninterest income 1,784 1,797 1,549 1,825 1,833 1,738 1,717 1,586Total revenue 4,208 4,281 4,076 4,336 4,321 4,242 4,215 4,061Provision for (Recapture of) credit losses (254) 52 2,463 914 221 183 180 189Noninterest expense 2,708 2,531 2,515 2,543 2,762 2,623 2,611 2,578Income (loss) from continuing operations before incometaxes and noncontrolling interests 1,754 1,698 (902) 879 1,338 1,436 1,424 1,294Income taxes (benefit) from continuing operations 298 166 (158) 120 195 255 239 212Net income (loss) from continuing operations 1,456 1,532 (744) 759 1,143 1,181 1,185 1,082Income from discontinued operations before taxes 5,596 181 288 251 224 225Income taxes from discontinued operations 1,197 25 50 40 35 36Net income from discontinued operations 4,399 156 238 211 189 189Net Income 1,456 1,532 3,655 915 1,381 1,392 1,374 1,271Less: Net income attributable to noncontrolling interests 14 13 7 7 14 13 12 10
Preferred stock dividends and discount accretionand redemptions 49 64 56 64 56 64 56 64
Net income attributable to common shareholders $ 1,393 $ 1,455 $ 3,592 $ 844 $ 1,311 $ 1,315 $ 1,306 $ 1,197Per Common ShareBook value $119.11 $117.44 $115.26 $106.70 $104.59 $103.37 $101.53 $ 98.47Cash dividends declared (a) $ 1.15 $ 1.15 $ 1.15 $ 1.15 $ 1.15 $ 1.15 $ 0.95 $ 0.95Basic earnings (loss) from continuing operations $ 3.26 $ 3.40 $ (1.90) $ 1.59 $ 2.44 $ 2.47 $ 2.47 $ 2.21Basic earnings from discontinued operations $ 10.28 $ 0.37 $ 0.54 $ 0.48 $ 0.42 $ 0.41Total basic earnings $ 3.26 $ 3.40 $ 8.40 $ 1.96 $ 2.98 $ 2.95 $ 2.89 $ 2.62Diluted earnings (loss) from continuing operations $ 3.26 $ 3.39 $ (1.90) $ 1.59 $ 2.43 $ 2.47 $ 2.47 $ 2.20Diluted earnings from discontinued operations $ 10.28 $ 0.36 $ 0.54 $ 0.47 $ 0.41 $ 0.41Total diluted earnings $ 3.26 $ 3.39 $ 8.40 $ 1.95 $ 2.97 $ 2.94 $ 2.88 $ 2.61(a) On January 5, 2021, we declared a quarterly common stock cash dividend of $1.15 per share payable on February 5, 2021.
188 The PNC Financial Services Group, Inc. – 2020 Form 10-K
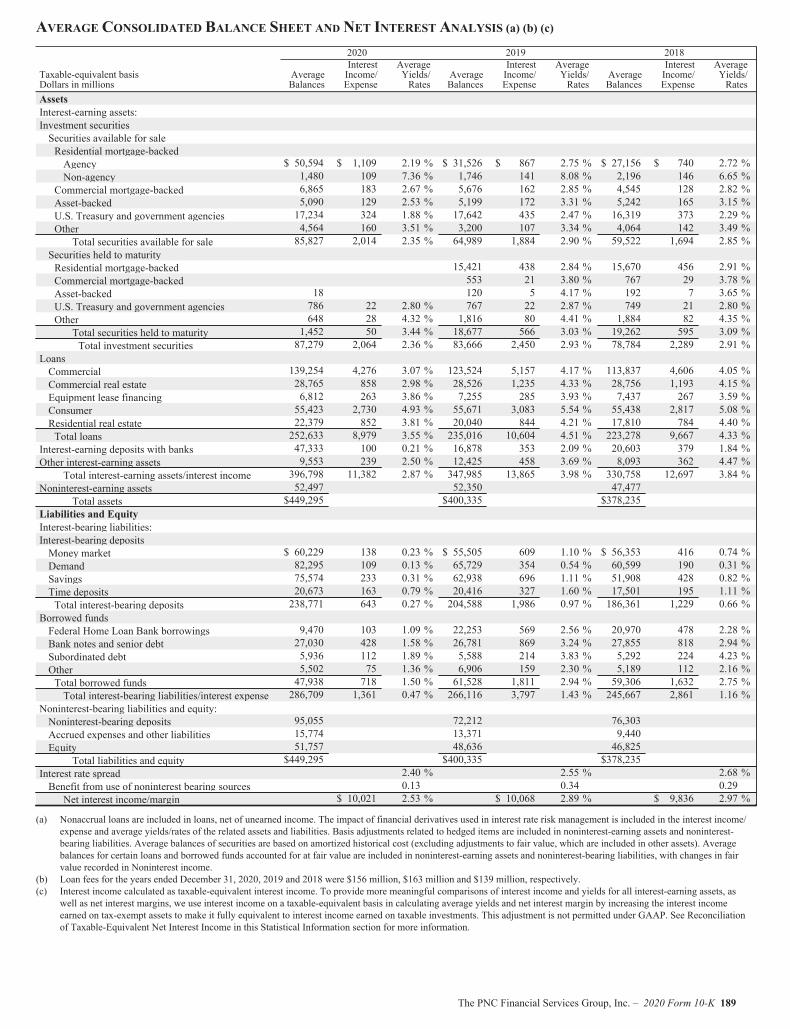
AVERAGE CONSOLIDATED BALANCE SHEET AND NET INTEREST ANALYSIS (a) (b) (c)2020 2019 2018
Taxable-equivalent basisDollars in millions
AverageBalances
InterestIncome/Expense
AverageYields/Rates
AverageBalances
InterestIncome/Expense
AverageYields/Rates
AverageBalances
InterestIncome/Expense
AverageYields/Rates
AssetsInterest-earning assets:Investment securitiesSecurities available for saleResidential mortgage-backedAgency $ 50,594 $ 1,109 2.19 % $ 31,526 $ 867 2.75 % $ 27,156 $ 740 2.72 %Non-agency 1,480 109 7.36 % 1,746 141 8.08 % 2,196 146 6.65 %
Commercial mortgage-backed 6,865 183 2.67 % 5,676 162 2.85 % 4,545 128 2.82 %Asset-backed 5,090 129 2.53 % 5,199 172 3.31 % 5,242 165 3.15 %U.S. Treasury and government agencies 17,234 324 1.88 % 17,642 435 2.47 % 16,319 373 2.29 %Other 4,564 160 3.51 % 3,200 107 3.34 % 4,064 142 3.49 %
Total securities available for sale 85,827 2,014 2.35 % 64,989 1,884 2.90 % 59,522 1,694 2.85 %Securities held to maturityResidential mortgage-backed 15,421 438 2.84 % 15,670 456 2.91 %Commercial mortgage-backed 553 21 3.80 % 767 29 3.78 %Asset-backed 18 120 5 4.17 % 192 7 3.65 %U.S. Treasury and government agencies 786 22 2.80 % 767 22 2.87 % 749 21 2.80 %Other 648 28 4.32 % 1,816 80 4.41 % 1,884 82 4.35 %
Total securities held to maturity 1,452 50 3.44 % 18,677 566 3.03 % 19,262 595 3.09 %Total investment securities 87,279 2,064 2.36 % 83,666 2,450 2.93 % 78,784 2,289 2.91 %
LoansCommercial 139,254 4,276 3.07 % 123,524 5,157 4.17 % 113,837 4,606 4.05 %Commercial real estate 28,765 858 2.98 % 28,526 1,235 4.33 % 28,756 1,193 4.15 %Equipment lease financing 6,812 263 3.86 % 7,255 285 3.93 % 7,437 267 3.59 %Consumer 55,423 2,730 4.93 % 55,671 3,083 5.54 % 55,438 2,817 5.08 %Residential real estate 22,379 852 3.81 % 20,040 844 4.21 % 17,810 784 4.40 %Total loans 252,633 8,979 3.55 % 235,016 10,604 4.51 % 223,278 9,667 4.33 %
Interest-earning deposits with banks 47,333 100 0.21 % 16,878 353 2.09 % 20,603 379 1.84 %Other interest-earning assets 9,553 239 2.50 % 12,425 458 3.69 % 8,093 362 4.47 %
Total interest-earning assets/interest income 396,798 11,382 2.87 % 347,985 13,865 3.98 % 330,758 12,697 3.84 %Noninterest-earning assets 52,497 52,350 47,477
Total assets $449,295 $400,335 $378,235Liabilities and EquityInterest-bearing liabilities:Interest-bearing depositsMoney market $ 60,229 138 0.23 % $ 55,505 609 1.10 % $ 56,353 416 0.74 %Demand 82,295 109 0.13 % 65,729 354 0.54 % 60,599 190 0.31 %Savings 75,574 233 0.31 % 62,938 696 1.11 % 51,908 428 0.82 %Time deposits 20,673 163 0.79 % 20,416 327 1.60 % 17,501 195 1.11 %Total interest-bearing deposits 238,771 643 0.27 % 204,588 1,986 0.97 % 186,361 1,229 0.66 %
Borrowed fundsFederal Home Loan Bank borrowings 9,470 103 1.09 % 22,253 569 2.56 % 20,970 478 2.28 %Bank notes and senior debt 27,030 428 1.58 % 26,781 869 3.24 % 27,855 818 2.94 %Subordinated debt 5,936 112 1.89 % 5,588 214 3.83 % 5,292 224 4.23 %Other 5,502 75 1.36 % 6,906 159 2.30 % 5,189 112 2.16 %Total borrowed funds 47,938 718 1.50 % 61,528 1,811 2.94 % 59,306 1,632 2.75 %Total interest-bearing liabilities/interest expense 286,709 1,361 0.47 % 266,116 3,797 1.43 % 245,667 2,861 1.16 %
Noninterest-bearing liabilities and equity:Noninterest-bearing deposits 95,055 72,212 76,303Accrued expenses and other liabilities 15,774 13,371 9,440Equity 51,757 48,636 46,825
Total liabilities and equity $449,295 $400,335 $378,235Interest rate spread 2.40 % 2.55 % 2.68 %Benefit from use of noninterest bearing sources 0.13 0.34 0.29Net interest income/margin $ 10,021 2.53 % $ 10,068 2.89 % $ 9,836 2.97 %
(a) Nonaccrual loans are included in loans, net of unearned income. The impact of financial derivatives used in interest rate risk management is included in the interest income/expense and average yields/rates of the related assets and liabilities. Basis adjustments related to hedged items are included in noninterest-earning assets and noninterest-bearing liabilities. Average balances of securities are based on amortized historical cost (excluding adjustments to fair value, which are included in other assets). Averagebalances for certain loans and borrowed funds accounted for at fair value are included in noninterest-earning assets and noninterest-bearing liabilities, with changes in fairvalue recorded in Noninterest income.
(b) Loan fees for the years ended December 31, 2020, 2019 and 2018 were $156 million, $163 million and $139 million, respectively.(c) Interest income calculated as taxable-equivalent interest income. To provide more meaningful comparisons of interest income and yields for all interest-earning assets, as
well as net interest margins, we use interest income on a taxable-equivalent basis in calculating average yields and net interest margin by increasing the interest incomeearned on tax-exempt assets to make it fully equivalent to interest income earned on taxable investments. This adjustment is not permitted under GAAP. See Reconciliationof Taxable-Equivalent Net Interest Income in this Statistical Information section for more information.
The PNC Financial Services Group, Inc. – 2020 Form 10-K 189
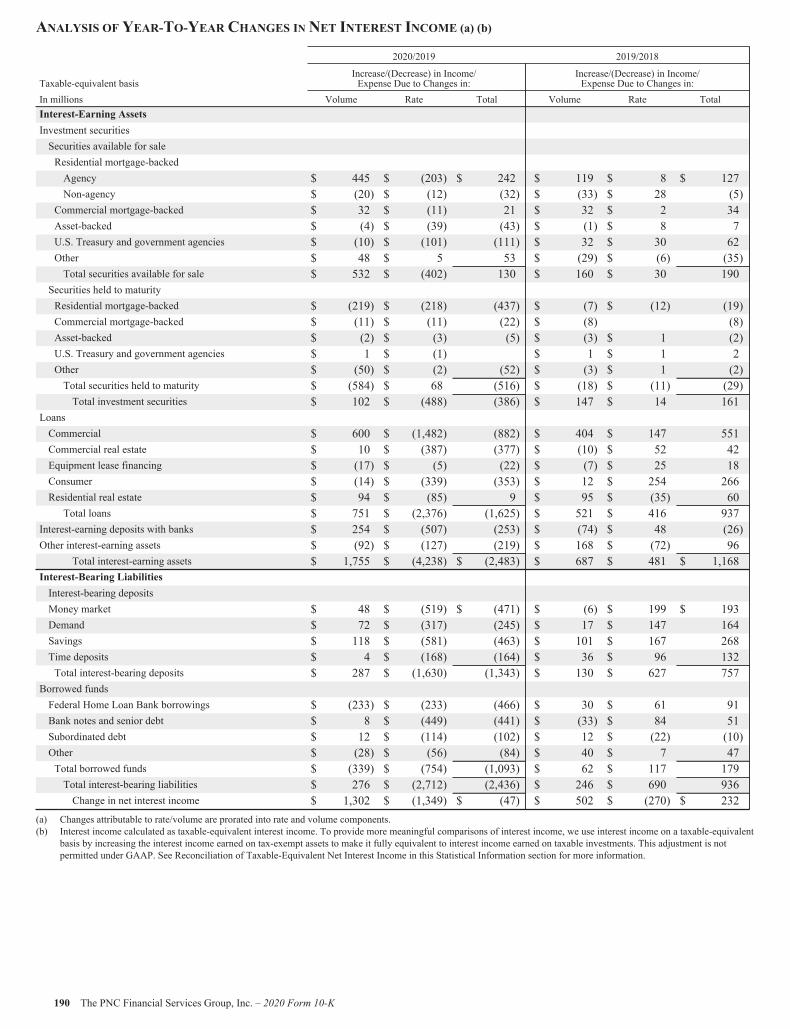
ANALYSIS OF YEAR-TO-YEAR CHANGES IN NET INTEREST INCOME (a) (b)
2020/2019 2019/2018
Taxable-equivalent basisIncrease/(Decrease) in Income/Expense Due to Changes in:
Increase/(Decrease) in Income/Expense Due to Changes in:
In millions Volume Rate Total Volume Rate TotalInterest-Earning AssetsInvestment securitiesSecurities available for saleResidential mortgage-backedAgency $ 445 $ (203) $ 242 $ 119 $ 8 $ 127Non-agency $ (20) $ (12) (32) $ (33) $ 28 (5)
Commercial mortgage-backed $ 32 $ (11) 21 $ 32 $ 2 34Asset-backed $ (4) $ (39) (43) $ (1) $ 8 7U.S. Treasury and government agencies $ (10) $ (101) (111) $ 32 $ 30 62Other $ 48 $ 5 53 $ (29) $ (6) (35)Total securities available for sale $ 532 $ (402) 130 $ 160 $ 30 190
Securities held to maturityResidential mortgage-backed $ (219) $ (218) (437) $ (7) $ (12) (19)Commercial mortgage-backed $ (11) $ (11) (22) $ (8) (8)Asset-backed $ (2) $ (3) (5) $ (3) $ 1 (2)U.S. Treasury and government agencies $ 1 $ (1) $ 1 $ 1 2Other $ (50) $ (2) (52) $ (3) $ 1 (2)Total securities held to maturity $ (584) $ 68 (516) $ (18) $ (11) (29)Total investment securities $ 102 $ (488) (386) $ 147 $ 14 161
LoansCommercial $ 600 $ (1,482) (882) $ 404 $ 147 551Commercial real estate $ 10 $ (387) (377) $ (10) $ 52 42Equipment lease financing $ (17) $ (5) (22) $ (7) $ 25 18Consumer $ (14) $ (339) (353) $ 12 $ 254 266Residential real estate $ 94 $ (85) 9 $ 95 $ (35) 60Total loans $ 751 $ (2,376) (1,625) $ 521 $ 416 937
Interest-earning deposits with banks $ 254 $ (507) (253) $ (74) $ 48 (26)Other interest-earning assets $ (92) $ (127) (219) $ 168 $ (72) 96
Total interest-earning assets $ 1,755 $ (4,238) $ (2,483) $ 687 $ 481 $ 1,168Interest-Bearing LiabilitiesInterest-bearing depositsMoney market $ 48 $ (519) $ (471) $ (6) $ 199 $ 193Demand $ 72 $ (317) (245) $ 17 $ 147 164Savings $ 118 $ (581) (463) $ 101 $ 167 268Time deposits $ 4 $ (168) (164) $ 36 $ 96 132Total interest-bearing deposits $ 287 $ (1,630) (1,343) $ 130 $ 627 757
Borrowed fundsFederal Home Loan Bank borrowings $ (233) $ (233) (466) $ 30 $ 61 91Bank notes and senior debt $ 8 $ (449) (441) $ (33) $ 84 51Subordinated debt $ 12 $ (114) (102) $ 12 $ (22) (10)Other $ (28) $ (56) (84) $ 40 $ 7 47Total borrowed funds $ (339) $ (754) (1,093) $ 62 $ 117 179Total interest-bearing liabilities $ 276 $ (2,712) (2,436) $ 246 $ 690 936Change in net interest income $ 1,302 $ (1,349) $ (47) $ 502 $ (270) $ 232
(a) Changes attributable to rate/volume are prorated into rate and volume components.(b) Interest income calculated as taxable-equivalent interest income. To provide more meaningful comparisons of interest income, we use interest income on a taxable-equivalent
basis by increasing the interest income earned on tax-exempt assets to make it fully equivalent to interest income earned on taxable investments. This adjustment is notpermitted under GAAP. See Reconciliation of Taxable-Equivalent Net Interest Income in this Statistical Information section for more information.
190 The PNC Financial Services Group, Inc. – 2020 Form 10-K
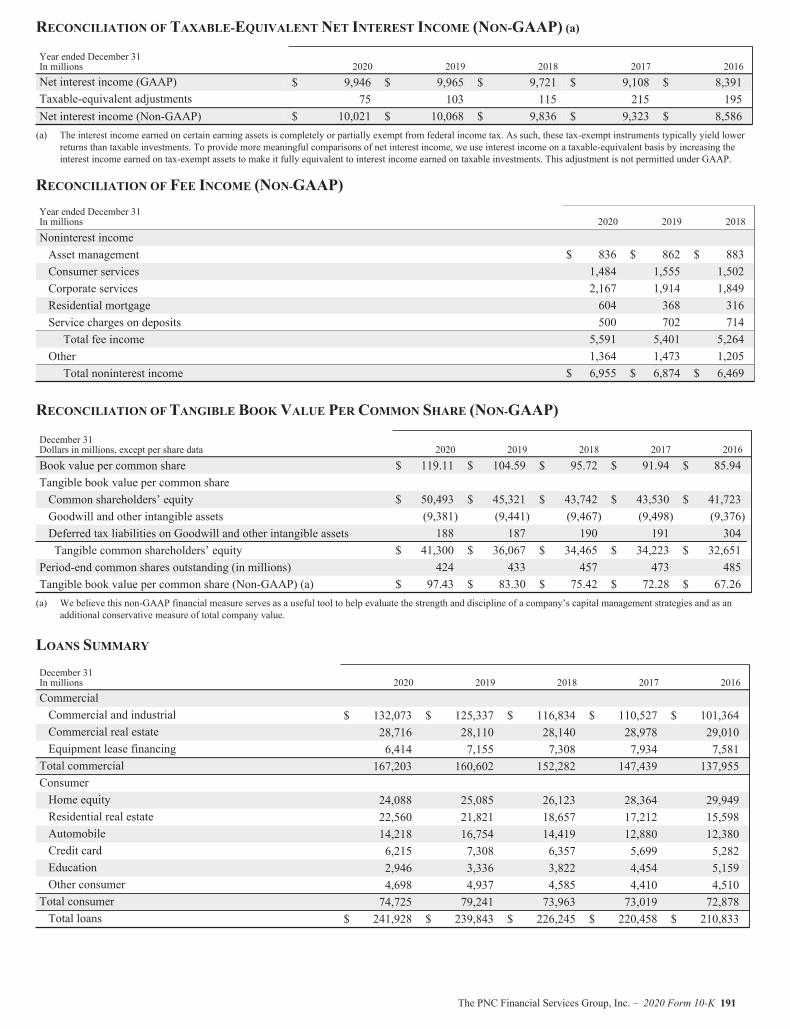
RECONCILIATION OF TAXABLE-EQUIVALENT NET INTEREST INCOME (NON-GAAP) (a)
Year ended December 31In millions 2020 2019 2018 2017 2016Net interest income (GAAP) $ 9,946 $ 9,965 $ 9,721 $ 9,108 $ 8,391Taxable-equivalent adjustments 75 103 115 215 195Net interest income (Non-GAAP) $ 10,021 $ 10,068 $ 9,836 $ 9,323 $ 8,586(a) The interest income earned on certain earning assets is completely or partially exempt from federal income tax. As such, these tax-exempt instruments typically yield lower
returns than taxable investments. To provide more meaningful comparisons of net interest income, we use interest income on a taxable-equivalent basis by increasing theinterest income earned on tax-exempt assets to make it fully equivalent to interest income earned on taxable investments. This adjustment is not permitted under GAAP.
RECONCILIATION OF FEE INCOME (NON-GAAP)Year ended December 31In millions 2020 2019 2018
Noninterest incomeAsset management $ 836 $ 862 $ 883Consumer services 1,484 1,555 1,502Corporate services 2,167 1,914 1,849Residential mortgage 604 368 316Service charges on deposits 500 702 714Total fee income 5,591 5,401 5,264
Other 1,364 1,473 1,205Total noninterest income $ 6,955 $ 6,874 $ 6,469
RECONCILIATION OFTANGIBLE BOOK VALUE PER COMMON SHARE (NON-GAAP)
December 31Dollars in millions, except per share data 2020 2019 2018 2017 2016
Book value per common share $ 119.11 $ 104.59 $ 95.72 $ 91.94 $ 85.94Tangible book value per common shareCommon shareholders’ equity $ 50,493 $ 45,321 $ 43,742 $ 43,530 $ 41,723Goodwill and other intangible assets (9,381) (9,441) (9,467) (9,498) (9,376)Deferred tax liabilities on Goodwill and other intangible assets 188 187 190 191 304Tangible common shareholders’ equity $ 41,300 $ 36,067 $ 34,465 $ 34,223 $ 32,651
Period-end common shares outstanding (in millions) 424 433 457 473 485Tangible book value per common share (Non-GAAP) (a) $ 97.43 $ 83.30 $ 75.42 $ 72.28 $ 67.26(a) We believe this non-GAAP financial measure serves as a useful tool to help evaluate the strength and discipline of a company’s capital management strategies and as an
additional conservative measure of total company value.
LOANS SUMMARYDecember 31In millions 2020 2019 2018 2017 2016CommercialCommercial and industrial $ 132,073 $ 125,337 $ 116,834 $ 110,527 $ 101,364Commercial real estate 28,716 28,110 28,140 28,978 29,010Equipment lease financing 6,414 7,155 7,308 7,934 7,581Total commercial 167,203 160,602 152,282 147,439 137,955ConsumerHome equity 24,088 25,085 26,123 28,364 29,949Residential real estate 22,560 21,821 18,657 17,212 15,598Automobile 14,218 16,754 14,419 12,880 12,380Credit card 6,215 7,308 6,357 5,699 5,282Education 2,946 3,336 3,822 4,454 5,159Other consumer 4,698 4,937 4,585 4,410 4,510Total consumer 74,725 79,241 73,963 73,019 72,878Total loans $ 241,928 $ 239,843 $ 226,245 $ 220,458 $ 210,833
The PNC Financial Services Group, Inc. – 2020 Form 10-K 191
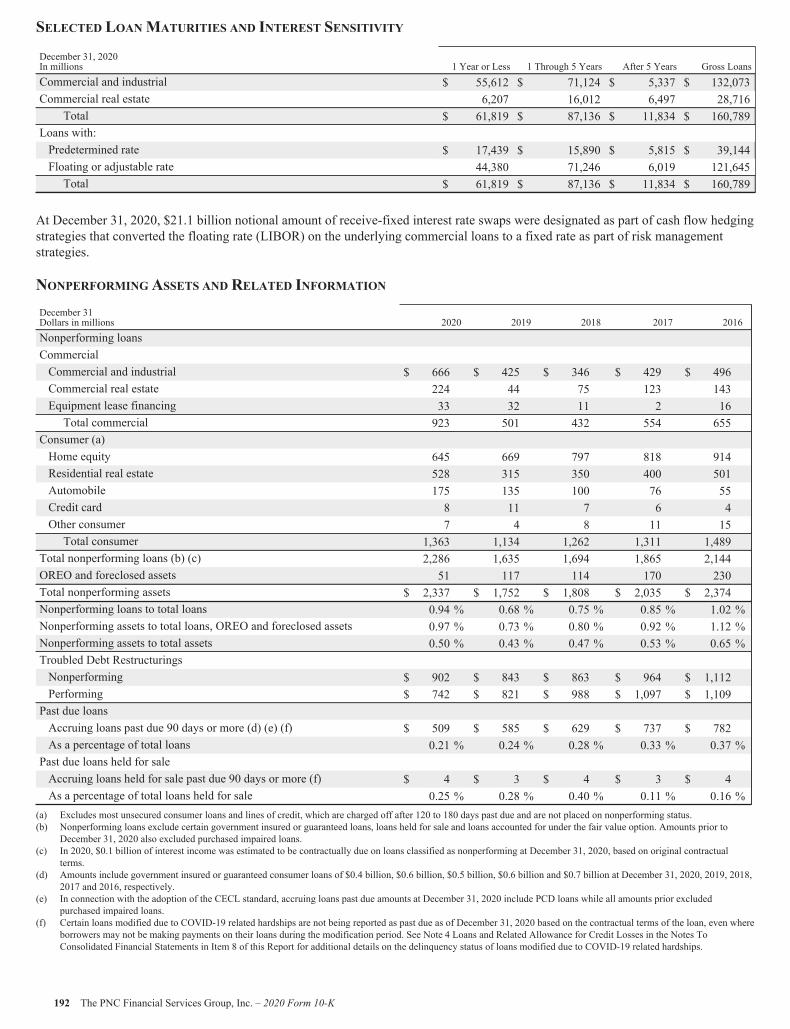
SELECTED LOANMATURITIES AND INTEREST SENSITIVITY
December 31, 2020In millions 1 Year or Less 1 Through 5 Years After 5 Years Gross LoansCommercial and industrial $ 55,612 $ 71,124 $ 5,337 $ 132,073Commercial real estate 6,207 16,012 6,497 28,716
Total $ 61,819 $ 87,136 $ 11,834 $ 160,789Loans with:Predetermined rate $ 17,439 $ 15,890 $ 5,815 $ 39,144Floating or adjustable rate 44,380 71,246 6,019 121,645Total $ 61,819 $ 87,136 $ 11,834 $ 160,789
At December 31, 2020, $21.1 billion notional amount of receive-fixed interest rate swaps were designated as part of cash flow hedgingstrategies that converted the floating rate (LIBOR) on the underlying commercial loans to a fixed rate as part of risk managementstrategies.
NONPERFORMING ASSETS AND RELATED INFORMATIONDecember 31Dollars in millions 2020 2019 2018 2017 2016Nonperforming loansCommercialCommercial and industrial $ 666 $ 425 $ 346 $ 429 $ 496Commercial real estate 224 44 75 123 143Equipment lease financing 33 32 11 2 16Total commercial 923 501 432 554 655
Consumer (a)Home equity 645 669 797 818 914Residential real estate 528 315 350 400 501Automobile 175 135 100 76 55Credit card 8 11 7 6 4Other consumer 7 4 8 11 15Total consumer 1,363 1,134 1,262 1,311 1,489
Total nonperforming loans (b) (c) 2,286 1,635 1,694 1,865 2,144OREO and foreclosed assets 51 117 114 170 230Total nonperforming assets $ 2,337 $ 1,752 $ 1,808 $ 2,035 $ 2,374Nonperforming loans to total loans 0.94 % 0.68 % 0.75 % 0.85 % 1.02 %Nonperforming assets to total loans, OREO and foreclosed assets 0.97 % 0.73 % 0.80 % 0.92 % 1.12 %Nonperforming assets to total assets 0.50 % 0.43 % 0.47 % 0.53 % 0.65 %Troubled Debt RestructuringsNonperforming $ 902 $ 843 $ 863 $ 964 $ 1,112Performing $ 742 $ 821 $ 988 $ 1,097 $ 1,109Past due loansAccruing loans past due 90 days or more (d) (e) (f) $ 509 $ 585 $ 629 $ 737 $ 782As a percentage of total loans 0.21 % 0.24 % 0.28 % 0.33 % 0.37 %Past due loans held for saleAccruing loans held for sale past due 90 days or more (f) $ 4 $ 3 $ 4 $ 3 $ 4As a percentage of total loans held for sale 0.25 % 0.28 % 0.40 % 0.11 % 0.16 %
(a) Excludes most unsecured consumer loans and lines of credit, which are charged off after 120 to 180 days past due and are not placed on nonperforming status.(b) Nonperforming loans exclude certain government insured or guaranteed loans, loans held for sale and loans accounted for under the fair value option. Amounts prior to
December 31, 2020 also excluded purchased impaired loans.(c) In 2020, $0.1 billion of interest income was estimated to be contractually due on loans classified as nonperforming at December 31, 2020, based on original contractual
terms.(d) Amounts include government insured or guaranteed consumer loans of $0.4 billion, $0.6 billion, $0.5 billion, $0.6 billion and $0.7 billion at December 31, 2020, 2019, 2018,
2017 and 2016, respectively.(e) In connection with the adoption of the CECL standard, accruing loans past due amounts at December 31, 2020 include PCD loans while all amounts prior excluded
purchased impaired loans.(f) Certain loans modified due to COVID-19 related hardships are not being reported as past due as of December 31, 2020 based on the contractual terms of the loan, even where
borrowers may not be making payments on their loans during the modification period. See Note 4 Loans and Related Allowance for Credit Losses in the Notes ToConsolidated Financial Statements in Item 8 of this Report for additional details on the delinquency status of loans modified due to COVID-19 related hardships.
192 The PNC Financial Services Group, Inc. – 2020 Form 10-K
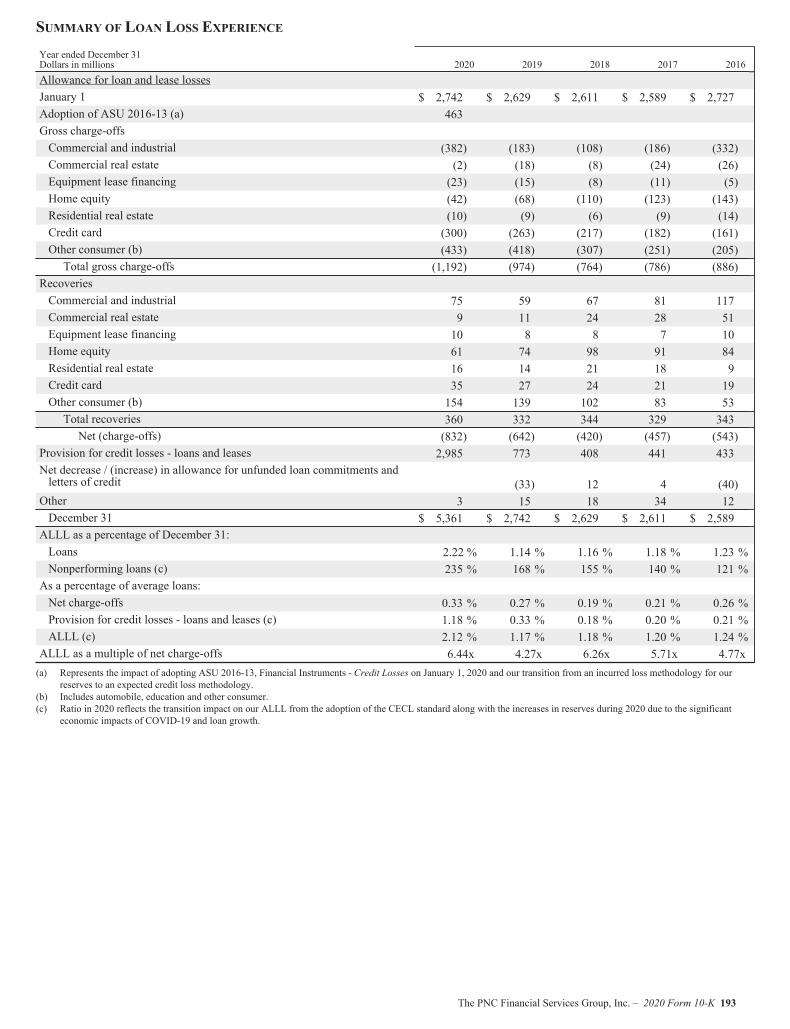
SUMMARY OF LOAN LOSS EXPERIENCEYear ended December 31Dollars in millions 2020 2019 2018 2017 2016Allowance for loan and lease lossesJanuary 1 $ 2,742 $ 2,629 $ 2,611 $ 2,589 $ 2,727Adoption of ASU 2016-13 (a) 463Gross charge-offsCommercial and industrial (382) (183) (108) (186) (332)Commercial real estate (2) (18) (8) (24) (26)Equipment lease financing (23) (15) (8) (11) (5)Home equity (42) (68) (110) (123) (143)Residential real estate (10) (9) (6) (9) (14)Credit card (300) (263) (217) (182) (161)Other consumer (b) (433) (418) (307) (251) (205)Total gross charge-offs (1,192) (974) (764) (786) (886)
RecoveriesCommercial and industrial 75 59 67 81 117Commercial real estate 9 11 24 28 51Equipment lease financing 10 8 8 7 10Home equity 61 74 98 91 84Residential real estate 16 14 21 18 9Credit card 35 27 24 21 19Other consumer (b) 154 139 102 83 53Total recoveries 360 332 344 329 343Net (charge-offs) (832) (642) (420) (457) (543)
Provision for credit losses - loans and leases 2,985 773 408 441 433Net decrease / (increase) in allowance for unfunded loan commitments andletters of credit (33) 12 4 (40)Other 3 15 18 34 12December 31 $ 5,361 $ 2,742 $ 2,629 $ 2,611 $ 2,589ALLL as a percentage of December 31:Loans 2.22 % 1.14 % 1.16 % 1.18 % 1.23 %Nonperforming loans (c) 235 % 168 % 155 % 140 % 121 %As a percentage of average loans:Net charge-offs 0.33 % 0.27 % 0.19 % 0.21 % 0.26 %Provision for credit losses - loans and leases (c) 1.18 % 0.33 % 0.18 % 0.20 % 0.21 %ALLL (c) 2.12 % 1.17 % 1.18 % 1.20 % 1.24 %ALLL as a multiple of net charge-offs 6.44x 4.27x 6.26x 5.71x 4.77x(a) Represents the impact of adopting ASU 2016-13, Financial Instruments - Credit Losses on January 1, 2020 and our transition from an incurred loss methodology for our
reserves to an expected credit loss methodology.(b) Includes automobile, education and other consumer.(c) Ratio in 2020 reflects the transition impact on our ALLL from the adoption of the CECL standard along with the increases in reserves during 2020 due to the significant
economic impacts of COVID-19 and loan growth.
The PNC Financial Services Group, Inc. – 2020 Form 10-K 193
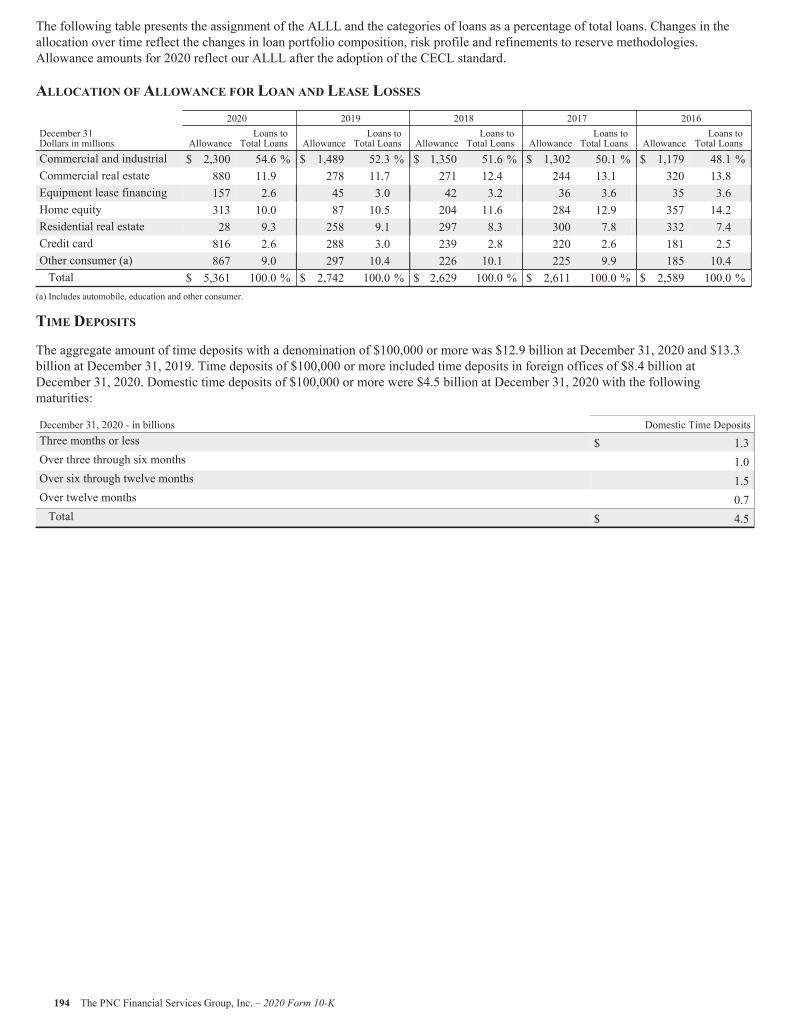
The following table presents the assignment of the ALLL and the categories of loans as a percentage of total loans. Changes in theallocation over time reflect the changes in loan portfolio composition, risk profile and refinements to reserve methodologies.Allowance amounts for 2020 reflect our ALLL after the adoption of the CECL standard.
ALLOCATION OF ALLOWANCE FOR LOAN AND LEASE LOSSES2020 2019 2018 2017 2016
December 31Dollars in millions Allowance
Loans toTotal Loans Allowance
Loans toTotal Loans Allowance
Loans toTotal Loans Allowance
Loans toTotal Loans Allowance
Loans toTotal Loans
Commercial and industrial $ 2,300 54.6 % $ 1,489 52.3 % $ 1,350 51.6 % $ 1,302 50.1 % $ 1,179 48.1 %Commercial real estate 880 11.9 278 11.7 271 12.4 244 13.1 320 13.8Equipment lease financing 157 2.6 45 3.0 42 3.2 36 3.6 35 3.6Home equity 313 10.0 87 10.5 204 11.6 284 12.9 357 14.2Residential real estate 28 9.3 258 9.1 297 8.3 300 7.8 332 7.4Credit card 816 2.6 288 3.0 239 2.8 220 2.6 181 2.5Other consumer (a) 867 9.0 297 10.4 226 10.1 225 9.9 185 10.4Total $ 5,361 100.0 % $ 2,742 100.0 % $ 2,629 100.0 % $ 2,611 100.0 % $ 2,589 100.0 %
(a) Includes automobile, education and other consumer.
TIME DEPOSITS
The aggregate amount of time deposits with a denomination of $100,000 or more was $12.9 billion at December 31, 2020 and $13.3billion at December 31, 2019. Time deposits of $100,000 or more included time deposits in foreign offices of $8.4 billion atDecember 31, 2020. Domestic time deposits of $100,000 or more were $4.5 billion at December 31, 2020 with the followingmaturities:
December 31, 2020 - in billions Domestic Time DepositsThree months or less $ 1.3Over three through six months 1.0Over six through twelve months 1.5Over twelve months 0.7Total $ 4.5
194 The PNC Financial Services Group, Inc. – 2020 Form 10-K
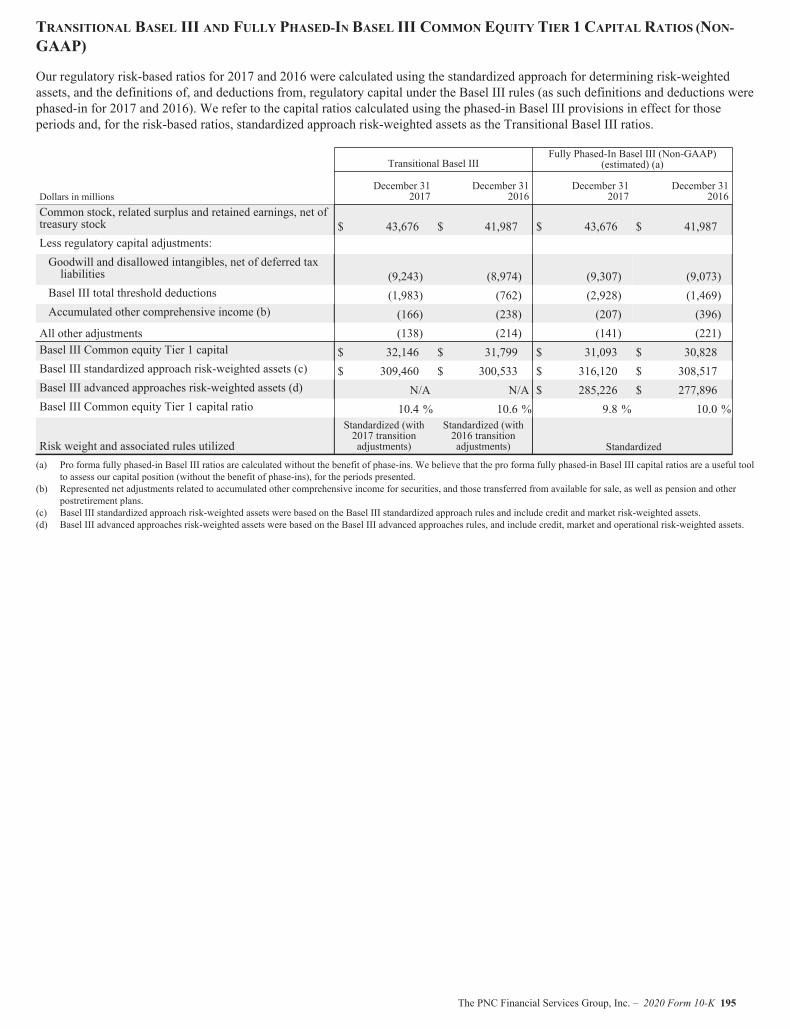
TRANSITIONAL BASEL III AND FULLY PHASED-IN BASEL III COMMON EQUITY TIER 1 CAPITAL RATIOS (NON-GAAP)
Our regulatory risk-based ratios for 2017 and 2016 were calculated using the standardized approach for determining risk-weightedassets, and the definitions of, and deductions from, regulatory capital under the Basel III rules (as such definitions and deductions werephased-in for 2017 and 2016). We refer to the capital ratios calculated using the phased-in Basel III provisions in effect for thoseperiods and, for the risk-based ratios, standardized approach risk-weighted assets as the Transitional Basel III ratios.
Transitional Basel IIIFully Phased-In Basel III (Non-GAAP)
(estimated) (a)
Dollars in millionsDecember 31
2017December 31
2016December 31
2017December 31
2016Common stock, related surplus and retained earnings, net oftreasury stock $ 43,676 $ 41,987 $ 43,676 $ 41,987Less regulatory capital adjustments:Goodwill and disallowed intangibles, net of deferred taxliabilities (9,243) (8,974) (9,307) (9,073)
Basel III total threshold deductions (1,983) (762) (2,928) (1,469)Accumulated other comprehensive income (b) (166) (238) (207) (396)All other adjustments (138) (214) (141) (221)Basel III Common equity Tier 1 capital $ 32,146 $ 31,799 $ 31,093 $ 30,828Basel III standardized approach risk-weighted assets (c) $ 309,460 $ 300,533 $ 316,120 $ 308,517Basel III advanced approaches risk-weighted assets (d) N/A N/A $ 285,226 $ 277,896Basel III Common equity Tier 1 capital ratio 10.4 % 10.6 % 9.8 % 10.0 %
Risk weight and associated rules utilized
Standardized (with2017 transitionadjustments)
Standardized (with2016 transitionadjustments) Standardized
(a) Pro forma fully phased-in Basel III ratios are calculated without the benefit of phase-ins. We believe that the pro forma fully phased-in Basel III capital ratios are a useful toolto assess our capital position (without the benefit of phase-ins), for the periods presented.
(b) Represented net adjustments related to accumulated other comprehensive income for securities, and those transferred from available for sale, as well as pension and otherpostretirement plans.
(c) Basel III standardized approach risk-weighted assets were based on the Basel III standardized approach rules and include credit and market risk-weighted assets.(d) Basel III advanced approaches risk-weighted assets were based on the Basel III advanced approaches rules, and include credit, market and operational risk-weighted assets.
The PNC Financial Services Group, Inc. – 2020 Form 10-K 195

GLOSSARYDEFINED TERMS
2019 Tailoring Rules – Rules adopted by the federal banking agencies to better tailor the application of their capital, liquidity, andenhanced prudential requirements for banking organizations to the asset size and risk profile (as measured by certain regulatorymetrics) of the banking organization. Effective January 1, 2020, the agencies' capital and liquidity rules classify all BHCs with $100billion or more in total assets into one of four categories (Category I, Category II, Category III, and Category IV).
Adjusted average total assets – Primarily consisted of total average quarterly (or annual) assets plus/less unrealized losses (gains) oninvestment securities, less goodwill and certain other intangible assets (net of eligible deferred taxes).
Allowance for credit losses (ACL) – A valuation account that is deducted from or added to the amortized cost basis of the relatedfinancial assets to present the net carrying value at the amount expected to be collected on the financial asset.
Amortized cost basis – Amount at which a financial asset is originated or acquired, adjusted for applicable accretion or amortization ofpremiums, discounts and net deferred fees or costs, collection of cash, charge-offs, foreign exchange and fair value hedge accountingadjustments.
Basel III common equity Tier 1 (CET1) capital - Common stock plus related surplus, net of treasury stock, plus retained earnings, plusaccumulated other comprehensive income for securities currently, and those transferred from, available for sale and pension and otherpostretirement benefit plans, subject to phase-in limits, less goodwill, net of associated deferred tax liabilities, less other disallowedintangibles, net of deferred tax liabilities and plus/less other adjustments. Significant common stock investments in unconsolidatedfinancial institutions, as well as mortgage servicing rights and deferred tax assets, must then be deducted to the extent such items (netof associated deferred tax liabilities) individually exceed 10%, or in the aggregate exceed 15%, of our adjusted Basel III commonequity Tier 1 capital.
Basel III common equity Tier 1 (CET1) capital (Tailoring Rules) - Common stock plus related surplus, net of treasury stock, plusretained earnings, less goodwill, net of associated deferred tax liabilities, less other disallowed intangibles, net of deferred taxliabilities and plus/less other adjustments. Investments in unconsolidated financial institutions, as well as mortgage servicing rightsand deferred tax assets, must then be deducted to the extent such items (net of associated deferred tax liabilities) individually exceed25% of our adjusted Basel III common equity Tier 1 capital.
Basel III common equity Tier 1 capital ratio – Common equity Tier 1 capital divided by period-end risk-weighted assets (asapplicable).
Basel III Tier 1 capital – Common equity Tier 1 capital, plus qualifying preferred stock, plus certain trust preferred capital securities,plus certain noncontrolling interests that are held by others and plus/less other adjustments.
Basel III Tier 1 capital ratio – Tier 1 capital divided by period-end risk-weighted assets (as applicable).
Basel III Total capital – Tier 1 capital plus qualifying subordinated debt, plus certain trust preferred securities, plus, under the Basel IIItransitional rules and the standardized approach, the allowance for loan and lease losses included in Tier 2 capital and other.
Basel III Total capital ratio – Basel III Total capital divided by period-end risk-weighted assets (as applicable).
Basel Committee – Basel Committee on Banking Supervision.
BBVA – BBVA USA Bancshares, Inc.
BBVA, S.A. – Banco Bilbao Vizcaya Argentaria, S.A.
BBVA USA – BBVA USA, the Alabama-chartered bank subsidiary of BBVA USA Bancshares, Inc.
BlackRock – BlackRock, Inc.
Charge-off – Process of removing a loan or portion of a loan from our balance sheet because it is considered uncollectible. We alsorecord a charge-off when a loan is transferred from portfolio holdings to held for sale by reducing the loan carrying amount to the fairvalue of the loan, if fair value is less than carrying amount.
196 The PNC Financial Services Group, Inc. – 2020 Form 10-K

Collateral dependent loans – Loans expected to be repaid substantially through the operation or sale of the collateral underlying theloan when a borrower is experiencing financial difficulty, and for which we have elected to measure the loan at the estimated fairvalue of collateral (less costs to sell if sale or foreclosure of the property is expected). Additionally, we consider a loan to be collateraldependent when foreclosure or liquidation of the underlying collateral is probable.
Combined loan-to-value ratio (CLTV) – This is the aggregate principal balance(s) of the mortgages on a property divided by itsappraised value or purchase price.
Common shareholders’ equity – Total shareholders’ equity less the liquidation value of preferred stock.
Company – The PNC Financial Services Group, Inc. and its subsidiaries (interchangeable with “PNC”, “we”, “us”, “the Company” or“the Corporation” on this Form).
COVID-19 – The coronavirus, which resulted in a worldwide pandemic beginning in 2020 (interchangeable with “the pandemic”, or“the COVID-19 pandemic” on this Form).
Credit valuation adjustment – Represents an adjustment to the fair value of our derivatives for our own and counterparties’ non-performance risk.
Criticized commercial loans – Loans with potential or identified weaknesses based upon internal risk ratings that comply with theregulatory classification definitions of “Special Mention,” “Substandard” or “Doubtful.”
Current Expected Credit Loss (CECL) – Methodology for estimating the ACL on in-scope financial assets heldat amortized cost and unfunded lending related commitments, which uses a combination of expected losses over a reasonable andsupportable forecast period, a reversion period and long run average credit losses for their estimated contractual term.
Discretionary client assets under management – Assets over which we have sole or shared investment authority for our customers/clients. We do not include these assets on our Consolidated Balance Sheet.
Dodd-Frank – Dodd-Frank Wall Street Reform and Consumer Protection Act.
Earning assets – Assets that generate income, which include: interest-earning deposits with banks, loans held for sale, loans,investment securities and certain other assets.
Effective duration – A measurement, expressed in years, that, when multiplied by a change in interest rates, would approximate thepercentage change in value of on- and off- balance sheet positions.
Efficiency – Noninterest expense divided by total revenue.
Estimated contractual term - In the context of CECL, the contractual term of the financial asset or credit exposure, adjusted forestimated draws and prepayments, certain embedded extension options and extensions granted under troubled debt restructurings.
Exchange Act – Securities Exchange Act of 1934, as amended.
Exposure at default (EAD) – The credit exposure estimated to be outstanding in the event of default of a credit obligor.
Fair value – The price that would be received to sell an asset or paid to transfer a liability in an orderly transaction between marketparticipants at the measurement date.
Federal Reserve – The Board of Governors of the Federal Reserve System.
Fee income – Refers to the following categories within Noninterest income: Asset management, Consumer services, Corporateservices, Residential mortgage and Service charges on deposits.
FICO score – A credit bureau-based industry standard score created by Fair Isaac Co. which predicts the likelihood of borrowerdefault. We use FICO scores both in underwriting and assessing credit risk in our consumer lending portfolio. Lower FICO scoresindicate likely higher risk of default, while higher FICO scores indicate likely lower risk of default. FICO scores are updated on aperiodic basis.
Foreign exchange contracts – Contracts that provide for the future receipt and delivery of foreign currency at previously agreed-uponterms.
The PNC Financial Services Group, Inc. – 2020 Form 10-K 197

Futures and forward contracts – Contracts in which the buyer agrees to purchase and the seller agrees to deliver a specific financialinstrument at a predetermined price or yield. May be settled either in cash or by delivery of the underlying financial instrument.
Home price index (HPI) – A broad measure of the movement of single-family house prices in the U.S.
Interest rate swap contracts – Contracts that are entered into primarily as an asset/liability management strategy to reduce interest raterisk. Interest rate swap contracts are exchanges of interest rate payments, such as fixed-rate payments for floating-rate payments, basedon notional principal amounts.
Intrinsic value – The difference between the price, if any, required to be paid for stock issued pursuant to an equity compensationarrangement and the fair market value of the underlying stock.
Leverage ratio – Basel III Tier 1 capital divided by average quarterly adjusted total assets.
London InterBank Offered Rate (LIBOR) – LIBOR is the average interest rate charged when banks in the London wholesale moneymarket (or interbank market) borrow unsecured funds from each other. LIBOR rates are used as a benchmark for interest rates on aglobal basis. Our product set includes loans priced using LIBOR as a benchmark.
Loan-to-value ratio (LTV) – A calculation of a loan’s collateral coverage that is used both in underwriting and assessing credit risk inour lending portfolio. LTV is the sum total of loan obligations secured by collateral divided by the market value of that samecollateral. Market value of the collateral is based on an independent valuation of the collateral. For example, a LTV of less than 90% isbetter secured and has less credit risk than a LTV of greater than or equal to 90%.
Long run average – In the context of CECL, expected credit losses or credit risk parameters for the remaining estimatedcontractual maturity beyond the reasonable and supportable forecast and reversion periods. The long run average is generally derivedfrom historical loss information and current portfolio characteristics, without considering current or forecasted conditions.
Loss given default (LGD) – Assuming a credit obligor enters default status, an estimate of loss, based on collateral type, collateralvalue, loan exposure and other factors. LGD is net of recovery, through any means, including but not limited to the liquidation ofcollateral or deficiency judgments rendered from foreclosure or bankruptcy proceedings.
Nonaccrual loans – Loans for which we do not accrue interest income. Nonaccrual loans include nonperforming loans, in addition toloans accounted for under fair value option and loans accounted for as held for sale for which full collection of contractual principaland/or interest is not probable.
Nondiscretionary client assets under administration – Assets we hold for our customers/clients in a nondiscretionary, custodialcapacity. We do not include these assets on our Consolidated Balance Sheet.
Nonperforming assets – Nonperforming assets include nonperforming loans, OREO and foreclosed assets. We do not accrue interestincome on assets classified as nonperforming.
Nonperforming loans – Loans accounted for at amortized cost whose credit quality has deteriorated to the extent that full collection ofcontractual principal and interest is not probable, including TDRs which have not returned to performing status. Interest income is notrecognized on nonperforming loans. Nonperforming loans exclude certain government insured or guaranteed loans for which weexpect to collect substantially all principal and interest, loans held for sale, and loans accounted for under the fair value option.
Notional amount – The basis to which the underlying referenced interest rate, security price, credit spread or other index is applied todetermine required payments under the derivative contract.
Operating leverage – The period to period dollar or percentage change in total revenue less the dollar or percentage change innoninterest expense. A positive variance indicates that revenue growth exceeded expense growth (i.e., positive operating leverage)while a negative variance implies expense growth exceeded revenue growth (i.e., negative operating leverage).
Options – Contracts that grant the purchaser, for a premium payment, the right, but not the obligation, to either purchase or sell theassociated financial instrument at a set price during a specified period or at a specified date in the future.
Other real estate owned (OREO) and foreclosed assets – Assets taken in settlement of troubled loans primarily through deed-in-lieu offoreclosure or foreclosure. Foreclosed assets include real and personal property. Certain assets that have a government-guaranteewhich are classified as other receivables are excluded.
PNC Bank – PNC Bank, National Association.
198 The PNC Financial Services Group, Inc. – 2020 Form 10-K
Probability of default (PD) – An estimate of the likelihood that a credit obligor will enter default status.
Purchased credit deteriorated assets (PCD) – Acquired loans or debt securities that, at acquisition, are determined to have experienceda more-than-insignificant deterioration in credit quality since origination or issuance.
Reasonable and supportable forecast period – In the context of CECL, the period for which forecasts and projections ofmacroeconomic variables have been determined to be reasonable and supportable, and are used as inputs for ACL measurement.
Recovery – Cash proceeds received on a loan that we had previously charged-off. We credit the amount received to the allowance forloan and lease losses.
Reversion period – In the context of CECL, the period between the end of the reasonable and supportable forecast period and the pointat which losses are expected to have reverted to their long run average, in order to reflect an overall reasonable estimate of expectedcredit losses.
Risk appetite – A dynamic, forward-looking view on the aggregate amount of risk we are willing and able to take in executingbusiness strategy in light of the current business environment.
Risk limits – Quantitative measures based on forward-looking assumptions that allocate our aggregate risk appetite (e.g., measure ofloss or negative events) to business lines, legal entities, specific risk categories, concentrations and as appropriate, other levels.
Risk profile – The risk profile is a point-in-time assessment of risk. The profile represents overall risk position in relation to thedesired risk appetite. The determination of the risk profile’s position is based on qualitative and quantitative analysis of reported risklimits, metrics, operating guidelines and qualitative assessments.
Risk-weighted assets – Computed by the assignment of specific risk-weights (as defined by the Board of Governors of the FederalReserve System) to assets and off-balance sheet instruments.
Secured Overnight Financing Rate (SOFR) - SOFR is a reference rate that is based on overnight transactions in the U.S. Treasuryrepurchase market.
Servicing rights – Intangible assets or liabilities created by an obligation to service assets for others. Typical servicing rights includethe right to receive a fee for collecting and forwarding payments on loans and related taxes and insurance premiums held in escrow.
Supplementary leverage exposure - The sum of adjusted average assets and certain off-balance sheet exposures, including undrawncredit commitments and derivative potential future exposures.
Supplementary leverage ratio – Basel III Tier 1 capital divided by Supplementary leverage exposure.
Taxable-equivalent interest income – The interest income earned on certain assets that is completely or partially exempt from federalincome tax. These tax-exempt instruments typically yield lower returns than taxable investments. To provide more meaningfulcomparisons of yields and margins for all interest-earning assets, we use interest income on a taxable-equivalent basis in calculatingaverage yields and net interest margins by increasing the interest income earned on tax-exempt assets to make it fully equivalent tointerest income earned on other taxable investments. This adjustment is not permitted under GAAP on the Consolidated IncomeStatement.
Troubled debt restructuring (TDR) – A loan whose terms have been restructured in a manner that grants a concession to a borrowerexperiencing financial difficulties.
Unfunded lending related commitments – Standby letters of credit, financial guarantees, commitments to extend credit and similarunfunded obligations that are not unilaterally, unconditionally, cancellable at PNC’s option.
Value-at-risk (VaR) – A statistically-based measure of risk that describes the amount of potential loss which may be incurred due toadverse market movements. The measure is of the maximum loss which should not be exceeded on 95 out of 100 days for a 95% VaR.
Yield curve – A graph showing the relationship between the yields on financial instruments or market indices of the same creditquality with different maturities. For example, a “normal” or “positive” yield curve exists when long-term bonds have higher yieldsthan short-term bonds. A “flat” yield curve exists when yields are the same for short-term and long-term bonds. A “steep” yield curveexists when yields on long-term bonds are significantly higher than on short-term bonds. An “inverted” or “negative” yield curveexists when short-term bonds have higher yields than long-term bonds.
The PNC Financial Services Group, Inc. – 2020 Form 10-K 199
ACRONYMSACH Automated clearing house GNMA Government National Mortgage AssociationACL Allowance for credit losses GSIB Globally systemically important bankALLL Allowance for loan and lease losses HPI Home price indexAML Anti-Money Laundering HQLA High quality, unencumbered liquid assetsAOCI Accumulated other comprehensive income ISDA International Swaps and Dealer AssociationASC Accounting Standards Codification ISP The PNC Incentive Savings PlanASF Available stable funding LCR Liquidity Coverage RatioASU Accounting Standards Update LGD Loss given defaultBEC Business email compromise scams LIBOR London Interbank Offered RateBHC Bank holding company LIHTC Low income housing tax creditBHC Act Bank Holding Company Act of 1956 LLC Limited liability companybps Basis points LTV Loan-to-value ratio
BSA Bank Secrecy Act MD&AManagement’s Discussion and Analysis of FinancialCondition and Results of Operations
CARES Act Coronavirus Aid, Relief and Economic Security Act MSR Mortgage servicing rightCCAR Comprehensive Capital Analysis and Review NAICS North American Industry Classification SystemCECL Current expected credit losses NAV Net asset value
CECL RACPNC’s Current Expected Credit Losses ReserveAdequacy Committee NSFR Net Stable Funding Ratio
CET1 Common equity tier 1 NYSE New York Stock ExchangeCFPB Consumer Financial Protection Bureau OCC Office of the Comptroller of the CurrencyCFTC Commodity Futures Trading Commission OCI Other comprehensive incomeCLTV Combined loan-to-value ratio OREO Other real estate owned
COSOCommittee of Sponsoring Organizations of theTreadway Commission OTC Over-the-counter
CRA Community Reinvestment Act OTTI Other than temporary impairmentDDoS Distributed denial of service cyber attacks PCAOB Public Company Accounting Oversight BoardDFAST Dodd-Frank capital stress testing PCD Purchased credit deterioratedDUS Delegated Underwriting and Servicing program PD Probability of defaultEAD Exposure at default PPP Paycheck Protection Program
ERISAEmployee Retirement Income Security Act of 1974, asamended ROAPs Removal of account provisions
ERM Enterprise Risk Management ROU Right-of-use assetsFASB Financial Accounting Standards Board RSF Required stable fundingFDI Act Federal Deposit Insurance Act SBA Small Business AdministrationFDIC Federal Deposit Insurance Corporation SCB Stress capital bufferFFIEC Federal Financial Institutions Examination Council SCCL Single counterparty credit limitFHA Federal Housing Administration SEC Securities and Exchange CommissionFHLB Federal Home Loan Bank SLR Supplementary leverage ratioFHLMC Federal Home Loan Mortgage Corporation SOFR Secured Overnight Financing RateFICO Fair Isaac Corporation (credit score) SPE Special purpose entityFinCEN Financial Crimes Enforcement Network TDR Troubled debt restructuringFINRA Financial Industry Regulatory Authority TLAC Total loss-absorbing capacityFNMA Federal National Mortgage Association U.S. United States of AmericaFOMC Federal Open Market Committee USD United States DollarFSOC Financial Stability Oversight Council VA Department of Veterans Affairs
GAAPAccounting principles generally accepted in the UnitedStates of America VaR Value-at-risk
GDP Gross Domestic Product VEBA Voluntary Employee Beneficiary AssociationGLB Act Gramm-Leach-Bliley Act VIE Variable interest entity
200 The PNC Financial Services Group, Inc. – 2020 Form 10-K
ITEM 9 – CHANGES IN AND DISAGREEMENTS WITH ACCOUNTANTS ON ACCOUNTING ANDFINANCIAL DISCLOSURENone.
ITEM 9A – CONTROLS AND PROCEDURES
MANAGEMENT’S REPORT ON INTERNALCONTROL OVER FINANCIAL REPORTINGThe management of The PNC Financial Services Group, Inc. and subsidiaries (PNC) is responsible for establishing and maintainingadequate internal control over financial reporting, as such term is defined in the Exchange Act Rule 13a-15(f).
Because of inherent limitations, internal control over financial reporting may not prevent or detect misstatements. Also, projections ofany evaluation of effectiveness to future periods are subject to the risk that controls may become inadequate because of changes inconditions, or that the degree of compliance with the policies or procedures may deteriorate.
We performed an evaluation under the supervision and with the participation of our management, including the Chairman, Presidentand Chief Executive Officer and the Executive Vice President and Chief Financial Officer, of the effectiveness of PNC’s internalcontrol over financial reporting as of December 31, 2020. This assessment was based on criteria for effective internal control overfinancial reporting described in Internal Control-Integrated Framework (2013) issued by the Committee of Sponsoring Organizationsof the Treadway Commission. Based on this assessment, management concluded that PNC maintained effective internal control overfinancial reporting as of December 31, 2020.
PricewaterhouseCoopers LLP, the independent registered public accounting firm that audited our consolidated financial statements asof and for the year ended December 31, 2020 included in this Report, has also audited the effectiveness of PNC’s internal control overfinancial reporting as of December 31, 2020. The report of PricewaterhouseCoopers LLP is included under Item 8 of this Report.
DISCLOSURE CONTROLS AND PROCEDURES ANDCHANGES IN INTERNALCONTROL OVER FINANCIAL REPORTINGAs of December 31, 2020, we performed an evaluation under the supervision and with the participation of our management, includingthe Chairman, President and Chief Executive Officer and the Executive Vice President and Chief Financial Officer, of theeffectiveness of the design and operation of our disclosure controls and procedures and of changes in our internal control overfinancial reporting.
Based on that evaluation, our Chairman, President and Chief Executive Officer and our Executive Vice President and Chief FinancialOfficer concluded that our disclosure controls and procedures (as defined in Rule 13a-15(e) under the Securities and Exchange Act of1934, as amended) were effective as of December 31, 2020, and that there has been no change in PNC’s internal control over financialreporting that occurred during the fourth quarter of 2020 that has materially affected, or is reasonably likely to materially affect, ourinternal control over financial reporting.
ITEM 9B – OTHER INFORMATIONNone.
PART III
ITEM 10 – DIRECTORS, EXECUTIVE OFFICERS AND CORPORATE GOVERNANCECertain of the information regarding our directors (or nominees for director), executive officers and Audit Committee (and AuditCommittee financial experts), required by this item is included under the captions “Election of Directors (Item 1),” and “CorporateGovernance – Board committees – Audit Committee,” in our Proxy Statement to be filed for the 2021 annual meeting of shareholdersand is incorporated herein by reference.
Additional information regarding our executive officers is included in Part I of this Report under the captions “Information about ourExecutive Officers.”
Information regarding our compliance with Section 16(a) of the Securities Exchange Act of 1934 is included, to the extent necessary,under the caption “Delinquent Section 16(a) Reports” in our Proxy Statement to be filed for the 2021 annual meeting of shareholdersand is incorporated herein by reference.
Certain information regarding our PNC Code of Business Conduct and Ethics required by this item is included under the caption“Corporate Governance – Our Code of Business Conduct and Ethics” and “Director and Executive Officer Relationships – Code ofBusiness Conduct and Ethics” in our Proxy Statement to be filed for the 2021 annual meeting of shareholders and is incorporated
The PNC Financial Services Group, Inc. – 2020 Form 10-K 201
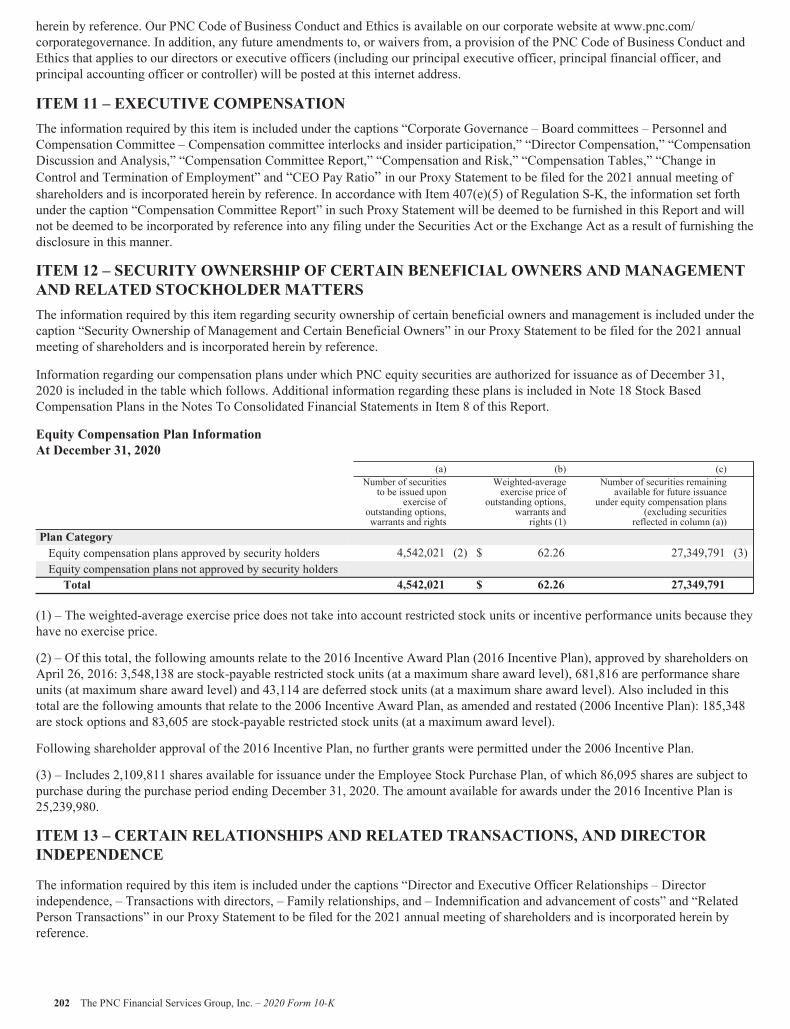
herein by reference. Our PNC Code of Business Conduct and Ethics is available on our corporate website at www.pnc.com/corporategovernance. In addition, any future amendments to, or waivers from, a provision of the PNC Code of Business Conduct andEthics that applies to our directors or executive officers (including our principal executive officer, principal financial officer, andprincipal accounting officer or controller) will be posted at this internet address.
ITEM 11 – EXECUTIVE COMPENSATIONThe information required by this item is included under the captions “Corporate Governance – Board committees – Personnel andCompensation Committee – Compensation committee interlocks and insider participation,” “Director Compensation,” “CompensationDiscussion and Analysis,” “Compensation Committee Report,” “Compensation and Risk,” “Compensation Tables,” “Change inControl and Termination of Employment” and “CEO Pay Ratio” in our Proxy Statement to be filed for the 2021 annual meeting ofshareholders and is incorporated herein by reference. In accordance with Item 407(e)(5) of Regulation S-K, the information set forthunder the caption “Compensation Committee Report” in such Proxy Statement will be deemed to be furnished in this Report and willnot be deemed to be incorporated by reference into any filing under the Securities Act or the Exchange Act as a result of furnishing thedisclosure in this manner.
ITEM 12 – SECURITY OWNERSHIP OF CERTAIN BENEFICIAL OWNERS AND MANAGEMENTAND RELATED STOCKHOLDER MATTERSThe information required by this item regarding security ownership of certain beneficial owners and management is included under thecaption “Security Ownership of Management and Certain Beneficial Owners” in our Proxy Statement to be filed for the 2021 annualmeeting of shareholders and is incorporated herein by reference.
Information regarding our compensation plans under which PNC equity securities are authorized for issuance as of December 31,2020 is included in the table which follows. Additional information regarding these plans is included in Note 18 Stock BasedCompensation Plans in the Notes To Consolidated Financial Statements in Item 8 of this Report.
Equity Compensation Plan InformationAt December 31, 2020
(a) (b) (c)Number of securitiesto be issued upon
exercise ofoutstanding options,warrants and rights
Weighted-averageexercise price of
outstanding options,warrants andrights (1)
Number of securities remainingavailable for future issuance
under equity compensation plans(excluding securities
reflected in column (a))Plan CategoryEquity compensation plans approved by security holders 4,542,021 (2) $ 62.26 27,349,791 (3)Equity compensation plans not approved by security holdersTotal 4,542,021 $ 62.26 27,349,791
(1) – The weighted-average exercise price does not take into account restricted stock units or incentive performance units because theyhave no exercise price.
(2) – Of this total, the following amounts relate to the 2016 Incentive Award Plan (2016 Incentive Plan), approved by shareholders onApril 26, 2016: 3,548,138 are stock-payable restricted stock units (at a maximum share award level), 681,816 are performance shareunits (at maximum share award level) and 43,114 are deferred stock units (at a maximum share award level). Also included in thistotal are the following amounts that relate to the 2006 Incentive Award Plan, as amended and restated (2006 Incentive Plan): 185,348are stock options and 83,605 are stock-payable restricted stock units (at a maximum award level).
Following shareholder approval of the 2016 Incentive Plan, no further grants were permitted under the 2006 Incentive Plan.
(3) – Includes 2,109,811 shares available for issuance under the Employee Stock Purchase Plan, of which 86,095 shares are subject topurchase during the purchase period ending December 31, 2020. The amount available for awards under the 2016 Incentive Plan is25,239,980.
ITEM 13 – CERTAIN RELATIONSHIPS AND RELATED TRANSACTIONS, AND DIRECTORINDEPENDENCE
The information required by this item is included under the captions “Director and Executive Officer Relationships – Directorindependence, – Transactions with directors, – Family relationships, and – Indemnification and advancement of costs” and “RelatedPerson Transactions” in our Proxy Statement to be filed for the 2021 annual meeting of shareholders and is incorporated herein byreference.
202 The PNC Financial Services Group, Inc. – 2020 Form 10-K

ITEM 14 – PRINCIPAL ACCOUNTING FEES AND SERVICESThe information required by this item is included under the caption “Ratification of Independent Registered Public Accounting Firm"in our Proxy Statement to be filed for the 2021 annual meeting of shareholders and is incorporated herein by reference.
PART IV
ITEM 15 – EXHIBITS, FINANCIAL STATEMENT SCHEDULES
FINANCIAL STATEMENTS, FINANCIAL STATEMENT SCHEDULES
Our consolidated financial statements required in response to this Item are incorporated by reference from Item 8 of this Report.Audited consolidated financial statements of BlackRock, Inc. as of December 31, 2020 and 2019 and for each of the three years in theperiod ended December 31, 2020 are filed with this Report as Exhibit 99.1 and incorporated herein by reference.
EXHIBIT INDEX
ExhibitNo. Description Method of Filing +
2.1 Stock Purchase Agreement, dated as of November 15, 2020,between Banco Bilbao Vizcaya Argentaria, S.A. and ThePNC Financial Services Group, Inc.
Incorporated herein by reference to Exhibit 2.1 of theCorporation’s Current Report on Form 8-K filed November19, 2020
3.1.1 Amended and Restated Articles of Incorporation of theCorporation, effective January 2, 2009
Incorporated herein by reference to Exhibit 3.1 of theCorporation’s Annual Report on Form 10-K for the yearended December 31, 2008 (2008 Form 10-K)
3.1.2 Statement with Respect to Shares of Fixed-to-Floating RateNon-Cumulative Perpetual Preferred Stock, Series O datedJuly 21, 2011
Incorporated herein by reference to Exhibit 3.1 of theCorporation’s Current Report on Form 8-K filed July 27,2011
3.1.3 Statement with Respect to Shares of Fixed-to-Floating RateNon-Cumulative Perpetual Preferred Stock, Series P datedApril 19, 2012
Incorporated herein by reference to Exhibit 3.1 of theCorporation’s Current Report on Form 8-K filed April 24,2012
3.1.4 Statement with Respect to Shares of 5.375% Non-Cumulative Perpetual Preferred Stock, Series Q datedSeptember 14, 2012
Incorporated herein by reference to Exhibit 3.1 of theCorporation’s Current Report on Form 8-K filedSeptember 21, 2012
3.1.5 Statement with Respect to Shares of Fixed-to-Floating RateNon-Cumulative Perpetual Preferred Stock, Series R datedMay 2, 2013
Incorporated herein by reference to Exhibit 3.1 of theCorporation’s Current Report on Form 8-K filed May 7,2013
3.1.6 Amendment to Amended and Restated Articles ofIncorporation of the Corporation, effective November 19,2015
Incorporated herein by reference to Exhibit 3.1.6 of theCorporation’s Current Report on Form 8-K filedNovember 20, 2015
3.1.7 Statement with Respect to Shares of Fixed-to-Floating RateNon-Cumulative Perpetual Preferred Stock, Series S datedOctober 27, 2016
Incorporated herein by reference to Exhibit 3.1 of theCorporation’s Current Report on Form 8-K filedNovember 1, 2016
3.2 By-Laws of the Corporation, as amended and restated,effective August 11, 2016
Incorporated herein by reference to Exhibit 3.2 of theCorporation’s Current Report on Form 8-K filed August 11,2016
4.1 There are no instruments with respect to long-term debt ofthe Corporation and its subsidiaries that involve a totalamount of securities authorized thereunder that exceed10 percent of the total assets of the Corporation and itssubsidiaries on a consolidated basis. The Corporation agreesto provide the SEC with a copy of instruments defining therights of holders of long-term debt of the Corporation andits subsidiaries on request.
The PNC Financial Services Group, Inc. – 2020 Form 10-K 203
ExhibitNo. Description Method of Filing +
4.2 Deposit Agreement dated July 27, 2011, between theCorporation, Computershare Trust Company, N.A.,Computershare Inc. and the holders from time to time of theDepositary Receipts representing interests in the Series Opreferred stock
Incorporated herein by reference to Exhibit 4.2 of theCorporation’s Current Report on Form 8-K filed July 27,2011
4.3 Deposit Agreement, dated April 24, 2012, between theCorporation, Computershare Trust Company, N.A.,Computershare Inc. and the holders from time to time of theDepositary Receipts representing interests in the Series Ppreferred stock
Incorporated herein by reference to Exhibit 4.2 of theCorporation’s Current Report on Form 8-K filed April 24,2012
4.4 Deposit Agreement, dated May 7, 2013, between theCorporation, Computershare Trust Company, N.A.,Computershare Inc. and the holders from time to time of theDepositary Receipts representing interests in the Series Rpreferred stock
Incorporated herein by reference to Exhibit 4.2 of theCorporation’s Current Report on Form 8-K filed May 7,2013
4.5 Deposit Agreement, dated November 1, 2016, between theCorporation, Computershare Trust Company, N.A.,Computershare Inc. and the holders from time to time of theDepositary Receipts representing interests in the Series Spreferred stock
Incorporated herein by reference to Exhibit 4.2 of theCorporation’s Current Report on Form 8-K filedNovember 1, 2016
4.6 Form of PNC Bank, National Association SubordinatedFixed Rate Global Bank Note issued prior to January 16,2014
Incorporated herein by reference to Exhibit 4.11 of theCorporation’s Quarterly Report on Form 10-Q for thequarter ended September 30, 2004
4.7.1 Issuing and Paying Agency Agreement, dated January 16,2014, between PNC Bank, National Association and PNCBank, National Association, relating to the $25 billionGlobal Bank Note Program for the Issue of Senior andSubordinated Bank Notes
Incorporated herein by reference to Exhibit 4.25 of theCorporation’s Annual Report on Form 10-K for the yearended December 31, 2013 (2013 Form 10-K)
4.7.2 Amendment No. 1 to Issuing and Paying AgencyAgreement, dated May 22, 2015, between PNC Bank,National Association and PNC Bank, National Association,relating to the $30 billion Global Bank Note Program for theIssue of Senior and Subordinated Bank Notes
Incorporated herein by reference to Exhibit 4.21.2 of theCorporation’s Quarterly Report on Form 10-Q for thequarter ended June 30, 2015 (2nd Quarter 2015 Form 10-Q)
4.7.3 Amendment No. 2 to Issuing and Paying AgencyAgreement, dated May 27, 2016, between PNC Bank,National Association and PNC Bank, National Association,relating to the $40 billion Global Bank Note Program for theIssue of Senior and Subordinated Bank Notes
Incorporated herein by reference to Exhibit 4.20.3 of theCorporation’s Quarterly Report on Form 10-Q for thequarter ended June 30, 2016 (2nd Quarter 2016 Form 10-Q)
4.8 Forms of PNC Bank, National Association Senior GlobalBank Notes issued after January 16, 2014 (included inExhibit 4.7.1)
Incorporated herein by reference to Exhibit 4.25 of theCorporation’s 2013 Form 10-K
4.9 Forms of PNC Bank, National Association SubordinatedGlobal Bank Notes issued on or after May 22, 2015(included in Exhibit 4.7.2)
Incorporated herein by reference to Exhibit 4.21.2 of theCorporation’s 2nd Quarter 2015 Form 10-Q
4.10 Description of the Corporation's Securities Filed herewith
10.1.1 The Corporation’s Supplemental Executive RetirementPlan, as amended and restated effective January 1, 2009
Incorporated herein by reference to Exhibit 10.2 of theCorporation’s 2008 Form 10-K*
10.1.2 Amendment 2009-1 to the Corporation’s SupplementalExecutive Retirement Plan, as amended and restatedeffective January 1, 2009
Incorporated herein by reference to Exhibit 10.3 of theCorporation’s Annual Report on Form 10-K for the yearended December 31, 2009 (2009 Form 10-K)*
10.1.3 Amendment 2013-1 to the Corporation’s SupplementalExecutive Retirement Plan, as amended and restatedeffective January 1, 2009
Incorporated herein by reference to Exhibit 10.1.3 of theCorporation’s 2013 Form 10-K*
204 The PNC Financial Services Group, Inc. – 2020 Form 10-K
ExhibitNo. Description Method of Filing +
10.2.1 The Corporation’s ERISA Excess Pension Plan, as amendedand restated effective January 1, 2009
Incorporated herein by reference to Exhibit 10.4 of theCorporation’s 2008 Form 10-K*
10.2.2 Amendment 2009-1 to the Corporation’s ERISA ExcessPlan, as amended and restated effective January 1, 2009
Incorporated herein by reference to Exhibit 10.6 of theCorporation’s 2009 Form 10-K*
10.2.3 Amendment 2011-1 to the Corporation’s ERISA ExcessPension Plan, as amended and restated effective January 1,2009
Incorporated herein by reference to Exhibit 10.8 of theCorporation’s Annual Report on Form 10-K for the yearended December 31, 2011 (2011 Form 10-K)*
10.2.4 Amendment 2013-1 to the Corporation’s ERISA ExcessPension Plan, as amended and restated effective January 1,2009
Incorporated herein by reference to Exhibit 10.2.4 of theCorporation’s 2013 Form 10-K*
10.3.1 The Corporation’s Key Executive Equity Program, asamended and restated effective January 1, 2009
Incorporated herein by reference to Exhibit 10.6 of theCorporation’s 2008 Form 10-K*
10.3.2 Amendment 2009-1 to the Corporation’s Key ExecutiveEquity Program, as amended and restated as of January 1,2009
Incorporated herein by reference to Exhibit 10.9 of theCorporation’s 2009 Form 10-K*
10.4.1 The Corporation’s Supplemental Incentive Savings Plan, asamended and restated effective January 1, 2010
Incorporated herein by reference to Exhibit 10.17 of theCorporation’s 2011 Form 10-K*
10.4.2 Amendment 2013-1 to the Corporation’s SupplementalIncentive Savings Plan, as amended and restated effectiveJanuary 1, 2010
Incorporated herein by reference to Exhibit 10.4.2 of theCorporation’s 2013 Form 10-K*
10.5.1 The Corporation and Affiliates Deferred CompensationPlan, as amended and restated May 5, 2009
Incorporated herein by reference to Exhibit 10.62 of theCorporation’s Quarterly Report on Form 10-Q for thequarter ended June 30, 2009*
10.5.2 Amendment 2009-1 to the Corporation and AffiliatesDeferred Compensation Plan, as amended and restatedMay 5, 2009
Incorporated herein by reference to Exhibit 10.17 of theCorporation’s 2009 Form 10-K*
10.5.3 Amendment 2010-1 to the Corporation and AffiliatesDeferred Compensation Plan, as amended and restatedMay 5, 2009
Incorporated herein by reference to Exhibit 10.20 of theCorporation’s Annual Report on Form 10-K for the yearended December 31, 2010 (2010 Form 10-K)*
10.5.4 Amendment 2011-1 to the Corporation and AffiliatesDeferred Compensation Plan, as amended and restatedMay 5, 2009
Incorporated herein by reference to Exhibit 10.23 of theCorporation’s 2011 Form 10-K*
10.5.5 Amendment 2012-1 to the Corporation and AffiliatesDeferred Compensation Plan, as amended and restatedMay 5, 2009
Incorporated herein by reference to Exhibit 10.24 of theCorporation’s Annual Report on Form 10-K for the yearended December 31, 2012 (2012 Form 10-K)*
10.5.6 Amendment 2013-1 to the Corporation and AffiliatesDeferred Compensation Plan, as amended and restatedMay 5, 2009
Incorporated herein by reference to Exhibit 10.5.6 of theCorporation’s 2013 Form 10-K*
10.6 The Corporation and Affiliates Deferred Compensation andIncentive Plan, as amended and restated effective January 1,2020
Incorporated herein by reference to Exhibit 10.6.3 of theCorporation’s Annual Report on Form 10-K for the yearended December 31, 2019*
10.7 The PNC Financial Services Group, Inc. 2016 IncentiveAward Plan
Incorporated herein by reference to Exhibit 99.1 of theCorporation’s Form S-8 (File No. 333-210995) filedApril 29, 2016*
10.8.1 The Corporation’s 2006 Incentive Award Plan, as amendedand restated effective as of March 11, 2011
Incorporated herein by reference to Exhibit 10.70 of theCorporation’s Quarterly Report on Form 1O-Q for thequarter ended March 31, 2011 (1st Quarter 2011 Form 10-Q)*
10.8.2 Addendum to the Corporation’s 2006 Incentive Award Plan,effective as of January 26, 2012
Incorporated herein by reference to Exhibit 10.28 of theCorporation’s 2011 Form 10-K*
The PNC Financial Services Group, Inc. – 2020 Form 10-K 205
ExhibitNo. Description Method of Filing +
10.9 The Corporation’s Directors Deferred Compensation Plan,as amended and restated effective January 1, 2015
Incorporated herein by reference to Exhibit 10.52 of theCorporation’s Quarterly Report on Form 10-Q for thequarter ended September 30, 2014*
10.10 The Corporation’s 2016 Incentive Award Plan DirectorsDeferred Stock Unit Program effective January 1, 2017
Incorporated herein by reference to Exhibit 10.16 of theCorporation’s 2016 Form 10-K*
10.11 Trust Agreement between the Corporation, as settlor, andMatrix Trust Company, as trustee
Incorporated herein by reference to Exhibit 10.15 of theCorporation’s Annual Report on Form 10-K for the yearended December 31, 2017*
10.12 Trust Agreement between PNC Investment Corp., as settlor,and PNC Bank, National Association, as trustee
Incorporated herein by reference to Exhibit 10.34 of theCorporation’s 3rd Quarter 2005 Form 10-Q*
10.13 Certificate of Corporate Action for Grantor Trusts effectiveJanuary 1, 2012
Incorporated herein by reference to Exhibit 10.37 of theCorporation’s 2011 Form 10-K*
10.14 The Corporation’s Employee Stock Purchase Plan, asamended and restated as of January 1, 2020
Incorporated herein by reference to Exhibit 4.4 of theCorporation’s Form S-8 (File No. 333-238049) filed May 6,2020*
10.15 2011 forms of employee stock option, restricted stock,restricted share unit and performance unit agreements
Incorporated herein by reference to Exhibit 10.71 of theCorporation’s 1st Quarter 2011 Form 10-Q*
10.16 2012 forms of employee stock option, restricted stock andrestricted share unit agreements
Incorporated herein by reference to Exhibit 10.77 of theCorporation’s Quarterly Report on Form 10-Q for thequarter ended March 31, 2012 (1st Quarter 2012 Form 10-Q)*
10.17 Forms of employee stock option, restricted stock andrestricted share unit agreements with varied vesting,payment and other circumstances
Incorporated herein by reference to Exhibit 10.78 of theCorporation’s 1st Quarter 2012 Form 10-Q*
10.18 2013 forms of employee stock option and restricted shareunit agreements
Incorporated herein by reference to Exhibit 10.64 of theCorporation’s 2012 Form 10-K*
10.19 Additional 2013 forms of employee stock option,performance unit, restricted stock and restricted share unitagreements
Incorporated herein by reference to Exhibit 10.82 of theCorporation’s Quarterly Report on Form 10-Q for thequarter ended June 30, 2013*
10.20 2017 Form of Performance Restricted Share Units AwardAgreement
Incorporated herein by reference to Exhibit 10.56 of theCorporation’s Quarterly Report on Form 10-Q for thequarter ended June 30, 2017 (2nd Quarter 2017 Form 10-Q)*
10.21 2017 Form of Performance Restricted Share Units AwardAgreement - Senior Leaders Program (Section 16Executives)
Incorporated herein by reference to Exhibit 10.58 of theCorporation’s 2nd Quarter 2017 Form 10-Q*
10.22 2018 Form of Performance Share Units Award Agreement Incorporated herein by reference to Exhibit 10.50 of theCorporation’s Quarterly Report on Form 10-Q for thequarter ended June 30, 2018 (2nd Quarter 2018 Form 10-Q)*
10.23 2018 Form of Restricted Share Units Award Agreement Incorporated herein by reference to Exhibit 10.51 of theCorporation’s 2nd Quarter 2018 Form 10-Q*
10.24 2018 Form of Restricted Share Units Award Agreement -Senior Leader Program
Incorporated herein by reference to Exhibit 10.52 of theCorporation’s 2nd Quarter 2018 Form 10-Q*
10.25 2019 Form of Performance Share Units Award Agreement Incorporated herein by reference to Exhibit 10.45 of theCorporation’s Quarterly Report on Form 10-Q for thequarter ended September 30, 2019 (3rd Quarter 2019 Form10-Q)*
10.26 2019 Form of Restricted Share Units Award Agreement Incorporated herein by reference to Exhibit 10.46 of theCorporation’s 3rd Quarter 2019 Form 10-Q*
10.27 2019 Form of Restricted Share Units Award Agreement -Senior Leader Program
Incorporated herein by reference to Exhibit 10.47 of theCorporation’s 3rd Quarter 2019 Form 10-Q*
206 The PNC Financial Services Group, Inc. – 2020 Form 10-K
ExhibitNo. Description Method of Filing +
10.28 2020 Form of Performance Share Units Award Agreement Incorporated herein by reference to Exhibit 10.39 of theCorporation’s Quarterly Report on Form 10-Q for thequarter ended June 30, 2020 (2nd Quarter 2020 Form 10-Q)*
10.29 2020 Form of Restricted Share Units Award Agreement Incorporated herein by reference to Exhibit 10.40 of theCorporation’s 2nd Quarter 2020 Form 10-Q*
10.30 2020 Form of Restricted Share Units Award Agreement -Senior Leader Program
Incorporated herein by reference to Exhibit 10.41 of theCorporation’s 2nd Quarter 2020 Form 10-Q*
10.31.1 Time Sharing Agreement, dated as of November 15, 2017,by and between the Corporation and William S. Demchak
Filed herewith*
10.31.2 Time Sharing Agreements Amendment and TerminationAgreement, dated as of February 27, 2020, by and betweenthe Corporation and William S. Demchak
Filed herewith*
10.32 Form of change of control employment agreements Incorporated herein by reference to Exhibit 10.51 of theCorporation’s Current Report on Form 8-K filed August 16,2016*
10.33.1 The National City Corporation 2004 DeferredCompensation Plan, as amended and restated effectiveJanuary 1, 2005
Incorporated herein by reference to Exhibit 10.35 ofNational City Corporation’s Quarterly Report on Form 10-Qfor the quarter ended March 31, 2006*
10.33.2 Amendment to The National City Corporation 2004Deferred Compensation Plan, as amended and restatedeffective January 1, 2005
Incorporated herein by reference to Exhibit 10.56 of theCorporation’s 2010 Form 10-K*
10.34.1 Distribution Agreement, dated January 16, 2014, betweenPNC Bank, National Association and the Dealers namedtherein, relating to the $25 billion Global Bank NoteProgram for the Issue of Senior and Subordinated BankNotes
Incorporated by reference to Exhibit 10.47 of theCorporation’s Annual Report on Form 10-K for the yearended December 31, 2014
10.34.2 Amendment No. 1 to Distribution Agreement, datedMay 22, 2015, between PNC Bank, National Associationand the Dealers named therein, relating to the $30 billionGlobal Bank Note Program for the Issue of Senior andSubordinated Bank Notes
Incorporated herein by reference to Exhibit 10.47.2 of theCorporation’s 2nd Quarter 2015 Form 10-Q
10.34.3 Amendment No. 2 to Distribution Agreement, datedMay 27, 2016, between PNC Bank, National Associationand the Dealers named therein, relating to the $40 billionGlobal Bank Note Program for the Issue of Senior andSubordinated Bank Notes
Incorporated herein by reference to Exhibit 10.48.3 of theCorporation’s 2nd Quarter 2016 Form 10-Q
21 Schedule of Certain Subsidiaries of the Corporation Filed herewith
23.1 Consent of PricewaterhouseCoopers LLP, the Corporation’sIndependent Registered Public Accounting Firm
Filed herewith
23.2 Consent of Deloitte & Touche LLP, Independent RegisteredPublic Accounting Firm of BlackRock, Inc.
Filed herewith
24 Powers of Attorney Filed herewith
31.1 Certification of Chief Executive Officer pursuant toSection 302 of the Sarbanes-Oxley Act of 2002
Filed herewith
31.2 Certification of Chief Financial Officer pursuant toSection 302 of the Sarbanes-Oxley Act of 2002
Filed herewith
32.1 Certification of Chief Executive Officer pursuant to 18U.S.C. Section 1350
Furnished herewith
The PNC Financial Services Group, Inc. – 2020 Form 10-K 207
ExhibitNo. Description Method of Filing +
32.2 Certification of Chief Financial Officer pursuant to 18U.S.C. Section 1350
Furnished herewith
99.1 Audited consolidated financial statements of BlackRock,Inc. as of December 31, 2020 and 2019 and for each of thethree years ended December 31, 2020
Filed herewith
101.INS
Inline XBRL Instance Document Filed herewith**
101.SCH
Inline XBRL Taxonomy Extension Schema Document Filed herewith
101.CAL
Inline XBRL Taxonomy Extension Calculation LinkbaseDocument
Filed herewith
101.LAB
Inline XBRL Taxonomy Extension Label LinkbaseDocument
Filed herewith
101.PRE
Inline XBRL Taxonomy Extension Presentation LinkbaseDocument
Filed herewith
101.DEF
Inline XBRL Taxonomy Extension Definition LinkbaseDocument
Filed herewith
104 Cover Page Interactive Data File (formatted as inline XBRLand contained in Exhibit 101)
+ Incorporated document references to filings by the Corporation are to SEC File No. 001-09718, and to filings byNational City Corporation are to SEC File No. 001-10074.
* Denotes management contract or compensatory plan.** The instance document does not appear in the interactive data file because its XBRL tags are embedded within the
inline XBRL.
You can obtain copies of these Exhibits electronically at the SEC’s website at www.sec.gov. The Exhibits are also available as part ofthis Form 10-K on PNC’s corporate website at www.pnc.com/secfilings. Shareholders and bondholders may also obtain copies ofExhibits, without charge, by contacting Shareholder Relations at 800-843-2206 or via e-mail at [email protected]. TheInteractive Data File (XBRL) exhibit is only available electronically.
ITEM 16 – FORM 10-K SUMMARYNone.
208 The PNC Financial Services Group, Inc. – 2020 Form 10-K

SIGNATURESPursuant to the requirements of Section 13 or 15(d) of the Securities Exchange Act of 1934, the registrant has duly caused this reportto be signed on its behalf by the undersigned, thereunto duly authorized.
The PNC Financial Services Group, Inc.(Registrant)
By: /s/ Robert Q. ReillyRobert Q. ReillyExecutive Vice President and Chief Financial OfficerFebruary 26, 2021
Pursuant to the requirements of the Securities Exchange Act of 1934, this report has been signed below by the following persons onbehalf of The PNC Financial Services Group, Inc. and in the capacities indicated on February 26, 2021.
Signature Capacities
/s/ William S. Demchak Chairman, President, Chief Executive Officer and Director
William S. Demchak (Principal Executive Officer)
/s/ Robert Q. Reilly Executive Vice President and Chief Financial OfficerRobert Q. Reilly (Principal Financial Officer)
/s/ Gregory H. Kozich Senior Vice President and ControllerGregory H. Kozich (Principal Accounting Officer)
* Joseph Alvarado; Charles E. Bunch; Debra A. Cafaro;Marjorie Rodgers Cheshire; David Cohen; Andrew T. Feldstein;Richard J. Harshman; Daniel R. Hesse; Linda R. Medler, MartinPfinsgraff; Toni Townes-Whitley; Michael J. Ward
Directors
*By: /s/ Alicia PowellAlicia Powell, Attorney-in-Fact,pursuant to Powers of Attorney filed herewith
The PNC Financial Services Group, Inc. – 2020 Form 10-K 209
EXHIBIT 31.1
In accordance with Exchange Act Rules 13a-14(f) and 15d-14(f), this certification does not relate to Interactive Data Files as definedin Rule 11 of Regulation S-T.
CERTIFICATION OF CHIEF EXECUTIVE OFFICER
I, William S. Demchak, certify that:
1. I have reviewed this Annual Report on Form 10-K for the year ended December 31, 2020 of The PNC Financial ServicesGroup, Inc.;
2. Based on my knowledge, this report does not contain any untrue statement of a material fact or omit to state a material factnecessary to make the statements made, in light of the circumstances under which such statements were made, not misleadingwith respect to the period covered by this report;
3. Based on my knowledge, the financial statements, and other financial information included in this report, fairly present in allmaterial respects the financial condition, results of operations and cash flows of the registrant as of, and for, the periodspresented in this report;
4. The registrant’s other certifying officer and I are responsible for establishing and maintaining disclosure controls and procedures(as defined in Exchange Act Rules 13a-15(e) and 15d-15(e)) and internal control over financial reporting (as defined inExchange Act Rules 13a-15(f) and 15d-15(f)) for the registrant and have:
a) Designed such disclosure controls and procedures, or caused such disclosure controls and procedures to be designed underour supervision, to ensure that material information relating to the registrant, including its consolidated subsidiaries, ismade known to us by others within those entities, particularly during the period in which this report is being prepared;
b) Designed such internal control over financial reporting, or caused such internal control over financial reporting to bedesigned under our supervision, to provide reasonable assurance regarding the reliability of financial reporting and thepreparation of financial statements for external purposes in accordance with generally accepted accounting principles;
c) Evaluated the effectiveness of the registrant’s disclosure controls and procedures and presented in this report ourconclusions about the effectiveness of the disclosure controls and procedures, as of the end of the period covered by thisreport based on such evaluation; and
d) Disclosed in this report any change in the registrant’s internal control over financial reporting that occurred during theregistrant’s most recent fiscal quarter (the registrant’s fourth fiscal quarter in the case of an annual report) that hasmaterially affected, or is reasonably likely to materially affect, the registrant’s internal control over financial reporting;and
5. The registrant’s other certifying officer and I have disclosed, based on our most recent evaluation of internal control overfinancial reporting, to the registrant’s auditors and the audit committee of the registrant’s board of directors (or personsperforming the equivalent functions):
a) All significant deficiencies and material weaknesses in the design or operation of internal control over financial reportingwhich are reasonably likely to adversely affect the registrant’s ability to record, process, summarize and report financialinformation; and
b) Any fraud, whether or not material, that involves management or other employees who have a significant role in theregistrant’s internal control over financial reporting.
Date: February 26, 2021
/s/ William S. DemchakWilliam S. DemchakChairman, President and Chief Executive Officer
EXHIBIT 31.2
In accordance with Exchange Act Rules 13a-14(f) and 15d-14(f), this certification does not relate to Interactive Data Files as definedin Rule 11 of Regulation S-T.
CERTIFICATION OF CHIEF FINANCIAL OFFICER
I, Robert Q. Reilly, certify that:
1. I have reviewed this Annual Report on Form 10-K for the year ended December 31, 2020 of The PNC Financial ServicesGroup, Inc.;
2. Based on my knowledge, this report does not contain any untrue statement of a material fact or omit to state a material factnecessary to make the statements made, in light of the circumstances under which such statements were made, not misleadingwith respect to the period covered by this report;
3. Based on my knowledge, the financial statements, and other financial information included in this report, fairly present in allmaterial respects the financial condition, results of operations and cash flows of the registrant as of, and for, the periodspresented in this report;
4. The registrant’s other certifying officer and I are responsible for establishing and maintaining disclosure controls and procedures(as defined in Exchange Act Rules 13a-15(e) and 15d-15(e)) and internal control over financial reporting (as defined inExchange Act Rules 13a-15(f) and 15d-15(f)) for the registrant and have:
a) Designed such disclosure controls and procedures, or caused such disclosure controls and procedures to be designed underour supervision, to ensure that material information relating to the registrant, including its consolidated subsidiaries, ismade known to us by others within those entities, particularly during the period in which this report is being prepared;
b) Designed such internal control over financial reporting, or caused such internal control over financial reporting to bedesigned under our supervision, to provide reasonable assurance regarding the reliability of financial reporting and thepreparation of financial statements for external purposes in accordance with generally accepted accounting principles;
c) Evaluated the effectiveness of the registrant’s disclosure controls and procedures and presented in this report ourconclusions about the effectiveness of the disclosure controls and procedures, as of the end of the period covered by thisreport based on such evaluation; and
d) Disclosed in this report any change in the registrant’s internal control over financial reporting that occurred during theregistrant’s most recent fiscal quarter (the registrant’s fourth fiscal quarter in the case of an annual report) that hasmaterially affected, or is reasonably likely to materially affect, the registrant’s internal control over financial reporting;and
5. The registrant’s other certifying officer and I have disclosed, based on our most recent evaluation of internal control overfinancial reporting, to the registrant’s auditors and the audit committee of the registrant’s board of directors (or personsperforming the equivalent functions):
a) All significant deficiencies and material weaknesses in the design or operation of internal control over financial reportingwhich are reasonably likely to adversely affect the registrant’s ability to record, process, summarize and report financialinformation; and
b) Any fraud, whether or not material, that involves management or other employees who have a significant role in theregistrant’s internal control over financial reporting.
Date: February 26, 2021
/s/ Robert Q. ReillyRobert Q. ReillyExecutive Vice President and Chief Financial Officer
EXHIBIT 32.1
In accordance with Exchange Act Rules 13a-14(f) and 15d-14(f), this certification does not relate to Interactive Data Files as definedin Rule 11 of Regulation S-T.
CERTIFICATION BY CHIEF EXECUTIVE OFFICERPURSUANT TO 18 U.S.C. SECTION 1350,
AS ADOPTED PURSUANT TOSECTION 906 OF THE SARBANES-OXLEY ACT OF 2002
In connection with the Annual Report on Form 10-K for the year ended December 31, 2020 of The PNC Financial Services Group,Inc. (Corporation) as filed with the Securities and Exchange Commission on the date hereof (Report), I, William S. Demchak,Chairman, President and Chief Executive Officer of the Corporation, hereby certify, pursuant to 18 U.S.C. Section 1350, as adoptedpursuant to Section 906 of the Sarbanes-Oxley Act of 2002, to the best of my knowledge, that:
(1) The Report fully complies with the requirements of Section 13(a) of the Securities Exchange Act of 1934; and
(2) The information contained in the Report fairly presents, in all material respects, the financial condition and results ofoperations of the Corporation for the dates and periods covered by the Report.
This certificate is being made for the exclusive purpose of compliance by the Chief Executive Officer of the Corporation with therequirements of Section 906 of the Sarbanes-Oxley Act of 2002, and may not be used by any person or for any reason other than asspecifically required by law.
/s/ William S. DemchakWilliam S. DemchakChairman, President and Chief Executive Officer
February 26, 2021
EXHIBIT 32.2
In accordance with Exchange Act Rules 13a-14(f) and 15d-14(f), this certification does not relate to Interactive Data Files as definedin Rule 11 of Regulation S-T.
CERTIFICATION BY CHIEF FINANCIAL OFFICERPURSUANT TO 18 U.S.C. SECTION 1350,
AS ADOPTED PURSUANT TOSECTION 906 OF THE SARBANES-OXLEY ACT OF 2002
In connection with the Annual Report on Form 10-K for the year ended December 31, 2020 of The PNC Financial Services Group,Inc. (Corporation) as filed with the Securities and Exchange Commission on the date hereof (Report), I, Robert Q. Reilly, ExecutiveVice President and Chief Financial Officer of the Corporation, hereby certify, pursuant to 18 U.S.C. Section 1350, as adopted pursuantto Section 906 of the Sarbanes-Oxley Act of 2002, to the best of my knowledge, that:
(1) The Report fully complies with the requirements of Section 13(a) of the Securities Exchange Act of 1934; and
(2) The information contained in the Report fairly presents, in all material respects, the financial condition and results ofoperations of the Corporation for the dates and periods covered by the Report.
This certificate is being made for the exclusive purpose of compliance by the Chief Financial Officer of the Corporation with therequirements of Section 906 of the Sarbanes-Oxley Act of 2002, and may not be used by any person or for any reason other than asspecifically required by law.
/s/ Robert Q. ReillyRobert Q. ReillyExecutive Vice President and Chief Financial Officer
February 26, 2021
CORPORATE INFORMATION The PNC Financial Services Group, Inc.
The PNC Financial Services Group, Inc. is one of the largest diversified financial services institutions in the United States. PNC has employees in more than 40 states across the country; a retail branch network located primarily in markets across the Mid-Atlantic, Midwest and Southeast; and strategic international offices in four countries outside the U.S. The bank is organized around its customers and communities through a Regional President model that enables the building of strong relationships and the local delivery of retail and business banking, including a full range of lending products; specialized services for corporations and government entities in the areas of corporate banking, real estate finance and asset-based lending; and wealth management and asset management.
Corporate HeadquartersThe PNC Financial Services Group, Inc. The Tower at PNC Plaza 300 Fifth Avenue Pittsburgh, PA 15222-2401
Stock Listing The common stock of The PNC Financial Services Group, Inc. is listed on the New York Stock Exchange under the symbol PNC.
Directors Shareholders and other interested parties who wish to communicate with the Board, any director (including the Presiding Director), the non-management or independent directors as a group, or any Board committee may send an email to [email protected] or a letter to the following address:
Board of Directors c/o Corporate Secretary The PNC Financial Services Group, Inc.300 Fifth AvenuePittsburgh, PA 15222-2401
Stock Transfer Agent and Registrar Computershare 462 South 4th Street, Suite 1600 Louisville, KY 40202 800-982-7652 Hearing impaired: 800-952-9245 www.computershare.com/pnc
Shareholder Services The PNC Financial Services Group, Inc. Dividend Reinvestment and Stock Purchase Plan enables registered holders of common stock to conveniently reinvest dividends and purchase additional common shares. Obtain a prospectus and enroll at www.computershare.com/pnc or contact Computershare at 800-982-7652. Direct deposit of dividends, online account access, sale of shares, and other services are available through Computershare.
Investor RelationsPNC financial news, SEC filings, stock and dividend information and other items that may be of interest to PNC shareholders can be found on PNC’s Investor Relations website at www.pnc.com/investorrelations. Inquires may be directed to:
[email protected] 800-843-2206
Media RelationsNews releases are available on the Media Relations website at pnc.mediaroom.com. Inquiries may be directed to:
[email protected] 412-762-4550
Customer InformationFor additional information about PNC products and services, visit www.pnc.com or call 1-888-PNC-BANK. Additional contact information for specific services is available at www.pnc.com/customerservice.
Independent AuditorPricewaterhouseCoopers LLP serves as PNC’s independent auditor.
7227_CVR_Singles_C1.indd 37227_CVR_Singles_C1.indd 3 3/1/21 9:41 AM3/1/21 9:41 AM

THE PNC FINANCIAL SERVICES GROUP
7227_CVR_Singles_C1.indd 47227_CVR_Singles_C1.indd 4 3/1/21 9:42 AM3/1/21 9:42 AM