Embed Size (px)
Citation preview

2020 Data Retrospective | 1
2020 Texas Election Data Analysis By Hudson Cavanagh (email [email protected] or [email protected] for more information)
Executive Summary 2
How Do We Know What Happened? 3
What Happened? 5 What went well 5 What went poorly 6
Turnout 7 Republicans had Higher Turnout 7 Why did Republicans Win Turnout? 9 In-Person Canvassing 10 Canvassing Targets 12 Limitations of Phone Numbers 12 Conclusions 13
How did turnout look across Demographics? 14 These groups aren’t monolithic 14 Black Turnout 16 Latino Turnout 17
Rio Grande Valley 18 Latino Support Conclusions 21
Rural Texas 22
Voter Registration 22 There are more Democrats to Register than Republicans 25
Our Goal: Winning Sustainably 26 One possible path to Blue 26
Summary of Takeaways 27
Acknowledgements 28
Paid for by the Texas Democratic Party. Not authorized by any candidate or candidate’s committee.

2020 Data Retrospective | 2
Executive Summary We were beaten in the turnout battle across the state. Despite record turnout, our collective Get Out The Vote (“GOTV”) turnout operation did not activate Democratic voters to the same extent Republicans were able to activate their base. The pandemic prevented us from getting the most out of our most powerful competitive advantage: our volunteers. We struggled to reach voters for whom we did not have phone numbers, who were disproportionately young, rural and folks of color. Our analysis shows that Latino voters, despite some worrying trends, did not abandon Democrats. Latino Republicans turned out at a higher rate than Latino Democrats. Although the Rio Grande Valley supported President Trump more than prior cycles, this pattern did not apply to the majority of Latino voters in Texas. In any case, we need to improve how we connect with Latino Texans, inside and outside the Rio Grande Valley. We need to massively expand our voter registration ambitions. From 2018 to 2020, we lost ground in terms of voter registration, losing about 26,000 net votes. However, there are more than enough potential registrants to flip the state if we invest in and execute effective programs at scale. If we can respond to these challenges, our 2020 margin quickly becomes surmountable. The goal is not to win one individual election. With sufficient investment and ambition, Texas can be a reliably Democratic state in the next decade.
Paid for by the Texas Democratic Party. Not authorized by any candidate or candidate’s committee.

2020 Data Retrospective | 3
How Do We Know What Happened? Traditional horse race polling was actively misleading. Polling errors were substantial this cycle, but what was most concerning was that polls consistently overestimated Democratic support.
Polling is not the only way of tracking partisanship. The TDP developed a partisanship model to predict which parry Texas voters are likely to support. The model aggregates everything we know about a voter and about the rest of the electorate to create a probability a given voter supports Democrats. The model uses field data generated by campaigns, county parties and other organizations rather than poll data. This means it is not affected by systemic polling errors. The model performed very well compared to other models in this election. These figures are generated by supplying the full set of voters from 2020, and seeing how accurate modeling predictions were, relative to what actually happened.
Proportion Scores Missing Projection Error
Civis Projected Vote Share 2.93% 1.92%
TargetSmart Projected Vote Share
1.21% 7.57%
DNC Projected Vote Share 0.00% 2.98%
Biden for President Projected Vote Share
0.04% 0.70%
Texas Democratic Party Projected Vote Share
0.00% 1.36%
Paid for by the Texas Democratic Party. Not authorized by any candidate or candidate’s committee.

2020 Data Retrospective | 4
Both our model and the Biden for President model performed very well. Whereas the Biden model attempted to predict Biden voters, ours focused on partisanship; we believe this allowed their model to predict presidential vote share slightly better due to split-ticket Biden voters. Our predictions were largely accurate. Errors were in small, rural, predominantly Latino counties. These errors also reflect the increase in support for President Trump in these areas. Because our model is based on field data, we need to contact more voters in the Rio Grande Valley to improve our predictions in future cycles.
Paid for by the Texas Democratic Party. Not authorized by any candidate or candidate’s committee.

2020 Data Retrospective | 5
Based on how well our model validated, we feel comfortable evaluating election results based on what it tells us about the people who voted. What Happened? What went well We have a lot to be proud of this cycle. Biden came the closest to flipping Texas in 25 years
● Kerry lost Texas by 23% ● Obama lost by 12% and 16% ● Hillary lost by 9% ● Biden lost by 5.5%
We are the state with the second most amount of growth in Democratic vote share since 2012 (second only to Utah). We increased total Democratic votes at the top of the ticket by 1.3 million, a 34% increase in the number of Democratic voters since 2016. We came within ~23,000 votes of flipping the Texas House . We did well compared to the national performance. Many states lost ground down-ballot, but we held our ground. However, we fell short of our ambitions to flip the State House and turn Texas blue.
Paid for by the Texas Democratic Party. Not authorized by any candidate or candidate’s committee.

2020 Data Retrospective | 6
What went poorly Biden lost Texas by 631,221 votes. This is a 5.58% margin in terms of two-way vote share. We split this margin into four categories.
Baseline Electorate Disadvantage measures the number of expected voters for each party after factoring in turnout likelihood. In other words, if no one did any campaigning, this is the margin by which Republicans would be expected to win the state. This is approximately 373k votes, or 59.1% of the total. This is calculated by comparing modelled partisanship and projected turnout likelihood of all voters in the state. Turnout Overperformance measures the extent to which voters supporting a given party turned out at higher rates than those of the other party, relative to what was expected. This can reflect field work or greater than normal enthusiasm. In the 2020 cycle, supporters of both parties turned out at greater rates than was projected, but projected Republican supporters did so by more than projected Democratic supporters. Turnout overperformance netted Republicans approximately 153,000 votes, or 24.2% of the total margin. Cycle-specific persuasion effects measure how many voters changed their opinions over the course of the cycle, or who were persuaded to vote differently than they normally would. The majority of these voters were in rural, majority Latino counties. This accounted for an estimated 17,000 net votes, or 2.7% of the total. This category is exclusionary; votes are attributed to persuasion if they can’t be attributed to other causes. Late GOP Voter Registration Surge refers to the large number of new Republican voters registered late in the cycle. Despite Democrats gradually building a voter registration advantage from 2018 to mid-2020, Republican voter registration outpaced Democratic
Paid for by the Texas Democratic Party. Not authorized by any candidate or candidate’s committee.

2020 Data Retrospective | 7
registration by so much that Republicans netted roughly 88,000 votes from the final three months of voter registration, or 13.9% of the total deficit. This can be measured by observing the new registrants over the cycle who voted in 2020 and how our model projected they voted.
Turnout Republicans had Higher Turnout Democratic voters turned out at higher rates than expected almost across the board. Blue dots above the dotted line represent turnout deciles that turned out at greater rates than projected.
Paid for by the Texas Democratic Party. Not authorized by any candidate or candidate’s committee.
2020 Data Retrospective | 8
Unfortunately, Republican voters (red dots) also turned out at higher rates across the board. And in virtually every single decile, they outperformed Democratic turnout, relative to projections.
Paid for by the Texas Democratic Party. Not authorized by any candidate or candidate’s committee.

2020 Data Retrospective | 9
Here’s the same information plotted with an emphasis on the difference in turnout, relative to expectations. Each of these bars shows the difference between Republican turnout and Democratic turnout in each decile. If the bars are above the 0 line, that means Democrats are doing a better job energizing our voters than Republicans are. However, as is clear in the consistent negative trend in this chart, Republicans did better in activating their base in Texas among high propensity voters, low propensity voters and everyone in between. Republicans had a better turnout operation than we did.
There is no way that Democrats can underperform relative to Republicans in turnout and still win Texas, given current Republican advantage in the state. We estimate 51% of the voting population are Democrats, but Republicans are more likely to vote. Democrats have to run a superior ground game to overcome this. Why did Republicans Win Turnout?
Paid for by the Texas Democratic Party. Not authorized by any candidate or candidate’s committee.
2020 Data Retrospective | 10
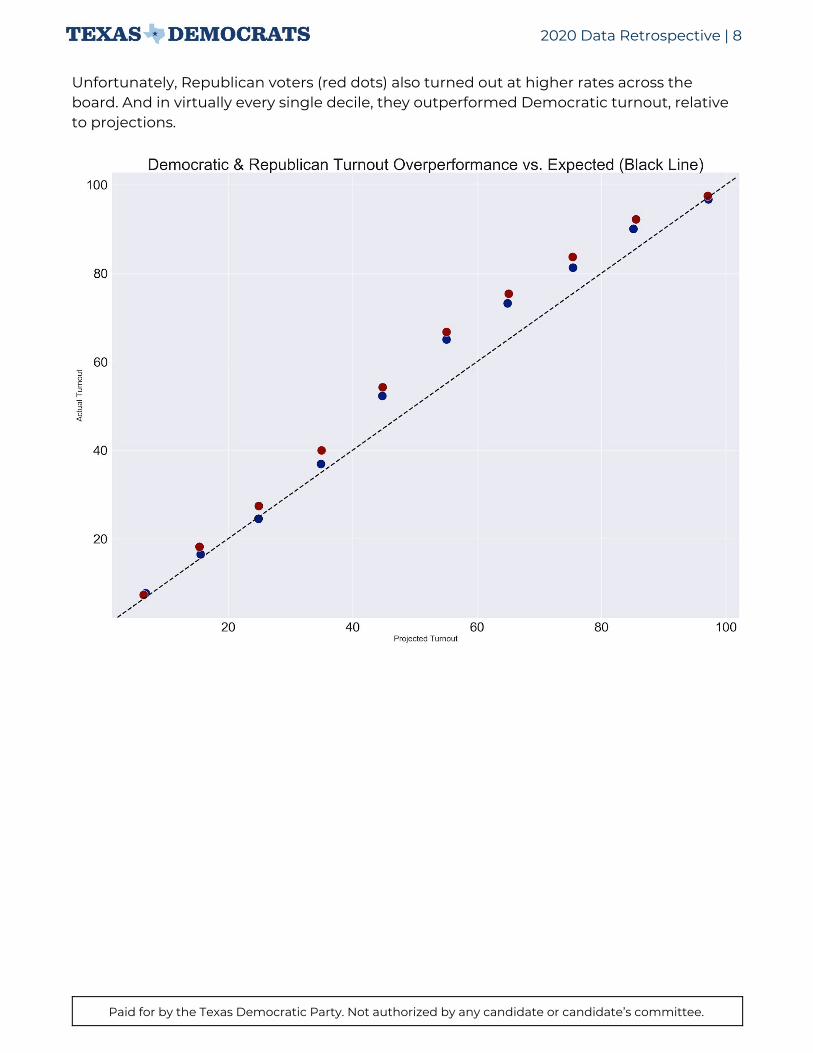
Democrats rely on direct voter contact work to stimulate turnout. This cycle, our turnout work was hampered by two factors: inability to do in-person canvassing and inefficient targeting. As we will show later, inefficient targeting is partially a symptom of our inability to do in-person canvassing, because we were not able to effectively reach large portions of our base for whom we lacked quality contact information. Phone quality data was particularly lacking among low to moderate propensity voters, making it hard to reach those who were our top strategic priority to reach. In-Person Canvassing Losing the option of in-person canvassing hurt our ground game. In-person canvassing allows us to reach hard-to-contact voters and evidence suggests yields greater lift per contact than other forms of direct voter contact. Dialers and SMS need to remain part of our tool kit, for their ability to leverage non-local volunteers and reach rural areas.
This is a graph of voter contact type by their estimated average Aggregate Turnout Lift Per Canvasser Hour. In other words, this chart combines how many voters a given person can contact per hour with how impactful a conversation through that channel is, on average. For example, dialers allow volunteers to contact many people per hour, but has less impact per successful contact than knocking on somebody’s door. This chart takes both of these
Paid for by the Texas Democratic Party. Not authorized by any candidate or candidate’s committee.
2020 Data Retrospective | 11
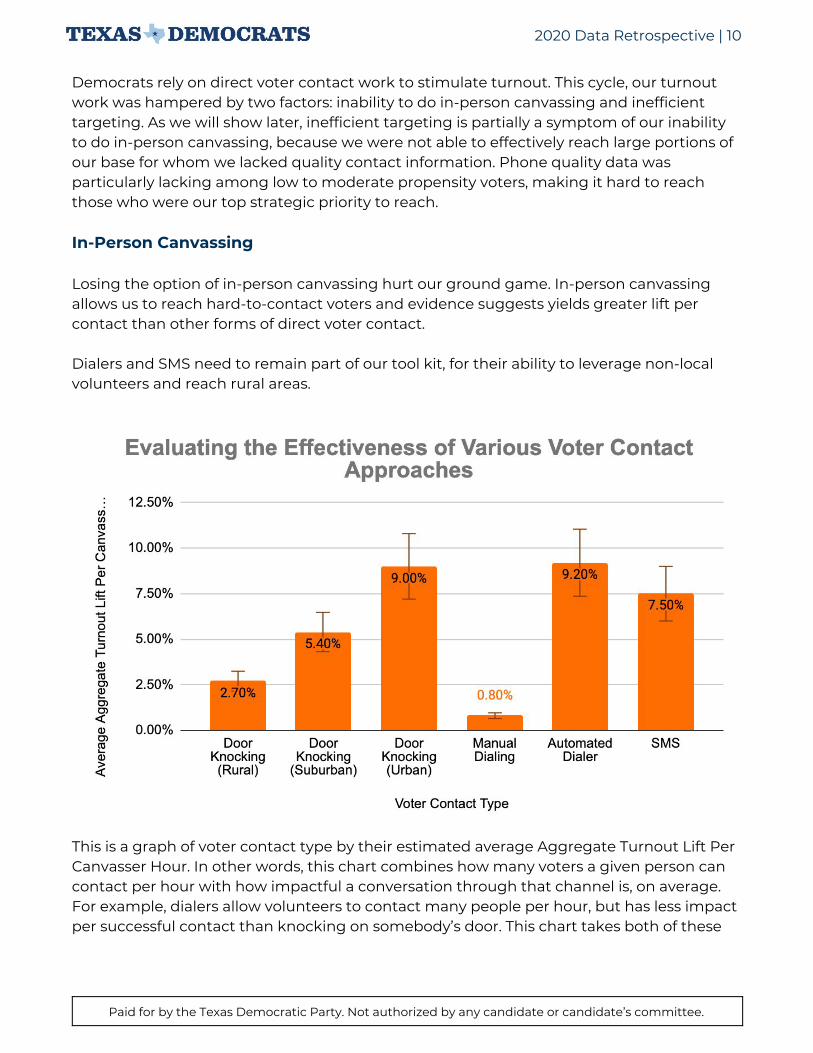
considerations, estimating how much impact a given volunteer can have, per hour, by contact type. Field work is particularly valuable when it contacts low-to-moderate propensity voters. This reinforces similar findings in other states and other cycles. We observed substantial lift in turnout rates among those we successfully contacted.
The X-axis shows groupings of individuals based on their modelled turnout likelihood. The Y-axis shows the average increase in actual turnout vs projected turnout of those contacted. Dark colors indicate more voter contact. This graph shows that contacting voters has the greatest impact when we speak to registered voters with low to moderate turnout propensity. In other words, these are people who are unlikely to vote unless we speak to them. Talking to somebody with 35% turnout likelihood is approximately five times as valuable as a person with 80% turnout likelihood. Unfortunately, statewide Democratic contact attempts were clustered around high turnout propensity voters who were likely to vote whether or not we talked to them.
Paid for by the Texas Democratic Party. Not authorized by any candidate or candidate’s committee.

2020 Data Retrospective | 12
Canvassing Targets The Texas Democratic Party provided targets to campaigns that corresponded to groups of voters that were valuable to contact. The turnout targets and persuasion targets were the highest priority groups during GOTV; however, the already reliable Democratic voters were successfully contacted at much higher rates. This persuasion target universe was not the result of modeling: this group is made up of people Democratic campaigns reached during the 2020 cycle who most recently self-identified as undecided.
In future cycles, we need to prioritize our voter contact more efficiently, away from reliable Democratic voters and more towards our Turnout Targets. Limitations of Phone Numbers Over contacting high propensity voters was not just because our targeting philosophy was not universally adopted among Democratic campaigns and partners. Reaching low propensity voters by phone is challenging due to limited or non-existant contact information for many of our highest priority turnout targets.
TDP Targets, in Priority order (left to right)
Turnout Targets
Persuasion Targets
Consistent Democratic Voters
Target Size (Millions)
4.09 0.49 3.30
Statewide Contact Rate (Last 6 Months)
15.4% 44.6% 28.0%
Targeted State House District Contact Rate (Last 6 Months)
22.6% 39.3% 35.8%
Paid for by the Texas Democratic Party. Not authorized by any candidate or candidate’s committee.

2020 Data Retrospective | 13
This histogram shows the distribution of contact attempts. On average, we attempted low propensity voters 8.3 times (orange), while we only attempted high propensity voters 4.5 times (purple). In other words, despite attempting to contact low propensity voters almost twice as much as high propensity voters, we nonetheless reached mostly high propensity folks. Conclusions We need to invest heavily in direct voter contact as much as possible, especially to newer voters or those with inconsistent voting history. As soon as it is safe, we need to begin knocking doors across the state. With the exception of volunteer recruitment and fundraising, we need to redistribute our resources away from high propensity Democrats towards lifting up the voices of those who are less likely to have their voices heard.
Paid for by the Texas Democratic Party. Not authorized by any candidate or candidate’s committee.

2020 Data Retrospective | 14
By connecting with as many voters as possible we can identify undecided voters that we can focus persuasion efforts on. The only persuasion canvassing with evidence of success was canvassing targeting self-identified undecided voters. This should inform our strategy going forward.
How did turnout look across Demographics? Latino turnout was lower, relative to expectations, than other groups (although in absolute terms, all groups voted at higher rates than projected). White, Black and Native voters experienced similar percentage growth above expected turnout. Asian American voters turned out significantly more than projected, representing a major shift in the electorate. However, the Texas electorate is disproportionately White relative to the state, so most of the unexpected voters were White. This meant that the electorate as a whole was whiter than projected.
These groups aren’t monolithic
Paid for by the Texas Democratic Party. Not authorized by any candidate or candidate’s committee.

2020 Data Retrospective | 15
When looking at movement in a particular population, it’s tempting to conclude that the group as a whole changed its mind. There are some persuasion effects in play in Texas, but most of the changes in demographic behavior can be attributed to differential turnout. Differential turnout means that as a result of an increase in turnout rates among one partisan group relative to another, a group’s partisan support appears to be trending in one direction without requiring any individual member to change their mind. In this case, voters already projected to be Republicans voted at higher rates than usual, while projected Democrats did not increase their turnout by quite as much. This effect does not require persuading a single voter for the group as a whole to appear to have changed its opinion. This phenomena is often confused with persuasion in cursory analysis, but is actually a function of relative turnout effectiveness.
Paid for by the Texas Democratic Party. Not authorized by any candidate or candidate’s committee.

2020 Data Retrospective | 16
Black Turnout Black turnout overperformed expectionations. However, Republicans were more successful in activating their base of Black voters than Democrats. Black Texans continued to support Democrats overwhelmingly; however, on the margins, Republicans did better at turning out Black Republicans than Democrats did at turning out Black Democrats. This is likely explained by limited phone data availability for Black voters and not enough field work targeting low-to-moderate propensity voters.
Paid for by the Texas Democratic Party. Not authorized by any candidate or candidate’s committee.

2020 Data Retrospective | 17
Latino Turnout Leaked Republican exit polls suggest a massive shift (+12) towards Republicans among Latino voters. Our evidence does not support this finding. Latino voters did move toward Trump in the Rio Grande Valley and some predominantly Latino portions of the Panhandle; however, many of these same voters continued to support down-ballot Democratic candidates. Latino voters outside of the valley, however, did not show the same movement towards supporting Trump. However, there was a pronounced differential turnout effect among Latino voters in Texas that hurt Democratic candidates up and down the ballot.
Many have interpreted this as “Latinos voted for Trump”, but it’s more accurate to say, “Latinos who were already Republicans turned out more than Latino Democrats.” Roughly two-thirds of Latinos continue to support Democrats, but Republican Latino voters turned out at a higher rate than Democratic Latino voters in the 2020 cycle, relative to expectations.
Paid for by the Texas Democratic Party. Not authorized by any candidate or candidate’s committee.

2020 Data Retrospective | 18
Rio Grande Valley Many heavily Latino areas, especially in the Rio Grande Valley, broke for Trump. Bad performance among Latino districts was driven by both differential turnout and persuasion However, Latinos in most of the state supported Democrats roughly as much as in 2016. Losing ground among Latino communities appears to be explained by differential turnout. Here’s how we draw this conclusion. First, here is our performance in all areas.
Paid for by the Texas Democratic Party. Not authorized by any candidate or candidate’s committee.

2020 Data Retrospective | 19
This seems to show that higher proportions of Latino voters in a county predicts lower Democratic support. However, let’s break this large trend into two groups: one with counties that are <30% Latino, and one with heavily Latino counties..
Latino proportion had no predictive effect on performance in districts with fewer than 30% Latino registrants
We lost ground at the presidential level in areas with a high proportion of Latino registrants
Paid for by the Texas Democratic Party. Not authorized by any candidate or candidate’s committee.

2020 Data Retrospective | 20
However, to better understand the dynamics within those districts with less than 30% Latino populations, we conducted precinct-level analysis within Harris, Dallas, Tarrant, and Fort Bend counties.
While these trends do show a negative trend, the magnitude of this effect, combined with our knowledge about Republican differential turnout especially among Latino voters, suggests that these trends (excluding the Rio Grande Valley) are fundamentally driven by differential turnout, not Latino abandonment of the Democratic party.
Paid for by the Texas Democratic Party. Not authorized by any candidate or candidate’s committee.

2020 Data Retrospective | 21
Latino Support Conclusions Our analysis concludes that there were multiple, simultaneous trends within the Latino portion of the electorate. First, in heavily Latino, rural counties we saw significant increases in support for President Trump. This trend makes up most of the cycle-specific persuasion effect alluded to earlier in this analysis (the purple portion of the pie chart). We need to develop better methods of reaching these folks and building relationships in these communities. However, Latino voters in Texas are not a monolith and this trend should not be confused with voting patterns of Latino voters in other parts of the state. Second, among the majority of Latino voters in Texas there was limited evidence of any persuasion effect, but strong evidence of differential turnout among Latino voters, in favor of Republicans. Latino voters continue to strongly support Democrats, but we have work to do to empower Latino voices at the ballot box.
Paid for by the Texas Democratic Party. Not authorized by any candidate or candidate’s committee.
2020 Data Retrospective | 22
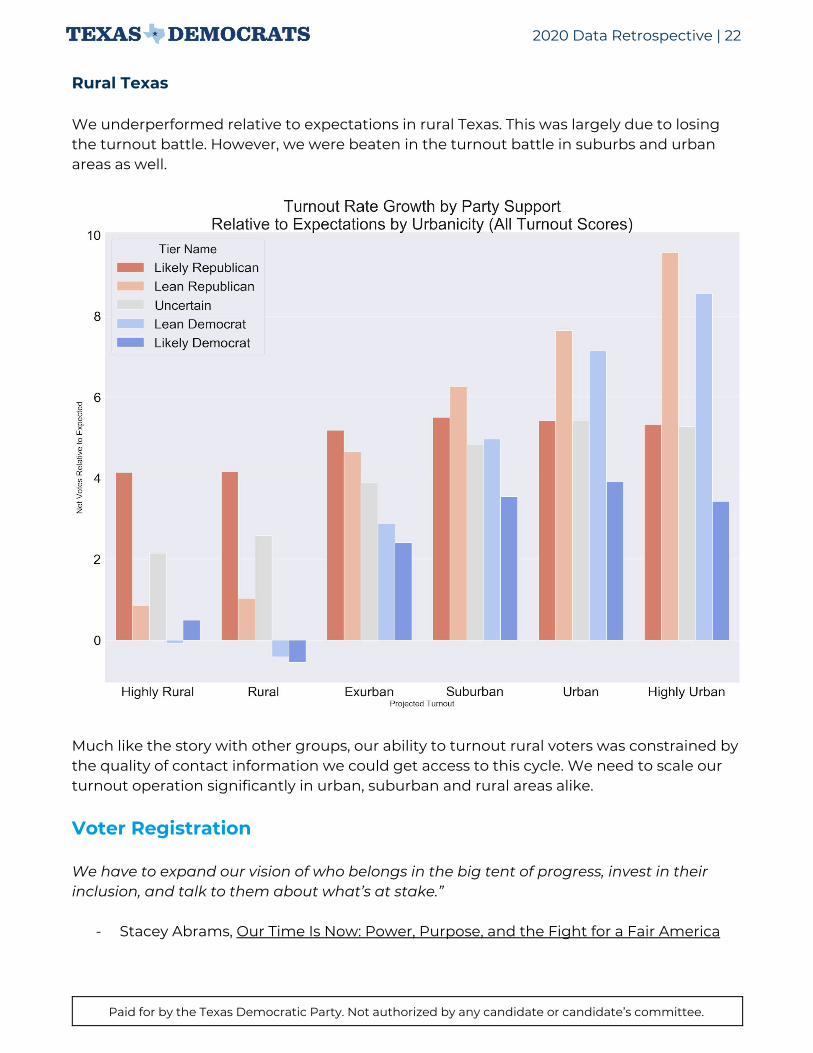
Rural Texas We underperformed relative to expectations in rural Texas. This was largely due to losing the turnout battle. However, we were beaten in the turnout battle in suburbs and urban areas as well.
Much like the story with other groups, our ability to turnout rural voters was constrained by the quality of contact information we could get access to this cycle. We need to scale our turnout operation significantly in urban, suburban and rural areas alike.
Voter Registration We have to expand our vision of who belongs in the big tent of progress, invest in their inclusion, and talk to them about what’s at stake.”
- Stacey Abrams, Our Time Is Now: Power, Purpose, and the Fight for a Fair America
Paid for by the Texas Democratic Party. Not authorized by any candidate or candidate’s committee.

2020 Data Retrospective | 23
Demographics are not destiny; they are an opportunity. Approximately 1.49 million Democrats registered to vote since November 2018. We cost-effectively registered Democrats throughout the cycle, but were not able to match a late Republican spending surge The following plot shows the gradual voter registration advantage built up by Democrats over the course of the cycle. Including the late surge by Republicans, approximately 150,000 more projected Democrats registered to vote during the 2020 cycle than Republicans.
Paid for by the Texas Democratic Party. Not authorized by any candidate or candidate’s committee.

2020 Data Retrospective | 24
Now, here’s the same graph, but showing the number of registered voters who actually voted in 2020, grouped by when they registered to vote.
One can see the accumulation of a Democratic advantage over the cycle which is then overwhelmed in the final months before the election by a rush of Republican registration. Despite more Democrats registering to vote than Republicans from 2018 to mid-2020, the late Republicans registration push accounted for roughly 87,900 net Republican votes, just from the final three months of voter registration. Due to higher turnout rates among recently registered Republicans than recently registered Democrats, Democrats actually lost ground based on Voter Registration over the course of the cycle. Despite registering about 150,000 more Democrats than Republicans, Republicans actually earned over 26,000 net votes from Voter Registration in the 2020 cycle when counting only those who voted. We ascribe this to a few factors. First, Republicans outspent Democrats on turnout by an estimated factor of 10-20x. Despite Democratic registration efforts being significantly more cost-effective, this Republican resource advantage overwhelmed our registration efforts.
Paid for by the Texas Democratic Party. Not authorized by any candidate or candidate’s committee.

2020 Data Retrospective | 25
Second, without online voter registration, Republicans’ willingness to knock on doors and do other forms of in-person registration yielded significant results. We believe that Republicans felt threatened in Texas and therefore diverted significant national resources here, making major investments in Texas voter registration for the first time in decades. They know that we have the potential to flip the state by investing in voter registration and turnout. There are more Democrats to Register than Republicans There are more than enough unregistered Democrats to change the makeup of the Texas electorate and make Texas sustainably blue. Our internal estimates suggest that the majority of unregistered voters would support Democrats if they were able to cast a ballot. These graphs show the unregistered solidly Democratic targets among Latino, Black, young, and Asian voters in key counties.
Paid for by the Texas Democratic Party. Not authorized by any candidate or candidate’s committee.
2020 Data Retrospective | 26
In summary, Republicans massively outspent us in both voter registration and in turning out recently registered voters. Based on public reporting, we know Republicans massively outspent us in voter registration despite their efforts being less efficient from a per dollar perspective. With adequate resources, we can reverse this dynamic.
Our Goal: Winning Sustainably “Victory must begin to mean more than winning a single election. Our obligation.... is to seize the high road by changing how we campaign and to whom.”
- Stacey Abrams, Our Time Is Now: Power, Purpose, and the Fight for a Fair America To win in the next few cycles, we will have to outperform Republicans in terms of turnout. The good news is a quarter of our deficit was a result of strong Republican turnout, which we can reverse in 2022. In order to make long-term, tractable gains, our goal is to register and turn out 100,000-150,000 more Democrats than Republican registrants per cycle. One possible path to Blue In order to understand the potential to flip Texas, let us propose a few relatively conservative assumptions:
● Relatively consistent partisanship among existing Democrats and Republican ● ~100,000 net Democratic registered voters in non-presidential cycles (150,000 in
presidential cycles) ● Slight decline in Republican turnout advantage due to aging and immigration to
Texas ● Improvement in GOTV & turnout performance. However, none of our turnout
estimates are as favorable as our estimates for what happened in 2018. This chart is not a projection, but one plausible path towards Democratic progress in Texas.
Paid for by the Texas Democratic Party. Not authorized by any candidate or candidate’s committee.
2020 Data Retrospective | 27
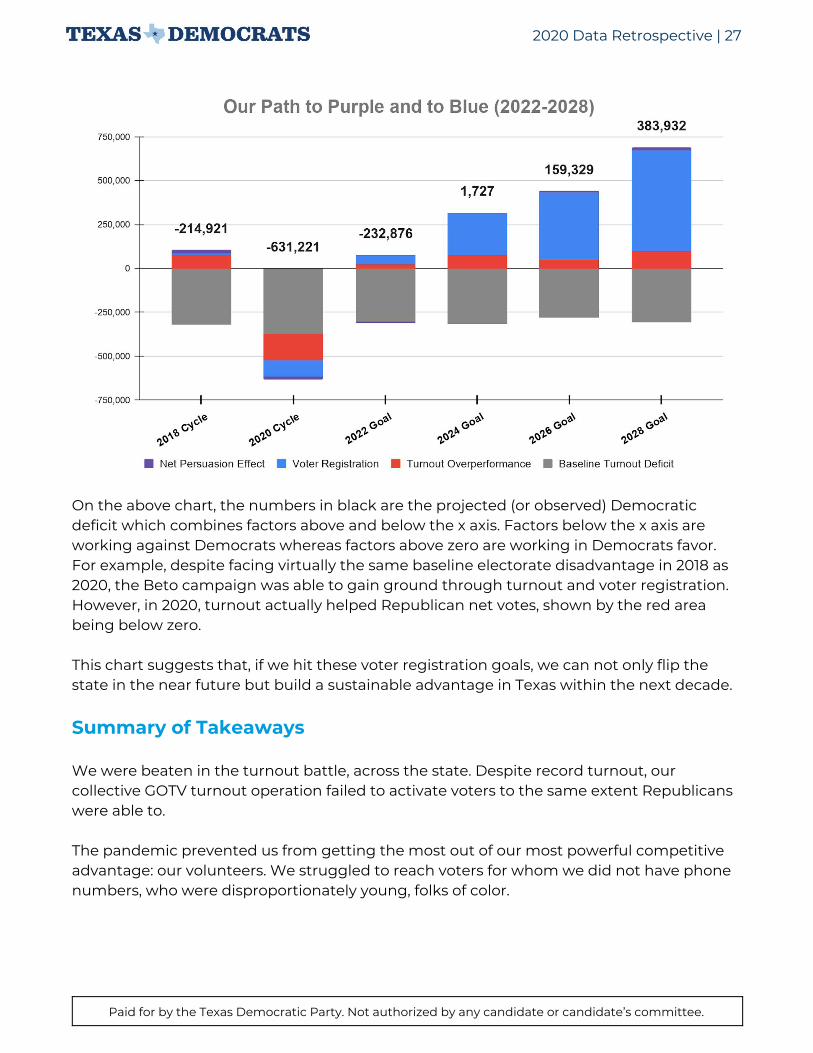
On the above chart, the numbers in black are the projected (or observed) Democratic deficit which combines factors above and below the x axis. Factors below the x axis are working against Democrats whereas factors above zero are working in Democrats favor. For example, despite facing virtually the same baseline electorate disadvantage in 2018 as 2020, the Beto campaign was able to gain ground through turnout and voter registration. However, in 2020, turnout actually helped Republican net votes, shown by the red area being below zero. This chart suggests that, if we hit these voter registration goals, we can not only flip the state in the near future but build a sustainable advantage in Texas within the next decade.
Summary of Takeaways We were beaten in the turnout battle, across the state. Despite record turnout, our collective GOTV turnout operation failed to activate voters to the same extent Republicans were able to. The pandemic prevented us from getting the most out of our most powerful competitive advantage: our volunteers. We struggled to reach voters for whom we did not have phone numbers, who were disproportionately young, folks of color.
Paid for by the Texas Democratic Party. Not authorized by any candidate or candidate’s committee.

2020 Data Retrospective | 28
Latino voters, despite some worrying trends, did not abandon Democrats. However, we need to improve how we connect with Latino Texans, inside and outside the Rio Grande Valley. We need to massively expand our voter registration programming. From 2018 to 2020, we lost ground in terms of voter registration, losing about 26,000 net votes. Crucially, in the three months before the election, we lost 88,000 net votes solely through being beaten in voter registration. However, there are more than enough potential registrants to flip the state. If we can respond to these challenges, our 2020 margin quickly becomes surmountable. Sustainable victory is possible, if we:
● Register voters and expand access to the ballot - We need to build a program that can register and turn out 100,000 - 150,000 more new Democratic registrants per cycle than Republicans.
● Build a robust turnout operation - We need to reverse Republican gains in turnout from 2020 and maximize our investment in voter registration. To get there, statewide organizations, county parties and campaigns up and down the ballot need to work together to further expand voter contact.
● Surgically target persuadable voters - Broad field work helps us find persuadable voters; we must build long-term relationships with those voters.
Acknowledgements This report was completed by Hudson Cavanagh, the Director of Data Science at the Texas Democratic Party. If you have any questions, concerns, or additional data or information you would like to share, please reach out to me at [email protected]. This report is the result of weeks of work and years of investments in data infrastructure. Thank you to Texas Democratic Party leadership and our allies who made bold investments in building the most sophisticated state party data infrastructure in the county. This project could not have been possible without the daring leadership of Manny Garcia and Cliff Walker, who made the shrewd choice to reinvent what a data team could achieve in a state party. Most importantly, they believed in Lauren Pully, our former CTO, who imagined and implemented a bold vision of how data could help flip Texas. Thank you Lauren for being the best mentor I have ever had and for defining excellence in leadership.
Paid for by the Texas Democratic Party. Not authorized by any candidate or candidate’s committee.

2020 Data Retrospective | 29
Investments in state parties benefit all campaigns in the state and allow for year-round organizing. By centralizing data investments, we can make our resources go farther, more easily iterate on our own intellectual property - such as the Texas Democratic Party Partisanship Model - and allow for better collaboration across campaigns, up and down the ticket. The person who most directly contributed to this presentation is our CTO John Elson, who pushed these ideas forward and gave incredible feedback throughout this process. Thank you to Hannah Roe Beck and Luke Warford for their insightful feedback and for visionary and compassionate leadership. Thank you to the 2020 TDP data team who were the most talented team I have ever worked with. In particular, thanks to Tom Swartz who made a number of the visuals in this document. Finally, thank you to my current teammates who gave incredible feedback, including Danni Gonyo, Doug Snyder, Rose Clouston, and Abhi Rahman and many more. Finally, thank you to the real heroes: our volunteers, our county party chairs, our campaigns, our candidates, our allies and everybody who spent their time and resources fighting to make Texas blue. Texas is the biggest battleground state.
Paid for by the Texas Democratic Party. Not authorized by any candidate or candidate’s committee.