Embed Size (px)
Citation preview
2020 PART B FFY 2018 SPP/APR INDICATOR ANALYSIS BOOKLET TABLE OF CONTENTS
Indicator 1: Graduation Rate ................................................................................................... 3 Prepared by the National Technical Assistance Center on Transition (NTACT)
Indicator 2: Dropout Rate ....................................................................................................... 10 Prepared by the National Technical Assistance Center on Transition (NTACT)
Indicator 3: Assessment ......................................................................................................... 17 Prepared by the National Center on Educational Outcomes (NCEO)
Indicator 4: Rates of Suspension and Expulsion ................................................................. 43 Prepared by the IDEA Data Center (IDC)
Indicator 5: Least Restrictive Environment (LRE) ................................................................ 57 Prepared by the National Center for Systemic Improvement (NCSI)
Indicator 6: Preschool LRE ..................................................................................................... 65 Prepared by the Early Childhood Technical Assistance Center (ECTA)
Indicator 7: Preschool Outcomes .......................................................................................... 69
Prepared by the Early Childhood Technical Assistance Center (ECTA)
Indicator 8: Parent Involvement ............................................................................................. 80 Prepared by the Center for Parent Information and Resources @SPAN and Regional Parent
Technical Assistance Centers (PTACs)
Indicators 9 & 10: Disproportionate Representation Due to Inappropriate Identification. 88 Prepared by the IDEA Data Center (IDC)
Indicator 11: Timely Initial Evaluations ................................................................................. 96
Prepared by the National Center for Systemic Improvement (NCSI)
Indicator 12: Early Childhood Transition ............................................................................ 101
Prepared by the Early Childhood Technical Assistance Center (ECTA)
Indicator 13: Secondary Transition ..................................................................................... 104
Prepared by the National Technical Assistance Center on Transition (NTACT)
Indicator 14: Post-School Outcomes ................................................................................... 111 Prepared by the National Technical Assistance Center on Transition (NTACT)
Indicators 15 & 16: Dispute Resolution ............................................................................... 122 Prepared by the Center for Appropriate Dispute Resolution in Special Education (CADRE)
Indicator 17: State Systemic Improvement Plan ................................................................ 128
Prepared by the National Center for Systemic Improvement (NCSI) with support from the IDEA
Data Center (IDC) and the National Technical Assistance Center on Transition (NTACT).
Indicator B1: Graduation Rate Completed by the National Technical Assistance Center on Transition (NTACT).
INTRODUCTION
The National Technical Assistance Center on Transition (NTACT) was assigned the task of analyzing and summarizing the data for Part B Indicator 1, Graduation Rate, from the FFY 2018 Annual Performance Reports (APRs) and State Performance Plans (SPPs), which were submitted by states to OSEP in the spring of 2020. The text of the indicator is as follows:
Percent of youth with Individualized Education Programs (IEPs) graduating from high school with a regular high school diploma.
This report summarizes NTACT’s findings for Indicator 1 across the 50 states, commonwealths, and territories, and the Bureau of Indian Education (BIE), for a total of 60 agencies. For the sake of convenience, in this report the term “states” is inclusive of the 50 states, the commonwealths, the territories, and the BIE.
MEASUREMENT
The Part B Measurement Table indicates that states are to use the, “Same data as used for reporting to the Department under Title I of the Elementary and Secondary Education Act (ESEA). States may report data for children with disabilities using either the four-year adjusted cohort graduation rate required under the ESEA or an extended-year adjusted cohort graduation rate under the ESEA, if the State has established one.” These data are reported in the Consolidated State Performance Report exiting data. Sampling is not permitted for this indicator, so states must report graduation information for all their students with disabilities. States were instructed to, “Describe the results of the State’s examination of the data for the year before the reporting year (e.g., for the FFY 2018 APR, use data from the 2017-2018 school year), and compare the results to the target.” States were also instructed to provide the actual numbers used in the calculation and to: “Provide a narrative that describes the conditions youth must meet in order to graduate with a regular diploma and, if different, the conditions that youth with IEPs must meet in order to graduate with a regular diploma. If there is a difference, explain.” States’ performance targets must be the same as their annual graduation rate targets under Title I of the ESEA.
Finally, states were instructed that they, “must continue to report the four-year adjusted cohort graduation rate for all students and disaggregated by student subgroups including the children with disabilities subgroup, as required under section 1111(h)(1)(C)(iii)(II) of the ESEA, on State report cards under Title I of the ESEA even if they only report an extended-year adjusted cohort graduation rate for the purpose of SPP/APR reporting.”
IMPLICATIONS OF THE GRADUATION RATE MEASUREMENT
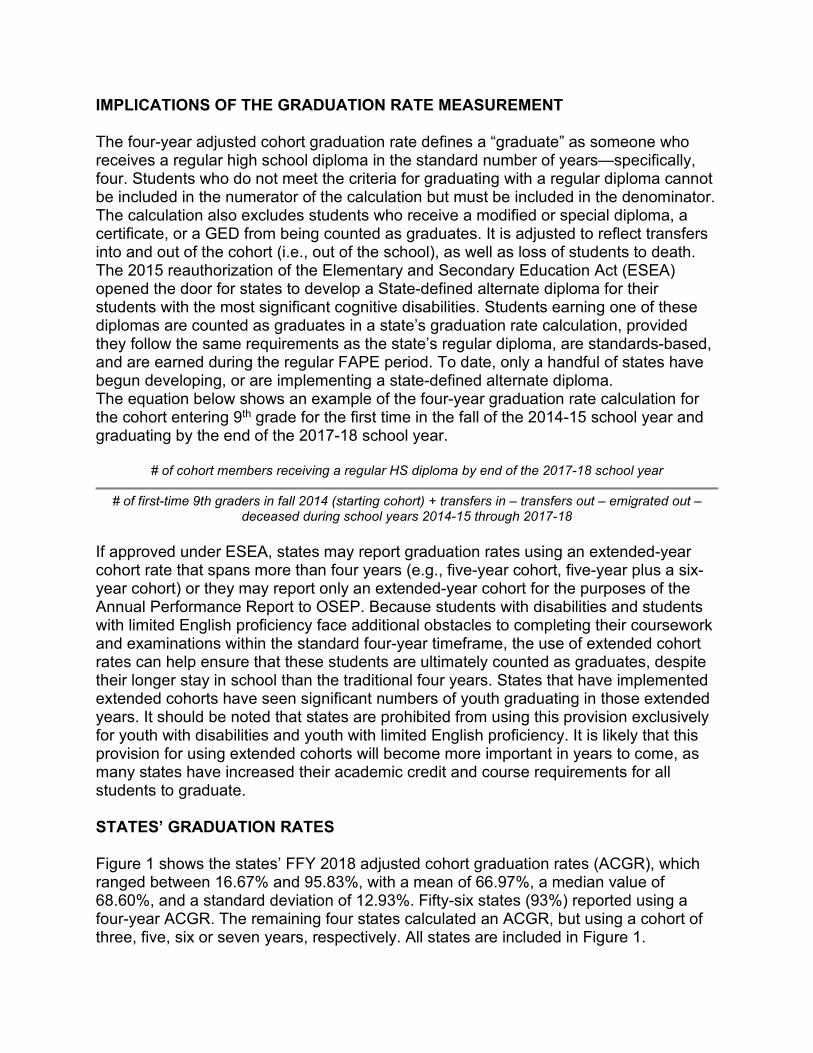
The four-year adjusted cohort graduation rate defines a “graduate” as someone who receives a regular high school diploma in the standard number of years—specifically, four. Students who do not meet the criteria for graduating with a regular diploma cannot be included in the numerator of the calculation but must be included in the denominator. The calculation also excludes students who receive a modified or special diploma, a certificate, or a GED from being counted as graduates. It is adjusted to reflect transfers into and out of the cohort (i.e., out of the school), as well as loss of students to death. The 2015 reauthorization of the Elementary and Secondary Education Act (ESEA) opened the door for states to develop a State-defined alternate diploma for their students with the most significant cognitive disabilities. Students earning one of these diplomas are counted as graduates in a state’s graduation rate calculation, provided they follow the same requirements as the state’s regular diploma, are standards-based, and are earned during the regular FAPE period. To date, only a handful of states have begun developing, or are implementing a state-defined alternate diploma. The equation below shows an example of the four-year graduation rate calculation for the cohort entering 9th grade for the first time in the fall of the 2014-15 school year and graduating by the end of the 2017-18 school year.
# of cohort members receiving a regular HS diploma by end of the 2017-18 school year
# of first-time 9th graders in fall 2014 (starting cohort) + transfers in – transfers out – emigrated out – deceased during school years 2014-15 through 2017-18
If approved under ESEA, states may report graduation rates using an extended-year cohort rate that spans more than four years (e.g., five-year cohort, five-year plus a six-year cohort) or they may report only an extended-year cohort for the purposes of the Annual Performance Report to OSEP. Because students with disabilities and students with limited English proficiency face additional obstacles to completing their coursework and examinations within the standard four-year timeframe, the use of extended cohort rates can help ensure that these students are ultimately counted as graduates, despite their longer stay in school than the traditional four years. States that have implemented extended cohorts have seen significant numbers of youth graduating in those extended years. It should be noted that states are prohibited from using this provision exclusively for youth with disabilities and youth with limited English proficiency. It is likely that this provision for using extended cohorts will become more important in years to come, as many states have increased their academic credit and course requirements for all students to graduate.
STATES’ GRADUATION RATES
Figure 1 shows the states’ FFY 2018 adjusted cohort graduation rates (ACGR), which ranged between 16.67% and 95.83%, with a mean of 66.97%, a median value of 68.60%, and a standard deviation of 12.93%. Fifty-six states (93%) reported using a four-year ACGR. The remaining four states calculated an ACGR, but using a cohort of three, five, six or seven years, respectively. All states are included in Figure 1.
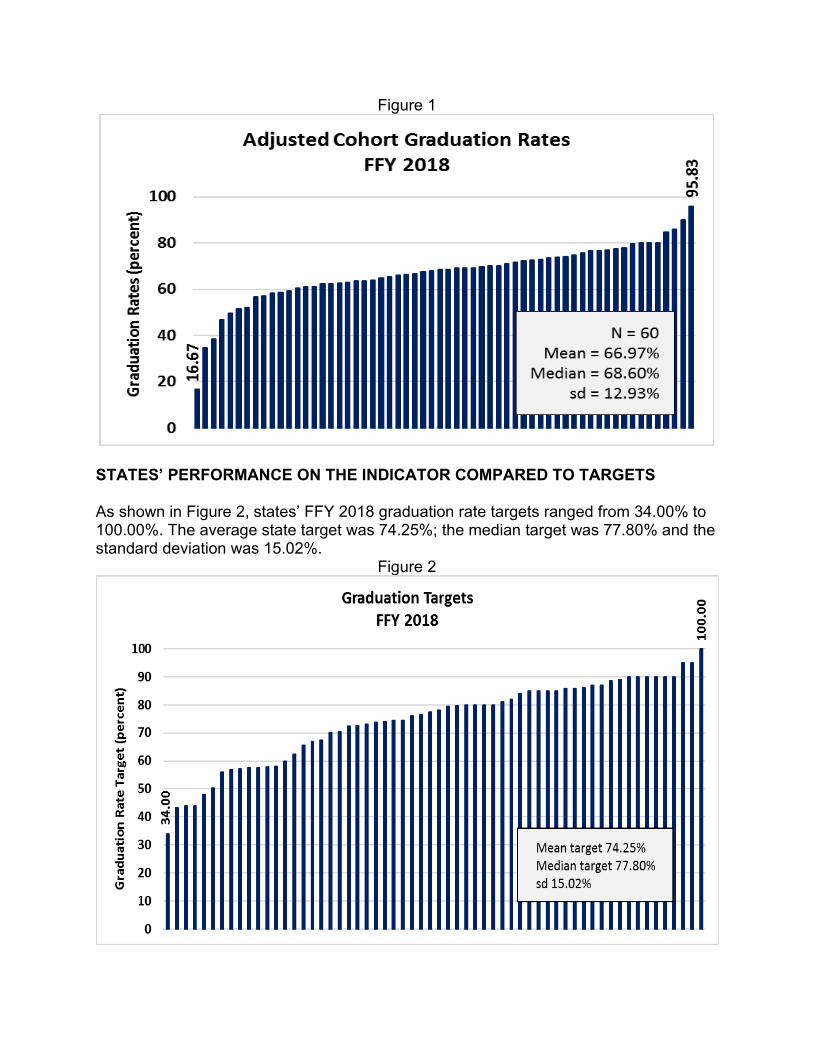
Figure 1
STATES’ PERFORMANCE ON THE INDICATOR COMPARED TO TARGETS
As shown in Figure 2, states’ FFY 2018 graduation rate targets ranged from 34.00% to 100.00%. The average state target was 74.25%; the median target was 77.80% and the standard deviation was 15.02%.
Figure 2
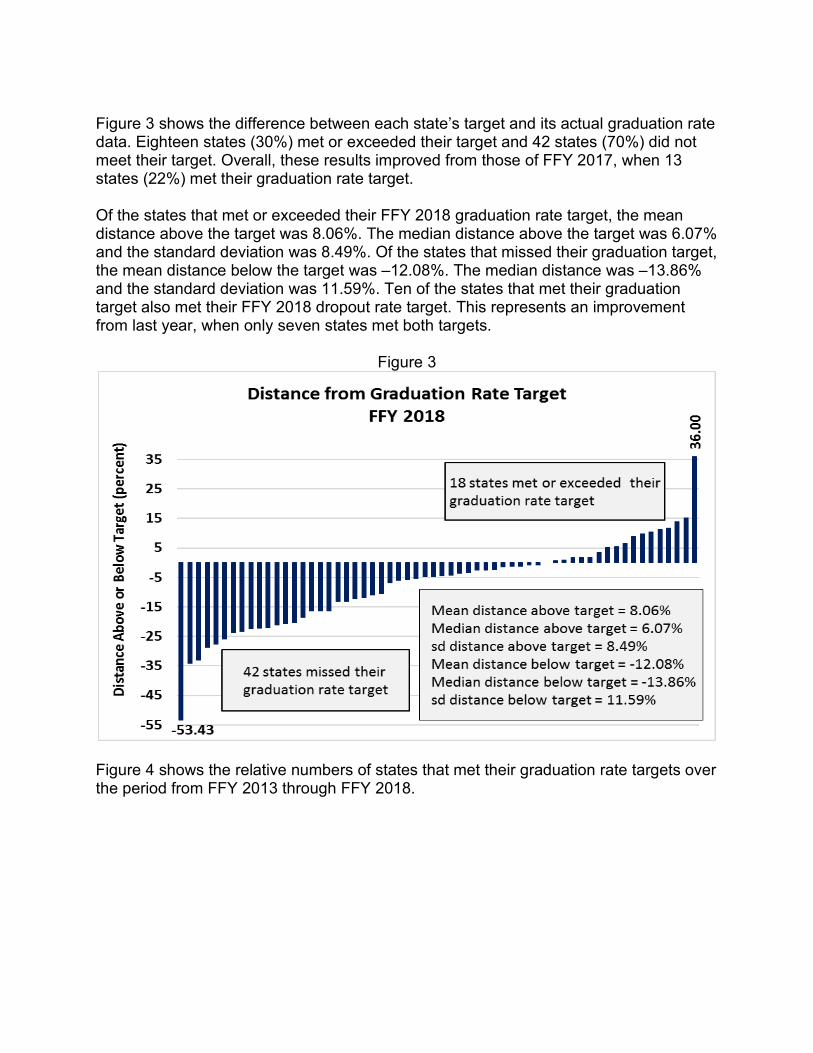
Figure 3 shows the difference between each state’s target and its actual graduation rate data. Eighteen states (30%) met or exceeded their target and 42 states (70%) did not meet their target. Overall, these results improved from those of FFY 2017, when 13 states (22%) met their graduation rate target.
Of the states that met or exceeded their FFY 2018 graduation rate target, the mean distance above the target was 8.06%. The median distance above the target was 6.07% and the standard deviation was 8.49%. Of the states that missed their graduation target, the mean distance below the target was –12.08%. The median distance was –13.86% and the standard deviation was 11.59%. Ten of the states that met their graduation target also met their FFY 2018 dropout rate target. This represents an improvement from last year, when only seven states met both targets.
Figure 3
Figure 4 shows the relative numbers of states that met their graduation rate targets over the period from FFY 2013 through FFY 2018.

Figure 4
Table 1 Number of States Meeting Their Graduation Target: FFY 2013 – FFY 2018
FFY 2013 2014 2015 2016 2017 2018 Number of states 17 19 17 19 13 18
CHANGE IN DATA FROM LAST REPORTING YEAR
Figure 5 shows the change in states’ graduation rates from FFY 2017 to FFY 2018. As may be seen, the degree of change this year ranged from –53.33% and 55.00%. Thirty-seven states (62%) made progress with graduation, improving their rates an average of 3.90%. Their median improvement was 1.44% and their standard deviation was 9.17%. Twenty-three states (38%) reported a decrease (slippage) in graduation rates from FFY 2017. Their mean slippage was –5.45% with a median of –1.76% and a standard deviation of 11.62%.
It should be noted that, in states with very small numbers of students with disabilities, one or two students can have a drastic impact on the state’s overall graduation or dropout rate. As a result, rates in these small states tend to fluctuate considerably from year to year and their rates are often extremely high or low, compared to those of more populous states, increasing the standard deviation for the measure.
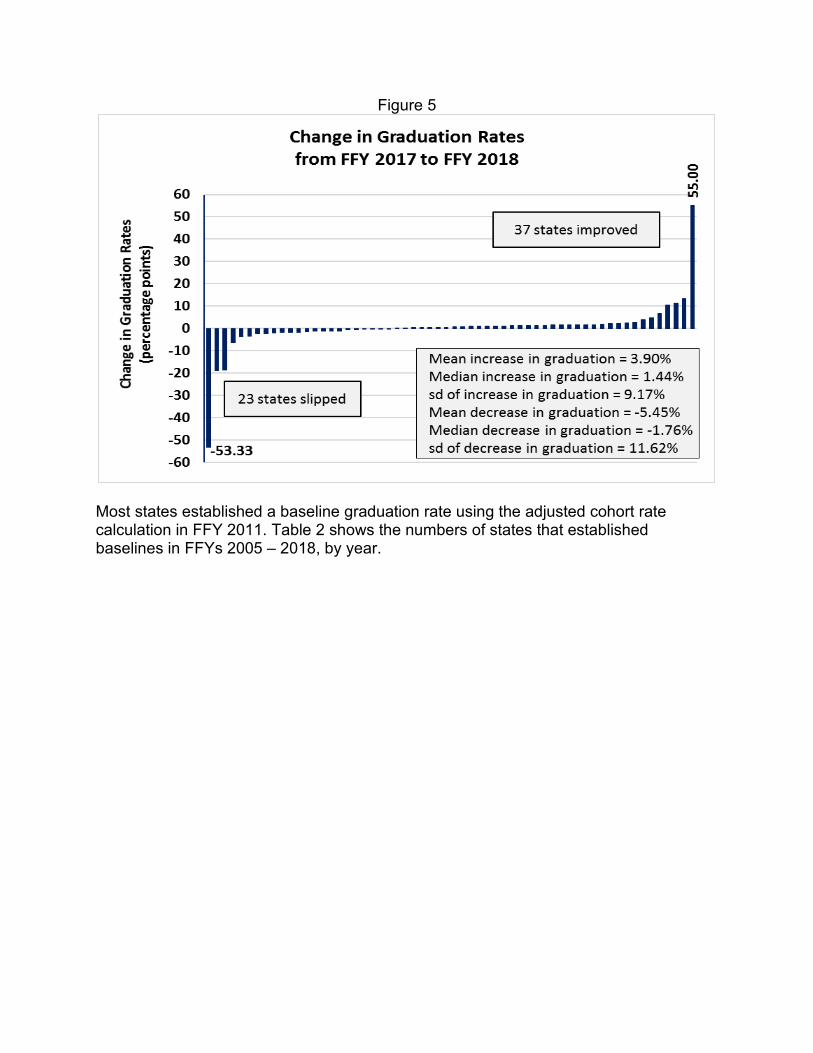
Figure 5
Most states established a baseline graduation rate using the adjusted cohort rate calculation in FFY 2011. Table 2 shows the numbers of states that established baselines in FFYs 2005 – 2018, by year.
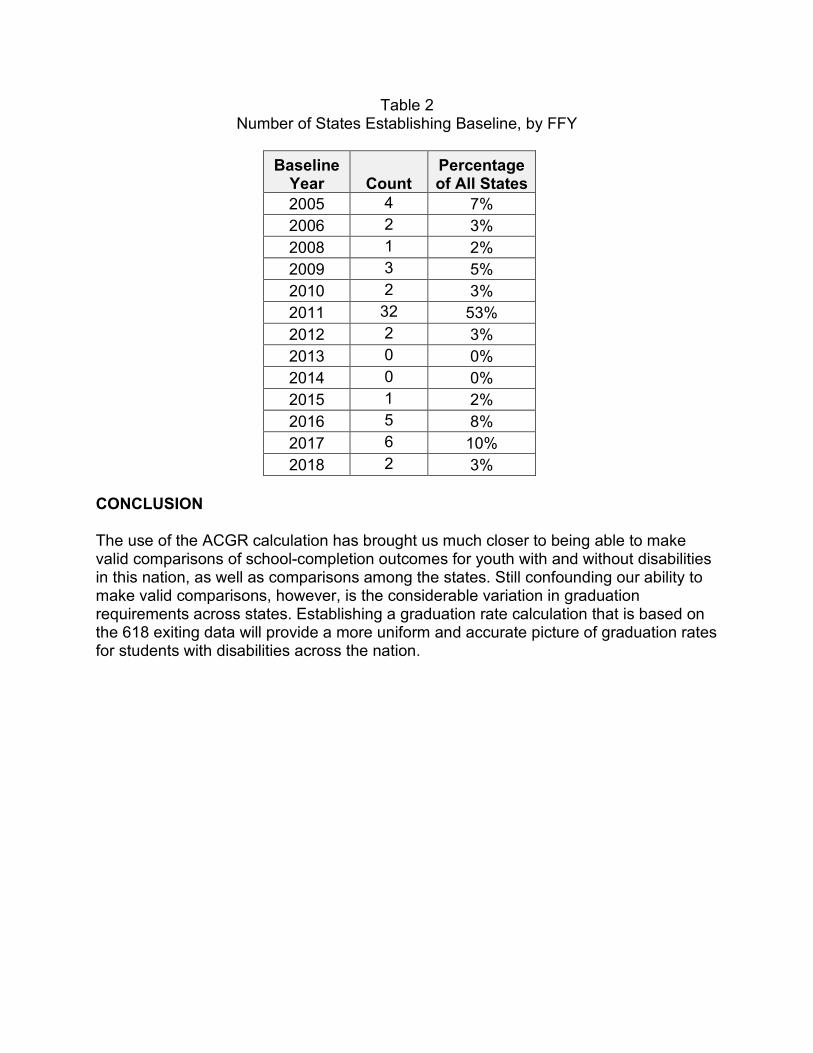
Table 2 Number of States Establishing Baseline, by FFY
Baseline
Year Count Percentage of All States
2005 4 7% 2006 2 3% 2008 1 2% 2009 3 5% 2010 2 3% 2011 32 53% 2012 2 3% 2013 0 0% 2014 0 0% 2015 1 2% 2016 5 8% 2017 6 10% 2018 2 3%
CONCLUSION
The use of the ACGR calculation has brought us much closer to being able to make valid comparisons of school-completion outcomes for youth with and without disabilities in this nation, as well as comparisons among the states. Still confounding our ability to make valid comparisons, however, is the considerable variation in graduation requirements across states. Establishing a graduation rate calculation that is based on the 618 exiting data will provide a more uniform and accurate picture of graduation rates for students with disabilities across the nation.
Indicator B2: Dropout Rate Completed by the National Technical Assistance Center on Transition (NTACT).
INTRODUCTION
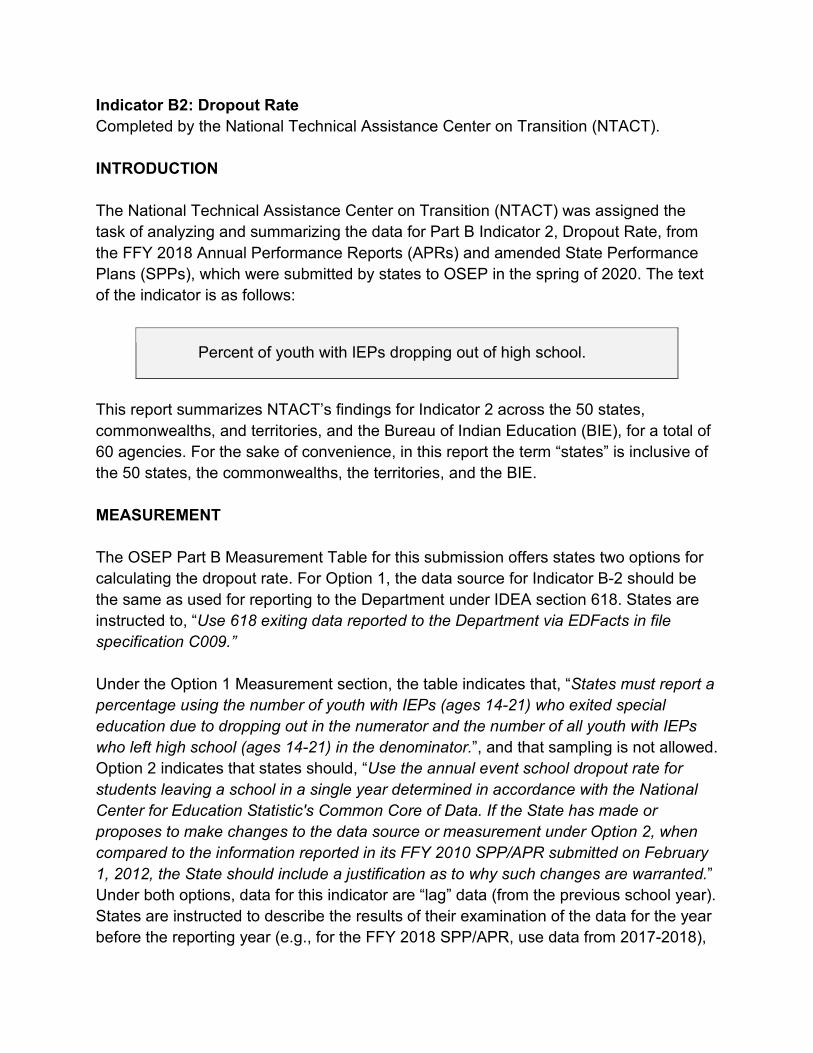
The National Technical Assistance Center on Transition (NTACT) was assigned the task of analyzing and summarizing the data for Part B Indicator 2, Dropout Rate, from the FFY 2018 Annual Performance Reports (APRs) and amended State Performance Plans (SPPs), which were submitted by states to OSEP in the spring of 2020. The text of the indicator is as follows:
Percent of youth with IEPs dropping out of high school.
This report summarizes NTACT’s findings for Indicator 2 across the 50 states, commonwealths, and territories, and the Bureau of Indian Education (BIE), for a total of 60 agencies. For the sake of convenience, in this report the term “states” is inclusive of the 50 states, the commonwealths, the territories, and the BIE.
MEASUREMENT
The OSEP Part B Measurement Table for this submission offers states two options for calculating the dropout rate. For Option 1, the data source for Indicator B-2 should be the same as used for reporting to the Department under IDEA section 618. States are instructed to, “Use 618 exiting data reported to the Department via EDFacts in file specification C009.”
Under the Option 1 Measurement section, the table indicates that, “States must report a percentage using the number of youth with IEPs (ages 14-21) who exited special education due to dropping out in the numerator and the number of all youth with IEPs who left high school (ages 14-21) in the denominator.”, and that sampling is not allowed. Option 2 indicates that states should, “Use the annual event school dropout rate for students leaving a school in a single year determined in accordance with the National Center for Education Statistic's Common Core of Data. If the State has made or proposes to make changes to the data source or measurement under Option 2, when compared to the information reported in its FFY 2010 SPP/APR submitted on February 1, 2012, the State should include a justification as to why such changes are warranted.” Under both options, data for this indicator are “lag” data (from the previous school year). States are instructed to describe the results of their examination of the data for the year before the reporting year (e.g., for the FFY 2018 SPP/APR, use data from 2017-2018),
and compare the results to the target. Finally, states are instructed to, “Provide a narrative that describes what counts as dropping out for all youth and, if different, what counts as dropping out for youth with IEPs. If there is a difference, explain.”
CALCULATION METHODS
Comparisons of dropout rates among states are still confounded by the existence of multiple methods of calculation. The dropout rates reported in the FFY 2018 APRs were calculated using predominately the OSEP exiter/leaver calculation (Option 1) or an event rate calculation (Option 2), though a handful of states employed a 4-year cohort rate calculation for the indicator.
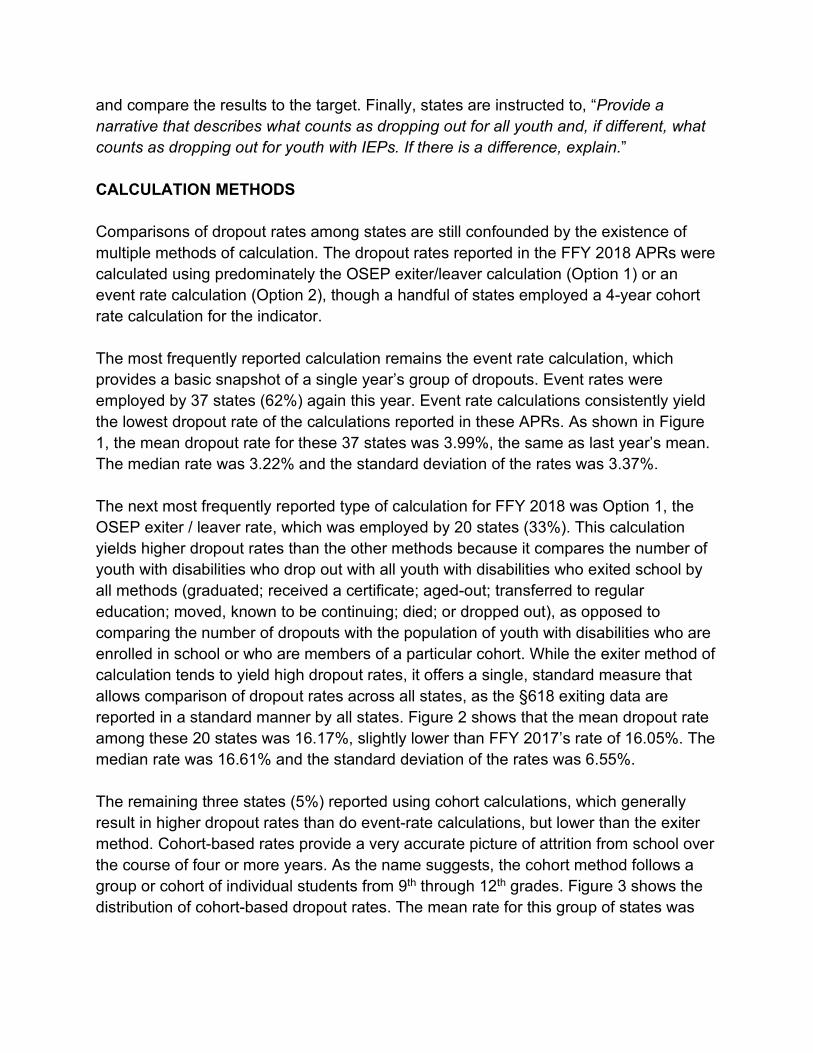
The most frequently reported calculation remains the event rate calculation, which provides a basic snapshot of a single year’s group of dropouts. Event rates were employed by 37 states (62%) again this year. Event rate calculations consistently yield the lowest dropout rate of the calculations reported in these APRs. As shown in Figure 1, the mean dropout rate for these 37 states was 3.99%, the same as last year’s mean. The median rate was 3.22% and the standard deviation of the rates was 3.37%.
The next most frequently reported type of calculation for FFY 2018 was Option 1, the OSEP exiter / leaver rate, which was employed by 20 states (33%). This calculation yields higher dropout rates than the other methods because it compares the number of youth with disabilities who drop out with all youth with disabilities who exited school by all methods (graduated; received a certificate; aged-out; transferred to regular education; moved, known to be continuing; died; or dropped out), as opposed to comparing the number of dropouts with the population of youth with disabilities who are enrolled in school or who are members of a particular cohort. While the exiter method of calculation tends to yield high dropout rates, it offers a single, standard measure that allows comparison of dropout rates across all states, as the §618 exiting data are reported in a standard manner by all states. Figure 2 shows that the mean dropout rate among these 20 states was 16.17%, slightly lower than FFY 2017’s rate of 16.05%. The median rate was 16.61% and the standard deviation of the rates was 6.55%.
The remaining three states (5%) reported using cohort calculations, which generally result in higher dropout rates than do event-rate calculations, but lower than the exiter method. Cohort-based rates provide a very accurate picture of attrition from school over the course of four or more years. As the name suggests, the cohort method follows a group or cohort of individual students from 9th through 12th grades. Figure 3 shows the distribution of cohort-based dropout rates. The mean rate for this group of states was
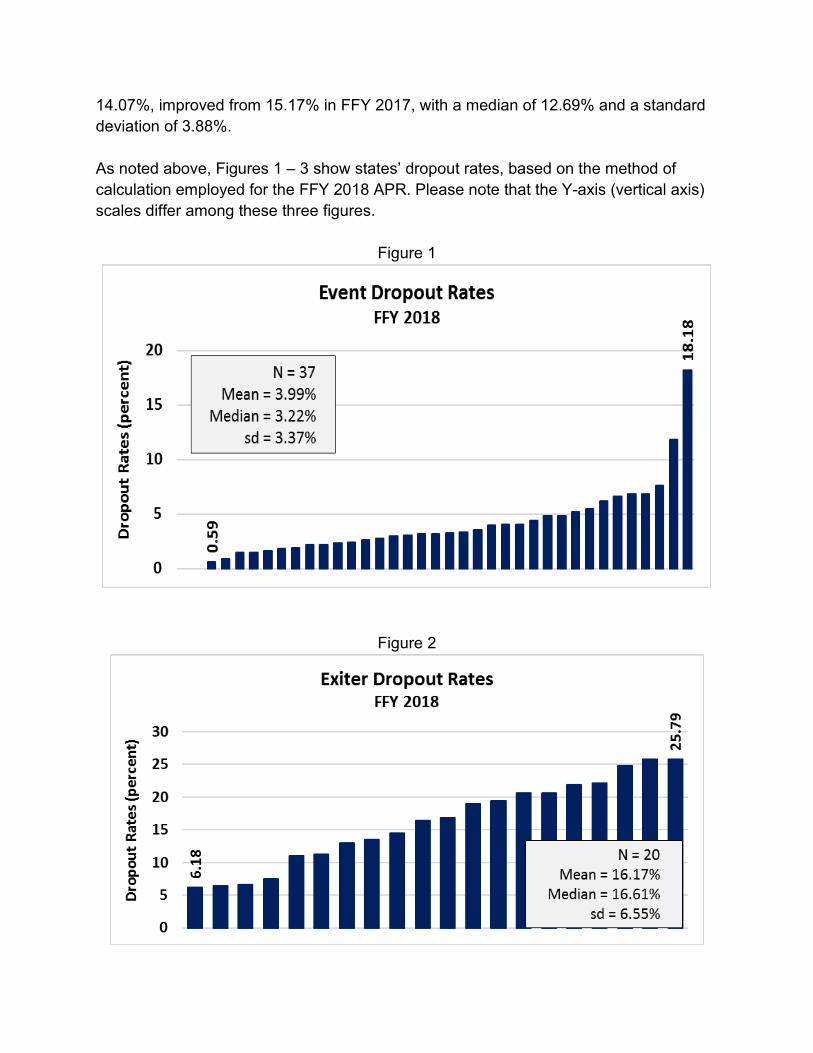
14.07%, improved from 15.17% in FFY 2017, with a median of 12.69% and a standard deviation of 3.88%.
As noted above, Figures 1 – 3 show states’ dropout rates, based on the method of calculation employed for the FFY 2018 APR. Please note that the Y-axis (vertical axis) scales differ among these three figures.
Figure 1
Figure 2
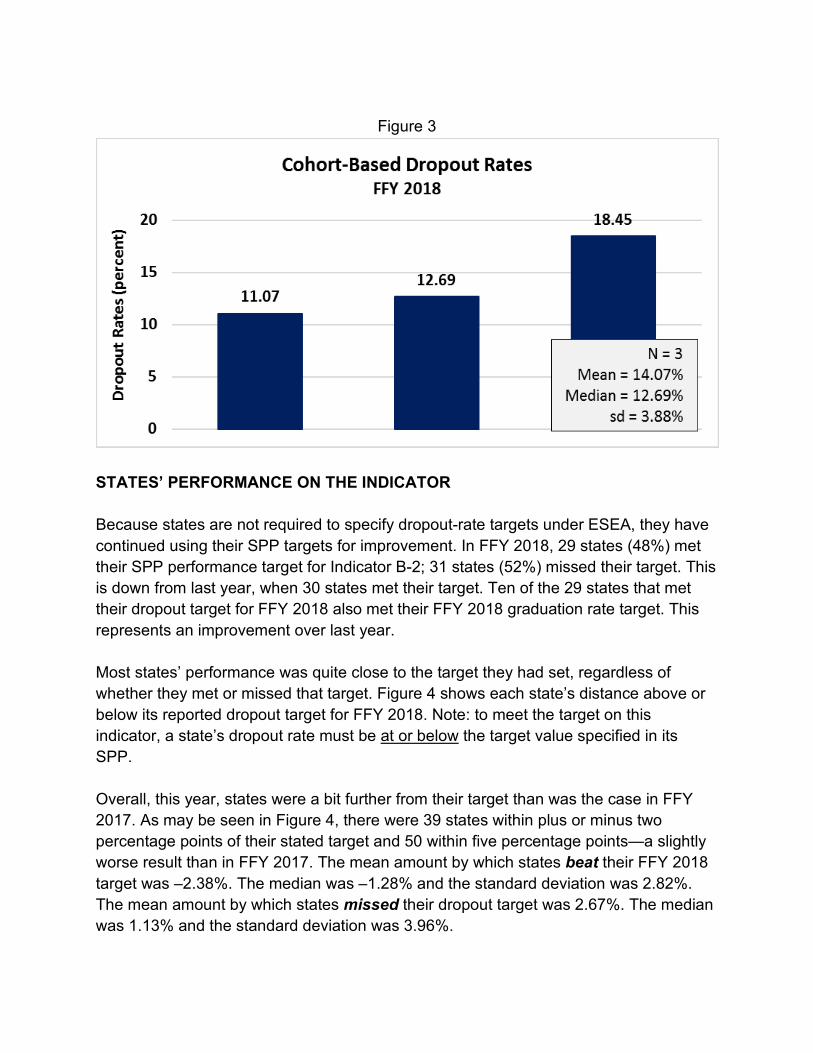
Figure 3
STATES’ PERFORMANCE ON THE INDICATOR
Because states are not required to specify dropout-rate targets under ESEA, they have continued using their SPP targets for improvement. In FFY 2018, 29 states (48%) met their SPP performance target for Indicator B-2; 31 states (52%) missed their target. This is down from last year, when 30 states met their target. Ten of the 29 states that met their dropout target for FFY 2018 also met their FFY 2018 graduation rate target. This represents an improvement over last year.
Most states’ performance was quite close to the target they had set, regardless of whether they met or missed that target. Figure 4 shows each state’s distance above or below its reported dropout target for FFY 2018. Note: to meet the target on this indicator, a state’s dropout rate must be at or below the target value specified in its SPP.
Overall, this year, states were a bit further from their target than was the case in FFY 2017. As may be seen in Figure 4, there were 39 states within plus or minus two percentage points of their stated target and 50 within five percentage points—a slightly worse result than in FFY 2017. The mean amount by which states beat their FFY 2018 target was –2.38%. The median was –1.28% and the standard deviation was 2.82%. The mean amount by which states missed their dropout target was 2.67%. The median was 1.13% and the standard deviation was 3.96%.
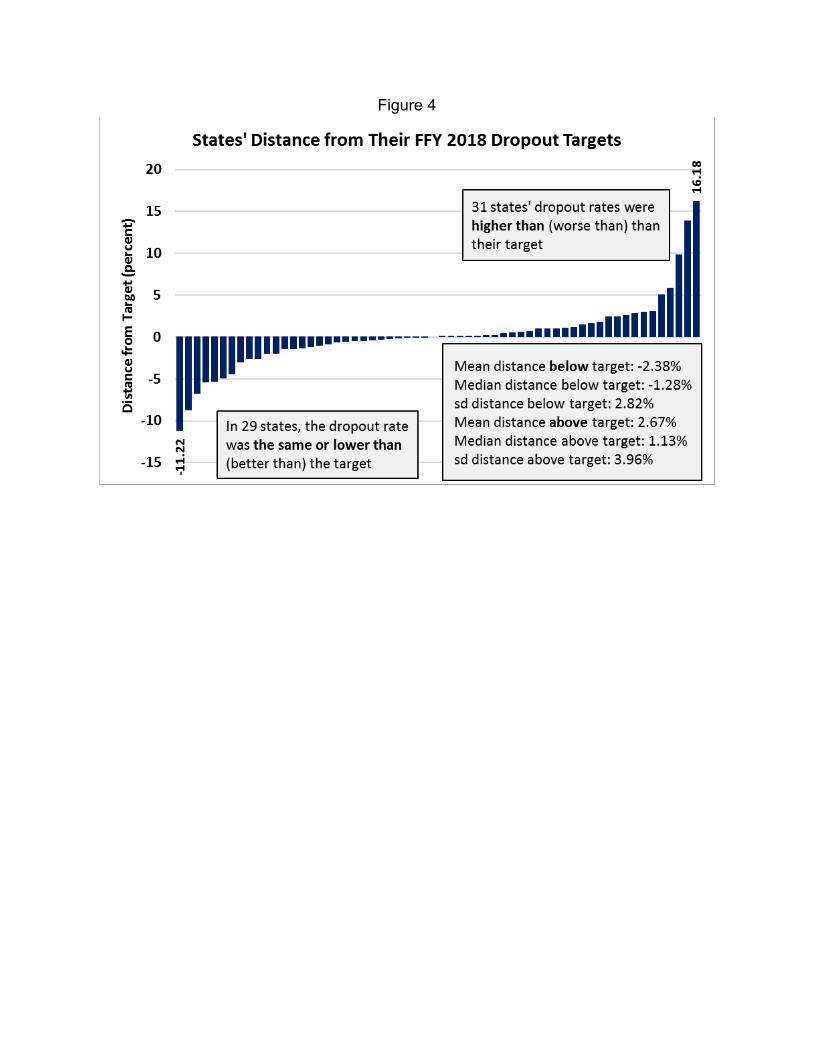
Figure 4
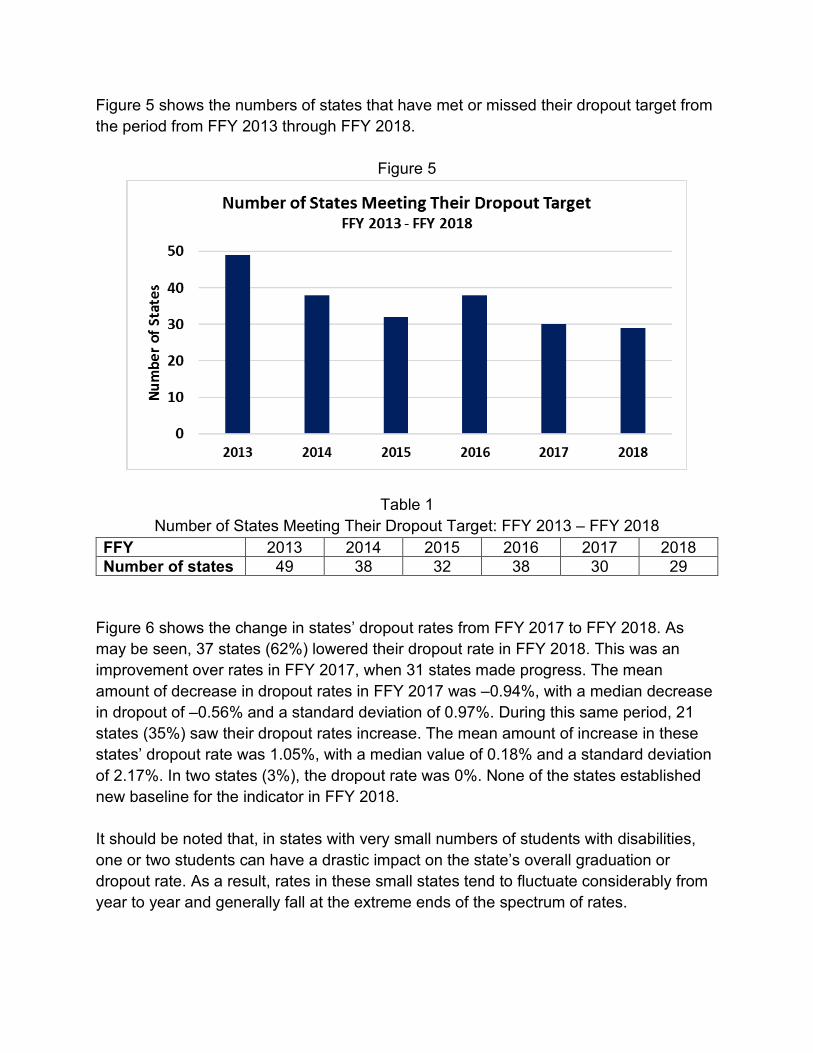
Figure 5 shows the numbers of states that have met or missed their dropout target from the period from FFY 2013 through FFY 2018.
Figure 5
Table 1 Number of States Meeting Their Dropout Target: FFY 2013 – FFY 2018
FFY 2013 2014 2015 2016 2017 2018 Number of states 49 38 32 38 30 29
Figure 6 shows the change in states’ dropout rates from FFY 2017 to FFY 2018. As may be seen, 37 states (62%) lowered their dropout rate in FFY 2018. This was an improvement over rates in FFY 2017, when 31 states made progress. The mean amount of decrease in dropout rates in FFY 2017 was –0.94%, with a median decrease in dropout of –0.56% and a standard deviation of 0.97%. During this same period, 21 states (35%) saw their dropout rates increase. The mean amount of increase in these states’ dropout rate was 1.05%, with a median value of 0.18% and a standard deviation of 2.17%. In two states (3%), the dropout rate was 0%. None of the states established new baseline for the indicator in FFY 2018.
It should be noted that, in states with very small numbers of students with disabilities, one or two students can have a drastic impact on the state’s overall graduation or dropout rate. As a result, rates in these small states tend to fluctuate considerably from year to year and generally fall at the extreme ends of the spectrum of rates.
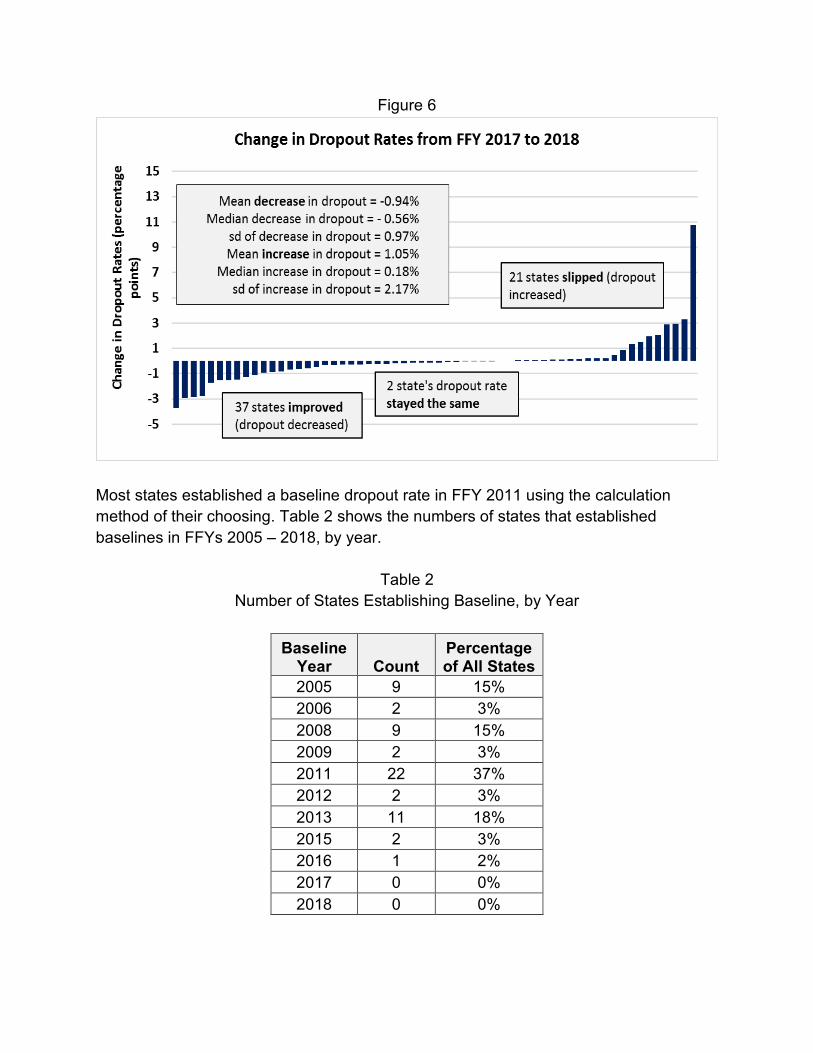
Figure 6
Most states established a baseline dropout rate in FFY 2011 using the calculation method of their choosing. Table 2 shows the numbers of states that established baselines in FFYs 2005 – 2018, by year.
Table 2 Number of States Establishing Baseline, by Year
Baseline Year Count
Percentage of All States
2005 9 15% 2006 2 3% 2008 9 15% 2009 2 3% 2011 22 37% 2012 2 3% 2013 11 18% 2015 2 3% 2016 1 2% 2017 0 0% 2018 0 0%
INDICATOR B3: PARTICIPATION AND PERFORMANCE OF CHILDREN WITH INDIVIDUALIZED EDUCATION PROGRAMS (IEPS) ON STATEWIDE ASSESSMENTS Completed by the National Center on Educational Outcomes.
Indicator B3: Participation and performance of children with IEPs on Statewide assessments:
A. Indicator 3A – Reserved B. Participation rate for children with IEPs. C. Proficiency rate for children with IEPs against grade level, modified and alternate
academic achievement standards.
[20 U.S.C. 1412 (a)(16)(D); 20 U.S.C. 1416 (a)(3)(A)]
INTRODUCTION
The National Center on Educational Outcomes (NCEO) reviewed the data provided by states for Part B Indicator 3 (Assessment), which includes both participation and performance of students with disabilities in statewide assessments. This indicator also has historically included a measure of the extent to which districts in a state were meeting the Elementary and Secondary Education Act (ESEA) Adequate Yearly Progress (AYP) or Annual Measurable Objective (AMO) targets for students with disabilities.
Indicator 3 information in this report is based on Annual Performance Report data from 2018–2019 state assessments. States submitted their data in February 2020 using baseline information and targets (unless revised at that time) submitted in their State Performance Plans (SPPs) first presented in 2005.
This report summarizes data and progress toward targets for the Indicator 3 subcomponents of (3B) state assessment participation of students with Individualized Education Programs (IEPs) and (3C) state assessment performance based on the proficiency rate for students with IEPs. All information contained in this report is an analysis or summary of state data for a given content area across grades 3 through 8, and one tested grade in high school. Because states disaggregated data to varying degrees, rather than providing aggregate data for each subject area, not all states are represented in all data summaries. For example, some states disaggregated by grade or school level, or provided only information summed across grades for participation, performance, or both participation and performance.
DATA SOURCES
We obtained data for this report in August 2020 from spreadsheets compiled by OSEP and placed in the OSEP Ideas That Work Collaboration Spaces webpage. We entered
these data into our working documents and then later verified data using state-submitted APRs. In instances of disagreement between the spreadsheet and the state-submitted APR, we confirmed correct data with OSEP. For the summaries in this report, we used only the data that states reported in their APRs for 2018–2019 assessments.
METHODOLOGY & MEASUREMENT APPROACHES
Two components now comprise the data in Part B Indicator 3:
• 3B is the participation rate for children with IEPs who participate in the various assessment options (Participation)
• 3C is the proficiency rate for children with IEPs against grade-level and alternate academic achievement standards (Proficiency)
States provided data disaggregated to the level of these subcomponents, which included for components 3B and 3C the two content areas of Reading or English Language Arts and Mathematics. Some states disaggregated data by specific grade levels tested only, or by school levels (elementary, middle school, and high school) only. Some states provided these content-specific data by both disaggregating by grade and by providing an overall data point. Most states reported only an overall data point for each subcomponent.
PARTICIPATION OF STUDENTS WITH DISABILITIES IN STATE ASSESSMENTS (COMPONENT 3B)
The participation rate for children with IEPs includes children who participated in the regular assessment with no accommodations, in the regular assessment with accommodations, and in the alternate assessment based on alternate academic achievement standards. Component 3B data (participation rates) were calculated by obtaining a single number of assessment participants and dividing by the total number of students with IEPs enrolled, as shown below:
Participation rate percent = [(# of children with IEPs participating in an assessment) divided by the (total # of children with IEPs enrolled during the testing window)]. Calculate separately for reading and math. The participation rate is based on all children with IEPs, including both children with IEPs enrolled for a full academic year and those not enrolled for a full academic year.
In this section, data and text address participation in reading and mathematics assessments separately.
Figure 1 shows the ways in which regular and unique states provided 2018-2019 participation data for reading and mathematics in their APRs. Thirty-five regular states and ten unique state entities (45 total) provided participation data summarized into single points for reading and for mathematics. Fourteen regular states reported
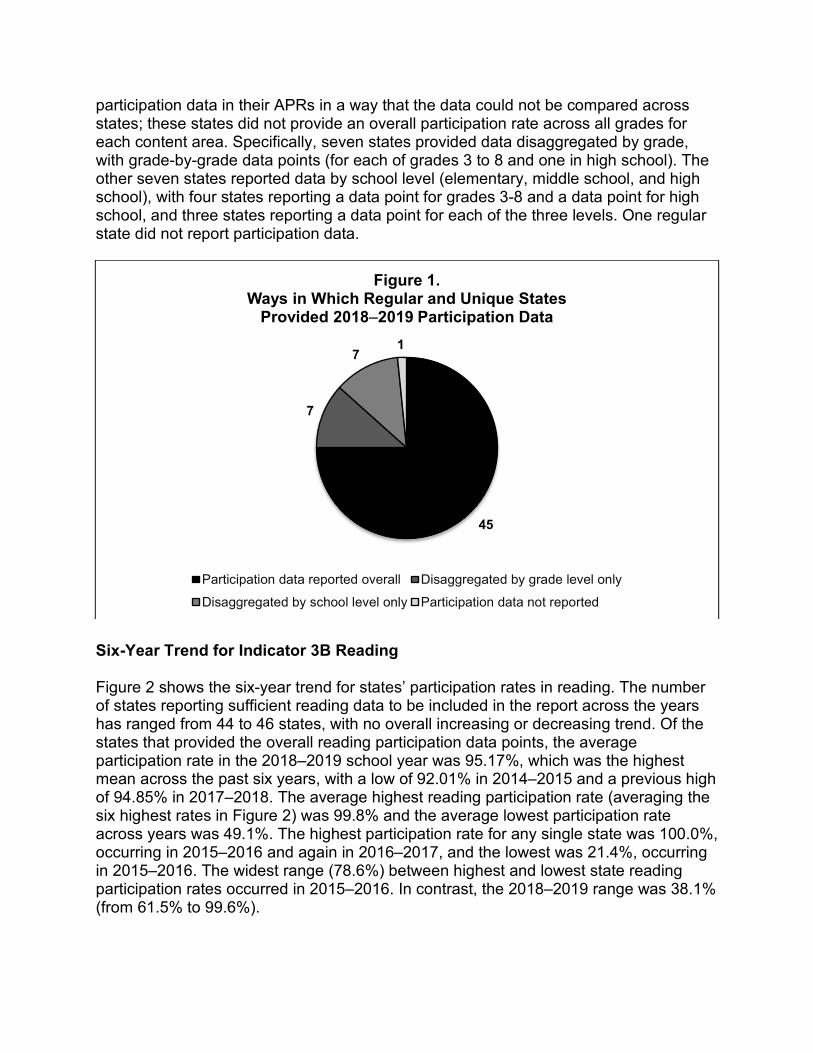
participation data in their APRs in a way that the data could not be compared across states; these states did not provide an overall participation rate across all grades for each content area. Specifically, seven states provided data disaggregated by grade, with grade-by-grade data points (for each of grades 3 to 8 and one in high school). The other seven states reported data by school level (elementary, middle school, and high school), with four states reporting a data point for grades 3-8 and a data point for high school, and three states reporting a data point for each of the three levels. One regular state did not report participation data.
Figure 1.Ways in Which Regular and Unique States
Provided 2018–2019 Participation Data
45
Participation data reported overall
7
Disaggregated by grade level only
7
Disaggregated by school level only
1
Participation data not reported
Six-Year Trend for Indicator 3B Reading
Figure 2 shows the six-year trend for states’ participation rates in reading. The number of states reporting sufficient reading data to be included in the report across the years has ranged from 44 to 46 states, with no overall increasing or decreasing trend. Of the states that provided the overall reading participation data points, the average participation rate in the 2018–2019 school year was 95.17%, which was the highest mean across the past six years, with a low of 92.01% in 2014–2015 and a previous high of 94.85% in 2017–2018. The average highest reading participation rate (averaging the six highest rates in Figure 2) was 99.8% and the average lowest participation rate across years was 49.1%. The highest participation rate for any single state was 100.0%, occurring in 2015–2016 and again in 2016–2017, and the lowest was 21.4%, occurring in 2015–2016. The widest range (78.6%) between highest and lowest state reading participation rates occurred in 2015–2016. In contrast, the 2018–2019 range was 38.1% (from 61.5% to 99.6%).
Thirty-three regular states and eight unique state entities provided data for participation on statewide reading assessments for students with disabilities across all the past six years. The average participation rate for 2018–2019 reading assessments across all states (with sufficient data) was 95.17%, which is an increase from 2017–2018 with 94.85%.
In 2018–2019, the range of reading participation rates reported by states was neither the broadest nor the narrowest range of the six years reported. The highest state’s rate was 99.6 percentage points, and the lowest was 61.5 percentage points; the range was 38.1 percentage points. In the previous year (2017–2018), by contrast, the high and low rates were 99.5 and 73.5 percentage points, respectively; the range was smaller at 26.0 percentage points. However, these two years had the smallest ranges in the six-year period. The states with the lowest reading participation rates had been under 60.0 percentage points prior to 2017–2018 and 2018–2019 but had increased into the deciles above 60%. Nearly all states with data in 2017–2018 and 2018–2019 had participation rates in the top two deciles, 90.0% to 100% and 80.0% to 89.9%.
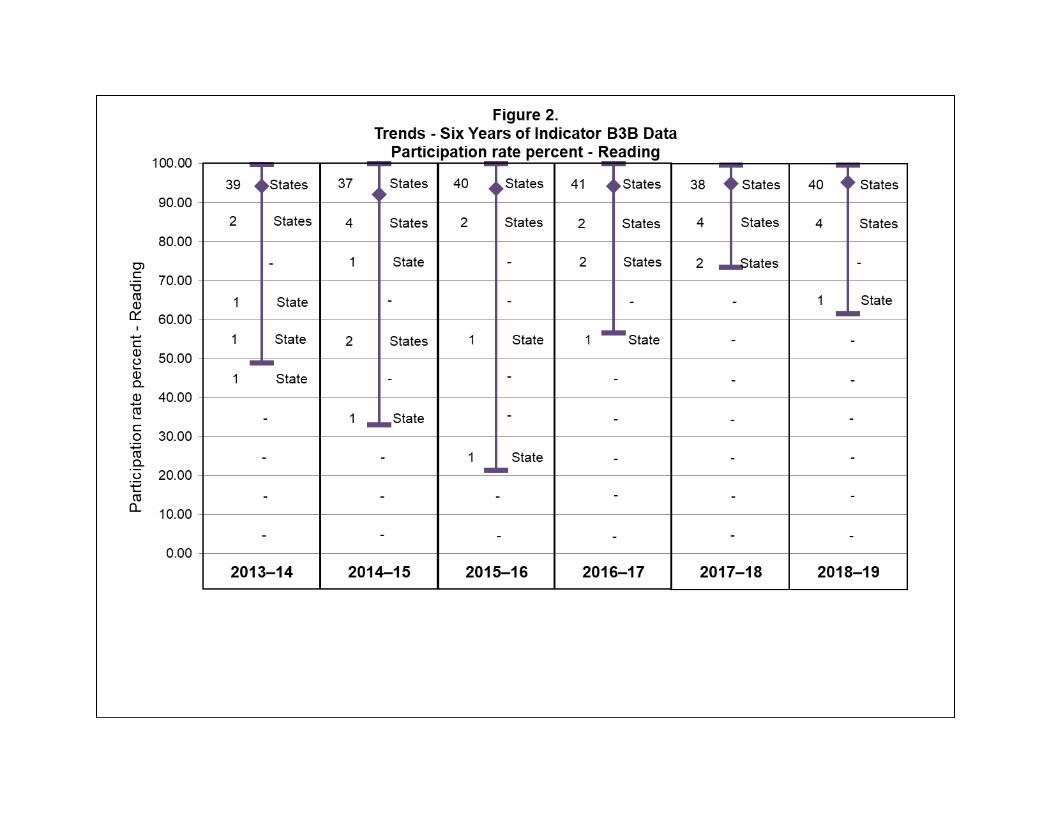
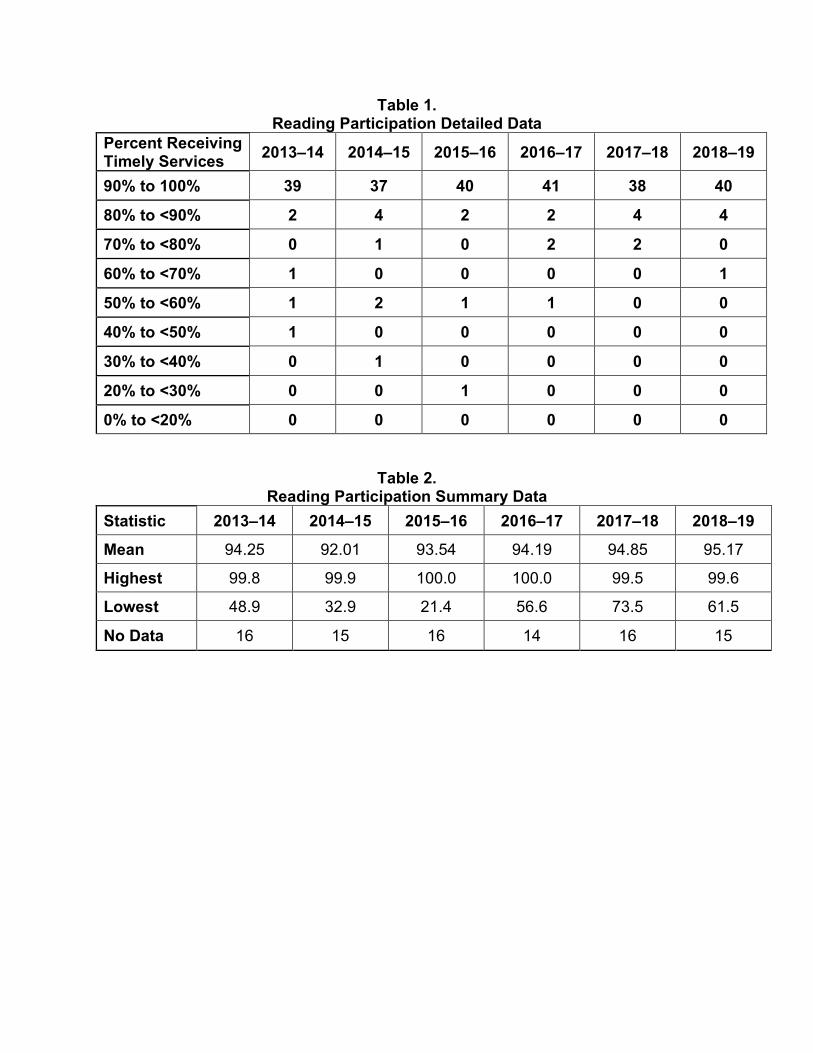
Table 1. Reading Participation Detailed Data
Percent Receiving Timely Services 2013–14 2014–15 2015–16 2016–17 2017–18 2018–19
90% to 100% 39 37 40 41 38 40
80% to <90% 2 4 2 2 4 4
70% to <80% 0 1 0 2 2 0
60% to <70% 1 0 0 0 0 1
50% to <60% 1 2 1 1 0 0
40% to <50% 1 0 0 0 0 0
30% to <40% 0 1 0 0 0 0
20% to <30% 0 0 1 0 0 0
0% to <20% 0 0 0 0 0 0
Table 2. Reading Participation Summary Data
Statistic 2013–14 2014–15 2015–16 2016–17 2017–18 2018–19
Mean 94.25 92.01 93.54 94.19 94.85 95.17
Highest 99.8 99.9 100.0 100.0 99.5 99.6
Lowest 48.9 32.9 21.4 56.6 73.5 61.5
No Data 16 15 16 14 16 15
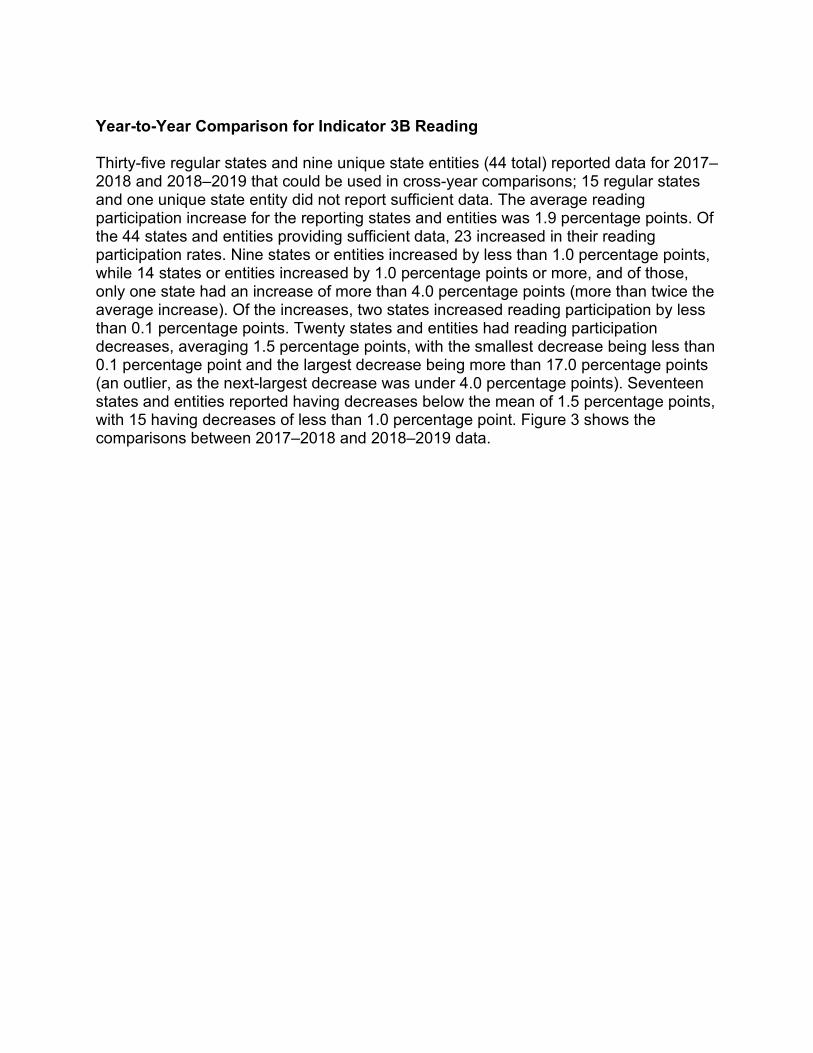
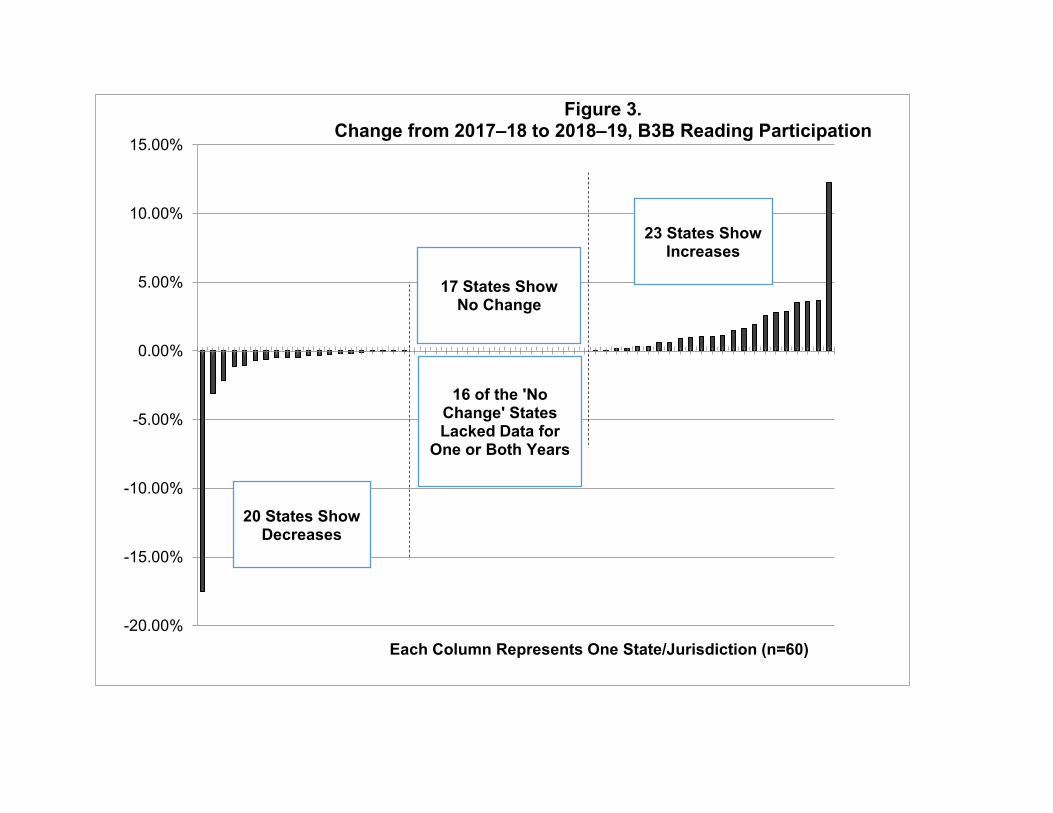
Year-to-Year Comparison for Indicator 3B Reading
Thirty-five regular states and nine unique state entities (44 total) reported data for 2017–2018 and 2018–2019 that could be used in cross-year comparisons; 15 regular states and one unique state entity did not report sufficient data. The average reading participation increase for the reporting states and entities was 1.9 percentage points. Of the 44 states and entities providing sufficient data, 23 increased in their reading participation rates. Nine states or entities increased by less than 1.0 percentage points, while 14 states or entities increased by 1.0 percentage points or more, and of those, only one state had an increase of more than 4.0 percentage points (more than twice the average increase). Of the increases, two states increased reading participation by less than 0.1 percentage points. Twenty states and entities had reading participation decreases, averaging 1.5 percentage points, with the smallest decrease being less than 0.1 percentage point and the largest decrease being more than 17.0 percentage points (an outlier, as the next-largest decrease was under 4.0 percentage points). Seventeen states and entities reported having decreases below the mean of 1.5 percentage points, with 15 having decreases of less than 1.0 percentage point. Figure 3 shows the comparisons between 2017–2018 and 2018–2019 data.
-20.00%
-15.00%
-10.00%
-5.00%
0.00%
5.00%
10.00%
15.00%
Each Column Represents One State/Jurisdiction (n=60)
Figure 3. Change from 2017–18 to 2018–19, B3B Reading Participation
20 States Show Decreases
23 States Show Increases
16 of the 'No Change' StatesLacked Data for
One or Both Years
17 States Show No Change
Six-Year Trend for Indicator 3B Mathematics
Figure 4 presents the six-year trend for states’ participation rates in mathematics. The number of states reporting sufficient math data to be included in the report across the years has ranged from 45 to 47 states, with no overall increasing or decreasing trend. This pattern was the same as that of reading participation during the same years. Of the states and entities that provided the overall math participation data points, the average participation rate in 2018–2019 was 95.1%, which was the highest mean across the past six years. The lowest mean math participation rate across six years was 92.7% in 2014–2015, and the previous highest mean was 94.5% in 2017–2018. The average highest states' math participation rate (averaging the six rates in Figure 4) was 99.8% and the average lowest math participation rate across years was 48.1%. The highest participation rate for any single state was 100.0%, occurring in both 2015–2016 and 2016–2017, and the lowest was 21.4%, occurring in 2015–2016.
Thirty-three regular states and eight unique state entities provided data for participation on statewide math assessments for students with disabilities across the past six years. The average participation rate for 2018–2019 math assessments across all states (with sufficient data) was 95.13%, which is a small increase from 2017–2018 with 94.5%.
In 2018–2019, the range of math participation rates reported by states was neither the broadest nor the narrowest range of the six years reported. The highest rate was 99.6 percentage points, and the lowest was 60.4 percentage points: the range 39.2 percentage points. This range contrasted with the narrower 2017–2018 range of 34.1 percentage points, like the reading participation range pattern in these two years. The highest state's math participation rate in 2018–2019 was one of the lowest in six years, yet these rates ranged only between 99.4 and 100 percentage points. The lowest state's math participation rate, 60.4 percentage points, was the second highest in six years. Also like the reading participation rate pattern, the math participation rate's range—from lowest to highest—showed a similar trend of becoming narrower in 2017–2018 and 2018–2019 compared to the previous years. This change might indicate a potential lasting improvement in all states' participation rates, with most of them above 80%, and all of them above 60%.
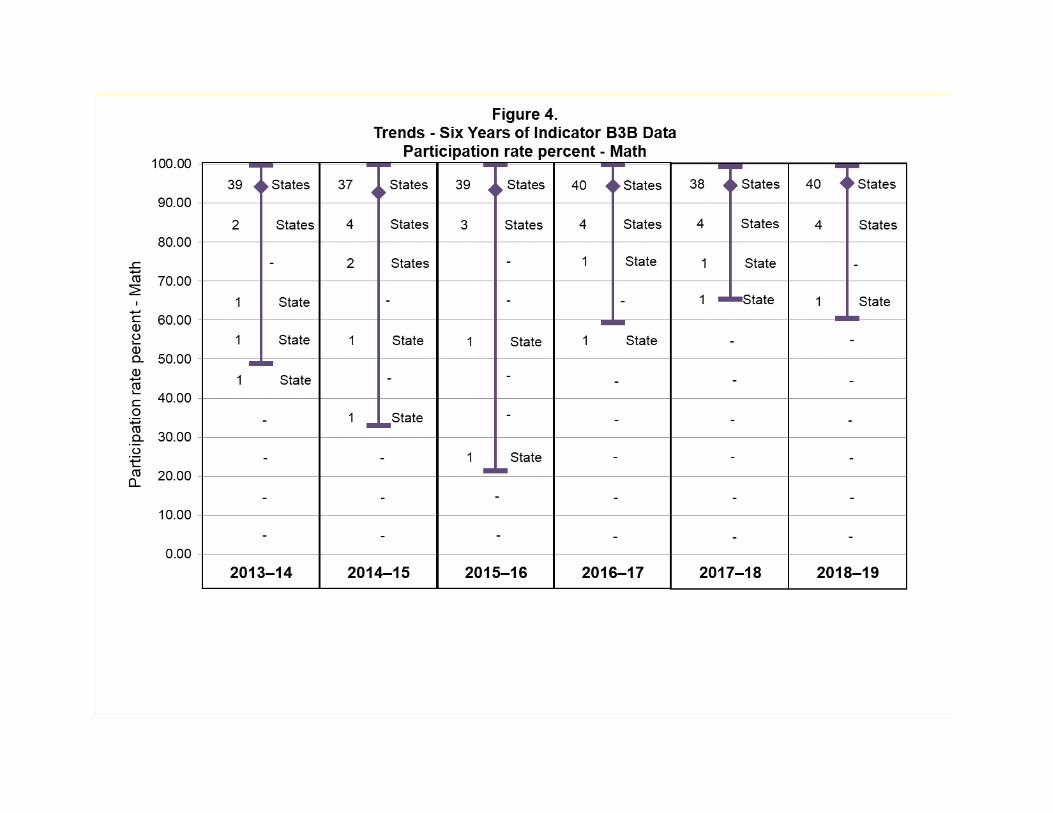
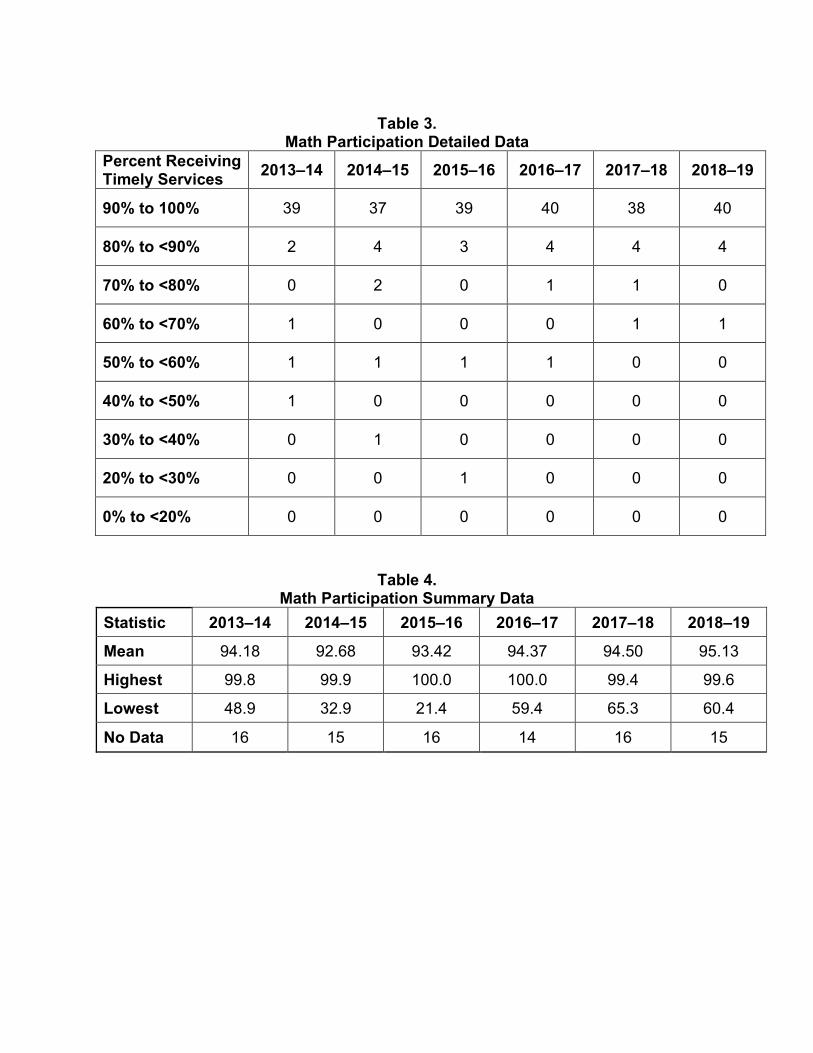
Table 3.
Math Participation Detailed Data Percent Receiving Timely Services 2013–14 2014–15 2015–16 2016–17 2017–18 2018–19
90% to 100% 39 37 39 40 38 40
80% to <90% 2 4 3 4 4 4
70% to <80% 0 2 0 1 1 0
60% to <70% 1 0 0 0 1 1
50% to <60% 1 1 1 1 0 0
40% to <50% 1 0 0 0 0 0
30% to <40% 0 1 0 0 0 0
20% to <30% 0 0 1 0 0 0
0% to <20% 0 0 0 0 0 0
Table 4. Math Participation Summary Data
Statistic 2013–14 2014–15 2015–16 2016–17 2017–18 2018–19
Mean 94.18 92.68 93.42 94.37 94.50 95.13
Highest 99.8 99.9 100.0 100.0 99.4 99.6
Lowest 48.9 32.9 21.4 59.4 65.3 60.4
No Data 16 15 16 14 16 15
Year-to-Year Comparison for Indicator 3B Mathematics
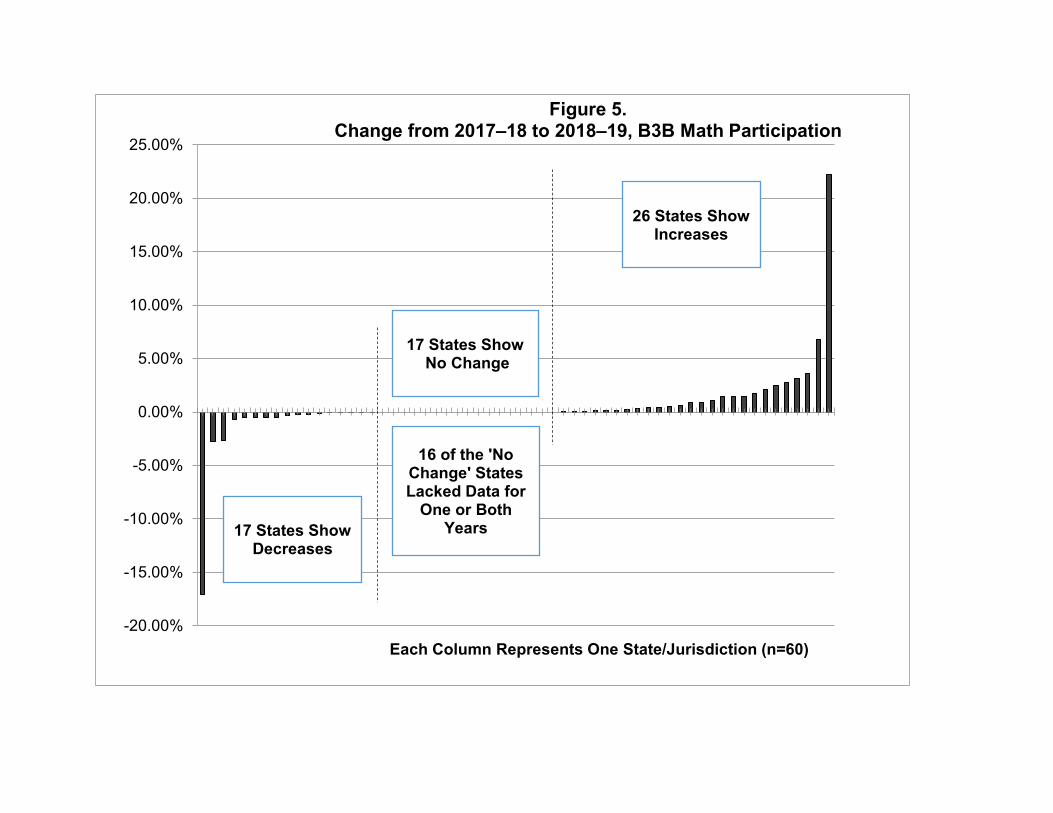
Thirty-five regular states and nine unique state entities reported data for 2017–2018 and 2018–2019 that could be used in cross-year comparisons; 15 regular states and one unique state entity did not provide sufficient data. The average math participation increase for the reporting states and entities was 2.1 percentage points. More states had math participation rate increases than decreases; in comparison, reading participation changes were nearly equally increases and decreases. Of the 44 states or entities providing sufficient data, 26 increased in their math participation rates; 14 states increased by less than 1.0 percentage points, with three states increasing by less than 0.1 percentage point. The other 12 states increased by 1.0 percentage point or more, yet only two states had increases of more than 5.0 percentage points (more than twice the average increase), with one increasing more than 22.0 percentage points. Seventeen states and entities had math participation decreases, averaging 1.6 percentage points, with the lowest decrease being less than 0.1 percentage point and the highest being 17.1 percentage points. Fourteen states or entities decreased by less than the mean of 1.6 percentage points, with all 14 decreasing by less than 1.0 percentage point. Three states or entities reported having decreases of 1.0 percentage point or more. One state had no change in participation rate across the two years. Figure 5 shows the comparisons between 2017–2018 and 2018–2019 data.
-20.00%
-15.00%
-10.00%
-5.00%
0.00%
5.00%
10.00%
15.00%
20.00%
25.00%
Each Column Represents One State/Jurisdiction (n=60)
Figure 5. Change from 2017–18 to 2018–19, B3B Math Participation
17 States Show Decreases
26 States Show Increases
16 of the 'No Change' StatesLacked Data for
One or Both Years
17 States ShowNo Change
PERFORMANCE OF STUDENTS WITH DISABILITIES ON STATE ASSESSMENTS (COMPONENT 3C)
State assessment performance of students with IEPs includes the rates of those children achieving proficiency on the regular assessment with no accommodations, the regular assessment with accommodations, and the alternate assessment based on alternate academic achievement standards. Component 3C data (proficiency rates) were calculated by obtaining a single number of assessment participants who are proficient or above as measured by the assessments and dividing by the total number of students with IEPs enrolled in assessed grades, as shown below:
Proficiency rate percent = [(# of children with IEPs scoring at or above proficient against grade level and alternate academic achievement standards) divided by the (total # of children with IEPs who received a valid score and for whom a proficiency level was assigned)]. Calculate separately for reading and math. The proficiency rate includes both children with IEPs enrolled for a full academic year and those not enrolled for a full academic year.
Twenty-six regular states and ten unique states (34 total) reported 2018–2019 reading assessment proficiency data. The same 26 regular states and ten unique states reported 2018–2019 mathematics assessment proficiency data. Performance data are examined separately for reading and mathematics in this section.
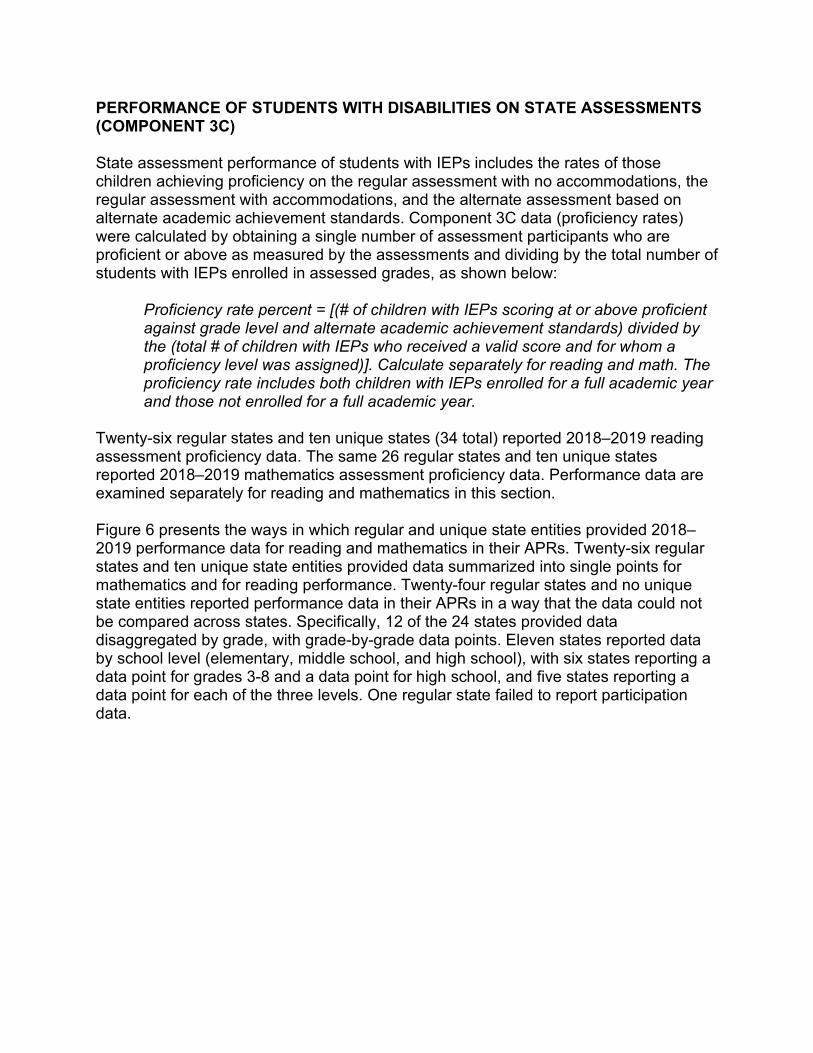
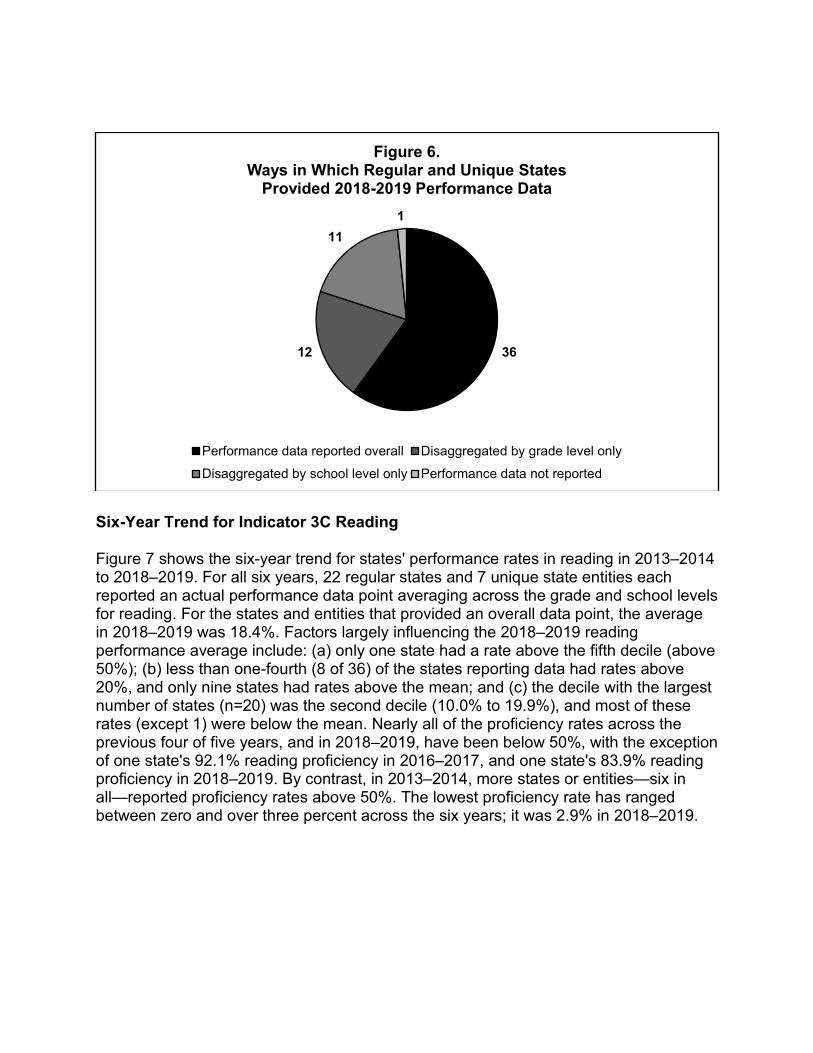
Figure 6 presents the ways in which regular and unique state entities provided 2018–2019 performance data for reading and mathematics in their APRs. Twenty-six regular states and ten unique state entities provided data summarized into single points for mathematics and for reading performance. Twenty-four regular states and no unique state entities reported performance data in their APRs in a way that the data could not be compared across states. Specifically, 12 of the 24 states provided data disaggregated by grade, with grade-by-grade data points. Eleven states reported data by school level (elementary, middle school, and high school), with six states reporting a data point for grades 3-8 and a data point for high school, and five states reporting a data point for each of the three levels. One regular state failed to report participation data.
3612
111
Figure 6. Ways in Which Regular and Unique States
Provided 2018-2019 Performance Data
Performance data reported overall Disaggregated by grade level only
Disaggregated by school level only Performance data not reported
Six-Year Trend for Indicator 3C Reading
Figure 7 shows the six-year trend for states' performance rates in reading in 2013–2014 to 2018–2019. For all six years, 22 regular states and 7 unique state entities each reported an actual performance data point averaging across the grade and school levels for reading. For the states and entities that provided an overall data point, the average in 2018–2019 was 18.4%. Factors largely influencing the 2018–2019 reading performance average include: (a) only one state had a rate above the fifth decile (above 50%); (b) less than one-fourth (8 of 36) of the states reporting data had rates above 20%, and only nine states had rates above the mean; and (c) the decile with the largest number of states (n=20) was the second decile (10.0% to 19.9%), and most of these rates (except 1) were below the mean. Nearly all of the proficiency rates across the previous four of five years, and in 2018–2019, have been below 50%, with the exception of one state's 92.1% reading proficiency in 2016–2017, and one state's 83.9% reading proficiency in 2018–2019. By contrast, in 2013–2014, more states or entities—six in all—reported proficiency rates above 50%. The lowest proficiency rate has ranged between zero and over three percent across the six years; it was 2.9% in 2018–2019.

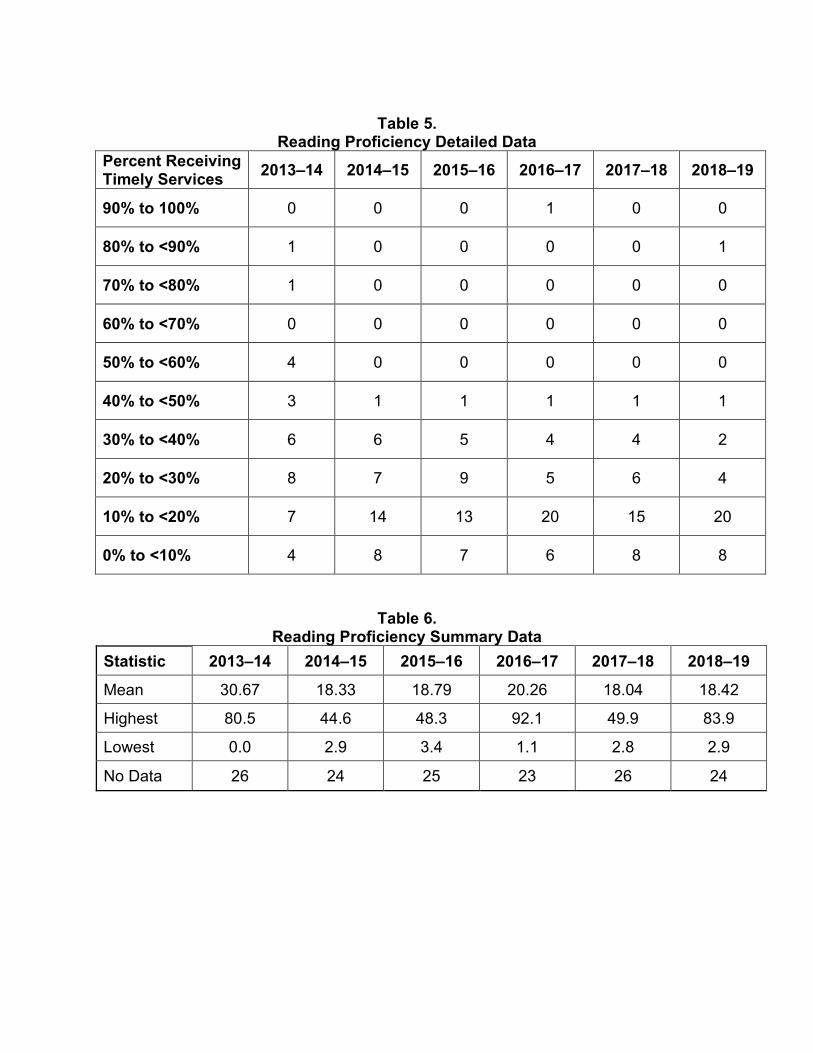
Table 5. Reading Proficiency Detailed Data
Percent Receiving Timely Services 2013–14 2014–15 2015–16 2016–17 2017–18 2018–19
90% to 100% 0 0 0 1 0 0
80% to <90% 1 0 0 0 0 1
70% to <80% 1 0 0 0 0 0
60% to <70% 0 0 0 0 0 0
50% to <60% 4 0 0 0 0 0
40% to <50% 3 1 1 1 1 1
30% to <40% 6 6 5 4 4 2
20% to <30% 8 7 9 5 6 4
10% to <20% 7 14 13 20 15 20
0% to <10% 4 8 7 6 8 8
Table 6. Reading Proficiency Summary Data
Statistic 2013–14 2014–15 2015–16 2016–17 2017–18 2018–19 Mean 30.67 18.33 18.79 20.26 18.04 18.42
Highest 80.5 44.6 48.3 92.1 49.9 83.9
Lowest 0.0 2.9 3.4 1.1 2.8 2.9
No Data 26 24 25 23 26 24
Year-to-Year Comparison for Indicator 3C Reading
In both 2017–2018 and 2018–2019, 26 regular states and eight unique state entities (34 total) reported overall information for reading performance. Fifteen states or entities showed year-to-year increases, from 2017–2018 to 2018–2019, ranging from less than 0.1 percentage point to 6.4 percentage points, with an average increase of 1.8 percentage points. Ten of the 15 states or entities exceeded the previous year’s percentage by less than 1.8 percentage points (i.e., the mean), and the other five states exceeded it by 1.9 percentage points to 6.4 percentage points. About the same proportion of the states providing data for 2018–2019 had lower and higher reading performance data, in comparison to their 2017–2018 data. Year-to-year decreases were reported by 19 states, ranging from less than 0.1 percentage point to 15.3 percentage points, with an average decrease of 3.5 percentage points. In summary, most states (n=22) reporting data had year-to-year changes of between -3.6 and +1.8 percentage points; only about one-third of the states had above-average changes. Twenty-six states were missing specific data points, making change observations not possible. Figure 8 shows the comparisons for 2017–2018 and 2018–2019 reading performance data.

-20.00%
-15.00%
-10.00%
-5.00%
0.00%
5.00%
10.00%
Each Column Represents One State/Jurisdiction (n=60)
Figure 8. Change from 2017–18 to 2018–19, B3C Reading Proficiency
19 States Show
Decreases
15 States Show
Increases
26 of the 'No Change' StatesLacked Data for
One or Both Years
26 States Show No Change

Six-Year Trend for Indicator 3C Mathematics Figure 9 shows the six-year trend for states’ performance rates in math. Across the six years, 25 regular states and seven unique state entities each reported an actual performance data point averaging across the grade and school levels for math. For the states and entities that provided an overall data point, the average in 2018–2019 was 17.9%, which was one of four means in the 17% range during the past six years; this also continues the trend since 2014–2015 of means below 20%, after a previous high average of more than 30% (in 2013–2014). Similar to the reading performance mean, a few factors strongly influenced this average: (a) only one state had a rate above the fifth decile (above 50%); (b) fewer than one-fourth of the states reporting data (8 of 36) had rates above 20%, and only 11 states had rates above the mean; and (c) the decile with the largest number of states (n=18) was the second decile (10.0% to 19.9%), and most of these rates (except 3) were below the mean. Nearly all of the proficiency rates across the previous four of five years, and in 2018–2019, have been below 60%, with the exception of one state's 92.5% math proficiency in 2016–2017, and one state's 86.4% math proficiency in 2018–2019. By contrast, in 2013–2014, four states or entities reported proficiency rates above 60%. The lowest proficiency rate has ranged between zero and 2.1%; it was 2.1% in 2018–2019.
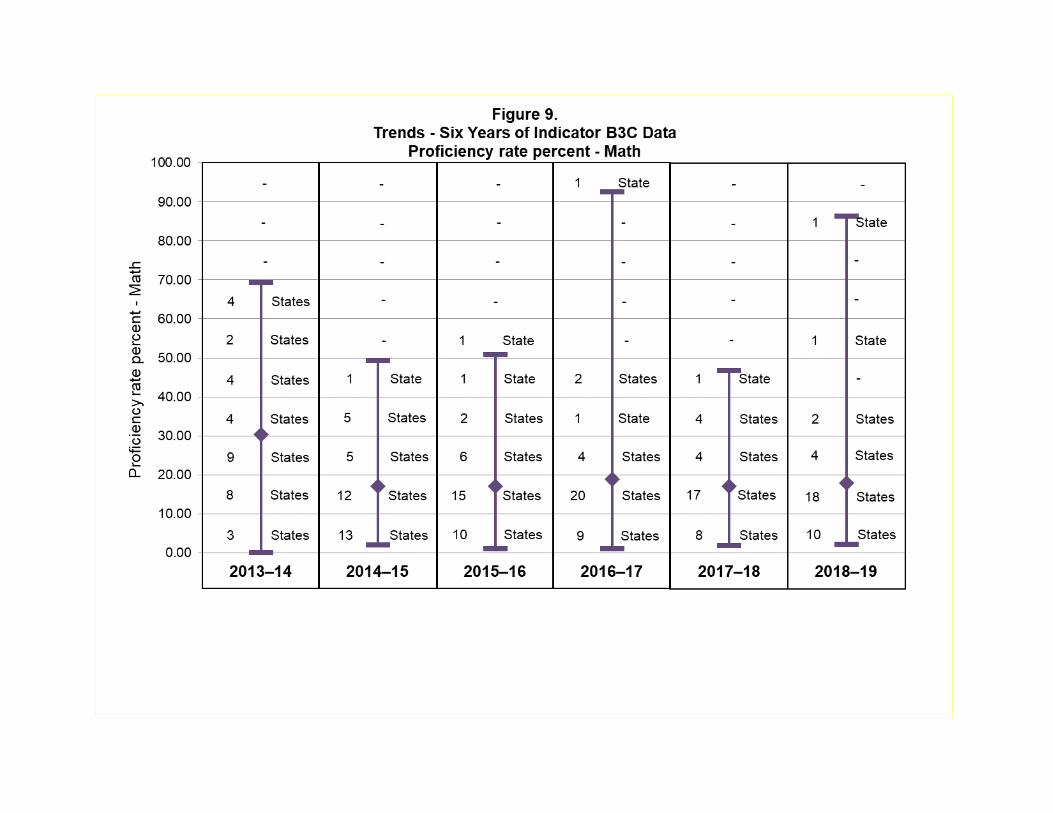
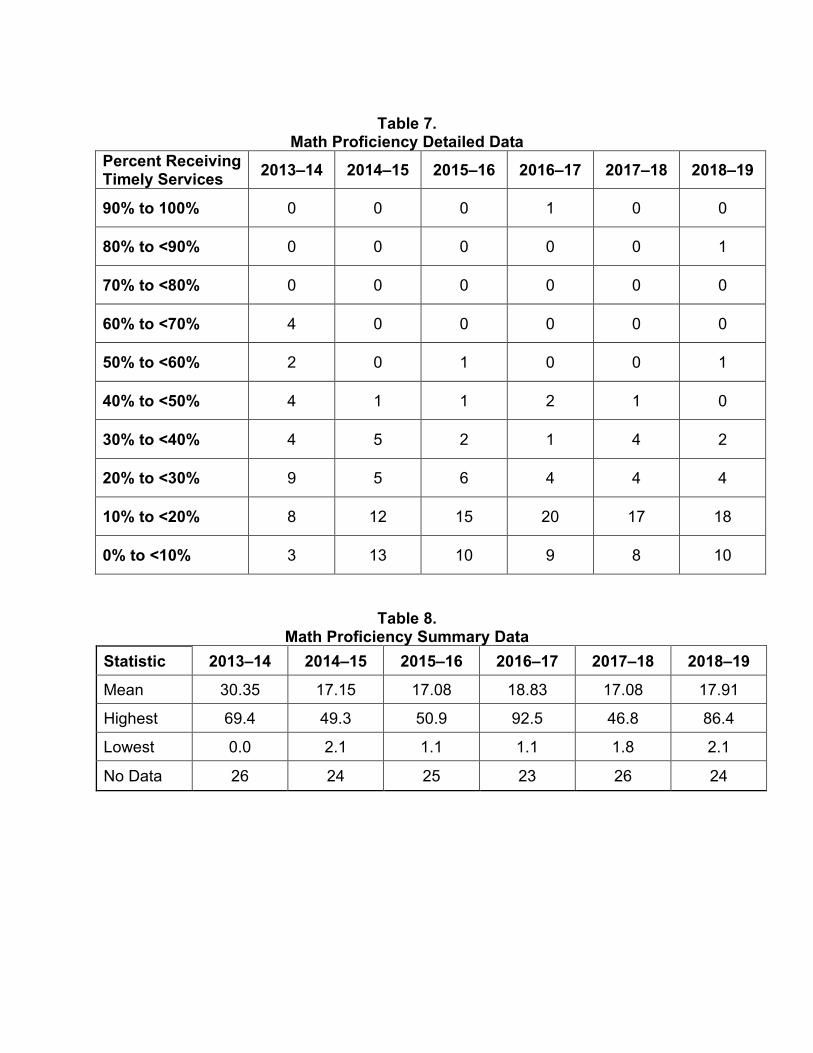
Table 7. Math Proficiency Detailed Data
Percent Receiving Timely Services 2013–14 2014–15 2015–16 2016–17 2017–18 2018–19
90% to 100% 0 0 0 1 0 0
80% to <90% 0 0 0 0 0 1
70% to <80% 0 0 0 0 0 0
60% to <70% 4 0 0 0 0 0
50% to <60% 2 0 1 0 0 1
40% to <50% 4 1 1 2 1 0
30% to <40% 4 5 2 1 4 2
20% to <30% 9 5 6 4 4 4
10% to <20% 8 12 15 20 17 18
0% to <10% 3 13 10 9 8 10
Table 8. Math Proficiency Summary Data
Statistic 2013–14 2014–15 2015–16 2016–17 2017–18 2018–19 Mean 30.35 17.15 17.08 18.83 17.08 17.91
Highest 69.4 49.3 50.9 92.5 46.8 86.4
Lowest 0.0 2.1 1.1 1.1 1.8 2.1
No Data 26 24 25 23 26 24
Year-to-Year Comparison for Indicator 3C Mathematics
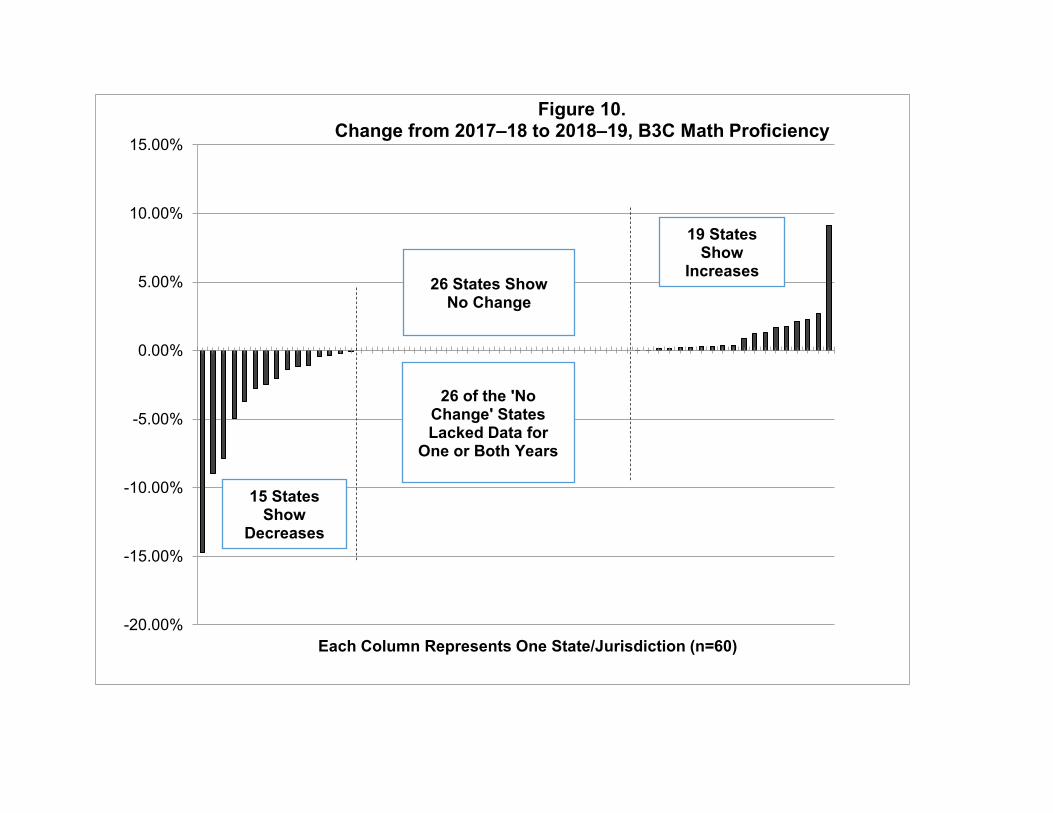
For comparison purposes across the two years, 26 regular states and eight unique state entities (34 total) reported overall information for math performance in both 2017–2018 and 2018–2019. Nineteen of these states showed year-to-year increases, ranging from less than 0.1 percentage point to 9.1 percentage points, with an average increase of 1.3 percentage points. Twelve of the 19 states exceeded the 2017–2018 data by fewer than 1.3 percentage points; the other seven states exceeded by between 1.3 percentage points and 9.1 percentage points. Year-to-year decreases were reported by 15 states, ranging from less than 0.1 percentage point to 14.7 percentage points, with an average decrease of 3.5 percentage points; 9 of the 14 states were lower by less than 3.4 percentage points. The other five states were lower by between 3.7 and 14.7 percentage points; the only state with a decrease higher than 10 percentage points had a 14.7 percentage point decrease. In summary, about one-third of states (n=12) reported year-to-year change data that were above the average increase or decrease. Twenty-six states were missing specific data points, making change observations not possible. Figure 10 shows the comparisons for 2017–2018 and 2018–2019 math performance data.
-20.00%
-15.00%
-10.00%
-5.00%
0.00%
5.00%
10.00%
15.00%
Each Column Represents One State/Jurisdiction (n=60)
Figure 10. Change from 2017–18 to 2018–19, B3C Math Proficiency
15 States Show
Decreases
19 States Show
Increases
26 of the 'No Change' StatesLacked Data for
One or Both Years
26 States Show No Change
CONCLUSION
Participation rates of students with disabilities on state reading assessments have remained on average the same (in 2018–2019) as the previous year yet have evidenced a slight overall increase across the past few years. Two co-occurring factors have contributed to this complex result. One factor indicated no overall change: an equivalent number of states have shown increases as have shown decreases between 2017–2018 and 2018–2019, and the states' changes have primarily been relatively small, with nearly all changes being by less than five percentage points. The other factor indicated a gradual increase across several years: relatively fewer states had atypical reading participation rates, narrowing the range of data results to between 60% and 100%. Participation rates for mathematics have improved on average in 2018–2019 over the previous year and have also evidenced a gradual overall increase across the past few years. The gradual increase, as with reading participation, can be associated with the decrease in the number of states with atypical math participation rates, narrowing the range of data results to between 60% and 100%. The improvement of math participation between 2017–2018 and 2018–2019 can be associated with the larger proportion of states with increases in comparison with the states with decreases, while these changes have also been similarly small, with nearly all by fewer than five percentage points.
States with participation decreases in their APRs have explained them in various ways. In total, 15 states had year-to-year decreases in both reading and math participation from the 2017–2018 school year to the 2018–2019 school year. Five additional states had a decrease in reading only, and two additional states had a decrease in math only. For these 22 states or entities, a few reasons were specified: (a) districts making testing schedule changes, (b) possible rounding error for a very small decrease, (c) districts providing no make-up testing for students absent on testing days, (d) concern about parental "opt-out" actions, and (e) limited data that could not be properly finalized due to the COVID-19 pandemic and associated crisis. One state did not explicitly explain its participation decreases but noted its efforts to address the concern. Some states offered more than one of these explanations. Approximately 15 states did not provide any information about their participation decreases; nearly all these states had small decreases (less than two percentage points). Six of these states met their targets, and the remainder did not meet their targets.
Performance rates of students with disabilities on state reading assessments have shown little change, and math performance rates have similarly shown little change in 2018–2019 compared to previous years. State performance data showed relatively small changes on average (of less than two percentage points) across five of the previous six years for both reading and mathematics, with the most recent change being mean increases between 2017–2018 and 2018–2019 for both reading and mathematics. Incidentally, performance means for both reading and math in 2018–2019 were at least somewhat influenced by one state having proficiency scores in the 80% range; in contrast, there had previously been no similarly high proficiency scores in 2017–2018. Accordingly, the 2018–2019 mean reading and math proficiency rates
increased by less than one percentage point since the previous year. Overall mean performance was lower for reading than math in 2018–2019. This difference can be attributed to the primary point that four more states had reading performance decreases than had reading increases, while four more states had math performance increases than had math decreases. Nearly all year-to-year performance changes for both reading and math were relatively and similarly small, less than five percentage points.
States with performance decreases in their APRs have explained them in various ways. In total, 13 states had year-to-year decreases in both reading and math proficiency from the 2017–2018 school year to the 2018–2019 school year. Six additional states had decreases in reading only and another two states had decreases in math only. For these 21 states or entities, a few reasons were specified: (a) recent implementation of new state assessments that were deemed more rigorous, (b) change in scoring scale with a different number of proficiency levels, (c) decreases in alternate assessment participation which shifted students to taking general assessments, (d) shortage of special education teachers who were highly qualified, and (e) a natural disaster having a lasting impact in highly populous regions. Some states offered more than one of these explanations. Other states did not offer explanations for performance decreases but described their actions toward improvement. Twelve other states did not provide any information about their performance decreases; nearly all these states had decreases of less than one percentage point. Six of these 12 states met their targets, while the remainder did not meet their targets.
INDICATOR B4: RATES OF SUSPENSION AND EXPULSION Completed by the IDEA Data Center (IDC).
INTRODUCTION
For Indicator B4A, states must report:
• The percent of districts that have a significant discrepancy in the rate of suspensions and expulsions of greater than 10 days in a school year for children with IEPs.
For Indicator B4B, states must report:
• The percent of districts that have: (a) a significant discrepancy, by race or ethnicity, in the rate of suspensions and expulsions of greater than 10 days in a school year for children with IEPs; and (b) policies, procedures, or practices that contribute to the significant discrepancy and do not comply with requirements relating to the development and implementation of IEPs, the use of positive behavioral interventions and supports, and procedural safeguards.
To determine whether a significant discrepancy exists for a district, states must use one of two comparison options. States may either:
1) Compare the rates of suspensions and expulsions of greater than 10 days in a school year for children with IEPs among districts in the state, or
2) Compare the rates of suspensions and expulsions of greater than 10 days in a school year for children with IEPs in each district to the rates for nondisabled children in the same district.
DATA SOURCES
Both B4A and B4B require states to use data collected for reporting under Section 618 [i.e., data reported in EDFacts file FS006 - Children with Disabilities (IDEA) Suspensions/Expulsions]. For FFY 2018 APRs, states were required to analyze discipline data from school year 2017–18. States are required to set targets for B4A; B4B, however, is considered a compliance indicator, so states must set targets for B4B at zero percent. IDC reviewed FFY 2018 APRs from a total of 60 entities, including the 50 states, the District of Columbia, the outlying areas, and the Bureau of Indian Education (BIE). All 60 entities were required to report on B4A; however, only the 50 states, the District of Columbia, and the Virgin Islands were required to report on B4B, resulting in a total of 52 entities reporting. For the remainder of this summary, we refer to all 60 entities as states.
METHODOLOGY AND MEASUREMENT APPROACHES
This section describes the comparison options and methods that states used to determine significant discrepancy and the percentages of districts that states excluded from their analyses because of states’ minimum n size requirements.
Comparison Option States Used for Determining Significant Discrepancy
States are required to use one of two comparison options when determining significant discrepancy for B4A and B4B. States can either: (1) compare the rates of suspensions/expulsions for children with disabilities among districts within the state, or (2) compare the rates of suspensions/expulsions for children with disabilities to the rates for children without disabilities within each district. We refer to these as Comparison Option 1 and Comparison Option 2, respectively. Figures 1 and 2 present the number of states that used each option for B4A and B4B, respectively, for FFY 2017 and FFY 2018.

Figure 1
Number of States That Used Comparison Option 1 or Comparison Option 2 to Determine Significant Discrepancy for B4A: FFY 2017 and FFY 2018 (N = 60)
37
23
38
22
0
10
20
30
40
50
60
ComparisonOption 1
ComparisonOption 2
Num
ber o
f sta
tes
Comparison option used to determine significant discrepancy
FFY 2017 FFY 2018
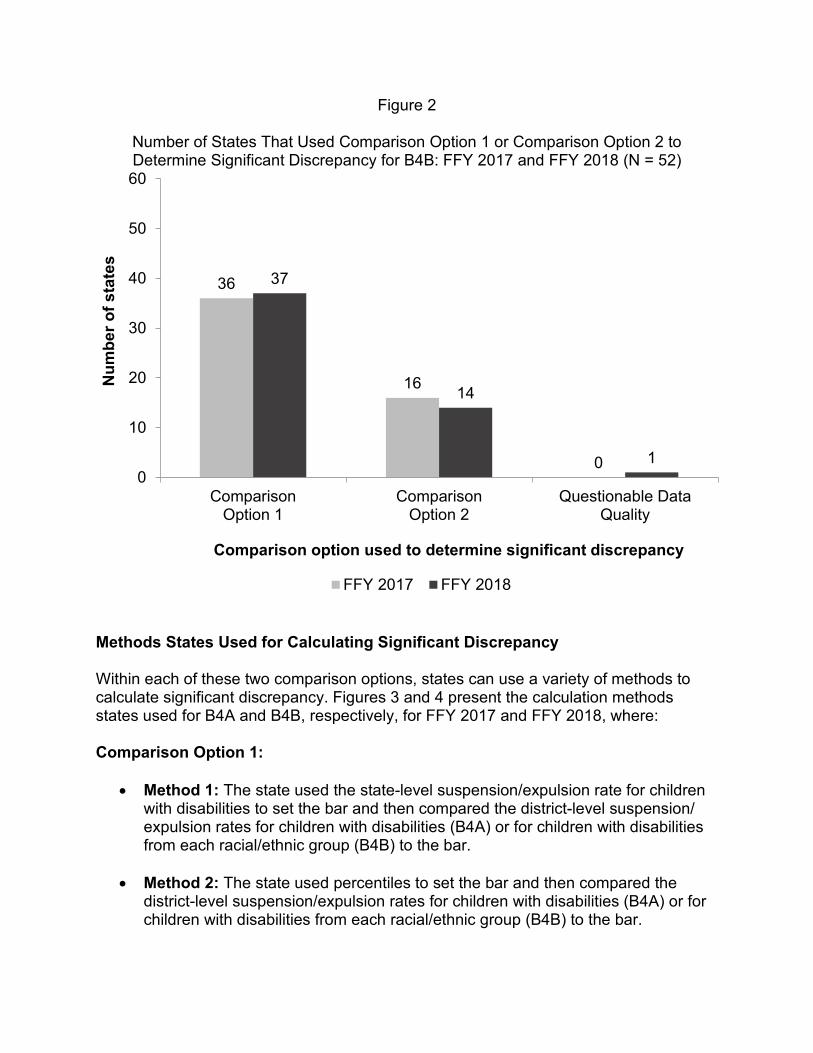
Figure 2
Number of States That Used Comparison Option 1 or Comparison Option 2 to Determine Significant Discrepancy for B4B: FFY 2017 and FFY 2018 (N = 52)
36
16
0
37
14
10
10
20
30
40
50
60
ComparisonOption 1
ComparisonOption 2
Questionable DataQuality
Num
ber o
f sta
tes
Comparison option used to determine significant discrepancy
FFY 2017 FFY 2018
Methods States Used for Calculating Significant Discrepancy
Within each of these two comparison options, states can use a variety of methods to calculate significant discrepancy. Figures 3 and 4 present the calculation methods states used for B4A and B4B, respectively, for FFY 2017 and FFY 2018, where:
Comparison Option 1:
• Method 1: The state used the state-level suspension/expulsion rate for children with disabilities to set the bar and then compared the district-level suspension/ expulsion rates for children with disabilities (B4A) or for children with disabilities from each racial/ethnic group (B4B) to the bar.
• Method 2: The state used percentiles to set the bar and then compared the district-level suspension/expulsion rates for children with disabilities (B4A) or for children with disabilities from each racial/ethnic group (B4B) to the bar.
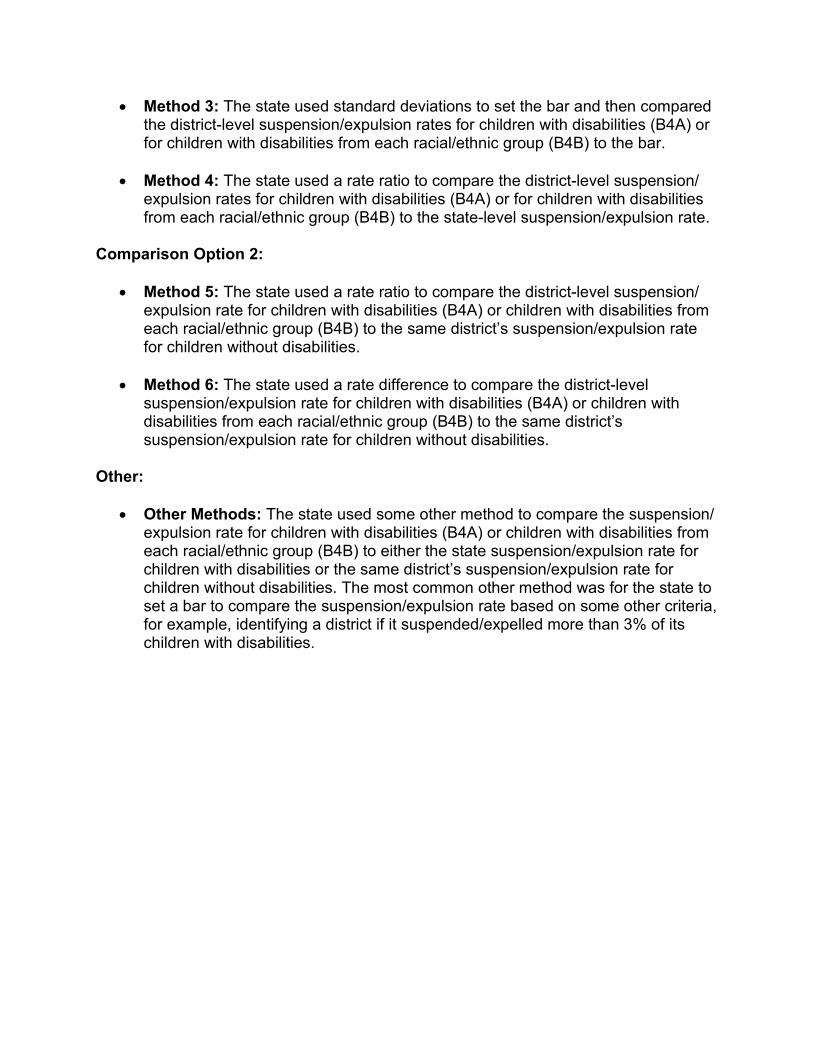
• Method 3: The state used standard deviations to set the bar and then compared the district-level suspension/expulsion rates for children with disabilities (B4A) or for children with disabilities from each racial/ethnic group (B4B) to the bar.
• Method 4: The state used a rate ratio to compare the district-level suspension/ expulsion rates for children with disabilities (B4A) or for children with disabilities from each racial/ethnic group (B4B) to the state-level suspension/expulsion rate.
Comparison Option 2:
• Method 5: The state used a rate ratio to compare the district-level suspension/ expulsion rate for children with disabilities (B4A) or children with disabilities from each racial/ethnic group (B4B) to the same district’s suspension/expulsion rate for children without disabilities.
• Method 6: The state used a rate difference to compare the district-level suspension/expulsion rate for children with disabilities (B4A) or children with disabilities from each racial/ethnic group (B4B) to the same district’s suspension/expulsion rate for children without disabilities.
Other:
• Other Methods: The state used some other method to compare the suspension/ expulsion rate for children with disabilities (B4A) or children with disabilities from each racial/ethnic group (B4B) to either the state suspension/expulsion rate for children with disabilities or the same district’s suspension/expulsion rate for children without disabilities. The most common other method was for the state to set a bar to compare the suspension/expulsion rate based on some other criteria, for example, identifying a district if it suspended/expelled more than 3% of its children with disabilities.
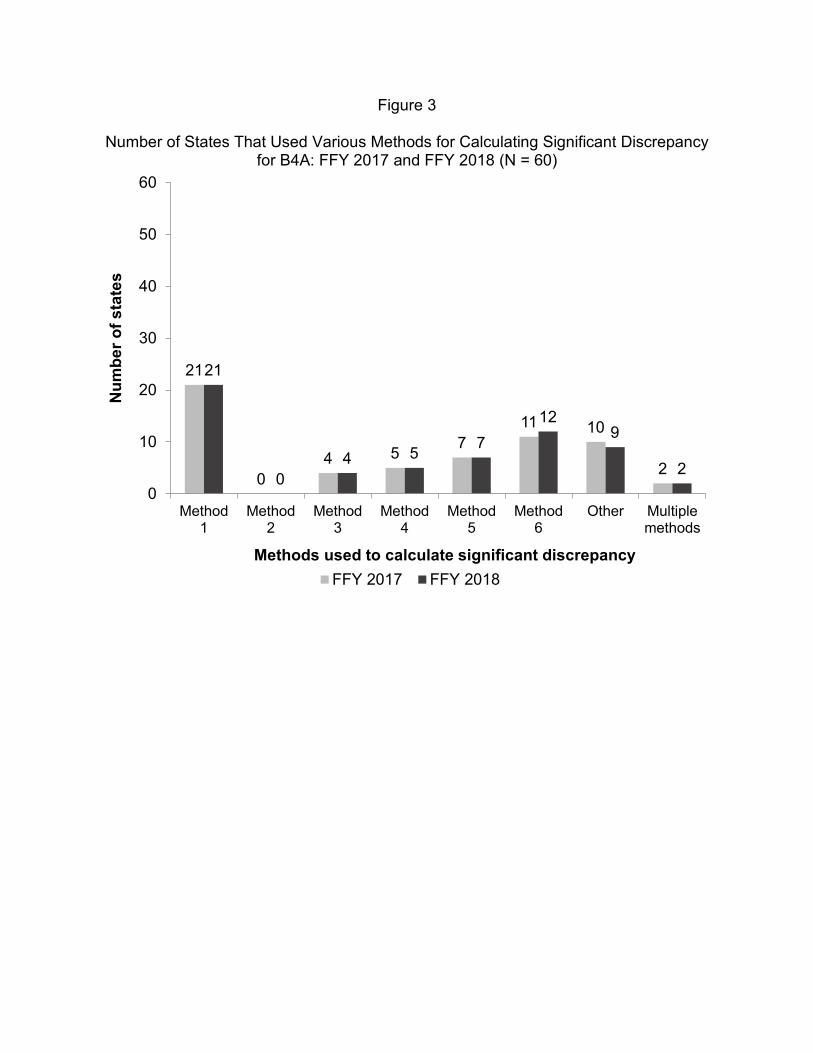
Figure 3
Number of States That Used Various Methods for Calculating Significant Discrepancy for B4A: FFY 2017 and FFY 2018 (N = 60)
21
04 5 7
11 10
2
21
04 5 7
129
20
10
20
30
40
50
60
Method1
Method2
Method3
Method4
Method5
Method6
Other Multiplemethods
Num
ber o
f sta
tes
Methods used to calculate significant discrepancyFFY 2017 FFY 2018
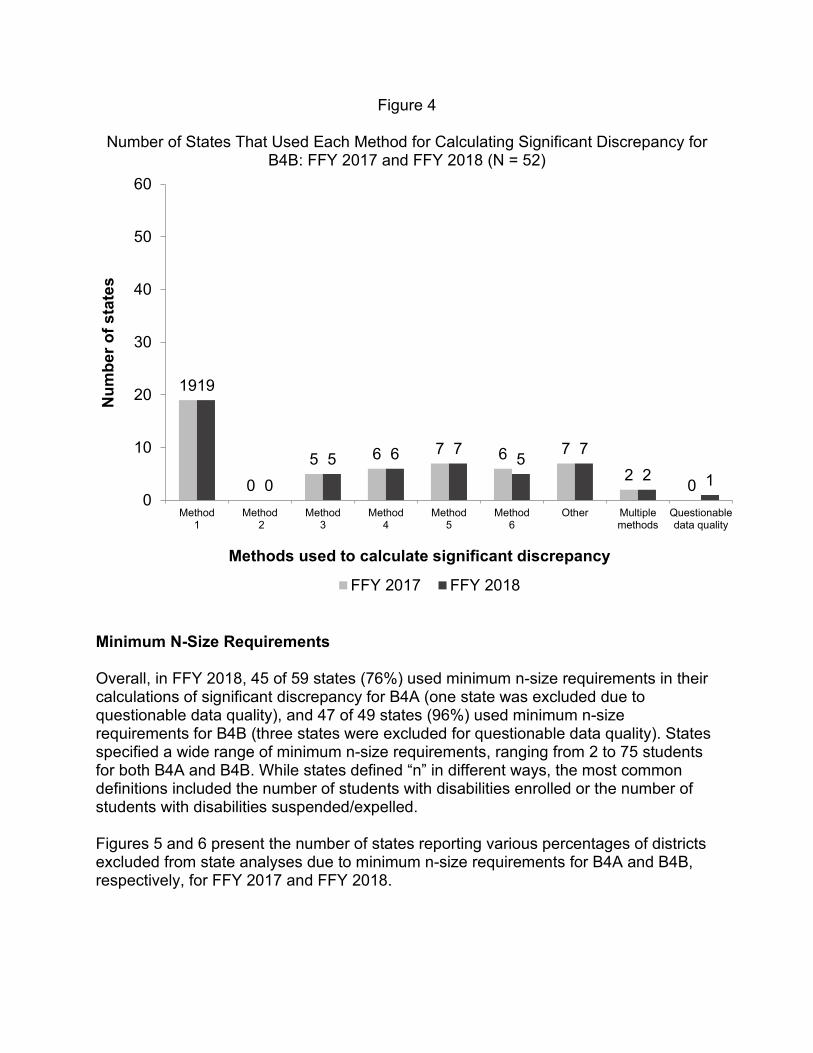
Figure 4
Number of States That Used Each Method for Calculating Significant Discrepancy for B4B: FFY 2017 and FFY 2018 (N = 52)
Minimum N-Size Requirements
Overall, in FFY 2018, 45 of 59 states (76%) used minimum n-size requirements in their calculations of significant discrepancy for B4A (one state was excluded due to questionable data quality), and 47 of 49 states (96%) used minimum n-size requirements for B4B (three states were excluded for questionable data quality). States specified a wide range of minimum n-size requirements, ranging from 2 to 75 students for both B4A and B4B. While states defined “n” in different ways, the most common definitions included the number of students with disabilities enrolled or the number of students with disabilities suspended/expelled.
Figures 5 and 6 present the number of states reporting various percentages of districts excluded from state analyses due to minimum n-size requirements for B4A and B4B, respectively, for FFY 2017 and FFY 2018.
19
05 6 7 6 7
2 0
19
05 6 7 5 7
2 10
10
20
30
40
50
60
Method1
Method 2
Method3
Method4
Method5
Method6
Other Multiplemethods
Questionabledata quality
Num
ber o
f sta
tes
Methods used to calculate significant discrepancy
FFY 2017 FFY 2018
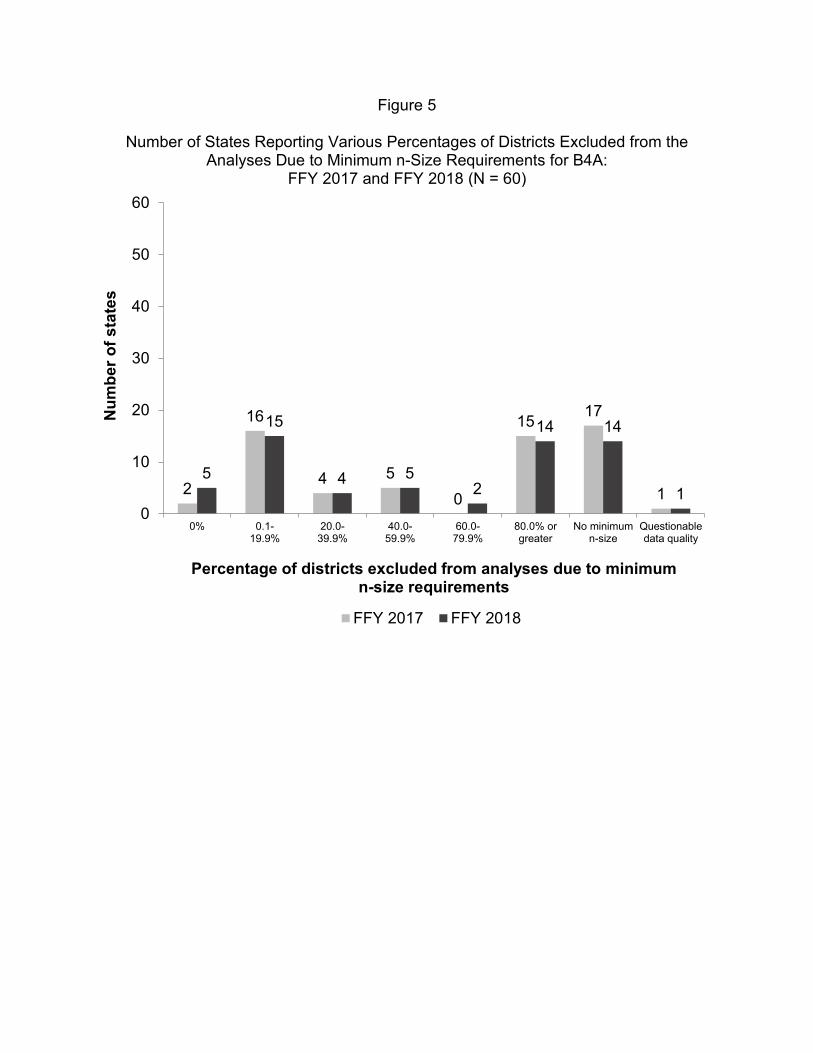
Figure 5
Number of States Reporting Various Percentages of Districts Excluded from the Analyses Due to Minimum n-Size Requirements for B4A:
FFY 2017 and FFY 2018 (N = 60)
2
16
4 50
15 17
15
15
4 52
14 14
10
10
20
30
40
50
60
0% 0.1-19.9%
20.0-39.9%
40.0-59.9%
60.0-79.9%
80.0% orgreater
No minimumn-size
Questionabledata quality
Num
ber o
f sta
tes
Percentage of districts excluded from analyses due to minimum n-size requirements
FFY 2017 FFY 2018
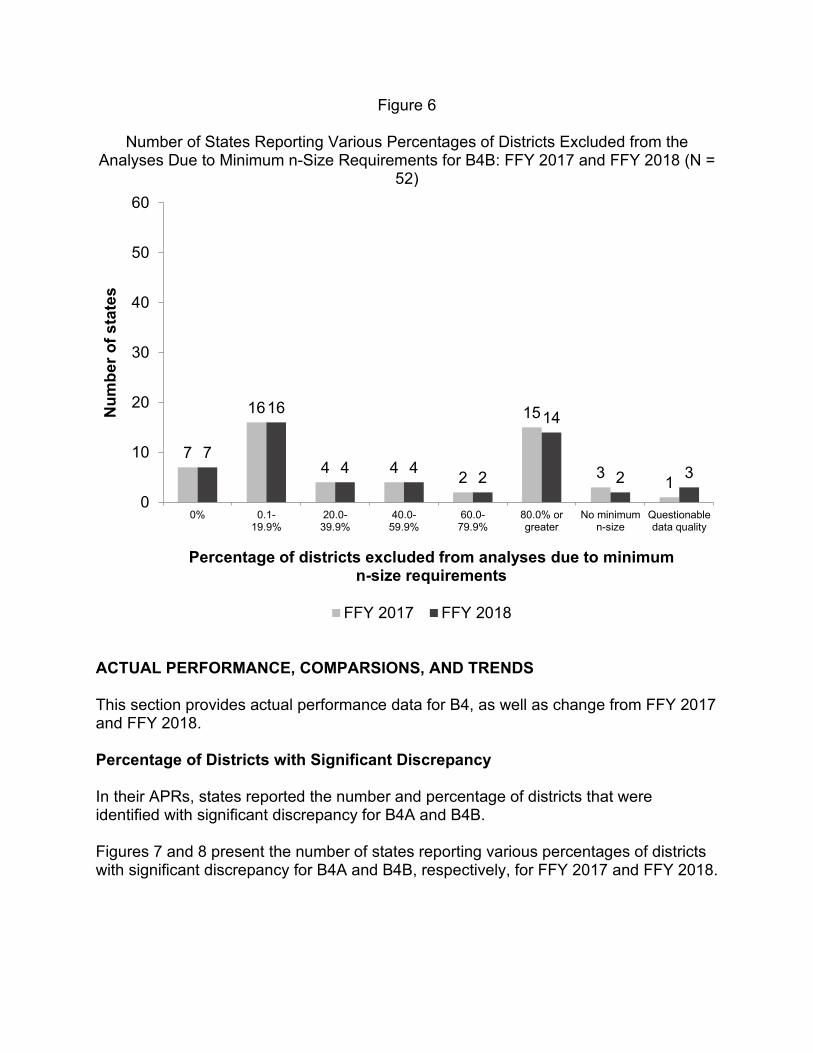
Figure 6
Number of States Reporting Various Percentages of Districts Excluded from the Analyses Due to Minimum n-Size Requirements for B4B: FFY 2017 and FFY 2018 (N =
52)
ACTUAL PERFORMANCE, COMPARSIONS, AND TRENDS
This section provides actual performance data for B4, as well as change from FFY 2017 and FFY 2018.
Percentage of Districts with Significant Discrepancy
In their APRs, states reported the number and percentage of districts that were identified with significant discrepancy for B4A and B4B.
Figures 7 and 8 present the number of states reporting various percentages of districts with significant discrepancy for B4A and B4B, respectively, for FFY 2017 and FFY 2018.
7
16
4 4 2
15
3 1
7
16
4 4 2
14
2 3
0
10
20
30
40
50
60
0% 0.1-19.9%
20.0-39.9%
40.0-59.9%
60.0-79.9%
80.0% orgreater
No minimumn-size
Questionabledata quality
Num
ber o
f sta
tes
Percentage of districts excluded from analyses due to minimum n-size requirements
FFY 2017 FFY 2018
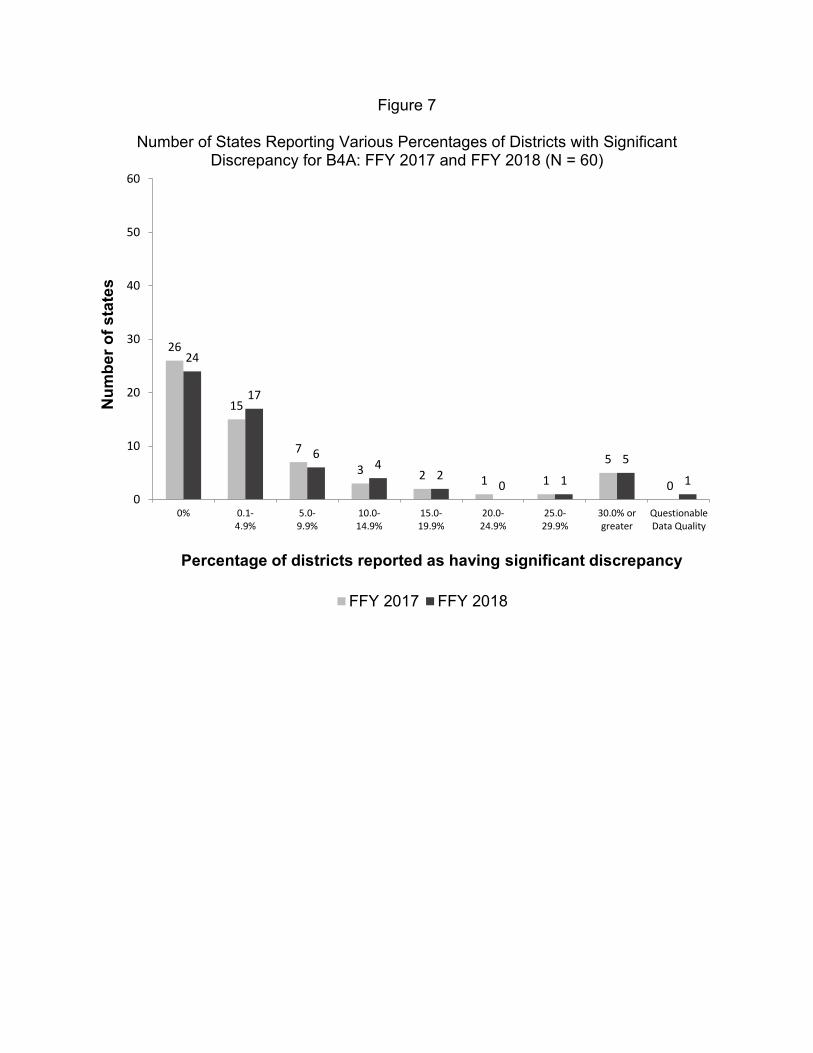
Figure 7
Number of States Reporting Various Percentages of Districts with Significant Discrepancy for B4A: FFY 2017 and FFY 2018 (N = 60)
26
15
7
3 2 1 1
5
0
24
17
64
20 1
5
10
10
20
30
40
50
60
0% 0.1-4.9%
5.0-9.9%
10.0-14.9%
15.0-19.9%
20.0-24.9%
25.0-29.9%
30.0% orgreater
QuestionableData Quality
Num
ber o
f sta
tes
Percentage of districts reported as having significant discrepancy
FFY 2017 FFY 2018
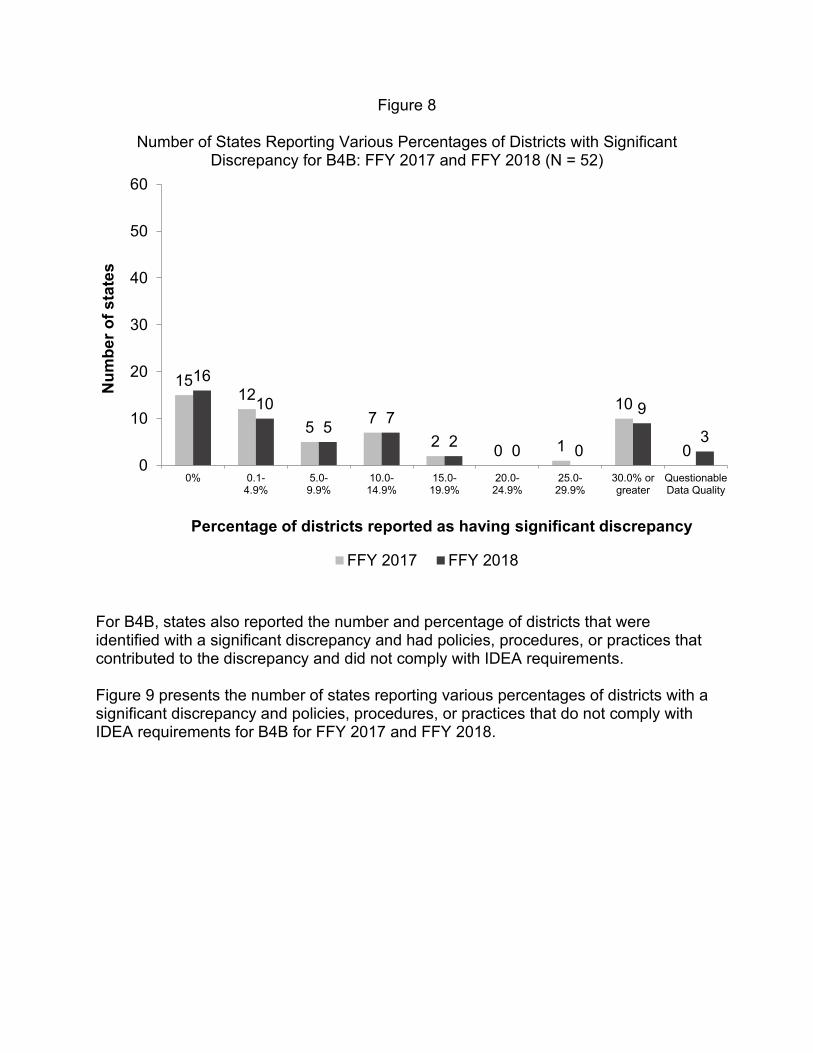
Figure 8
Number of States Reporting Various Percentages of Districts with Significant Discrepancy for B4B: FFY 2017 and FFY 2018 (N = 52)
For B4B, states also reported the number and percentage of districts that were identified with a significant discrepancy and had policies, procedures, or practices that contributed to the discrepancy and did not comply with IDEA requirements.
Figure 9 presents the number of states reporting various percentages of districts with a significant discrepancy and policies, procedures, or practices that do not comply with IDEA requirements for B4B for FFY 2017 and FFY 2018.
1512
5 72 0 1
10
0
16
105 7
2 0 0
9
3
0
10
20
30
40
50
60
0% 0.1-4.9%
5.0-9.9%
10.0-14.9%
15.0-19.9%
20.0-24.9%
25.0-29.9%
30.0% orgreater
QuestionableData Quality
Num
ber o
f sta
tes
Percentage of districts reported as having significant discrepancy
FFY 2017 FFY 2018

Figure 9
Number of States Reporting Various Percentages of Districts with Significant Discrepancy and Policies, Procedures, or Practices That Do Not Comply with IDEA
Requirements for B4B: FFY 2017 and FFY 2018 (N = 52)
Description of Change from FFY 2017 to FFY 2018
B4A: An examination of change from FFY 2017 to FFY 2018 in the percentage of districts identified as having a significant discrepancy in the rate of suspensions and expulsions of greater than 10 days in a school year for children with IEPs revealed:
• Of the 60 states reporting on B4A, the number of states meeting their annual target remained the same from FFY 2017 to FFY 2018, at 39. OSEP was unable to determine whether one state met its annual target due to questionable data quality.
• Of the 59 states reporting valid and reliable data in FFY 2018, 17 states (29%) reported an increase in the percentage of districts identified as having a significant discrepancy in B4A, while 19 states (32%) reported a decrease.
33
105
1 1 0 0 2 0
35
9
2 0 1 1 0 04
0
10
20
30
40
50
60
0% 0.1-4.9%
5.0-9.9%
10.0-14.9%
15.0-19.9%
20.0-24.9%
25.0-29.9%
30.0% orgreater
QuestionableData Quality
Num
ber o
f sta
tes
Percentage of districts reported as having significant discrepancy and non-compliant policies, procedures, and practices
FFY 2017 FFY 2018
B4B: An examination of change from FFY 2017 to FFY 2018 in the percentage of districts identified as having a significant discrepancy, by race or ethnicity, in the rate of suspensions and expulsions of greater than 10 days in a school year for children with IEPs and policies, procedures, or practices that contribute to the significant discrepancy revealed:
• Of the 52 states reporting on B4B, the number of states meeting the annual target of zero percent increased slightly from 33 in FFY 2017 to 35 in FFY 2018 for B4B. OSEP was unable to determine whether four states met their annual target due to questionable data quality.
• Of the 48 state reporting valid and reliable data, four states (8%) reported an increase in the percentage of districts identified as having a significant discrepancy and policies, procedures, and practices that contributed to the significant discrepancy in B4B, while 14 states (29%) reported a decrease.
CONCLUSION
• In both FFY 2017 and FFY 2018, most states used Comparison Option 1 for B4A and B4B, meaning they compared suspension/expulsion rates for children with disabilities among districts. From FFY 2017 to FFY 2018, only one state changed the comparison option it used to measure B4A. Two states changed the comparison option used to measure B4B, and the measure used by one state was unclear due to questionable data quality.
• In both FFY 2017 and FFY 2018, Method 1 (i.e., using the state-level suspension/expulsion rate to set the bar) continued to be the most used methodology for determining significant discrepancy for both B4A and B4B. In FFY 2017 and FFY 2018, 21 states used Method 1 for B4A. In FFY 2017 and FFY 2018, 19 states used Method 1 for B4B.
• For B4A, in FFY 2017, 20 states excluded 40 percent or more of their districts from analyses. This number increased slightly in FFY 2018 to 21 states. For B4B, in FFY 2017, 21 states excluded 40 percent or more of their districts from analyses. This number decreased slightly in FFY 2018 to 20 states.
• From FFY 2017 to FFY 2018, the number of states reporting that they did not identify any districts as having significant discrepancy for B4A decreased slightly from 26 to 24 states. From FFY 2017 to FFY 2018, the number of states reporting that they did not identify any districts as having significant discrepancy for B4B increased slightly from 15 to 16 states.
• The number of states reporting that they identified 30% or more of their districts as having significant discrepancy for B4A remained constant at five states in FFY 2017 and FFY 2018. The number of states reporting that they identified 30% or
more of their districts as having significant discrepancy for B4B decreased slightly from ten states in FFY 2017 to nine states in FFY 2018.
• For B4B, the number of states reporting zero districts with significant discrepancy and policies, procedures, or practices that contributed to the discrepancy increased slightly, from 33 states in FFY 2017 to 35 states FFY 2018.
INDICATOR B5: ENVIRONMENTS A, B, AND C: PERCENT OF CHILDREN WITH IEPS AGED 6 THROUGH 21 Completed by the National Center for Systemic Improvement
INTRODUCTION This report presents a review of state improvement activities from the Annual Performance Reports (APR) of 50 states and 10 other administrative units including the District of Columbia, the Bureau of Indian Education, and eight territories. Each of these states, territories, the District of Columbia, and the Bureau of Indian Education will be referred to as ‘states’ throughout this document. Indicator 5 data are composed of three components outlined in the table below.
Table 1: Indicator 5, Part B: Percent of children with IEPs aged 6 through 21 A. Inside the regular classroom 80% or more of the day; B. Inside the regular classroom less than 40% of the day; C. In separate schools, residential facilities, or homebound/hospital placements
After an overview of the data from all 60 reporting states, an analysis is presented. The overview of the data includes tables summarizing findings of components A, B, and C of Part B Indicator 5. A conclusion with recommendations is included in this report as well.
DATA SOURCES AND MEASUREMENT APPROACHES
All 60 states (50 U.S. states and 10 U.S. administrative units) send annual performance reports to the Office of Special Education Programs (OSEP), as required by IDEA. These data are compiled and organized into data tables that are then analyzed by external evaluators who adhere to specific guidelines provided by OSEP. Once these reports are received, OSEP personnel review the data, analysis, and any inferences drawn from the data for accuracy. This report covers only those data that were submitted to demonstrate state performance on Indicator 5 for Part B.
OVERVIEW OF ACTUAL PERFORMANCE
An analysis of performance data since the FFY 2013 reporting year on the three components of Indicator 5, Part B demonstrates slight progress. As indicated in the three figures throughout this report, the differences in means are less than one percentage point in each indicator per year across all six years. Progress is measured as the difference from baseline data reported for FFY 2013 and the data reported for the current reporting year. The average rate of change over the six reporting years is also calculated. Finally, the change in mean from the current reporting year and prior reporting year is presented. As a reminder, B5B and B5C include the number of students placed outside the general education setting for most of the school day and in separate schools, residential facilities, or homebound/hospital placements. Therefore, in
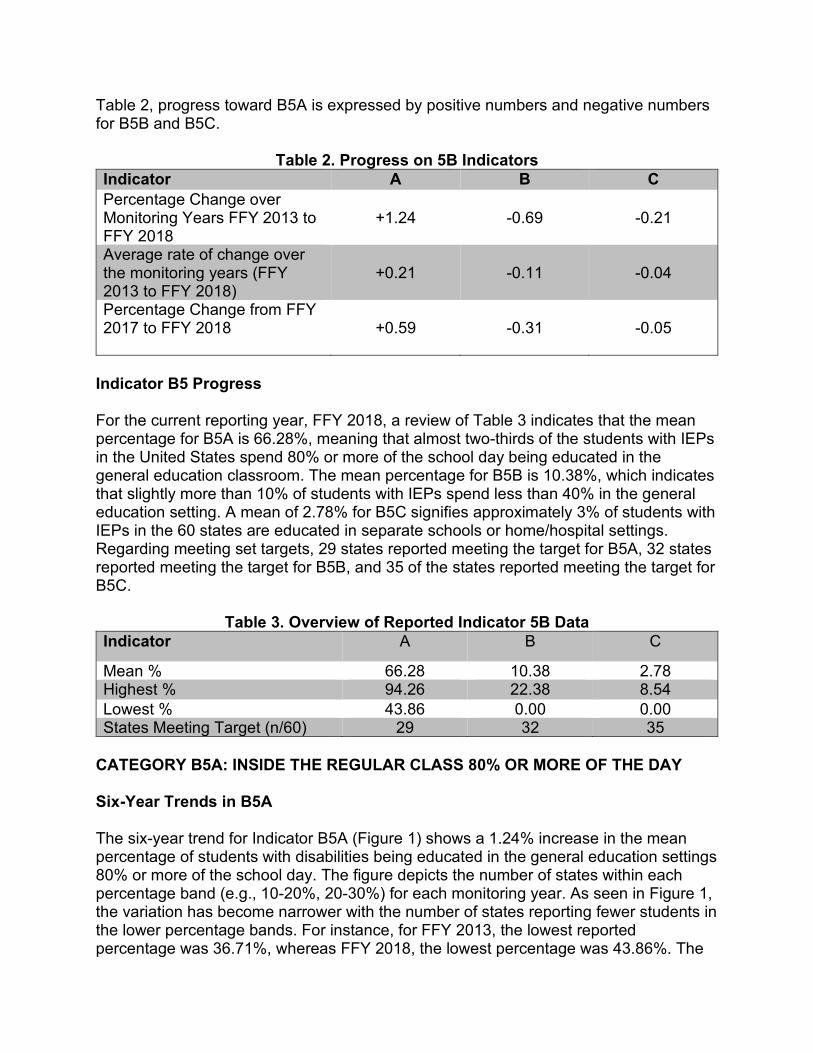
Table 2, progress toward B5A is expressed by positive numbers and negative numbers for B5B and B5C.
Table 2. Progress on 5B Indicators Indicator A B C Percentage Change over Monitoring Years FFY 2013 to FFY 2018
+1.24 -0.69 -0.21
Average rate of change over the monitoring years (FFY 2013 to FFY 2018)
+0.21 -0.11 -0.04
Percentage Change from FFY 2017 to FFY 2018 +0.59 -0.31 -0.05
Indicator B5 Progress
For the current reporting year, FFY 2018, a review of Table 3 indicates that the mean percentage for B5A is 66.28%, meaning that almost two-thirds of the students with IEPs in the United States spend 80% or more of the school day being educated in the general education classroom. The mean percentage for B5B is 10.38%, which indicates that slightly more than 10% of students with IEPs spend less than 40% in the general education setting. A mean of 2.78% for B5C signifies approximately 3% of students with IEPs in the 60 states are educated in separate schools or home/hospital settings. Regarding meeting set targets, 29 states reported meeting the target for B5A, 32 states reported meeting the target for B5B, and 35 of the states reported meeting the target for B5C.
Table 3. Overview of Reported Indicator 5B Data Indicator A B C
Mean % 66.28 10.38 2.78 Highest % 94.26 22.38 8.54 Lowest % 43.86 0.00 0.00 States Meeting Target (n/60) 29 32 35
CATEGORY B5A: INSIDE THE REGULAR CLASS 80% OR MORE OF THE DAY
Six-Year Trends in B5A
The six-year trend for Indicator B5A (Figure 1) shows a 1.24% increase in the mean percentage of students with disabilities being educated in the general education settings 80% or more of the school day. The figure depicts the number of states within each percentage band (e.g., 10-20%, 20-30%) for each monitoring year. As seen in Figure 1, the variation has become narrower with the number of states reporting fewer students in the lower percentage bands. For instance, for FFY 2013, the lowest reported percentage was 36.71%, whereas FFY 2018, the lowest percentage was 43.86%. The
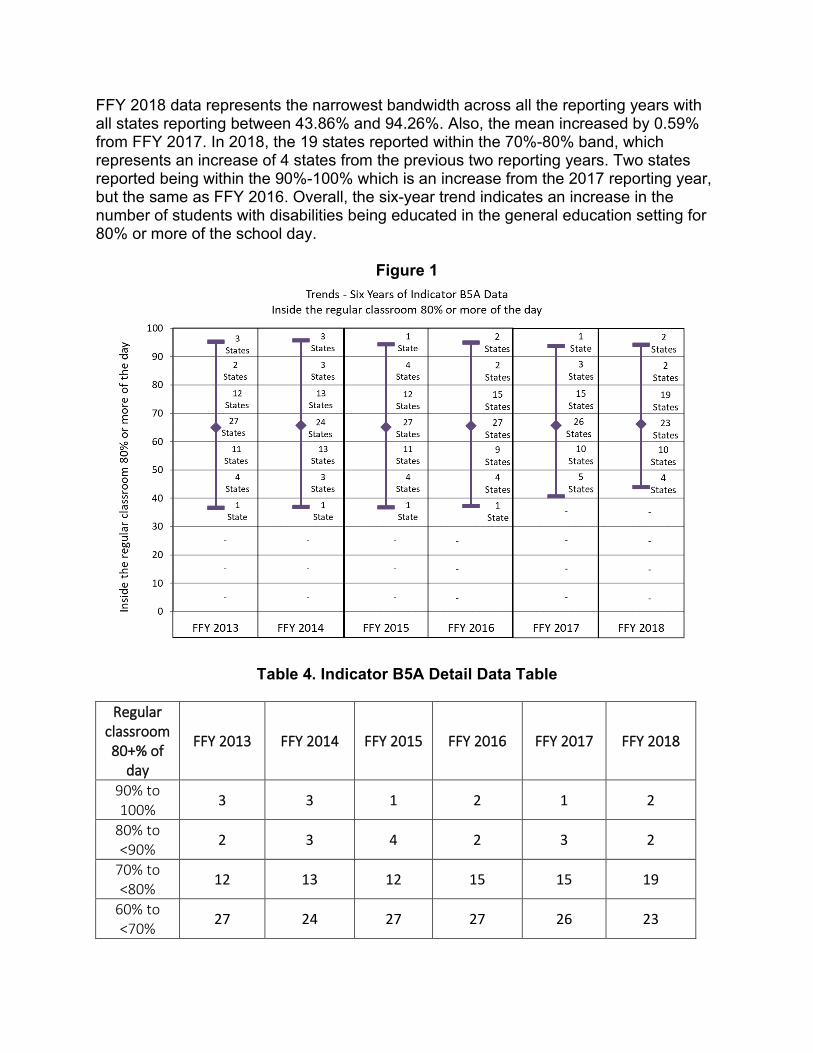
FFY 2018 data represents the narrowest bandwidth across all the reporting years with all states reporting between 43.86% and 94.26%. Also, the mean increased by 0.59% from FFY 2017. In 2018, the 19 states reported within the 70%-80% band, which represents an increase of 4 states from the previous two reporting years. Two states reported being within the 90%-100% which is an increase from the 2017 reporting year, but the same as FFY 2016. Overall, the six-year trend indicates an increase in the number of students with disabilities being educated in the general education setting for 80% or more of the school day.
Figure 1
Table 4. Indicator B5A Detail Data Table
Regular classroom 80+% of
day
FFY 2013 FFY 2014 FFY 2015 FFY 2016 FFY 2017 FFY 2018
90% to 100% 3 3 1 2 1 2
80% to <90% 2 3 4 2 3 2
70% to <80% 12 13 12 15 15 19
60% to <70% 27 24 27 27 26 23
Regular classroom 80+% of
day
FFY 2013 FFY 2014 FFY 2015 FFY 2016 FFY 2017 FFY 2018
50% to <60% 11 13 11 9 10 10
40% to <50% 4 3 4 4 5 4
30% to <40% 1 1 1 1 0 0
0% to <30% 0 0 0 0 0 0
Table 5. Indicator B5A Summary Data Table
Statistic FFY 2013 FFY 2014 FFY 2015 FFY 2016 FFY 2017 FFY 2018 Mean 65.04 65.69 65.14 65.53 65.69 66.28 Highest 95.31 95.73 94.41 95.00 93.72 94.26 Lowest 36.71 36.90 36.83 37.33 40.63 43.86 No Data 0.00 0.00 0.00 0.00 0.00 0.00
CATEGORY B5B: INSIDE THE REGULAR CLASS 40% OR LESS OF THE DAY
Six-Year Trends in B5B
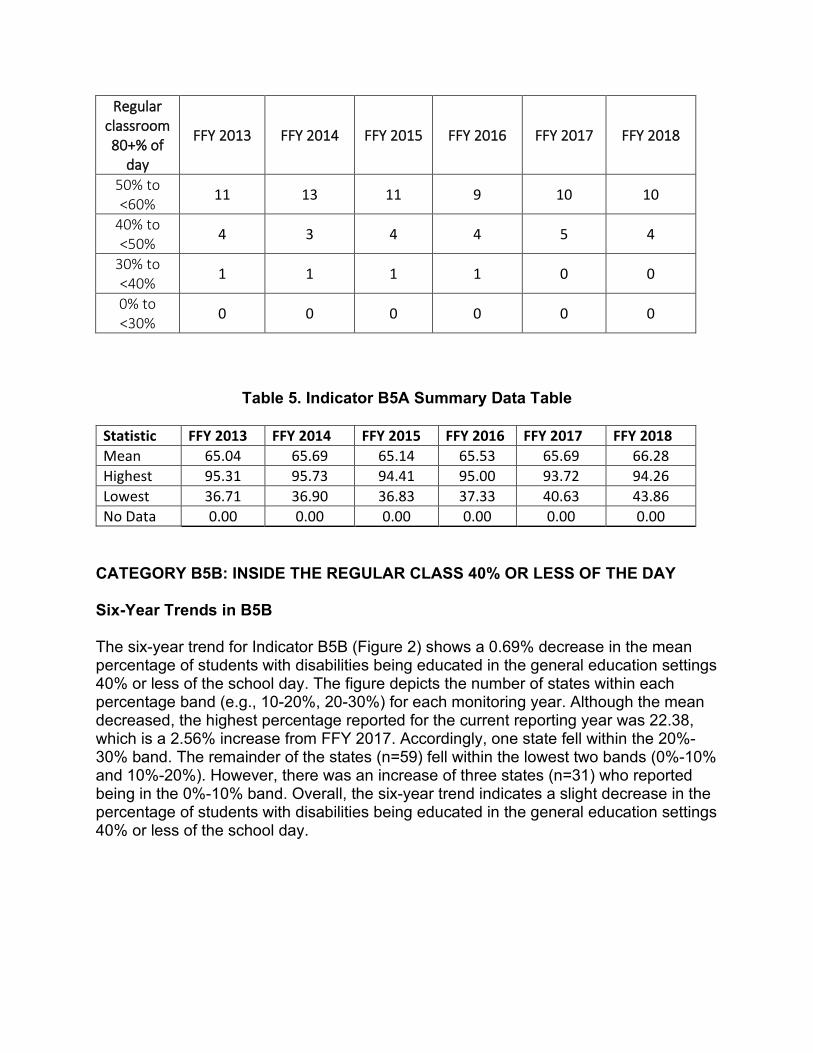
The six-year trend for Indicator B5B (Figure 2) shows a 0.69% decrease in the mean percentage of students with disabilities being educated in the general education settings 40% or less of the school day. The figure depicts the number of states within each percentage band (e.g., 10-20%, 20-30%) for each monitoring year. Although the mean decreased, the highest percentage reported for the current reporting year was 22.38, which is a 2.56% increase from FFY 2017. Accordingly, one state fell within the 20%-30% band. The remainder of the states (n=59) fell within the lowest two bands (0%-10% and 10%-20%). However, there was an increase of three states (n=31) who reported being in the 0%-10% band. Overall, the six-year trend indicates a slight decrease in the percentage of students with disabilities being educated in the general education settings 40% or less of the school day.
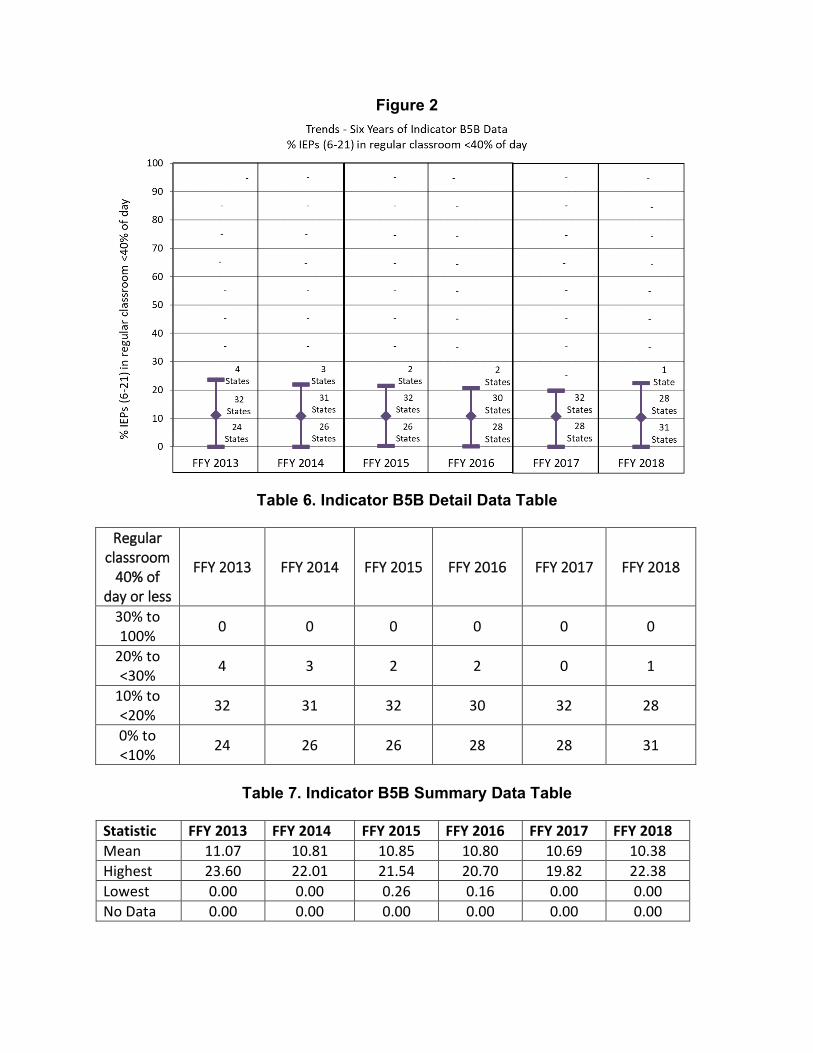
Figure 2
Table 6. Indicator B5B Detail Data Table
Regular classroom
40% of day or less
FFY 2013 FFY 2014 FFY 2015 FFY 2016 FFY 2017 FFY 2018
30% to 100% 0 0 0 0 0 0
20% to <30% 4 3 2 2 0 1
10% to <20% 32 31 32 30 32 28
0% to <10% 24 26 26 28 28 31
Table 7. Indicator B5B Summary Data Table
Statistic FFY 2013 FFY 2014 FFY 2015 FFY 2016 FFY 2017 FFY 2018 Mean 11.07 10.81 10.85 10.80 10.69 10.38 Highest 23.60 22.01 21.54 20.70 19.82 22.38 Lowest 0.00 0.00 0.26 0.16 0.00 0.00 No Data 0.00 0.00 0.00 0.00 0.00 0.00

CATEGORY B5C: SEPARATE SETTINGS
Six-Year Trends in B5C
The six-year trend data for B5C (Figure 3) shows a 0.21% decrease in the mean percentage of students with disabilities receiving services in separate school settings. The variability in placement in separate school settings has decreased over the monitoring years. The highest percentage reported for FFY 2013 was 12.40%. For the current reporting year, the highest percentage reported is 8.54%, which represents a 3.86% decrease. For reporting years FFY 2016 through 2018, all 60 states consistently reported serving 9.41% or less of students in separate settings. Overall, the six-year trend indicates a decrease in the percentage of students with disabilities placed in a separate school setting.
Figure 3
Table 8. Indicator B5C Detail Data Table
Separate School or
facility FFY 2013 FFY 2014 FFY 2015 FFY 2016 FFY 2017 FFY 2018
20% to 100% 0 0 0 0 0 0
10% to <20% 1 1 1 0 0 0
Separate School or
facility FFY 2013 FFY 2014 FFY 2015 FFY 2016 FFY 2017 FFY 2018
0% to <10% 59 59 59 60 60 60
Table 9. Indicator B5C Summary Data Table
Statistic FFY 2013 FFY 2014 FFY 2015 FFY 2016 FFY 2017 FFY 2018 Mean 2.99 2.96 2.91 2.85 2.82 2.78 Highest 12.40 11.53 10.04 9.41 9.03 8.54 Lowest 0.00 0.06 0.00 0.00 0.00 0.00 No Data 0.00 0.00 0.00 0.00 0.00 0.00
CONCLUSION
The six-year trends regarding the percent of students with IEPs who are placed in the regular class setting demonstrate some progress over the monitoring years. Data reported for B5C since FFY 2013 demonstrates the most change over the monitoring years. Very little change has occurred with indicators B5A and B5C. While examining the mean provides statistically relevant results, it is also important to consider the additional data such as the number of states in each percentage band and the trends in the highest and lowest percentages reported from year to year.
While overall progress has been made, many states continue to report not meeting set targets. While Sections 616 and 624 of IDEA require each state to include measurable and rigorous performance goals in the State Performance Plan (SPP), the data reported for Indicator 5, Part B makes it difficult to assess the appropriateness of the targets set by all 60 states. In addition, IDEA does not provide guidance regarding the definition of measurable or provide a threshold for rigorous. Absent of that data, interpretation of the existing data should be made with caution.
As indicated by the current Results Driven Accountability (RDA) federal requirements, what is missing from this analysis is the impact of placement on the academic, behavioral, and functional achievement of students with disabilities. Without such data, it is difficult to assess if all the states are adequately setting goals that address the need to change policy or practice regarding the provision of special education services in the least restrictive environment for students with disabilities. In other words, given the requirements to provide special education services in the least restrictive environment and to provide a continuum of placements, without student outcome data, it is not possible to draw conclusions that the data reported by the states for Indicator 5, Part B results in positive or negative academic, behavioral and functional outcomes for students with disabilities.
Another limitation of this analysis is the lack of data regarding the demographics of the students with disabilities represented in Indicator 5, Part B data. Information such as disability categories, age, grade, and functional levels, as well as race/ethnicity/culture and English language status would enhance the data analysis to better inform states and other stakeholders regarding the appropriateness and effectiveness of student placements. As mentioned, this data analysis does not include measures of quality (e.g. access to high-quality instruction, delivery of individualized instruction) experienced by students in different educational settings. This analysis provides an overview of reported Indicator 5, Part B as reported by all 60 states. For components B5A, B5B, and B5C, a significant percentage of states, 40% or more, cluster around the mean, indicating consistent patterns across the United States. The data across the monitoring years indicates minimal change overall; however, it is important to note that this analysis only includes Indicator 5, Part B. Per IDEA regulations, OSEP collects data on a total of 17 Part B Indicators.
INDICATOR B6: PRESCHOOL LRE Completed by the Early Childhood Technical Assistance Center (ECTA).
Indicator B6: Percent of children aged 3 through 5 with IEPs attending a:
A. Regular early childhood program and receiving the majority of special education and related services in the regular early childhood program; and
B. Separate special education class, separate school or residential facility. (20 U.S.C. 1416 (a)(3)(A))
INTRODUCTION
Indicator 6 reports on the educational environments in which preschool children are served. The Individuals with Disabilities Education Act (IDEA) specifies that in order for a state to be eligible for a grant under Part B, it must have policies and procedures ensuring that:
(i) To the maximum extent appropriate, children with disabilities, including children in public or private institutions or other care facilities, are educated with children who are nondisabled; and
(ii) Special classes, separate schooling, or other removal of children with disabilities from the regular educational environment occurs only if the nature or severity of the disability is such that education in regular classes with the use of supplementary aids and services cannot be achieved satisfactorily. (34 CFR §§300.114)
The Part B Indicator 6 analysis is based on data from the FFY 2018 Part B Annual Performance Reports (APRs) from 60 states and jurisdictions. For the purpose of this report, all states and jurisdictions are referred to collectively as “states”.
DATA SOURCES AND MEASUREMENT APPROACH
The data for this indicator are from the 618 IDEA Part B Child Count and Educational Environments data collection. This data includes all children with disabilities ages 3 through 5 who receive special education and related services according to an individual education program or services plan on the count date. States vary in their 618 data collection methods.
ACTUAL PERFORMANCE
Figures 1 and 2 illustrate current data (FFY 2018) and trend data for the last six reporting years (FFY 2013 to FFY 2018) for Indicators 6A and 6B. The number of states represented within each ten-percentage point range are shown in the figures. Tables 1 and 2 provide the detailed data and summary data associated with Indicator 6A, and Tables 3 and 4 provide the detailed and summary data associated with Indicator 6B.
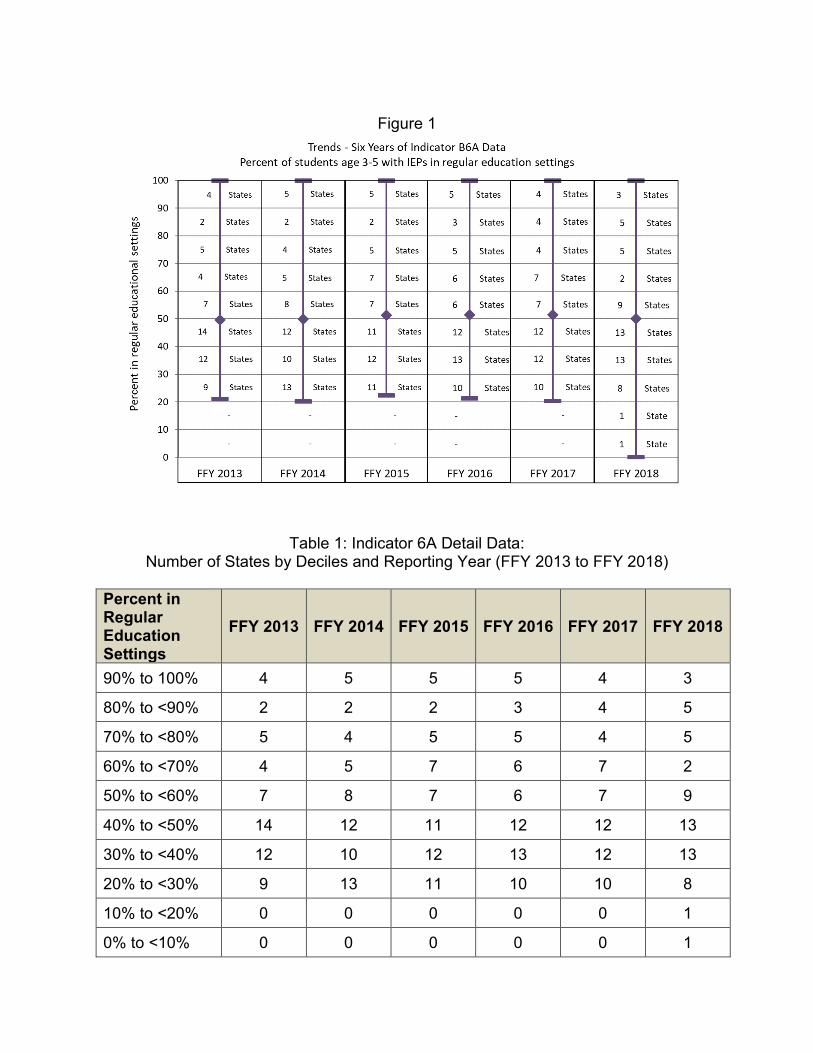
Figure 1
Table 1: Indicator 6A Detail Data: Number of States by Deciles and Reporting Year (FFY 2013 to FFY 2018)
Percent in Regular Education Settings
FFY 2013 FFY 2014 FFY 2015 FFY 2016 FFY 2017 FFY 2018
90% to 100% 4 5 5 5 4 3
80% to <90% 2 2 2 3 4 5
70% to <80% 5 4 5 5 4 5
60% to <70% 4 5 7 6 7 2
50% to <60% 7 8 7 6 7 9
40% to <50% 14 12 11 12 12 13
30% to <40% 12 10 12 13 12 13
20% to <30% 9 13 11 10 10 8
10% to <20% 0 0 0 0 0 1
0% to <10% 0 0 0 0 0 1
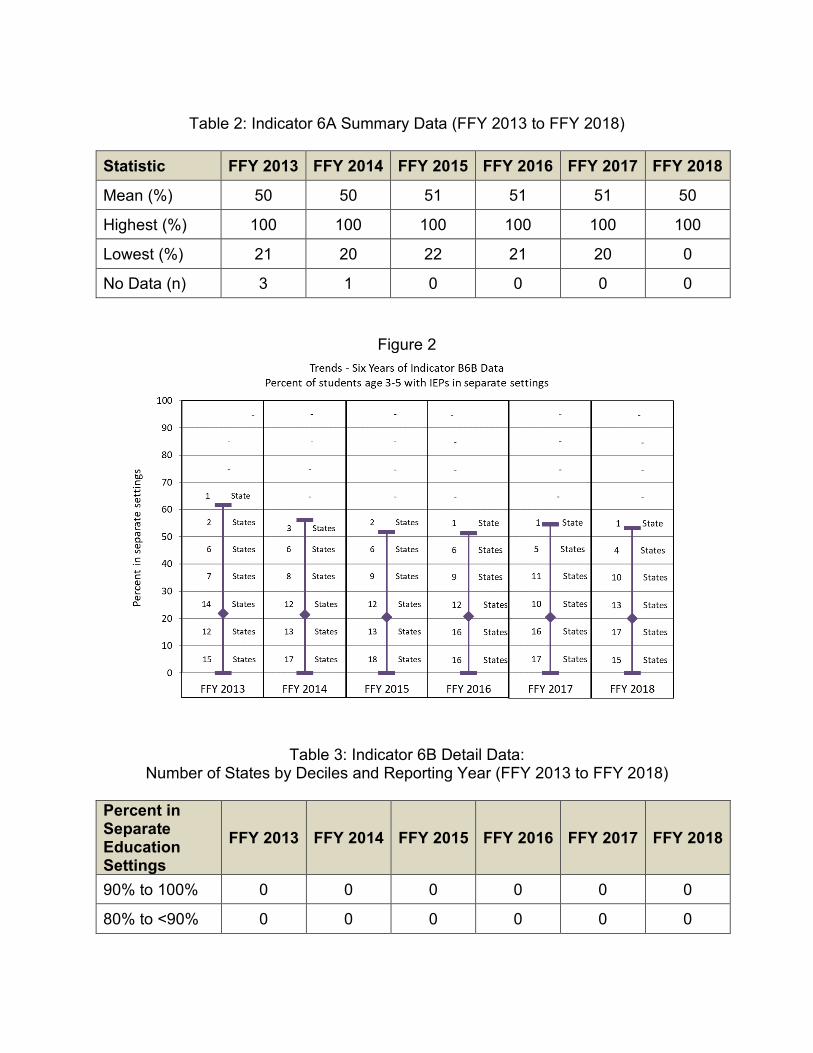
Table 2: Indicator 6A Summary Data (FFY 2013 to FFY 2018)
Statistic FFY 2013 FFY 2014 FFY 2015 FFY 2016 FFY 2017 FFY 2018
Mean (%) 50 50 51 51 51 50
Highest (%) 100 100 100 100 100 100
Lowest (%) 21 20 22 21 20 0
No Data (n) 3 1 0 0 0 0
Figure 2
Table 3: Indicator 6B Detail Data: Number of States by Deciles and Reporting Year (FFY 2013 to FFY 2018)
Percent in Separate Education Settings
FFY 2013 FFY 2014 FFY 2015 FFY 2016 FFY 2017 FFY 2018
90% to 100% 0 0 0 0 0 0
80% to <90% 0 0 0 0 0 0
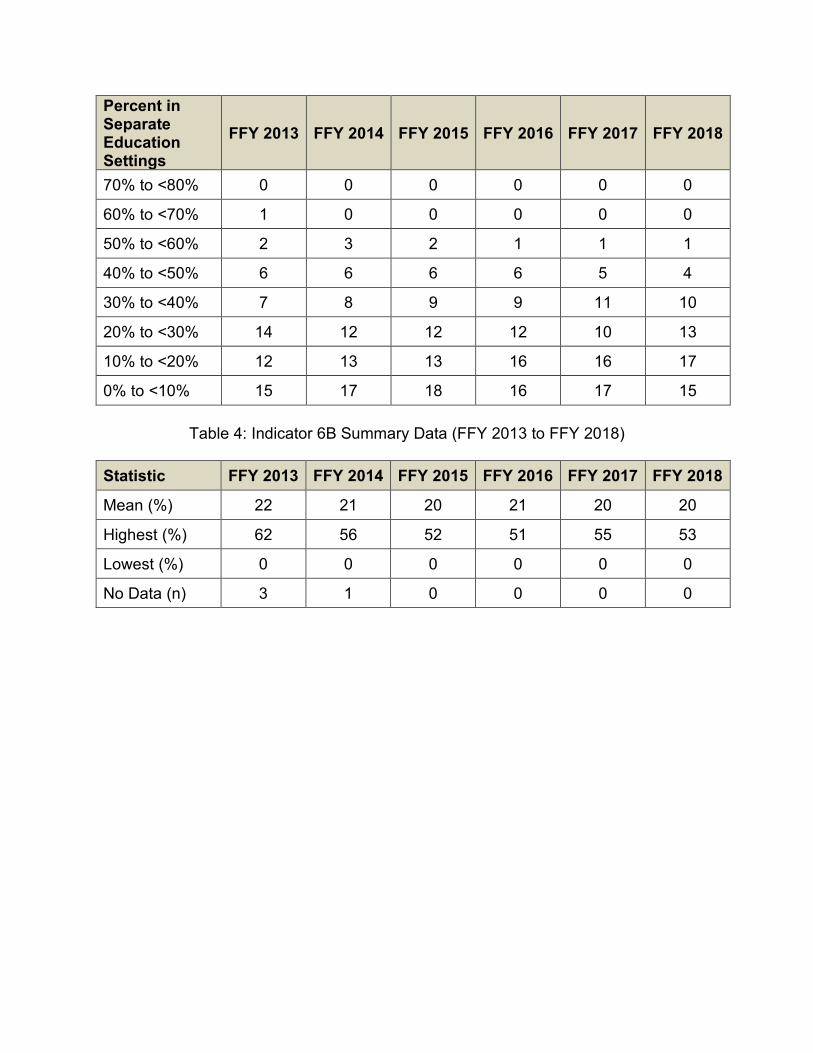
Percent in Separate Education Settings
FFY 2013 FFY 2014 FFY 2015 FFY 2016 FFY 2017 FFY 2018
70% to <80% 0 0 0 0 0 0
60% to <70% 1 0 0 0 0 0
50% to <60% 2 3 2 1 1 1
40% to <50% 6 6 6 6 5 4
30% to <40% 7 8 9 9 11 10
20% to <30% 14 12 12 12 10 13
10% to <20% 12 13 13 16 16 17
0% to <10% 15 17 18 16 17 15
Table 4: Indicator 6B Summary Data (FFY 2013 to FFY 2018)
Statistic FFY 2013 FFY 2014 FFY 2015 FFY 2016 FFY 2017 FFY 2018
Mean (%) 22 21 20 21 20 20
Highest (%) 62 56 52 51 55 53
Lowest (%) 0 0 0 0 0 0
No Data (n) 3 1 0 0 0 0
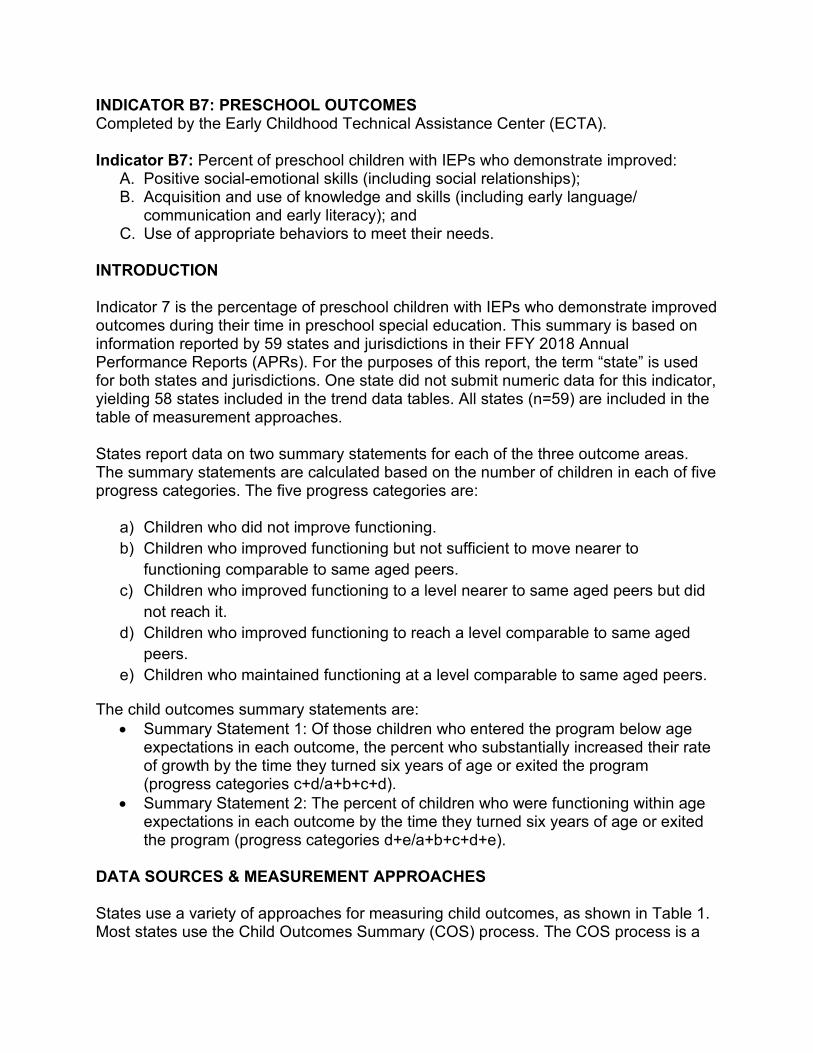
INDICATOR B7: PRESCHOOL OUTCOMES Completed by the Early Childhood Technical Assistance Center (ECTA).
Indicator B7: Percent of preschool children with IEPs who demonstrate improved: A. Positive social-emotional skills (including social relationships); B. Acquisition and use of knowledge and skills (including early language/
communication and early literacy); and C. Use of appropriate behaviors to meet their needs.
INTRODUCTION
Indicator 7 is the percentage of preschool children with IEPs who demonstrate improved outcomes during their time in preschool special education. This summary is based on information reported by 59 states and jurisdictions in their FFY 2018 Annual Performance Reports (APRs). For the purposes of this report, the term “state” is used for both states and jurisdictions. One state did not submit numeric data for this indicator, yielding 58 states included in the trend data tables. All states (n=59) are included in the table of measurement approaches.
States report data on two summary statements for each of the three outcome areas. The summary statements are calculated based on the number of children in each of five progress categories. The five progress categories are:
a) Children who did not improve functioning. b) Children who improved functioning but not sufficient to move nearer to
functioning comparable to same aged peers. c) Children who improved functioning to a level nearer to same aged peers but did
not reach it. d) Children who improved functioning to reach a level comparable to same aged
peers. e) Children who maintained functioning at a level comparable to same aged peers.
The child outcomes summary statements are: • Summary Statement 1: Of those children who entered the program below age
expectations in each outcome, the percent who substantially increased their rate of growth by the time they turned six years of age or exited the program (progress categories c+d/a+b+c+d).
• Summary Statement 2: The percent of children who were functioning within age expectations in each outcome by the time they turned six years of age or exited the program (progress categories d+e/a+b+c+d+e).
DATA SOURCES & MEASUREMENT APPROACHES
States use a variety of approaches for measuring child outcomes, as shown in Table 1. Most states use the Child Outcomes Summary (COS) process. The COS process is a

team process for summarizing information from multiple sources about a child’s functioning in each of the three outcome areas.
Table 1: Child Outcomes Measurement Approaches
Approach Count Percent COS process 40 68.0% One tool statewide 9 15.2% Publisher online system 5 8.4% Other 5 8.4% TOTAL 59 100%
PERFORMANCE TRENDS
Figures 1 and 2 illustrate current data (FFY 2018) and trend data for the last six reporting years (FFY 2013 to FFY 2018) for Summary Statements 1 and 2 for Outcome A (positive social emotional skills). Tables 2 through 5 provide the detailed data and summary data associated with Outcome A.
Figures 3 and 4 illustrate current data (FFY 2018) and trend data for the last six reporting years (FFY 2013 to FFY 2018) for Summary Statements 1 and 2 for Outcome B (knowledge and skills). Tables 6 through 9 provide the detailed data and summary data associated with Outcome B.
Figures 5 and 6 illustrate current data (FFY 2018) and trend data for the last six reporting years (FFY 2013 to FFY 2018) for Summary Statements 1 and 2 for Outcome C (appropriate behaviors to meet needs). Tables 10 through 13 provide the detailed data and summary data associated with Outcome C.
Figure 1

Table 2: Indicator B7 Outcome A (Positive Social-Emotional Skills) Summary Statement 1 Detail Data
Number of States by Reporting Year (FFY 2013 to FFY 2018)
Percent Increased Rate of Growth; Outcome A
FFY 2013 FFY 2014 FFY 2015 FFY 2016 FFY 2017 FFY 2018
90% to 100% 12 11 12 10 12 9
80% to <90% 25 21 20 22 21 23
70% to <80% 13 17 16 20 13 12
60% to <70% 4 6 7 5 9 10
50% to <60% 4 3 2 0 0 1
40% to <50% 1 1 1 2 2 2
30% to <40% 0 0 1 0 0 1
0% to <30% 0 0 0 0 0 0
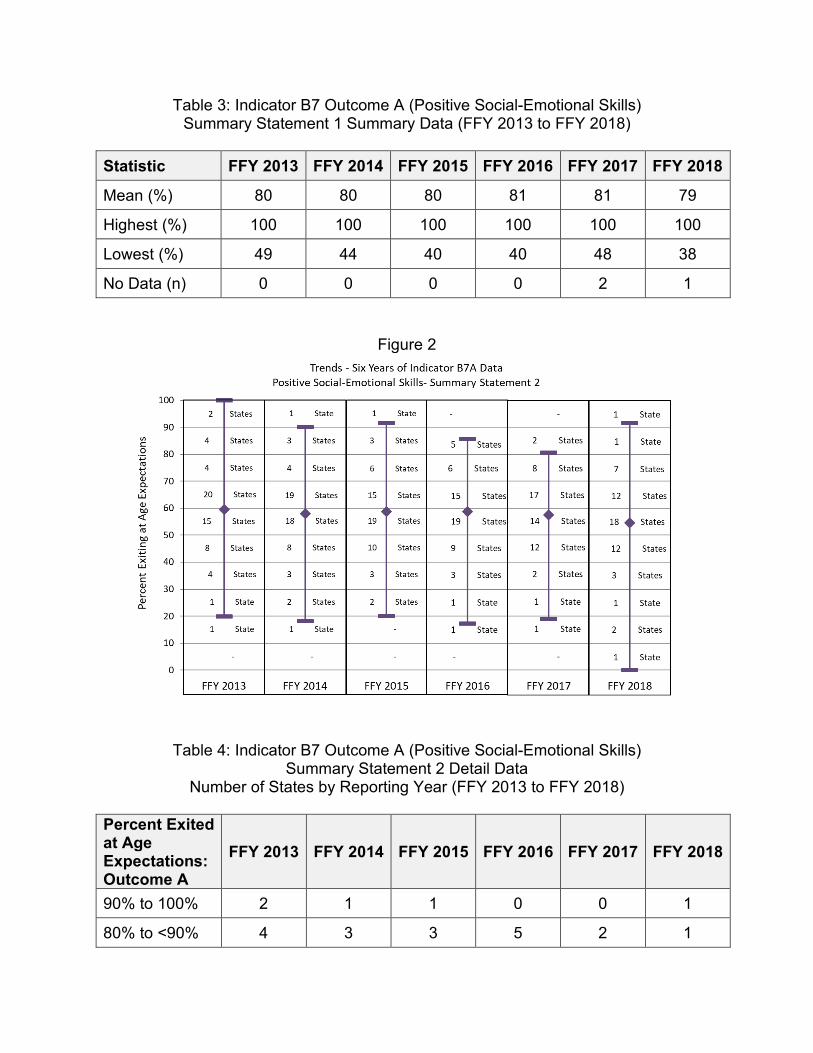
Table 3: Indicator B7 Outcome A (Positive Social-Emotional Skills) Summary Statement 1 Summary Data (FFY 2013 to FFY 2018)
Statistic FFY 2013 FFY 2014 FFY 2015 FFY 2016 FFY 2017 FFY 2018
Mean (%) 80 80 80 81 81 79
Highest (%) 100 100 100 100 100 100
Lowest (%) 49 44 40 40 48 38
No Data (n) 0 0 0 0 2 1
Figure 2
Table 4: Indicator B7 Outcome A (Positive Social-Emotional Skills) Summary Statement 2 Detail Data
Number of States by Reporting Year (FFY 2013 to FFY 2018)
Percent Exited at Age Expectations: Outcome A
FFY 2013 FFY 2014 FFY 2015 FFY 2016 FFY 2017 FFY 2018
90% to 100% 2 1 1 0 0 1
80% to <90% 4 3 3 5 2 1
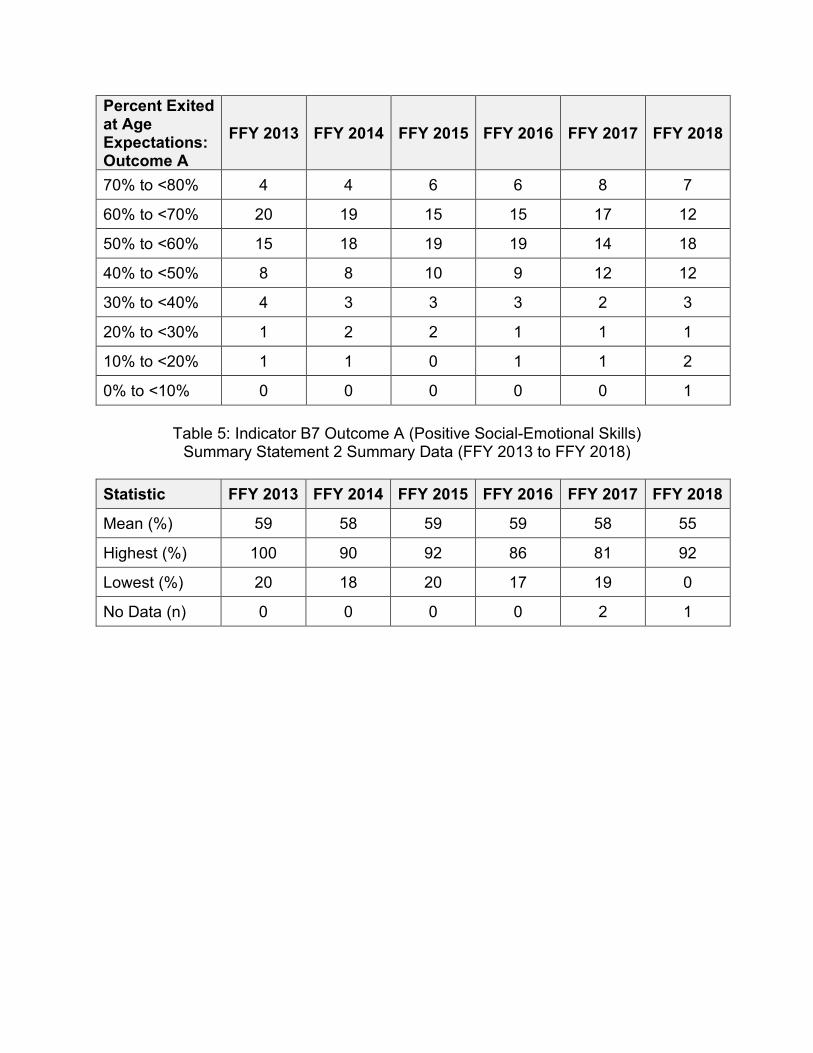
Percent Exited at Age Expectations: Outcome A
FFY 2013 FFY 2014 FFY 2015 FFY 2016 FFY 2017 FFY 2018
70% to <80% 4 4 6 6 8 7
60% to <70% 20 19 15 15 17 12
50% to <60% 15 18 19 19 14 18
40% to <50% 8 8 10 9 12 12
30% to <40% 4 3 3 3 2 3
20% to <30% 1 2 2 1 1 1
10% to <20% 1 1 0 1 1 2
0% to <10% 0 0 0 0 0 1
Table 5: Indicator B7 Outcome A (Positive Social-Emotional Skills) Summary Statement 2 Summary Data (FFY 2013 to FFY 2018)
Statistic FFY 2013 FFY 2014 FFY 2015 FFY 2016 FFY 2017 FFY 2018
Mean (%) 59 58 59 59 58 55
Highest (%) 100 90 92 86 81 92
Lowest (%) 20 18 20 17 19 0
No Data (n) 0 0 0 0 2 1
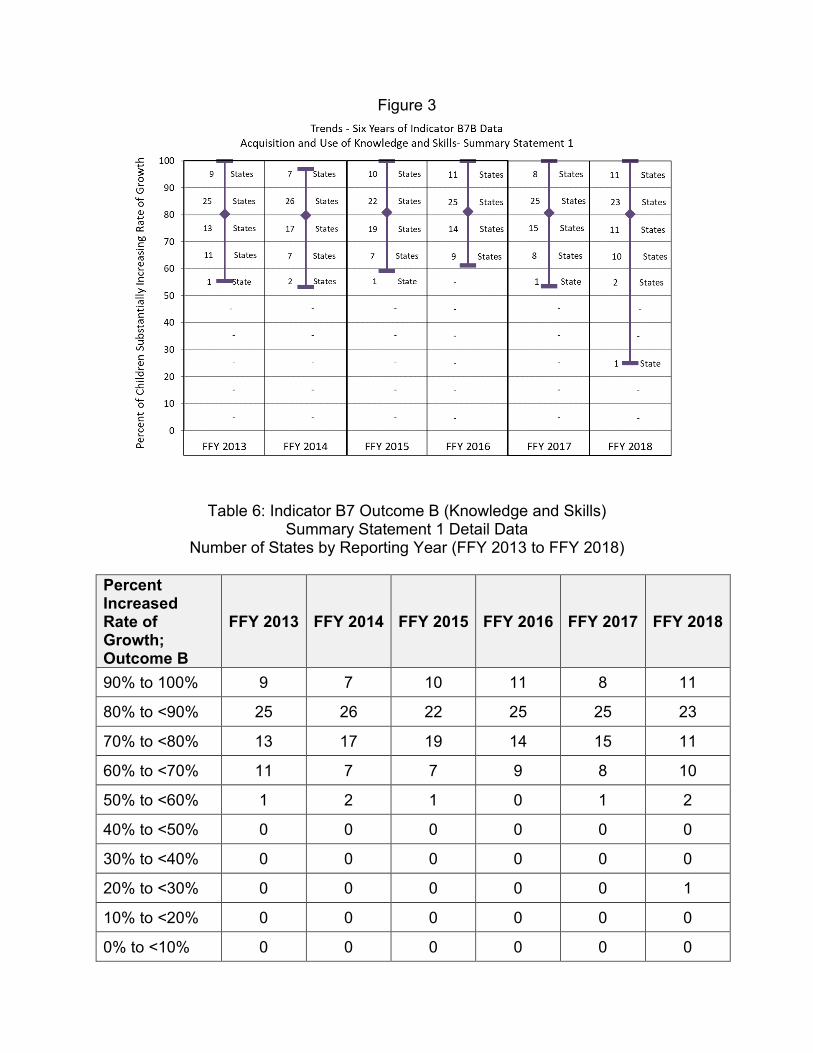
Figure 3
Table 6: Indicator B7 Outcome B (Knowledge and Skills) Summary Statement 1 Detail Data
Number of States by Reporting Year (FFY 2013 to FFY 2018)
Percent Increased Rate of Growth; Outcome B
FFY 2013 FFY 2014 FFY 2015 FFY 2016 FFY 2017 FFY 2018
90% to 100% 9 7 10 11 8 11
80% to <90% 25 26 22 25 25 23
70% to <80% 13 17 19 14 15 11
60% to <70% 11 7 7 9 8 10
50% to <60% 1 2 1 0 1 2
40% to <50% 0 0 0 0 0 0
30% to <40% 0 0 0 0 0 0
20% to <30% 0 0 0 0 0 1
10% to <20% 0 0 0 0 0 0
0% to <10% 0 0 0 0 0 0
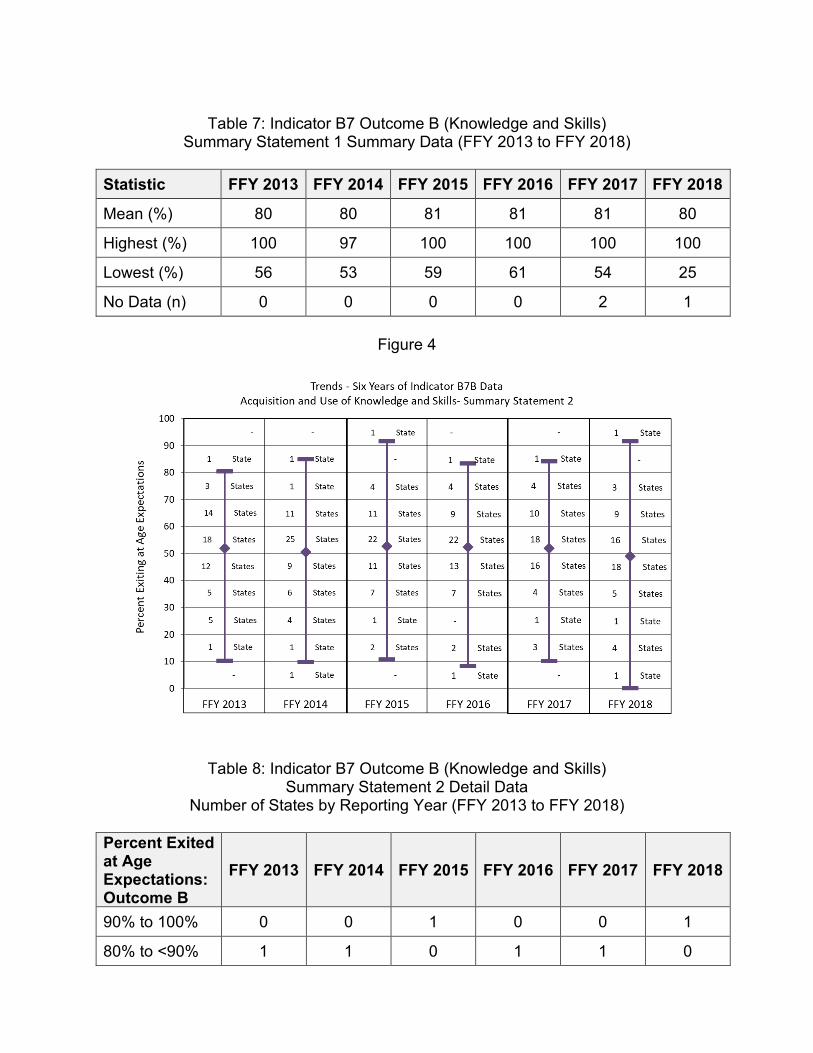
Table 7: Indicator B7 Outcome B (Knowledge and Skills) Summary Statement 1 Summary Data (FFY 2013 to FFY 2018)
Statistic FFY 2013 FFY 2014 FFY 2015 FFY 2016 FFY 2017 FFY 2018
Mean (%) 80 80 81 81 81 80
Highest (%) 100 97 100 100 100 100
Lowest (%) 56 53 59 61 54 25
No Data (n) 0 0 0 0 2 1
Figure 4
Table 8: Indicator B7 Outcome B (Knowledge and Skills) Summary Statement 2 Detail Data
Number of States by Reporting Year (FFY 2013 to FFY 2018)
Percent Exited at Age Expectations: Outcome B
FFY 2013 FFY 2014 FFY 2015 FFY 2016 FFY 2017 FFY 2018
90% to 100% 0 0 1 0 0 1
80% to <90% 1 1 0 1 1 0
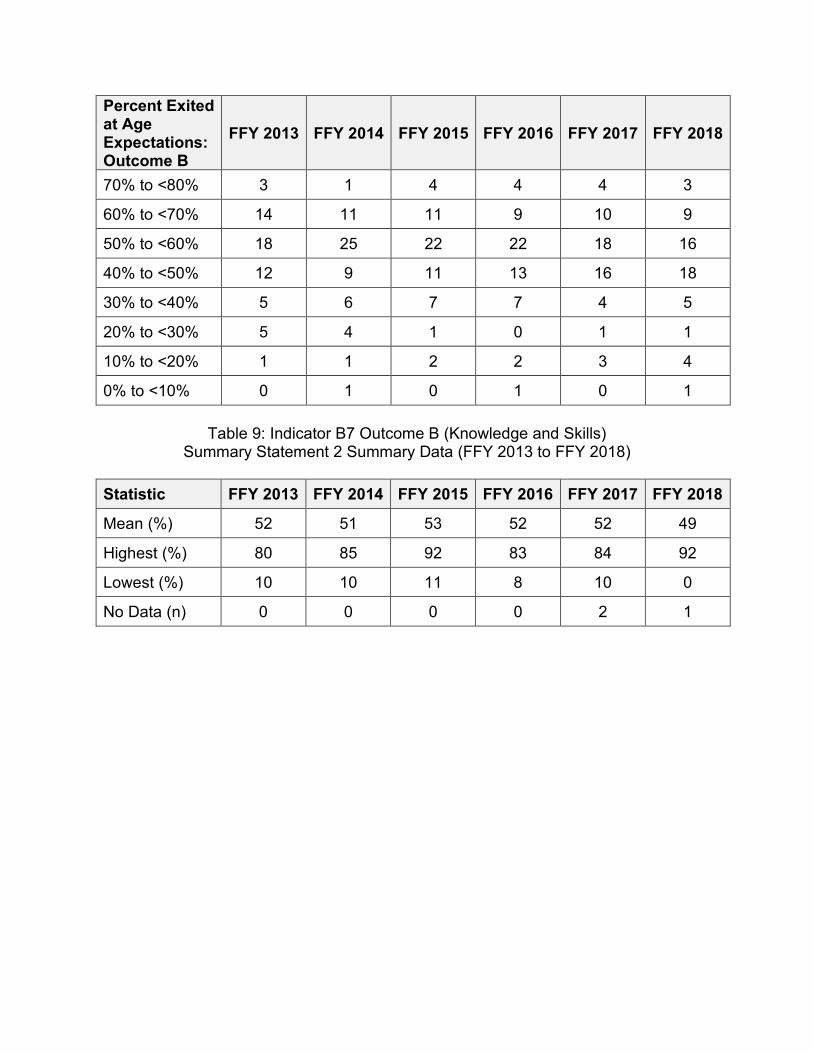
Percent Exited at Age Expectations: Outcome B
FFY 2013 FFY 2014 FFY 2015 FFY 2016 FFY 2017 FFY 2018
70% to <80% 3 1 4 4 4 3
60% to <70% 14 11 11 9 10 9
50% to <60% 18 25 22 22 18 16
40% to <50% 12 9 11 13 16 18
30% to <40% 5 6 7 7 4 5
20% to <30% 5 4 1 0 1 1
10% to <20% 1 1 2 2 3 4
0% to <10% 0 1 0 1 0 1
Table 9: Indicator B7 Outcome B (Knowledge and Skills) Summary Statement 2 Summary Data (FFY 2013 to FFY 2018)
Statistic FFY 2013 FFY 2014 FFY 2015 FFY 2016 FFY 2017 FFY 2018
Mean (%) 52 51 53 52 52 49
Highest (%) 80 85 92 83 84 92
Lowest (%) 10 10 11 8 10 0
No Data (n) 0 0 0 0 2 1

Figure 5
Table 10: Indicator B7 Outcome C (Use of Appropriate Behaviors to Meet Needs) Summary Statement 1 Detail Data
Number of States by Reporting Year (FFY 2013 to FFY 2018)
Percent Increased Rate of Growth; Outcome C
FFY 2013 FFY 2014 FFY 2015 FFY 2016 FFY 2017 FFY 2018
90% to 100% 12 11 12 13 17 11
80% to <90% 25 23 21 21 20 21
70% to <80% 9 13 13 13 10 9
60% to <70% 6 6 7 7 5 10
50% to <60% 5 3 4 3 4 5
40% to <50% 2 0 0 0 0 1
30% to <40% 0 3 2 2 1 0
20% to <30% 0 0 0 0 0 1
10% to <20% 0 0 0 0 0 0
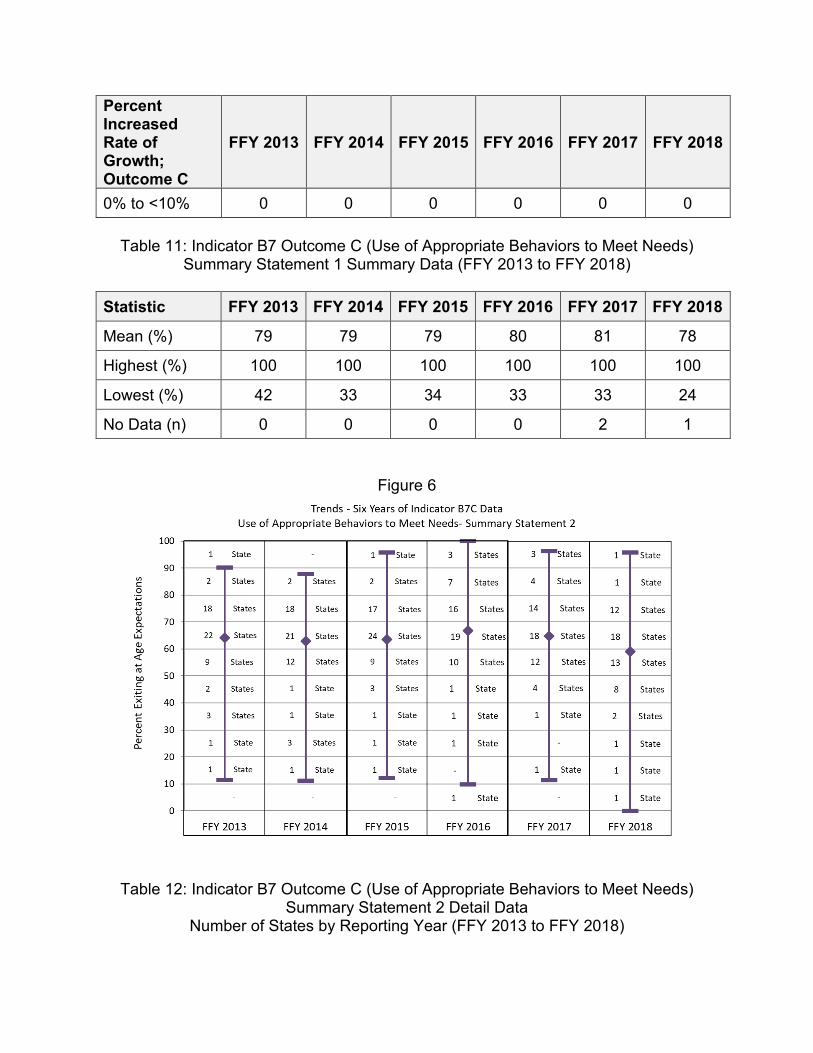
Percent Increased Rate of Growth; Outcome C
FFY 2013 FFY 2014 FFY 2015 FFY 2016 FFY 2017 FFY 2018
0% to <10% 0 0 0 0 0 0
Table 11: Indicator B7 Outcome C (Use of Appropriate Behaviors to Meet Needs) Summary Statement 1 Summary Data (FFY 2013 to FFY 2018)
Statistic FFY 2013 FFY 2014 FFY 2015 FFY 2016 FFY 2017 FFY 2018
Mean (%) 79 79 79 80 81 78
Highest (%) 100 100 100 100 100 100
Lowest (%) 42 33 34 33 33 24
No Data (n) 0 0 0 0 2 1
Figure 6
Table 12: Indicator B7 Outcome C (Use of Appropriate Behaviors to Meet Needs) Summary Statement 2 Detail Data
Number of States by Reporting Year (FFY 2013 to FFY 2018)
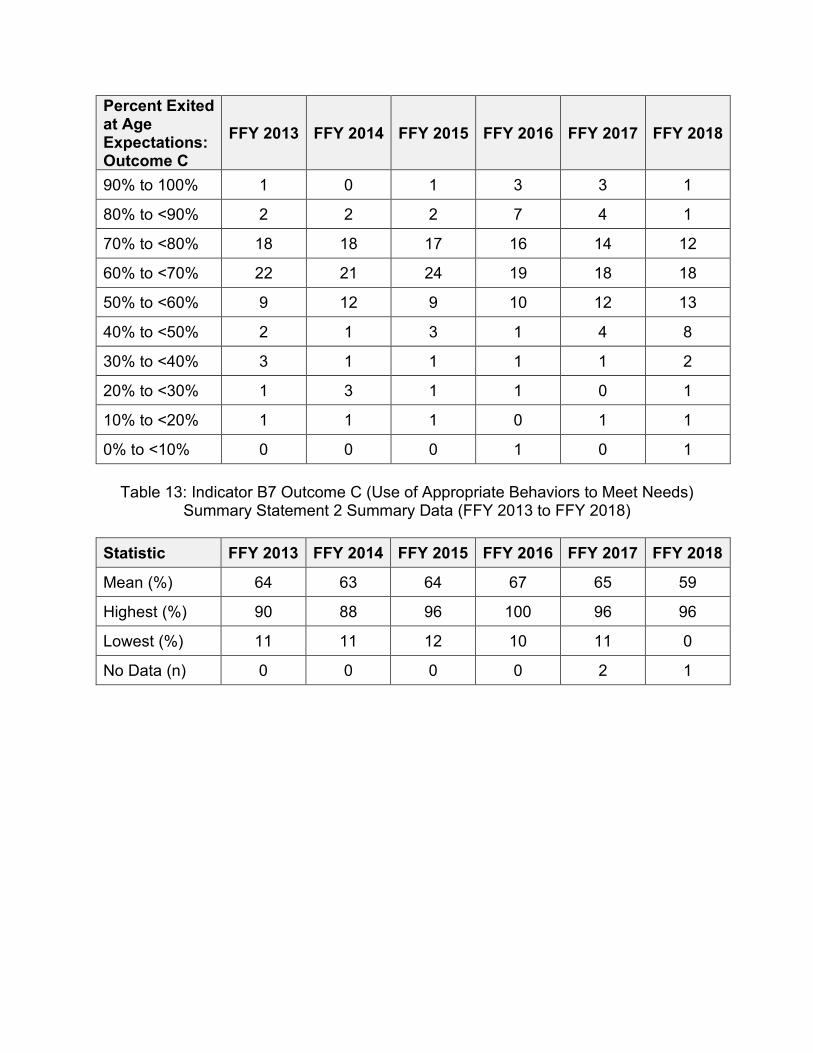
Percent Exited at Age Expectations: Outcome C
FFY 2013 FFY 2014 FFY 2015 FFY 2016 FFY 2017 FFY 2018
90% to 100% 1 0 1 3 3 1
80% to <90% 2 2 2 7 4 1
70% to <80% 18 18 17 16 14 12
60% to <70% 22 21 24 19 18 18
50% to <60% 9 12 9 10 12 13
40% to <50% 2 1 3 1 4 8
30% to <40% 3 1 1 1 1 2
20% to <30% 1 3 1 1 0 1
10% to <20% 1 1 1 0 1 1
0% to <10% 0 0 0 1 0 1
Table 13: Indicator B7 Outcome C (Use of Appropriate Behaviors to Meet Needs) Summary Statement 2 Summary Data (FFY 2013 to FFY 2018)
Statistic FFY 2013 FFY 2014 FFY 2015 FFY 2016 FFY 2017 FFY 2018
Mean (%) 64 63 64 67 65 59
Highest (%) 90 88 96 100 96 96
Lowest (%) 11 11 12 10 11 0
No Data (n) 0 0 0 0 2 1
INDICATOR B8: PARENT INVOLVEMENT Completed by the Center for Parent Information and Resources (CPIR) housed at the SPAN Parent Advocacy Network.
INTRODUCTION
Indicator 8 requires states to measure and report the “percent of parents with a child receiving special education services who report that schools facilitated parent involvement as a means of improving services and results for children with disabilities.” [20 U.S.C. 1416(a)(3)(A)]. The Center for Parent Information and Resources (CPIR) analyzed the Annual Performance Reports (APRs) submitted by 50 states, nine jurisdictions/entities, and the District of Columbia (collectively, for a total of 60 state entities). It should be noted that in some of the tables and charts presented herein, the total may equal more than 60. This higher “n” results from the addition of eight entities representing the states that reported separate performance data for parents of preschoolers (ages three to five) and parents of school-age students (6-21 years). In some sections, preschool data are discussed separately, while in other areas, the data are aggregated. Where data are aggregated, percentages are based on a total “n” of 68 and may exceed 100% due to rounding. When the actual number of states is less than 60, numbers of states are provided, not a percentage.
DATA SOURCES
This analysis is based on information on Indicator 8 from states’ FFY 2018 APRs and subsequent revisions submitted to the Office of Special Education Programs (OSEP). State Performance Plans (SPPs) with any revisions also reviewed in order to clarify and analyze APR data.
METHODOLOGY & MEASUREMENT APPROACHES
In understanding any comparisons of state performance, it is important to note that states use a variety of methodologies and measures to determine their performance on this indicator. As outlined in Chart 1 below, the state-developed survey instruments make up the majority of measures used, with 68% of states identifying these as their data collection tool during FFY 2018. The NCSEAM survey is used by 20% of states, and an additional 10% use a survey that is reported as a modification of the NCSEAM tool. One state (2%) reported that it used the ECO survey. This data represents a change in states data collection instruments from FFY2017: two states (RI and SC) went from NCSEAM to State Developed surveys, and one state (CT) went from State Developed to Modified NCSEAM. During FFY 2018 the use of state developed surveys increased as well as the use of the Modified NCSEAM. The use of NCSEAM had a small reduction. The use of the ECO survey remains the same; only one state reported its use.
The number of states that are using state-developed instruments minimizes the comparability of performance data for this indicator.
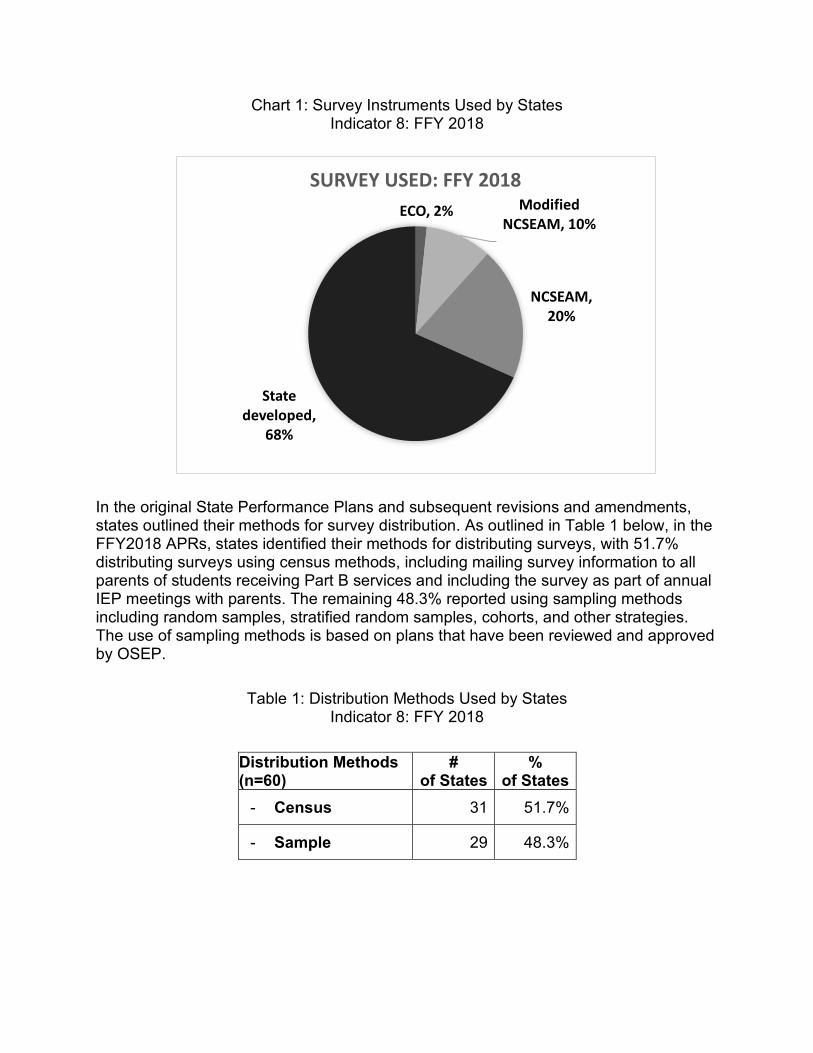
Chart 1: Survey Instruments Used by States Indicator 8: FFY 2018
In the original State Performance Plans and subsequent revisions and amendments, states outlined their methods for survey distribution. As outlined in Table 1 below, in the FFY2018 APRs, states identified their methods for distributing surveys, with 51.7% distributing surveys using census methods, including mailing survey information to all parents of students receiving Part B services and including the survey as part of annual IEP meetings with parents. The remaining 48.3% reported using sampling methods including random samples, stratified random samples, cohorts, and other strategies. The use of sampling methods is based on plans that have been reviewed and approved by OSEP.
Table 1: Distribution Methods Used by States Indicator 8: FFY 2018
Distribution Methods (n=60)
# of States
% of States
- Census 31 51.7%
- Sample 29 48.3%
ECO, 2% Modified NCSEAM, 10%
NCSEAM, 20%
State developed,
68%
SURVEY USED: FFY 2018
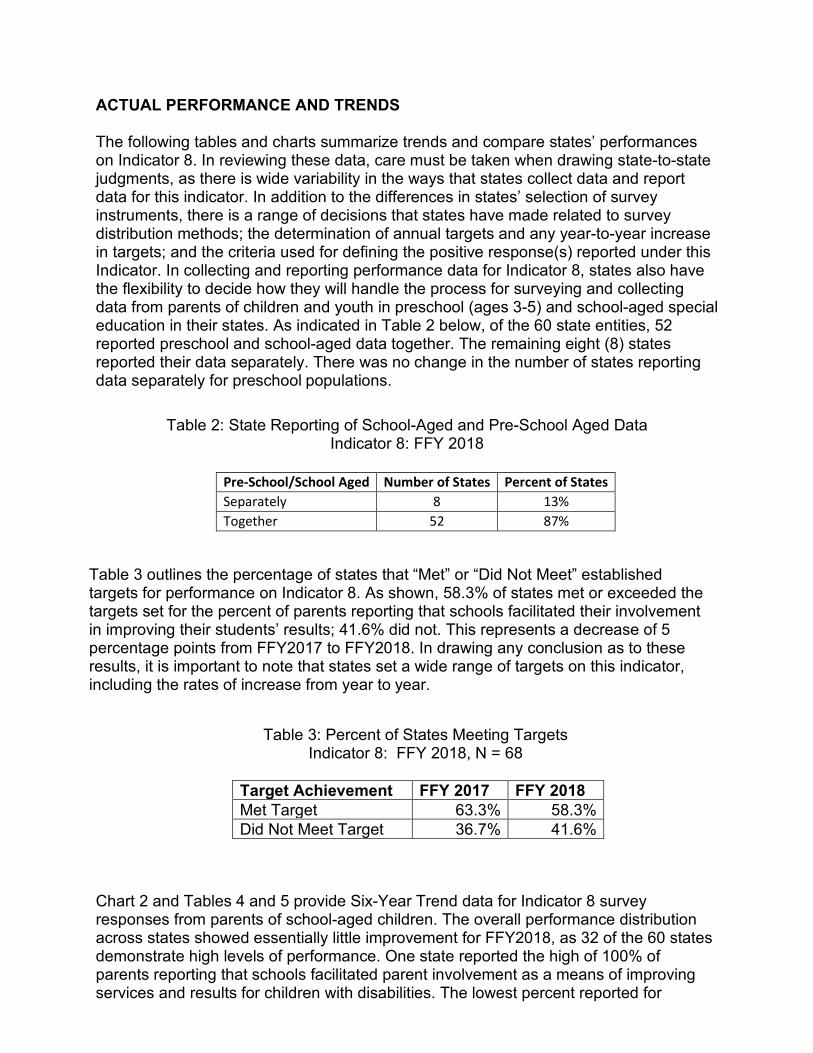
ACTUAL PERFORMANCE AND TRENDS
The following tables and charts summarize trends and compare states’ performances on Indicator 8. In reviewing these data, care must be taken when drawing state-to-state judgments, as there is wide variability in the ways that states collect data and report data for this indicator. In addition to the differences in states’ selection of survey instruments, there is a range of decisions that states have made related to survey distribution methods; the determination of annual targets and any year-to-year increase in targets; and the criteria used for defining the positive response(s) reported under this Indicator. In collecting and reporting performance data for Indicator 8, states also have the flexibility to decide how they will handle the process for surveying and collecting data from parents of children and youth in preschool (ages 3-5) and school-aged special education in their states. As indicated in Table 2 below, of the 60 state entities, 52 reported preschool and school-aged data together. The remaining eight (8) states reported their data separately. There was no change in the number of states reporting data separately for preschool populations.
Table 2: State Reporting of School-Aged and Pre-School Aged Data Indicator 8: FFY 2018
Pre-School/School Aged Number of States Percent of States Separately 8 13% Together 52 87%
Table 3 outlines the percentage of states that “Met” or “Did Not Meet” established targets for performance on Indicator 8. As shown, 58.3% of states met or exceeded the targets set for the percent of parents reporting that schools facilitated their involvement in improving their students’ results; 41.6% did not. This represents a decrease of 5 percentage points from FFY2017 to FFY2018. In drawing any conclusion as to these results, it is important to note that states set a wide range of targets on this indicator, including the rates of increase from year to year.
Table 3: Percent of States Meeting Targets Indicator 8: FFY 2018, N = 68
Target Achievement FFY 2017 FFY 2018 Met Target 63.3% 58.3% Did Not Meet Target 36.7% 41.6%
Chart 2 and Tables 4 and 5 provide Six-Year Trend data for Indicator 8 survey responses from parents of school-aged children. The overall performance distribution across states showed essentially little improvement for FFY2018, as 32 of the 60 states demonstrate high levels of performance. One state reported the high of 100% of parents reporting that schools facilitated parent involvement as a means of improving services and results for children with disabilities. The lowest percent reported for
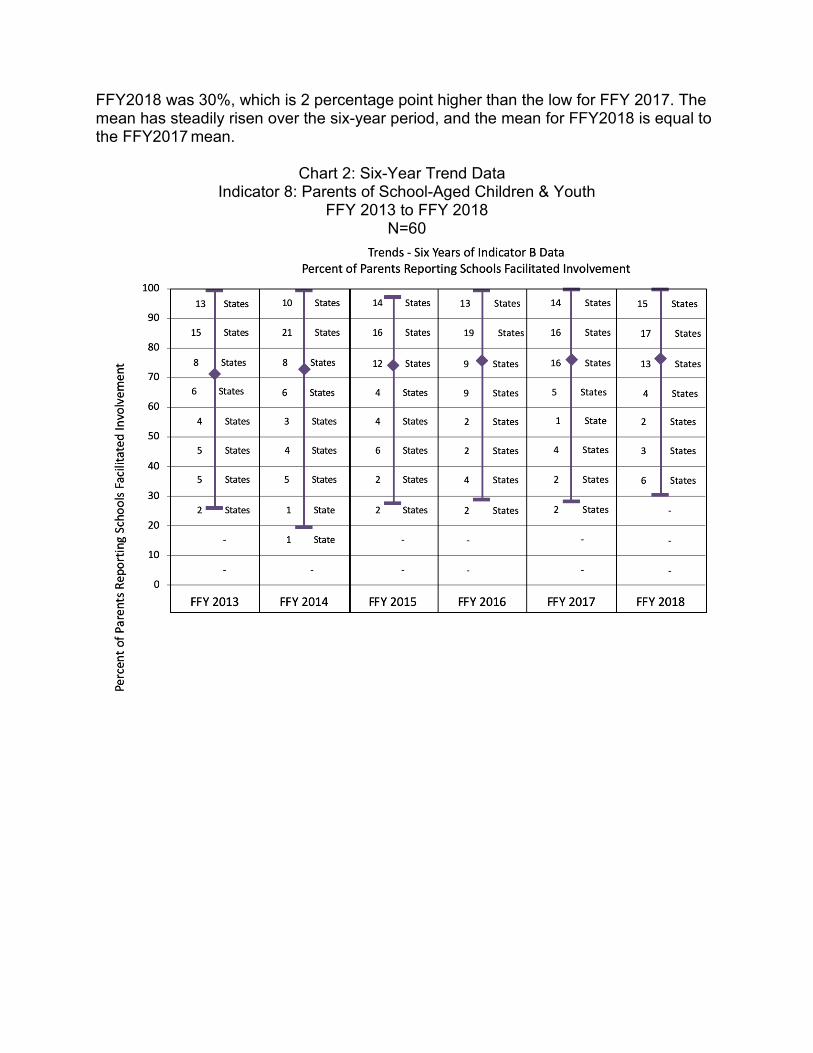
FFY2018 was 30%, which is 2 percentage point higher than the low for FFY 2017. The mean has steadily risen over the six-year period, and the mean for FFY2018 is equal to the FFY2017 mean.
Chart 2: Six-Year Trend Data
Indicator 8: Parents of School-Aged Children & Youth FFY 2013 to FFY 2018
N=60
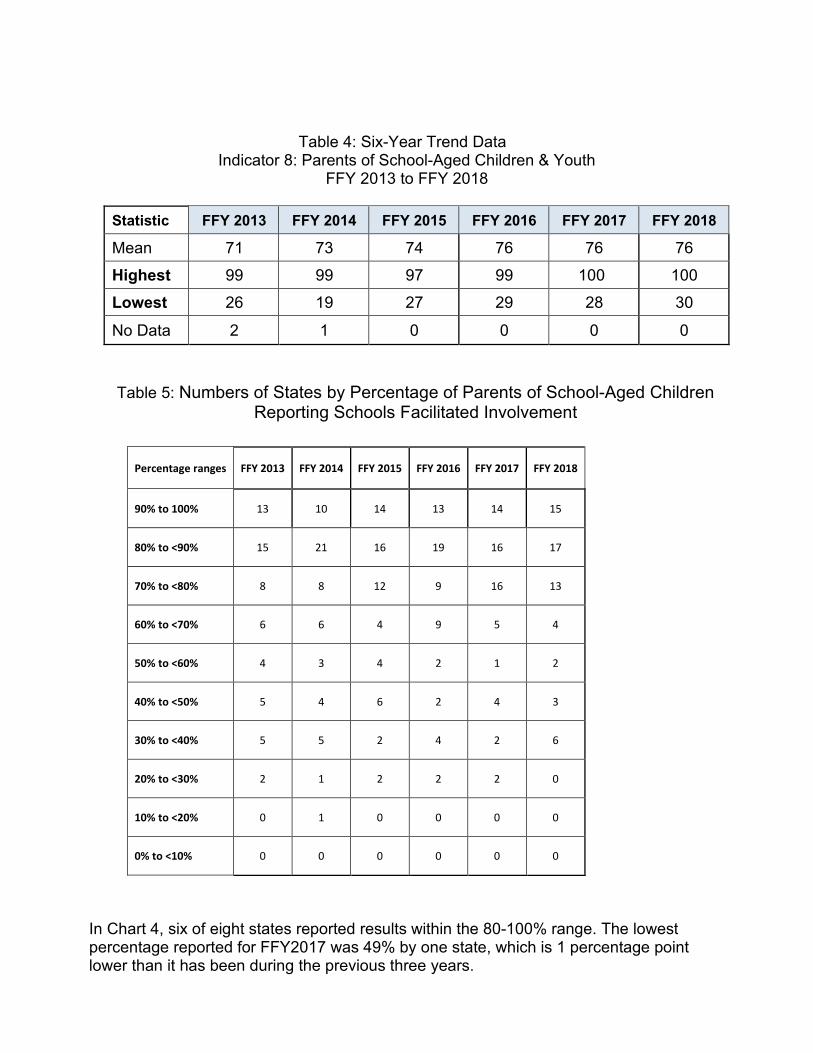
Table 4: Six-Year Trend Data Indicator 8: Parents of School-Aged Children & Youth
FFY 2013 to FFY 2018
Statistic FFY 2013 FFY 2014 FFY 2015 FFY 2016 FFY 2017 FFY 2018
Mean 71 73 74 76 76 76
Highest 99 99 97 99 100 100
Lowest 26 19 27 29 28 30
No Data 2 1 0 0 0 0
Table 5: Numbers of States by Percentage of Parents of School-Aged Children Reporting Schools Facilitated Involvement
Percentage ranges FFY 2013 FFY 2014 FFY 2015 FFY 2016 FFY 2017 FFY 2018
90% to 100% 13 10 14 13 14 15
80% to <90% 15 21 16 19 16 17
70% to <80% 8 8 12 9 16 13
60% to <70% 6 6 4 9 5 4
50% to <60% 4 3 4 2 1 2
40% to <50% 5 4 6 2 4 3
30% to <40% 5 5 2 4 2 6
20% to <30% 2 1 2 2 2 0
10% to <20% 0 1 0 0 0 0
0% to <10% 0 0 0 0 0 0
In Chart 4, six of eight states reported results within the 80-100% range. The lowest percentage reported for FFY2017 was 49% by one state, which is 1 percentage point lower than it has been during the previous three years.
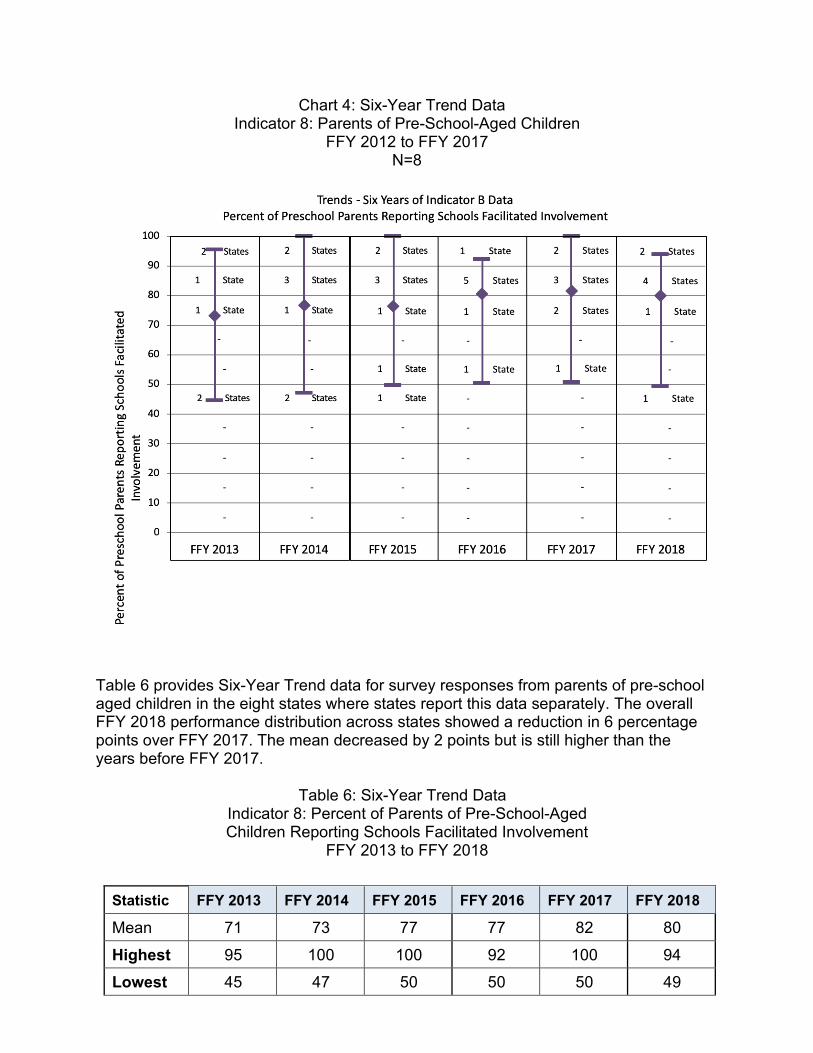
Chart 4: Six-Year Trend Data Indicator 8: Parents of Pre-School-Aged Children
FFY 2012 to FFY 2017 N=8
Table 6 provides Six-Year Trend data for survey responses from parents of pre-school aged children in the eight states where states report this data separately. The overall FFY 2018 performance distribution across states showed a reduction in 6 percentage points over FFY 2017. The mean decreased by 2 points but is still higher than the years before FFY 2017.
Table 6: Six-Year Trend Data Indicator 8: Percent of Parents of Pre-School-Aged Children Reporting Schools Facilitated Involvement
FFY 2013 to FFY 2018
Statistic FFY 2013 FFY 2014 FFY 2015 FFY 2016 FFY 2017 FFY 2018
Mean 71 73 77 77 82 80
Highest 95 100 100 92 100 94 Lowest 45 47 50 50 50 49

Table 7: Indicator 8 – Numbers of States by Percentage of Parents of Pre-School-Aged Children Reporting Schools Facilitated Involvement
Percentage FFY 2013 FFY 2014 FFY 2015 FFY 2016 FFY 2017 FFY 2018
90% to 100% 2 2 2 1 2 2
80% to <90% 1 3 3 5 3 4
70% to <80% 1 1 1 1 2 1
60% to <70% 0 0 0 0 0 0
50% to <60% 0 0 1 1 1 0
40% to <50% 2 2 1 0 0 1
0% to <40% 0 0 0 0 0 0
Responses Representative of Student Demographics
In addition to providing information on the surveys used and their data collection methods, States were also asked to provide a “Yes or “No” response to this statement: “The demographics of the parents responding are representative of the demographics of children receiving special education services.” As outlined in the Table 8 below, 53.3% of states (32) indicated that the responses received were indeed representative of student demographics.
Table 8: States Indicating Responses are Representative of Student Demographics
In FY 2018 # of States % of States No 28 46.7% Yes 32 53.3%
States used a variety of methods for determining the extent to which responses were representative. For example, some states analyzed direct comparisons between the overall demographic distributions of students receiving special education services based on gender, race, ethnicity, and disability and the demographics parent responses to the states’ survey. Other states included data on ages, and/or grade ranges in their comparisons. States conducted chi square analyses of the relation between the demographic variables of race/ethnicity categories of surveyed parents and the children receiving special education services with the significance of the relation between these variables used in determining the extent to which responses were representative. States also used a variety of standards for measuring the extent to which responses are representative of the demographics of states students receiving special education services. Where states specifically identified their standard, there was a range of a low of +/- 1 point to a high of +/-10 points difference between the percent of responses and the percent of students in a demographic group.
States indicating that they did not achieve representative responses outlined a number of strategies for improving results in FY 2019. These strategies included increasing collaborations with local education agencies to identify local contacts or liaisons for the survey, providing easily accessible on-line resources and training to support local dissemination efforts, sharing real time data on response rates and demographics of responses, and providing outreach materials for multiple messages and reminders for families to complete surveys. One state is developing improvement plans with LEAs. States indicated expanding online survey options, including increased survey completion through mobile devices, providing the survey in a variety of languages, and also oversampling of some populations as other strategies. Collaborations and partnerships with OSEP funded Parent Training and Information Centers and Community Parent Resource Centers to target outreach to under-represented populations was included as a strategy by the vast majority states.
CONCLUSION
As a result of the differences in survey instruments and also in data collection and measurement techniques, states' individual performances on Indicator 8 vary significantly. However, despite the number of states that did not meet targets, given the performance across states as measured by the changes in the mean and also in the numbers of states experiencing improvements in their data, it can be concluded that overall performance on Indicator 8 remains stable, showing modest changes or no change in all data from FFY2017 to FFY2018.
INDICATOR B9 & B10: DISPROPORTIONATE REPRESENTATION DUE TO INAPPROPRIATE IDENTIFICATION Completed by the IDEA Data Center (IDC).
INTRODUCTION
The measurements for these SPP/APR indicators are as follows:
B9. Percent of districts with disproportionate representation of racial and ethnic groups in special education and related services that is the result of inappropriate identification; and
B10. Percent of districts with disproportionate representation of racial and ethnic groups in specific disability categories that is the result of inappropriate identification.
The IDEA Data Center (IDC) reviewed the FFY 2018 APRs for the 50 states, the District of Columbia, and the Virgin Islands (52 entities). Two states did not have valid and reliable data for B9 and B10. One state did not have valid and reliable data for B9 or B10. One state is not required to report on B10. The other territories and the Bureau of Indian Education are not required to report on B9 and B10. Throughout the remainder of this section, all are referred to as states, unless otherwise noted.
DATA SOURCES
Data sources include data states submitted through the EDFacts Submission System FS002 Children with Disabilities (IDEA) School Age File and states’ analyses to determine if the disproportionate representation of racial/ethnic groups in special education and related services (B9) and in specific disability categories (B10) was the result of inappropriate identification.
METHODOLOGY & MEASUREMENT APPROACHES
This section describes the various approaches states used to calculate disproportionate representation, including whether states used a single method or multiple methods, definitions of disproportionate representation, and minimum cell and/or n-size requirements.
Methods States Used to Calculate Disproportionate Representation
Most states (45 out of the 50 states or 90%) used one method to calculate disproportionate representation (see Figure 1). All states used the same method for B9 as they used for B10. Of the 45 states using one method, 42 states (93%) used one or more forms of the risk ratio (i.e., risk ratio, alternate risk ratio, weighted risk ratio) as their sole method for calculating disproportionate representation. The other three states
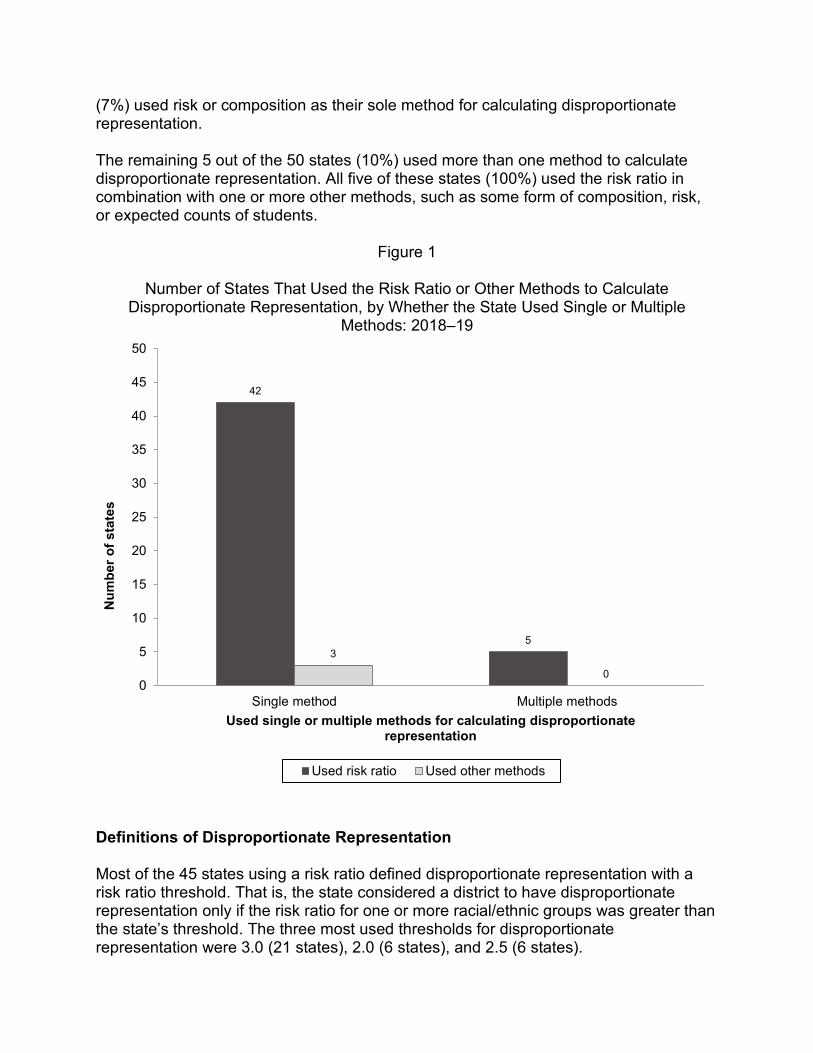
(7%) used risk or composition as their sole method for calculating disproportionate representation. The remaining 5 out of the 50 states (10%) used more than one method to calculate disproportionate representation. All five of these states (100%) used the risk ratio in combination with one or more other methods, such as some form of composition, risk, or expected counts of students.
Figure 1
Number of States That Used the Risk Ratio or Other Methods to Calculate Disproportionate Representation, by Whether the State Used Single or Multiple
Methods: 2018–19
42
53
00
5
10
15
20
25
30
35
40
45
50
Single method Multiple methods
Num
ber o
f sta
tes
Used single or multiple methods for calculating disproportionate representation
Used risk ratio Used other methods
Definitions of Disproportionate Representation
Most of the 45 states using a risk ratio defined disproportionate representation with a risk ratio threshold. That is, the state considered a district to have disproportionate representation only if the risk ratio for one or more racial/ethnic groups was greater than the state’s threshold. The three most used thresholds for disproportionate representation were 3.0 (21 states), 2.0 (6 states), and 2.5 (6 states).
The small number of states (3 states out of the 50) that calculated disproportionate representation using other methods defined disproportionate representation in different ways. These included percentage-point differences (composition) and comparisons to thresholds and statistical significance (risk).
Minimum Cell and/or N-Size Requirements
When determining disproportionate representation, states are required to analyze data for each district, either for all racial/ethnic groups in the district or for all racial/ethnic groups in the district that meet the minimum cell and/or n-size set by the state. Overall, 49 states (98%) used minimum cell and/or n-size requirements in their calculations of disproportionate representation for both B9 and B10. States specified a variety of minimum cell and/or n-size requirements, ranging from 5 to 100 students.
All states reported on the percentage of districts excluded from the analyses due to minimum cell and/or n-size requirements for B9 and B10. Figure 2 presents this information.
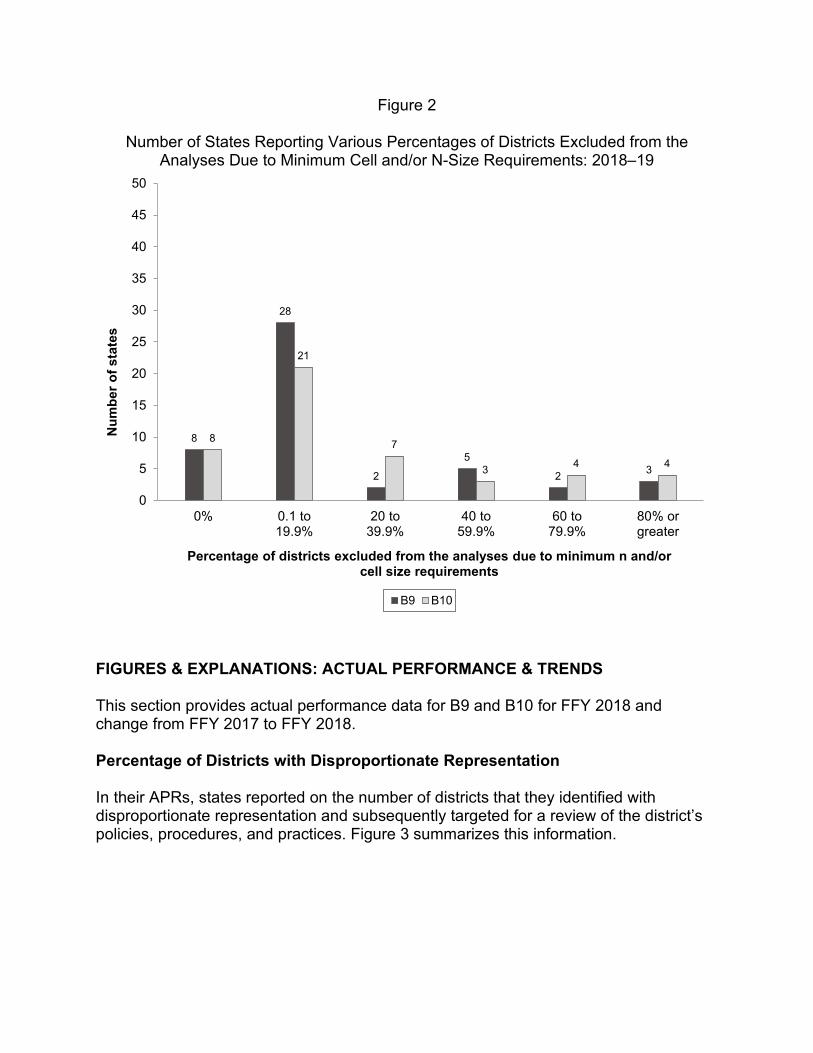
Figure 2
Number of States Reporting Various Percentages of Districts Excluded from the Analyses Due to Minimum Cell and/or N-Size Requirements: 2018–19
8
28
2
5
2 3
8
21
7
3 4 4
0
5
10
15
20
25
30
35
40
45
50
0% 0.1 to19.9%
20 to39.9%
40 to59.9%
60 to79.9%
80% orgreater
Num
ber o
f sta
tes
Percentage of districts excluded from the analyses due to minimum n and/or cell size requirements
B9 B10
FIGURES & EXPLANATIONS: ACTUAL PERFORMANCE & TRENDS
This section provides actual performance data for B9 and B10 for FFY 2018 and change from FFY 2017 to FFY 2018.
Percentage of Districts with Disproportionate Representation
In their APRs, states reported on the number of districts that they identified with disproportionate representation and subsequently targeted for a review of the district’s policies, procedures, and practices. Figure 3 summarizes this information.
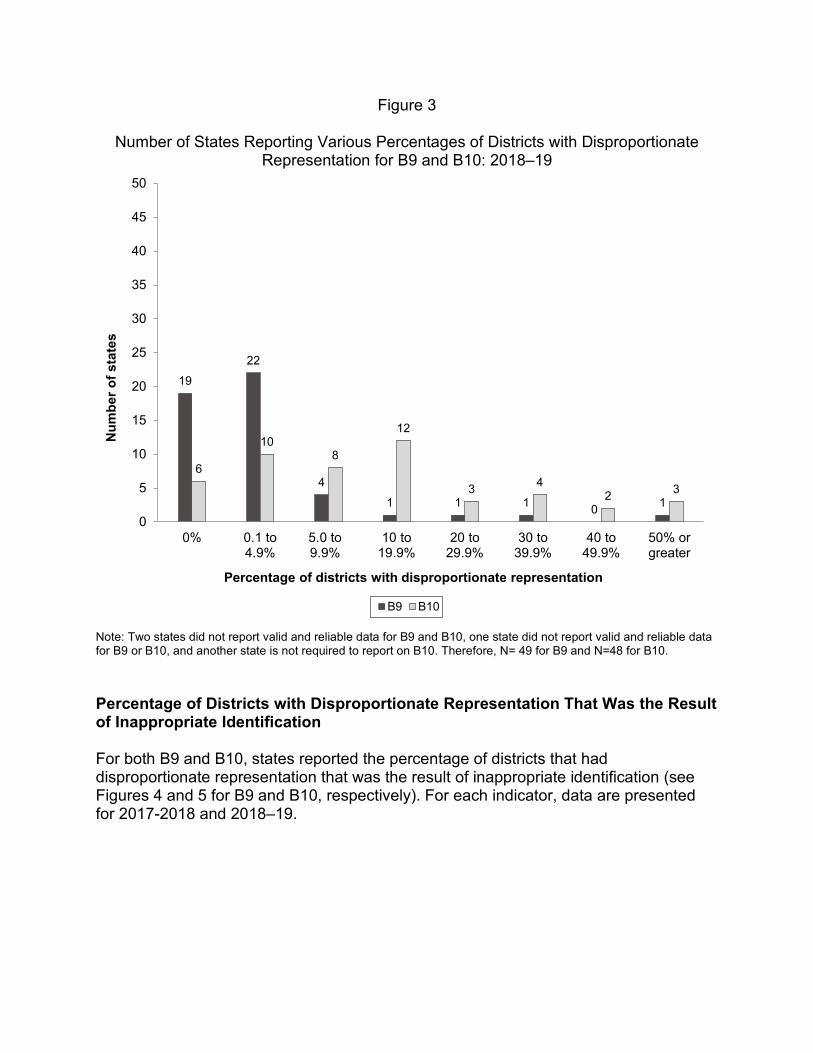
Figure 3
Number of States Reporting Various Percentages of Districts with Disproportionate Representation for B9 and B10: 2018–19
1922
41 1 1 0 1
6
108
12
3 42 3
0
5
10
15
20
25
30
35
40
45
50
0% 0.1 to4.9%
5.0 to9.9%
10 to19.9%
20 to29.9%
30 to39.9%
40 to49.9%
50% orgreater
Num
ber o
f sta
tes
Percentage of districts with disproportionate representation
B9 B10
Note: Two states did not report valid and reliable data for B9 and B10, one state did not report valid and reliable data for B9 or B10, and another state is not required to report on B10. Therefore, N= 49 for B9 and N=48 for B10.
Percentage of Districts with Disproportionate Representation That Was the Result of Inappropriate Identification
For both B9 and B10, states reported the percentage of districts that had disproportionate representation that was the result of inappropriate identification (see Figures 4 and 5 for B9 and B10, respectively). For each indicator, data are presented for 2017-2018 and 2018–19.
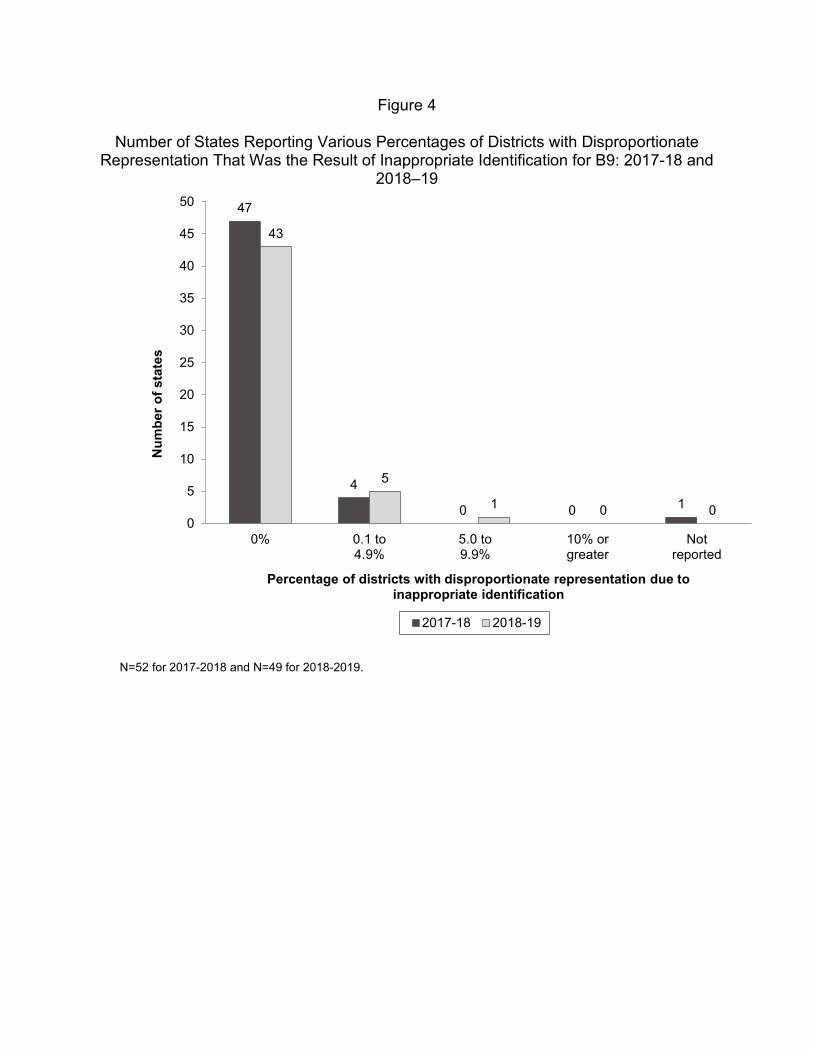
Figure 4
Number of States Reporting Various Percentages of Districts with Disproportionate Representation That Was the Result of Inappropriate Identification for B9: 2017-18 and
2018–19
N=52 for 2017-2018 and N=49 for 2018-2019.
47
4
0 0 1
43
5
1 0 00
5
10
15
20
25
30
35
40
45
50
0% 0.1 to4.9%
5.0 to9.9%
10% orgreater
Notreported
Num
ber o
f sta
tes
Percentage of districts with disproportionate representation due to inappropriate identification
2017-18 2018-19

Figure 5
Number of States Reporting Various Percentages of Districts with Disproportionate Representation That Was the Result of Inappropriate Identification for B10: 2017–18
and 2018–19
N=52 for 2017-2018 and N=49 for 2018-2019.
Description of Change From 2017–18 to 2018–19
An examination of change from 2017–18 to 2018–19 in the percentage of districts identified as having disproportionate representation due to inappropriate identification revealed that of those states that reported valid and reliable data in both 2017–18 and 2018–191:
• Forty-one states (84%) for B9 and 37 states (77%) for B10 reported no change in the percentage of districts identified as having disproportionate representation due to
1 Fifty-one states reported valid and reliable data for 2017-18 and 49 states for 2018-19 for B9, and 48
states reported valid and reliable data for B10 for both 2017–18 and 2018-19. One state is not required to report on B10.
39
7
31 2
38
7
30 1
0
5
10
15
20
25
30
35
40
45
50
0% 0.1 to4.9%
5.0 to9.9%
10% orgreater
Notreported
Num
ber o
f sta
tes
Percentage of districts with disproportionate representation due to inappropriate identification
2017-18 2018-19
inappropriate identification (all of these states for B9 and all but one state for B10 met the target of 0% in 2017–18 and 2018–19).
• For B9, two states (4%) reported a decrease in the percentage of districts identified as having disproportionate representation due to inappropriate identification, and six states (12%) reported an increase.
• For B10, seven states (15%) reported a decrease in the percentage of districts identified as having disproportionate representation due to inappropriate identification, and four states (8%) reported an increase.
INDICATOR B11: TIMELY INITIAL EVALUATIONS Completed by the National Center for Systemic Improvement (NCSI).
INTRODUCTION
This report presents a review of Indicator 11 state improvement activities from the Annual Performance Reports (APR) of 50 states and 10 other administrative units including the District of Columbia, the Bureau of Indian Education, and eight territories. Each of these states, territories, the District of Columbia, and the Bureau of Indian Education, will be referred to as entities throughout this document.
Measurement of this indicator is defined in the Part B SPP/APR Measurement Table as:
Percent of children who were evaluated within 60 days of receiving parental consent for initial evaluation or, if the state establishes a timeframe within which the evaluation must be conducted, within that timeframe.
After an overview of the data from all 60 reporting entities, an analysis is presented. The overview of the data includes tables summarizing findings of data reported on Indicator 11, Part B. A conclusion with recommendations is included in this report as well.
DATA SOURCES AND MEASUREMENT APPROACHES
All 60 entities (50 U.S. states and 10 U.S. administrative units) are required to account for children for whom parental consent was received but who were not evaluated within the timeline. States must also indicate the range of days for which evaluations occurred beyond the timeline, including any reasons for the delays. Under 34 CFR §300.301(d), the timeframe set for initial evaluation does not apply if: (1) the parent of a child repeatedly fails or refuses to produce the child for the evaluation, or (2) a child enrolls in a school of another public agency after the timeframe for initial evaluations has begun, and prior to a determination by the child’s previous public agency as to whether the child is a child with a disability. In the event the state has established a timeframe which provides for exceptions through state regulation or policy, it must describe the cases falling within those exceptions and include this number in the denominator. Data for reporting on this indicator are to be taken from state monitoring or state data systems and based on actual, not an average, number of days. If data is generated from a state monitoring system, the state must describe the method used to select Local Education Agencies (LEAs) for monitoring. If data are from a state database, the state must include data for the entire reporting year.
OVERVIEW OF ACTUAL PERFORMANCE
State-reported data since the first reporting year (2011-2012) shows very minimal changes. Across all six monitoring years, the highest percentage reported by a state was 100% (FFY 2018), meaning all children were evaluated within 60 days of initial
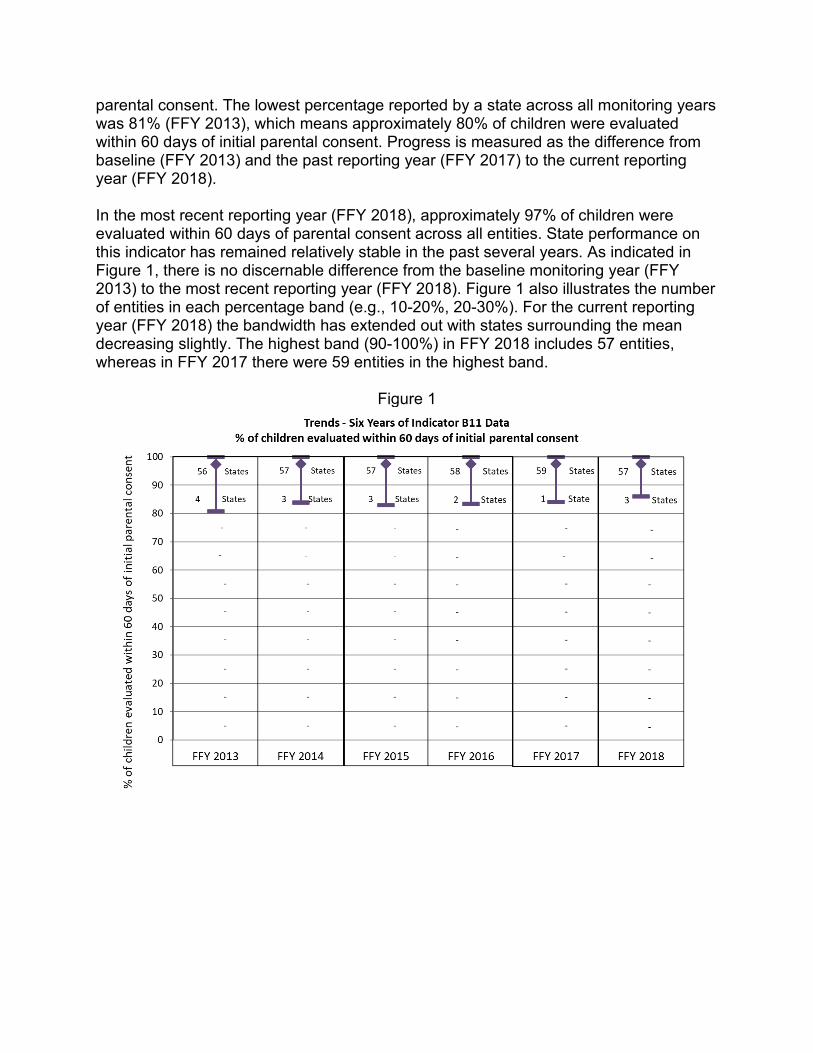
parental consent. The lowest percentage reported by a state across all monitoring years was 81% (FFY 2013), which means approximately 80% of children were evaluated within 60 days of initial parental consent. Progress is measured as the difference from baseline (FFY 2013) and the past reporting year (FFY 2017) to the current reporting year (FFY 2018).
In the most recent reporting year (FFY 2018), approximately 97% of children were evaluated within 60 days of parental consent across all entities. State performance on this indicator has remained relatively stable in the past several years. As indicated in Figure 1, there is no discernable difference from the baseline monitoring year (FFY 2013) to the most recent reporting year (FFY 2018). Figure 1 also illustrates the number of entities in each percentage band (e.g., 10-20%, 20-30%). For the current reporting year (FFY 2018) the bandwidth has extended out with states surrounding the mean decreasing slightly. The highest band (90-100%) in FFY 2018 includes 57 entities, whereas in FFY 2017 there were 59 entities in the highest band.
Figure 1
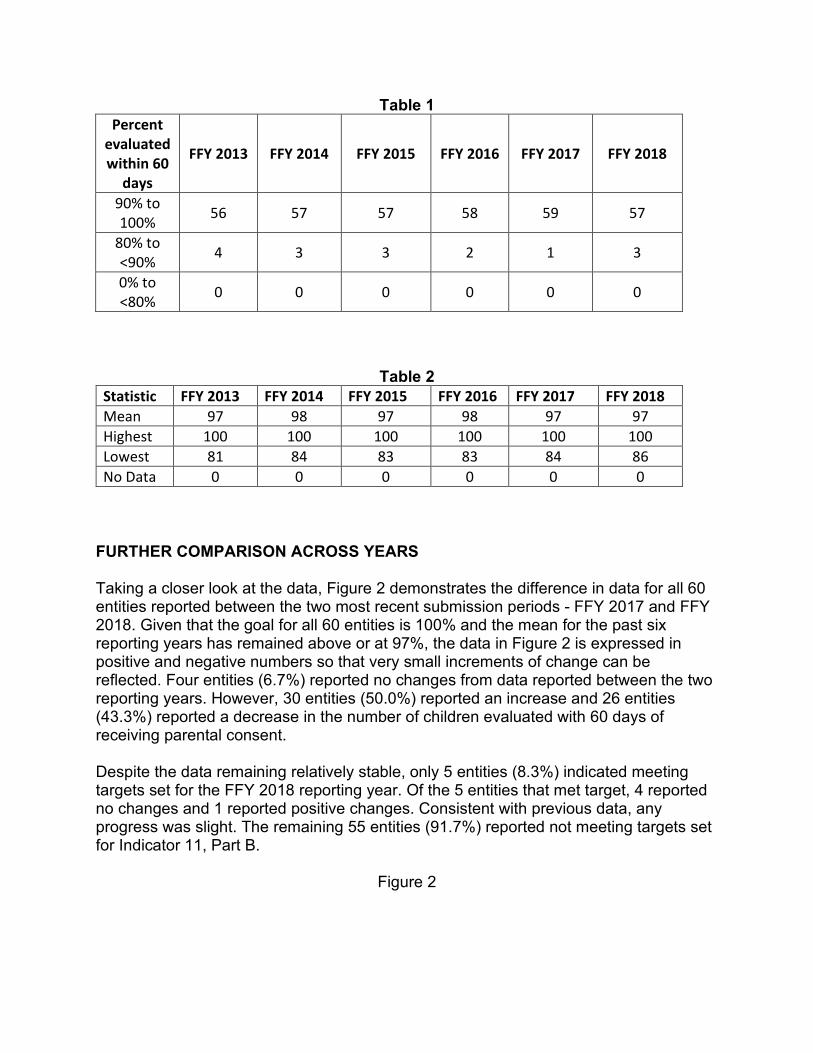
Table 1 Percent
evaluated within 60
days
FFY 2013 FFY 2014 FFY 2015 FFY 2016 FFY 2017 FFY 2018
90% to 100% 56 57 57 58 59 57
80% to <90% 4 3 3 2 1 3
0% to <80% 0 0 0 0 0 0
Table 2 Statistic FFY 2013 FFY 2014 FFY 2015 FFY 2016 FFY 2017 FFY 2018 Mean 97 98 97 98 97 97 Highest 100 100 100 100 100 100 Lowest 81 84 83 83 84 86 No Data 0 0 0 0 0 0
FURTHER COMPARISON ACROSS YEARS
Taking a closer look at the data, Figure 2 demonstrates the difference in data for all 60 entities reported between the two most recent submission periods - FFY 2017 and FFY 2018. Given that the goal for all 60 entities is 100% and the mean for the past six reporting years has remained above or at 97%, the data in Figure 2 is expressed in positive and negative numbers so that very small increments of change can be reflected. Four entities (6.7%) reported no changes from data reported between the two reporting years. However, 30 entities (50.0%) reported an increase and 26 entities (43.3%) reported a decrease in the number of children evaluated with 60 days of receiving parental consent.
Despite the data remaining relatively stable, only 5 entities (8.3%) indicated meeting targets set for the FFY 2018 reporting year. Of the 5 entities that met target, 4 reported no changes and 1 reported positive changes. Consistent with previous data, any progress was slight. The remaining 55 entities (91.7%) reported not meeting targets set for Indicator 11, Part B.
Figure 2
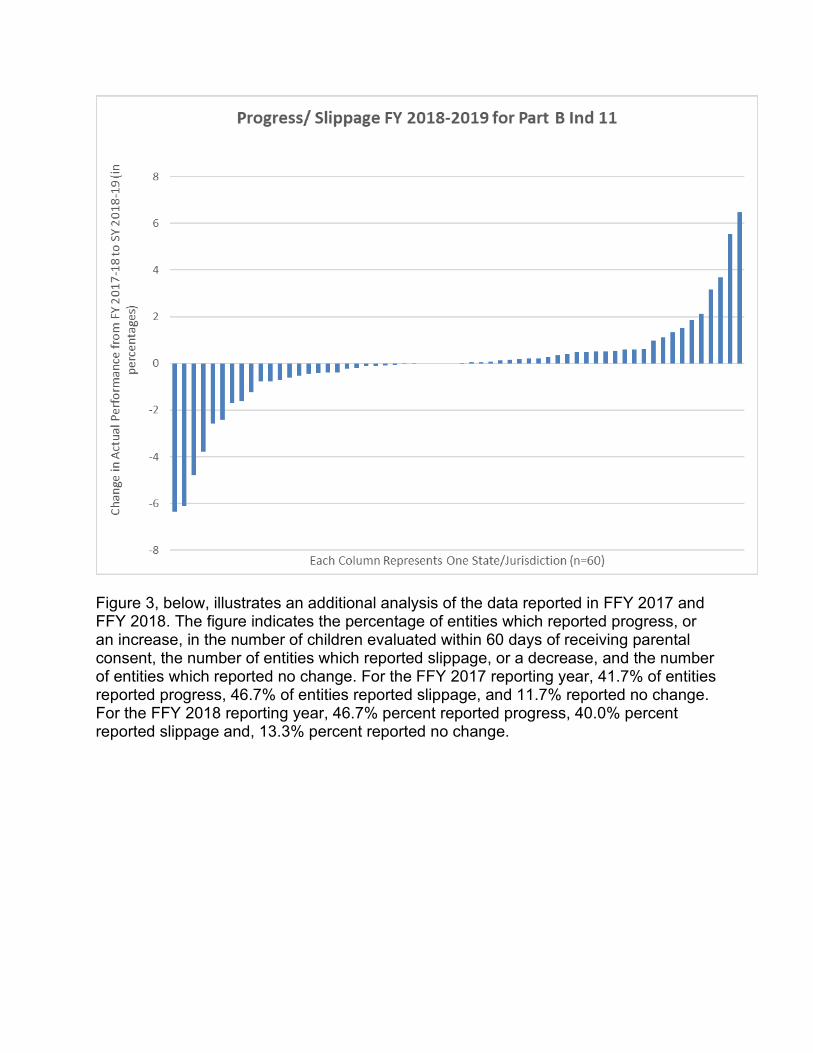
Figure 3, below, illustrates an additional analysis of the data reported in FFY 2017 and FFY 2018. The figure indicates the percentage of entities which reported progress, or an increase, in the number of children evaluated within 60 days of receiving parental consent, the number of entities which reported slippage, or a decrease, and the number of entities which reported no change. For the FFY 2017 reporting year, 41.7% of entities reported progress, 46.7% of entities reported slippage, and 11.7% reported no change. For the FFY 2018 reporting year, 46.7% percent reported progress, 40.0% percent reported slippage and, 13.3% percent reported no change.
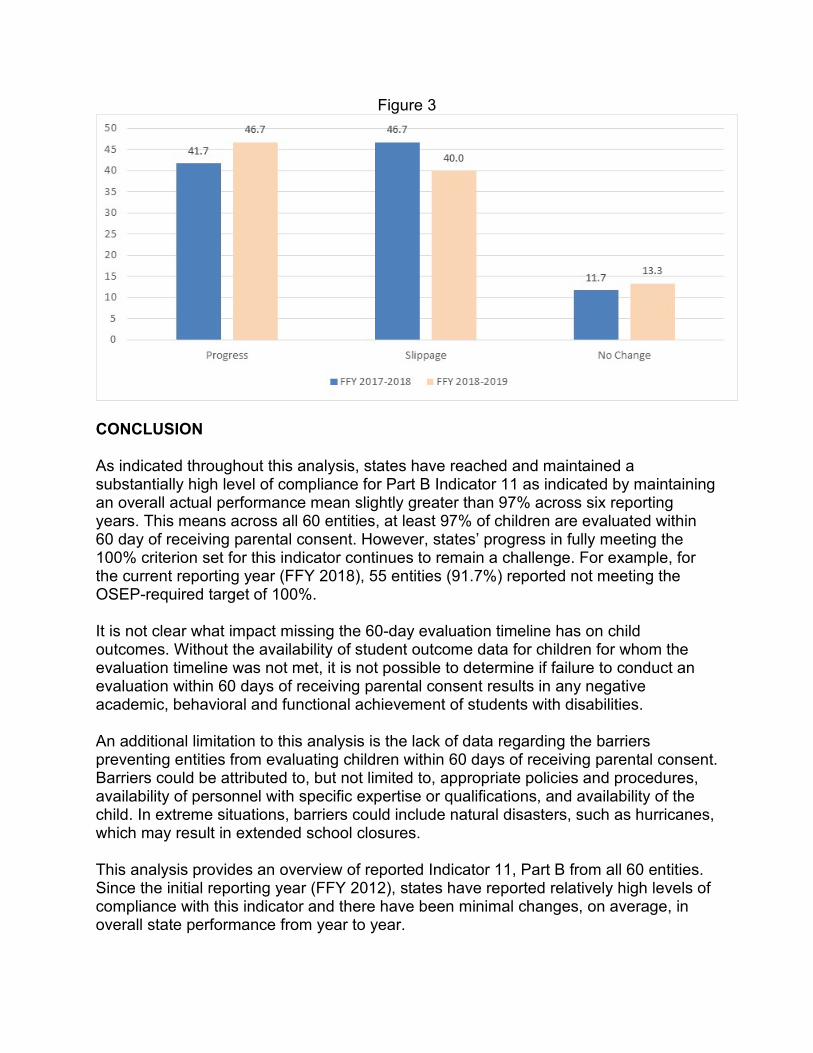
Figure 3
CONCLUSION
As indicated throughout this analysis, states have reached and maintained a substantially high level of compliance for Part B Indicator 11 as indicated by maintaining an overall actual performance mean slightly greater than 97% across six reporting years. This means across all 60 entities, at least 97% of children are evaluated within 60 day of receiving parental consent. However, states’ progress in fully meeting the 100% criterion set for this indicator continues to remain a challenge. For example, for the current reporting year (FFY 2018), 55 entities (91.7%) reported not meeting the OSEP-required target of 100%.
It is not clear what impact missing the 60-day evaluation timeline has on child outcomes. Without the availability of student outcome data for children for whom the evaluation timeline was not met, it is not possible to determine if failure to conduct an evaluation within 60 days of receiving parental consent results in any negative academic, behavioral and functional achievement of students with disabilities.
An additional limitation to this analysis is the lack of data regarding the barriers preventing entities from evaluating children within 60 days of receiving parental consent. Barriers could be attributed to, but not limited to, appropriate policies and procedures, availability of personnel with specific expertise or qualifications, and availability of the child. In extreme situations, barriers could include natural disasters, such as hurricanes, which may result in extended school closures.
This analysis provides an overview of reported Indicator 11, Part B from all 60 entities. Since the initial reporting year (FFY 2012), states have reported relatively high levels of compliance with this indicator and there have been minimal changes, on average, in overall state performance from year to year.
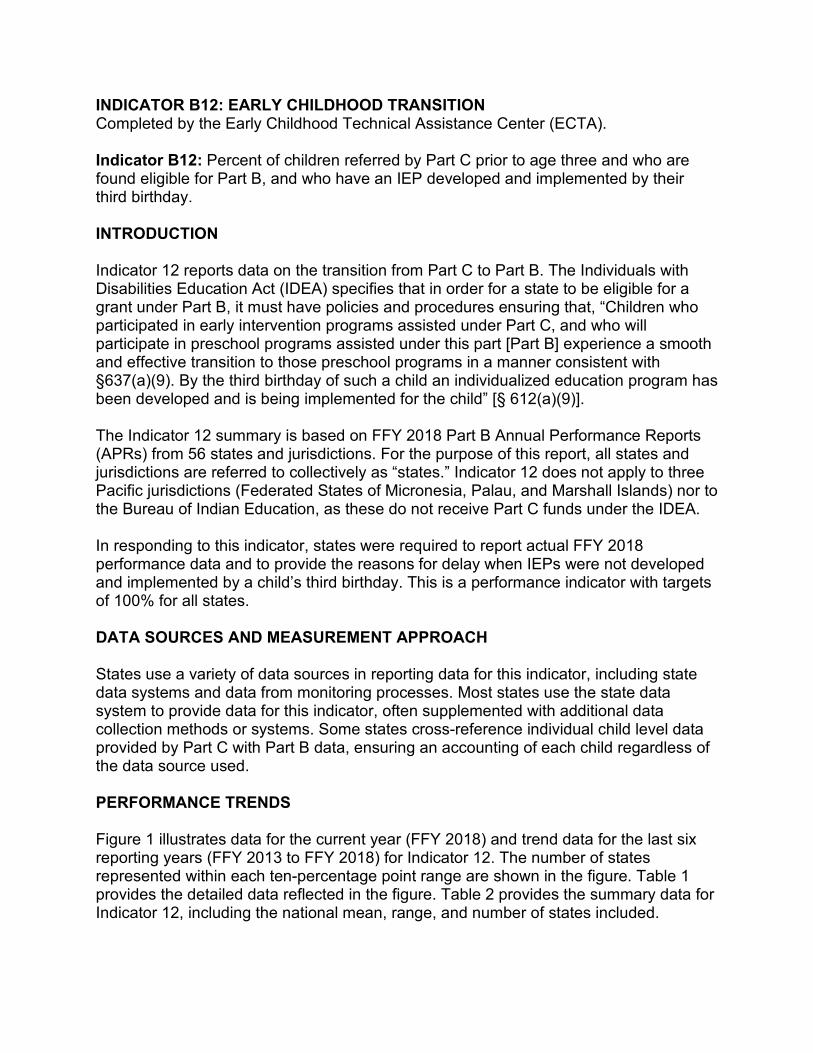
INDICATOR B12: EARLY CHILDHOOD TRANSITION Completed by the Early Childhood Technical Assistance Center (ECTA).
Indicator B12: Percent of children referred by Part C prior to age three and who are found eligible for Part B, and who have an IEP developed and implemented by their third birthday.
INTRODUCTION
Indicator 12 reports data on the transition from Part C to Part B. The Individuals with Disabilities Education Act (IDEA) specifies that in order for a state to be eligible for a grant under Part B, it must have policies and procedures ensuring that, “Children who participated in early intervention programs assisted under Part C, and who will participate in preschool programs assisted under this part [Part B] experience a smooth and effective transition to those preschool programs in a manner consistent with §637(a)(9). By the third birthday of such a child an individualized education program has been developed and is being implemented for the child” [§ 612(a)(9)].
The Indicator 12 summary is based on FFY 2018 Part B Annual Performance Reports (APRs) from 56 states and jurisdictions. For the purpose of this report, all states and jurisdictions are referred to collectively as “states.” Indicator 12 does not apply to three Pacific jurisdictions (Federated States of Micronesia, Palau, and Marshall Islands) nor to the Bureau of Indian Education, as these do not receive Part C funds under the IDEA.
In responding to this indicator, states were required to report actual FFY 2018 performance data and to provide the reasons for delay when IEPs were not developed and implemented by a child’s third birthday. This is a performance indicator with targets of 100% for all states.
DATA SOURCES AND MEASUREMENT APPROACH
States use a variety of data sources in reporting data for this indicator, including state data systems and data from monitoring processes. Most states use the state data system to provide data for this indicator, often supplemented with additional data collection methods or systems. Some states cross-reference individual child level data provided by Part C with Part B data, ensuring an accounting of each child regardless of the data source used.
PERFORMANCE TRENDS
Figure 1 illustrates data for the current year (FFY 2018) and trend data for the last six reporting years (FFY 2013 to FFY 2018) for Indicator 12. The number of states represented within each ten-percentage point range are shown in the figure. Table 1 provides the detailed data reflected in the figure. Table 2 provides the summary data for Indicator 12, including the national mean, range, and number of states included.

Figure 1
Table 1: Indicator B12 Detail Data Number of States by Deciles and Reporting Year (FFY 2013 to FFY 2018)
Percent Part B Eligible with IEP by Age Three
FFY 2013 FFY 2014 FFY 2015 FFY 2016 FFY 2017 FFY 2018
90% to 100% 55 54 53 52 50 49
80% to <90% 1 1 1 2 4 6
70% to <80% 0 1 1 1 1 1
60% to <70% 0 0 1 0 0 0
50% to <60% 0 0 0 0 1 0
0% to <50% 0 0 0 0 0 0
Table 2: Indicator B12 Summary Data (FFY 2013 to FFY 2018)
Statistic FFY 2013 FFY 2014 FFY 2015 FFY 2016 FFY 2017 FFY 2018
Mean (%) 98 98 97 97 96 96
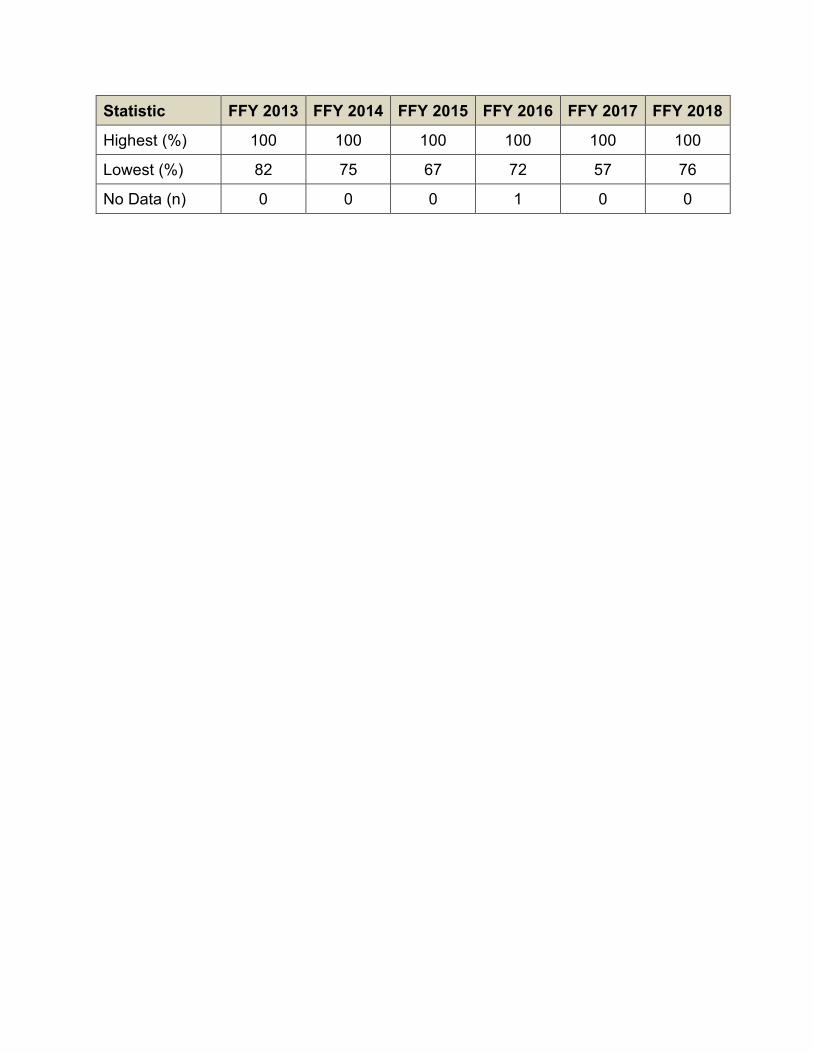
Statistic FFY 2013 FFY 2014 FFY 2015 FFY 2016 FFY 2017 FFY 2018
Highest (%) 100 100 100 100 100 100
Lowest (%) 82 75 67 72 57 76
No Data (n) 0 0 0 1 0 0
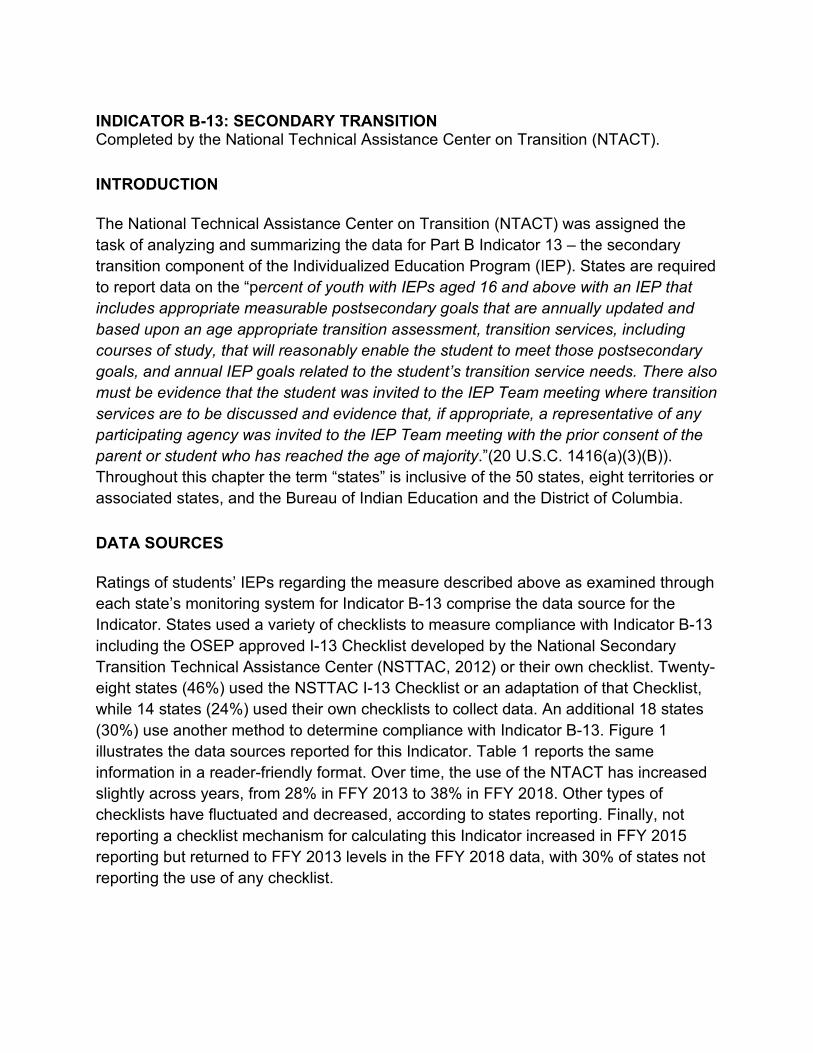
INDICATOR B-13: SECONDARY TRANSITION Completed by the National Technical Assistance Center on Transition (NTACT).
INTRODUCTION
The National Technical Assistance Center on Transition (NTACT) was assigned the task of analyzing and summarizing the data for Part B Indicator 13 – the secondary transition component of the Individualized Education Program (IEP). States are required to report data on the “percent of youth with IEPs aged 16 and above with an IEP that includes appropriate measurable postsecondary goals that are annually updated and based upon an age appropriate transition assessment, transition services, including courses of study, that will reasonably enable the student to meet those postsecondary goals, and annual IEP goals related to the student’s transition service needs. There also must be evidence that the student was invited to the IEP Team meeting where transition services are to be discussed and evidence that, if appropriate, a representative of any participating agency was invited to the IEP Team meeting with the prior consent of the parent or student who has reached the age of majority.”(20 U.S.C. 1416(a)(3)(B)). Throughout this chapter the term “states” is inclusive of the 50 states, eight territories or associated states, and the Bureau of Indian Education and the District of Columbia.
DATA SOURCES
Ratings of students’ IEPs regarding the measure described above as examined through each state’s monitoring system for Indicator B-13 comprise the data source for the Indicator. States used a variety of checklists to measure compliance with Indicator B-13 including the OSEP approved I-13 Checklist developed by the National Secondary Transition Technical Assistance Center (NSTTAC, 2012) or their own checklist. Twenty-eight states (46%) used the NSTTAC I-13 Checklist or an adaptation of that Checklist, while 14 states (24%) used their own checklists to collect data. An additional 18 states (30%) use another method to determine compliance with Indicator B-13. Figure 1 illustrates the data sources reported for this Indicator. Table 1 reports the same information in a reader-friendly format. Over time, the use of the NTACT has increased slightly across years, from 28% in FFY 2013 to 38% in FFY 2018. Other types of checklists have fluctuated and decreased, according to states reporting. Finally, not reporting a checklist mechanism for calculating this Indicator increased in FFY 2015 reporting but returned to FFY 2013 levels in the FFY 2018 data, with 30% of states not reporting the use of any checklist.
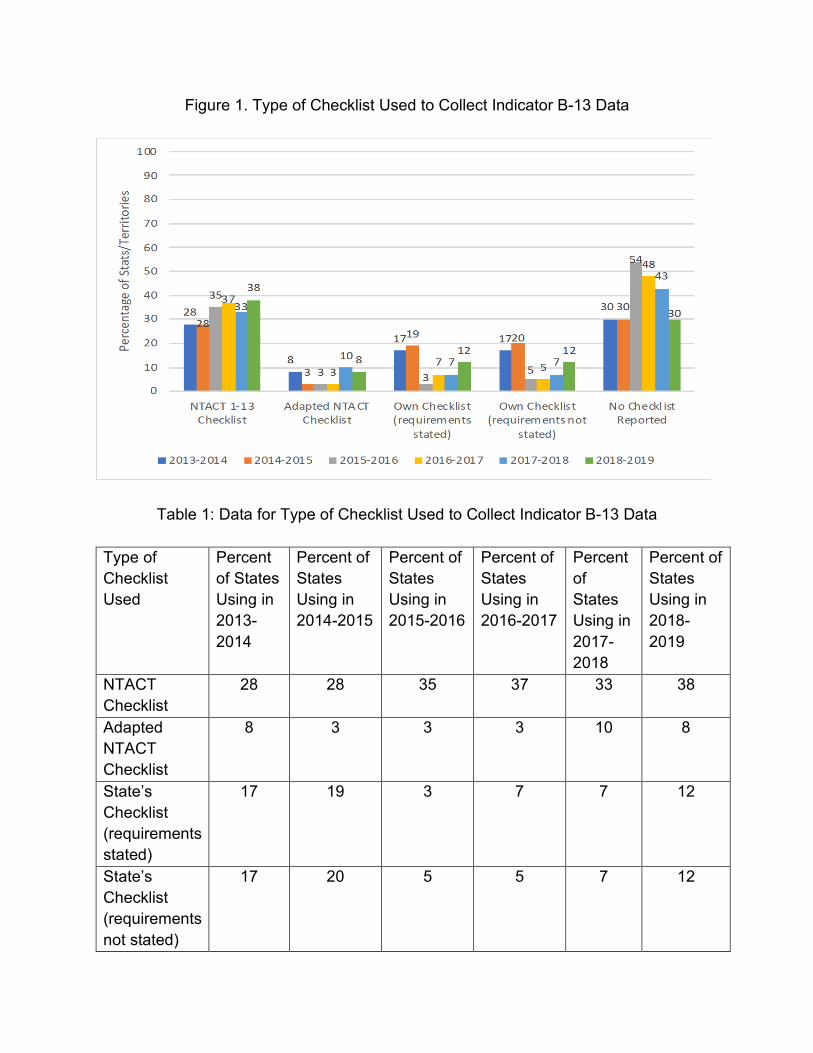
Figure 1. Type of Checklist Used to Collect Indicator B-13 Data
Table 1: Data for Type of Checklist Used to Collect Indicator B-13 Data
Type of Checklist Used
Percent of States Using in 2013-2014
Percent of States Using in 2014-2015
Percent of States Using in 2015-2016
Percent of States Using in 2016-2017
Percent of States Using in 2017-2018
Percent of States Using in 2018-2019
NTACT Checklist
28 28 35 37 33 38
Adapted NTACT Checklist
8 3 3 3 10 8
State’s Checklist (requirements stated)
17 19 3 7 7 12
State’s Checklist (requirements not stated)
17 20 5 5 7 12
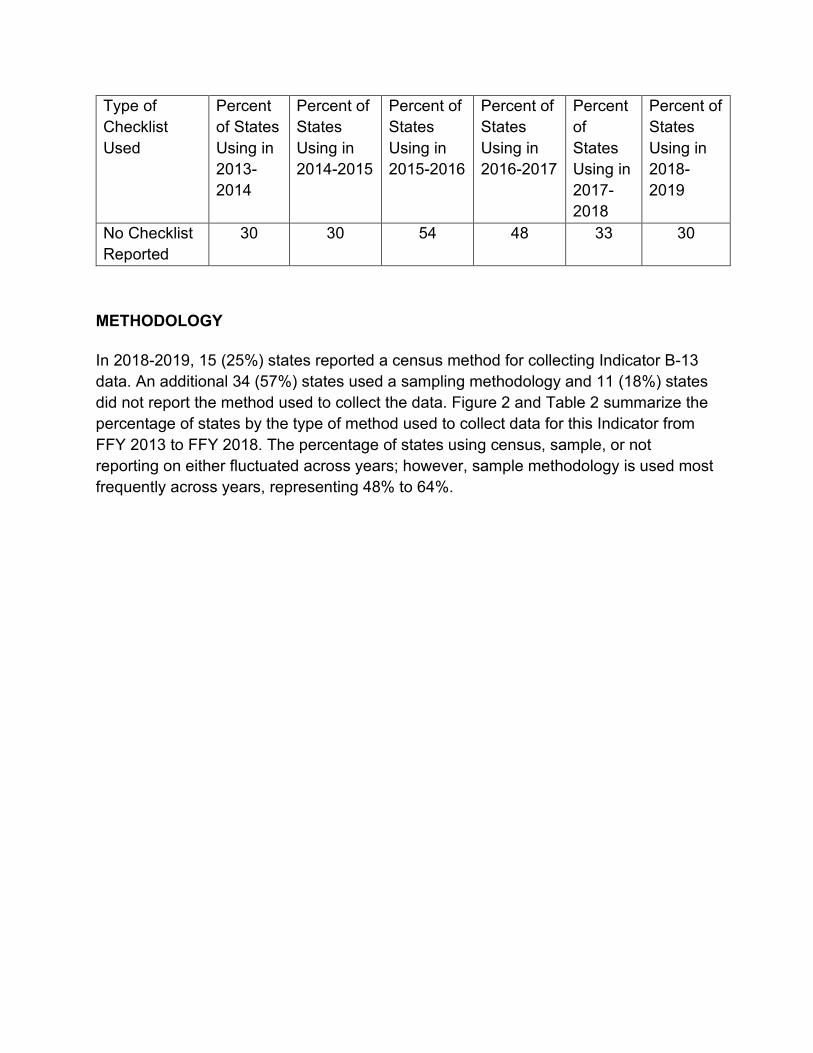
Type of Checklist Used
Percent of States Using in 2013-2014
Percent of States Using in 2014-2015
Percent of States Using in 2015-2016
Percent of States Using in 2016-2017
Percent of States Using in 2017-2018
Percent of States Using in 2018-2019
No Checklist Reported
30 30 54 48 33 30
METHODOLOGY
In 2018-2019, 15 (25%) states reported a census method for collecting Indicator B-13 data. An additional 34 (57%) states used a sampling methodology and 11 (18%) states did not report the method used to collect the data. Figure 2 and Table 2 summarize the percentage of states by the type of method used to collect data for this Indicator from FFY 2013 to FFY 2018. The percentage of states using census, sample, or not reporting on either fluctuated across years; however, sample methodology is used most frequently across years, representing 48% to 64%.
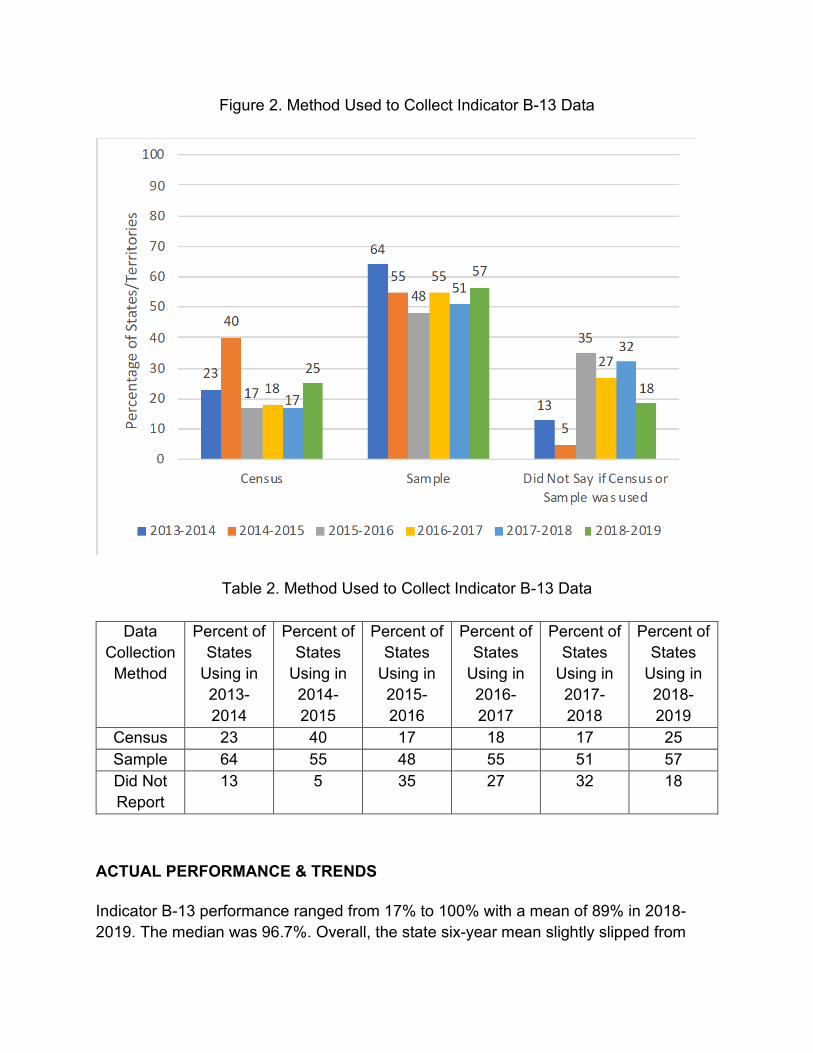
Figure 2. Method Used to Collect Indicator B-13 Data
Table 2. Method Used to Collect Indicator B-13 Data
Data Collection Method
Percent of States
Using in 2013-2014
Percent of States
Using in 2014-2015
Percent of States
Using in 2015-2016
Percent of States
Using in 2016-2017
Percent of States
Using in 2017-2018
Percent of States
Using in 2018-2019
Census 23 40 17 18 17 25 Sample 64 55 48 55 51 57 Did Not Report
13 5 35 27 32 18
ACTUAL PERFORMANCE & TRENDS
Indicator B-13 performance ranged from 17% to 100% with a mean of 89% in 2018-2019. The median was 96.7%. Overall, the state six-year mean slightly slipped from
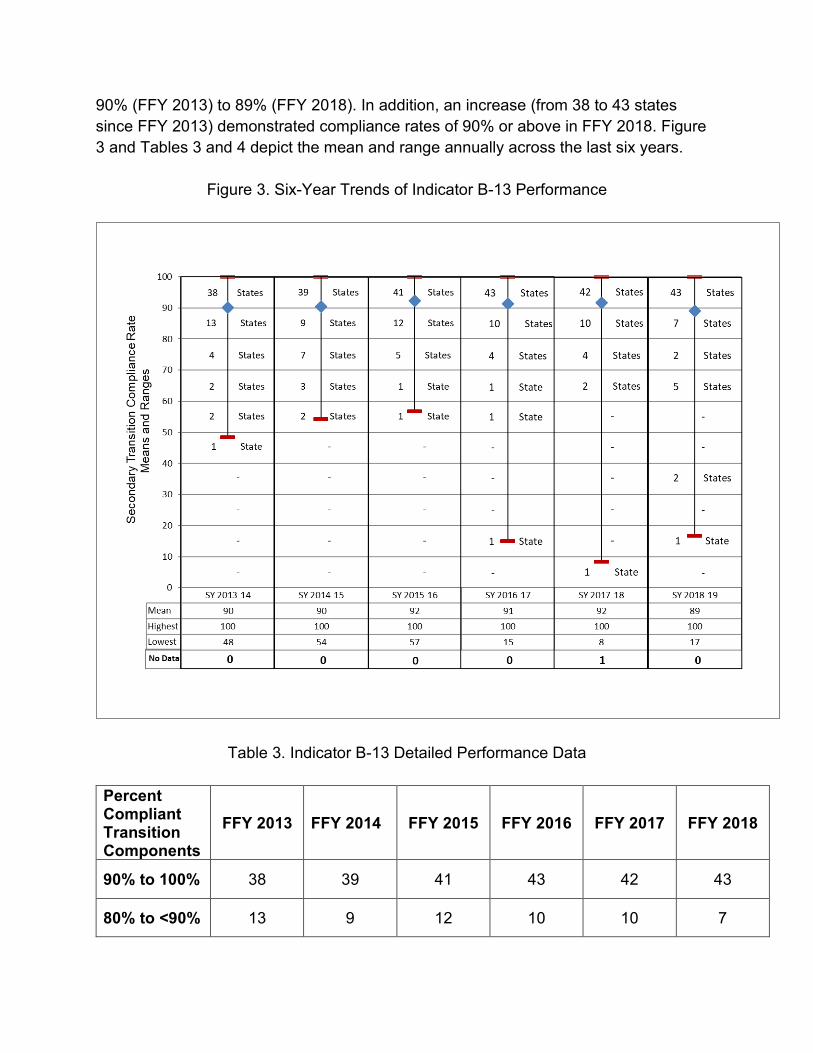
90% (FFY 2013) to 89% (FFY 2018). In addition, an increase (from 38 to 43 states since FFY 2013) demonstrated compliance rates of 90% or above in FFY 2018. Figure 3 and Tables 3 and 4 depict the mean and range annually across the last six years.
Figure 3. Six-Year Trends of Indicator B-13 Performance
Table 3. Indicator B-13 Detailed Performance Data
Percent Compliant Transition Components
FFY 2013 FFY 2014 FFY 2015 FFY 2016 FFY 2017 FFY 2018
90% to 100% 38 39 41 43 42 43
80% to <90% 13 9 12 10 10 7
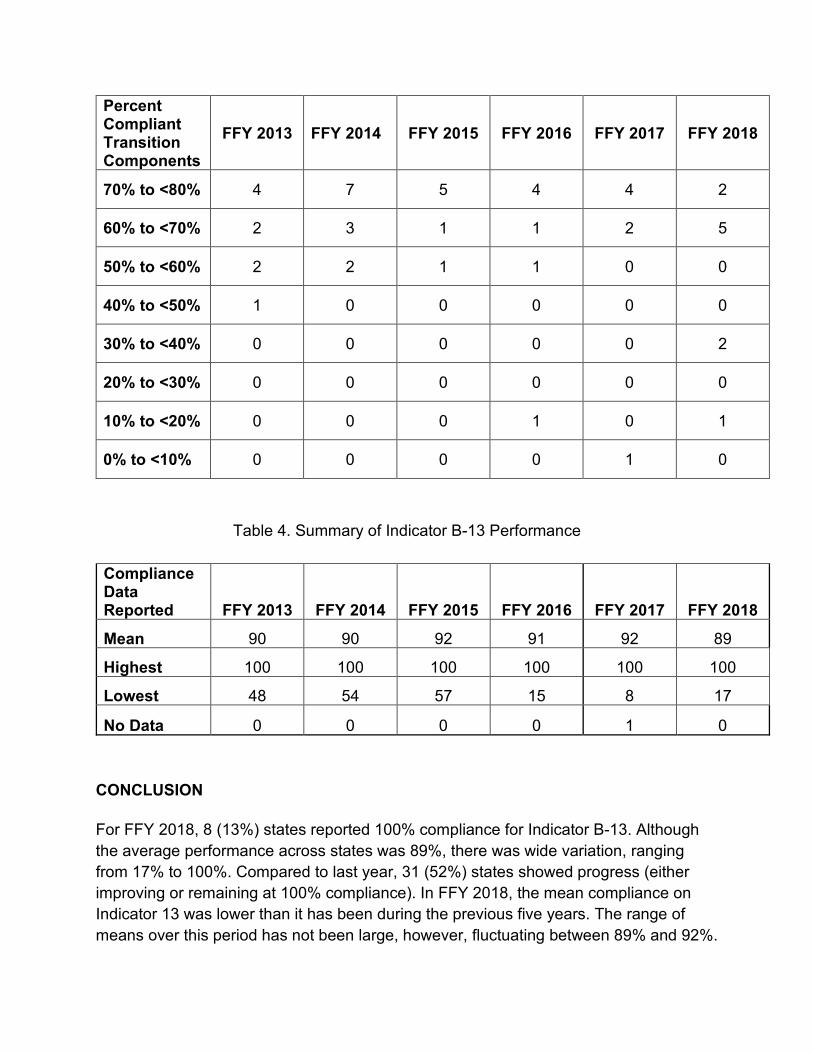
Percent Compliant Transition Components
FFY 2013 FFY 2014 FFY 2015 FFY 2016 FFY 2017 FFY 2018
70% to <80% 4 7 5 4 4 2
60% to <70% 2 3 1 1 2 5
50% to <60% 2 2 1 1 0 0
40% to <50% 1 0 0 0 0 0
30% to <40% 0 0 0 0 0 2
20% to <30% 0 0 0 0 0 0
10% to <20% 0 0 0 1 0 1
0% to <10% 0 0 0 0 1 0
Table 4. Summary of Indicator B-13 Performance
Compliance Data Reported FFY 2013 FFY 2014 FFY 2015 FFY 2016 FFY 2017 FFY 2018
Mean 90 90 92 91 92 89
Highest 100 100 100 100 100 100
Lowest 48 54 57 15 8 17
No Data 0 0 0 0 1 0
CONCLUSION
For FFY 2018, 8 (13%) states reported 100% compliance for Indicator B-13. Although the average performance across states was 89%, there was wide variation, ranging from 17% to 100%. Compared to last year, 31 (52%) states showed progress (either improving or remaining at 100% compliance). In FFY 2018, the mean compliance on Indicator 13 was lower than it has been during the previous five years. The range of means over this period has not been large, however, fluctuating between 89% and 92%.
States’ most recent APR submissions also provided greater specificity about data sources and methodology than in the previous three years.
INDICATOR B14: POST-SCHOOL OUTCOMES Completed by the National Technical Assistance Center on Transition.
INTRODUCTION
This report summarizes states’ Federal Fiscal Year 2018 (FFY18) submission for Part B Indicator 14: the “percent of youth who are no longer in secondary school, had IEPs in effect at the time they left school, and were:
A. Enrolled in higher education within one year of leaving high school. B. Enrolled in higher education or competitively employed within one year of leaving high
school. C. Enrolled in higher education or in some other postsecondary education or training
program; or competitively employed or in some other employment within one year of leaving high school”. (20 U.S.C. 1416(a)(3)(B))
Per the Measurement Table, the definitions for each measure are: Higher education as used in measures A, B, and C means youth have been enrolled on a full- or part-time basis in a community college (two year program) or college/university (four or more year program) for at least one complete term, at any time in the year since leaving high school. States had two options for defining competitive employment as used in measures B and C:
Option 1: Use the same definition as used to report in the FFY 2015 SPP/APR, i.e., competitive employment means that youth have worked for pay at or above the minimum wage in a setting with others who are nondisabled for a period of 20 hours a week for at least 90 days at any time in the year since leaving high school. This includes military employment. In total, 41 of 60 states (inclusive of freely associated states, jurisdictions/entities) reported using Option 1.
Option 2: States report in alignment with the term “competitive integrated employment” and its definition, in section 7(5) of the Rehabilitation Act, as amended by Workforce Innovation and Opportunity Act (WIOA), and 34 CFR §361.5(c)(9). ). For the purpose of defining the rate of compensation for students working on a “part-time basis” under this category, OSEP maintains the standard of 20 hours a week for at least 90 days at any time in the year since leaving high school. This definition applies to military employment. In total, 19 of 60 states (inclusive of freely associated states, jurisdictions/entities) reported using Option 2.
Per OSEP, if a State changes its methodology it must revise the baseline. If the change in the definition for competitive employment in Indicator 14 led to a new methodology for collecting/analyzing data, then a baseline change would be required. States would also
be required to obtain stakeholder input to revise targets. Only 5 states appear to have reset baseline since 2016 and reported using Option 2.
Enrolled in other postsecondary education or training as used in measure C, means youth have been enrolled on a full- or part-time basis for at least one complete term at any time in the year since leaving high school in an education or training program (e.g., Job Corps, adult education, workforce development program, vocational technical school which is less than a two year program).
Some other employment as used in measure C means youth have worked for pay or been self-employed for a period of at least 90 days at any time in the year since leaving high school. This includes working in a family business (e.g., farm, store, fishing, ranching, catering services, etc.).
States reported post-school outcomes (PSO) data to the Office of Special Education Programs (OSEP) on February 1, 2020. States reported their SPP/APR data via the GRADS360 website (https://osep.grads360.org/#program). The National Technical Assistance Center on Transition (NTACT) at the University of Oregon analyzed the APRs submitted by the 50 states, nine jurisdictions/entities/free associated states, and District of Columbia. Collectively, we refer to these as the 60 states in this report. Percentages are based on a total number of 60 and may exceed 100% due to rounding. When the actual number of states is less than 60, the number of states is provided, not a percentage.
DATA SOURCES
When responding to Indicator B14, states could use data from (a) a post-school outcomes survey, conducted with former students or their designee one year after students left high school, (b) an administrative records database/s, or (c) using a combination of these methods.
To analyze Indicator B14, NTACT staff coded all 60 APRs using a structured coding protocol. OSEP supplied Center staff a spreadsheet containing baseline, targets, achieved performance data, whether targets were met, and difference between FFY17 and FFY18 data for Indicator 14 Measures A, B, and C. These data were used to calculate national median aggregate percentages in this report. Below we describe (a) whether the state used a census or sample, (b) the method used to collect PSO data, and (c) states’ response rates and representativeness.
METHODOLOGY & MEASUREMENT APPROACHES (Optional, for some indicators)
Census versus Sample
To address Indicator B14, states had the option of conducting either a census of all student leavers with an IEP or a representative sample of students with an IEP leaving
high school (one year out). When using a sample, the sample had to be representative of each of the LEAs sampled based on disability category, age, race, and gender. States were asked, “Was sampling used?”
Of the 60 states, 72% (n = 43) of states reported collecting PSO data from a census of leavers with an IEP and 28% (n = 17) of states reported collecting data from a representative sample of leavers.
Method of Data Collection
The method used to collect PSO data is at the states’ discretion. States were asked, “Was a survey used?”
Of the 56 states that reported their method of data collection, survey methodology continues to be the dominant method used by states to collect PSO data. In FFY18, 4 states did not report the method used to collect PSO data. In total,
• 27 states reported using a survey without being more specific, • 15 states reported using only a phone or in-person interview, • 10 states reported using some combination of methods (e.g., mailed
questionnaire and phone interviews, or administrative database and interviews), • 3 states reported using only an administrative database for collecting PSO data,
and • 1 state reported using only a mailed questionnaire.
Response Rate and Representation
Response rate and representation are two indicators of valid and reliable data for survey methods. States were asked, Are the response data representative of the demographics of youth who are no longer in school and had IEPs in effect at the time they left school?
The response rate for PSO data collection is calculated by dividing the number of youth contacted and who completed the survey by the total number of youth with an IEP who left school in the year, less any youth ineligible for the survey. Ineligible youth are those who returned to school or deceased. States are required to input the number of respondents into the reporting system, but they are not required to enter the total number of leavers eligible for the PSO data collection. Absent this information, the response rate cannot be calculated or confirmed.
In FFY18, 43% of states (n = 26) reported a response rate or included the information to calculate the response rate. This rate is a decrease from the 40 states that reported a response rate in FFY17. Reported response rates for FFY18 ranged from 15.0% to 100%. The national median response rate was 59.9%; an increase from the national median of 48.6% in FFY17.
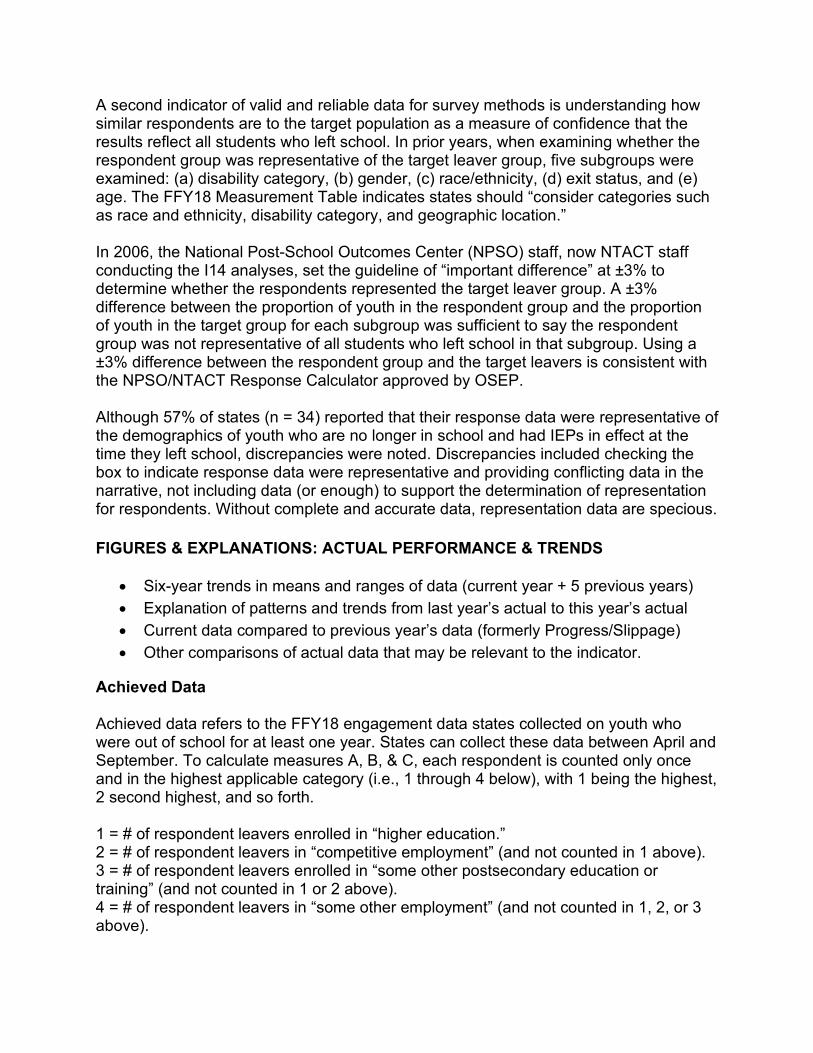
A second indicator of valid and reliable data for survey methods is understanding how similar respondents are to the target population as a measure of confidence that the results reflect all students who left school. In prior years, when examining whether the respondent group was representative of the target leaver group, five subgroups were examined: (a) disability category, (b) gender, (c) race/ethnicity, (d) exit status, and (e) age. The FFY18 Measurement Table indicates states should “consider categories such as race and ethnicity, disability category, and geographic location.”
In 2006, the National Post-School Outcomes Center (NPSO) staff, now NTACT staff conducting the I14 analyses, set the guideline of “important difference” at ±3% to determine whether the respondents represented the target leaver group. A ±3% difference between the proportion of youth in the respondent group and the proportion of youth in the target group for each subgroup was sufficient to say the respondent group was not representative of all students who left school in that subgroup. Using a ±3% difference between the respondent group and the target leavers is consistent with the NPSO/NTACT Response Calculator approved by OSEP.
Although 57% of states (n = 34) reported that their response data were representative of the demographics of youth who are no longer in school and had IEPs in effect at the time they left school, discrepancies were noted. Discrepancies included checking the box to indicate response data were representative and providing conflicting data in the narrative, not including data (or enough) to support the determination of representation for respondents. Without complete and accurate data, representation data are specious.
FIGURES & EXPLANATIONS: ACTUAL PERFORMANCE & TRENDS
• Six-year trends in means and ranges of data (current year + 5 previous years) • Explanation of patterns and trends from last year’s actual to this year’s actual • Current data compared to previous year’s data (formerly Progress/Slippage) • Other comparisons of actual data that may be relevant to the indicator.
Achieved Data
Achieved data refers to the FFY18 engagement data states collected on youth who were out of school for at least one year. States can collect these data between April and September. To calculate measures A, B, & C, each respondent is counted only once and in the highest applicable category (i.e., 1 through 4 below), with 1 being the highest, 2 second highest, and so forth.
1 = # of respondent leavers enrolled in “higher education.” 2 = # of respondent leavers in “competitive employment” (and not counted in 1 above). 3 = # of respondent leavers enrolled in “some other postsecondary education or training” (and not counted in 1 or 2 above). 4 = # of respondent leavers in “some other employment” (and not counted in 1, 2, or 3 above).
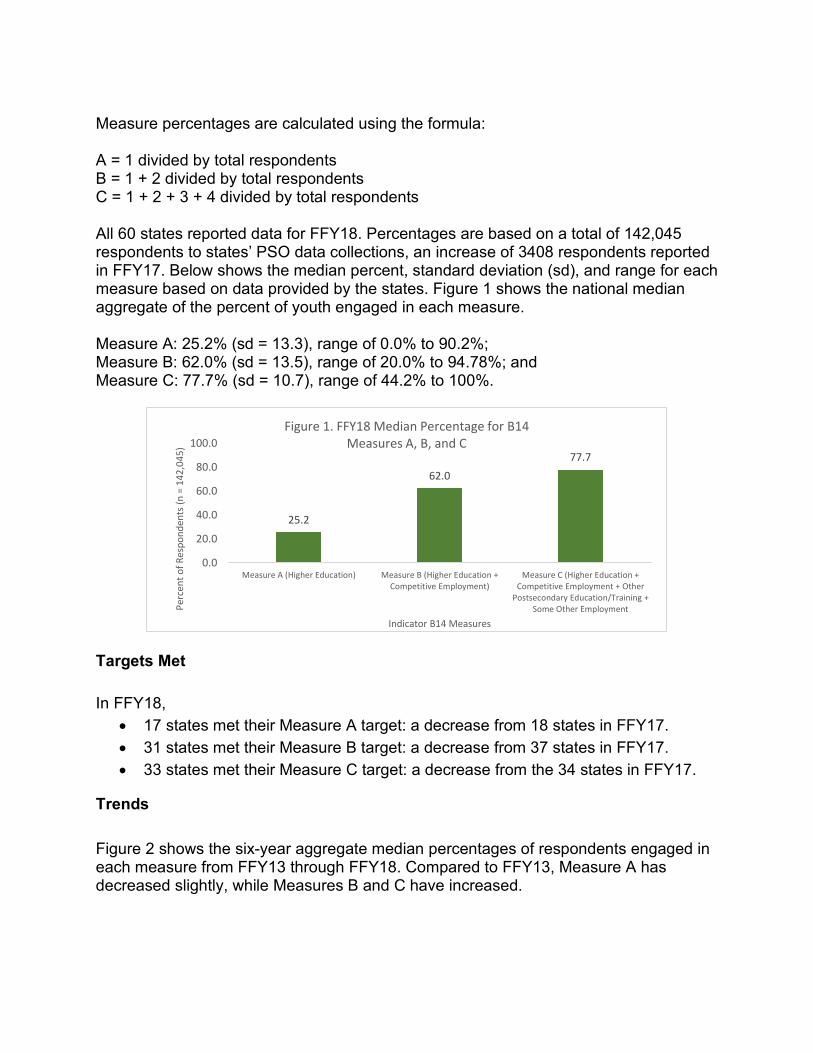
Measure percentages are calculated using the formula:
A = 1 divided by total respondents B = 1 + 2 divided by total respondents C = 1 + 2 + 3 + 4 divided by total respondents
All 60 states reported data for FFY18. Percentages are based on a total of 142,045 respondents to states’ PSO data collections, an increase of 3408 respondents reported in FFY17. Below shows the median percent, standard deviation (sd), and range for each measure based on data provided by the states. Figure 1 shows the national median aggregate of the percent of youth engaged in each measure.
Measure A: 25.2% (sd = 13.3), range of 0.0% to 90.2%; Measure B: 62.0% (sd = 13.5), range of 20.0% to 94.78%; and Measure C: 77.7% (sd = 10.7), range of 44.2% to 100%.
25.2
62.077.7
0.0
20.0
40.0
60.0
80.0
100.0
Measure A (Higher Education) Measure B (Higher Education +Competitive Employment)
Measure C (Higher Education +Competitive Employment + Other
Postsecondary Education/Training +Some Other EmploymentPe
rcen
t of R
espo
nden
ts (n
= 1
42,0
45)
Indicator B14 Measures
Figure 1. FFY18 Median Percentage for B14 Measures A, B, and C
Targets Met
In FFY18, • 17 states met their Measure A target: a decrease from 18 states in FFY17. • 31 states met their Measure B target: a decrease from 37 states in FFY17. • 33 states met their Measure C target: a decrease from the 34 states in FFY17.
Trends
Figure 2 shows the six-year aggregate median percentages of respondents engaged in each measure from FFY13 through FFY18. Compared to FFY13, Measure A has decreased slightly, while Measures B and C have increased.
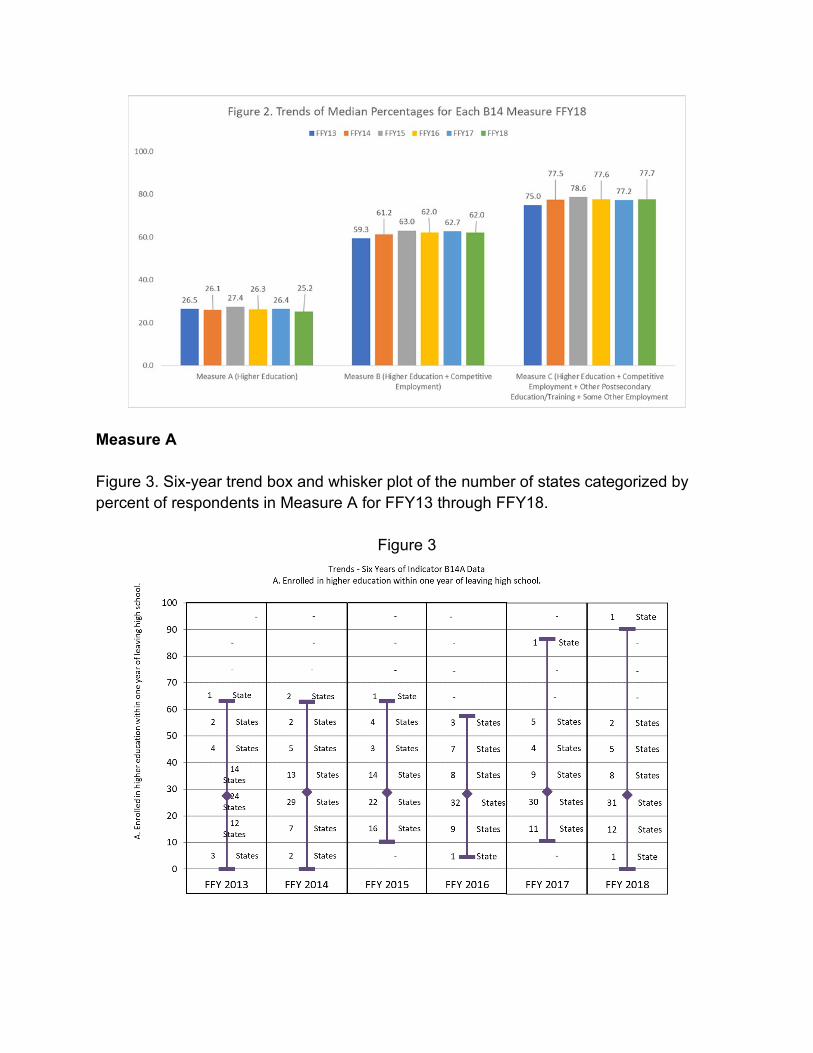
Measure A
Figure 3. Six-year trend box and whisker plot of the number of states categorized by percent of respondents in Measure A for FFY13 through FFY18.
Figure 3
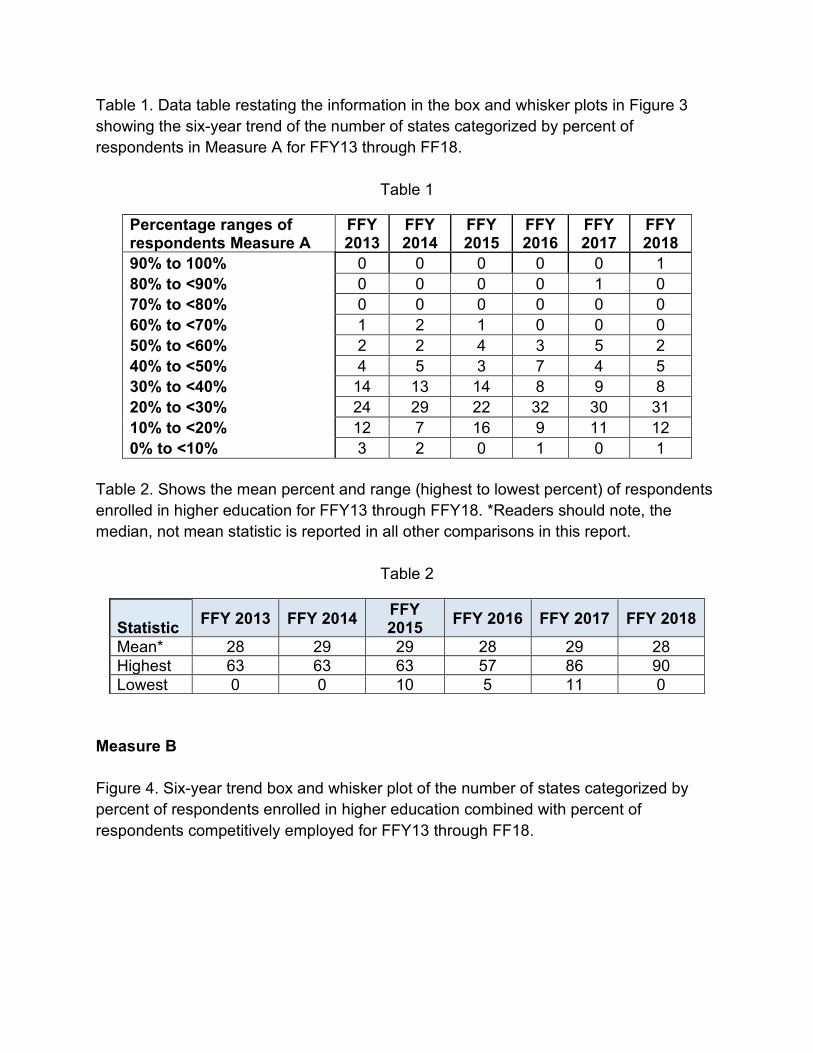
Table 1. Data table restating the information in the box and whisker plots in Figure 3 showing the six-year trend of the number of states categorized by percent of respondents in Measure A for FFY13 through FF18.
Table 1
Percentage ranges of respondents Measure A
FFY 2013
FFY 2014
FFY 2015
FFY 2016
FFY 2017
FFY 2018
90% to 100% 0 0 0 0 0 1 80% to <90% 0 0 0 0 1 0 70% to <80% 0 0 0 0 0 0 60% to <70% 1 2 1 0 0 0 50% to <60% 2 2 4 3 5 2 40% to <50% 4 5 3 7 4 5 30% to <40% 14 13 14 8 9 8 20% to <30% 24 29 22 32 30 31 10% to <20% 12 7 16 9 11 12 0% to <10% 3 2 0 1 0 1
Table 2. Shows the mean percent and range (highest to lowest percent) of respondents enrolled in higher education for FFY13 through FFY18. *Readers should note, the median, not mean statistic is reported in all other comparisons in this report.
Table 2
Statistic FFY 2013 FFY 2014 FFY 2015 FFY 2016 FFY 2017 FFY 2018
Mean* 28 29 29 28 29 28 Highest 63 63 63 57 86 90 Lowest 0 0 10 5 11 0
Measure B
Figure 4. Six-year trend box and whisker plot of the number of states categorized by percent of respondents enrolled in higher education combined with percent of respondents competitively employed for FFY13 through FF18.
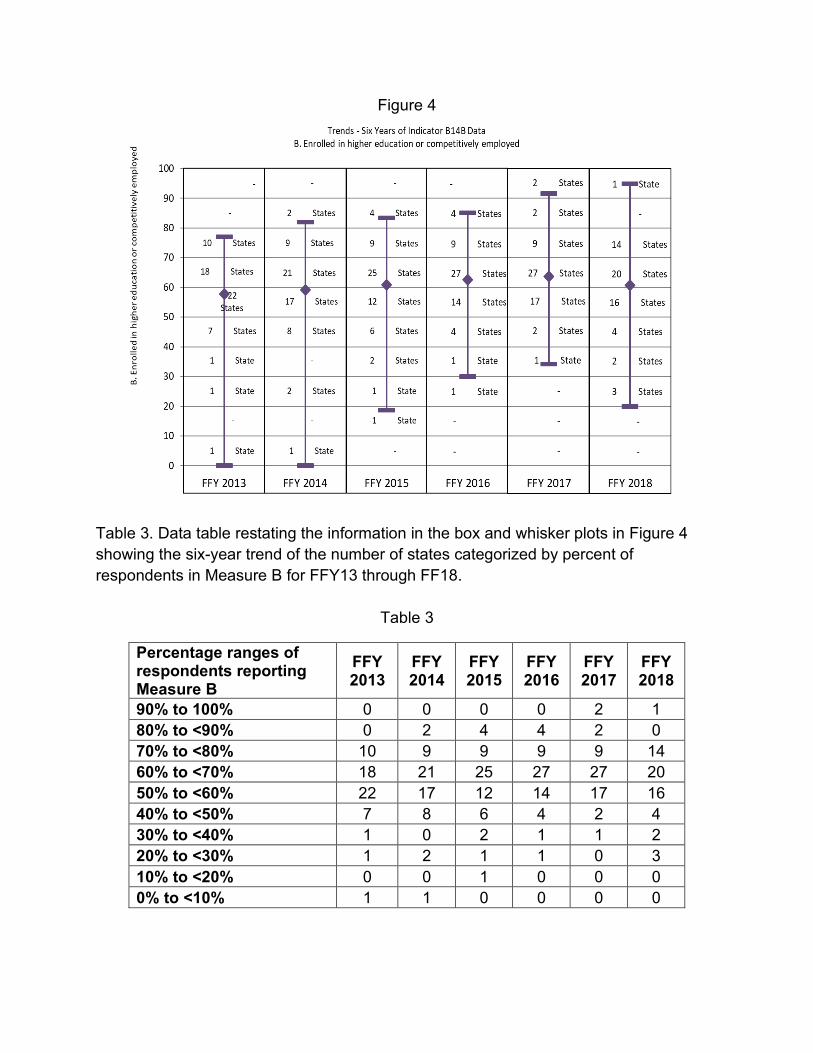
Figure 4
Table 3. Data table restating the information in the box and whisker plots in Figure 4 showing the six-year trend of the number of states categorized by percent of respondents in Measure B for FFY13 through FF18.
Table 3
Percentage ranges of respondents reporting Measure B
FFY 2013
FFY 2014
FFY 2015
FFY 2016
FFY 2017
FFY 2018
90% to 100% 0 0 0 0 2 1 80% to <90% 0 2 4 4 2 0 70% to <80% 10 9 9 9 9 14 60% to <70% 18 21 25 27 27 20 50% to <60% 22 17 12 14 17 16 40% to <50% 7 8 6 4 2 4 30% to <40% 1 0 2 1 1 2 20% to <30% 1 2 1 1 0 3 10% to <20% 0 0 1 0 0 0 0% to <10% 1 1 0 0 0 0
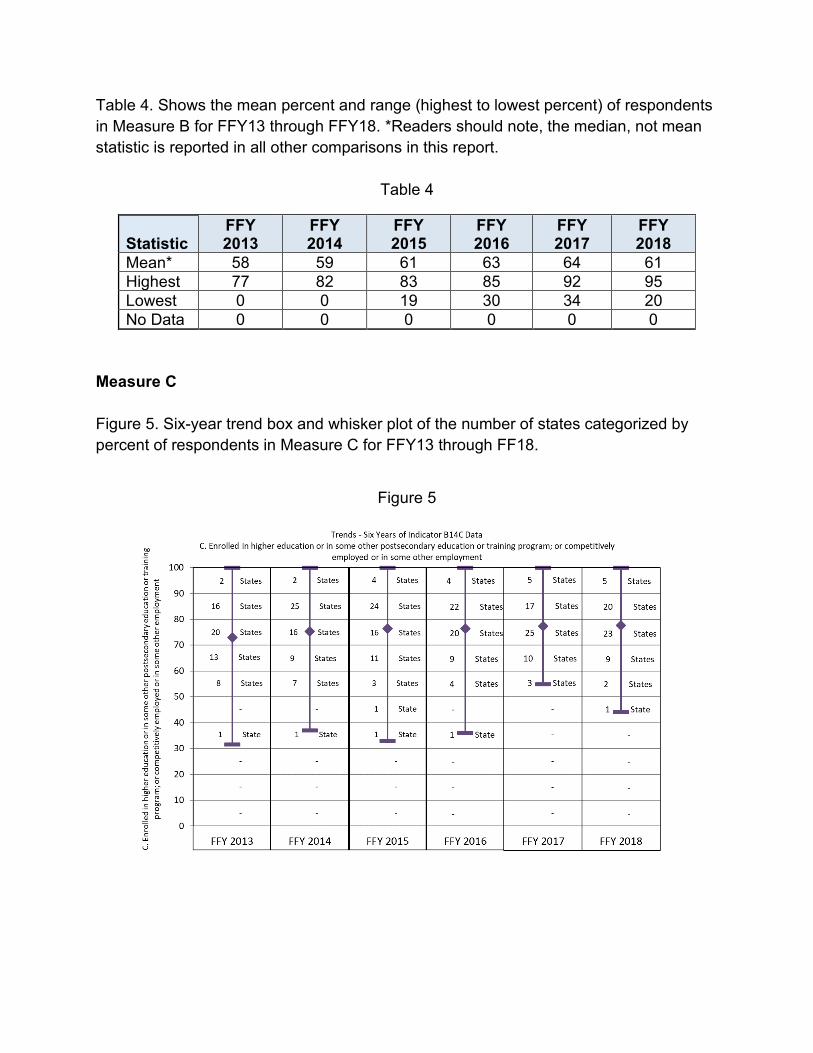
Table 4. Shows the mean percent and range (highest to lowest percent) of respondents in Measure B for FFY13 through FFY18. *Readers should note, the median, not mean statistic is reported in all other comparisons in this report.
Table 4
Statistic FFY 2013
FFY 2014
FFY 2015
FFY 2016
FFY 2017
FFY 2018
Mean* 58 59 61 63 64 61 Highest 77 82 83 85 92 95 Lowest 0 0 19 30 34 20 No Data 0 0 0 0 0 0
Measure C
Figure 5. Six-year trend box and whisker plot of the number of states categorized by percent of respondents in Measure C for FFY13 through FF18.
Figure 5

Table 5. Data table restating the information in the box and whisker plots in Figure 5 showing the six-year trend of the number of states categorized by percent of respondents in Measure C for FFY13 through FF18.
Table 5
Percentage ranges of respondents reporting Measure C
FFY 2013
FFY 2014
FFY 2015
FFY 2016
FFY 2017
FFY 2018
90% to 100% 2 2 4 4 5 5 80% to <90% 16 25 24 22 17 20 70% to <80% 20 16 16 20 25 23 60% to <70% 13 9 11 9 10 9 50% to <60% 8 7 3 4 3 2 40% to <50% 0 0 1 0 0 1 30% to <40% 1 1 1 1 0 0 0% to <30% 0 0 0 0 0 0
Table 6. Shows the mean percent and range (highest to lowest percent) of respondents in Measure C for FFY13 through FFY18. *Readers should note, the median, not mean statistic is reported in all other comparisons of this report.
Table 6
Statistic FFY 2013
FFY 2014
FFY 2015
FFY 2016
FFY 2017
FFY 2018
Mean* 73 75 76 76 77 78 Highest 100 100 100 100 100 100 Lowest 32 37 33 36 55 44
CONCLUSION
In response to the requirements for Indicator B14, post-school outcomes, states have developed a data collection process for collecting and analyzing post-school outcomes for former students with disabilities. Most states make a concerted effort to collect reliable and valid data in a practical manner.
As more states strive to use their post-school outcomes data to drive decisions at state and local levels, it is imperative that these data represent the youth who had an IEP in effect at the time they exit school. Unfortunately, many states do not report response rate nor provide enough information to calculate response rate and representation. For NTACT staff to verify key data elements such as response rate and representation, states must go beyond the reporting prompts in GRADS360. For example, to verify response rate requires states to report the total number of leavers who exited school in
the reporting year; a data element not requested in GRADS360. Without the total number of leavers reported, response rate cannot be calculated, nor can the numbers and percentages reported in each measure be verified to ensure unduplicated counts- which has been a persistent error in prior years.
To verify the extent to which respondents are similar to the targeted leaver group, states need to calculate and report the proportion of youth in the target leaver group and respondent group by each demographic category (i.e., disability, gender, method of exit, and race/ethnicity). The addition of the prompt Are the response data representative of the demographics of youth who are no longer in school and had IEPs in effect at the time they left school? is useful. However, several states continue to provide contradictive, incomplete, or no data to support the response. The NTACT Response Calculator, originally developed under NPSO, was created to facilitate the calculating, and reporting of proportions between the two groups on demographic variables and identify where important differences exist between the two groups on those variables. The Response Calculator is available at https://transitionta.org/node/1978
Overall, based on information provided in the states’ APR, improvement in post-school outcomes demonstrates slight improved engagement of young adults’ post-school in further education and or employment. Using these data, disaggregated, at a local level can inform programmatic changes that can continue to improve outcomes for youth with disabilities leaving school.
INDICATORS B15 & B16: DISPUTE RESOLUTION Completed by the Center for Appropriate Dispute Resolution in Special Education (CADRE).
INTRODUCTION
The IDEA requires states receiving grants under Part B to make available four dispute resolution processes, and to report annually to the U.S. Department of Education Office of Special Education Programs (OSEP) on their performance.1 The processes, which include signed written complaints, mediation, due process complaints, and resolution meetings associated with due process, offer formal means for resolving disagreements and issues arising under the IDEA.
The following are brief analyses of states’ Federal Fiscal Year (FFY) 2018 Annual Performance Reports (APRs) for Indicators B15 (Resolution Meetings Resulting in Written Settlement Agreements) and B16 (Mediations Resulting in Written Agreements).2
DATA SOURCES AND METHODOLOGY
Data sources for this report include FFY 2018 APRs and Section 618 data, available through the OSEP Collaboration Space. These analyses are specific to state performance on Indicators B15 and B16, and do not present a complete picture of dispute resolution activity.
SUMMARY BY INDICATOR
Indicator B15: Resolution Meetings Resulting in Written Settlement Agreements Indicator B15 is a performance indicator that documents the percentage of resolution meetings resulting in written settlement agreements. States are required to report any activity relating to Indicator B15; however, they are not required to set a performance target if fewer than ten resolution meetings are held in a single year.
In 2018-2019, there were 14,074 resolution meetings held. A few states account for most resolution meeting activity, with one State reporting 9,702 resolution meetings, or 69% of all resolution activity.
The performance bands in Figure 1 (below) display states’ performance on the percentage of resolution sessions resulting in written settlement agreements across the last six years. Fifty-three States reported Indicator B15 activity in 2018-19; seven States/entities reported no activity.
The purple diamonds on each performance band in Figure 1 indicate the mean, or
1 For the purposes of this report, the terms “states” and “states/entities” are used interchangeably to refer to all 60 Part B grant recipients (i.e., the fifty States, the District of Columbia, the Bureau of Indian Education (BIE), Puerto Rico, the Virgin Islands, American Samoa, Guam, the Northern Mariana Islands, the Republic of the Marshall Islands, the Federated States of Micronesia, and the Republic of Palau). 2 The reporting period (July 1, 2018-June 30, 2019) began during FFY 2018.
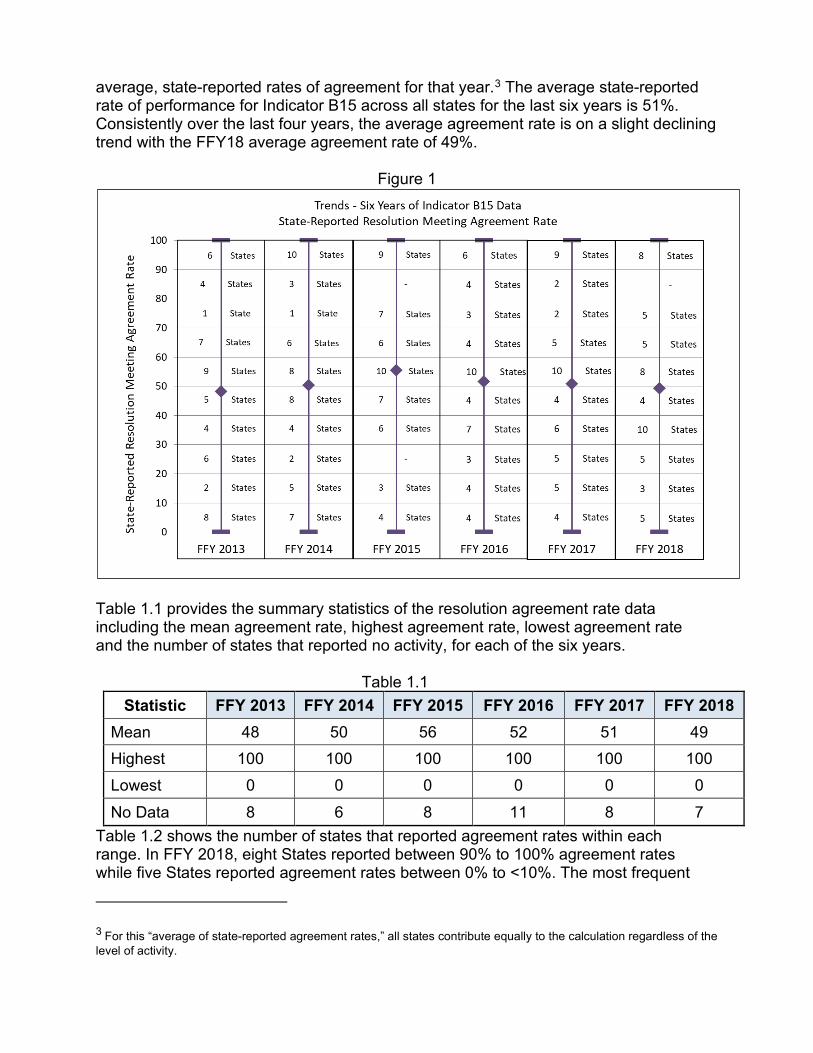
average, state-reported rates of agreement for that year.3 The average state-reported rate of performance for Indicator B15 across all states for the last six years is 51%. Consistently over the last four years, the average agreement rate is on a slight declining trend with the FFY18 average agreement rate of 49%.
Figure 1
Table 1.1 provides the summary statistics of the resolution agreement rate data including the mean agreement rate, highest agreement rate, lowest agreement rate and the number of states that reported no activity, for each of the six years.
Table 1.1 Statistic FFY 2013 FFY 2014 FFY 2015 FFY 2016 FFY 2017 FFY 2018
Mean 48 50 56 52 51 49 Highest 100 100 100 100 100 100 Lowest 0 0 0 0 0 0 No Data 8 6 8 11 8 7
Table 1.2 shows the number of states that reported agreement rates within each range. In FFY 2018, eight States reported between 90% to 100% agreement rates while five States reported agreement rates between 0% to <10%. The most frequent
3 For this “average of state-reported agreement rates,” all states contribute equally to the calculation regardless of the level of activity.
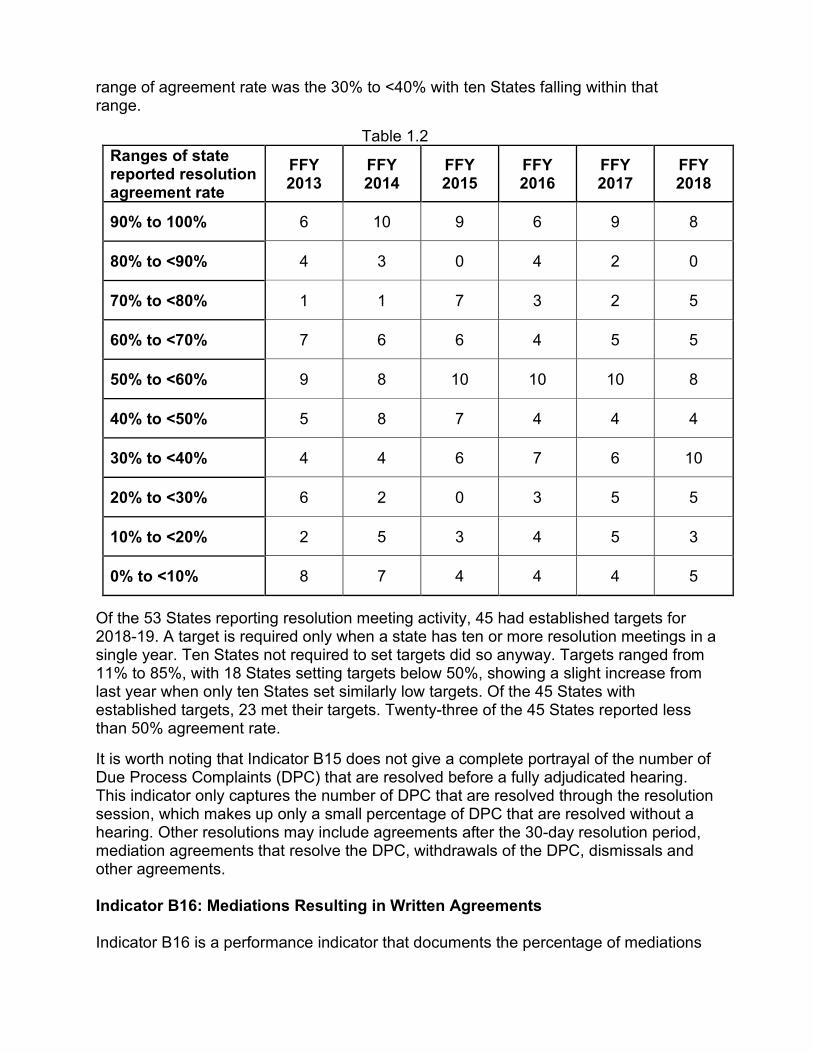
range of agreement rate was the 30% to <40% with ten States falling within that range.
Table 1.2
Ranges of state reported resolution agreement rate
FFY 2013
FFY 2014
FFY 2015
FFY 2016
FFY 2017
FFY 2018
90% to 100% 6 10 9 6 9 8
80% to <90% 4 3 0 4 2 0
70% to <80% 1 1 7 3 2 5
60% to <70% 7 6 6 4 5 5
50% to <60% 9 8 10 10 10 8
40% to <50% 5 8 7 4 4 4
30% to <40% 4 4 6 7 6 10
20% to <30% 6 2 0 3 5 5
10% to <20% 2 5 3 4 5 3
0% to <10% 8 7 4 4 4 5
Of the 53 States reporting resolution meeting activity, 45 had established targets for 2018-19. A target is required only when a state has ten or more resolution meetings in a single year. Ten States not required to set targets did so anyway. Targets ranged from 11% to 85%, with 18 States setting targets below 50%, showing a slight increase from last year when only ten States set similarly low targets. Of the 45 States with established targets, 23 met their targets. Twenty-three of the 45 States reported less than 50% agreement rate.
It is worth noting that Indicator B15 does not give a complete portrayal of the number of Due Process Complaints (DPC) that are resolved before a fully adjudicated hearing. This indicator only captures the number of DPC that are resolved through the resolution session, which makes up only a small percentage of DPC that are resolved without a hearing. Other resolutions may include agreements after the 30-day resolution period, mediation agreements that resolve the DPC, withdrawals of the DPC, dismissals and other agreements.
Indicator B16: Mediations Resulting in Written Agreements
Indicator B16 is a performance indicator that documents the percentage of mediations
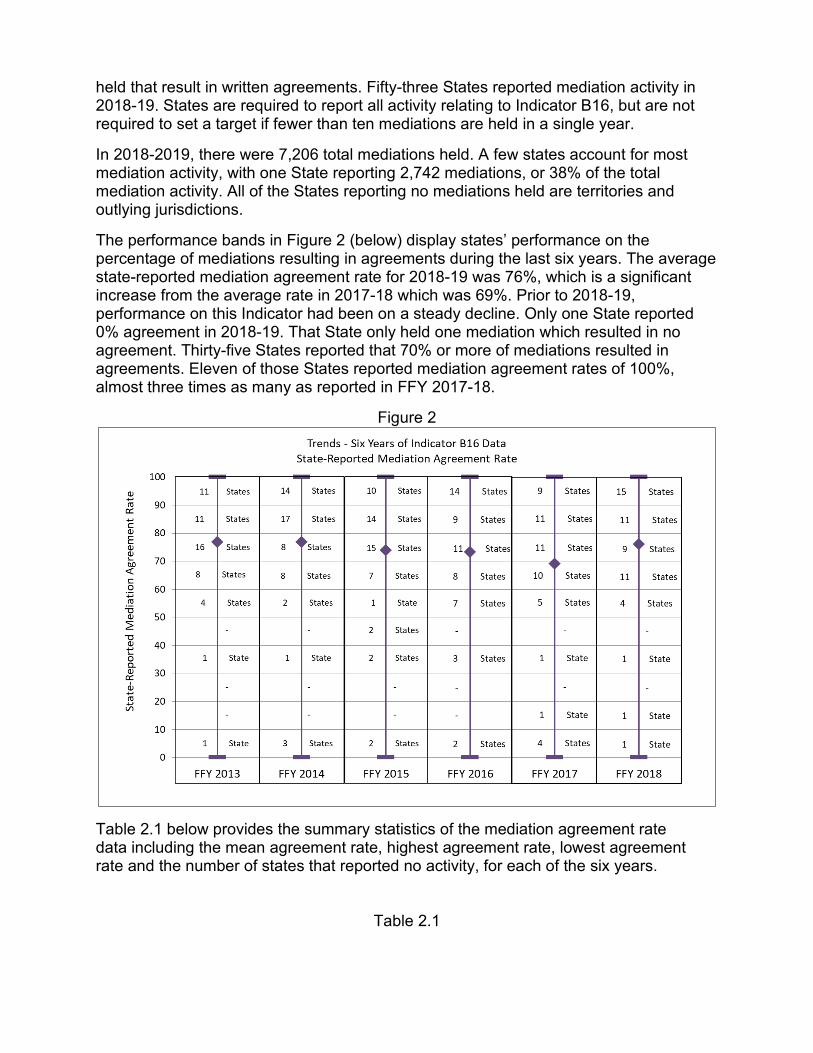
held that result in written agreements. Fifty-three States reported mediation activity in 2018-19. States are required to report all activity relating to Indicator B16, but are not required to set a target if fewer than ten mediations are held in a single year.
In 2018-2019, there were 7,206 total mediations held. A few states account for most mediation activity, with one State reporting 2,742 mediations, or 38% of the total mediation activity. All of the States reporting no mediations held are territories and outlying jurisdictions.
The performance bands in Figure 2 (below) display states’ performance on the percentage of mediations resulting in agreements during the last six years. The average state-reported mediation agreement rate for 2018-19 was 76%, which is a significant increase from the average rate in 2017-18 which was 69%. Prior to 2018-19, performance on this Indicator had been on a steady decline. Only one State reported 0% agreement in 2018-19. That State only held one mediation which resulted in no agreement. Thirty-five States reported that 70% or more of mediations resulted in agreements. Eleven of those States reported mediation agreement rates of 100%, almost three times as many as reported in FFY 2017-18.
Figure 2
Table 2.1 below provides the summary statistics of the mediation agreement rate data including the mean agreement rate, highest agreement rate, lowest agreement rate and the number of states that reported no activity, for each of the six years.
Table 2.1
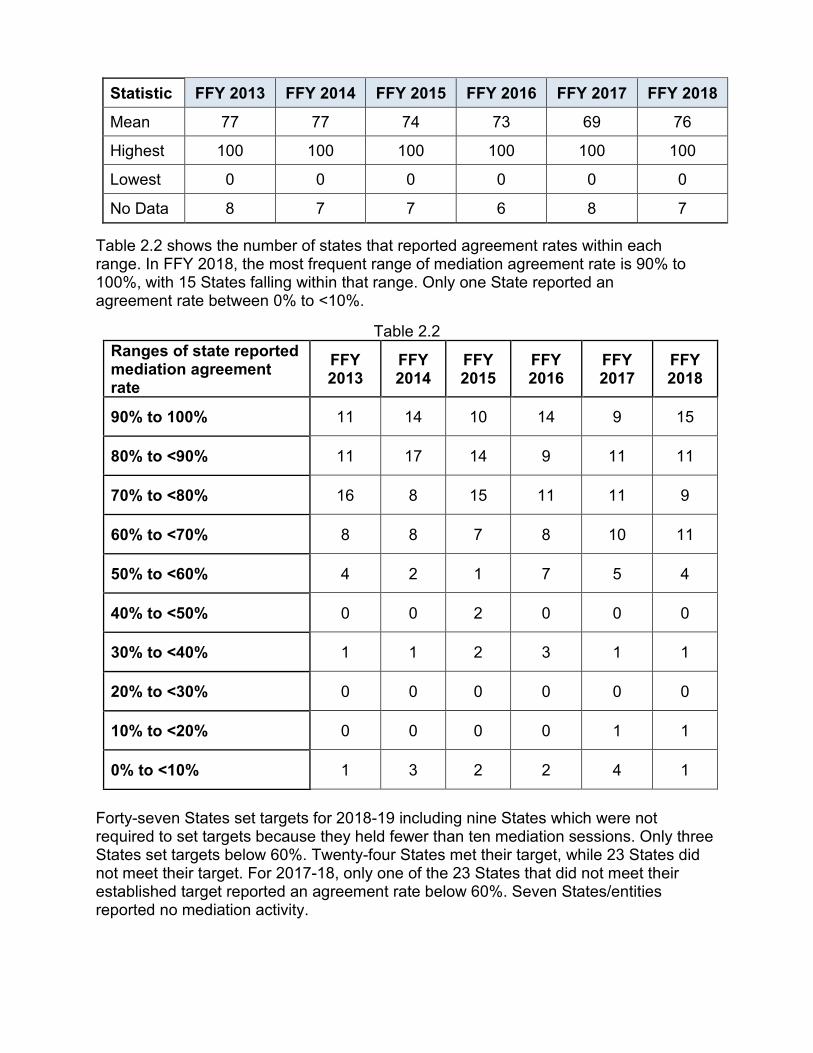
Statistic FFY 2013 FFY 2014 FFY 2015 FFY 2016 FFY 2017 FFY 2018
Mean 77 77 74 73 69 76
Highest 100 100 100 100 100 100
Lowest 0 0 0 0 0 0
No Data 8 7 7 6 8 7
Table 2.2 shows the number of states that reported agreement rates within each range. In FFY 2018, the most frequent range of mediation agreement rate is 90% to 100%, with 15 States falling within that range. Only one State reported an agreement rate between 0% to <10%.
Table 2.2 Ranges of state reported mediation agreement rate
FFY 2013
FFY 2014
FFY 2015
FFY 2016
FFY 2017
FFY 2018
90% to 100% 11 14 10 14 9 15
80% to <90% 11 17 14 9 11 11
70% to <80% 16 8 15 11 11 9
60% to <70% 8 8 7 8 10 11
50% to <60% 4 2 1 7 5 4
40% to <50% 0 0 2 0 0 0
30% to <40% 1 1 2 3 1 1
20% to <30% 0 0 0 0 0 0
10% to <20% 0 0 0 0 1 1
0% to <10% 1 3 2 2 4 1
Forty-seven States set targets for 2018-19 including nine States which were not required to set targets because they held fewer than ten mediation sessions. Only three States set targets below 60%. Twenty-four States met their target, while 23 States did not meet their target. For 2017-18, only one of the 23 States that did not meet their established target reported an agreement rate below 60%. Seven States/entities reported no mediation activity.
CONCLUSION Historical data remains consistent in that state-reported mediation agreement rates outperform those of resolution meeting agreement rates. Despite the drop in average state-reported mediation agreement rate, there remains consistent high performance in mediation agreement rates. This result continues to endorse that the use of a neutral third party helps educators and families involved in a dispute successfully reach agreement.
INDICATOR 17: STATE SYSTEMIC IMPROVEMENT PLAN — Phase III Prepared by the National Center for Systemic Improvement (NCSI) with support from the IDEA Data Center (IDC) and the National Center on Educational Outcomes (NCEO).
INTRODUCTION The State Systemic Improvement Plan (SSIP) is a comprehensive, multiyear plan that outlines a state’s strategy for improving results for children with disabilities. The Office of Special Education Programs (OSEP) requires that each state plan will focus on results that will drive innovation with the use of evidence-based practices (EBPs) in the delivery of services to children with disabilities. The SSIP is to be developed and implemented in three phases over the five-year life of each state’s current State Performance Plan/Annual Performance Report (SPP/APR). Phase I of the SSIP was submitted by states on or before April 1, 2015; Phase II was submitted by states on or before April 4, 2016; Phase III-Year 1 was submitted by states on or before April 3, 2017; Phase III-Year 2 was submitted by states on or before April 2, 2018; Phase III-Year 3 was submitted by states on or before April 1, 2019; and Phase III-Year 4, which is the subject of this report, was due to OSEP by April 1, 2020.
Engaging stakeholders, including parents of children with disabilities, general education partners, state advisory panels, parent training and information centers, and others, is a critical component of efforts to improve results for children with disabilities. Consequently, as in earlier phases, states were expected to engage stakeholders and provide descriptions of their involvement in developing and implementing Phase III of the SSIP.
This report is based on information included in the Phase III-Year 4 SSIP submissions of a total of 60 Part B agencies, which include states, commonwealths, territories, and the Bureau of Indian Education. These agencies are all referred to as “states” throughout this report.
MEASUREMENT TABLE EXPECTATIONS As detailed for Part B Indicator 17 (SSIP) in the federal fiscal year (FFY) 2018 Part B Indicator Measurement Table, each state in Phase III must assess and report on its progress in implementing the SSIP, consistent with its evaluation described in Phase II, using the following reporting requirements:
• Baseline data must be established by each state (expressed as a percentage and aligned with the State Identified Measurable Result (SIMR) for Children with Disabilities.
• A measurable and rigorous target (expressed as a percentage) for the SIMR must be included for each of the five years from FFY 2014 through FFY 2018. The final year’s target must show improvement over the baseline percentage.
• Updated data (expressed as percentages) for this specific FFY; those data must be aligned with the SIMR for Children with Disabilities.
• Reporting on whether the state met its target. • The Phase III reporting on whether the state met its target must include the
following:
o Data and analysis on the extent to which the state has made progress toward and/or met the state-established short- and long-term objectives for implementation of the SSIP
o Data and analysis on the state’s progress in achieving the SIMR o A description of how the evaluation data support continuing to implement
the SSIP without modifications — if such continuation is what the state intends to do
o A description of any changes to the activities, strategies, or timelines described in Phase II
o A rationale for any revisions the state has made or plans to make in the SSIP as a result of implementation, analysis, and evaluation
o A narrative or graphic representation (e.g., a logic model) of the principal activities, measures, and outcomes that were implemented since the state’s last SSIP submission
o A summary of the infrastructure improvement strategies that were implemented and the short-term outcomes achieved, including the measures or rationale used by the state and stakeholders to assess and communicate achievement
o An explanation of how these infrastructure improvement strategies support system change, and are necessary for (a) achievement of the SIMR, (b) sustainability of systems improvement efforts, and/or (c) scale-up
o A description of the next steps for each infrastructure improvement strategy and the anticipated outcomes to be attained during the next fiscal year
o A summary of the specific EBPs that were implemented and the strategies or activities that supported their selection and ensured their use with fidelity
o A description of how the EBPs and activities or strategies that support their use are intended to impact the SIMR by changing programs; district policies, procedures, and/or practices; practices (i.e., behaviors) of teacher or providers; parent and caregiver outcomes; and/or child outcomes
o A description of any additional data (e.g., progress monitoring data) that were collected to support the ongoing use of the EBPs and inform decision-making for the next year of SSIP implementation
o A description of meaningful stakeholder engagement, including describing the specific strategies implemented to engage stakeholders in key improvement efforts and how the state addressed concerns, if any, raised by stakeholders through its engagement activities
REVIEW PROCESS A review protocol and a writing process were developed to analyze the Phase III-Year 4 SSIP submissions systematically and consistently from all 60 Part B states. A data collection tool was created based on OSEP’s State Phase III Report Organizational Outline. The review team consisted of 29 individuals from the NCSI, IDC, and NCEO technical assistance (TA) centers as primary coders, and each reviewed up to three SSIPs and coded them using a data collection tool developed by NCSI. Prior to the reviews, initial training was conducted on the scoring process and two reliability trainings were held for all individuals who would be involved in scoring or conducting reliability tests, with data collected to determine a reliability rating of at least 80 percent agreement among reviewers on each of the coded choice questions. To further ensure reliability among reviewers during the data collection phase, three additional reliability checkers were assigned to conduct a review of randomly selected states and items following the individual reviews. Their results were compared to the results of the primary coder to establish an inter-rater reliability of 89% (see Appendix 1). An additional review was conducted to ensure that all reviewer responses were entered accurately into the data collection tool. Following this review, an item-by-item review was conducted to ensure that all items had an accurate number of responses.
The data collection tool team created categories of “could not tell,” “did not describe,” and “not applicable (N/A)” for questions in the data collection tool that states were not required to answer or address in their SSIP reports. Answers were coded to those responses when one of the other response options in the data collection tool was not apparent from a review of the SSIP. Also, an “other” category was created to capture information from the SSIPs that was not covered by one of the main response options. After reviews were completed for all 60 states, a writing team from NCSI analyzed the data from the reviews and prepared this report.
This analysis of the Part B Phase III-Year 4 SSIPs is based on OSEP’s State Phase III Report Organizational Outline and is divided into sections that address the elements reported on by states. These include a summary of progress toward achieving SIMR targets, implementation of the SSIP, evaluation of outcomes, data quality issues, and plans for next year. The report also provides information about stakeholder involvement in states’ SSIP efforts, and about states’ revisions to SSIP and SIMR, including updates on baseline and target data. The n size for all data, figures, and tables is 60 unless otherwise noted.
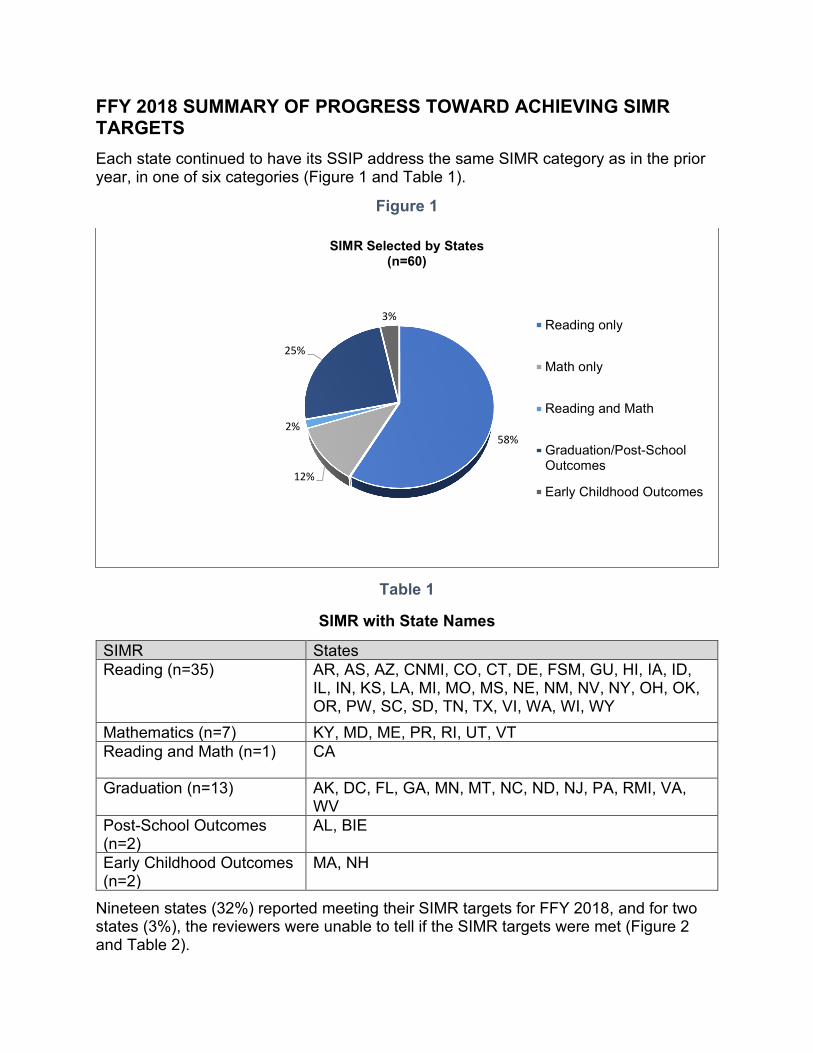
FFY 2018 SUMMARY OF PROGRESS TOWARD ACHIEVING SIMR TARGETS Each state continued to have its SSIP address the same SIMR category as in the prior year, in one of six categories (Figure 1 and Table 1).
Figure 1
58%
12%
2%
25%
3%
SIMR Selected by States(n=60)
Reading only
Math only
Reading and Math
Graduation/Post-SchoolOutcomes
Early Childhood Outcomes
Table 1
SIMR with State Names
SIMR States Reading (n=35) AR, AS, AZ, CNMI, CO, CT, DE, FSM, GU, HI, IA, ID,
IL, IN, KS, LA, MI, MO, MS, NE, NM, NV, NY, OH, OK, OR, PW, SC, SD, TN, TX, VI, WA, WI, WY
Mathematics (n=7) KY, MD, ME, PR, RI, UT, VT Reading and Math (n=1) CA
Graduation (n=13) AK, DC, FL, GA, MN, MT, NC, ND, NJ, PA, RMI, VA, WV
Post-School Outcomes (n=2)
AL, BIE
Early Childhood Outcomes (n=2)
MA, NH
Nineteen states (32%) reported meeting their SIMR targets for FFY 2018, and for two states (3%), the reviewers were unable to tell if the SIMR targets were met (Figure 2 and Table 2).

Figure 2
32%
65%
3%
States Meeting SIMR Targets(n=60)
Yes
No
Could not tell
Table 2
States Meeting SIMR Targets
SIMR States Reading AS, AZ, CT, FSM, ID, KS, MI, WY
Mathematics MD, VT, PR
Reading and Math None
Graduation AK, AL, BIE, FL, GA, MN, RMI
Post-School Outcomes None
Early Childhood Outcomes NH
STATES’ REVISIONS TO SSIP AND SIMR Some states reported multiple types of revisions and rationales for making changes to their SSIP and SIMR, so the total percentages in Figures 3 and 4 may be greater than 100 percent.
As states completed this fourth year of implementation of their SSIPs, more than half (65%, 39 states) found it necessary or advisable to revise their SSIPs. Among the 39 states making revisions, they most frequently changed their improvement strategies/activities (67%, 26 states), followed by their evaluation plan (51%, 20 states) (Figure 3). Less frequently altered components included baseline data (21%, eight states), the targets (21%, eight states), and the theory of action (21%, eight states).
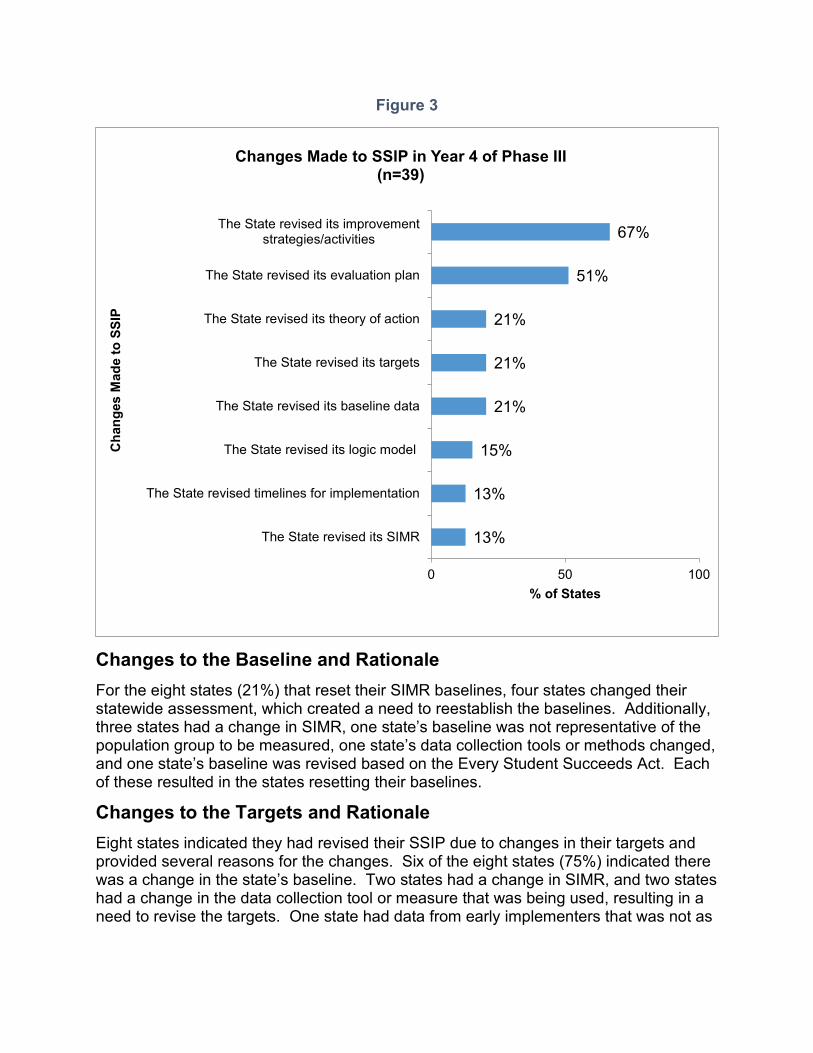
Figure 3
13%
13%
15%
21%
21%
21%
51%
67%
0 50 100
The State revised its SIMR
The State revised timelines for implementation
The State revised its logic model
The State revised its baseline data
The State revised its targets
The State revised its theory of action
The State revised its evaluation plan
The State revised its improvementstrategies/activities
% of States
Cha
nges
Mad
e to
SSI
P
Changes Made to SSIP in Year 4 of Phase III(n=39)
Changes to the Baseline and Rationale For the eight states (21%) that reset their SIMR baselines, four states changed their statewide assessment, which created a need to reestablish the baselines. Additionally, three states had a change in SIMR, one state’s baseline was not representative of the population group to be measured, one state’s data collection tools or methods changed, and one state’s baseline was revised based on the Every Student Succeeds Act. Each of these resulted in the states resetting their baselines.
Changes to the Targets and Rationale Eight states indicated they had revised their SSIP due to changes in their targets and provided several reasons for the changes. Six of the eight states (75%) indicated there was a change in the state’s baseline. Two states had a change in SIMR, and two states had a change in the data collection tool or measure that was being used, resulting in a need to revise the targets. One state had data from early implementers that was not as
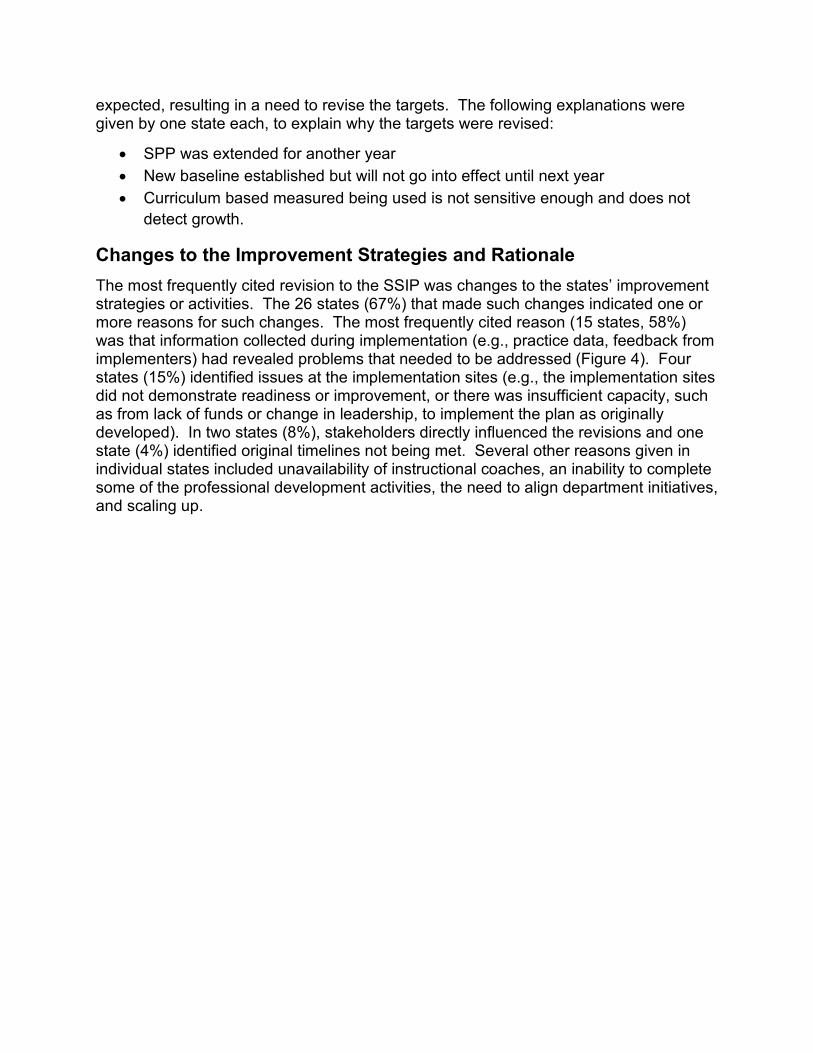
expected, resulting in a need to revise the targets. The following explanations were given by one state each, to explain why the targets were revised:
• SPP was extended for another year • New baseline established but will not go into effect until next year • Curriculum based measured being used is not sensitive enough and does not
detect growth.
Changes to the Improvement Strategies and Rationale The most frequently cited revision to the SSIP was changes to the states’ improvement strategies or activities. The 26 states (67%) that made such changes indicated one or more reasons for such changes. The most frequently cited reason (15 states, 58%) was that information collected during implementation (e.g., practice data, feedback from implementers) had revealed problems that needed to be addressed (Figure 4). Four states (15%) identified issues at the implementation sites (e.g., the implementation sites did not demonstrate readiness or improvement, or there was insufficient capacity, such as from lack of funds or change in leadership, to implement the plan as originally developed). In two states (8%), stakeholders directly influenced the revisions and one state (4%) identified original timelines not being met. Several other reasons given in individual states included unavailability of instructional coaches, an inability to complete some of the professional development activities, the need to align department initiatives, and scaling up.
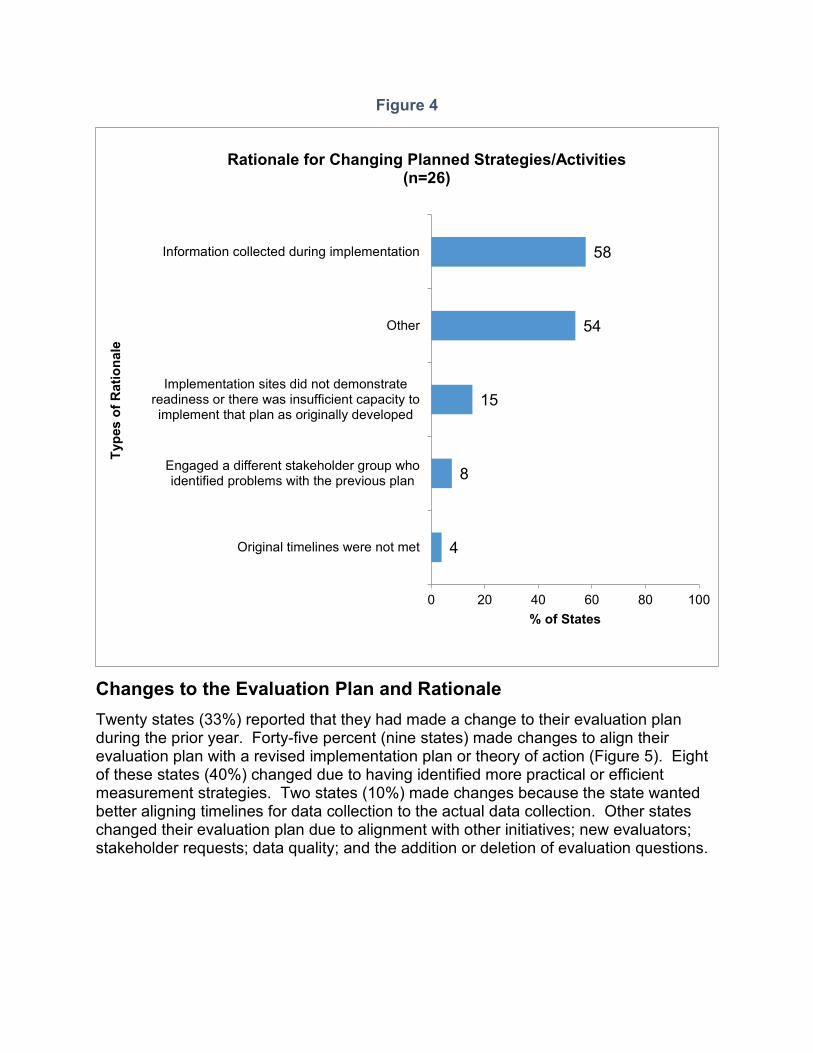
Figure 4
4
8
15
54
58
0 20 40 60 80 100
Original timelines were not met
Engaged a different stakeholder group whoidentified problems with the previous plan
Implementation sites did not demonstratereadiness or there was insufficient capacity toimplement that plan as originally developed
Other
Information collected during implementation
% of States
Type
s of
Rat
iona
le
Rationale for Changing Planned Strategies/Activities(n=26)
Changes to the Evaluation Plan and Rationale Twenty states (33%) reported that they had made a change to their evaluation plan during the prior year. Forty-five percent (nine states) made changes to align their evaluation plan with a revised implementation plan or theory of action (Figure 5). Eight of these states (40%) changed due to having identified more practical or efficient measurement strategies. Two states (10%) made changes because the state wanted better aligning timelines for data collection to the actual data collection. Other states changed their evaluation plan due to alignment with other initiatives; new evaluators; stakeholder requests; data quality; and the addition or deletion of evaluation questions.
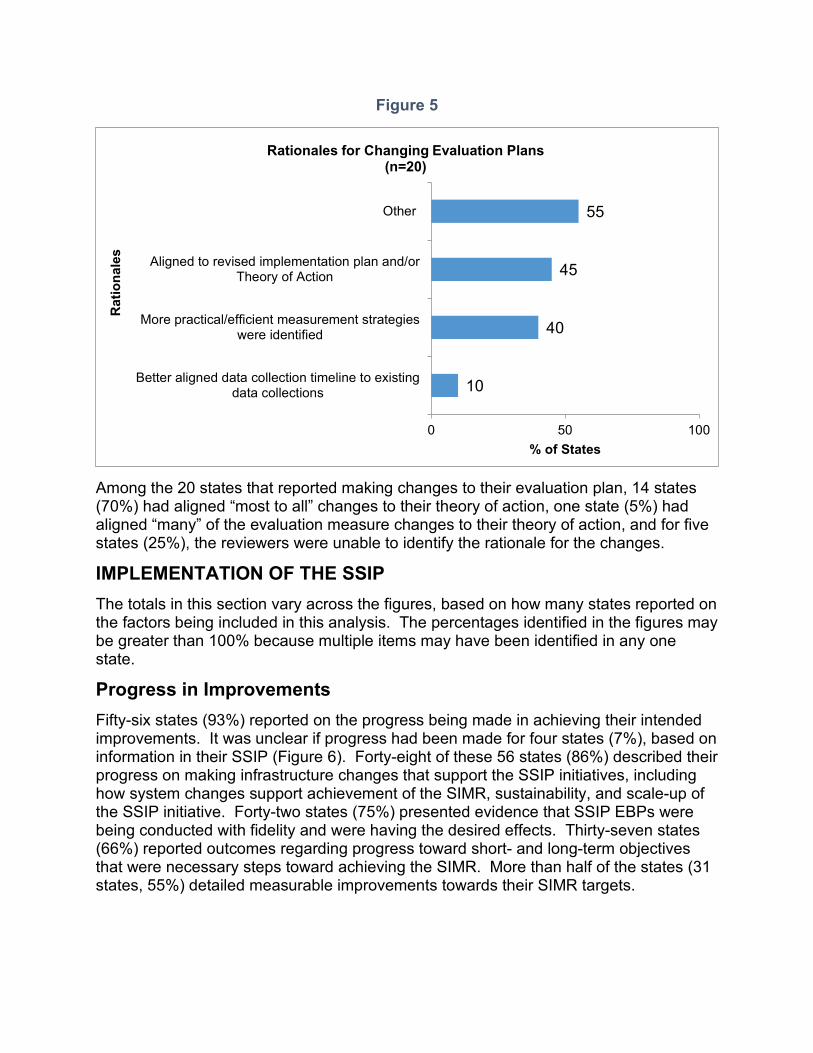
Figure 5
10
40
45
55
0 50 100
Better aligned data collection timeline to existingdata collections
More practical/efficient measurement strategieswere identified
Aligned to revised implementation plan and/orTheory of Action
Other
% of States
Rat
iona
les
Rationales for Changing Evaluation Plans (n=20)
Among the 20 states that reported making changes to their evaluation plan, 14 states (70%) had aligned “most to all” changes to their theory of action, one state (5%) had aligned “many” of the evaluation measure changes to their theory of action, and for five states (25%), the reviewers were unable to identify the rationale for the changes.
IMPLEMENTATION OF THE SSIP The totals in this section vary across the figures, based on how many states reported on the factors being included in this analysis. The percentages identified in the figures may be greater than 100% because multiple items may have been identified in any one state.
Progress in Improvements Fifty-six states (93%) reported on the progress being made in achieving their intended improvements. It was unclear if progress had been made for four states (7%), based on information in their SSIP (Figure 6). Forty-eight of these 56 states (86%) described their progress on making infrastructure changes that support the SSIP initiatives, including how system changes support achievement of the SIMR, sustainability, and scale-up of the SSIP initiative. Forty-two states (75%) presented evidence that SSIP EBPs were being conducted with fidelity and were having the desired effects. Thirty-seven states (66%) reported outcomes regarding progress toward short- and long-term objectives that were necessary steps toward achieving the SIMR. More than half of the states (31 states, 55%) detailed measurable improvements towards their SIMR targets.
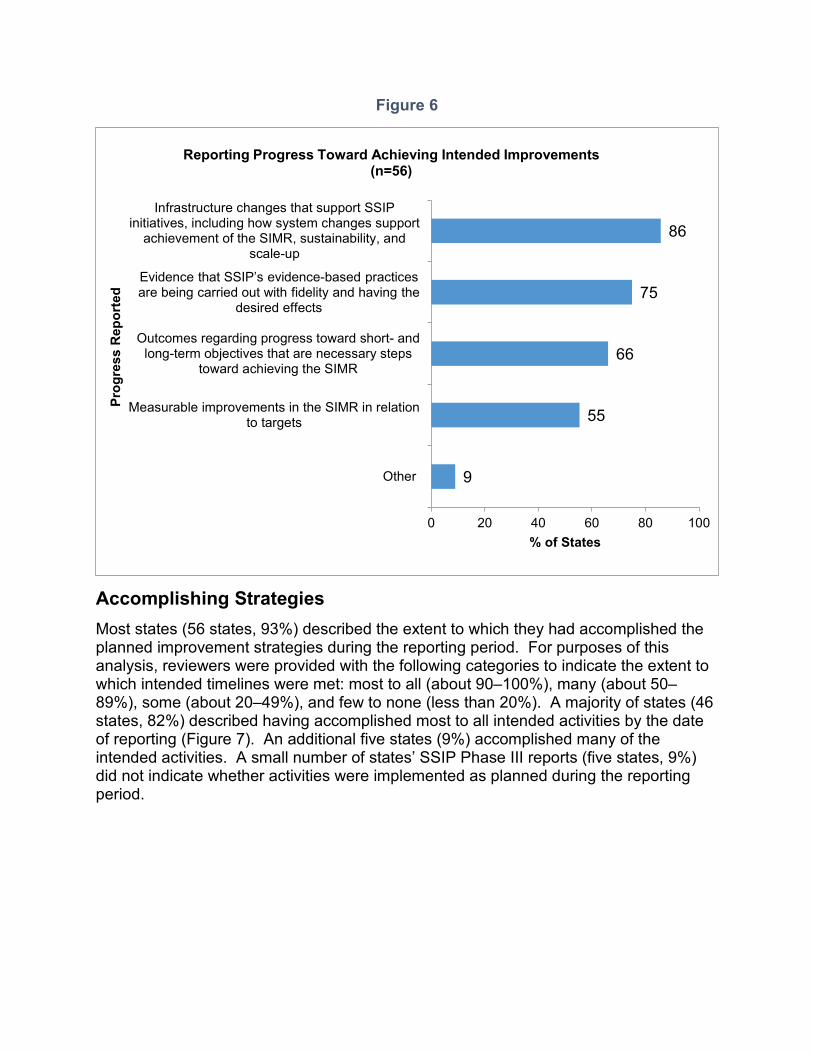
Figure 6
9
55
66
75
86
0 20 40 60 80 100
Other
Measurable improvements in the SIMR in relationto targets
Outcomes regarding progress toward short- andlong-term objectives that are necessary steps
toward achieving the SIMR
Evidence that SSIP’s evidence-based practices are being carried out with fidelity and having the
desired effects
Infrastructure changes that support SSIPinitiatives, including how system changes support
achievement of the SIMR, sustainability, andscale-up
% of States
Prog
ress
Rep
orte
d
Reporting Progress Toward Achieving Intended Improvements (n=56)
Accomplishing Strategies Most states (56 states, 93%) described the extent to which they had accomplished the planned improvement strategies during the reporting period. For purposes of this analysis, reviewers were provided with the following categories to indicate the extent to which intended timelines were met: most to all (about 90–100%), many (about 50–89%), some (about 20–49%), and few to none (less than 20%). A majority of states (46 states, 82%) described having accomplished most to all intended activities by the date of reporting (Figure 7). An additional five states (9%) accomplished many of the intended activities. A small number of states’ SSIP Phase III reports (five states, 9%) did not indicate whether activities were implemented as planned during the reporting period.
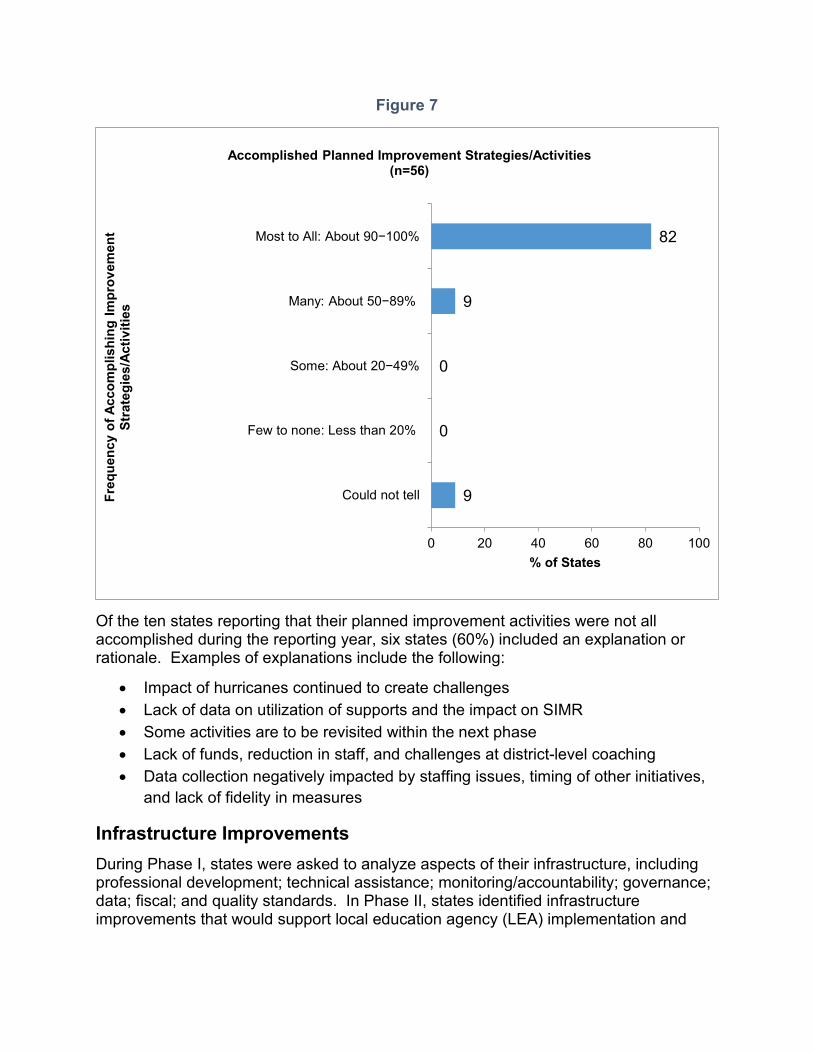
Figure 7
9
0
0
9
82
0 20 40 60 80 100
Could not tell
Few to none: Less than 20%
Some: About 20−49%
Many: About 50−89%
Most to All: About 90−100%
% of States
Freq
uenc
y of
Acc
ompl
ishi
ng Im
prov
emen
t St
rate
gies
/Act
iviti
es
Accomplished Planned Improvement Strategies/Activities(n=56)
Of the ten states reporting that their planned improvement activities were not all accomplished during the reporting year, six states (60%) included an explanation or rationale. Examples of explanations include the following:
• Impact of hurricanes continued to create challenges • Lack of data on utilization of supports and the impact on SIMR • Some activities are to be revisited within the next phase • Lack of funds, reduction in staff, and challenges at district-level coaching • Data collection negatively impacted by staffing issues, timing of other initiatives,
and lack of fidelity in measures
Infrastructure Improvements During Phase I, states were asked to analyze aspects of their infrastructure, including professional development; technical assistance; monitoring/accountability; governance; data; fiscal; and quality standards. In Phase II, states identified infrastructure improvements that would support local education agency (LEA) implementation and
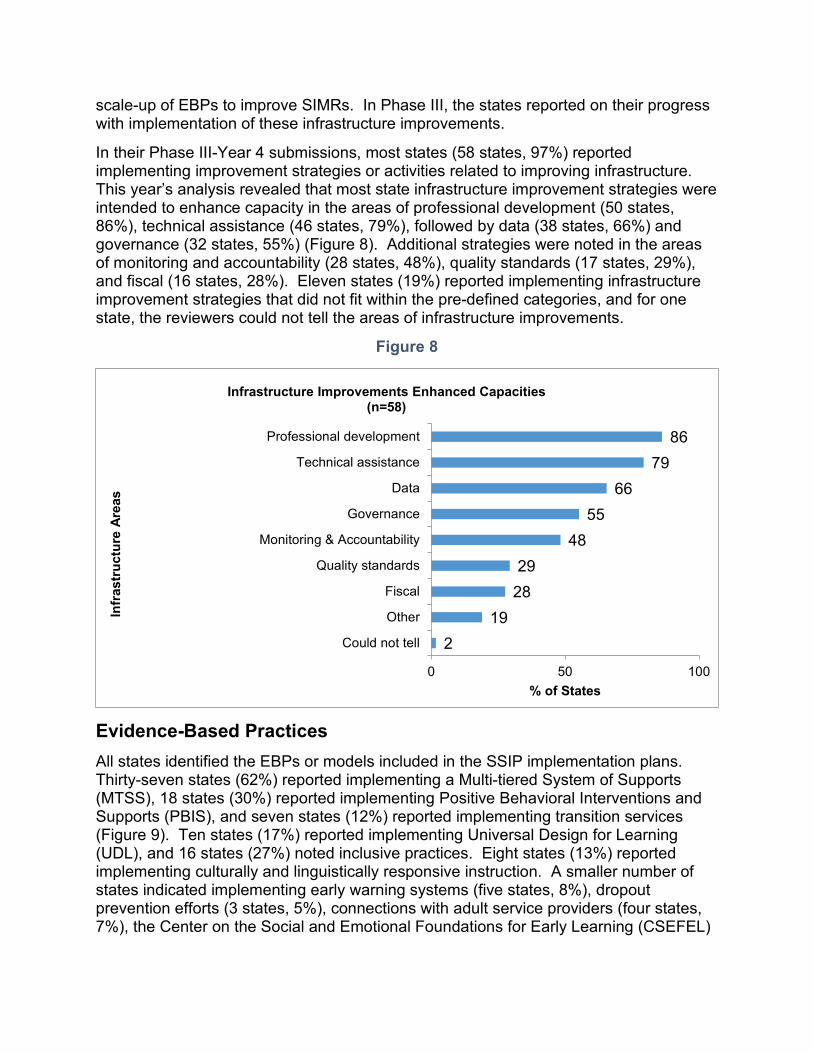
scale-up of EBPs to improve SIMRs. In Phase III, the states reported on their progress with implementation of these infrastructure improvements.
In their Phase III-Year 4 submissions, most states (58 states, 97%) reported implementing improvement strategies or activities related to improving infrastructure. This year’s analysis revealed that most state infrastructure improvement strategies were intended to enhance capacity in the areas of professional development (50 states, 86%), technical assistance (46 states, 79%), followed by data (38 states, 66%) and governance (32 states, 55%) (Figure 8). Additional strategies were noted in the areas of monitoring and accountability (28 states, 48%), quality standards (17 states, 29%), and fiscal (16 states, 28%). Eleven states (19%) reported implementing infrastructure improvement strategies that did not fit within the pre-defined categories, and for one state, the reviewers could not tell the areas of infrastructure improvements.
Figure 8
219
2829
4855
6679
86
0 50 100
Could not tell
Other
Fiscal
Quality standards
Monitoring & Accountability
Governance
Data
Technical assistance
Professional development
% of States
Infr
astr
uctu
re A
reas
Infrastructure Improvements Enhanced Capacities(n=58)
Evidence-Based Practices All states identified the EBPs or models included in the SSIP implementation plans. Thirty-seven states (62%) reported implementing a Multi-tiered System of Supports (MTSS), 18 states (30%) reported implementing Positive Behavioral Interventions and Supports (PBIS), and seven states (12%) reported implementing transition services (Figure 9). Ten states (17%) reported implementing Universal Design for Learning (UDL), and 16 states (27%) noted inclusive practices. Eight states (13%) reported implementing culturally and linguistically responsive instruction. A smaller number of states indicated implementing early warning systems (five states, 8%), dropout prevention efforts (3 states, 5%), connections with adult service providers (four states, 7%), the Center on the Social and Emotional Foundations for Early Learning (CSEFEL)
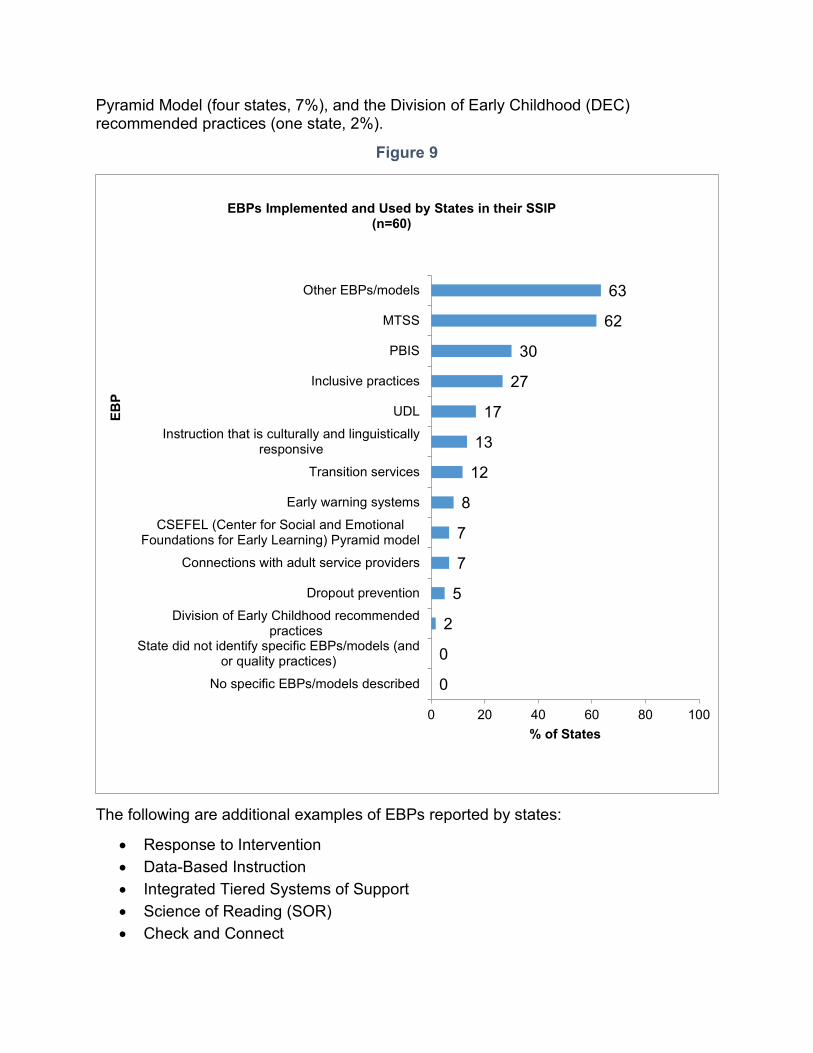
Pyramid Model (four states, 7%), and the Division of Early Childhood (DEC) recommended practices (one state, 2%).
Figure 9
0
0
2
5
7
7
8
12
13
17
27
30
62
63
0 20 40 60 80 100
No specific EBPs/models described
State did not identify specific EBPs/models (andor quality practices)
Division of Early Childhood recommendedpractices
Dropout prevention
Connections with adult service providers
CSEFEL (Center for Social and EmotionalFoundations for Early Learning) Pyramid model
Early warning systems
Transition services
Instruction that is culturally and linguisticallyresponsive
UDL
Inclusive practices
PBIS
MTSS
Other EBPs/models
% of States
EBP
EBPs Implemented and Used by States in their SSIP(n=60)
The following are additional examples of EBPs reported by states:
• Response to Intervention • Data-Based Instruction • Integrated Tiered Systems of Support • Science of Reading (SOR) • Check and Connect
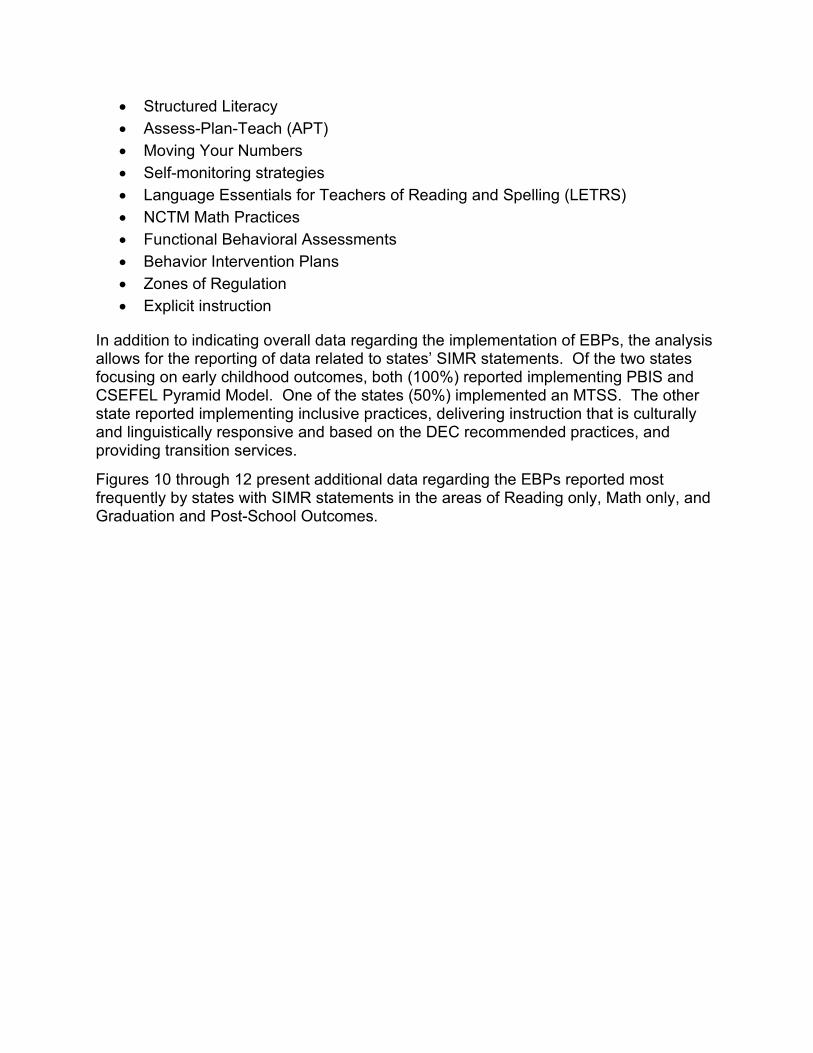
• Structured Literacy • Assess-Plan-Teach (APT) • Moving Your Numbers • Self-monitoring strategies • Language Essentials for Teachers of Reading and Spelling (LETRS) • NCTM Math Practices • Functional Behavioral Assessments • Behavior Intervention Plans • Zones of Regulation • Explicit instruction
In addition to indicating overall data regarding the implementation of EBPs, the analysis allows for the reporting of data related to states’ SIMR statements. Of the two states focusing on early childhood outcomes, both (100%) reported implementing PBIS and CSEFEL Pyramid Model. One of the states (50%) implemented an MTSS. The other state reported implementing inclusive practices, delivering instruction that is culturally and linguistically responsive and based on the DEC recommended practices, and providing transition services.
Figures 10 through 12 present additional data regarding the EBPs reported most frequently by states with SIMR statements in the areas of Reading only, Math only, and Graduation and Post-School Outcomes.
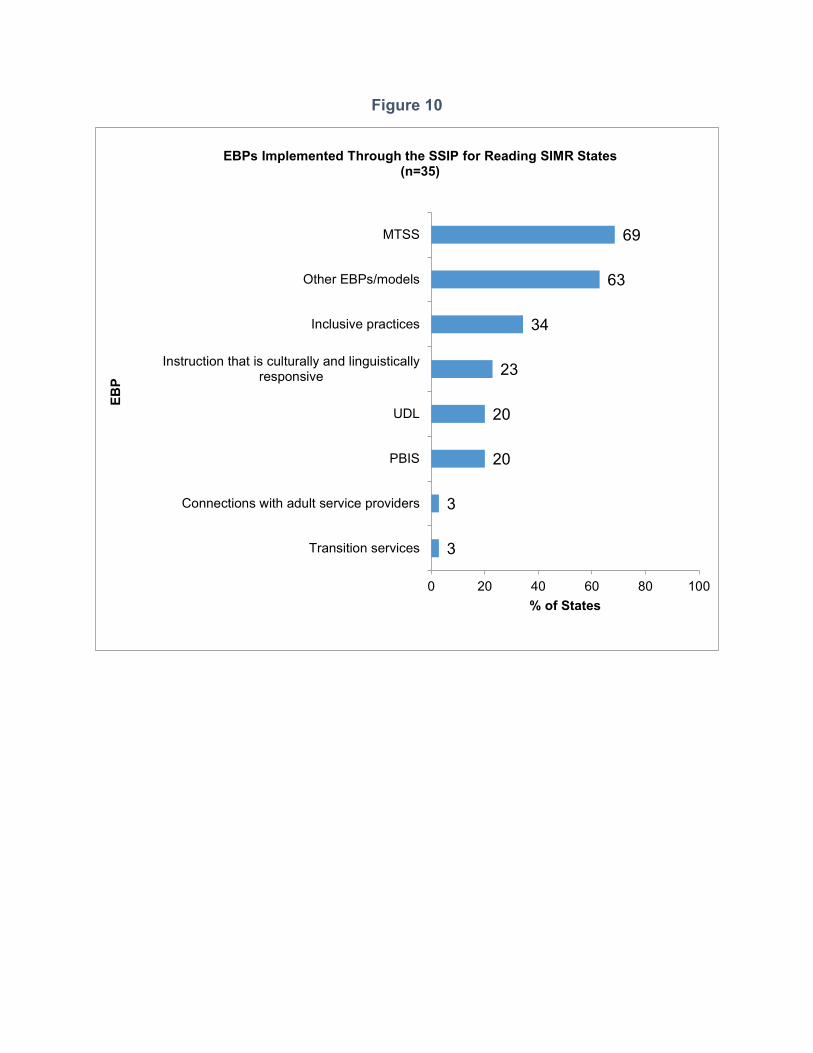
Figure 10
3
3
20
20
23
34
63
69
0 20 40 60 80 100
Transition services
Connections with adult service providers
PBIS
UDL
Instruction that is culturally and linguisticallyresponsive
Inclusive practices
Other EBPs/models
MTSS
% of States
EBP
EBPs Implemented Through the SSIP for Reading SIMR States(n=35)
Figure 11
0
0
0
0
0
0
0
0
0
14
14
43
57
86
0 20 40 60 80 100
No specific EBPs/models described
State did not identify specific EBPs/models
Instruction that is culturally and linguisticallyresponsive
Transition services
Dropout prevention
Early warning systems
Connections with adult service providers
DEC recommended practices
CSEFEL Pyramid Model
UDL
Inclusive practices
PBIS
MTSS
Other EBPs/models
% of States
EBP
EBPs Implemented Through the SSIP for Math SIMR States(n=7)
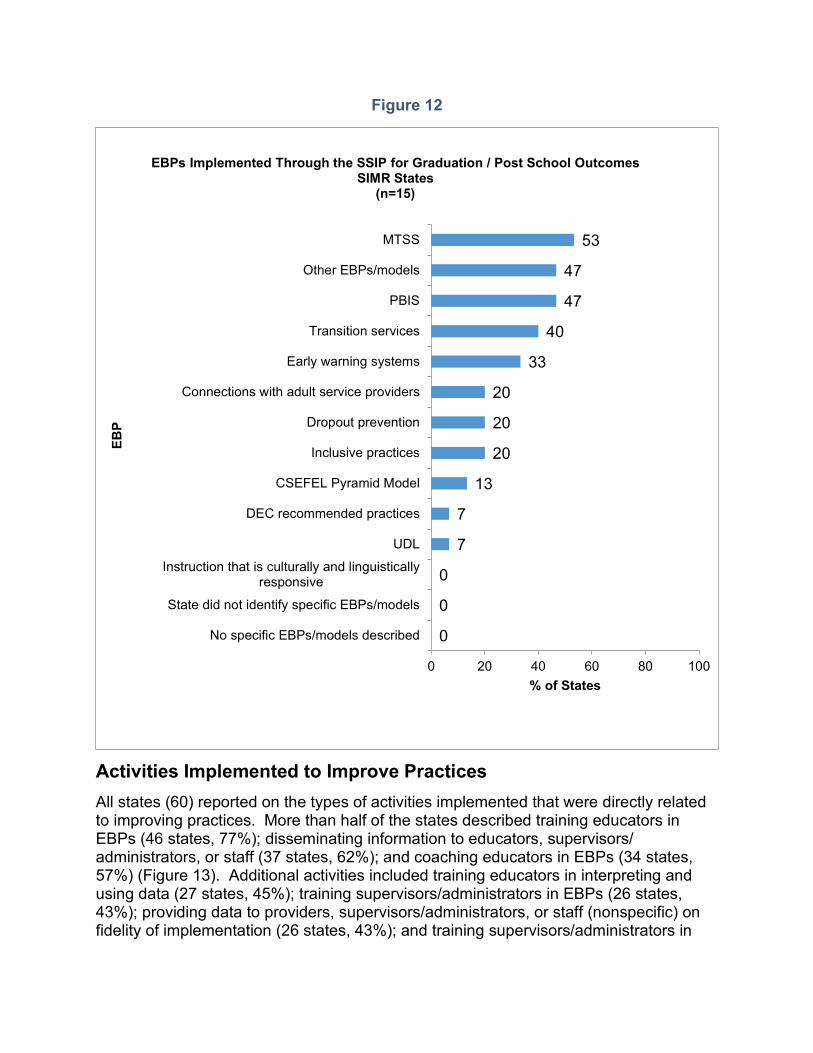
Figure 12
Activities Implemented to Improve Practices All states (60) reported on the types of activities implemented that were directly related to improving practices. More than half of the states described training educators in EBPs (46 states, 77%); disseminating information to educators, supervisors/ administrators, or staff (37 states, 62%); and coaching educators in EBPs (34 states, 57%) (Figure 13). Additional activities included training educators in interpreting and using data (27 states, 45%); training supervisors/administrators in EBPs (26 states, 43%); providing data to providers, supervisors/administrators, or staff (nonspecific) on fidelity of implementation (26 states, 43%); and training supervisors/administrators in
0
0
0
7
7
13
20
20
20
33
40
47
47
53
0 20 40 60 80 100
No specific EBPs/models described
State did not identify specific EBPs/models
Instruction that is culturally and linguisticallyresponsive
UDL
DEC recommended practices
CSEFEL Pyramid Model
Inclusive practices
Dropout prevention
Connections with adult service providers
Early warning systems
Transition services
PBIS
Other EBPs/models
MTSS
% of States
EBP
EBPs Implemented Through the SSIP for Graduation / Post School Outcomes SIMR States
(n=15)
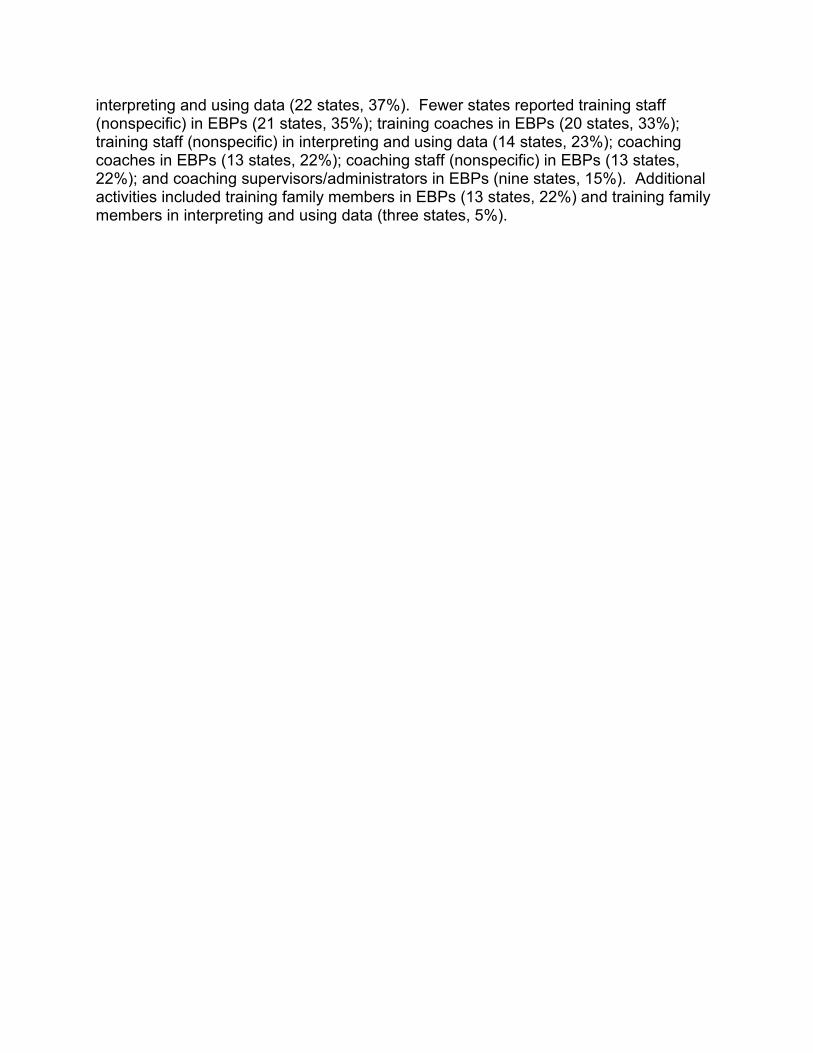
interpreting and using data (22 states, 37%). Fewer states reported training staff (nonspecific) in EBPs (21 states, 35%); training coaches in EBPs (20 states, 33%); training staff (nonspecific) in interpreting and using data (14 states, 23%); coaching coaches in EBPs (13 states, 22%); coaching staff (nonspecific) in EBPs (13 states, 22%); and coaching supervisors/administrators in EBPs (nine states, 15%). Additional activities included training family members in EBPs (13 states, 22%) and training family members in interpreting and using data (three states, 5%).
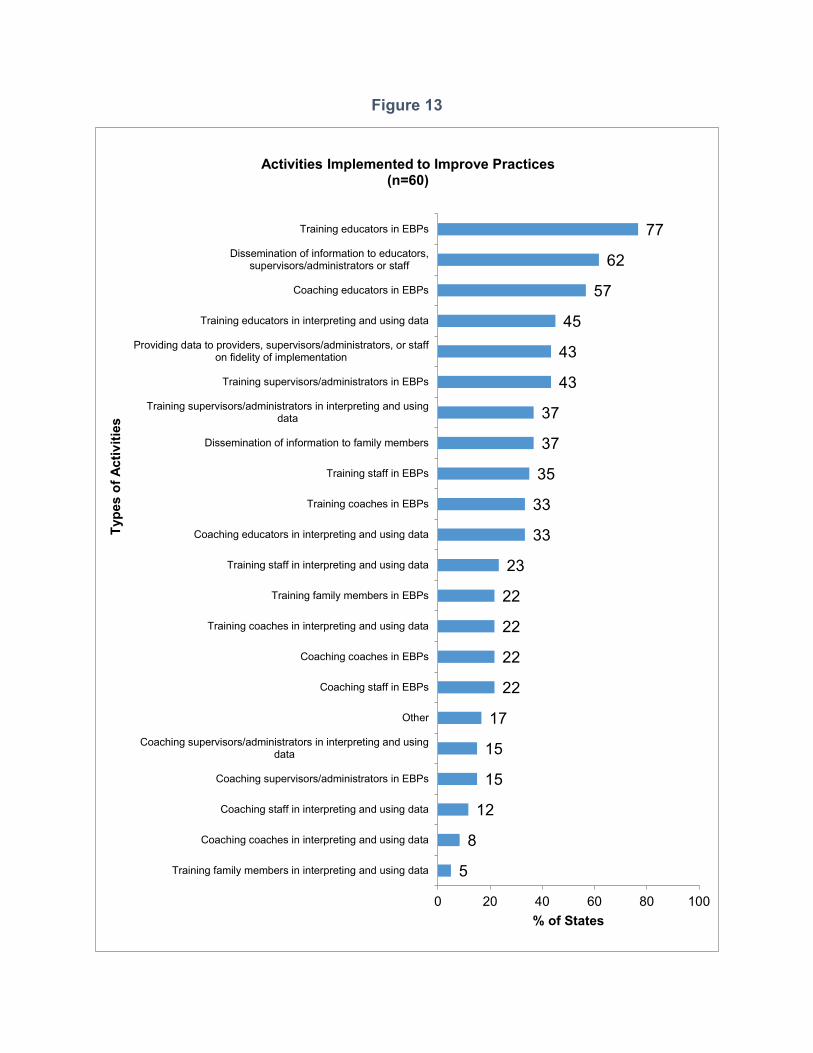
Figure 13
5
8
12
15
15
17
22
22
22
22
23
33
33
35
37
37
43
43
45
57
62
77
0 20 40 60 80 100
Training family members in interpreting and using data
Coaching coaches in interpreting and using data
Coaching staff in interpreting and using data
Coaching supervisors/administrators in EBPs
Coaching supervisors/administrators in interpreting and usingdata
Other
Coaching staff in EBPs
Coaching coaches in EBPs
Training coaches in interpreting and using data
Training family members in EBPs
Training staff in interpreting and using data
Coaching educators in interpreting and using data
Training coaches in EBPs
Training staff in EBPs
Dissemination of information to family members
Training supervisors/administrators in interpreting and usingdata
Training supervisors/administrators in EBPs
Providing data to providers, supervisors/administrators, or staffon fidelity of implementation
Training educators in interpreting and using data
Coaching educators in EBPs
Dissemination of information to educators,supervisors/administrators or staff
Training educators in EBPs
% of States
Type
s of
Act
iviti
es
Activities Implemented to Improve Practices(n=60)
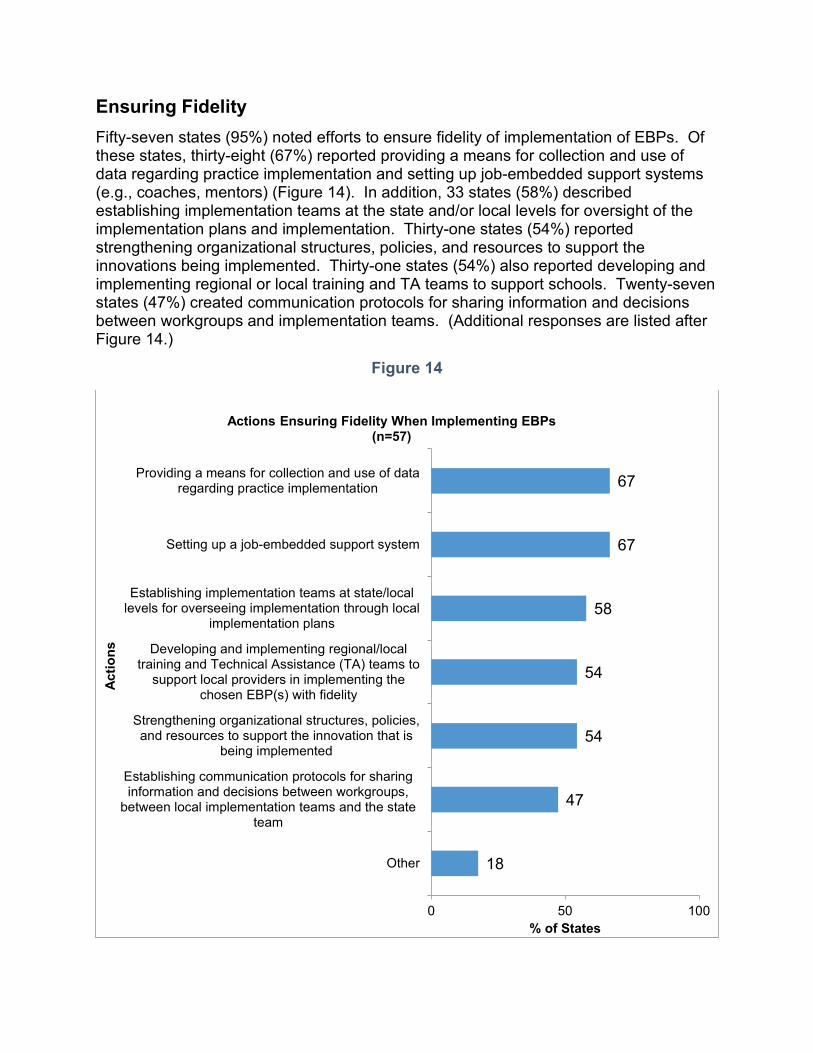
Ensuring Fidelity Fifty-seven states (95%) noted efforts to ensure fidelity of implementation of EBPs. Of these states, thirty-eight (67%) reported providing a means for collection and use of data regarding practice implementation and setting up job-embedded support systems (e.g., coaches, mentors) (Figure 14). In addition, 33 states (58%) described establishing implementation teams at the state and/or local levels for oversight of the implementation plans and implementation. Thirty-one states (54%) reported strengthening organizational structures, policies, and resources to support the innovations being implemented. Thirty-one states (54%) also reported developing and implementing regional or local training and TA teams to support schools. Twenty-seven states (47%) created communication protocols for sharing information and decisions between workgroups and implementation teams. (Additional responses are listed after Figure 14.)
Figure 14
18
47
54
54
58
67
67
0 50 100
Other
Establishing communication protocols for sharinginformation and decisions between workgroups,
between local implementation teams and the stateteam
Strengthening organizational structures, policies,and resources to support the innovation that is
being implemented
Developing and implementing regional/localtraining and Technical Assistance (TA) teams to
support local providers in implementing thechosen EBP(s) with fidelity
Establishing implementation teams at state/locallevels for overseeing implementation through local
implementation plans
Setting up a job-embedded support system
Providing a means for collection and use of dataregarding practice implementation
% of States
Actio
ns
Actions Ensuring Fidelity When Implementing EBPs(n=57)
The following are additional examples of actions that states reported for ensuring fidelity of implementation of EBPs:
• Community of Practice • State-developed self-assessments • Professional Learning Communities • Peer, administrator, and coach observations • Development of cadres • External evaluator • Use of protocols
Ensuring Desired Frequency and Intended Dosage Fifty-seven states (95%) reported using strategies to ensure that districts, schools, and/or teachers were implementing EBPs at the desired frequency and intended dosage for consistency of implementation across sites. For purposes of this analysis, reviewers were asked to input all data into an open textbox; therefore, exact frequency and percentage of responses across the states are not reported for this item. In general, states’ responses consisted of using specific tools (e.g., Data-Based Individualization [DBI] Implementation Checklist), using nonspecific tools (e.g., fidelity checklists), engaging in capacity-building activities (e.g., professional development), and documenting behaviors (e.g., observation). Further, some states indicated using just one strategy, while others mentioned two to four strategies, and a few states reported five or more strategies in response to the item. See Table 3 for examples of strategies reported by states.
Table 3
Examples of Strategies to Ensure Desired Frequency and Dosage
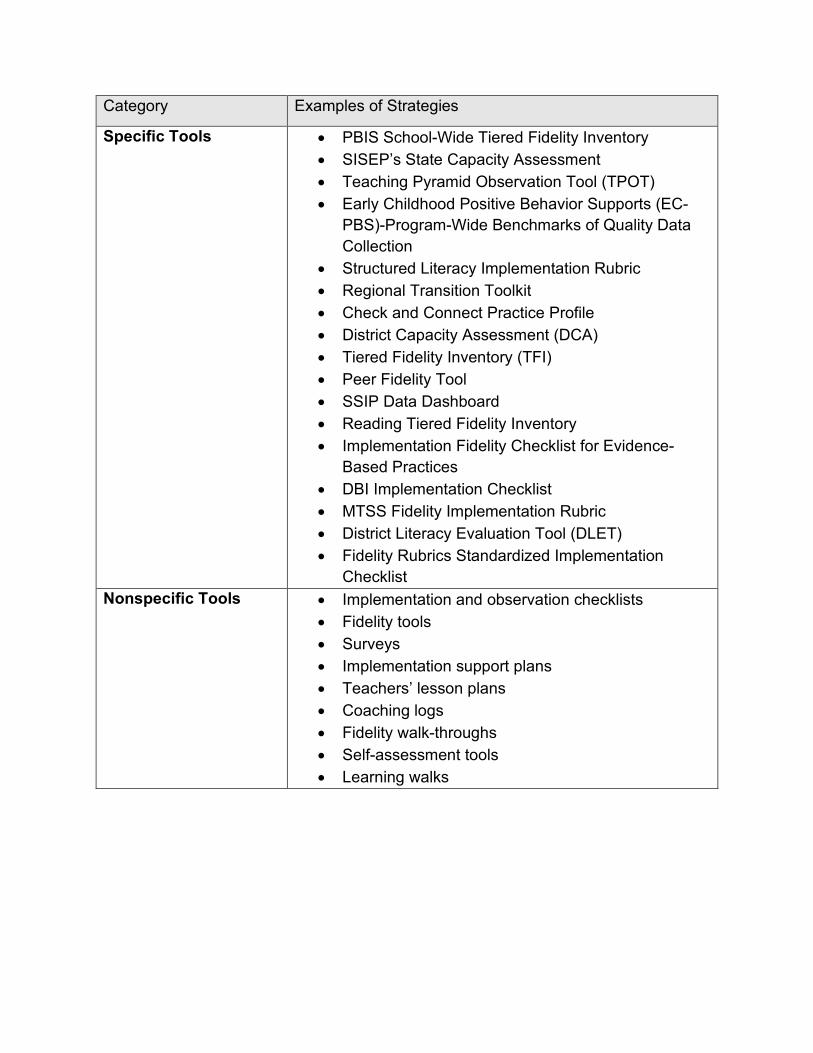
Category Examples of Strategies
Specific Tools • PBIS School-Wide Tiered Fidelity Inventory • SISEP’s State Capacity Assessment • Teaching Pyramid Observation Tool (TPOT) • Early Childhood Positive Behavior Supports (EC-
PBS)-Program-Wide Benchmarks of Quality Data Collection
• Structured Literacy Implementation Rubric • Regional Transition Toolkit • Check and Connect Practice Profile • District Capacity Assessment (DCA) • Tiered Fidelity Inventory (TFI) • Peer Fidelity Tool • SSIP Data Dashboard • Reading Tiered Fidelity Inventory • Implementation Fidelity Checklist for Evidence-
Based Practices • DBI Implementation Checklist • MTSS Fidelity Implementation Rubric • District Literacy Evaluation Tool (DLET) • Fidelity Rubrics Standardized Implementation
Checklist Nonspecific Tools • Implementation and observation checklists
• Fidelity tools • Surveys • Implementation support plans • Teachers’ lesson plans • Coaching logs • Fidelity walk-throughs • Self-assessment tools • Learning walks
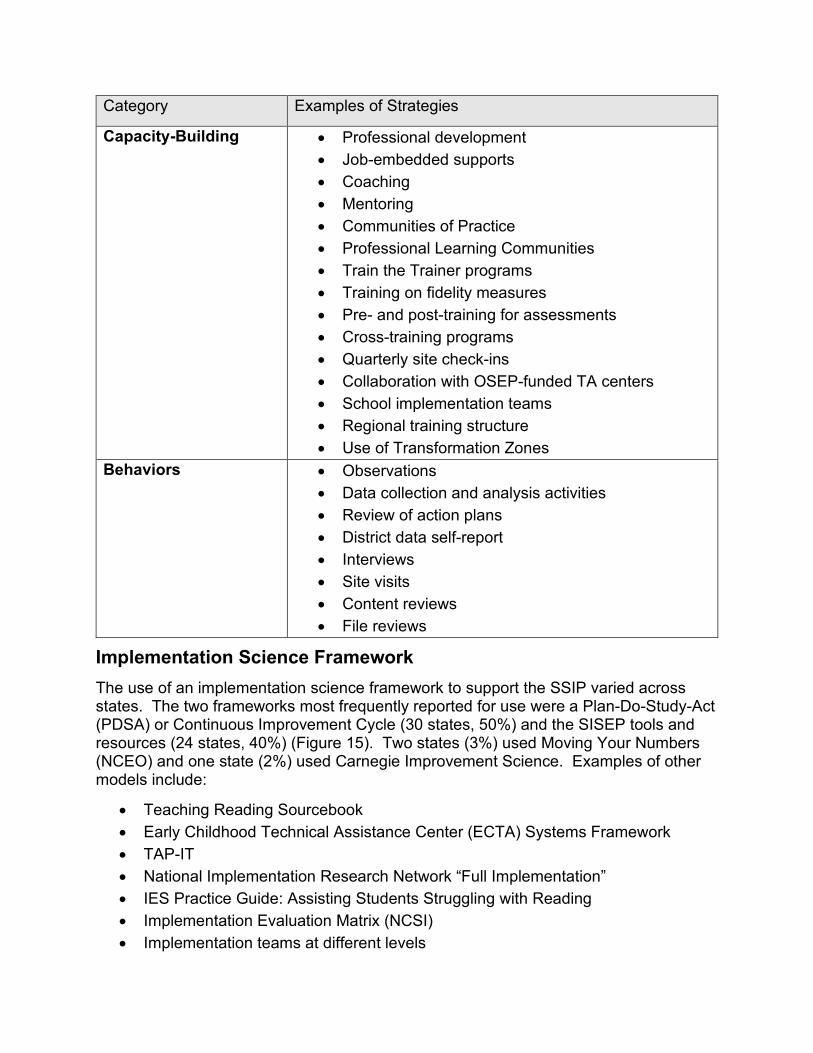
Category Examples of Strategies
Capacity-Building • Professional development • Job-embedded supports • Coaching • Mentoring • Communities of Practice • Professional Learning Communities • Train the Trainer programs • Training on fidelity measures • Pre- and post-training for assessments • Cross-training programs • Quarterly site check-ins • Collaboration with OSEP-funded TA centers • School implementation teams • Regional training structure • Use of Transformation Zones
Behaviors • Observations • Data collection and analysis activities • Review of action plans • District data self-report • Interviews • Site visits • Content reviews • File reviews
Implementation Science Framework The use of an implementation science framework to support the SSIP varied across states. The two frameworks most frequently reported for use were a Plan-Do-Study-Act (PDSA) or Continuous Improvement Cycle (30 states, 50%) and the SISEP tools and resources (24 states, 40%) (Figure 15). Two states (3%) used Moving Your Numbers (NCEO) and one state (2%) used Carnegie Improvement Science. Examples of other models include:
• Teaching Reading Sourcebook • Early Childhood Technical Assistance Center (ECTA) Systems Framework • TAP-IT • National Implementation Research Network “Full Implementation” • IES Practice Guide: Assisting Students Struggling with Reading • Implementation Evaluation Matrix (NCSI) • Implementation teams at different levels
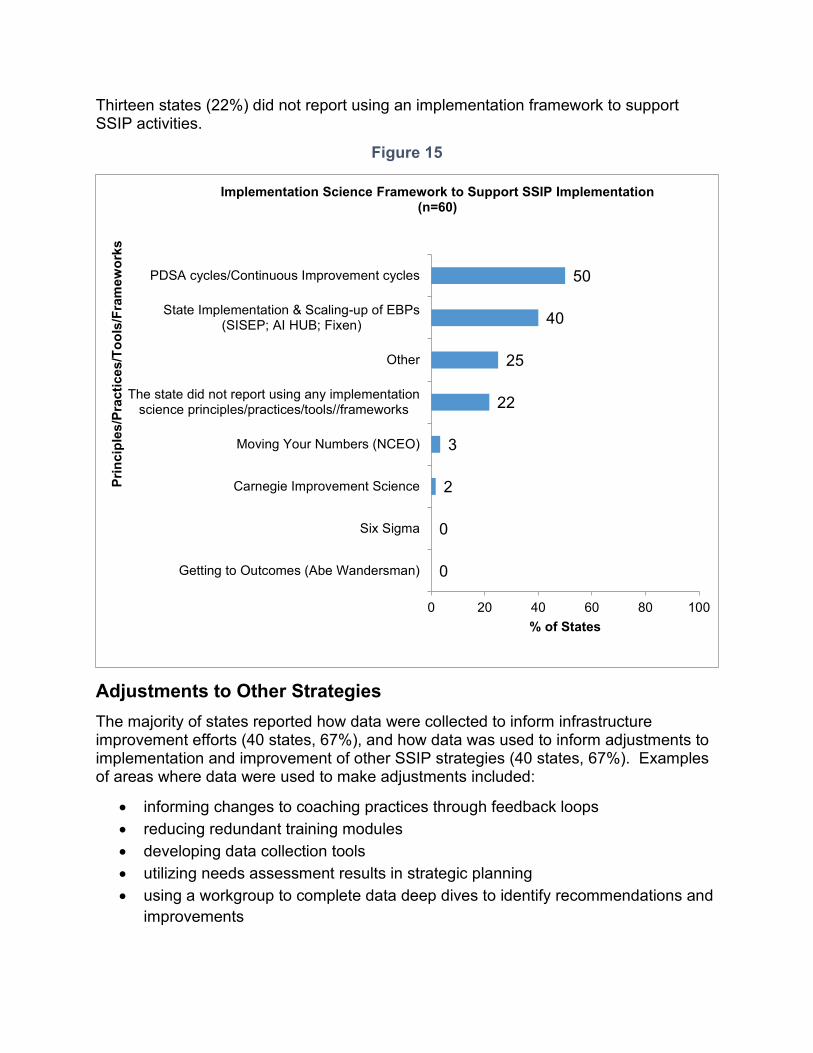
Thirteen states (22%) did not report using an implementation framework to support SSIP activities.
Figure 15
0
0
2
3
22
25
40
50
0 20 40 60 80 100
Getting to Outcomes (Abe Wandersman)
Six Sigma
Carnegie Improvement Science
Moving Your Numbers (NCEO)
The state did not report using any implementationscience principles/practices/tools//frameworks
Other
State Implementation & Scaling-up of EBPs(SISEP; AI HUB; Fixen)
PDSA cycles/Continuous Improvement cycles
% of States
Prin
cipl
es/P
ract
ices
/Too
ls/F
ram
ewor
ks
Implementation Science Framework to Support SSIP Implementation(n=60)
Adjustments to Other Strategies The majority of states reported how data were collected to inform infrastructure improvement efforts (40 states, 67%), and how data was used to inform adjustments to implementation and improvement of other SSIP strategies (40 states, 67%). Examples of areas where data were used to make adjustments included:
• informing changes to coaching practices through feedback loops • reducing redundant training modules • developing data collection tools • utilizing needs assessment results in strategic planning • using a workgroup to complete data deep dives to identify recommendations and
improvements
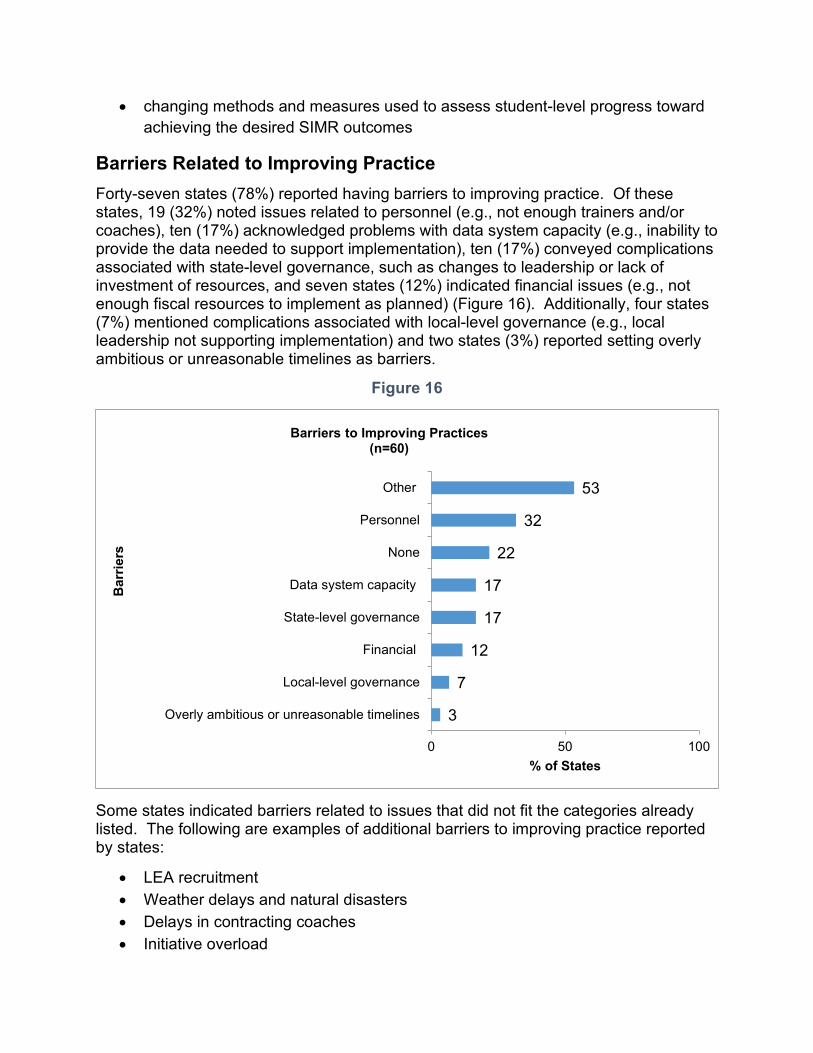
• changing methods and measures used to assess student-level progress toward achieving the desired SIMR outcomes
Barriers Related to Improving Practice Forty-seven states (78%) reported having barriers to improving practice. Of these states, 19 (32%) noted issues related to personnel (e.g., not enough trainers and/or coaches), ten (17%) acknowledged problems with data system capacity (e.g., inability to provide the data needed to support implementation), ten (17%) conveyed complications associated with state-level governance, such as changes to leadership or lack of investment of resources, and seven states (12%) indicated financial issues (e.g., not enough fiscal resources to implement as planned) (Figure 16). Additionally, four states (7%) mentioned complications associated with local-level governance (e.g., local leadership not supporting implementation) and two states (3%) reported setting overly ambitious or unreasonable timelines as barriers.
Figure 16
3
7
12
17
17
22
32
53
0 50 100
Overly ambitious or unreasonable timelines
Local-level governance
Financial
State-level governance
Data system capacity
None
Personnel
Other
% of States
Bar
riers
Barriers to Improving Practices (n=60)
Some states indicated barriers related to issues that did not fit the categories already listed. The following are examples of additional barriers to improving practice reported by states:
• LEA recruitment • Weather delays and natural disasters • Delays in contracting coaches • Initiative overload
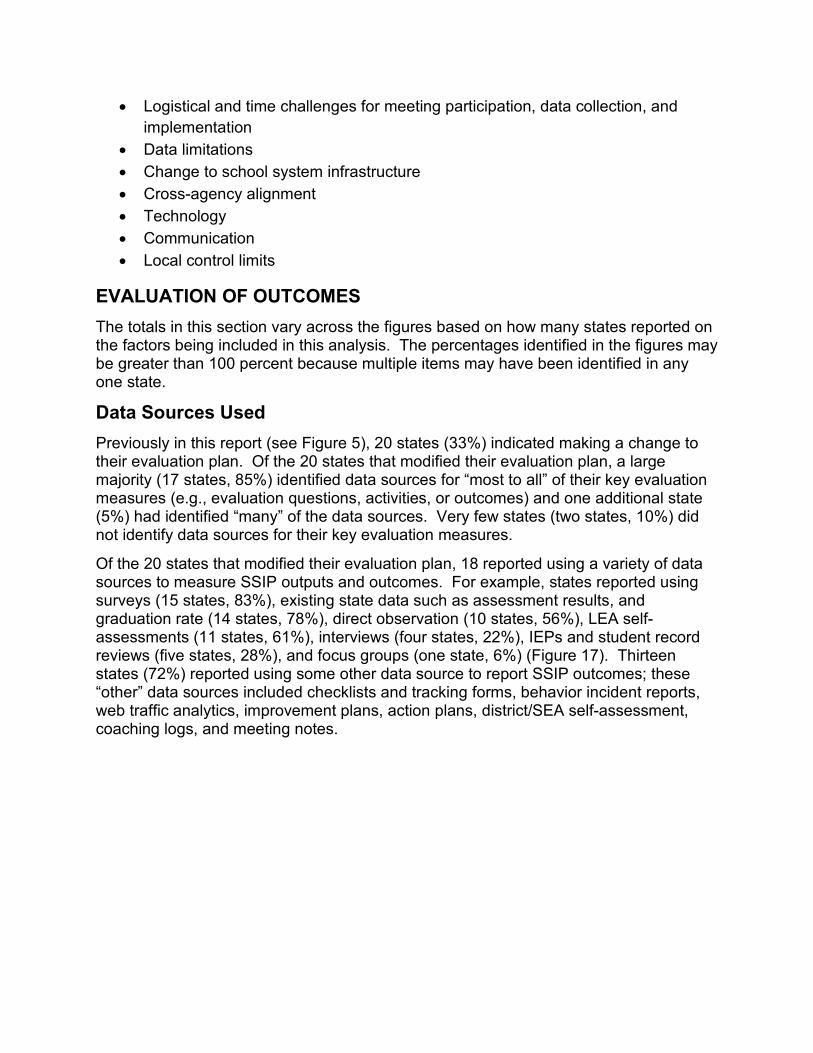
• Logistical and time challenges for meeting participation, data collection, and implementation
• Data limitations • Change to school system infrastructure • Cross-agency alignment • Technology • Communication • Local control limits
EVALUATION OF OUTCOMES The totals in this section vary across the figures based on how many states reported on the factors being included in this analysis. The percentages identified in the figures may be greater than 100 percent because multiple items may have been identified in any one state.
Data Sources Used Previously in this report (see Figure 5), 20 states (33%) indicated making a change to their evaluation plan. Of the 20 states that modified their evaluation plan, a large majority (17 states, 85%) identified data sources for “most to all” of their key evaluation measures (e.g., evaluation questions, activities, or outcomes) and one additional state (5%) had identified “many” of the data sources. Very few states (two states, 10%) did not identify data sources for their key evaluation measures.
Of the 20 states that modified their evaluation plan, 18 reported using a variety of data sources to measure SSIP outputs and outcomes. For example, states reported using surveys (15 states, 83%), existing state data such as assessment results, and graduation rate (14 states, 78%), direct observation (10 states, 56%), LEA self-assessments (11 states, 61%), interviews (four states, 22%), IEPs and student record reviews (five states, 28%), and focus groups (one state, 6%) (Figure 17). Thirteen states (72%) reported using some other data source to report SSIP outcomes; these “other” data sources included checklists and tracking forms, behavior incident reports, web traffic analytics, improvement plans, action plans, district/SEA self-assessment, coaching logs, and meeting notes.
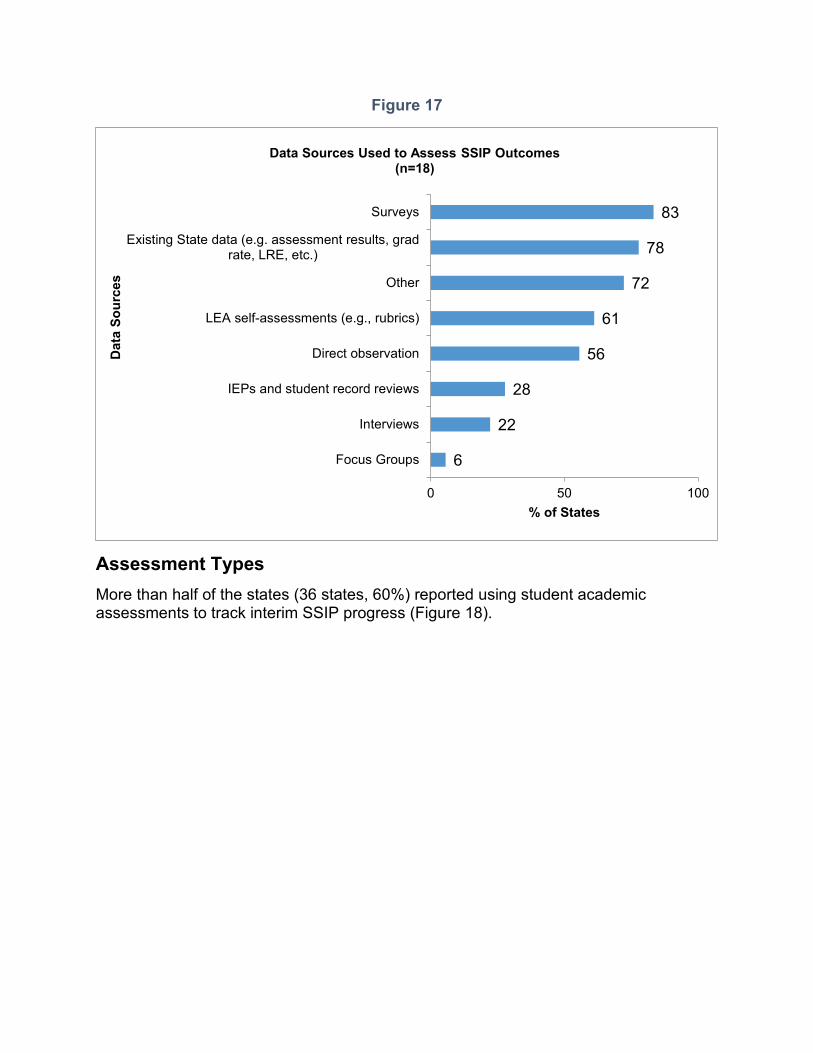
Figure 17
6
22
28
56
61
72
78
83
0 50 100
Focus Groups
Interviews
IEPs and student record reviews
Direct observation
LEA self-assessments (e.g., rubrics)
Other
Existing State data (e.g. assessment results, gradrate, LRE, etc.)
Surveys
% of States
Dat
a So
urce
s
Data Sources Used to Assess SSIP Outcomes(n=18)
Assessment Types More than half of the states (36 states, 60%) reported using student academic assessments to track interim SSIP progress (Figure 18).
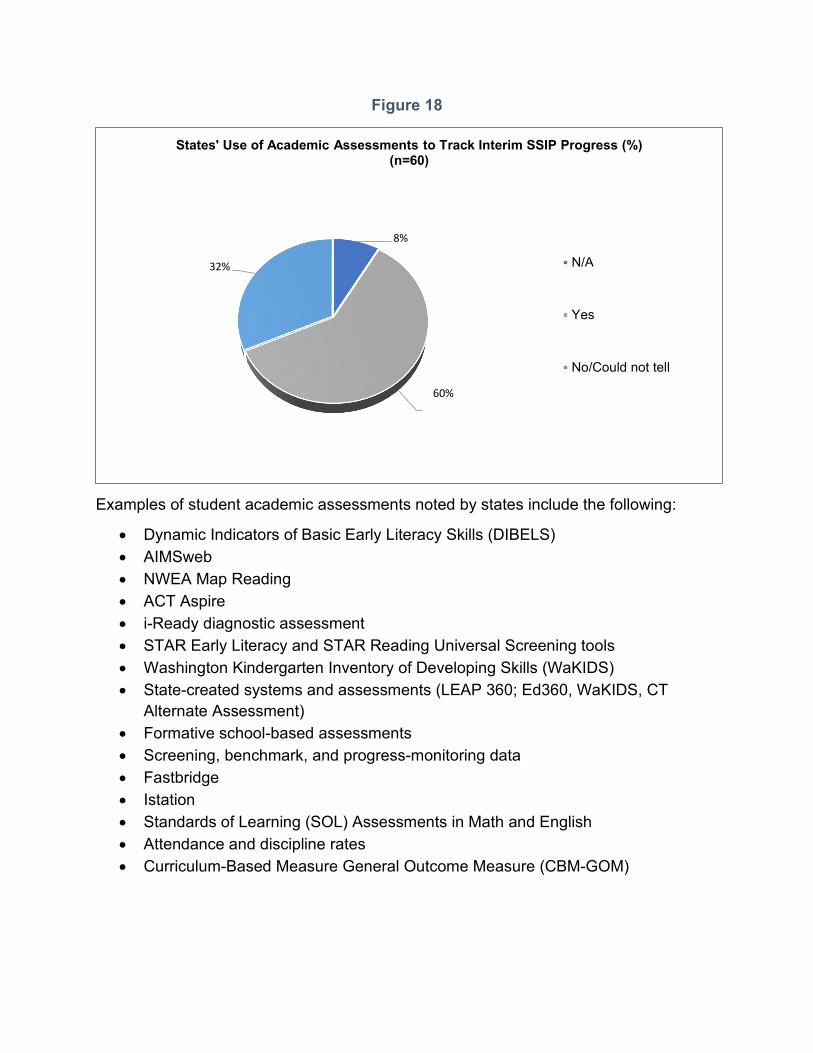
Figure 18
8%
60%
32%
States' Use of Academic Assessments to Track Interim SSIP Progress (%)(n=60)
N/A
Yes
No/Could not tell
Examples of student academic assessments noted by states include the following:
• Dynamic Indicators of Basic Early Literacy Skills (DIBELS) • AIMSweb • NWEA Map Reading • ACT Aspire • i-Ready diagnostic assessment • STAR Early Literacy and STAR Reading Universal Screening tools • Washington Kindergarten Inventory of Developing Skills (WaKIDS) • State-created systems and assessments (LEAP 360; Ed360, WaKIDS, CT
Alternate Assessment) • Formative school-based assessments • Screening, benchmark, and progress-monitoring data • Fastbridge • Istation • Standards of Learning (SOL) Assessments in Math and English • Attendance and discipline rates • Curriculum-Based Measure General Outcome Measure (CBM-GOM)
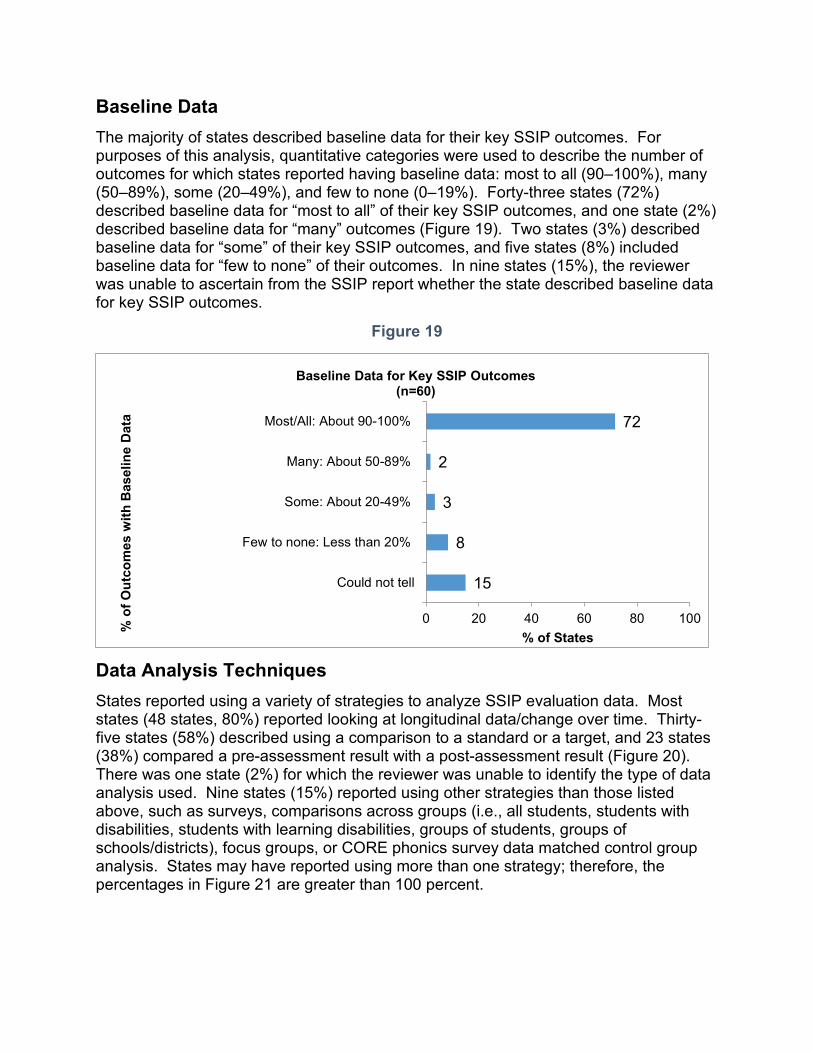
Baseline Data The majority of states described baseline data for their key SSIP outcomes. For purposes of this analysis, quantitative categories were used to describe the number of outcomes for which states reported having baseline data: most to all (90–100%), many (50–89%), some (20–49%), and few to none (0–19%). Forty-three states (72%) described baseline data for “most to all” of their key SSIP outcomes, and one state (2%) described baseline data for “many” outcomes (Figure 19). Two states (3%) described baseline data for “some” of their key SSIP outcomes, and five states (8%) included baseline data for “few to none” of their outcomes. In nine states (15%), the reviewer was unable to ascertain from the SSIP report whether the state described baseline data for key SSIP outcomes.
Figure 19
15
8
3
2
72
0 20 40 60 80 100
Could not tell
Few to none: Less than 20%
Some: About 20-49%
Many: About 50-89%
Most/All: About 90-100%
% of States
% o
f Out
com
es w
ith B
asel
ine
Dat
a
Baseline Data for Key SSIP Outcomes (n=60)
Data Analysis Techniques States reported using a variety of strategies to analyze SSIP evaluation data. Most states (48 states, 80%) reported looking at longitudinal data/change over time. Thirty-five states (58%) described using a comparison to a standard or a target, and 23 states (38%) compared a pre-assessment result with a post-assessment result (Figure 20). There was one state (2%) for which the reviewer was unable to identify the type of data analysis used. Nine states (15%) reported using other strategies than those listed above, such as surveys, comparisons across groups (i.e., all students, students with disabilities, students with learning disabilities, groups of students, groups of schools/districts), focus groups, or CORE phonics survey data matched control group analysis. States may have reported using more than one strategy; therefore, the percentages in Figure 21 are greater than 100 percent.
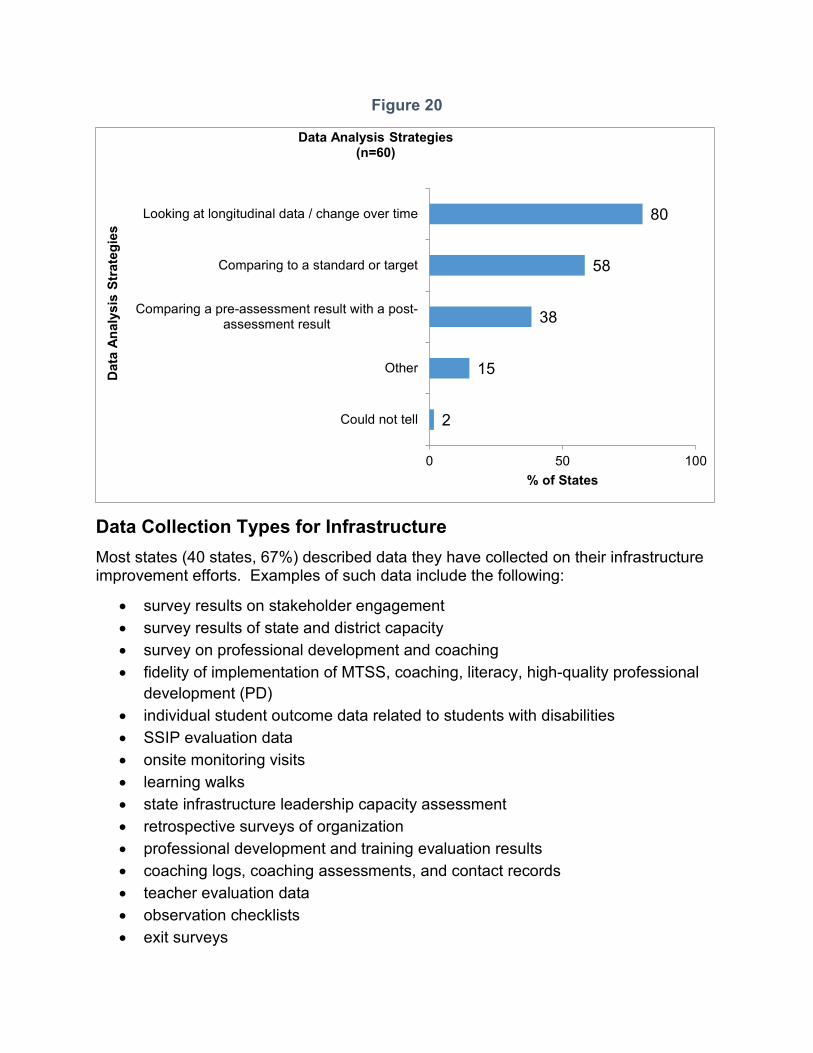
Figure 20
2
15
38
58
80
0 50 100
Could not tell
Other
Comparing a pre-assessment result with a post-assessment result
Comparing to a standard or target
Looking at longitudinal data / change over time
% of States
Dat
a An
alys
is S
trat
egie
s
Data Analysis Strategies(n=60)
Data Collection Types for Infrastructure Most states (40 states, 67%) described data they have collected on their infrastructure improvement efforts. Examples of such data include the following:
• survey results on stakeholder engagement • survey results of state and district capacity • survey on professional development and coaching • fidelity of implementation of MTSS, coaching, literacy, high-quality professional
development (PD) • individual student outcome data related to students with disabilities • SSIP evaluation data • onsite monitoring visits • learning walks • state infrastructure leadership capacity assessment • retrospective surveys of organization • professional development and training evaluation results • coaching logs, coaching assessments, and contact records • teacher evaluation data • observation checklists • exit surveys

• document reviews (e.g., state and district meeting notes, meeting minutes, reports on implementation progress and procedures, action plans, LEA improvement plans, project guidelines, communication documents)
DATA QUALITY ISSUES Limitations and Concerns Forty-three states (72%) noted limitations or concerns with data quality either as a current or prior issue, a future issue, or both. A total of 42 states (70%) described current or prior data limitations or concerns leading up to the date of submission of their 2020 SSIP Phase III-Year 4 report (Figure 21). Fourteen states (23%) predicted future data quality limitations or concerns.
Figure 21
10
18
23
70
0 50 100
Could not tell/No mention from the informationprovided
No, the state actually stated that there were noissues
Yes - future issues
Yes - current or prior issues up to the date of thereport
% of States
Lim
itatio
ns o
r Con
cern
s
Data Quality Limitations or Concerns(n=60)
Of the 43 states (72%) that reported limitations or concerns about data quality, more than half of the 43 states (23 states, 53%) had concerns about the quality of their student outcomes data, and 17 states (40%) noted concerns about the quality of their data on documenting progress in implementation of improvement activities (Figure 22). Eighteen states (42%) were concerned about quality of their data on fidelity of practices to their model or to EBPs, five states (12%) on their infrastructure, and seven states (16%) about the quality of data related to the status of or changes to practice. Twelve states (28%) reported other problems with their data quality; these “other” data quality issues included data quality limitations, ability of LEA personnel to efficiently and effectively navigate the state student information system, frequent turnover in LEA personnel resulting in varied data interpretation, lack of statewide assessment data due to COVID-19, and inability to measure implementation theory through professional development opportunities.
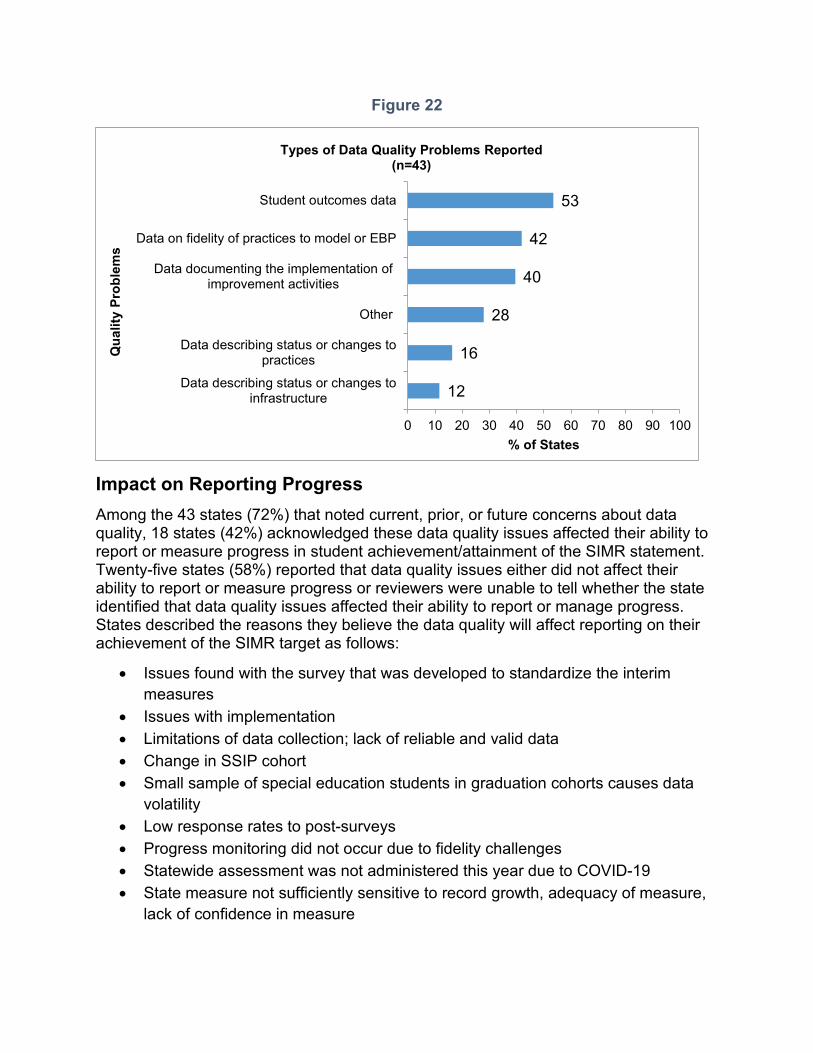
Figure 22
12
16
28
40
42
53
0 10 20 30 40 50 60 70 80 90 100
Data describing status or changes toinfrastructure
Data describing status or changes topractices
Other
Data documenting the implementation ofimprovement activities
Data on fidelity of practices to model or EBP
Student outcomes data
% of States
Qua
lity
Prob
lem
s
Types of Data Quality Problems Reported(n=43)
Impact on Reporting Progress Among the 43 states (72%) that noted current, prior, or future concerns about data quality, 18 states (42%) acknowledged these data quality issues affected their ability to report or measure progress in student achievement/attainment of the SIMR statement. Twenty-five states (58%) reported that data quality issues either did not affect their ability to report or measure progress or reviewers were unable to tell whether the state identified that data quality issues affected their ability to report or manage progress. States described the reasons they believe the data quality will affect reporting on their achievement of the SIMR target as follows:
• Issues found with the survey that was developed to standardize the interim measures
• Issues with implementation • Limitations of data collection; lack of reliable and valid data • Change in SSIP cohort • Small sample of special education students in graduation cohorts causes data
volatility • Low response rates to post-surveys • Progress monitoring did not occur due to fidelity challenges • Statewide assessment was not administered this year due to COVID-19 • State measure not sufficiently sensitive to record growth, adequacy of measure,
lack of confidence in measure
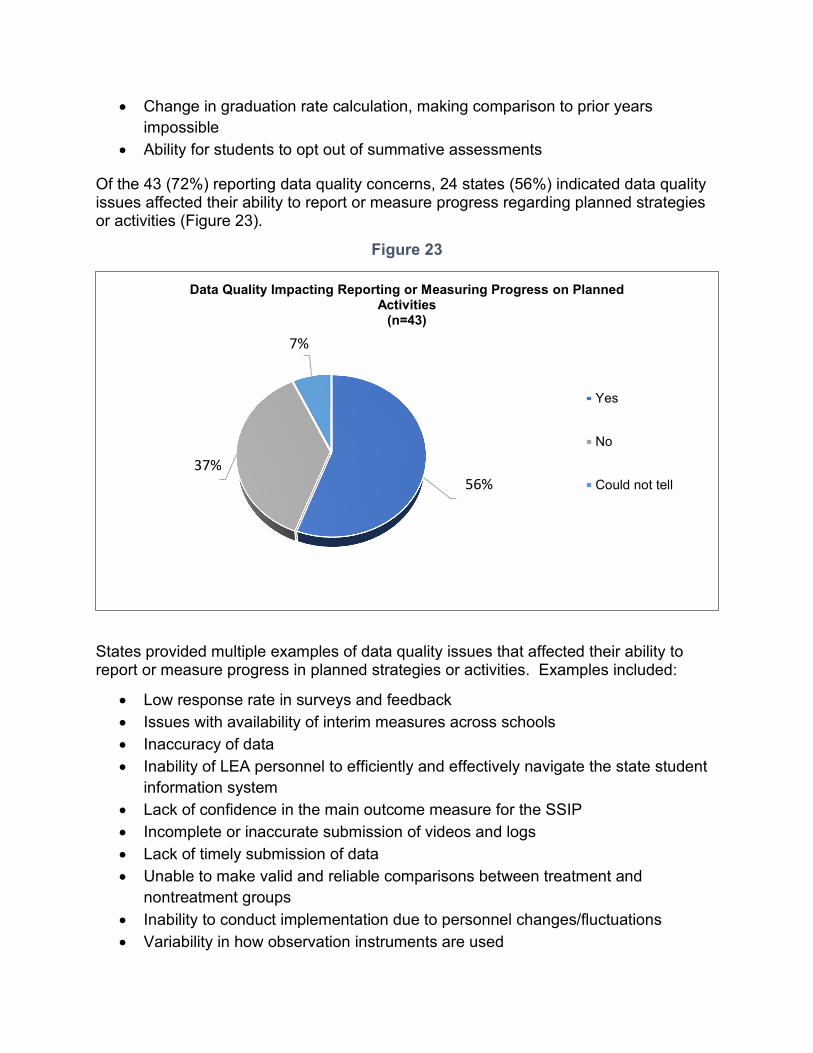
• Change in graduation rate calculation, making comparison to prior years impossible
• Ability for students to opt out of summative assessments
Of the 43 (72%) reporting data quality concerns, 24 states (56%) indicated data quality issues affected their ability to report or measure progress regarding planned strategies or activities (Figure 23).
Figure 23
56%37%
7%
Data Quality Impacting Reporting or Measuring Progress on Planned Activities
(n=43)
Yes
No
Could not tell
States provided multiple examples of data quality issues that affected their ability to report or measure progress in planned strategies or activities. Examples included:
• Low response rate in surveys and feedback • Issues with availability of interim measures across schools • Inaccuracy of data • Inability of LEA personnel to efficiently and effectively navigate the state student
information system • Lack of confidence in the main outcome measure for the SSIP • Incomplete or inaccurate submission of videos and logs • Lack of timely submission of data • Unable to make valid and reliable comparisons between treatment and
nontreatment groups • Inability to conduct implementation due to personnel changes/fluctuations • Variability in how observation instruments are used
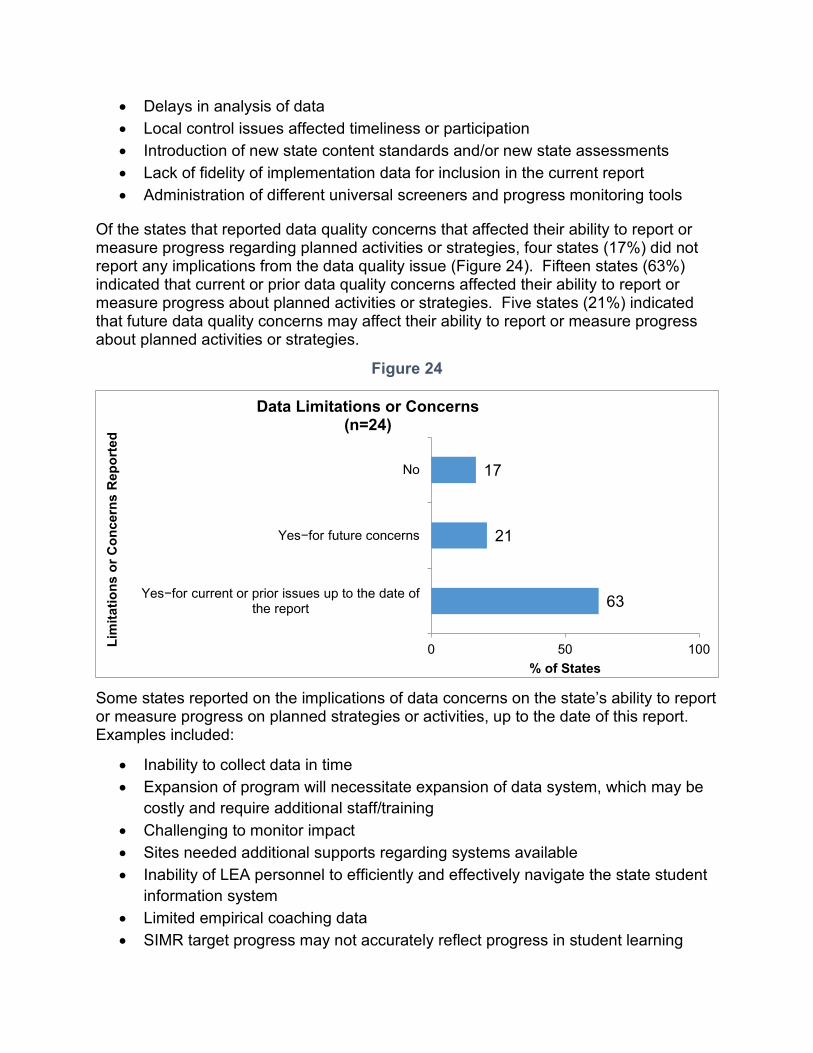
• Delays in analysis of data • Local control issues affected timeliness or participation • Introduction of new state content standards and/or new state assessments • Lack of fidelity of implementation data for inclusion in the current report • Administration of different universal screeners and progress monitoring tools
Of the states that reported data quality concerns that affected their ability to report or measure progress regarding planned activities or strategies, four states (17%) did not report any implications from the data quality issue (Figure 24). Fifteen states (63%) indicated that current or prior data quality concerns affected their ability to report or measure progress about planned activities or strategies. Five states (21%) indicated that future data quality concerns may affect their ability to report or measure progress about planned activities or strategies.
Figure 24
63
21
17
0 50 100
Yes−for current or prior issues up to the date of the report
Yes−for future concerns
No
% of States
Lim
itatio
ns o
r Con
cern
s R
epor
ted
Data Limitations or Concerns(n=24)
Some states reported on the implications of data concerns on the state’s ability to report or measure progress on planned strategies or activities, up to the date of this report. Examples included:
• Inability to collect data in time • Expansion of program will necessitate expansion of data system, which may be
costly and require additional staff/training • Challenging to monitor impact • Sites needed additional supports regarding systems available • Inability of LEA personnel to efficiently and effectively navigate the state student
information system • Limited empirical coaching data • SIMR target progress may not accurately reflect progress in student learning
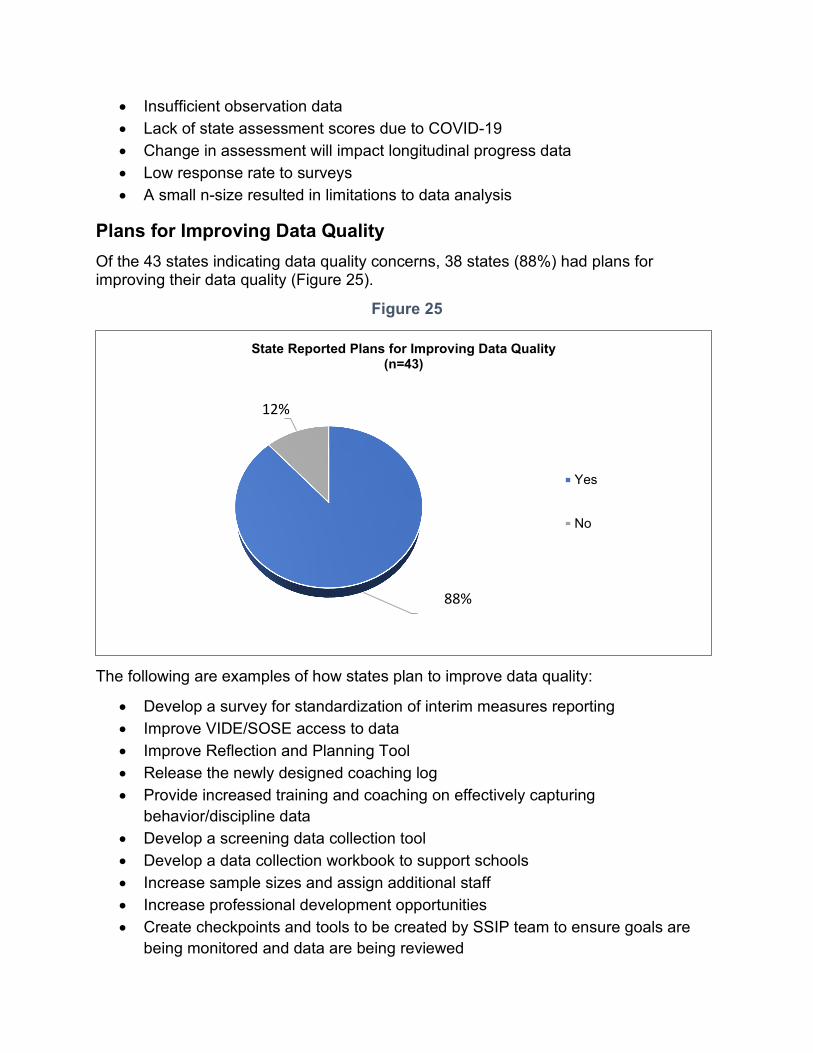
• Insufficient observation data • Lack of state assessment scores due to COVID-19 • Change in assessment will impact longitudinal progress data • Low response rate to surveys • A small n-size resulted in limitations to data analysis
Plans for Improving Data Quality Of the 43 states indicating data quality concerns, 38 states (88%) had plans for improving their data quality (Figure 25).
Figure 25
88%
12%
State Reported Plans for Improving Data Quality (n=43)
Yes
No
The following are examples of how states plan to improve data quality:
• Develop a survey for standardization of interim measures reporting • Improve VIDE/SOSE access to data • Improve Reflection and Planning Tool • Release the newly designed coaching log • Provide increased training and coaching on effectively capturing
behavior/discipline data • Develop a screening data collection tool • Develop a data collection workbook to support schools • Increase sample sizes and assign additional staff • Increase professional development opportunities • Create checkpoints and tools to be created by SSIP team to ensure goals are
being monitored and data are being reviewed
• Develop strong pre/post survey questions to assess impact of training on participants’ knowledge
• Address data omissions that occurred due to spring 2020 school closures (from COVID-19)
• Continue collaboration with IDEA Data Center Training • Refine coaching logs • Refocus efforts on fidelity of data collection • Increase staff stability • Invest in an online data system that will allow teachers access to real-time
student data • Train consultants and specialists on the use of protocols • Provide online modules and TA • Develop easily accessible FAQs
STAKEHOLDER INVOLVEMENT IN SSIP PHASE III-Year 4 States were asked to provide a description of how stakeholders had been engaged in Phase III-Year 4 of the SSIP, including their involvement in decision-making regarding revisions, implementation, and evaluation. The following descriptors of stakeholder involvement used in this analysis — informing, networking, collaborating, and transforming — are based on work from Leading by Convening (Cashman et al., 2014). These levels are hierarchical in nature; however, depending on the purpose for the engagement, one level of engagement is not necessarily more valued over another. In addition, the totals in this section vary across the figures based on how many states reported on the factors being included in this analysis. The percentages identified in the figures may be greater than 100 percent because multiple items may have been identified in any one state.
Stakeholder Involvement in Revisions to the SSIP A review of the SSIPs indicated that of the 39 states (65%) that revised their SSIPs for Phase III-Year 4, 35 (90%) described how they engaged stakeholders in decision-making. More than half of the states engaged stakeholders in networking (26 states, 74%) through two-way sharing of ideas, and 26 states (74%) used collaborating, which involved engaging more deeply over time to make joint decisions about revisions (Figure 26). Transforming was less frequently identified, with 11 states (31%) having engaged stakeholders as equal partners in the decision-making that occurred to revise the SSIP for Phase III-Year 4.
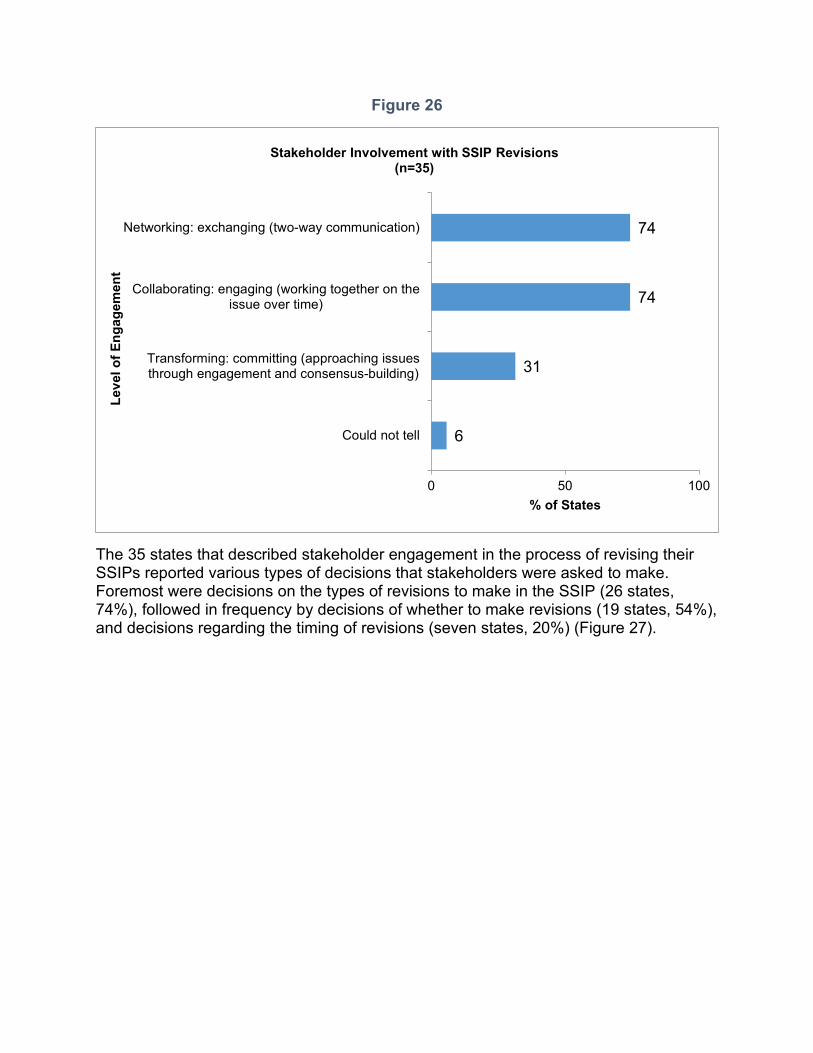
Figure 26
6
31
74
74
0 50 100
Could not tell
Transforming: committing (approaching issuesthrough engagement and consensus-building)
Collaborating: engaging (working together on theissue over time)
Networking: exchanging (two-way communication)
% of States
Leve
l of E
ngag
emen
t
Stakeholder Involvement with SSIP Revisions(n=35)
The 35 states that described stakeholder engagement in the process of revising their SSIPs reported various types of decisions that stakeholders were asked to make. Foremost were decisions on the types of revisions to make in the SSIP (26 states, 74%), followed in frequency by decisions of whether to make revisions (19 states, 54%), and decisions regarding the timing of revisions (seven states, 20%) (Figure 27).
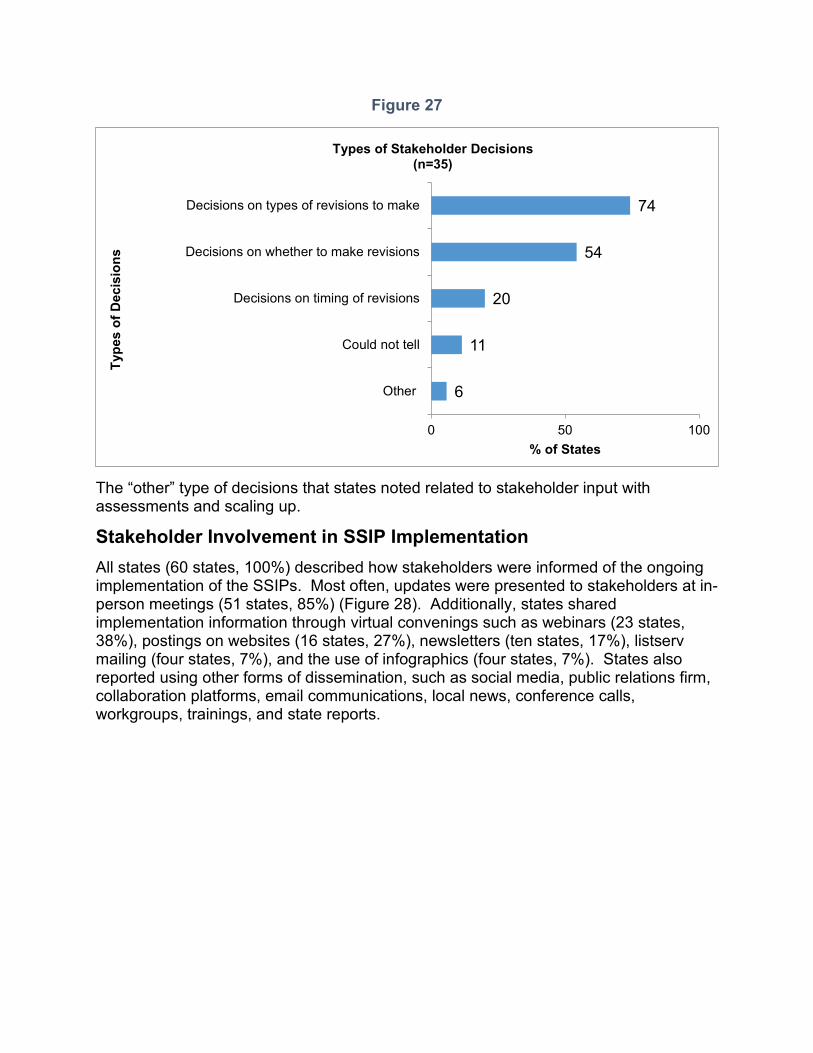
Figure 27
6
11
20
54
74
0 50 100
Other
Could not tell
Decisions on timing of revisions
Decisions on whether to make revisions
Decisions on types of revisions to make
% of States
Type
s of
Dec
isio
ns
Types of Stakeholder Decisions(n=35)
The “other” type of decisions that states noted related to stakeholder input with assessments and scaling up.
Stakeholder Involvement in SSIP Implementation All states (60 states, 100%) described how stakeholders were informed of the ongoing implementation of the SSIPs. Most often, updates were presented to stakeholders at in-person meetings (51 states, 85%) (Figure 28). Additionally, states shared implementation information through virtual convenings such as webinars (23 states, 38%), postings on websites (16 states, 27%), newsletters (ten states, 17%), listserv mailing (four states, 7%), and the use of infographics (four states, 7%). States also reported using other forms of dissemination, such as social media, public relations firm, collaboration platforms, email communications, local news, conference calls, workgroups, trainings, and state reports.
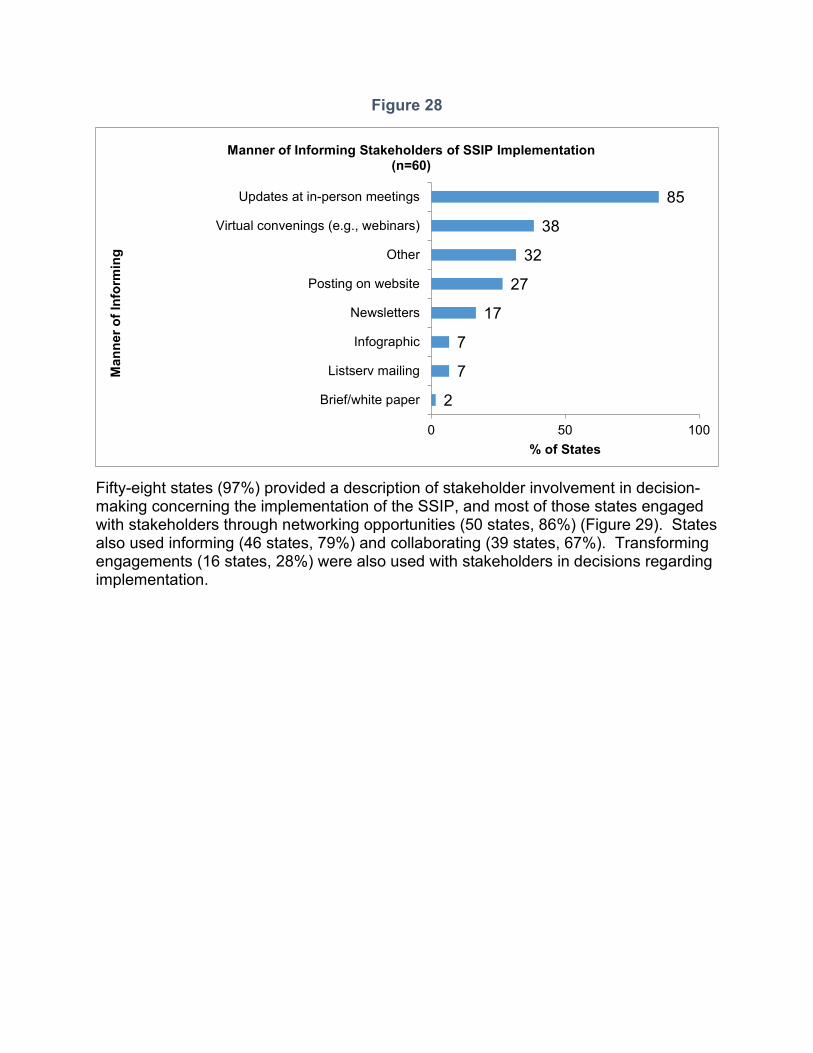
Figure 28
2
7
7
17
27
32
38
85
0 50 100
Brief/white paper
Listserv mailing
Infographic
Newsletters
Posting on website
Other
Virtual convenings (e.g., webinars)
Updates at in-person meetings
% of States
Man
ner o
f Inf
orm
ing
Manner of Informing Stakeholders of SSIP Implementation (n=60)
Fifty-eight states (97%) provided a description of stakeholder involvement in decision-making concerning the implementation of the SSIP, and most of those states engaged with stakeholders through networking opportunities (50 states, 86%) (Figure 29). States also used informing (46 states, 79%) and collaborating (39 states, 67%). Transforming engagements (16 states, 28%) were also used with stakeholders in decisions regarding implementation.

Figure 29
0
28
67
79
86
0 20 40 60 80 100
Could not tell
Transforming: committing (approaching issuesthrough engagement and consensus building)
Collaborating: engaging (working together on theissue over time)
Informing: sharing/disseminating (one-waycommunication)
Networking: exchanging (two-way communication)
% of States
Leve
l of E
ngag
emen
t
Stakeholder Decisions with SSIP Implementation(n=58)
States involved stakeholders in decision-making about the implementation of the SSIP in a variety of ways. States solicited information from stakeholders and gathered their responses through verbal (35 states, 60%) and written (28 states, 48%) methods (Figure 30). States also reported having stakeholders, rather than state staff, gather information to inform decision-making (17 states, 29%) and using observational data from stakeholders to inform decision-making (15 states, 26%).

Figure 30
10
12
26
29
48
60
0 20 40 60 80 100
Other
Could not tell
Observational information
Gather information
Written response to requests for information
Verbal response to requests for information
% of States
Met
hods
Methods of Gathering Stakeholder Input(n=58)
Other means of engaging stakeholders included their involvement in:
• Serving on SSIP committees • Participating in an implementation review process • Contributing observational data • Analyzing fidelity data • Providing input on barriers • Co-presenting at conferences and workshops
Stakeholder Involvement in Ongoing Evaluation of the SSIP Fifty-three states (88%) reported informing stakeholders about the ongoing evaluation of the SSIP. Most of this information was shared through updates at in-person meetings (46 states, 87%) (Figure 31). Sixteen states (30%) used virtual convenings, such as webinars, seven states (13%) used website postings, six states (11%) used newsletters, and five states (9%) used infographics. Another 14 states (26%) used a variety of other means including emails, phone communications, professional learning communities, work groups, conferences, and data reports.
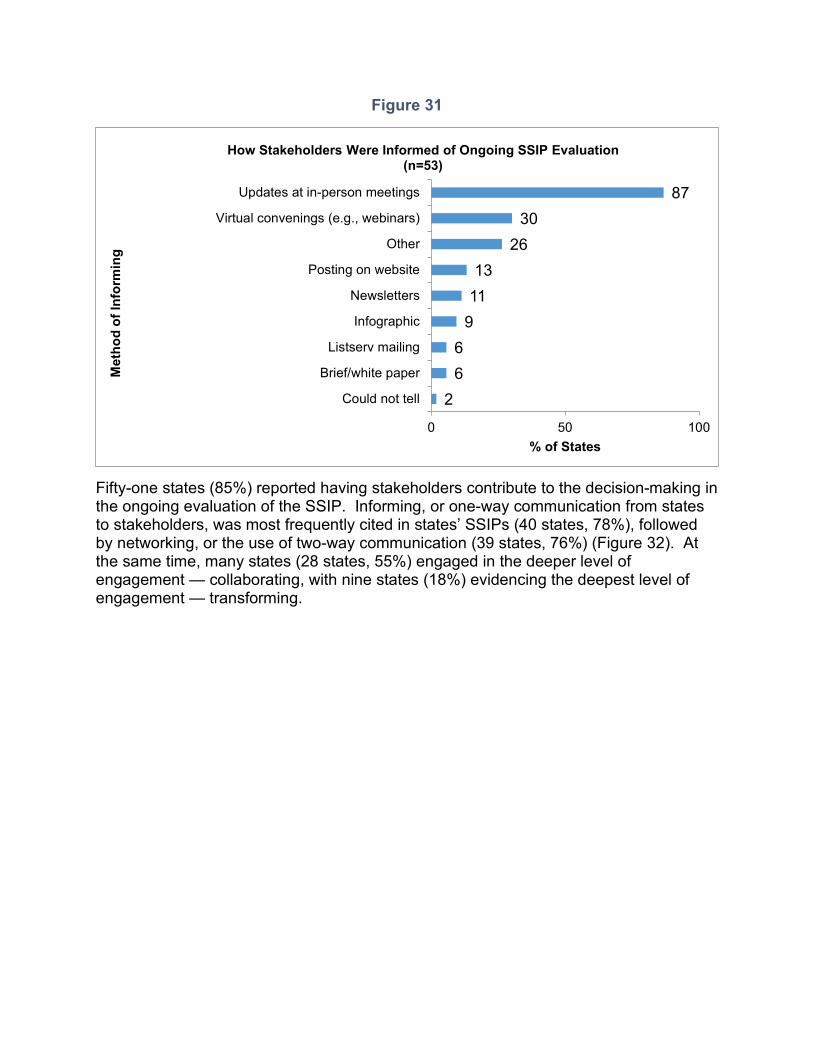
Figure 31
266
91113
2630
87
0 50 100
Could not tell
Brief/white paper
Listserv mailing
Infographic
Newsletters
Posting on website
Other
Virtual convenings (e.g., webinars)
Updates at in-person meetings
% of States
Met
hod
of In
form
ing
How Stakeholders Were Informed of Ongoing SSIP Evaluation(n=53)
Fifty-one states (85%) reported having stakeholders contribute to the decision-making in the ongoing evaluation of the SSIP. Informing, or one-way communication from states to stakeholders, was most frequently cited in states’ SSIPs (40 states, 78%), followed by networking, or the use of two-way communication (39 states, 76%) (Figure 32). At the same time, many states (28 states, 55%) engaged in the deeper level of engagement — collaborating, with nine states (18%) evidencing the deepest level of engagement — transforming.
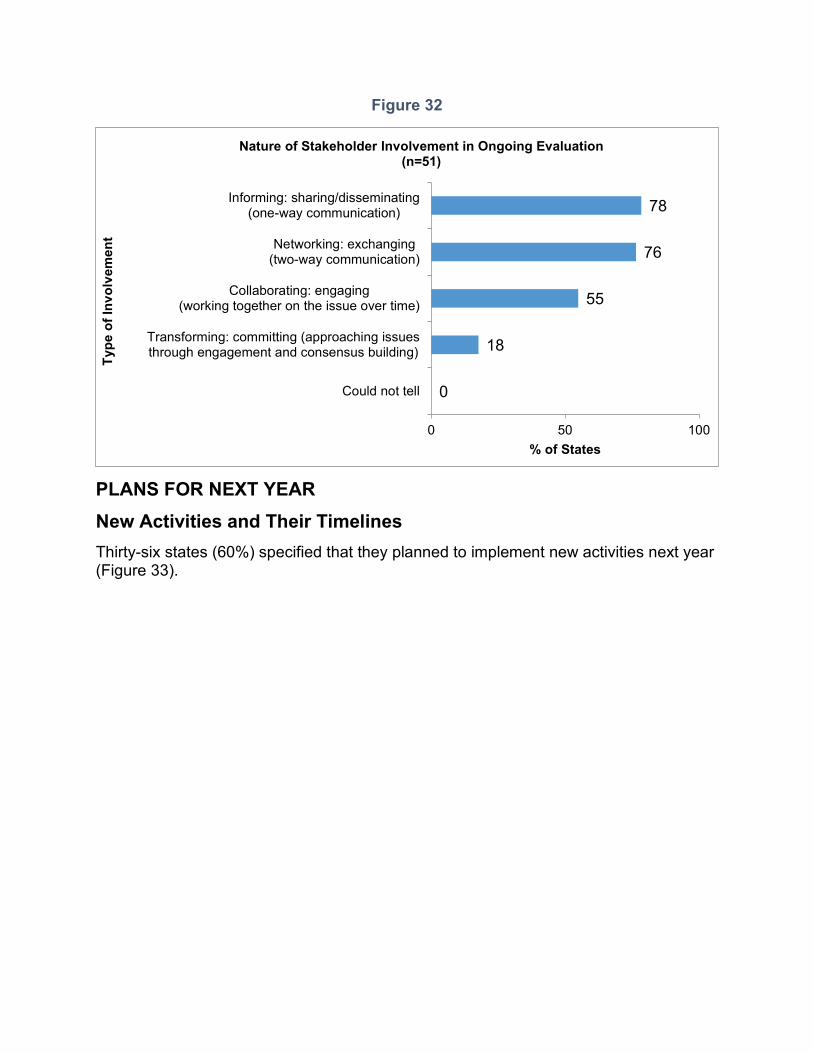
Figure 32
0
18
55
76
78
0 50 100
Could not tell
Transforming: committing (approaching issuesthrough engagement and consensus building)
Collaborating: engaging(working together on the issue over time)
Networking: exchanging(two-way communication)
Informing: sharing/disseminating(one-way communication)
% of States
Type
of I
nvol
vem
ent
Nature of Stakeholder Involvement in Ongoing Evaluation(n=51)
PLANS FOR NEXT YEAR New Activities and Their Timelines Thirty-six states (60%) specified that they planned to implement new activities next year (Figure 33).
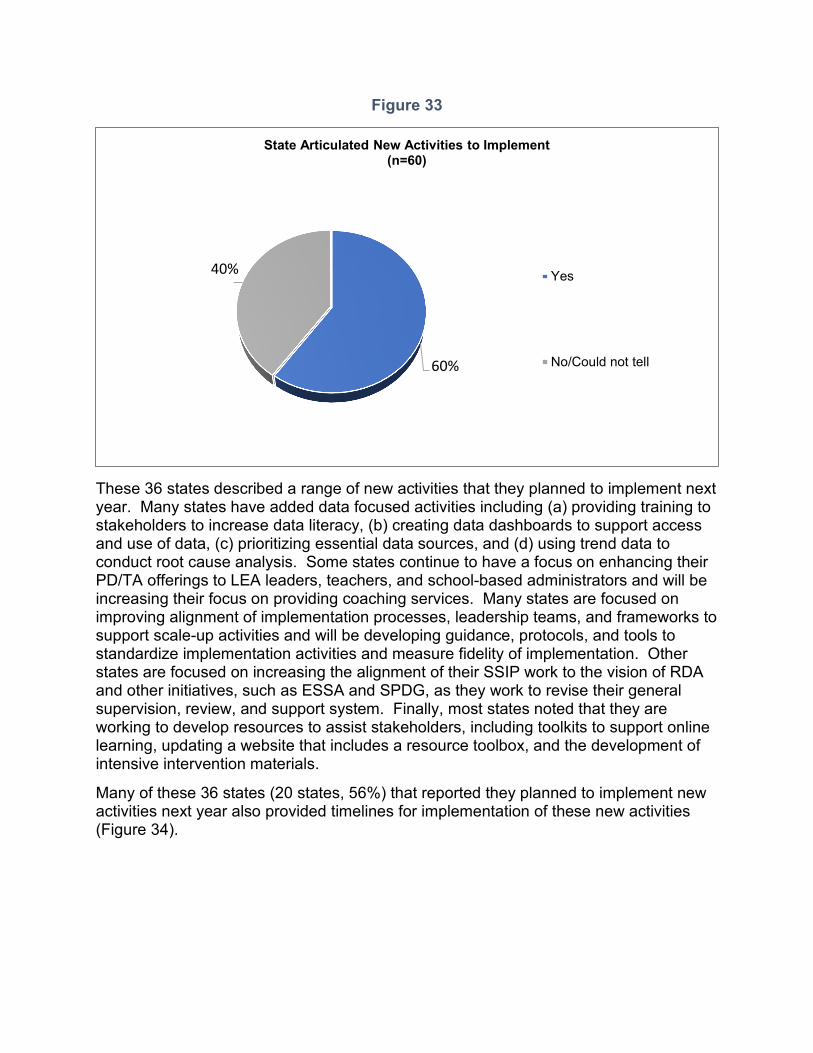
Figure 33
60%
40%
State Articulated New Activities to Implement(n=60)
Yes
No/Could not tell
These 36 states described a range of new activities that they planned to implement next year. Many states have added data focused activities including (a) providing training to stakeholders to increase data literacy, (b) creating data dashboards to support access and use of data, (c) prioritizing essential data sources, and (d) using trend data to conduct root cause analysis. Some states continue to have a focus on enhancing their PD/TA offerings to LEA leaders, teachers, and school-based administrators and will be increasing their focus on providing coaching services. Many states are focused on improving alignment of implementation processes, leadership teams, and frameworks to support scale-up activities and will be developing guidance, protocols, and tools to standardize implementation activities and measure fidelity of implementation. Other states are focused on increasing the alignment of their SSIP work to the vision of RDA and other initiatives, such as ESSA and SPDG, as they work to revise their general supervision, review, and support system. Finally, most states noted that they are working to develop resources to assist stakeholders, including toolkits to support online learning, updating a website that includes a resource toolbox, and the development of intensive intervention materials.
Many of these 36 states (20 states, 56%) that reported they planned to implement new activities next year also provided timelines for implementation of these new activities (Figure 34).
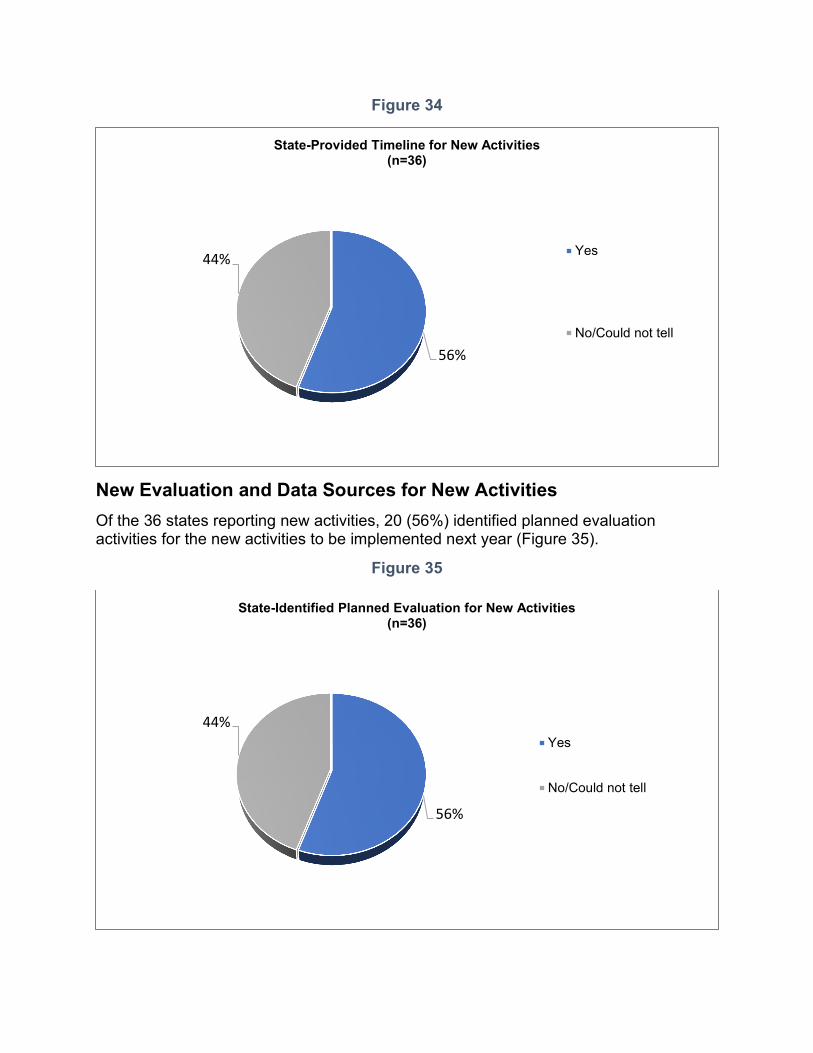
Figure 34
56%
44%
State-Provided Timeline for New Activities(n=36)
Yes
No/Could not tell
New Evaluation and Data Sources for New Activities Of the 36 states reporting new activities, 20 (56%) identified planned evaluation activities for the new activities to be implemented next year (Figure 35).
Figure 35
56%
44%
State-Identified Planned Evaluation for New Activities(n=36)
Yes
No/Could not tell
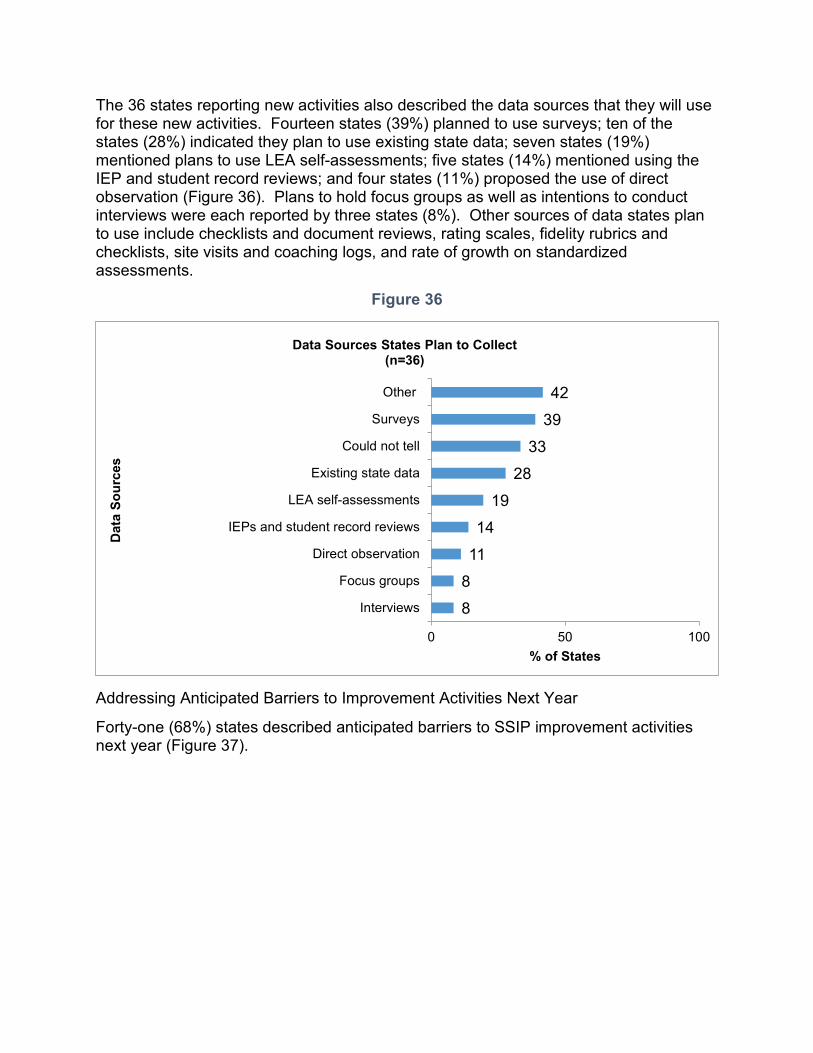
The 36 states reporting new activities also described the data sources that they will use for these new activities. Fourteen states (39%) planned to use surveys; ten of the states (28%) indicated they plan to use existing state data; seven states (19%) mentioned plans to use LEA self-assessments; five states (14%) mentioned using the IEP and student record reviews; and four states (11%) proposed the use of direct observation (Figure 36). Plans to hold focus groups as well as intentions to conduct interviews were each reported by three states (8%). Other sources of data states plan to use include checklists and document reviews, rating scales, fidelity rubrics and checklists, site visits and coaching logs, and rate of growth on standardized assessments.
Figure 36
881114
1928
333942
0 50 100
Interviews
Focus groups
Direct observation
IEPs and student record reviews
LEA self-assessments
Existing state data
Could not tell
Surveys
Other
% of States
Dat
a So
urce
s
Data Sources States Plan to Collect (n=36)
Addressing Anticipated Barriers to Improvement Activities Next Year
Forty-one (68%) states described anticipated barriers to SSIP improvement activities next year (Figure 37).
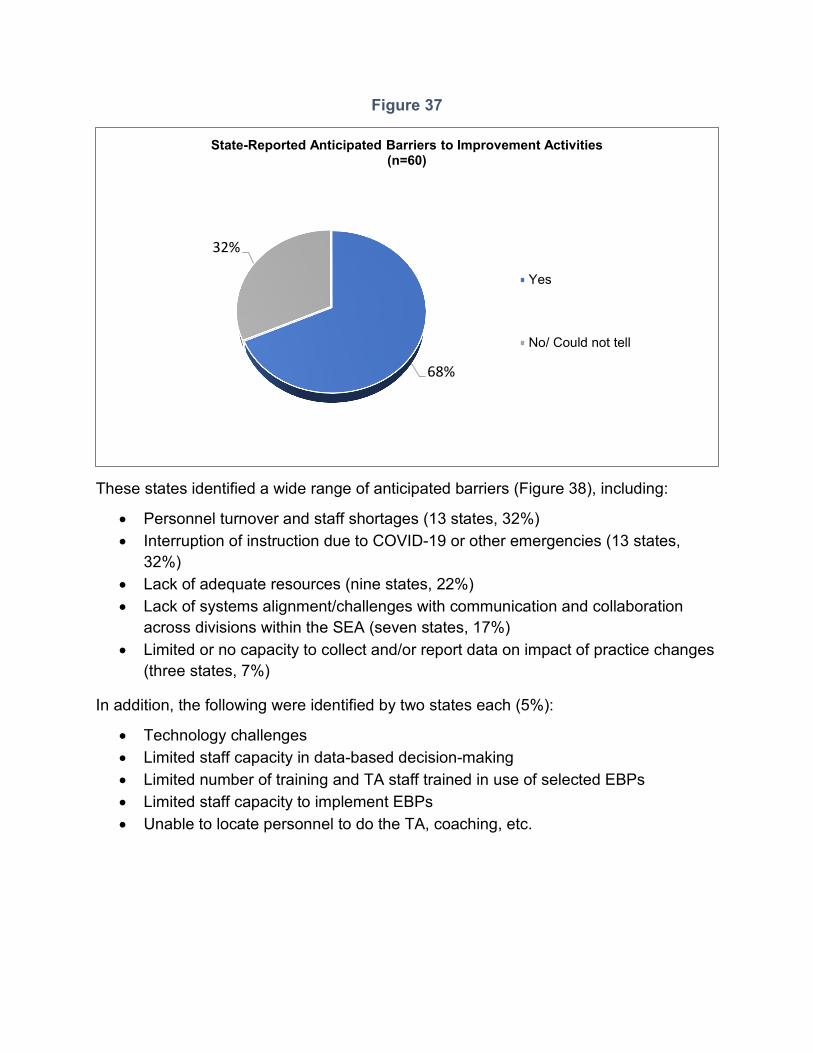
Figure 37
68%
32%
State-Reported Anticipated Barriers to Improvement Activities(n=60)
Yes
No/ Could not tell
These states identified a wide range of anticipated barriers (Figure 38), including:
• Personnel turnover and staff shortages (13 states, 32%) • Interruption of instruction due to COVID-19 or other emergencies (13 states,
32%) • Lack of adequate resources (nine states, 22%) • Lack of systems alignment/challenges with communication and collaboration
across divisions within the SEA (seven states, 17%) • Limited or no capacity to collect and/or report data on impact of practice changes
(three states, 7%)
In addition, the following were identified by two states each (5%):
• Technology challenges • Limited staff capacity in data-based decision-making • Limited number of training and TA staff trained in use of selected EBPs • Limited staff capacity to implement EBPs • Unable to locate personnel to do the TA, coaching, etc.
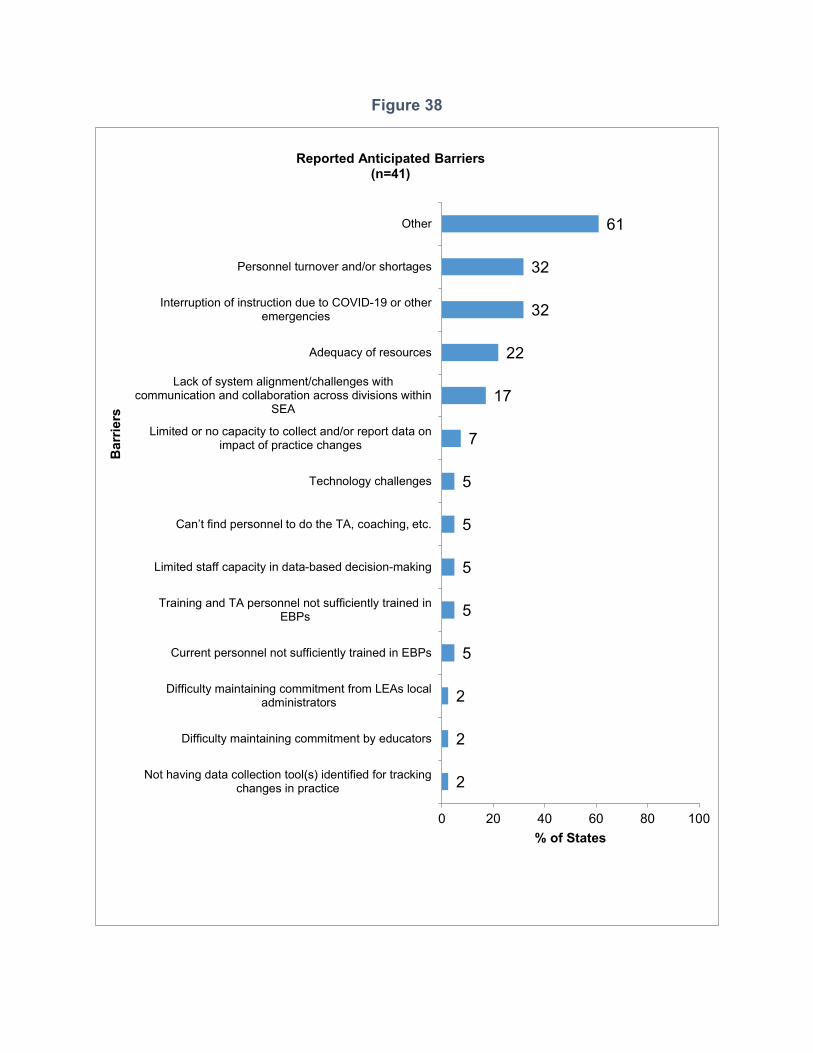
Figure 38
2
2
2
5
5
5
5
5
7
17
22
32
32
61
0 20 40 60 80 100
Not having data collection tool(s) identified for trackingchanges in practice
Difficulty maintaining commitment by educators
Difficulty maintaining commitment from LEAs localadministrators
Current personnel not sufficiently trained in EBPs
Training and TA personnel not sufficiently trained inEBPs
Limited staff capacity in data-based decision-making
Can’t find personnel to do the TA, coaching, etc.
Technology challenges
Limited or no capacity to collect and/or report data onimpact of practice changes
Lack of system alignment/challenges withcommunication and collaboration across divisions within
SEA
Adequacy of resources
Interruption of instruction due to COVID-19 or otheremergencies
Personnel turnover and/or shortages
Other
% of States
Bar
riers
Reported Anticipated Barriers(n=41)
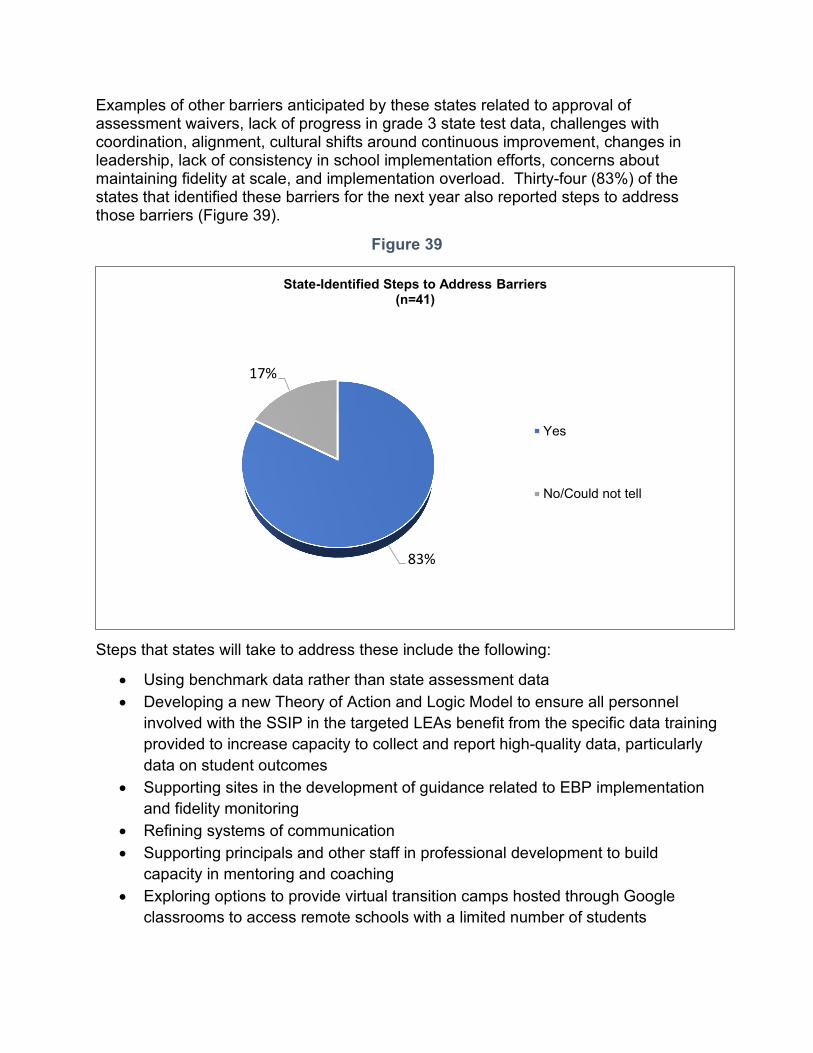
Examples of other barriers anticipated by these states related to approval of assessment waivers, lack of progress in grade 3 state test data, challenges with coordination, alignment, cultural shifts around continuous improvement, changes in leadership, lack of consistency in school implementation efforts, concerns about maintaining fidelity at scale, and implementation overload. Thirty-four (83%) of the states that identified these barriers for the next year also reported steps to address those barriers (Figure 39).
Figure 39
83%
17%
State-Identified Steps to Address Barriers(n=41)
Yes
No/Could not tell
Steps that states will take to address these include the following:
• Using benchmark data rather than state assessment data • Developing a new Theory of Action and Logic Model to ensure all personnel
involved with the SSIP in the targeted LEAs benefit from the specific data training provided to increase capacity to collect and report high-quality data, particularly data on student outcomes
• Supporting sites in the development of guidance related to EBP implementation and fidelity monitoring
• Refining systems of communication • Supporting principals and other staff in professional development to build
capacity in mentoring and coaching • Exploring options to provide virtual transition camps hosted through Google
classrooms to access remote schools with a limited number of students
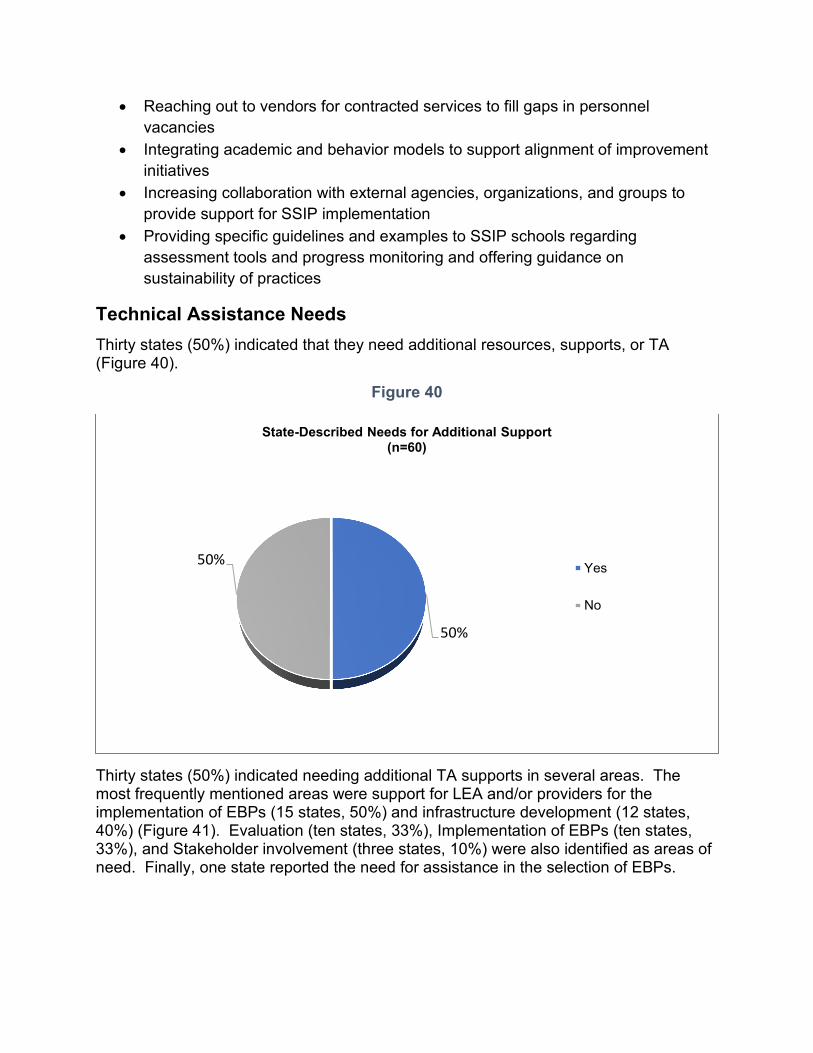
• Reaching out to vendors for contracted services to fill gaps in personnel vacancies
• Integrating academic and behavior models to support alignment of improvement initiatives
• Increasing collaboration with external agencies, organizations, and groups to provide support for SSIP implementation
• Providing specific guidelines and examples to SSIP schools regarding assessment tools and progress monitoring and offering guidance on sustainability of practices
Technical Assistance Needs Thirty states (50%) indicated that they need additional resources, supports, or TA (Figure 40).
Figure 40
50%
50%
State-Described Needs for Additional Support (n=60)
Yes
No
Thirty states (50%) indicated needing additional TA supports in several areas. The most frequently mentioned areas were support for LEA and/or providers for the implementation of EBPs (15 states, 50%) and infrastructure development (12 states, 40%) (Figure 41). Evaluation (ten states, 33%), Implementation of EBPs (ten states, 33%), and Stakeholder involvement (three states, 10%) were also identified as areas of need. Finally, one state reported the need for assistance in the selection of EBPs.
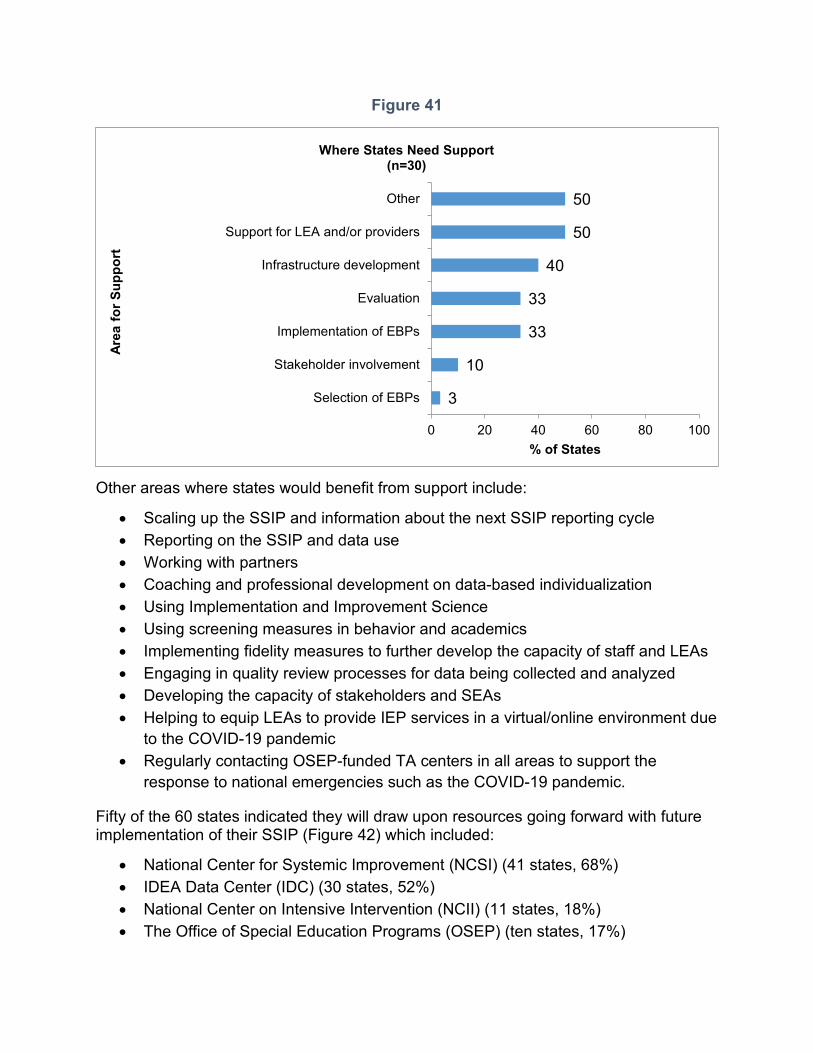
Figure 41
3
10
33
33
40
50
50
0 20 40 60 80 100
Selection of EBPs
Stakeholder involvement
Implementation of EBPs
Evaluation
Infrastructure development
Support for LEA and/or providers
Other
% of States
Area
for S
uppo
rt
Where States Need Support(n=30)
Other areas where states would benefit from support include:
• Scaling up the SSIP and information about the next SSIP reporting cycle • Reporting on the SSIP and data use • Working with partners • Coaching and professional development on data-based individualization • Using Implementation and Improvement Science • Using screening measures in behavior and academics • Implementing fidelity measures to further develop the capacity of staff and LEAs • Engaging in quality review processes for data being collected and analyzed • Developing the capacity of stakeholders and SEAs • Helping to equip LEAs to provide IEP services in a virtual/online environment due
to the COVID-19 pandemic • Regularly contacting OSEP-funded TA centers in all areas to support the
response to national emergencies such as the COVID-19 pandemic.
Fifty of the 60 states indicated they will draw upon resources going forward with future implementation of their SSIP (Figure 42) which included:
• National Center for Systemic Improvement (NCSI) (41 states, 68%) • IDEA Data Center (IDC) (30 states, 52%) • National Center on Intensive Intervention (NCII) (11 states, 18%) • The Office of Special Education Programs (OSEP) (ten states, 17%)
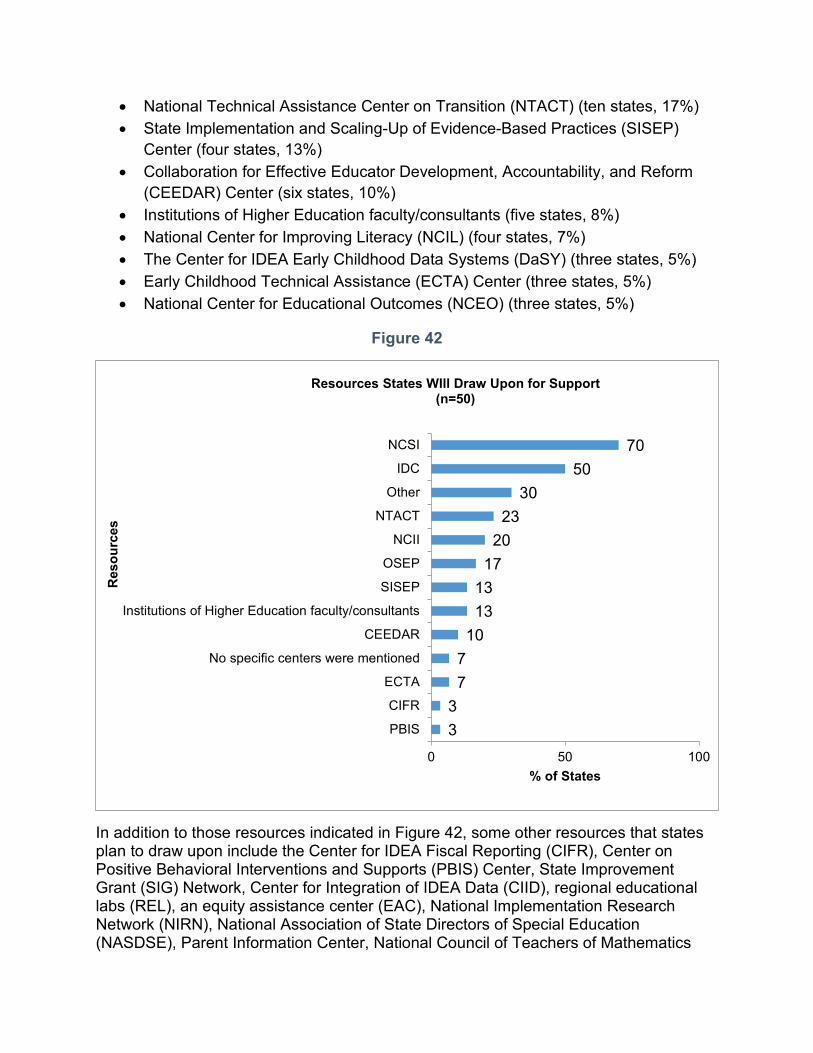
• National Technical Assistance Center on Transition (NTACT) (ten states, 17%) • State Implementation and Scaling-Up of Evidence-Based Practices (SISEP)
Center (four states, 13%) • Collaboration for Effective Educator Development, Accountability, and Reform
(CEEDAR) Center (six states, 10%) • Institutions of Higher Education faculty/consultants (five states, 8%) • National Center for Improving Literacy (NCIL) (four states, 7%) • The Center for IDEA Early Childhood Data Systems (DaSY) (three states, 5%) • Early Childhood Technical Assistance (ECTA) Center (three states, 5%) • National Center for Educational Outcomes (NCEO) (three states, 5%)
Figure 42
33
77
101313
1720
2330
5070
0 50 100
PBIS
CIFR
ECTA
No specific centers were mentioned
CEEDAR
Institutions of Higher Education faculty/consultants
SISEP
OSEP
NCII
NTACT
Other
IDC
NCSI
% of States
Res
ourc
es
Resources States WIll Draw Upon for Support(n=50)
In addition to those resources indicated in Figure 42, some other resources that states plan to draw upon include the Center for IDEA Fiscal Reporting (CIFR), Center on Positive Behavioral Interventions and Supports (PBIS) Center, State Improvement Grant (SIG) Network, Center for Integration of IDEA Data (CIID), regional educational labs (REL), an equity assistance center (EAC), National Implementation Research Network (NIRN), National Association of State Directors of Special Education (NASDSE), Parent Information Center, National Council of Teachers of Mathematics
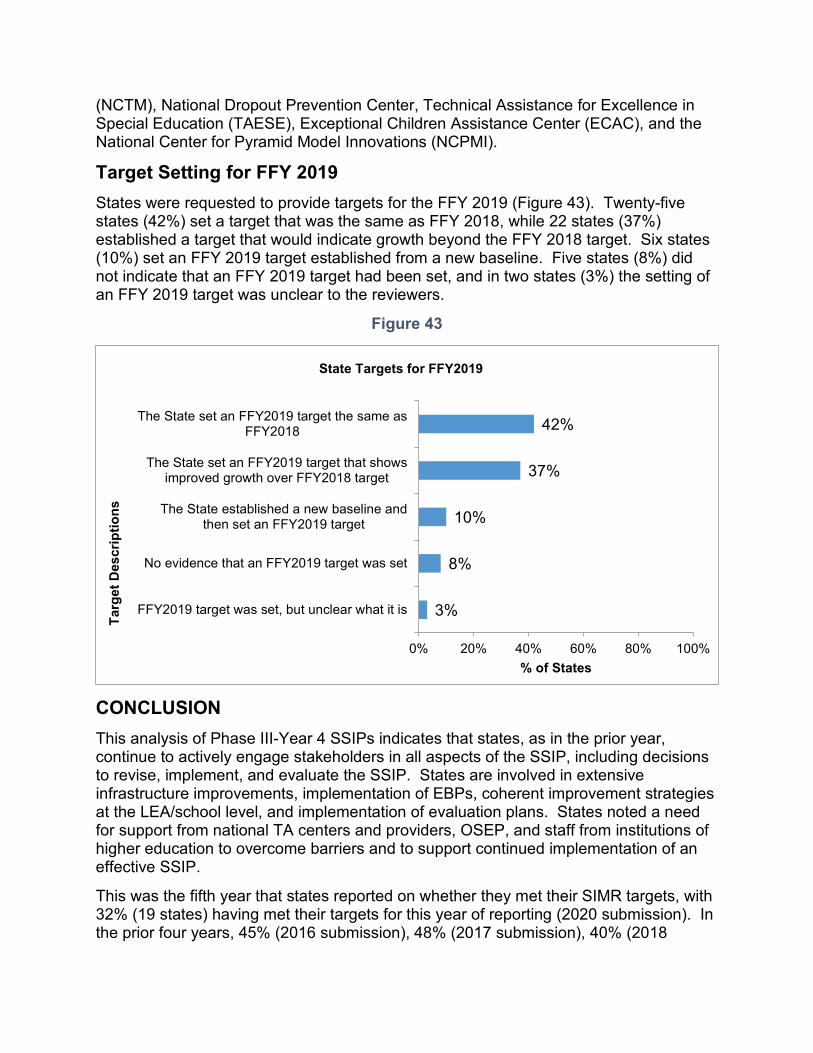
(NCTM), National Dropout Prevention Center, Technical Assistance for Excellence in Special Education (TAESE), Exceptional Children Assistance Center (ECAC), and the National Center for Pyramid Model Innovations (NCPMI).
Target Setting for FFY 2019 States were requested to provide targets for the FFY 2019 (Figure 43). Twenty-five states (42%) set a target that was the same as FFY 2018, while 22 states (37%) established a target that would indicate growth beyond the FFY 2018 target. Six states (10%) set an FFY 2019 target established from a new baseline. Five states (8%) did not indicate that an FFY 2019 target had been set, and in two states (3%) the setting of an FFY 2019 target was unclear to the reviewers.
Figure 43
3%
8%
10%
37%
42%
0% 20% 40% 60% 80% 100%
FFY2019 target was set, but unclear what it is
No evidence that an FFY2019 target was set
The State established a new baseline andthen set an FFY2019 target
The State set an FFY2019 target that showsimproved growth over FFY2018 target
The State set an FFY2019 target the same asFFY2018
% of States
Targ
et D
escr
iptio
ns
State Targets for FFY2019
CONCLUSION This analysis of Phase III-Year 4 SSIPs indicates that states, as in the prior year, continue to actively engage stakeholders in all aspects of the SSIP, including decisions to revise, implement, and evaluate the SSIP. States are involved in extensive infrastructure improvements, implementation of EBPs, coherent improvement strategies at the LEA/school level, and implementation of evaluation plans. States noted a need for support from national TA centers and providers, OSEP, and staff from institutions of higher education to overcome barriers and to support continued implementation of an effective SSIP.
This was the fifth year that states reported on whether they met their SIMR targets, with 32% (19 states) having met their targets for this year of reporting (2020 submission). In the prior four years, 45% (2016 submission), 48% (2017 submission), 40% (2018
submission), and 32% (2019 submission) of the states, respectively, met their targets for those years.
REFERENCE
Cashman, J., Linehan, P., Purcell, L., Rosser, M., Schultz, S., & Skalski, S. (2014). Leading by convening: A blueprint for authentic engagement. Alexandria, VA: National Association of State Directors of Special Education.
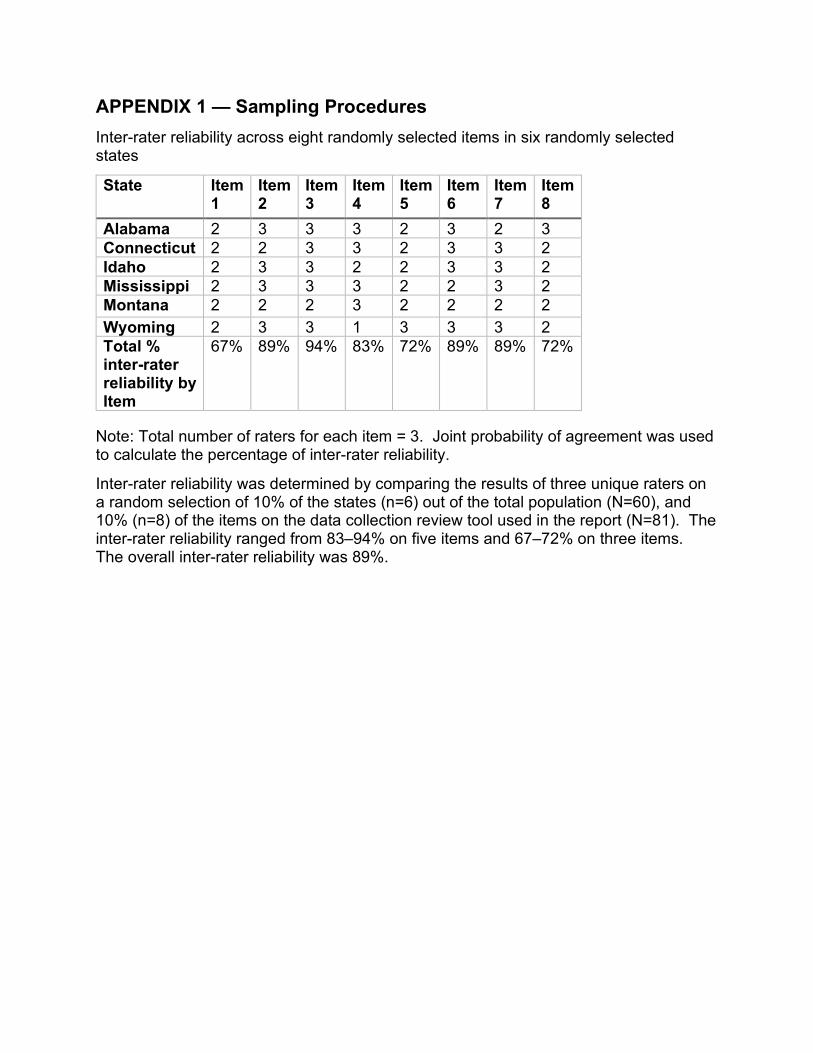
APPENDIX 1 — Sampling Procedures Inter-rater reliability across eight randomly selected items in six randomly selected states
State Item 1
Item 2
Item 3
Item 4
Item 5
Item 6
Item 7
Item 8
Alabama 2 3 3 3 2 3 2 3 Connecticut 2 2 3 3 2 3 3 2 Idaho 2 3 3 2 2 3 3 2 Mississippi 2 3 3 3 2 2 3 2 Montana 2 2 2 3 2 2 2 2 Wyoming 2 3 3 1 3 3 3 2 Total % inter-rater reliability by Item
67%
89%
94%
83%
72%
89%
89%
72%
Note: Total number of raters for each item = 3. Joint probability of agreement was used to calculate the percentage of inter-rater reliability.
Inter-rater reliability was determined by comparing the results of three unique raters on a random selection of 10% of the states (n=6) out of the total population (N=60), and 10% (n=8) of the items on the data collection review tool used in the report (N=81). The inter-rater reliability ranged from 83–94% on five items and 67–72% on three items. The overall inter-rater reliability was 89%.
APPENDIX 2 — Stakeholder Engagement The following stakeholder engagement definitions were used by reviewers when scoring the SSIPs.
Informing: sharing/dissemination, in a one-way communication method, from the state to the stakeholders, such as by emails or newsletters. With this type of engagement, a state would be informing stakeholders that revisions were made to the Phase III SSIP. Information would be shared with or disseminated to stakeholders who had an interest in the SSIP. There is no expectation from the state to receive any information in return from stakeholders.
Networking: exchanging information in a two-way communication between the SEA and the stakeholders. With this type of engagement, the state would give out information and stakeholders would give back information to the state about their understanding. Each party is explaining their position and working to understand the other. Communication at this level of engagement is about clarifying what the other party is saying. There is no creation of new knowledge nor combining of information to create a new idea. In this level of engagement, the state would be asking stakeholders what they think about an issue and listening to what is said. There is no expectation from stakeholders that the state will use the information that is received.
Collaborating: the SEA and stakeholders engaging with each other, getting together on an issue over time, and creating new thoughts. There would be dialogue and discussion occurring. This type of engagement is more likely done in smaller groups. With this type of engagement, the intent is to engage the state and stakeholders in trying to do something of value and working together around the issue.
Transforming: committing to the work, approaching issues through engagement and consensus-building, where the SEA and stakeholders are equals and considered partners. Stakeholders may block decisions. At this level, the state is engaged in actively talking with practitioners, such as speaking directly to multiple teachers, rather than only engaging with a teacher representative on a committee. This type of engagement leads to creating things that are new and different. The state provides leadership by convening people to come together and address an issue. Perhaps the state and stakeholders are co-presenting information at meetings or conferences or working in cross-stakeholder groups to accomplish their work. There is usually a sharing of leadership in conducting meetings and building consensus on most or all issues that are tackled jointly. The state and partners are “in it together.” The partners have “skin in the game.”