Embed Size (px)
Citation preview

FFY 2016 Part C State Performance Plan (SPP)/Annual Performance Report (APR)
Michigan Part C FFY2016 State Performance Plan /
Annual Performance Report
2/27/2018 Page 1 of 34

Introduction to the State Performance Plan (SPP)/Annual Performance Report (APR)
Attachments
Executive Summary:
The Lead Agency for Part C in Michigan is the State Education Agency, the Michigan Department of Education (MDE). Since programinception, the early intervention system has coordinated and collaborated with the Department of Human Services (DHS), the childwell-being agency, and the Department of Community Health (DCH), which houses both mental health and public health, toimplement the early intervention system for infants and toddlers with disabilities or developmental delays and their families. Thethree partner agencies are now one agency, the Michigan Department of Health and Human Services.
There are 56 intermediate school districts responsible for the administration of Early On across the state. Each local earlyintervention system (LEIS) is required to have a Local Interagency Coordinating Council (LICC) to provide advice for its system ofservices. The LICCs are patterned after the MICC, requiring representative stakeholders as well as parent membership.
The APR development process included input from partner agencies, data collected by various contractors, and a review by theMichigan Interagency Coordinating Council (MICC). Individual contractors are assigned responsibility for indicator-specific data. Datasources include local data programs via the Michigan Student Data System (MSDS), with analysis from the Part C 618 datacontractor, and the Wayne State University Outcome data contractor. A series of meetings were held to review and analyze data anddevelop appropriate activities. The data coordination meetings helped to align work and decrease redundancy of efforts.
In Michigan, Parts B and C were involved in the development of a more comprehensive monitoring/accountability system namedCatamaran. The monitoring system has gone through various iterations to respond to the changes mandated as a result of the2004 Reauthorization of the Individuals with Disabilities Education Improvement Act. Continuous improvement is a constant goal, soenhancements were initiated to the monitoring/accountability system in response to needs of the users. There are three monitoringcomponents to Catamaran: (1) Focused Monitoring; (2) Data Analysis, which includes a process for notifying local early interventionprograms of findings which require corrective action plans for compliance indicators; and (3) Verification.
Verification that each local early intervention system is correctly implementing a specific regulatory requirement starts with MDEreviewing the MSDS data submitted by each local system. If data submitted and reviewed by MDE indicates correction, thenverification is complete. If a deeper analysis is required, MDE will request that the service area submit a random sample of 10% ofthe most recent local child count or a minimum of ten records, whichever is greater from the local program child files within thereporting period. MDE uses an indicator-specific checklist based upon the federal and state standards when reviewing each set oflocal program files. This ensures that local programs are correctly implementing the specific regulatory requirements. Verification ofnoncompliance notification is made in the Catamaran system. For all child level noncompliance and/or related requirements,citations are provided to the LEIS through a child level corrective action form. The local systems are given a deadline by which theymust correct the noncompliance for each child record. The state verifies child level correction of noncompliance by reviewingindividual child records using the same indicator-specific checklist. This review certifies that the specific missing component thatcaused noncompliance has been provided to that child and/or family.
A copy of the Michigan Part C of IDEA State Performance Plan (SPP) can be downloaded at www.michigan.gov/earlyon.
Public Reporting
The FFY 2015 public report on the performance of each LEIS for all of the required indicators was posted on MDE’s website:www.michigan.gov/earlyon. Data were shared with the stakeholder group, the MICC. Prior to release, LEIS were asked to review theirdata. After the various reviews, a media advisory was released by MDE’s Office of Communications directing stakeholders to the site.
File Name Uploaded By Uploaded Date Remove
micc apr form.pdf Cheryl Najm
Remove
General Supervision System:
The systems that are in place to ensure that IDEA Part C requirements are met, e.g., monitoring systems, dispute resolution systems.
A Michigan Part C comprehensive general supervision system is in place to assist in achieving improved results for infants andtoddlers with disabilities and/or a developmental delay and their families. Various components of the system are briefly discussedbelow.
The Michigan Department of Education (MDE) is the lead agency for the implementation of Part C of the Individuals with DisabilitiesEducation Act (IDEA). Part C of IDEA is commonly known as Early On within the State. Leadership for Early On is located in the Officeof Great Start/Early Childhood Development and Family Education (OGS/ECD&FE).There are 56 intermediate school districtsresponsible for the administration of Early On across the state. Each LEIS is required to have a Local Interagency CoordinatingCouncil (LICC) to provide advice for its system of services. The LICCs are patterned after the MICC, requiring representativestakeholders as well as parent membership.
Early On partners and collaborates with the Michigan Interagency Coordinating Council (MICC), the state interagency coordinating
FFY 2016 Part C State Performance Plan (SPP)/Annual Performance Report (APR)
2/27/2018 Page 2 of 34
Attachments
council. MDE staff reviewed available data along with statewide contractors, members of the MICC Executive Committee, and theParent Involvement Committee (PIC). After many data review meetings, target recommendations were presented to the MICC attheir November 2014 meeting. In each November the MICC reviews current data in comparison to the previously set targets.
Data Collection for Part C reporting requirements are collected from three sources: 1) the Michigan Electronic Grants System Plus(MEGS+); 2) the Michigan Student Data System (MSDS); and 3) the Qualitative Compliance Information Project (QCIP), Michigan'sconfidential system for reporting family outcomes. Local lead agencies collect basic demographic data on all children enrolled inEarly On, assigning a unique identification code (UIC) to each child. Those data are then uploaded from individual local datamanagement systems into MSDS. MSDS builds a secure, confidential record of elements needed for federal reporting.
Fiscal management of LEIS and statewide contracts is controlled using MEGS+. All fiscal agents must apply for Part C funds throughthis system. Budgets and subsequent amendments are approved by lead agency staff. Distribution of reimbursement payments areconducted and final expenditure reports are filed via the Cash Management System.
An Effective Dispute Resolution System is in place with the support of Michigan's Office of Special Education (OSE), the lead office forPart B of IDEA. OSE provides oversight and administration for mediation, complaints, and due process hearings for both Part C andPart B of IDEA.
Mediations in the state are processed by the Michigan Special Education Mediation Program (MSEMP). MSEMP provides servicesthrough the Community Dispute Resolution Program, a network of 18 conflict resolution centers across the state. The project usesmediation, facilitation, and training services for working through disputes. The mediation process is intended to resolve disputes bysharing ideas on what the child needs. The process helps participants find solutions for the good of the child and family in anon-legal way, thereby avoiding a lengthy and expensive court process. The use of mediation is voluntary and has to be agreed toby both the parent and the local early intervention system. MSEMP is administered by Dispute Resolution Education Resources, Inc.a Lansing-based nonprofit organization.
Complaints filed with the state are processed by OSE. OSE has a very organized system to track and process complaints. OSEutilizes a single-tier complaint system. All state complaints are completed using this system. This single-tier system allows the earlyintervention systems and OSE to jointly investigate complaints resulting in the opportunity to encourage and support the use of localresolution and methods of alternative dispute resolution.
Due Process Hearings in Michigan are processed in a single-tier system that uses hearing officers who are administrative lawjudges.The hearing officers are salaried state employees employed by a state department separate from MDE. It is required thatthe hearing officers are knowledgeable and understand the provision of IDEA, federal and state regulations, and all relevant legalinterpretations. This separate agency is the State Office of Administrative Hearings and Rules (SOAHR).
The monitoring system used by OSE and OGS/ECD&FE was redesigned and is now called Catamaran. The state uses this system toensure compliance with IDEA and any state rule and to promote outcomes. This system was designed to help the state and localsanalyze and interpret data, as well as record all monitoring activities in a single location. It reflects the priorities of IDEA and theState Performance Plan (SPP). In assessing the performance of its locals, the state monitors data collected through the following:
Focused monitoring activities (on-site, state-verified desk audit or state-verified self-review),Data reviews, andOther activities.
Michigan evaluates the performance of each local early intervention system, relative to the SPP indicator targets. If areas ofnoncompliance are identified, the state issues a finding of noncompliance to the local early intervention system.
A Finding is a dated, written notification that includes both the citation of the statute, rule or regulation, and a description of thedata supporting the state's conclusion that there is noncompliance with that statute or regulation. There are two prongs ofverification of correction used by the state: Prong 1 – The local has corrected each individual case of noncompliance, and Prong 2 –The local is correctly implementing the specific regulatory requirements (i.e., achieved 100 percent compliance) based on the state'sreview of new data per established indicator timeframes.
All identified noncompliance must be corrected as soon as possible, but in no case later than one year, including verification.Policies, procedures, and the SPP/APR are in place to provide guidance to the field. A Michigan State Plan for Part C of IDEA providesa general overview to the federal requirements. The State Plan, additional guidance, and implementation can be found on the MDE,Early On, and Early On Training and Technical Assistance websites; which are available to the public. The three website addresses arebelow:Michigan Department of Education: www.michigan.gov/earlyonEarly On: www.1800EarlyOn.orgEarly On Training and Technical Assistance: www.eotta.ccresa.org
File Name Uploaded By Uploaded Date
No APR attachments found.
Technical Assistance System:
The mechanisms that the State has in place to ensure the timely delivery of high quality, evidenced based technical assistance and support to early intervention service (EIS)programs.
Technical Assistance (TA) is provided by a statewide contractor, Early On Training and Technical Assistance (EOT&TA), at ClintonCounty Regional Educational Service Agency. Technical assistance is a component of the comprehensive system of personneldevelopment provided by this same contractor. Staff of EOT&TA participate in numerous national initiatives and activities to stayabreast of current practices. The contractor provides TA to local early intervention systems through a variety of methods includingguidance documents, phone contacts, email, one on one technical assistance for each of the local systems, and onsite meetings. Adaily toll-free line is available for early intervention personnel to ask questions. This contractor also provides TA after state
FFY 2016 Part C State Performance Plan (SPP)/Annual Performance Report (APR)
2/27/2018 Page 3 of 34

Attachments
Attachments
Attachments
monitoring to assist the LEIS to come into compliance.
Each LEIS also receive technical assistance from state staff. Three state consultants are assigned a cohort of local systems toprovide TA in addition to support from EOT&TA. State staff and EOT&TA work closely to coordinate support to the local systems.State staff technical assistance is at the policy level to clarify guidance where needed at the local level.
File Name Uploaded By Uploaded Date
No APR attachments found.
Professional Development System:
The mechanisms the State has in place to ensure that service providers are effectively providing services that improve results for infants and toddlers with disabilities and theirfamilies.
Comprehensive system of personnel development
Through issuance of a mandated activities project contract, Michigan has developed a comprehensive system of personneldevelopment, including the training of paraprofessionals and the training of primary referral sources with respect to the basiccomponents of an early intervention system available in the state that includes:
Training personnel in implementing innovative strategies and activities for the recruitment and retention of Early On serviceproviders,Promoting the preparation of Early On service providers who are fully and appropriately qualified to provide early interventionservices under Part C, andTraining personnel to coordinate transition services for infants and toddlers in geographic areas throughout the state.
This contractor also has the responsibility of providing timely delivery of high quality, evidenced-based technical assistance andsupport to LEIS. Supports to the field include a resourceful website, online and in person trainings, webinars, system updatessessions, conferences, communities of practice, and recently a book study with national technical assistance experts. Participation innational communities of practice and technical assistance events provide contractors the most current and up-to-date information.A self-paced, five-part training module for personnel development entitled the Essentials for Early On is available to supportproviders in the field to understand expectations for those evaluating infants and toddlers. State staff worked to enable continuingeducation credits for those completing the on-line course.
File Name Uploaded By Uploaded Date
No APR attachments found.
Stakeholder Involvement: apply this to all Part C results indicators
The mechanism for soliciting broad stakeholder input on targets in the SPP, including revisions to targets.
Michigan Part C collaborates extensively with the Michigan Interagency Coordinating Council (MICC), a Governor-appointed advisorycouncil. The MICC includes multiple stakeholders from various perspectives around the state. Issues are addressed through variousad hoc and standing committees. The Executive and Parent Involvement Committees provide a great deal of advice to the leadagency. When targets need to be established or revised, these committees, along with statewide contractors, review data and makerecommendations for the targets. After many data review meetings, target recommendations were presented to the MICC at theirNovember 2014 meeting. Each November the MICC reviews current data in comparison to the previously set targets.
File Name Uploaded By Uploaded Date
No APR attachments found.
Reporting to the Public:
How and where the State reported to the public on the FFY 2015 performance of each EIS Program or Provider located in the State on the targets in the SPP/APR as soon aspracticable, but no later than 120 days following the State’s submission of its FFY 2015 APR, as required by 34 CFR §303.702(b)(1)(i)(A); and a description of where, on its Website, a complete copy of the State’s SPP, including any revision if the State has revised the SPP that it submitted with its FFY 2015 APR in 2017, is available.
As required by law, public reporting occurs no later than 120 days from submission of the Annual Performance Report (APR).Michigan's Part C SPP can be found at www.michigan.gov/earlyon under the heading Federal Reports/Performance.
Reporting to the public is conducted on the three websites for Early On listed below:
Michigan Department of Education: www.michigan.gov/earlyon or www.MiSchoolData.org, and Early On: www.1800EarlyOn.org.
FFY 2016 Part C State Performance Plan (SPP)/Annual Performance Report (APR)
2/27/2018 Page 4 of 34

Attachments
File Name Uploaded By Uploaded Date
No APR attachments found.
Actions required in FFY 2015 response
FFY 2016 Part C State Performance Plan (SPP)/Annual Performance Report (APR)
2/27/2018 Page 5 of 34
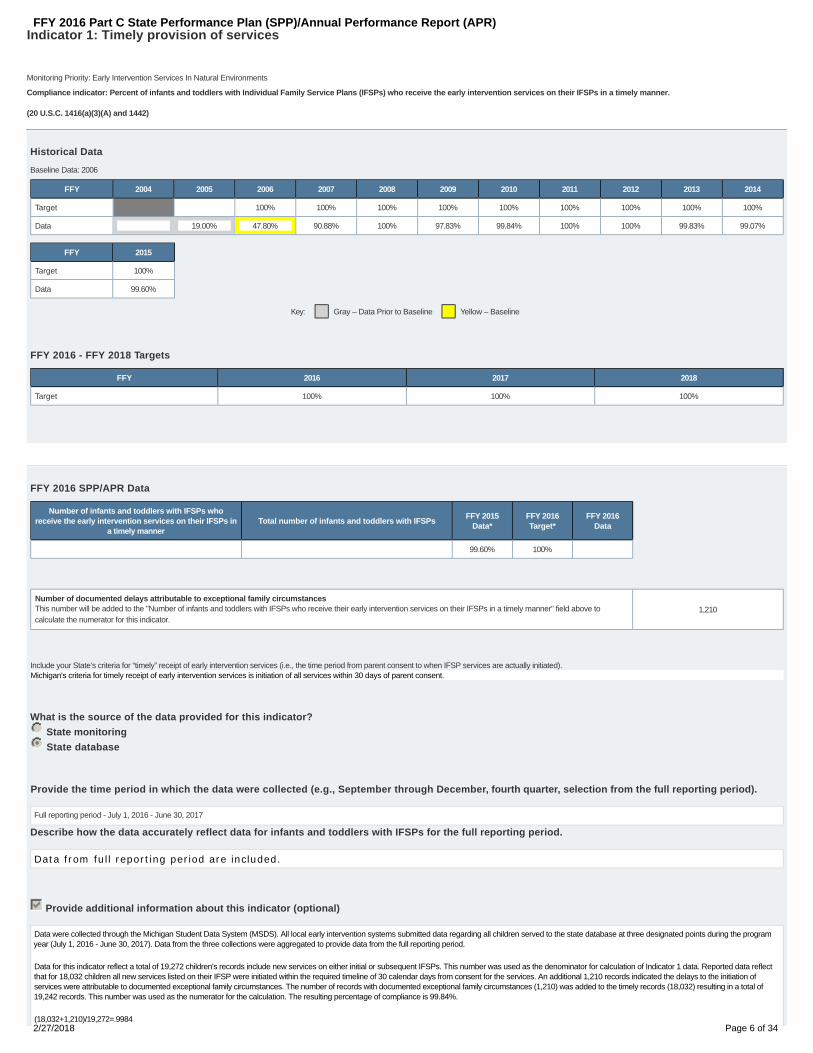
Indicator 1: Timely provision of services
Baseline Data: 2006
Monitoring Priority: Early Intervention Services In Natural Environments
Compliance indicator: Percent of infants and toddlers with Individual Family Service Plans (IFSPs) who receive the early intervention services on their IFSPs in a timely manner.
(20 U.S.C. 1416(a)(3)(A) and 1442)
Historical Data
FFY 2004 2005 2006 2007 2008 2009 2010 2011 2012 2013 2014
Target 100% 100% 100% 100% 100% 100% 100% 100% 100%
Data 19.00% 47.80% 90.88% 100% 97.83% 99.84% 100% 100% 99.83% 99.07%
FFY 2015
Target 100%
Data 99.60%
Key: Gray – Data Prior to Baseline Yellow – Baseline
FFY 2016 - FFY 2018 Targets
FFY 2016 2017 2018
Target 100% 100% 100%
FFY 2016 SPP/APR Data
Number of infants and toddlers with IFSPs whoreceive the early intervention services on their IFSPs in
a timely mannerTotal number of infants and toddlers with IFSPs
FFY 2015Data*
FFY 2016Target*
FFY 2016Data
99.60% 100%
Number of documented delays attributable to exceptional family circumstancesThis number will be added to the "Number of infants and toddlers with IFSPs who receive their early intervention services on their IFSPs in a timely manner" field above tocalculate the numerator for this indicator.
1,210
Include your State’s criteria for “timely” receipt of early intervention services (i.e., the time period from parent consent to when IFSP services are actually initiated).Michigan's criteria for timely receipt of early intervention services is initiation of all services within 30 days of parent consent.
What is the source of the data provided for this indicator?
State monitoring
State database
Provide the time period in which the data were collected (e.g., September through December, fourth quarter, selection from the full reporting period).
Full reporting period - July 1, 2016 - June 30, 2017
Describe how the data accurately reflect data for infants and toddlers with IFSPs for the full reporting period.
Data from full reporting period are included.
Provide additional information about this indicator (optional)
Data were collected through the Michigan Student Data System (MSDS). All local early intervention systems submitted data regarding all children served to the state database at three designated points during the programyear (July 1, 2016 - June 30, 2017). Data from the three collections were aggregated to provide data from the full reporting period.
Data for this indicator reflect a total of 19,272 children's records include new services on either initial or subsequent IFSPs. This number was used as the denominator for calculation of Indicator 1 data. Reported data reflectthat for 18,032 children all new services listed on their IFSP were initiated within the required timeline of 30 calendar days from consent for the services. An additional 1,210 records indicated the delays to the initiation ofservices were attributable to documented exceptional family circumstances. The number of records with documented exceptional family circumstances (1,210) was added to the timely records (18,032) resulting in a total of19,242 records. This number was used as the numerator for the calculation. The resulting percentage of compliance is 99.84%.
(18,032+1,210)/19,272=.9984
FFY 2016 Part C State Performance Plan (SPP)/Annual Performance Report (APR)
2/27/2018 Page 6 of 34
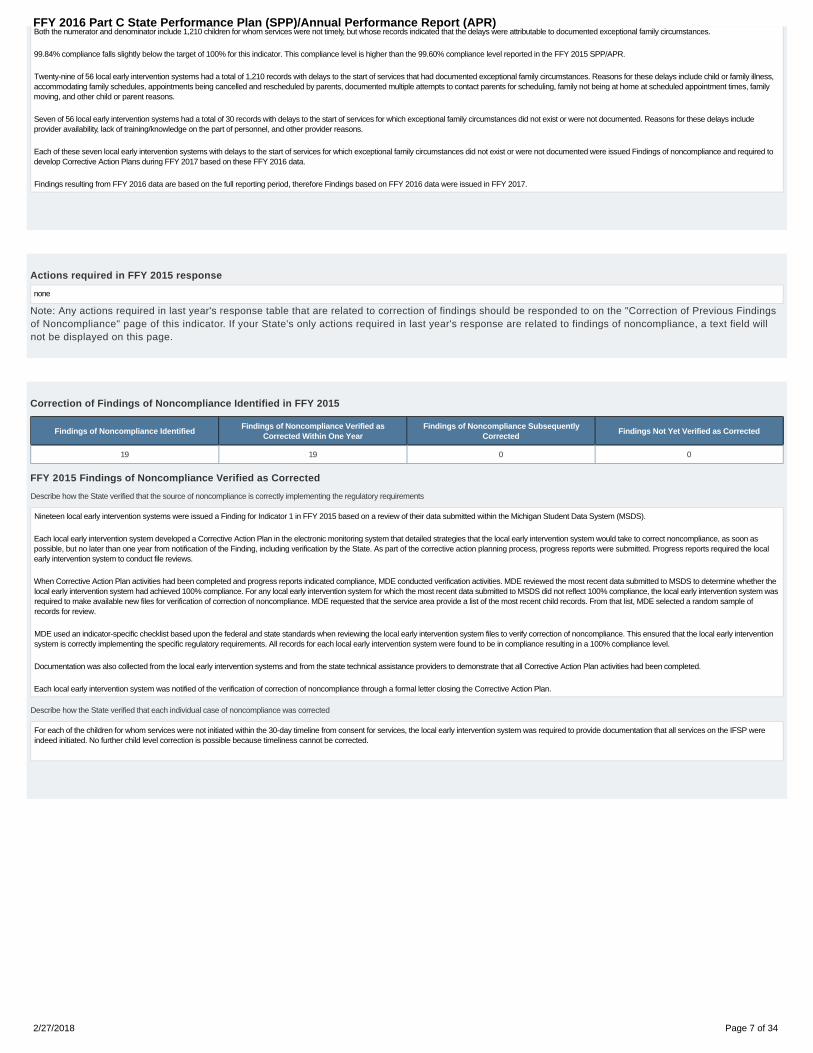
Both the numerator and denominator include 1,210 children for whom services were not timely, but whose records indicated that the delays were attributable to documented exceptional family circumstances.
99.84% compliance falls slightly below the target of 100% for this indicator. This compliance level is higher than the 99.60% compliance level reported in the FFY 2015 SPP/APR.
Twenty-nine of 56 local early intervention systems had a total of 1,210 records with delays to the start of services that had documented exceptional family circumstances. Reasons for these delays include child or family illness,accommodating family schedules, appointments being cancelled and rescheduled by parents, documented multiple attempts to contact parents for scheduling, family not being at home at scheduled appointment times, familymoving, and other child or parent reasons.
Seven of 56 local early intervention systems had a total of 30 records with delays to the start of services for which exceptional family circumstances did not exist or were not documented. Reasons for these delays includeprovider availability, lack of training/knowledge on the part of personnel, and other provider reasons.
Each of these seven local early intervention systems with delays to the start of services for which exceptional family circumstances did not exist or were not documented were issued Findings of noncompliance and required todevelop Corrective Action Plans during FFY 2017 based on these FFY 2016 data.
Findings resulting from FFY 2016 data are based on the full reporting period, therefore Findings based on FFY 2016 data were issued in FFY 2017.
Actions required in FFY 2015 response
none
Note: Any actions required in last year's response table that are related to correction of findings should be responded to on the "Correction of Previous Findingsof Noncompliance" page of this indicator. If your State's only actions required in last year's response are related to findings of noncompliance, a text field willnot be displayed on this page.
Correction of Findings of Noncompliance Identified in FFY 2015
Findings of Noncompliance IdentifiedFindings of Noncompliance Verified as
Corrected Within One YearFindings of Noncompliance Subsequently
CorrectedFindings Not Yet Verified as Corrected
19 19 0 0
FFY 2015 Findings of Noncompliance Verified as Corrected
Describe how the State verified that the source of noncompliance is correctly implementing the regulatory requirements
Nineteen local early intervention systems were issued a Finding for Indicator 1 in FFY 2015 based on a review of their data submitted within the Michigan Student Data System (MSDS).
Each local early intervention system developed a Corrective Action Plan in the electronic monitoring system that detailed strategies that the local early intervention system would take to correct noncompliance, as soon aspossible, but no later than one year from notification of the Finding, including verification by the State. As part of the corrective action planning process, progress reports were submitted. Progress reports required the localearly intervention system to conduct file reviews.
When Corrective Action Plan activities had been completed and progress reports indicated compliance, MDE conducted verification activities. MDE reviewed the most recent data submitted to MSDS to determine whether thelocal early intervention system had achieved 100% compliance. For any local early intervention system for which the most recent data submitted to MSDS did not reflect 100% compliance, the local early intervention system wasrequired to make available new files for verification of correction of noncompliance. MDE requested that the service area provide a list of the most recent child records. From that list, MDE selected a random sample ofrecords for review.
MDE used an indicator-specific checklist based upon the federal and state standards when reviewing the local early intervention system files to verify correction of noncompliance. This ensured that the local early interventionsystem is correctly implementing the specific regulatory requirements. All records for each local early intervention system were found to be in compliance resulting in a 100% compliance level.
Documentation was also collected from the local early intervention systems and from the state technical assistance providers to demonstrate that all Corrective Action Plan activities had been completed.
Each local early intervention system was notified of the verification of correction of noncompliance through a formal letter closing the Corrective Action Plan.
Describe how the State verified that each individual case of noncompliance was corrected
For each of the children for whom services were not initiated within the 30-day timeline from consent for services, the local early intervention system was required to provide documentation that all services on the IFSP wereindeed initiated. No further child level correction is possible because timeliness cannot be corrected.
FFY 2016 Part C State Performance Plan (SPP)/Annual Performance Report (APR)
2/27/2018 Page 7 of 34

Indicator 2: Services in Natural Environments
Baseline Data: 2005
Monitoring Priority: Early Intervention Services In Natural Environments
Results indicator: Percent of infants and toddlers with IFSPs who primarily receive early intervention services in the home or community-based settings.
(20 U.S.C. 1416(a)(3)(A) and 1442)
Historical Data
FFY 2004 2005 2006 2007 2008 2009 2010 2011 2012 2013 2014
Target ≥ 88.00% 90.00% 92.00% 92.00% 93.00% 93.00% 93.00% 93.00% 93.50%
Data 84.20% 88.10% 92.41% 93.31% 94.31% 96.95% 96.63% 96.24% 96.34% 95.00%
FFY 2015
Target ≥ 93.50%
Data 95.28%
Key: Gray – Data Prior to Baseline Yellow – Baseline Blue – Data Update
FFY 2016 - FFY 2018 Targets
FFY 2016 2017 2018
Target ≥ 94.00% 94.00% 94.00%
Key:
Targets: Description of Stakeholder Input - Please see the Stakeholder Involvement section of the introduction.
Enter additional information about stakeholder involvement
Prepopulated Data
Source Date Description Data Overwrite Data
SY 2016-17 Child Count/EducationalEnvironment Data Groups
7/12/2017Number of infants and toddlers with IFSPs who primarily receive early intervention services in thehome or community-based settings
9,488
SY 2016-17 Child Count/EducationalEnvironment Data Groups
7/12/2017 Total number of infants and toddlers with IFSPs 9,835
FFY 2016 SPP/APR Data
Number of infants and toddlers with IFSPs whoprimarily receive early intervention services in
the home or community-based settings
Total number of infants and toddlers withIFSPs
FFY 2015Data*
FFY 2016Target*
FFY 2016Data
9,488 9,835 95.28% 94.00% 96.47%
Actions required in FFY 2015 response
none
FFY 2016 Part C State Performance Plan (SPP)/Annual Performance Report (APR)
2/27/2018 Page 8 of 34

Indicator 3: Early Childhood Outcomes
Monitoring Priority: Early Intervention Services In Natural Environments
Results indicator: Percent of infants and toddlers with IFSPs who demonstrate improved:
Positive social-emotional skills (including social relationships);A.Acquisition and use of knowledge and skills (including early language/ communication); andB.Use of appropriate behaviors to meet their needs.C.
(20 U.S.C. 1416(a)(3)(A) and 1442)
Does your State's Part C eligibility criteria include infants and toddlers who are at risk of having substantial developmental delays (or “at-risk infants and toddlers”) under IDEA section 632(5)(B)(i)? No
Historical Data
Baseline
YearFFY 2004 2005 2006 2007 2008 2009 2010 2011 2012 2013 2014
A1 2008Target ≥ 74.50% 74.80% 74.80% 76.30% 75.00% 75.30%
Data 74.00% 76.40% 75.10% 74.90% 76.20% 78.21% 64.00%
A2 2008Target ≥ 59.40% 59.70% 59.70% 60.80% 60.40% 60.50%
Data 59.20% 63.40% 60.90% 59.30% 57.70% 54.19% 54.79%
B1 2008Target ≥ 79.00% 79.30% 79.30% 79.50% 79.50% 79.70%
Data 79.10% 80.70% 78.60% 80.80% 80.90% 80.94% 67.60%
B2 2008Target ≥ 53.80% 54.20% 54.20% 51.20% 51.20% 51.80%
Data 54.00% 58.80% 55.30% 54.70% 53.50% 48.63% 49.04%
C1 2008Target ≥ 78.30% 78.60% 78.60% 79.50% 78.80% 79.00%
Data 78.10% 80.00% 79.00% 79.30% 79.80% 81.10% 68.17%
C2 2008Target ≥ 59.50% 59.70% 59.70% 60.10% 59.20% 59.40%
Data 59.40% 61.70% 58.00% 57.40% 54.30% 52.44% 51.95%
FFY 2015
A1Target ≥ 75.60%
Data 74.82%
A2Target ≥ 60.60%
Data 54.26%
B1Target ≥ 79.90%
Data 79.08%
B2Target ≥ 52.40%
Data 48.79%
C1Target ≥ 79.20%
Data 78.30%
C2Target ≥ 59.60%
Data 49.89%
Key: Gray – Data Prior to Baseline Yellow – Baseline Blue – Data Update
FFY 2016 - FFY 2018 Targets
FFY 2016 2017 2018
Target A1 ≥ 75.90% 76.20% 76.50%
Target A2 ≥ 60.70% 60.80% 60.90%
Target B1 ≥ 80.10% 80.30% 80.50%
Target B2 ≥ 53.00% 53.60% 54.10%
Target C1 ≥ 79.40% 79.60% 79.80%
Target C2 ≥ 59.80% 60.00% 60.20%
Key:
Targets: Description of Stakeholder Input - Please see the Stakeholder Involvement section of the introduction.
Enter additional information about stakeholder involvement
FFY 2016 Part C State Performance Plan (SPP)/Annual Performance Report (APR)
2/27/2018 Page 9 of 34

FFY 2016 SPP/APR Data
Number of infants and toddlers with IFSPs assessed 5100.00
Outcome A: Positive social-emotional skills (including social relationships)
Number ofChildren
Percentage ofChildren
a. Infants and toddlers who did not improve functioning 20.00 0.39%
b. Infants and toddlers who improved functioning but not sufficient to move nearer to functioning comparable to same-aged peers 944.00 18.51%
c. Infants and toddlers who improved functioning to a level nearer to same-aged peers but did not reach it 1379.00 27.04%
d. Infants and toddlers who improved functioning to reach a level comparable to same-aged peers 1757.00 34.45%
e. Infants and toddlers who maintained functioning at a level comparable to same-aged peers 1000.00 19.61%
Numerator DenominatorFFY 2015
Data*FFY 2016Target*
FFY 2016Data
A1. Of those children who entered or exited the program below ageexpectations in Outcome A, the percent who substantially increased
their rate of growth by the time they turned 3 years of age or exited theprogram (c+d)/(a+b+c+d).
3136.00 4100.00 74.82% 75.90% 76.49%
A2. The percent of infants and toddlers who were functioning withinage expectations in Outcome A by the time they turned 3 years of age
or exited the program (d+e)/(a+b+c+d+e).2757.00 5100.00 54.26% 60.70% 54.06%
Outcome B. Acquisition and use of knowledge and skills (including early language/ communication)
Number ofChildren
Percentage ofChildren
a. Infants and toddlers who did not improve functioning 13.00 0.25%
b. Infants and toddlers who improved functioning but not sufficient to move nearer to functioning comparable to same-aged peers 902.00 17.69%
c. Infants and toddlers who improved functioning to a level nearer to same-aged peers but did not reach it 1720.00 33.73%
d. Infants and toddlers who improved functioning to reach a level comparable to same-aged peers 1950.00 38.24%
e. Infants and toddlers who maintained functioning at a level comparable to same-aged peers 515.00 10.10%
Numerator DenominatorFFY 2015
Data*FFY 2016Target*
FFY 2016Data
B1. Of those children who entered or exited the program below ageexpectations in Outcome B, the percent who substantially increased
their rate of growth by the time they turned 3 years of age or exited theprogram (c+d)/(a+b+c+d).
3670.00 4585.00 79.08% 80.10% 80.04%
B2. The percent of infants and toddlers who were functioning withinage expectations in Outcome B by the time they turned 3 years of age
or exited the program (d+e)/(a+b+c+d+e).2465.00 5100.00 48.79% 53.00% 48.33%
Outcome C: Use of appropriate behaviors to meet their needs
Number ofChildren
Percentage ofChildren
a. Infants and toddlers who did not improve functioning 14.00 0.27%
b. Infants and toddlers who improved functioning but not sufficient to move nearer to functioning comparable to same-aged peers 867.00 17.00%
c. Infants and toddlers who improved functioning to a level nearer to same-aged peers but did not reach it 1654.00 32.43%
d. Infants and toddlers who improved functioning to reach a level comparable to same-aged peers 1960.00 38.43%
e. Infants and toddlers who maintained functioning at a level comparable to same-aged peers 605.00 11.86%
Numerator DenominatorFFY 2015
Data*FFY 2016Target*
FFY 2016Data
C1. Of those children who entered or exited the program below ageexpectations in Outcome C, the percent who substantially increased
their rate of growth by the time they turned 3 years of age or exited theprogram (c+d)/(a+b+c+d).
3614.00 4495.00 78.30% 79.40% 80.40%
C2. The percent of infants and toddlers who were functioning withinage expectations in Outcome C by the time they turned 3 years of age
or exited the program (d+e)/(a+b+c+d+e).2565.00 5100.00 49.89% 59.80% 50.29%
FFY 2016 Part C State Performance Plan (SPP)/Annual Performance Report (APR)
2/27/2018 Page 10 of 34

The number of infants and toddlers who did not receive early intervention services for at least six months before exiting the Part C program
The number of infants and toddlers who exited the Part C program during the reporting period, as reported in the State’s part C exiting 618 data
The number of those infants and toddlers who did not receive early intervention services for at least six months before exiting the Part C program.
Please note that this data about the number of infants and toddlers who did not receive early intervention services for at least six months before exiting the Part C program is optional in this FFY16 submission. It will be requiredin the FFY17 submission.
Was sampling used? No
Did you use the Early Childhood Outcomes Center (ECO) Child Outcomes Summary (COS) process? Yes
List the instruments and procedures used to gather data for this indicator.
Every child is rated on each of the three child outcome functional areas using the Child Outcome Summary (COS) seven-point rating scale. Impact is basedupon the child’s progress by comparing his/her developmental status between the entry (collected within 90 days of the referral date) and the exit ratings(collected within 90 days prior to exit date and after at least six months of continuousservice). Rating differences between the two data points measure change or progress. At exit, the service provider(s) not only rate the child on the seven-pointrating scale, but also answer the question with a “yes” or “no” about whether the child acquired any new skills or behaviors. Entry ratings, exit ratings, andanswers to the “new skill” questions are all required. If the child’s record is missing any of this information, the progress data will not be available forthis child. Using the Early Childhood Outcomes (ECO) Center Calculator, progress for each child is then converted into one of the five OSEP categories (A-E),indicating the degree to which the child’s status has changed between the time he or she entered and exited Early On. Local service areas submitteddemographic and assessment information on child entry or exit in Early On through the MSDS. Multiple sources of information, such as assessments, IFSPs,and parent input are collected to help determine the child’s functioning across the three outcomes to determine the COS ratings. The COS is a standardizedmethod of reporting a child’s developmental status using the seven-point COS rating scale. Ongoing assessment information and/or state-approved assessmenttool results are used when establishing COS ratings.
A variety of tools are used to gather information to assist in determining entry and exit COS ratings. Below is a list of the most common tools used. This is notan exhaustive list.
Assessment, Evaluation, and Programming System for Infants and Children (AEPS)
Battelle Developmental Inventory Second Addition Bayley
Brigance
Carolina
Early Leaning Intervention Developmental Profile Revised Edition (EIDP)
Early Learning Accomplishment Profile Kit (E-LAP)
Hawaii Early Learning Profile (HELP)
Infant-Toddler Developmental Assessment Kit (IDA)
Other: An assessment tool not listed above
Actions required in FFY 2015 response
none
FFY 2016 Part C State Performance Plan (SPP)/Annual Performance Report (APR)
2/27/2018 Page 11 of 34

Indicator 4: Family Involvement
Monitoring Priority: Early Intervention Services In Natural Environments
Results indicator: Percent of families participating in Part C who report that early intervention services have helped the family:
Know their rights;A.Effectively communicate their children's needs; andB.Help their children develop and learn.C.
(20 U.S.C. 1416(a)(3)(A) and 1442)
Historical Data
Baseline
YearFFY 2004 2005 2006 2007 2008 2009 2010 2011 2012 2013 2014
A 2005Target ≥ 56.00% 60.00% 65.00% 70.00% 58.00% 58.20% 58.40% 58.40% 58.60%
Data 56.00% 58.00% 56.00% 58.00% 58.00% 59.00% 62.00% 71.50% 70.08% 70.65%
B 2005Target ≥ 51.00% 55.00% 60.00% 67.00% 53.00% 53.20% 53.40% 53.40% 53.60%
Data 51.00% 54.00% 51.00% 53.00% 53.00% 54.00% 56.00% 64.90% 63.98% 63.75%
C 2005Target ≥ 73.00% 78.00% 83.00% 89.00% 77.00% 77.20% 77.40% 77.40% 77.60%
Data 73.00% 75.00% 72.00% 75.00% 77.00% 78.00% 78.00% 85.60% 84.40% 84.05%
FFY 2015
ATarget ≥ 58.80%
Data 69.07%
BTarget ≥ 53.80%
Data 62.81%
CTarget ≥ 77.80%
Data 83.98%
Key: Gray – Data Prior to Baseline Yellow – Baseline Blue – Data Update
FFY 2016 - FFY 2018 Targets
FFY 2016 2017 2018
Target A ≥ 59.00% 59.20% 59.40%
Target B ≥ 54.00% 54.20% 54.40%
Target C ≥ 78.00% 78.20% 78.40%
Key:
Targets: Description of Stakeholder Input
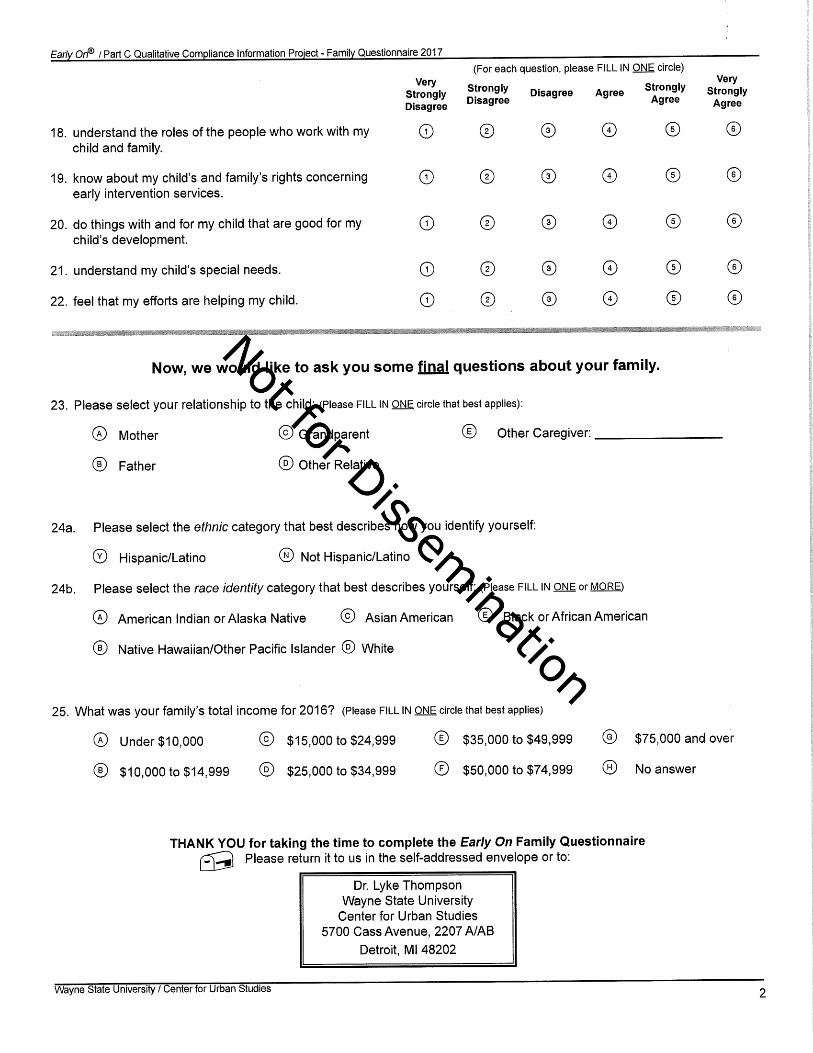
The Parent Involvement Committee (PIC) of the Michigan Interagency Coordinating Council (MICC) reviewed the recent FamilySurvey data in October 2017. The data were shared by the Qualitative Compliance Information Project (QCIP) grantee from WayneState University. The PIC consists of five Governor-appointed MICC parents, two parent alternates, two interagency partners,grantees from Michigan Alliance for Families and Early On Training and Technical Assistance, and a member from the MichiganFamily Voices organization.
The PIC also reviewed and supported the current improvement activities, as well as commenting positively about the progress beingmade in Michigan around family outcomes.
Recommendations for targets were developed by MDE with input from our data contractors, the MICC Executive Committee, and thePIC. Those recommendations were brought to the MICC for discussion. The MICC approved the targets through 2018 at theNovember 2014 meeting. In November 2017, the MICC reviewed and approved current data in comparison to the previously settargets.
FFY 2016 SPP/APR Data
Number of families to whom surveys were distributed 6772.00
Number of respondent families participating in Part C 40.96% 2774.00
A1. Number of respondent families participating in Part C who report that early intervention services have helped the family know their rights 1920.00
A2. Number of responses to the question of whether early intervention services have helped the family know their rights 2774.00
FFY 2016 Part C State Performance Plan (SPP)/Annual Performance Report (APR)
2/27/2018 Page 12 of 34

B1. Number of respondent families participating in Part C who report that early intervention services have helped the family effectively communicate their children's needs 1740.00
B2. Number of responses to the question of whether early intervention services have helped the family effectively communicate their children's needs 2774.00
C1. Number of respondent families participating in Part C who report that early intervention services have helped the family help their children develop and learn 2334.00
C2. Number of responses to the question of whether early intervention services have helped the family help their children develop and learn 2774.00
FFY 2015Data*
FFY 2016Target*
FFY 2016Data
A. Percent of families participating in Part C who report that early intervention services have helped the family know theirrights
69.07% 59.00% 69.21%
B. Percent of families participating in Part C who report that early intervention services have helped the family effectivelycommunicate their children's needs
62.81% 54.00% 62.73%
C. Percent of families participating in Part C who report that early intervention services have helped the family help theirchildren develop and learn
83.98% 78.00% 84.14%
Was sampling used? No
Was a collection tool used? Yes
Is it a new or revised collection tool? No
Include the State’s analysis of the extent to which the demographics of the families responding are representative of the demographics of infants,toddlers, and families enrolled in the Part C program.
Survey data were collected through multiple modes: online, mail, and telephone interviews. The online survey data were stored in a secure server asrespondents completed the surveys via the web. Completed mail surveys were processed using data scanning software, also stored in a secure server. Surveyscompleted by telephone were stored through the computer assisted telephone interview (CATI) software and in a secure server. All completed surveys werethen merged into a statistical package database, and several levels of data quality control measures (audit, verification, deduping, etc.) were performed.
Compared to other states that have also adopted the National Center for Special Education Accountability Monitoring (NCSEAM) 22-Item Scale, Raschanalysis, and the three standards, Michigan’s results are consistent with those states.
Michigan selected the NCSEAM Impact of Early Intervention Services on Your Family Scale to collect data on Indicator 4. The Scale has two importantqualities necessary for use as a measure of Indicator 4: validity and high reliability.
The Scale exhibits evidence of both content and construct validity. To ensure good content validity, the items in the scale were suggested by parents and otherkey stakeholders in early intervention and special education and then reviewed by experts in the field. Rasch analysis was used to ensure the items formed aunidimensional scale so that all items address the same construct.
In the NCSEAM pilot study, the Scale had a reliability coefficient of .90. The reliability coefficient found in Michigan’s administrationof the scale was 0.93 for 2017. Another form of reliability is assessed by the margin of error or confidence interval. Using a 95%confidence interval, the margin of error was ±1.46 for 2017.
Per the recommendation of the NCSEAM researchers who developed the Scale, and since the Scale was constructed using the Rasch measurementframework, “a Rasch analysis provides an estimate of the reliability of both the calibration values (related to the items) and the measures (related to people’sresponses).”* In addition, the measure (average result based on Rasch) can be directly interpreted with respect to the items defining the Scale – that is, onecan identify specific items to guide improvement activities.
*http://ecoutcomes.fpg.unc.edu/resources/understanding-and-using-results-ncseam-family-survey
The 2017 survey, completed for FFY 2016, had a sample that was representative with regard to child’s gender and age, but not in terms of eligibility norethnicity. Specifically, the sample was over-represented of children eligible for Michigan Mandatory Special Education (MMSE) and White children. TheMichigan Mandatory Special Education Act is a state law passed in 1971, ensuring special education to resident children with disabilities from birth to age 26.Services provided under this act are known as MMSE. Michigan is a “birth mandate” state, and as such provides support and/or services to individuals from birthto age 26 who meet the eligibility definitions put forth in Michigan Administrative Rules for Special Education (MARSE) under the Michigan Compiled Lawsat no cost to the family. MMSE eligibility criteria are narrower than those for Early On and thus any child birth to age three who qualifies under MMSE is alsoeligible for Early On.
The table below summarizes the children’s gender, age, eligibility, and race/ethnicities in comparison to statewide demographics.
Table 1: 2017 Family Survey Sample Compared to the Statewide Population
Family Survey Sample
(survey respondents)
Statewide Population
(Families eligible for survey,according to
2016 Fall Count)
Child’s Gender
Female 38.9% 40.2%
FFY 2016 Part C State Performance Plan (SPP)/Annual Performance Report (APR)
2/27/2018 Page 13 of 34

Male 61.1% 59.8%
Child’s Age at survey time
Birth to 1 year 7.2% 7.9%
1 to 2 years 33.1% 32.7%
2 to 3 years 59.6% 59.4%
Child's Eligibility
Part C only* 60.6% 64.4%
MI Special Education* 39.4% 35.6%
Ethnicity of Child
White/Caucasian* 72.9% 70.1%
African-American/Black* 15.0% 17.5%
Hispanic/Latino 7.2% 6.5%
Asian 1.8% 1.7%
American Indian* 0.5% 0.9%
Pacific Islander 0.1% 0.1%
Two or more races 2.5% 3.2%
Total n=2,774 N=7,141
Description of Weighting Procedure to Adjust Representation for Eligibility and Ethnicity
To determine if the difference in eligibility and ethnicity distribution made a statistically significant impact on the findings related to this indicator, weightswere applied to adjust the sample sizes for eligibility and ethnicity. Weights are commonly used to adjust survey results for under- and over-representation ofspecific subgroups in a sample. This procedure provides an estimate of the results that would be found if the distribution of a particular characteristic in thesample were identical to the distribution in the overall population. For this indicator, these weights were calculated by dividing the proportion of each group inthe population by the corresponding proportion in the sample.
Creation of Weights Based on Sample and Population Distribution
Weights were calculated by dividing the proportion of each of the subgroups in the Part C population by the corresponding proportion in the sample. Forexample, in the Part C population the proportion of children identified as white was .701. In the survey sample, the proportion of white children was .729.Dividing .701 by .729 yields 0.962. Therefore, the weight assigned to white children was 0.962. The proportion of African-American children in the populationwas .175 but in the survey sample it was .150, making the weight 1.167. This computation was repeated for the remaining racial and ethnic groups:Hispanic/Latino, Asian, American Indian, Pacific Islander, and two or more races.
The result of weighting is the same as if you duplicated each Impact on Family Scale score by as many times as the weight and then computed the averagescore.
A comparison of the unweighted results to the results after weighting by eligibility and ethnicity showed no statistically significant difference in the scores (seeTable 2 below); there is virtually no difference in the scores after weighting. It suggests that even if the sample is not representative in terms of eligibilityand ethnicity, it does not measurably affect the Indicator 4 results, and unweighted results are reported.
Table 2: Indicator 4 results before and after weighting
Un-weighted Weighted by eligibility Weighted by ethnicity
(N=2,774) (N=2,774) (N=2,775)
n % n % n %
SPP 4A 1,920 69.21 1,911 68.89 1,916 69.05
SPP 4B 1,740 62.73 1,730 62.36 1,734 62.49
SPP 4C 2,334 84.14 2,331 84.03 2,331 84.00
meanstandarddeviation
mean standard deviationmeanstandarddeviation
FFY 2016 Part C State Performance Plan (SPP)/Annual Performance Report (APR)
2/27/2018 Page 14 of 34

OverallScore
618.06 143.05 617.24 143.12 617.20 142.72
The demographics of the families responding are representative of the demographics of infants, toddlers, and families enrolled in the Part C program. No
Describe the strategies that the State will use to ensure that in the future the response data are representative of those demographics.
Several measures were undertaken this year, and will be used again in future years, to maximize the number of respondents, aswell as to ensure adequate representation of ethnicity and eligibility throughout the state. Activities included:
Mailing parents a survey notification brochure, sharing the family survey results from last year, and explaining the proceduresof the current survey. In the brochure, the parents were also provided a 1-800 number that they could call to refuse toparticipate in the survey. The parents who refused were removed from subsequent contact lists.
1.
Working with local Early On Coordinators to ensure the address list is up to date for each family.2.
Offering a toll free phone number with English, Spanish, and Arabic speaking interpreters for assistance in responding to thesurvey.
3.
Offering an online option for completing the survey.4.
Sending postcard reminders, approximately two weeks after the survey was sent to families, to those who have not yetcompleted the survey.
5.
Calls to non-respondents were made at different times of the day and of the week, including evenings and weekends.Interviewers were trained to ensure that appropriate consideration was given to cultural and ethnic diversity, and that invasion ofprivacy for the family was minimal. Training also included measures to maintain the reliability of the data and to reduce bias inthe data set.
6.
For service areas with a lower response rate than the average, surveys were re-mailed and sometimes a second round ofreminder postcards were mailed out, as well as increasing call attempts up to ten times.
7.
Actions required in FFY 2015 response
In the FFY 2016 SPP/APR, the State must report whether its FFY 2016 response data represent the demographics of the State, and, if not, the actions the State is taking to address this issue.
Responses to actions required in FFY 2015 OSEP response
See the response on the FFY16 data page for Indicator 4.
FFY 2016 Part C State Performance Plan (SPP)/Annual Performance Report (APR)
2/27/2018 Page 15 of 34
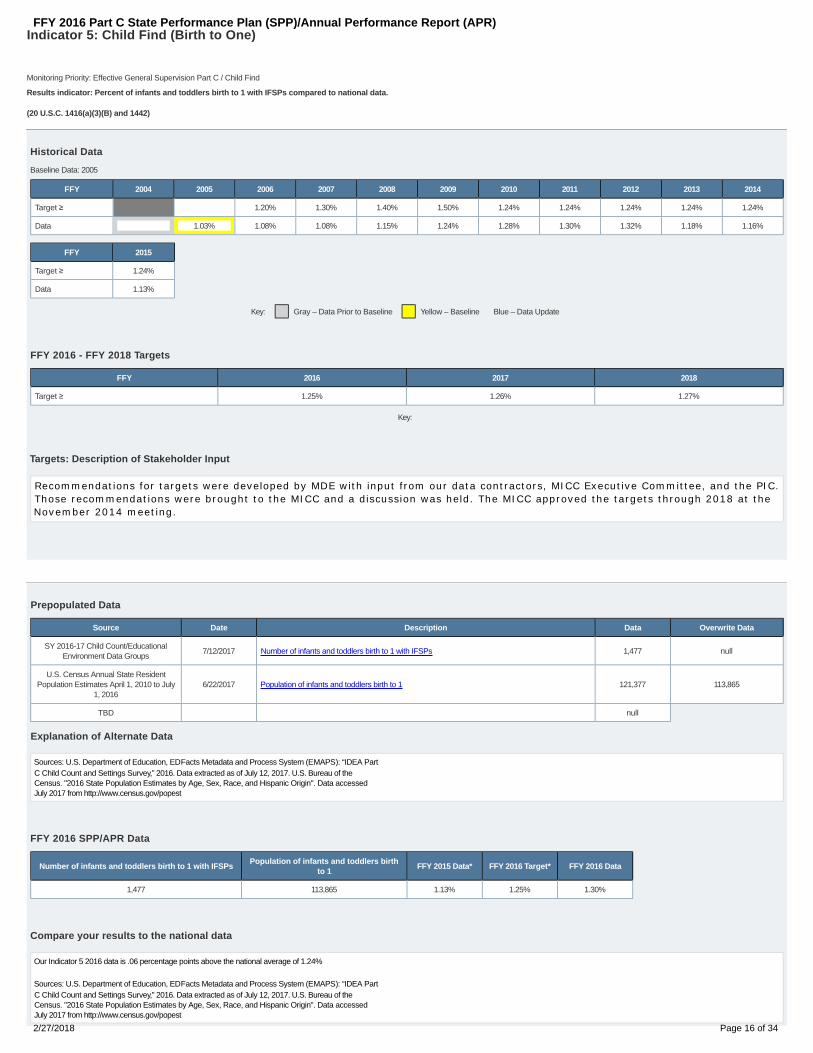
Indicator 5: Child Find (Birth to One)
Baseline Data: 2005
Monitoring Priority: Effective General Supervision Part C / Child Find
Results indicator: Percent of infants and toddlers birth to 1 with IFSPs compared to national data.
(20 U.S.C. 1416(a)(3)(B) and 1442)
Historical Data
FFY 2004 2005 2006 2007 2008 2009 2010 2011 2012 2013 2014
Target ≥ 1.20% 1.30% 1.40% 1.50% 1.24% 1.24% 1.24% 1.24% 1.24%
Data 1.03% 1.08% 1.08% 1.15% 1.24% 1.28% 1.30% 1.32% 1.18% 1.16%
FFY 2015
Target ≥ 1.24%
Data 1.13%
Key: Gray – Data Prior to Baseline Yellow – Baseline Blue – Data Update
FFY 2016 - FFY 2018 Targets
FFY 2016 2017 2018
Target ≥ 1.25% 1.26% 1.27%
Key:
Targets: Description of Stakeholder Input
Recommendations for targets were developed by MDE with input from our data contractors, MICC Executive Committee, and the PIC.Those recommendations were brought to the MICC and a discussion was held. The MICC approved the targets through 2018 at theNovember 2014 meeting.
Prepopulated Data
Source Date Description Data Overwrite Data
SY 2016-17 Child Count/EducationalEnvironment Data Groups
7/12/2017 Number of infants and toddlers birth to 1 with IFSPs 1,477 null
U.S. Census Annual State ResidentPopulation Estimates April 1, 2010 to July
1, 20166/22/2017 Population of infants and toddlers birth to 1 121,377 113,865
TBD null
Explanation of Alternate Data
Sources: U.S. Department of Education, EDFacts Metadata and Process System (EMAPS): “IDEA PartC Child Count and Settings Survey,” 2016. Data extracted as of July 12, 2017. U.S. Bureau of theCensus. "2016 State Population Estimates by Age, Sex, Race, and Hispanic Origin". Data accessedJuly 2017 from http://www.census.gov/popest
FFY 2016 SPP/APR Data
Number of infants and toddlers birth to 1 with IFSPsPopulation of infants and toddlers birth
to 1FFY 2015 Data* FFY 2016 Target* FFY 2016 Data
1,477 113,865 1.13% 1.25% 1.30%
Compare your results to the national data
Our Indicator 5 2016 data is .06 percentage points above the national average of 1.24%
Sources: U.S. Department of Education, EDFacts Metadata and Process System (EMAPS): “IDEA PartC Child Count and Settings Survey,” 2016. Data extracted as of July 12, 2017. U.S. Bureau of theCensus. "2016 State Population Estimates by Age, Sex, Race, and Hispanic Origin". Data accessedJuly 2017 from http://www.census.gov/popest
FFY 2016 Part C State Performance Plan (SPP)/Annual Performance Report (APR)
2/27/2018 Page 16 of 34

Actions required in FFY 2015 response
none
FFY 2016 Part C State Performance Plan (SPP)/Annual Performance Report (APR)
2/27/2018 Page 17 of 34

Indicator 6: Child Find (Birth to Three)
Baseline Data: 2005
Monitoring Priority: Effective General Supervision Part C / Child Find
Results indicator: Percent of infants and toddlers birth to 3 with IFSPs compared to national data.
(20 U.S.C. 1416(a)(3)(B) and 1442)
Historical Data
FFY 2004 2005 2006 2007 2008 2009 2010 2011 2012 2013 2014
Target ≥ 2.30% 2.40% 2.50% 2.60% 2.70% 2.70% 2.70% 2.70% 2.70%
Data 2.20% 2.30% 2.44% 2.67% 2.88% 2.96% 3.00% 2.78% 2.64% 2.62%
FFY 2015
Target ≥ 2.70%
Data 2.60%
Key: Gray – Data Prior to Baseline Yellow – Baseline Blue – Data Update
FFY 2016 - FFY 2018 Targets
FFY 2016 2017 2018
Target ≥ 2.80% 2.90% 3.00%
Key:
Targets: Description of Stakeholder Input
Recommendations for targets were developed by MDE with input from our data contractors, the MICC Executive Committee, and thePIC. Those recommendations were brought to the MICC and a discussion was held. The MICC approved the targets through 2018 atthe November 2014 meeting.
Prepopulated Data
Source Date Description Data Overwrite Data
SY 2016-17 Child Count/EducationalEnvironment Data Groups
7/12/2017 Number of infants and toddlers birth to 3 with IFSPs 9,835
U.S. Census Annual State ResidentPopulation Estimates April 1, 2010 to July
1, 20166/22/2017 Population of infants and toddlers birth to 3 365,871 344477
TBD null
Explanation of Alternate Data
Sources: U.S. Department of Education, EDFacts Metadata and Process System (EMAPS): “IDEA PartC Child Count and Settings Survey,” 2016. Data extracted as of July 12, 2017. U.S. Bureau of theCensus. "2016 State Population Estimates by Age, Sex, Race, and Hispanic Origin". Data accessedJuly 2017 from http://www.census.gov/popest
FFY 2016 SPP/APR DataNumber of infants and toddlers birth to 3 with
IFSPsPopulation of infants and toddlers birth to 3
FFY 2015Data*
FFY 2016Target*
FFY 2016Data
9,835 344,477 2.60% 2.80% 2.86%
Compare your results to the national data
Our Indicator 6 data for 2016 is .26 percentage points below the national average of 3.12%
Sources: U.S. Department of Education, EDFacts Metadata and Process System (EMAPS): “IDEA PartC Child Count and Settings Survey,” 2016. Data extracted as of July 12, 2017. U.S. Bureau of theCensus. "2016 State Population Estimates by Age, Sex, Race, and Hispanic Origin". Data accessedJuly 2017 from http://www.census.gov/popest
FFY 2016 Part C State Performance Plan (SPP)/Annual Performance Report (APR)
2/27/2018 Page 18 of 34

Actions required in FFY 2015 response
none
FFY 2016 Part C State Performance Plan (SPP)/Annual Performance Report (APR)
2/27/2018 Page 19 of 34

Indicator 7: 45-day timeline
Baseline Data: 2006
Monitoring Priority: Effective General Supervision Part C / Child Find
Compliance indicator: Percent of eligible infants and toddlers with IFSPs for whom an initial evaluation and initial assessment and an initial IFSP meeting were conducted within Part C’s 45-day timeline.
(20 U.S.C. 1416(a)(3)(B) and 1442)
Historical Data
FFY 2004 2005 2006 2007 2008 2009 2010 2011 2012 2013 2014
Target 100% 100% 100% 100% 100% 100% 100% 100% 100%
Data 63.10% 87.10% 99.40% 99.50% 100% 100% 97.48% 99.12% 95.07%
FFY 2015
Target 100%
Data 96.81%
Key: Gray – Data Prior to Baseline Yellow – Baseline
FFY 2016 - FFY 2018 Targets
FFY 2016 2017 2018
Target 100% 100% 100%
FFY 2016 SPP/APR Data
Number of eligible infants and toddlers with IFSPs forwhom an initial evaluation and assessment and aninitial IFSP meeting was conducted within Part C’s
45-day timeline
Number of eligible infants and toddlers evaluated andassessed for whom an initial IFSP meeting was
required to be conducted
FFY 2015Data*
FFY 2016Target*
FFY 2016Data
9,289 10,650 96.81% 100% 99.12%
Number of documented delays attributable to exceptional family circumstancesThis number will be added to the "Number of eligible infants and toddlers with IFSPs for whom an initial evaluation and assessment and an initial IFSP meeting was conductedwithin Part C's 45-day timeline" field above to calculate the numerator for this indicator.
1,267
What is the source of the data provided for this indicator?
State monitoring
State database
Provide the time period in which the data were collected (e.g., September through December, fourth quarter, selection from the full reporting period).
Full reporting period - July 1, 2016-June 30, 2017.
Describe how the data accurately reflect data for infants and toddlers with IFSPs for the full reporting period.
Full reporting period is included in the data.
Provide additional information about this indicator (optional)
Data were collected through MSDS. All local early intervention systems submitted data regarding all children served to the state database at three designated points during the program year (July 1, 2016 - June 30, 2017).Data from the three collections were aggregated to provide data for the full reporting period.
Data reported for this indicator reflect that a total of 10,650 records included eligible infants and toddlers evaluated and assessed for whom an initial IFSP meeting was required to be conducted. This number was used as thedenominator for calculation of Indicator 7 data. Data reported reflect that 9,289 of the records documented that an initial evaluation, an initial assessment, and the initial IFSP meeting were completed within the 45-day timeline.An additional 1,267 records contained documentation that the delays to the completion of the initial evaluation, initial assessment, and initial IFSP meeting were attributable to exceptional family circumstances. The number ofrecords with documented exceptional family circumstances (1,267) was added to the timely records (9,289) resulting in a total of 10,556 records. This number was used as the numerator for the calculation. The resultingpercentage compliance is 99.12%.
(9,289+1,267)/10,650=.9912
Both the numerator and the denominator include 1,267 children for whom completion of the initial evaluation, initial assessment, and initial IFSP meeting was not timely, but whose records contained documentation that thedelays were attributable to exceptional family circumstances.
99.12% compliance falls below the target of 100% for this indicator. These data reflect an increased level of compliance for this indicator from the 96.81% compliance level reported in the FFY 2015 APR.
FFY 2016 Part C State Performance Plan (SPP)/Annual Performance Report (APR)
2/27/2018 Page 20 of 34
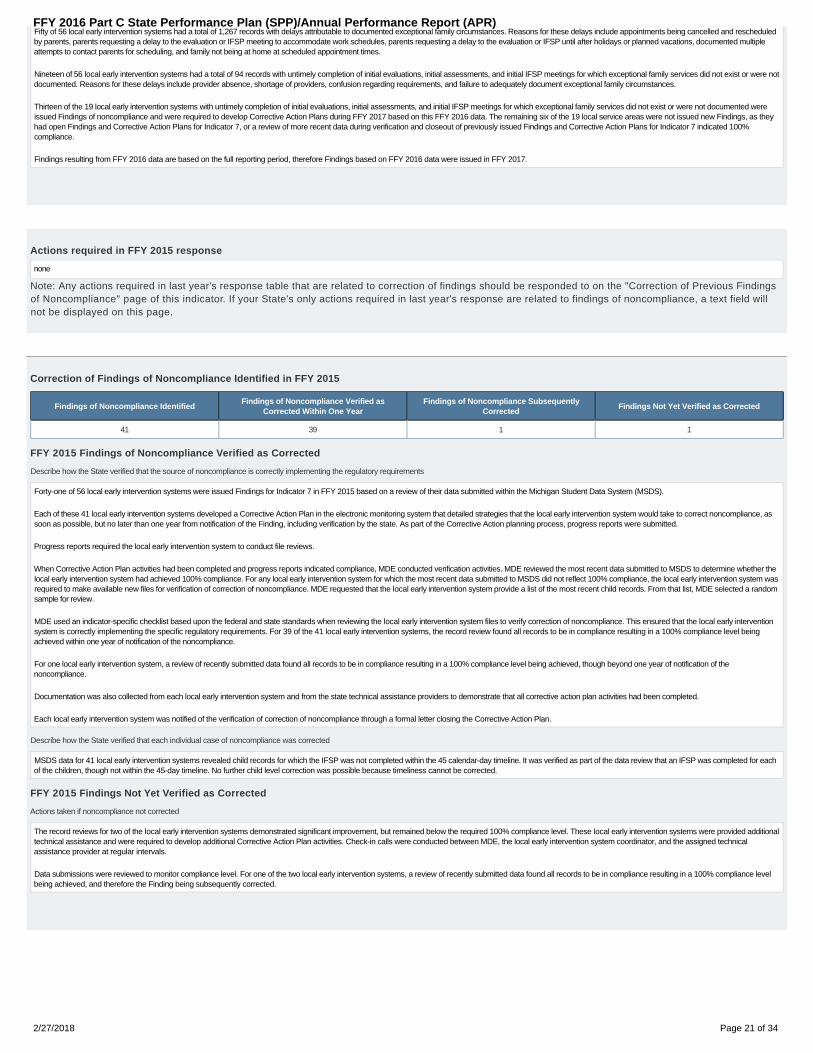
Fifty of 56 local early intervention systems had a total of 1,267 records with delays attributable to documented exceptional family circumstances. Reasons for these delays include appointments being cancelled and rescheduledby parents, parents requesting a delay to the evaluation or IFSP meeting to accommodate work schedules, parents requesting a delay to the evaluation or IFSP until after holidays or planned vacations, documented multipleattempts to contact parents for scheduling, and family not being at home at scheduled appointment times.
Nineteen of 56 local early intervention systems had a total of 94 records with untimely completion of initial evaluations, initial assessments, and initial IFSP meetings for which exceptional family services did not exist or were notdocumented. Reasons for these delays include provider absence, shortage of providers, confusion regarding requirements, and failure to adequately document exceptional family circumstances.
Thirteen of the 19 local early intervention systems with untimely completion of initial evaluations, initial assessments, and initial IFSP meetings for which exceptional family services did not exist or were not documented wereissued Findings of noncompliance and were required to develop Corrective Action Plans during FFY 2017 based on this FFY 2016 data. The remaining six of the 19 local service areas were not issued new Findings, as theyhad open Findings and Corrective Action Plans for Indicator 7, or a review of more recent data during verification and closeout of previously issued Findings and Corrective Action Plans for Indicator 7 indicated 100%compliance.
Findings resulting from FFY 2016 data are based on the full reporting period, therefore Findings based on FFY 2016 data were issued in FFY 2017.
Actions required in FFY 2015 response
none
Note: Any actions required in last year's response table that are related to correction of findings should be responded to on the "Correction of Previous Findingsof Noncompliance" page of this indicator. If your State's only actions required in last year's response are related to findings of noncompliance, a text field willnot be displayed on this page.
Correction of Findings of Noncompliance Identified in FFY 2015
Findings of Noncompliance IdentifiedFindings of Noncompliance Verified as
Corrected Within One YearFindings of Noncompliance Subsequently
CorrectedFindings Not Yet Verified as Corrected
41 39 1 1
FFY 2015 Findings of Noncompliance Verified as Corrected
Describe how the State verified that the source of noncompliance is correctly implementing the regulatory requirements
Forty-one of 56 local early intervention systems were issued Findings for Indicator 7 in FFY 2015 based on a review of their data submitted within the Michigan Student Data System (MSDS).
Each of these 41 local early intervention systems developed a Corrective Action Plan in the electronic monitoring system that detailed strategies that the local early intervention system would take to correct noncompliance, assoon as possible, but no later than one year from notification of the Finding, including verification by the state. As part of the Corrective Action planning process, progress reports were submitted.
Progress reports required the local early intervention system to conduct file reviews.
When Corrective Action Plan activities had been completed and progress reports indicated compliance, MDE conducted verification activities. MDE reviewed the most recent data submitted to MSDS to determine whether thelocal early intervention system had achieved 100% compliance. For any local early intervention system for which the most recent data submitted to MSDS did not reflect 100% compliance, the local early intervention system wasrequired to make available new files for verification of correction of noncompliance. MDE requested that the local early intervention system provide a list of the most recent child records. From that list, MDE selected a randomsample for review.
MDE used an indicator-specific checklist based upon the federal and state standards when reviewing the local early intervention system files to verify correction of noncompliance. This ensured that the local early interventionsystem is correctly implementing the specific regulatory requirements. For 39 of the 41 local early intervention systems, the record review found all records to be in compliance resulting in a 100% compliance level beingachieved within one year of notification of the noncompliance.
For one local early intervention system, a review of recently submitted data found all records to be in compliance resulting in a 100% compliance level being achieved, though beyond one year of notification of thenoncompliance.
Documentation was also collected from each local early intervention system and from the state technical assistance providers to demonstrate that all corrective action plan activities had been completed.
Each local early intervention system was notified of the verification of correction of noncompliance through a formal letter closing the Corrective Action Plan.
Describe how the State verified that each individual case of noncompliance was corrected
MSDS data for 41 local early intervention systems revealed child records for which the IFSP was not completed within the 45 calendar-day timeline. It was verified as part of the data review that an IFSP was completed for eachof the children, though not within the 45-day timeline. No further child level correction was possible because timeliness cannot be corrected.
FFY 2015 Findings Not Yet Verified as Corrected
Actions taken if noncompliance not corrected
The record reviews for two of the local early intervention systems demonstrated significant improvement, but remained below the required 100% compliance level. These local early intervention systems were provided additionaltechnical assistance and were required to develop additional Corrective Action Plan activities. Check-in calls were conducted between MDE, the local early intervention system coordinator, and the assigned technicalassistance provider at regular intervals.
Data submissions were reviewed to monitor compliance level. For one of the two local early intervention systems, a review of recently submitted data found all records to be in compliance resulting in a 100% compliance levelbeing achieved, and therefore the Finding being subsequently corrected.
FFY 2016 Part C State Performance Plan (SPP)/Annual Performance Report (APR)
2/27/2018 Page 21 of 34

Indicator 8A: Early Childhood Transition
Baseline Data: 2005
Monitoring Priority: Effective General Supervision Part C / Effective Transition
Compliance indicator: The percentage of toddlers with disabilities exiting Part C with timely transition planning for whom the Lead Agency has:
Developed an IFSP with transition steps and services at least 90 days, and at the discretion of all parties, not more than nine months, prior to the toddler’s third birthday;A.Notified (consistent with any opt-out policy adopted by the State) the State educational agency (SEA) and the local educational agency (LEA) where the toddler resides at least 90 days prior to thetoddler’s third birthday for toddlers potentially eligible for Part B preschool services; and
B.
Conducted the transition conference held with the approval of the family at least 90 days, and at the discretion of all parties, not more than nine months, prior to the toddler’s third birthday fortoddlers potentially eligible for Part B preschool services.
C.
(20 U.S.C. 1416(a)(3)(B) and 1442)
Historical Data
FFY 2004 2005 2006 2007 2008 2009 2010 2011 2012 2013 2014
Target 100% 100% 100% 100% 100% 100% 100% 100% 100%
Data 59.28% 73.90% 95.15% 99.20% 99.33% 100% 99.56% 100% 100% 99.45%
FFY 2015
Target 100%
Data 92.89%
Key: Gray – Data Prior to Baseline Yellow – Baseline
FFY 2016 - FFY 2018 Targets
FFY 2016 2017 2018
Target 100% 100% 100%
FFY 2016 SPP/APR Data
Data include only those toddlers with disabilities exiting Part C with timely transition planning for whom the Lead Agency has developed an IFSP withtransition steps and services at least 90 days, and at the discretion of all parties, not more than nine months, prior to the toddler’s third birthday.
Yes
No
Number of children exiting Part C who have an IFSPwith transition steps and services Number of toddlers with disabilities exiting Part C
FFY 2015Data*
FFY 2016Target*
FFY 2016Data
6,560 7,408 92.89% 100% 95.91%
Number of documented delays attributable to exceptional family circumstancesThis number will be added to the "Number of children exiting Part C who have an IFSP with transition steps and services" field to calculate the numerator for this indicator. 545
What is the source of the data provided for this indicator?
State monitoring
State database
Provide the time period in which the data were collected (e.g., September through December, fourth quarter, selection from the full reporting period).
Full reporting period - July 1, 2016 - June 30, 2017.
Describe how the data accurately reflect data for infants and toddlers with IFSPs for the full reporting period.
Data from full reporting period are included.
Provide additional information about this indicator (optional)
Data were collected through MSDS. All local early intervention systems submitted data regarding all children served to the state database at three designated points during the program year (July 1, 2016 - June 30, 2017).
FFY 2016 Part C State Performance Plan (SPP)/Annual Performance Report (APR)
2/27/2018 Page 22 of 34

Data from the three collections were aggregated to provide data from the full reporting period.
Data reported for this indicator reflect that a total of 7,408 records included eligible infants and toddlers for whom transition planning, including an IFSP developed with transition steps and services, was required to beconducted. This number was used as the denominator for calculation of Indicator 8a data. Data reported for this indicator reflect that 6,560 of the records documented timely transition planning including an IFSP developed withtransition steps and services. An additional 545 records contained documentation that delays to the completion of transition planning including an IFSP developed with transition steps and services were attributable toexceptional family circumstances. The number of records with documented exceptional family circumstances (545) was added to the timely records (6,560) resulting in a total of 7,105 records. This number was used as thenumerator for the calculation. The resulting percentage of compliance is 95.91%.
(6,560+545)/7,408=.9591
Both the numerator and the denominator include 545 children for whom IFSPs with transition steps and services were not timely, but whose records contained documentation that the delays were attributable to exceptional familycircumstances.
95.91% compliance falls below the target of 100% compliance for this indicator. These data reflect an increase for this indicator from the 92.89% compliance level reported in the FFY 2015 APR.
Fifty-one of 56 local early intervention systems reported delays attributable to exceptional family circumstances for a total of 545 children. Documented reasons for these delays include illness or hospitalization of child or familymembers, multiple unsuccessful attempts to contact family to set appointment, accommodating family schedule, meetings being rescheduled at parent request, cancellation or no show by parent, family moved, and other childor parent reasons.
Thirty-four of 56 local early intervention systems reported delays that were not attributable to exceptional family circumstances for a total of 303 children. Reasons for these delays include provider availability, lack of personneltraining/knowledge, other provider reasons, and failure to report transition plan timliness data.
Six of the 34 local early intervention systems with reported delays that were not attributable to exceptional family circumstances were issued Findings of noncompliance and required to develop Corrective Action Plans duringFFY 2017 based on this FFY 2016 data. The remaining 28 of the 34 local early intervention systems were not issued new Findings, as they had open Findings and Corrective Action Plans for Indicator 8a or a review of morerecent data during verification and closeout of previously issued Findings and Corrective Action Plans for Indicator 8a indicated 100% compliance.
Findings resulting from FFY 2016 data are based on the full reporting period, therefore Findings based on FFY 2016 data were issued in FFY 2017.
Actions required in FFY 2015 response
none
Note: Any actions required in last year's response table that are related to correction of findings should be responded to on the "Correction of Previous Findingsof Noncompliance" page of this indicator. If your State's only actions required in last year's response are related to findings of noncompliance, a text field willnot be displayed on this page.
Correction of Findings of Noncompliance Identified in FFY 2015
Findings of Noncompliance IdentifiedFindings of Noncompliance Verified as
Corrected Within One YearFindings of Noncompliance Subsequently
CorrectedFindings Not Yet Verified as Corrected
1 1 0 0
FFY 2015 Findings of Noncompliance Verified as Corrected
Describe how the State verified that the source of noncompliance is correctly implementing the regulatory requirements
One local early intervention system was issued a Finding related to Indicator 8a in FFY 2015 as a result of self assessment data. The local early intervention system developed a Corrective Action Plan in the electronicmonitoring system that detailed strategies that the local early intervention system would take to correct noncompliance, as soon as possible, but no later than one year from notification of the Finding, including verification by thestate. As part of the corrective action planning process, progress reports were submitted. Progress reports required the local early intervention system to conduct file reviews.
When Corrective Action Plan activities had been completed and progress reports indicated compliance, MDE conducted a desk review during which the local early intervention system was required to make available new filesfor verification of correction of noncompliance. MDE requested that the local early intervention system provide a list of the most recent child records. From that list, MDE selected a random sample of records for review.
MDE used an indicator-specific checklist based upon the federal and state standards when reviewing the local early intervention system files to verify correction of noncompliance. This ensured that the local early interventionsystem is correctly implementing the specific regulatory requirements. Documentation was also collected from the local early intervention system and from the state technical assistance providers to demonstrate that allcorrective action plan activities had been completed.
The local early intervention system was notified of the verification of correction of noncompliance through a formal letter closing the Corrective Action Plan.
Describe how the State verified that each individual case of noncompliance was corrected
It was verified during the self-assessment process that a written transition plan with steps and services had been developed for all children, although not all timely. No further child level correction was possible becausetimeliness cannot be corrected.
FFY 2016 Part C State Performance Plan (SPP)/Annual Performance Report (APR)
2/27/2018 Page 23 of 34

Indicator 8B: Early Childhood Transition
Baseline Data: 2005
Monitoring Priority: Effective General Supervision Part C / Effective Transition
Compliance indicator: The percentage of toddlers with disabilities exiting Part C with timely transition planning for whom the Lead Agency has:
Developed an IFSP with transition steps and services at least 90 days, and at the discretion of all parties, not more than nine months, prior to the toddler’s third birthday;A.Notified (consistent with any opt-out policy adopted by the State) the State educational agency (SEA) and the local educational agency (LEA) where the toddler resides at least 90 days prior to thetoddler’s third birthday for toddlers potentially eligible for Part B preschool services; and
B.
Conducted the transition conference held with the approval of the family at least 90 days, and at the discretion of all parties, not more than nine months, prior to the toddler’s third birthday fortoddlers potentially eligible for Part B preschool services.
C.
(20 U.S.C. 1416(a)(3)(B) and 1442)
Historical Data
FFY 2004 2005 2006 2007 2008 2009 2010 2011 2012 2013 2014
Target 100% 100% 100% 100% 100% 100% 100% 100% 100%
Data 100% 100% 100% 100% 100% 100% 100% 100% 100% 100%
FFY 2015
Target 100%
Data 100%
Key: Gray – Data Prior to Baseline Yellow – Baseline
FFY 2016 - FFY 2018 Targets
FFY 2016 2017 2018
Target 100% 100% 100%
FFY 2016 SPP/APR Data
Data include notification to both the SEA and LEA
Yes
No
Number of toddlers with disabilities exiting Part Cwhere notification to the SEA and LEA occurred at
least 90 days prior to their third birthday for toddlerspotentially eligible for Part B preschool services
Number of toddlers with disabilities exiting Part C whowere potentially eligible for Part B
FFY 2015Data*
FFY 2016Target*
FFY 2016Data
3,407 3,407 100% 100% 100%
Number of parents who opted outThis number will be subtracted from the "Number of toddlers with disabilities exiting Part C who were potentially eligible for Part B" field to calculate the denominator for thisindicator.
0
Describe the method used to collect these data
Data were collected through MSDS. All local early intervention systems submitted data regarding all children served to the statedatabase at three designated points during the program year (July 1, 2016 - June 30, 2017). Data from the three collections wereaggregated to provide data from the full reporting period.
Do you have a written opt-out policy? No
What is the source of the data provided for this indicator?
State monitoring
State database
FFY 2016 Part C State Performance Plan (SPP)/Annual Performance Report (APR)
2/27/2018 Page 24 of 34

Provide the time period in which the data were collected (e.g., September through December, fourth quarter, selection from the full reporting period).
Full reporting period - July 1, 2016 - June 30, 2017.
Describe how the data accurately reflect data for infants and toddlers with IFSPs for the full reporting period.
Data from full reporting period are included.
Provide additional information about this indicator (optional)
In Michigan, MDE is the state education agency (SEA) with ISDs acting as local lead agencies. Given thatMichigan is a birth mandate state (the term used is Michigan Mandatory Special Education/MMSE) and thePart C local lead agency is the ISD, notification from Part C to the SEA and local education agency (LEA)is internal and takes place as the child is identified as eligible for MMSE at any time from birth to agethree. Michigan defines potentially eligible for Part B preschool services as any child found eligible andreceiving MMSE prior to two years, nine months while receiving services under Part C. Any toddlerpotentially eligible for Part B preschool services is transitioned by age three. "The school district ofresidence is responsible for conducting the initial individualized education program team meetinginvolving a student in its district and shall conduct, or authorize the operating district to conduct, eachsubsequent individualized education program team meeting at a mutually agreed upon time and place."Michigan Special Education Rule R 340.1721c. As specified in the Transition Intra-agency Agreement,each resident LEA (or its designee) will act on behalf of the SEA for the receipt of SEA notificationsregarding a toddler exiting Part C and potentially eligible for Part B section 619. Therefore, the SEA andLEAs are notified of 100% of children potentially eligible for Part B.
Actions required in FFY 2015 response
none
Note: Any actions required in last year's response table that are related to correction of findings should be responded to on the "Correction of Previous Findingsof Noncompliance" page of this indicator. If your State's only actions required in last year's response are related to findings of noncompliance, a text field willnot be displayed on this page.
Correction of Findings of Noncompliance Identified in FFY 2015
Findings of Noncompliance IdentifiedFindings of Noncompliance Verified as
Corrected Within One YearFindings of Noncompliance Subsequently
CorrectedFindings Not Yet Verified as Corrected
0 0 0 0
FFY 2016 Part C State Performance Plan (SPP)/Annual Performance Report (APR)
2/27/2018 Page 25 of 34
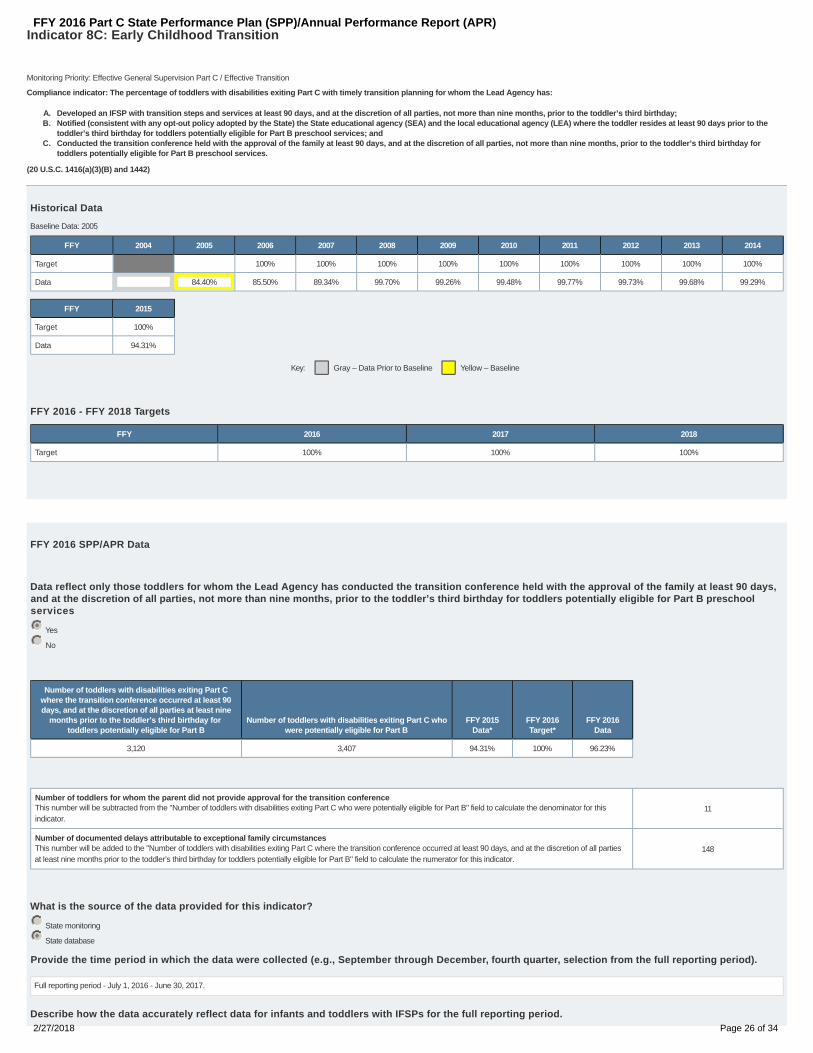
Indicator 8C: Early Childhood Transition
Baseline Data: 2005
Monitoring Priority: Effective General Supervision Part C / Effective Transition
Compliance indicator: The percentage of toddlers with disabilities exiting Part C with timely transition planning for whom the Lead Agency has:
Developed an IFSP with transition steps and services at least 90 days, and at the discretion of all parties, not more than nine months, prior to the toddler’s third birthday;A.Notified (consistent with any opt-out policy adopted by the State) the State educational agency (SEA) and the local educational agency (LEA) where the toddler resides at least 90 days prior to thetoddler’s third birthday for toddlers potentially eligible for Part B preschool services; and
B.
Conducted the transition conference held with the approval of the family at least 90 days, and at the discretion of all parties, not more than nine months, prior to the toddler’s third birthday fortoddlers potentially eligible for Part B preschool services.
C.
(20 U.S.C. 1416(a)(3)(B) and 1442)
Historical Data
FFY 2004 2005 2006 2007 2008 2009 2010 2011 2012 2013 2014
Target 100% 100% 100% 100% 100% 100% 100% 100% 100%
Data 84.40% 85.50% 89.34% 99.70% 99.26% 99.48% 99.77% 99.73% 99.68% 99.29%
FFY 2015
Target 100%
Data 94.31%
Key: Gray – Data Prior to Baseline Yellow – Baseline
FFY 2016 - FFY 2018 Targets
FFY 2016 2017 2018
Target 100% 100% 100%
FFY 2016 SPP/APR Data
Data reflect only those toddlers for whom the Lead Agency has conducted the transition conference held with the approval of the family at least 90 days,and at the discretion of all parties, not more than nine months, prior to the toddler’s third birthday for toddlers potentially eligible for Part B preschoolservices
Yes
No
Number of toddlers with disabilities exiting Part Cwhere the transition conference occurred at least 90days, and at the discretion of all parties at least nine
months prior to the toddler’s third birthday fortoddlers potentially eligible for Part B
Number of toddlers with disabilities exiting Part C whowere potentially eligible for Part B
FFY 2015Data*
FFY 2016Target*
FFY 2016Data
3,120 3,407 94.31% 100% 96.23%
Number of toddlers for whom the parent did not provide approval for the transition conferenceThis number will be subtracted from the "Number of toddlers with disabilities exiting Part C who were potentially eligible for Part B" field to calculate the denominator for thisindicator.
11
Number of documented delays attributable to exceptional family circumstancesThis number will be added to the "Number of toddlers with disabilities exiting Part C where the transition conference occurred at least 90 days, and at the discretion of all partiesat least nine months prior to the toddler’s third birthday for toddlers potentially eligible for Part B" field to calculate the numerator for this indicator.
148
What is the source of the data provided for this indicator?
State monitoring
State database
Provide the time period in which the data were collected (e.g., September through December, fourth quarter, selection from the full reporting period).
Full reporting period - July 1, 2016 - June 30, 2017.
Describe how the data accurately reflect data for infants and toddlers with IFSPs for the full reporting period.
FFY 2016 Part C State Performance Plan (SPP)/Annual Performance Report (APR)
2/27/2018 Page 26 of 34

Data from the full reporting period are included.
Provide additional information about this indicator (optional)
Data were collected through MSDS. All local early intervention systems submitted data regarding all children served to the state database at three designated points during the program year (July 1, 2016 - June 30, 2017).Data from the three collections were aggregated to provide data from the full reporting period.
Data reported for this indicator reflect that a total of 3,407 records included toddlers potentially eligible for Part B preschool services for whom a transition conference was required to be conducted. Parents of 11 of thesechildren did not provide approval for a transition conference. This number was subtracted from the 3,407 toddlers potentially eligible for Part B preschool services and the resulting 3,396 was used as the denominator forcalculation of Indicator 8c data. Data reported for this indicator reflect that 3,120 of the records documented timely transition conferences. One hundred forty-eight additional records contained documentation that the delay tothe completion of a transition conference was attributable to exceptional family circumstances. The number of records with documented exceptional family circumstances (148) was added to the timely records (3,120) resultingin a total of 3,268 records. This number was used as the numerator for the calculation. The resulting percentage of compliance is 96.23%.
(3,120+148)/(3,407-11)=.9623
Both the numerator and the denominator include 148 children for whom the transition conference was not timely, but whose file contained documentation that the delay was attributable to exceptional family circumstances.
96.23% compliance falls below the target of 100% compliance for this indicator. These data reflect an increased level of compliance for this indicator from the 94.31% compliance level reported in the FFY 2015 APR.
FFY 2016 Part C State Performance Plan (SPP)/Annual Performance Report (APR)
2/27/2018 Page 27 of 34

Thirty-one of 56 local early intervention systems reported delays attributable to exceptional family circumstances for 148 children.Documented reasons for these delays include sickness or hospitalization of child or family members, multiple unsuccessful attempts tocontact family to set appointment, meeting cancellations or no shows on the part of the family, and meetings being rescheduled toaccommodate family schedules.
Twenty-one of 56 local early intervention systems reported delays that were not attributable to exceptional family circumstances for a totalof 128 children. Reasons for these delays include provider availability, personnel lack of training/knowledge, and failure to reporttimeliness of transition conferences.
Five of the 21 local early intervention systems with delays that were not attributable to exceptional family circumstances were issued Findings of noncompliance and required to develop Corrective Action Plans during FFY2017 based on this FFY 2016 data. The remaining 16 of the 21 local early intervention systems were not issued new Findings, as they had open Findings and Corrective Action Plans for Indicator 8c or a review of more recentdata during verification and closeout of previously issued Findings and Corrective Action Plans for Indicator 8c indicated 100% compliance.
Findings resulting from FFY 2016 data are based on the full reporting period, therefore Findings based on FFY 2016 data were issued inFFY 2017.
Actions required in FFY 2015 response
none
Note: Any actions required in last year's response table that are related to correction of findings should be responded to on the "Correction of Previous Findingsof Noncompliance" page of this indicator. If your State's only actions required in last year's response are related to findings of noncompliance, a text field willnot be displayed on this page.
Correction of Findings of Noncompliance Identified in FFY 2015
Findings of Noncompliance IdentifiedFindings of Noncompliance Verified as
Corrected Within One YearFindings of Noncompliance Subsequently
CorrectedFindings Not Yet Verified as Corrected
1 1 0 0
FFY 2015 Findings of Noncompliance Verified as Corrected
Describe how the State verified that the source of noncompliance is correctly implementing the regulatory requirements
One local early intervention system was issued a Finding of noncompliance related to Indicator 8c in FFY 2015. The Finding was issued as a result of noncompliance identified based on verification of self-assessment data.The local early intervention system developed a Corrective Action Plan in the electronic monitoring system that detailed strategies that the local early intervention system would take to correct noncompliance, as soon aspossible, but no later than one year from notification of the Finding, including verification by the state. As part of the corrective action planning process, progress reports were submitted. Progress reports required the localearly intervention system to conduct file reviews.
When Corrective Action Plan activities had been completed and progress reports indicated compliance MDE conducted a desk review during which the local early intervention system was required to make available new filesfor verification of correction of noncompliance. MDE requested that the local early intervention system provide a list of the most recent child records. From that list, MDE selected a random sample of records for review.
MDE used an indicator-specific checklist based upon the federal and state standards when reviewing the local early intervention system files to verify correction of noncompliance. This ensured that the local early interventionsystem is correctly implementing the specific regulatory requirements. Documentation was also collected from the local early intervention system and state technical assistance providers to demonstrate that all CorrectiveAction Plan activities had been completed.
The local early intervention system was notified of the verification of correction of noncompliance through a formal letter closing the Corrective Action Plan.
Describe how the State verified that each individual case of noncompliance was corrected
It was verified during the desk review of the self-assessment data that the child did not have a transition conference with all required participants at least 90 days prior to the child's third birthday. The impacted child was nolonger under the jurisdiction of the local early intervention system. Child level correction was not possible.
FFY 2016 Part C State Performance Plan (SPP)/Annual Performance Report (APR)
2/27/2018 Page 28 of 34

Indicator 9: Resolution Sessions
Baseline Data:
Monitoring Priority: Effective General Supervision Part C / General Supervision
Results indicator: Percent of hearing requests that went to resolution sessions that were resolved through resolution session settlement agreements (applicable if Part B due process procedures undersection 615 of the IDEA are adopted).
(20 U.S.C. 1416(a)(3)(B) and 1442)
Historical Data
FFY 2004 2005 2006 2007 2008 2009 2010 2011 2012 2013 2014
Target ≥
Data 0% 0% 0% 0% 0% 0% 0% 0% 0% 0%
FFY 2015
Target ≥
Data
Key: Gray – Data Prior to Baseline Yellow – Baseline Blue – Data Update
FFY 2016 - FFY 2018 Targets
FFY 2016 2017 2018
Target ≥
Key:
Explanation of Changes
No targets are required.
Targets: Description of Stakeholder Input - Please see the Stakeholder Involvement section of the introduction.
Enter additional information about stakeholder involvement
Prepopulated Data
Source Date Description Data Overwrite Data
SY 2016-17 EMAPS IDEA Part C DisputeResolution Survey; Section C: Due
Process Complaints11/1/2017 3.1(a) Number resolution sessions resolved through settlement agreements n null
SY 2016-17 EMAPS IDEA Part C DisputeResolution Survey; Section C: Due
Process Complaints11/1/2017 3.1 Number of resolution sessions n null
FFY 2016 SPP/APR Data3.1(a) Number resolution sessions resolved
through settlement agreements3.1 Number of resolution sessions
FFY 2015Data*
FFY 2016 Target*FFY 2016
Data
0 0 0%
Actions required in FFY 2015 response
none
FFY 2016 Part C State Performance Plan (SPP)/Annual Performance Report (APR)
2/27/2018 Page 29 of 34

Indicator 10: Mediation
Baseline Data: 2005
Monitoring Priority: Effective General Supervision Part C / General Supervision
Results indicator: Percent of mediations held that resulted in mediation agreements.
(20 U.S.C. 1416(a)(3)(B) and 1442)
Historical Data
FFY 2004 2005 2006 2007 2008 2009 2010 2011 2012 2013 2014
Target ≥
Data 0% 0% 0% 0% 0% 0% 0% 0% 0% 0%
FFY 2015
Target ≥
Data
Key: Gray – Data Prior to Baseline Yellow – Baseline Blue – Data Update
FFY 2016 - FFY 2018 Targets
FFY 2016 2017 2018
Target ≥
Key:
Explanation of Changes
No targets are required.
Targets: Description of Stakeholder Input
N/A
Prepopulated Data
Source Date Description Data Overwrite Data
SY 2016-17 EMAPS IDEA Part C DisputeResolution Survey; Section B: Mediation
Requests11/1/2017 2.1.a.i Mediations agreements related to due process complaints n null
SY 2016-17 EMAPS IDEA Part C DisputeResolution Survey; Section B: Mediation
Requests11/1/2017 2.1.b.i Mediations agreements not related to due process complaints n null
SY 2016-17 EMAPS IDEA Part C DisputeResolution Survey; Section B: Mediation
Requests11/1/2017 2.1 Mediations held n null
FFY 2016 SPP/APR Data2.1.a.i Mediations agreements
related to due process complaints2.1.b.i Mediations agreements notrelated to due process complaints
2.1 Mediations heldFFY 2015
Data*FFY 2016 Target*
FFY 2016Data
0 0 0 100%
Actions required in FFY 2015 response
none
FFY 2016 Part C State Performance Plan (SPP)/Annual Performance Report (APR)
2/27/2018 Page 30 of 34

Indicator 11: State Systemic Improvement Plan
Baseline Data: 2013
Monitoring Priority: General Supervision
Results indicator: The State’s SPP/APR includes a State Systemic Improvement Plan (SSIP) that meets the requirements set forth for this indicator.
Reported Data
FFY 2013 2014 2015 2016
Target 38.00% 40.00% 42.90%
Data 40.44% 41.87% 44.55%
Key: Gray – Data Prior to Baseline Yellow – Baseline
Blue – Data Update
FFY 2017 - FFY 2018 Targets
FFY 2017 2018
Target 46.30% 51.60%
Key:
Description of Measure
Please see the attached report for information on the Description of Measure.
Targets: Description of Stakeholder Input
Please see the attached report for information on the Description of Stakeholder Input.
Overview
Data Analysis
A description of how the State identified and analyzed key data, including data from SPP/APR indicators, 618 data collections, and other available data as applicable, to: (1) select the State-identified Measurable Result(s) forInfants and Toddlers with Disabilities and their Families, and (2) identify root causes contributing to low performance. The description must include information about how the data were disaggregated by multiple variables (e.g.,EIS program and/or EIS provider, geographic region, race/ethnicity, socioeconomic status, gender, etc.) As part of its data analysis, the State should also consider compliance data and whether those data present potentialbarriers to improvement. In addition, if the State identifies any concerns about the quality of the data, the description must include how the State will address these concerns. Finally, if additional data are needed, the descriptionshould include the methods and timelines to collect and analyze the additional data.
Analysis of State Infrastructure to Support Improvement and Build Capacity
A description of how the State analyzed the capacity of its current infrastructure to support improvement and build capacity in EIS programs and/or EIS providers to implement, scale up, and sustain the use of evidence-basedpractices to improve results for infants and toddlers with disabilities and their families. State systems that make up its infrastructure include, at a minimum: governance, fiscal, quality standards, professional development, data,technical assistance, and accountability/monitoring. The description must include current strengths of the systems, the extent the systems are coordinated, and areas for improvement of functioning within and across the systems.The State must also identify current State-level improvement plans and other early learning initiatives, such as Race to the Top-Early Learning Challenge and the Home Visiting program and describe the extent that these newinitiatives are aligned, and how they are, or could be, integrated with, the SSIP. Finally, the State should identify representatives (e.g., offices, agencies, positions, individuals, and other stakeholders) that were involved indeveloping Phase I of the SSIP and that will be involved in developing and implementing Phase II of the SSIP.
State-identified Measurable Result(s) for Infants and Toddlers with Disabilities and Their FamiliesA statement of the result(s) the State intends to achieve through the implementation of the SSIP. The State-identified Measurable Result(s) for Infants and Toddlers with Disabilities and their Families must be aligned to anSPP/APR indicator or a component of an SPP/APR indicator. The State-identified Measurable Result(s) for Infants and Toddlers with Disabilities and their Families must be clearly based on the Data and State Infrastructure
FFY 2016 Part C State Performance Plan (SPP)/Annual Performance Report (APR)
2/27/2018 Page 31 of 34
Analyses and must be a child- or family-level outcome in contrast to a process outcome. The State may select a single result (e.g., increase the rate of growth in infants and toddlers demonstrating positive social-emotionalskills) or a cluster of related results (e.g., increase the percentage reported under child outcome B under Indicator 3 of the SPP/APR (knowledge and skills) and increase the percentage trend reported for families underIndicator 4 (helping their child develop and learn)).
Statement
Description
Selection of Coherent Improvement Strategies
An explanation of how the improvement strategies were selected, and why they are sound, logical and aligned, and will lead to a measurable improvement in the State-identified Measurable Result(s) for Infants and Toddlers withDisabilities and their Families. The improvement strategies should include the strategies, identified through the Data and State Infrastructure Analyses, that are needed to improve the State infrastructure and to support EISprogram and/or EIS provider implementation of evidence-based practices to improve the State-identified result(s) for infants and toddlers with disabilities and their families. The State must describe how implementation of theimprovement strategies will address identified root causes for low performance and ultimately build EIS program and/or EIS provider capacity to achieve the State-identified Measurable Result(s) for Infants and Toddlers withDisabilities and their Families.
Theory of Action
A graphic illustration that shows the rationale of how implementing the coherent set of improvement strategies selected will increase the State’s capacity to lead meaningful change in EIS programs and/or EIS providers, andachieve improvement in the State-identified Measurable Result(s) for Infants and Toddlers with Disabilities and their Families.
Submitted Theory of Action: No Theory of Action Submitted
Provide a description of the provided graphic illustration (optional)
Infrastructure Development
(a) Specify improvements that will be made to the State infrastructure to better support EIS programs and providers to implement and scale up EBPs to improve results for infants and toddlers with disabilities and their families.(b) Identify the steps the State will take to further align and leverage current improvement plans and other early learning initiatives and programs in the State, including Race to the Top-Early Learning Challenge, Home VisitingProgram, Early Head Start and others which impact infants and toddlers with disabilities and their families.(c) Identify who will be in charge of implementing the changes to infrastructure, resources needed, expected outcomes, and timelines for completing improvement efforts.(d) Specify how the State will involve multiple offices within the State Lead Agency, as well as other State agencies and stakeholders in the improvement of its infrastructure.
Please see the SSIP Phase II report for information about the Infrastucture Development. Also, please see the attached Michigan Action Plan for more detailed information about the strategies and how they relate toInfrastructure Development.
Support for EIS programs and providers Implementation of Evidence-Based Practices
(a) Specify how the State will support EIS providers in implementing the evidence-based practices that will result in changes in Lead Agency, EIS program, and EIS provider practices to achieve the SIMR(s) for infants andtoddlers with disabilities and their families.(b) Identify steps and specific activities needed to implement the coherent improvement strategies, including communication strategies and stakeholder involvement; how identified barriers will be addressed; who will be in chargeof implementing; how the activities will be implemented with fidelity; the resources that will be used to implement them; and timelines for completion.(c) Specify how the State will involve multiple offices within the Lead Agency (and other State agencies such as the SEA) to support EIS providers in scaling up and sustaining the implementation of the evidence-based practicesonce they have been implemented with fidelity.
Please see the SSIP Phase II report for information about the implementation of Evidence-Based Practices. Also, please see the attached Michigan Action Plan for more detailed information about how the strategies will beimplemented.
Evaluation
(a) Specify how the evaluation is aligned to the theory of action and other components of the SSIP and the extent to which it includes short-term and long-term objectives to measure implementation of the SSIP and its impact onachieving measurable improvement in SIMR(s) for infants and toddlers with disabilities and their families.(b) Specify how the evaluation includes stakeholders and how information from the evaluation will be disseminated to stakeholders.(c) Specify the methods that the State will use to collect and analyze data to evaluate implementation and outcomes of the SSIP and the progress toward achieving intended improvements in the SIMR(s).(d) Specify how the State will use the evaluation data to examine the effectiveness of the implementation; assess the State’s progress toward achieving intended improvements; and to make modifications to the SSIP as necessary.
Please see the SSIP Phase II report for information about Evaluation. Also, please see the attached Michigan Action Plan for more detailed information about how the strategies will be evaluated.
Technical Assistance and Support
Describe the support the State needs to develop and implement an effective SSIP. Areas to consider include: Infrastructure development; Support for EIS programs and providers implementation of EBP; Evaluation; andStakeholder involvement in Phase II.
FFY 2016 Part C State Performance Plan (SPP)/Annual Performance Report (APR)
2/27/2018 Page 32 of 34

Please see the SSIP Phase II report for information about Technical Assistance and Support.
Phase III submissions should include:
• Data-based justifications for any changes in implementation activities.• Data to support that the State is on the right path, if no adjustments are being proposed.• Descriptions of how stakeholders have been involved, including in decision-making.
A. Summary of Phase 3
1. Theory of action or logic model for the SSIP, including the SiMR.2. The coherent improvement strategies or principle activities employed during the year, including infrastructure improvement strategies.3. The specific evidence-based practices that have been implemented to date.4. Brief overview of the year’s evaluation activities, measures, and outcomes.5. Highlights of changes to implementation and improvement strategies.
Please see attached report.
B. Progress in Implementing the SSIP
1. Description of the State’s SSIP implementation progress: (a) Description of extent to which the State has carried out its planned activities with fidelity—what has been accomplished, what milestones have been met, andwhether the intended timeline has been followed and (b) Intended outputs that have been accomplished as a result of the implementation activities.2. Stakeholder involvement in SSIP implementation: (a) How stakeholders have been informed of the ongoing implementation of the SSIP and (b) How stakeholders have had a voice and been involved in decision-makingregarding the ongoing implementation of the SSIP.
Please see attached report.
C. Data on Implementation and Outcomes
1. How the State monitored and measured outputs to assess the effectiveness of the implementation plan: (a) How evaluation measures align with the theory of action, (b) Data sources for each key measure, (c) Description ofbaseline data for key measures, (d) Data collection procedures and associated timelines, (e) [If applicable] Sampling procedures, (f) [If appropriate] Planned data comparisons, and (g) How data management and data analysisprocedures allow for assessment of progress toward achieving intended improvements2. How the State has demonstrated progress and made modifications to the SSIP as necessary: (a) How the State has reviewed key data that provide evidence regarding progress toward achieving intended improvements toinfrastructure and the SiMR, (b) Evidence of change to baseline data for key measures, (c) How data support changes that have been made to implementation and improvement strategies, (d) How data are informing next stepsin the SSIP implementation, and (e) How data support planned modifications to intended outcomes (including the SIMR)—rationale or justification for the changes or how data support that the SSIP is on the right path3. Stakeholder involvement in the SSIP evaluation: (a) How stakeholders have been informed of the ongoing evaluation of the SSIP and (b) How stakeholders have had a voice and been involved in decision-making regarding theongoing evaluation of the SSIP
Please see attached report.
D. Data Quality Issues: Data limitations that affected reports of progress in implementing the SSIP and achieving the SIMR
1. Concern or limitations related to the quality or quantity of the data used to report progress or results2. Implications for assessing progress or results3. Plans for improving data quality
Please see attached report.
E. Progress Toward Achieving Intended Improvements
1. Infrastructure changes that support SSIP initiatives, including how system changes support achievement of the SiMR, sustainability, and scale-up2. Evidence that SSIP’s evidence-based practices are being carried out with fidelity and having the desired effects3. Outcomes regarding progress toward short-term and long-term objectives that are necessary steps toward achieving the SIMR4. Measurable improvements in the SIMR in relation to targets
Please see attached report.
F. Plans for Next Year
1. Additional activities to be implemented next year, with timeline2. Planned evaluation activities including data collection, measures, and expected outcomes3. Anticipated barriers and steps to address those barriers4. The State describes any needs for additional support and/or technical assistance
Please see attached report.
FFY 2016 Part C State Performance Plan (SPP)/Annual Performance Report (APR)
2/27/2018 Page 33 of 34
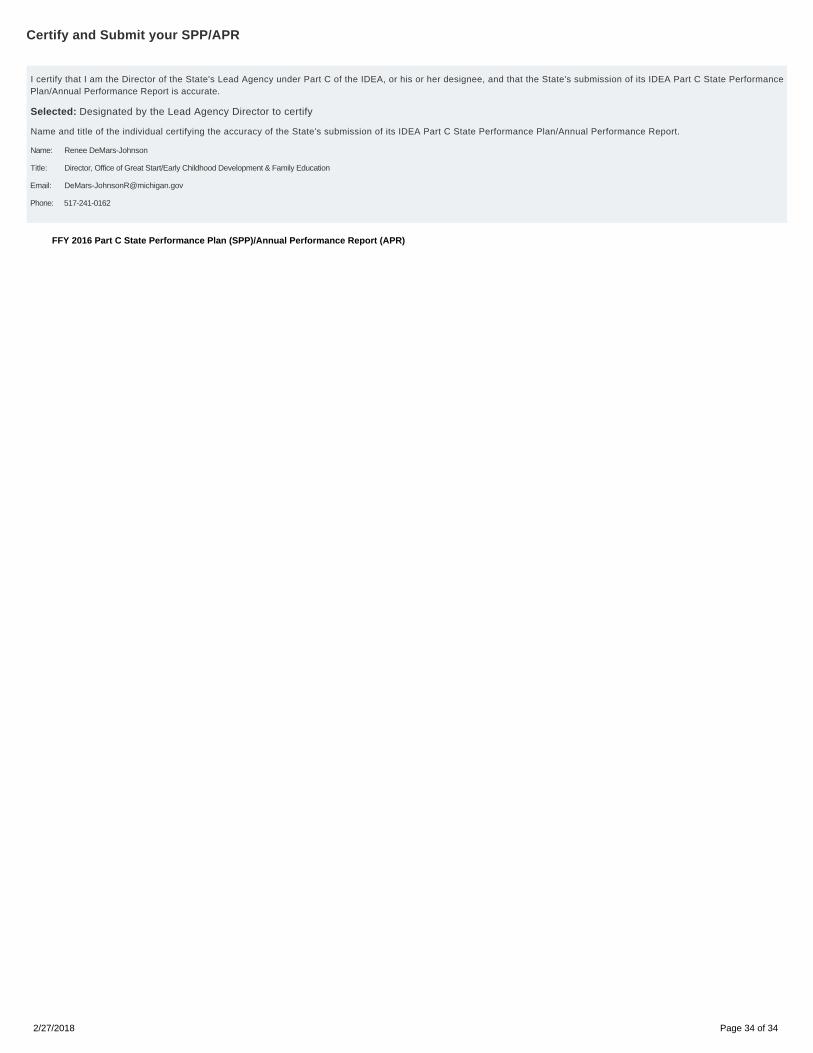
Certify and Submit your SPP/APR
Name: Renee DeMars-Johnson
Title: Director, Office of Great Start/Early Childhood Development & Family Education
Email: [email protected]
Phone: 517-241-0162
I certify that I am the Director of the State's Lead Agency under Part C of the IDEA, or his or her designee, and that the State's submission of its IDEA Part C State PerformancePlan/Annual Performance Report is accurate.
Selected: Designated by the Lead Agency Director to certify
Name and title of the individual certifying the accuracy of the State's submission of its IDEA Part C State Performance Plan/Annual Performance Report.
IntroductionIndicator 1Indicator 2Indicator 3Indicator 4Indicator 5Indicator 6Indicator 7Indicator 8Indicator 8AIndicator 8BIndicator 8CIndicator 9Indicator 10Indicator 11
FFY 2016 Part C State Performance Plan (SPP)/Annual Performance Report (APR)
2/27/2018 Page 34 of 34