Embed Size (px)
Citation preview
1
2020 Hospital and Surgery Center Cost Assessment
Methodology Overview Background:
The objective of HealthPartners’ hospital and surgery center cost assessment is to compare the cost of a facility including the inpatient and outpatient services provided. The overall cost index is case mix adjusted (DRG, APC, RVUs) and place of service case mix adjusted (IP vs. OP). The cost index for each facility is indexed to the aggregate 13 county metro Total Cost Index.
Criteria Applied to Analysis
1 . Dates of serv ice: 1/2018 to 12/2018 2. Outliers excluded 3. Commercial product 4. COB admissions excluded 5. Paid amounts adjusted to 2019 contracts
13 County benchmark
1. Minnesota counties included in the benchmark – Anoka, Carver, Chisago, Dakota, Hennepin, Isanti, Ramsey , Scott, Sherburne, Washington and Wright
2. Wisconsin counties included in the benchmark – Pierce and St. Croix
Cost Assessment Methodology
1. Facility case mix is adjusted by DRG for inpatient admissions and APC and RVUs for outpatient
v isits. 2. The inpatient/outpatient case mix is adjusted by facility. (the cost index from IP and OP will be
weighted by the percent of business in each component by facility)
Cost Assessment Details
1. Hospital admission and outpatient encounter service dates between 1/2018 and 12/2018 2. Outliers excluded
All admissions and outpatient encounters with TCI’s outside of the normal range are excluded
Admissions with a LOS outside the normal range for the same DRG are excluded 3. Commercial products included
Includes fully insured and self insured 4. COB admissions and encounters excluded
Only admissions and encounters that are paid 100% by HealthPartners are evaluated 5. Paid amounts adjusted to 2019 contracts
Prospectively price all major facilities to their 2019 contracts. 6. Facilities with a minimum of 30 inpatient admissions or 200 outpatient encounters are evaluated
2
2020 Primary Care Cost Assessments
Cost Assessment Methodology Overview
Based on NQF endorsed Total Cost of Care Measure
1. Only providers that meet minimum number of attributed members are included. 2. Providers with less then minimum number of attributed members are excluded, and follow default
rules. 3. Cost tier placement is based on the provider specific risk adjusted PMPM indexed against the overall
risk adjusted PMPM for all 13-county metro primary care providers.
Criteria Applied to Analysis
1. Attributed Provider 2. Outlier members truncated 3. ACG Risk adjustment applied 4. Paid amounts adjusted to 2019 contract rates 5. Commercial product only 6. Claims dates between January 2018 and December 2018 7 . Babies age less than one and members 65 and over are excluded 8. Members must be continuously enrolled for a minimum of 9 months to be included
13 County benchmark
1. Minnesota counties included in the benchmark – Anoka, Carver, Chisago, Dakota, Hennepin, Isanti, Ramsey , Scott, Sherburne, Washington and Wright
2. Wisconsin counties included in the benchmark – Pierce and St. Croix
Further explanations of the above criteria:
1. Attributed Provider A member is assigned to a medical group that provides the majority of the primary care office v isits
Office v isits are identified though the place of service code that indicates a clinic site (11, 50)
Primary care specialty is determined by the servicing physician
Primary care specialties include: family practice, internal medicine, pediatrics, geriatrics, nurse practitioner, physician assistant and OB/GY N
Indiv iduals that do not have a primary care office v isit are excluded
2. Outlier members truncated
A member’s combined medical and pharmacy costs are truncated at $125,000
3. ACG Risk adjustment
Adjusted Clinical Groups (or ACGs) were developed by Johns Hopkins University and allow comparisons between populations with varying illness burdens.
A member’s medical claims are ACG risk adjusted based on diagnoses, age, and gender
3
2020 Specialty Cost Assessments
Cost Assessment Methodology Overview
1. Only providers that meet minimum number of episodes requirement are included. 2. Providers with less than minimum number of episodes are excluded, and follow default rules. 3. Cost evaluation is based on the provider specific indexed TCI against the overall TCI for all 13-county
metro providers.
Specialties Evaluated for Tiering
1. Cardiology 2. Orthopedics 3. ENT 4. OB/GY N
Specialties Evaluated for Transparency
1. Allergy & Immunology 2. Dermatology 3. Endocrinology 4. Gastroenterology 5. Neurology 6. Podiatry 7 . Pulmonary Medicine 8. Rheumatology 9. Surgery 10. Urology
Criteria Applied to Analysis
1. Paid amounts adjusted to 2019 contract rates 2. Cost evaluation methodology 3. Significant Contributor 4. Chronic/acute case mix adjustment applied 5. Episode dates between Oct 2016 and Sept 2018 6. Outlier episodes removed 7 . Completed episodes 8. Commercial product 9. Continuously enrolled members only 10. Rx Proxy applied 11. Patient-Centered outliers 12. Provider/Specialty ETG threshold 13. ETG Severity Risk Adjusted 14. Trauma/transplant episodes removed
13 County benchmark
1. Minnesota counties included in the benchmark – Anoka, Carver, Chisago, Dakota, Hennepin, Isanti, Ramsey , Scott, Sherburne, Washington and Wright
2. Wisconsin counties included in the benchmark – Pierce and St. Croix
4
Further explanation of the criteria:
1. Paid amounts adjusted to 2019 contract rates
Prospectively priced all claims to their 2019 contracts
2. Cost evaluation methodology The episode grouper creates clinically homogenous events (conditions/procedures) that are risk
adjusted allowing for a provider’s cost experience to be compared to a benchmark
The benchmark is created by specialty and condition/procedures using a peer group that is similar to the provider being measured
The resulting comparison is an actual to expected value that presents as a cost index relative to the peer group average.
3. Significant Contributor HealthPartners assigns providers to episodes where the provider represents 25% or greater of the
management or surgery resources within a given specialty. Resources are defined as HealthPartners’ Total Care Relative Resource Value rather than actual paid as the TCRRV are not influenced by contracted rates and is a fair comparison.
The provider must have 25% of the Management and Surgery TCRRV to be attributed the episode (this is industry standard)
Multiple provider groups can be the significant contributor on the same episode (up to 4 providers, 25% each)
Some specialties do not direct the management of care, therefore they cannot be significant contributors (i.e. Anesthesiology, Radiology, etc.)
4. Chronic/Acute Case Mix Adjustment A factor was generated to weight the ETGs based on their level of completeness to effectively
evaluate a provider’s true case mix of services delivered. The factor is applied to the number of episodes, actual paid amount & the expected paid amount.
This factor adjusts the impact an ETG’s TCI has on aggregate TCI.
5. Episode dates between Oct 2016 and Sept 2018
6. Outlier episodes removed
Episodes are excluded where the total medical costs are not within the predefined trim points.
7. Completed Episodes An episode is considered complete when there is an absence of treatment through a “clean period”
8. Commercial product Includes fully and self insured
9. Continuously enrolled members only Member must have coverage for the duration of the episode
10. Rx Proxy applied A network average Rx cost is applied for episodes where employers carve out pharmacy benefit
11. Patient-Centered outliers
Removed any patient who had 12 or more ETGs in the evaluation period
12. Provider ETG Threshold A provider must have 10 or more episodes within an ETG for that ETG to be included in their profile
13. ETG Severity Risk Adjusted Episodes are risk adjusted to account for patient’s full illness burden
14. Trauma and transplant episodes removed
Trauma episodes are defined by the presence of a trauma DRG and are excluded Patients that have had or are scheduled for a transplant are excluded

5
2020 Quality Assessments
Principles for Assessing Primary Care/Specialty and Hospital Quality Performance
Quality assessments are conducted based upon the following over-arching
principals:
Performance assessment should represent a reasonable cross section of conditions or procedures within the usual scope of practice
Performance assessment should sufficiently reflect the spectrum of care (e.g., prevention and health promotion, chronic illness, acute care and procedures (diagnostic and surgica l).
Performance assessment should be assessed using a sufficient combination of cost/efficiency, patient experience, process, structural, and risk-adjusted outcome measures
Performance assessment set of metrics should reflect multiple available data source s to incorporate all perspectives and v iewpoints (external, internal, chart, admin, hybrid, self-report, patient exp, etc).
Quality domains should reflect the strength and breadth of the underlying measures and scope of practice of the provider.
The significance and comparative performance benchmarks as calculated by external measurement organizations will be leveraged for determining performance. This means comparative groups will vary by measure.
Performance assessments should be shared with the physicians or hospitals prior to public reporting with a reasonable comment period to address any provider concerns.
Significant provider and member feedback & complaints should be addressed within a reasonable time period.
Complete descriptions of all measures, criteria, algorithms, methodologies, and data sources should be made available to all stakeholders.
Phy sicians and consumer’s feedback and collaboration regarding the design, selection of measures, methodology, and display formats will be considered through appropriate advisory and collaboration forums.
Measure Inclusion in Quality Assessment scoring
Measures are selected for Quality Assessments based upon the following
measurement selection principles:
Measures selected should represent a reasonable cross section of conditions or procedures within the usual scope of practice of a provider group or hospital.
Measures selected should have followed HealthPartners’ Measurement Development Policy reflecting reliable, valid based on sound scientific evidence, and accurate and timely as possible.
Measures should be based on where there has been consensus among stakeholders and when possible, predictive of overall quality performance.
Measures should be important and relevant to stakeholders, including physicians, c onsumers, health plans, and purchasers.
Measures should reflect appropriateness and/or processes of care that provider groups or hospitals can influence or impact.
As available, measures selected should be endorsed by nationally or locally recognized quali ty measurement organizations such as NQF, AQA, ACC, ICSI, MNCM, etc. HealthPartners will supplement with internally developed or provider self-reported measures.
Measures of appropriateness of care should be utilized whenever possible.
6
Provider Inclusion in Quality Assessment scoring
Providers are included in quality assessment scoring if they meet the following
criteria:
Obstetrics and Gy necology Providers must have at least 600 episodes
Other specialty care providers must have at least 300 episodes
Providers that primarily serve PMAP members are excluded
Providers’ scope of services should be representative of the specialty being assessed
Members must have direct access to the provider
Measurement results for the provider must represent the spectrum of quality domains (clusters) defined for each specialty.
o Providers must have at least 50% of available measures within a quality domain in order for the domain to be included in their overall quality assessment. For clusters that have a break between child and adult measures – the quality domain will be included if the provider has 50% of Adult measures, 50% of pediatric measures, or a 50% combination between adult and pediatric measures. For hospitals, the Helping Patients Get Better cluster is broken down into 7 sub-clusters. Critical access hospitals must have 50% of available measures within 3 of the 7 sub-clusters in order for the domain to be included and acute care hospital must have 4 of the 7 sub-clusters.
o Providers must have quality domains representing at least 40% of the total quality domain weights in order to calculate an overall quality assessment score/tier placement.
Provider Mergers
Due to the fact that measurement & sy stem changes typically lag & require time to reflect merged providers, adjustments to cost and quality measures may need to be accommodated to provide the most accurate profiles.
o Historical mergers -- Quality assessments will be calculated separately for each merged entity, and then weighted based on percentage of business and combined for their final quality assessment. When one of the merged providers lacks sufficient quality measures to be scored, the remaining provider’s quality assessment will represent the merged entities’ quality performance. In some cases system limitations may only allow for the display of one set of cost/quality data for a merged provider. In this case, the larger entities information will be displayed.
o Current Mergers – Quality assessments will be calculated based on an 80/20 rule. If one provider under the new merger accounts for 80% of the business, that provider’s quality assessment will be used. Otherwise “historical merger” rules will be applied.
7
Individual Measure Scoring Sampled Population Measures
A sampled measure is a measure based on a subset of a population. This is done when measuring the full population is not possible or impractical.
Examples of sampled measures: o Preventive Services - Adult (sourced from HealthPartners Clinical Indicators Report; o High Blood Pressure (sourced from Minnesota Community Measurement)
Performance Level Scoring: o Confidence intervals for sampled measures are leverages when determining performance
level scoring. o Score assignments for sampled measures are as follows:
Significantly above quality target threshold = 1 point Not significantly above or below quality target threshold = 0.5 points Significantly below quality target threshold = 0 points
Full-Population Measures
Significance is not appropriate for full-population measures since no error rate is introduced due to sampling. Each measure is individually reviewed to determine provider performance levels; 1) high performer, 2) solid performer, or 3) lower performer.
Performance Level Scoring: o Providers are assigned a score based on their performance to set quality threshold(s). o Score assignments for full-population measures are as follows:
Above top quality target = 1 point Between top and bottom quality targets = 0.5 points Below bottom quality target = 0 points
Clustering & Weighting
All measures are clustered into meaningful categories (quality domains) that closely align with NCQA and NQF categories. Categorizing measures into clusters balances a provider’s performance across a spectrum of care. For Primary Care the following quality domain clusters were utilized:
o Patient Experience: Getting Care and Information o Patient Experience: Care and Communication o Stay ing Healthy and Care for Illness o Care for Chronic Conditions o Health Information Technology and Generic Prescribing
In general, measures all have equal weights (1.0). However, it is possible for new measures, or topically similar measures to be weighted differently in specific circumstances. In some cases this is done to essentially composite several measures into one with a total weight of 1 .0.
In 2020, the following measures had special weights assigned: o Safety : Immunizations for influenza – 0.5 (1/2) o Safety : Healthcare workers given influenza vaccination – 0.5 (1/2) o Safety : Door to diagnostic evaluation – 0.333 (1/3) o Safety : ER: Median time to pain medication for long bone fractures – 0.333 (1/3) o Safety : Head CT results within 45 minutes – 0.333 (1/3) o Safety : Abdomen CT use of contrast material – 0.5 (1/2) o Safety : Thorax CT use of contrast material – 0.5 (1/2) o Hospital surgical care infection prevention measures each weighted 0.166 (1/6) o Orthopedic care: Arthroscopic knee surgery complications measures – each weighted 0.333
(1/3) o Orthopedic care: Hip replacement and revision complications measures – each weighted
0.333 (1/3)
8
o Orthopedic care: Knee replacement and revision complications measures – each weighted 0.333 (1/3)
o General surgery: Gall bladder surgery complications measures – each weighted 0.333 (1/3) o General surgery: Hernia repair complications measures – each weighted 0.333 (1/3)
In the event that a provider is missing one or more of the specially weighted measures, the measure weights of the measure present re-calibrate to a weighting that adds to 1 . For example, if a provider is missing the MNCM chlamydia screening measure, the weight assigned to the MNCM cervical and breast cancer screening measures would be 1/2 each instead of 1/3 .
Decimal Rules
All calculations used in Quality Assessments will be rounded until the quality assessments are determined. Final quality assessment indices will be truncated at 3 -decimals. Tier assignments will only be applied after the truncation has occurred.
Quality Tier Definitions
The following tier definitions will be used to designate providers as tier 1 or tier 2 for quality. These may be adjusted by specialty to account for other factors such as member access.
o 2 Tier Model Tier 1 : Overall Quality Index >= 1 .000 Tier 2: Overall Quality Index < 1 .000
o 3 Tier Model Tier 1 : Overall Quality Index >= 1 .000 Tier 2: Overall Quality Index >= 0.5 and < 1 .000 Tier 3: Overall Quality Index < 0.5
9
Principles for Determining Provider/Hospital Benefit Levels/Tiers Final Tier placements are determined based upon the following over-arching
principals:
Cost and quality must be available at the comparative specialty level (e.g. hospital, primary care, cardiology, orthopedics, OB/GY N and ENT) for tiering application.
In general, better than average quality and cost performance is required to achieve tier 1 placement.
Cost determines tier placement when provider volume in quality measures is not sufficient for comparative assessments.
Tier placements may be adjusted due to access concerns related to geographic location and capacity. To avoid barriers to preventive services for Primary & OB/GY N care, a reasonable proportional split of historic episodes will help serve as a guide when considering tier adjustments.
Public displays for will consumer transparency illustrate actual performance regardless of Tier placement.
Primary care providers who do not submit to Minnesota Community Measurement will receive the lowest Tier placement.
Employ er groups may customize HealthPartner’s standard Tier placements.
Tier placements may be adjusted to recognize highly-specialized providers/facilities serving unique populations or conditions/procedures.
Final Tier Definitions
2 Tier Method- All specialties and hospital Tier 1 determined by average and better cost & quality (index TCI <=1 for cost and index Quality Index => 1 for quality)
3 Tier Methodology
Primary Care, OB/GYN, Hospital o Tier 1 determined by TCI <= 1 , QI => 1 o Tier 2 determined by TCI <= 1 .05, QI => 0.5 o Tier 3 determined by TCI > 1 .05, QI < 0.5
All other specialties
o Tier 1 determined by TCI <= 0.95, QI => 1 o Tier 2 determined by TCI <= 1 .05, QI => 0.5 o Tier 3 determined by TCI > 1 .05, QI < 0.5
Geographic Assessment The east/west geographic distribution of Tier 1 providers is assessed to ensure reasonable access to Tier 1 providers by specialty and hospital. If there is limited access to Tier 1 providers, additional providers may be moved into Tier 1 using the following process:
Only providers that meet the quality requirements to be eligible for Tier 1 are considered
Of these providers, identify the provider in the geographic area that has the next best TCI — this provider would be moved into Tier 1.
Identify any providers outside of the geographic area that have a TCI better than the group moving into Tier 1 and meet the quality requirements to be eligible for Tier 1 . These identified groups would be moved into Tier 1 as well.
10
2020 Metro Hospital Quality Scoring Specifics and Example: Steps (1 – 4):
1. Selected measures that represent a broad domain of quality
Centers for Medicare and Medicaid Services Outcomes Measures
Minnesota Community Measurement/Minnesota Hospital Association
Centers for Medicare and Medicaid Services HCAHPS Patient Satisfaction (experience) Surveys
HealthPartners surgical procedure specific complications measures
2. For each of the measures, determine if the hospital was at threshold, or
significantly above or below.
CMS HCAHPS measures o Scoring based on thresholds using the linear average: o Thresholds are informed by CMS star assignment groupings
CMS mortality and readmissions measures o Scoring based on significance to thresholds o Thresholds are informed by the regional distribution of hospital performance
CMS process of care measures o Scoring based on performance rate thresholds
HealthPartners complications measures o Scoring based on significance to thresholds o Thresholds are informed by 2 standard deviations from the mean over the prior two
measurement cycles MNCM AHRQ volume measures
o Scoring based on thresholds using # of procedures o Thresholds informed by AHRQ proficiency levels
MNCM AHRQ significance measures o Scoring based on significance to actual to expected rates o Actual and expected rates are hospital specific
See appendix for hospital measure targets
3. Group measures into logical clusters or domains
Patient Experience
Helping Patients Get Better o Heart Care o Lung Care o OB Care o Stroke Care o Orthopedic Care o General Surgery o Safety
4. For each domain, calculate a quality score.
A quality score is obtained by assigning a point value to each individual measure results within a quality domain based on significance.
Below Threshold = 0 pts, At Threshold = 0.5 pts, Above Threshold = 1 pt
The total number of points within each quality domain is calculated for each provider
The total number of points for each cluster is div ided by the total number of measures to produce the providers’ actual to expected quality domain score
11
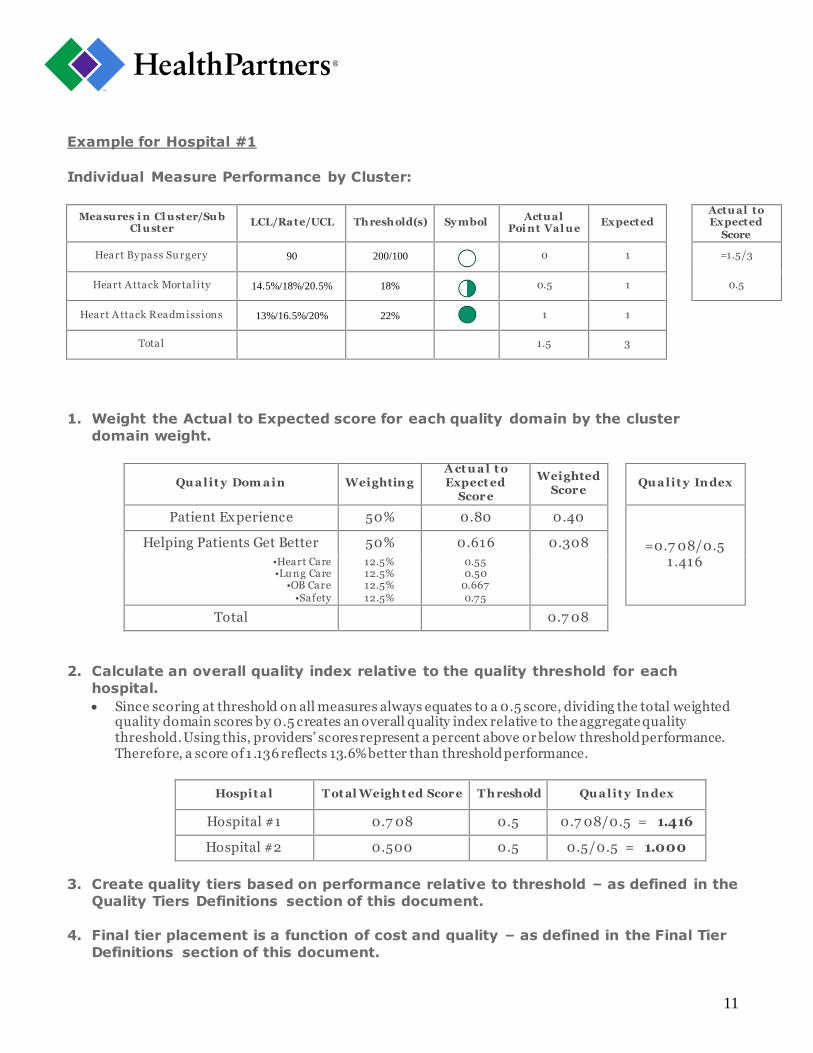
Example for Hospital #1
Individual Measure Performance by Cluster:
Measures i n Cl uster/Sub Cl uster
LCL/Rate/UCL Threshold(s) Sy mbol Actual
Poi nt Val ue Expected
Actual to Expected
Score
Heart Bypass Su rgery 90 200/100 0 1 =1.5/3
Heart A ttack Mortal i ty 14.5%/18%/20.5% 18%
0.5 1 0.5
Heart A ttack Readmissions 13%/16.5%/20% 22% 1 1
Total 1.5 3
1. Weight the Actual to Expected score for each quality domain by the cluster
domain weight.
Qu a lit y Dom a in Weighting A ct u a l t o Expect ed
Score
Weighted Score
Qu a lit y Index
Patient Experience 50% 0.80 0.40
=0.7 08/0.5 1 .416
Helping Patients Get Better 50% 0.616 0.308
•Heart Care •Lu ng Care
•OB Care •Safety
12.5% 12.5% 12.5% 12.5%
0.55 0.50
0.667 0.75
Total 0.7 08
2. Calculate an overall quality index relative to the quality threshold for each
hospital.
Since scoring at threshold on all measures always equates to a 0.5 score, dividing the total weighted quality domain scores by 0.5 creates an overall quality index relative to the aggregate quality threshold. Using this, providers’ scores represent a percent above or below threshold performance. Therefore, a score of 1 .136 reflects 13.6% better than threshold performance.
Hospit a l T ot al Weigh t ed Score T h reshold Qu a lit y Index
Hospital #1 0.7 08 0.5 0.7 08/0.5 = 1.416
Hospital #2 0.500 0.5 0.5/0.5 = 1.000
3. Create quality tiers based on performance relative to threshold – as defined in the
Quality Tiers Definitions section of this document.
4. Final tier placement is a function of cost and quality – as defined in the Final Tier
Definitions section of this document.

12
2020 Primary Care Quality Scoring Specifics and Example Steps (1 – 8)
1. Selected quality measures that represent a broad domain of quality
HealthPartners Clinical Indicators Report
Minnesota Community Measurement
Patient Experience
Several measures are composites.
For some measures where a composite is not available, individual components were equally weighted to produce a composite equivalent.
o For the three Minnesota Community Measurement Health IT Survey measures – each component measure is weighted 1/3rd
o The six safety assessment survey measures and two medication safety measures – each weighted 1/8th
o Minnesota Community Measurement Depression care measures – each weighted 1/7th. o Minnesota Community Measurement Breast Cancer screening, cervical cancer, and
chlamydia screening – each weighted 1/3rd.
2. For each of the measures, determine if the medical group was at threshold, or
significantly above or below.
3. Group measures into logical clusters or domains
Getting Care
Care and Communication
Care for Chronic Illness
Stay ing Healthy and Care for Illness
Health Information Tech and Generic Prescribing
4. For each domain, calculate a quality score.
A quality score is obtained by assigning a point value to each individual measure result within a quality domain based on significance.
Below Threshold = 0 pts, At Threshold = 0.5 pts, Above Threshold = 1 pt
The total number of points within each quality domain is calculated for each provider
The total number of points for each quality domain is divided by the total number of measures to produce the providers’ actual to expected quality domain score
Example for Medical Group #1
Individual Measure Performance by Cluster:
Care for Chroni c Condi ti ons
UCL/Rate/LCL Threshol d(s) Sy mbol Actual Poi nt Val ue
Expected Actual to
Expected Points Score
Optimal V ascu lar 62.5%/60.0%/56.5% 50% 1 1 =4/5
Optimal Diabetes 42%/40%/38% 40% 0.5 1 0.8
High Blood Pressu re 90%/85%/80% 75% 1 1
Diabetic Eye Exam 55% 60/50% 0.5 1
Use of Spirometry for COPD 55%/50%/45% 40% 1 1
Total 4 5
13
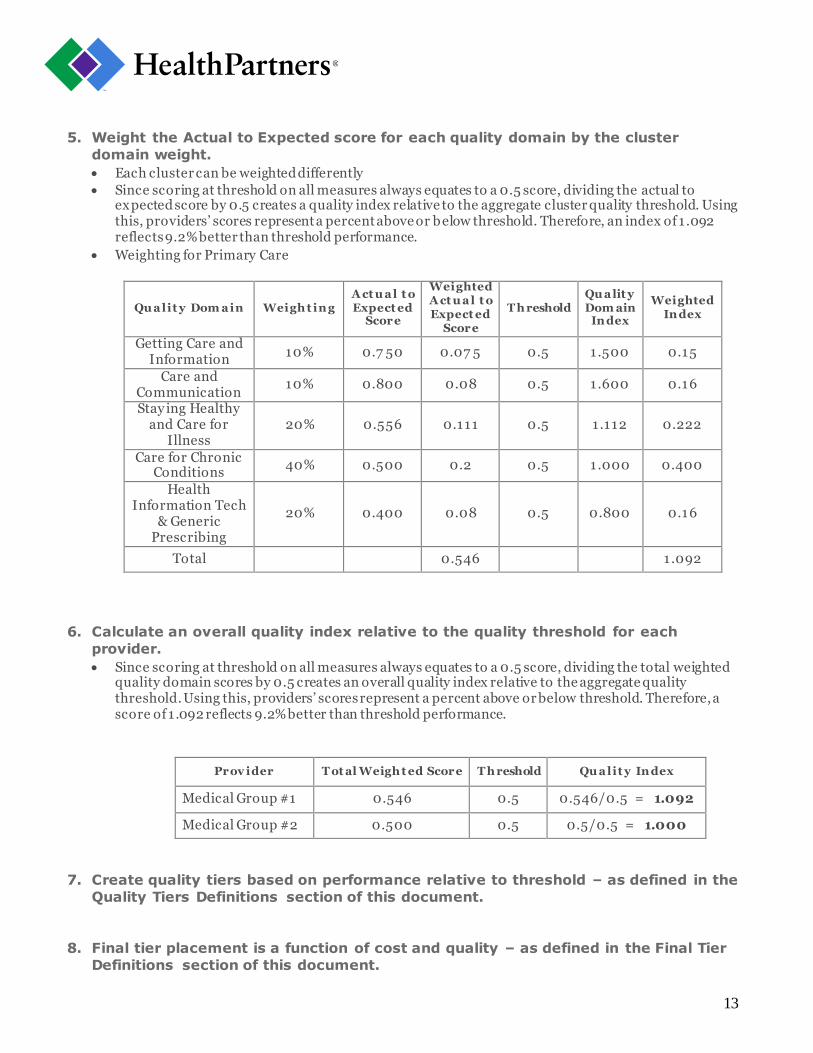
5. Weight the Actual to Expected score for each quality domain by the cluster
domain weight.
Each cluster can be weighted differently
Since scoring at threshold on all measures always equates to a 0.5 score, dividing the actual to expected score by 0.5 creates a quality index relative to the aggregate cluster quality threshold. Using this, providers’ scores represent a percent above or below threshold. Therefore, an index of 1 .092 reflects 9.2% better than threshold performance.
Weighting for Primary Care
Qu a lit y Dom a in Weigh t ing A ct u a l t o Expect ed
Score
Weighted A ct u a l t o Expect ed
Score
T h reshold Qu a lit y Dom ain
Index
Weighted Index
Getting Care and Information
10% 0.7 50 0.07 5 0.5 1 .500 0.15
Care and Communication
10% 0.800 0.08 0.5 1 .600 0.16
Stay ing Healthy and Care for
Illness 20% 0.556 0.111 0.5 1 .112 0.222
Care for Chronic Conditions
40% 0.500 0.2 0.5 1 .000 0.400
Health Information Tech
& Generic Prescribing
20% 0.400 0.08 0.5 0.800 0.16
Total 0.546 1 .092
6. Calculate an overall quality index relative to the quality threshold for each
provider.
Since scoring at threshold on all measures always equates to a 0.5 score, dividing the total weighted quality domain scores by 0.5 creates an overall quality index relative to the aggregate quality threshold. Using this, providers’ scores represent a percent above or below threshold. Therefore, a score of 1 .092 reflects 9.2% better than threshold performance.
Prov ider T ot al Weigh t ed Score T h reshold Qu a lit y Index
Medical Group #1 0.546 0.5 0.546/0.5 = 1.092
Medical Group #2 0.500 0.5 0.5/0.5 = 1.000
7. Create quality tiers based on performance relative to threshold – as defined in the
Quality Tiers Definitions section of this document.
8. Final tier placement is a function of cost and quality – as defined in the Final Tier
Definitions section of this document.

14
2020 Star/Dollar-Assignment Methodology
Star/Dollar-Assignment Methodology
Description – Overall quality star ratings are calculated for Primary Care, Cardiology, ENT, Obstetrics and Gy necology, and Orthopedics specialties, and Hospitals. In addition:
Providers must have at least 50% of available measures within a quality domain in order for a star assignment to be calculated. For clusters that have a break between child and adult measures – the quality domain star rating will be calculated if the provider has 50% of Adult measures, 50% of pediatric measures, or a 50% combination between adult and pediatric measures.
Providers must have star ratings in all Primary care or Hospital quality domains in order to calculate an overall quality star rating.
T hresholds – Star assignment performance levels are set such that a provider must have 1/2 of their measures within a quality domain above threshold with the other 1/2 at threshold to achieve a 4 star rating. To achieve a 1 star rating a provider must have greater than 1/2 of their measures below threshold with the remaining measures at threshold. For the overall quality star assignment rating, the total weighted quality score is used against this same scale.
Example of Quality Star Rating Calculations
Qu a lit y Dom a in Qu a lit y
Index Qu a lit y Dom a in St a r Ra t ing Weighting
Weighted Index
Getting Care and Information
1 .50 1 .50 <= 1.50 < 2.0 = 10% 0.15
Care and Communication
1 .60 1 .50 <= 1.600 < 2.0 = 10% 0.16
Stay ing Healthy and Care for Illness
1 .112 1 .0 <= 1.112 < 1 .50 = 20% 0.222
Care for Chronic Conditions
1 .00 1 .0 <= 1.00 < 1 .50 = 40% 0.40
Health Information Tech & Generic Prescribing
0.800 0.50 <= 0.800 < 1 .0 = 20% 0.160
Total 1 .092
T ot a l Weigh t ed Qu a lit y Dom a in Indices
Ov era ll Qu a lit y St a r Ra t ing
1 .092 1 .0 <= 1.092 < 1 .50 =
0.50 1 .0
1 .50 2.0 0
AT THRESHOLD ABOVE THRESHOLD BELOW THRESHOLD

15
Dollar Ratings Description – For 2020, overall dollar sign ratings are calculated for Primary Care , Cardiology, ENT, Obstetrics and Gy necology, and Orthopedics specialties , and Hospitals and Surgery Centers. Dollar sign ratings are based on each provider’s TCI within each specialty compared to set thresholds as described below.
T hresholds – Dollar ratings are assigned as follows.
T ot a l Cost Index (T CI) Dolla r Ra t ing
TCI <0.90 $
0.90 <= TCI < 1 .0 $$
1 .0<= TCI < 1 .1 $$$
TCI >= 1 .10 $$$$
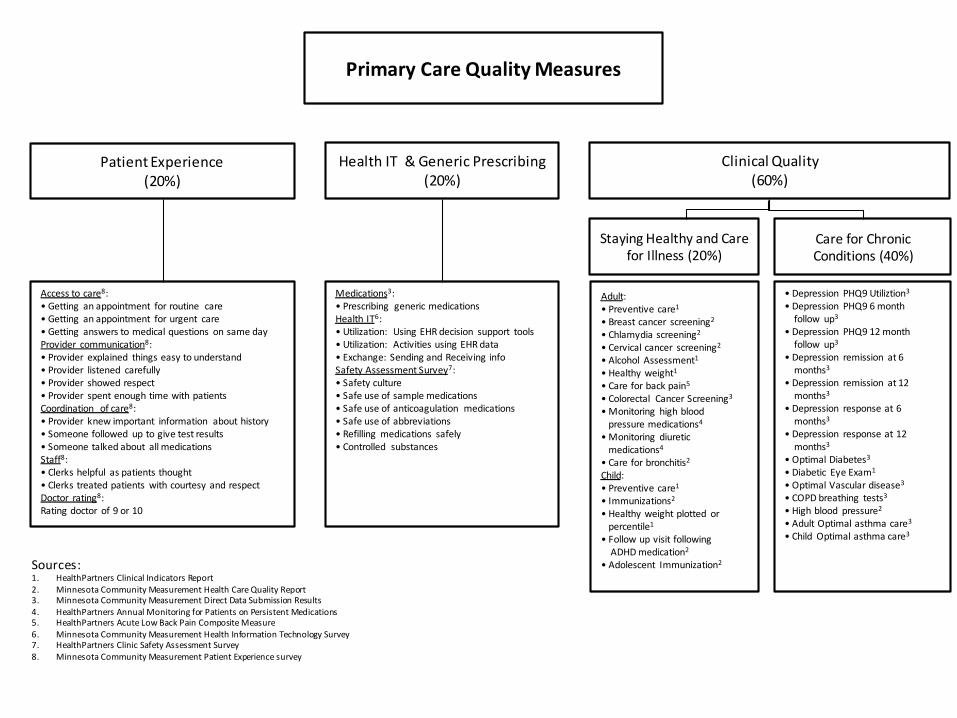
Primary Care Quality Measures
Patient Experience (20%)
Health IT & Generic Prescribing (20%)
Clinical Quality (60%)
Access to care8:• Getting an appointment for routine care• Getting an appointment for urgent care• Getting answers to medical questions on same dayProvider communication8:• Provider explained things easy to understand• Provider listened carefully• Provider showed respect• Provider spent enough time with patientsCoordination of care8:• Provider knew important information about history• Someone followed up to give test results• Someone talked about all medicationsStaff8:• Clerks helpful as patients thought• Clerks treated patients with courtesy and respectDoctor rating8:Rating doctor of 9 or 10
Medications3:• Prescribing generic medicationsHealth IT6: • Utilization: Using EHR decision support tools• Utilization: Activities using EHR data• Exchange: Sending and Receiving infoSafety Assessment Survey7:• Safety culture• Safe use of sample medications• Safe use of anticoagulation medications• Safe use of abbreviations• Refilling medications safely• Controlled substances
Staying Healthy and Care for Illness (20%)
Care for Chronic Conditions (40%)
Adult:• Preventive care1
• Breast cancer screening2
• Chlamydia screening2
• Cervical cancer screening2
• Alcohol Assessment1
• Healthy weight1
• Care for back pain5
• Colorectal Cancer Screening3
• Monitoring high blood pressure medications4
• Monitoring diuretic medications4
• Care for bronchitis2
Child: • Preventive care1
• Immunizations2
• Healthy weight plotted orpercentile1
• Follow up visit followingADHD medication2
• Adolescent Immunization2
• Depression PHQ9 Utiliztion3
• Depression PHQ9 6 month follow up3
• Depression PHQ9 12 month follow up3
• Depression remission at 6months3
• Depression remission at 12months3
• Depression response at 6months3
• Depression response at 12months3
• Optimal Diabetes3
• Diabetic Eye Exam1
• Optimal Vascular disease3
• COPD breathing tests3
• High blood pressure2
• Adult Optimal asthma care3
• Child Optimal asthma care3
Sources:1. HealthPartners Clinical Indicators Report 2. Minnesota Community Measurement Health Care Quality Report3. Minnesota Community Measurement Direct Data Submission Results4. HealthPartners Annual Monitoring for Patients on Persistent Medications5. HealthPartners Acute Low Back Pain Composite Measure6. Minnesota Community Measurement Health Information Technology Survey7. HealthPartners Clinic Safety Assessment Survey8. Minnesota Community Measurement Patient Experience survey
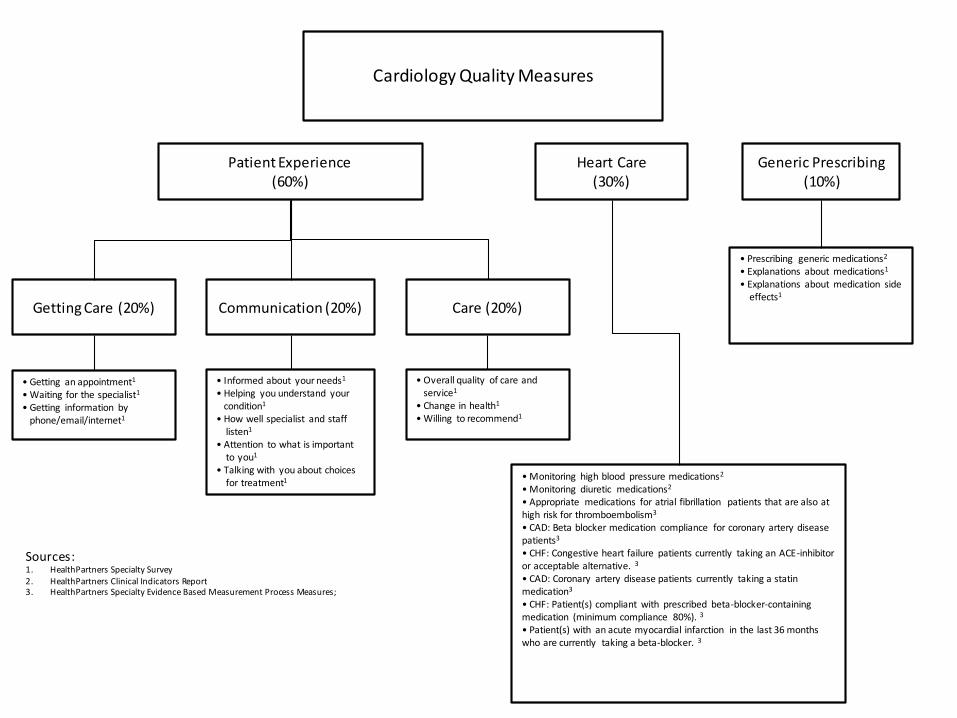
Cardiology Quality Measures
Patient Experience (60%)
Heart Care(30%)
Generic Prescribing(10%)
Getting Care (20%) Communication (20%)
• Getting an appointment1
• Waiting for the specialist1
• Getting information byphone/email/internet1
• Informed about your needs1
• Helping you understand yourcondition1
• How well specialist and stafflisten1
• Attention to what is importantto you1
• Talking with you about choicesfor treatment1 • Monitoring high blood pressure medications2
• Monitoring diuretic medications2
• Appropriate medications for atrial fibrillation patients that are also at high risk for thromboembolism3
• CAD: Beta blocker medication compliance for coronary artery disease patients3
• CHF: Congestive heart failure patients currently taking an ACE-inhibitor or acceptable alternative. 3
• CAD: Coronary artery disease patients currently taking a statinmedication3
• CHF: Patient(s) compliant with prescribed beta-blocker-containing medication (minimum compliance 80%). 3
• Patient(s) with an acute myocardial infarction in the last 36 months who are currently taking a beta-blocker. 3
• Prescribing generic medications2
• Explanations about medications1
• Explanations about medication sideeffects1
Care (20%)
• Overall quality of care andservice1
• Change in health1
• Willing to recommend1
Sources:1. HealthPartners Specialty Survey2. HealthPartners Clinical Indicators Report 3. HealthPartners Specialty Evidence Based Measurement Process Measures;
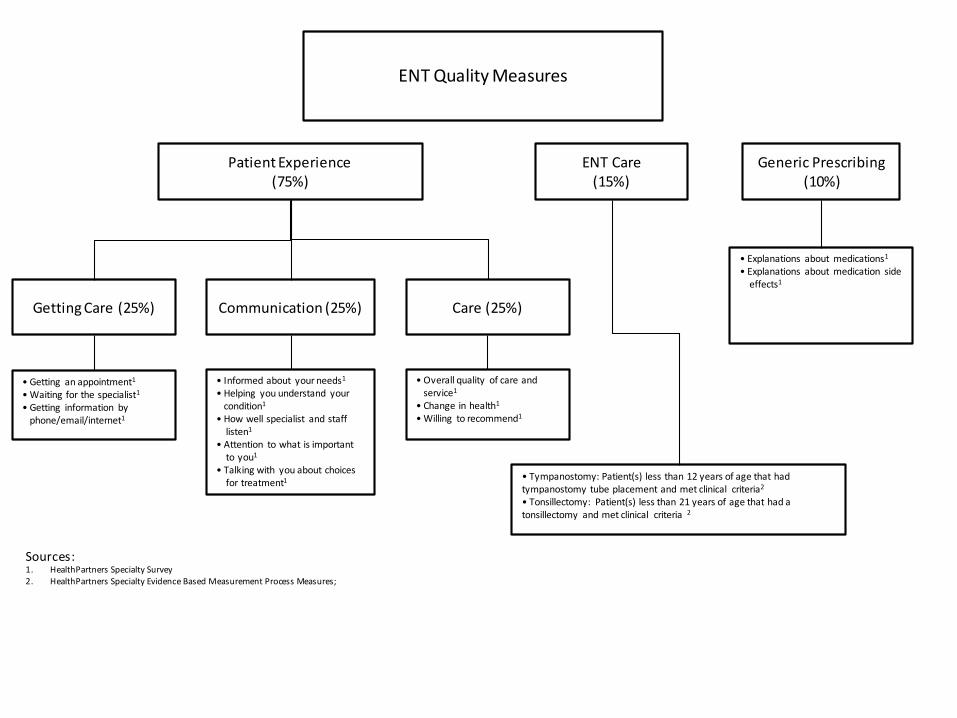
ENT Quality Measures
Patient Experience (75%)
ENT Care(15%)
Generic Prescribing(10%)
Getting Care (25%) Communication (25%)
• Getting an appointment1
• Waiting for the specialist1
• Getting information byphone/email/internet1
• Informed about your needs1
• Helping you understand yourcondition1
• How well specialist and stafflisten1
• Attention to what is importantto you1
• Talking with you about choicesfor treatment1 • Tympanostomy: Patient(s) less than 12 years of age that had
tympanostomy tube placement and met clinical criteria2
• Tonsillectomy: Patient(s) less than 21 years of age that had a tonsillectomy and met clinical criteria 2
• Explanations about medications1
• Explanations about medication sideeffects1
Care (25%)
• Overall quality of care andservice1
• Change in health1
• Willing to recommend1
Sources:1. HealthPartners Specialty Survey2. HealthPartners Specialty Evidence Based Measurement Process Measures;
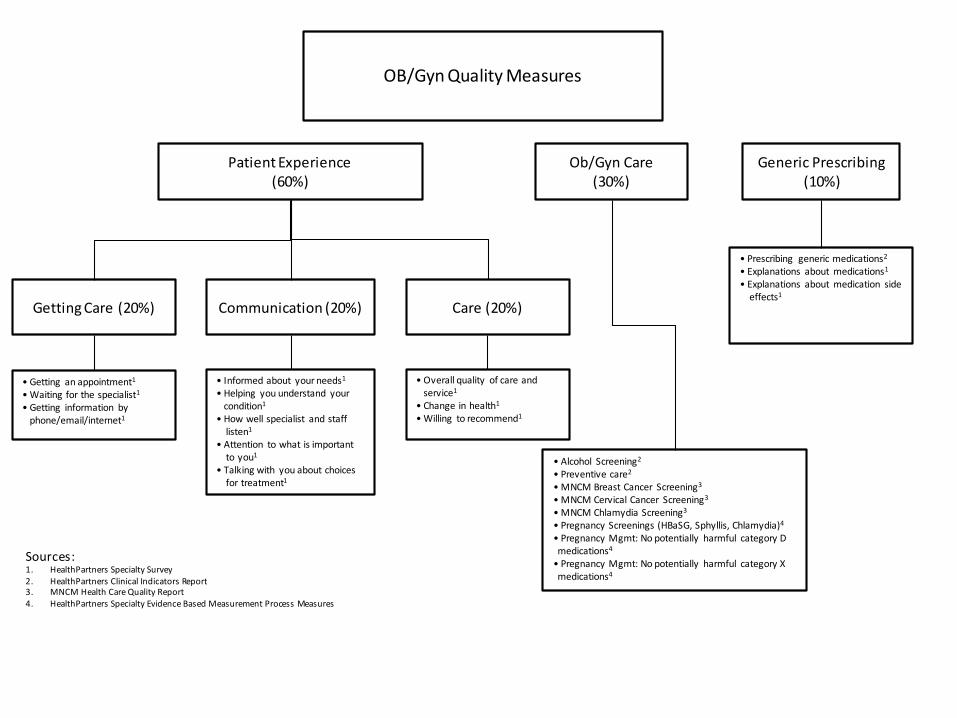
OB/Gyn Quality Measures
Patient Experience (60%)
Ob/Gyn Care(30%)
Generic Prescribing(10%)
Getting Care (20%) Communication (20%)
• Getting an appointment1
• Waiting for the specialist1
• Getting information byphone/email/internet1
• Informed about your needs1
• Helping you understand yourcondition1
• How well specialist and stafflisten1
• Attention to what is importantto you1
• Talking with you about choicesfor treatment1
• Alcohol Screening2
• Preventive care2
• MNCM Breast Cancer Screening3
• MNCM Cervical Cancer Screening3
• MNCM Chlamydia Screening3
• Pregnancy Screenings (HBaSG, Sphyllis, Chlamydia)4
• Pregnancy Mgmt: No potentially harmful category Dmedications4
• Pregnancy Mgmt: No potentially harmful category Xmedications4
• Prescribing generic medications2
• Explanations about medications1
• Explanations about medication sideeffects1
Care (20%)
• Overall quality of care andservice1
• Change in health1
• Willing to recommend1
Sources:1. HealthPartners Specialty Survey2. HealthPartners Clinical Indicators Report 3. MNCM Health Care Quality Report4. HealthPartners Specialty Evidence Based Measurement Process Measures

Orthopedics Quality Measures
Patient Experience (90%)
Generic Prescribing(10%)
Getting Care (30%) Communication (30%)
• Getting an appointment1
• Waiting for the specialist1
• Getting information byphone/email/internet1
• Informed about your needs1
• Helping you understand yourcondition1
• How well specialist and stafflisten1
• Attention to what is importantto you1
• Talking with you about choicesfor treatment1
• Prescribing generic medications2
• Explanations about medications1
• Explanations about medication sideeffects1
Care (30%)
• Overall quality of care andservice1
• Change in health1
• Willing to recommend1
Sources:1. HealthPartners Specialty Survey2. HealthPartners Clinical Indicators Report
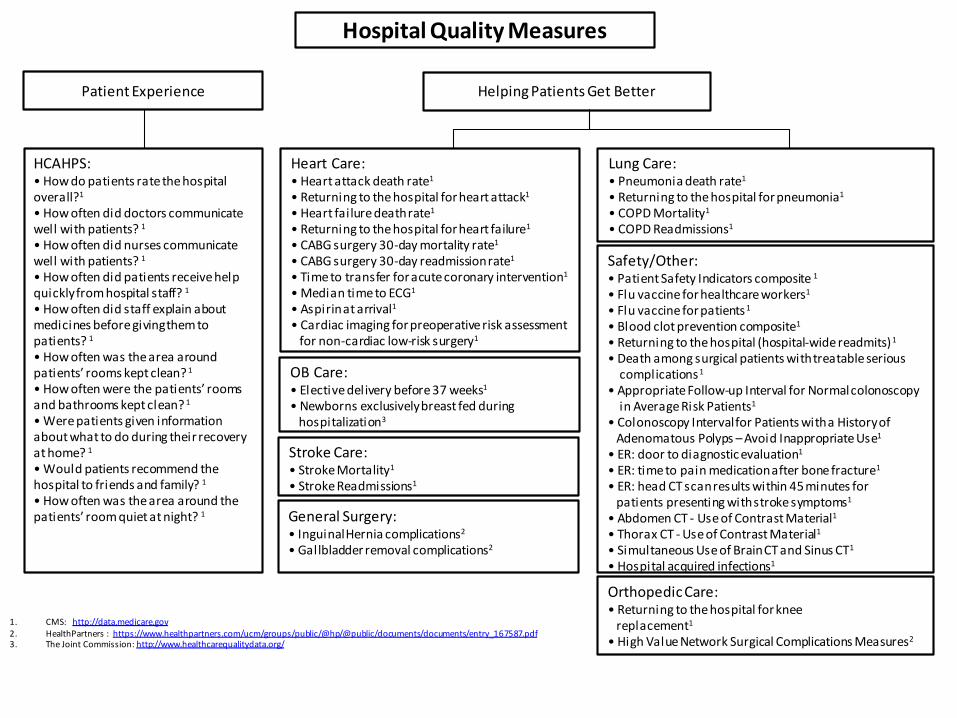
Hospital Quality Measures
Patient Experience Helping Patients Get Better
HCAHPS:• How do patients rate the hospital overall?1
• How often did doctors communicate well with patients? 1
• How often did nurses communicate well with patients? 1
• How often did patients receive help quickly from hospital staff? 1
• How often did staff explain about medicines before giving them to patients? 1
• How often was the area around patients’ rooms kept clean? 1
• How often were the patients’ rooms and bathrooms kept clean? 1
• Were patients given information about what to do during their recovery at home? 1
• Would patients recommend the hospital to friends and family? 1
• How often was the area around the patients’ room quiet at night? 1
Heart Care:• Heart attack death rate1
• Returning to the hospital for heart attack1
• Heart failure death rate1
• Returning to the hospital for heart failure1
• CABG surgery 30-day mortality rate1
• CABG surgery 30-day readmission rate1
• Time to transfer for acute coronary intervention1
• Median time to ECG1
• Aspirin at arrival1
• Cardiac imaging for preoperative risk assessmentfor non-cardiac low-risk surgery1
Lung Care:• Pneumonia death rate1
• Returning to the hospital for pneumonia1
• COPD Mortality1
• COPD Readmissions1
Safety/Other: • Patient Safety Indicators composite 1
• Flu vaccine for healthcare workers1
• Flu vaccine for patients1
• Blood clot prevention composite1
• Returning to the hospital (hospital-wide readmits)1
• Death among surgical patients with treatable serious complications1
• Appropriate Follow-up Interval for Normal colonoscopy in Average Risk Patients1
• Colonoscopy Interval for Patients with a History ofAdenomatous Polyps – Avoid Inappropriate Use1
• ER: door to diagnostic evaluation1
• ER: time to pain medication after bone fracture1
• ER: head CT scan results within 45 minutes forpatients presenting with stroke symptoms1
• Abdomen CT - Use of Contrast Material1
• Thorax CT - Use of Contrast Material1
• Simultaneous Use of Brain CT and Sinus CT1
• Hospital acquired infections1
OB Care:• Elective delivery before 37 weeks1
• Newborns exclusively breast fed during hospitalization3
General Surgery:• Inguinal Hernia complications2
• Gallbladder removal complications2
Orthopedic Care:• Returning to the hospital for knee
replacement1
• High Value Network Surgical Complications Measures2
Stroke Care:• Stroke Mortality1
• Stroke Readmissions1
1. CMS: http://data.medicare.gov2. HealthPartners : https://www.healthpartners.com/ucm/groups/public/@hp/@public/documents/documents/entry_167587.pdf3. The Joint Commission: http://www.healthcarequalitydata.org/


![[XLS] · Web viewJIVAN JYOT CHARITABLE TRUST, PATAN JANTA HOSPITAL-PATAN SAL HOSPITAL (2) CARDIOLOGY (4) CARDIOVASCULAR SURGERY (5) GENITOURINARY SURGERY AARNA SUPERSPECIALITY HOSPITAL](https://img.pdfslide.us/doc/110x75/5ad68f887f8b9a32618b4569/xls-viewjivan-jyot-charitable-trust-patan-janta-hospital-patan-sal-hospital-2.jpg)