Embed Size (px)
Citation preview
Commitment Runs Deep
Climate Change Assessment Report
2 0 2 0 D E V O N E N E R G Y
2 0 2 0 C L I M AT E C H A N G E A S S E S S M E N T R E P O R T
CO N T E N T S
CEO Letter ....................................................................................... 3
About this Report .........................................................................4
Governance and Risk Management ..............................................6
Business Strategy .......................................................................... 9
Climate Change Resilience Analysis .......................................10
Analytical Approach and Results of Assessment ..........12
Climate-Related Risks and Opportunities ..............................20
Risks and Mitigation .............................................................................21
Opportunities ..........................................................................................27
Metrics and Targets ............................................................................. 29
Conclusions ................................................................................................31
Methodological Appendix ................................................................33
Disclaimer ..................................................................................................35
List of Acronyms ....................................................................................36
3
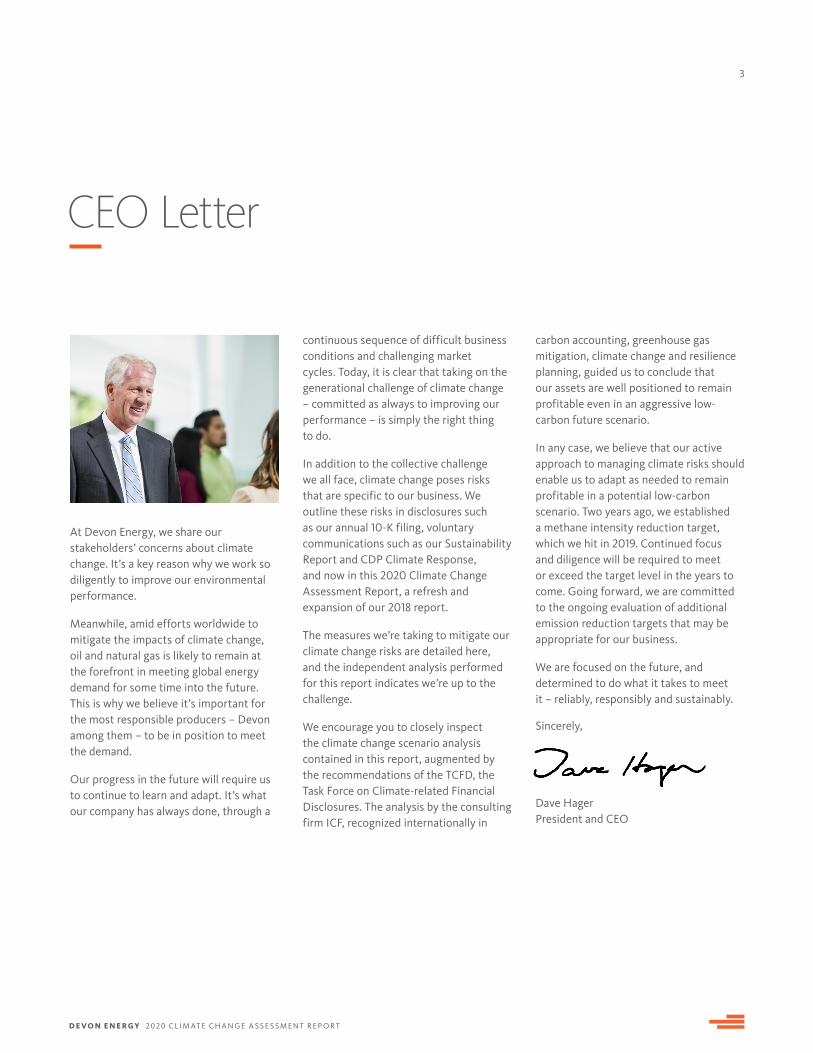
At Devon Energy, we share our stakeholders’ concerns about climate change. It’s a key reason why we work so diligently to improve our environmental performance.
Meanwhile, amid efforts worldwide to mitigate the impacts of climate change, oil and natural gas is likely to remain at the forefront in meeting global energy demand for some time into the future. This is why we believe it’s important for the most responsible producers – Devon among them – to be in position to meet the demand.
Our progress in the future will require us to continue to learn and adapt. It’s what our company has always done, through a
CEO Letter
continuous sequence of difficult business conditions and challenging market cycles. Today, it is clear that taking on the generational challenge of climate change – committed as always to improving our performance – is simply the right thing to do.
In addition to the collective challenge we all face, climate change poses risks that are specific to our business. We outline these risks in disclosures such as our annual 10-K filing, voluntary communications such as our Sustainability Report and CDP Climate Response, and now in this 2020 Climate Change Assessment Report, a refresh and expansion of our 2018 report.
The measures we’re taking to mitigate our climate change risks are detailed here, and the independent analysis performed for this report indicates we’re up to the challenge.
We encourage you to closely inspect the climate change scenario analysis contained in this report, augmented by the recommendations of the TCFD, the Task Force on Climate-related Financial Disclosures. The analysis by the consulting firm ICF, recognized internationally in
carbon accounting, greenhouse gas mitigation, climate change and resilience planning, guided us to conclude that our assets are well positioned to remain profitable even in an aggressive low-carbon future scenario.
In any case, we believe that our active approach to managing climate risks should enable us to adapt as needed to remain profitable in a potential low-carbon scenario. Two years ago, we established a methane intensity reduction target, which we hit in 2019. Continued focus and diligence will be required to meet or exceed the target level in the years to come. Going forward, we are committed to the ongoing evaluation of additional emission reduction targets that may be appropriate for our business.
We are focused on the future, and determined to do what it takes to meet it – reliably, responsibly and sustainably.
Sincerely,
Dave Hager President and CEO
D E V O N E N E R G Y 2020 C L I M AT E C H A N G E A S S E S S M E N T R E P O R T
4
About this Report
Devon and its stakeholders are committed to understanding the potential impacts of climate change on the company’s long-range business plans. Since 2018, Devon’s risk management includes formal and ongoing consideration of the potential quantifiable effects of climate change on the company’s portfolio. In 2018, Devon retained ICF1 to help assess the company’s oil and natural gas portfolio’s resilience in the face of potential impacts of climate policy on oil, natural gas, and natural gas liquids (NGL) demand, production, and prices. During that assessment, Devon evaluated several possible future climate change scenarios in order to quantify the potential risks to Devon’s oil and natural gas portfolio and long-range business plan from a possible carbon-constrained future. Devon's 2018 analysis used the IEA New Policies Scenario, the IEA Sustainalbe Development Scenario, and two pricing scenarios developed by ICF for this assessment.
1 With more than 65 offices around the globe, ICF is internationally recognized for its consulting in carbon accounting, greenhouse gas mitigation, climate change, and resilience planning. ICF was retained as an independent consultant to generate pricing scenarios.
2 Global Affairs Associates (GAA) is a boutique consulting firm specialized in sustainability, ESG, and climate reporting and communications.
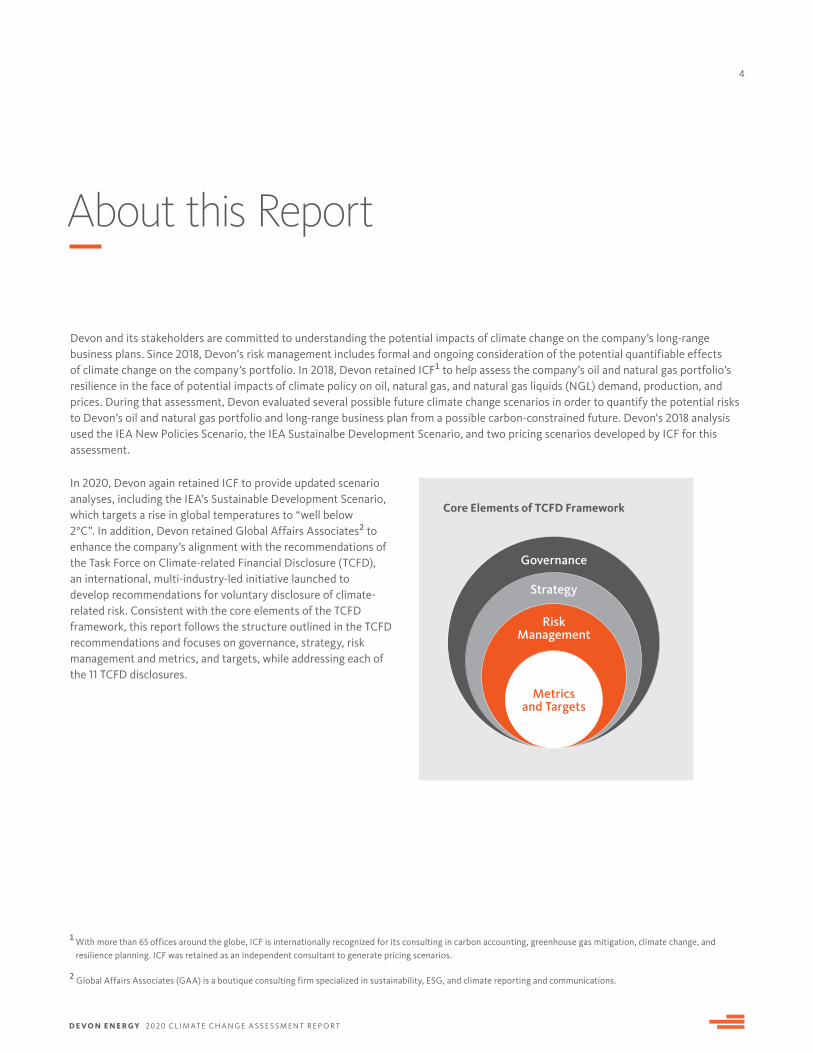
Core Elements of TCFD Framework
Governance
Strategy
Risk Management
Metrics and Targets
In 2020, Devon again retained ICF to provide updated scenario analyses, including the IEA’s Sustainable Development Scenario, which targets a rise in global temperatures to “well below 2°C”. In addition, Devon retained Global Affairs Associates2 to enhance the company’s alignment with the recommendations of the Task Force on Climate-related Financial Disclosure (TCFD), an international, multi-industry-led initiative launched to develop recommendations for voluntary disclosure of climate-related risk. Consistent with the core elements of the TCFD framework, this report follows the structure outlined in the TCFD recommendations and focuses on governance, strategy, risk management and metrics, and targets, while addressing each of the 11 TCFD disclosures.
D E V O N E N E R G Y 2020 C L I M AT E C H A N G E A S S E S S M E N T R E P O R T
5
About Devon
Devon Energy Corp. (NYSE: DVN) is an independent energy company engaged in oil and natural gas exploration and production. Devon is among the largest U.S.-based independent producers and is included in the S&P 500 index. The company is based in Oklahoma City with operations concentrated in various onshore areas in the U.S. The company’s portfolio of oil and natural gas properties provides stable, environmentally responsible production and a platform for future growth. For 2019, the company’s production mix for retained assets was 31% natural gas and 69% oil and liquids such as propane, butane, and ethane. Devon’s mission is to be a results-oriented oil and natural gas company that creates value for stakeholders in an employee culture of optimism, teamwork, creativity, and resourcefulness, and by doing business in an open and ethical manner. For more information about Devon, please visit www.devonenergy.com
A B O U T T H I S R E P O R T
KEY CONCLUSIONS OF THIS REPORT
• In carbon-constrained future scenarios, oil and natural gas remain crucial to meeting global energy demand and North American oil and natural gas production plays a large role in meeting that demand. Low-cost oil and natural gas resources in the basins in which Devon operates are expected to be some of the most resilient in the aggressive low-carbon scenarios modeled in this report.
• Model results indicate that aggressive low-carbon scenarios will reduce oil, natural gas, and NGL prices by 18-50%; even in such low carbon scenarios, the model results suggest that Devon’s current portfolio is likely to be resilient to these potential price impacts.
• Based on the comparison of projected regional price impacts with estimated regional breakeven prices for each of Devon’s major assets, the company concludes that its assets are likely to be well-positioned to remain profitable even in an aggressive low-carbon scenario. Furthermore, the changes in Devon’s portfolio – exiting Western Canada and the Barnett – since the 2018 analysis have made it more resilient in low oil and natural gas price scenarios.
• Devon's disclosure practices for the governance, management, and disclosure of climate-related risks and opportunities are aligned with the recommendations of the TCFD.
D E V O N E N E R G Y 2020 C L I M AT E C H A N G E A S S E S S M E N T R E P O R T
6
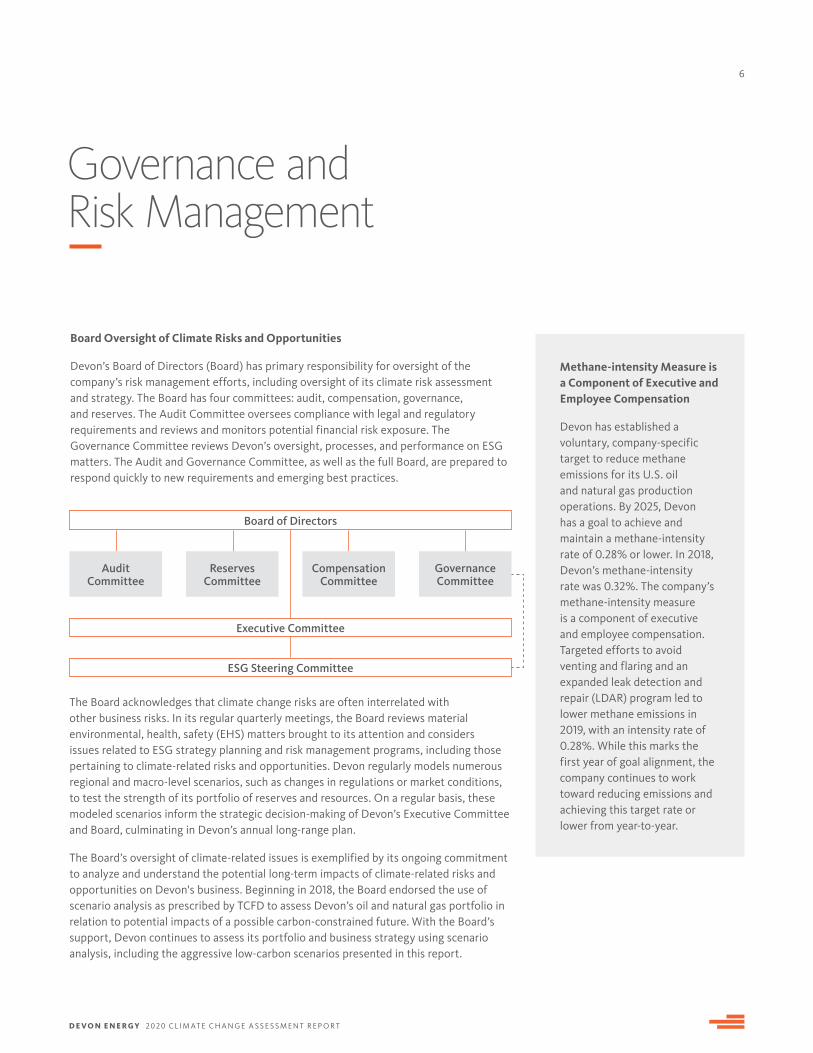
Board Oversight of Climate Risks and Opportunities
Devon’s Board of Directors (Board) has primary responsibility for oversight of the company’s risk management efforts, including oversight of its climate risk assessment and strategy. The Board has four committees: audit, compensation, governance, and reserves. The Audit Committee oversees compliance with legal and regulatory requirements and reviews and monitors potential financial risk exposure. The Governance Committee reviews Devon’s oversight, processes, and performance on ESG matters. The Audit and Governance Committee, as well as the full Board, are prepared to respond quickly to new requirements and emerging best practices.
Methane-intensity Measure is a Component of Executive and Employee Compensation
Devon has established a voluntary, company-specific target to reduce methane emissions for its U.S. oil and natural gas production operations. By 2025, Devon has a goal to achieve and maintain a methane-intensity rate of 0.28% or lower. In 2018, Devon’s methane-intensity rate was 0.32%. The company’s methane-intensity measure is a component of executive and employee compensation. Targeted efforts to avoid venting and flaring and an expanded leak detection and repair (LDAR) program led to lower methane emissions in 2019, with an intensity rate of 0.28%. While this marks the first year of goal alignment, the company continues to work toward reducing emissions and achieving this target rate or lower from year-to-year.
Governance and Risk Management
The Board acknowledges that climate change risks are often interrelated with other business risks. In its regular quarterly meetings, the Board reviews material environmental, health, safety (EHS) matters brought to its attention and considers issues related to ESG strategy planning and risk management programs, including those pertaining to climate-related risks and opportunities. Devon regularly models numerous regional and macro-level scenarios, such as changes in regulations or market conditions, to test the strength of its portfolio of reserves and resources. On a regular basis, these modeled scenarios inform the strategic decision-making of Devon’s Executive Committee and Board, culminating in Devon’s annual long-range plan.
The Board’s oversight of climate-related issues is exemplified by its ongoing commitment to analyze and understand the potential long-term impacts of climate-related risks and opportunities on Devon's business. Beginning in 2018, the Board endorsed the use of scenario analysis as prescribed by TCFD to assess Devon’s oil and natural gas portfolio in relation to potential impacts of a possible carbon-constrained future. With the Board’s support, Devon continues to assess its portfolio and business strategy using scenario analysis, including the aggressive low-carbon scenarios presented in this report.
Board of Directors
Audit Committee
Reserves Committee
Compensation Committee
Governance Committee
Executive Committee
ESG Steering Committee
D E V O N E N E R G Y 2020 C L I M AT E C H A N G E A S S E S S M E N T R E P O R T
7
Management's Role
The company’s management of ESG risks and opportunities, including climate-related risks, starts at the top. Devon’s Chief Legal and Administrative Officer manages climate-related risks and opportunities with assistance from the Executive Vice President of Exploration & Production. Both of these roles report directly to Devon’s CEO and are liaisons to the Board.
In order to provide support for Devon's ongoing ESG efforts, executive leadership established an ESG Steering Committee, which helps senior leaders remain focused, informed and engaged on ESG matters that influence the company’s business planning, strategy, and operations. The Executive Vice President of Exploration & Production is the executive sponsor and an active member of the ESG Steering Committee.
The ESG Steering Committee supports Devon’s ongoing commitment to EHS, sustainability, corporate responsibility, and governance. The Committee assists senior management in setting and implementing strategy relating to ESG matters, including monitoring climate change and ESG matters, and overseeing communications with employees, investors, and other stakeholders with respect to ESG matters. On a regular basis, the work of the ESG Steering Committee is reported to the Board and executive leadership.
Approach to Risk Management
Primary responsibility for risk oversight lies with Devon’s Board. On a regular basis, the Board assesses business risks and determines whether the company’s risk-management programs are appropriately designed and implemented to address them. The four standing Board committees consider the risks inherent in their areas of oversight and report regularly to the full Board. The Devon management team is, in turn, responsible for executing the risk-management directives of the Board and its committees, including overseeing and reporting on Devon’s day-to-day efforts to manage risk. Emerging climate-related risks are reviewed frequently and integrated into the company’s risk assessment system as deemed appropriate.
G OV E R N A N C E A N D R I S K M A N AG E M E N T
Senior Executive Dedicated to Climate Policy: VP Policy and Government Affairs
Climate-related public policy issues are fully integrated into Devon’s internal processes. In order to ensure that the company maintains strong internal alignment and focus related to climate change-related public policies, Devon appointed its Vice President, Policy and Government Affairs to lead and coordinate the development of all climate-related policy and advocacy strategies across the company. With a senior executive dedicated to climate change policy, Devon can comprehensively inform its position on the issues and engage thoughtfully and constructively with its trade associations and other external stakeholders on developing industry-led GHG emissions reduction solutions and designing public policies that address the risks of climate change.
D E V O N E N E R G Y 2020 C L I M AT E C H A N G E A S S E S S M E N T R E P O R T
8G OV E R N A N C E A N D R I S K M A N AG E M E N T
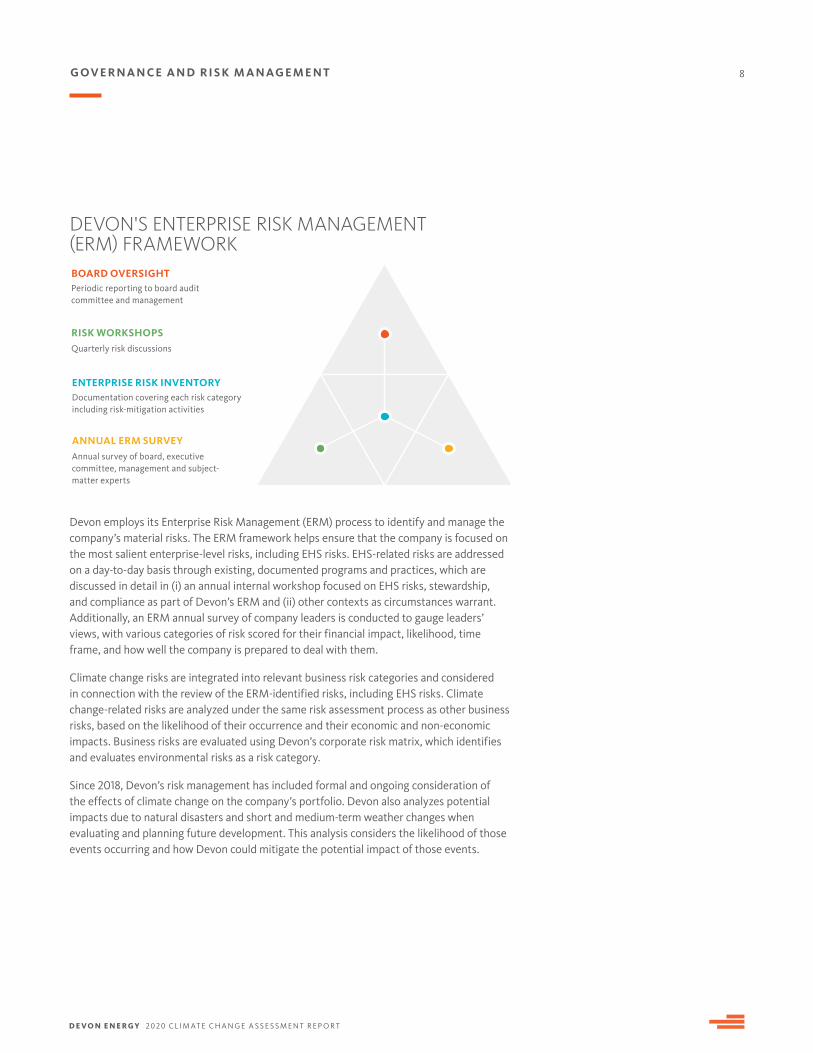
Devon employs its Enterprise Risk Management (ERM) process to identify and manage the company’s material risks. The ERM framework helps ensure that the company is focused on the most salient enterprise-level risks, including EHS risks. EHS-related risks are addressed on a day-to-day basis through existing, documented programs and practices, which are discussed in detail in (i) an annual internal workshop focused on EHS risks, stewardship, and compliance as part of Devon’s ERM and (ii) other contexts as circumstances warrant. Additionally, an ERM annual survey of company leaders is conducted to gauge leaders’ views, with various categories of risk scored for their financial impact, likelihood, time frame, and how well the company is prepared to deal with them.
Climate change risks are integrated into relevant business risk categories and considered in connection with the review of the ERM-identified risks, including EHS risks. Climate change-related risks are analyzed under the same risk assessment process as other business risks, based on the likelihood of their occurrence and their economic and non-economic impacts. Business risks are evaluated using Devon’s corporate risk matrix, which identifies and evaluates environmental risks as a risk category.
Since 2018, Devon’s risk management has included formal and ongoing consideration of the effects of climate change on the company’s portfolio. Devon also analyzes potential impacts due to natural disasters and short and medium-term weather changes when evaluating and planning future development. This analysis considers the likelihood of those events occurring and how Devon could mitigate the potential impact of those events.
DEVON'S ENTERPRISE RISK MANAGEMENT (ERM) FRAMEWORKBOARD OVERSIGHT
RISK WORKSHOPS
ENTERPRISE RISK INVENTORY
ANNUAL ERM SURVEY
Periodic reporting to board audit committee and management
Documentation covering each risk category including risk-mitigation activities
Quarterly risk discussions
Annual survey of board, executive committee, management and subject-matter experts
D E V O N E N E R G Y 2020 C L I M AT E C H A N G E A S S E S S M E N T R E P O R T
9
Business Strategy
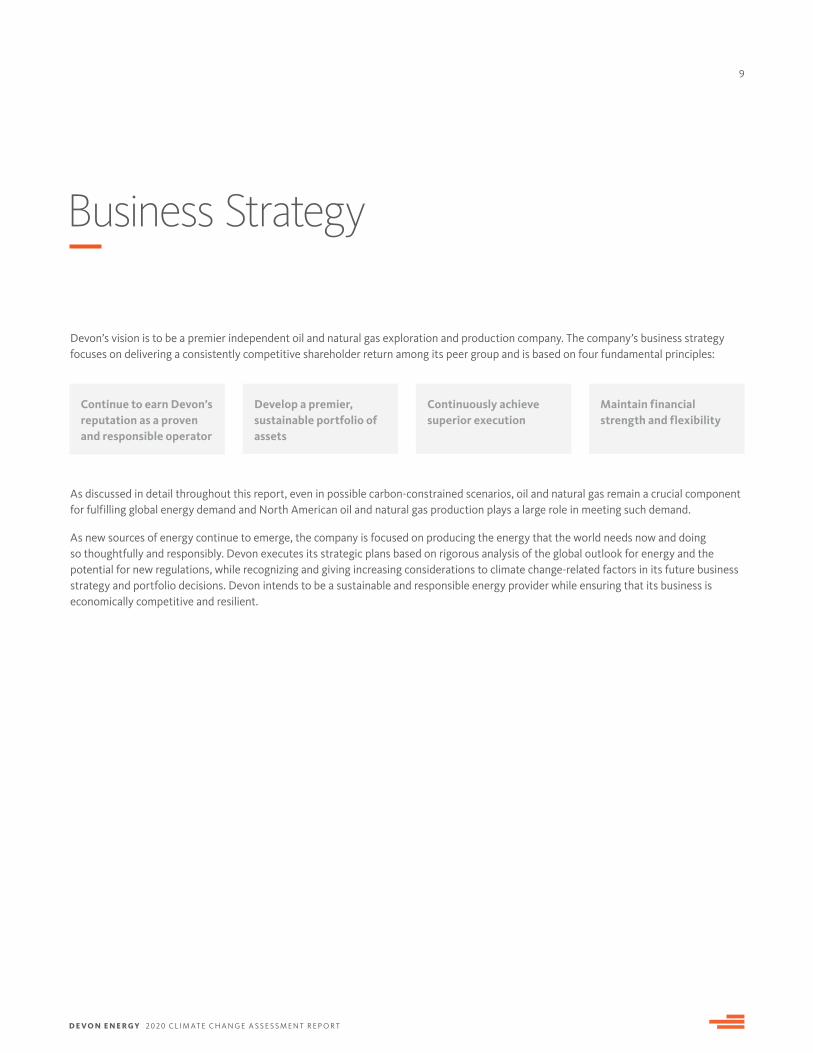
Devon’s vision is to be a premier independent oil and natural gas exploration and production company. The company’s business strategy focuses on delivering a consistently competitive shareholder return among its peer group and is based on four fundamental principles:
As discussed in detail throughout this report, even in possible carbon-constrained scenarios, oil and natural gas remain a crucial component for fulfilling global energy demand and North American oil and natural gas production plays a large role in meeting such demand.
As new sources of energy continue to emerge, the company is focused on producing the energy that the world needs now and doing so thoughtfully and responsibly. Devon executes its strategic plans based on rigorous analysis of the global outlook for energy and the potential for new regulations, while recognizing and giving increasing considerations to climate change-related factors in its future business strategy and portfolio decisions. Devon intends to be a sustainable and responsible energy provider while ensuring that its business is economically competitive and resilient.
Continue to earn Devon’s reputation as a proven and responsible operator
Develop a premier, sustainable portfolio of assets
Continuously achieve superior execution
Maintain financial strength and flexibility
D E V O N E N E R G Y 2020 C L I M AT E C H A N G E A S S E S S M E N T R E P O R T
10
Methodology and Analysis
This report considers base case scenarios from both ICF and the IEA for the oil and natural gas market and compares each base case scenario3 to an alternate carbon-constrained future scenario, in which demand for oil and natural gas is substantially reduced. Each scenario has been analyzed for this report by the consulting firm, ICF, with modeling conducted for oil, natural gas, and propane (the latter as a proxy for NGLs). The first scenario is based on ICF’s assumptions, and the second is based on widely-referenced projections by the IEA. Because the two scenarios differ in their baseline assumptions, analyzing both of them provides a level of robustness against alternative future scenarios. To model the impacts of a carbon-constrained future, the analysis applies, under both scenarios, IEA’s assumptions about demand for oil and natural gas under aggressive carbon-reduction policies. The carbon-constrained scenarios include emissions reductions on the level required to achieve the goals of the Paris Agreement and align with an emissions pathway “fully aligned with the Paris Agreement by holding the rise in global temperatures to ‘well below 2°C … and pursuing efforts to limit [it] to 1.5°C.’”4 IEA’s Sustainable Development Scenario is fully aligned with the Paris Agreement. For more detail on methodology, please refer to the appendix of this report.
This section provides the results of an analysis of the potential impacts to Devon’s oil and natural gas reserves and resources under a scenario of reduction in demand due to various factors including carbon restrictions and related rules or commitments adopted by governments consistent with a path to global average temperature increase well below 2 degrees Celsius (i.e., a low-demand and low-price environment).
In the carbon-constrained scenarios, demand for oil and natural gas is substantially reduced. However, even in such carbon-constrained scenarios, oil and natural gas remain a crucial component for fulfilling global energy demand and North American oil and natural gas production plays a proportionally larger role in meeting that demand. Accordingly, Devon remains confident that its asset portfolio is aligned to (i) remain economically profitable in a range of future climate change scenarios and (ii) provide oil and natural gas in an environmentally responsible way.
A Continued Role for North American Oil and Natural Gas in a Low-Carbon World
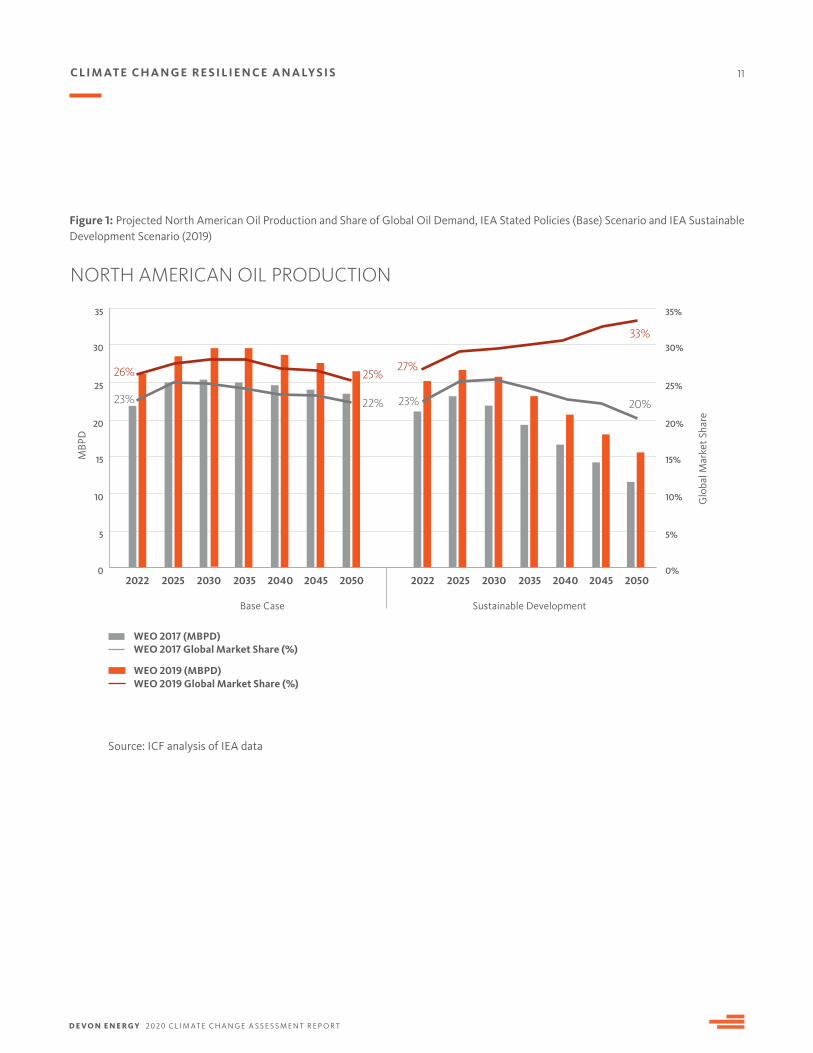
Under the assumption of aggressive decarbonization policy, forecasters still project a central role for oil and natural gas as part of the global energy mix. In the IEA Sustainable Development Scenario, oil still supplies 17% of world primary energy demand in 2050 while natural gas supplies 25%. In such scenario, oil and natural gas sourced in North America plays a large role in meeting remaining global demand. Figure 1 shows an extrapolation of the IEA’s 2019 World Energy Outlook (WEO) projections for North American oil production through 2050 and the proportion of global oil demand that is met by that production. In terms of both total production and global market share, forecasted North American production is higher than in the IEA 2017 WEO. Notably, in the IEA Sustainable Development Scenario used for this updated analysis, North American oil production meets one third of global oil demand. According to the IEA 2019 WEO, this is because “faced with uncertainty about the future, tight oil (produced in the U.S.) could be a logical choice for many looking to produce oil, as its high decline rates reduce the need for a long-term outlook on demand and prices.”5
Climate Change Resilience Analysis
3 The IEA World Energy Outlook State Policies scenario is considered the IEA base case for the purposes of this analysis since it includes current policy as well and policy intentions and targets globally.
4 IEA World Energy Outlook 2019, pg. 23-24.
5 IEA World Energy Outlook 2019, pg. 161.
D E V O N E N E R G Y 2020 C L I M AT E C H A N G E A S S E S S M E N T R E P O R T
11C L I M AT E C H A N G E R E S I L I E N C E A N A LY S I S
Figure 1: Projected North American Oil Production and Share of Global Oil Demand, IEA Stated Policies (Base) Scenario and IEA Sustainable Development Scenario (2019)
NORTH AMERICAN OIL PRODUCTION
0%
5%
10%
15%
20%
25%
30%
0
5
10
15
20
25
30
35 35%
2022 2025 2030 2035 2040 2045 2050 2022 2025 2030 2035 2040 2045 2050
Glo
bal M
arke
t Sha
re
MBP
D
Base Case Sustainable Development
23% 23%22%
26% 25%27%
33%
20%
WEO 2017 (MBPD)
WEO 2019 (MBPD)
WEO 2017 Global Market Share (%)
WEO 2019 Global Market Share (%)
Source: ICF analysis of IEA data
D E V O N E N E R G Y 2020 C L I M AT E C H A N G E A S S E S S M E N T R E P O R T
12
Analytical Approach and Results of Assessment
Base Case Scenarios
ICF Base Case
This scenario represents ICF’s standard baseline energy market scenario. Its assumptions fall in line with many other projections from industry consultants and banks. It assumes robust growth in demand for natural gas in North America (21% growth between 2022 and 2050), including liquefied natural gas (LNG) exports and pipeline exports to Mexico. Global oil market growth is assumed from the IEA forecast. Regarding clean energy targets and carbon pricing, ICF’s Base Case accounts for U.S. and Canada territorial, state, and local Renewable Portfolio Standard targets and other legislation aimed at reducing greenhouse gas emissions. The Base Case also assumes a regional, probability-weighted CO2 price for the power sector with a national carbon price that begins in 2026.6 At these levels, the carbon prices further exhibit the advantages of natural gas over coal as a source of non-intermittent power in the U.S. In ICF’s Base Case, natural gas demand from the power sector increases throughout the forecast as demand pivots from coal to gas and natural gas complements the deployment of renewable power generation by providing a flexible source of power.
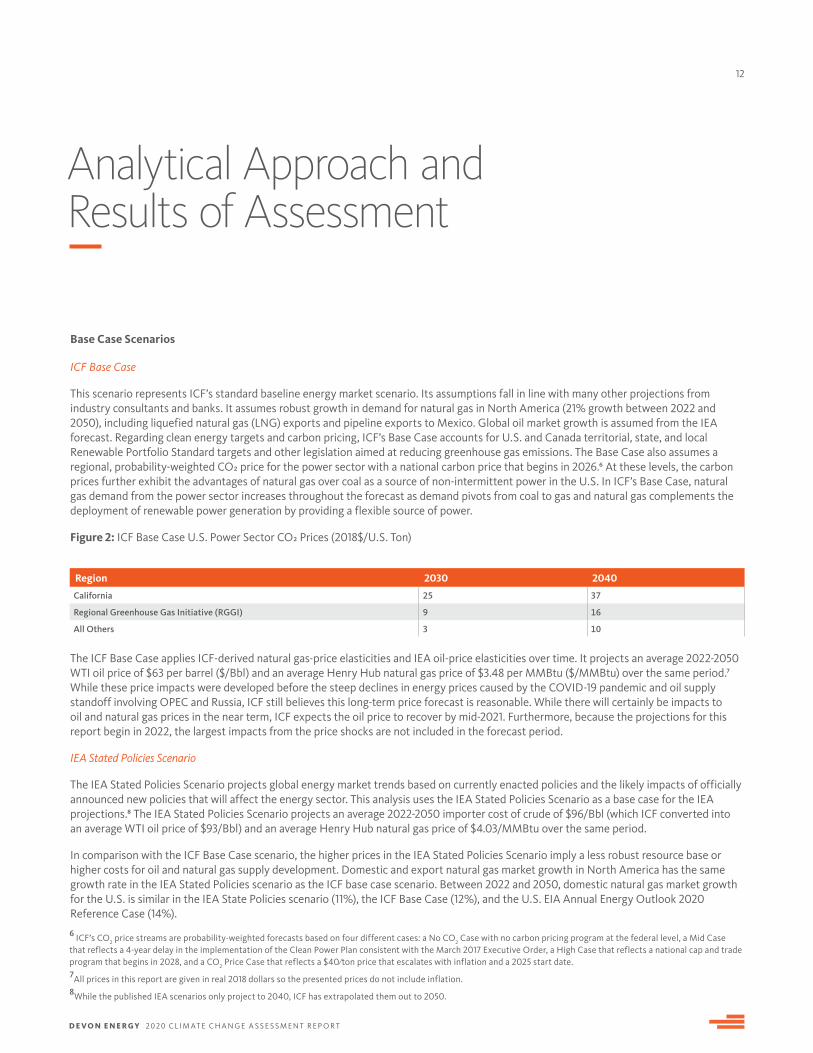
Figure 2: ICF Base Case U.S. Power Sector CO2 Prices (2018$/U.S. Ton)
The ICF Base Case applies ICF-derived natural gas-price elasticities and IEA oil-price elasticities over time. It projects an average 2022-2050 WTI oil price of $63 per barrel ($/Bbl) and an average Henry Hub natural gas price of $3.48 per MMBtu ($/MMBtu) over the same period.7 While these price impacts were developed before the steep declines in energy prices caused by the COVID-19 pandemic and oil supply standoff involving OPEC and Russia, ICF still believes this long-term price forecast is reasonable. While there will certainly be impacts to oil and natural gas prices in the near term, ICF expects the oil price to recover by mid-2021. Furthermore, because the projections for this report begin in 2022, the largest impacts from the price shocks are not included in the forecast period.
IEA Stated Policies Scenario
The IEA Stated Policies Scenario projects global energy market trends based on currently enacted policies and the likely impacts of officially announced new policies that will affect the energy sector. This analysis uses the IEA Stated Policies Scenario as a base case for the IEA projections.8 The IEA Stated Policies Scenario projects an average 2022-2050 importer cost of crude of $96/Bbl (which ICF converted into an average WTI oil price of $93/Bbl) and an average Henry Hub natural gas price of $4.03/MMBtu over the same period.
In comparison with the ICF Base Case scenario, the higher prices in the IEA Stated Policies Scenario imply a less robust resource base or higher costs for oil and natural gas supply development. Domestic and export natural gas market growth in North America has the same growth rate in the IEA Stated Policies scenario as the ICF base case scenario. Between 2022 and 2050, domestic natural gas market growth for the U.S. is similar in the IEA State Policies scenario (11%), the ICF Base Case (12%), and the U.S. EIA Annual Energy Outlook 2020 Reference Case (14%).
Region 2030 2040
California 25 37
Regional Greenhouse Gas Initiative (RGGI) 9 16
All Others 3 10
6 ICF’s CO2 price streams are probability-weighted forecasts based on four different cases: a No CO2 Case with no carbon pricing program at the federal level, a Mid Case that reflects a 4-year delay in the implementation of the Clean Power Plan consistent with the March 2017 Executive Order, a High Case that reflects a national cap and trade program that begins in 2028, and a CO2 Price Case that reflects a $40/ton price that escalates with inflation and a 2025 start date.7All prices in this report are given in real 2018 dollars so the presented prices do not include inflation.8While the published IEA scenarios only project to 2040, ICF has extrapolated them out to 2050.
D E V O N E N E R G Y 2020 C L I M AT E C H A N G E A S S E S S M E N T R E P O R T
13A N A LY T I C A L A P P R OAC H A N D R E S U LT S O F A S S E S S M E N T
Carbon-Constrained Scenarios
IEA Sustainable Development Scenario
ICF analyzed the price impacts of IEA’s Sustainable Development Scenario, the primary carbon-reduction scenario in IEA’s 2019 WEO. In the IEA Sustainable Development Scenario, markets are constrained by policies that achieve three objectives:
• An early peak and rapid subsequent reductions in emissions, in line with achieving the goals of the Paris Agreement (Sustainable Development Goal [SDG] 13).
• Universal access to modern energy by 2030, including electricity and clean cooking (SDG 7).
• A dramatic reduction in energy-related air pollution and the associated impacts on public health (SDG 3.9).
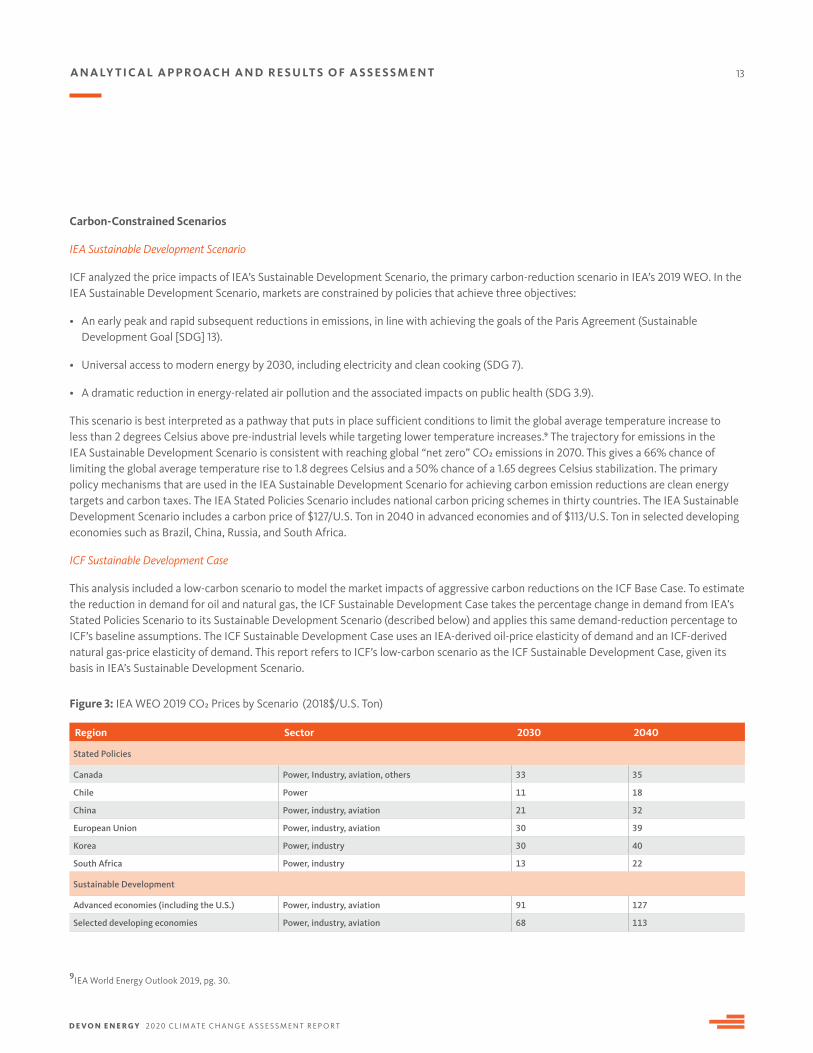
This scenario is best interpreted as a pathway that puts in place sufficient conditions to limit the global average temperature increase to less than 2 degrees Celsius above pre-industrial levels while targeting lower temperature increases.9 The trajectory for emissions in the IEA Sustainable Development Scenario is consistent with reaching global “net zero” CO2 emissions in 2070. This gives a 66% chance of limiting the global average temperature rise to 1.8 degrees Celsius and a 50% chance of a 1.65 degrees Celsius stabilization. The primary policy mechanisms that are used in the IEA Sustainable Development Scenario for achieving carbon emission reductions are clean energy targets and carbon taxes. The IEA Stated Policies Scenario includes national carbon pricing schemes in thirty countries. The IEA Sustainable Development Scenario includes a carbon price of $127/U.S. Ton in 2040 in advanced economies and of $113/U.S. Ton in selected developing economies such as Brazil, China, Russia, and South Africa.
ICF Sustainable Development Case
This analysis included a low-carbon scenario to model the market impacts of aggressive carbon reductions on the ICF Base Case. To estimate the reduction in demand for oil and natural gas, the ICF Sustainable Development Case takes the percentage change in demand from IEA’s Stated Policies Scenario to its Sustainable Development Scenario (described below) and applies this same demand-reduction percentage to ICF’s baseline assumptions. The ICF Sustainable Development Case uses an IEA-derived oil-price elasticity of demand and an ICF-derived natural gas-price elasticity of demand. This report refers to ICF’s low-carbon scenario as the ICF Sustainable Development Case, given its basis in IEA’s Sustainable Development Scenario.
Figure 3: IEA WEO 2019 CO2 Prices by Scenario (2018$/U.S. Ton)
Region Sector 2030 2040
Stated Policies
Canada Power, Industry, aviation, others 33 35
Chile Power 11 18
China Power, industry, aviation 21 32
European Union Power, industry, aviation 30 39
Korea Power, industry 30 40
South Africa Power, industry 13 22
Sustainable Development
Advanced economies (including the U.S.) Power, industry, aviation 91 127
Selected developing economies Power, industry, aviation 68 113
9IEA World Energy Outlook 2019, pg. 30.
D E V O N E N E R G Y 2020 C L I M AT E C H A N G E A S S E S S M E N T R E P O R T
14A N A LY T I C A L A P P R OAC H A N D R E S U LT S O F A S S E S S M E N T
It is important to note that limiting global temperature rise to 2 degrees Celsius or less is dependent on global greenhouse gas emissions trends through 2100, while the IEA Sustainable Development Scenario only provides forecast data through 2040. Because of this, ICF assumed for this report that the trends in declining oil and natural gas demand will continue through 2050 and further declines in demand may be necessary after 2050 as well.
Assessment Results
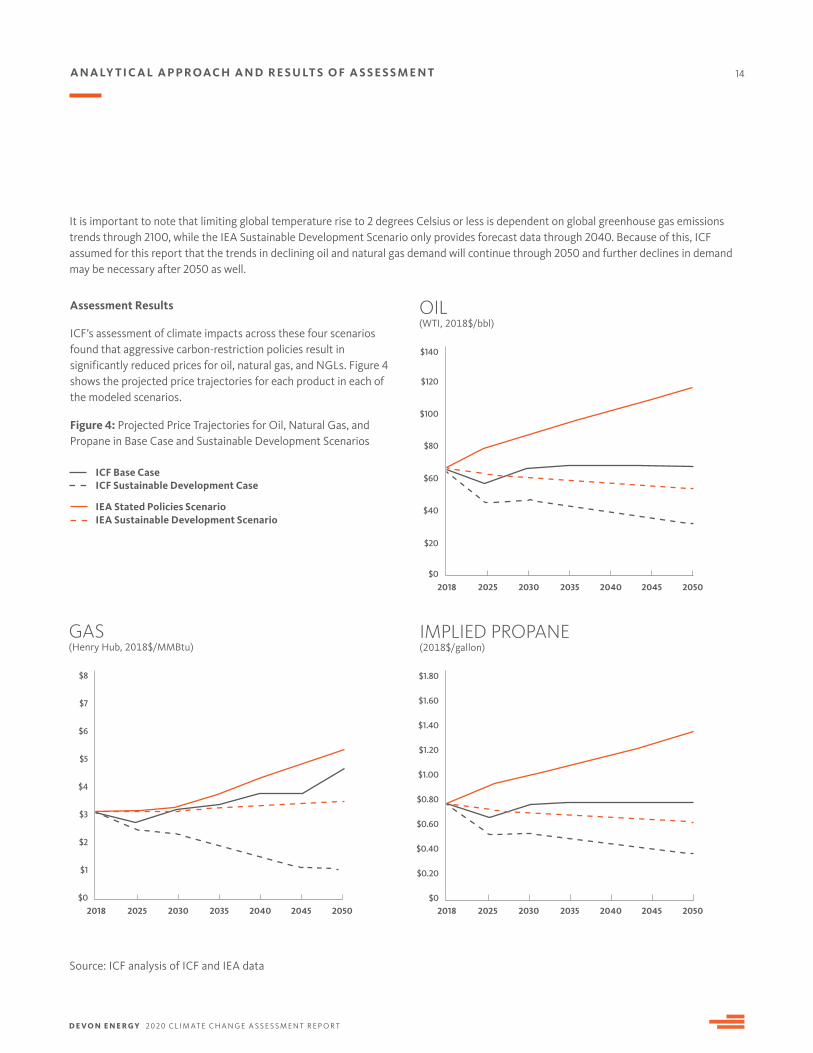
ICF’s assessment of climate impacts across these four scenarios found that aggressive carbon-restriction policies result in significantly reduced prices for oil, natural gas, and NGLs. Figure 4 shows the projected price trajectories for each product in each of the modeled scenarios.
Figure 4: Projected Price Trajectories for Oil, Natural Gas, and Propane in Base Case and Sustainable Development Scenarios
OIL(WTI, 2018$/bbl)
2018 2025 2030 2035 2040 2045 2050
$120
$140
$100
$80
$60
$40
$20
$0
GAS(Henry Hub, 2018$/MMBtu)
$6
$8
$7
$5
$4
$3
$2
$1
$0
IMPLIED PROPANE(2018$/gallon)
$1.40
$1.60
$1.80
$1.20
$1.00
$0.80
$0.60
$0.40
$0.20
$0
Source: ICF analysis of ICF and IEA data
ICF Base Case
IEA Stated Policies Scenario
ICF Sustainable Development Case
IEA Sustainable Development Scenario
2018 2025 2030 2035 2040 2045 20502018 2025 2030 2035 2040 2045 2050
D E V O N E N E R G Y 2020 C L I M AT E C H A N G E A S S E S S M E N T R E P O R T
15
OIL(WTI, 2018$/bbl)
ICF 2020 IEA 2019
$120
$100
$80
$60
$40
$20
$0
-36%-38%
GAS(Henry Hub, 2018$/MMBtu)
ICF 2020 IEA 2019
$6
$4
$2
$0
-50%-18%
IMPLIED PROPANE(2018$/gallon)
ICF 2020 IEA 2019
$1.40
$1.20
$1.00
$0.80
$0.60
$0.40
$0.20
$0
-36%-38%
A N A LY T I C A L A P P R OAC H A N D R E S U LT S O F A S S E S S M E N T
Base Case (ICF) / Stated Policies Scenario (IEA)
Sustainable Development Case (ICF) / Sustainable Developemnt Scenario (IEA)
Source: ICF analysis of ICF and IEA data
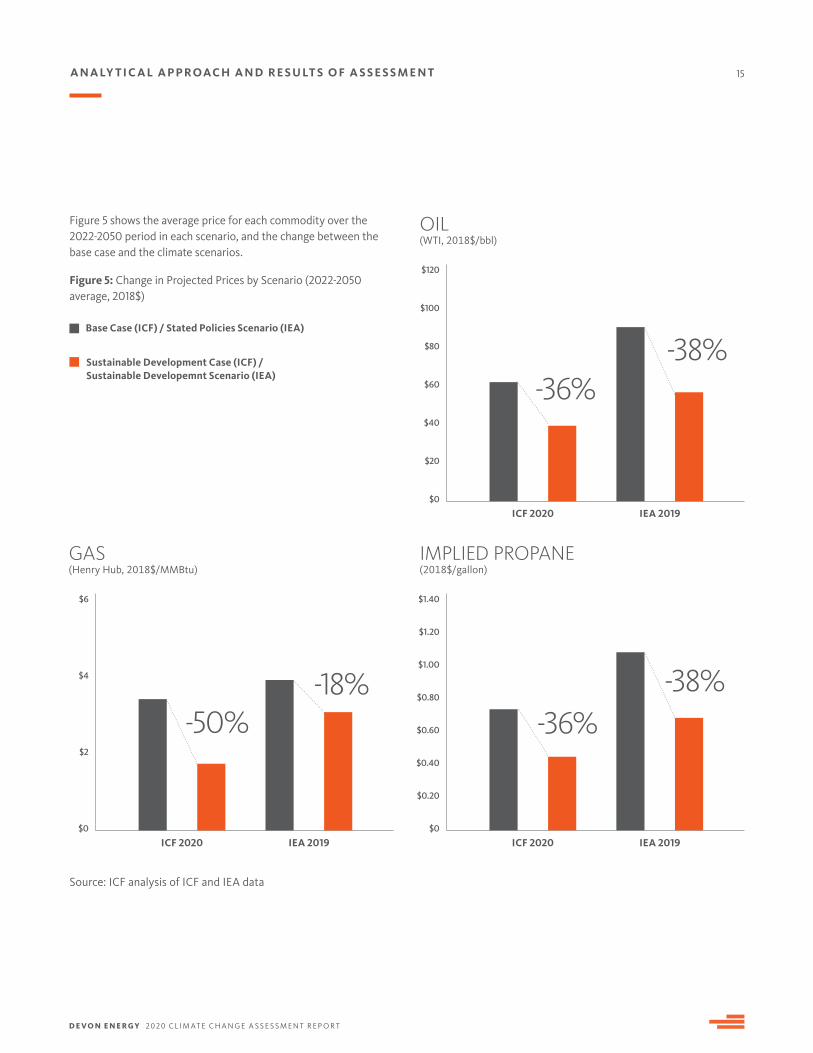
Figure 5 shows the average price for each commodity over the 2022-2050 period in each scenario, and the change between the base case and the climate scenarios.
Figure 5: Change in Projected Prices by Scenario (2022-2050 average, 2018$)
D E V O N E N E R G Y 2020 C L I M AT E C H A N G E A S S E S S M E N T R E P O R T
16
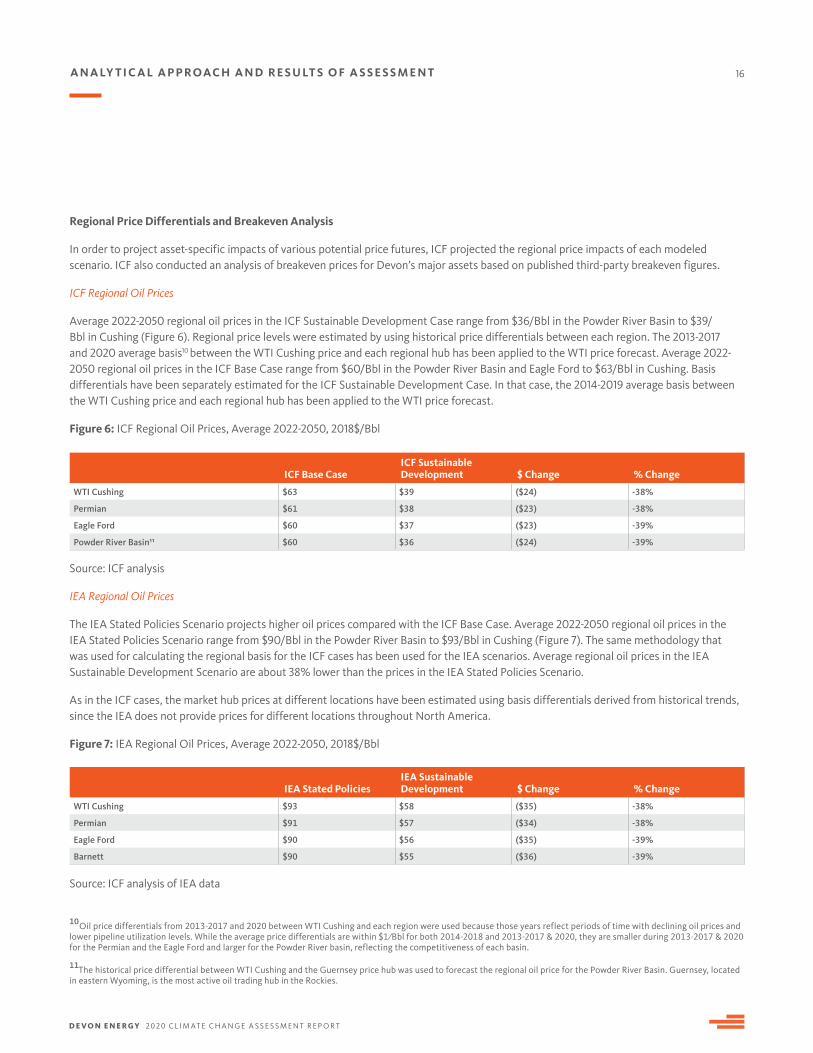
Regional Price Differentials and Breakeven Analysis
In order to project asset-specific impacts of various potential price futures, ICF projected the regional price impacts of each modeled scenario. ICF also conducted an analysis of breakeven prices for Devon’s major assets based on published third-party breakeven figures.
ICF Regional Oil Prices
Average 2022-2050 regional oil prices in the ICF Sustainable Development Case range from $36/Bbl in the Powder River Basin to $39/Bbl in Cushing (Figure 6). Regional price levels were estimated by using historical price differentials between each region. The 2013-2017 and 2020 average basis10 between the WTI Cushing price and each regional hub has been applied to the WTI price forecast. Average 2022-2050 regional oil prices in the ICF Base Case range from $60/Bbl in the Powder River Basin and Eagle Ford to $63/Bbl in Cushing. Basis differentials have been separately estimated for the ICF Sustainable Development Case. In that case, the 2014-2019 average basis between the WTI Cushing price and each regional hub has been applied to the WTI price forecast.
Figure 6: ICF Regional Oil Prices, Average 2022-2050, 2018$/Bbl
Source: ICF analysis
IEA Regional Oil Prices
The IEA Stated Policies Scenario projects higher oil prices compared with the ICF Base Case. Average 2022-2050 regional oil prices in the IEA Stated Policies Scenario range from $90/Bbl in the Powder River Basin to $93/Bbl in Cushing (Figure 7). The same methodology that was used for calculating the regional basis for the ICF cases has been used for the IEA scenarios. Average regional oil prices in the IEA Sustainable Development Scenario are about 38% lower than the prices in the IEA Stated Policies Scenario.
As in the ICF cases, the market hub prices at different locations have been estimated using basis differentials derived from historical trends, since the IEA does not provide prices for different locations throughout North America.
Figure 7: IEA Regional Oil Prices, Average 2022-2050, 2018$/Bbl
Source: ICF analysis of IEA data
ICF Base CaseICF Sustainable Development $ Change % Change
WTI Cushing $63 $39 ($24) -38%
Permian $61 $38 ($23) -38%
Eagle Ford $60 $37 ($23) -39%
Powder River Basin11 $60 $36 ($24) -39%
IEA Stated PoliciesIEA Sustainable Development $ Change % Change
WTI Cushing $93 $58 ($35) -38%
Permian $91 $57 ($34) -38%
Eagle Ford $90 $56 ($35) -39%
Barnett $90 $55 ($36) -39%
10Oil price differentials from 2013-2017 and 2020 between WTI Cushing and each region were used because those years reflect periods of time with declining oil prices and lower pipeline utilization levels. While the average price differentials are within $1 / Bbl for both 2014-2018 and 2013-2017 & 2020, they are smaller during 2013-2017 & 2020 for the Permian and the Eagle Ford and larger for the Powder River basin, reflecting the competitiveness of each basin.
11The historical price differential between WTI Cushing and the Guernsey price hub was used to forecast the regional oil price for the Powder River Basin. Guernsey, located in eastern Wyoming, is the most active oil trading hub in the Rockies.
A N A LY T I C A L A P P R OAC H A N D R E S U LT S O F A S S E S S M E N T
D E V O N E N E R G Y 2020 C L I M AT E C H A N G E A S S E S S M E N T R E P O R T
17A N A LY T I C A L A P P R OAC H A N D R E S U LT S O F A S S E S S M E N T
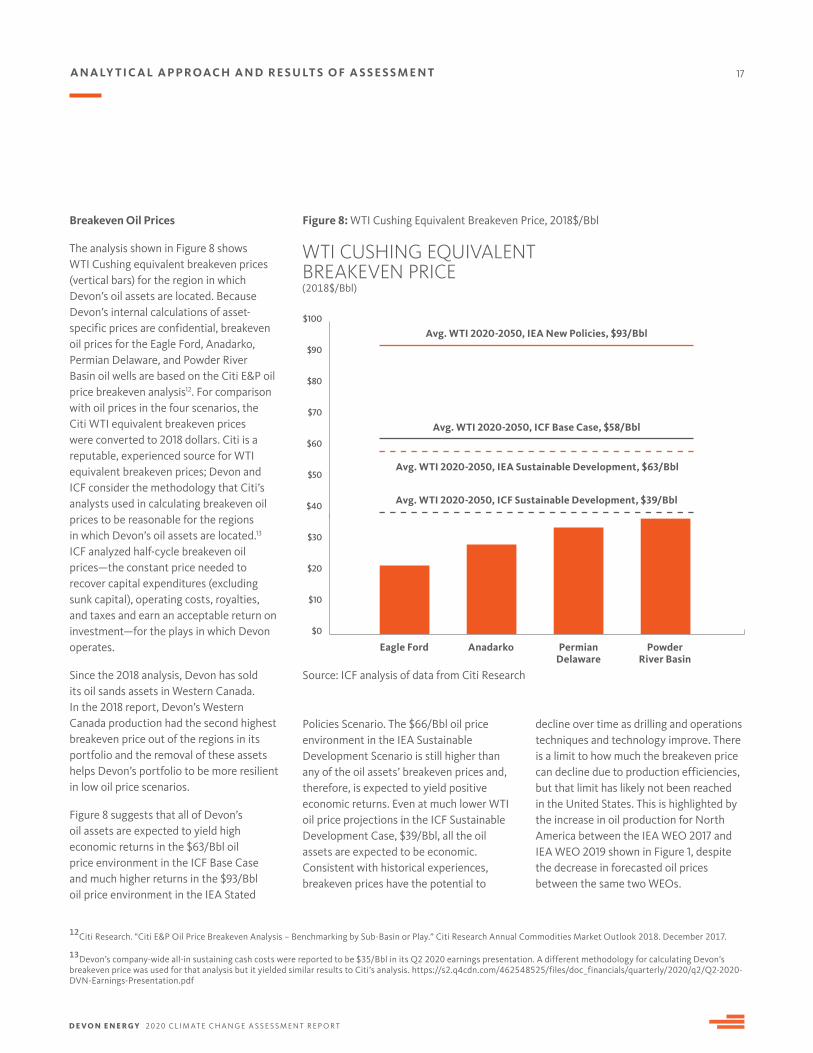
Breakeven Oil Prices
The analysis shown in Figure 8 shows WTI Cushing equivalent breakeven prices (vertical bars) for the region in which Devon’s oil assets are located. Because Devon’s internal calculations of asset-specific prices are confidential, breakeven oil prices for the Eagle Ford, Anadarko, Permian Delaware, and Powder River Basin oil wells are based on the Citi E&P oil price breakeven analysis12. For comparison with oil prices in the four scenarios, the Citi WTI equivalent breakeven prices were converted to 2018 dollars. Citi is a reputable, experienced source for WTI equivalent breakeven prices; Devon and ICF consider the methodology that Citi’s analysts used in calculating breakeven oil prices to be reasonable for the regions in which Devon’s oil assets are located.13 ICF analyzed half-cycle breakeven oil prices—the constant price needed to recover capital expenditures (excluding sunk capital), operating costs, royalties, and taxes and earn an acceptable return on investment—for the plays in which Devon operates.
Since the 2018 analysis, Devon has sold its oil sands assets in Western Canada. In the 2018 report, Devon’s Western Canada production had the second highest breakeven price out of the regions in its portfolio and the removal of these assets helps Devon’s portfolio to be more resilient in low oil price scenarios.
Figure 8 suggests that all of Devon’s oil assets are expected to yield high economic returns in the $63/Bbl oil price environment in the ICF Base Case and much higher returns in the $93/Bbl oil price environment in the IEA Stated
WTI CUSHING EQUIVALENT BREAKEVEN PRICE(2018$/Bbl)
Figure 8: WTI Cushing Equivalent Breakeven Price, 2018$/Bbl
Policies Scenario. The $66/Bbl oil price environment in the IEA Sustainable Development Scenario is still higher than any of the oil assets’ breakeven prices and, therefore, is expected to yield positive economic returns. Even at much lower WTI oil price projections in the ICF Sustainable Development Case, $39/Bbl, all the oil assets are expected to be economic. Consistent with historical experiences, breakeven prices have the potential to
Eagle Ford Anadarko Permian Delaware
Avg. WTI 2020-2050, IEA New Policies, $93/Bbl
Avg. WTI 2020-2050, ICF Base Case, $58/Bbl
Avg. WTI 2020-2050, ICF Sustainable Development, $39/Bbl
Powder River Basin
$90
$100
$80
$70
$60
$50
$40
$30
$20
$10
$0
Avg. WTI 2020-2050, IEA Sustainable Development, $63/Bbl
Source: ICF analysis of data from Citi Research
decline over time as drilling and operations techniques and technology improve. There is a limit to how much the breakeven price can decline due to production efficiencies, but that limit has likely not been reached in the United States. This is highlighted by the increase in oil production for North America between the IEA WEO 2017 and IEA WEO 2019 shown in Figure 1, despite the decrease in forecasted oil prices between the same two WEOs.
12Citi Research. "Citi E&P Oil Price Breakeven Analysis – Benchmarking by Sub-Basin or Play.” Citi Research Annual Commodities Market Outlook 2018. December 2017.
13Devon’s company-wide all-in sustaining cash costs were reported to be $35/Bbl in its Q2 2020 earnings presentation. A different methodology for calculating Devon’s breakeven price was used for that analysis but it yielded similar results to Citi’s analysis. https://s2.q4cdn.com/462548525/files/doc_financials/quarterly/2020/q2/Q2-2020-DVN-Earnings-Presentation.pdf
D E V O N E N E R G Y 2020 C L I M AT E C H A N G E A S S E S S M E N T R E P O R T
18A N A LY T I C A L A P P R OAC H A N D R E S U LT S O F A S S E S S M E N T
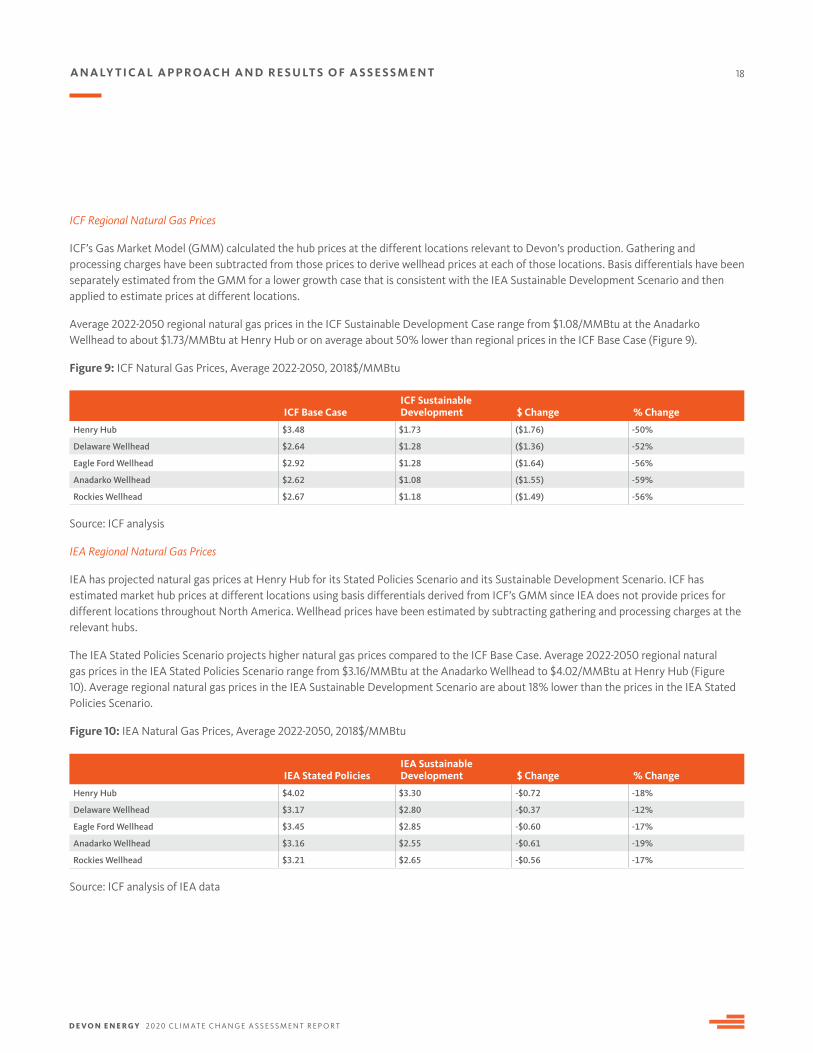
ICF Regional Natural Gas Prices
ICF’s Gas Market Model (GMM) calculated the hub prices at the different locations relevant to Devon’s production. Gathering and processing charges have been subtracted from those prices to derive wellhead prices at each of those locations. Basis differentials have been separately estimated from the GMM for a lower growth case that is consistent with the IEA Sustainable Development Scenario and then applied to estimate prices at different locations.
Average 2022-2050 regional natural gas prices in the ICF Sustainable Development Case range from $1.08/MMBtu at the Anadarko Wellhead to about $1.73/MMBtu at Henry Hub or on average about 50% lower than regional prices in the ICF Base Case (Figure 9).
Figure 9: ICF Natural Gas Prices, Average 2022-2050, 2018$/MMBtu
Source: ICF analysis
IEA Regional Natural Gas Prices
IEA has projected natural gas prices at Henry Hub for its Stated Policies Scenario and its Sustainable Development Scenario. ICF has estimated market hub prices at different locations using basis differentials derived from ICF’s GMM since IEA does not provide prices for different locations throughout North America. Wellhead prices have been estimated by subtracting gathering and processing charges at the relevant hubs.
The IEA Stated Policies Scenario projects higher natural gas prices compared to the ICF Base Case. Average 2022-2050 regional natural gas prices in the IEA Stated Policies Scenario range from $3.16/MMBtu at the Anadarko Wellhead to $4.02/MMBtu at Henry Hub (Figure 10). Average regional natural gas prices in the IEA Sustainable Development Scenario are about 18% lower than the prices in the IEA Stated Policies Scenario.
Figure 10: IEA Natural Gas Prices, Average 2022-2050, 2018$/MMBtu
Source: ICF analysis of IEA data
ICF Base CaseICF Sustainable Development $ Change % Change
Henry Hub $3.48 $1.73 ($1.76) -50%
Delaware Wellhead $2.64 $1.28 ($1.36) -52%
Eagle Ford Wellhead $2.92 $1.28 ($1.64) -56%
Anadarko Wellhead $2.62 $1.08 ($1.55) -59%
Rockies Wellhead $2.67 $1.18 ($1.49) -56%
IEA Stated PoliciesIEA Sustainable Development $ Change % Change
Henry Hub $4.02 $3.30 -$0.72 -18%
Delaware Wellhead $3.17 $2.80 -$0.37 -12%
Eagle Ford Wellhead $3.45 $2.85 -$0.60 -17%
Anadarko Wellhead $3.16 $2.55 -$0.61 -19%
Rockies Wellhead $3.21 $2.65 -$0.56 -17%
D E V O N E N E R G Y 2020 C L I M AT E C H A N G E A S S E S S M E N T R E P O R T
19A N A LY T I C A L A P P R OAC H A N D R E S U LT S O F A S S E S S M E N T
Breakeven Natural Gas Prices
As shown in Figure 9 and Figure 10, natural gas prices are expected to be significantly lower in the sustainable development scenarios. ICF did not conduct a breakeven analysis of the natural gas prices, because the majority of the natural gas that Devon produces is associated with its oil production, and thus provides income in addition to the revenue from selling oil. Therefore, the resiliency of Devon’s portfolio is expected to be primarily driven by oil prices and not by natural gas prices. The natural gas prices in the IEA Sustainable Development Scenario are well above the prices seen in 2019 and 2020, however, and would positively affect the profitability of oil drilling in Devon’s portfolio, especially in the Anadarko basin where there is potential for gas-directed drilling.
The natural gas prices in ICF’s Sustainable Development Scenario are at levels that would make it difficult for most gas-directed drilling to be profitable with current drilling technology. Low natural gas prices could induce greater demand for natural gas, however, and provide an additional source of income for oil producers. Consistent with the breakeven prices for oil, breakeven prices for natural gas also have the potential to decline over time as drilling techniques and technology improve. Consequently, even though most of Devon’s current portfolio is focused on oil production, there is potential for natural gas to provide incremental income for oil-directed drilling or profitable gas-directed drilling in the future.
D E V O N E N E R G Y 2020 C L I M AT E C H A N G E A S S E S S M E N T R E P O R T
20
Climate-Related Risks and Opportunities
Risks
There is an increasing level of awareness and understanding about the potential risks to business from climate change. The risks to different types of businesses may be varied, including impacts to business operations, capital investments, long-range planning and strategy, and worker health and safety. The TCFD defines two categories of climate-related risks: physical and transition. Physical risks refer to those risks that are associated with physical impacts from climate change and transition risks are related to the transition to a lower-carbon economy. Aligned with stakeholders, Devon is committed to understanding the potential impacts of climate change and a possible carbon-constrained future on its long-range business plans.
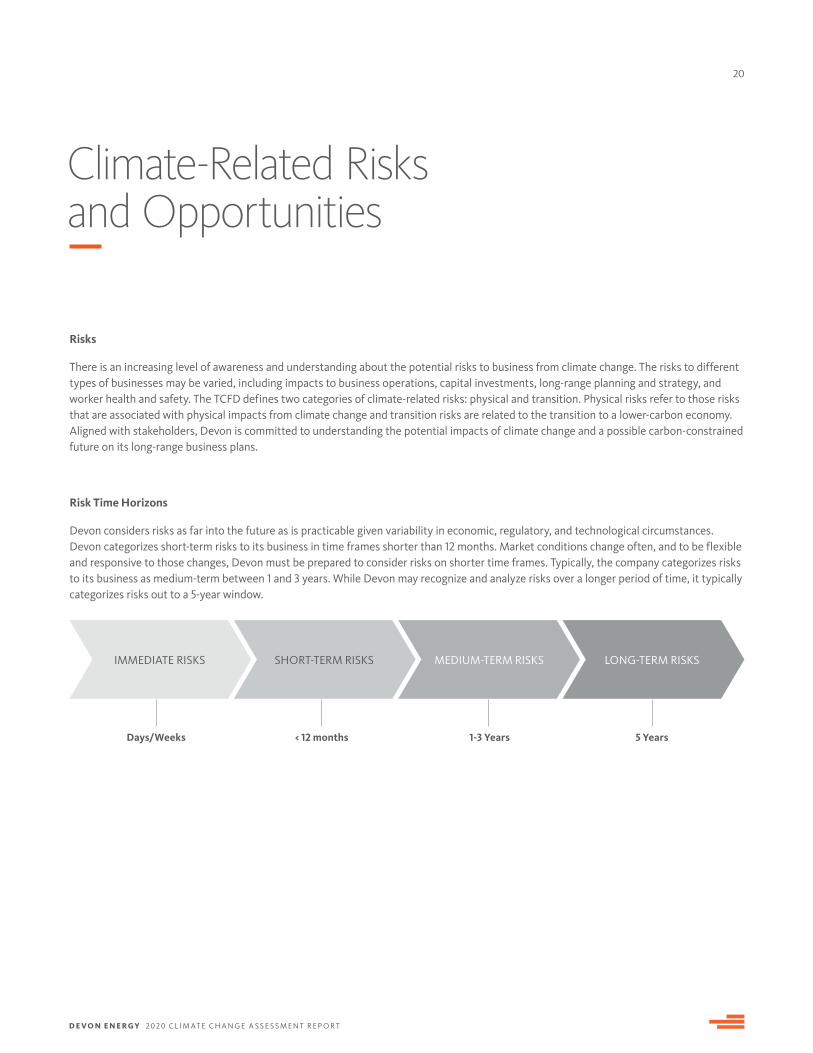
Risk Time Horizons
Devon considers risks as far into the future as is practicable given variability in economic, regulatory, and technological circumstances. Devon categorizes short-term risks to its business in time frames shorter than 12 months. Market conditions change often, and to be flexible and responsive to those changes, Devon must be prepared to consider risks on shorter time frames. Typically, the company categorizes risks to its business as medium-term between 1 and 3 years. While Devon may recognize and analyze risks over a longer period of time, it typically categorizes risks out to a 5-year window.
IMMEDIATE RISKS SHORT-TERM RISKS MEDIUM-TERM RISKS LONG-TERM RISKS
Days/Weeks < 12 months 1-3 Years 5 Years
D E V O N E N E R G Y 2020 C L I M AT E C H A N G E A S S E S S M E N T R E P O R T
21
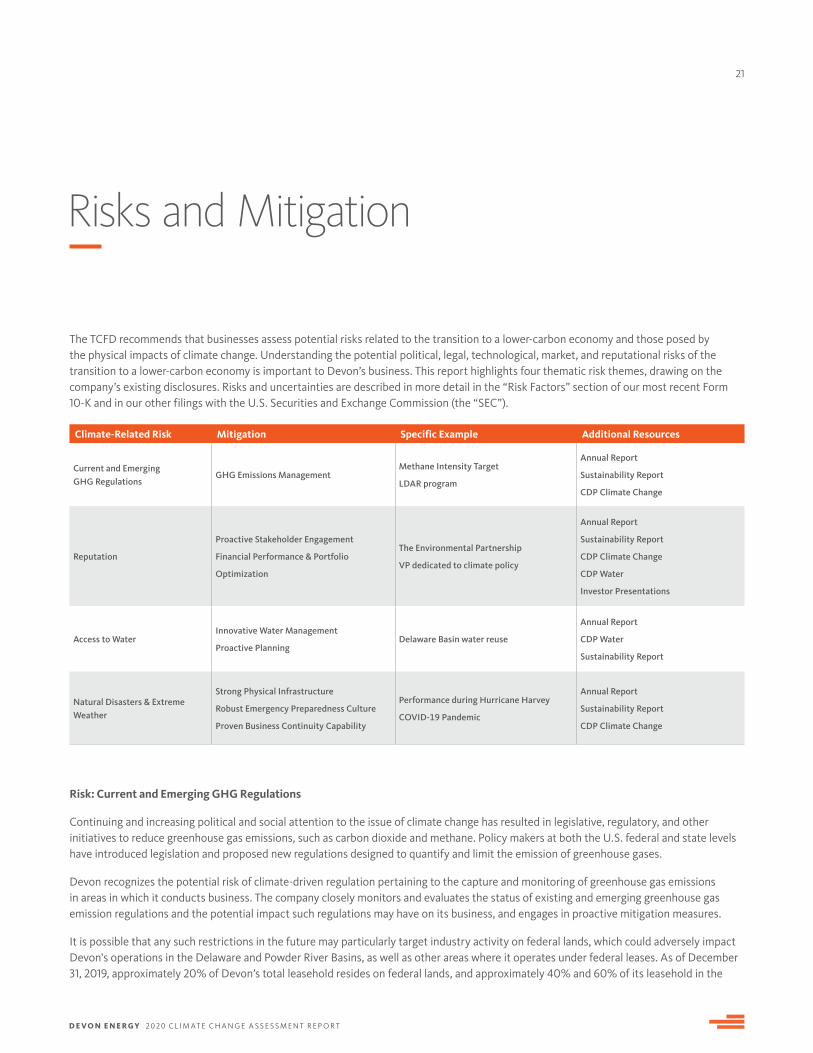
Risks and Mitigation
The TCFD recommends that businesses assess potential risks related to the transition to a lower-carbon economy and those posed by the physical impacts of climate change. Understanding the potential political, legal, technological, market, and reputational risks of the transition to a lower-carbon economy is important to Devon’s business. This report highlights four thematic risk themes, drawing on the company’s existing disclosures. Risks and uncertainties are described in more detail in the “Risk Factors” section of our most recent Form 10-K and in our other filings with the U.S. Securities and Exchange Commission (the “SEC”).
Risk: Current and Emerging GHG Regulations
Continuing and increasing political and social attention to the issue of climate change has resulted in legislative, regulatory, and other initiatives to reduce greenhouse gas emissions, such as carbon dioxide and methane. Policy makers at both the U.S. federal and state levels have introduced legislation and proposed new regulations designed to quantify and limit the emission of greenhouse gases.
Devon recognizes the potential risk of climate-driven regulation pertaining to the capture and monitoring of greenhouse gas emissions in areas in which it conducts business. The company closely monitors and evaluates the status of existing and emerging greenhouse gas emission regulations and the potential impact such regulations may have on its business, and engages in proactive mitigation measures.
It is possible that any such restrictions in the future may particularly target industry activity on federal lands, which could adversely impact Devon's operations in the Delaware and Powder River Basins, as well as other areas where it operates under federal leases. As of December 31, 2019, approximately 20% of Devon’s total leasehold resides on federal lands, and approximately 40% and 60% of its leasehold in the
Climate-Related Risk Mitigation Specific Example Additional Resources
Current and Emerging GHG Regulations
GHG Emissions ManagementMethane Intensity Target
LDAR program
Annual Report
Sustainability Report
CDP Climate Change
Reputation
Proactive Stakeholder Engagement
Financial Performance & Portfolio
Optimization
The Environmental Partnership
VP dedicated to climate policy
Annual Report
Sustainability Report
CDP Climate Change
CDP Water
Investor Presentations
Access to WaterInnovative Water Management
Proactive PlanningDelaware Basin water reuse
Annual Report
CDP Water
Sustainability Report
Natural Disasters & Extreme Weather
Strong Physical Infrastructure
Robust Emergency Preparedness Culture
Proven Business Continuity Capability
Performance during Hurricane Harvey
COVID-19 Pandemic
Annual Report
Sustainability Report
CDP Climate Change
D E V O N E N E R G Y 2020 C L I M AT E C H A N G E A S S E S S M E N T R E P O R T
22R I S K S A N D M I T I G AT I O N
Delaware and Powder River Basins, respectively, resides on federal lands. To mitigate regulatory risks related to federal land activity, Devon is building a deep, multi-year inventory of federal drilling permits in its core development areas within the Delaware Basin and Powder River Basin. With this proactive approach to permitting, the company estimates that its permits in hand will cover substantially all of its desired activity over the next four years under a maintenance capital scenario. Should the federal regulatory environment become more challenging, Devon has significant optionality on high-quality, non-federal land within its diversified portfolio.
Mitigation: GHG Emissions Management
Devon is committed to and focused on emissions at the point of production, where it can directly and meaningfully effect emissions reductions. Devon continues to evaluate ways in which it can reduce its overall carbon footprint and strives to better understand its emissions sources beyond the point of production, prioritizing the impacts over which it has the most control.
As part of its continuous improvement culture, Devon manages its emissions performance through a variety of mitigation strategies. The company has steadily expanded its LDAR program and upgraded existing operations to reduce methane emissions from production sites. Since 2011, Devon has replaced high-bleed natural gas pneumatic controllers on hundreds of wells across its operations and since early 2019 has transitioned to install only air-driven pneumatic pumps and controllers at new facilities in its highest activity basin. The company has also increasingly incorporated engines powered by alternative fuels into its drilling program. Devon is conducting ongoing evaluations into emissions detection and quantification technologies, and is collaborating with industry, environmental nonprofits and agency partners on emissions-reduction strategies.
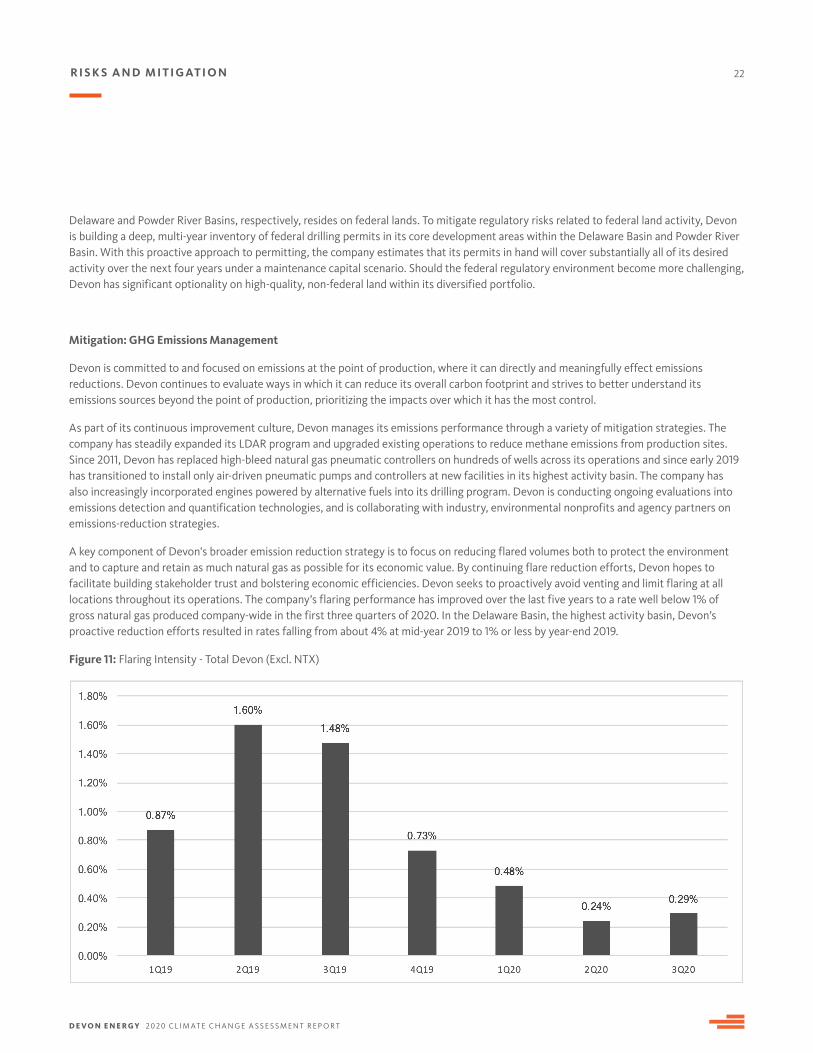
A key component of Devon's broader emission reduction strategy is to focus on reducing flared volumes both to protect the environment and to capture and retain as much natural gas as possible for its economic value. By continuing flare reduction efforts, Devon hopes to facilitate building stakeholder trust and bolstering economic efficiencies. Devon seeks to proactively avoid venting and limit flaring at all locations throughout its operations. The company’s flaring performance has improved over the last five years to a rate well below 1% of gross natural gas produced company-wide in the first three quarters of 2020. In the Delaware Basin, the highest activity basin, Devon’s proactive reduction efforts resulted in rates falling from about 4% at mid-year 2019 to 1% or less by year-end 2019.
Figure 11: Flaring Intensity - Total Devon (Excl. NTX)
D E V O N E N E R G Y 2020 C L I M AT E C H A N G E A S S E S S M E N T R E P O R T
23R I S K S A N D M I T I G AT I O N
Carbon Capture, Utilization and Storage (CCUS) is an important technology to achieve GHG emissions reduction goals in the oil and natural gas industry. Devon has successfully used CCUS technology for more than a decade in its operations. Since 2008, the company has injected approximately 5.5 million metric tons of CO2 for enhanced oil and natural gas recovery into the Beaver Creek and Big Sand Draw oilfields. The company’s experience positions Devon to take advantage of emerging opportunities related to CCUS in the future.
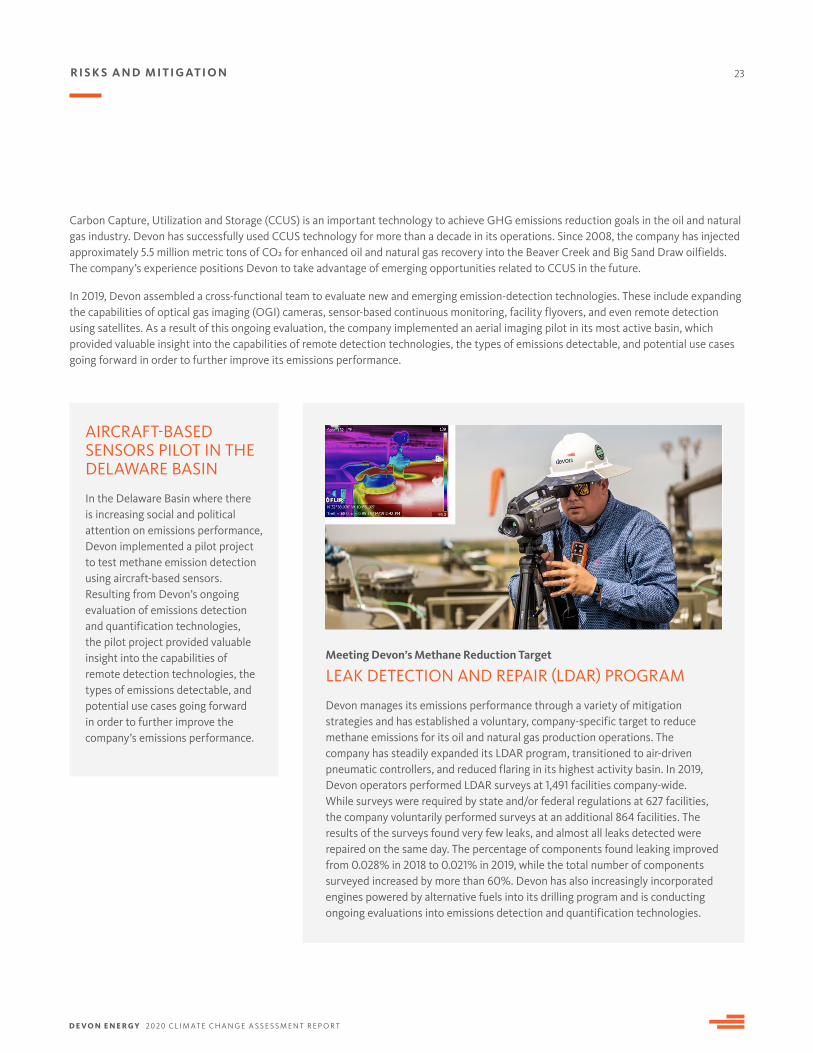
In 2019, Devon assembled a cross-functional team to evaluate new and emerging emission-detection technologies. These include expanding the capabilities of optical gas imaging (OGI) cameras, sensor-based continuous monitoring, facility flyovers, and even remote detection using satellites. As a result of this ongoing evaluation, the company implemented an aerial imaging pilot in its most active basin, which provided valuable insight into the capabilities of remote detection technologies, the types of emissions detectable, and potential use cases going forward in order to further improve its emissions performance.
AIRCRAFT-BASED SENSORS PILOT IN THE DELAWARE BASIN
In the Delaware Basin where there is increasing social and political attention on emissions performance, Devon implemented a pilot project to test methane emission detection using aircraft-based sensors. Resulting from Devon’s ongoing evaluation of emissions detection and quantification technologies, the pilot project provided valuable insight into the capabilities of remote detection technologies, the types of emissions detectable, and potential use cases going forward in order to further improve the company’s emissions performance.
Meeting Devon’s Methane Reduction Target
LEAK DETECTION AND REPAIR (LDAR) PROGRAM
Devon manages its emissions performance through a variety of mitigation strategies and has established a voluntary, company-specific target to reduce methane emissions for its oil and natural gas production operations. The company has steadily expanded its LDAR program, transitioned to air-driven pneumatic controllers, and reduced flaring in its highest activity basin. In 2019, Devon operators performed LDAR surveys at 1,491 facilities company-wide. While surveys were required by state and/or federal regulations at 627 facilities, the company voluntarily performed surveys at an additional 864 facilities. The results of the surveys found very few leaks, and almost all leaks detected were repaired on the same day. The percentage of components found leaking improved from 0.028% in 2018 to 0.021% in 2019, while the total number of components surveyed increased by more than 60%. Devon has also increasingly incorporated engines powered by alternative fuels into its drilling program and is conducting ongoing evaluations into emissions detection and quantification technologies.
D E V O N E N E R G Y 2020 C L I M AT E C H A N G E A S S E S S M E N T R E P O R T
24
Risk: Reputation
Evolving perception of climate change may result in reputational risk and higher cost of capital. In addition to regulatory risk, other market and social initiatives resulting from the changing perception of climate change present risks for the oil and natural gas industry. For example, in an effort to promote a lower-carbon economy, there are various public and private initiatives subsidizing the development and adoption of alternative energy sources and technologies, including by mandating the use of specific fuels or technologies. These initiatives may reduce the competitiveness of carbon-based fuels, such as oil and natural gas. Moreover, certain financial institutions, funds, and other sources of capital have begun restricting or eliminating their investment in oil and natural gas activities due to their concern regarding climate change. Such restrictions in capital could make it more difficult to access funding. These and the other regulatory, social, and market risks relating to climate change described above could result in unexpected costs, increase operating expenses and reduce the demand for oil and natural gas products. These potential issues could lower the value of reserves and have an adverse effect on profitability, financial condition, and liquidity.
Mitigation: Financial Performance & Portfolio Optimization
With a disciplined hedging strategy, a returns-driven capital program and strong cash flows, Devon has delivered consistent financial performance despite the uncertainties and challenges of 2020. After divestments of assets that represented higher financial, regulatory, and environmental risk, Devon continues to review its portfolio with a comprehensive view of risk, cost, and benefits, including environmental and carbon footprint considerations. The company’s strategic focus remains on building its inventory of high quality opportunities and optimizing its diversified oil and natural gas portfolio to provide a robust platform for future growth in core areas of the Delaware Basin of southeastern New Mexico, the Eagle Ford Shale in south Texas, the Powder River Basin in Wyoming and the Anadarko Basin in western Oklahoma.
R I S K S A N D M I T I G AT I O N
Mitigation: Proactive Stakeholder Engagement
Devon has ongoing engagements on climate issues with a wide variety of partners along the value chain, ranging from stockholders, to nonprofits such as the Environmental Defense Fund and industry associations such as the American Petroleum Institute (See more about the company’s proactive approach stakeholder engagement in its Sustainability Report.). The company engages with state and federal agencies and agency partners including the U.S. Bureau of Land Management, U.S. Environmental Protection Agency, and New Mexico Methane Advisory Panel. Devon works with climate-focused groups including The Environmental Partnership, the Energy Water Initiative, and the Texas Methane & Flaring Coalition. The company prioritizes its engagements based on efforts that it sees as most effective and where Devon can contribute meaningfully while prudently managing its financial resources and personnel.
Devon employees engage with stakeholders to build relationships founded in trust and cooperation. The company places a high priority on its commitment to work together to find solutions benefiting the stakeholders and communities where it operates. Devon conducts investor outreach throughout the year to ensure that management and the Board understand the compensation and sustainability issues that matter to Devon’s stockholders. During 2019, the Company contacted a majority of its 50 largest stockholders and had productive interactions with many stockholders, both inside and outside of that group, including several in-person meetings. In addition, Devon’s participation in several ESG-related surveys has allowed the company to provide transparency to its stakeholders, as well as stay informed on key issues that are important to Devon's stakeholders.
D E V O N E N E R G Y 2020 C L I M AT E C H A N G E A S S E S S M E N T R E P O R T
25
Risk: Access to Water
Devon's oil and natural gas extraction operations depend upon reliable access to, and the ability to dispose of, water used or produced in drilling and completions operations. Regulatory restrictions in Devon’s ability to either source or dispose of water may result in higher operating costs. In recent years, various federal agencies have asserted regulatory authority over certain aspects of the hydraulic fracturing process. For example, the EPA finalized regulations in 2016 that prohibit the discharge of wastewater from hydraulic fracturing operations to publicly owned wastewater treatment plants. Several states in which Devon operates have adopted, or stated intentions to adopt, laws or regulations that mandate further restrictions on hydraulic fracturing, such as requiring disclosure of chemicals used in hydraulic fracturing and imposing more stringent permitting, disclosure, and well-construction requirements on hydraulic fracturing operations.
In addition to risk driven by regulations around water use and disposal, Devon recognizes the need to mitigate physical risks associated with regional water stress. By working to identify and develop alternative sources of water for operational activities, the company hopes to reduce its dependence on fresh water and improve its ability to respond in a scenario where fresh water or disposal availability is constrained.
Mitigation: Innovative Water Management, Proactive Planning
Devon has invested significant capital in developing technologies for re-using and recycling water as well as using alternative sources of water, which will help to improve its ability to respond to lack of freshwater availability. Devon’s history of leadership in water conservation includes being the first company to recycle flowback and produced water from natural gas wells in the Barnett Shale of north Texas in 2004 and subsequently becoming one of the largest users of treated produced water in New Mexico, where it led the effort to establish state rules to encourage the practice.
Devon has collaborated with stakeholders in government, industry, and the communities where it works to proactively find ways to conserve water in its drilling and completions operations. Wherever possible, Devon works to use water in its operations that would not be consumed for drinking and other public uses and to use recycled produced water to avoid fresh water use in areas of drilling and production activity. Every gallon of produced, recycled, brackish, or non-potable water that Devon uses in its operations reduces its consumption of fresh water.
R I S K S A N D M I T I G AT I O N
In addition to water management, Devon also takes a proactive approach to planning. In all of its project designs, Devon considers access to and the cost of water, alongside the costs of methane and GHG management. Such costs are incorporated into the characterizations of an asset, which may then inform the overall allocation of capital to an area. If costs are too burdensome, the company may consider directing capital to other assets. This proactive approach helps Devon mitigate both the physical and transition risks related to water access.
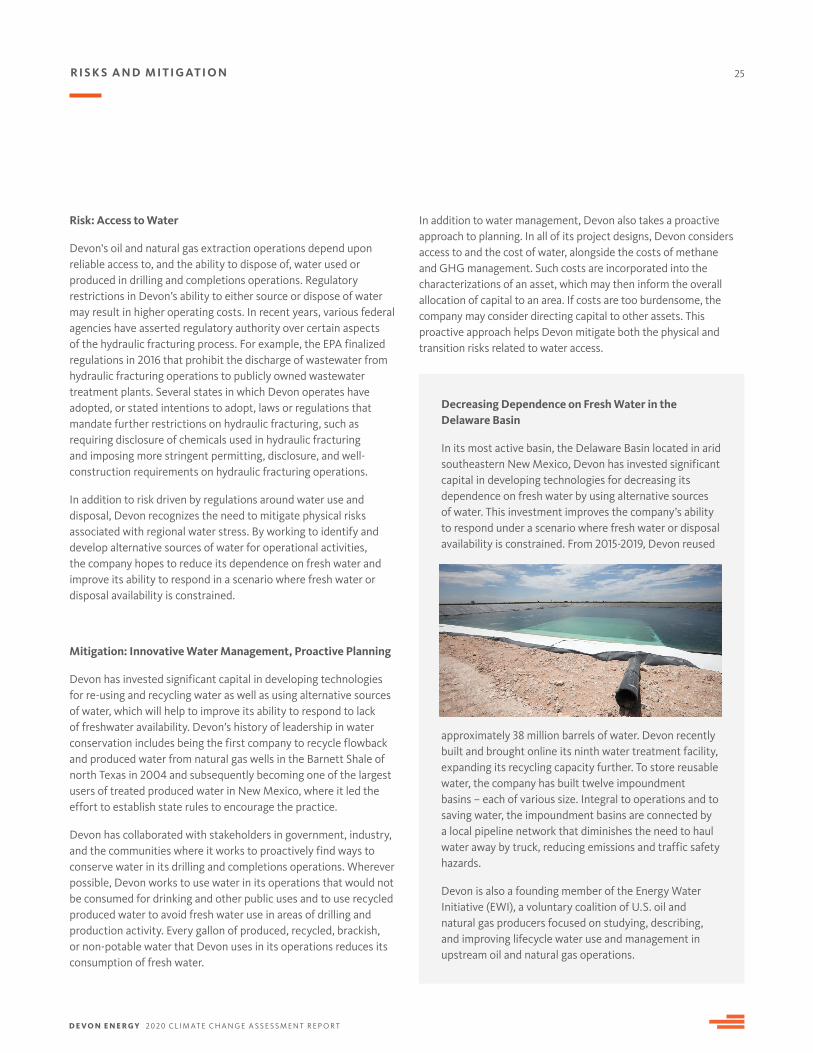
Decreasing Dependence on Fresh Water in the Delaware Basin
In its most active basin, the Delaware Basin located in arid southeastern New Mexico, Devon has invested significant capital in developing technologies for decreasing its dependence on fresh water by using alternative sources of water. This investment improves the company’s ability to respond under a scenario where fresh water or disposal availability is constrained. From 2015-2019, Devon reused
approximately 38 million barrels of water. Devon recently built and brought online its ninth water treatment facility, expanding its recycling capacity further. To store reusable water, the company has built twelve impoundment basins – each of various size. Integral to operations and to saving water, the impoundment basins are connected by a local pipeline network that diminishes the need to haul water away by truck, reducing emissions and traffic safety hazards.
Devon is also a founding member of the Energy Water Initiative (EWI), a voluntary coalition of U.S. oil and natural gas producers focused on studying, describing, and improving lifecycle water use and management in upstream oil and natural gas operations.
D E V O N E N E R G Y 2020 C L I M AT E C H A N G E A S S E S S M E N T R E P O R T
26R I S K S A N D M I T I G AT I O N
Risk: Natural Disasters and Extreme Weather
Devon analyzes potential impacts due to natural disasters and short and medium-term weather changes when evaluating and planning future development. This analysis considers the likelihood of those events occurring and how Devon could mitigate the potential impact of
those events. Oil and natural gas extraction operations have been successful in some of the most extreme environments across the planet, and in the areas where Devon operates and plans to operate, it is confident in its ability to continue to operate during periods of extreme weather or natural disasters. Currently, and in the short, medium, and long-term time frames, Devon does not foresee risks associated with acute or chronic physical changes due to climate change impacting its business any more or less than the status quo. In part, this is because Devon has experience managing extreme weather and natural disasters. Examples include Devon’s adept response to Hurricane Harvey in 2017, in which as a precautionary
measure the company temporarily suspended operations and shut-in production across its entire Eagle Ford position in south Texas during an unprecedented disruption of transportation and logistics infrastructure in the energy sector in the U.S. Gulf Coast region.
Mitigation: Robust Emergency Preparedness, Proven Business Continuity Capability
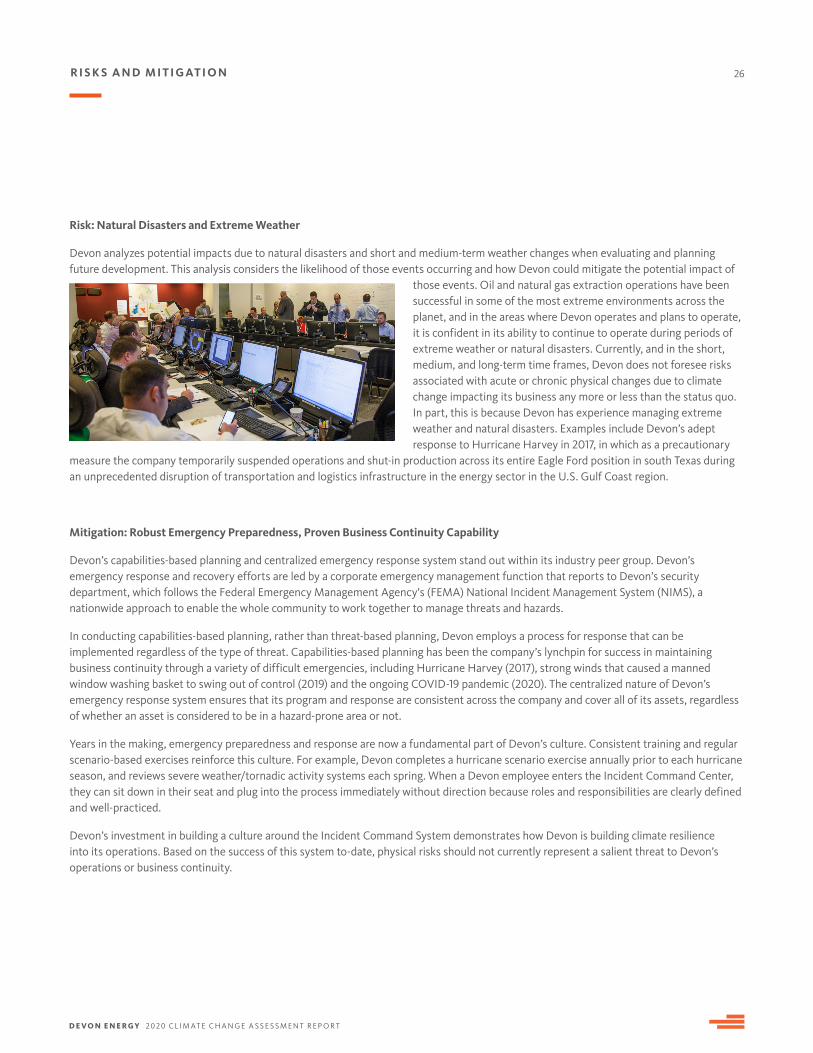
Devon’s capabilities-based planning and centralized emergency response system stand out within its industry peer group. Devon’s emergency response and recovery efforts are led by a corporate emergency management function that reports to Devon’s security department, which follows the Federal Emergency Management Agency's (FEMA) National Incident Management System (NIMS), a nationwide approach to enable the whole community to work together to manage threats and hazards.
In conducting capabilities-based planning, rather than threat-based planning, Devon employs a process for response that can be implemented regardless of the type of threat. Capabilities-based planning has been the company’s lynchpin for success in maintaining business continuity through a variety of difficult emergencies, including Hurricane Harvey (2017), strong winds that caused a manned window washing basket to swing out of control (2019) and the ongoing COVID-19 pandemic (2020). The centralized nature of Devon’s emergency response system ensures that its program and response are consistent across the company and cover all of its assets, regardless of whether an asset is considered to be in a hazard-prone area or not.
Years in the making, emergency preparedness and response are now a fundamental part of Devon’s culture. Consistent training and regular scenario-based exercises reinforce this culture. For example, Devon completes a hurricane scenario exercise annually prior to each hurricane season, and reviews severe weather/tornadic activity systems each spring. When a Devon employee enters the Incident Command Center, they can sit down in their seat and plug into the process immediately without direction because roles and responsibilities are clearly defined and well-practiced.
Devon’s investment in building a culture around the Incident Command System demonstrates how Devon is building climate resilience into its operations. Based on the success of this system to-date, physical risks should not currently represent a salient threat to Devon’s operations or business continuity.
D E V O N E N E R G Y 2020 C L I M AT E C H A N G E A S S E S S M E N T R E P O R T
27
Opportunities
Since its founding in 1971, Devon has been at the forefront of technological innovation in the oil and natural gas sector, having devoted significant resources to evaluating and implementing advanced technologies and solutions. The company believes that the ability to use technology with increasing efficiency across the business is material to the company’s sustainability. Devon supports continuing investments in innovation, research, and development in ways that are appropriate for Devon’s business. To advance its commitment to reducing GHG emissions and minimizing environmental impact, the company has methodically invested in a wide range of technologies such as implementing infra-red cameras and piloting aircraft-based sensors to improve methane leak detection. With its continued focus on innovative technological solutions, Devon strives to create new opportunities for further emissions reductions and resource efficiency in order to deliver strong returns in a potentially carbon-constrained future.
Using Advanced Analytics and Technology to Improve Leak Detection
Devon remains focused on continuous improvement and growing its technological capabilities and resources to match its business needs and objectives. In 2018, to meet growing business needs and better leverage new technologies, Devon invested in a software product to transition its enterprise system to cloud computing. The deployment of cloud computing better enables the company to monitor vast amounts of data in real-time and use advanced analytics tools to transform collected data into actionable insights and inform decision-making.
Through leveraging real-time telemetry and well condition data, Devon believes the application of advanced analytics tools has the potential to strengthen its capacity to improve emission detection and reduce leaks by , for example, being able to receive earlier notifications if an onsite leak has occurred. Moreover, Devon believes predictive analytics and machine learning have the ability to not only anticipate potential leaks and equipment failures, but ultimately to prevent them before they occur.
Because technologies to detect and quantify emissions are rapidly evolving, Devon assembled a cross-functional team to conduct ongoing evaluation into new and emerging technologies and to collaborate with industry, environmental groups, and others to better understand potential technology solutions that could further enhance the company’s ability not only to find and prevent leaks, but also to empirically measure and validate its emissions performance.
Carbon Capture, Utilization and Storage
Carbon capture, utilization and storage (CCUS) is an important GHG emissions reduction technology that can be deployed across the energy sector. For nearly a half-century, exploration and production companies have used captured CO2 to extract additional oil and natural gas resources in mature fields by re-injecting CO2 into reservoirs to stimulate production, an industry practice called enhanced oil recovery (EOR).
Devon has over a decade of experience in CCUS for EOR operations. Since 2008, the company has injected nearly 5.5 million metric tons of CO2 into the Beaver Creek and Big Sand Draw oilfields in Wyoming. Devon will continue to evaluate ways in which the company can further deploy CCUS throughout its operation in the future.
Ending Routine Flaring and Natural Gas Monetization
Flaring of natural gas is a controlled process for eliminating emissions of methane and VOCs. It is necessary for safe operations in various phases of the oil and natural gas production process. Devon strives to avoid venting of raw gas entirely and to limit flaring as much as possible at all locations. This reflects the company’s objective of protecting the environment and capturing as much natural gas as possible for its economic value, while also complying with laws, regulations and permits and proactively addressing stakeholder concerns.
D E V O N E N E R G Y 2020 C L I M AT E C H A N G E A S S E S S M E N T R E P O R T
28O P P O R T U N I T I E S
Devon stopped routine flaring in 2017, only connecting and producing wells when gas takeaway has been established. The company flares only when experiencing system upsets or midstream or downstream constraints. Devon continually evaluates and optimizes its facilities, including the installation of reliable pressure-relief valves to minimize tank releases and vapor-recovery equipment to capture flash gas emissions and route them to a pipeline. The company also uses “green completions” to capture produced natural gas following hydraulic fracturing and well workovers. Where flaring is unavoidable, pilot monitoring equipment is installed to help ensure the gas is properly combusted.
In 2019, the company’s flaring reduction efforts focused on improving performance at one field with facilities that accounted for most of its flared gas volumes in the Delaware Basin. Devon took ownership of the associated midstream gas compression equipment and proceeded to drive down the upset conditions that caused most of the flaring.
With its multi-year commitment to building out midstream assets through its partnership with Cotton Draw Midstream in its highest activity basin, Devon is positioning itself to continue reducing gas flared volumes and associated carbon emissions in its operations while seizing the opportunity to efficiently monetize natural gas resources.
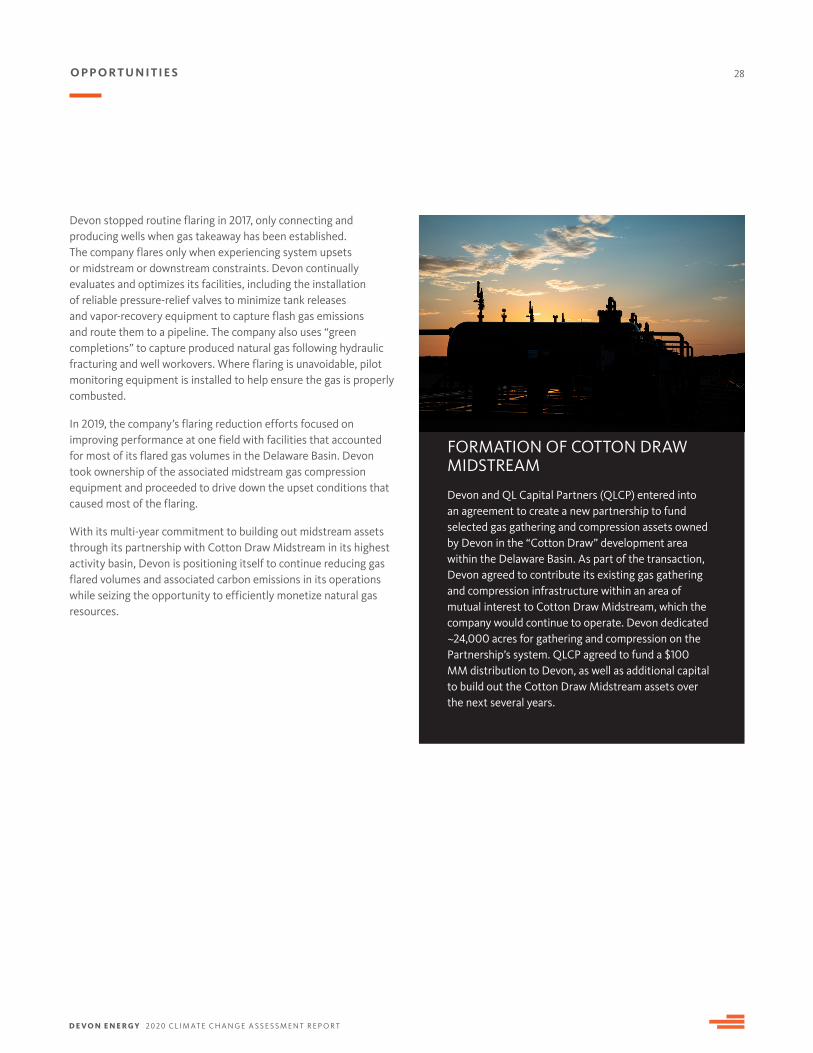
FORMATION OF COTTON DRAW MIDSTREAM
Devon and QL Capital Partners (QLCP) entered into an agreement to create a new partnership to fund selected gas gathering and compression assets owned by Devon in the “Cotton Draw” development area within the Delaware Basin. As part of the transaction, Devon agreed to contribute its existing gas gathering and compression infrastructure within an area of mutual interest to Cotton Draw Midstream, which the company would continue to operate. Devon dedicated ~24,000 acres for gathering and compression on the Partnership’s system. QLCP agreed to fund a $100 MM distribution to Devon, as well as additional capital to build out the Cotton Draw Midstream assets over the next several years.
D E V O N E N E R G Y 2020 C L I M AT E C H A N G E A S S E S S M E N T R E P O R T
29
Metrics and Targets
Measuring GHG Emissions, Verification, and Validation
Devon reports emissions from fuel combustion, flaring, fugitive emissions, venting, and storage losses (Scope 1) and electricity consumption (Scope 2) for assets under its operational control. The company collects data on greenhouse gas (carbon dioxide (CO2), methane and nitrous oxide) and submits annual GHG emissions according to the requirements of the U.S. Environmental Protection Agency (EPA) Mandatory Greenhouse Gas Reporting Rule. Under the Greenhouse Gas Reporting Program, the EPA completes electronic validation and verification checks annually on reports. If potential errors are identified, the EPA notifies the reporter and the reporter must resolve and resubmit the report or provide an acceptable response describing why the flagged issue is not an error.
In addition to the U.S. EPA Mandatory Greenhouse Gas Reporting Rule, the following standards, protocols, or methodologies are used to collect activity data and calculate emissions:
• American Petroleum Institute Compendium of Greenhouse Gas Emissions Methodologies for the Oil and Natural Gas Industry, 2009
• IPCC Guidelines for National Greenhouse Gas Inventories, 2006
• IPIECA's Petroleum Industry Guidelines for reporting GHG emissions, 2003
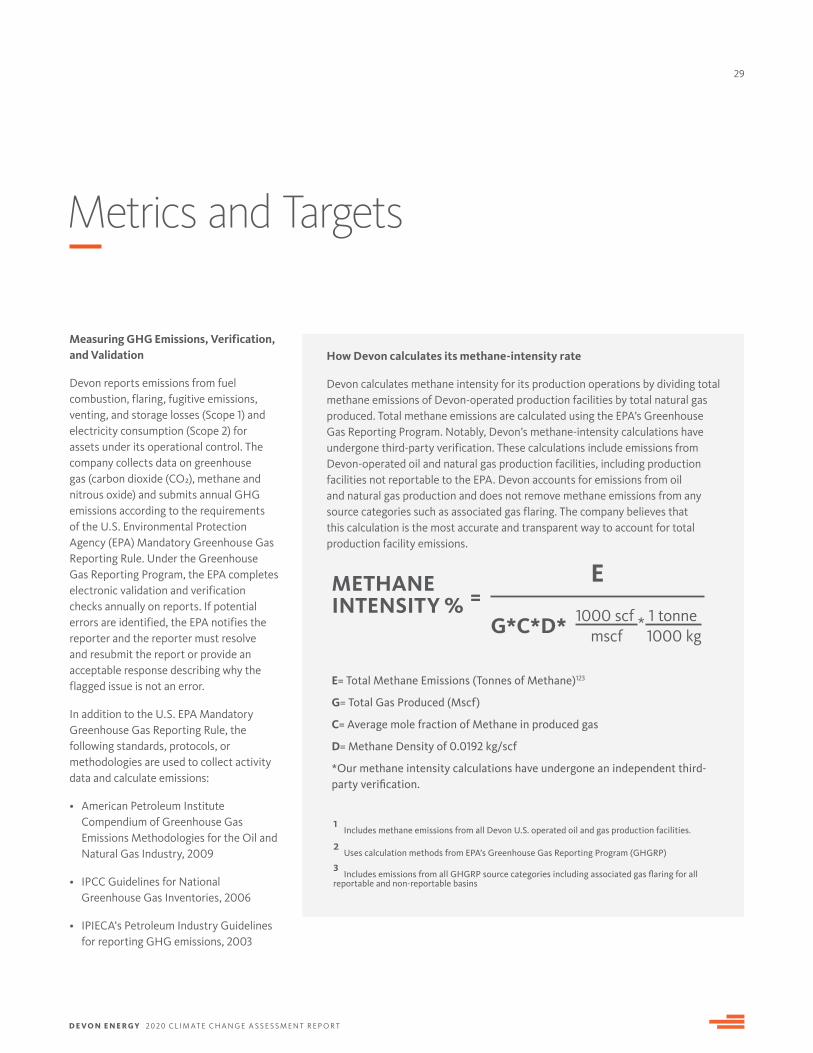
How Devon calculates its methane-intensity rate
Devon calculates methane intensity for its production operations by dividing total methane emissions of Devon-operated production facilities by total natural gas produced. Total methane emissions are calculated using the EPA’s Greenhouse Gas Reporting Program. Notably, Devon’s methane-intensity calculations have undergone third-party verification. These calculations include emissions from Devon-operated oil and natural gas production facilities, including production facilities not reportable to the EPA. Devon accounts for emissions from oil and natural gas production and does not remove methane emissions from any source categories such as associated gas flaring. The company believes that this calculation is the most accurate and transparent way to account for total production facility emissions.
METHANE INTENSITY % =
E
G*C*D* 1000 scfmscf
1 tonne1000 kg
*
E= Total Methane Emissions (Tonnes of Methane)123
G= Total Gas Produced (Mscf)
C= Average mole fraction of Methane in produced gas
D= Methane Density of 0.0192 kg/scf
*Our methane intensity calculations have undergone an independent third-party verification.
1 Includes methane emissions from all Devon U.S. operated oil and gas production facilities.
2 Uses calculation methods from EPA’s Greenhouse Gas Reporting Program (GHGRP)
3 Includes emissions from all GHGRP source categories including associated gas flaring for all reportable and non-reportable basins
D E V O N E N E R G Y 2020 C L I M AT E C H A N G E A S S E S S M E N T R E P O R T
30M E T R I C S A N D TA R G E T S
Targets
Methane Emissions Intensity (% of natural gas produced)
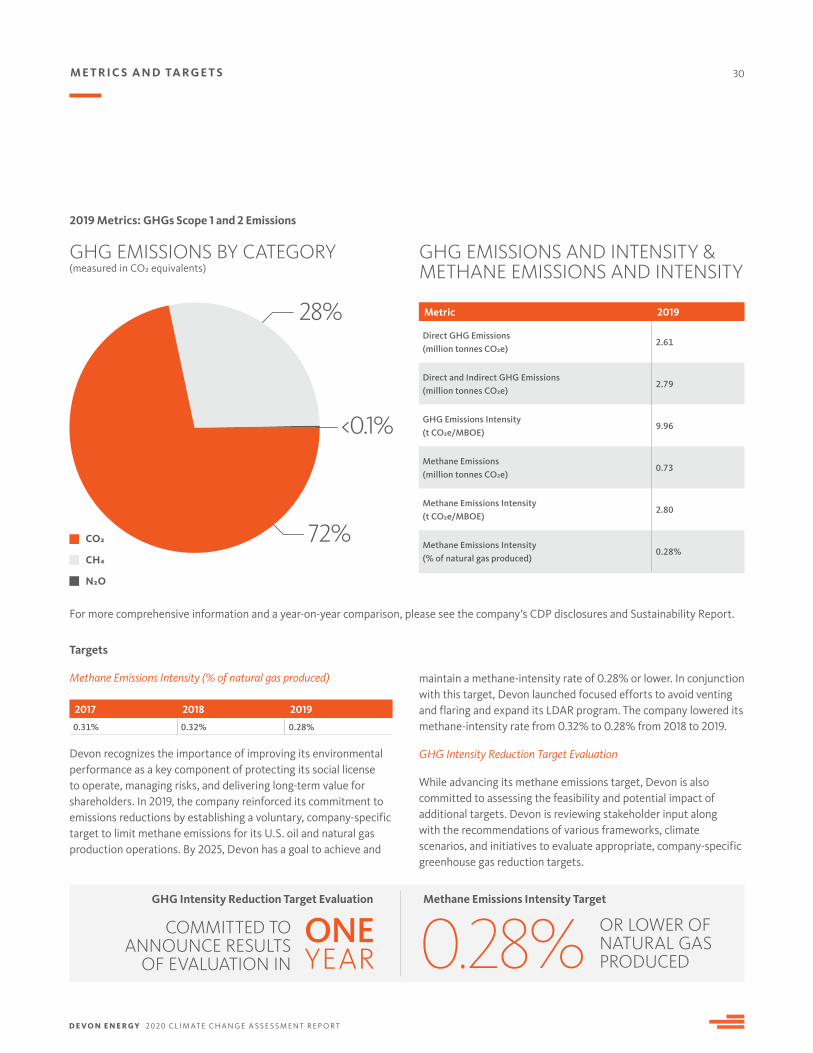
Devon recognizes the importance of improving its environmental performance as a key component of protecting its social license to operate, managing risks, and delivering long-term value for shareholders. In 2019, the company reinforced its commitment to emissions reductions by establishing a voluntary, company-specific target to limit methane emissions for its U.S. oil and natural gas production operations. By 2025, Devon has a goal to achieve and
72%
28%
<0.1%
Metric 2019
Direct GHG Emissions (million tonnes CO2e)
2.61
Direct and Indirect GHG Emissions (million tonnes CO2e)
2.79
GHG Emissions Intensity (t CO2e/MBOE)
9.96
Methane Emissions (million tonnes CO2e)
0.73
Methane Emissions Intensity (t CO2e/MBOE)
2.80
Methane Emissions Intensity (% of natural gas produced)
0.28%
GHG EMISSIONS BY CATEGORY(measured in CO2 equivalents)
GHG EMISSIONS AND INTENSITY & METHANE EMISSIONS AND INTENSITY
2019 Metrics: GHGs Scope 1 and 2 Emissions
CO2
CH4
N2O
2017 2018 2019
0.31% 0.32% 0.28%
maintain a methane-intensity rate of 0.28% or lower. In conjunction with this target, Devon launched focused efforts to avoid venting and flaring and expand its LDAR program. The company lowered its methane-intensity rate from 0.32% to 0.28% from 2018 to 2019.
GHG Intensity Reduction Target Evaluation
While advancing its methane emissions target, Devon is also committed to assessing the feasibility and potential impact of additional targets. Devon is reviewing stakeholder input along with the recommendations of various frameworks, climate scenarios, and initiatives to evaluate appropriate, company-specific greenhouse gas reduction targets.
OR LOWER OF NATURAL GAS PRODUCED0.28%
Methane Emissions Intensity Target
COMMITTED TO ANNOUNCE RESULTS
OF EVALUATION IN
ONEYEAR
GHG Intensity Reduction Target Evaluation
For more comprehensive information and a year-on-year comparison, please see the company’s CDP disclosures and Sustainability Report.
D E V O N E N E R G Y 2020 C L I M AT E C H A N G E A S S E S S M E N T R E P O R T
31
Conclusions
Devon is preparing for a carbon-constrained future through proactive management of climate-related risks and emerging opportunities. This year’s scenario analysis affirms that the company’s business strategy and portfolio of assets are likely to be resilient, while governance and risk management processes are in place to facilitate the company’s ability to respond to changing market conditions.
Devon actively cultivates a strong culture of health, safety, environment stewardship, and emergency preparedness. The company is committed to be transparent and accountable in how it deals with the climate-related issues. Devon will continue to invest in new technologies to improve efficiency in its operations, reduce GHG emission and seize on opportunities to use more alternative sources of energy within its operations. As such, Devon is confident that the company is positioned to deliver value to its shareholders and stakeholders now and in the future.
D E V O N E N E R G Y 2020 C L I M AT E C H A N G E A S S E S S M E N T R E P O R T
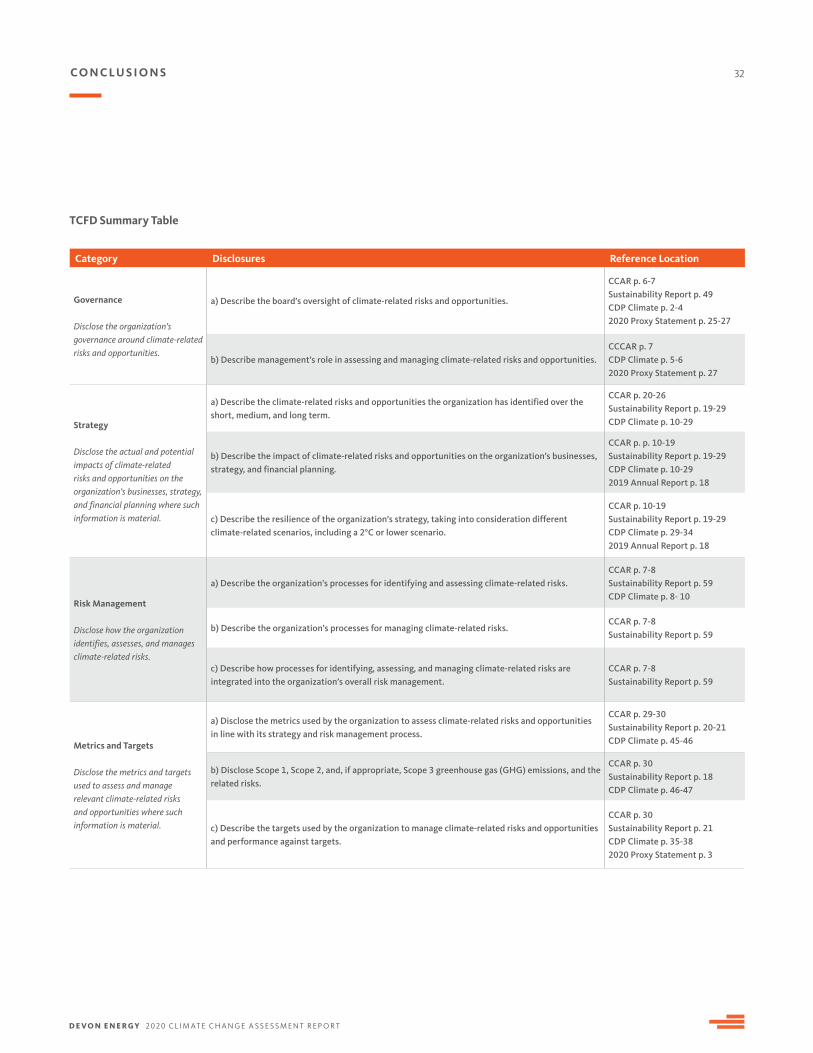
32
Category Disclosures Reference Location
Governance Disclose the organization’s governance around climate-related risks and opportunities.
a) Describe the board’s oversight of climate-related risks and opportunities.
CCAR p. 6-7Sustainability Report p. 49CDP Climate p. 2-42020 Proxy Statement p. 25-27
b) Describe management’s role in assessing and managing climate-related risks and opportunities.CCCAR p. 7CDP Climate p. 5-62020 Proxy Statement p. 27
Strategy Disclose the actual and potential impacts of climate-related risks and opportunities on the organization’s businesses, strategy, and financial planning where such information is material.
a) Describe the climate-related risks and opportunities the organization has identified over the short, medium, and long term.
CCAR p. 20-26Sustainability Report p. 19-29CDP Climate p. 10-29
b) Describe the impact of climate-related risks and opportunities on the organization’s businesses, strategy, and financial planning.
CCAR p. p. 10-19Sustainability Report p. 19-29CDP Climate p. 10-292019 Annual Report p. 18
c) Describe the resilience of the organization’s strategy, taking into consideration different climate-related scenarios, including a 2°C or lower scenario.
CCAR p. 10-19Sustainability Report p. 19-29CDP Climate p. 29-342019 Annual Report p. 18
Risk Management Disclose how the organization identifies, assesses, and manages climate-related risks.
a) Describe the organization’s processes for identifying and assessing climate-related risks.CCAR p. 7-8 Sustainability Report p. 59CDP Climate p. 8- 10
b) Describe the organization’s processes for managing climate-related risks.CCAR p. 7-8Sustainability Report p. 59
c) Describe how processes for identifying, assessing, and managing climate-related risks are integrated into the organization’s overall risk management.
CCAR p. 7-8Sustainability Report p. 59
Metrics and Targets Disclose the metrics and targets used to assess and manage relevant climate-related risks and opportunities where such information is material.
a) Disclose the metrics used by the organization to assess climate-related risks and opportunities in line with its strategy and risk management process.
CCAR p. 29-30Sustainability Report p. 20-21CDP Climate p. 45-46
b) Disclose Scope 1, Scope 2, and, if appropriate, Scope 3 greenhouse gas (GHG) emissions, and the related risks.
CCAR p. 30Sustainability Report p. 18CDP Climate p. 46-47
c) Describe the targets used by the organization to manage climate-related risks and opportunities and performance against targets.
CCAR p. 30Sustainability Report p. 21CDP Climate p. 35-382020 Proxy Statement p. 3
TCFD Summary Table
C O N C LU S I O N S
D E V O N E N E R G Y 2020 C L I M AT E C H A N G E A S S E S S M E N T R E P O R T
33
Methodological Appendix
This section details the methodology that ICF used to generate its price forecasts and to adapt and further analyze price forecasts from IEA.
ICF Oil Prices
ICF’s oil prices have been estimated using a combination of near-term futures prices and a long-term assessment of oil market fundamentals. For 2020, WTI futures were used to forecast oil prices. For 2021 through 2025, a blend of futures prices and ICF’s fundamentals forecast is used. For the long-term, ICF assumes an equilibrium marginal production cost of $70/Bbl. That $70/Bbl Refiner Acquisition Cost of Crude Oil (RACC) has been converted to a WTI Cushing price for this analysis. In this report, estimated prices rely on ICF’s Q1 2020 Base Case Projection.
Oil prices for the ICF Sustainable Development Case have been estimated by applying a derived price elasticity14 for oil to the demand change between the IEA Stated Policies Scenario and the IEA Sustainable Development Scenario. For example, in 2030, IEA forecasted a 17% reduction in demand and a 29% reduction in price for the WEO 2019 Sustainable Development Scenario compared to the IEA Stated Policies Scenario. In this example, ICF used the resulting 0.59 price elasticity of demand for 2030 to determine the expected price change that would result if the same demand change that occurred between the IEA scenarios occurred between the ICF Base Case and the ICF Sustainable Development Case in the year 2030.
The IEA price elasticity is about 0.60 in the near term and 0.85 in the long term. The average elasticity over the entire 2020-2050 projection period is about 0.75.
IEA Oil Prices
For both its Stated Policies Scenario and the Sustainable Development Scenario, IEA provided an average worldwide oil importer price through 2040. ICF extrapolated the price to 2050 and converted the worldwide oil importer price to a WTI price forecast by carrying forward the 2018 difference between the IEA importer average price and the 2018 average WTI price. This difference was about $3/Bbl.
14 Oil price elasticity of demand measures the responsiveness of oil demand with the change in oil price. The elasticity is calculated by dividing the percentage change in oil demand by the percentage change in oil price. Natural gas price elasticity of demand is calculated with the same methodology as oil price elasticity of demand using IEA’s natural gas price and demand forecast.
D E V O N E N E R G Y 2020 C L I M AT E C H A N G E A S S E S S M E N T R E P O R T
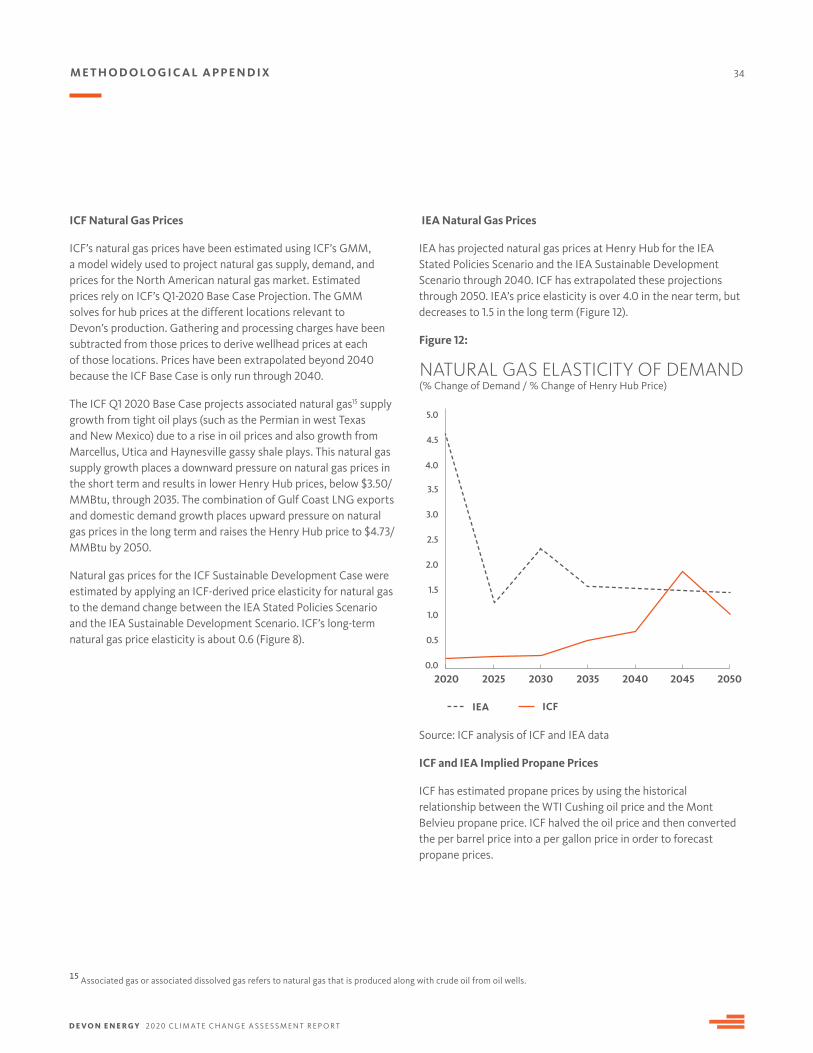
34
ICF Natural Gas Prices
ICF’s natural gas prices have been estimated using ICF’s GMM, a model widely used to project natural gas supply, demand, and prices for the North American natural gas market. Estimated prices rely on ICF’s Q1-2020 Base Case Projection. The GMM solves for hub prices at the different locations relevant to Devon’s production. Gathering and processing charges have been subtracted from those prices to derive wellhead prices at each of those locations. Prices have been extrapolated beyond 2040 because the ICF Base Case is only run through 2040.
The ICF Q1 2020 Base Case projects associated natural gas15 supply growth from tight oil plays (such as the Permian in west Texas and New Mexico) due to a rise in oil prices and also growth from Marcellus, Utica and Haynesville gassy shale plays. This natural gas supply growth places a downward pressure on natural gas prices in the short term and results in lower Henry Hub prices, below $3.50/MMBtu, through 2035. The combination of Gulf Coast LNG exports and domestic demand growth places upward pressure on natural gas prices in the long term and raises the Henry Hub price to $4.73/MMBtu by 2050.
Natural gas prices for the ICF Sustainable Development Case were estimated by applying an ICF-derived price elasticity for natural gas to the demand change between the IEA Stated Policies Scenario and the IEA Sustainable Development Scenario. ICF’s long-term natural gas price elasticity is about 0.6 (Figure 8).
IEA Natural Gas Prices
IEA has projected natural gas prices at Henry Hub for the IEA Stated Policies Scenario and the IEA Sustainable Development Scenario through 2040. ICF has extrapolated these projections through 2050. IEA’s price elasticity is over 4.0 in the near term, but decreases to 1.5 in the long term (Figure 12).
Figure 12:
Source: ICF analysis of ICF and IEA data
ICF and IEA Implied Propane Prices
ICF has estimated propane prices by using the historical relationship between the WTI Cushing oil price and the Mont Belvieu propane price. ICF halved the oil price and then converted the per barrel price into a per gallon price in order to forecast propane prices.
15 Associated gas or associated dissolved gas refers to natural gas that is produced along with crude oil from oil wells.
M E T H O D O LO G I C A L A P P E N D I X
NATURAL GAS ELASTICITY OF DEMAND(% Change of Demand / % Change of Henry Hub Price)
2020 2025 2030 2035 2040 2045 2050
2.5
3.0
3.5
4.0
4.5
5.0
2.0
1.5
1.0
0.5
0.0
IEA ICF
D E V O N E N E R G Y 2020 C L I M AT E C H A N G E A S S E S S M E N T R E P O R T
35
Disclaimer
This report contains information, terms, and standards from third parties, such as ICF, the TCFD, and the IEA. The contents of this report are intended as guidance only and may not be comprehensive in scope or coverage, including as to such third parties. Devon does not intend to and is not endorsing or adopting phrases, specific terms, or recommendations from the third parties. Devon does not make any express or implied representations or warranties and shall not assume any liability whatsoever for providing guidance or using the third-party information, or for any errors, mistakes, or omissions in this report. This report considers a number of different scenarios. These scenarios are not intended to be predictions of what is likely to happen or what Devon believes is likely to happen. Instead, the scenarios are meant to examine the potential effects of several regulatory, economic, and societal conditions; they do not provide a comprehensive description of all possible future outcomes and there can be no assurance that the scenarios presented in this report are a reliable indicator of the actual impact of climate change on Devon’s portfolio.
The concept of materiality used in this report is not intended to correspond to the concept of materiality associated with the concept of materiality as used for the purposes of creating our disclosures required by the SEC. Please refer to our 2020 Annual Report on Form 10-K and our other filings with the SEC for information about the material risks and uncertainties to our business and operations, and our industry in general. This report covers our owned and operated businesses and does
not address the performance or operations of our suppliers, contractors, and partners unless otherwise noted. As used in this report, the term "Devon" and such terms as "the company," "their," "our," "its," "we", and "us" may refer to our ultimate parent company (Devon Energy Corporation), one or more of Devon's consolidated subsidiaries, or to all of them taken as a whole.
This report includes “forward-looking statements” as defined by the SEC. Such statements relate to the manner in which Devon intends to conduct certain of its activities, based on management’s current plans and expectations. Such statements are not promises or guarantees of future conduct or policy and are subject to a number of assumptions, risks and uncertainties, many of which are beyond our control and are difficult or impossible to identify in advance. Devon’s actual activities, including the development, implementation or continuation of any program, target or initiative discussed in this report may differ materially in the future. The forward-looking statements in this report are made as of the date of submittal of our responses to this report, even if subsequently made available by Devon on its website or otherwise. Devon does not undertake and expressly disclaims any obligation to update the forward-looking statements as a result of new information, future events, or otherwise.
Forward-looking statements are often identified by use of the words "will," "may," "should," "could," "expects," “forecasts,” “projections,” “estimates,” “plans,”
“expectations, “targets,” “opportunities,” “potential,” “outlook” and other similar terminology. Such statements concerning future performance are subject to a variety of risks and uncertainties that could cause Devon’s actual results to differ materially from the forward-looking statements contained herein. Risks and uncertainties are described in more detail in the “Risk Factors” section of our most recent Form 10-K and in our other filings with the SEC. The forward-looking statements provided in this report are based on management’s examination of historical operating trends, the information which was used to prepare reserve reports and other data in Devon’s possession or available from third parties. Devon cautions that its future oil, natural gas and NGL production, revenues and expenses are subject to all of the risks and uncertainties normally incident to the exploration for and development, production and sale of oil, natural gas and NGLs. These risks include, but are not limited to, price volatility, inflation or lack of availability of goods and services, environmental risks, drilling risks, political changes, changes in laws or regulations, the uncertainty inherent in estimating future oil and gas production or reserves and, as noted above, other risks identified in our Form 10-K and our other filings with the SEC. Moreover, we note that the forecasts and scenarios included in this Report are subject to additional layers of uncertainty due to the extensive timelines involved, and the levels of estimation and extrapolation necessary to produce data, and therefore are likely to change, potentially materially, in the future.
D E V O N E N E R G Y 2020 C L I M AT E C H A N G E A S S E S S M E N T R E P O R T
36
API - American Petroleum Institute
AXPC - American Exploration and Production Council
Bbl - Barrels of oil
CCAR - Climate Change Assessment Report
CDP - formerly Carbon Disclosure Project
CO2 - Carbon dioxide
CH4 - Methane
EHS - Environmental, Health, and Safety
EPA - Environmental Protection Agency
ERM - Enterprise Risk Management
ESG - Environment, Social, Governance
EWI - Energy Water Initiative
FEMA - Federal Emergency Management Agency
GHGs - Greenhouse gases
GMM - Gas Market Model (ICF)
ISS - Institutional Shareholder Services
List of Acronyms
LDAR - Leak detection and repair
LNG - Liquefied natural gas
IEA - International Energy Agency
IPCC - Intergovernmental Panel on Climate Change
IPIECA - formerly International Petroleum Industry Environmental Conservation Association
MBOE - Thousands of barrels of oil equivalent
MMBtu - Million British thermal units
MSCI - Morgan Stanley Capital International
N2O - Nitrous oxide
NGL - Natural gas liquids
NIMS - National Incident Management System
TCFD - Task Force on Climate-related Financial Disclosures
VOCs - Volatile organic compounds
WEO - World Energy Outlook (IEA annual report)
WTI - West Texas Intermediate (benchmark oil price)
D E V O N E N E R G Y 2020 C L I M AT E C H A N G E A S S E S S M E N T R E P O R T