Embed Size (px)
Citation preview
1
2020-21TRIMESTER 1REPORTWITH PHASE 1 MITIGATIONMay 1, 2020 to August 31, 2020
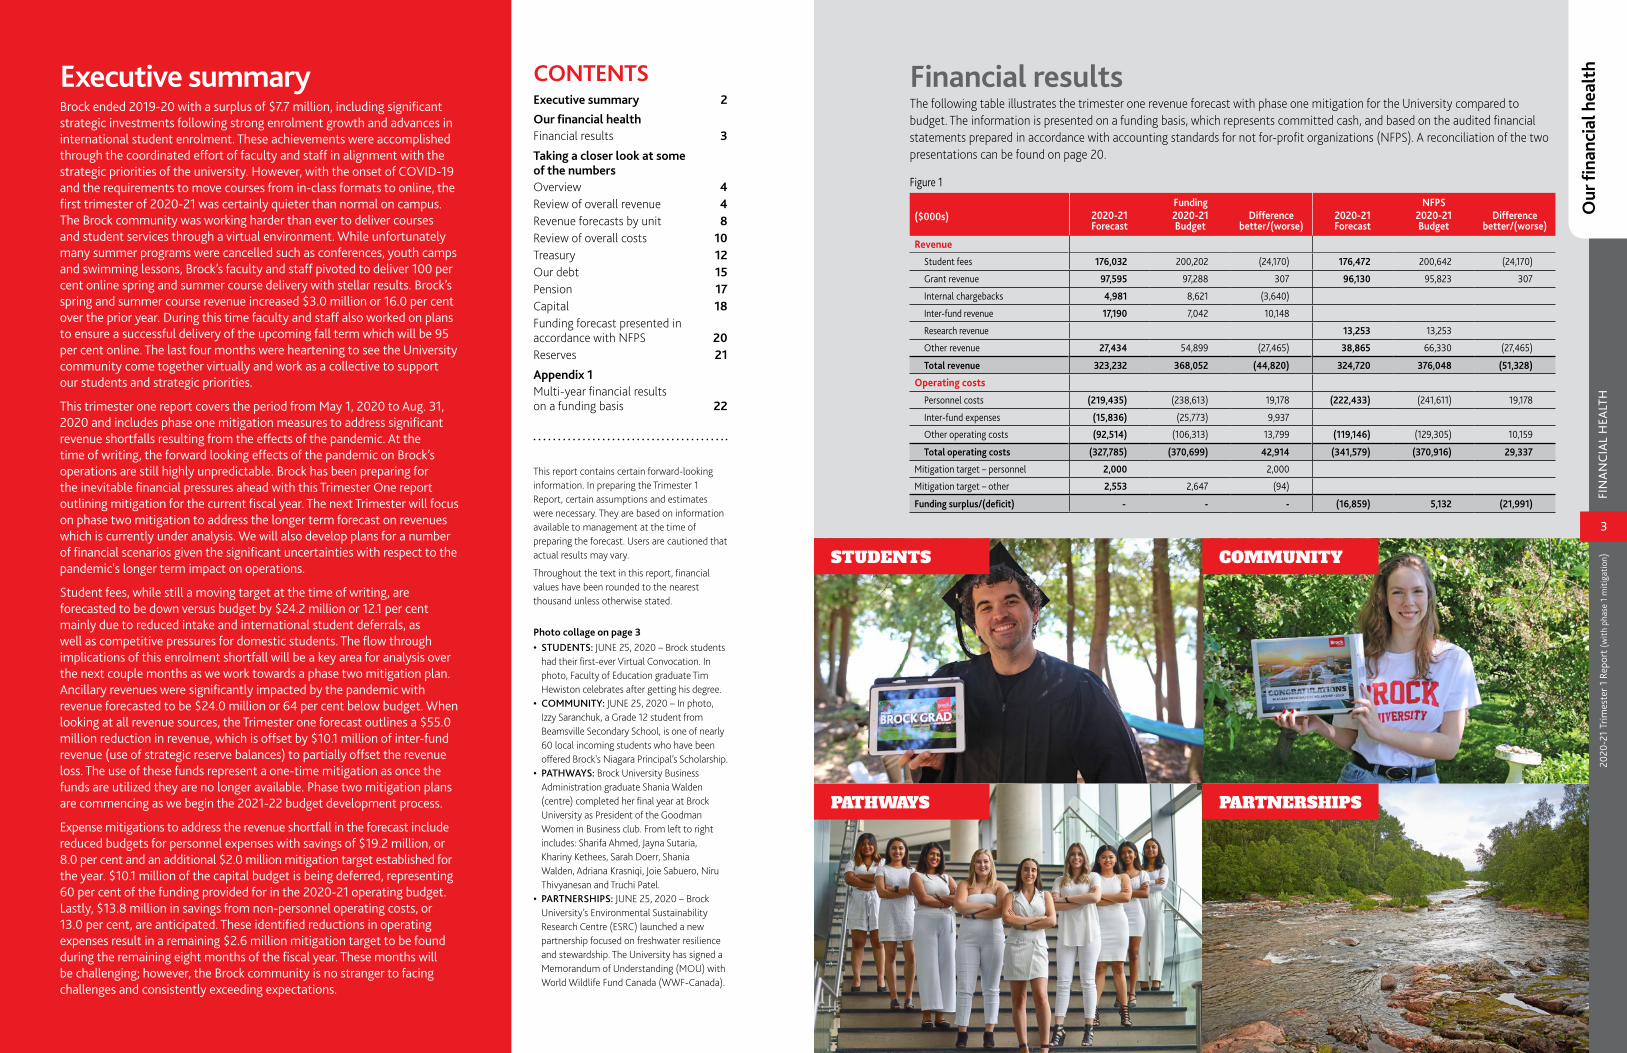
Financial resultsThe following table illustrates the trimester one revenue forecast with phase one mitigation for the University compared to budget. The information is presented on a funding basis, which represents committed cash, and based on the audited financial statements prepared in accordance with accounting standards for not for-profit organizations (NFPS). A reconciliation of the two presentations can be found on page 20.
Figure 1
($000s) Funding NFPS
2020-21 Forecast
2020-21 Budget
Differencebetter/(worse)
2020-21 Forecast
2020-21 Budget
Differencebetter/(worse)
Revenue
Student fees 176,032 200,202 (24,170) 176,472 200,642 (24,170)
Grant revenue 97,595 97,288 307 96,130 95,823 307
Internal chargebacks 4,981 8,621 (3,640)
Inter-fund revenue 17,190 7,042 10,148
Research revenue 13,253 13,253
Other revenue 27,434 54,899 (27,465) 38,865 66,330 (27,465)
Total revenue 323,232 368,052 (44,820) 324,720 376,048 (51,328)
Operating costs
Personnel costs (219,435) (238,613) 19,178 (222,433) (241,611) 19,178
Inter-fund expenses (15,836) (25,773) 9,937
Other operating costs (92,514) (106,313) 13,799 (119,146) (129,305) 10,159
Total operating costs (327,785) (370,699) 42,914 (341,579) (370,916) 29,337
Mitigation target – personnel 2,000 2,000
Mitigation target – other 2,553 2,647 (94)
Funding surplus/(deficit) - - - (16,859) 5,132 (21,991)
PARTNERSHIPSPATHWAYS
COMMUNITYSTUDENTS
3
2020
-21
Trim
este
r 1 R
epor
t (w
ith p
hase
1 m
itiga
tion)
FI
NA
NC
IAL
HEA
LTH
This report contains certain forward-looking information. In preparing the Trimester 1 Report, certain assumptions and estimates were necessary. They are based on information available to management at the time of preparing the forecast. Users are cautioned that actual results may vary.
Throughout the text in this report, financial values have been rounded to the nearest thousand unless otherwise stated.
Photo collage on page 3• STUDENTS: JUNE 25, 2020 – Brock students
had their first-ever Virtual Convocation. In photo, Faculty of Education graduate Tim Hewiston celebrates after getting his degree.
• COMMUNITY: JUNE 25, 2020 – In photo, Izzy Saranchuk, a Grade 12 student from Beamsville Secondary School, is one of nearly 60 local incoming students who have been offered Brock's Niagara Principal’s Scholarship.
• PATHWAYS: Brock University Business Administration graduate Shania Walden (centre) completed her final year at Brock University as President of the Goodman Women in Business club. From left to right includes: Sharifa Ahmed, Jayna Sutaria, Khariny Kethees, Sarah Doerr, Shania Walden, Adriana Krasniqi, Joie Sabuero, Niru Thivyanesan and Truchi Patel.
• PARTNERSHIPS: JUNE 25, 2020 – Brock University’s Environmental Sustainability Research Centre (ESRC) launched a new partnership focused on freshwater resilience and stewardship. The University has signed a Memorandum of Understanding (MOU) with World Wildlife Fund Canada (WWF-Canada).
Executive summary Brock ended 2019-20 with a surplus of $7.7 million, including significant strategic investments following strong enrolment growth and advances in international student enrolment. These achievements were accomplished through the coordinated effort of faculty and staff in alignment with the strategic priorities of the university. However, with the onset of COVID-19 and the requirements to move courses from in-class formats to online, the first trimester of 2020-21 was certainly quieter than normal on campus. The Brock community was working harder than ever to deliver courses and student services through a virtual environment. While unfortunately many summer programs were cancelled such as conferences, youth camps and swimming lessons, Brock’s faculty and staff pivoted to deliver 100 per cent online spring and summer course delivery with stellar results. Brock’s spring and summer course revenue increased $3.0 million or 16.0 per cent over the prior year. During this time faculty and staff also worked on plans to ensure a successful delivery of the upcoming fall term which will be 95 per cent online. The last four months were heartening to see the University community come together virtually and work as a collective to support our students and strategic priorities.
This trimester one report covers the period from May 1, 2020 to Aug. 31, 2020 and includes phase one mitigation measures to address significant revenue shortfalls resulting from the effects of the pandemic. At the time of writing, the forward looking effects of the pandemic on Brock’s operations are still highly unpredictable. Brock has been preparing for the inevitable financial pressures ahead with this Trimester One report outlining mitigation for the current fiscal year. The next Trimester will focus on phase two mitigation to address the longer term forecast on revenues which is currently under analysis. We will also develop plans for a number of financial scenarios given the significant uncertainties with respect to the pandemic's longer term impact on operations.
Student fees, while still a moving target at the time of writing, are forecasted to be down versus budget by $24.2 million or 12.1 per cent mainly due to reduced intake and international student deferrals, as well as competitive pressures for domestic students. The flow through implications of this enrolment shortfall will be a key area for analysis over the next couple months as we work towards a phase two mitigation plan. Ancillary revenues were significantly impacted by the pandemic with revenue forecasted to be $24.0 million or 64 per cent below budget. When looking at all revenue sources, the Trimester one forecast outlines a $55.0 million reduction in revenue, which is offset by $10.1 million of inter-fund revenue (use of strategic reserve balances) to partially offset the revenue loss. The use of these funds represent a one-time mitigation as once the funds are utilized they are no longer available. Phase two mitigation plans are commencing as we begin the 2021-22 budget development process.
Expense mitigations to address the revenue shortfall in the forecast include reduced budgets for personnel expenses with savings of $19.2 million, or 8.0 per cent and an additional $2.0 million mitigation target established for the year. $10.1 million of the capital budget is being deferred, representing 60 per cent of the funding provided for in the 2020-21 operating budget. Lastly, $13.8 million in savings from non-personnel operating costs, or 13.0 per cent, are anticipated. These identified reductions in operating expenses result in a remaining $2.6 million mitigation target to be found during the remaining eight months of the fiscal year. These months will be challenging; however, the Brock community is no stranger to facing challenges and consistently exceeding expectations.
Our
fina
ncia
l hea
lthCONTENTS
Executive summary 2
Our financial health Financial results 3
Taking a closer look at some of the numbers Overview 4Review of overall revenue 4Revenue forecasts by unit 8Review of overall costs 10Treasury 12Our debt 15Pension 17Capital 18Funding forecast presented in accordance with NFPS 20Reserves 21
Appendix 1 Multi-year financial results on a funding basis 22
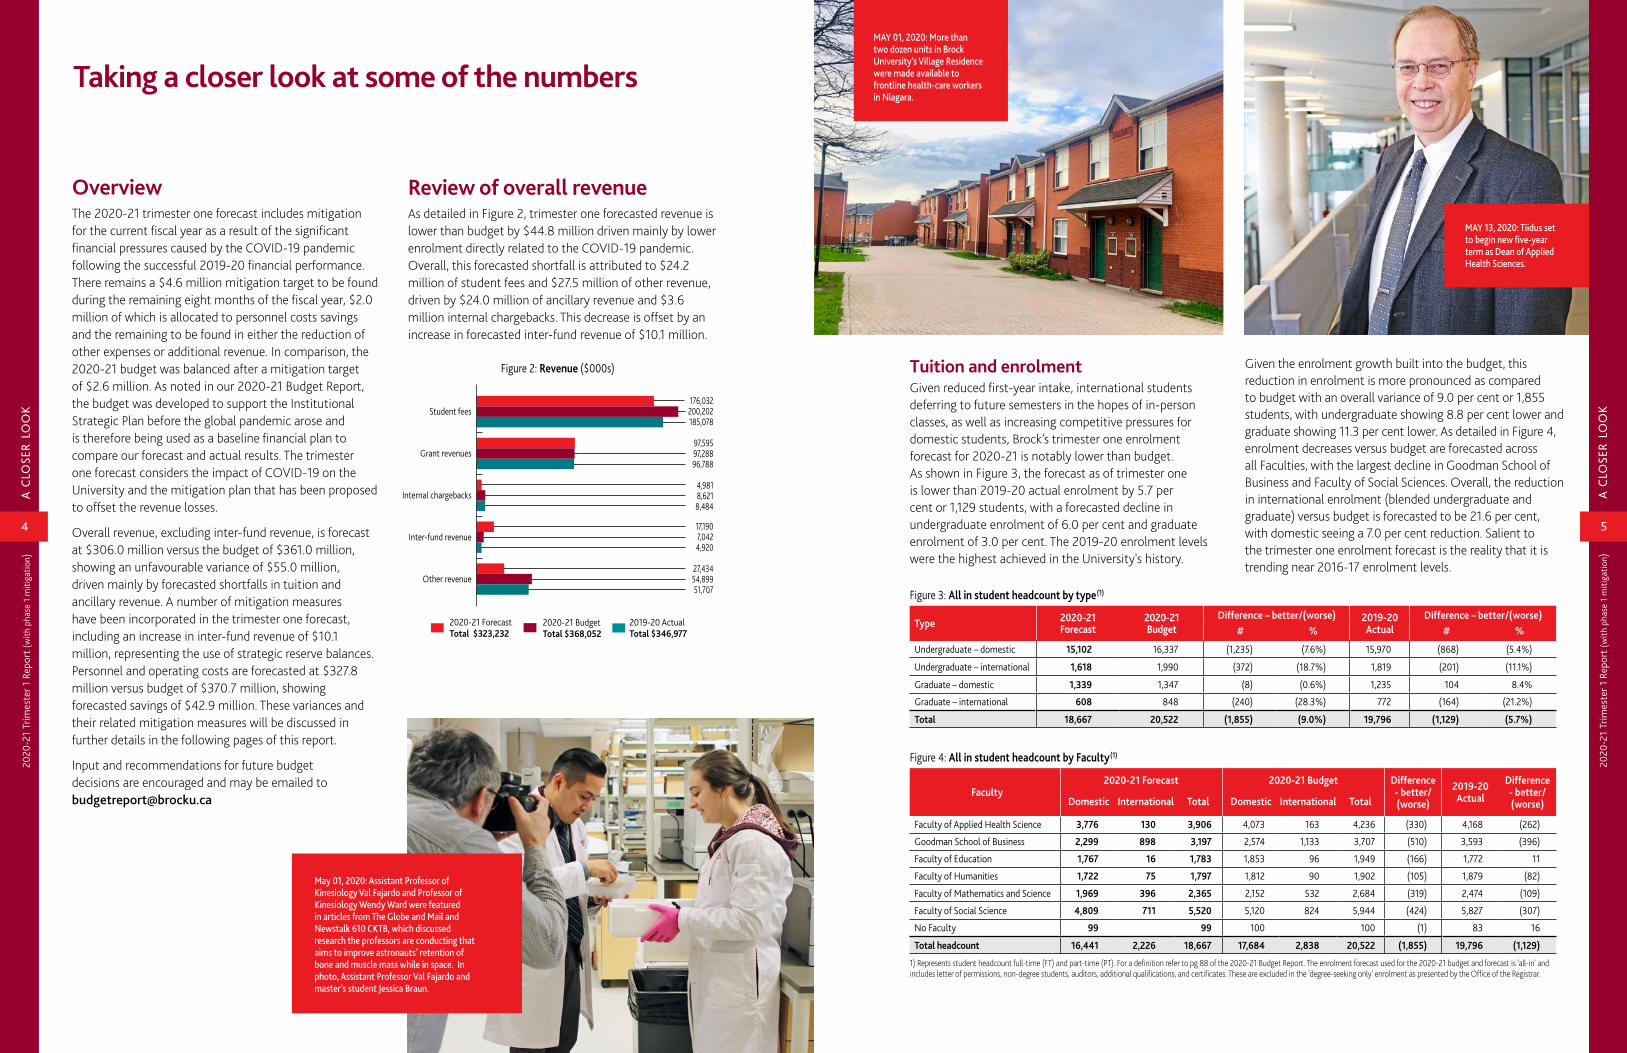
MAY 13, 2020: Tiidus set to begin new five-year term as Dean of Applied Health Sciences.
5
2020
-21
Trim
este
r 1 R
epor
t (w
ith p
hase
1 m
itiga
tion)
A
CLO
SER
LOO
K
4
2020
-21
Trim
este
r 1 R
epor
t (w
ith p
hase
1 m
itiga
tion)
A
CLO
SER
LOO
K
OverviewThe 2020-21 trimester one forecast includes mitigation for the current fiscal year as a result of the significant financial pressures caused by the COVID-19 pandemic following the successful 2019-20 financial performance. There remains a $4.6 million mitigation target to be found during the remaining eight months of the fiscal year, $2.0 million of which is allocated to personnel costs savings and the remaining to be found in either the reduction of other expenses or additional revenue. In comparison, the 2020-21 budget was balanced after a mitigation target of $2.6 million. As noted in our 2020-21 Budget Report, the budget was developed to support the Institutional Strategic Plan before the global pandemic arose and is therefore being used as a baseline financial plan to compare our forecast and actual results. The trimester one forecast considers the impact of COVID-19 on the University and the mitigation plan that has been proposed to offset the revenue losses.
Overall revenue, excluding inter-fund revenue, is forecast at $306.0 million versus the budget of $361.0 million, showing an unfavourable variance of $55.0 million, driven mainly by forecasted shortfalls in tuition and ancillary revenue. A number of mitigation measures have been incorporated in the trimester one forecast, including an increase in inter-fund revenue of $10.1 million, representing the use of strategic reserve balances. Personnel and operating costs are forecasted at $327.8 million versus budget of $370.7 million, showing forecasted savings of $42.9 million. These variances and their related mitigation measures will be discussed in further details in the following pages of this report.
Input and recommendations for future budget decisions are encouraged and may be emailed to [email protected]
Taking a closer look at some of the numbers
May 01, 2020: Assistant Professor of Kinesiology Val Fajardo and Professor of Kinesiology Wendy Ward were featured in articles from The Globe and Mail and Newstalk 610 CKTB, which discussed research the professors are conducting that aims to improve astronauts’ retention of bone and muscle mass while in space. In photo, Assistant Professor Val Fajardo and master’s student Jessica Braun.
176,032 200,202185,078
97,595 97,28896,788
4,981 8,6218,484
17,190 7,0424,920
27,434 54,89951,707
2019-20 ActualTotal $346,977
2020-21 ForecastTotal $323,232
2020-21 BudgetTotal $368,052
Figure 2: Revenue ($000s)
Student fees
Grant revenues
Internal chargebacks
Inter-fund revenue
Other revenue
Review of overall revenueAs detailed in Figure 2, trimester one forecasted revenue is lower than budget by $44.8 million driven mainly by lower enrolment directly related to the COVID-19 pandemic. Overall, this forecasted shortfall is attributed to $24.2 million of student fees and $27.5 million of other revenue, driven by $24.0 million of ancillary revenue and $3.6 million internal chargebacks. This decrease is offset by an increase in forecasted inter-fund revenue of $10.1 million.
Tuition and enrolmentGiven reduced first-year intake, international students deferring to future semesters in the hopes of in-person classes, as well as increasing competitive pressures for domestic students, Brock’s trimester one enrolment forecast for 2020-21 is notably lower than budget. As shown in Figure 3, the forecast as of trimester one is lower than 2019-20 actual enrolment by 5.7 per cent or 1,129 students, with a forecasted decline in undergraduate enrolment of 6.0 per cent and graduate enrolment of 3.0 per cent. The 2019-20 enrolment levels were the highest achieved in the University's history.
Given the enrolment growth built into the budget, this reduction in enrolment is more pronounced as compared to budget with an overall variance of 9.0 per cent or 1,855 students, with undergraduate showing 8.8 per cent lower and graduate showing 11.3 per cent lower. As detailed in Figure 4, enrolment decreases versus budget are forecasted across all Faculties, with the largest decline in Goodman School of Business and Faculty of Social Sciences. Overall, the reduction in international enrolment (blended undergraduate and graduate) versus budget is forecasted to be 21.6 per cent, with domestic seeing a 7.0 per cent reduction. Salient to the trimester one enrolment forecast is the reality that it is trending near 2016-17 enrolment levels.
MAY 01, 2020: More than two dozen units in Brock University’s Village Residence were made available to frontline health-care workers in Niagara.
Figure 4: All in student headcount by Faculty(1)
Faculty2020-21 Forecast 2020-21 Budget Difference
- better/(worse)
2019-20 Actual
Difference - better/(worse)Domestic International Total Domestic International Total
Faculty of Applied Health Science 3,776 130 3,906 4,073 163 4,236 (330) 4,168 (262)
Goodman School of Business 2,299 898 3,197 2,574 1,133 3,707 (510) 3,593 (396)
Faculty of Education 1,767 16 1,783 1,853 96 1,949 (166) 1,772 11
Faculty of Humanities 1,722 75 1,797 1,812 90 1,902 (105) 1,879 (82)
Faculty of Mathematics and Science 1,969 396 2,365 2,152 532 2,684 (319) 2,474 (109)
Faculty of Social Science 4,809 711 5,520 5,120 824 5,944 (424) 5,827 (307)
No Faculty 99 99 100 100 (1) 83 16
Total headcount 16,441 2,226 18,667 17,684 2,838 20,522 (1,855) 19,796 (1,129)
1) Represents student headcount full-time (FT) and part-time (PT). For a definition refer to pg 88 of the 2020-21 Budget Report. The enrolment forecast used for the 2020-21 budget and forecast is 'all-in' and includes letter of permissions, non-degree students, auditors, additional qualifications, and certificates. These are excluded in the 'degree-seeking only' enrolment as presented by the Office of the Registrar.
Figure 3: All in student headcount by type(1)
Type 2020-21 Forecast
2020-21 Budget
Difference – better/(worse) 2019-20 Actual
Difference – better/(worse)# % # %
Undergraduate – domestic 15,102 16,337 (1,235) (7.6%) 15,970 (868) (5.4%)
Undergraduate – international 1,618 1,990 (372) (18.7%) 1,819 (201) (11.1%)
Graduate – domestic 1,339 1,347 (8) (0.6%) 1,235 104 8.4%
Graduate – international 608 848 (240) (28.3%) 772 (164) (21.2%)
Total 18,667 20,522 (1,855) (9.0%) 19,796 (1,129) (5.7%)
7
2020
-21
Trim
este
r 1 R
epor
t (w
ith p
hase
1 m
itiga
tion)
A
CLO
SER
LOO
K
6
2020
-21
Trim
este
r 1 R
epor
t (w
ith p
hase
1 m
itiga
tion)
A
CLO
SER
LOO
K
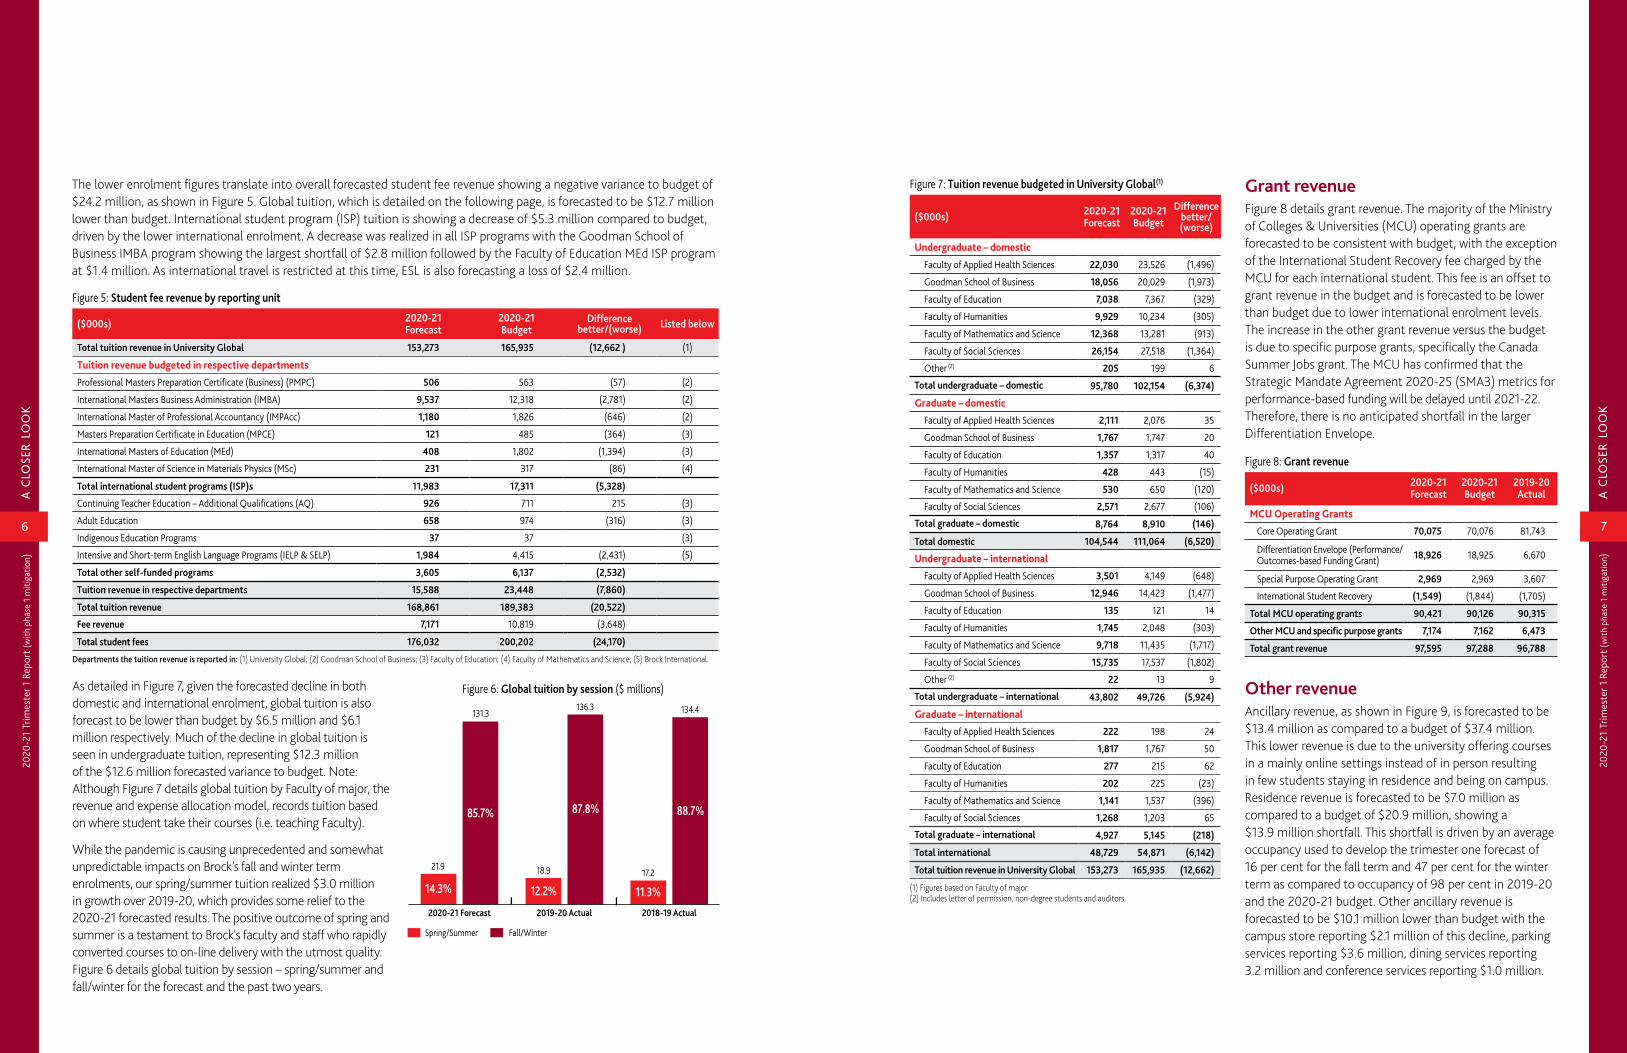
The lower enrolment figures translate into overall forecasted student fee revenue showing a negative variance to budget of $24.2 million, as shown in Figure 5. Global tuition, which is detailed on the following page, is forecasted to be $12.7 million lower than budget. International student program (ISP) tuition is showing a decrease of $5.3 million compared to budget, driven by the lower international enrolment. A decrease was realized in all ISP programs with the Goodman School of Business IMBA program showing the largest shortfall of $2.8 million followed by the Faculty of Education MEd ISP program at $1.4 million. As international travel is restricted at this time, ESL is also forecasting a loss of $2.4 million.
Figure 5: Student fee revenue by reporting unit
($000s) 2020-21 Forecast
2020-21 Budget
Differencebetter/(worse) Listed below
Total tuition revenue in University Global 153,273 165,935 (12,662 ) (1)
Tuition revenue budgeted in respective departments
Professional Masters Preparation Certificate (Business) (PMPC) 506 563 (57) (2)
International Masters Business Administration (IMBA) 9,537 12,318 (2,781) (2)
International Master of Professional Accountancy (IMPAcc) 1,180 1,826 (646) (2)
Masters Preparation Certificate in Education (MPCE) 121 485 (364) (3)
International Masters of Education (MEd) 408 1,802 (1,394) (3)
International Master of Science in Materials Physics (MSc) 231 317 (86) (4)
Total international student programs (ISP)s 11,983 17,311 (5,328)
Continuing Teacher Education – Additional Qualifications (AQ) 926 711 215 (3)
Adult Education 658 974 (316) (3)
Indigenous Education Programs 37 37 (3)
Intensive and Short-term English Language Programs (IELP & SELP) 1,984 4,415 (2,431) (5)
Total other self-funded programs 3,605 6,137 (2,532)
Tuition revenue in respective departments 15,588 23,448 (7,860)
Total tuition revenue 168,861 189,383 (20,522)
Fee revenue 7,171 10,819 (3,648)
Total student fees 176,032 200,202 (24,170)
Departments the tuition revenue is reported in: (1) University Global; (2) Goodman School of Business; (3) Faculty of Education; (4) Faculty of Mathematics and Science; (5) Brock International.
Spring/Summer Fall/Winter
2018-19 Actual2019-20 Actual2020-21 Forecast
14.3%
85.7%
12.2%
87.8%
11.3%
88.7%
Figure 6: Global tuition by session ($ millions)
21.9
131.3
18.9 17.2
136.3 134.4
As detailed in Figure 7, given the forecasted decline in both domestic and international enrolment, global tuition is also forecast to be lower than budget by $6.5 million and $6.1 million respectively. Much of the decline in global tuition is seen in undergraduate tuition, representing $12.3 million of the $12.6 million forecasted variance to budget. Note: Although Figure 7 details global tuition by Faculty of major, the revenue and expense allocation model, records tuition based on where student take their courses (i.e. teaching Faculty).
While the pandemic is causing unprecedented and somewhat unpredictable impacts on Brock’s fall and winter term enrolments, our spring/summer tuition realized $3.0 million in growth over 2019-20, which provides some relief to the 2020-21 forecasted results. The positive outcome of spring and summer is a testament to Brock's faculty and staff who rapidly converted courses to on-line delivery with the utmost quality. Figure 6 details global tuition by session – spring/summer and fall/winter for the forecast and the past two years.
Figure 8: Grant revenue
($000s) 2020-21 Forecast
2020-21 Budget
2019-20Actual
MCU Operating Grants
Core Operating Grant 70,075 70,076 81,743
Differentiation Envelope (Performance/ Outcomes-based Funding Grant) 18,926 18,925 6,670
Special Purpose Operating Grant 2,969 2,969 3,607
International Student Recovery (1,549) (1,844) (1,705)
Total MCU operating grants 90,421 90,126 90,315
Other MCU and specific purpose grants 7,174 7,162 6,473
Total grant revenue 97,595 97,288 96,788
Grant revenueFigure 8 details grant revenue. The majority of the Ministry of Colleges & Universities (MCU) operating grants are forecasted to be consistent with budget, with the exception of the International Student Recovery fee charged by the MCU for each international student. This fee is an offset to grant revenue in the budget and is forecasted to be lower than budget due to lower international enrolment levels. The increase in the other grant revenue versus the budget is due to specific purpose grants, specifically the Canada Summer Jobs grant. The MCU has confirmed that the Strategic Mandate Agreement 2020-25 (SMA3) metrics for performance-based funding will be delayed until 2021-22. Therefore, there is no anticipated shortfall in the larger Differentiation Envelope.
Figure 7: Tuition revenue budgeted in University Global(1)
($000s) 2020-21 Forecast
2020-21 Budget
Differencebetter/(worse)
Undergraduate – domestic
Faculty of Applied Health Sciences 22,030 23,526 (1,496)
Goodman School of Business 18,056 20,029 (1,973)
Faculty of Education 7,038 7,367 (329)
Faculty of Humanities 9,929 10,234 (305)
Faculty of Mathematics and Science 12,368 13,281 (913)
Faculty of Social Sciences 26,154 27,518 (1,364)
Other (2) 205 199 6
Total undergraduate – domestic 95,780 102,154 (6,374)
Graduate – domestic
Faculty of Applied Health Sciences 2,111 2,076 35
Goodman School of Business 1,767 1,747 20
Faculty of Education 1,357 1,317 40
Faculty of Humanities 428 443 (15)
Faculty of Mathematics and Science 530 650 (120)
Faculty of Social Sciences 2,571 2,677 (106)
Total graduate – domestic 8,764 8,910 (146)
Total domestic 104,544 111,064 (6,520)
Undergraduate – international
Faculty of Applied Health Sciences 3,501 4,149 (648)
Goodman School of Business 12,946 14,423 (1,477)
Faculty of Education 135 121 14
Faculty of Humanities 1,745 2,048 (303)
Faculty of Mathematics and Science 9,718 11,435 (1,717)
Faculty of Social Sciences 15,735 17,537 (1,802)
Other (2) 22 13 9
Total undergraduate – international 43,802 49,726 (5,924)
Graduate – international
Faculty of Applied Health Sciences 222 198 24
Goodman School of Business 1,817 1,767 50
Faculty of Education 277 215 62
Faculty of Humanities 202 225 (23)
Faculty of Mathematics and Science 1,141 1,537 (396)
Faculty of Social Sciences 1,268 1,203 65
Total graduate – international 4,927 5,145 (218)
Total international 48,729 54,871 (6,142)
Total tuition revenue in University Global 153,273 165,935 (12,662)
(1) Figures based on Faculty of major.(2) Includes letter of permission, non-degree students and auditors.
Other revenueAncillary revenue, as shown in Figure 9, is forecasted to be $13.4 million as compared to a budget of $37.4 million. This lower revenue is due to the university offering courses in a mainly online settings instead of in person resulting in few students staying in residence and being on campus. Residence revenue is forecasted to be $7.0 million as compared to a budget of $20.9 million, showing a $13.9 million shortfall. This shortfall is driven by an average occupancy used to develop the trimester one forecast of 16 per cent for the fall term and 47 per cent for the winter term as compared to occupancy of 98 per cent in 2019-20 and the 2020-21 budget. Other ancillary revenue is forecasted to be $10.1 million lower than budget with the campus store reporting $2.1 million of this decline, parking services reporting $3.6 million, dining services reporting 3.2 million and conference services reporting $1.0 million.
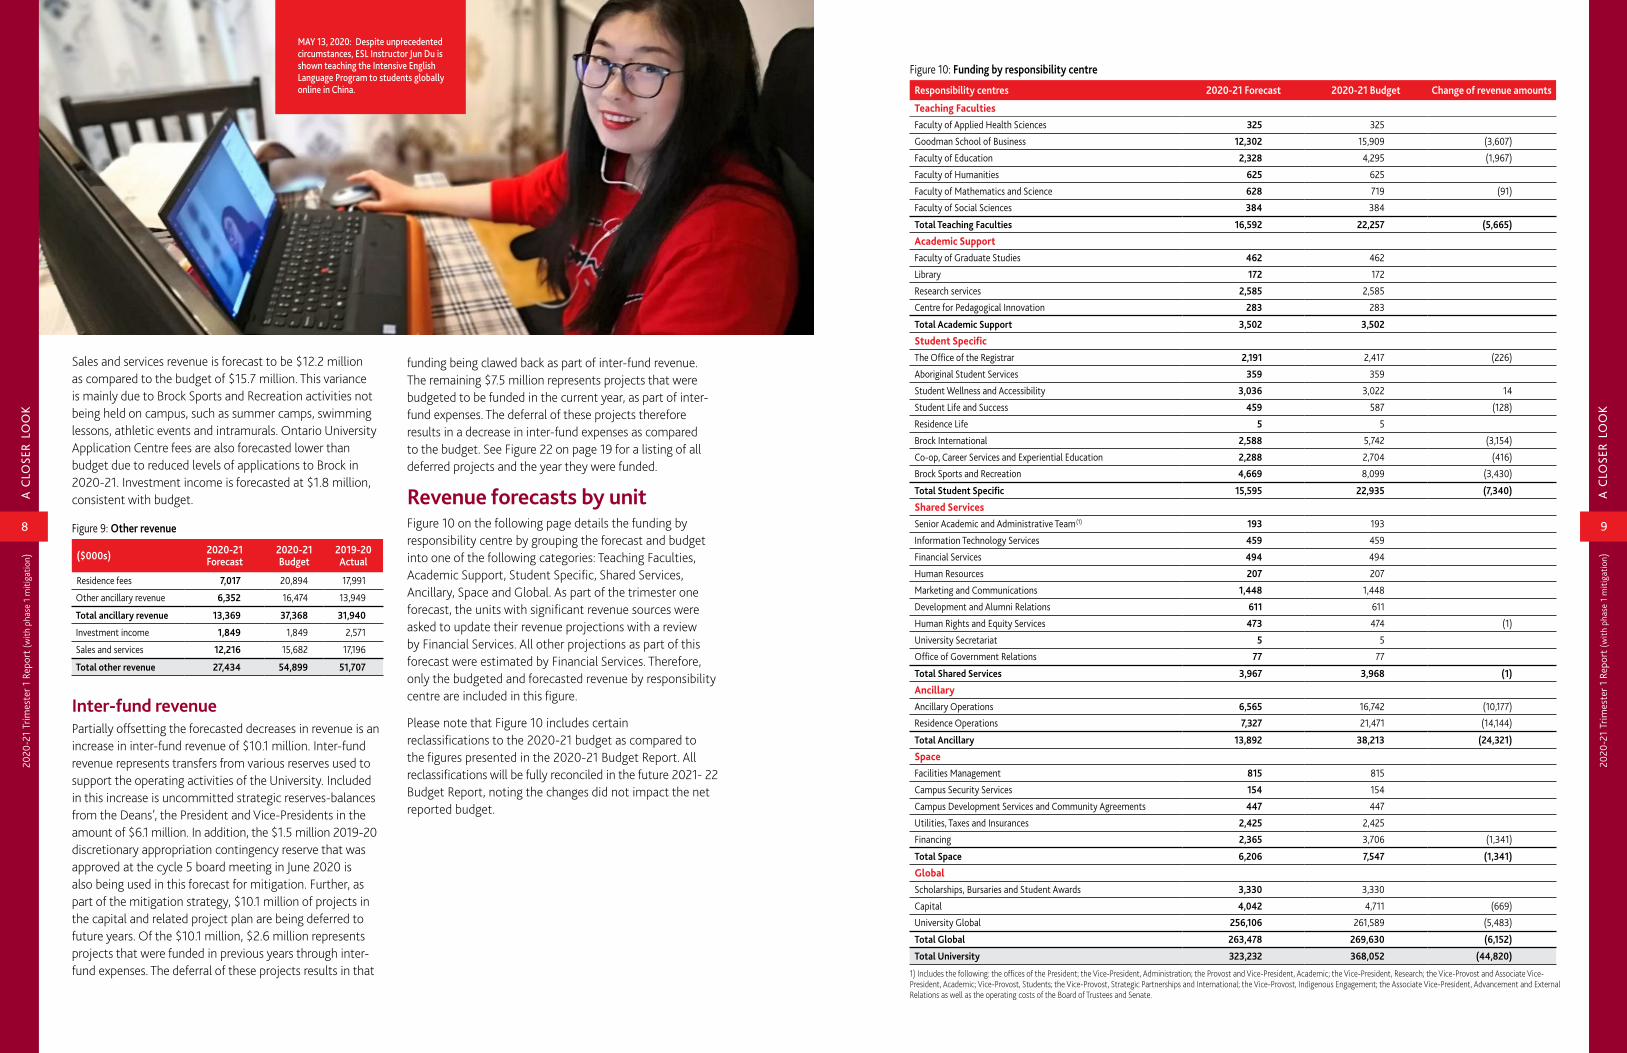
MAY 13, 2020: Despite unprecedented circumstances, ESL Instructor Jun Du is shown teaching the Intensive English Language Program to students globally online in China.
8 9
2020
-21
Trim
este
r 1 R
epor
t (w
ith p
hase
1 m
itiga
tion)
A
CLO
SER
LOO
K
2020
-21
Trim
este
r 1 R
epor
t (w
ith p
hase
1 m
itiga
tion)
A
CLO
SER
LOO
K
Sales and services revenue is forecast to be $12.2 million as compared to the budget of $15.7 million. This variance is mainly due to Brock Sports and Recreation activities not being held on campus, such as summer camps, swimming lessons, athletic events and intramurals. Ontario University Application Centre fees are also forecasted lower than budget due to reduced levels of applications to Brock in 2020-21. Investment income is forecasted at $1.8 million, consistent with budget.
Figure 9: Other revenue
($000s) 2020-21 Forecast
2020-21 Budget
2019-20 Actual
Residence fees 7,017 20,894 17,991
Other ancillary revenue 6,352 16,474 13,949
Total ancillary revenue 13,369 37,368 31,940
Investment income 1,849 1,849 2,571
Sales and services 12,216 15,682 17,196
Total other revenue 27,434 54,899 51,707
Inter-fund revenue Partially offsetting the forecasted decreases in revenue is an increase in inter-fund revenue of $10.1 million. Inter-fund revenue represents transfers from various reserves used to support the operating activities of the University. Included in this increase is uncommitted strategic reserves-balances from the Deans’, the President and Vice-Presidents in the amount of $6.1 million. In addition, the $1.5 million 2019-20 discretionary appropriation contingency reserve that was approved at the cycle 5 board meeting in June 2020 is also being used in this forecast for mitigation. Further, as part of the mitigation strategy, $10.1 million of projects in the capital and related project plan are being deferred to future years. Of the $10.1 million, $2.6 million represents projects that were funded in previous years through inter-fund expenses. The deferral of these projects results in that
funding being clawed back as part of inter-fund revenue. The remaining $7.5 million represents projects that were budgeted to be funded in the current year, as part of inter-fund expenses. The deferral of these projects therefore results in a decrease in inter-fund expenses as compared to the budget. See Figure 22 on page 19 for a listing of all deferred projects and the year they were funded.
Revenue forecasts by unitFigure 10 on the following page details the funding by responsibility centre by grouping the forecast and budget into one of the following categories: Teaching Faculties, Academic Support, Student Specific, Shared Services, Ancillary, Space and Global. As part of the trimester one forecast, the units with significant revenue sources were asked to update their revenue projections with a review by Financial Services. All other projections as part of this forecast were estimated by Financial Services. Therefore, only the budgeted and forecasted revenue by responsibility centre are included in this figure.
Please note that Figure 10 includes certain reclassifications to the 2020-21 budget as compared to the figures presented in the 2020-21 Budget Report. All reclassifications will be fully reconciled in the future 2021- 22 Budget Report, noting the changes did not impact the net reported budget.
Figure 10: Funding by responsibility centre
Responsibility centres 2020-21 Forecast 2020-21 Budget Change of revenue amounts
Teaching FacultiesFaculty of Applied Health Sciences 325 325
Goodman School of Business 12,302 15,909 (3,607)
Faculty of Education 2,328 4,295 (1,967)
Faculty of Humanities 625 625
Faculty of Mathematics and Science 628 719 (91)
Faculty of Social Sciences 384 384
Total Teaching Faculties 16,592 22,257 (5,665)
Academic SupportFaculty of Graduate Studies 462 462
Library 172 172
Research services 2,585 2,585
Centre for Pedagogical Innovation 283 283
Total Academic Support 3,502 3,502
Student SpecificThe Office of the Registrar 2,191 2,417 (226)
Aboriginal Student Services 359 359
Student Wellness and Accessibility 3,036 3,022 14
Student Life and Success 459 587 (128)
Residence Life 5 5
Brock International 2,588 5,742 (3,154)
Co-op, Career Services and Experiential Education 2,288 2,704 (416)
Brock Sports and Recreation 4,669 8,099 (3,430)
Total Student Specific 15,595 22,935 (7,340)
Shared ServicesSenior Academic and Administrative Team(1) 193 193
Information Technology Services 459 459
Financial Services 494 494
Human Resources 207 207
Marketing and Communications 1,448 1,448
Development and Alumni Relations 611 611
Human Rights and Equity Services 473 474 (1)
University Secretariat 5 5
Office of Government Relations 77 77
Total Shared Services 3,967 3,968 (1)
AncillaryAncillary Operations 6,565 16,742 (10,177)
Residence Operations 7,327 21,471 (14,144)
Total Ancillary 13,892 38,213 (24,321)
SpaceFacilities Management 815 815
Campus Security Services 154 154
Campus Development Services and Community Agreements 447 447
Utilities, Taxes and Insurances 2,425 2,425
Financing 2,365 3,706 (1,341)
Total Space 6,206 7,547 (1,341)
GlobalScholarships, Bursaries and Student Awards 3,330 3,330
Capital 4,042 4,711 (669)
University Global 256,106 261,589 (5,483)
Total Global 263,478 269,630 (6,152)
Total University 323,232 368,052 (44,820)
1) Includes the following: the offices of the President; the Vice-President, Administration; the Provost and Vice-President, Academic; the Vice-President, Research; the Vice-Provost and Associate Vice-President, Academic; Vice-Provost, Students; the Vice-Provost, Strategic Partnerships and International; the Vice-Provost, Indigenous Engagement; the Associate Vice-President, Advancement and External Relations as well as the operating costs of the Board of Trustees and Senate.
11
2020
-21
Trim
este
r 1 R
epor
t (w
ith p
hase
1 m
itiga
tion)
A
CLO
SER
LOO
K
10
2020
-21
Trim
este
r 1 R
epor
t (w
ith p
hase
1 m
itiga
tion)
A
CLO
SER
LOO
K
JUNE 19, 2020 : Carol Macintosh, Manager, Printing Services, has been hard at work preparing Convocation-in-a-box packages for Brock University’s Spring Class of 2020.
Figure 11: Personnel costs
Personnel group(1) ($000s)Forecast 2020-21 Budget 2020-21
Salary/wage Benefits Total personnel costs Salary/wage Benefits Total personnel
costsFaculty and professional librarians 88,897 18,801 107,698 92,062 20,992 113,054
Admin/professional 43,045 11,490 54,535 48,858 13,354 62,212
OSSTF 7,418 2,305 9,723 8,111 2,580 10,691
CUPE 1295 FT 7,102 2,431 9,533 6,954 2,445 9,399
SAC 5,725 1,103 6,828 6,026 1,255 7,281
Other ongoing personnel 1,118 318 1,436 1,922 594 2,516
Total ongoing personnel 153,305 36,448 189,753 163,933 41,220 205,153
Temporary personnel 27,139 2,543 29,682 30,616 2,844 33,460
Total – before mitigation target 180,444 38,991 219,435 194,549 44,064 238,613
Mitigation target (2,000)
Total – after mitigation target 217,435 194,549 44,064 238,613
(1) Faculty and Professional Librarians – BUFA members, Professional Librarians, Associate Deans, Associate Vice-Presidents of Research and Associate Librarian; Admin/Professional-administrative/professional and exempt staff; OSSTF – support and technical staff; CUPE 1295 FT – full-time maintenance, trades and custodial staff; SAC – Senior Administrative Council; Other ongoing personnel groups – CUPE 4207 Unit 3, IATSE, CUPE 4207 Unit 2, CUPE 2220; Temporary personnel groups – all other temporary union groups, BUFA Overload, CUPE 4207 unit 1, part-time teaching and non-teaching positions and stipend transfers.
Review of overall costsPersonnel costsOur people are what make everything possible at our University including the strong enrolment and financial achievement of 2019-20 and the adjustments from in-class to online course offerings required in 2020-21 due to COVID-19. Figure 11 details the trimester one personnel cost forecast by personnel group as compared
JUNE 05, 2020: Event Co-ordinator Jillian Nero preparing for Brock University’s virtual Rise and Shine event, one of the many ways the Co-op, Career and Experiential Education is supporting students working from home.
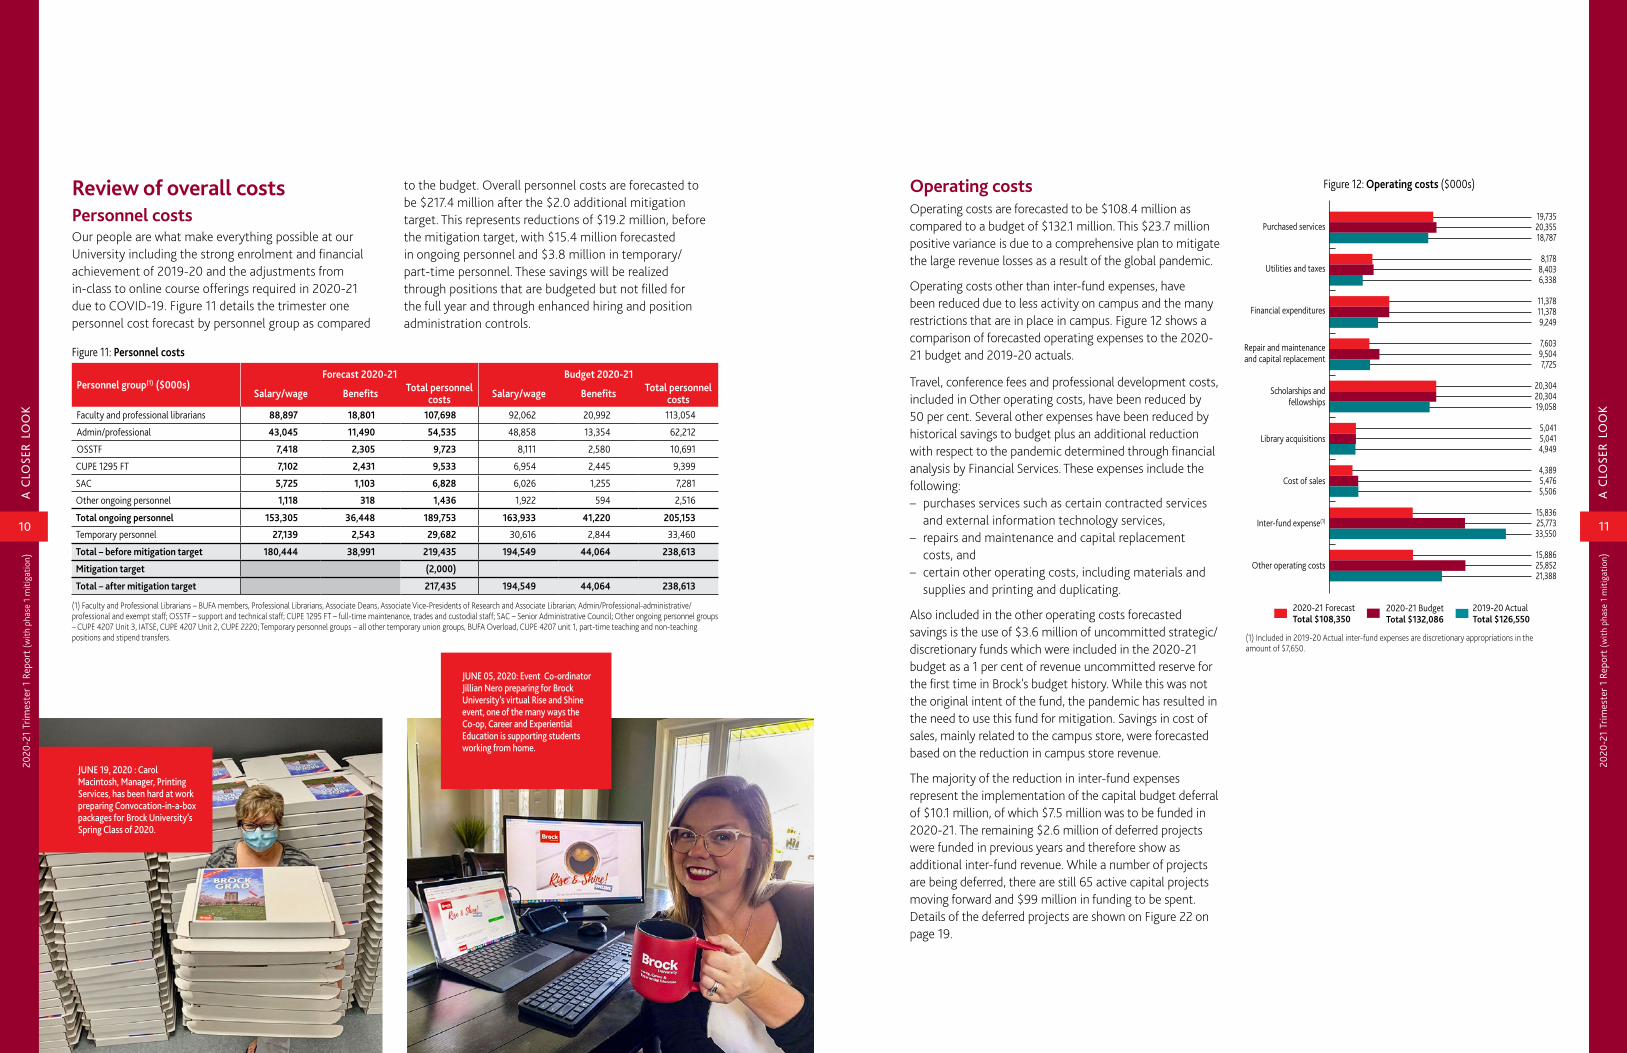
Operating costsOperating costs are forecasted to be $108.4 million as compared to a budget of $132.1 million. This $23.7 million positive variance is due to a comprehensive plan to mitigate the large revenue losses as a result of the global pandemic.
Operating costs other than inter-fund expenses, have been reduced due to less activity on campus and the many restrictions that are in place in campus. Figure 12 shows a comparison of forecasted operating expenses to the 2020-21 budget and 2019-20 actuals.
Travel, conference fees and professional development costs, included in Other operating costs, have been reduced by 50 per cent. Several other expenses have been reduced by historical savings to budget plus an additional reduction with respect to the pandemic determined through financial analysis by Financial Services. These expenses include the following: – purchases services such as certain contracted services
and external information technology services,– repairs and maintenance and capital replacement
costs, and– certain other operating costs, including materials and
supplies and printing and duplicating.
Also included in the other operating costs forecasted savings is the use of $3.6 million of uncommitted strategic/discretionary funds which were included in the 2020-21 budget as a 1 per cent of revenue uncommitted reserve for the first time in Brock's budget history. While this was not the original intent of the fund, the pandemic has resulted in the need to use this fund for mitigation. Savings in cost of sales, mainly related to the campus store, were forecasted based on the reduction in campus store revenue.
The majority of the reduction in inter-fund expenses represent the implementation of the capital budget deferral of $10.1 million, of which $7.5 million was to be funded in 2020-21. The remaining $2.6 million of deferred projects were funded in previous years and therefore show as additional inter-fund revenue. While a number of projects are being deferred, there are still 65 active capital projects moving forward and $99 million in funding to be spent. Details of the deferred projects are shown on Figure 22 on page 19.
19,73520,35518,787
8,1788,4036,338
11,37811,3789,249
7,6039,5047,725
20,30420,30419,058
5,0415,0414,949
4,3895,4765,506
15,83625,77333,550
15,88625,85221,388
2019-20 ActualTotal $126,550
2020-21 ForecastTotal $108,350
(1) Included in 2019-20 Actual inter-fund expenses are discretionary appropriations in the amount of $7,650.
2020-21 BudgetTotal $132,086
Figure 12: Operating costs ($000s)
Purchased services
Utilities and taxes
Financial expenditures
Repair and maintenance and capital replacement
Scholarships andfellowships
Library acquisitions
Cost of sales
Inter-fund expense(1)
Other operating costs
to the budget. Overall personnel costs are forecasted to be $217.4 million after the $2.0 additional mitigation target. This represents reductions of $19.2 million, before the mitigation target, with $15.4 million forecasted in ongoing personnel and $3.8 million in temporary/part-time personnel. These savings will be realized through positions that are budgeted but not filled for the full year and through enhanced hiring and position administration controls.
13
2020
-21
Trim
este
r 1 R
epor
t (w
ith p
hase
1 m
itiga
tion)
A
CLO
SER
LOO
K
JUNE 26, 2020 : President Gervan Fearon spoke to the CBC about ongoing efforts to promote equity and inclusion at Brock University as well as the obligation of all members of society contribute to inclusive communities by addressing systemic discrimination and racism.
12
2020
-21
Trim
este
r 1 R
epor
t (w
ith p
hase
1 m
itiga
tion)
A
CLO
SER
LOO
K
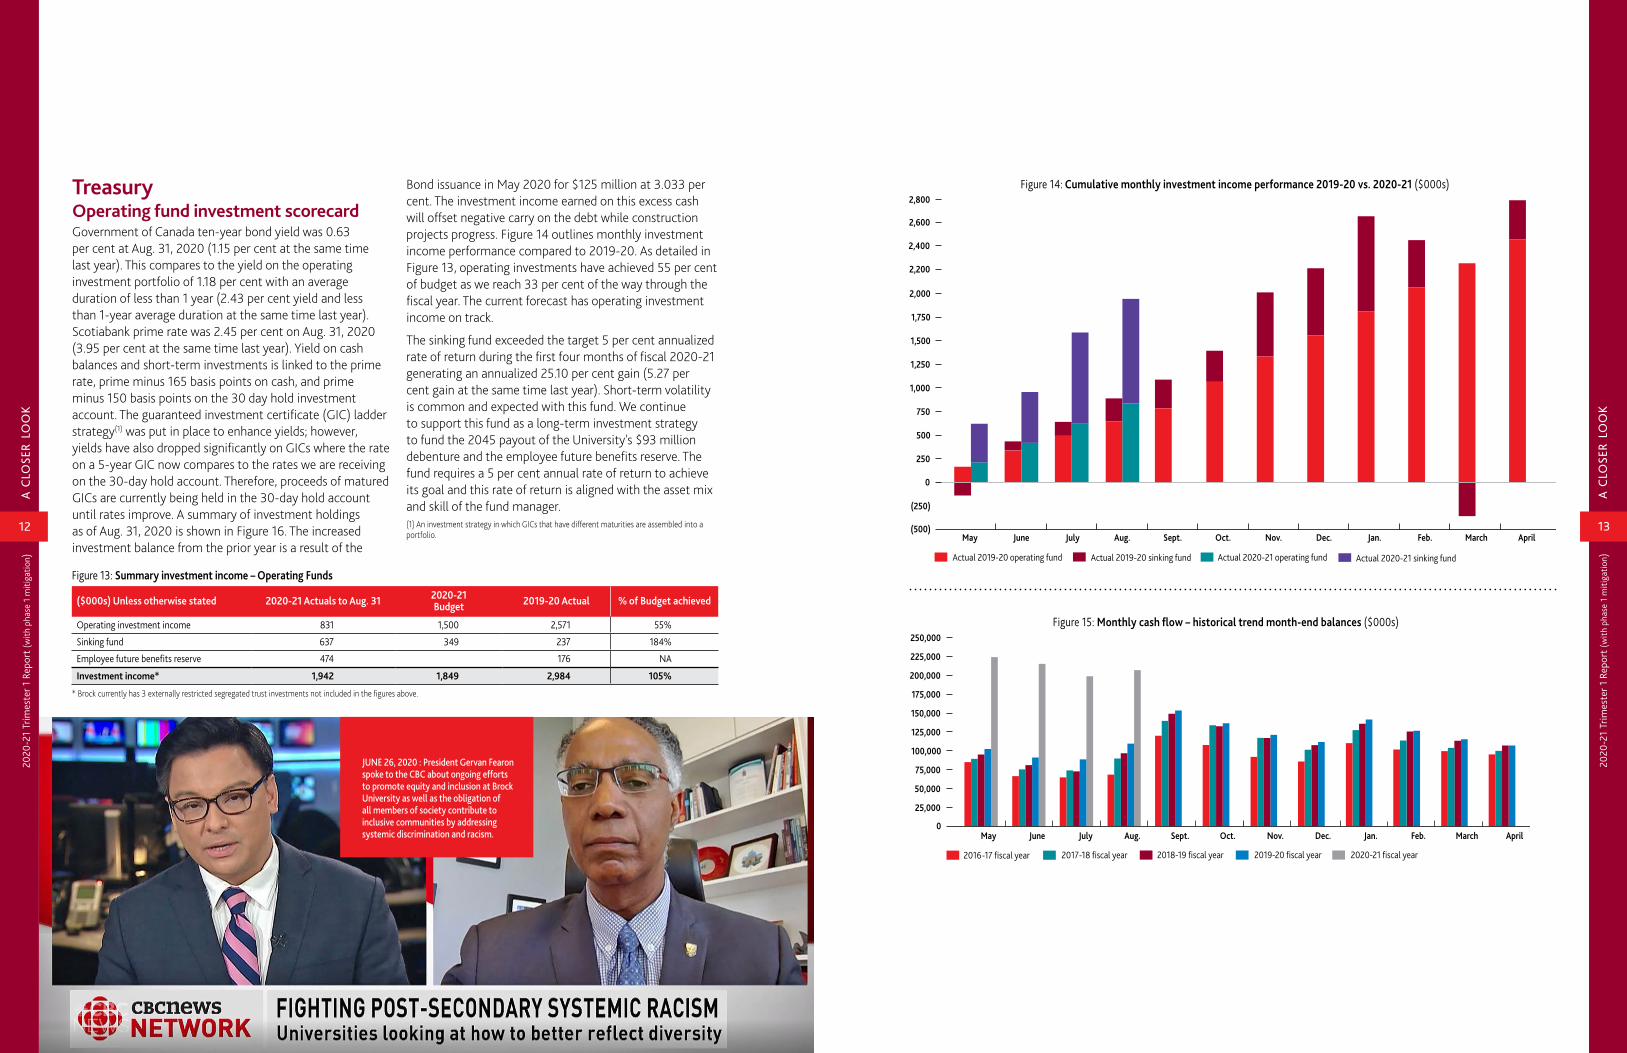
TreasuryOperating fund investment scorecardGovernment of Canada ten-year bond yield was 0.63 per cent at Aug. 31, 2020 (1.15 per cent at the same time last year). This compares to the yield on the operating investment portfolio of 1.18 per cent with an average duration of less than 1 year (2.43 per cent yield and less than 1-year average duration at the same time last year). Scotiabank prime rate was 2.45 per cent on Aug. 31, 2020 (3.95 per cent at the same time last year). Yield on cash balances and short-term investments is linked to the prime rate, prime minus 165 basis points on cash, and prime minus 150 basis points on the 30 day hold investment account. The guaranteed investment certificate (GIC) ladder strategy(1) was put in place to enhance yields; however, yields have also dropped significantly on GICs where the rate on a 5-year GIC now compares to the rates we are receiving on the 30-day hold account. Therefore, proceeds of matured GICs are currently being held in the 30-day hold account until rates improve. A summary of investment holdings as of Aug. 31, 2020 is shown in Figure 16. The increased investment balance from the prior year is a result of the
Figure 13: Summary investment income – Operating Funds
($000s) Unless otherwise stated 2020-21 Actuals to Aug. 31 2020-21 Budget 2019-20 Actual % of Budget achieved
Operating investment income 831 1,500 2,571 55%
Sinking fund 637 349 237 184%
Employee future benefits reserve 474 176 NA
Investment income* 1,942 1,849 2,984 105%
* Brock currently has 3 externally restricted segregated trust investments not included in the figures above.
Bond issuance in May 2020 for $125 million at 3.033 per cent. The investment income earned on this excess cash will offset negative carry on the debt while construction projects progress. Figure 14 outlines monthly investment income performance compared to 2019-20. As detailed in Figure 13, operating investments have achieved 55 per cent of budget as we reach 33 per cent of the way through the fiscal year. The current forecast has operating investment income on track.
The sinking fund exceeded the target 5 per cent annualized rate of return during the first four months of fiscal 2020-21 generating an annualized 25.10 per cent gain (5.27 per cent gain at the same time last year). Short-term volatility is common and expected with this fund. We continue to support this fund as a long-term investment strategy to fund the 2045 payout of the University's $93 million debenture and the employee future benefits reserve. The fund requires a 5 per cent annual rate of return to achieve its goal and this rate of return is aligned with the asset mix and skill of the fund manager.(1) An investment strategy in which GICs that have different maturities are assembled into a portfolio.
Actual 2020-21 operating fund Actual 2019-20 operating fund Actual 2019-20 sinking fund Actual 2020-21 sinking fund
Figure 14: Cumulative monthly investment income performance 2019-20 vs. 2020-21 ($000s)
0
250
500
750
1,000
1,250
1,500
1,750
2,000
AprilMarchFeb. Jan. Dec. Nov. Oct. Sept. Aug. JulyJune May
2,200
2,400
2,600
2,800
(250)
(500)
2018-19 fiscal year2016-17 fiscal year 2017-18 fiscal year 2019-20 fiscal year 2020-21 fiscal year
Figure 15: Monthly cash flow – historical trend month-end balances ($000s)
0
25,000
50,000
75,000
100,000
125,000
150,000
175,000
200,000
225,000
250,000
AprilMarchFeb. Jan. Dec. Nov. Oct. Sept. Aug. JulyJune May
14 15
2020
-21
Trim
este
r 1 R
epor
t (w
ith p
hase
1 m
itiga
tion)
A
CLO
SER
LOO
K
2020
-21
Trim
este
r 1 R
epor
t (w
ith p
hase
1 m
itiga
tion)
A
CLO
SER
LOO
K
Figure 16: Summary of investment holdings
($000s)Unless otherwise stated
Market Value as at Aug. 31, 2020
Annualized rate of return Fees Net annualized rate
of return
Scotiabank
General account ($20 million average minimum balance) 51,302 0.80% 0.00% 0.80%
30 Day GIC 50,000 0.95% 0.00% 0.95%
6 Month GIC 4,100 1.10% 0.00% 1.10%
7 Month GIC 4,600 1.15% 0.00% 1.15%
8 Month GIC 6,300 1.20% 0.00% 1.20%
9 month GIC 6,300 1.25% 0.00% 1.25%
10 Month GIC 6,000 1.30% 0.00% 1.30%
11 Month GIC 3,500 1.35% 0.00% 1.35%
12 Month GIC 10,500 1.40% 0.00% 1.40%
14 Month GIC 8,300 1.56% 0.00% 1.56%
2 Year GIC 7,200 1.95% 0.00% 1.95%
2 Year GIC 17,300 1.50% 0.00% 1.50%
3 Year GIC 5,000 3.08% 0.00% 3.08%
3 Year GIC 2,500 2.65% 0.00% 2.65%
Total for account 182,902 1.18% 0.00% 1.18%
BMO Nesbitt Burns
Savings Account 3 0.00% 0.05% -0.05%
2 Year GIC 1,000 2.60% 0.05% 2.55%
2 Year GIC 2,650 3.21% 0.05% 3.16%
Total for account 3,653 3.04% 0.05% 2.99%
TD Waterhouse
2 Year GIC 5,713 2.47% 0.00% 2.47%
Total for account 5,713 2.47% 0.00% 2.47%
Mawer – balanced fund
Sinking fund 8,243
Employee future benefits reserve 6,135
Total for account 14,378 25.10% 0.25% 24.85%
Portfolio consolidated total 206,646 2.85% 0.02% 2.83%
(Left) JUNE 26, 2020: Rozhin Rowshanpour (BSc '20) has produced incredible results during her time at Brock University. Five years ago, she moved from Iran and followed in her mother’s footsteps doing research at Brock.
(Right) JUNE 26, 2020: Kyle Jones is 1 of 32 students to graduate from the first class of the Brock University-Niagara College Game Program.
Brock issued a $14.4-million five-year loan fixed at 2.49 per cent in fiscal 2019-20 as preliminary financing for student experience capital projects. These projects (i.e. Ancillary/ Residence student experience projects) are supported by a business plan that is 100 per cent self-funded, including financing costs and a contribution back to the University; support the Institutional Strategic Plan by offering a transformational and accessible academic and university experience for our student population; and had no negative impact on the University’s credit rating. At the beginning of this fiscal year Brock secured a series B debenture of $125 million 3.03 per cent interest
40 year bullet, with the proceeds covering capital needs and refinancing of upcoming debt maturities. This series B debenture is in addition to the 2005 series A debenture offering with proceeds of $93 million. This debenture strategy has been implemented to take advantage of historically low interest rates. As well, this additional debt is expected to have no negative impact on Brock’s credit rating position, although the additional debt brings Brock closer to its current credit rating threshold. On Feb. 4, 2020 DBRS Morningstar reconfirmed Brock’s credit rating of A (high) with Stable trends.
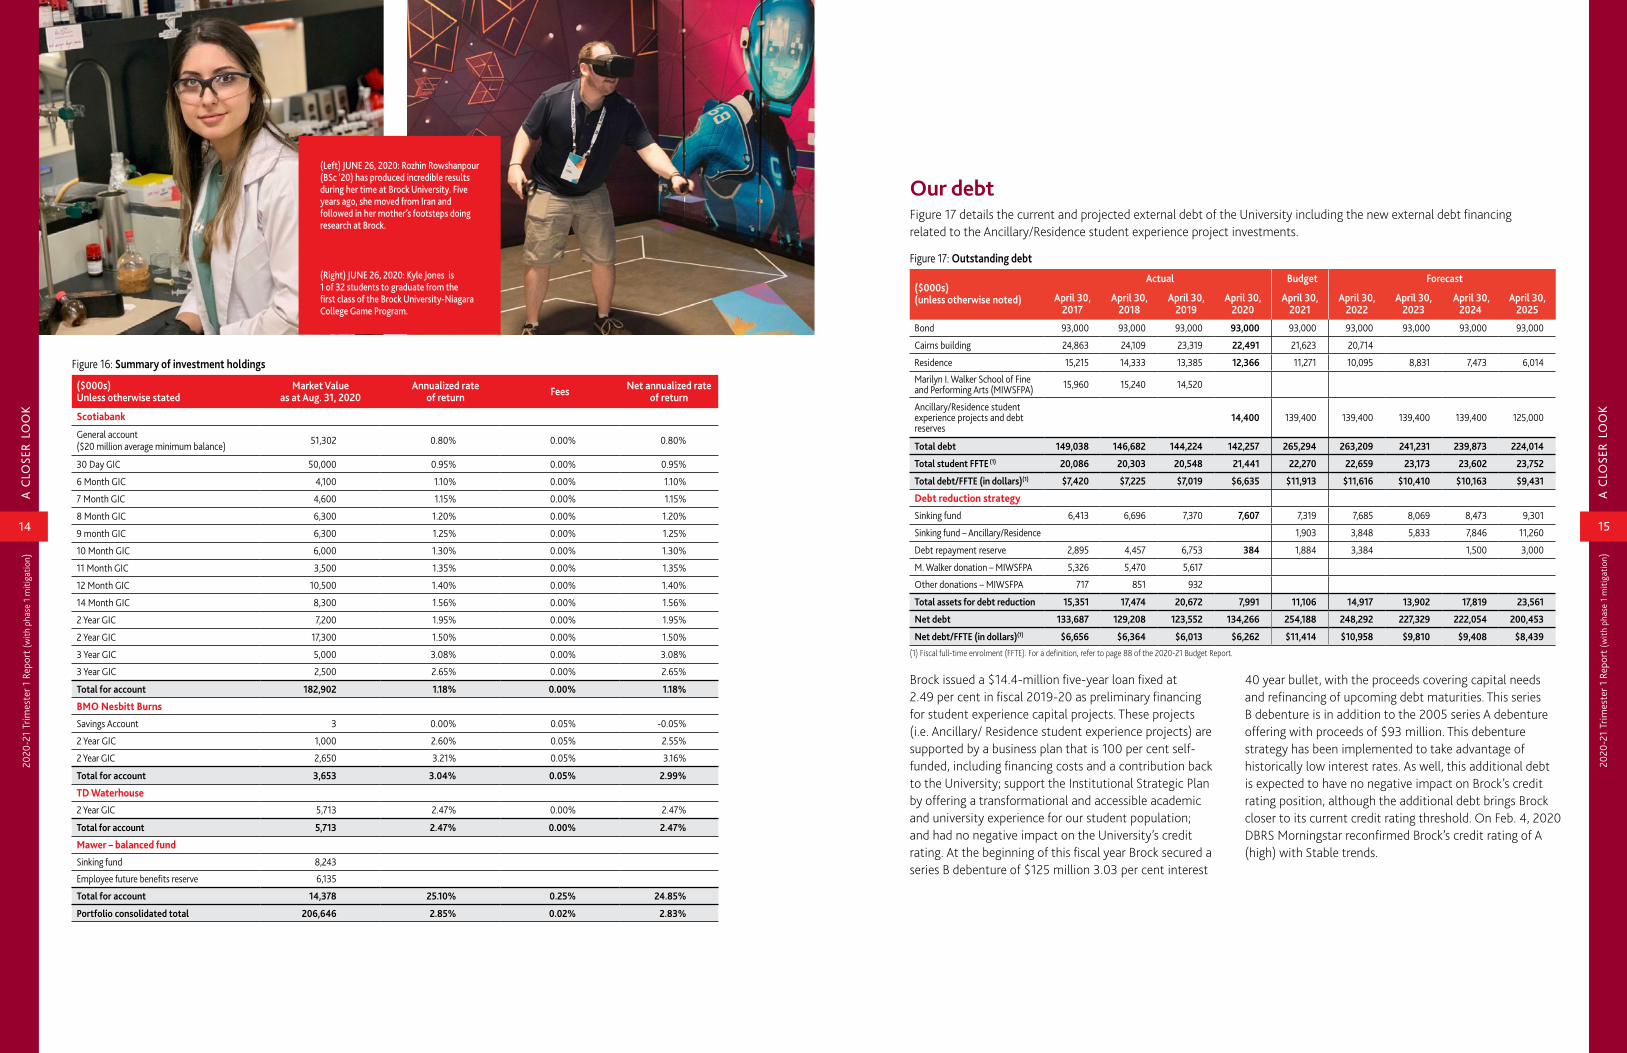
Our debtFigure 17 details the current and projected external debt of the University including the new external debt financing related to the Ancillary/Residence student experience project investments.
Figure 17: Outstanding debt
($000s)(unless otherwise noted)
Actual Budget Forecast
April 30, 2017
April 30, 2018
April 30, 2019
April 30, 2020
April 30, 2021
April 30, 2022
April 30, 2023
April 30, 2024
April 30, 2025
Bond 93,000 93,000 93,000 93,000 93,000 93,000 93,000 93,000 93,000
Cairns building 24,863 24,109 23,319 22,491 21,623 20,714
Residence 15,215 14,333 13,385 12,366 11,271 10,095 8,831 7,473 6,014
Marilyn I. Walker School of Fine and Performing Arts (MIWSFPA) 15,960 15,240 14,520
Ancillary/Residence student experience projects and debt reserves
14,400 139,400 139,400 139,400 139,400 125,000
Total debt 149,038 146,682 144,224 142,257 265,294 263,209 241,231 239,873 224,014
Total student FFTE (1) 20,086 20,303 20,548 21,441 22,270 22,659 23,173 23,602 23,752
Total debt/FFTE (in dollars)(1) $7,420 $7,225 $7,019 $6,635 $11,913 $11,616 $10,410 $10,163 $9,431
Debt reduction strategy
Sinking fund 6,413 6,696 7,370 7,607 7,319 7,685 8,069 8,473 9,301
Sinking fund – Ancillary/Residence 1,903 3,848 5,833 7,846 11,260
Debt repayment reserve 2,895 4,457 6,753 384 1,884 3,384 1,500 3,000
M. Walker donation – MIWSFPA 5,326 5,470 5,617
Other donations – MIWSFPA 717 851 932
Total assets for debt reduction 15,351 17,474 20,672 7,991 11,106 14,917 13,902 17,819 23,561
Net debt 133,687 129,208 123,552 134,266 254,188 248,292 227,329 222,054 200,453
Net debt/FFTE (in dollars)(1) $6,656 $6,364 $6,013 $6,262 $11,414 $10,958 $9,810 $9,408 $8,439
(1) Fiscal full-time enrolment (FFTE). For a definition, refer to page 88 of the 2020-21 Budget Report.
16
2020
-21
Trim
este
r 1 R
epor
t (w
ith p
hase
1 m
itiga
tion)
A
CLO
SER
LOO
K
Figure 18: Long-term debt
Interest rate Payment terms Date to be paid in full
Annual payment ($000s)
Earp/Lowenberger – Residence 7.200% Monthly blended payments of principal and interest of $162,443.70. October 2028 1,949
Cairns Building 4.690% Monthly blended payments of principal and interest of $158,668.10. Interest rate swap on $28 million. Payment based on 25 year amortization. July 2037 1,904
Student experience projects 2.490% Interest only payments until June 2024. June 2024 359
Student experience projects – line of credit
Bankers Acceptance + 45 basis points Due on demand NA NA
Debenture payable (bullet) 4.967% Interest payable semi-annually $2,309,655. December 2045 4,619
Debenture payable (bullet) 3.033% Interest payable semi-annually $1,895,625. May 2060 3,791
Figure 19: Debt metrics
Published range current credit rating 2019-20 Fiscal year 2018-19 Fiscal year
Fiscal full-time equivalent (FFTE) 21,441 20,548
Total long-term debt/FFTE ($) 10.000 – 15.000 6,635 7,019
Interest coverage ratio 1.3 times to 2.5 times 4.64 times 4.97 times
Surplus-to-revenue 0% to 1% (5 year average) 3.3% 4.5%
Debt retirement assets
Required rate of return Payment terms Date to be
paid in fullAnnual
payment ($000s)
Sinking fund investment 5.000% Policy requires Brock to annually review sinking fund investment performance and required contributions. December 2045 As per Fiscal
Framework
Sinking fund investment 5.200% Policy requires Brock to annually review sinking fund investment performance and required contributions. May 2060 As per Fiscal
Framework
Debt reduction reserve N/AAnnual contribution ($1,022 in 2017-18 as per fiscal framework) to an internally restricted reserve for debt repayment initially approved by the Board of Trustees on March 12, 2015.
N/A As per Fiscal Framework
JULY 07, 20200: Brock University Manager of Structural Services Bryan Cober installs a COVID-related floor sticker near the east entrance of the Roy and Lois Cairns Health and Bioscience Research Complex.
17
2020
-21
Trim
este
r 1 R
epor
t (w
ith p
hase
1 m
itiga
tion)
A
CLO
SER
LOO
K
AUGUST 10, 2020: The Gerald B. Mitchell Centre in Experiential Education creates a $2.7-million legacy for Brock students, enabling this Brock University Honorary Degree recipient to live on. Stephanie and Gerry Mitchell shown in photo.
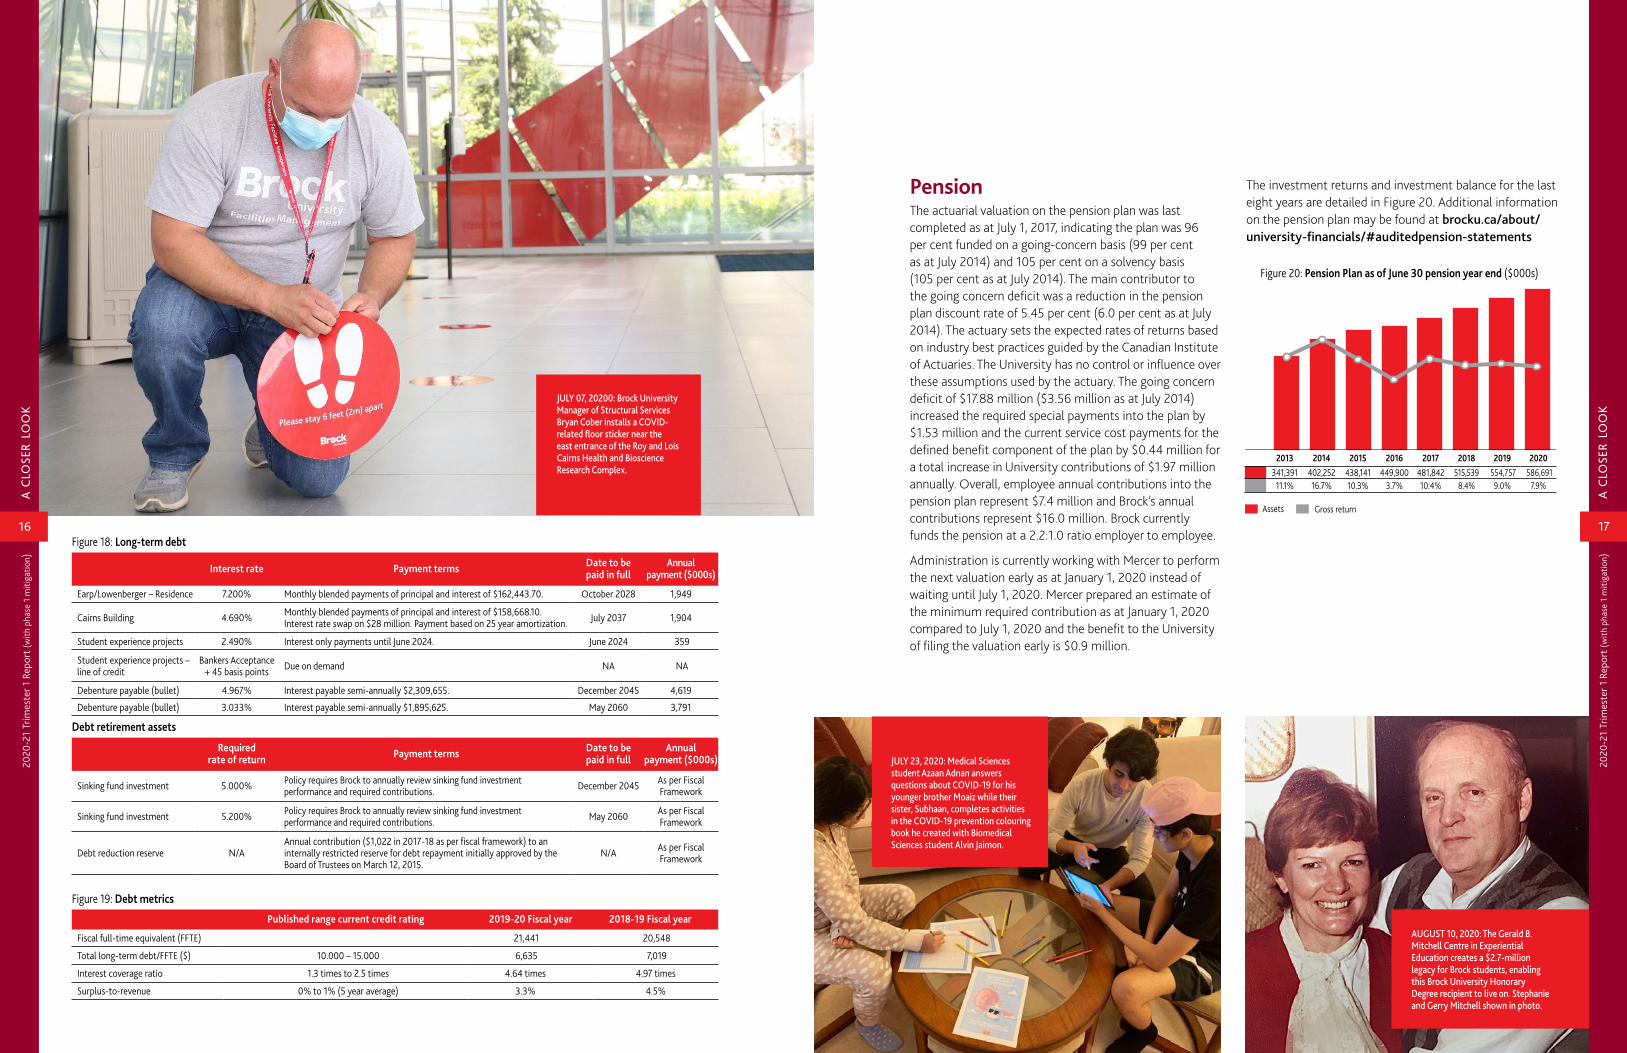
PensionThe actuarial valuation on the pension plan was last completed as at July 1, 2017, indicating the plan was 96 per cent funded on a going-concern basis (99 per cent as at July 2014) and 105 per cent on a solvency basis (105 per cent as at July 2014). The main contributor to the going concern deficit was a reduction in the pension plan discount rate of 5.45 per cent (6.0 per cent as at July 2014). The actuary sets the expected rates of returns based on industry best practices guided by the Canadian Institute of Actuaries. The University has no control or influence over these assumptions used by the actuary. The going concern deficit of $17.88 million ($3.56 million as at July 2014) increased the required special payments into the plan by $1.53 million and the current service cost payments for the defined benefit component of the plan by $0.44 million for a total increase in University contributions of $1.97 million annually. Overall, employee annual contributions into the pension plan represent $7.4 million and Brock’s annual contributions represent $16.0 million. Brock currently funds the pension at a 2.2:1.0 ratio employer to employee.
Administration is currently working with Mercer to perform the next valuation early as at January 1, 2020 instead of waiting until July 1, 2020. Mercer prepared an estimate of the minimum required contribution as at January 1, 2020 compared to July 1, 2020 and the benefit to the University of filing the valuation early is $0.9 million.
Figure 20: Pension Plan as of June 30 pension year end ($000s)
Assets Gross return
2013 2014 2015 2016 2017 2018 2019 2020341,391 402,252 438,141 449,900 481,842 515,539 554,757 586,691
11.1% 16.7% 10.3% 3.7% 10.4% 8.4% 9.0% 7.9%
The investment returns and investment balance for the last eight years are detailed in Figure 20. Additional information on the pension plan may be found at brocku.ca/about/university-financials/#auditedpension-statements
JULY 23, 2020: Medical Sciences student Azaan Adnan answers questions about COVID-19 for his younger brother Moaiz while their sister, Subhaan, completes activities in the COVID-19 prevention colouring book he created with Biomedical Sciences student Alvin Jaimon.
18 19
2020
-21
Trim
este
r 1 R
epor
t (w
ith p
hase
1 m
itiga
tion)
A
CLO
SER
LOO
K
2020
-21
Trim
este
r 1 R
epor
t (w
ith p
hase
1 m
itiga
tion)
A
CLO
SER
LOO
K
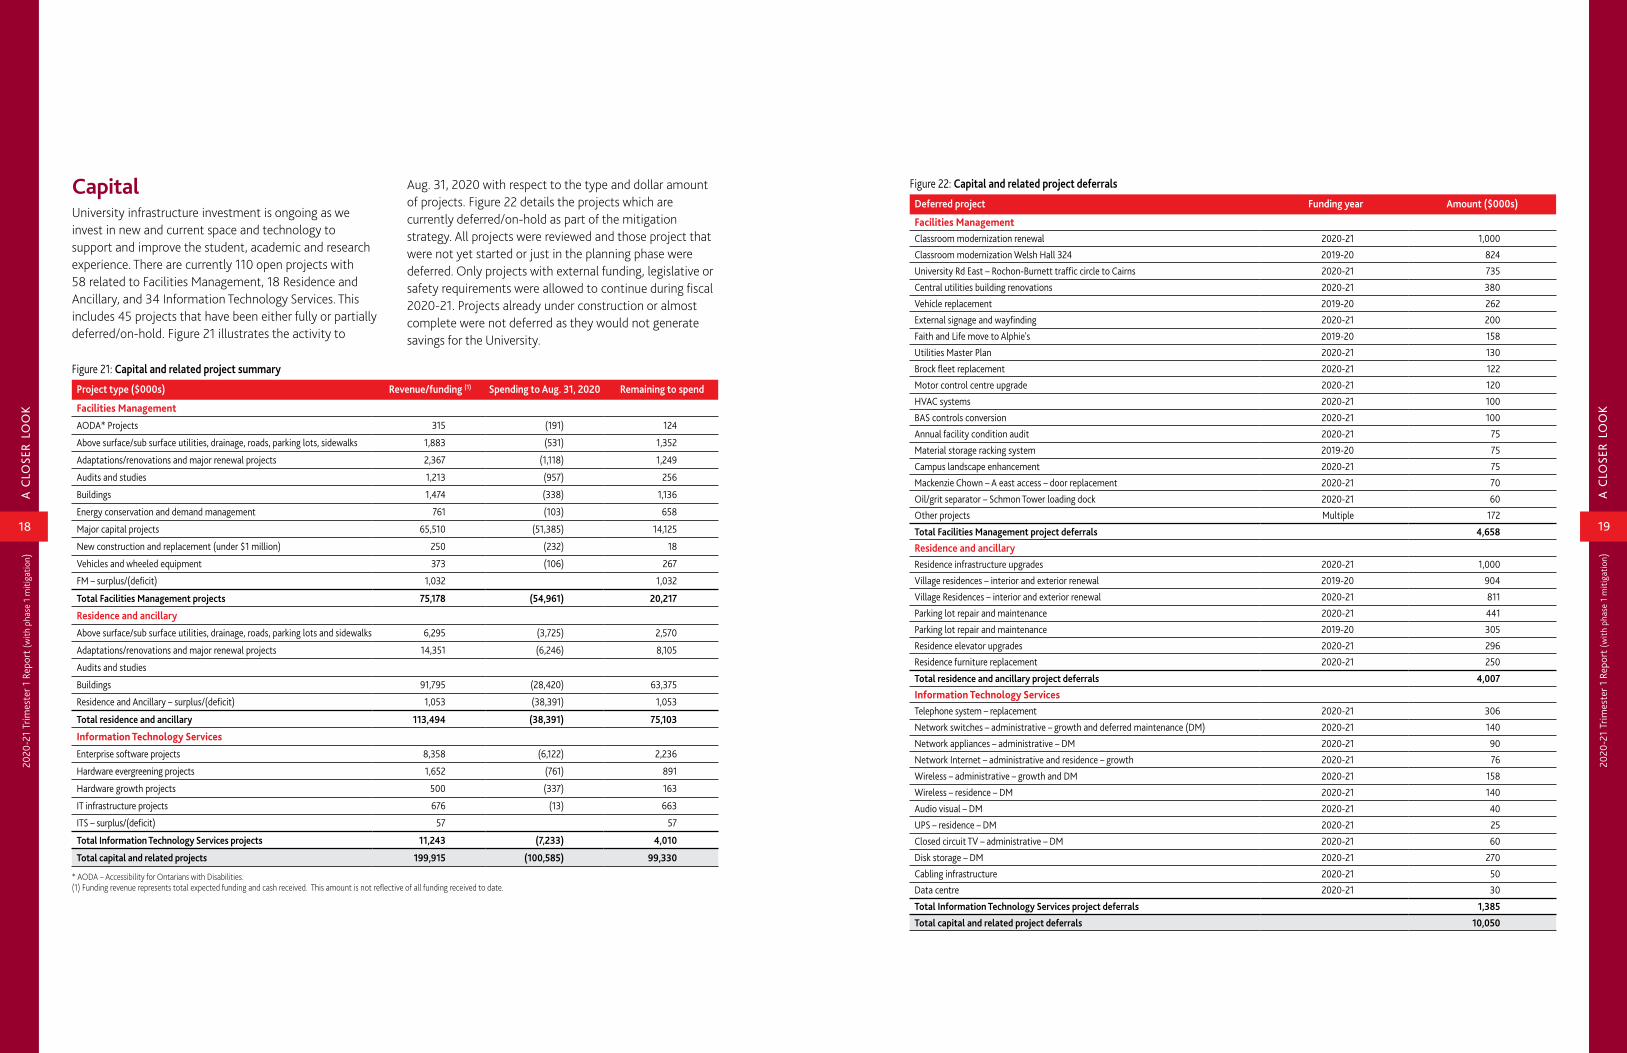
Figure 22: Capital and related project deferrals
Deferred project Funding year Amount ($000s)
Facilities Management Classroom modernization renewal 2020-21 1,000
Classroom modernization Welsh Hall 324 2019-20 824
University Rd East – Rochon-Burnett traffic circle to Cairns 2020-21 735
Central utilities building renovations 2020-21 380
Vehicle replacement 2019-20 262
External signage and wayfinding 2020-21 200
Faith and Life move to Alphie's 2019-20 158
Utilities Master Plan 2020-21 130
Brock fleet replacement 2020-21 122
Motor control centre upgrade 2020-21 120
HVAC systems 2020-21 100
BAS controls conversion 2020-21 100
Annual facility condition audit 2020-21 75
Material storage racking system 2019-20 75
Campus landscape enhancement 2020-21 75
Mackenzie Chown – A east access – door replacement 2020-21 70
Oil/grit separator – Schmon Tower loading dock 2020-21 60
Other projects Multiple 172
Total Facilities Management project deferrals 4,658
Residence and ancillary Residence infrastructure upgrades 2020-21 1,000
Village residences – interior and exterior renewal 2019-20 904
Village Residences – interior and exterior renewal 2020-21 811
Parking lot repair and maintenance 2020-21 441
Parking lot repair and maintenance 2019-20 305
Residence elevator upgrades 2020-21 296
Residence furniture replacement 2020-21 250
Total residence and ancillary project deferrals 4,007
Information Technology Services Telephone system – replacement 2020-21 306
Network switches – administrative – growth and deferred maintenance (DM) 2020-21 140
Network appliances – administrative – DM 2020-21 90
Network Internet – administrative and residence – growth 2020-21 76
Wireless – administrative – growth and DM 2020-21 158
Wireless – residence – DM 2020-21 140
Audio visual – DM 2020-21 40
UPS – residence – DM 2020-21 25
Closed circuit TV – administrative – DM 2020-21 60
Disk storage – DM 2020-21 270
Cabling infrastructure 2020-21 50
Data centre 2020-21 30
Total Information Technology Services project deferrals 1,385
Total capital and related project deferrals 10,050
Figure 21: Capital and related project summary
Project type ($000s) Revenue/funding (1) Spending to Aug. 31, 2020 Remaining to spend
Facilities Management
AODA* Projects 315 (191) 124
Above surface/sub surface utilities, drainage, roads, parking lots, sidewalks 1,883 (531) 1,352
Adaptations/renovations and major renewal projects 2,367 (1,118) 1,249
Audits and studies 1,213 (957) 256
Buildings 1,474 (338) 1,136
Energy conservation and demand management 761 (103) 658
Major capital projects 65,510 (51,385) 14,125
New construction and replacement (under $1 million) 250 (232) 18
Vehicles and wheeled equipment 373 (106) 267
FM – surplus/(deficit) 1,032 1,032
Total Facilities Management projects 75,178 (54,961) 20,217
Residence and ancillary
Above surface/sub surface utilities, drainage, roads, parking lots and sidewalks 6,295 (3,725) 2,570
Adaptations/renovations and major renewal projects 14,351 (6,246) 8,105
Audits and studies
Buildings 91,795 (28,420) 63,375
Residence and Ancillary – surplus/(deficit) 1,053 (38,391) 1,053
Total residence and ancillary 113,494 (38,391) 75,103
Information Technology Services
Enterprise software projects 8,358 (6,122) 2,236
Hardware evergreening projects 1,652 (761) 891
Hardware growth projects 500 (337) 163
IT infrastructure projects 676 (13) 663
ITS – surplus/(deficit) 57 57
Total Information Technology Services projects 11,243 (7,233) 4,010
Total capital and related projects 199,915 (100,585) 99,330
* AODA – Accessibility for Ontarians with Disabilities.(1) Funding revenue represents total expected funding and cash received. This amount is not reflective of all funding received to date.
CapitalUniversity infrastructure investment is ongoing as we invest in new and current space and technology to support and improve the student, academic and research experience. There are currently 110 open projects with 58 related to Facilities Management, 18 Residence and Ancillary, and 34 Information Technology Services. This includes 45 projects that have been either fully or partially deferred/on-hold. Figure 21 illustrates the activity to
Aug. 31, 2020 with respect to the type and dollar amount of projects. Figure 22 details the projects which are currently deferred/on-hold as part of the mitigation strategy. All projects were reviewed and those project that were not yet started or just in the planning phase were deferred. Only projects with external funding, legislative or safety requirements were allowed to continue during fiscal 2020-21. Projects already under construction or almost complete were not deferred as they would not generate savings for the University.
20
2020
-21
Trim
este
r 1 R
epor
t (w
ith p
hase
1 m
itiga
tion)
A
CLO
SER
LOO
K
21
2020
-21
Trim
este
r 1 R
epor
t (w
ith p
hase
1 m
itiga
tion)
A
CLO
SER
LOO
K
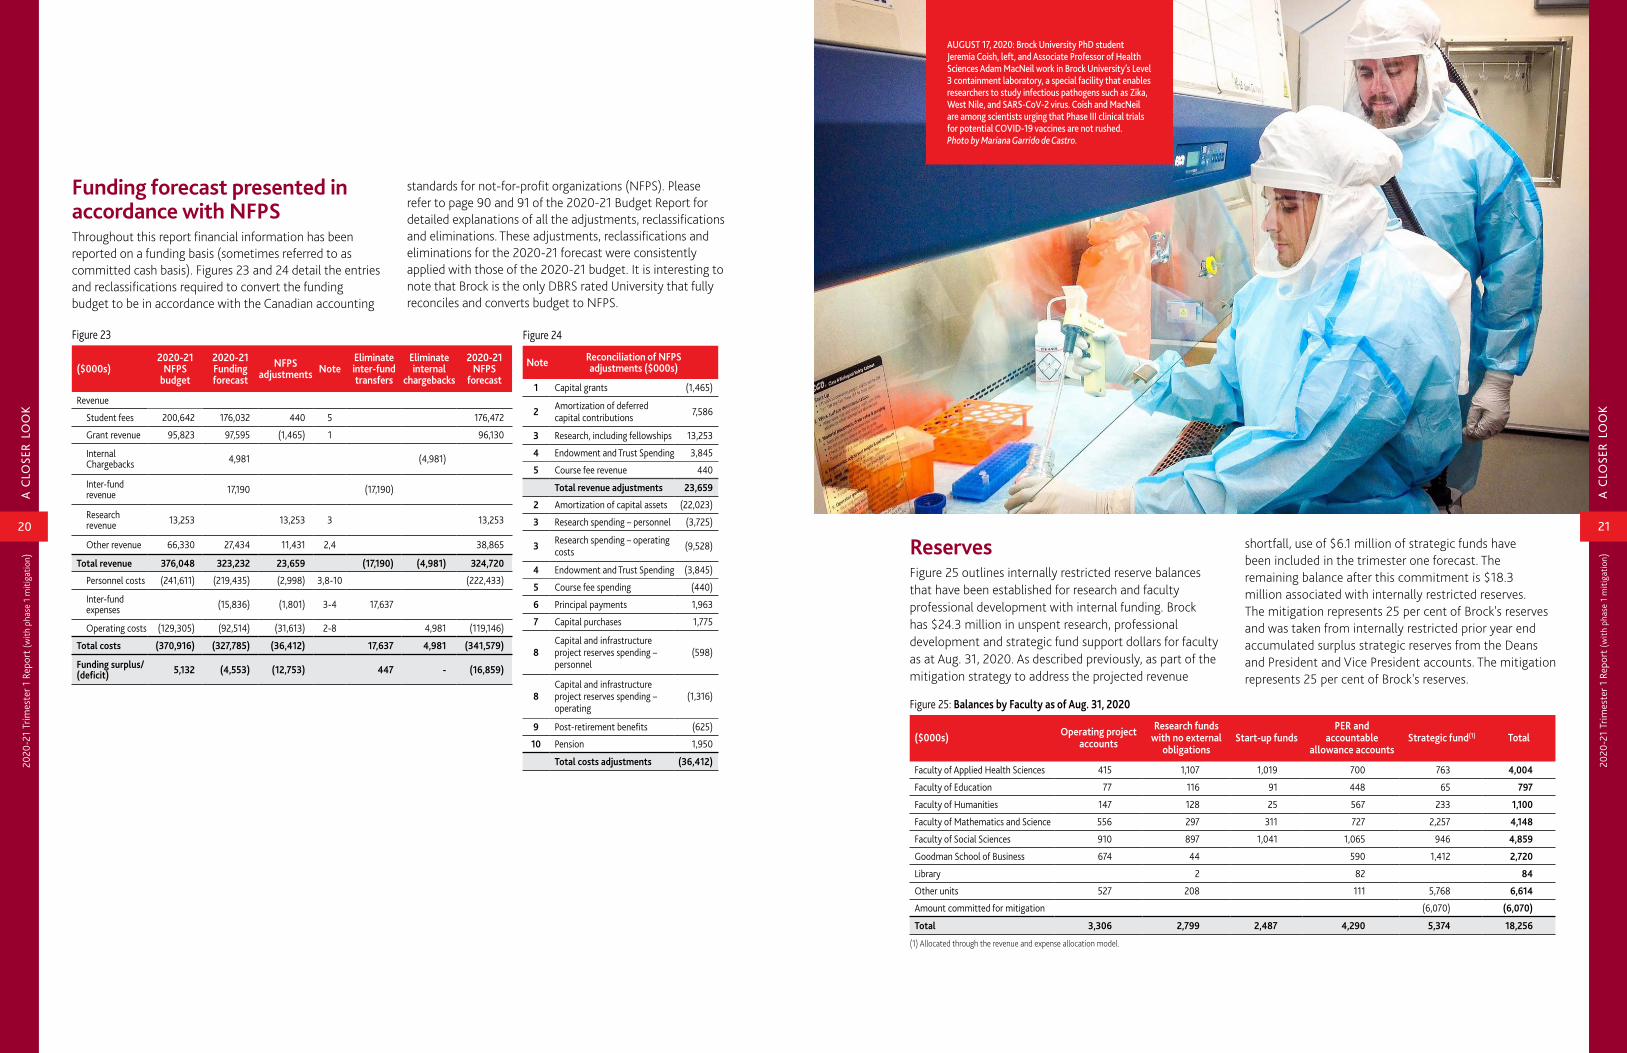
Funding forecast presented in accordance with NFPSThroughout this report financial information has been reported on a funding basis (sometimes referred to as committed cash basis). Figures 23 and 24 detail the entries and reclassifications required to convert the funding budget to be in accordance with the Canadian accounting
Figure 24
Note Reconciliation of NFPS adjustments ($000s)
1 Capital grants (1,465)
2 Amortization of deferred capital contributions 7,586
3 Research, including fellowships 13,253
4 Endowment and Trust Spending 3,845
5 Course fee revenue 440
Total revenue adjustments 23,659
2 Amortization of capital assets (22,023)
3 Research spending – personnel (3,725)
3 Research spending – operating costs (9,528)
4 Endowment and Trust Spending (3,845)
5 Course fee spending (440)
6 Principal payments 1,963
7 Capital purchases 1,775
8Capital and infrastructure project reserves spending – personnel
(598)
8Capital and infrastructure project reserves spending – operating
(1,316)
9 Post-retirement benefits (625)
10 Pension 1,950
Total costs adjustments (36,412)
Figure 23
($000s)2020-21
NFPS budget
2020-21 Funding forecast
NFPS adjustments Note
Eliminate inter-fund transfers
Eliminate internal
chargebacks
2020-21 NFPS
forecast
Revenue
Student fees 200,642 176,032 440 5 176,472
Grant revenue 95,823 97,595 (1,465) 1 96,130
Internal Chargebacks 4,981 (4,981)
Inter-fund revenue 17,190 (17,190)
Research revenue 13,253 13,253 3 13,253
Other revenue 66,330 27,434 11,431 2,4 38,865
Total revenue 376,048 323,232 23,659 (17,190) (4,981) 324,720
Personnel costs (241,611) (219,435) (2,998) 3,8-10 (222,433)
Inter-fund expenses (15,836) (1,801) 3-4 17,637
Operating costs (129,305) (92,514) (31,613) 2-8 4,981 (119,146)
Total costs (370,916) (327,785) (36,412) 17,637 4,981 (341,579)
Funding surplus/(deficit) 5,132 (4,553) (12,753) 447 - (16,859)
Reserves Figure 25 outlines internally restricted reserve balances that have been established for research and faculty professional development with internal funding. Brock has $24.3 million in unspent research, professional development and strategic fund support dollars for faculty as at Aug. 31, 2020. As described previously, as part of the mitigation strategy to address the projected revenue
Figure 25: Balances by Faculty as of Aug. 31, 2020
($000s) Operating project accounts
Research funds with no external
obligationsStart-up funds
PER and accountable
allowance accountsStrategic fund(1) Total
Faculty of Applied Health Sciences 415 1,107 1,019 700 763 4,004
Faculty of Education 77 116 91 448 65 797
Faculty of Humanities 147 128 25 567 233 1,100
Faculty of Mathematics and Science 556 297 311 727 2,257 4,148
Faculty of Social Sciences 910 897 1,041 1,065 946 4,859
Goodman School of Business 674 44 590 1,412 2,720
Library 2 82 84
Other units 527 208 111 5,768 6,614
Amount committed for mitigation (6,070) (6,070)
Total 3,306 2,799 2,487 4,290 5,374 18,256
(1) Allocated through the revenue and expense allocation model.
AUGUST 17, 2020: Brock University PhD student Jeremia Coish, left, and Associate Professor of Health Sciences Adam MacNeil work in Brock University’s Level 3 containment laboratory, a special facility that enables researchers to study infectious pathogens such as Zika, West Nile, and SARS-CoV-2 virus. Coish and MacNeil are among scientists urging that Phase III clinical trials for potential COVID-19 vaccines are not rushed. Photo by Mariana Garrido de Castro.
standards for not-for-profit organizations (NFPS). Please refer to page 90 and 91 of the 2020-21 Budget Report for detailed explanations of all the adjustments, reclassifications and eliminations. These adjustments, reclassifications and eliminations for the 2020-21 forecast were consistently applied with those of the 2020-21 budget. It is interesting to note that Brock is the only DBRS rated University that fully reconciles and converts budget to NFPS.
shortfall, use of $6.1 million of strategic funds have been included in the trimester one forecast. The remaining balance after this commitment is $18.3 million associated with internally restricted reserves. The mitigation represents 25 per cent of Brock's reserves and was taken from internally restricted prior year end accumulated surplus strategic reserves from the Deans and President and Vice President accounts. The mitigation represents 25 per cent of Brock's reserves.
22
2020
-21
Trim
este
r 1 R
epor
t (w
ith p
hase
1 m
itiga
tion)
A
PPEN
DIX
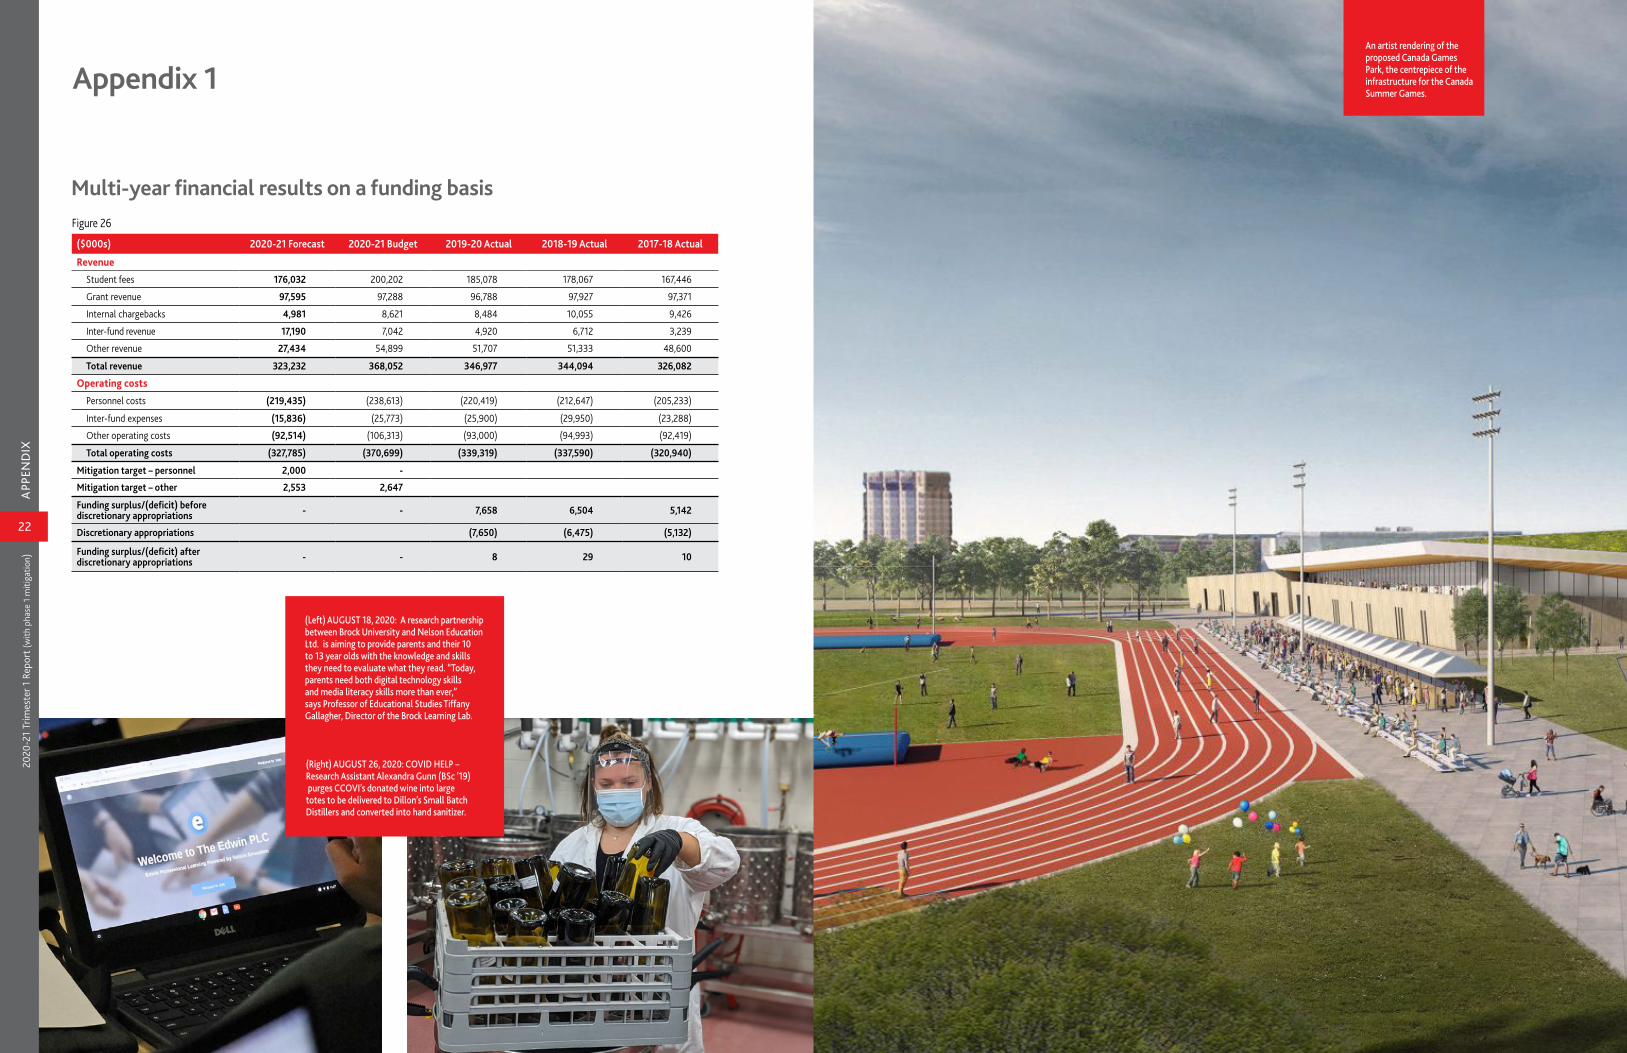
Figure 26
($000s) 2020-21 Forecast 2020-21 Budget 2019-20 Actual 2018-19 Actual 2017-18 Actual
Revenue
Student fees 176,032 200,202 185,078 178,067 167,446
Grant revenue 97,595 97,288 96,788 97,927 97,371
Internal chargebacks 4,981 8,621 8,484 10,055 9,426
Inter-fund revenue 17,190 7,042 4,920 6,712 3,239
Other revenue 27,434 54,899 51,707 51,333 48,600
Total revenue 323,232 368,052 346,977 344,094 326,082
Operating costs
Personnel costs (219,435) (238,613) (220,419) (212,647) (205,233)
Inter-fund expenses (15,836) (25,773) (25,900) (29,950) (23,288)
Other operating costs (92,514) (106,313) (93,000) (94,993) (92,419)
Total operating costs (327,785) (370,699) (339,319) (337,590) (320,940)
Mitigation target – personnel 2,000 -
Mitigation target – other 2,553 2,647
Funding surplus/(deficit) before discretionary appropriations - - 7,658 6,504 5,142
Discretionary appropriations (7,650) (6,475) (5,132)
Funding surplus/(deficit) after discretionary appropriations - - 8 29 10
Appendix 1
Multi-year financial results on a funding basis
(Right) AUGUST 26, 2020: COVID HELP – Research Assistant Alexandra Gunn (BSc ’19) purges CCOVI’s donated wine into large totes to be delivered to Dillon’s Small Batch Distillers and converted into hand sanitizer.
(Left) AUGUST 18, 2020: A research partnership between Brock University and Nelson Education Ltd. is aiming to provide parents and their 10 to 13 year olds with the knowledge and skills they need to evaluate what they read. “Today, parents need both digital technology skills and media literacy skills more than ever,” says Professor of Educational Studies Tiffany Gallagher, Director of the Brock Learning Lab.
An artist rendering of the proposed Canada Games Park, the centrepiece of the infrastructure for the Canada Summer Games.
24
Brock UniversityNiagara Region 1812 Sir Isaac Brock Way St. Catharines, ON L2S 3A1 Canada 905 688 5550
brocku.ca/finance
Student Experience Research Community Engagement Inclusivity
INSTITUTIONAL STRATEGIC PRIORITIES