Embed Size (px)
Citation preview

Press Release
1
First quarter 2019 results1
Paris, April 26, 2019 - Total’s Board of Directors met on April 25, 2019, to approve the Group’s first quarter 2019 financial statements. Commenting on the results, Chairman and CEO Patrick Pouyanné said: “Markets remained volatile with Brent averaging $63/b in the first quarter, down 6% from last year, while natural gas prices were down 11% in Europe and 30% in Asia. Adjusted net income was $2.8 billion this quarter, down 4%, and return on equity held steady at 12% this quarter. With strong growth in production that reached 2.95 Mboe/d, up 9% year-on-year, the Group’s cash flow (DACF) increased by more than 15% year-on-year to $6.5 billion (B$), driven by the ramp-up in cash-accretive projects, including Egina in Nigeria, Ichthys in Australia and Kaombo in Angola. Cash flow after organic investments increased to 3.2 B$, up 18% year-on-year, thanks to strong operational performance and ongoing spending discipline, and the organic pre-dividend cash breakeven was less than $25/b. The Group made two exploration discoveries: Brulpadda in South Africa and Glengorm in the UK North Sea. Effective this quarter, the new iGRP (integrated Gas, Renewables & Power) reporting segment spearheads the Group’s ambition in the integrated gas value chain and low-carbon electricity. The segment’s operating cash flow before working capital changes increased by 55% year-on-year, thanks to growing LNG production by more than 50% and doubling LNG sales activity by Total. To prepare the segment for profitable growth in the future, the Group finalized its entry into the Arctic LNG 2 project in Russia, signed the gas agreement for the Papua LNG project to enable the launch of the engineering phase, and strengthened its commitment to the Tellurian-led Driftwood LNG project in the United States. Downstream continued to perform at a high level, generating 1.7 B$ of operating cash flow before working capital changes, up 25% year-on-year. Total’s balance sheet is strong, with gearing (incorporating the impact of the new IFRS 16 rule on debt) below 20%, in line with the objective. In accordance with the shareholder return policy, the Group increased the first interim dividend for 2019 by 3.1% to €0.66 per share and bought back 0.35 B$ of shares during the quarter, in line with the 2019 target to buy back 1.5 B$ of shares in a $60/b Brent environment. The cash return to the shareholders expressed in dollars stands at 38% of operating cash flow before working capital changes.”
1 Definition on page 2
1Q19 1Q18Changevs 1Q18
Adjusted net income1
- in billions of dollars (B$) 2.8 2.9 -4%
- in dollars per share 1.02 1.09 -6%
DACF1 (B$) 6.5 5.7 +15%
Cash Flow from operations (B$) 3.6 2.1 +74%
Net income (Group share) of 3.1 B$ in 1Q19, a 18% increase compared to 1Q18
Net-debt-to-capital ratio of 19.8% at March 31, 2019
Hydrocarbon production of 2,946 kboe/d in 1Q19, an increase of 9% compared to 1Q18
Ex-dividend date for first interim 2019 dividend of 0.66 €/share on September 27, 2019

2
Key figures23456789
2019 data take into account the impact of the new rule IFRS16 “Leases”, effective January 1, 2019.
* Average €-$ exchange rate: 1.1358 in the first quarter 2019.
** 1Q18 and 4Q18 restated; historical data for 2017 and 2018 available on www.total.com.
Highlights since the beginning of 201910 Started production at the Egina field in Nigeria and Kaombo Sul in Angola Significant exploration discovery of Brulpadda offshore South Africa and a new discovery of
Glengorm in UK North Sea Finalized entry into Arctic LNG 2 project in Russia Signed gas agreement with Papua New Guinea for Papua LNG project Agreed to invest in Tellurian-led Driftwood LNG project in the U.S. and lift 2.5 Mt/y Signed 10-year contract to sell 0.7 Mt/y of LNG to private Chinese company Guanghui Acquired Synova, a company specializing in plastics recycling Agreement with Saudi Aramco to develop a joint venture in distribution and acquire a network of
250 service stations in Saudi Arabia Agreement between Saft and the Chinese Tianneng Group to create a joint venture in Lithium-ion
batteries
2 Adjusted results are defined as income using replacement cost, adjusted for special items, excluding the impact of changes for fair value; adjustment items are on page 11. 3 Tax on adjusted net operating income / (adjusted net operating income – income from equity affiliates – dividends received from investments – impairment of goodwill. + tax on adjusted net operating income). 4 In accordance with IFRS rules, adjusted fully-diluted earnings per share is calculated from the adjusted net income less the interest on the perpetual subordinated bond 5 Organic investments = net investments excluding acquisitions, asset sales and other operations with non-controlling interests. 6 Net acquisitions = acquisitions – assets sales – other transactions with non-controlling interests (see page 11). 7 Net investments = Organic investments + net acquisitions = Total expenditures – asset sales - repayment of non-current loans - other operations with non-controlling interests. 8 Operating cash flow before working capital changes (including only financial charges related to leases), is defined as cash flow from operating activities before changes in working capital at replacement cost. The inventory valuation effect is explained on page 14. The reconciliation table for different cash flow figures is on page 12. 9 DACF = debt adjusted cash flow, is defined as operating cash flow before working capital changes and financial charges. 10 Certain transactions referred to in the highlights are subject to approval by authorities or to other conditions as per the agreements.
In millions of dollars, except effective tax rate,earnings per share and number of shares
1Q19 4Q18 1Q181Q19
vs 1Q18
Adjusted net operating income from business segments 3,413 3,885 3,385 +1%
Exploration & Production** 1,722 1,976 1,817 -5%
Integrated Gas, Renewables & Power** 592 676 481 +23%
Refining & Chemicals 756 900 720 +5%
Marketing & Services 343 333 367 -7%
Contribution of equity affiliates to adjusted net income 614 893 637 -4%
Group effective tax rate3 40.5% 38.1% 39.9% -
Adjusted net income 2,759 3,164 2,884 -4%
Adjusted fully-diluted earnings per share (dollars)4 1.02 1.17 1.09 -6%
Adjusted fully-diluted earnings per share (euros)* 0.90 1.02 0.89 +1%
Fully-diluted weighted-average shares (millions) 2,620 2,637 2,568 +2%
Net income (Group share) 3,111 1,132 2,636 +18%
Organic investments5 2,784 4,459 2,620 +6%
Net acquisitions6 306 (1,751) 1,519 -80%
Net investments7 3,090 2,708 4,139 -25%
Operating cash flow
before working capital changes8 6,033 5,672 5,370 +12%
Operating cash flow before working capital changes w/o financial
charges (DACF)9 6,536 6,095 5,668 +15%
Cash flow from operations 3,629 10,640 2,081 +74%

3
Key figures of environment and Group production
> Environment* – liquids and gas price realizations, refining margins
* The indicators, which were changed in the first quarter of 2019, are shown on page 15.
** Consolidated subsidiaries. Brent was down 6% year-on-year to $63.1/b. The average liquids selling price was more resilient, particularly due to higher prices for Canadian bitumen production. Gas prices fell by 11% in Europe and 30% in Asia year-on-year.
Production*
* Group production = EP production + iGRP production.
** 4Q18 data restated.
Hydrocarbon production was 2,946 thousand barrels of oil equivalent per day (kboe/d) in first quarter 2019, an increase of 9% compared to last year, due to: • +11% related to the start-up and ramp-up of new projects, including Yamal LNG in Russia, Ichthys in
Australia, Kaombo North in Angola and Egina in Nigeria, • +3% portfolio effect linked in particular to the integration of Maersk Oil’s assets, • -2% linked to production quotas, in particular in the United Arab Emirates, and to the deterioration of safety
conditions, notably in Venezuela, • -3% due to the natural decline of the fields and to planned maintenance, notably in Qatar.
1Q19 4Q18 1Q181Q19
vs 1Q18
Brent ($/b) 63.1 68.8 66.8 -6%
Henry Hub ($/Mbtu) 2.9 3.7 2.8 +1%
NBP ($/Mbtu) 6.3 8.8 7.1 -11%
JKM ($/Mbtu) 6.6 10.2 9.4 -30%
Average price of liquids($/b)** 58.7 59.2 60.0 -2%
Average price of gas ($/Mbtu)** 4.5 5.0 4.8 -6%
Variable cost margin - European refining, VCM ($/t) 33.0 40.8 29.8 +11%
1Q19 4Q18 1Q181Q19
vs 1Q18
Hydrocarbon production (kboe/d) 2,946 2,876 2,703 +9%
Oil (including bitumen) (kb/d)** 1,425 1,382 1,297 +10%
Gas (including condensates and associated NGL) (kboe/d)** 1,521 1,493 1,406 +8%
Hydrocarbon production (kboe/d) 2,946 2,876 2,703 +9%
Liquids (kb/d) 1,629 1,589 1,481 +10%
Gas (Mcf/d) 7,321 6,994 6,664 +10%

4
Analysis of business segments Exploration & Production (EP – redefined scope)
> Production
> Results
* Details on adjustment items are shown in the business segment information annex to financial statements. ** Tax on adjusted net operating income / (adjusted net operating income - income from equity affiliates - dividends received from investments - impairment of goodwill + tax on adjusted net operating income).
*** Excluding financial charges, except those related to leases.
Exploration & Production adjusted net operating income was 1,722 M$ in the first quarter of 2019, a decrease of 5% year-on-year, reflecting the weaker environment and an 84 M$ increase in exploration expense this quarter. Operating cash flow before working capital changes increased by 8% year-on-year, driven by the production ramp-up of cash accretive new fields. Exploration & Production generated 2.3 B$ of cash flow after organic investments in the first quarter of 2019.
Hydrocarbon production 1Q19 4Q18 1Q181Q19
vs 1Q18
EP (kboe/d) 2,428 2,408 2,359 +3%
Liquids (kb/d) 1,563 1,541 1,445 +8%
Gas (Mcf/d) 4,707 4,710 4,976 -5%
In millions of dollars, except effective tax rate 1Q19 4Q18 1Q181Q19
vs 1Q18
Adjusted net operating income* 1,722 1,976 1,817 -5%
including income from equity affiliates 213 269 228 -7%
Effective tax rate** 48.6% 41.2% 48.7% -
Organic investments 1,958 2,765 1,798 +9%
Net acquisitions 38 (143) 1,571 -98%
Net investments 1,996 2,622 3,369 -41%
Operating cash flow before working capital changes*** 4,246 3,911 3,921 +8%
Cash flow from operations*** 3,936 6,310 3,322 +18%
5
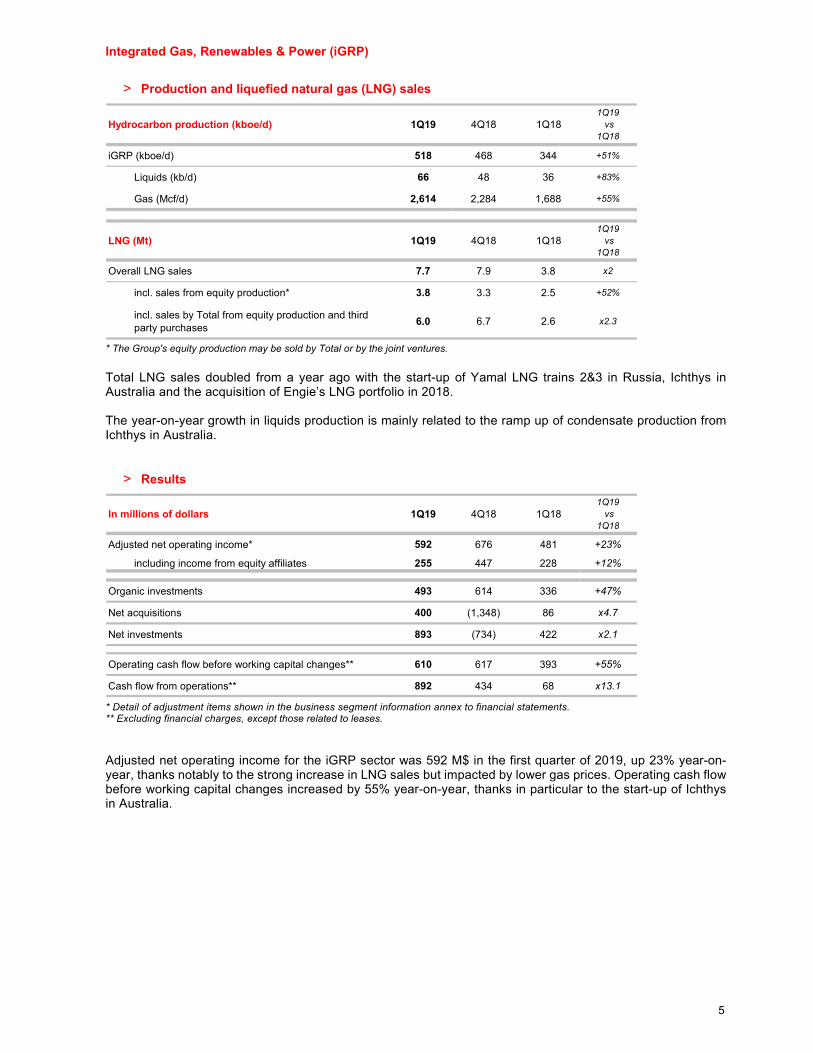
Integrated Gas, Renewables & Power (iGRP)
> Production and liquefied natural gas (LNG) sales
* The Group's equity production may be sold by Total or by the joint ventures.
Total LNG sales doubled from a year ago with the start-up of Yamal LNG trains 2&3 in Russia, Ichthys in Australia and the acquisition of Engie’s LNG portfolio in 2018. The year-on-year growth in liquids production is mainly related to the ramp up of condensate production from Ichthys in Australia.
> Results
* Detail of adjustment items shown in the business segment information annex to financial statements. ** Excluding financial charges, except those related to leases. Adjusted net operating income for the iGRP sector was 592 M$ in the first quarter of 2019, up 23% year-on-year, thanks notably to the strong increase in LNG sales but impacted by lower gas prices. Operating cash flow before working capital changes increased by 55% year-on-year, thanks in particular to the start-up of Ichthys in Australia.
Hydrocarbon production (kboe/d) 1Q19 4Q18 1Q181Q19
vs 1Q18
iGRP (kboe/d) 518 468 344 +51%
Liquids (kb/d) 66 48 36 +83%
Gas (Mcf/d) 2,614 2,284 1,688 +55%
LNG (Mt) 1Q19 4Q18 1Q181Q19
vs 1Q18
Overall LNG sales 7.7 7.9 3.8 x2
incl. sales from equity production* 3.8 3.3 2.5 +52%
incl. sales by Total from equity production and third party purchases
6.0 6.7 2.6 x2.3
In millions of dollars 1Q19 4Q18 1Q181Q19
vs 1Q18
Adjusted net operating income* 592 676 481 +23%
including income from equity affiliates 255 447 228 +12%
Organic investments 493 614 336 +47%
Net acquisitions 400 (1,348) 86 x4.7
Net investments 893 (734) 422 x2.1
Operating cash flow before working capital changes** 610 617 393 +55%
Cash flow from operations** 892 434 68 x13.1

6
Refining & Chemicals > Refinery throughput and utilization rates*
* Includes refineries in Africa reported in the Marketing & Services segment. ** Based on distillation capacity at the beginning of the year. Refinery throughput volumes increased by 2% in the first quarter 2019 compared to the first quarter 2018, as a result of improved use of facilities in the first quarter of 2019 linked to improved operational performance this year.
> Results
* Detail of adjustment items shown in the business segment information annex to financial statements.
** Excluding financial charges, except those related to leases.
With the European refining variable cost margin (VCM) up 11% year-on-year and despite a deterioration in petrochemical margins, adjusted net operating income for the Refining & Chemicals segment increased by 5% year-on-year to 756 M$. Operating cash flow before working capital changes increased by 20% year-on-year.
1Q19 4Q18 1Q181Q19
vs 1Q18
Total refinery throughput (kb/d) 1,862 1,886 1,832 +2%
France 592 591 624 -5%
Rest of Europe 823 809 746 +10%
Rest of world 447 486 462 -3%
Utlization rate based on crude only** 89% 90% 87% -
In millions of dollars 1Q19 4Q18 1Q181Q19
vs 1Q18
Adjusted net operating income* 756 900 720 +5%
Organic investments 240 615 308 -22%
Net acquisitions (124) (429) (1) x124
Net investments 116 186 307 -62%
Operating cash flow before working capital changes** 1,104 1,276 920 +20%
Cash flow from operations** (538) 3,080 (1,109) -51%

7
Marketing & Services
> Petroleum product sales
* Excludes trading and bulk refining sales Sales of petroleum products increased by 2% compared to last year, in line with market growth.
> Results
* Detail of adjustment items shown in the business segment information annex to financial statements.
** Excluding financial charges, except those related to leases
Adjusted net operating income was 343 M$ in the first quarter, down 7% year-on-year due to the sale of Total Erg in 2018. Group results
> Adjusted net operating income from business segments
Adjusted net operating income from the business segments was 3,413 M$ in the first quarter 2019, up 1% year-on-year, despite lower Brent prices. This strong resilience is linked to production growth in a context of continuing efforts to reduce costs.
> Adjusted net income (Group share)
Adjusted net income (Group share) was 2,759 M$ in the first quarter 2019, down 4% compared to last year. This decrease reflects the increase in the net cost of net debt compared to a year ago mainly due to the rise in U.S. dollar interest rates. Adjusted net income excludes the after-tax inventory effect, special items and the impact of effects of changes in fair value11. Total net income adjustments12 were 352 M$ in the first quarter 2019, primarily related to inventory items. The effective tax rate for the Group was stable in the first quarter 2019 at 40.5%, compared to 39.9% last year.
11 Adjustment items shown on page 11. 12 Details shown on page 11 and in the annex to the financial statements.
Sales in kb/d* 1Q19 4Q18 1Q181Q19
vs 1Q18
Total Marketing & Services sales 1,836 1,786 1,801 +2%
Europe 1,012 986 993 +2%
Rest of world 824 800 808 +2%
In millions of dollars 1Q19 4Q18 1Q181Q19
vs 1Q18
Adjusted net operating income* 343 333 367 -7%
Organic investments 80 424 136 -41%
Net acquisitions (8) 165 (136) ns
Net investments 72 589 - ns
Operating cash flow before working capital changes** 582 500 430 +35%
Cash flow from operations** 232 1,226 (60) ns

8
> Adjusted fully-diluted earnings per share
Adjusted earnings per share in the first quarter 2019 decreased by 6% to $1.02, calculated on the basis of a weighted average of 2,620 million fully-diluted shares, from $1.09 in the first quarter 2018. In the context of the shareholder return policy announced in February 2018, the Group has continued to buy back shares, including:
the buyback of shares issued in 2019 under the scrip dividend option to cancel any dilution related to the exercise of this option: 1.2 million shares repurchased in the first quarter 2019.
the buyback of additional shares : 6.2 million shares repurchased in the first quarter 2019 for 0.35 B$ as part of the 5 B$ buyback program for 2018-20.
The number of fully-diluted shares was 2,620 million on March 31, 2019.
Asset sales – acquisitions
Asset sales completed in the first quarter 2019 were 363 M$, comprised mainly of the sale of the Group’s interest in the Hazira terminal in India and its polystyrene activity in China.
Acquisitions completed in the first quarter 2019 were 669 M$, related mainly to the signature of the acquisition of a 10% stake in the Arctic LNG 2 project in Russia.
Net cash flow
Net cash flow13 for the Group was 2,943 M$ in the first quarter 2019, up sharply year-on-year due to higher operating cash flow before working capital changes and lower net acquisitions.
Profitability
The return on equity was 11.7% for the twelve months ended March 31, 2019, an increase compared to the same period last year.
The return on average capital employed was 10.7% for the twelve months ended March 31, 2019, an increase compared to the same period last year.
Total S.A. accounts Net income for Total S.A., the parent company, was 1,391 million euros in the first quarter 2019, compared with 1,928 million euros a year ago.
13 Net cash flow = operating cash flow before working capital changes - net investments (including other transactions with non-controlling interests).
In millions of dollars
Adjusted net income
Average adjusted shareholders' equity
Return on equity (ROE)
April 1, 2017March 31, 2018
11,150
111,522
10.0%11.7% 12.2%
April 1, 2018March 31, 2019
January 1, 2018 toDecember 31, 2018
13,810 13,964
118,094 114,183
In millions of dollars
Adjusted net operating income
Average capital employed
ROACE
146,210 133,123 136,384
10.7% 11.8% 9.1%
April 1, 2018March 31, 2019
January 1, 2018 toDecember 31, 2018
April 1, 2017March 31, 2018
15,697 15,691 12,428

9
2019 Sensitivities*
* Sensitivities are revised once per year upon publication of the previous year’s fourth quarter results. Sensitivities are estimates based on assumptions about the Group’s portfolio in 2019. Actual results could vary significantly from estimates based on the application of these sensitivities. The impact of the $-€ sensitivity on adjusted net operating income is essentially attributable to Refining & Chemicals.
** In a 60 $/b Brent environment.
*** VCM was introduced with the release of the main indicators for the first quarter of 2019.
Summary and outlook Since the start of the second quarter 2019, Brent has traded at around $70/b in a context of compliance with OPEC quotas, disrupted production in Venezuela and uncertainty in Libya. The environment remains volatile, however, with uncertainty around the evolution of non-OPEC supply and the impact of global economic growth on demand. The Group has strong visibility on DACF growth in 2019 with an increase of 6 B$ compared to 2017 at $60/b thanks to the ramp-up of high cash margin projects, like Ichthys in Australia, Kaombo in Angola and Egina in Nigeria, that have already started up. It will also benefit from the full-year contribution of the Maersk Oil assets and ADNOC Offshore in 2019. The Group maintains its spending discipline in 2019 with a net investment target of 15-16 B$, cost savings of 4.7 B$ and an average production cost of $5.5/boe. The organic pre-dividend cash flow breakeven will remain below $30/b. Production growth should exceed 9% in 2019, thanks to the ramp-up of projects started in 2018 and the start-ups this year of Kaombo Sul in Angola, Iara 1 in Brazil, Culzean in the UK and Johan Sverdrup in Norway. To take advantage of the favorable cost environment, the Group is working to launch profitable projects, including Mero 2 in Brazil, Tilenga & Kingfisher in Uganda and Arctic LNG 2 in Russia. After the acquisition of Engie’s LNG assets in 2018, the Group is continuing to grow in this area in 2019 with the planned start-up of Cameron LNG in the United States. Refining margins remain volatile at the start of the second quarter and the refinery utilization rate is expected to be affected by seasonal maintenance in France and the UK in the second quarter. In this context, the Group is continuing to implement its shareholder return policy. The dividend in euro will be increased by 3.1% in 2019 representing a total increase of 6.5% since 2017 in line with the target increase of 10% over the period 2018-2020. Total will buy back 1.5 B$ of shares in 2019 at $60/b as part of its 5 B$ share buyback program over the 2018-2020 period, and it will eliminate the scrip dividend option as of June 2019.
To listen to the presentation by CFO Patrick de La Chevardière today at 13:00 (London time) please log on to total.com or call +44 (0) 207 192 8000 in Europe or +1 631 510 7495 in the United States (code: 9794372). To listen to the replay, please consult the website or call +44 (0) 333 300 9785 in Europe or +1 917 677 7532 in the United States (code: 9794372).
* * * * *
Total contacts
Media Relations: +33 1 47 44 46 99 l [email protected] l @TotalPress
Investors Relations: +44 (0) 207 719 7962 l [email protected]
Change
Estimated impact on adjusted
net operating income
Estimated impact on cash flow
from operations
Dollar +/- 0.1 $ per € -/+ 0.1 B$ ~0 B$
Average liquids price** +/- 10 $/b +/- 2.7 B$ +/- 3.2 B$
Variable cost margin, European refining (VCM)*** +/- 10 $/t +/- 0.5 B$ +/- 0.6 B$

10
Operating information by segment
Group production (EP + iGRP)
Combined liquids and gasproduction by region (kboe/d)
1Q19 4Q18 1Q181Q19
vs 1Q18
Europe and Central Asia 990 997 886 +12%
Africa 697 661 673 +3%
Middle East and North Africa 686 655 639 +7%
Americas 373 386 371 +1%
Asia-Pacific 201 176 134 +50%
Total production 2,946 2,876 2,703 +9%
includes equity affiliates 709 699 724 -2%
Liquids production by region (kb/d) 1Q19 4Q18 1Q181Q19
vs 1Q18
Europe and Central Asia 352 363 299 +18%
Africa 540 509 503 +7%
Middle East and North Africa 522 503 501 +4%
Americas 177 191 165 +7%
Asia-Pacific 39 22 13 +199%
Total production 1,629 1,589 1,481 +10%
includes equity affiliates 217 231 304 -29%
Gas production by region (Mcf/d) 1Q19 4Q18 1Q181Q19
vs 1Q18
Europe and Central Asia 3,426 3,416 3,157 +9%
Africa 792 738 857 -8%
Middle East and North Africa 905 843 761 +19%
Americas 1,101 1,094 1,158 -5%
Asia-Pacific 1,097 903 731 +50%
Total production 7,321 6,994 6,664 +10%
includes equity affiliates 2,653 2,524 2,257 +18%

11
Downstream (Refining & Chemicals and Marketing & Services)
Adjustment items to net income (Group share)
Investments - Divestments
Petroleum product sales by region (kb/d) 1Q19 4Q18 1Q181Q19
vs 1Q18
Europe 2,022 2,062 1,902 +6%
Africa 658 778 754 -13%
Americas 839 767 760 +10%
Rest of world 616 531 680 -9%
Total consolidated sales 4,135 4,138 4,096 +1%
Includes bulk sales 557 593 570 -2%
Includes trading 1,742 1,759 1,725 +1%
In millions of dollars 1Q19 4Q18 1Q18
Special items affecting net income (Group share) (14) (1,026) (195)
Gain (loss) on asset sales - (2) (101)
Restructuring charges (2) (32) (21)
Impairments - (1,259) (12)
Other (12) 267 (61)
After-tax inventory effect : FIFO vs. replacement cost 388 (1,052) (45)
Effect of changes in fair value (22) 46 (8)
Total adjustments affecting net income 352 (2,032) (248)
In millions of dollars 1Q19 4Q18 1Q181Q19
vs 1Q18
Organic investments (a) 2,784 4,459 2,620 +6%
capitalized exploration 232 306 111 x2.1
increase in non-current loans 130 160 171 -24%
repayment of non-current loans (134) (382) (416) -68%
Acquisitions (b) 669 349 3,688 -82%
Asset sales (c) 363 2,101 2,169 -83%
Other transactions with non-controlling interests (d) - (1) - -
Net investments (a + b - c - d) 3,090 2,708 4,139 -25%

12
Cash flow
Gearing ratio*
*The net-debt-to-capital ratio on March 31, 2019 includes the impact of the new IFRS 16 rule, effective January 1, 2019.
In millions of dollars 1Q19 4Q18 1Q181Q19
vs 1Q18
Operating cash flow before working capital changes excluding financials charges (DACF)
6,536 6,095 5,668 +15%
Financial charges (503) (423) (298) +69%
Operating cash flow before working capital changes (a) 6,033 5,672 5,370 +12%
(Increase) decrease in working capital (2,970) 6,425 (3,222) -8%
Inventory effect 566 (1,457) (67) ns
Cash flow from operations 3,629 10,640 2,081 +74%
Organic investments (b) 2,784 4,459 2,620 +6%
Free cash flow after organic investments,excluding net acquisitions (a-b)
3,249 1,213 2,750 +18%
Net investments ( c ) 3,090 2,708 4,139 -25%
Net cash flow (a-c) 2,943 2,964 1,231 x2.4
In millions of dollars 03/31/2019 12/31/2018 03/31/2018
Current borrowings 13,906 13,306 14,909
Net current financial assets (2,722) (3,176) (1,920)
Net financial assets classified as held for sale 227 (15) -
Non-current financial debt 44,396 40,129 40,257
Hedging instruments of non-current debt (637) (680) (1,154)
Cash and cash equivalents (25,432) (27,907) (30,092)
Net debt (a) 29,738 21,657 22,000
Shareholders’ equity - Group share 117,993 115,640 121,187
Non-controlling interests 2,365 2,474 2,499
Shareholders' equity (b) 120,358 118,114 123,686
Net-debt-to-capital ratio = a / (a + b) 19.8% 15.5% 15.1%

13
Return on average capital employed
Twelve months ended March 31, 2019
Full-year 2018
* At replacement cost (excluding after-tax inventory effect).
In millions of dollarsExploration &
Production
Integrated Gas, Renewables &
Power
Refining & Chemicals
Marketing & Services
Group
Adjusted net operating income 8,452 2,530 3,415 1,628 15,697
Capital employed at 3/31/2018* 93,276 30,996 13,428 7,409 143,957
Capital employed at 3/31/2019* 90,051 37,235 13,153 8,255 148,463
ROACE 9.2% 7.4% 25.7% 20.8% 10.7%
In millions of dollarsExploration &
Production
Integrated Gas, Renewables &
Power
Refining & Chemicals
Marketing & Services
Group
Adjusted net operating income 8,547 2,419 3,379 1,652 15,691
Capital employed at 12/31/2017* 82,510 30,103 11,045 6,929 127,727
Capital employed at 12/31/2018* 89,400 34,746 10,599 6,442 138,519
ROACE 9.9% 7.5% 31.2% 24.7% 11.8%
14
This press release presents the results for the first quarter 2019 from the consolidated financial statements of TOTAL S.A. as of March 31, 2019 (unaudited). The review procedures by the Statutory Auditors are underway. This document does not constitute the Annual Financial Report (Rapport Financier Annuel) within the meaning of article L. 451-1-2 of the French monetary and financial Code (Code monétaire et financier). This document may contain forward-looking information on the Group (including objectives and trends), as well as forward-looking statements within the meaning of the Private Securities Litigation Reform Act of 1995, notably with respect to the financial condition, results of operations, business, strategy and plans of TOTAL. These data do not represent forecasts within the meaning of European Regulation No. 809/2004. Such forward-looking information and statements included in this document are based on a number of economic data and assumptions made in a given economic, competitive and regulatory environment. They may prove to be inaccurate in the future, and are subject to a number of risk factors that could lead to a significant difference between actual results and those anticipated, the price of petroleum products, the ability to realize cost reductions and operating efficiencies without unduly disrupting business operations, changes in regulations including environmental and climate, currency fluctuations, as well as economic and political developments and changes in business conditions. Certain financial information is based on estimates particularly in the assessment of the recoverable value of assets and potential impairments of assets relating thereto. Neither TOTAL nor any of its subsidiaries assumes any obligation to update publicly any forward-looking information or statement, objectives or trends contained in this document whether as a result of new information, future events or otherwise. Further information on factors, risks and uncertainties that could affect the Group’s business, financial condition, including its operating income and cash flow, reputation or outlook is provided in the most recent Registration Document, the French language version of which is filed by the Company with the French Autorité des Marchés Financiers and annual report on Form 20-F filed with the United States Securities and Exchange Commission (“SEC”). Financial information by business segment is reported in accordance with the internal reporting system and shows internal segment information that is used to manage and measure the performance of TOTAL. In addition to IFRS measures, certain alternative performance indicators are presented, such as performance indicators excluding the adjustment items described below (adjusted operating income, adjusted net operating income, adjusted net income), return on equity (ROE), return on average capital employed (ROACE) and gearing ratio. These indicators are meant to facilitate the analysis of the financial performance of TOTAL and the comparison of income between periods. They allow investors to track the measures used internally to manage and measure the performance of the Group. These adjustment items include: (i) Special items Due to their unusual nature or particular significance, certain transactions qualified as "special items" are excluded from the business segment figures. In general, special items relate to transactions that are significant, infrequent or unusual. However, in certain instances, transactions such as restructuring costs or asset disposals, which are not considered to be representative of the normal course of business, may be qualified as special items although they may have occurred within prior years or are likely to occur again within the coming years. (ii) Inventory valuation effect The adjusted results of the Refining & Chemicals and Marketing & Services segments are presented according to the replacement cost method. This method is used to assess the segments’ performance and facilitate the comparability of the segments’ performance with those of its competitors. In the replacement cost method, which approximates the LIFO (Last-In, First-Out) method, the variation of inventory values in the statement of income is, depending on the nature of the inventory, determined using either the month-end price differentials between one period and another or the average prices of the period rather than the historical value. The inventory valuation effect is the difference between the results according to the FIFO (First-In, First-Out) and the replacement cost. (iii) Effect of changes in fair value The effect of changes in fair value presented as an adjustment item reflects, for some transactions, differences between internal measures of performance used by TOTAL’s management and the accounting for these transactions under IFRS. IFRS requires that trading inventories be recorded at their fair value using period-end spot prices. In order to best reflect the management of economic exposure through derivative transactions, internal indicators used to measure performance include valuations of trading inventories based on forward prices. Furthermore, TOTAL, in its trading activities, enters into storage contracts, whose future effects are recorded at fair value in Group’s internal economic performance. IFRS precludes recognition of this fair value effect. The adjusted results (adjusted operating income, adjusted net operating income, adjusted net income) are defined as replacement cost results, adjusted for special items, excluding the effect of changes in fair value. Euro amounts presented for the fully adjusted-diluted earnings per share represent dollar amounts converted at the average euro-dollar (€-$) exchange rate for the applicable period and are not the result of financial statements prepared in euros. Cautionary Note to U.S. Investors – The SEC permits oil and gas companies, in their filings with the SEC, to separately disclose proved, probable and possible reserves that a company has determined in accordance with SEC rules. We may use certain terms in this press release, such as “potential reserves” or “resources”, that the SEC’s guidelines strictly prohibit us from including in filings with the SEC. U.S. investors are urged to consider closely the disclosure in our Form 20-F, File N° 1-10888, available from us at 2, place Jean Millier – Arche Nord Coupole/Regnault - 92078 Paris-La Défense Cedex, France, or at our website total.com. You can also obtain this form from the SEC by calling 1-800-SEC-0330 or on the SEC’s website sec.gov.

15
Main indicators
Note: The indicators for average liquids price and average gas price have been amended and a new indicator of variable cost margin for European refining has been introduced in replacement of the ERMI (European Refining Margin Indicator). Corresponding 2018 data has been restated to reflect these changes.
$/€ Brent ($/b) Average liquids price* ($/b) Average gas price* ($/Mbtu) Variable cost margin, European refining**
($/t)
First quarter 2019 1.14 63.1 58.7 4.51 33.0
Fourth quarter 2018 1.14 68.8 59.2 5.01 40.8
Third quarter 2018 1.16 75.2 68.8 5.06 47.2
Second quarter 2018 1.19 74.4 68.4 4.62 33.9
First quarter 2018 1.23 66.8 60.0 4.79 29.8
* Sales in $ / sales in volume for consolidated subsidiaries (no longer including stock value variation).
** This indicator represents the average margin on variable costs realized by Total’s European refining business (equal to the difference between the sales of refined products realized by Total’s European refining and the crude purchases as well as associated variable costs, divided by refinery throughput in tonnes). The previous ERMI indicator was intended to represent the margin after variable costs for a hypothetical complex refinery located around Rotterdam in Northern Europe that processes a mix of crude oil and other inputs commonly supplied to this region to produce and market the main refined products at prevailing prices in this region.
Disclaimer: data is based on Total’s reporting and is not audited. To the extent permitted by law, TOTAL S.A. disclaims all liability from the use of the restated main indicators.
16
Total financial statements First quarter 2019 consolidated accounts, IFRS

17
CONSOLIDATED STATEMENT OF INCOME
TOTAL
(unaudited)
1st quarter 4th quarter 1st quarter(M$)(a) 2019 2018 2018
Sales 51,205 52,495 49,611
Excise taxes (6,081) (6,183) (6,319)
Revenues from sales 45,124 46,312 43,292
Purchases, net of inventory variation (29,721) (33,420) (29,446)Other operating expenses (6,725) (6,913) (6,937)
Exploration costs (288) (201) (204)
Depreciation, depletion and impairment of tangible assets and mineral interests (3,466) (4,362) (2,916)
Other income 247 482 523
Other expense (209) (315) (190)
Financial interest on debt (561) (529) (390)Financial income and expense from cash & cash equivalents (28) (30) (41)
Cost of net debt (589) (559) (431)
Other financial income 160 269 240 Other financial expense (195) (185) (170)
Net income (loss) from equity affiliates 711 665 484
Income taxes (1,909) (593) (1,596)
Consolidated net income 3,140 1,180 2,649
Group share 3,111 1,132 2,636
Non-controlling interests 29 48 13
Earnings per share ($) 1.17 0.40 1.00 Fully-diluted earnings per share ($) 1.16 0.40 0.99
(a) Except for per share amounts.
18
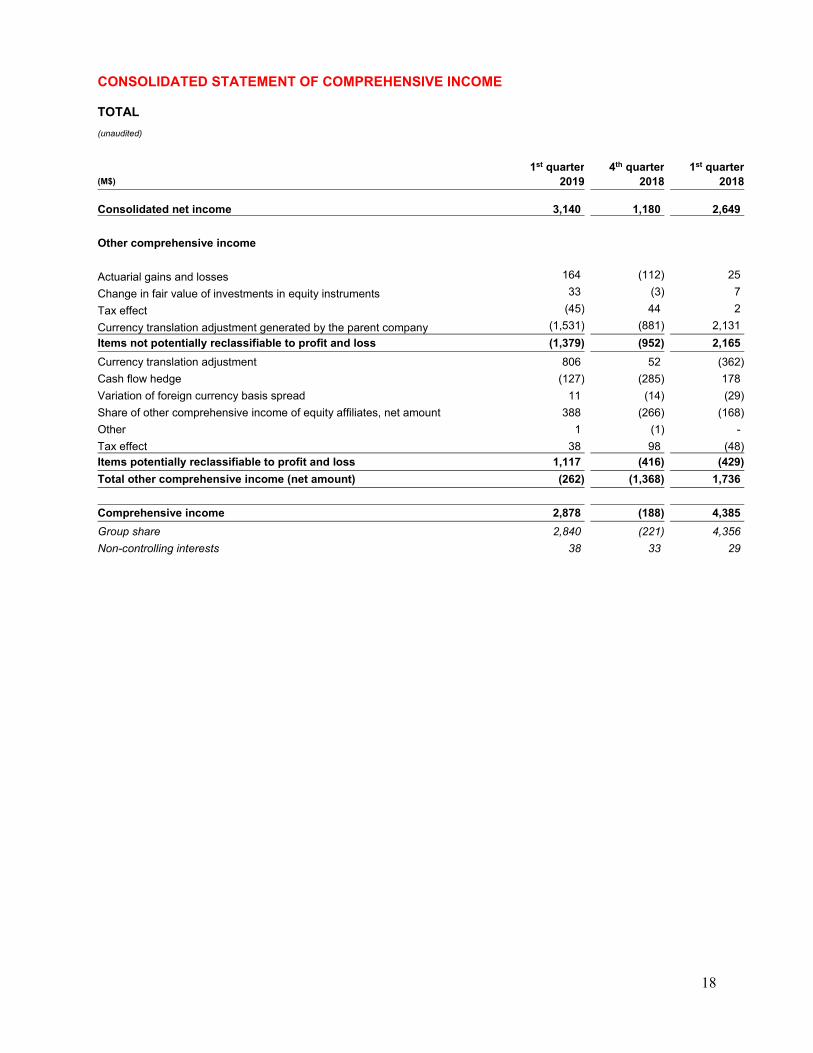
CONSOLIDATED STATEMENT OF COMPREHENSIVE INCOME
TOTAL
(unaudited)
1st quarter 4th quarter 1st quarter(M$) 2019 2018 2018
Consolidated net income 3,140 1,180 2,649
Other comprehensive income
Actuarial gains and losses 164 (112) 25
Change in fair value of investments in equity instruments 33 (3) 7
Tax effect (45) 44 2
Currency translation adjustment generated by the parent company (1,531) (881) 2,131
Items not potentially reclassifiable to profit and loss (1,379) (952) 2,165
Currency translation adjustment 806 52 (362)
Cash flow hedge (127) (285) 178
Variation of foreign currency basis spread 11 (14) (29)
Share of other comprehensive income of equity affiliates, net amount 388 (266) (168)
Other 1 (1) -
Tax effect 38 98 (48)Items potentially reclassifiable to profit and loss 1,117 (416) (429)
Total other comprehensive income (net amount) (262) (1,368) 1,736
Comprehensive income 2,878 (188) 4,385
Group share 2,840 (221) 4,356
Non-controlling interests 38 33 29
19
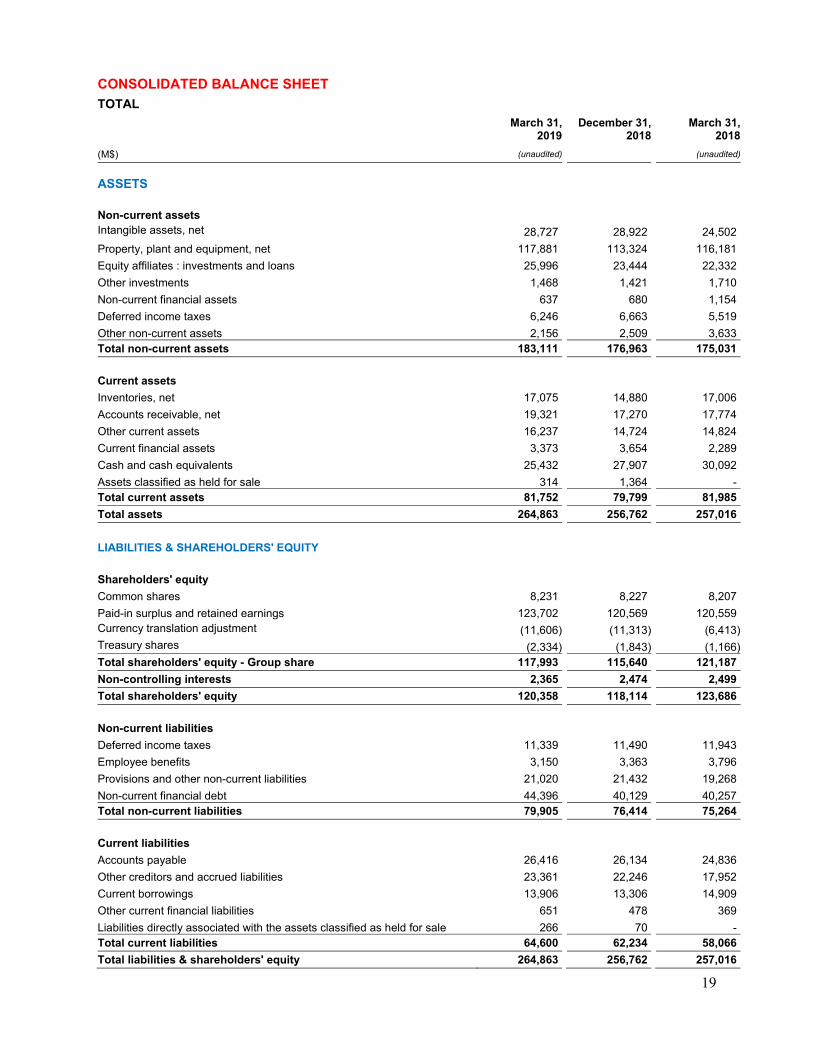
CONSOLIDATED BALANCE SHEET TOTAL
March 31,
2019December 31,
2018 March 31,
2018
(M$) (unaudited) (unaudited) (unaudited)
ASSETS
Non-current assets Intangible assets, net 28,727 28,922 24,502
Property, plant and equipment, net 117,881 113,324 116,181
Equity affiliates : investments and loans 25,996 23,444 22,332
Other investments 1,468 1,421 1,710
Non-current financial assets 637 680 1,154
Deferred income taxes 6,246 6,663 5,519
Other non-current assets 2,156 2,509 3,633 Total non-current assets 183,111 176,963 175,031
Current assets
Inventories, net 17,075 14,880 17,006
Accounts receivable, net 19,321 17,270 17,774
Other current assets 16,237 14,724 14,824
Current financial assets 3,373 3,654 2,289
Cash and cash equivalents 25,432 27,907 30,092
Assets classified as held for sale 314 1,364 - Total current assets 81,752 79,799 81,985
Total assets 264,863 256,762 257,016
LIABILITIES & SHAREHOLDERS' EQUITY
Shareholders' equity
Common shares 8,231 8,227 8,207
Paid-in surplus and retained earnings 123,702 120,569 120,559 Currency translation adjustment (11,606) (11,313) (6,413)Treasury shares (2,334) (1,843) (1,166)Total shareholders' equity - Group share 117,993 115,640 121,187
Non-controlling interests 2,365 2,474 2,499
Total shareholders' equity 120,358 118,114 123,686
Non-current liabilities
Deferred income taxes 11,339 11,490 11,943
Employee benefits 3,150 3,363 3,796
Provisions and other non-current liabilities 21,020 21,432 19,268
Non-current financial debt 44,396 40,129 40,257 Total non-current liabilities 79,905 76,414 75,264
Current liabilities
Accounts payable 26,416 26,134 24,836
Other creditors and accrued liabilities 23,361 22,246 17,952
Current borrowings 13,906 13,306 14,909
Other current financial liabilities 651 478 369
Liabilities directly associated with the assets classified as held for sale 266 70 - Total current liabilities 64,600 62,234 58,066
Total liabilities & shareholders' equity 264,863 256,762 257,016
20
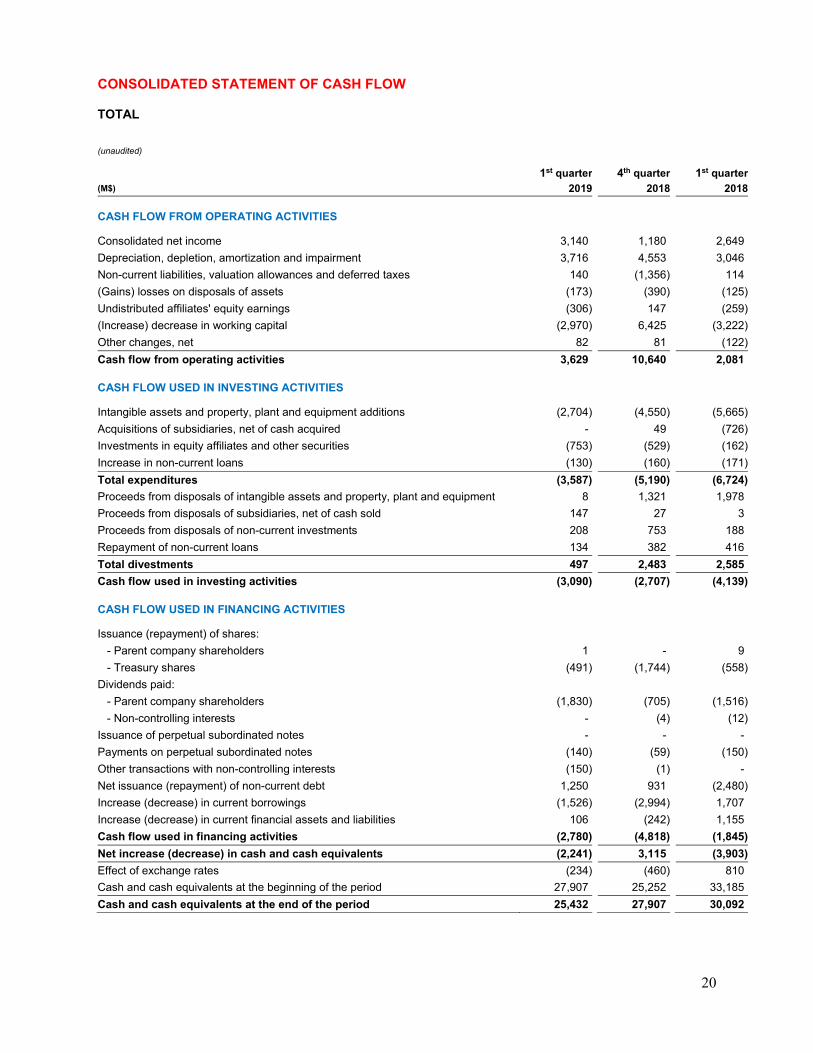
CONSOLIDATED STATEMENT OF CASH FLOW
TOTAL
(unaudited)
1st quarter 4th quarter 1st quarter(M$) 2019 2018 2018
CASH FLOW FROM OPERATING ACTIVITIES
Consolidated net income 3,140 1,180 2,649
Depreciation, depletion, amortization and impairment 3,716 4,553 3,046
Non-current liabilities, valuation allowances and deferred taxes 140 (1,356) 114
(Gains) losses on disposals of assets (173) (390) (125)
Undistributed affiliates' equity earnings (306) 147 (259)
(Increase) decrease in working capital (2,970) 6,425 (3,222)
Other changes, net 82 81 (122)
Cash flow from operating activities 3,629 10,640 2,081
CASH FLOW USED IN INVESTING ACTIVITIES
Intangible assets and property, plant and equipment additions (2,704) (4,550) (5,665)
Acquisitions of subsidiaries, net of cash acquired - 49 (726)
Investments in equity affiliates and other securities (753) (529) (162)
Increase in non-current loans (130) (160) (171)
Total expenditures (3,587) (5,190) (6,724)
Proceeds from disposals of intangible assets and property, plant and equipment 8 1,321 1,978
Proceeds from disposals of subsidiaries, net of cash sold 147 27 3
Proceeds from disposals of non-current investments 208 753 188
Repayment of non-current loans 134 382 416
Total divestments 497 2,483 2,585
Cash flow used in investing activities (3,090) (2,707) (4,139)
CASH FLOW USED IN FINANCING ACTIVITIES
Issuance (repayment) of shares:
- Parent company shareholders 1 - 9
- Treasury shares (491) (1,744) (558)
Dividends paid:
- Parent company shareholders (1,830) (705) (1,516)
- Non-controlling interests - (4) (12)
Issuance of perpetual subordinated notes - - -
Payments on perpetual subordinated notes (140) (59) (150)
Other transactions with non-controlling interests (150) (1) -
Net issuance (repayment) of non-current debt 1,250 931 (2,480)
Increase (decrease) in current borrowings (1,526) (2,994) 1,707
Increase (decrease) in current financial assets and liabilities 106 (242) 1,155
Cash flow used in financing activities (2,780) (4,818) (1,845)
Net increase (decrease) in cash and cash equivalents (2,241) 3,115 (3,903)
Effect of exchange rates (234) (460) 810
Cash and cash equivalents at the beginning of the period 27,907 25,252 33,185
Cash and cash equivalents at the end of the period 25,432 27,907 30,092

21
CONSOLIDATED STATEMENT OF CHANGES IN SHAREHOLDERS' EQUITY TOTAL (unaudited)
Common shares issued Paid-insurplus and
retainedearnings
Currency translationadjustment
Treasury shares Shareholders'equity - Group
Share
Non-controlling
interests
Total shareholders'
equity (M$) Number Amount Number Amount
As of January 1, 2018 2,528,989,616 7,882 112,040 (7,908) (8,376,756) (458) 111,556 2,481 114,037 Net income of the first quarter
2018 - - 2,636 - - - 2,636 13 2,649
Other comprehensive Income - - 225 1,495 - - 1,720 16 1,736
Comprehensive Income - - 2,861 1,495 - - 4,356 29 4,385
Dividend - - - - - - - (12) (12)
Issuance of common shares 104,830,551 325 5,675 - - - 6,000 - 6,000
Purchase of treasury shares - - - - (12,471,369) (708) (708) - (708)
Sale of treasury shares(a) - - - - - - - - -
Share-based payments - - 129 - - - 129 - 129
Share cancellation - - - - - - - - -
Issuance of perpetual subordinated
notes - - - - - - - - -
Payments on perpetual
subordinated notes - - (81) - - - (81) - (81)
Other operations with
non-controlling interests - - (4) - - - (4) 4 -
Other items - - (61) - - - (61) (3) (64)
As of March 31, 2018 2,633,820,167 8,207 120,559 (6,413) (20,848,125) (1,166) 121,187 2,499 123,686 Net income from April 1 to
December 31, 2018 - - 8,810 - - - 8,810 91 8,901
Other comprehensive Income - - (245) (4,900) - - (5,145) (85) (5,230)
Comprehensive Income - - 8,565 (4,900) - - 3,665 6 3,671
Dividend - - (7,881) - - - (7,881) (85) (7,966)
Issuance of common shares 51,372,539 151 2,691 - - - 2,842 - 2,842
Purchase of treasury shares - - - - (60,295,112) (3,620) (3,620) - (3,620)
Sale of treasury shares(a) - - (240) - 4,079,257 240 - - -
Share-based payments - - 165 - - - 165 - 165
Share cancellation (44,590,699) (131) (2,572) - 44,590,699 2,703 - - -
Issuance of perpetual subordinated
notes - - - - - - - - -
Payments on perpetual
subordinated notes - - (234) - - - (234) - (234)
Other operations with
non-controlling interests - - (513) - - - (513) (103) (616)
Other items - - 29 - - - 29 157 186
As of December 31, 2018 2,640,602,007 8,227 120,569 (11,313) (32,473,281) (1,843) 115,640 2,474 118,114
Net income of the first quarter 2019 - - 3,111 - - - 3,111 29 3,140
Other comprehensive Income - - 22 (293) - - (271) 9 (262)
Comprehensive Income - - 3,133 (293) - - 2,840 38 2,878
Dividend - - - - - - - - -
Issuance of common shares 1,272,267 4 64 - - - 68 - 68
Purchase of treasury shares - - - - (8,675,188) (491) (491) - (491)
Sale of treasury shares(a) - - - - 2,210 - - - -
Share-based payments - - 11 - - - 11 - 11
Share cancellation - - - - - - - - -
Issuance of perpetual subordinated
notes - - - - - - - - -
Payments on perpetual
subordinated notes - - (75) - - - (75) - (75)
Other operations with
non-controlling interests - - - - - - - (150) (150)
Other items - - - - - - - 3 3
As of March 31, 2019 2,641,874,274 8,231 123,702 (11,606) (41,146,259) (2,334) 117,993 2,365 120,358
(a)Treasury shares related to the restricted stock grants.

22
INFORMATIONS BY BUSINESS SEGMENT
TOTAL
(unaudited)
1st quarter 2019 Exploration &
Production
Integrated Gas,Renewables
& Power
Refining &
Chemicals
Marketing &
Services Corporate Intercompany Total
(M$)
Non-Group sales 1,794 6,419 21,711 21,279 2 - 51,205 Intersegment sales 7,716 627 8,017 162 27 (16,549) - Excise taxes - - (776) (5,305) - - (6,081)Revenues from sales 9,510 7,046 28,952 16,136 29 (16,549) 45,124 Operating expenses (4,029) (6,409) (27,334) (15,334) (177) 16,549 (36,734)Depreciation, depletion and impairment of tangible assets and mineral interests
(2,529) (315) (374) (233) (15) - (3,466) Operating income 2,952 322 1,244 569 (163) - 4,924 Net income (loss) from equity affiliates and other items
194 380 149 (10) 1 - 714
Tax on net operating income (1,424) (173) (292) (164) 60 - (1,993) Net operating income 1,722 529 1,101 395 (102) - 3,645 Net cost of net debt (505)Non-controlling interests (29)Net income - group share 3,111
1st quarter 2019 (adjustments)(a) Exploration &
Production
Integrated Gas,Renewables
& Power
Refining &
Chemicals
Marketing &
Services Corporate Intercompany Total
(M$) Non-Group sales - (27) - - - - (27)Intersegment sales - - - - - - - Excise taxes - - - - - - - Revenues from sales - (27) - - - - (27)Operating expenses - (58) 492 74 - - 508 Depreciation, depletion and impairment of tangible assets and mineral interests
- - - - - - - Operating income (b) - (85) 492 74 - - 481 Net income (loss) from equity affiliates and other items
- 6 2 - - - 8
Tax on net operating income - 16 (149) (22) - - (155) Net operating income (b) - (63) 345 52 - - 334 Net cost of net debt (4)Non-controlling interests 22 Net income - group share 352 (a) Adjustments include special items, inventory valuation effect and the effect of changes in fair value. (b) Of which inventory valuation effect - On operating income - - 492 74 - - On net operating income - - 345 52 -
1st quarter 2019 (adjusted) Exploration &
Production
Integrated Gas,Renewables
& Power
Refining &
Chemicals
Marketing &
Services Corporate Intercompany Total
(M$) Non-Group sales 1,794 6,446 21,711 21,279 2 - 51,232 Intersegment sales 7,716 627 8,017 162 27 (16,549) - Excise taxes - - (776) (5,305) - - (6,081)Revenues from sales 9,510 7,073 28,952 16,136 29 (16,549) 45,151 Operating expenses (4,029) (6,351) (27,826) (15,408) (177) 16,549 (37,242)Depreciation, depletion and impairment of tangible assets and mineral interests
(2,529) (315) (374) (233) (15) - (3,466) Adjusted operating income 2,952 407 752 495 (163) - 4,443 Net income (loss) from equity affiliates and other items
194 374 147 (10) 1 - 706
Tax on net operating income (1,424) (189) (143) (142) 60 - (1,838) Adjusted net operating income 1,722 592 756 343 (102) - 3,311 Net cost of net debt (501)Non-controlling interests (51)Adjusted net income - group share 2,759
1st quarter 2019 Exploration &
Production
Integrated Gas,Renewables
& Power
Refining &
Chemicals
Marketing &
Services Corporate Intercompany Total
(M$) Total expenditures 2,025 1,118 285 144 15 3,587 Total divestments 29 225 169 72 2 497 Cash flow from operating activities 3,936 892 (538) 232 (893) 3,629
23
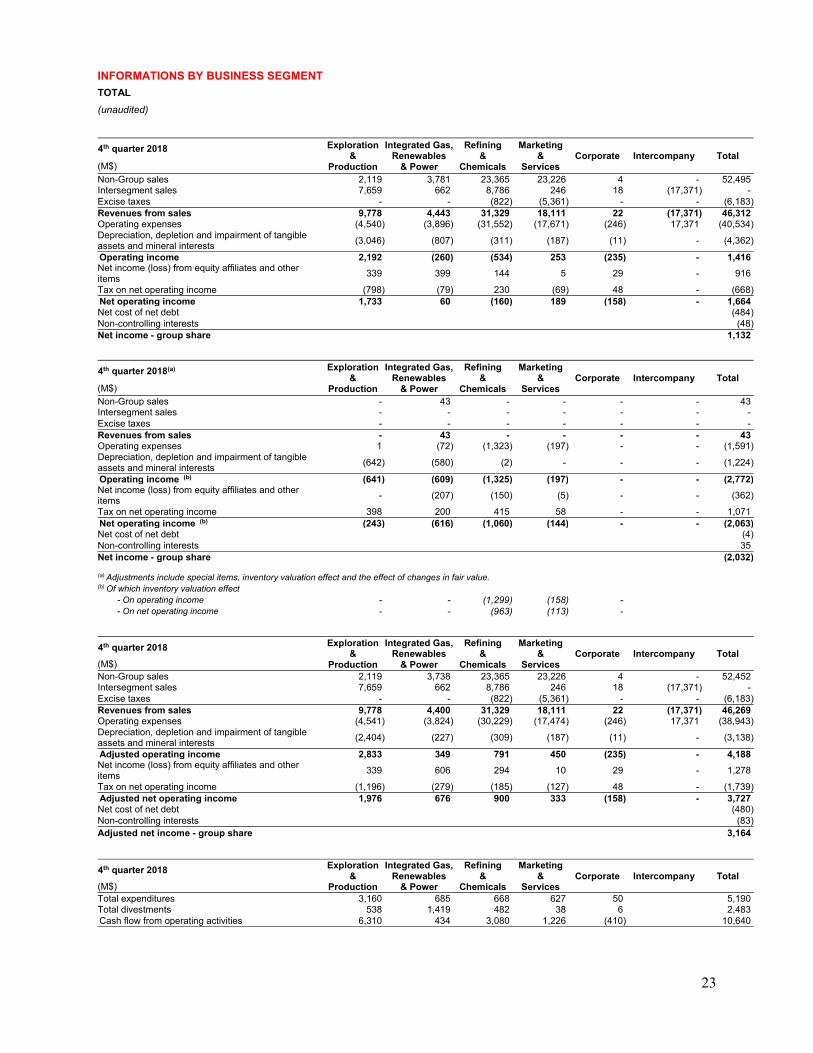
INFORMATIONS BY BUSINESS SEGMENT
TOTAL
(unaudited)
4th quarter 2018 Exploration &
Production
Integrated Gas,Renewables
& Power
Refining &
Chemicals
Marketing &
Services Corporate Intercompany Total
(M$)
Non-Group sales 2,119 3,781 23,365 23,226 4 - 52,495 Intersegment sales 7,659 662 8,786 246 18 (17,371) - Excise taxes - - (822) (5,361) - - (6,183)Revenues from sales 9,778 4,443 31,329 18,111 22 (17,371) 46,312 Operating expenses (4,540) (3,896) (31,552) (17,671) (246) 17,371 (40,534)Depreciation, depletion and impairment of tangible assets and mineral interests
(3,046) (807) (311) (187) (11) - (4,362) Operating income 2,192 (260) (534) 253 (235) - 1,416 Net income (loss) from equity affiliates and other items
339 399 144 5 29 - 916
Tax on net operating income (798) (79) 230 (69) 48 - (668) Net operating income 1,733 60 (160) 189 (158) - 1,664 Net cost of net debt (484)Non-controlling interests (48)Net income - group share 1,132
4th quarter 2018(a) Exploration &
Production
Integrated Gas,Renewables
& Power
Refining &
Chemicals
Marketing &
Services Corporate Intercompany Total
(M$) Non-Group sales - 43 - - - - 43 Intersegment sales - - - - - - - Excise taxes - - - - - - - Revenues from sales - 43 - - - - 43 Operating expenses 1 (72) (1,323) (197) - - (1,591)Depreciation, depletion and impairment of tangible assets and mineral interests
(642) (580) (2) - - - (1,224) Operating income (b) (641) (609) (1,325) (197) - - (2,772)Net income (loss) from equity affiliates and other items
- (207) (150) (5) - - (362)
Tax on net operating income 398 200 415 58 - - 1,071 Net operating income (b) (243) (616) (1,060) (144) - - (2,063)Net cost of net debt (4)Non-controlling interests 35 Net income - group share (2,032) (a) Adjustments include special items, inventory valuation effect and the effect of changes in fair value. (b) Of which inventory valuation effect - On operating income - - (1,299) (158) - - On net operating income - - (963) (113) -
4th quarter 2018 Exploration &
Production
Integrated Gas,Renewables
& Power
Refining &
Chemicals
Marketing &
Services Corporate Intercompany Total
(M$) Non-Group sales 2,119 3,738 23,365 23,226 4 - 52,452 Intersegment sales 7,659 662 8,786 246 18 (17,371) - Excise taxes - - (822) (5,361) - - (6,183)Revenues from sales 9,778 4,400 31,329 18,111 22 (17,371) 46,269 Operating expenses (4,541) (3,824) (30,229) (17,474) (246) 17,371 (38,943)Depreciation, depletion and impairment of tangible assets and mineral interests
(2,404) (227) (309) (187) (11) - (3,138) Adjusted operating income 2,833 349 791 450 (235) - 4,188 Net income (loss) from equity affiliates and other items
339 606 294 10 29 - 1,278
Tax on net operating income (1,196) (279) (185) (127) 48 - (1,739) Adjusted net operating income 1,976 676 900 333 (158) - 3,727 Net cost of net debt (480)Non-controlling interests (83)Adjusted net income - group share 3,164
4th quarter 2018 Exploration &
Production
Integrated Gas,Renewables
& Power
Refining &
Chemicals
Marketing &
Services Corporate Intercompany Total
(M$) Total expenditures 3,160 685 668 627 50 5,190 Total divestments 538 1,419 482 38 6 2,483 Cash flow from operating activities 6,310 434 3,080 1,226 (410) 10,640

24
INFORMATIONS BY BUSINESS SEGMENT
TOTAL
(unaudited)
1st quarter 2018 Exploration &
Production
Integrated Gas,Renewables
& Power
Refining &
Chemicals
Marketing &
Services Corporate Intercompany Total
(M$)
Non-Group sales 2,218 4,340 21,739 21,308 6 - 49,611 Intersegment sales 6,777 492 7,956 198 97 (15,520) - Excise taxes - - (847) (5,472) - - (6,319)Revenues from sales 8,995 4,832 28,848 16,034 103 (15,520) 43,292 Operating expenses (3,930) (4,518) (27,879) (15,503) (277) 15,520 (36,587)Depreciation, depletion and impairment of tangible assets and mineral interests
(2,216) (204) (313) (174) (9) - (2,916) Operating income 2,849 110 656 357 (183) - 3,789 Net income (loss) from equity affiliates and other items
321 354 128 86 (2) - 887
Tax on net operating income (1,432) (133) (104) (103) 96 - (1,676) Net operating income 1,738 331 680 340 (89) - 3,000 Net cost of net debt (351)Non-controlling interests (13)Net income - group share 2,636
1st quarter 2018 (adjustments)(a) Exploration &
Production
Integrated Gas,Renewables
& Power
Refining &
Chemicals
Marketing &
Services Corporate Intercompany Total
(M$)
Non-Group sales - (11) - - - - (11)Intersegment sales - - - - - - - Excise taxes - - - - - - - Revenues from sales - (11) - - - - (11)Operating expenses (53) (92) (38) (29) (9) - (221)Depreciation, depletion and impairment of tangible assets and mineral interests
- (22) - - - - (22) Operating income (b) (53) (125) (38) (29) (9) - (254)Net income (loss) from equity affiliates and other items
(101) (11) (21) (1) - - (134)
Tax on net operating income 75 (14) 19 3 - - 83 Net operating income (b) (79) (150) (40) (27) (9) - (305)Net cost of net debt (10)Non-controlling interests 67 Net income - group share (248) (a) Adjustments include special items, inventory valuation effect and the effect of changes in fair value. (b) Of which inventory valuation effect - On operating income - - (38) (29) - - On net operating income - - (23) (27) -
1st quarter 2018 (adjusted) Exploration &
Production
Integrated Gas,Renewables
& Power
Refining &
Chemicals
Marketing &
Services Corporate Intercompany Total
(M$)
Non-Group sales 2,218 4,351 21,739 21,308 6 - 49,622 Intersegment sales 6,777 492 7,956 198 97 (15,520) - Excise taxes - - (847) (5,472) - - (6,319)Revenues from sales 8,995 4,843 28,848 16,034 103 (15,520) 43,303 Operating expenses (3,877) (4,426) (27,841) (15,474) (268) 15,520 (36,366)Depreciation, depletion and impairment of tangible assets and mineral interests
(2,216) (182) (313) (174) (9) - (2,894) Adjusted operating income 2,902 235 694 386 (174) - 4,043 Net income (loss) from equity affiliates and other items
422 365 149 87 (2) - 1,021
Tax on net operating income (1,507) (119) (123) (106) 96 - (1,759) Adjusted net operating income 1,817 481 720 367 (80) - 3,305 Net cost of net debt (341)Non-controlling interests (80)Adjusted net income - group share 2,884
1st quarter 2018 Exploration &
Production
Integrated Gas,Renewables
& Power
Refining &
Chemicals
Marketing &
Services Corporate Intercompany Total
(M$)
Total expenditures 5,545 575 332 228 44 6,724 Total divestments 2,176 153 25 228 3 2,585 Cash flow from operating activities 3,322 68 (1,109) (60) (140) 2,081
25
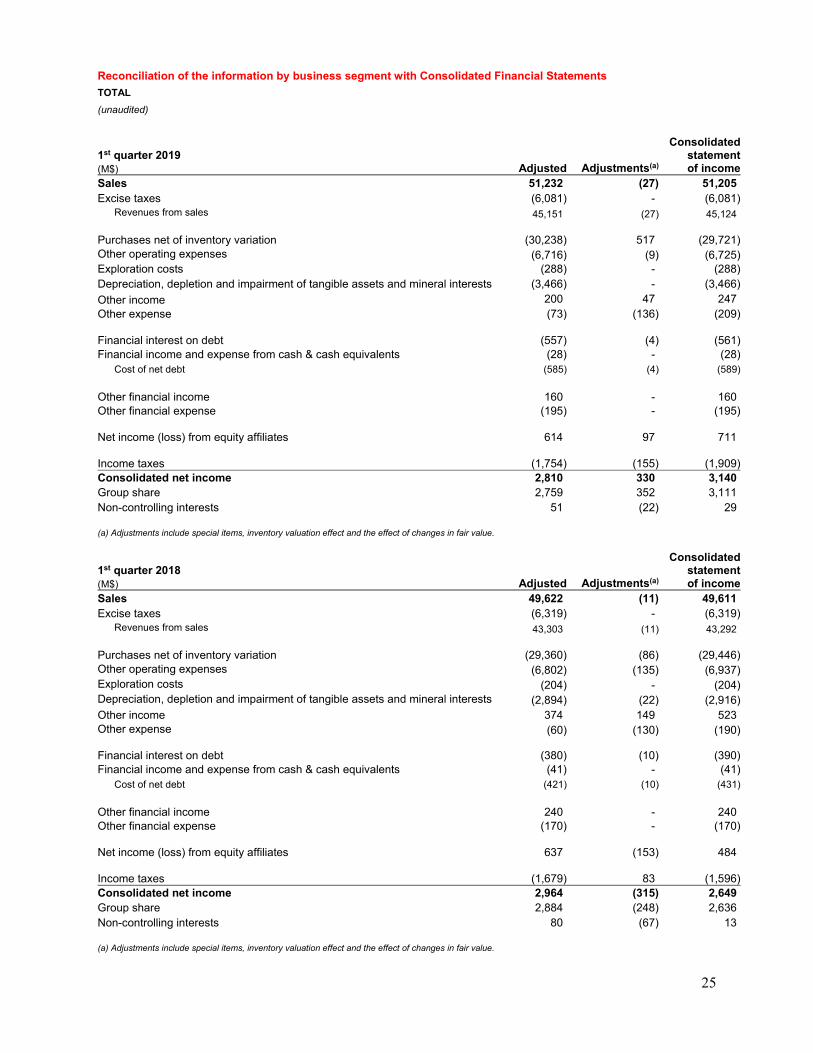
Reconciliation of the information by business segment with Consolidated Financial Statements
TOTAL
(unaudited)
Consolidated1st quarter 2019 statement(M$) Adjusted Adjustments(a) of incomeSales 51,232 (27) 51,205 Excise taxes (6,081) - (6,081) Revenues from sales 45,151 (27) 45,124
Purchases net of inventory variation (30,238) 517 (29,721)Other operating expenses (6,716) (9) (6,725)Exploration costs (288) - (288)Depreciation, depletion and impairment of tangible assets and mineral interests (3,466) - (3,466)
Other income 200 47 247 Other expense (73) (136) (209)
Financial interest on debt (557) (4) (561)Financial income and expense from cash & cash equivalents (28) - (28) Cost of net debt (585) (4) (589)
Other financial income 160 - 160 Other financial expense (195) - (195)
Net income (loss) from equity affiliates 614 97 711 Income taxes (1,754) (155) (1,909)Consolidated net income 2,810 330 3,140 Group share 2,759 352 3,111 Non-controlling interests 51 (22) 29 (a) Adjustments include special items, inventory valuation effect and the effect of changes in fair value.
Consolidated1st quarter 2018 statement(M$) Adjusted Adjustments(a) of incomeSales 49,622 (11) 49,611 Excise taxes (6,319) - (6,319) Revenues from sales 43,303 (11) 43,292
Purchases net of inventory variation (29,360) (86) (29,446)Other operating expenses (6,802) (135) (6,937)Exploration costs (204) - (204)Depreciation, depletion and impairment of tangible assets and mineral interests (2,894) (22) (2,916)Other income 374 149 523 Other expense (60) (130) (190)
Financial interest on debt (380) (10) (390)Financial income and expense from cash & cash equivalents (41) - (41) Cost of net debt (421) (10) (431)
Other financial income 240 - 240 Other financial expense (170) - (170)
Net income (loss) from equity affiliates 637 (153) 484 Income taxes (1,679) 83 (1,596)Consolidated net income 2,964 (315) 2,649 Group share 2,884 (248) 2,636 Non-controlling interests 80 (67) 13 (a) Adjustments include special items, inventory valuation effect and the effect of changes in fair value.