Embed Size (px)
Citation preview
2019
SUMMER LOADS &
RESOURCES ASSESSMENT
Moy 8, 2019
California ISO

California ISO 2019 Summer Loads and Resources Assessment
Page | 1
Table of Contents I. EXECUTIVE SUMMARY ................................................................................. 2 II. SUMMER 2018 REVIEW ............................................................................... 12
Demand ................................................................................................. 12
Supply .................................................................................................... 13
Interchange ............................................................................................ 13
III. SUMMER 2019 ASSESSMENT ..................................................................... 15 CAISO Loads ......................................................................................... 15
Hydro Generation ................................................................................... 18
System Capacity .................................................................................... 21
System Capacity Additions ..................................................................... 22
System Capacity Unavailability .............................................................. 22
Unit Commitment ................................................................................... 23
Curtailable Demand ............................................................................... 24
Interchange ............................................................................................ 25
Stochastic Simulation Approach ............................................................. 25
Simulation Results ................................................................................. 28
Impacts of the Aliso Canyon Gas Storage Operating Restrictions .......... 36
Once Through Cooled Generation ......................................................... 39
Conclusion ............................................................................................. 41
IV. APPENDICES ............................................................................................ 43 Appendix A: 2018 Summer Supply and Demand Summary Graphs ...... 44
Appendix B: 2018 Summer Imports Summary Graphs .......................... 56
Appendix C: 2019 CAISO Summer On-Peak Available Capacity by Fuel
Type ....................................................................................................... 59

California ISO 2019 Summer Loads and Resources Assessment
Page | 2
I. EXECUTIVE SUMMARY The 2019 Summer Loads and Resources Assessment (“2019 Assessment”) provides an assessment of the upcoming summer supply and demand outlook for the California Independent System Operator (CAISO) balancing authority area. The CAISO works with state agencies, generation and transmission owners, load serving entities, and other balancing authorities to formulate the summer forecast and identify any issues regarding upcoming operating conditions. The Assessment considers the supply and demand conditions across the entire CAISO balancing authority area (representing about 80 percent of California).
To better assess summer operating conditions given the changing resource mix of higher levels of renewable resources and fewer conventional gas fired resources, the CAISO developed a robust probabilistic approach using a stochastic production simulation model to assess the system-wide supply and demand outlook on an hourly basis.
In its production simulation process, the CAISO runs 2,000 unique randomly generated scenarios – each representing a combination of forecasted summer hourly load profiles and renewable generation levels that are based on historic weather patterns. The simulation seeks the least cost solution to dispatch generation and curtailable demand to meet system capacity, ancillary services, and flexible capacity requirements simultaneously.
Projections for 2019 show that the CAISO faces less risk of encountering operating conditions that could result in operating reserve shortfalls than was projected for 2018. The decreased risk in 2019 over 2018 is primarily a result of greater than average hydro conditions providing more daily energy, allowing hydro generation output to be sustained over more hours of the day.
While 2019 Assessment finds the CAISO system has a very low probability of a system capacity shortage that would potentially necessitate demand curtailments, it did find a higher potential for shortages of upward ramping capability during certain times of the day, which would create operational risks. These upward ramping shortages are most prevalent in the late afternoon when solar generation output decreases while system demand is still high. Without sufficient upward ramping capability within the CAISO to offset the loss of solar output during these times, neighboring balancing authority areas would have to provide the necessary support to balance supply and demand to maintain system frequency under normal conditions.
The CAISO will be at the greatest operational risk during late summer as the availability of hydro energy wanes and potential high peak demands in neighboring balancing authority areas decrease the availability of imports into the CAISO. The continuing decline in dispatchable generation as gas units retire creates further challenges for meeting the CAISO flexible capacity requirement and the peak demand, which is now occurring later in the day when solar output is at or near zero.
The 2019 Assessment does not specifically assess the risk associated with transmission outages due to wildfires. The assessment analysis is largely based on historical outage rates of generation, which includes historical outages caused by wildfires.

California ISO 2019 Summer Loads and Resources Assessment
Page | 3
Peak Demand Forecast
The CAISO 2019 1-in-2 peak demand forecast is 46,511 MW, which is 0.1 percent below the 2018 weather normalized peak demand of 46,526 MW. The slight decrease in the demand projection is a result of projected modest economic growth over 2018, and continuing load reductions from behind-the-meter solar installations and energy efficiency programs. The CAISO 2019 1-in-10 peak demand forecast is 48,979 MW.
Hydro Conditions
California hydro conditions for 2019 are well above normal. As of April 2, 2019, the statewide snow water content for the California mountain regions was 162 percent of the April 1 average, and major statewide reservoir storage levels were at 109 percent of normal. California hydroelectric capability is dramatically higher than 2018 when the statewide snow water content on April 2 was 51 percent of the April 1 average. Above average hydro conditions will impact the level and frequency of oversupply conditions during the spring and early summer as well.
As of April 10, 2019, the Northwest River Forecast Center projected the April to August reservoir storage at the Dalles Dam on the Columbia River to be 94 percent of average, less than the 118 percent of average experienced in 2018.
System Capacity
The ISO projects 51,765 MW of system capacity for summer 2019, based on capacity available for resource adequacy. From June 1, 2018, to June 1, 2019, approximately 1,523 MW of additional generation is expected to reach commercial operation, with 1,333 MW in the southern portion of the CAISO system and 190 MW in the northern portion of the CAISO system. Of the 1,523 MW, approximately 42 percent is solar, 36 percent is gas, 10 percent is wind, 4 percent is geothermal, 3 percent is battery, 3 percent is hydro, and 2 percent is biofuel. During this same period, 2,702 MW of generation is expected to retire or mothball, of which 2,589 MW is dispatchable and 113 MW is non-dispatchable.
When the simulation model depletes all available generating resources before meeting the load and ancillary service requirements, the model will utilize demand response programs. The demand response capability in the CAISO market for 2019 is 1,140 MW.
Simulation Results
The reported simulation results include the system capacity adequacy, ancillary service, and flexible capacity adequacy.
System Capacity Adequacy
The 2019 Assessment uses unloaded capacity and loaded capacity to characterize the capacity adequacy of the system. Loaded capacity is the generation capacity that is serving load. The unloaded capacity refers to any portion of online generation capacity that is not serving load and offline generation capacity that can come online in 20 minutes or less to serve load as well as curtailable demands such as demand response, interruptible pumping load, and aggregated participating load that can provide non-spinning reserve or demand reduction. In other words, the hourly unloaded capacity consists of unloaded and available resources, including operating reserves the system procures. The Unloaded Capacity

California ISO 2019 Summer Loads and Resources Assessment
Page | 4
Margin (UCM) is the excess of the available resources, within 20 minutes or less, over the projected load expressed as a percentage on an hourly basis.
The model produces an UCM for each hour modeled. Taking into account the unloaded capacity margin for all of the 2,928 summer hours1 within each of the 2,000 summer scenarios, the median2 value of all unloaded capacity margin values is 35.7 percent (Figure 1).
Figure 1
CAISO Unloaded Capacity Margins (June through September 2019)
Figure 1 shows the forecast of the UCMs over all 2,928 summer operating hours from all 2,000 scenarios. The distribution of the UCMs is significantly higher that the results discussed below because the results that follow in the report are based on results at time of system peak demand. UCM levels above the operating reserve requirement for any given hour (typically around 6 percent) signifies that capacity is available beyond the requirement for operating reserves, which to the extent available, can be used during system contingencies. Figure 2 shows scenarios with extreme low operating reserves where the UCM is at emergency levels
1 The study period of June 1 through September 30 in each scenario represents 2,928 hours (24 hours 122 days). 2 The median is the value that is in the middle of the model results data set, where there is a 50 percent probability that the result will be above the median and a 50 percent probability that the result will be below the median.
Num
ber o
f Hou
rs a
t Eac
h U
nloa
ded
Cap
acity
Mar
gin
California ISO 2019 Summer Loads and Resources Assessment
Page | 5
(stage 2, stage 3)3 and scenarios with unserved energy. Should CAISO system operating conditions go into the emergency stages, the CAISO will implement its mitigation operating plan to minimize loss of load in the CAISO balancing authority area described in the Preparation for Summer Operation section at the end of the Executive Summary.
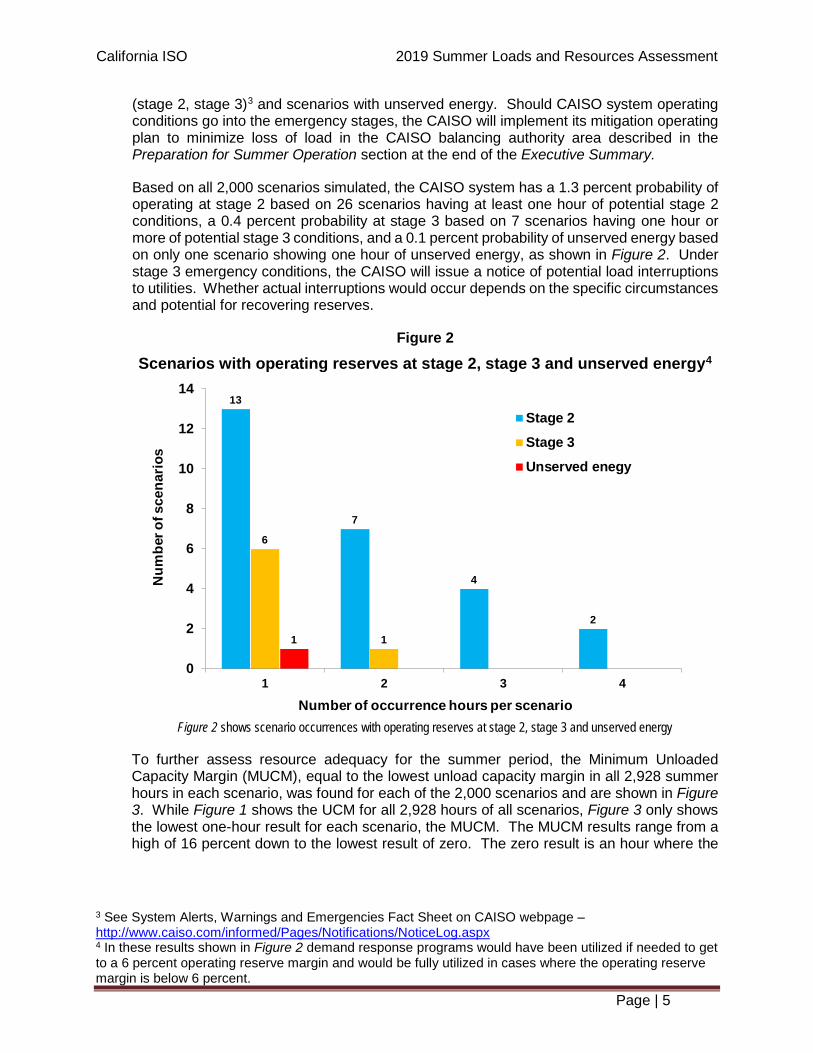
Based on all 2,000 scenarios simulated, the CAISO system has a 1.3 percent probability of operating at stage 2 based on 26 scenarios having at least one hour of potential stage 2 conditions, a 0.4 percent probability at stage 3 based on 7 scenarios having one hour or more of potential stage 3 conditions, and a 0.1 percent probability of unserved energy based on only one scenario showing one hour of unserved energy, as shown in Figure 2. Under stage 3 emergency conditions, the CAISO will issue a notice of potential load interruptions to utilities. Whether actual interruptions would occur depends on the specific circumstances and potential for recovering reserves.
Figure 2 Scenarios with operating reserves at stage 2, stage 3 and unserved energy4
Figure 2 shows scenario occurrences with operating reserves at stage 2, stage 3 and unserved energy
To further assess resource adequacy for the summer period, the Minimum Unloaded Capacity Margin (MUCM), equal to the lowest unload capacity margin in all 2,928 summer hours in each scenario, was found for each of the 2,000 scenarios and are shown in Figure 3. While Figure 1 shows the UCM for all 2,928 hours of all scenarios, Figure 3 only shows the lowest one-hour result for each scenario, the MUCM. The MUCM results range from a high of 16 percent down to the lowest result of zero. The zero result is an hour where the
3 See System Alerts, Warnings and Emergencies Fact Sheet on CAISO webpage – http://www.caiso.com/informed/Pages/Notifications/NoticeLog.aspx 4 In these results shown in Figure 2 demand response programs would have been utilized if needed to get to a 6 percent operating reserve margin and would be fully utilized in cases where the operating reserve margin is below 6 percent.
13
7
4
2
6
11
0
2
4
6
8
10
12
14
1 2 3 4
Num
ber o
f sce
nario
s
Number of occurrence hours per scenario
Stage 2Stage 3Unserved enegy

California ISO 2019 Summer Loads and Resources Assessment
Page | 6
supply is less than demand, and represents the most extreme hour within the 2,000 scenarios considered.
Figure 3
CAISO Minimum Unloaded Capacity Margin (June – September)
Figure 3 shows forecast distribution of summer MUCM for the CAISO.
Figure 4 shows the distribution of the MUCM over the hours of the day in comparison to the hours of solar generation anticipated during the 2019 summer peak day. The MUCM has the highest level of occurrences at hour ending 20 (i.e., 8:00 pm). Figure 4 demonstrates that the timing of 93 percent of the MUCM values fall in periods of significantly reduced or no solar generation.
13321364382527
4556
69
927980
100107
142
168
205207215
154
129
51
123
0
50
100
150
200
250
0
1.0%
2.0%
3.0%
4.0%
5.0%
6.0%
7.0%
8.0%
9.0%
10.0
%
11.0
%
12.0
%
13.0
%
14.0
%
15.0
%
16.0
%
Num
ber o
f Sce
nario
s
Minimum Unloaded Capacity Margin
Stage 3 Emergency range
Stage 2 Emergency range
Stage 1 Emergency range1
1Stage 1 range is approximate

California ISO 2019 Summer Loads and Resources Assessment
Page | 7
Figure 4
Solar generation versus minimum unloaded capacity margin
Figure 4 shows solar generation profile versus MUCM occurrence.
Figure 5 shows the months where the MUCM dropped below 3 percent, the point of initiating a stage 3 emergency. There were six occurrences in August, and two occurrences in September. The August loads range from approximately 49,500 MW to 51,000 MW, which are above the 1-in-10 peak demand forecast of 48,979 MW. The September loads were slightly below 47,000 MW (slightly above the 46,511 MW peak demand forecast) and represent periods of declining hydro and solar production.

California ISO 2019 Summer Loads and Resources Assessment
Page | 8
Figure 5 ISO load versus scenarios where capacity available
for operating reserves is less than 3%
Figure 5 shows CAISO load level versus most extreme MUCM levels.
Ancillary Service and Flexible Capacity Adequacy
Figure 6 shows that the CAISO system has a 10.5 percent probability (210 out of 2,000 scenarios) of incurring an hour or more of load following up shortages, a 2.3 percent probability of incurring an hour or more of spinning shortage based (45 out of 2,000
44000
45000
46000
47000
48000
49000
50000
51000
52000
1.4%
1.6%
2.0%
2.4%
2.5%
2.5%
2.6%
2.9%
ISO
Loa
d
Minimum Unloaded Capacity Margin
August Occurance September Occurances

California ISO 2019 Summer Loads and Resources Assessment
Page | 9
scenarios), and 0.6 percent probability of incurring an hour or more of regulation up shortage (11 out of 2,000) scenarios.
Figure 6 Scenarios with regulation up, spinning and load following up shortage
Figure 6 shows Scenarios with regulation up, spinning and load following up shortage
Sensitivity Study
In order to understand the vulnerability of the CAISO system under conditions less favorable than expected during 2019, a sensitivity assessment was performed representing lower hydro conditions and higher loads in the Southwest. The assumptions for the sensitivity were: 1. ISO hydro conditions from 2018 where snow water content was 51 percent of normal; 2. Hydro for Bonneville Power Administration and BC Hydro at 93 percent of normal
(actual 2019 hydro conditions); 3. Peak demand of 1-in-10 in Arizona Public Service (APS) and Salt River Project (SRP),
versus the 1-in-2 normally assumed (to simulate a Southwest heat wave); and,
4. ISO net imports capped at 9,309 MW – the maximum imports experienced during 2018 when ISO demand was within 10 percent of the summer peak.5
5 The base case assessment assumed that imports up to the highest level seen during 2017, 11,701 MW, could occur during any hour of 2019. Availability of sufficient imports during high peak load conditions is critical to ensuring system reliability and the maximum import capability assumption has a large impact on the modeling results.
93
52
1913 12
47 5
2 1 1 1
26
12
52
10
10
10
20
30
40
50
60
70
80
90
100
1 2 3 4 5 6 7 8 9 10 11 12 13 14
Num
ber o
f sce
nario
s
Number of occurrence hours per scenario
Load following up shortage
Spinning shortage
Regulation up shortage

California ISO 2019 Summer Loads and Resources Assessment
Page | 10
The sensitivity study simulation results indicate that the CAISO system would have a 26 percent probability operating at a stage 2 emergency (512 scenarios produced at least one hour of potential stage 2), a 12 percent probability at stage 3 (231 scenarios produced an hour or more of potential stage 3), and a 6 percent probability with unserved energy (116 scenarios showed at least one hour of potential unserved energy).
Table 1 provides a comparison of the probabilities for system capacity shortages from the base case assessment and the sensitivity assessment.
Table 1
Probabilities for System Capacity Shortages
This sensitivity analysis highlights the importance of California hydroelectric generation and imports for meeting peak summer conditions – in light of declining levels of gas-fired generation within the CAISO.
Impacts of the Aliso Canyon Gas Storage Operating Restrictions
The results of the latest studies and recommendations by various state agencies on the operating restrictions of Aliso Canyon going forward and the projected impacts to electric system reliability are being assessed by the CAISO, Los Angeles Department of Water and Power, California Energy Commission and California Public Utilities Commission (Joint Agencies). The results of the Joint Agencies assessment for this summer and beyond will be presented in a report that is expected to be released in May 2019.
The outlook for energy reliability in Southern California remains challenging due to uncertainty about the status of its natural gas system. The Southern California Gas (SoCalGas) system continues to operate at less than full capacity due to pipeline outages and continuing restrictions on use of the Aliso Canyon natural gas storage facility. Pipeline outages will continue through much of the summer with some potentially returning to service later in the summer.
The risk to electric reliability associated with operating restrictions at Aliso Canyon and other gas storage facilities is greater in the local reliability areas in Southern California than to the CAISO system as a whole. From a system perspective, the risk to electric reliability and the ability to re-supply from electric supply sources not impacted by SoCalGas limitations is similar to previous years.
Conclusion
Projections for 2019 show that the CAISO faces less risk of encountering operating conditions that could result in operating reserve shortfalls than was projected for 2018. The decreased risk in 2019 over 2018 is primarily a result of greater than average hydro
Base case Sensitivity caseStage 2 1.3% 26%Stage 3 0.4% 12%Unserved energy 0.1% 6%

California ISO 2019 Summer Loads and Resources Assessment
Page | 11
conditions providing more daily energy, allowing hydro generation output to be sustained over more hours of the day.
The base case results showed a significant probability of load following up shortages. During such shortages, the CAISO will have to lean on neighboring balancing authority areas to maintain system frequency. The continuing decline in dispatchable generation as gas units retire creates further challenges for meeting the CAISO flexible capacity requirement and the peak demand, which is now occurring later in the day when solar output is at or near zero.
The CAISO will be at the greatest operational risk of a system capacity shortage if hot weather occurs that extends beyond the CAISO footprint and impacts the availability of surplus energy in neighboring balancing authority areas for imports into the CAISO. The risk increases if such conditions occur later in the summer when the hydro availability wanes and the solar production afternoon ramp-down begins earlier in the day.
Preparation for Summer Operation
Producing this report and publicizing its results is one of many activities the CAISO undertakes each year to prepare for summer system operations. Other activities include coordinating meetings on summer preparedness with the Western Electricity Coordinating Council (WECC), California Department of Forestry and Fire Protection (Cal Fire), natural gas providers, transmission operators and neighboring balancing areas. The ISO’s ongoing coordination activities with these entities help to ensure everyone is prepared for the upcoming summer operational season.

California ISO 2019 Summer Loads and Resources Assessment
Page | 12
II. SUMMER 2018 REVIEW Demand The recorded 2018 summer hourly average peak demand reached 46,310 MW6 on 7/25/2018. California weather turned below normal after 8/10/2018. The California Independent System Operator (CAISO) daily high weighted average temperatures never exceeded 97 degrees after that date. Adjusting the load to normalized weather results in a peak load of 46,526 MW for the CAISO in 2018. The 2018 annual peak demand for the Southern California zone (South of Path 26 or SP26) reached 28,472 MW and for the Northern California zone (North of Path 26 or NP26), the annual peak demand was 19,166 MW. The annual peak for CAISO and NP26 peaks occurred on 7/25/2018 at hour ending 18:00 and 19:00, respectively. The annual peak for Southern California zone occurred on 7/6/2018 at hour ending 17:00.
Figure 7 shows CAISO, SP26 and NP26 actual monthly peak demands from 2009 to 2018. Since 2009, annual peak demand has fluctuated primarily due to weather conditions unique to each year and changing economic conditions and demographics. Behind the meter solar installed capacity has increased from approximately 900 MW in 2009 to 8,000 MW by mid-summer 2019. CAISO peak demand has been significantly impacted by the growth in behind the meter solar installations, shifting the system peak hour to later in the evening when grid-connected solar generation is low or zero. To a lesser extent, increasing energy efficiency and the use of demand side management has impacted peak demand as well.
Figure 7
Figure 7 shows the CAISO system peak and peaks for Northern and Southern California (2009-2018).
Table 2 shows the 2018 actual peaks, 2018 triggered demand response, 2018 weather normalized peaks, and the 2018 1-in-2 peak demand forecasts. The CAISO actual peak
6 All demand data represented in this report is hourly average demand.
12,000
20,000
28,000
36,000
44,000
52,000
Jan-
09M
ay-0
9Se
p-09
Jan-
10M
ay-1
0Se
p-10
Jan-
11M
ay-1
1Se
p-11
Jan-
12M
ay-1
2Se
p-12
Jan-
13M
ay-1
3Se
p-13
Jan-
14M
ay-1
4Se
p-14
Jan-
15M
ay-1
5Se
p-15
Jan-
16M
ay-1
6Se
p-16
Jan-
17M
ay-1
7Se
p-17
Jan-
18M
ay-1
8Se
p-18
Actu
al M
onth
ly P
eak
Dem
and
(MW
)
ISO, SP26 and NP26 Monthly Peak Demand (MW)(based on hourly average data)
NP26 SP26 ISO
28,4727/6/2018
46,3107/25/2018
19,1667/25/2018
California ISO 2019 Summer Loads and Resources Assessment
Page | 13
demand plus DR was close to the 1-in-2 peak demand forecasts due to actual weather conditions being 1-in-2 weather event. The weather normalized peak load for CAISO in 2018 was 46,526 MW. The actual peak demand in Northern California was 7 percent lower than 1-in-2 peak demand forecasts for NP26. The weather at the time of the actual NP26 peak demand was a 1-in-1 weather event.
The actual peak demand in Southern California was 5 percent higher than the 1-in-2 forecast peak demand for SP26. The weather at the time of the SP26 peak demand was a 1-in-3 weather event.
Table 2
Supply Actual daily supply and demand from June through September 2018 for the CAISO system and the SP26 and NP26 zones are shown in Appendix A: 2018 Summer Supply and Demand Summary Graphs.
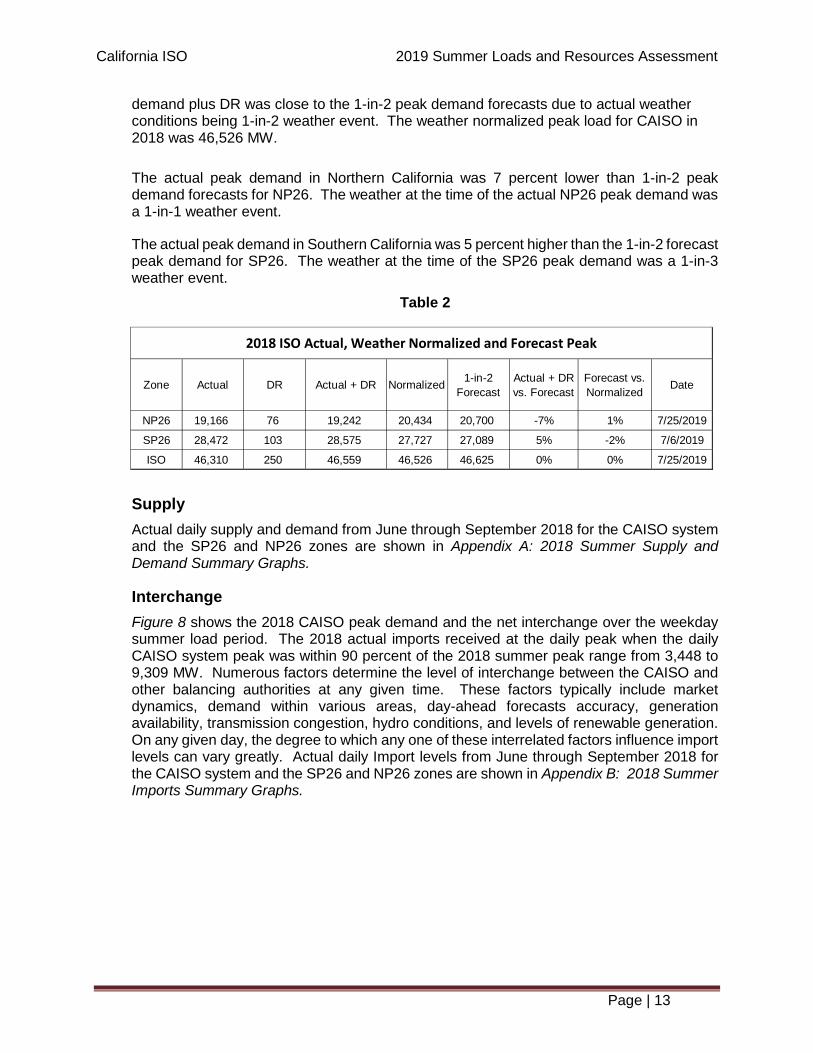
Interchange Figure 8 shows the 2018 CAISO peak demand and the net interchange over the weekday summer load period. The 2018 actual imports received at the daily peak when the daily CAISO system peak was within 90 percent of the 2018 summer peak range from 3,448 to 9,309 MW. Numerous factors determine the level of interchange between the CAISO and other balancing authorities at any given time. These factors typically include market dynamics, demand within various areas, day-ahead forecasts accuracy, generation availability, transmission congestion, hydro conditions, and levels of renewable generation. On any given day, the degree to which any one of these interrelated factors influence import levels can vary greatly. Actual daily Import levels from June through September 2018 for the CAISO system and the SP26 and NP26 zones are shown in Appendix B: 2018 Summer Imports Summary Graphs.
Zone Actual DR Actual + DR Normalized 1-in-2 Forecast
Actual + DR vs. Forecast
Forecast vs. Normalized Date
NP26 19,166 76 19,242 20,434 20,700 -7% 1% 7/25/2019
SP26 28,472 103 28,575 27,727 27,089 5% -2% 7/6/2019
ISO 46,310 250 46,559 46,526 46,625 0% 0% 7/25/2019
2018 ISO Actual, Weather Normalized and Forecast Peak
California ISO 2019 Summer Loads and Resources Assessment
Page | 14
Figure 8
Figure 8 shows the amount of imports at CAISO daily system peaks.
Table 3 shows actual net import with CAISO loads equal to or greater than 43,000 MW from 2016 to 2018 MW. Typically, depending on availability, when the CAISO peak loads increase, the net imports to the CAISO will increase. The CAISO system reliability depends on the certainty of a certain range of net imports from neighboring balancing authority areas, particularly during CAISO system peak hours. As the CAISO internal dispatchable generation retire or mothball, the CAISO system will increasingly rely on imports from neighboring balancing authority areas when internal shortfalls of flexible capacity occur.
Table 3 Actual net import with CAISO load equal to or
greater than 43,000 MW from 2016 to 2018
2018 Actual Net Import 2017 Actual Net Import 2016 Actual Net Import
Min 2,898 3,263 1,764
First Quartile 4,166 5,272 3,101
Median 5,136 7,062 4,620
Third Quartile 6,602 8,300 5,881
Max 9,541 11,147 7,570

California ISO 2019 Summer Loads and Resources Assessment
Page | 15
III. SUMMER 2019 ASSESSMENT CAISO Loads Annual Peak and Energy Forecast
The CAISO’s annual peak and energy forecast process has three steps. The first is to develop daily peak and energy forecast models for Pacific Gas Electric, Southern California Edison, and San Diego Gas & Electric in MetrixND®, the forecasting tool used by the CAISO. The inputs are historical loads, weather data, historical and forecast economic and demographic data, and calendar information. In the second step, a simulation program generates 161 weather scenarios using 23 years of historical weather data from 1995 through 2018. Each historical year has seven different weather scenarios so that each year has a scenario that starts on each of seven days of a week. Finally, 161 annual peaks are produced by combining the MetrixND® models with the 161 weather scenarios through a peak simulation process. The historical loads are hourly average demand values sourced from the CAISO energy management system (EMS) from January 1, 2003 through September 30, 2018. Water delivery pump loads were not counted in the historical demand as they do not react to weather conditions in a similar fashion and are subject to interruption. Pump loads are added back into the forecast demand based on a range of typical pump loads during summer peak conditions.
The weather data comes from 24 weather stations located throughout large population centers within the CAISO balancing authority. Weather data used in the model include maximum, minimum and average temperatures, cooling degree days, heat index, relative humidity, solar radiation indexes, as well as a 631 three-day temperature weighting index.
The CAISO uses gross domestic product (GDP) and population developed by Moody’s Analytics for the metropolitan statistical areas within the CAISO as the economic and demographic indicators to the models. Figure 9 shows the historical trend of GDP and the five economic scenario forecasts of GDP developed by Moody’s Analytics that represent different outlooks of how the economy could play out based on different assumptions such as consumer confidence and household spending, labor markets and credit conditions. The baseline forecast is the median scenario wherein there is a 50 percent probability that the economy will perform better and a 50 percent probability that the economy will perform worse. Four other scenarios are defined below.
• Scenario 1 is a Stronger Near-Term Growth Scenario, which is designed so that there is a 10 percent probability that the economy will perform better than this scenario, broadly speaking, and a 90 percent probability that it will perform worse.
• Scenario 2 is a Slower Near-Term Growth Scenario in which there is a 75 percent probability that economic conditions will be better, broadly speaking, and a 25 percent probability that conditions will be worse.
• Scenario 3 is a Moderate Recession Scenario in which there is a 90 percent probability that the economy will perform better, broadly speaking, and a 10 percent probability that it will perform worse.
• Scenario 4 is a Protracted Slump Scenario in which there is a 96 percent probability that the economy will perform better, broadly speaking, and a 4 percent probability that it will perform worse.

California ISO 2019 Summer Loads and Resources Assessment
Page | 16
Scenario 1 is more optimistic about the economy than the base case forecast while scenarios 2 through 4 are progressively more pessimistic. The divergence between the various scenario forecasts began January 1, 2019. It is important to note that these forecasts are based on the Moody’s GDP forecasts released in December 2018. The gross domestic product data reflects actual historical data through Dec 31, 2017 (January 2018 and later historical data are estimates of actual GDP). Consequently, this forecast is based on the most current data available at that time. Figure 10 shows the historical summer/annual peaks demands and the CAISO 1-in-2 peak demand forecasts based on the five economic scenarios from Moody’s Analytics.
Figure 9

California ISO 2019 Summer Loads and Resources Assessment
Page | 17
Figure 10
The 2019 base case forecasted gross load peak demand is a modest 0.1 percent reduction from the CAISO 2018 weather normalized peak demand. The slight decrease in the demand projection is a result of projected modest economic growth over 2018, based on the economic base case forecast from Moody’s Analytics, reduced by ongoing behind the meter solar installations and energy efficiency program impacts on peak demand. The 1-in-2, 1-in-5 and 1-in-10 peak load forecasts for 2019 are shown in Table 4.
Table 4 2019 Gross Load Peak Demand Forecast
The net load is defined as demand minus grid-connected wind and solar production. In other words, net load is the remaining load that the CAISO dispatched resources serve after the gross load has been reduced by the amount of energy production from renewable resources. Renewable resources have an energy profile based on the availability of the resource they utilize to produce energy (e.g. solar and wind). The net load is served by the resources that the CAISO is able to dispatch. Table 5 shows the forecasted net load peak demand for 2019.
2019 ISO SP26 NP26
1-in-2 46,511 27,889 20,369
1-in-5 48,305 28,957 21,125
1-in-10 48,979 29,598 21,576

California ISO 2019 Summer Loads and Resources Assessment
Page | 18
Table 5 2019 Net Load Peak Demand Forecast
Hydro Generation
California hydro conditions for 2019 are above normal. As of April 2, 2019, the statewide snow water content for the California mountain regions was 162 percent of the April 1 average and major statewide reservoir storage levels were at 109% of normal on average. California hydroelectric capability will be above normal for 2019 and well above 2018 when the statewide snow water content was 51 percent of average. Above average hydro conditions will impact the level and frequency of oversupply conditions during the spring and early summer as well.
As of April 10, 2019, the Northwest River Forecast Center projected the April to August reservoir storage at the Dalles Dam on the Columbia River to be 94 percent of average. Although summer 2019 water supply projections for the Pacific Northwest are less than the 2018 118 percent of average, there are no concerns with the availability of Pacific Northwest hydroelectric generation for imports into the CAISO.
The Hydro generation is modeled on an aggregated basis with two types, non-dispatchable and dispatchable hydro generation. Non-dispatchable hydro generation has a fixed generation profile derived from historical data for the north and the south while the dispatchable hydro generation is optimized subject to the daily energy limits and daily maximum and minimum values, which are derived from historical data. Dispatchable hydro can provide ancillary service and flexible capacity. Pump storage generators are modeled individually and are optimized subject to storage capacity, inflow and target limits, and cycling efficiency.
Figure 11 shows the similarity between the snow water content available for hydro generation during 2017 compared to 2019, and the significant increase between 2018 and 2019. Above normal hydro conditions will result in higher energy production throughout the summer. Figure 11 also shows that as of April 2, 2019, the 2018 – 2019 snow water content is similar to 2016 – 2017. As a result, the 2017 hydro generation profile was used for the 2019 modeling process. Figures 12, 13 and 14 provide the latest water year’s history of precipitation for North Sierra, San Joaquin and Tulare Basin. All have tracked higher than average.
2019 CAISO Net Load Forecast(MW)
1-in-2 40,102
1-in-5 42,522
1-in-10 43,805
Max 48,805

California ISO 2019 Summer Loads and Resources Assessment
Page | 19
Figure 11
Source: California Department of Water Resources

California ISO 2019 Summer Loads and Resources Assessment
Page | 20
Figure 12
Source: California Department of Water Resources
Figure 13
Source: California Department of Water Resources

California ISO 2019 Summer Loads and Resources Assessment
Page | 21
Figure 14
Source: California Department of Water Resources
System Capacity The CAISO bases its unloaded capacity margin on its active market participant resources. Total CAISO system capacity at time of system peak for 2019 summer peak is estimated to be 51,765 MW using the final net qualifying capacity (NQC) list that was used for the California Public Utilities Commission (CPUC) and CAISO’s resource adequacy program for compliance year 2019, and is posted on the CAISO website.7 In addition, 327 MW of participating generation that does not participate in the NQC process were added using the CAISO Master File database. The CAISO Master Control Area Generating Capability List, posted on the CAISO website8 provides access to the information in the Master File database.
Each year, the CPUC, and the California Energy Commission (CEC), work together to develop the monthly qualifying capacity values the CAISO uses to develop the NQC list. The NQC values for each resource describes the amount of generation that has been deemed deliverable and can be utilized to meet Resource Adequacy (RA) requirements. The NQC value for dispatchable resources depend on its demonstrated capacity and deliverability — the ability of the grid to deliver the generation to load centers. The CAISO
7 Final Net Qualifying Capacity Report for Compliance Year 2019: http://www.caiso.com/planning/Pages/ReliabilityRequirements/Default.aspx 8 Master Control Area Generating Capability List: http://www.caiso.com/planning/Pages/GeneratorInterconnection/Default.aspx (under Atlas Reference)

California ISO 2019 Summer Loads and Resources Assessment
Page | 22
determines the net qualifying capacity by testing and verifying as outlined in the CAISO tariff and the applicable business practice manual.
The largest generation resource fuel type is natural gas, accounting for 56.4 percent of CAISO summer on-peak available capacity, and the second largest generation type is solar, which accounts for 15.8 percent. Hydro accounts for 14.2 percent. Wind, geothermal, and biofuel units make up about 6.3 percent. Nuclear generation is 4.4 percent, DR is 2.2 percent and oil generation provides 0.3 percent. The overall resource percentages by fuel type is shown in a chart in Appendix C: 2019 CAISO Summer On-Peak Available Capacity by Fuel Type.
System Capacity Additions Table 6 shows the total generation of 1,523 MW from new generation interconnected to the CAISO balancing authority area that came online in the period from 6/1/2018 to 6/1/2019. This new system capacity included 1,333 MW in SP26 (Southern California Edison (SCE) and San Diego Gas & Electric (SDG&E)), and 190 MW in NP26 (Pacific Gas & Electric (PG&E)). Of the 1,523 MW of generation additions, 528 MW is dispatchable and 995 MW is non-dispatchable.
Table 6 Generation Additions (MW) From 6/1/2018 to 6/1/2019
System Capacity Unavailability Forced outages are generated for individual units on a random basis by PLEXOS using each unit’s historical forced outage rate with a uniform distribution function based on 2015 through 2017 individual historical summer forced outages. Planned outages were sourced from the CAISO outage management system. Table 7 shows the resources that have retired or mothballed since June 1, 2018. To date, there are no other known retirements that will take place by June 1, 2019. Of the 2,702 MW of generation that have retired since June 1, 2018, 1,611 MW are in SP26 and 1,091
PG&E SCE SDGE NP26 SP26 ISO
Bio 31 31 31
Gas 26 528 554 554
Geo 60 60 60
Battery 42 42 42
Solar 159 111 370 159 481 640
Hydro 40 40 40
Wind 156 156 156
Total 190 1,333 1,523

California ISO 2019 Summer Loads and Resources Assessment
Page | 23
MW are in NP26. Of those, 2,589 MW are dispatchable and 113 MW are non-dispatchable.
Table 7 Newly Retired or Mothballed Generation (6/1/2018 to 6/1/2019)
Unit Commitment The PLEXOS production simulation applies unit commitment constraints for generator startups and shutdowns, using the following criteria. While the generator is starting up, it cannot provide ancillary or load following services while ramping from initial synchronization to its minimum allowed operating capacity. Similarly, when a generator is in the process of shutting down it cannot provide ancillary or load following services once it has ramped down passed its minimum capacity threshold. Once a generator is committed, it must remain operating for its minimum run time before it can be shut down. After a generator has been
Resource ID Current Status MW Actual
Offline Date PTO Dispatchable Fuel Type
ETIWND_7_UNIT 3 Retired 320 6/1/2018 SCE Y GAS
ETIWND_7_UNIT 4 Retired 320 6/1/2018 SCE Y GAS
LAGBEL_2_STG1 Retired 10 6/30/2018 SCE Y BIOM
THMENG_1_UNIT 1 Retired 6 8/29/2018 PGAE N BIOM
ENCINA_7_EA2 Retired 103 12/12/2018 SDGE Y GAS
ENCINA_7_EA3 Retired 109 12/12/2018 SDGE Y GAS
ENCINA_7_EA4 Retired 299 12/12/2018 SDGE Y GAS
ENCINA_7_EA5 Retired 329 12/12/2018 SDGE Y GAS
ENCINA_7_GT1 Retired 14 12/12/2018 SDGE Y GAS
LAPLMA_2_UNIT 3 Mothballed 256 12/21/2018 PGAE Y GAS
LAPLMA_2_UNIT 4 Mothballed 260 12/21/2018 PGAE Y GAS
NIMTG_6_NIQF Retired 39 12/31/2018 SDGE N GAS
DIVSON_6_NSQF Retired 46 12/31/2018 SDGE N GAS
PTLOMA_6_NTCQF Retired 22 12/31/2018 SDGE N OTHR
LAPLMA_2_UNIT 1 Mothballed 260 2/22/2019 PGAE Y GAS
LAPLMA_2_UNIT 2 Mothballed 260 2/22/2019 PGAE Y GAS
GRNLF1_1_UNITS Mothballed 49 3/11/2019 PGAE Y GAS
ISO Total 2,702
Dispatchable 2,589
Non dispatchable 113

California ISO 2019 Summer Loads and Resources Assessment
Page | 24
shut down, it is not available for commitment again until it has been off for its specified minimum down time.
Once a generator is operating within its operating range (between its minimum and maximum capacity) it must meet the criteria set out below.
If a generator is ramping up: • Regulation up, spinning, and non-spinning provided by the generator cannot exceed
its 10-minute ramping up capability and unused capacity; • Energy, regulation up, spinning, and non-spinning provided by the generator cannot
exceed its 60-minute ramping capability and its available unused capacity.
During ramping down: • Difference between its minimum capacity and its current operating point determine
the amount of regulation-down and load following-down that can be provided by a generator.
Therefore, the model sets 60 minutes ramping time for energy and 10 minutes for ancillary services in each hour’s simulation. Each dispatchable generator’s output can fluctuate up to its maximum ramp rate between its minimum and maximum capacity.
Curtailable Demand Curtailable Demand includes demand response, pumping load, and aggregated participating load that can provide non-spinning reserve or demand reduction. Curtailable demand reduces end-user loads in response to high prices, financial incentives, environmental conditions or reliability issues. It can play an important role to offset the need for more generation and provide grid operators with additional flexibility in operating the system during periods of limited supply.
Demand response programs can be categorized as event based and non-event based. Non-event based demand response programs include real-time pricing and load shifting. Event based or dispatchable demand response programs are modeled as supply side resources that have triggering conditions in the stochastic simulation model. Event-based demand response resources are modeled as either on or off. They include base interruptible programs, aggregator managed portfolios, capacity bidding programs, demand bidding programs, smart AC, summer discount plans, and demand response contracts. The Reliability Demand Response Resources (RDRR) programs in the CAISO market are event-based programs that require the CAISO to declare a system warning before they can be utilized.
Whenever the model depletes all available resources before meeting the load and ancillary service requirements the model will utilize demand response programs. The available RDRR and Proxy Demand Resource (PDR) in the CAISO market for 2019 is 1,140 MW.
The Flex Alert program is a voluntary energy conservation program that alerts and advises consumers about how and when to conserve energy. The Flex Alert program continues to be a vital tool for the CAISO during periods of high peak demand or other stressed grid conditions to maintain system reliability. The alerts also serve as a signal that both non-event and event-based demand responses are needed.

California ISO 2019 Summer Loads and Resources Assessment
Page | 25
Interchange The model simulated 35 WECC zones and 91 WECC interchange paths between zones, as shown in Figure 15. The zonal interchange path limits were set based on the WECC Path Rating Catalog. Transmission limits within the zones were not modeled and the model cannot provide results related to local capacity requirements. The transfer capabilities between any two adjacent zones reflected the maximum simultaneous transfer capabilities. In addition, a total CAISO maximum import limit was set based on historical import patterns. Exports from California was subject to the transmission limits of the export paths. Path 15 and Southern California Import Transmission (SCIT) nomogram constraint were enforced in the model.
Figure 15
Figure 15 Simulation covers WECC 35 Zones and 91 Paths
Stochastic Simulation Approach In recent years, significant amounts of new renewable generation, especially solar, have reached commercial operation to meet the state’s 33 percent Renewables Portfolio Standard (RPS) milestone by 2020 and the 60 percent requirement by 2030. These increasing amounts of variable resources integrated with the CAISO grid pose unique challenges for CAISO operations and for the analytical tools used by the CAISO to assess near-term reliability.
As new renewable resources come on the system, CAISO reliability requirements have evolved from meeting the gross peak demand to meeting both net peak demand and flexible capacity requirements. The gross peak usually occurs at the hour ending of 16:00 or 18:00 while net peak occurs in the hour ending 19:00 to 21:00 timeframe where solar generation is close to zero. The CAISO’s evolving net load profile – gross load minus grid-connected interconnected solar and wind generation – has become known as the duck curve. The
BCTC
BPA
PG&ETIDC
SMUD LDWP
SDGE
SCE
AESO
NWMT
CFE
PACEWY
PSC
EPE
SPP
APSIID
AVA
CHPD
GCPD
PACW
TPWR
DOPDPSE
PGN
SCL
WAUW
WACM
SRP
TEP
WALC PNM
NEVP
PACEID-UT
IPCO
California ISO 2019 Summer Loads and Resources Assessment
Page | 26
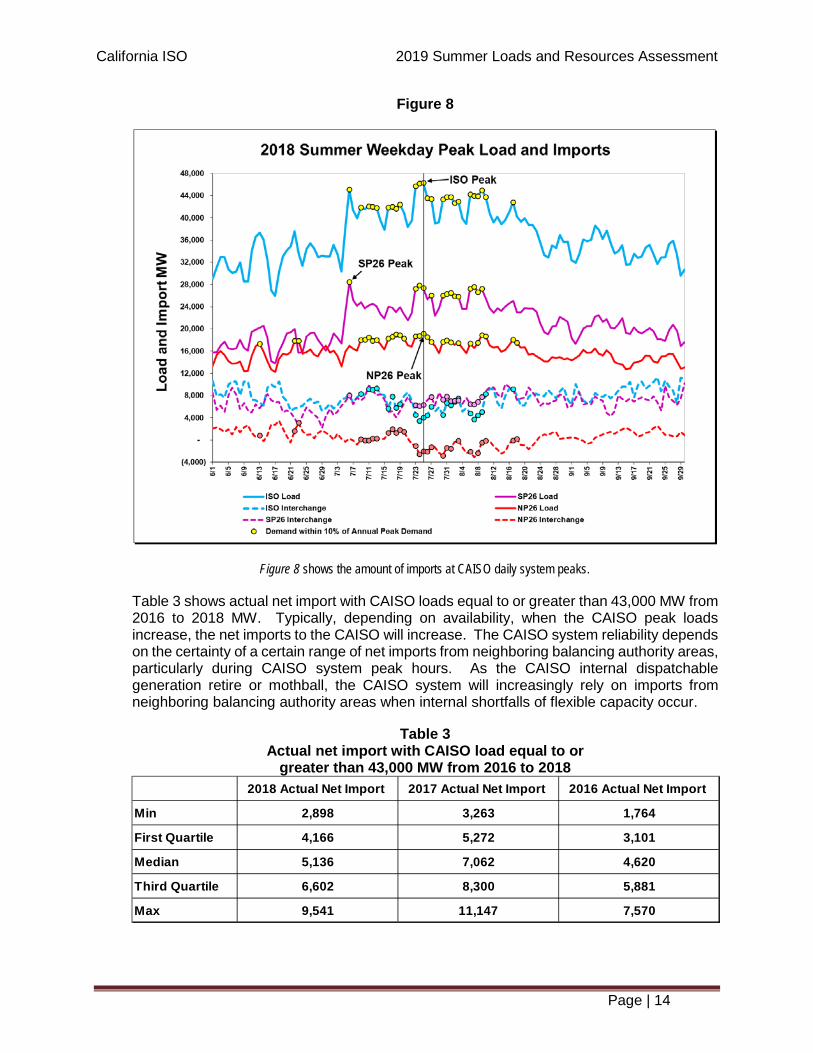
growing amount of photovoltaic solar generation that is interconnected to the CAISO grid continues to change the CAISO’s net load profile and creates more challenges and uncertainty for CAISO operations.
Photovoltaic solar generation located behind the customer meter has an additional impact, affecting the gross load and further decreasing the net load the CAISO serves. The result is a constantly increasing ramping requirement, both in the upward and downward directions. Furthermore, solar generation does not provide significant power at the hours ending 19:00 to 21:00, which leads to reliance on gas and other non-solar generation after sunset. The continuing decline in the CAISO’s dispatchable generation as its dispatchable units retire is beginning to challenge the CAISO’s system ability to meet its net peak demand after sunset and meet the flexible capacity requirement.
To better assess summer operating conditions given the changing resource mix of higher levels of renewable resources and fewer conventional gas fired resources, the CAISO developed a robust probabilistic approach using a stochastic production simulation model to assess the system-wide supply and demand outlook on an hourly basis. In 2019, to mimic the real-time market short-term unit commitment function during the window extending 4.5 hours prior to real-time and the real-time unit dispatch function 1 hour 45 minutes prior to real-time for the intra-hour fluctuation requirement, hourly regulation and flexible capacity requirements were generated using a probabilistic Monte Carlo simulation program and input into the PLEXOS stochastic model. The Monte Carlo program was developed by Pacific Northwest National Laboratory and the CAISO. This program calculated the intra-hour regulation and load following requirements and converted these intra-hour requirements to hourly requirements. This enhancement is anticipated to produce results for the 2019 Assessment that more closely align with 2019 actual results. The CAISO is confident the enhanced model more accurately represents the real time operational issues that the CAISO would face during normal and extreme operation conditions.
The enhanced PLEXOS stochastic model used a mixed-integer linear programing to dispatch energy, ancillary services and load following to seek the least cost co-optimized solution to meet the system demand, ancillary service and flexibility requirement simultaneously. The simulation runs 2,000 scenarios on an hourly interval chronologically. These 2,000 random scenarios are generated with a two-step process. Each scenario represents a combination of forecasted 2,9289 hourly load profiles and renewable generation levels based on historic annual weather patterns.
The first step is to build three pools of load, wind and solar profiles. In this step, 15 years of historical hourly load profiles were matched with the 161 annual peak and annual energy forecasts to produce 161 hourly load scenarios in the load pool; 11 years of historical hourly wind capacity factors were multiplied with the projected wind capacity in 2019 to generate 11 hourly wind profiles in the wind pool; and 6 years of historical hourly solar capacity factors were multiplied with the projected solar capacity in 2019 to generate 6 hourly solar profiles in the solar pool.
The second step is to randomly generate 2,000 scenarios from the load, wind and solar pools. One random draw from each of the load, wind and solar pools creates a scenario, which contains one load, wind, and solar profile. A total of 2,000 draws generates 2,000
9 The study period of June 1 through September 30 in each scenario represents 2,928 hours.

California ISO 2019 Summer Loads and Resources Assessment
Page | 27
scenarios from 10,626 possible scenarios (161 load profiles x 6 solar profiles x 11 wind profiles), illustrated in Figure 16.
Two thousand randomly drawn scenarios of load, wind and solar generation are applied to PG&E, SCE, and SDG&E. VEA is included in the SCE zone. The rest of the 32 WECC zones utilize load profiles and forecasts of 1-in-2 peak demand and annual energy provided by WECC. The simulation covers 35 WECC zones with 91 WECC interchange paths. Operational constraints include forced and planned outage rates, unit commitment parameters, minimum unit up and down times, unit heat rates, and ramp rates for each generator in the CAISO.
Figure 16
Figure 16: 2,000 scenarios of load, wind and solar are randomly selected from 10,626 scenarios
The simulation uses all active market participant capacities available within the CAISO balancing authority regardless of contractual arrangements to evaluate resource adequacy in order to understand how the system will respond under a broad range of operating conditions. While some resources may not receive contracts under the resource adequacy program, and may possibly contract with entities outside the CAISO for scheduled short-term exports, these resources are still considered available to the CAISO for the purposes of this assessment. Resources not participating in the resource adequacy program do not have must offer obligation to the CAISO Day Ahead and Real Time Market. The CAISO may be able to utilize these non-RA resources, if physically available, via the backstop Capacity Procurement Mechanism.
Conventional generation units such as gas and nuclear are individually modeled while non-dispatchable qualifying facilities (QFs), biofuel and geothermal generation are modeled using fixed hourly generation profiles, which are developed based on the projected capacities and historical generation profiles on an aggregated basis.
The 2019 Assessment uses unloaded capacity and loaded capacity to characterize the capacity adequacy of the system. Loaded capacity is the generation capacity that is serving load. The unloaded capacity refers to online generation capacity that are not fully loaded
Load Sample Pool Wind Sample Pool Solar Sample Pool
161
11 6
2000 out of 10626 scenarios (161 x 6 x 11)
Random Draw
Random Draw
Random Draw
California ISO 2019 Summer Loads and Resources Assessment
Page | 28
and has remaining capacity to serve load, and offline generation capacity from the day-ahead unit commitment process that can come online in 20 minutes or less — fast enough for operations to call on to serve load if needed. Unloaded capacity also includes curtailable demand such as demand response, pumping load, and aggregated participating load that can provide non-spinning reserves or demand reductions. The Unloaded Capacity Margin (UCM) is applied to assess system reliability. The UCM is the projection of excess supply that the model deems available, which includes operating reserves, over projected demand on an hour basis.
For capacity sufficiency and ability to meet flexibility capacity requirements, the model reports the summer Minimum Unloaded Capacity Margin (MUCM) for each 2,928-hour scenario based on load and available resources, including curtailable demand, imports, and exports, on an hourly basis. Each of the 2,000 scenarios produce one MUCM value over the 2,928 hours from June 1 through September 30.
UCM (t) = 𝐴𝐴𝐴𝐴𝐴𝐴𝐴𝐴𝐴𝐴𝐴𝐴𝐴𝐴𝐴𝐴𝐴𝐴 𝑅𝑅𝐴𝐴𝑅𝑅𝑅𝑅𝑅𝑅𝑅𝑅𝑅𝑅𝐴𝐴𝑅𝑅(𝑡𝑡)+𝐼𝐼𝐼𝐼𝐼𝐼𝑅𝑅𝑅𝑅𝑡𝑡(𝑡𝑡)−𝐸𝐸𝐸𝐸𝐼𝐼𝑅𝑅𝑅𝑅𝑡𝑡(𝑡𝑡)
𝐿𝐿𝑅𝑅𝐴𝐴𝐿𝐿(𝑡𝑡) − 1
MUCM = Min (𝑈𝑈𝑈𝑈𝑈𝑈 (1), … ,𝑈𝑈𝑈𝑈𝑈𝑈 (𝑡𝑡), … ,𝑈𝑈𝑈𝑈𝑈𝑈(2,928))
If demand exceeds supply, the model reports the unserved hours and unserved energy.
Simulation Results
The simulation results include the system capacity adequacy, ancillary service and flexible capacity adequacy
System Capacity Adequacy
The model produces an UCM for each hour modeled. Taking into account the unloaded capacity margin for all of the 2,928 hours within each of the 2,000 summer scenarios, the UCM ranges from a high of 61 percent to – in a very small number of scenarios - a low of zero. The median value of all unloaded capacity margin values is 35.7 percent in Figure 17.

California ISO 2019 Summer Loads and Resources Assessment
Page | 29
Figure 17 CAISO Unloaded Capacity Margins
(June through September 2019)
Figure 17 shows the forecast of the UCMs over all 2,928 summer operating hours from all 2,000 scenarios. The distribution of the UCMs is significantly higher that the results discussed below because the results that follow in the report are based on results at time of system peak demand.
The CAISO has developed a series of emergency stages10 to communicate periods of low operating reserve conditions. A stage 1 emergency is usually issued when the CAISO anticipates/forecasts the system will not be able to maintain the required contingency reserve level, and there are insufficient additional resources (in or out of market) to maintain or recover the contingency reserves required. The CAISO will usually issue a stage 1 emergency when the operating reserve is seesawing above, then below the contingency reserve requirement and load continues to increase or energy supply continues to decline. A stage 2 is an indication that all the steps available under a stage 1 do not resolve or recover the reserve deficiency and the system is using non-spinning reserves to meet load and spinning reserve requirements, thereby making non-spin deficient and contingency reserve deficient. A stage 3 is an indication the system cannot maintain the spinning reserve requirement – generally 3 percent of load.
The results in Figure 18 represent the CAISO system has 1.3 percent probability operating at stage 2 based on 26 scenarios producing at least one hour within the stage 2 emergency
10 See System Alerts, Warnings and Emergencies Fact Sheet on CAISO webpage – http://www.caiso.com/informed/Pages/Notifications/NoticeLog.aspx
Num
ber o
f Hou
rs a
t Eac
h U
nloa
ded
Cap
acity
Mar
gin

California ISO 2019 Summer Loads and Resources Assessment
Page | 30
condition range, 0.4 percent probability of a stage 3 based on 7 scenarios producing an hour or more within the stage 3 emergency range, and 0.1 percent probability of unserved energy with only one scenario having an unserved energy result. Under stage 3 emergency conditions, the CAISO will issue a notice of potential load interruptions to utilities. Whether actual interruptions would occur depends on the specific circumstances and potential for recovering reserves.
Figure 18
Scenarios with operating reserves at stage 2, stage 3 and unserved energy11
Figure 18 shows scenario occurrences with operating reserves at stage 2, stage 3 and unserved energy
To further assess resource adequacy for the summer period, the Minimum Unloaded Capacity Margin (MUCM) value, equal to the lowest unload capacity margin in all 2,928 summer hours in each scenario, was found for each of the 2,000 scenarios. While Figure 17 shows the UCM for all 2,928 hours of all scenarios, Figure 19 only shows the lowest one-hour result for each scenario, the MUCM. The MUCM results range from a high of 16 percent down to the lowest result of zero. The zero result represents the most extreme hourly supply and demand condition within the 2,000 scenarios considered.
11 In these results shown in Figure 18 demand response programs would have been utilized if needed to get to a 6 percent operating reserve margin and would be fully utilized in cases where the operating reserve margin is below 6 percent.
13
7
4
2
6
11
0
2
4
6
8
10
12
14
1 2 3 4
Num
ber o
f sce
nario
s
Number of occurrence hours per scenario
Stage 2Stage 3Unserved enegy

California ISO 2019 Summer Loads and Resources Assessment
Page | 31
Figure 19 CAISO Minimum Unloaded Capacity Margin
(June – September)
Figure 19 shows forecast distribution of summer MUCM for the CAISO.
Figure 20 shows the distribution of the MUCM over the hours of the day in comparison to the hours of solar generation during the 2019 summer peak day. The MUCM has the highest level of occurrences at hour ending 20 (i.e., 8:00 pm). Figure 20 demonstrates the timing of 93 percent of the MUCM values fall in periods of low or zero solar generation.
Figure 20 Solar generation profile vs.
Minimum Unloaded Capacity Margin Occurrences
Figure 20 shows solar generation profile vs. MUCM occurrence.
13321364382527
4556
69
927980
100107
142
168
205207215
154
129
51
123
0
50
100
150
200
250
0
1.0%
2.0%
3.0%
4.0%
5.0%
6.0%
7.0%
8.0%
9.0%
10.0
%
11.0
%
12.0
%
13.0
%
14.0
%
15.0
%
16.0
%
Num
ber o
f Sce
nario
s
Minimum Unloaded Capacity Margin
Stage 3 Emergency range
Stage 2 Emergency range
Stage 1 Emergency range1
1Stage 1 range is approximate
26 45 79
317
505
892
136
0
100
200
300
400
500
600
700
800
900
1000
6:00
7:00
8:00
9:00
10:0
0
11:0
0
12:0
0
13:0
0
14:0
0
15:0
0
16:0
0
17:0
0
18:0
0
19:0
0
20:0
0
21:0
0
22:0
0
Sola
r gen
erat
ion
Time
ISO Solar generation MUCMNo
.of M
UCM
occ
urre
nces

California ISO 2019 Summer Loads and Resources Assessment
Page | 32
Figure 21 shows the months where the MUCM dropped below 3 percent, the point of initiating a stage 3 emergency. There were six occurrences in August, and two occurrences in September. The August loads range from approximately 49,500 MW to 51,000 MW, which are above the 1-in-10 peak demand forecast of 48,979 MW. The September loads were slightly below 47,000 MW (slightly above the 46,511 MW peak demand forecast) and represent periods of declining hydro and solar production.
Figure 21
ISO load versus scenarios where capacity available for operating reserves is less than 3%
Figure 21 shows CAISO load level versus most extreme MUCM levels.
Ancillary Service and Flexible Capacity Adequacy
In addition to assessing system capacity adequacy, the PLEXOS model assesses the ancillary service and flexible capacity adequacy in CAISO market. The results in Figure 22 represent that the CAISO system has a 10.5 percent probability of incurring a load following up shortage based on 210 scenarios producing at least one hour of potential shortage. When solar output decreases in the late afternoon, the CAISO experiences an upward ramp in net load. The magnitude of upward ramps will continue to increase as more grid connected and behind the meter solar come on-line. The increasing upwards ramps poses operational challenges for the CAISO as the fleet of dispatchable resources continues to diminish. The results in Figure 22 represent that the CAISO system has a 2.3 percent probability of a spinning shortage based on 45 scenarios producing an hour or more of the
44000
45000
46000
47000
48000
49000
50000
51000
52000
1.4%
1.6%
2.0%
2.4%
2.5%
2.5%
2.6%
2.9%
ISO
Loa
d
Minimum Unloaded Capacity Margin
August Occurance September Occurances

California ISO 2019 Summer Loads and Resources Assessment
Page | 33
shortage, and 0.6 percent probability of a regulation up shortage based on 11 scenarios producing one hour or more of the potential shortage.
Figure 22 Scenarios with regulation up, spinning and load following up shortage
Figure 22 shows scenario occurrences with regulation up, spinning and load following up shortage
Sensitivity Study
In order to understand the vulnerability of the CAISO system under conditions less favorable than expected during 2019, a sensitivity assessment was performed representing lower hydro conditions and higher loads in the Southwest. The assumptions for the sensitivity were:
1. ISO hydro conditions from 2018 where snow water content was 51 percent of normal; 2. Hydro for Bonneville Power Administration and BC Hydro at 93 percent of normal
(actual 2019 hydro conditions); 3. Peak demand of 1-in-10 in Arizona Public Service (APS) and Salt River Project (SRP),
versus the 1-in-2 normally assumed (to simulate a Southwest heat wave); and,
4. ISO net imports capped at 9,309 MW – the maximum imports experienced during 2018 when ISO demand was within 10 percent of the summer peak.12
12 The base case assessment assumed that imports up to the highest level seen during 2017, 11,701 MW, could occur during any hour of 2019. Availability of sufficient imports during high peak load conditions is critical to ensuring system reliability and the maximum import capability assumption has a large impact on the modeling results.
93
52
1913 12
47 5
2 1 1 1
26
12
52
10
10
10
20
30
40
50
60
70
80
90
100
1 2 3 4 5 6 7 8 9 10 11 12 13 14
Num
ber o
f sce
nario
s
Number of occurrence hours per scenario
Load following up shortage
Spinning shortage
Regulation up shortage

California ISO 2019 Summer Loads and Resources Assessment
Page | 34
Figure 23 shows that the CAISO system has 26 percent probability operating within a stage 2 or 512 scenarios produced at least one hour of potential stage 2 emergency conditions, 12 percent probability within a stage 3 or 231 scenarios produced an hour or more of a potential stage 3 emergency, and 6 percent probability of unserved energy or 116 scenarios showed at least one hour of potential unserved energy.
Figure 23 Scenarios with operating reserves at stage 2, stage 3 and unserved energy
Figure 23 shows scenario occurrences with operating reserves at stage 2, stage 3 and unserved energy
0
20
40
60
80
100
120
140
1 2 3 4 5 6 7 8 9 10 11 12 13 14 15 16 17 18 19
Num
ber o
f sce
nario
s
Number of occurrence hours per scenario
Stage 2Stage 3Unserved enegy

California ISO 2019 Summer Loads and Resources Assessment
Page | 35
Figure 24 shows the distribution of MUCM values ranging from a high of 14.5 percent down to the lowest result of zero.
Figure 24 CAISO Minimum Unloaded Capacity Margin
Low hydro, 1-in-10 load in APS and SRP and import capped at 9,309 MW
Figure 24 shows forecast distribution of summer MUCM for the CAISO

California ISO 2019 Summer Loads and Resources Assessment
Page | 36
Figure 25 shows that the CAISO system has 45 percent probability operating in a load following up shortage or 909 scenarios produce at least one hour of potential shortage, 25 percent probability of a spinning shortage or 502 scenarios produced an hour or more of potential shortage, and 10 percent probability of a regulation up shortage or 195 scenarios produced an hour or more of potential shortage.
Figure 25 Ancillary service and load following up shortages
Low hydro, 1-in-10 load in APS and SRP, and imports capped at 9,309 MW
Figure 25 shows scenario occurrences with ancillary service and load following up shortages
The sensitive study results show that the CAISO will be at the greatest operational risk during late summer if low hydro availability occurs together with low net import due to high peak demands in its neighboring balancing authority areas.
Impacts of the Aliso Canyon Gas Storage Operating Restrictions Natural gas needs in Southern California are met by a combination of major gas pipelines, distribution gas infrastructure and gas storage facilities. Four major gas storage facilities are located in the Southern California Gas system, the largest of which is the Aliso Canyon facility located in Los Angeles County. Aliso Canyon and other gas storage facilities are used year-round to support the delivery of gas to core and non-core users. Among the non-core users are electric generators, which help meet electric demands throughout the region.
Following a significant natural gas leak in late 2015, the injection and withdrawal capabilities of the Aliso Canyon were severely restricted. These restrictions impacted the ability of pipeline operators to manage real-time natural gas supply and demand deviations, which in turn could have had impacts on the real-time flexibility of natural gas-fired electric generators in Southern California. This primarily impacted resources operated in the Southern
0
20
40
60
80
100
120
140
1 3 5 7 9 11 13 15 17 19 21 23 25 27 29 31 33 35 37 39 41 43 45 47 49 51
Num
ber o
f sce
nario
s
Number of occurrence hours per scenario
Load following up shortageSpinning shortageRegulation up shortage

California ISO 2019 Summer Loads and Resources Assessment
Page | 37
California Gas Company (SoCalGas) and San Diego Gas and Electric (SDG&E) service areas, collectively referred to as the SoCalGas system.
Aliso Canyon directly supplies 17 gas-fired power plants with a combined total 9,800 MW of electric generation in the Los Angeles basin and indirectly impacts 48 plants with a combined total 20,120 MW of electric generation across Southern California. There are limitations in attempting to shift power supply from resources affected by Aliso Canyon to resources that are not affected because of certain factors, such as local generation requirements, transmission constraints and other resource availability issues.
The CAISO, Los Angeles Department of Water and Power, California Energy Commission and California Public Utilities Commission (Joint Agencies) published a third summer risk assessment and technical report in May 2018.13 The assessment found summer reliability risks existed if the electric system was not fully available or gas (or electric) supplies were limited. The report noted that prolonged periods of hot weather and other unpredictable events could pose problems to electricity delivery.
Continuation of mitigation measures developed in 2016 improved the outlook for energy reliability for the 2018 summer. The measures included SoCalGas adjusting natural gas balancing rules to provide stronger incentives for natural gas customers, such as electric generators, to align their natural gas schedules and burns. Furthermore, electric operators and gas system operators developed enhanced coordination procedures.
The CAISO implemented several operational tools and market mechanisms in summer 2016 to mitigate the electric system reliability risk posed by the restricted operations of Aliso Canyon. The CAISO proposed, and FERC temporarily approved14, some tariff provisions until November 30, 2016 while approving others as permanent changes. Because Aliso Canyon remained under restricted operations over winter 2016–2017, the CAISO proposed, and FERC approved15, extending most of the temporary tariff provisions through November 2017. In December 2017, the CAISO requested, and FERC approved16, an extension of these measures for one year. These actions, in addition to relatively well-forecasted load and weather conditions during the 2018 summer, contributed to system reliability during that time.
13 Aliso Canyon Risk Assessment Technical Report, May 7, 2018: https://efiling.energy.ca.gov/getdocument.aspx?tn=223343. 14 Jun 1, 2016 FERC Order Accepting Tariff Revisions and Establishing a Technical Conference - Aliso Canyon (ER16-1649): http://www.caiso.com/Documents/Jun1_2016_OrderAcceptingTariffRevisions_Establishing_TechnicalConference_AlisoCanyon_ER16-1649.pdf 15 Nov 28, 2016 FERC Order Accepting Tariff Amendment - Aliso Canyon Electric-Gas Coordination Phase 2 (ER17-110): http://www.caiso.com/Documents/Nov28_2016_OrderAcceptingTariffAmendment_AlisoCanyonElectricGasCoordinationPhase2_ER17-110.pdf. 16 December 15, 2017 FERC Order Accepting Tariff Amendment to Re-Implement Expired Provisions – Aliso Canyon Gas-Electric Coordination Enhancements (ER18-375): http://www.caiso.com/Documents/Dec15_2017_OrderAccepting_Re-ImplementExpiredProvisions_AlisoCanyonGas-ElectricCoordination_ER18-375.pdf

California ISO 2019 Summer Loads and Resources Assessment
Page | 38
On November 26, 2018, the FERC issued an order17 granting in part and rejecting in part the CAISO’s September 28, 2019 request to extend mitigation measures to address gas system limitations related to the limited operability of the Aliso Canyon gas storage facility. FERC’s order rejected the CAISO’s proposal to extend tariff revisions regarding gas price scalars, finding that the use of gas price scalars over the past year were not effective, weakened market power mitigation and increased bid cost recovery for the period that they were active. The remaining mitigation measures will remain in effect until December 31, 2019.
On January 17, 2017, the Department of Conservation’s Division of Oil, Gas, and Geothermal Resources (DOGGR) announced that it had completed its comprehensive safety review of the Aliso Canyon Storage Facility. The safety review determined Aliso Canyon could operate in a reduced fashion. On February 15, 2017, SoCalGas released a Storage Safety Enhancement Plan18 that was updated on February 17.19
In a July 19, 2017 open letter to SoCalGas and the public, the CPUC and the Division of Oil, Gas, and Geothermal Resources (DOGGR) announced that DOGGR had “determined that the risks of failures identified during the review have been addressed, that well integrity has been verified, and injection at [Aliso] may safely resume.”20 SoCalGas began injecting gas into Aliso Canyon on August 1 up to approximately 28 percent of the facility’s maximum capacity.
The results of the latest studies and recommendations by various state agencies on the operating restrictions of Aliso Canyon going forward and the projected impacts to electric system reliability are being assessed by the Joint Agencies. The results of the Joint Agencies assessment for this summer and beyond will be presented in a report that is expected to be released in May 2019.
The outlook for energy reliability in Southern California remains challenging due to uncertainty about the status of its natural gas system. The challenges to the gas system are similar to last summer and leave SoCalGas unable to meet demand on a 1-in-10 peak day without potentially having to curtail gas to the electric generators in the Southern California or using gas from the Aliso Canyon underground gas storage facility. The challenges stem primarily from continuing outages on as many as three key natural gas pipelines. The ability for the CAISO electric system in Southern California to maintain electric reliability at lower gas burn levels is the result of a combination of transmission upgrades and some generation retirements. With similar system risk to electricity reliability as last summer, measures to mitigate the risk remain necessary.
17 November 26, 2018 FERC Order: http://www.caiso.com/Documents/Nov26-2018-Order-TariffRevisions-AlisoCanyonGas-ElectricCoordinationPhase4-ER18-2520.pdf
18 SoCalGas Letter to CPUC – SoCalGas Storage Safety Enhancement Plan, February 15, 2017: https://www.socalgas.com/1443740459585/02-15-17_SoCalGas_Letter-to-CPUC_SoCalGas-Storage-Safety-Enhancement-Pla....pdf 19 SoCalGas Letter to CPUC – SoCalGas Storage Safety Enhancement Plan (Updated), February 17, 2017: https://www.socalgas.com/1443740471338/Storage-Safety-Enhancement-Plan-Update-2-17.pdf 20 July 19, 2017 SB380 Findings and Concurrence Regarding the Safety of the Aliso Cany7on Gas Storage Facility: http://www.cpuc.ca.gov/uploadedFiles/CPUC_Public_Website/Content/News_Room/News_and_Updates/OpenLettertoSoCalGasandPublic.pdf

California ISO 2019 Summer Loads and Resources Assessment
Page | 39
The risk associated with the gas storage facility restrictions at the Aliso Canyon and other gas storage facilities to electric reliability is greater in the local reliability areas in Southern California than to the CAISO system. From a system perspective, the risk to electric reliability and the ability to re-supply from electric supply sources not impacted by SoCalGas limitations is similar to previous years.
Once Through Cooled Generation On May 4, 2010, the State Water Resources Control Board (SWRCB) adopted a policy on the use of coastal and estuarine waters for power plant cooling (Policy). The Policy applies to 19 power plants, some of which have already retired, that together had the ability to withdraw over 15 billion gallons per day from the state’s coastal and estuarine waters using a single-pass system, also known as once-through cooling (OTC). Table 8 shows the power plants that are subject to the Policy. Of the OTC units’ 17,302 MW of generating capability affected by the policy, 9,740 MW are in compliance. The remaining 5,322 MW of gas-fired generation will be required to repower, be retrofitted or retire by the end of 2020 with Diablo Canyon retiring later. New generation additions of 1,482 MW will come on line as a replacement by early 2021. The resulting net change is a loss of 3,840 MW of dispatchable generation by early 2021. On January 11, 2018, the CPUC approved Pacific Gas & Electric's request to retire the Diablo Canyon nuclear power plant by 2025.
The Statewide Advisory Committee on Cooling Water Intake Structures (SACCWIS) continues to assess the reliability impacts to the CAISO grid in the implementation of the OTC Policy. New generation resources that were interconnected to the CAISO grid have replaced 53 percent of the OTC capacity subject to the OTC policy and additional replacements are under way. Although some OTC units will retire ahead of their compliance dates, the majority of the remaining OTC units are retiring by 2020 to comply with the Policy. A few OTC units may still require an extension under the OTC Policy’s compliance schedule if one or more uncertainties pose a threat to local or system reliability or if replacement infrastructure is not on a schedule that matches with the existing OTC compliance dates.

California ISO 2019 Summer Loads and Resources Assessment
Page | 40
Table 8
Plant (Unit) Owner
State Water Resources
Control Board Compliance Date
Planned retirement Date by Generating
Owners
Capacity (MW)
PTO Area
Compliance Plan Yet to be Implemented (Natural Gas Fired)Huntington Beach Units 1-2 AES 12/31/2020 Unit 1: 1/1/2020 452 SCERedondo Beach Units 5-8 AES 12/31/2020 Unit 7: 10/1/2019 1,343 SCEAlamitos Units 1-6 AES 12/31/2020 Units 1,2 & 6: 1/1/2020 2,011 SCEOrmond Beach Units 1 and 2 NRG 12/31/2020 1,516 SCE
Total MW 5,322Notes:* Moss Landing Units 1 and 2 will remain in operation after compliance with OTC policy via Track 2.AdditionsHuntington Beach Unit 6 AES 3/1/2020 644 SCEAlamitos Unit 8 AES 4/1/2020 640 SCEStanton Energy Reliability Center SERC 12/31/2020 98 SCEAlamitos battery energy storage AES 1/1/2021 100 SCE
Total MW 1,482
Net Decrease in Capacity beyond Summer 2019 (MW) 3,840
In Compliance** Encina Power Station Units 2-5 NRG 12/12/2018 840 SDG&EMandalay Units 1 and 2 NRG 2/15/2018 430 SCEEncina Power Station Units 1 NRG 5/8/2017 106 SDG&EMoss Landing Units 6 and 7 Dynegy 1/1/2017 1,500 PG&EPittsburg Units 5, 6 and 7 NRG 12/31/2016 1,159 PG&E
Huntington Beach Units 3-41 AES 12/7/2012 452 SCEHumboldt PG&E Sept. 2010 105 PG&EPotrero Unit 3 GenOn 2/28/2011 206 PG&ESouth Bay Dynegy 1/1/2011 702 SDG&EContra Costa Units 6 and 7 NRG 5/1/2013 674 PG&ESan Onofre Unit 2 & 3 SCE 6/7/2013 2,246 SCEEl Segundo Units 3 NRG 7/1/2014 335 SCEEl Segundo Units 4 NRG 12/31/2015 335 SCEMorro Bay Units 3 and 4 Dynegy 2/5/2014 650 PG&E
Total MW 9,740Notes**: these generating units were retired.Nuclear Plant to be in complianceDiablo Canyon PG&E 12/31/2025 2,240 PG&E
Total MW 2,240Total of all OTC Units 17,302
Generating Units Compliance with California Statewide Policyon the Use of Coastal and Estuarine Waters for Power Plant Cooling

California ISO 2019 Summer Loads and Resources Assessment
Page | 41
Conclusion Projections for 2019 show that the CAISO faces less risk of encountering operating conditions that could result in operating reserve shortfalls than was projected for 2018. The decreased risk in 2019 over 2018 is primarily a result of greater than average hydro conditions providing more daily energy, allowing hydro output to be sustained over more hours of the day.
The 2019 PLEXOS base case stochastic simulation results show that the CAISO system has a low probability of system capacity shortage. However, the CAISO system has a significant probability of a load following up shortage. These upward ramping shortages are most prevalent in the late afternoon when solar generation output decreases while system demand is still high. Without sufficient upward ramping capability within the CAISO to offset the loss of solar output during these times, neighboring balancing authority areas would have to provide the necessary support to balance supply and demand to maintain system frequency under normal conditions. The continuing decline in dispatchable generation as gas units retire creates further challenges for meeting the CAISO flexible capacity requirement and the peak demand, which is now occurring later in the day when solar output is at or near zero.
The CAISO will be at the greatest operational risk of a system capacity shortage if hot weather occurs that extends beyond the CAISO footprint and impacts the availability of surplus energy in neighboring balancing authority areas for imports into the CAISO. Availability of sufficient imports during high peak load conditions is critical to ensuring system reliability. The greatest risk would be if such an event occurred during late summer as hydro availability wains and the solar production afternoon ramp-down begins earlier in the day.
Low hydro sensitivity study results show that reduced levels of net imports during high demand conditions significantly affects system reliability. If import levels during 2019 summer peak conditions are significantly lower than 11,701 MW level assumed in the base case, the impact will be that the actual system reliability will tend towards the more challenging sensitivity study results. This could occur under above normal high temperatures in the CAISO that extend across the Southwest or into the Northwest. Such conditions would produce high loads in the CAISO and in its neighboring balancing authority areas, resulting in decreased imports into the CAISO.
The CAISO operations has procedures in place that can be used to facilitate the less extreme scenarios through out of market activities. However, in potential extreme weather conditions affecting the CAISO along with neighboring balancing authority areas the CAISO could be faced with the necessity of having to shed frim load. While the probability of shedding firm load is very low, the probability of ancillary service and load following up shortages is higher, requiring operations to act more frequently to shore up declining and deficient operating reserve margins.
This Assessment is a system level assessment and does not provide results on local area resource adequacy issues. In addition, this Assessment does not include potential risks associated with transmission facility forced outages, including transmission outages due to wildfires. The assessment analysis is largely based on historical outage rates of generation, which includes historical outages caused by wildfires. Finally, the risks to electric reliability associated with the gas storage facility restrictions at the Aliso Canyon and other gas storage facilities is greater in the local reliability areas in Southern California than to the CAISO system and are not included in the modeling results.
California ISO 2019 Summer Loads and Resources Assessment
Page | 42
The outlook for energy reliability in Southern California related to restrictions at the Aliso Canyon remain challenging. SoCalGas will likely need to withdraw gas supply from Aliso Canyon to meet the summer peak gas demand on a daily and hourly basis in addition to withdrawals from the other storage fields to meet non-peak demands.
The CAISO annually trains its grid operators to be prepared for system events, and to brush up on current operating procedures and utility best practices. Furthermore, the CAISO meets with WECC, Cal Fire, gas companies, and neighboring balancing authorities to discuss and coordinate on key areas. The CAISO fosters ongoing relationships with these organizations to ensure reliable operation of the market and grid during normal and critical periods.
Should CAISO system operating conditions go into the emergency stages, such as operating reserve shortfalls where non-spinning reserve requirement cannot be maintained or spinning reserve is depleted and operating reserve falls below minimum requirement, the CAISO will implement the following mitigation operating plan to minimize loss of load in the CAISO balancing authority area:
• Utilization of Flex Alert program, signaling that the CAISO expects high peak load condition. This program has been proven to reduce peak load in the CAISO balancing authority Area.
• Utilization of CAISO Restricted Maintenance program. This program is intended to reduce potential forced outages; therefore, minimizing forced outage rate during the high peak load condition.
• Manual post-day ahead unit commitment and exceptional dispatch of resources under RA contract to ensure ability to serve load and meet flexible ramping capability requirements.
• Manual exceptional dispatch of intertie resource that have Resource Adequacy obligation to serve CAISO load.
• Utilization of Alert/Warning/Emergency (AWE) program. • Utilization of Demand Response program including the Reliability Demand Response
Resources (RDRR) under the “Warning” stage. • Manual exceptional dispatch and utilization of back stop Capacity Procurement
Mechanism for physically available resources that have un-contracted RA capacity.

California ISO 2019 Summer Loads and Resources Assessment
Page | 43
IV. APPENDICES A. 2018 Summer Supply and Demand Summary Graphs
B. 2018 Summer Imports Summary Graphs
C. 2019 CAISO Summer On-Peak Available Capacity by Fuel Type

California ISO 2019 Summer Loads and Resources Assessment
Page | 44
Appendix A: 2018 Summer Supply and Demand Summary Graphs

California ISO 2019 Summer Loads and Resources Assessment
Page | 45
Appendix A: 2018 Summer Supply and Demand Summary Graphs

California ISO 2019 Summer Loads and Resources Assessment
Page | 46
Appendix A: 2018 Summer Supply and Demand Summary Graphs
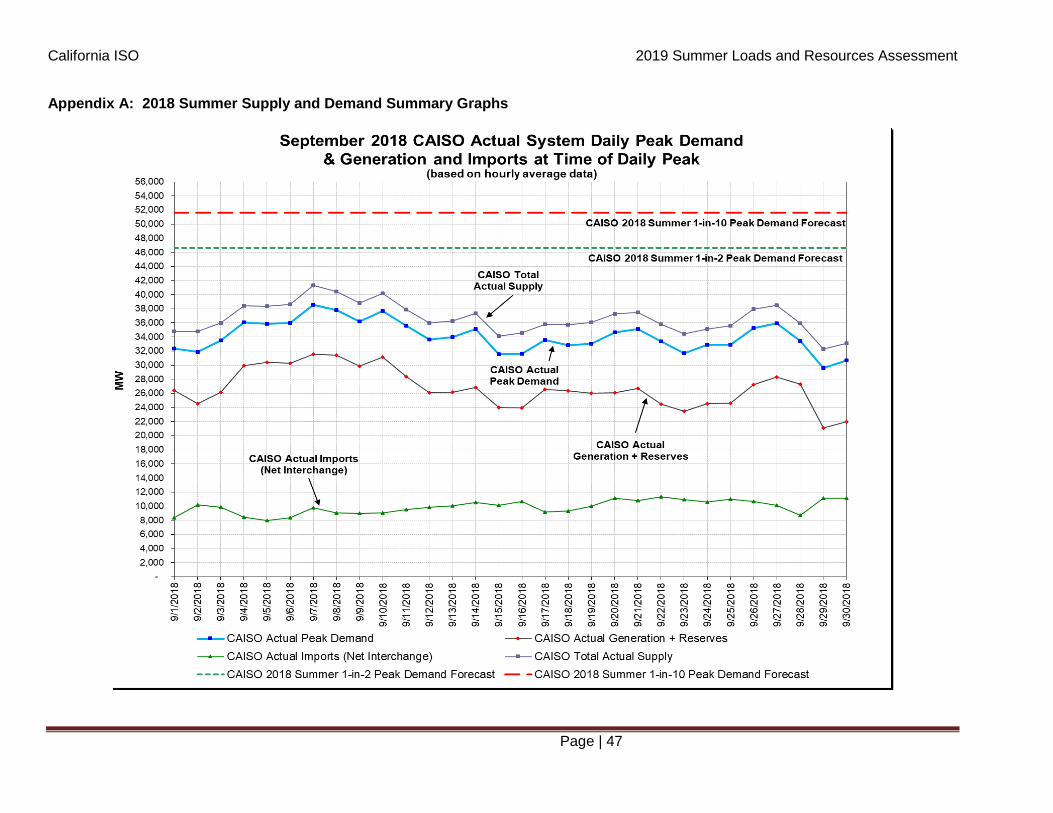
California ISO 2019 Summer Loads and Resources Assessment
Page | 47
Appendix A: 2018 Summer Supply and Demand Summary Graphs

California ISO 2019 Summer Loads and Resources Assessment
Page | 48
Appendix A: 2018 Summer Supply and Demand Summary Graphs

California ISO 2019 Summer Loads and Resources Assessment
Page | 49
Appendix A: 2018 Summer Supply and Demand Summary Graphs

California ISO 2019 Summer Loads and Resources Assessment
Page | 50
Appendix A: 2018 Summer Supply and Demand Summary Graphs
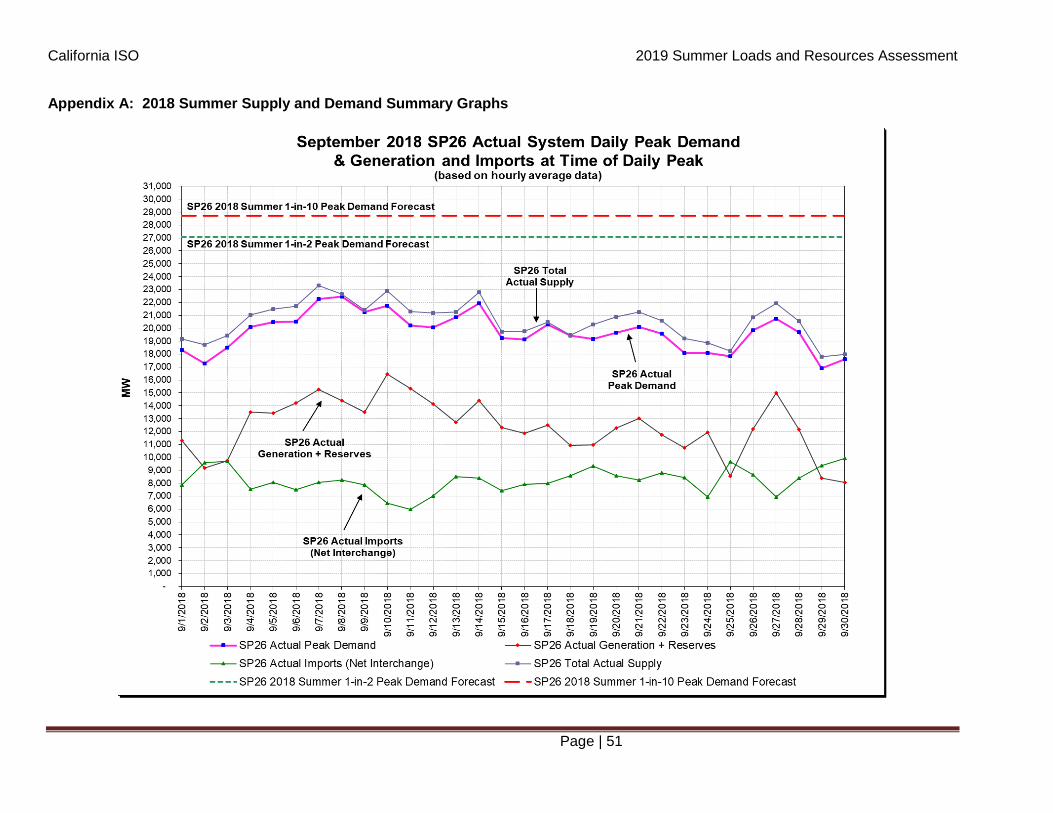
California ISO 2019 Summer Loads and Resources Assessment
Page | 51
Appendix A: 2018 Summer Supply and Demand Summary Graphs
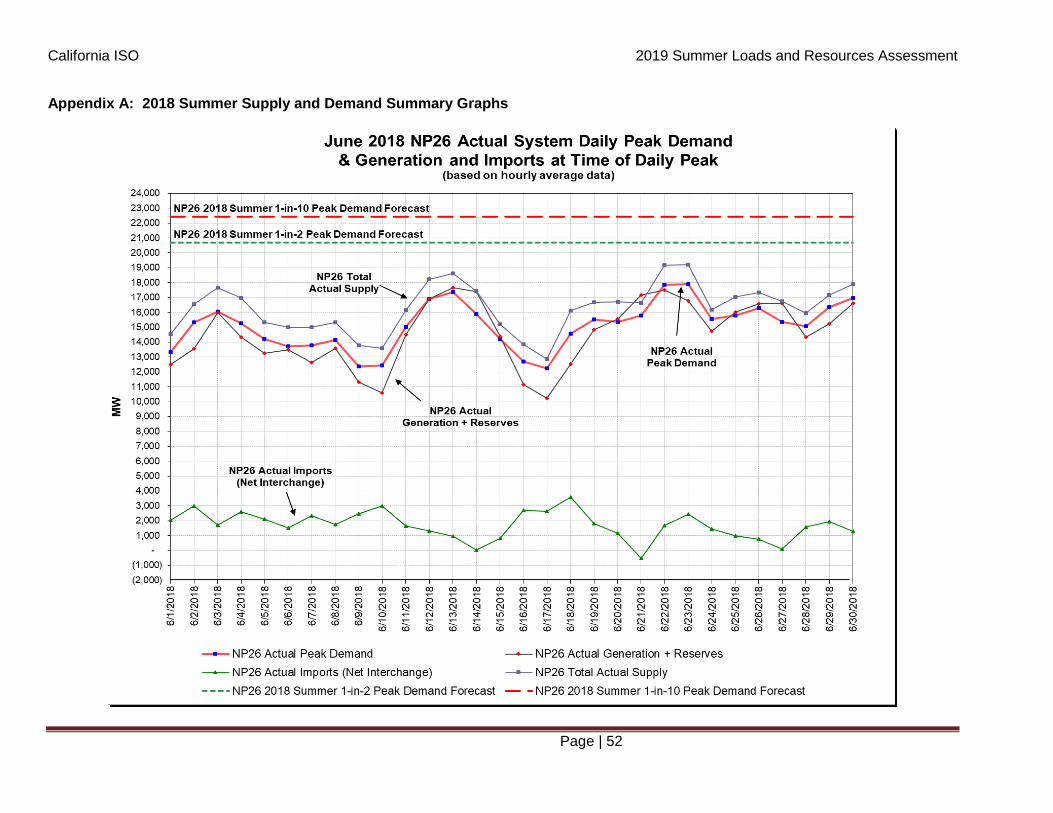
California ISO 2019 Summer Loads and Resources Assessment
Page | 52
Appendix A: 2018 Summer Supply and Demand Summary Graphs

California ISO 2019 Summer Loads and Resources Assessment
Page | 53
Appendix A: 2018 Summer Supply and Demand Summary Graphs

California ISO 2019 Summer Loads and Resources Assessment
Page | 54
Appendix A: 2018 Summer Supply and Demand Summary Graphs
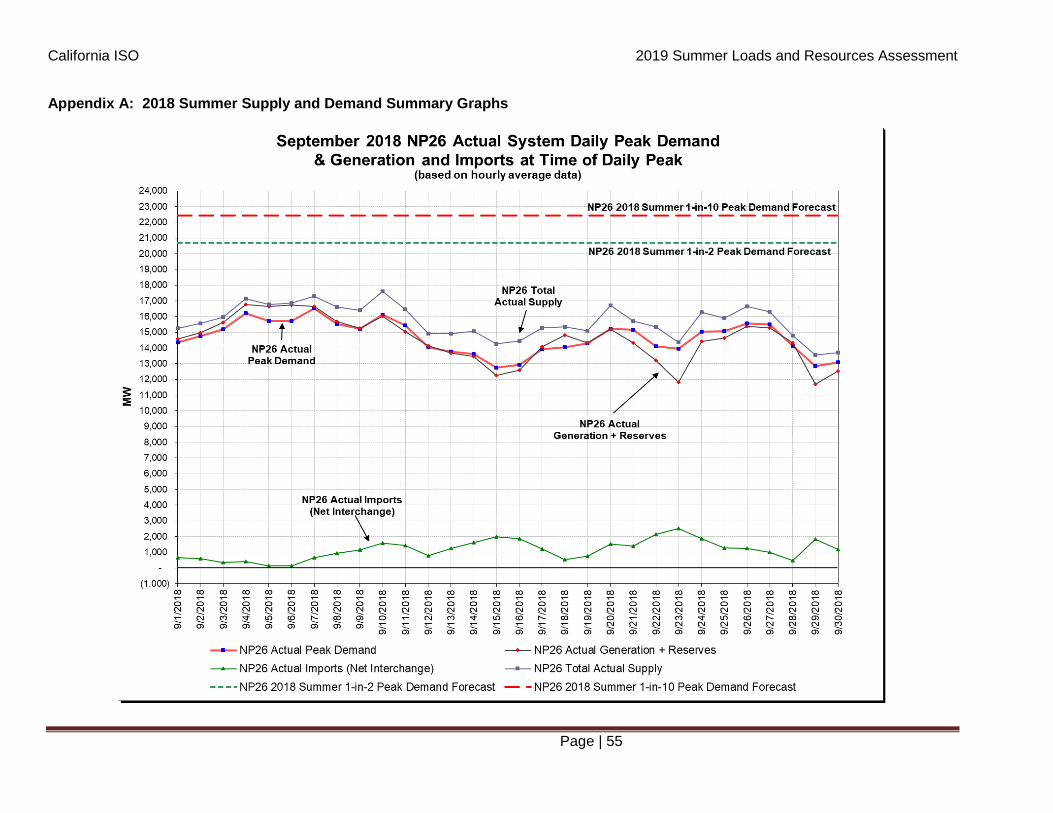
California ISO 2019 Summer Loads and Resources Assessment
Page | 55
Appendix A: 2018 Summer Supply and Demand Summary Graphs

California ISO 2019 Summer Loads and Resources Assessment
Page | 56
Appendix B: 2018 Summer Imports Summary Graphs
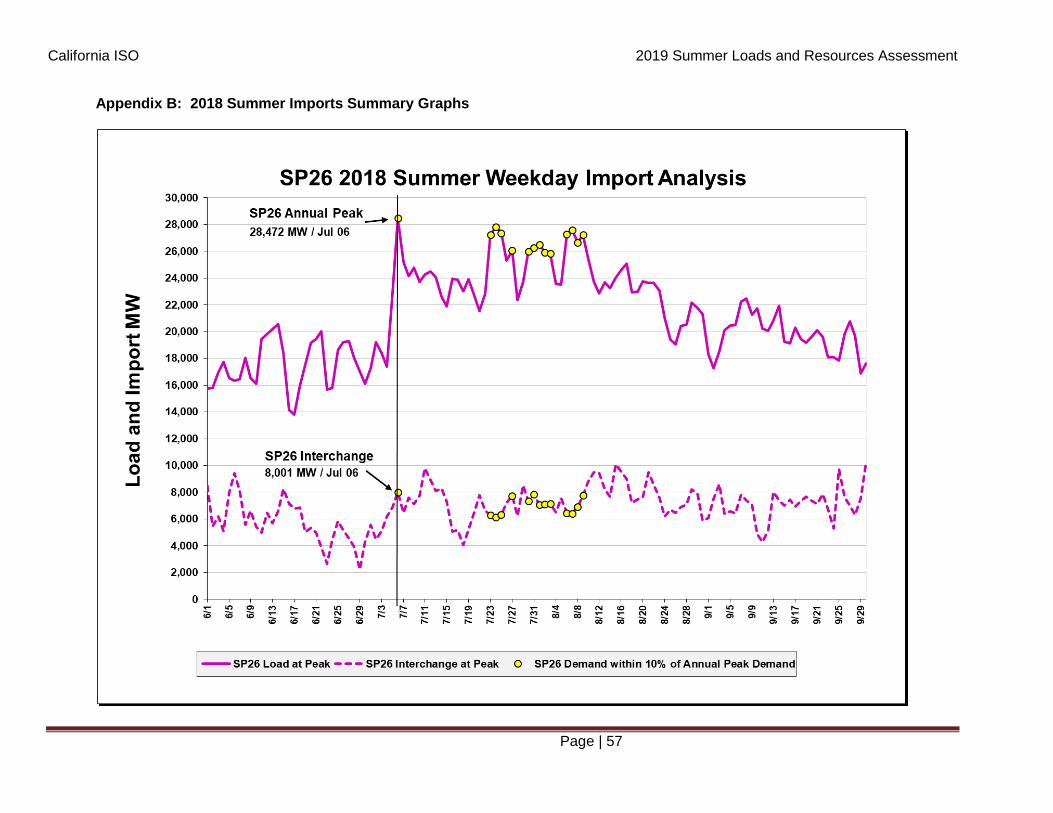
California ISO 2019 Summer Loads and Resources Assessment
Page | 57
Appendix B: 2018 Summer Imports Summary Graphs

California ISO 2019 Summer Loads and Resources Assessment
Page | 58
Appendix B: 2018 Summer Imports Summary Graphs

California ISO 2019 Summer Loads and Resources Assessment
Page | 59
Appendix C: 2019 CAISO Summer On-Peak Available Capacity by Fuel Type
Bio1.5%
Oil0.3%
Gas56.4%
Geo2.0% Nuclear
4.4%
Hydro14.2%
Battery0.3%
Solar15.8%
Wind2.9%
Coal0.0%
DR2.2%
2019 CAISO Summer On-Peak Available Capacity by Fuel Type