Embed Size (px)
Citation preview
Comprehensive Annual Financial ReportWith Independent Auditors’ Report for Fiscal Years EndedDecember 31, 2019 and 2018
Commonwealth of PennsylvaniaState Employees’ Retirement System
A Component Unit of the Commonwealth of Pennsylvania
2019
Traditional Pension
DEFINEDBENEFIT PLAN
Investment Option
DEFINEDCONTRIBUTIONPLAN
Comprehensive Annual Financial ReportWith Independent Auditors’ Report for Fiscal Years EndedDecember 31, 2019 and 2018
Commonwealth of PennsylvaniaState Employees’ Retirement System
A Component Unit of the Commonwealth of Pennsylvania
Prepared by the staff of thePennsylvania State Employees’ Retirement System
Terrill J. SanchezExecutive Director
Alicia E. James Chief Financial Officer
State Employees’ Retirement System30 N 3rd St, Suite 150Harrisburg, PA 17101-17161.800.633.5461www.SERS.pa.gov
2019
Table of Contents
INTRODUCTORY SECTION
Introductory SectionGFOA Award Certificate iPPCC Award Certificate iiTransmittal Letter iiiSERS Mission, Vision, and Organizational Chart viSERS Board vii
Financial SectionIndependent Auditors’ Report 1Management’s Discussion and Analysis (unaudited) 3Financial Statements:
Statements of Fiduciary Net Position 12Statements of Changes in Fiduciary Net Position 14Notes to Financial Statements 16
Required Supplementary Information (unaudited):Schedule 1 - Schedule of Changes in Net Pension Liability and Related Ratios 43
Schedule 2 - Schedule of Employer Contributions 44Schedule 3 - Schedule of Investment Returns 44
Supplementary Information:Schedule 4 - Schedule of Administrative Expenses 45Schedule 5 - Summary of Investment and Consultant Expenses 46
Investment SectionReport on Investment Activity 47Investment Policy and Objectives 49Investment Returns 51Defined Benefit Plan Values and Annual Return 53Largest Assets Held 54Schedule of Trading Broker Commissions 56Investment Summary 57
Private Equity 58Global Public Equity 69Real Estate 71Multi-Strategy 75Legacy Hedge Funds 78Fixed Income 79Cash 81
Defined Contribution Plan Investment Options 82
Actuarial SectionActuary’s Certification 83Summary of Actuarial Assumptions and Methods 87Schedules of Active Member Valuation Data 89Schedule of Retirees and Beneficiaries Added to and Removed from Rolls 93
Solvency Test 94Analysis of Financial Experience 95Schedule of Funding Progress 96Schedule of Contributions Under Previous Reporting Standards 97
History and Projection of Contribution Rates and Funded Ratios 98
Summary of Plan Provisions 99
Statistical Section Statistical Section Narrative 102Schedule of Trend Data 104Schedule of Additions to Fiduciary Net Position 105Schedule of Deductions from Fiduciary Net Position 106Schedule of Benefit and Refund Deductions from Fiduciary Net Position by Type 107
Schedule of Total Changes in Fiduciary Net Position 108Schedule of Investment Income 109Schedule of Active Member Statistics 110Schedule of Retired Members by Type of Benefit 111Schedule of Retired Members by Option 112Schedule of Average Monthly Benefit Payments 113Schedule of Average Annual Benefit Payments 114Schedule of Employer/Agency Participation 115

i
GFOA Award Certificate
INTRODUCTORY SECTION
ii
PPCC Award Certificate
INTRODUCTORY SECTION
Public Pension Coordinating Council
Public Pension Standards AwardFor Funding and Administration
2019
Presented to
Pennsylvania State Employees' Retirement SystemIn recognition of meeting professional standards for
plan funding and administration as set forth in the Public Pension Standards.
Presented by the Public Pension Coordinating Council, a confederation of
National Association of State Retirement Administrators (NASRA)National Conference on Public Employee Retirement Systems (NCPERS)
National Council on Teacher Retirement (NCTR)
Alan H. WinkleProgram Administrator
P CP C
iii
30 NORTH 3RD STREET, SUITE 150 | HARRISBURG, PA 17101-1716
P: 1.800.633.5461 | F: 717.237.0346 | www.SERS.pa.gov
May 31, 2020
Mr. David R. FillmanChairman, State Employees’ Retirement BoardCommonwealth of Pennsylvania30 North Third Street, Suite 150Harrisburg, PA 17101
Dear Chairman Fillman,
The Pennsylvania State Employees’ Retirement System (SERS) is pleased to present you with the 2019 calendar year Comprehensive Annual Financial Report (CAFR). The purpose of this report is to provide the governor, legislature, system members, participants, and annuitants, as well as the public with a clear accounting of SERS operations and financial position. We hope you will find this financial, investment, actuarial, and statistical material produced by SERS management to be both interesting and useful.
SERS remains committed to delivering accurate, meaningful information to policymakers and SERS members, as well as to provide context for our independently audited financial statements.
SERS administers four retirement plans for state employees – three plans require mandatory employee and employer contributions and one plan allows only voluntary employee contributions:
• Hybrid Plan – is a combination of two Internal Revenue Code-defined plans – a traditional pension or IRC section 401(a) defined benefit plan with an IRC section 401(a) defined contribution investment plan. This plan requires mandatory contributions from both the employee and the employer. There are two classes of service within the Hybrid Plan, class A-5 and class A-6.
• Defined Contribution Plan – is an IRC section 401(a) investment plan. This plan requires mandatory contributions from both the employee and the employer.
• Defined Benefit Plan – is a traditional pension plan defined by IRC section 401(a). This plan requires mandatory contributions from both the employee and the employer.
• Deferred Compensation Plan – is a voluntary supplemental plan defined by IRC section 457(b). This plan allows only voluntary employee contributions. (Note: The DCP has its own stand-alone financial statements and is not included in the CAFR).
Most new state employees are automatically enrolled in the Hybrid Plan A-5 class of service, with the right to opt out of that class of service into the Hybrid Plan A-6 class of service or the defined contribution-only plan. The exceptions are hazardous-duty employees and those who contributed to the traditional defined benefit pension plan in the past. In those two cases, the employee is automatically enrolled in the traditional defined benefit pension plan.
All SERS members, as of January 1, 2019, were given a one-time, irrevocable option to switch to either one of the hybrid plan classes of service or the defined contribution-only plan. Sixty-eight members opted into one of the new plans.
For 2019, KPMG LLP has conducted an independent audit of SERS financial statements, which are prepared in accordance with U.S. generally accepted accounting principles. Because the cost of a control should not exceed the benefits to be derived, the objective is to provide reasonable, rather than absolute, assurance that SERS financial statements are free of any material misstatements and fairly presented. As is our standard practice, independent auditors have full and unrestricted access to you and the board to discuss their findings regarding the adequacy of SERS internal controls and the integrity of SERS financial reporting.
iv
30 NORTH 3RD STREET, SUITE 150 | HARRISBURG, PA 17101-1716
P: 1.800.633.5461 | F: 717.237.0346 | www.SERS.pa.gov
SERS again received an unmodified opinion in 2019.
The Defined Contribution Plan opened for enrollment on January 1, 2019. As of December 31, 2019, there were over 8,000 accounts established and the plan had assets of approximately $12.4 million. The plan receives participant and employer contributions and the participant can choose to invest their money in several investment options, with most plan participants investing in the default option of a target date fund. More information regarding this plan can be found in the Management’s Discussion and Analysis within the Financial Section, while the remainder of the financial information in this letter is for the Defined Benefit Plan only.
Members and the SERS Board can be assured that their retirement system is administered well, and that staff carefully manages the funds entrusted to the board. As of December 31, 2019, the SERS’ Defined Benefit Plan had approximately $31.1 billion after paying out approximately $3.5 billion in retirement benefits to more than 132,000 retirees and beneficiaries; $3.2 billion was paid to people living in Pennsylvania, stimulating local economies.
In 2019, SERS served 102 agencies/employers and approximately 243,000 total members.
In mature pension plans such as SERS, newly retired members entering the pension rolls tend to have higher benefits than those who die and are removed from rolls. SERS’ experience reflects that trend. In 2019, approximately 6,100 SERS members retired with an average annual benefit of about $28,800, while approximately 4,400 retirees with an average annual benefit of about $16,300 were removed from the rolls.
The past year, 2019, saw a dramatic rebound across all asset classes. As a result, SERS experienced investment gains of nearly 19% for our Defined Benefit Plan, more than double the fund’s assumed rate of return. Positive investment performance contributed approximately $5.2 billion to net investment income in 2019.
Thanks to these positive returns, along with our continued push toward greater efficiencies and transparency, as well as four consecutive years of full funding of the actuarially required contribution from the General Assembly, SERS continues to progress toward our long-term goal of eliminating our unfunded liability.
Now that SERS employers are paying the full “uncollared” contribution amount, plus making extra “plowback” contributions to return Act 2017-5 savings, there has been a positive impact on paying down the unfunded liability. This funding is crucial for the overall long-term health of the pension system.
Based on the GASB 67 accounting valuation as of December 31, 2019, the resulting net pension liability was $18.2 billion. SERS plan fiduciary net position as a percentage of the total pension liability was 63.1%. Based on the actuarial methods used for funding purposes, as of December 31, 2019, the unfunded actuarial accrued liability was $23.0 billion. SERS funded ratio was 56.5%.
A high level of volatility in 2018 led to an unanticipated delay in the pace of employer contribution reductions. The impact of much improved investment results in 2019 on FY 2020-21 employer contributions was mitigated somewhat by the SERS Board’s decision to reduce the assumed rate of return from 7.25% to 7.125%. In FY 2020-21, the composite employer contribution rate will be 33.48% of payroll. This is estimated to generate approximately $2.2 billion.
It should be noted that Act 2017-5 included a savings “plow-back” provision requiring that the annual savings achieved through SERS’ benefit changes flow back into the system rather than to other non-pension obligations. The 33.48% projected employer contribution rate for FY 2020-21 includes a savings return of 0.66%. Without the plow-back provision, the employer rate would have been lower. The plow-back contributions, currently calculated to range from 0.10% to 0.93% of payroll, are expected in 12 of the next 22 fiscal years and will work to accelerate the systems’ return to fully funded status.
While future contribution rates depend on future returns and experience, current projections indicate SERS’ funded ratio will reach the 80% threshold generally accepted by pension experts as “healthy” by 2033. Pennsylvania is among nearly two-thirds of public pension plans currently below the 80% funding threshold.
The annual cost of the plan continues to drop as the number of members in the newer classes of service, including the A-3 and A-4 classes and the new A-5, A-6, and defined contribution classes that opened January 1, 2019, increases.
SERS continues major initiatives to improve services to our stakeholders, as well as improving efficiencies in the delivery of benefits and reducing cost in the administration of the system.
Investment strategies seek the highest-conviction investment opportunities within an acceptable level of risk. To be more responsive to our members and reduce transaction costs, we continue to increase the volume of electronic funds transfers for benefit payments. This initiative has reduced waiting periods for benefit payments and increased the security of delivery of our members’ money. Improving customer service to our members remains a top priority for the plan. We continue to enhance our member materials, striving to make the information contained within more understandable and accessible to a range of employees. We increasingly leverage technology to deliver many of these materials electronically, allowing the plan to reduce administrative costs and employ data-driven results to help guide future communication initiatives. SERS is also working to complete its multi-year benefits processing system upgrade that is expected to further improve how we interact with our members, their account-related transactions, and payment processing.
Throughout 2019, the SERS Board and staff continued to review and act upon key initiatives based on recommendations from the report issued in December 2018 by the Public Pension Management and Asset Investment Review Commission (part of Act 2017-5).
With an eye toward increased transparency, the SERS Board approved standard formats for specialty consultant performance reports, staff memos, consultant memos, and a recommended template for manager presentations that ultimately will be posted on SERS’ website. The board also approved a Stress Testing and Risk Assessment report, developed by SERS’ actuarial firm, Korn Ferry, in coordination with SERS’ investment consultant, Callan. The report reviewed a wide range of investment-related, contribution-related, and demographic-related risks that could affect the long-term health and stability of the fund. At the direction of the SERS Board, the Executive Director and staff continue to explore measures to further enhance the financial stability of the system through the establishment of a dedicated funding stream and other supporting strategies.
We are solely responsible for the contents of this report; however, we do wish to acknowledge the significant contributions of many SERS professionals whose work to compile, quality assure, and produce it is essential.
The commitment of the agency’s 200+ employees ensures that we maintain effective internal controls to assure that assets are safeguarded, transactions are properly executed, and financial statements conform to U.S. generally accepted accounting principles – all while providing effective, high-quality member services. SERS remains dedicated to providing the highest level of service to commonwealth employers, policymakers, employees, retirees, and the SERS Board. Staff at all levels strive to provide exceptional service to those who have dedicated their careers to the citizens of Pennsylvania and maintain careful stewardship of public dollars.
Respectfully submitted,
Terrill J. Sanchez Alicia E. James, CPAExecutive Director Chief Financial Officer
30 NORTH 3RD STREET, SUITE 150 | HARRISBURG, PA 17101-1716
P: 1.800.633.5461 | F: 717.237.0346 | www.SERS.pa.gov
v
vi
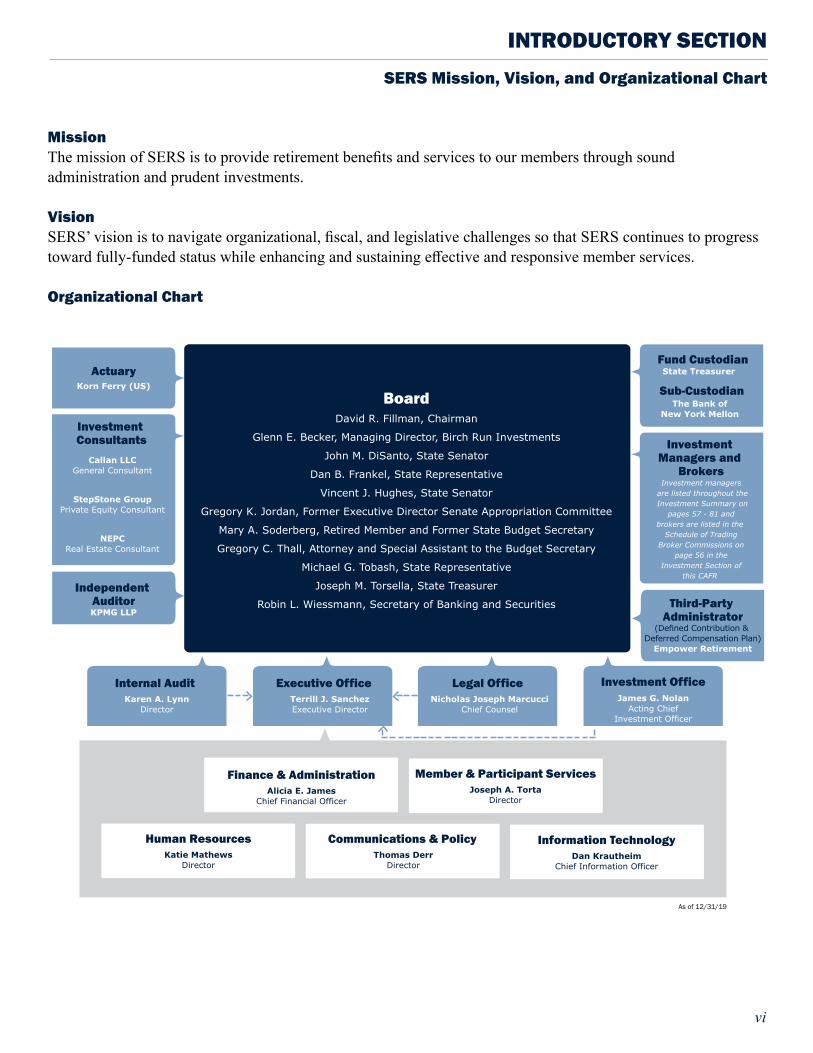
Mission The mission of SERS is to provide retirement benefits and services to our members through sound administration and prudent investments.
Vision SERS’ vision is to navigate organizational, fiscal, and legislative challenges so that SERS continues to progress toward fully-funded status while enhancing and sustaining effective and responsive member services.
Organizational Chart
SERS Mission, Vision, and Organizational Chart
INTRODUCTORY SECTION
Korn Ferry (US)Actuary State Treasurer
Fund Custodian
The Bank of New York Mellon
Sub-Custodian
Callan LLCGeneral Consultant
StepStone GroupPrivate Equity Consultant
NEPCReal Estate Consultant
Investment Consultants
Independent AuditorKPMG LLP
Third-Party Administrator
(Defined Contribution & Deferred Compensation Plan)
Empower Retirement
Alicia E. JamesChief Financial Officer
Finance & Administration
Thomas DerrDirector
Communications & Policy
Joseph A. TortaDirector
Member & Participant Services
Katie MathewsDirector
Human Resources
BoardDavid R. Fillman, Chairman
Glenn E. Becker, Managing Director, Birch Run Investments
John M. DiSanto, State Senator
Dan B. Frankel, State Representative
Vincent J. Hughes, State Senator
Gregory K. Jordan, Former Executive Director Senate Appropriation Committee
Mary A. Soderberg, Retired Member and Former State Budget Secretary
Gregory C. Thall, Attorney and Special Assistant to the Budget Secretary
Michael G. Tobash, State Representative
Joseph M. Torsella, State Treasurer
Robin L. Wiessmann, Secretary of Banking and Securities
Terrill J. SanchezExecutive Director
Executive OfficeKaren A. Lynn
Director
Internal AuditNicholas Joseph Marcucci
Chief Counsel
Legal OfficeJames G. Nolan
Acting ChiefInvestment Officer
Investment Office
Dan KrautheimChief Information Officer
Information Technology
As of 12/31/19
Investment Managers and
BrokersInvestment managers
are listed throughout the Investment Summary on
pages 57 - 81 andbrokers are listed in the
Schedule of TradingBroker Commissions on
page 56 in theInvestment Section of
this CAFR

Mr. David R. Fillman Chairman
Executive Director, AFSCME Council 13
Honorable Dan B. Frankel State Representative
Honorable Vincent J. Hughes State Senator
SERS Board December 31, 2019
INTRODUCTORY SECTION
vii
Honorable John M. DiSanto State Senator
Mr. Glenn E. Becker Managing Director, Birch Run Investments

Mr. Gregory C. Thall Attorney and Special Assistant to the
Budget Secretary
viii
Honorable Robin L. Wiessmann Secretary of Banking and Securities
Honorable Joseph M. TorsellaState Treasurer
Mr. Gregory K. Jordan Former Executive Director Senate
Appropriation Committee
SERS Board December 31, 2019
INTRODUCTORY SECTION
Honorable Michael G. Tobash State Representative
Honorable Mary A. Soderberg Retired Member and Former
State Budget Secretary
Photo Not
Available

Financial Section
2019
SERS 2019 Comprehensive Annual Financial Report | 1
2 | SERS 2019 Comprehensive Annual Financial Report
2
Other Matters
Required Supplementary Information
U.S. generally accepted accounting principles require that the management’s discussion and analysis on pages 3–11 and the required supplementary information in schedules 1 through 3 on pages 43–44 be presented to supplement the financial statements. Such information, although not a part of the financial statements, is required by the Governmental Accounting Standards Board who considers it to be an essential part of financial reporting for placing the financial statements in an appropriate operational, economic, or historical context. We have applied certain limited procedures to the required supplementary information in accordance with auditing standards generally accepted in the United States of America, which consisted of inquiries of management about the methods of preparing the information and comparing the information for consistency with management’s responses to our inquiries, the financial statements, and other knowledge we obtained during our audit of the financial statements. We do not express an opinion or provide any assurance on the information because the limited procedures do not provide us with sufficient evidence to express an opinion or provide any assurance.
Supplementary and Other Information
Our audits were conducted for the purpose of forming an opinion on the financial statements that collectively comprise SERS’ financial statements. The supplementary information in schedules 4 and 5 on pages 45-46,and the other information in the introductory section, investment section, actuarial section, and statistical section as listed in the table of contents, are presented for purposes of additional analysis and are not a required part of the financial statements.
The supplementary information in schedules 4 and 5 is the responsibility of management and was derived from and relates directly to the underlying accounting and other records used to prepare the financial statements for the year ended December 31, 2019. Such information has been subjected to the auditing procedures applied in the audit of the financial statements and certain additional procedures, including comparing and reconciling such information directly to the underlying accounting and other records used to prepare the financial statements or to the financial statements themselves, and other additional procedures in accordance with auditing standards generally accepted in the United States of America. In our opinion, the supplementary information in schedules 4 and 5 is fairly stated in all material respects in relation to the financial statements as a whole.
The introductory, investment, actuarial and statistical sections have not been subject to the auditing procedures applied in the audit of the financial statements and, accordingly, we do not express an opinion or provide any assurance on them.
Harrisburg, Pennsylvania May 29, 2020
SERS 2019 Comprehensive Annual Financial Report | 3
Management’s Discussion and Analysis December 31, 2019 and 2018 (unaudited)
FINANCIAL SECTION
This section presents Management’s Discussion and Analysis of the Pennsylvania State Employees’ Retirement System’s (SERS) financial statements, as well as the significant events and conditions that affected the operations and performance of SERS during the years ended December 31, 2019, 2018, and 2017.
In addition to historical information, the Management’s Discussion and Analysis includes forward-looking statements, which involve currently known facts and certain risks and uncertainties. Actual results and performance may differ materially from those expressed or implied in the forward-looking statements due to a wide range of factors including but not limited to: changes in securities markets, general economic conditions, interest rates, legislation, and global conflicts.
Overview of the Financial Statements and Accompanying InformationSERS administers two mandatory-participation retirement plans defined by the Internal Revenue Code: the Defined Benefit Plan, for which assets are held in the State Employee Retirement Fund (Defined Benefit Plan or pension plan); and the Defined Contribution Plan established by Act 2017-5, for which assets are held in a trust with ownership attributed to individual participant investment accounts. The financial statements present the financial position and activities for the Defined Benefit Plan and the Defined Contribution Plan.
(1) Financial Statements. SERS presents Statements of Fiduciary Net Position as of December 31, 2019 and 2018 as well as Statements of Changes in Fiduciary Net Position for the years then ended. These statements reflect resources available for the payment of benefits as of year end, and the sources and uses of those funds during the year.
(2) Notes to Financial Statements. The notes to financial statements are an integral part of the statements. SERS encourages readers to review them because the additional detail will provide a more complete understanding of the financial
statements. The notes provide information about SERS’ organization; benefits and contributions; determination of asset values; contingencies and commitments; actuarial liabilities and the associated methods and assumptions used to calculate them; and subsequent events that occurred after year end.
(3) Required Supplementary Information. The Required Supplementary Information (RSI) consists of:• This Management’s Discussion and Analysis
(MD&A)• A schedule of changes in net pension liability
and related ratios• A schedule of employer contributions• A schedule of investment returns
(4) Other Supplementary Information Schedules. Other schedules provide details of SERS administrative, investment, and consultant expenses. Supplementary information is considered useful in understanding and evaluating the financial activities of SERS.
Financial Highlights• In June 2019, the SERS Board approved a
reduction in the pension plan investment return assumption from 7.25% to 7.125%. The new investment return assumption was used for the December 31, 2019, valuation.
• The time-weighted rate of return on investments for the pension plan was 18.8% for year ended December 31, 2019, compared to a -4.6% for year ended December 31, 2018. The return for the ten-year period ended December 31, 2019, was 8.1%, which exceeded the 7.125% investment return assumption.
• The net position for the pension plan increased by approximately $4.2 billion for the year ended December 31, 2019, compared to a decrease of approximately $2.4 billion for the year ended December 31, 2018, as reflected in
Commonwealth of Pennsylvania State Employees’ Retirement SystemManagement’s Discussion and Analysis December 31, 2019 and 2018 (unaudited)
4 | SERS 2019 Financial Statements
4 | SERS 2019 Comprehensive Annual Financial Report
FINANCIAL SECTIONManagement’s Discussion and Analysis December 31, 2019 and 2018 (unaudited)
the table on page 11. The increase in 2019 is mainly attributed to positive investment returns and the ongoing commitment of employers to pay the full amount of the actuarially determined contribution.
• The Defined Contribution Plan opened forenrollment on January 1, 2019. The netposition for the Defined Contribution Planwas approximately $12.4 million as ofDecember 31, 2019. In 2018, the DefinedContribution Plan only incurred expenses forand received funding from the Commonwealthof Pennsylvania (commonwealth) for startupcosts associated with this plan.
The Defined Benefit PlanThe Defined Benefit Plan is a traditional pension plan defined by IRC section 401(a). This plan requires mandatory contributions from both the member and employer. SERS invests the contributions to achieve returns to help ensure sufficient funds are available to make required payments to current and future retirees.
Member ContributionsMember contributions were approximately $405 million for the year ended December 31, 2019, $394 million for the year ended December 31, 2018, and $383 million for the year ended December 31, 2017. There was a slight increase in gross salaries, which were approximately $6.3 billion for 2019 and $6.1 billion for 2018. The member contribution rate is set by statute and is 6.25% of gross salary for most members.
Employer ContributionsEmployer contributions were approximately $2.1 billion, $2.0 billion, and $1.9 billion for the years ended December 31, 2019, 2018, and 2017, respectively. The 2019 contributions represented an increase of $66 million – or 3% – compared to 2018. The growth was due to salaries increasing as well as a slight increase in the composite employer rate to 33.59% from 32.93% on July 1, 2019. The $150 million – or 8% – contribution growth in 2018 from 2017 was due to salaries increasing, despite a
slight decrease in the employer rate to 32.93% from 33.24% on July 1, 2018.
Since 2005, Pennsylvania law statutorily suppressed employer contribution rates, primarily through Acts 2003-40 and 2010-120. Act 2010-120 limited the rate at which employer contributions increased in any given year after fiscal year (FY) 2011-12, up to a maximum of 4.5% each year, until rate collars were no longer needed. Under this schedule, commonwealth FY 2017-18 was the first year since legislatively mandated contribution rates were enacted through Act 2010-120 that collars were no longer needed and employers paid the uncollared rate. Since FY 2017-18, employers continued to make contributions to the Defined Benefit Plan at the actuarially required rate. The FY 2020-21 composite employer contribution rate is going to be 33.48% of payroll.
Suppressed employer contributions have provided budgetary relief to commonwealth agencies and the taxpayers of Pennsylvania. The short-term benefit, however, has resulted in the need for employers to contribute more over a 30-year period due to implied financing costs. Such financing costs are incurred because the monies are not presently available to invest and cannot compound.
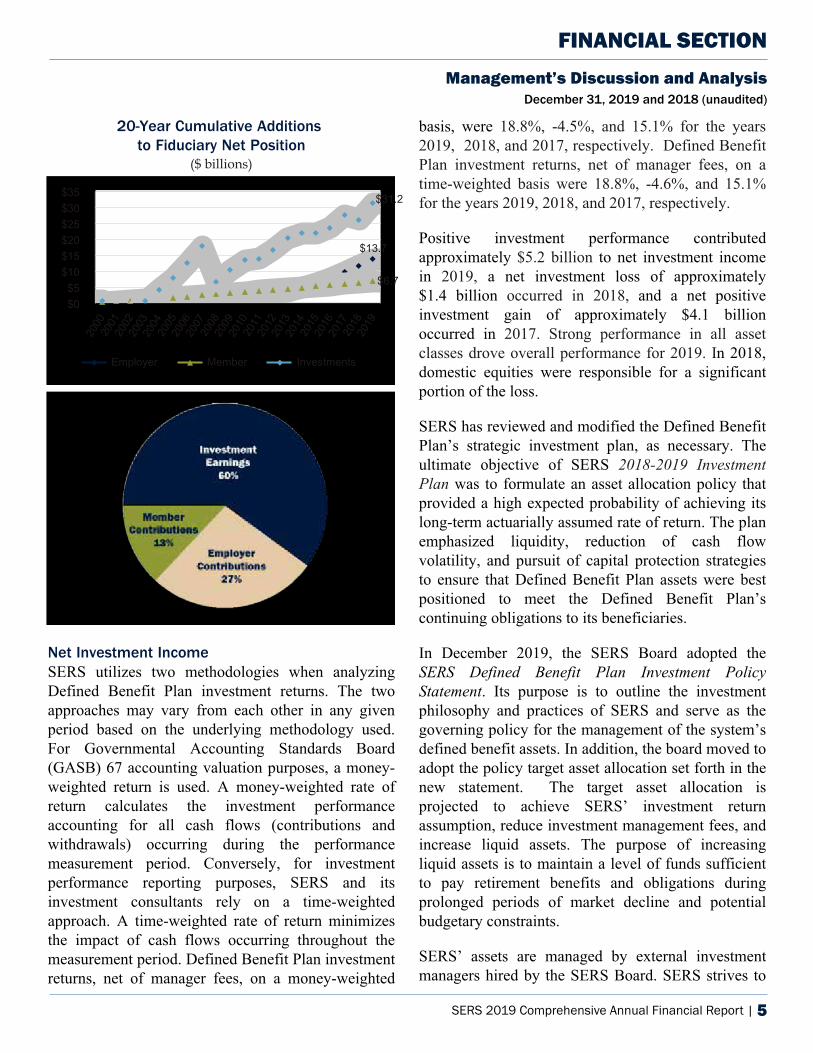
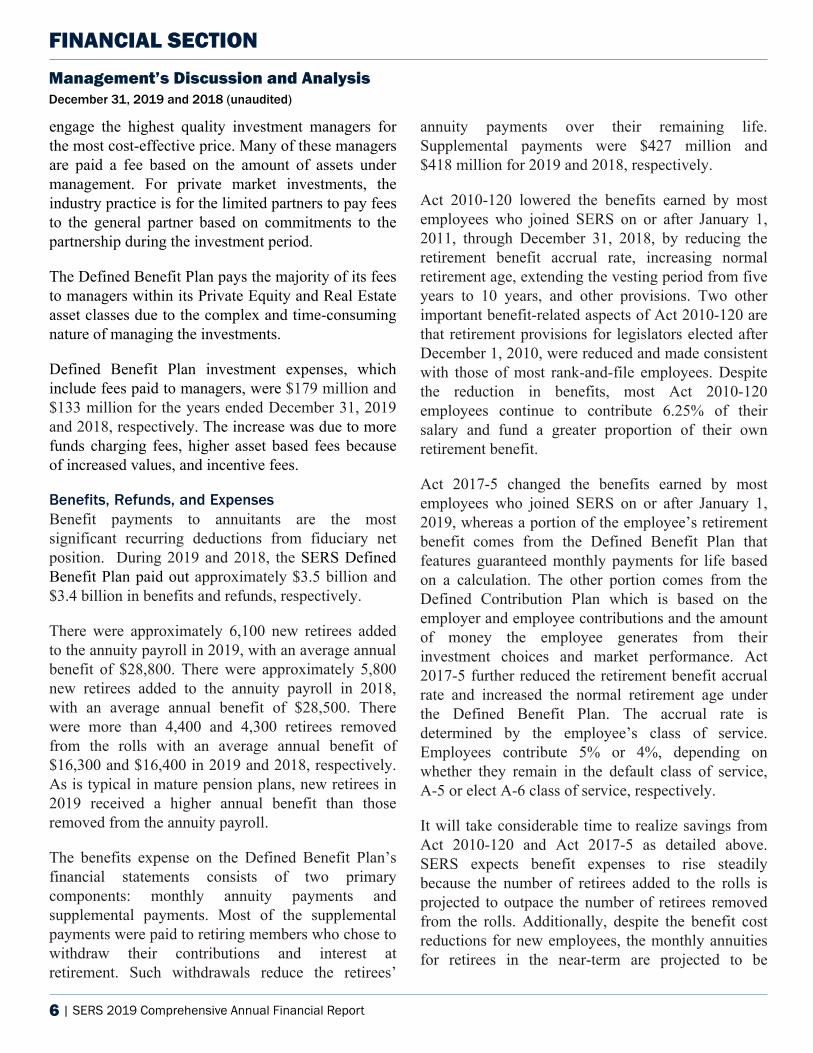
From 2000 through 2019, employer contributions totaled $13.7 billion – or 27% – of total additions to fiduciary net position, compared to $6.7 billion – or 13% – of total additions attributed to member contributions, and $31.2 billion – or 60% – of total additions attributed to investment earnings, as illustrated in the following charts.
Commonwealth of Pennsylvania State Employees’ Retirement SystemManagement’s Discussion and Analysis
December 31, 2019 and 2018 (unaudited)
SERS 2019 Financial Statements | 5
SERS 2019 Comprehensive Annual Financial Report | 5
FINANCIAL SECTIONManagement’s Discussion and Analysis
December 31, 2019 and 2018 (unaudited)20
0020
0120
0220
0320
0520
0620
0720
0920
1020
1120
1220
1320
1520
1620
1720
19
6 | SERS 2019 Comprehensive Annual Financial Report
FINANCIAL SECTIONManagement’s Discussion and Analysis December 31, 2019 and 2018 (unaudited)
engage the highest quality investment managers for the most cost-effective price. Many of these managers are paid a fee based on the amount of assets under management. For private market investments, the industry practice is for the limited partners to pay fees to the general partner based on commitments to the partnership during the investment period.
The Defined Benefit Plan pays the majority of its fees to managers within its Private Equity and Real Estate asset classes due to the complex and time-consuming nature of managing the investments.
Defined Benefit Plan investment expenses, which include fees paid to managers, were $179 million and $133 million for the years ended December 31, 2019 and 2018, respectively. The increase was due to more funds charging fees, higher asset based fees because of increased values, and incentive fees.
Benefits, Refunds, and ExpensesBenefit payments to annuitants are the most significant recurring deductions from fiduciary net position. During 2019 and 2018, the SERS Defined Benefit Plan paid out approximately $3.5 billion and $3.4 billion in benefits and refunds, respectively.
There were approximately 6,100 new retirees added to the annuity payroll in 2019, with an average annual benefit of $28,800. There were approximately 5,800 new retirees added to the annuity payroll in 2018, with an average annual benefit of $28,500. There were more than 4,400 and 4,300 retirees removed from the rolls with an average annual benefit of $16,300 and $16,400 in 2019 and 2018, respectively. As is typical in mature pension plans, new retirees in 2019 received a higher annual benefit than those removed from the annuity payroll.
The benefits expense on the Defined Benefit Plan’s financial statements consists of two primary components: monthly annuity payments and supplemental payments. Most of the supplemental payments were paid to retiring members who chose to withdraw their contributions and interest at retirement. Such withdrawals reduce the retirees’
annuity payments over their remaining life. Supplemental payments were $427 million and $418 million for 2019 and 2018, respectively.
Act 2010-120 lowered the benefits earned by most employees who joined SERS on or after January 1, 2011, through December 31, 2018, by reducing the retirement benefit accrual rate, increasing normal retirement age, extending the vesting period from five years to 10 years, and other provisions. Two other important benefit-related aspects of Act 2010-120 are that retirement provisions for legislators elected after December 1, 2010, were reduced and made consistent with those of most rank-and-file employees. Despite the reduction in benefits, most Act 2010-120 employees continue to contribute 6.25% of their salary and fund a greater proportion of their own retirement benefit.
Act 2017-5 changed the benefits earned by most employees who joined SERS on or after January 1, 2019, whereas a portion of the employee’s retirement benefit comes from the Defined Benefit Plan that features guaranteed monthly payments for life based on a calculation. The other portion comes from the Defined Contribution Plan which is based on the employer and employee contributions and the amount of money the employee generates from their investment choices and market performance. Act 2017-5 further reduced the retirement benefit accrual rate and increased the normal retirement age under the Defined Benefit Plan. The accrual rate is determined by the employee’s class of service. Employees contribute 5% or 4%, depending on whether they remain in the default class of service, A-5 or elect A-6 class of service, respectively.
It will take considerable time to realize savings from Act 2010-120 and Act 2017-5 as detailed above. SERS expects benefit expenses to rise steadily because the number of retirees added to the rolls is projected to outpace the number of retirees removed from the rolls. Additionally, despite the benefit cost reductions for new employees, the monthly annuities for retirees in the near-term are projected to be
Commonwealth of Pennsylvania State Employees’ Retirement SystemManagement’s Discussion and Analysis
December 31, 2019 and 2018 (unaudited)
SERS 2019 Financial Statements | 7
SERS 2019 Comprehensive Annual Financial Report | 7
FINANCIAL SECTIONManagement’s Discussion and Analysis
December 31, 2019 and 2018 (unaudited)
approximately 75% higher than the annuities of those being removed from the payrolls.
SERS was established in 1923, but did not pay more than $1 billion in annual benefits until 1997. SERS’ Defined Benefit Plan annual benefit payments reached $2 billion in 2007 and $3 billion in 2015. Based on recent actuarial projections, the SERS Defined Benefit Plan annual benefit payments will reach $4 billion by 2023.
Growth in Annuity Payroll
December
2019 2018 2017
Monthly annuity payroll($ millions) $259 $250 $242
Retirees 132,731 131,007 129,473
SERS’ administrative expenses represented 0.1% of fiduciary net position in 2019 and 2018. All expenses were within budget.
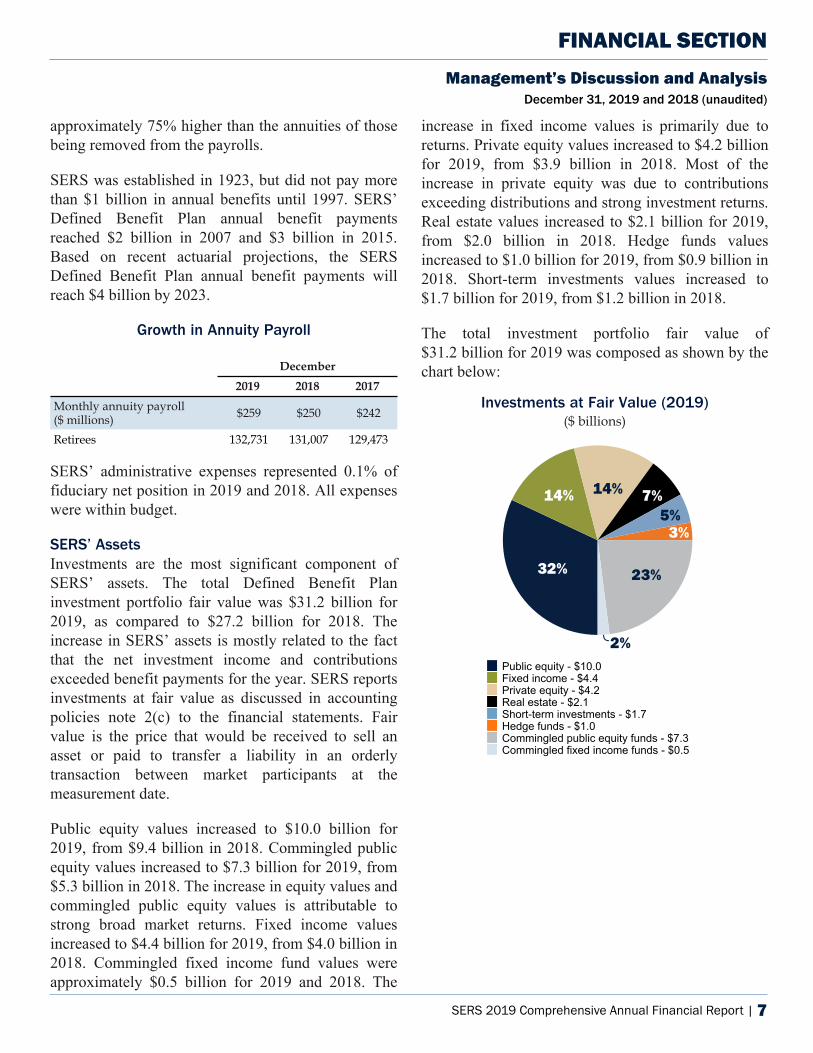
SERS’ AssetsInvestments are the most significant component of SERS’ assets. The total Defined Benefit Plan investment portfolio fair value was $31.2 billion for 2019, as compared to $27.2 billion for 2018. The increase in SERS’ assets is mostly related to the fact that the net investment income and contributions exceeded benefit payments for the year. SERS reports investments at fair value as discussed in accounting policies note 2(c) to the financial statements. Fair value is the price that would be received to sell an asset or paid to transfer a liability in an orderly transaction between market participants at the measurement date.
Public equity values increased to $10.0 billion for 2019, from $9.4 billion in 2018. Commingled public equity values increased to $7.3 billion for 2019, from $5.3 billion in 2018. The increase in equity values and commingled public equity values is attributable to strong broad market returns. Fixed income values increased to $4.4 billion for 2019, from $4.0 billion in 2018. Commingled fixed income fund values were approximately $0.5 billion for 2019 and 2018. The
increase in fixed income values is primarily due to returns. Private equity values increased to $4.2 billion for 2019, from $3.9 billion in 2018. Most of the increase in private equity was due to contributions exceeding distributions and strong investment returns. Real estate values increased to $2.1 billion for 2019, from $2.0 billion in 2018. Hedge funds values increased to $1.0 billion for 2019, from $0.9 billion in 2018. Short-term investments values increased to $1.7 billion for 2019, from $1.2 billion in 2018.
The total investment portfolio fair value of $31.2 billion for 2019 was composed as shown by the chart below:
Investments at Fair Value (2019)($ billions)
32%
14%14% 7%
5%3%
23%
2%Public equity - $10.0Fixed income - $4.4Private equity - $4.2Real estate - $2.1Short-term investments - $1.7Hedge funds - $1.0Commingled public equity funds - $7.3Commingled fixed income funds - $0.5
Commonwealth of Pennsylvania State Employees’ Retirement SystemManagement’s Discussion and Analysis December 31, 2019 and 2018 (unaudited)
8 | SERS 2019 Financial Statements
4GEGODGT
&
F
6N
8O
BKCN:K5U5U
,
32%
14% 14% 7%5%
3%
23%
2%
8 | SERS 2019 Comprehensive Annual Financial Report
FINANCIAL SECTIONManagement’s Discussion and Analysis December 31, 2019 and 2018 (unaudited)
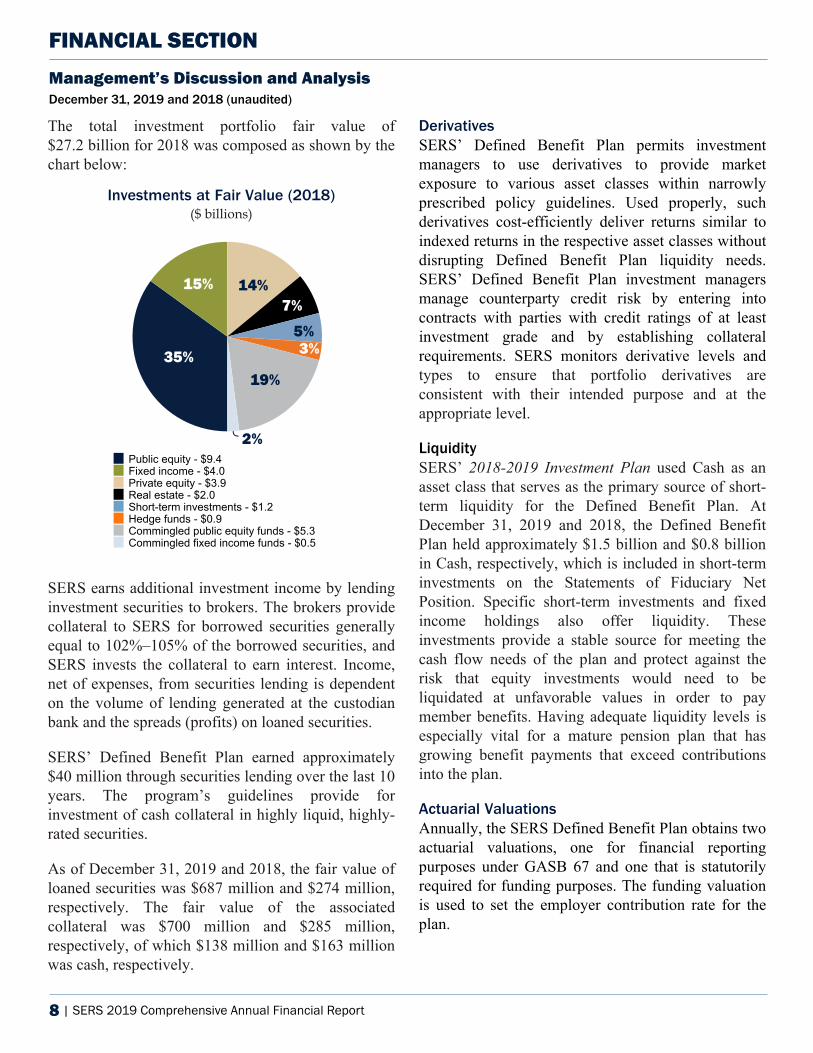
The total investment portfolio fair value of $27.2 billion for 2018 was composed as shown by the chart below:
Investments at Fair Value (2018)($ billions)
35%
15% 14%7%
5%3%
19%
2%Public equity - $9.4Fixed income - $4.0Private equity - $3.9Real estate - $2.0Short-term investments - $1.2Hedge funds - $0.9Commingled public equity funds - $5.3Commingled fixed income funds - $0.5
SERS earns additional investment income by lending investment securities to brokers. The brokers provide collateral to SERS for borrowed securities generally equal to 102%–105% of the borrowed securities, and SERS invests the collateral to earn interest. Income, net of expenses, from securities lending is dependent on the volume of lending generated at the custodian bank and the spreads (profits) on loaned securities.
SERS’ Defined Benefit Plan earned approximately $40 million through securities lending over the last 10 years. The program’s guidelines provide for investment of cash collateral in highly liquid, highly-rated securities.
As of December 31, 2019 and 2018, the fair value of loaned securities was $687 million and $274 million, respectively. The fair value of the associated collateral was $700 million and $285 million, respectively, of which $138 million and $163 million was cash, respectively.
DerivativesSERS’ Defined Benefit Plan permits investment managers to use derivatives to provide market exposure to various asset classes within narrowly prescribed policy guidelines. Used properly, such derivatives cost-efficiently deliver returns similar to indexed returns in the respective asset classes without disrupting Defined Benefit Plan liquidity needs. SERS’ Defined Benefit Plan investment managers manage counterparty credit risk by entering into contracts with parties with credit ratings of at least investment grade and by establishing collateral requirements. SERS monitors derivative levels and types to ensure that portfolio derivatives are consistent with their intended purpose and at the appropriate level.
LiquiditySERS’ 2018-2019 Investment Plan used Cash as an asset class that serves as the primary source of short-term liquidity for the Defined Benefit Plan. At December 31, 2019 and 2018, the Defined Benefit Plan held approximately $1.5 billion and $0.8 billion in Cash, respectively, which is included in short-term investments on the Statements of Fiduciary Net Position. Specific short-term investments and fixed income holdings also offer liquidity. These investments provide a stable source for meeting the cash flow needs of the plan and protect against the risk that equity investments would need to be liquidated at unfavorable values in order to pay member benefits. Having adequate liquidity levels is especially vital for a mature pension plan that has growing benefit payments that exceed contributions into the plan.
Actuarial ValuationsAnnually, the SERS Defined Benefit Plan obtains two actuarial valuations, one for financial reporting purposes under GASB 67 and one that is statutorily required for funding purposes. The funding valuation is used to set the employer contribution rate for the plan.
Commonwealth of Pennsylvania State Employees’ Retirement SystemManagement’s Discussion and Analysis
December 31, 2019 and 2018 (unaudited)
SERS 2019 Financial Statements | 9
FR
8O
BKCN:K5U5U
1ERIVATIVES
V&
&
-
35%
15% 14%7%
5%3%
19%
2%
SERS 2019 Comprehensive Annual Financial Report | 9
FINANCIAL SECTIONManagement’s Discussion and Analysis
December 31, 2019 and 2018 (unaudited)
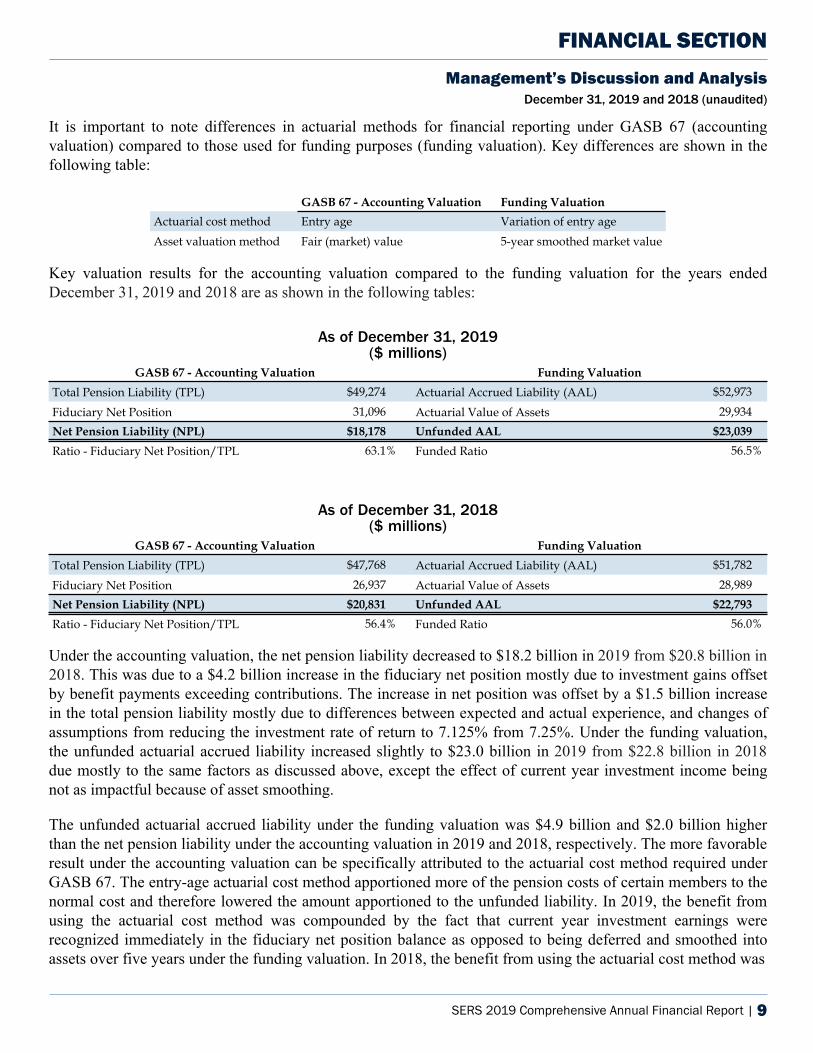
It is important to note differences in actuarial methods for financial reporting under GASB 67 (accounting valuation) compared to those used for funding purposes (funding valuation). Key differences are shown in the following table:
GASB 67 - Accounting Valuation Funding Valuation
Actuarial cost method Entry age Variation of entry ageAsset valuation method Fair (market) value 5-year smoothed market value
Key valuation results for the accounting valuation compared to the funding valuation for the years ended December 31, 2019 and 2018 are as shown in the following tables:
As of December 31, 2019($ millions)
GASB 67 - Accounting Valuation Funding Valuation
Total Pension Liability (TPL) $49,274 Actuarial Accrued Liability (AAL) $52,973
Fiduciary Net Position 31,096 Actuarial Value of Assets 29,934 Net Pension Liability (NPL) $18,178 Unfunded AAL $23,039
Ratio - Fiduciary Net Position/TPL 63.1% Funded Ratio 56.5%
As of December 31, 2018($ millions)
GASB 67 - Accounting Valuation Funding Valuation
Total Pension Liability (TPL) $47,768 Actuarial Accrued Liability (AAL) $51,782
Fiduciary Net Position 26,937 Actuarial Value of Assets 28,989 Net Pension Liability (NPL) $20,831 Unfunded AAL $22,793
Ratio - Fiduciary Net Position/TPL 56.4% Funded Ratio 56.0%
Under the accounting valuation, the net pension liability decreased to $18.2 billion in 2019 from $20.8 billion in 2018. This was due to a $4.2 billion increase in the fiduciary net position mostly due to investment gains offset by benefit payments exceeding contributions. The increase in net position was offset by a $1.5 billion increase in the total pension liability mostly due to differences between expected and actual experience, and changes of assumptions from reducing the investment rate of return to 7.125% from 7.25%. Under the funding valuation, the unfunded actuarial accrued liability increased slightly to $23.0 billion in 2019 from $22.8 billion in 2018 due mostly to the same factors as discussed above, except the effect of current year investment income being not as impactful because of asset smoothing.
The unfunded actuarial accrued liability under the funding valuation was $4.9 billion and $2.0 billion higher than the net pension liability under the accounting valuation in 2019 and 2018, respectively. The more favorable result under the accounting valuation can be specifically attributed to the actuarial cost method required under GASB 67. The entry-age actuarial cost method apportioned more of the pension costs of certain members to the normal cost and therefore lowered the amount apportioned to the unfunded liability. In 2019, the benefit from using the actuarial cost method was compounded by the fact that current year investment earnings were recognized immediately in the fiduciary net position balance as opposed to being deferred and smoothed into assets over five years under the funding valuation. In 2018, the benefit from using the actuarial cost method was
Commonwealth of Pennsylvania State Employees’ Retirement SystemManagement’s Discussion and Analysis December 31, 2019 and 2018 (unaudited)
10 | SERS 2019 Financial Statements
10 | SERS 2019 Comprehensive Annual Financial Report
FINANCIAL SECTIONManagement’s Discussion and Analysis December 31, 2019 and 2018 (unaudited)
offset by the fact that investment losses were recognized immediately in the fiduciary net position balance as opposed to being deferred and smoothed into assets over five years under the funding valuation.
Every five years, the SERS Defined Benefit Plan is required to conduct an actuarial experience study to determine whether the assumptions used in its annual actuarial valuations remain accurate based on current and anticipated demographic trends and economic conditions. The 18th Investigation of Actuarial Experience study for the period 2011-2015 was released in March 2016. The actuary, under oversight of the SERS Board, reviewed economic assumptions (such as the assumed future investment returns and salary increases) as well as demographic assumptions (such as employee turnover, retirement, disability, and death rates). Some assumption adjustments increased projected cost and some decreased projected cost, but the overall result was a slight increase to the net position liability.
Most demographic assumptions remained the same as, or similar to, experience over the last five years. However, the experience study did recommend changing some assumptions. The study recommended decreasing disability retirement rates for all active members. Additionally, it recommended adjusting superannuation separation rates, early retirement separation rates, and withdrawal rates for certain active member groupings (gender, age, and years of service) in both the general and special membership classes. Furthermore, it recommended decreasing most annuitant and survivor mortality rates.
The SERS Board adopted the actuarial assumptions set forth in the 18th Investigation of Actuarial Experience at its March 2016 meeting. The study can be viewed at www.SERS.pa.gov.
In addition to the five-year experience study, the SERS Board reviews the Defined Benefit Plan’s investment return assumption in light of economic conditions every year. In June 2019, the SERS Board approved a reduction in the Defined Benefit Plan
investment rate of return assumption to 7.125% for 2019 from 7.25% for 2018.
The Defined Contribution PlanOn June 12, 2017, Governor Wolf signed Act 2017-5 into law. The law established two new side-by-side hybrid defined benefit/defined contribution benefit options and a new defined contribution-only option for all state employees, excluding most hazardous duty employees, who first enter SERS membership on or after January 1, 2019. Additionally, all legacy SERS members had a one time, irrevocable option to select one of the three new retirement benefit options.
While new employees are automatically enrolled in the hybrid Defined Benefit/Defined Contribution Plan A-5 class of service, they have the option to elect the other hybrid Defined Benefit/Defined Contribution Plan option A-6 class of service, or to join the stand-alone Defined Contribution Plan. The Defined Contribution Plan, for all options, has three-year vesting for employer contributions and immediate vesting for employee contributions.
The SERS Board selects the investment options offered through the Defined Contribution Plan, and contracts with investment managers and with a third-party administrator (TPA) for the plan. The employee defined contribution accounts are maintained by the TPA. Employee and employer contributions for the Defined Contribution Plan are deposited into participants’ individual investment accounts. Employees may invest their money in several investment options including a range of target date funds, equity funds, fixed income funds, a short-term investment fund, and self-directed brokerage option. If no active selection is made, contributions will be defaulted into one of the target date funds. The benefit to which a participant is entitled to is their vested account balance at termination. Distribution of benefits can be made in installments, lump sum payments, or through an annuity.
There were approximately 8,000 defined contribution accounts established in 2019. The net position of the Defined Contribution Plan as of December 31, 2019,
Commonwealth of Pennsylvania State Employees’ Retirement SystemManagement’s Discussion and Analysis
December 31, 2019 and 2018 (unaudited)
SERS 2019 Financial Statements | 11
SERS 2019 Comprehensive Annual Financial Report | 11
FINANCIAL SECTIONManagement’s Discussion and Analysis
December 31, 2019 and 2018 (unaudited)
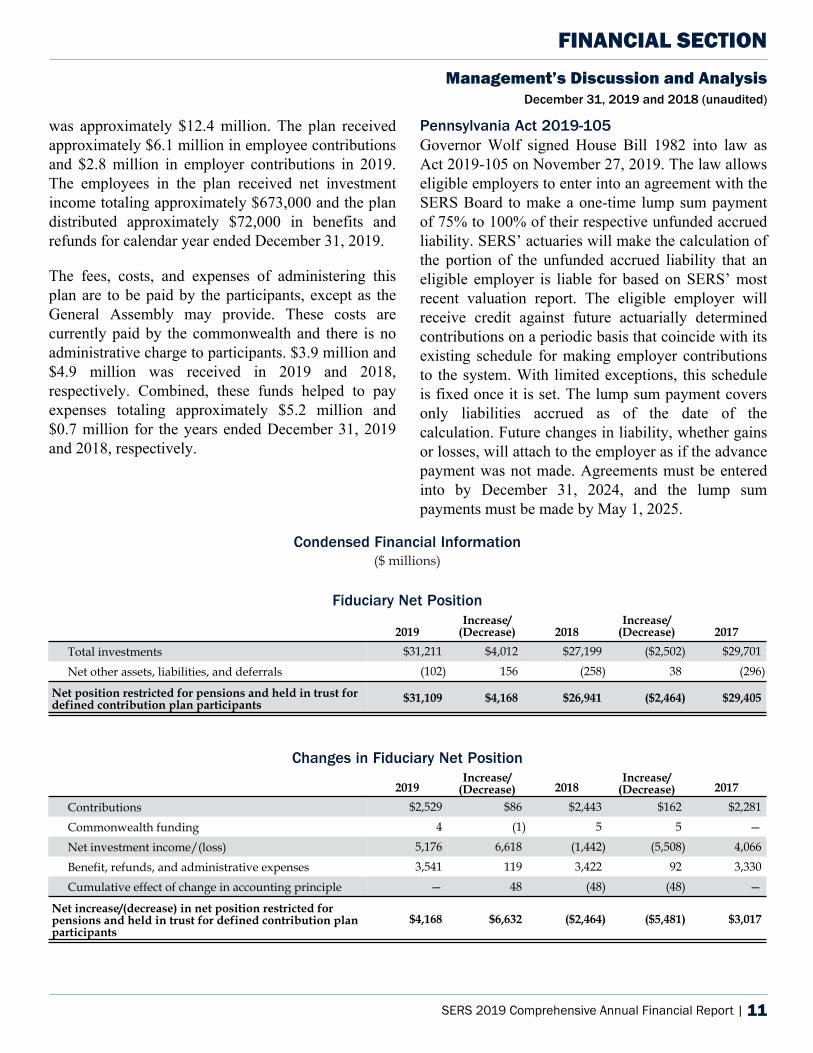
was approximately $12.4 million. The plan received approximately $6.1 million in employee contributions and $2.8 million in employer contributions in 2019. The employees in the plan received net investment income totaling approximately $673,000 and the plan distributed approximately $72,000 in benefits and refunds for calendar year ended December 31, 2019.
The fees, costs, and expenses of administering this plan are to be paid by the participants, except as the General Assembly may provide. These costs are currently paid by the commonwealth and there is no administrative charge to participants. $3.9 million and $4.9 million was received in 2019 and 2018, respectively. Combined, these funds helped to pay expenses totaling approximately $5.2 million and $0.7 million for the years ended December 31, 2019 and 2018, respectively.
Pennsylvania Act 2019-105Governor Wolf signed House Bill 1982 into law as Act 2019-105 on November 27, 2019. The law allows eligible employers to enter into an agreement with the SERS Board to make a one-time lump sum payment of 75% to 100% of their respective unfunded accrued liability. SERS’ actuaries will make the calculation of the portion of the unfunded accrued liability that an eligible employer is liable for based on SERS’ most recent valuation report. The eligible employer will receive credit against future actuarially determined contributions on a periodic basis that coincide with its existing schedule for making employer contributions to the system. With limited exceptions, this schedule is fixed once it is set. The lump sum payment covers only liabilities accrued as of the date of the calculation. Future changes in liability, whether gains or losses, will attach to the employer as if the advance payment was not made. Agreements must be entered into by December 31, 2024, and the lump sum payments must be made by May 1, 2025.
Commonwealth of Pennsylvania State Employees’ Retirement SystemManagement’s Discussion and Analysis December 31, 2019 and 2018 (unaudited)
12 | SERS 2019 Financial Statements
Condensed Financial Information($ millions)
Fiduciary Net Position
2019Increase/
(Decrease) 2018Increase/
(Decrease) 2017
Total investments $31,211 $4,012 $27,199 ($2,502) $29,701
Net other assets, liabilities, and deferrals (102) 156 (258) 38 (296)
Net position restricted for pensions and held in trust for defined contribution plan participants $31,109 $4,168 $26,941 ($2,464) $29,405
Changes in Fiduciary Net Position
2019Increase/
(Decrease) 2018Increase/
(Decrease) 2017
Contributions $2,529 $86 $2,443 $162 $2,281
Commonwealth funding 4 (1) 5 5 —
Net investment income/(loss) 5,176 6,618 (1,442) (5,508) 4,066
Benefit, refunds, and administrative expenses 3,541 119 3,422 92 3,330
Cumulative effect of change in accounting principle — 48 (48) (48) —
Net increase/(decrease) in net position restricted for pensions and held in trust for defined contribution plan participants
$4,168 $6,632 ($2,464) ($5,481) $3,017
Commonwealth of Pennsylvania State Employees’ Retirement SystemManagement’s Discussion and Analysis
December 31, 2019 and 2018 (unaudited)
SERS 2019 Financial Statements | 13
12 | SERS 2019 Comprehensive Annual Financial Report
FINANCIAL SECTIONStatements of Fiduciary Net Position
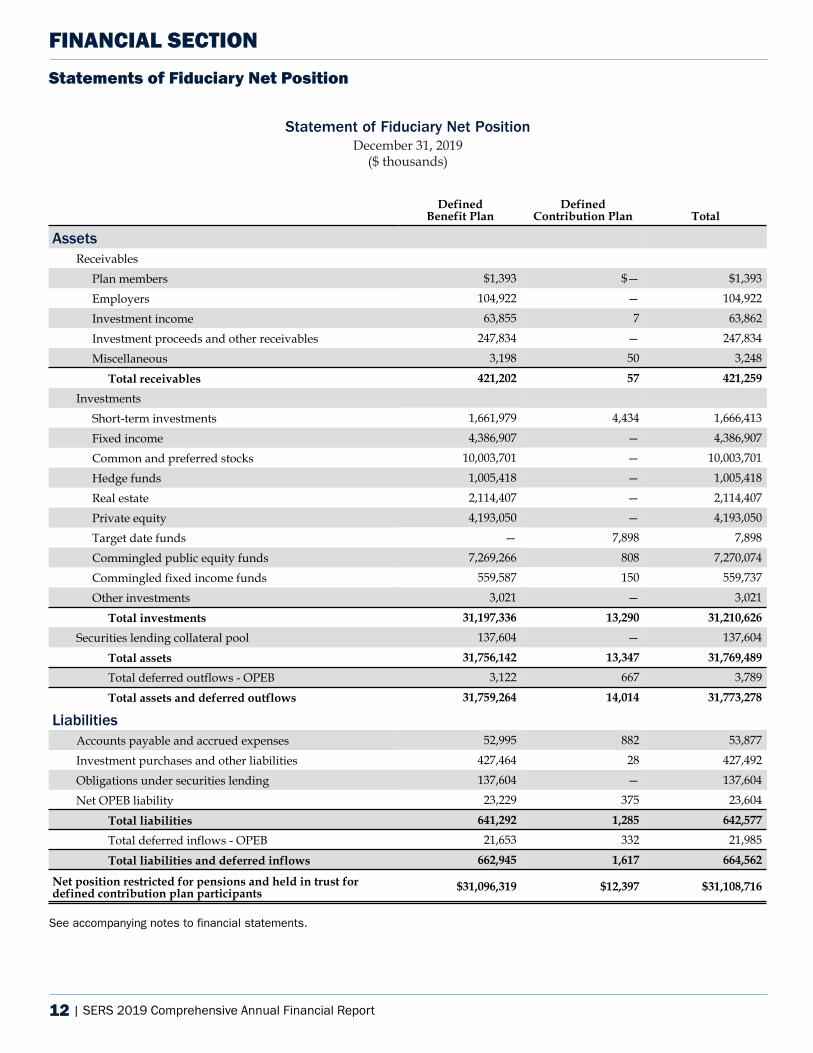
Statement of Fiduciary Net PositionDecember 31, 2019
($ thousands)
DefinedBenefit Plan
DefinedContribution Plan Total
AssetsReceivables
Plan members $1,393 $— $1,393
Employers 104,922 — 104,922
Investment income 63,855 7 63,862
Investment proceeds and other receivables 247,834 — 247,834
Miscellaneous 3,198 50 3,248
Total receivables 421,202 57 421,259
InvestmentsShort-term investments 1,661,979 4,434 1,666,413
Fixed income 4,386,907 — 4,386,907
Common and preferred stocks 10,003,701 — 10,003,701
Hedge funds 1,005,418 — 1,005,418
Real estate 2,114,407 — 2,114,407
Private equity 4,193,050 — 4,193,050
Target date funds — 7,898 7,898
Commingled public equity funds 7,269,266 808 7,270,074
Commingled fixed income funds 559,587 150 559,737
Other investments 3,021 — 3,021
Total investments 31,197,336 13,290 31,210,626
Securities lending collateral pool 137,604 — 137,604
Total assets 31,756,142 13,347 31,769,489
Total deferred outflows - OPEB 3,122 667 3,789
Total assets and deferred outflows 31,759,264 14,014 31,773,278
LiabilitiesAccounts payable and accrued expenses 52,995 882 53,877
Investment purchases and other liabilities 427,464 28 427,492
Obligations under securities lending 137,604 — 137,604
Net OPEB liability 23,229 375 23,604
Total liabilities 641,292 1,285 642,577
Total deferred inflows - OPEB 21,653 332 21,985
Total liabilities and deferred inflows 662,945 1,617 664,562
Net position restricted for pensions and held in trust for defined contribution plan participants $31,096,319 $12,397 $31,108,716
See accompanying notes to financial statements.
Commonwealth of Pennsylvania State Employees’ Retirement SystemStatements of Fiduciary Net Position
14 | SERS 2019 Financial Statements
SERS 2019 Comprehensive Annual Financial Report | 13
FINANCIAL SECTIONStatements of Fiduciary Net Position
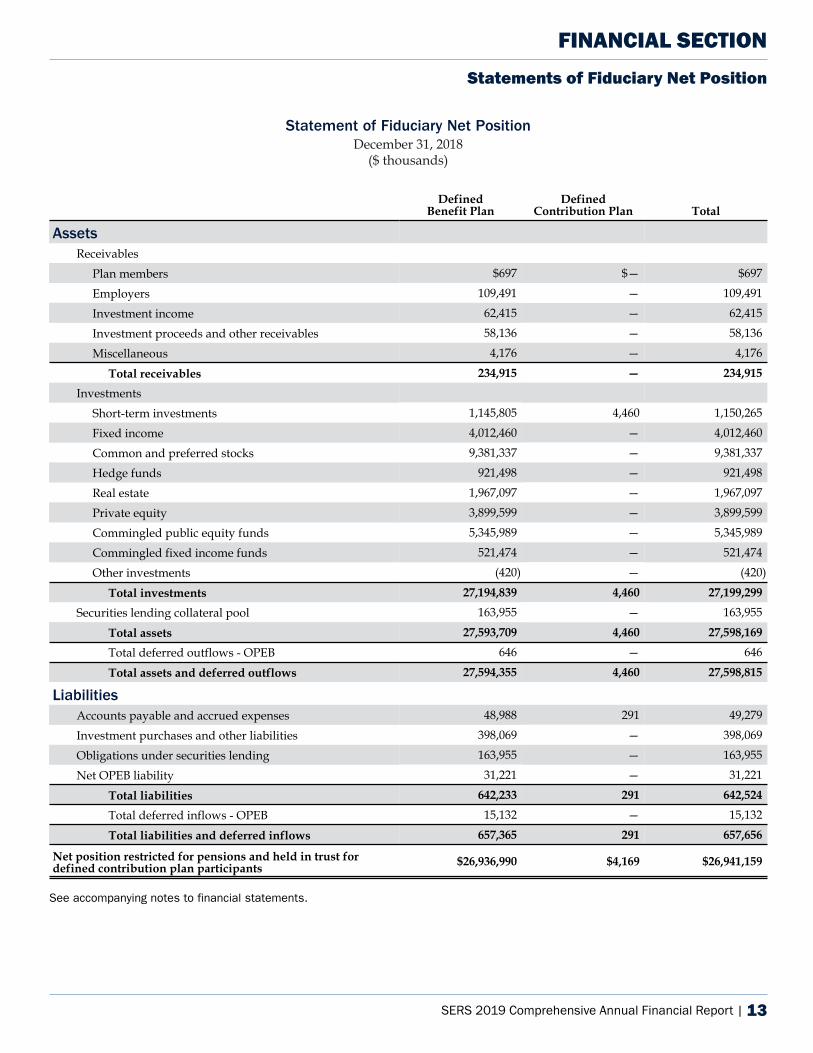
Statement of Fiduciary Net PositionDecember 31, 2018
($ thousands)
DefinedBenefit Plan
DefinedContribution Plan Total
AssetsReceivables
Plan members $697 $— $697
Employers 109,491 — 109,491
Investment income 62,415 — 62,415
Investment proceeds and other receivables 58,136 — 58,136
Miscellaneous 4,176 — 4,176
Total receivables 234,915 — 234,915
InvestmentsShort-term investments 1,145,805 4,460 1,150,265
Fixed income 4,012,460 — 4,012,460
Common and preferred stocks 9,381,337 — 9,381,337
Hedge funds 921,498 — 921,498
Real estate 1,967,097 — 1,967,097
Private equity 3,899,599 — 3,899,599
Commingled public equity funds 5,345,989 — 5,345,989
Commingled fixed income funds 521,474 — 521,474
Other investments (420) — (420)
Total investments 27,194,839 4,460 27,199,299
Securities lending collateral pool 163,955 — 163,955
Total assets 27,593,709 4,460 27,598,169
Total deferred outflows - OPEB 646 — 646
Total assets and deferred outflows 27,594,355 4,460 27,598,815
LiabilitiesAccounts payable and accrued expenses 48,988 291 49,279
Investment purchases and other liabilities 398,069 — 398,069
Obligations under securities lending 163,955 — 163,955
Net OPEB liability 31,221 — 31,221
Total liabilities 642,233 291 642,524
Total deferred inflows - OPEB 15,132 — 15,132
Total liabilities and deferred inflows 657,365 291 657,656
Net position restricted for pensions and held in trust for defined contribution plan participants $26,936,990 $4,169 $26,941,159
See accompanying notes to financial statements.
Commonwealth of Pennsylvania State Employees’ Retirement SystemStatements of Fiduciary Net Position
SERS 2019 Financial Statements | 15
14 | SERS 2019 Comprehensive Annual Financial Report
FINANCIAL SECTIONStatements of Changes in Fiduciary Net Position
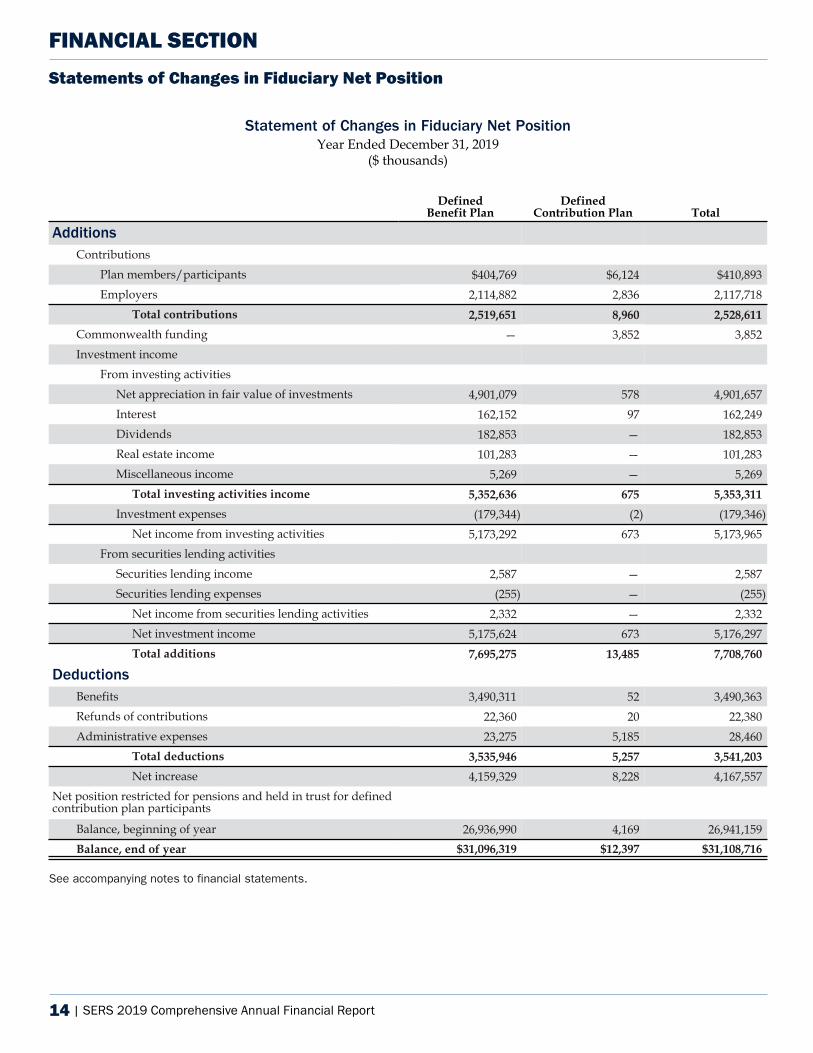
Statement of Changes in Fiduciary Net PositionYear Ended December 31, 2019
($ thousands)
DefinedBenefit Plan
DefinedContribution Plan Total
AdditionsContributions
Plan members/participants $404,769 $6,124 $410,893 Employers 2,114,882 2,836 2,117,718
Total contributions 2,519,651 8,960 2,528,611
Commonwealth funding — 3,852 3,852 Investment income
From investing activitiesNet appreciation in fair value of investments 4,901,079 578 4,901,657 Interest 162,152 97 162,249 Dividends 182,853 — 182,853 Real estate income 101,283 — 101,283 Miscellaneous income 5,269 — 5,269
Total investing activities income 5,352,636 675 5,353,311
Investment expenses (179,344) (2) (179,346) Net income from investing activities 5,173,292 673 5,173,965
From securities lending activitiesSecurities lending income 2,587 — 2,587 Securities lending expenses (255) — (255)
Net income from securities lending activities 2,332 — 2,332 Net investment income 5,175,624 673 5,176,297 Total additions 7,695,275 13,485 7,708,760
DeductionsBenefits 3,490,311 52 3,490,363 Refunds of contributions 22,360 20 22,380 Administrative expenses 23,275 5,185 28,460
Total deductions 3,535,946 5,257 3,541,203
Net increase 4,159,329 8,228 4,167,557 Net position restricted for pensions and held in trust for defined contribution plan participants
Balance, beginning of year 26,936,990 4,169 26,941,159 Balance, end of year $31,096,319 $12,397 $31,108,716
See accompanying notes to financial statements.
Commonwealth of Pennsylvania State Employees’ Retirement SystemStatements of Changes in Fiduciary Net Position
16 | SERS 2019 Financial Statements
SERS 2019 Comprehensive Annual Financial Report | 15
FINANCIAL SECTIONStatements of Changes in Fiduciary Net Position
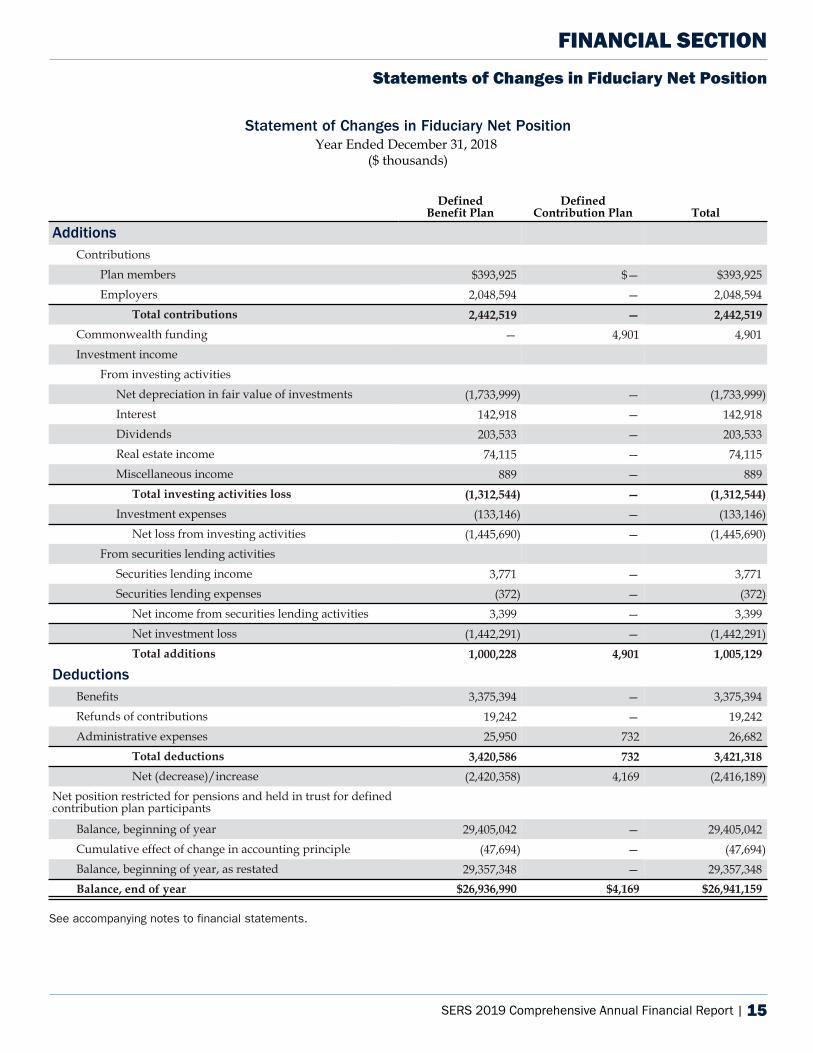
Statement of Changes in Fiduciary Net PositionYear Ended December 31, 2018
($ thousands)
DefinedBenefit Plan
DefinedContribution Plan Total
AdditionsContributions
Plan members $393,925 $— $393,925 Employers 2,048,594 — 2,048,594
Total contributions 2,442,519 — 2,442,519
Commonwealth funding — 4,901 4,901 Investment income
From investing activitiesNet depreciation in fair value of investments (1,733,999) — (1,733,999) Interest 142,918 — 142,918 Dividends 203,533 — 203,533 Real estate income 74,115 — 74,115 Miscellaneous income 889 — 889
Total investing activities loss (1,312,544) — (1,312,544)
Investment expenses (133,146) — (133,146) Net loss from investing activities (1,445,690) — (1,445,690)
From securities lending activitiesSecurities lending income 3,771 — 3,771 Securities lending expenses (372) — (372)
Net income from securities lending activities 3,399 — 3,399 Net investment loss (1,442,291) — (1,442,291) Total additions 1,000,228 4,901 1,005,129
DeductionsBenefits 3,375,394 — 3,375,394 Refunds of contributions 19,242 — 19,242 Administrative expenses 25,950 732 26,682
Total deductions 3,420,586 732 3,421,318
Net (decrease)/increase (2,420,358) 4,169 (2,416,189) Net position restricted for pensions and held in trust for defined contribution plan participants
Balance, beginning of year 29,405,042 — 29,405,042 Cumulative effect of change in accounting principle (47,694) — (47,694) Balance, beginning of year, as restated 29,357,348 — 29,357,348 Balance, end of year $26,936,990 $4,169 $26,941,159
See accompanying notes to financial statements.
Commonwealth of Pennsylvania State Employees’ Retirement SystemStatements of Changes in Fiduciary Net Position
SERS 2019 Financial Statements | 17
16 | SERS 2019 Comprehensive Annual Financial Report
FINANCIAL SECTION
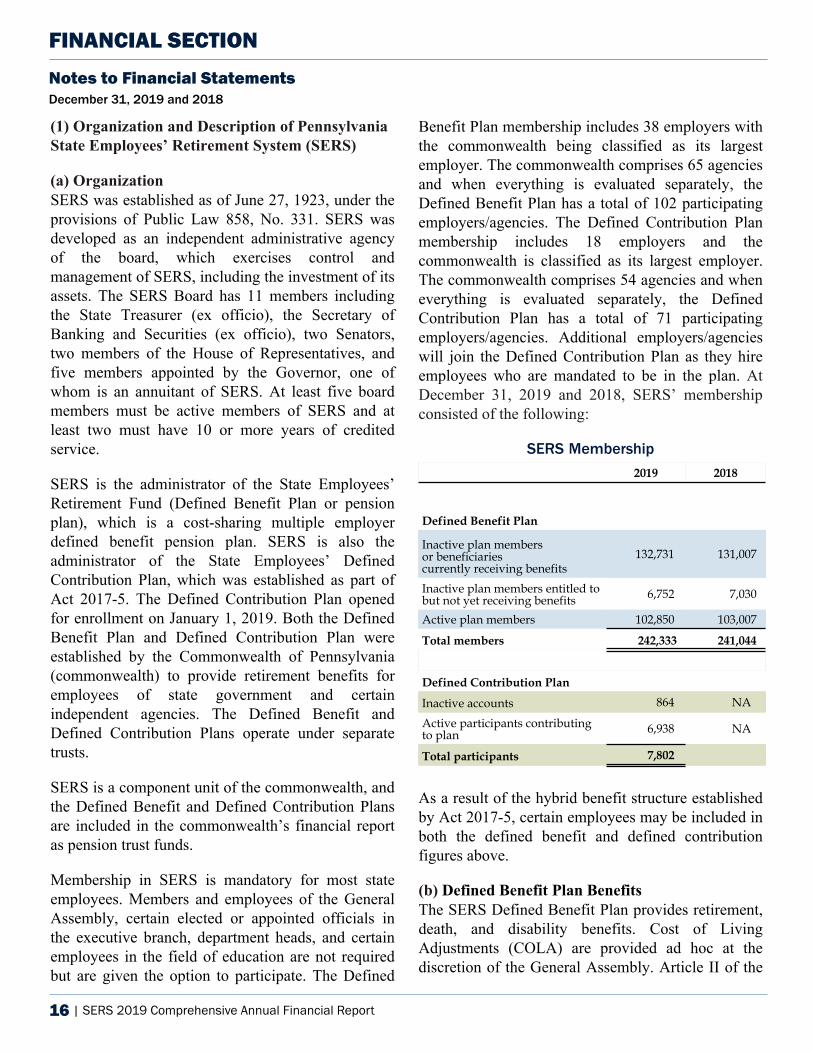
(1) Organization and Description of Pennsylvania State Employees’ Retirement System (SERS)
(a) OrganizationSERS was established as of June 27, 1923, under the provisions of Public Law 858, No. 331. SERS was developed as an independent administrative agency of the board, which exercises control and management of SERS, including the investment of its assets. The SERS Board has 11 members including the State Treasurer (ex officio), the Secretary of Banking and Securities (ex officio), two Senators, two members of the House of Representatives, and five members appointed by the Governor, one of whom is an annuitant of SERS. At least five board members must be active members of SERS and at least two must have 10 or more years of credited service.
SERS is the administrator of the State Employees’ Retirement Fund (Defined Benefit Plan or pension plan), which is a cost-sharing multiple employer defined benefit pension plan. SERS is also the administrator of the State Employees’ Defined Contribution Plan, which was established as part of Act 2017-5. The Defined Contribution Plan opened for enrollment on January 1, 2019. Both the Defined Benefit Plan and Defined Contribution Plan were established by the Commonwealth of Pennsylvania (commonwealth) to provide retirement benefits for employees of state government and certain independent agencies. The Defined Benefit and Defined Contribution Plans operate under separate trusts.
SERS is a component unit of the commonwealth, and the Defined Benefit and Defined Contribution Plans are included in the commonwealth’s financial report as pension trust funds.
Membership in SERS is mandatory for most state employees. Members and employees of the General Assembly, certain elected or appointed officials in the executive branch, department heads, and certain employees in the field of education are not required but are given the option to participate. The Defined
Benefit Plan membership includes 38 employers with the commonwealth being classified as its largest employer. The commonwealth comprises 65 agencies and when everything is evaluated separately, the Defined Benefit Plan has a total of 102 participating employers/agencies. The Defined Contribution Plan membership includes 18 employers and the commonwealth is classified as its largest employer. The commonwealth comprises 54 agencies and when everything is evaluated separately, the Defined Contribution Plan has a total of 71 participating employers/agencies. Additional employers/agencies will join the Defined Contribution Plan as they hire employees who are mandated to be in the plan. At December 31, 2019 and 2018, SERS’ membership consisted of the following:
SERS Membership
2019 2018
Defined Benefit Plan
Inactive plan membersor beneficiariescurrently receiving benefits
132,731 131,007
Inactive plan members entitled to but not yet receiving benefits 6,752 7,030
Active plan members 102,850 103,007
Total members 242,333 241,044
Defined Contribution Plan
Inactive accounts 864 NA
Active participants contributing to plan 6,938 NA
Total participants 7,802
As a result of the hybrid benefit structure established by Act 2017-5, certain employees may be included in both the defined benefit and defined contribution figures above.
(b) Defined Benefit Plan BenefitsThe SERS Defined Benefit Plan provides retirement, death, and disability benefits. Cost of Living Adjustments (COLA) are provided ad hoc at the discretion of the General Assembly. Article II of the
Commonwealth of Pennsylvania State Employees’ Retirement SystemNotes to Financial StatementsDecember 31, 2019 and 2018
18 | SERS 2019 Financial Statements
Notes to Financial Statements December 31, 2019 and 2018
SERS 2019 Comprehensive Annual Financial Report | 17
Notes to Financial Statements December 31, 2019 and 2018
FINANCIAL SECTION
Commonwealth of Pennsylvania’s Constitution assigns the authority to establish and amend the benefit provisions of the pension plan to the General Assembly. Member retirement benefits are determined by taking years of credited service multiplied by the final average salary multiplied by the annual accrual rate.
Most employees who entered SERS membership prior to January 1, 2011, and who retire at age 60 with three years of service, or at any age with 35 years of service, are entitled to a full retirement benefit. Members of the General Assembly and certain employees classified in hazardous duty positions can retire with full benefits at age 50, with at least three years of service. Act 2010-120 preserved all benefits in place for members but mandated a number of benefit reductions for new members effective January 1, 2011, through December 31, 2018. The Act created a class of service in which members earn a benefit that accrues at 2% of the member’s final average salary instead of 2.5% each year and vests in 10 years instead of five. The full retirement age is 65 for most employees who entered SERS membership after January 1, 2011, and age 55 for members of the General Assembly and certain employees classified in hazardous duty positions. Act 2017-5 changed the benefit structure for most new employees effective January 1, 2019, which created two hybrid plan options as well as a defined contribution-only plan option. The two hybrid plan options contain a Defined Benefit Plan component with a full retirement age of 67 that accrues at 1.25% or 1% of the member’s final average salary.
Most members of SERS, and all state employees hired after June 30, 2001, and prior to January 1, 2011 (except state police officers and certain members of the judiciary and legislators), are Class AA members. Each class of benefits is based on a multiple of the base accrual rate of 2%, which is called the multiplier. The multiplier for Class AA is 1.25, which translates into an annual benefit of 2.5% of the member’s highest three-year average salary multiplied by years of service and became effective
for members July 1, 2001. The general annual benefit for Class A members is 2% of the member’s highest three-year average salary multiplied by years of service.
State police are entitled to a benefit equal to a percentage of their highest annual salary, excluding their year of retirement. The benefit is 75% of salary for 25 or more years of service and 50% of salary for 20–24.99 years of service. Judges are entitled to a benefit of 4% of final average salary for each of the first 10 years of service and 3% for subsequent years. Magisterial District Judges are entitled to a benefit of 3% of final average salary for each year of service. Legislators taking office before December 1, 2010, are Class D-4. The multiplier for Class D-4 is 1.5, which translates into an annual benefit of 3% of the final average salary for each year of service.
Act 2010-120 created an A-3 class of service and an optional A-4 class for most employees who enter SERS membership for the first time on or after January 1, 2011, and December 1, 2010, for legislators newly elected in November 2010, through December 31, 2018. On or after January 1, 2019, class A-3 is only offered to hazardous duty employees. Employees who enter SERS membership under Act 2010-120 enter as members of the A-3 class with a 45-day window to elect membership in the optional A-4 class. The general annual benefit for Class A-3 members is 2% of the member’s highest three-year average salary multiplied by years of service, while the Class A-4 benefit accrual rate is 2.5%.
Act 2017-5 created a new A-5 hybrid class of service with optional hybrid A-6 class and straight defined contribution-only plan options for state employees (excluding most hazardous duty employees), who first enter SERS membership on or after January 1, 2019. Employees who enter SERS membership under Act 2017-5 enter as members of the A-5 class with a 45-day window to elect membership in the optional A-6 class or straight Defined Contribution Plan. The general annual benefit for Class A-5 members is 1.25% of an average of the highest five calendar
Commonwealth of Pennsylvania State Employees’ Retirement SystemNotes to Financial Statements
December 31, 2019 and 2018
SERS 2019 Financial Statements | 19
18 | SERS 2019 Comprehensive Annual Financial Report
Notes to Financial Statements December 31, 2019 and 2018
FINANCIAL SECTION
years of the member’s salary multiplied by years of service, while the Class A-6 benefit accrual rate is 1%. Those members choosing the straight Defined Contribution Plan do not have a benefit accrual rate and retire with their contributions, employer contributions if vested, and any investment gains on those contributions.
According to the State Employees’ Retirement Code (retirement code), all obligations of SERS will be assumed by the commonwealth should SERS terminate.
(c) Defined Benefit Plan ContributionsSERS retirement code (71 Pa. C.S.) requires that all SERS participating employers make contributions to the pension plan on behalf of all active members and annuitants necessary to fund the liabilities and provide the annuity reserves required to pay benefits. The SERS Defined Benefit Plan funding policy, as set by the board, provides for periodic active member contributions at statutory rates. The Defined Benefit Plan funding policy also provides for periodic employer contributions at actuarially determined rates based on the Defined Benefit Plan funding valuation, expressed as a percentage of annual retirement covered payroll, such that they, along with employee contributions and an actuarially determined rate of investment return, are adequate to accumulate assets to pay benefits when due. In fiscal year (FY) 2017-18, the commonwealth paid the full actuarially required rate after being collared in previous years due to Act 2010-120. At December 31, 2019 and 2018, the actuarially determined rate was 33.59% and 32.93%, respectively. Act 2017-5 includes a savings “plow-back” provision requiring that the annual savings achieved through SERS’ benefit changes flow back into the Defined Benefit Plan through the employer contribution rate rather than to other non-pension obligations.
Employer rates are computed based on SERS’ fiscal year end of December 31 and applied to the commonwealth based on its fiscal year end of June 30; therefore, the employer contribution rates, in effect for SERS’ full year ended December 31, reflect
a blended average of calculated rates. As of December 31, 2019 and 2018, the blended contribution rates were 33.26% and 33.09%, respectively.
The general membership contribution rate for all Class A and Class AA members is 5% and 6.25% of salary, respectively. The general membership contribution rate under Act 2010-120 for A-3 and A-4 members is 6.25% and 9.3% of salary, respectively. The general membership contribution rate under Act 2017-5 for A-5 and A-6 members is 5% and 4% of salary, respectively. The contribution rate for Class D-4 Members of the General Assembly is 7.5%. Judges and Magisterial District Judges have the option of electing special membership classes requiring a contribution of 10% and 7.5%, respectively. All Defined Benefit Plan employee contributions are recorded in individually identified accounts that are credited with interest, calculated at 4% per annum, as mandated by statute. Accumulated employee contributions and credited interest vest immediately and are returned to the employee upon termination of service if the employee is not eligible for other benefits or elects to waive their benefits.
(d) Defined Contribution PlanThe SERS retirement code requires that all SERS participating employers make contributions to the Defined Contribution Plan on behalf of all active participants. SERS’ funding policy, as set by the SERS Board, provides for periodic employer and active participant contributions at statutory rates.
Participants in the A-5 class, A-6 class, and defined contribution-only plan option contribute 3.25%, 3.5%, and 7.5% to the plan, respectively. Participants may also make additional voluntary contributions to the plan. Employers contribute 2.25%, 2.00%, and 3.50% for participants in the A-5 class, A-6 class, and defined contribution-only plan option, respectively. Employers are not required to match participant voluntary contributions to the plan. Participants are also permitted to transfer or roll over monies into the plan from other qualified plans.
Commonwealth of Pennsylvania State Employees’ Retirement SystemNotes to Financial StatementsDecember 31, 2019 and 2018
20 | SERS 2019 Financial Statements
SERS 2019 Comprehensive Annual Financial Report | 19
FINANCIAL SECTIONNotes to Financial Statements
December 31, 2019 and 2018
While participant contributions are immediately vested, the employer contributions are not vested until a participant earns three eligibility points. Eligibility points are generally credited based on hours worked in a calendar year.
If a participant terminates employment before earning three eligibility points, any unvested employer contributions are returned to the employees’ most recent employer to be used to offset future employer contributions to the plan. These monies are kept in employer-level forfeiture accounts with the third-party administrator (TPA). During the year ended Dec. 31, 2019, employer contributions were reduced by $30,000. There were $210,000 in forfeitures available for future use as of the end of the year.
Each participant in the Defined Contribution Plan holds an individual account with the plan’s TPA. The TPA is paid a fee for administering the plan. This fee, and other administrative fees incurred by the plan are currently being paid by the commonwealth.
Participant accounts are credited with the participant’s contributions as well as their employer’s contributions and are adjusted for the investment earnings and investment management expenses associated with the investment options chosen by the participant. Participants can choose to invest their money in any of several investment options including a range of target date funds, equity funds, fixed income funds, a short-term investment fund, and a self-directed brokerage option. The benefit to which a participant is entitled to is their vested account balance at termination. Distribution of benefits can be made in installments, lump sum payments, or through an annuity. Participants are also permitted to transfer or roll over monies out of the plan into other qualified plans.
(2) Summary of Significant Accounting Policies
(a) Basis of AccountingSERS’ financial statements are prepared using the accrual basis of accounting and economic resources measurement focus. Plan member contributions are recognized in the period in which the contributions are due. Employer contributions are recognized when due and the employer has a legal requirement to provide the contributions. Benefits, disbursements, and refunds are recognized when due and payable in accordance with the terms of the plans. Investment purchases and sales are recorded on a trade-date basis.
(b) Use of EstimatesManagement of SERS has made certain estimates and assumptions relating to the reporting of assets and liabilities, and the disclosure of contingent assets and liabilities to prepare these financial statements in conformity with U.S. generally accepted accounting principles. Actual results could differ from those estimates.
(c) Valuation of InvestmentsSERS investments are reported at fair value. Fair value is the price that would be received to sell an asset or paid to transfer a liability in an orderly transaction between market participants at the measurement date. U.S. government securities and corporate and foreign bonds and notes are valued based on matrix pricing. Commingled public equity funds and common and preferred stocks are generally valued based on published market prices and quotations at the close of business from national security exchanges and securities pricing services. Private equity, real estate, hedge funds, target date funds, and commingled fixed income funds are reported at fair value as estimated and reported by general partners, based upon the underlying net asset value (NAV) of the fund or partnership as a practical expedient of fair value. Adjustments are required when SERS expects to sell the investment at a value other than NAV.
Commonwealth of Pennsylvania State Employees’ Retirement SystemNotes to Financial Statements
December 31, 2019 and 2018
SERS 2019 Financial Statements | 21
20 | SERS 2019 Comprehensive Annual Financial Report
FINANCIAL SECTIONNotes to Financial Statements December 31, 2019 and 2018
The investments in short-term investment funds, including those managed by the treasurer of the commonwealth, are reported at cost plus allocated interest, which approximates fair value. The securities lending collateral pool, which is a fund operated by the securities lending agent is also accounted for at cost plus accrued interest, which approximates fair value.
Unsettled investment sales are reported as investment proceeds receivable and unsettled investment purchases are reported as investment purchases payable. Investment expenses consist of investment managers’ fees and those expenses directly related to SERS investment operations.
(d) CommitmentsAs of December 31, 2019 and 2018, SERS’ Defined Benefit Plan had contractual commitments totaling approximately $4.8 billion and $3.6 billion, respectively, to fund future private equity and real estate investments over the next several years.
(e) Federal Income TaxesThe Internal Revenue Service (IRS) issued a favorable tax determination letter on May 19, 2017, qualifying the Defined Benefit Plan as a Governmental Plan under the Internal Revenue Code (IRC). Therefore, SERS is exempt from federal income taxes.
(f) Risk ManagementSERS is exposed to various liabilities and risks of loss related to theft or destruction of assets, injuries to employees, and court challenges to fiduciary decisions. SERS is accorded sovereign immunity as an administrative agency of the commonwealth. SERS participates in certain commonwealth pooled insurance programs and requires asset managers to carry certain insurance coverage. SERS is self-insured for fiduciary, director, and officer liability. During the past three fiscal years, SERS insurance settlements did not exceed insurance coverage.
(g) Interfund TransactionsInterfund transfers of assets take place on a regular basis between the Defined Benefit Plan and Defined Contribution Plan. Interfund activity is used to properly align expenses with each plan.
(h) Adopted Accounting PronouncementsSERS implemented the requirements of Governmental Accounting Standards Board (GASB) Statement No. 75, Accounting and Financial Reporting for Postemployment Benefits Other Than Pensions (OPEB) (GASB 75). GASB 75 replaces GASB 45, Accounting and Financial Reporting by Employers for Postemployment Benefits Other Than Pensions, as amended, and GASB 57, OPEB Measurements by Agent Employers and Agent Multiple-Employer Plans, for OPEB. GASB specifies the required approach to measuring the OPEB liability for employers for benefits provided through the commonwealth Retired Employees Health Program (REHP). This required SERS to record its proportionate share of net OPEB liability, as of a determined date, and restate its net position restricted for pensions as of January 1, 2018. Please see note 7 for further information.
(3) Legally Required ReservesThe retirement code requires the maintenance of the following reserve accounts representing the net position held for future and current benefit payments.
The Members’ Savings Account accumulates contributions and interest earnings of active employees. Member balances are transferred to the Annuity Reserve Accounts as members retire.
The State Accumulation Account accumulates contributions of the employer and the net earnings of the pension plan. Funds are transferred to the Annuity Reserve Accounts as members retire. The amount transferred is actuarially determined. Negative balances represent the amounts transferred to other reserve account balances in excess of accumulated employer contributions and net earnings.
Commonwealth of Pennsylvania State Employees’ Retirement SystemNotes to Financial StatementsDecember 31, 2019 and 2018
22 | SERS 2019 Financial Statements
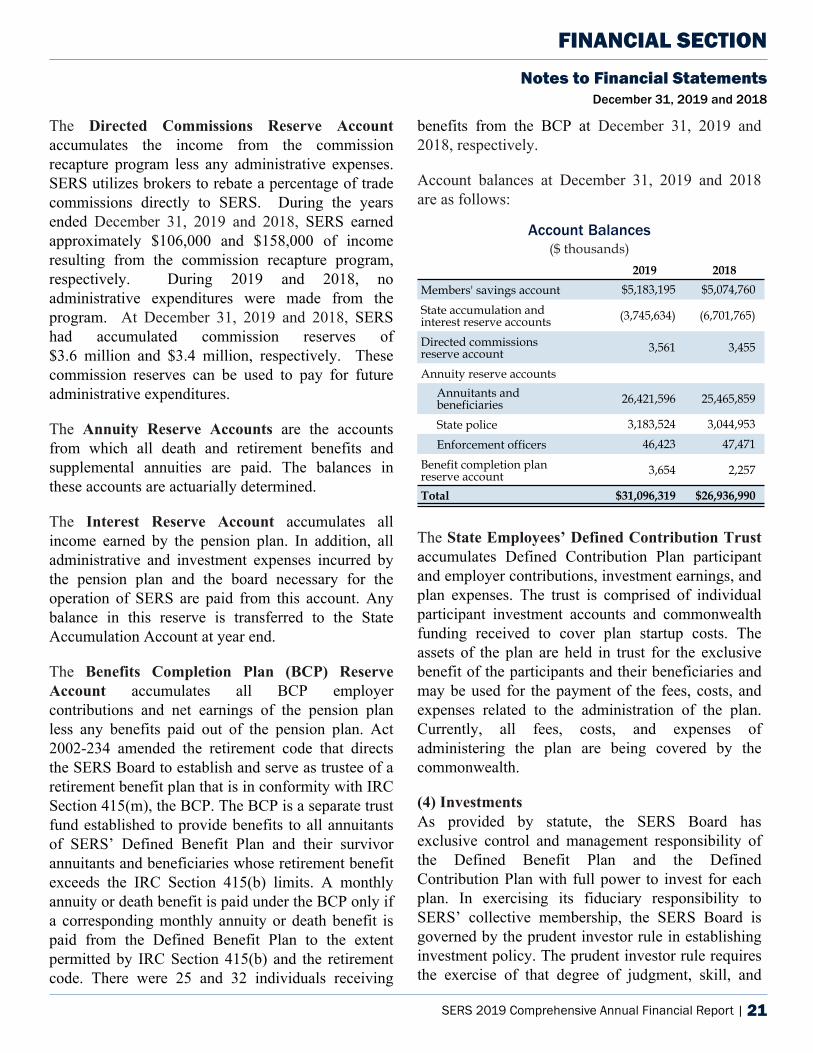
SERS 2019 Comprehensive Annual Financial Report | 21
FINANCIAL SECTIONNotes to Financial Statements
December 31, 2019 and 2018
The Directed Commissions Reserve Account accumulates the income from the commission recapture program less any administrative expenses. SERS utilizes brokers to rebate a percentage of trade commissions directly to SERS. During the years ended December 31, 2019 and 2018, SERS earned approximately $106,000 and $158,000 of income resulting from the commission recapture program, respectively. During 2019 and 2018, no administrative expenditures were made from the program. At December 31, 2019 and 2018, SERS had accumulated commission reserves of $3.6 million and $3.4 million, respectively. These commission reserves can be used to pay for future administrative expenditures.
The Annuity Reserve Accounts are the accounts from which all death and retirement benefits and supplemental annuities are paid. The balances in these accounts are actuarially determined.
The Interest Reserve Account accumulates all income earned by the pension plan. In addition, all administrative and investment expenses incurred by the pension plan and the board necessary for the operation of SERS are paid from this account. Any balance in this reserve is transferred to the State Accumulation Account at year end.
The Benefits Completion Plan (BCP) Reserve Account accumulates all BCP employer contributions and net earnings of the pension plan less any benefits paid out of the pension plan. Act 2002-234 amended the retirement code that directs the SERS Board to establish and serve as trustee of a retirement benefit plan that is in conformity with IRC Section 415(m), the BCP. The BCP is a separate trust fund established to provide benefits to all annuitants of SERS’ Defined Benefit Plan and their survivor annuitants and beneficiaries whose retirement benefit exceeds the IRC Section 415(b) limits. A monthly annuity or death benefit is paid under the BCP only if a corresponding monthly annuity or death benefit is paid from the Defined Benefit Plan to the extent permitted by IRC Section 415(b) and the retirement code. There were 25 and 32 individuals receiving
benefits from the BCP at December 31, 2019 and 2018, respectively.
Account balances at December 31, 2019 and 2018 are as follows:
Account Balances($ thousands)
2019 2018
Members' savings account $5,183,195 $5,074,760
State accumulation andinterest reserve accounts (3,745,634) (6,701,765)
Directed commissionsreserve account 3,561 3,455
Annuity reserve accountsAnnuitants andbeneficiaries 26,421,596 25,465,859
State police 3,183,524 3,044,953
Enforcement officers 46,423 47,471
Benefit completion planreserve account 3,654 2,257
Total $31,096,319 $26,936,990
The State Employees’ Defined Contribution Trust accumulates Defined Contribution Plan participant and employer contributions, investment earnings, and plan expenses. The trust is comprised of individual participant investment accounts and commonwealth funding received to cover plan startup costs. The assets of the plan are held in trust for the exclusive benefit of the participants and their beneficiaries and may be used for the payment of the fees, costs, and expenses related to the administration of the plan. Currently, all fees, costs, and expenses of administering the plan are being covered by the commonwealth.
(4) InvestmentsAs provided by statute, the SERS Board has exclusive control and management responsibility of the Defined Benefit Plan and the Defined Contribution Plan with full power to invest for each plan. In exercising its fiduciary responsibility to SERS’ collective membership, the SERS Board is governed by the prudent investor rule in establishing investment policy. The prudent investor rule requires the exercise of that degree of judgment, skill, and
Commonwealth of Pennsylvania State Employees’ Retirement SystemNotes to Financial Statements
December 31, 2019 and 2018
SERS 2019 Financial Statements | 23
22 | SERS 2019 Comprehensive Annual Financial Report
FINANCIAL SECTIONNotes to Financial Statements December 31, 2019 and 2018
care under the circumstances then prevailing which investors of prudence, discretion, and intelligence, who are familiar with such matters, exercise in the management of their own affairs, not in regard to speculation, but in regard to permanent disposition of the funds, considering the probable income to be derived there from, as well as the probable safety of their capital. The SERS Board has adopted SERS’ Defined Benefit Plan Investment Policy Statement and the 401(a) Defined Contribution Plan Statement of Investment Policy to formally document investment objectives and responsibilities. These policies, as well as applicable state law, establishes guidelines for permissible investments of SERS.
Fair Value HierarchyThe fair value hierarchy is broken down into three levels based on inputs that market participants would use in valuing assets and liabilities derived from market data as follows:
• Level 1 inputs: are quoted prices in active markets for identical assets or liabilities.
• Level 2 inputs: are quoted prices for similar assets or liabilities in active markets, quoted prices for identical or similar assets or liabilities in markets that are not active, or other than quoted prices that are observable.
• Level 3 inputs: are unobservable inputs used to measure fair value if relevant observable inputs are not available for the asset or liability at the reporting date.
Common and preferred stocks, commingled public equity funds, real estate securities, and foreign exchange contracts are valued using prices quoted in active markets for those securities and are categorized as Level 1. They are marked to market daily with changes in fair value recognized as part of investments and investment income. Fixed income securities are valued using a matrix pricing technique and are categorized as Level 2. Matrix pricing is used to value securities based on the securities’ relationship to benchmark quoted prices and recently printed security specific trading levels. Value add/opportunistic separately managed accounts (SMA) in real estate and other securities classified in Level 3 reflect prices, which may use several unobservable inputs using assumptions based on market methodologies to determine the fair value of investments.
Derivative instruments, which include foreign exchange contracts, interest rate swaps, credit default swaps, and futures, are included in other investments in the fair value tables.
Commonwealth of Pennsylvania State Employees’ Retirement SystemNotes to Financial StatementsDecember 31, 2019 and 2018
24 | SERS 2019 Financial Statements
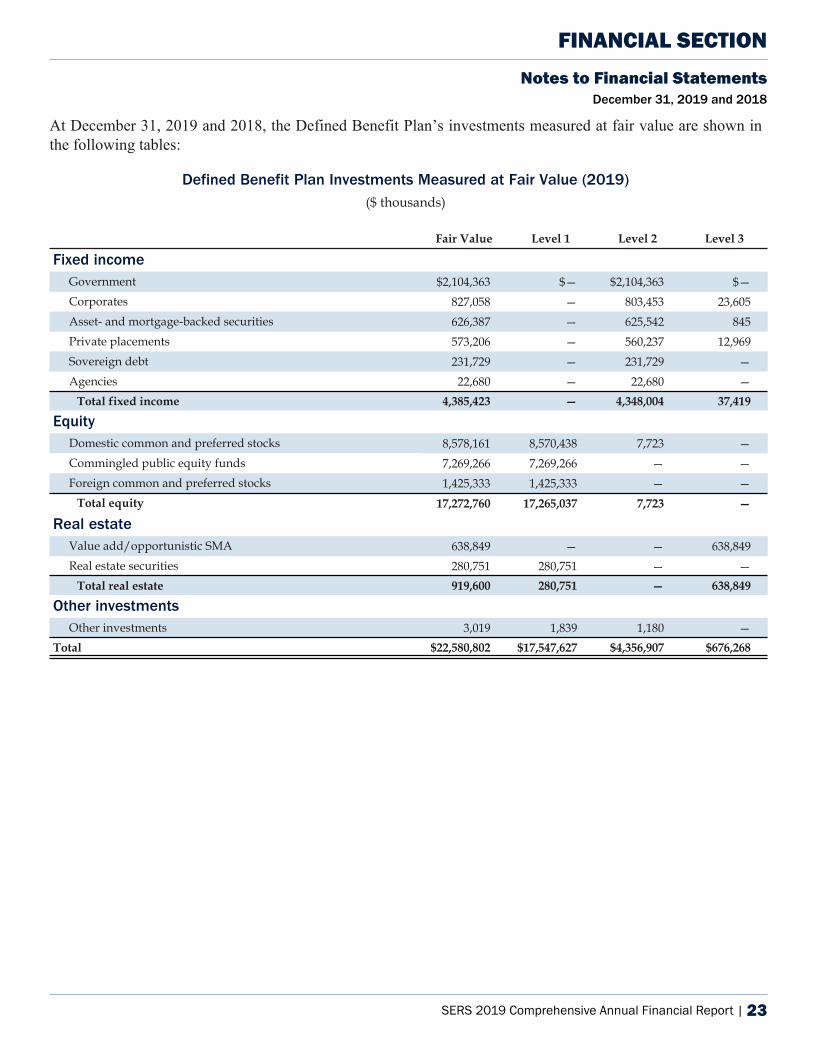
SERS 2019 Comprehensive Annual Financial Report | 23
FINANCIAL SECTIONNotes to Financial Statements
December 31, 2019 and 2018
At December 31, 2019 and 2018, the Defined Benefit Plan’s investments measured at fair value are shown in the following tables:
Defined Benefit Plan Investments Measured at Fair Value (2019)($ thousands)
Fair Value Level 1 Level 2 Level 3
Fixed incomeGovernment $2,104,363 $— $2,104,363 $— Corporates 827,058 — 803,453 23,605 Asset- and mortgage-backed securities 626,387 — 625,542 845 Private placements 573,206 — 560,237 12,969 Sovereign debt 231,729 — 231,729 — Agencies 22,680 — 22,680 —
Total fixed income 4,385,423 — 4,348,004 37,419
EquityDomestic common and preferred stocks 8,578,161 8,570,438 7,723 — Commingled public equity funds 7,269,266 7,269,266 — — Foreign common and preferred stocks 1,425,333 1,425,333 — —
Total equity 17,272,760 17,265,037 7,723 —
Real estateValue add/opportunistic SMA 638,849 — — 638,849 Real estate securities 280,751 280,751 — —
Total real estate 919,600 280,751 — 638,849
Other investmentsOther investments 3,019 1,839 1,180 —
Total $22,580,802 $17,547,627 $4,356,907 $676,268
Commonwealth of Pennsylvania State Employees’ Retirement SystemNotes to Financial Statements
December 31, 2019 and 2018
SERS 2019 Financial Statements | 25
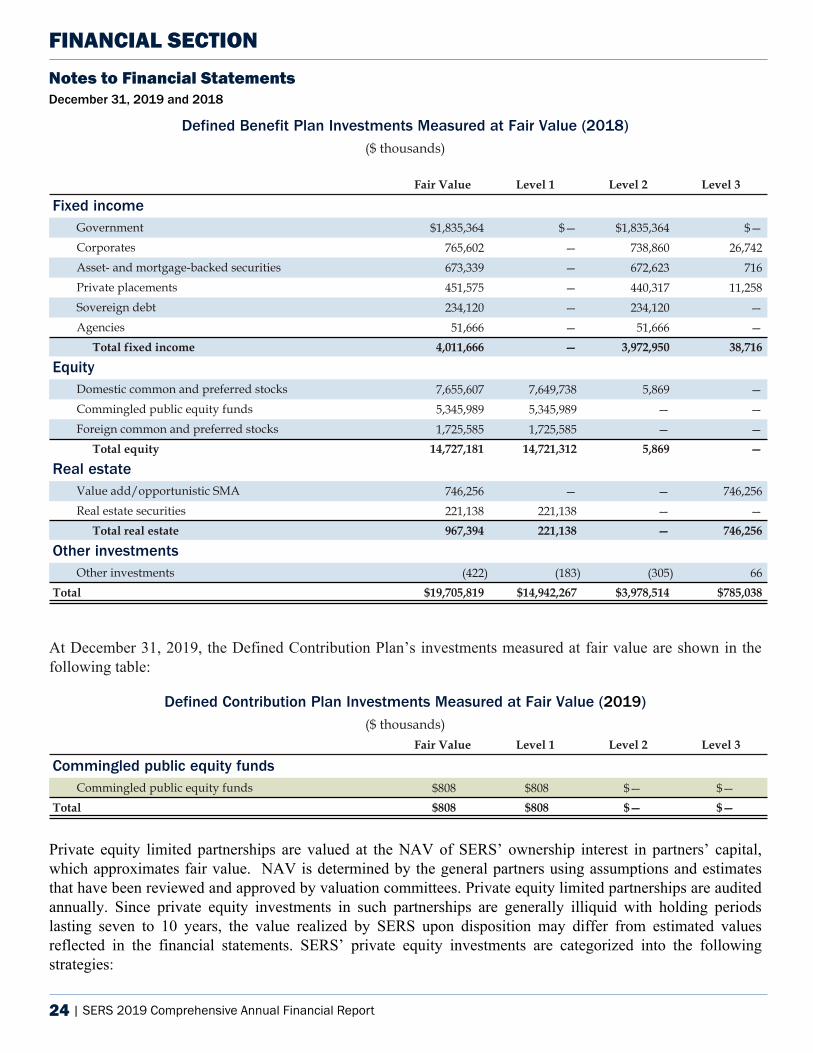
24 | SERS 2019 Comprehensive Annual Financial Report
FINANCIAL SECTIONNotes to Financial Statements December 31, 2019 and 2018
Defined Benefit Plan Investments Measured at Fair Value (2018)($ thousands)
Fair Value Level 1 Level 2 Level 3
Fixed incomeGovernment $1,835,364 $— $1,835,364 $— Corporates 765,602 — 738,860 26,742 Asset- and mortgage-backed securities 673,339 — 672,623 716 Private placements 451,575 — 440,317 11,258 Sovereign debt 234,120 — 234,120 — Agencies 51,666 — 51,666 —
Total fixed income 4,011,666 — 3,972,950 38,716
EquityDomestic common and preferred stocks 7,655,607 7,649,738 5,869 — Commingled public equity funds 5,345,989 5,345,989 — — Foreign common and preferred stocks 1,725,585 1,725,585 — —
Total equity 14,727,181 14,721,312 5,869 —
Real estateValue add/opportunistic SMA 746,256 — — 746,256 Real estate securities 221,138 221,138 — —
Total real estate 967,394 221,138 — 746,256
Other investmentsOther investments (422) (183) (305) 66
Total $19,705,819 $14,942,267 $3,978,514 $785,038
At December 31, 2019, the Defined Contribution Plan’s investments measured at fair value are shown in the following table:
Defined Contribution Plan Investments Measured at Fair Value (2019)($ thousands)
Fair Value Level 1 Level 2 Level 3
Commingled public equity fundsCommingled public equity funds $808 $808 $— $—
Total $808 $808 $— $—
Private equity limited partnerships are valued at the NAV of SERS’ ownership interest in partners’ capital, which approximates fair value. NAV is determined by the general partners using assumptions and estimates that have been reviewed and approved by valuation committees. Private equity limited partnerships are audited annually. Since private equity investments in such partnerships are generally illiquid with holding periods lasting seven to 10 years, the value realized by SERS upon disposition may differ from estimated values reflected in the financial statements. SERS’ private equity investments are categorized into the following strategies:
Commonwealth of Pennsylvania State Employees’ Retirement SystemNotes to Financial StatementsDecember 31, 2019 and 2018
26 | SERS 2019 Financial Statements
SERS 2019 Comprehensive Annual Financial Report | 25
FINANCIAL SECTIONNotes to Financial Statements
December 31, 2019 and 2018
• Buyouts is characterized chiefly by investments in established private or publicly listed firms that are undergoing a fundamental change in operations or strategy.
• Venture Capital is characterized chiefly by high-risk investments in new or young companies following a growth path (early, late, and balanced stage funds) in technology and other value-added sectors.
• Special Situations is characterized chiefly by investments in funds that acquire distressed companies or companies in need of restructuring, funds from the secondary market, and funds providing mezzanine financing.
• Legacy Private Equity is characterized chiefly by consolidating legacy assets from various Private Equity core sub asset-classes (Buyouts, Venture Capital, Special Situations) that are being managed by a third-party administrator which provides day-to-day oversight of operations.
• Private Credit Funds is characterized chiefly by closed-end (drawdown) limited partnership structures with liquidity events in five years or more, which may include investment strategies such as direct lending, specialty lending, mezzanine, and distressed investing.
Real estate limited partnerships are valued at the NAV of SERS’ ownership percentage in partners’ capital. The investment managers use third-party appraisals based on discounted cash flows, recent comparable sales, and current market conditions to arrive at NAV. For SERS’ Value Add/Opportunistic Funds and Core/Core Plus, NAV is updated by independent appraisals typically at least every three years by appraisers who meet specific professional qualifications. The appraisal process involves significant judgment and estimating; thus, the value upon sale of an asset may differ from its appraised value.
Any assumptions and estimates used in developing the NAV have been reviewed and approved by valuation committees. Because the investments in such partnerships are generally illiquid with holding periods lasting seven to 10 years, the value realized by SERS upon disposition may differ materially from estimated values reflected in the financial statements. The following portions of SERS’ real estate investments are valued at NAV:
• Core/Core Plus are a long-term investment in high-quality real estate that generates returns primarily from stable income producing properties. These are open-end funds.
• Value Add/Opportunistic Funds utilize greater leverage and development strategies relative to core strategies, thereby taking higher risks but demand higher returns. Returns are primarily generated from capital appreciation from opportunistic investments. Strategies for this category of investing can include niche opportunities that are typically not available in core-style investing. These are closed-end funds.
• Natural Resources/Infrastructure differ from real estate in that they focus on other real assets other than real estate but maintain the characteristics of collateralization by hard assets and income-producing potential.
Hedge funds are valued on a monthly basis by general partners based on information provided by underlying hedge fund investments (if a fund-of-hedge fund structure), third-party administrators, and brokers. Hedge fund investments in limited partnerships are valued using NAV of units held at the end of the period based on the fair value of underlying investments.
Commonwealth of Pennsylvania State Employees’ Retirement SystemNotes to Financial Statements
December 31, 2019 and 2018
SERS 2019 Financial Statements | 27
26 | SERS 2019 Comprehensive Annual Financial Report
FINANCIAL SECTIONNotes to Financial Statements December 31, 2019 and 2018
Hedge fund investments are categorized into the following specific strategies:
• Credit-Focused Strategies are investments that include directional and relative value investments through various structures, excluding closed-end funds, that may include debt securities, credit derivatives and related instruments, and/or multi-sector fixed income funds.
• Funds-of-Hedge Funds were investments in funds with investment managers who invest in hedge funds. Funds-of-Hedge Funds provided an additional layer of fiduciary oversight (investment, legal, compliance, and monitoring) with similar all-in fees as direct investments in hedge funds. SERS was the only limited partner and was able to make larger allocations, which lowered fees and improved liquidity terms. The assets are to be sold in an orderly fashion as market conditions dictate.
• Direct Investments were investments where SERS and other institutional investors pool their funds with a manager tasked with incorporating hedge strategies. The assets are to be sold in an orderly fashion as market conditions dictate.
• Absolute Return Strategies were investments intended to produce uncorrelated diversified return streams in the portfolio to help preserve and enhance the real value of the pension fund over long periods of time. The assets are to be sold in an orderly fashion as market conditions dictate.
Commingled fixed income funds are pooled investments in multiple debt-type securities, which are valued at NAV. Target date funds invest over multiple asset types at varying allocation percentages based on planned maturity of the fund. The NAV for commingled fixed income funds and target date funds is calculated using the closing price of the underlying investments, with the total value of the fund being apportioned to SERS based on units of ownership.
Commonwealth of Pennsylvania State Employees’ Retirement SystemNotes to Financial StatementsDecember 31, 2019 and 2018
28 | SERS 2019 Financial Statements
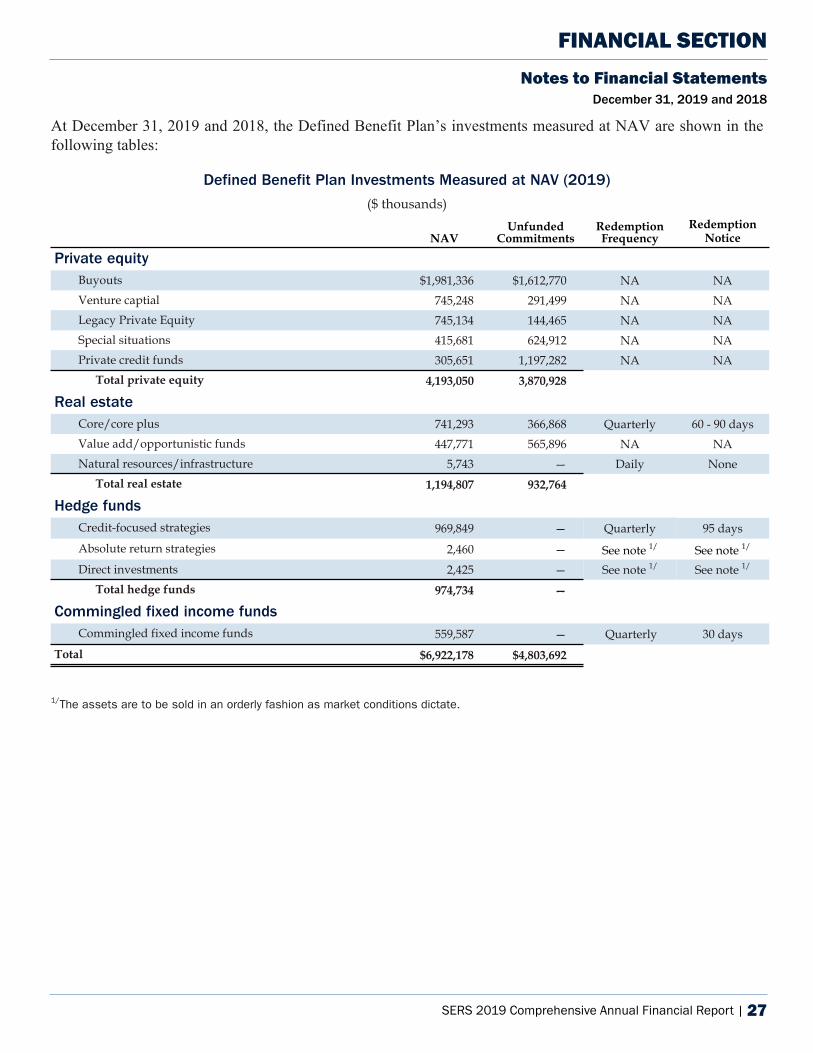
SERS 2019 Comprehensive Annual Financial Report | 27
FINANCIAL SECTIONNotes to Financial Statements
December 31, 2019 and 2018
At December 31, 2019 and 2018, the Defined Benefit Plan’s investments measured at NAV are shown in the following tables:
Defined Benefit Plan Investments Measured at NAV (2019)
($ thousands)
NAVUnfunded
Commitments RedemptionFrequency
RedemptionNoticePeriodPrivate equity
Buyouts $1,981,336 $1,612,770 NA NAVenture captial 745,248 291,499 NA NALegacy Private Equity 745,134 144,465 NA NASpecial situations 415,681 624,912 NA NAPrivate credit funds 305,651 1,197,282 NA NA
Total private equity 4,193,050 3,870,928
Real estateCore/core plus 741,293 366,868 Quarterly 60 - 90 daysValue add/opportunistic funds 447,771 565,896 NA NANatural resources/infrastructure 5,743 — Daily None
Total real estate 1,194,807 932,764
Hedge fundsCredit-focused strategies 969,849 — Quarterly 95 daysAbsolute return strategies 2,460 — See note 1/ See note 1/
Direct investments 2,425 — See note 1/ See note 1/
Total hedge funds 974,734 —
Commingled fixed income fundsCommingled fixed income funds 559,587 — Quarterly 30 days
Total $6,922,178 $4,803,692
1/The assets are to be sold in an orderly fashion as market conditions dictate.
Commonwealth of Pennsylvania State Employees’ Retirement SystemNotes to Financial Statements
December 31, 2019 and 2018
SERS 2019 Financial Statements | 29
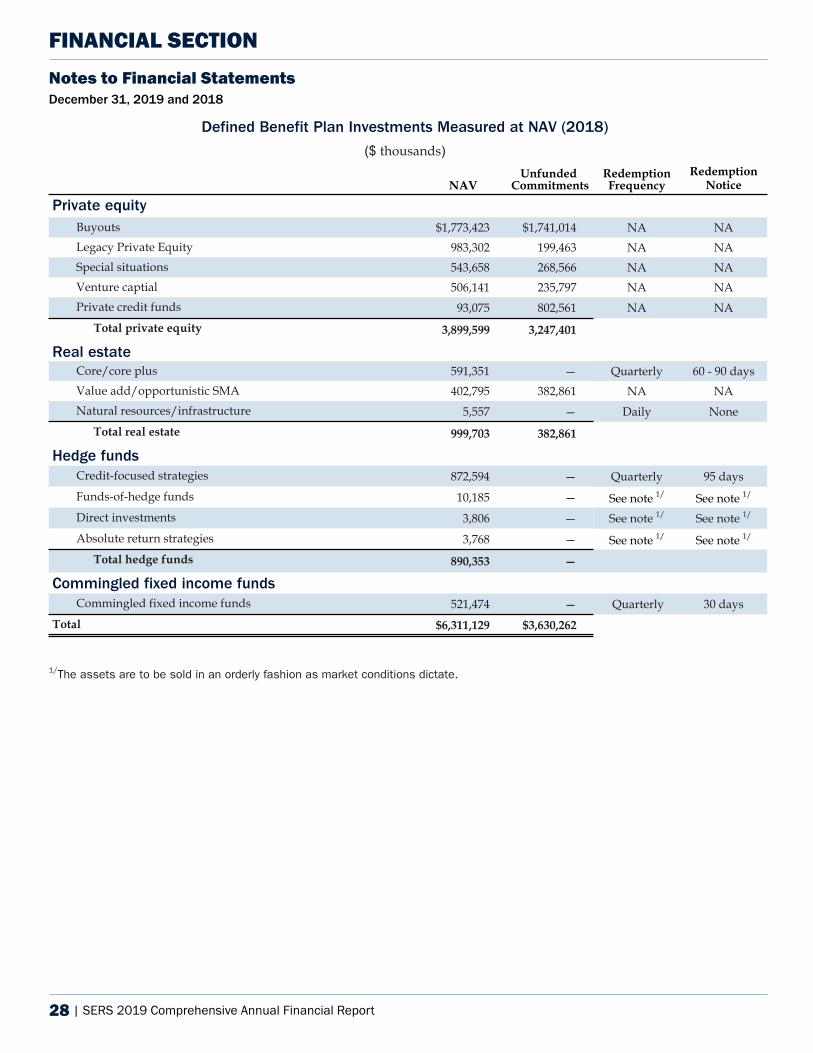
28 | SERS 2019 Comprehensive Annual Financial Report
FINANCIAL SECTIONNotes to Financial Statements December 31, 2019 and 2018
Defined Benefit Plan Investments Measured at NAV (2018)
($ thousands)
NAVUnfunded
CommitmentsRedemptionFrequency
RedemptionNoticePeriodPrivate equity
Buyouts $1,773,423 $1,741,014 NA NALegacy Private Equity 983,302 199,463 NA NASpecial situations 543,658 268,566 NA NAVenture captial 506,141 235,797 NA NAPrivate credit funds 93,075 802,561 NA NA
Total private equity 3,899,599 3,247,401
Real estateCore/core plus 591,351 — Quarterly 60 - 90 daysValue add/opportunistic SMA 402,795 382,861 NA NANatural resources/infrastructure 5,557 — Daily None
Total real estate 999,703 382,861
Hedge fundsCredit-focused strategies 872,594 — Quarterly 95 daysFunds-of-hedge funds 10,185 — See note 1/ See note 1/
Direct investments 3,806 — See note 1/ See note 1/
Absolute return strategies 3,768 — See note 1/ See note 1/
Total hedge funds 890,353 —
Commingled fixed income fundsCommingled fixed income funds 521,474 — Quarterly 30 days
Total $6,311,129 $3,630,262
1/The assets are to be sold in an orderly fashion as market conditions dictate.
Commonwealth of Pennsylvania State Employees’ Retirement SystemNotes to Financial StatementsDecember 31, 2019 and 2018
30 | SERS 2019 Financial Statements
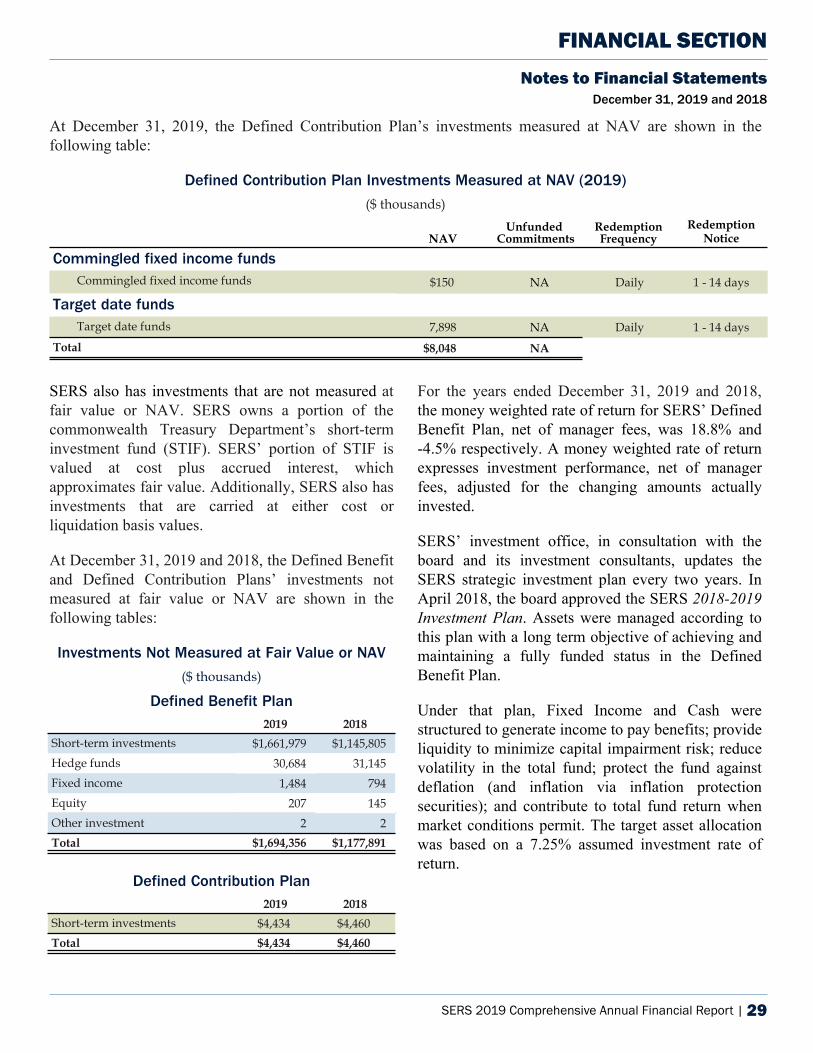
SERS 2019 Comprehensive Annual Financial Report | 29
FINANCIAL SECTIONNotes to Financial Statements
December 31, 2019 and 2018
At December 31, 2019, the Defined Contribution Plan’s investments measured at NAV are shown in the following table:
Defined Contribution Plan Investments Measured at NAV (2019)
($ thousands)
NAVUnfunded
CommitmentsRedemptionFrequency
RedemptionNoticePeriodCommingled fixed income funds
Commingled fixed income funds $150 NA Daily 1 - 14 days
Target date fundsTarget date funds 7,898 NA Daily 1 - 14 days
Total $8,048 NA
SERS also has investments that are not measured at fair value or NAV. SERS owns a portion of the commonwealth Treasury Department’s short-term investment fund (STIF). SERS’ portion of STIF is valued at cost plus accrued interest, which approximates fair value. Additionally, SERS also has investments that are carried at either cost or liquidation basis values.
At December 31, 2019 and 2018, the Defined Benefit and Defined Contribution Plans’ investments not measured at fair value or NAV are shown in the following tables:
Investments Not Measured at Fair Value or NAV
($ thousands)
Defined Benefit Plan2019 2018
Short-term investments $1,661,979 $1,145,805 Hedge funds 30,684 31,145 Fixed income 1,484 794 Equity 207 145 Other investment 2 2 Total $1,694,356 $1,177,891
Defined Contribution Plan2019 2018
Short-term investments $4,434 $4,460 Total $4,434 $4,460
For the years ended December 31, 2019 and 2018, the money weighted rate of return for SERS’ Defined Benefit Plan, net of manager fees, was 18.8% and -4.5% respectively. A money weighted rate of return expresses investment performance, net of manager fees, adjusted for the changing amounts actually invested.
SERS’ investment office, in consultation with the board and its investment consultants, updates the SERS strategic investment plan every two years. In April 2018, the board approved the SERS 2018-2019 Investment Plan. Assets were managed according to this plan with a long term objective of achieving and maintaining a fully funded status in the Defined Benefit Plan.
Under that plan, Fixed Income and Cash were structured to generate income to pay benefits; provide liquidity to minimize capital impairment risk; reduce volatility in the total fund; protect the fund against deflation (and inflation via inflation protection securities); and contribute to total fund return when market conditions permit. The target asset allocation was based on a 7.25% assumed investment rate of return.
Commonwealth of Pennsylvania State Employees’ Retirement SystemNotes to Financial Statements
December 31, 2019 and 2018
SERS 2019 Financial Statements | 31
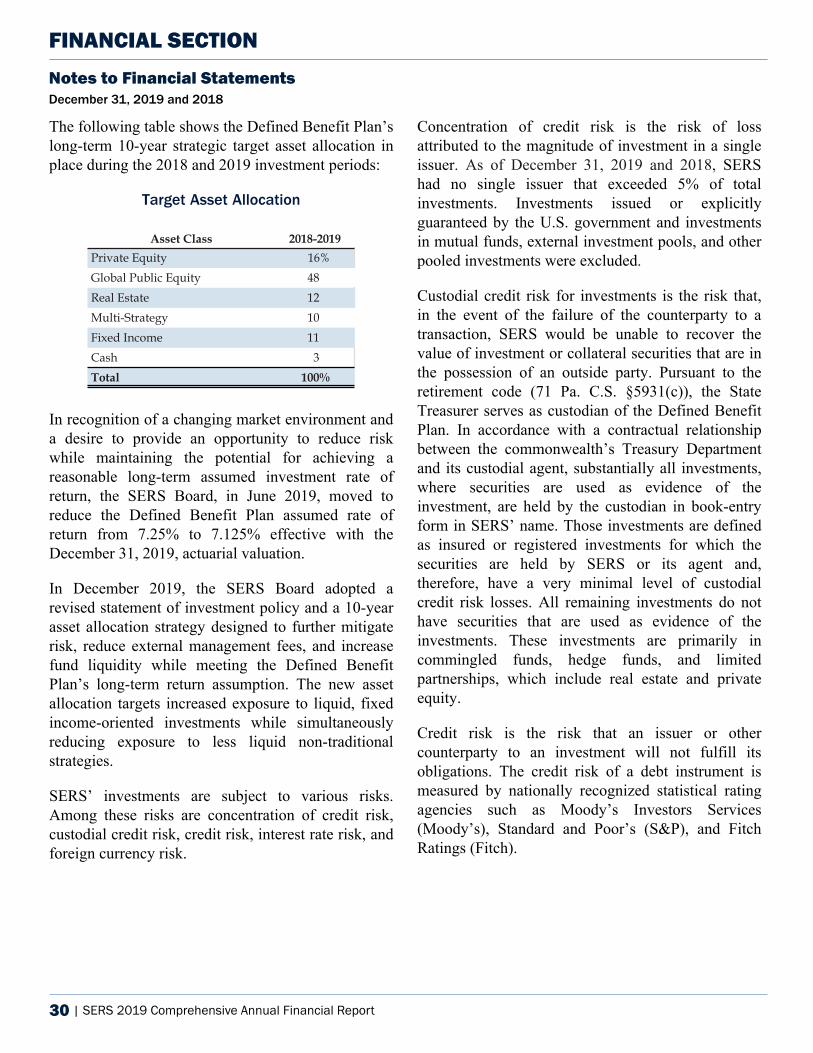
30 | SERS 2019 Comprehensive Annual Financial Report
FINANCIAL SECTIONNotes to Financial Statements December 31, 2019 and 2018
The following table shows the Defined Benefit Plan’s long-term 10-year strategic target asset allocation in place during the 2018 and 2019 investment periods:
Target Asset Allocation
Asset Class 2018-2019
Private Equity 16 %Global Public Equity 48Real Estate 12Multi-Strategy 10Fixed Income 11Cash 3Total 100 %
In recognition of a changing market environment and a desire to provide an opportunity to reduce risk while maintaining the potential for achieving a reasonable long-term assumed investment rate of return, the SERS Board, in June 2019, moved to reduce the Defined Benefit Plan assumed rate of return from 7.25% to 7.125% effective with the December 31, 2019, actuarial valuation.
In December 2019, the SERS Board adopted a revised statement of investment policy and a 10-year asset allocation strategy designed to further mitigate risk, reduce external management fees, and increase fund liquidity while meeting the Defined Benefit Plan’s long-term return assumption. The new asset allocation targets increased exposure to liquid, fixed income-oriented investments while simultaneously reducing exposure to less liquid non-traditional strategies.
SERS’ investments are subject to various risks. Among these risks are concentration of credit risk, custodial credit risk, credit risk, interest rate risk, and foreign currency risk.
Concentration of credit risk is the risk of loss attributed to the magnitude of investment in a single issuer. As of December 31, 2019 and 2018, SERS had no single issuer that exceeded 5% of total investments. Investments issued or explicitly guaranteed by the U.S. government and investments in mutual funds, external investment pools, and other pooled investments were excluded.
Custodial credit risk for investments is the risk that, in the event of the failure of the counterparty to a transaction, SERS would be unable to recover the value of investment or collateral securities that are in the possession of an outside party. Pursuant to the retirement code (71 Pa. C.S. §5931(c)), the State Treasurer serves as custodian of the Defined Benefit Plan. In accordance with a contractual relationship between the commonwealth’s Treasury Department and its custodial agent, substantially all investments, where securities are used as evidence of the investment, are held by the custodian in book-entry form in SERS’ name. Those investments are defined as insured or registered investments for which the securities are held by SERS or its agent and, therefore, have a very minimal level of custodial credit risk losses. All remaining investments do not have securities that are used as evidence of the investments. These investments are primarily in commingled funds, hedge funds, and limited partnerships, which include real estate and private equity.
Credit risk is the risk that an issuer or other counterparty to an investment will not fulfill its obligations. The credit risk of a debt instrument is measured by nationally recognized statistical rating agencies such as Moody’s Investors Services (Moody’s), Standard and Poor’s (S&P), and Fitch Ratings (Fitch).
Commonwealth of Pennsylvania State Employees’ Retirement SystemNotes to Financial StatementsDecember 31, 2019 and 2018
32 | SERS 2019 Financial Statements
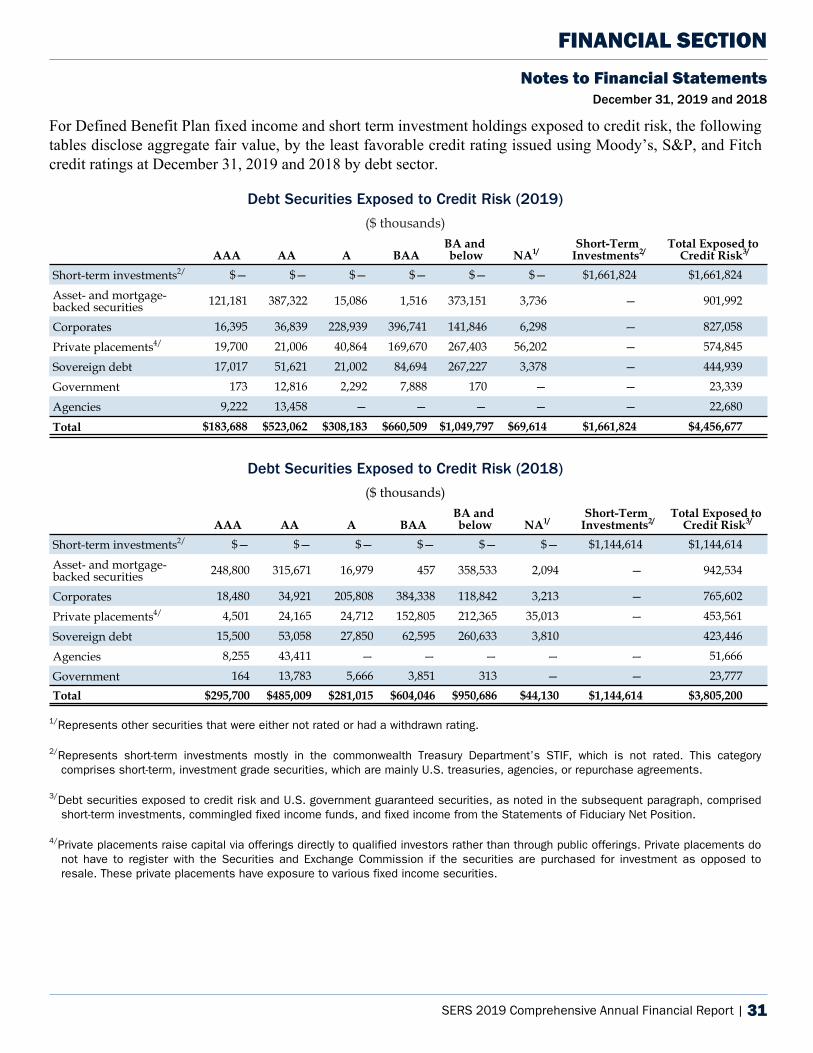
SERS 2019 Comprehensive Annual Financial Report | 31
FINANCIAL SECTIONNotes to Financial Statements
December 31, 2019 and 2018
For Defined Benefit Plan fixed income and short term investment holdings exposed to credit risk, the following tables disclose aggregate fair value, by the least favorable credit rating issued using Moody’s, S&P, and Fitch credit ratings at December 31, 2019 and 2018 by debt sector.
Debt Securities Exposed to Credit Risk (2019)
($ thousands)
AAA AA A BAABA and below NA1/
Short-Term Investments2/
Total Exposed to Credit Risk3/
Short-term investments2/ $— $— $— $— $— $— $1,661,824 $1,661,824
Asset- and mortgage-backed securities 121,181 387,322 15,086 1,516 373,151 3,736 — 901,992
Corporates 16,395 36,839 228,939 396,741 141,846 6,298 — 827,058
Private placements4/ 19,700 21,006 40,864 169,670 267,403 56,202 — 574,845
Sovereign debt 17,017 51,621 21,002 84,694 267,227 3,378 — 444,939
Government 173 12,816 2,292 7,888 170 — — 23,339
Agencies 9,222 13,458 — — — — — 22,680
Total $183,688 $523,062 $308,183 $660,509 $1,049,797 $69,614 $1,661,824 $4,456,677
Debt Securities Exposed to Credit Risk (2018)
($ thousands)
AAA AA A BAABA and below NA1/
Short-Term Investments2/
Total Exposed to Credit Risk3/
Short-term investments2/ $— $— $— $— $— $— $1,144,614 $1,144,614
Asset- and mortgage-backed securities 248,800 315,671 16,979 457 358,533 2,094 — 942,534
Corporates 18,480 34,921 205,808 384,338 118,842 3,213 — 765,602
Private placements4/ 4,501 24,165 24,712 152,805 212,365 35,013 — 453,561
Sovereign debt 15,500 53,058 27,850 62,595 260,633 3,810 423,446
Agencies 8,255 43,411 — — — — — 51,666
Government 164 13,783 5,666 3,851 313 — — 23,777 Total $295,700 $485,009 $281,015 $604,046 $950,686 $44,130 $1,144,614 $3,805,200
1/Represents other securities that were either not rated or had a withdrawn rating.
2/Represents short-term investments mostly in the commonwealth Treasury Department’s STIF, which is not rated. This category comprises short-term, investment grade securities, which are mainly U.S. treasuries, agencies, or repurchase agreements.
3/Debt securities exposed to credit risk and U.S. government guaranteed securities, as noted in the subsequent paragraph, comprised short-term investments, commingled fixed income funds, and fixed income from the Statements of Fiduciary Net Position.
4/Private placements raise capital via offerings directly to qualified investors rather than through public offerings. Private placements do not have to register with the Securities and Exchange Commission if the securities are purchased for investment as opposed to resale. These private placements have exposure to various fixed income securities.
Commonwealth of Pennsylvania State Employees’ Retirement SystemNotes to Financial Statements
December 31, 2019 and 2018
SERS 2019 Financial Statements | 33
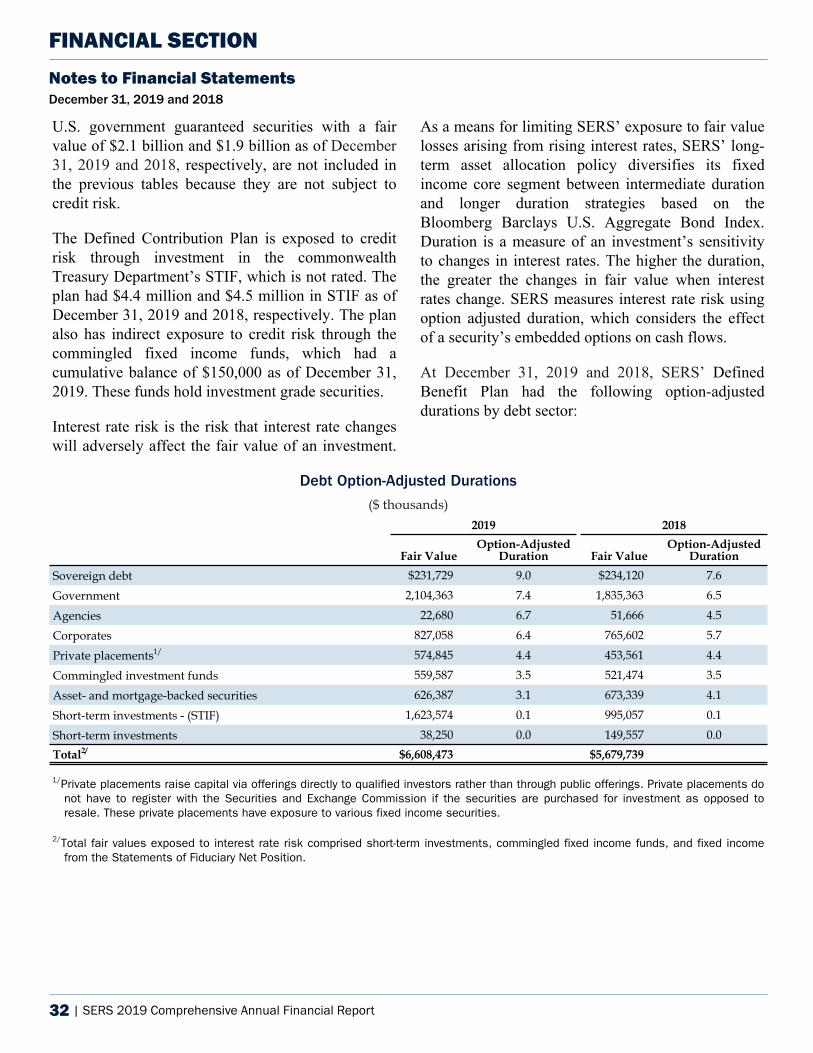
32 | SERS 2019 Comprehensive Annual Financial Report
FINANCIAL SECTIONNotes to Financial Statements December 31, 2019 and 2018
U.S. government guaranteed securities with a fair value of $2.1 billion and $1.9 billion as of December 31, 2019 and 2018, respectively, are not included in the previous tables because they are not subject to credit risk.
The Defined Contribution Plan is exposed to credit risk through investment in the commonwealth Treasury Department’s STIF, which is not rated. The plan had $4.4 million and $4.5 million in STIF as of December 31, 2019 and 2018, respectively. The plan also has indirect exposure to credit risk through the commingled fixed income funds, which had a cumulative balance of $150,000 as of December 31, 2019. These funds hold investment grade securities.
Interest rate risk is the risk that interest rate changes will adversely affect the fair value of an investment.
As a means for limiting SERS’ exposure to fair value losses arising from rising interest rates, SERS’ long-term asset allocation policy diversifies its fixed income core segment between intermediate duration and longer duration strategies based on the Bloomberg Barclays U.S. Aggregate Bond Index. Duration is a measure of an investment’s sensitivity to changes in interest rates. The higher the duration, the greater the changes in fair value when interest rates change. SERS measures interest rate risk using option adjusted duration, which considers the effect of a security’s embedded options on cash flows.
At December 31, 2019 and 2018, SERS’ Defined Benefit Plan had the following option-adjusted durations by debt sector:
Debt Option-Adjusted Durations
($ thousands)2019 2018
Fair Value Option-Adjusted
Duration Fair Value Option-Adjusted
Duration
Sovereign debt $231,729 9.0 $234,120 7.6
Government 2,104,363 7.4 1,835,363 6.5
Agencies 22,680 6.7 51,666 4.5
Corporates 827,058 6.4 765,602 5.7
Private placements1/ 574,845 4.4 453,561 4.4
Commingled investment funds 559,587 3.5 521,474 3.5
Asset- and mortgage-backed securities 626,387 3.1 673,339 4.1
Short-term investments - (STIF) 1,623,574 0.1 995,057 0.1
Short-term investments 38,250 0.0 149,557 0.0Total2/ $6,608,473 $5,679,739
1/Private placements raise capital via offerings directly to qualified investors rather than through public offerings. Private placements do not have to register with the Securities and Exchange Commission if the securities are purchased for investment as opposed to resale. These private placements have exposure to various fixed income securities.
2/Total fair values exposed to interest rate risk comprised short-term investments, commingled fixed income funds, and fixed income from the Statements of Fiduciary Net Position.
Commonwealth of Pennsylvania State Employees’ Retirement SystemNotes to Financial StatementsDecember 31, 2019 and 2018
34 | SERS 2019 Financial Statements
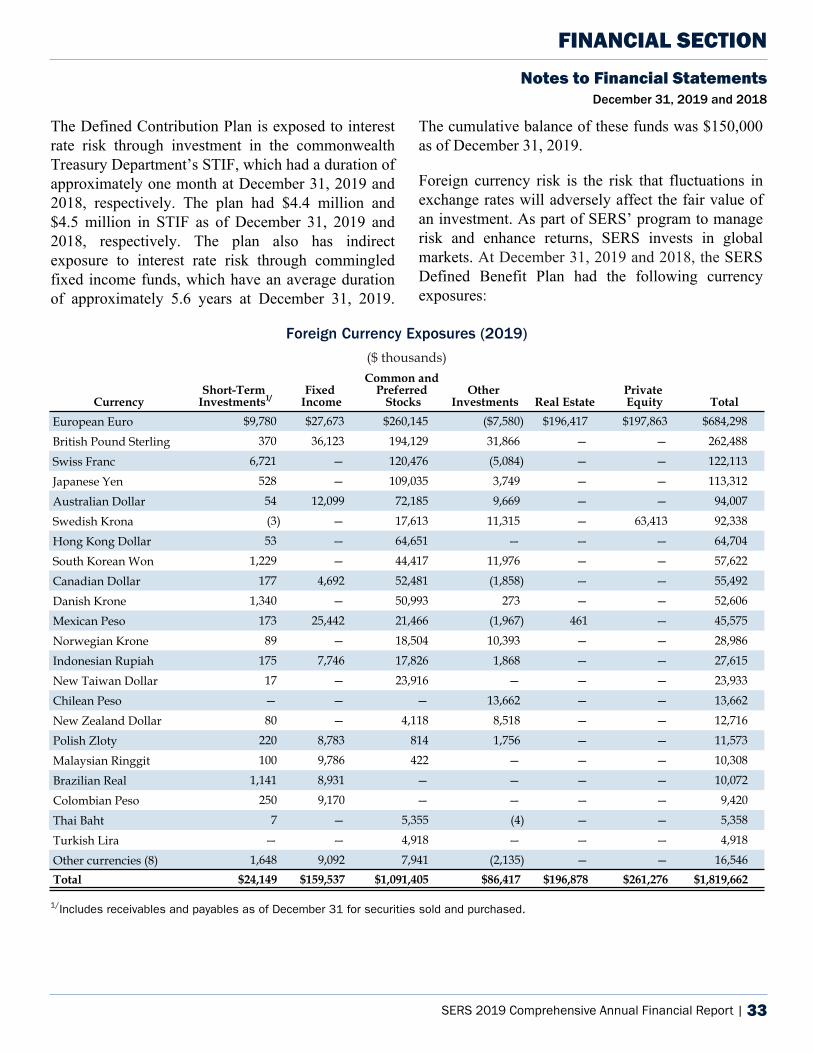
SERS 2019 Comprehensive Annual Financial Report | 33
Notes to Financial Statements December 31, 2019 and 2018
FINANCIAL SECTION
The Defined Contribution Plan is exposed to interest rate risk through investment in the commonwealth Treasury Department’s STIF, which had a duration of approximately one month at December 31, 2019 and 2018, respectively. The plan had $4.4 million and $4.5 million in STIF as of December 31, 2019 and 2018, respectively. The plan also has indirect exposure to interest rate risk through commingled fixed income funds, which have an average duration of approximately 5.6 years at December 31, 2019.
The cumulative balance of these funds was $150,000 as of December 31, 2019.
Foreign currency risk is the risk that fluctuations in exchange rates will adversely affect the fair value of an investment. As part of SERS’ program to manage risk and enhance returns, SERS invests in global markets. At December 31, 2019 and 2018, the SERS Defined Benefit Plan had the following currency exposures:
Foreign Currency Exposures (2019)
($ thousands)
CurrencyShort-Term
Investments1/Fixed
Income
Common and Preferred
StocksOther
Investments Real EstatePrivate Equity Total
European Euro $9,780 $27,673 $260,145 ($7,580) $196,417 $197,863 $684,298
British Pound Sterling 370 36,123 194,129 31,866 — — 262,488
Swiss Franc 6,721 — 120,476 (5,084) — — 122,113
Japanese Yen 528 — 109,035 3,749 — — 113,312
Australian Dollar 54 12,099 72,185 9,669 — — 94,007
Swedish Krona (3) — 17,613 11,315 — 63,413 92,338
Hong Kong Dollar 53 — 64,651 — — — 64,704
South Korean Won 1,229 — 44,417 11,976 — — 57,622
Canadian Dollar 177 4,692 52,481 (1,858) — — 55,492
Danish Krone 1,340 — 50,993 273 — — 52,606
Mexican Peso 173 25,442 21,466 (1,967) 461 — 45,575
Norwegian Krone 89 — 18,504 10,393 — — 28,986
Indonesian Rupiah 175 7,746 17,826 1,868 — — 27,615
New Taiwan Dollar 17 — 23,916 — — — 23,933
Chilean Peso — — — 13,662 — — 13,662
New Zealand Dollar 80 — 4,118 8,518 — — 12,716
Polish Zloty 220 8,783 814 1,756 — — 11,573
Malaysian Ringgit 100 9,786 422 — — — 10,308
Brazilian Real 1,141 8,931 — — — — 10,072
Colombian Peso 250 9,170 — — — — 9,420
Thai Baht 7 — 5,355 (4) — — 5,358
Turkish Lira — — 4,918 — — — 4,918
Other currencies (8) 1,648 9,092 7,941 (2,135) — — 16,546 Total $24,149 $159,537 $1,091,405 $86,417 $196,878 $261,276 $1,819,662
1/Includes receivables and payables as of December 31 for securities sold and purchased.
Commonwealth of Pennsylvania State Employees’ Retirement SystemNotes to Financial Statements
December 31, 2019 and 2018
SERS 2019 Financial Statements | 35
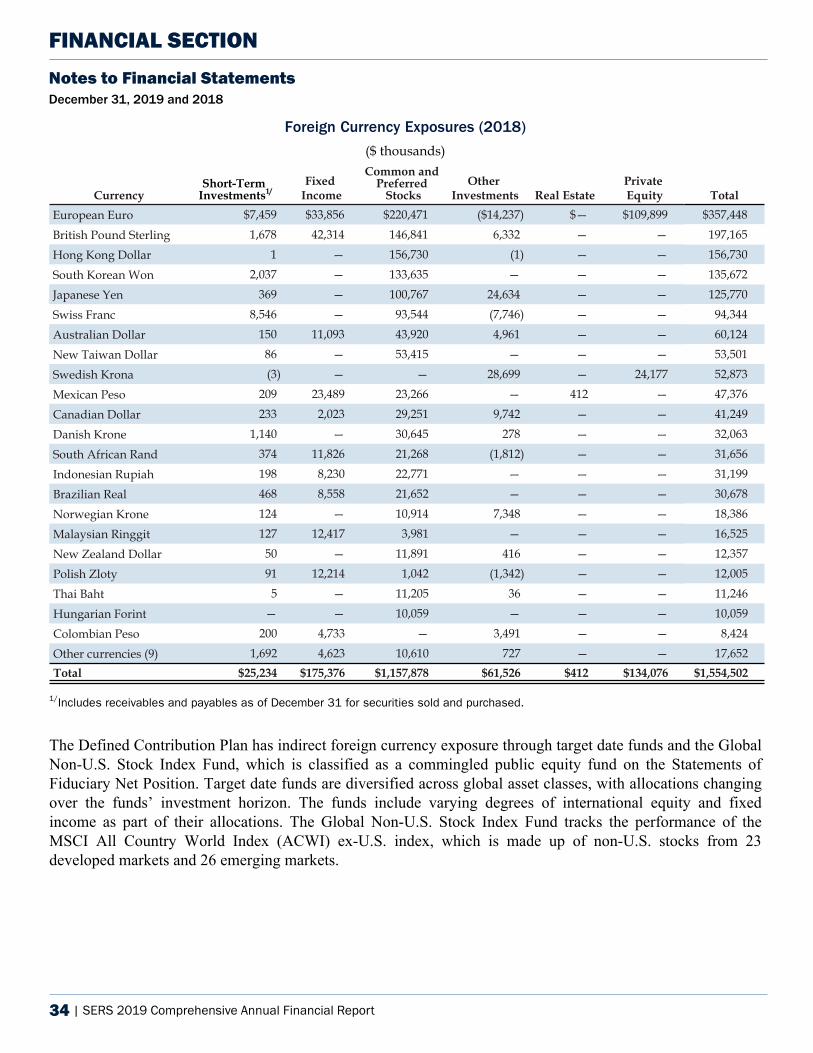
34 | SERS 2019 Comprehensive Annual Financial Report
FINANCIAL SECTIONNotes to Financial Statements December 31, 2019 and 2018
Foreign Currency Exposures (2018)
($ thousands)
CurrencyShort-Term
Investments1/Fixed
Income
Common and Preferred
StocksOther
Investments Real EstatePrivate Equity Total
European Euro $7,459 $33,856 $220,471 ($14,237) $— $109,899 $357,448
British Pound Sterling 1,678 42,314 146,841 6,332 — — 197,165
Hong Kong Dollar 1 — 156,730 (1) — — 156,730
South Korean Won 2,037 — 133,635 — — — 135,672
Japanese Yen 369 — 100,767 24,634 — — 125,770
Swiss Franc 8,546 — 93,544 (7,746) — — 94,344
Australian Dollar 150 11,093 43,920 4,961 — — 60,124
New Taiwan Dollar 86 — 53,415 — — — 53,501
Swedish Krona (3) — — 28,699 — 24,177 52,873
Mexican Peso 209 23,489 23,266 — 412 — 47,376
Canadian Dollar 233 2,023 29,251 9,742 — — 41,249
Danish Krone 1,140 — 30,645 278 — — 32,063
South African Rand 374 11,826 21,268 (1,812) — — 31,656
Indonesian Rupiah 198 8,230 22,771 — — — 31,199
Brazilian Real 468 8,558 21,652 — — — 30,678
Norwegian Krone 124 — 10,914 7,348 — — 18,386
Malaysian Ringgit 127 12,417 3,981 — — — 16,525
New Zealand Dollar 50 — 11,891 416 — — 12,357
Polish Zloty 91 12,214 1,042 (1,342) — — 12,005
Thai Baht 5 — 11,205 36 — — 11,246
Hungarian Forint — — 10,059 — — — 10,059
Colombian Peso 200 4,733 — 3,491 — — 8,424
Other currencies (9) 1,692 4,623 10,610 727 — — 17,652 Total $25,234 $175,376 $1,157,878 $61,526 $412 $134,076 $1,554,502
1/Includes receivables and payables as of December 31 for securities sold and purchased.
The Defined Contribution Plan has indirect foreign currency exposure through target date funds and the Global Non-U.S. Stock Index Fund, which is classified as a commingled public equity fund on the Statements of Fiduciary Net Position. Target date funds are diversified across global asset classes, with allocations changing over the funds’ investment horizon. The funds include varying degrees of international equity and fixed income as part of their allocations. The Global Non-U.S. Stock Index Fund tracks the performance of the MSCI All Country World Index (ACWI) ex-U.S. index, which is made up of non-U.S. stocks from 23 developed markets and 26 emerging markets.
Commonwealth of Pennsylvania State Employees’ Retirement SystemNotes to Financial StatementsDecember 31, 2019 and 2018
36 | SERS 2019 Financial Statements
SERS 2019 Comprehensive Annual Financial Report | 35
Notes to Financial Statements December 31, 2019 and 2018
FINANCIAL SECTION
(5) Securities LendingIn accordance with a contract between the commonwealth’s treasurer and its custodian, the SERS Defined Benefit Plan participates in a securities lending program.
The custodian, acting as lending agent, lends the plan’s equity, debt, and money market securities for cash, securities, or letter of credit collateral. Collateral is required at 102% of the fair value of the securities loaned except for the equity securities of non-U.S. corporations, for which collateral of 105% is required. Collateral is marked to market daily. If the collateral falls below guidelines for the fair value of the securities loaned, additional collateral is obtained. Cash collateral is invested by the lending agent in accordance with investment guidelines approved by the board. The lending agent cannot pledge or sell securities collateral unless the borrower defaults.
As of December 31, 2019 and 2018, the Defined Benefit Plan’s credit exposure to individual borrowers was limited because the amounts owed to the borrowers exceeded the amounts the borrowers owed the plan. The treasurer’s contract with the lending agent requires the agent to indemnify the plan if the borrowers fail to return the underlying securities and the collateral is inadequate to replace the loaned securities or if the borrowers fail to pay income distributions on the loaned securities.
All loaned securities at December 31, 2019 and 2018, could be terminated on demand by either the lending agent or the borrower. Cash collateral is invested in a short-term collective investment pool. The duration of the investments in the pool at December 31, 2019 and 2018 was two days and one day, respectively. Interest rate risk may be posed by mismatched maturities and could be affected by other program features, such as the lending agent’s ability to reallocate loaned securities among all of its lending customers.
As of December 31, 2019 and 2018, for the Defined Benefit Plan, the fair value of loaned securities was
$687 million and $274 million, respectively; the fair value of the associated collateral was $700 million and $285 million, of which $138 million and $164 million was cash, respectively. As of December 31, 2019 and 2018, noncash collateral of $562 million and $121 million, respectively, was invested in U.S. government guaranteed securities, which are not subject to credit risk.
(6) Derivative and Structured Financial Instruments and Restricted AssetsWithin narrowly prescribed guidelines, the SERS Defined Benefit Plan permits investment managers to directly enter into certain derivative and structured financial instruments primarily to hedge risk and reduce the volatility of its portfolio. Typically, investment managers enter into foreign exchange contracts to make payment for international investments and to hedge currency risk, futures contracts to manage interest rate risk, and swaps to more efficiently gain investment exposure in the equity and credit markets.
SERS also indirectly holds derivatives and financial instruments through commingled fund and hedge fund managers in the Defined Benefit Plan and Defined Contribution Plan. At a fund level, these managers hold foreign exchange contracts, futures contracts, and certain swap contracts. These funds invest in instruments directly and indirectly to gain foreign exchange exposure, to synthetically create equity-like returns, and to manage interest rate risk by altering the average life of the portfolio. Derivatives are viewed within the context of the fund’s total portfolio and are consistent with the funds’ overall strategy.
SERS is exposed to counterparty credit risk on all open derivative positions. Counterparty credit risk is the risk that a derivative counterparty may fail to meet its payment obligation under the derivative contract. As of December 31, 2019 and 2018, SERS direct counterparty credit risk was not significant. SERS mitigates its legal risk on investment holdings including derivatives by ensuring that all of our legal requirements (indemnification, sovereign immunity, jurisdiction, etc.) are acknowledged and agreed to in
Commonwealth of Pennsylvania State Employees’ Retirement SystemNotes to Financial Statements
December 31, 2019 and 2018
SERS 2019 Financial Statements | 37
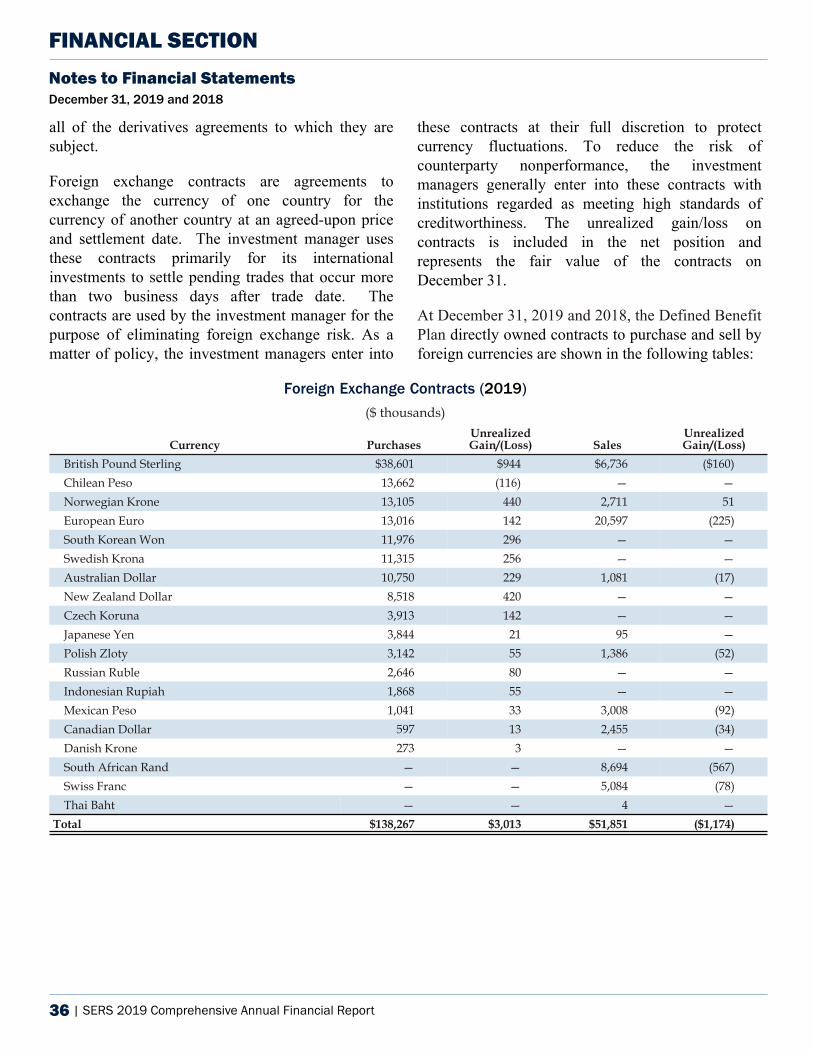
36 | SERS 2019 Comprehensive Annual Financial Report
FINANCIAL SECTIONNotes to Financial Statements December 31, 2019 and 2018
all of the derivatives agreements to which they are subject.
Foreign exchange contracts are agreements to exchange the currency of one country for the currency of another country at an agreed-upon price and settlement date. The investment manager uses these contracts primarily for its international investments to settle pending trades that occur more than two business days after trade date. The contracts are used by the investment manager for the purpose of eliminating foreign exchange risk. As a matter of policy, the investment managers enter into
these contracts at their full discretion to protect currency fluctuations. To reduce the risk of counterparty nonperformance, the investment managers generally enter into these contracts with institutions regarded as meeting high standards of creditworthiness. The unrealized gain/loss on contracts is included in the net position and represents the fair value of the contracts on December 31.
At December 31, 2019 and 2018, the Defined Benefit Plan directly owned contracts to purchase and sell by foreign currencies are shown in the following tables:
Foreign Exchange Contracts (2019)
($ thousands)
Currency PurchasesUnrealizedGain/(Loss) Sales
UnrealizedGain/(Loss)
British Pound Sterling $38,601 $944 $6,736 ($160) Chilean Peso 13,662 (116) — — Norwegian Krone 13,105 440 2,711 51 European Euro 13,016 142 20,597 (225) South Korean Won 11,976 296 — — Swedish Krona 11,315 256 — — Australian Dollar 10,750 229 1,081 (17) New Zealand Dollar 8,518 420 — — Czech Koruna 3,913 142 — — Japanese Yen 3,844 21 95 — Polish Zloty 3,142 55 1,386 (52) Russian Ruble 2,646 80 — — Indonesian Rupiah 1,868 55 — — Mexican Peso 1,041 33 3,008 (92) Canadian Dollar 597 13 2,455 (34) Danish Krone 273 3 — — South African Rand — — 8,694 (567) Swiss Franc — — 5,084 (78) Thai Baht — — 4 —
Total $138,267 $3,013 $51,851 ($1,174)
Commonwealth of Pennsylvania State Employees’ Retirement SystemNotes to Financial StatementsDecember 31, 2019 and 2018
38 | SERS 2019 Financial Statements
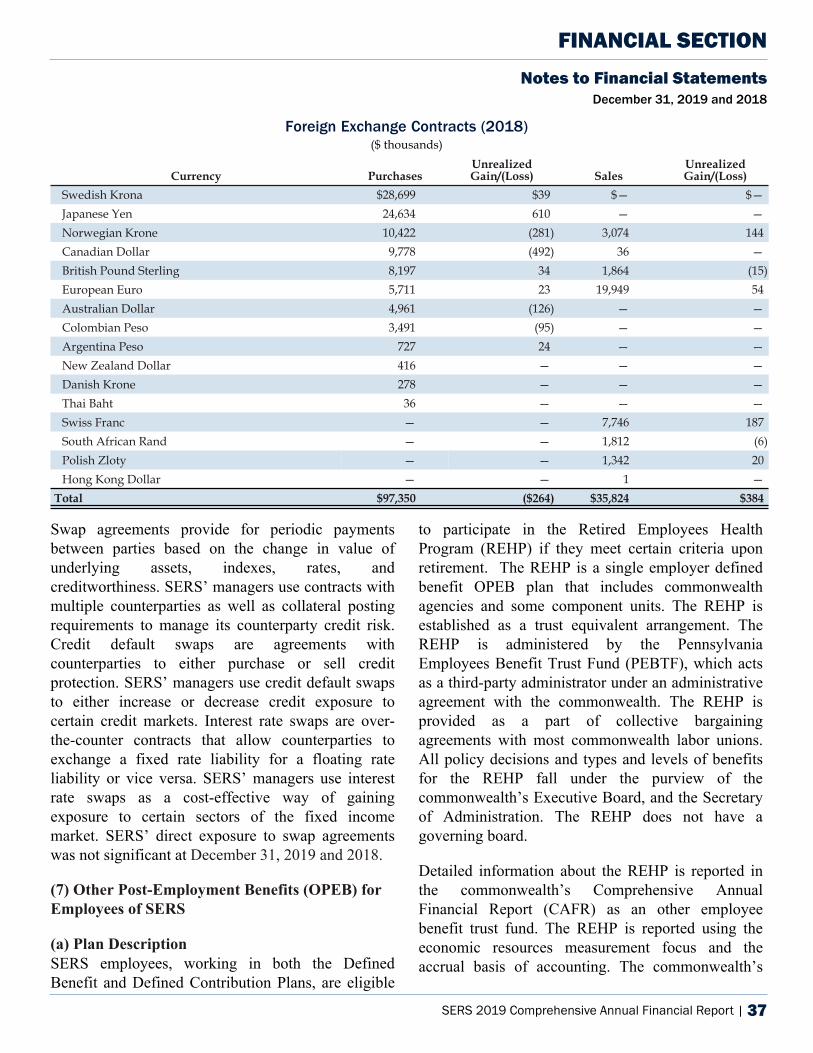
SERS 2019 Comprehensive Annual Financial Report | 37
FINANCIAL SECTIONNotes to Financial Statements
December 31, 2019 and 2018
Foreign Exchange Contracts (2018)($ thousands)
Currency PurchasesUnrealizedGain/(Loss) Sales
UnrealizedGain/(Loss)
Swedish Krona $28,699 $39 $— $— Japanese Yen 24,634 610 — — Norwegian Krone 10,422 (281) 3,074 144 Canadian Dollar 9,778 (492) 36 — British Pound Sterling 8,197 34 1,864 (15) European Euro 5,711 23 19,949 54 Australian Dollar 4,961 (126) — — Colombian Peso 3,491 (95) — — Argentina Peso 727 24 — — New Zealand Dollar 416 — — — Danish Krone 278 — — — Thai Baht 36 — — — Swiss Franc — — 7,746 187 South African Rand — — 1,812 (6) Polish Zloty — — 1,342 20 Hong Kong Dollar — — 1 —
Total $97,350 ($264) $35,824 $384
Swap agreements provide for periodic payments between parties based on the change in value of underlying assets, indexes, rates, and creditworthiness. SERS’ managers use contracts with multiple counterparties as well as collateral posting requirements to manage its counterparty credit risk. Credit default swaps are agreements with counterparties to either purchase or sell credit protection. SERS’ managers use credit default swaps to either increase or decrease credit exposure to certain credit markets. Interest rate swaps are over-the-counter contracts that allow counterparties to exchange a fixed rate liability for a floating rate liability or vice versa. SERS’ managers use interest rate swaps as a cost-effective way of gaining exposure to certain sectors of the fixed income market. SERS’ direct exposure to swap agreements was not significant at December 31, 2019 and 2018.
(7) Other Post-Employment Benefits (OPEB) for Employees of SERS
(a) Plan DescriptionSERS employees, working in both the Defined Benefit and Defined Contribution Plans, are eligible
to participate in the Retired Employees Health Program (REHP) if they meet certain criteria upon retirement. The REHP is a single employer defined benefit OPEB plan that includes commonwealth agencies and some component units. The REHP is established as a trust equivalent arrangement. The REHP is administered by the Pennsylvania Employees Benefit Trust Fund (PEBTF), which acts as a third-party administrator under an administrative agreement with the commonwealth. The REHP is provided as a part of collective bargaining agreements with most commonwealth labor unions. All policy decisions and types and levels of benefits for the REHP fall under the purview of the commonwealth’s Executive Board, and the Secretary of Administration. The REHP does not have a governing board.
Detailed information about the REHP is reported in the commonwealth’s Comprehensive Annual Financial Report (CAFR) as an other employee benefit trust fund. The REHP is reported using the economic resources measurement focus and the accrual basis of accounting. The commonwealth’s
Commonwealth of Pennsylvania State Employees’ Retirement SystemNotes to Financial Statements
December 31, 2019 and 2018
SERS 2019 Financial Statements | 39
38 | SERS 2019 Comprehensive Annual Financial Report
FINANCIAL SECTIONNotes to Financial Statements December 31, 2019 and 2018
CAFR is an audited financial statement and is available at www.budget.pa.gov.
(b) Benefits ProvidedEligible employees who retire from the state and meet one of the following eligibility criteria are eligible to receive REHP benefits:
• 25 or more years of service
• 20 or more years of service and superannuation age – Age 50 for Park Rangers, Capitol Police and certain enforcement officers or 60 for general employees (age 55 or 65 for employees subject to Act 2010-120)
• Disability retirement – requires five years of service (no service requirement for enforcement officers)
Spouses and dependents are eligible for subsidized postemployment medical coverage while the retiree is alive. The Patient Protection and Affordable Care Act (PPACA), signed into law on March 23, 2010, increased the dependent child age limit to age 26 and applied to the Commonwealth effective January 1, 2011.
(c) ContributionsEmployer contributions for retiree healthcare benefits are charged as a component of payroll expenditures on a “pay as you go” basis. During 2019 and 2018, SERS funded REHP benefits by paying a set dollar amount per pay period for each active SERS employee.
Retiree contributions ranged from 0 – 3% of final average salary, which varies depending on retirement date. In addition to the retiree contributions for those hired on or after August 1, 2003, non-Medicare retirees who elect the Choice PPO plan are required to pay the incremental cost between the Choice PPO plan and the least expensive plan (LEP) in their county of residence through monthly pension deductions (PPO buy-up). Surviving spouses of deceased retirees may continue to participate in the plan if they pay the full cost of the coverage.
(d) Proportionate Share of OPEB AmountsThe REHP undergoes an actuarial valuation each year and uses a June 30 measurement date.
At December 31, 2019 and 2018, SERS reported a liability of $23.6 million and $31.2 million for its proportionate share of the net OPEB liability respectively. SERS’ proportion of the net OPEB liability was based on actual contributions made to the REHP. At June 30, 2019 and 2018, SERS proportion was 0.227% and 0.213% respectively.
For the years ended December 31, 2019 and 2018, SERS recognized OPEB expense of $3.9 million and $2.0 million respectively, which is included with administrative expenses.
Commonwealth of Pennsylvania State Employees’ Retirement SystemNotes to Financial StatementsDecember 31, 2019 and 2018
40 | SERS 2019 Financial Statements
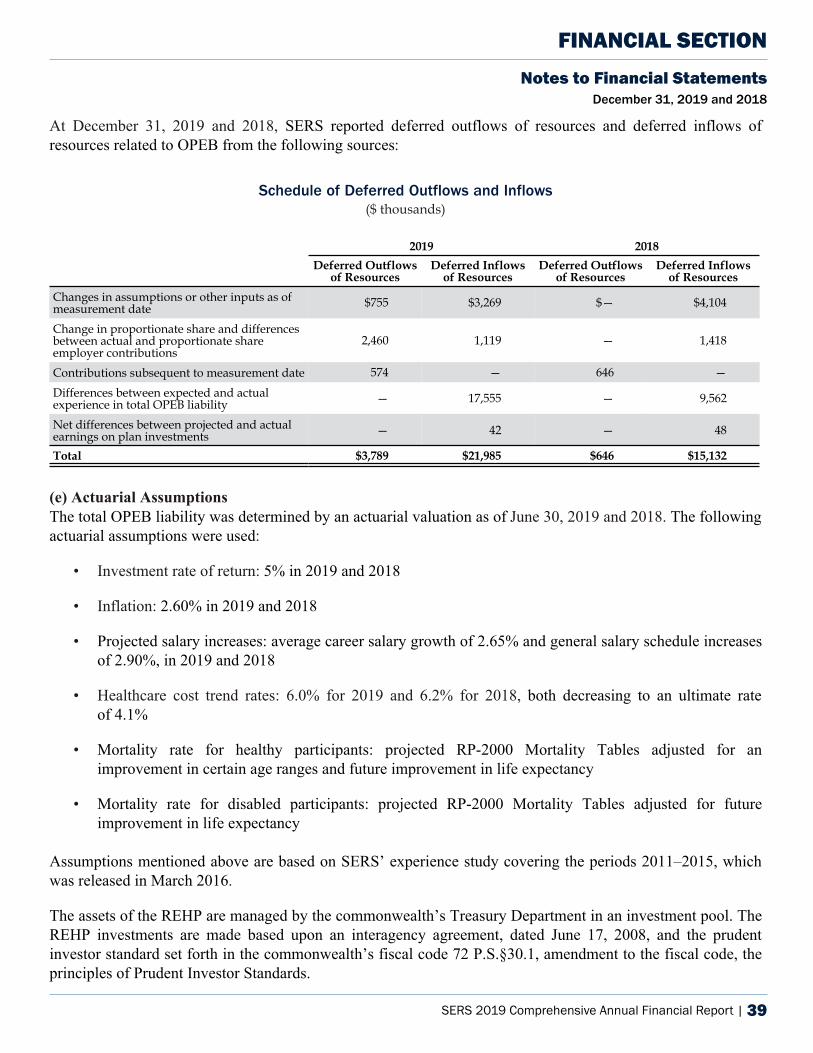
SERS 2019 Comprehensive Annual Financial Report | 39
FINANCIAL SECTIONNotes to Financial Statements
December 31, 2019 and 2018
At December 31, 2019 and 2018, SERS reported deferred outflows of resources and deferred inflows of resources related to OPEB from the following sources:
Schedule of Deferred Outflows and Inflows($ thousands)
2019 2018
Deferred Outflowsof Resources
Deferred Inflowsof Resources
Deferred Outflowsof Resources
Deferred Inflowsof Resources
Changes in assumptions or other inputs as of measurement date $755 $3,269 $— $4,104
Change in proportionate share and differences between actual and proportionate share employer contributions
2,460 1,119 — 1,418
Contributions subsequent to measurement date 574 — 646 —
Differences between expected and actual experience in total OPEB liability — 17,555 — 9,562
Net differences between projected and actual earnings on plan investments — 42 — 48
Total $3,789 $21,985 $646 $15,132
(e) Actuarial AssumptionsThe total OPEB liability was determined by an actuarial valuation as of June 30, 2019 and 2018. The following actuarial assumptions were used:
• Investment rate of return: 5% in 2019 and 2018
• Inflation: 2.60% in 2019 and 2018
• Projected salary increases: average career salary growth of 2.65% and general salary schedule increases of 2.90%, in 2019 and 2018
• Healthcare cost trend rates: 6.0% for 2019 and 6.2% for 2018, both decreasing to an ultimate rate of 4.1%
• Mortality rate for healthy participants: projected RP-2000 Mortality Tables adjusted for an improvement in certain age ranges and future improvement in life expectancy
• Mortality rate for disabled participants: projected RP-2000 Mortality Tables adjusted for future improvement in life expectancy
Assumptions mentioned above are based on SERS’ experience study covering the periods 2011–2015, which was released in March 2016.
The assets of the REHP are managed by the commonwealth’s Treasury Department in an investment pool. The REHP investments are made based upon an interagency agreement, dated June 17, 2008, and the prudent investor standard set forth in the commonwealth’s fiscal code 72 P.S.§30.1, amendment to the fiscal code, the principles of Prudent Investor Standards.
Commonwealth of Pennsylvania State Employees’ Retirement SystemNotes to Financial Statements
December 31, 2019 and 2018
SERS 2019 Financial Statements | 41
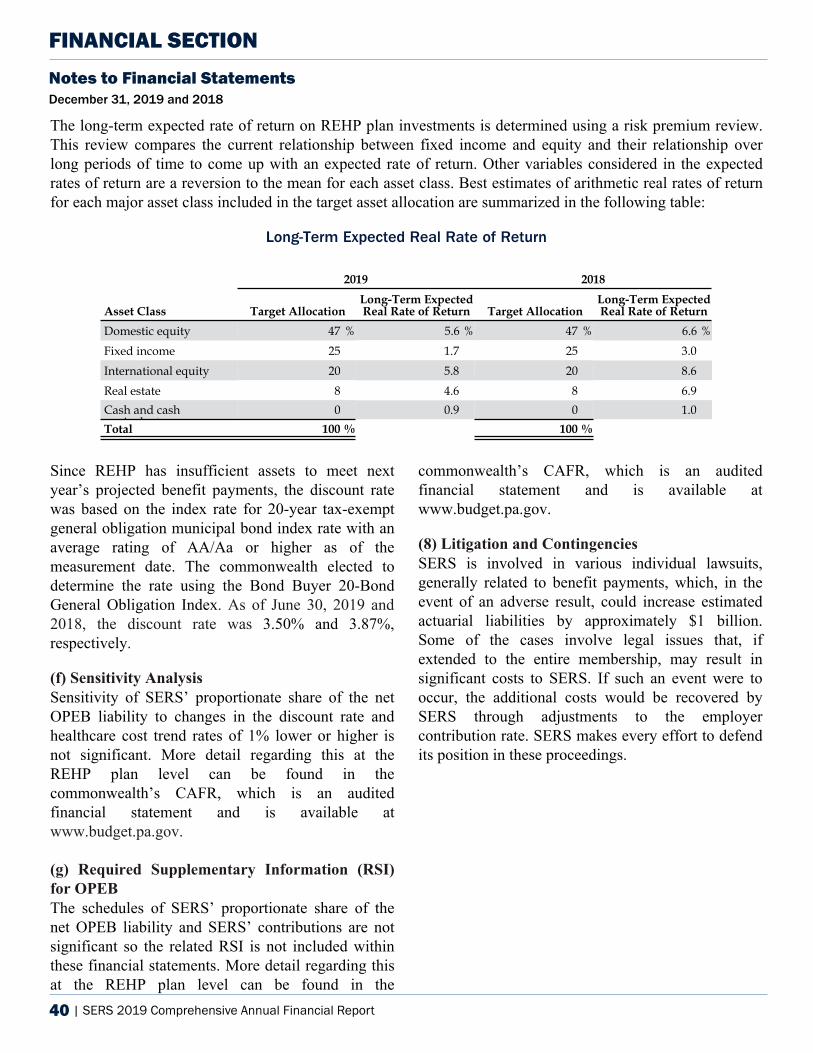
40 | SERS 2019 Comprehensive Annual Financial Report
FINANCIAL SECTIONNotes to Financial Statements December 31, 2019 and 2018
The long-term expected rate of return on REHP plan investments is determined using a risk premium review. This review compares the current relationship between fixed income and equity and their relationship over long periods of time to come up with an expected rate of return. Other variables considered in the expected rates of return are a reversion to the mean for each asset class. Best estimates of arithmetic real rates of return for each major asset class included in the target asset allocation are summarized in the following table:
Long-Term Expected Real Rate of Return
2019 2018
Asset Class Target AllocationLong-Term ExpectedReal Rate of Return Target Allocation
Long-Term ExpectedReal Rate of Return
Domestic equity 47 % 5.6 % 47 % 6.6 %Fixed income 25 1.7 25 3.0 International equity 20 5.8 20 8.6 Real estate 8 4.6 8 6.9 Cash and cash equivalents
0 0.9 0 1.0 Total 100 % 100 %
Since REHP has insufficient assets to meet next year’s projected benefit payments, the discount rate was based on the index rate for 20-year tax-exempt general obligation municipal bond index rate with an average rating of AA/Aa or higher as of the measurement date. The commonwealth elected to determine the rate using the Bond Buyer 20-Bond General Obligation Index. As of June 30, 2019 and 2018, the discount rate was 3.50% and 3.87%, respectively.
(f) Sensitivity AnalysisSensitivity of SERS’ proportionate share of the net OPEB liability to changes in the discount rate and healthcare cost trend rates of 1% lower or higher is not significant. More detail regarding this at the REHP plan level can be found in the commonwealth’s CAFR, which is an audited financial statement and is available at www.budget.pa.gov.
(g) Required Supplementary Information (RSI) for OPEBThe schedules of SERS’ proportionate share of the net OPEB liability and SERS’ contributions are not significant so the related RSI is not included within these financial statements. More detail regarding this at the REHP plan level can be found in the
commonwealth’s CAFR, which is an audited financial statement and is available at www.budget.pa.gov.
(8) Litigation and ContingenciesSERS is involved in various individual lawsuits, generally related to benefit payments, which, in the event of an adverse result, could increase estimated actuarial liabilities by approximately $1 billion. Some of the cases involve legal issues that, if extended to the entire membership, may result in significant costs to SERS. If such an event were to occur, the additional costs would be recovered by SERS through adjustments to the employer contribution rate. SERS makes every effort to defend its position in these proceedings.
Commonwealth of Pennsylvania State Employees’ Retirement SystemNotes to Financial StatementsDecember 31, 2019 and 2018
42 | SERS 2019 Financial Statements

SERS 2019 Comprehensive Annual Financial Report | 41
FINANCIAL SECTIONNotes to Financial Statements
December 31, 2019 and 2018
(9) Net Pension LiabilityThe components of the net pension liability of participating employers at December 31, 2019 and 2018, were as follows:
Net Pension Liability($ thousands)
2019 2018
Total pension liability $49,274,314 $47,768,011
Plan fiduciary net position 31,096,319 26,936,990 Net pension liability $18,177,995 $20,831,021
Plan fiduciary net positionas a percentage of the totalpension liability
63.1% 56.4%
The total pension liability was determined by an actuarial valuation for financial reporting purposes as of December 31, 2019 and 2018, using some of the following actuarial methods and assumptions:
• Actuarial cost method: entry age
• Investment rate of return: 7.125% net of manager fees including inflation for 2019 and 7.25% net of manager fees including inflation for 2018
• Projected salary increases: average of 5.60% with range of 3.70%–8.90% including inflation
• Asset valuation method: fair (market) value
• Inflation: 2.60%
• Mortality rate: projected RP-2000 Mortality Tables adjusted for actual plan experience and future improvement
The assumptions, unless otherwise approved by the board, mentioned above are based on the 18th Investigation of Actuarial Experience study covering the periods 2011–2015, which was released in March 2016. SERS Board has elected to lower the investment rate of return twice over the past few years. The board lowered the investment rate of
return to 7.25% in 2017 and lowered it in 2019 to 7.125%.
The long-term expected real rate of return on pension plan investments is determined using a building-block method in which best-estimate ranges of expected future real rates of return (expected returns, net of manager fees and inflation) are developed for each major asset class. These ranges are combined to produce the long-term expected rate of return by weighting the expected future real rates of return by the target asset allocation percentage and by adding expected inflation. Best estimates of arithmetic real rates of return for each major asset class included in the pension plan’s target asset allocation in note 4 as of December 31, 2019 and 2018 (see the discussion of the pension plan’s investment policy) are summarized in the following tables:
Long-Term Expected Real Rate of Return (2018 and 2019)
Asset ClassLong-Term ExpectedReal Rate of Return
Private Equity 7.25 %Global Public Equity 5.15Real Estate 5.26Multi-Strategy 4.44Fixed Income 1.26
Cash 0.00
The discount rate used to measure the total pension liability was reduced to 7.125% in 2019 from 7.25% in 2018. The projection of cash flows used to determine the discount rate assumed that contributions from plan members will be made at the current contribution rates and that contributions from participating employers will be made at actuarially determined rates as set by statute. Based on those assumptions, the pension plan’s fiduciary net position was projected to be available to make all projected future benefit payments of current plan members. Therefore, the long-term expected rate of return on pension plan investments was applied to all periods of projected benefit payments to determine the total pension liability.
Commonwealth of Pennsylvania State Employees’ Retirement SystemNotes to Financial Statements
December 31, 2019 and 2018
SERS 2019 Financial Statements | 43
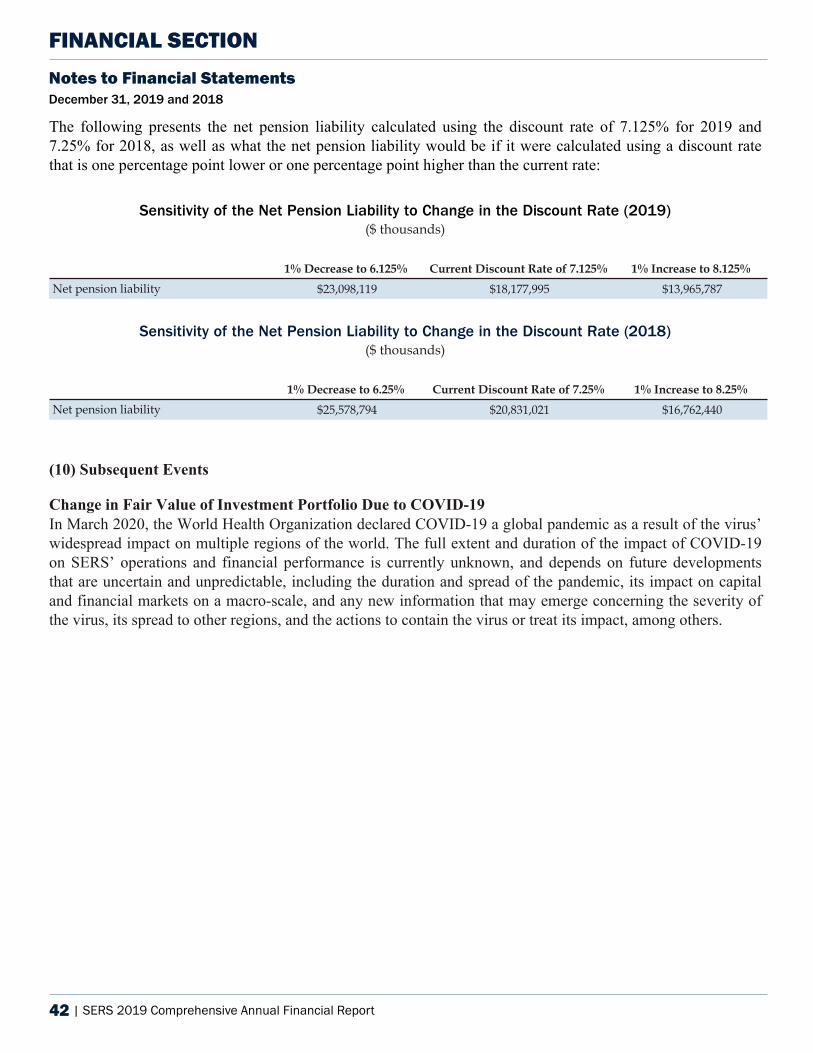
42 | SERS 2019 Comprehensive Annual Financial Report
FINANCIAL SECTIONNotes to Financial Statements December 31, 2019 and 2018
The following presents the net pension liability calculated using the discount rate of 7.125% for 2019 and 7.25% for 2018, as well as what the net pension liability would be if it were calculated using a discount rate that is one percentage point lower or one percentage point higher than the current rate:
Sensitivity of the Net Pension Liability to Change in the Discount Rate (2019)($ thousands)
1% Decrease to 6.125% Current Discount Rate of 7.125% 1% Increase to 8.125%
Net pension liability $23,098,119 $18,177,995 $13,965,787
Sensitivity of the Net Pension Liability to Change in the Discount Rate (2018)($ thousands)
1% Decrease to 6.25% Current Discount Rate of 7.25% 1% Increase to 8.25%
Net pension liability $25,578,794 $20,831,021 $16,762,440
(10) Subsequent Events
Change in Fair Value of Investment Portfolio Due to COVID-19In March 2020, the World Health Organization declared COVID-19 a global pandemic as a result of the virus’ widespread impact on multiple regions of the world. The full extent and duration of the impact of COVID-19 on SERS’ operations and financial performance is currently unknown, and depends on future developments that are uncertain and unpredictable, including the duration and spread of the pandemic, its impact on capital and financial markets on a macro-scale, and any new information that may emerge concerning the severity of the virus, its spread to other regions, and the actions to contain the virus or treat its impact, among others.
Commonwealth of Pennsylvania State Employees’ Retirement SystemNotes to Financial StatementsDecember 31, 2019 and 2018
44 | SERS 2019 Financial Statements
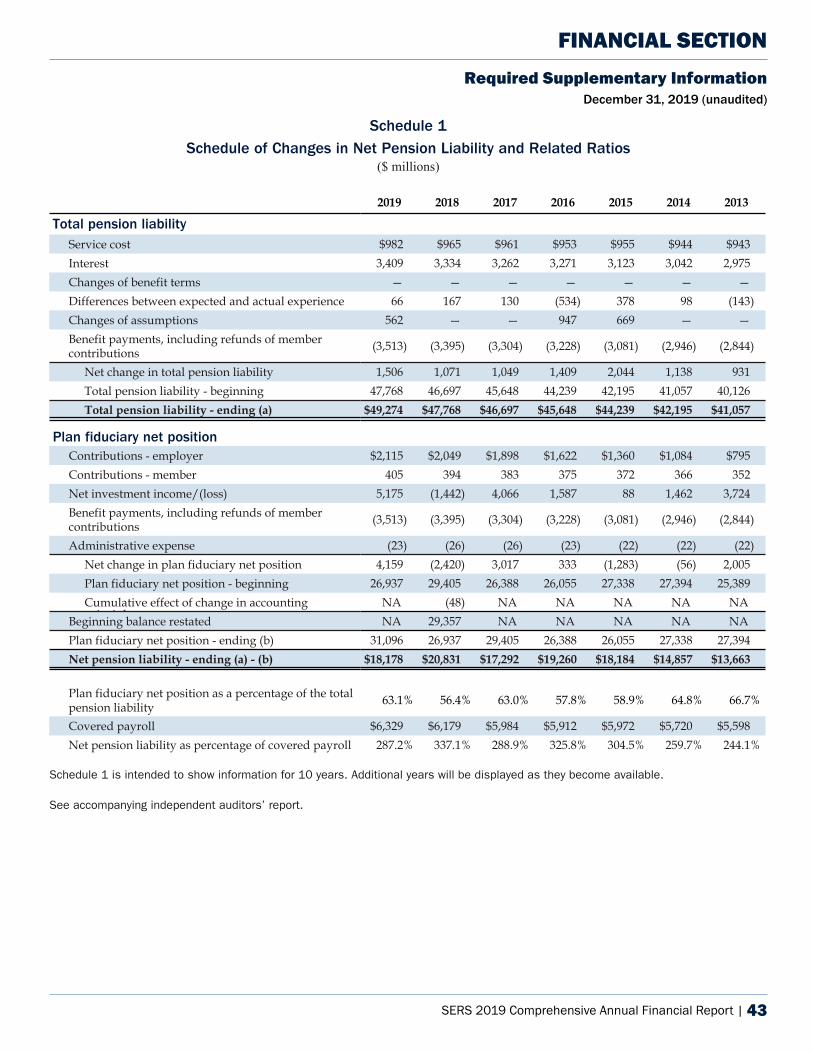
SERS 2019 Comprehensive Annual Financial Report | 43
Required Supplementary Information December 31, 2019 (unaudited)
FINANCIAL SECTION
Schedule 1Schedule of Changes in Net Pension Liability and Related Ratios
($ millions)
2019 2018 2017 2016 2015 2014 2013
Total pension liabilityService cost $982 $965 $961 $953 $955 $944 $943 Interest 3,409 3,334 3,262 3,271 3,123 3,042 2,975 Changes of benefit terms — — — — — — — Differences between expected and actual experience 66 167 130 (534) 378 98 (143) Changes of assumptions 562 — — 947 669 — — Benefit payments, including refunds of membercontributions (3,513) (3,395) (3,304) (3,228) (3,081) (2,946) (2,844)
Net change in total pension liability 1,506 1,071 1,049 1,409 2,044 1,138 931 Total pension liability - beginning 47,768 46,697 45,648 44,239 42,195 41,057 40,126 Total pension liability - ending (a) $49,274 $47,768 $46,697 $45,648 $44,239 $42,195 $41,057
Plan fiduciary net positionContributions - employer $2,115 $2,049 $1,898 $1,622 $1,360 $1,084 $795 Contributions - member 405 394 383 375 372 366 352 Net investment income/(loss) 5,175 (1,442) 4,066 1,587 88 1,462 3,724 Benefit payments, including refunds of membercontributions (3,513) (3,395) (3,304) (3,228) (3,081) (2,946) (2,844)
Administrative expense (23) (26) (26) (23) (22) (22) (22) Net change in plan fiduciary net position 4,159 (2,420) 3,017 333 (1,283) (56) 2,005 Plan fiduciary net position - beginning 26,937 29,405 26,388 26,055 27,338 27,394 25,389 Cumulative effect of change in accounting principle
NA (48) NA NA NA NA NABeginning balance restated NA 29,357 NA NA NA NA NAPlan fiduciary net position - ending (b) 31,096 26,937 29,405 26,388 26,055 27,338 27,394 Net pension liability - ending (a) - (b) $18,178 $20,831 $17,292 $19,260 $18,184 $14,857 $13,663
Plan fiduciary net position as a percentage of the total pension liability 63.1% 56.4% 63.0% 57.8% 58.9% 64.8% 66.7%
Covered payroll $6,329 $6,179 $5,984 $5,912 $5,972 $5,720 $5,598 Net pension liability as percentage of covered payroll 287.2% 337.1% 288.9% 325.8% 304.5% 259.7% 244.1%
Schedule 1 is intended to show information for 10 years. Additional years will be displayed as they become available.
See accompanying independent auditors’ report.
Commonwealth of Pennsylvania State Employees’ Retirement SystemRequired Supplementary InformationDecember 31, 2019 (unaudited)
SERS 2019 Financial Statements | 45
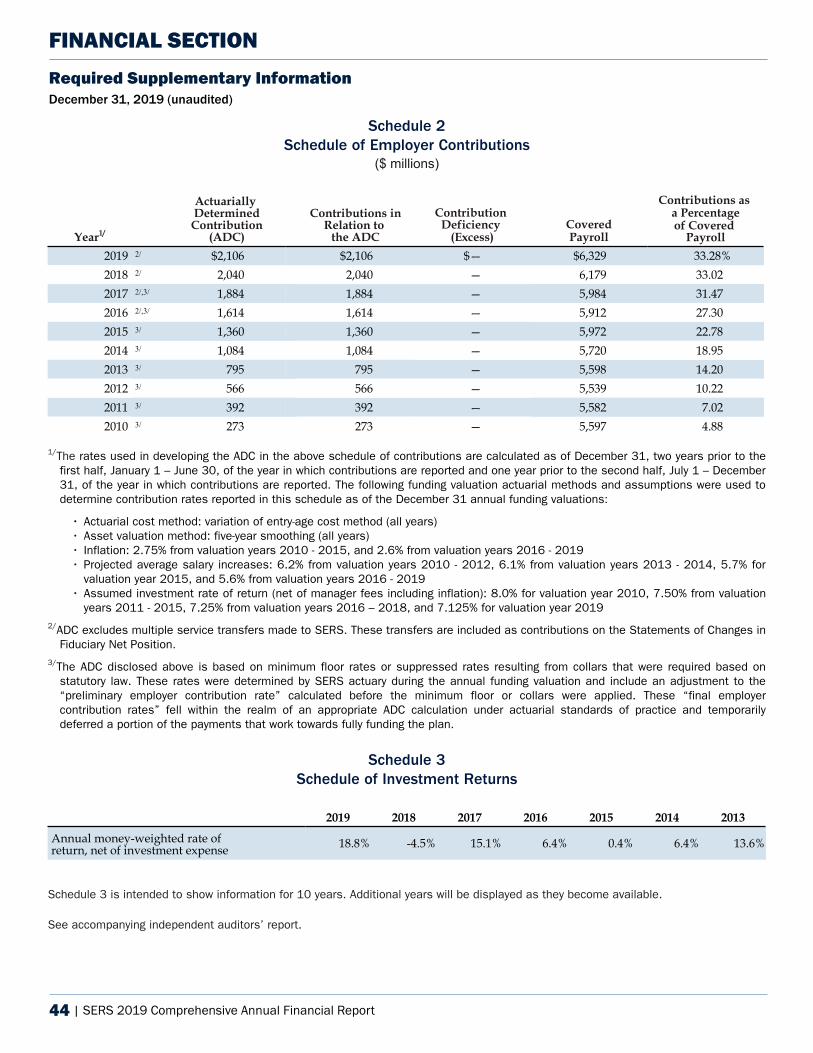
44 | SERS 2019 Comprehensive Annual Financial Report
Required Supplementary Information December 31, 2019 (unaudited)
FINANCIAL SECTION
Schedule 2Schedule of Employer Contributions
($ millions)
Year1/
Actuarially Determined
Contribution (ADC)
Contributions in Relation to
the ADC
Contribution Deficiency
(Excess)CoveredPayroll
Contributions as a Percentageof Covered
Payroll
2019 2/ $2,106 $2,106 $— $6,329 33.28 %2018 2/ 2,040 2,040 — 6,179 33.02 2017 2/,3/ 1,884 1,884 — 5,984 31.47 2016 2/,3/ 1,614 1,614 — 5,912 27.30 2015 3/ 1,360 1,360 — 5,972 22.78 2014 3/ 1,084 1,084 — 5,720 18.95 2013 3/ 795 795 — 5,598 14.20 2012 3/ 566 566 — 5,539 10.22 2011 3/ 392 392 — 5,582 7.02 2010 3/ 273 273 — 5,597 4.88
1/The rates used in developing the ADC in the above schedule of contributions are calculated as of December 31, two years prior to the first half, January 1 – June 30, of the year in which contributions are reported and one year prior to the second half, July 1 – December 31, of the year in which contributions are reported. The following funding valuation actuarial methods and assumptions were used to determine contribution rates reported in this schedule as of the December 31 annual funding valuations:
• Actuarial cost method: variation of entry-age cost method (all years)• Asset valuation method: five-year smoothing (all years)• Inflation: 2.75% from valuation years 2010 - 2015, and 2.6% from valuation years 2016 - 2019• Projected average salary increases: 6.2% from valuation years 2010 - 2012, 6.1% from valuation years 2013 - 2014, 5.7% for
valuation year 2015, and 5.6% from valuation years 2016 - 2019• Assumed investment rate of return (net of manager fees including inflation): 8.0% for valuation year 2010, 7.50% from valuation
years 2011 - 2015, 7.25% from valuation years 2016 – 2018, and 7.125% for valuation year 20192/ADC excludes multiple service transfers made to SERS. These transfers are included as contributions on the Statements of Changes in
Fiduciary Net Position.3/The ADC disclosed above is based on minimum floor rates or suppressed rates resulting from collars that were required based on
statutory law. These rates were determined by SERS actuary during the annual funding valuation and include an adjustment to the “preliminary employer contribution rate” calculated before the minimum floor or collars were applied. These “final employer contribution rates” fell within the realm of an appropriate ADC calculation under actuarial standards of practice and temporarily deferred a portion of the payments that work towards fully funding the plan.
Schedule 3Schedule of Investment Returns
2019 2018 2017 2016 2015 2014 2013
Annual money-weighted rate ofreturn, net of investment expense 18.8 % -4.5 % 15.1 % 6.4 % 0.4 % 6.4 % 13.6 %
Schedule 3 is intended to show information for 10 years. Additional years will be displayed as they become available.
See accompanying independent auditors’ report.
Commonwealth of Pennsylvania State Employees’ Retirement SystemRequired Supplementary Information
December 31, 2019 (unaudited)
46 | SERS 2019 Financial Statements
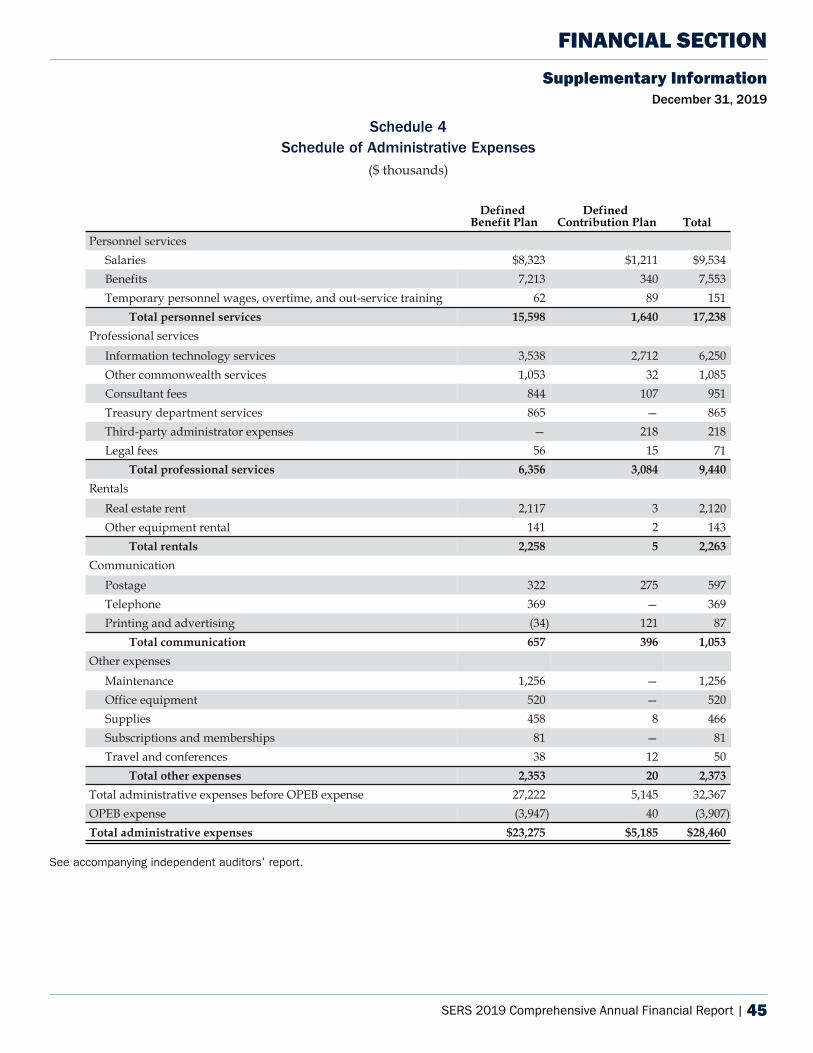
SERS 2019 Comprehensive Annual Financial Report | 45
Supplementary Information December 31, 2019
FINANCIAL SECTION
Schedule 4Schedule of Administrative Expenses
($ thousands)
Defined Benefit Plan
Defined Contribution Plan Total
Personnel servicesSalaries $8,323 $1,211 $9,534 Benefits 7,213 340 7,553 Temporary personnel wages, overtime, and out-service training 62 89 151
Total personnel services 15,598 1,640 17,238
Professional servicesInformation technology services 3,538 2,712 6,250 Other commonwealth services 1,053 32 1,085 Consultant fees 844 107 951 Treasury department services 865 — 865 Third-party administrator expenses — 218 218 Legal fees 56 15 71
Total professional services 6,356 3,084 9,440
RentalsReal estate rent 2,117 3 2,120 Other equipment rental 141 2 143
Total rentals 2,258 5 2,263
CommunicationPostage 322 275 597 Telephone 369 — 369 Printing and advertising (34) 121 87
Total communication 657 396 1,053
Other expensesMaintenance 1,256 — 1,256 Office equipment 520 — 520 Supplies 458 8 466 Subscriptions and memberships 81 — 81 Travel and conferences 38 12 50
Total other expenses 2,353 20 2,373
Total administrative expenses before OPEB expense 27,222 5,145 32,367 OPEB expense (3,947) 40 (3,907) Total administrative expenses $23,275 $5,185 $28,460
See accompanying independent auditors’ report.
Commonwealth of Pennsylvania State Employees’ Retirement SystemSupplementary InformationYear ended December 31, 2019
SERS 2019 Financial Statements | 47
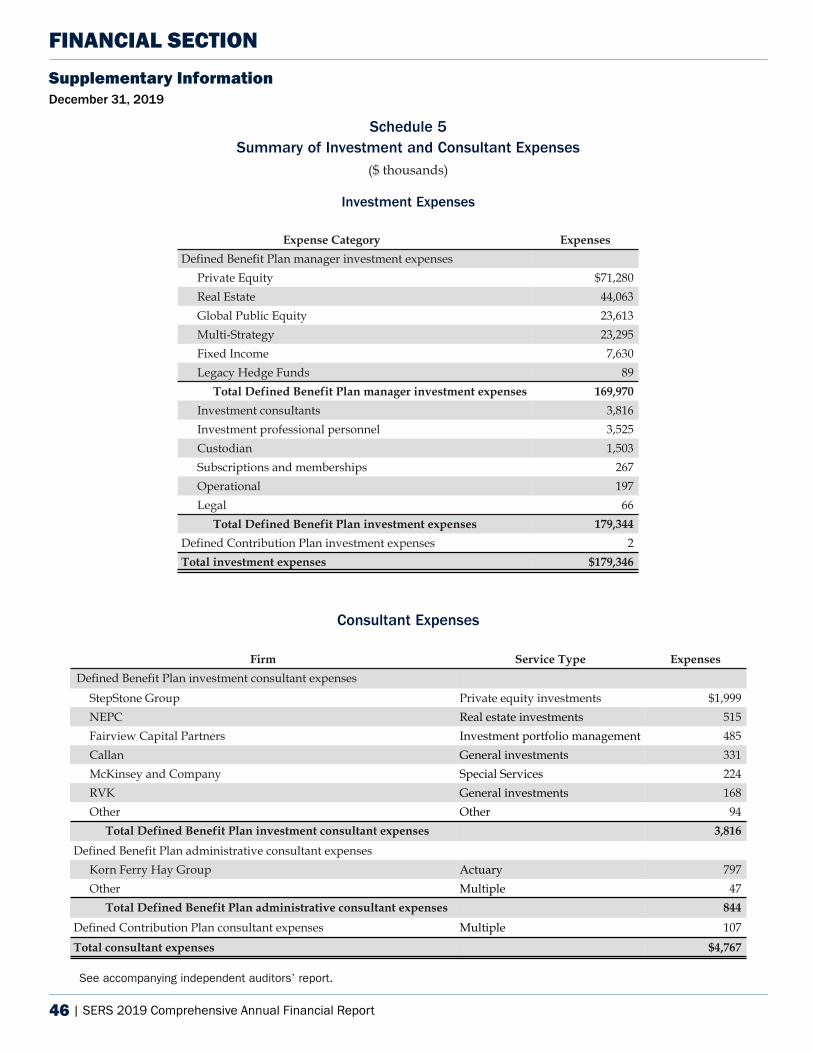
46 | SERS 2019 Comprehensive Annual Financial Report
Supplementary Information December 31, 2019
FINANCIAL SECTION
Schedule 5Summary of Investment and Consultant Expenses
($ thousands)
Investment Expenses
Expense Category Expenses
Defined Benefit Plan manager investment expensesPrivate Equity $71,280 Real Estate 44,063 Global Public Equity 23,613 Multi-Strategy 23,295 Fixed Income 7,630 Legacy Hedge Funds 89
Total Defined Benefit Plan manager investment expenses 169,970
Investment consultants 3,816 Investment professional personnel 3,525 Custodian 1,503 Subscriptions and memberships 267 Operational 197 Legal 66
Total Defined Benefit Plan investment expenses 179,344
Defined Contribution Plan investment expenses 2 Total investment expenses $179,346
Consultant Expenses
Firm Service Type Expenses
Defined Benefit Plan investment consultant expensesStepStone Group Private equity investments $1,999 NEPC Real estate investments 515 Fairview Capital Partners Investment portfolio management 485 Callan General investments 331 McKinsey and Company Special Services 224 RVK General investments 168 Other Other 94
Total Defined Benefit Plan investment consultant expenses 3,816
Defined Benefit Plan administrative consultant expensesKorn Ferry Hay Group Actuary 797 Other Multiple 47
Total Defined Benefit Plan administrative consultant expenses 844
Defined Contribution Plan consultant expenses Multiple 107 Total consultant expenses $4,767
See accompanying independent auditors’ report.
Commonwealth of Pennsylvania State Employees’ Retirement SystemSupplementary Information
Year ended December 31, 2019
48 | SERS 2019 Financial Statements
Investment Section
2019
SERS 2019 Comprehensive Annual Financial Report | 47
May 28, 2020
State Employees’ Retirement Board and Executive Director State Employees’ Retirement System 30 North Third Street, Suite 150Harrisburg, Pennsylvania 17101
On behalf of SERS’ investment office, I am pleased to present the investment section of the Pennsylvania State Employees’ Retirement System (SERS) Comprehensive Annual Financial Report for calendar year 2019. The SERS Board administers a Defined Benefit Plan with approximately $31.1 billion in assets, a Defined Contribution Plan with approximately $12.4 million in assets, and a voluntary Deferred Compensation Plan offered to members with approximately $3.9 billion in assets.
SERS’ Defined Benefit Plan investment performance for the calendar year ended December 31, 2019, was 18.8%, net of investment management fees. This compares to a 2018 calendar year return of –4.6% net of investment management fees. While year-to-year returns are important, as long-term investors a longer time horizon is a more appropriate view of SERS’ returns. The end of 2019 marks 10-, 15-, 20-, and 25-year periods of returns of 8.1%, 6.7%, 6.0%, and 8.4% (net of fees), respectively.
SERS’ funded status as a percentage of total pension liability was approximately 56.5% (actuarial value), as of December 31, 2019. SERS’ Board considers its funded status in selecting its risk tolerance, and as such SERS prioritizes an asset allocation to meet the long-term actuarial assumed rate of return, while maintaining an allocation to address the shorter-term liquidity needs of its members.
A number of key accomplishments were achieved in 2019, several of which are documented below. The investment section of this report provides further information regarding the investment program.
• Maintained low annual Defined Benefit Plan investment manager expenses paid to external firms of 58.3 basis points.
• In December 2019, adopted a new Target Asset Allocation Policy, which was designed to achieve SERS’ investment return assumption of 7.125%, reduce annual investment manager fees, increase the allocation to liquid assets with low correlation to the public equity markets, and reduce the allocation to less liquid assets.
• Consolidated and streamlined five documents into the new SERS’ Defined Benefit Plan Investment Policy Statement.
• Worked with SERS’ General Consultant to present an Asset/Liability Study that fully links all three aspects of a plan’s key financial drivers –Investment Policy, Contribution Policy, and Benefit Policy.
• Enhanced transparency by requiring general partners of new investment opportunities in private markets to provide SERS with the information found within the Institutional Limited Partners Association (ILPA) Reporting Template and requested general partners of existing investments in private markets to provide SERS with the information found within the ILPA Reporting Template.
30 NORTH 3RD STREET, SUITE 150 | HARRISBURG, PA 17101-1716
P: 1.800.633.5461 | F: 717.237.0346 | www.SERS.pa.gov
48 | SERS 2019 Comprehensive Annual Financial Report
• Enhanced quarterly performance reports by reporting both net-of-fee and gross-of-fee returns on a prospective basis, effective with the 1st Quarter 2020 performance report. Also, will report total fund performance against a commonly understood reference portfolio benchmark (e.g., global 60/40 index), and include graphically rolling returns over the last five years.
• Developed a semi-annual performance report in consultation with SERS’ private market specialty consultants for public dissemination beginning with the semi-annual reporting period ending June 30, 2019. Assisted the SERS Board Chair and Executive Director by developing a process to request data from several hundred SERS’ private market general partners to obtain permission to disclose additional details, with a great deal of success.
• Implemented a newly established Defined Contribution Plan.
• Optimized the investment lineup in the Deferred Compensation Plan, effective January 2020, by replacing the risk-profile funds with target date funds and added a more diverse international equity option, which aligns more closely to the Defined Contribution Plan investment lineup to reduce participant confusion.
• Committed $2.1 billion to best-in-class private market funds.
• Expanded private equity co-investment program that will build upon SERS’ investment capabilities and seek to improve efficiency of expected private equity returns relative to risk in a lower-cost manner.
• Recruited to fill three vacancies including a Managing Director, Portfolio Manager, and Analyst.
The SERS Investment Office continues to operate efficiently and effectively during the current challenging and changing global economic conditions. I remain confident that with a focus on the SERS mission, thoughtful leadership from the board, and a disciplined investment process aligned with the investment objectives, SERS and its members will continue on the path of financial security.
Sincerely,
James G. NolanActing Chief Investment Officer
30 NORTH 3RD STREET, SUITE 150 | HARRISBURG, PA 17101-1716
P: 1.800.633.5461 | F: 717.237.0346 | www.SERS.pa.gov
SERS 2019 Comprehensive Annual Financial Report | 49
Investment Policy and ObjectivesDecember 31, 2019 (unaudited)
INVESTMENT SECTION
Investment PolicyThe SERS Board originally adopted a formal Statement of Investment Policy (policy) in 1979. It has been revised periodically to reflect and incorporate legislative changes governing investments and amendments to policies and procedures guiding the investment of the defined benefit portfolio. The information presented in the Investment Section of the 2019 CAFR references the Commonwealth of Pennsylvania State Employees’ Retirement Board Statement of Investment Policy Adopted April 21, 2004 and Amended March 8, 2017, as this was the governing policy in place during the 2019 reporting period.
The purpose of the policy is to formalize the board’s investment objectives and policies, and to define the duties and responsibilities of the various individuals and entities involved in the investment process.
The major elements of the policy are:
• The assets of the SERS Fund will be managed with the primary objectives of the payment of benefit obligations to participants in the plans as well as to maximize return with acceptable risk considerations and sufficient liquidity so that employer contributions can be minimized.
• The SERS Fund’s overall investment objective is to provide a total rate of return, over full economic cycles, which achieves SERS’ long-term actuarially assumed rate of return consistent with the board’s tolerance for risk.
• The board’s investment authority is governed by the prudent investor standard as set forth in Title 71, Pennsylvania Consolidated Statutes, Section 5931(a).
• The members of the board, employees of the board, and agents thereof shall stand in a fiduciary relationship to the members of the system regarding the investments and disbursements of any of the moneys of the fund and shall not profit either directly or indirectly with respect thereto.
• The board employs an investment staff which is responsible to the board to review and analyze the current investment climate, and to recommend adjustments with respect to the policy that are appropriate to take optimum advantage of new conditions and strategies as they arise in the market place. The staff also reviews and analyzes the philosophies, policies, and strategies employed by the investment managers, evaluating the appropriateness of their decision–making processes and their investment styles in relation to present and projected investment horizons.
• The board continually seeks to employ investment managers that possess superior capabilities in the management of assets of public retirement systems. Each manager has full discretion to carry out its investment mandate subject to the investment strategy statement contained in the investment management agreement and will be expected to conduct business on behalf of SERS in accordance with the mandate for which they were retained.
• SERS will employ investment consultants, who act as fiduciaries to the fund, and who will provide investment consulting services in their respective areas of expertise.
50 | SERS 2019 Comprehensive Annual Financial Report
• Where investment characteristics are equivalent, the policy will favor investments that will have a positive impact on the economy of the Commonwealth of Pennsylvania.
• SERS instituted an Emerging Investment Manager Program designed to identify and gain early access to talented investment managers in their early stages to generate above benchmark returns (net of fees).
Investment ObjectivesAs indicated in the Commonwealth of Pennsylvania State Employees’ Retirement Board Statement of Investment Policy Adopted April 21, 2004 and Amended March 8, 2017, the objectives of the SERS Fund are to provide benefit payments to participants and beneficiaries at the lowest cost to the commonwealth and to fund the program through a carefully planned and executed investment program.
Consistent with achieving these objectives, the board has established the following goals relative to investment performance:
• Achieve a net total return equivalent to the actuarial assumed rate of return, or
Investment Policy and ObjectivesDecember 31, 2019 (unaudited)
INVESTMENT SECTION
preferably, in excess of this rate in order to improve the funded ratio of the SERS Fund through investment earnings and favorably impact future employer and employee contribution rates.
• Achieve a net, total long-term return that meets or exceeds an appropriate, composite plan benchmark index on a five- to 10-year rolling time horizon. The composite benchmark index will be based on the asset allocation set forth in the investment plan approved by the board.
In December 2019, the SERS Board adopted a revised statement of investment policy, SERS’ Defined Benefit Plan and Investment Policy Statement, which included a new 10-year asset allocation strategy designed to further mitigate risk, reduce external management fees, and increase fund liquidity while meeting its long-term return assumption. The new asset allocation targets increased exposure to liquid, fixed income-oriented investments while simultaneously reducing exposure to less liquid non-traditional strategies.
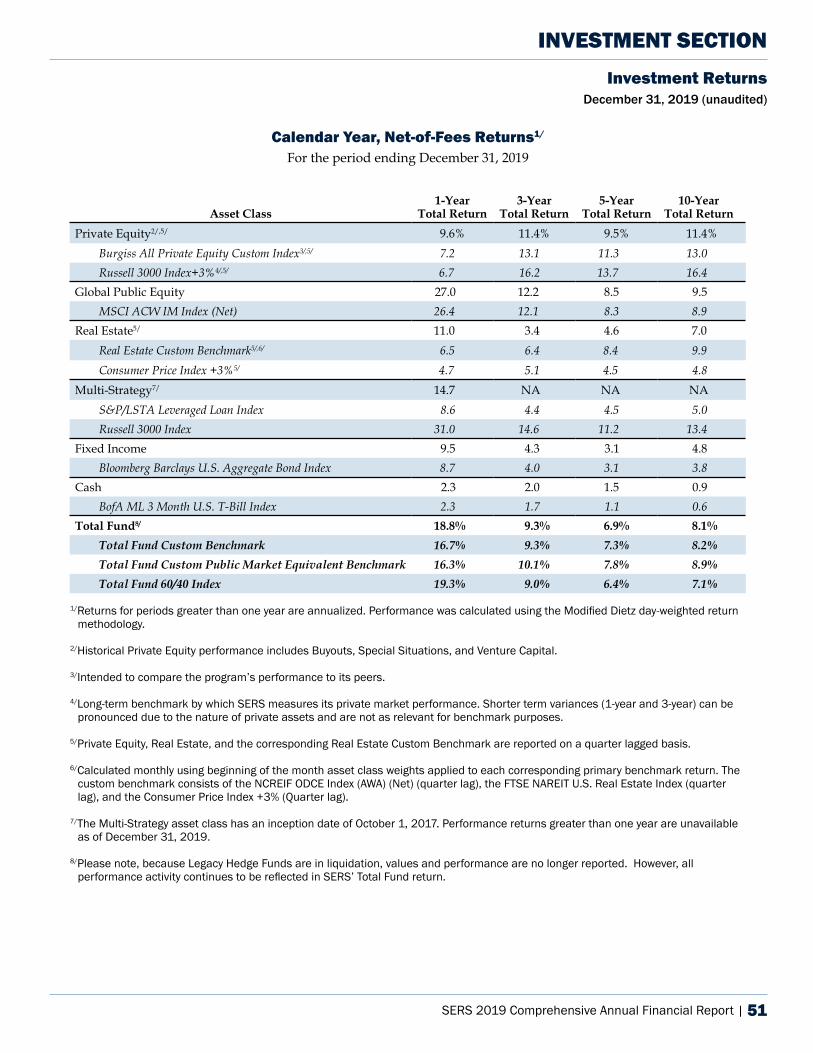
SERS 2019 Comprehensive Annual Financial Report | 51
Calendar Year, Net-of-Fees Returns1/
For the period ending December 31, 2019
Investment ReturnsDecember 31, 2019 (unaudited)
INVESTMENT SECTION
Asset Class1-Year
Total Return3-Year
Total Return5-Year
Total Return10-Year
Total ReturnPrivate Equity2/,5/ 9.6% 11.4% 9.5% 11.4%
Burgiss All Private Equity Custom Index3/,5/ 7.2 13.1 11.3 13.0Russell 3000 Index+3%4/,5/ 6.7 16.2 13.7 16.4
Global Public Equity 27.0 12.2 8.5 9.5MSCI ACW IM Index (Net) 26.4 12.1 8.3 8.9
Real Estate5/ 11.0 3.4 4.6 7.0Real Estate Custom Benchmark5/,6/ 6.5 6.4 8.4 9.9Consumer Price Index +3%5/ 4.7 5.1 4.5 4.8
Multi-Strategy7/ 14.7 NA NA NAS&P/LSTA Leveraged Loan Index 8.6 4.4 4.5 5.0Russell 3000 Index 31.0 14.6 11.2 13.4
Fixed Income 9.5 4.3 3.1 4.8Bloomberg Barclays U.S. Aggregate Bond Index 8.7 4.0 3.1 3.8
Cash 2.3 2.0 1.5 0.9BofA ML 3 Month U.S. T-Bill Index 2.3 1.7 1.1 0.6
Total Fund8/ 18.8% 9.3% 6.9% 8.1%Total Fund Custom Benchmark 16.7% 9.3% 7.3% 8.2%Total Fund Custom Public Market Equivalent Benchmark 16.3% 10.1% 7.8% 8.9%Total Fund 60/40 Index 19.3% 9.0% 6.4% 7.1%
1/Returns for periods greater than one year are annualized. Performance was calculated using the Modified Dietz day-weighted return methodology.
2/Historical Private Equity performance includes Buyouts, Special Situations, and Venture Capital.
3/Intended to compare the program’s performance to its peers.
4/Long-term benchmark by which SERS measures its private market performance. Shorter term variances (1-year and 3-year) can be pronounced due to the nature of private assets and are not as relevant for benchmark purposes.
5/Private Equity, Real Estate, and the corresponding Real Estate Custom Benchmark are reported on a quarter lagged basis.
6/Calculated monthly using beginning of the month asset class weights applied to each corresponding primary benchmark return. The custom benchmark consists of the NCREIF ODCE Index (AWA) (Net) (quarter lag), the FTSE NAREIT U.S. Real Estate Index (quarter lag), and the Consumer Price Index +3% (Quarter lag).
7/The Multi-Strategy asset class has an inception date of October 1, 2017. Performance returns greater than one year are unavailable as of December 31, 2019.
8/Please note, because Legacy Hedge Funds are in liquidation, values and performance are no longer reported. However, all performance activity continues to be reflected in SERS’ Total Fund return.
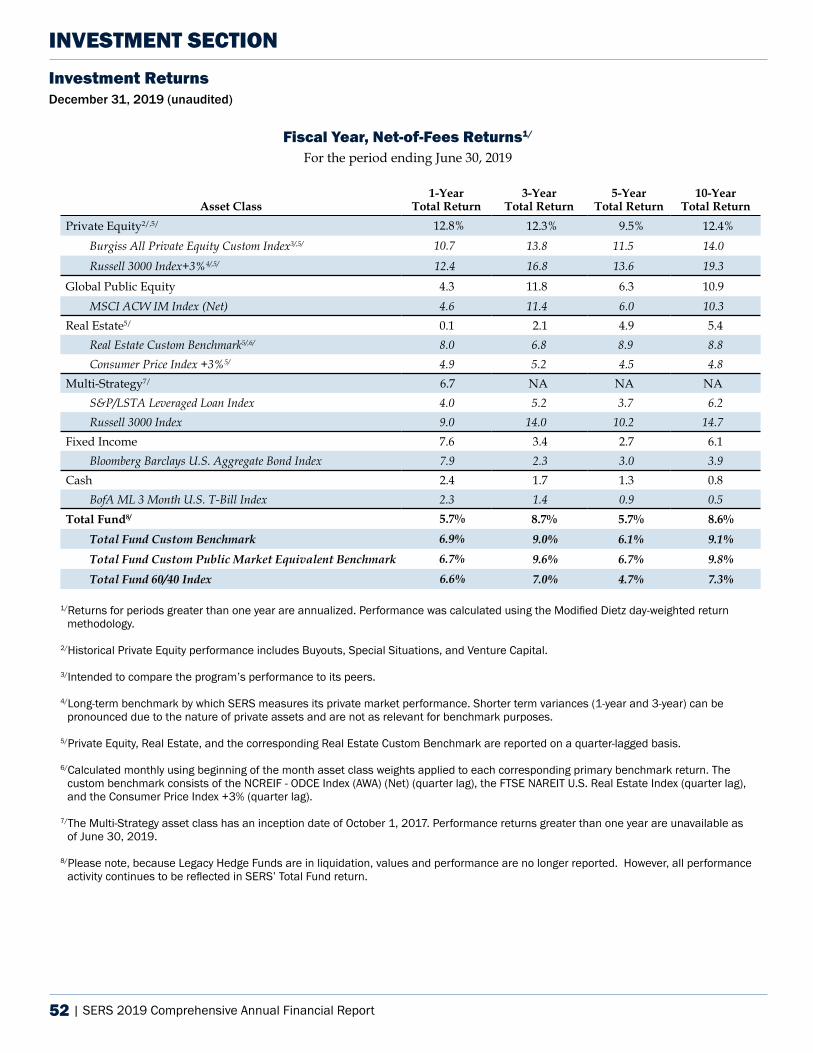
52 | SERS 2019 Comprehensive Annual Financial Report
Investment ReturnsDecember 31, 2019 (unaudited)
INVESTMENT SECTION
Fiscal Year, Net-of-Fees Returns1/ For the period ending June 30, 2019
Asset Class1-Year
Total Return3-Year
Total Return5-Year
Total Return10-Year
Total ReturnPrivate Equity2/,5/ 12.8% 12.3% 9.5% 12.4%
Burgiss All Private Equity Custom Index3/,5/ 10.7 13.8 11.5 14.0 Russell 3000 Index+3%4/,5/ 12.4 16.8 13.6 19.3
Global Public Equity 4.3 11.8 6.3 10.9 MSCI ACW IM Index (Net) 4.6 11.4 6.0 10.3
Real Estate5/ 0.1 2.1 4.9 5.4 Real Estate Custom Benchmark5/,6/ 8.0 6.8 8.9 8.8 Consumer Price Index +3%5/ 4.9 5.2 4.5 4.8
Multi-Strategy7/ 6.7 NA NA NA S&P/LSTA Leveraged Loan Index 4.0 5.2 3.7 6.2 Russell 3000 Index 9.0 14.0 10.2 14.7
Fixed Income 7.6 3.4 2.7 6.1 Bloomberg Barclays U.S. Aggregate Bond Index 7.9 2.3 3.0 3.9
Cash 2.4 1.7 1.3 0.8 BofA ML 3 Month U.S. T-Bill Index 2.3 1.4 0.9 0.5
Total Fund8/ 5.7% 8.7% 5.7% 8.6%Total Fund Custom Benchmark 6.9% 9.0% 6.1% 9.1%Total Fund Custom Public Market Equivalent Benchmark 6.7% 9.6% 6.7% 9.8%Total Fund 60/40 Index 6.6% 7.0% 4.7% 7.3%
1/Returns for periods greater than one year are annualized. Performance was calculated using the Modified Dietz day-weighted return methodology.
2/Historical Private Equity performance includes Buyouts, Special Situations, and Venture Capital.
3/Intended to compare the program’s performance to its peers.
4/Long-term benchmark by which SERS measures its private market performance. Shorter term variances (1-year and 3-year) can be pronounced due to the nature of private assets and are not as relevant for benchmark purposes.
5/Private Equity, Real Estate, and the corresponding Real Estate Custom Benchmark are reported on a quarter-lagged basis.
6/Calculated monthly using beginning of the month asset class weights applied to each corresponding primary benchmark return. The custom benchmark consists of the NCREIF - ODCE Index (AWA) (Net) (quarter lag), the FTSE NAREIT U.S. Real Estate Index (quarter lag), and the Consumer Price Index +3% (quarter lag).
7/The Multi-Strategy asset class has an inception date of October 1, 2017. Performance returns greater than one year are unavailable as of June 30, 2019.
8/Please note, because Legacy Hedge Funds are in liquidation, values and performance are no longer reported. However, all performance activity continues to be reflected in SERS’ Total Fund return.
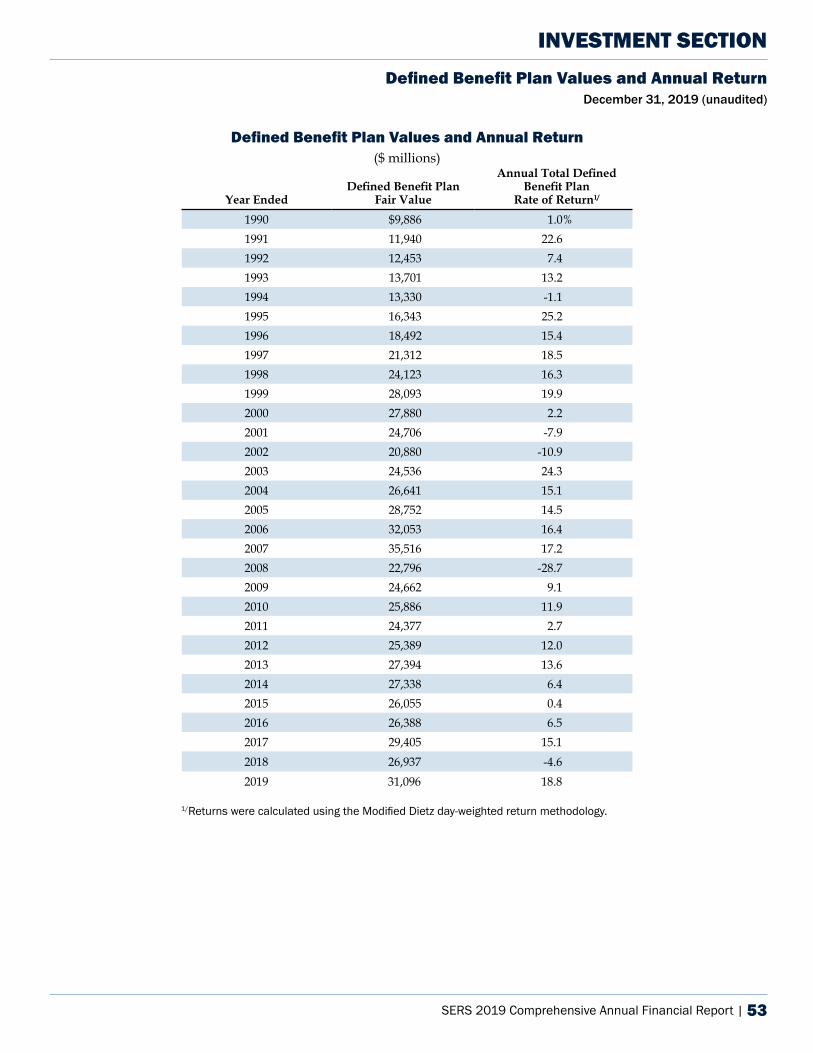
SERS 2019 Comprehensive Annual Financial Report | 53
Defined Benefit Plan Values and Annual Return December 31, 2019 (unaudited)
INVESTMENT SECTION
Defined Benefit Plan Values and Annual Return($ millions)
Year EndedDefined Benefit Plan
Fair Value
Annual Total Defined Benefit Plan
Rate of Return1/
1990 $9,886 1.0%1991 11,940 22.61992 12,453 7.41993 13,701 13.21994 13,330 -1.11995 16,343 25.21996 18,492 15.41997 21,312 18.51998 24,123 16.31999 28,093 19.92000 27,880 2.22001 24,706 -7.92002 20,880 -10.92003 24,536 24.32004 26,641 15.12005 28,752 14.52006 32,053 16.42007 35,516 17.22008 22,796 -28.72009 24,662 9.12010 25,886 11.92011 24,377 2.72012 25,389 12.02013 27,394 13.62014 27,338 6.42015 26,055 0.42016 26,388 6.52017 29,405 15.12018 26,937 -4.62019 31,096 18.8
1/Returns were calculated using the Modified Dietz day-weighted return methodology.
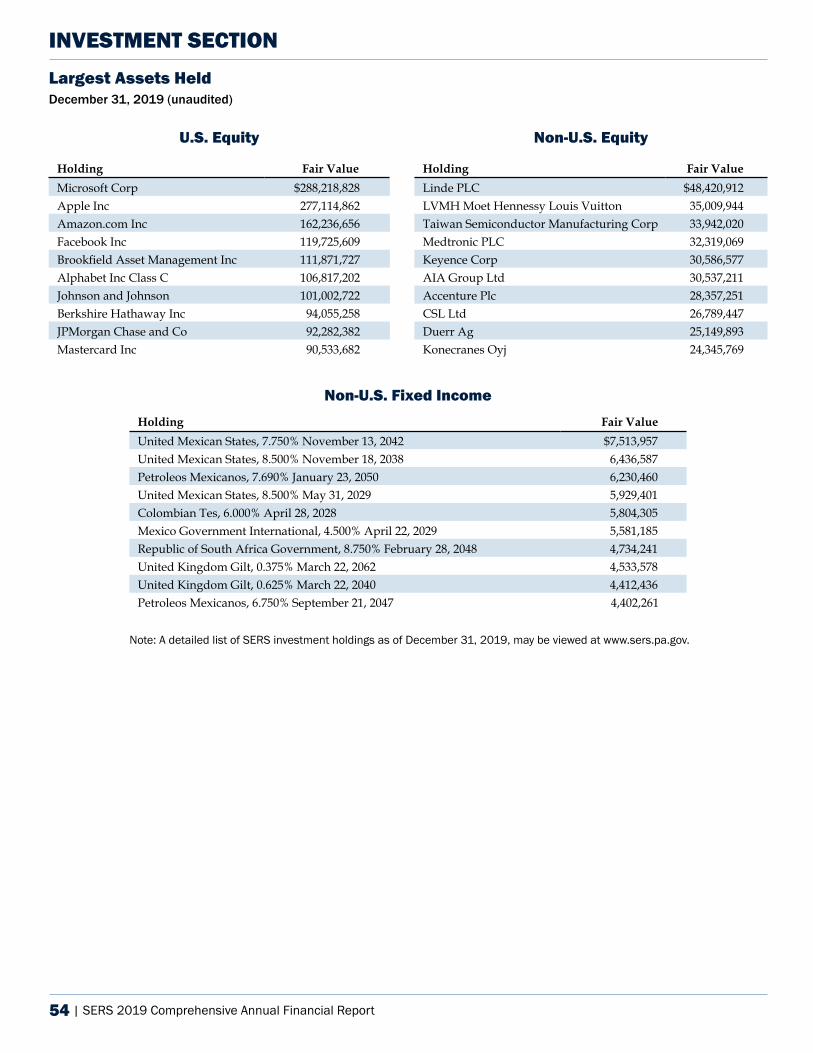
54 | SERS 2019 Comprehensive Annual Financial Report
U.S. Equity Non-U.S. Equity
Holding Fair Value Holding Fair Value Microsoft Corp $288,218,828 Linde PLC $48,420,912 Apple Inc 277,114,862 LVMH Moet Hennessy Louis Vuitton 35,009,944 Amazon.com Inc 162,236,656 Taiwan Semiconductor Manufacturing Corp 33,942,020 Facebook Inc 119,725,609 Medtronic PLC 32,319,069 Brookfield Asset Management Inc 111,871,727 Keyence Corp 30,586,577 Alphabet Inc Class C 106,817,202 AIA Group Ltd 30,537,211 Johnson and Johnson 101,002,722 Accenture Plc 28,357,251 Berkshire Hathaway Inc 94,055,258 CSL Ltd 26,789,447 JPMorgan Chase and Co 92,282,382 Duerr Ag 25,149,893 Mastercard Inc 90,533,682 Konecranes Oyj 24,345,769
Non-U.S. Fixed Income Holding Fair Value United Mexican States, 7.750% November 13, 2042 $7,513,957 United Mexican States, 8.500% November 18, 2038 6,436,587 Petroleos Mexicanos, 7.690% January 23, 2050 6,230,460 United Mexican States, 8.500% May 31, 2029 5,929,401 Colombian Tes, 6.000% April 28, 2028 5,804,305 Mexico Government International, 4.500% April 22, 2029 5,581,185 Republic of South Africa Government, 8.750% February 28, 2048 4,734,241 United Kingdom Gilt, 0.375% March 22, 2062 4,533,578 United Kingdom Gilt, 0.625% March 22, 2040 4,412,436 Petroleos Mexicanos, 6.750% September 21, 2047 4,402,261
Largest Assets Held December 31, 2019 (unaudited)
INVESTMENT SECTION
Note: A detailed list of SERS investment holdings as of December 31, 2019, may be viewed at www.sers.pa.gov.
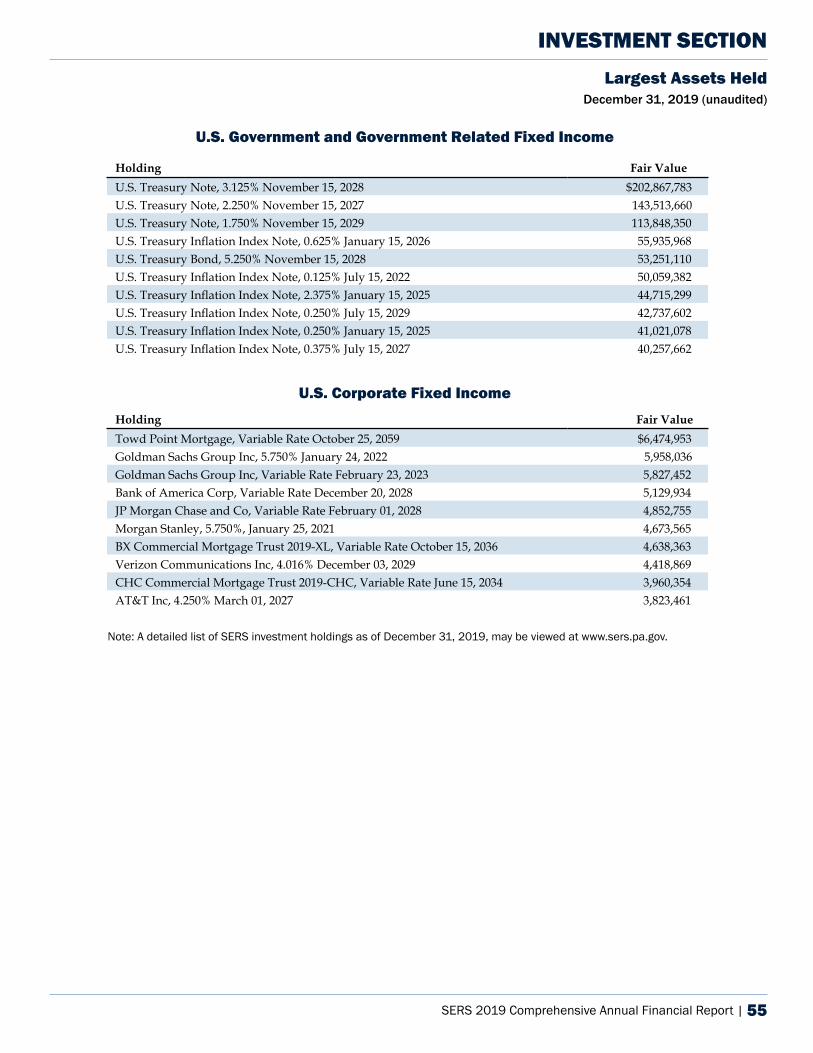
SERS 2019 Comprehensive Annual Financial Report | 55
U.S. Government and Government Related Fixed Income
Holding Fair Value U.S. Treasury Note, 3.125% November 15, 2028 $202,867,783 U.S. Treasury Note, 2.250% November 15, 2027 143,513,660 U.S. Treasury Note, 1.750% November 15, 2029 113,848,350 U.S. Treasury Inflation Index Note, 0.625% January 15, 2026 55,935,968 U.S. Treasury Bond, 5.250% November 15, 2028 53,251,110 U.S. Treasury Inflation Index Note, 0.125% July 15, 2022 50,059,382 U.S. Treasury Inflation Index Note, 2.375% January 15, 2025 44,715,299 U.S. Treasury Inflation Index Note, 0.250% July 15, 2029 42,737,602 U.S. Treasury Inflation Index Note, 0.250% January 15, 2025 41,021,078 U.S. Treasury Inflation Index Note, 0.375% July 15, 2027 40,257,662
U.S. Corporate Fixed Income Holding Fair Value Towd Point Mortgage, Variable Rate October 25, 2059 $6,474,953 Goldman Sachs Group Inc, 5.750% January 24, 2022 5,958,036 Goldman Sachs Group Inc, Variable Rate February 23, 2023 5,827,452 Bank of America Corp, Variable Rate December 20, 2028 5,129,934 JP Morgan Chase and Co, Variable Rate February 01, 2028 4,852,755 Morgan Stanley, 5.750%, January 25, 2021 4,673,565 BX Commercial Mortgage Trust 2019-XL, Variable Rate October 15, 2036 4,638,363 Verizon Communications Inc, 4.016% December 03, 2029 4,418,869 CHC Commercial Mortgage Trust 2019-CHC, Variable Rate June 15, 2034 3,960,354 AT&T Inc, 4.250% March 01, 2027 3,823,461
Note: A detailed list of SERS investment holdings as of December 31, 2019, may be viewed at www.sers.pa.gov.
Largest Assets Held December 31, 2019 (unaudited)
INVESTMENT SECTION
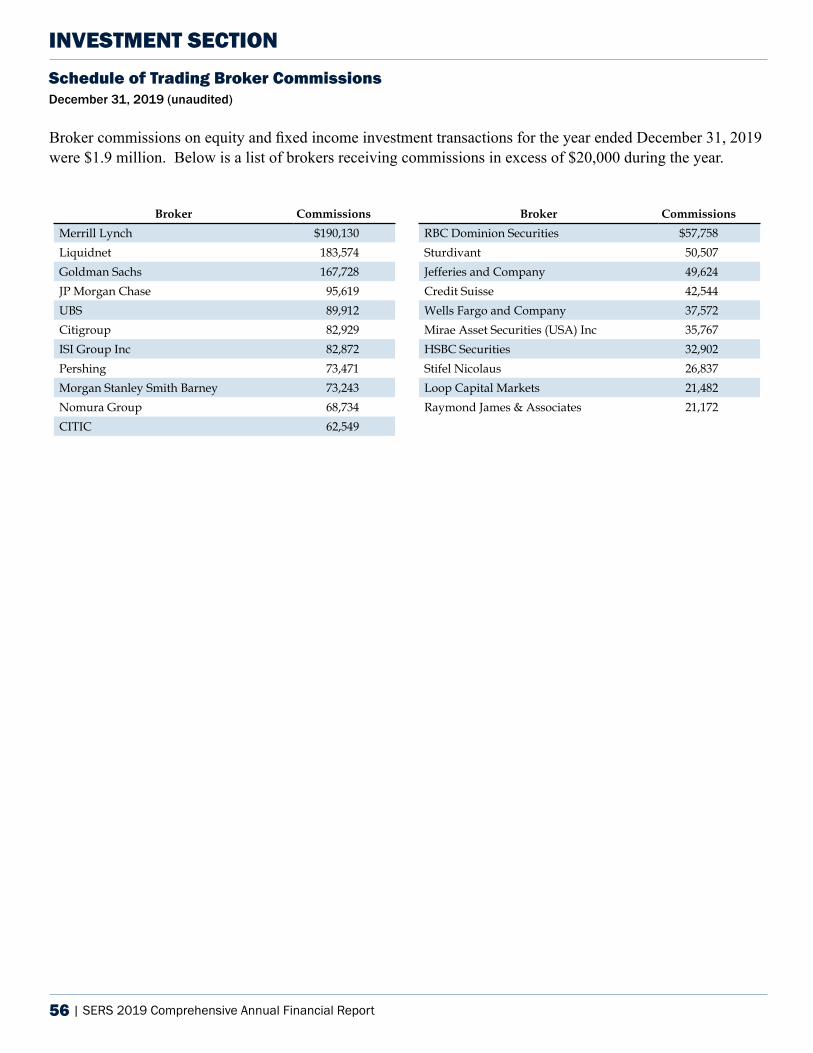
56 | SERS 2019 Comprehensive Annual Financial Report
Broker Commissions Broker Commissions Merrill Lynch $190,130 RBC Dominion Securities $57,758 Liquidnet 183,574 Sturdivant 50,507 Goldman Sachs 167,728 Jefferies and Company 49,624 JP Morgan Chase 95,619 Credit Suisse 42,544 UBS 89,912 Wells Fargo and Company 37,572 Citigroup 82,929 Mirae Asset Securities (USA) Inc 35,767 ISI Group Inc 82,872 HSBC Securities 32,902 Pershing 73,471 Stifel Nicolaus 26,837 Morgan Stanley Smith Barney 73,243 Loop Capital Markets 21,482 Nomura Group 68,734 Raymond James & Associates 21,172 CITIC 62,549
Schedule of Trading Broker CommissionsDecember 31, 2019 (unaudited)
INVESTMENT SECTION
Broker commissions on equity and fixed income investment transactions for the year ended December 31, 2019 were $1.9 million. Below is a list of brokers receiving commissions in excess of $20,000 during the year.
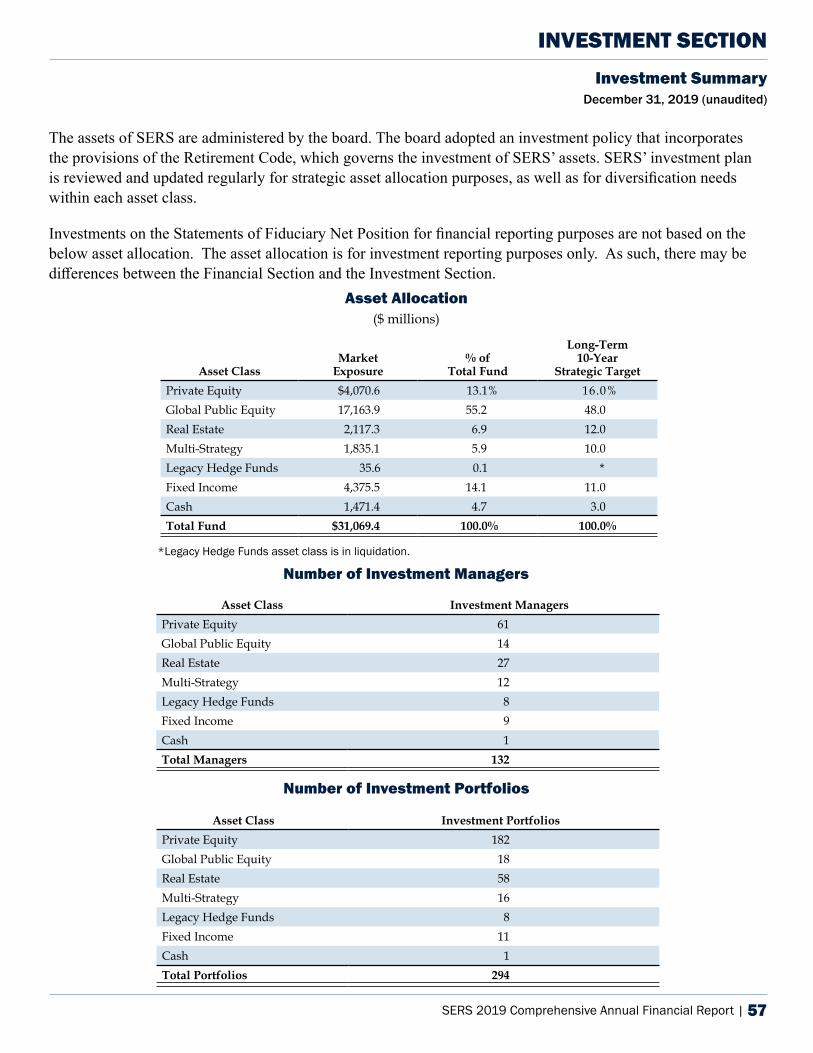
SERS 2019 Comprehensive Annual Financial Report | 57
Asset Allocation ($ millions)
Long-Term10-Year
Strategic TargetAsset ClassMarket
Exposure% of
Total FundPrivate Equity $4,070.6 13.1% 16.0%Global Public Equity 17,163.9 55.2 48.0Real Estate 2,117.3 6.9 12.0Multi-Strategy 1,835.1 5.9 10.0Legacy Hedge Funds 35.6 0.1 *Fixed Income 4,375.5 14.1 11.0Cash 1,471.4 4.7 3.0Total Fund $31,069.4 100.0% 100.0%
*Legacy Hedge Funds asset class is in liquidation.
Number of Investment Managers
Asset Class Investment ManagersPrivate Equity 61Global Public Equity 14Real Estate 27Multi-Strategy 12Legacy Hedge Funds 8Fixed Income 9Cash 1Total Managers 132
Number of Investment Portfolios
Asset Class Investment PortfoliosPrivate Equity 182Global Public Equity 18Real Estate 58Multi-Strategy 16Legacy Hedge Funds 8Fixed Income 11Cash 1Total Portfolios 294
Investment Summary December 31, 2019 (unaudited)
INVESTMENT SECTION
The assets of SERS are administered by the board. The board adopted an investment policy that incorporates the provisions of the Retirement Code, which governs the investment of SERS’ assets. SERS’ investment plan is reviewed and updated regularly for strategic asset allocation purposes, as well as for diversification needs within each asset class.
Investments on the Statements of Fiduciary Net Position for financial reporting purposes are not based on the below asset allocation. The asset allocation is for investment reporting purposes only. As such, there may be differences between the Financial Section and the Investment Section.
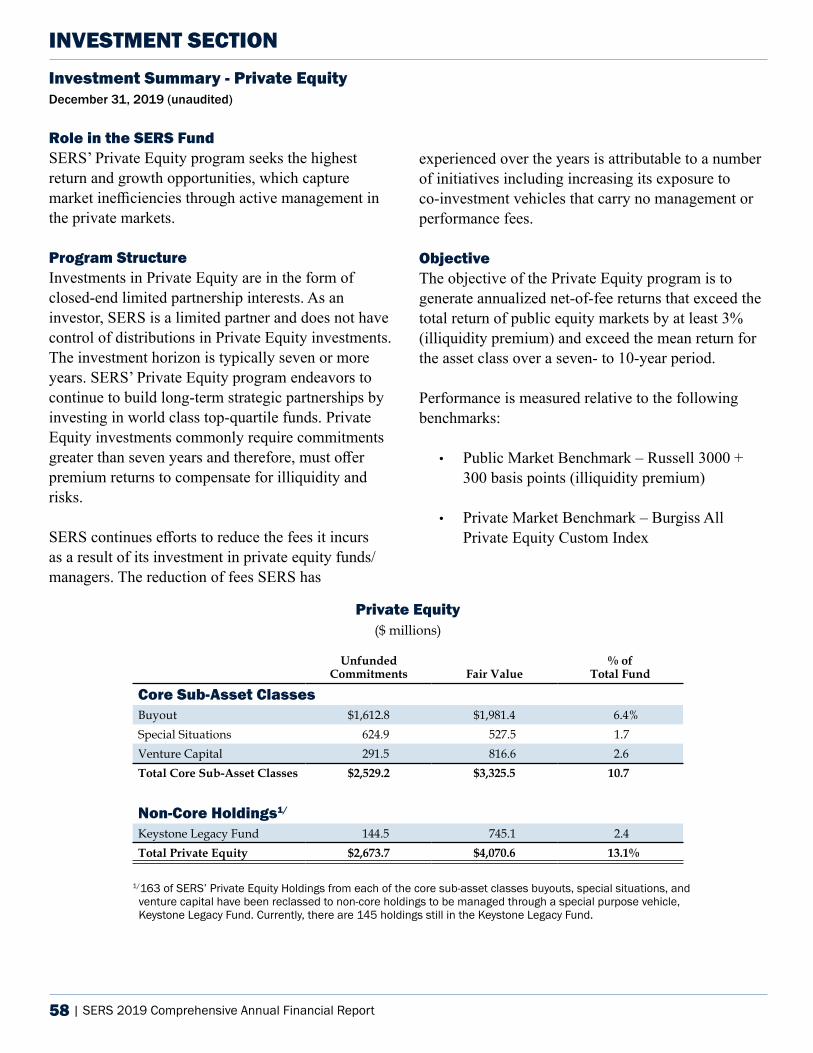
58 | SERS 2019 Comprehensive Annual Financial Report
Investment Summary - Private Equity December 31, 2019 (unaudited)
INVESTMENT SECTION
Role in the SERS Fund SERS’ Private Equity program seeks the highest return and growth opportunities, which capture market inefficiencies through active management in the private markets.
Program StructureInvestments in Private Equity are in the form of closed-end limited partnership interests. As an investor, SERS is a limited partner and does not have control of distributions in Private Equity investments. The investment horizon is typically seven or more years. SERS’ Private Equity program endeavors to continue to build long-term strategic partnerships by investing in world class top-quartile funds. Private Equity investments commonly require commitments greater than seven years and therefore, must offer premium returns to compensate for illiquidity and risks.
SERS continues efforts to reduce the fees it incurs as a result of its investment in private equity funds/managers. The reduction of fees SERS has
experienced over the years is attributable to a number of initiatives including increasing its exposure to co-investment vehicles that carry no management or performance fees.
ObjectiveThe objective of the Private Equity program is to generate annualized net-of-fee returns that exceed thetotal return of public equity markets by at least 3% (illiquidity premium) and exceed the mean return for the asset class over a seven- to 10-year period. Performance is measured relative to the following benchmarks:
• Public Market Benchmark – Russell 3000 + 300 basis points (illiquidity premium)
• Private Market Benchmark – Burgiss All Private Equity Custom Index
Private Equity($ millions)
Unfunded Commitments Fair Value
% of Total Fund
Core Sub-Asset ClassesBuyout $1,612.8 $1,981.4 6.4%Special Situations 624.9 527.5 1.7Venture Capital 291.5 816.6 2.6Total Core Sub-Asset Classes $2,529.2 $3,325.5 10.7
Non-Core Holdings1/
Keystone Legacy Fund 144.5 745.1 2.4Total Private Equity $2,673.7 $4,070.6 13.1%
1/163 of SERS’ Private Equity Holdings from each of the core sub-asset classes buyouts, special situations, and venture capital have been reclassed to non-core holdings to be managed through a special purpose vehicle, Keystone Legacy Fund. Currently, there are 145 holdings still in the Keystone Legacy Fund.
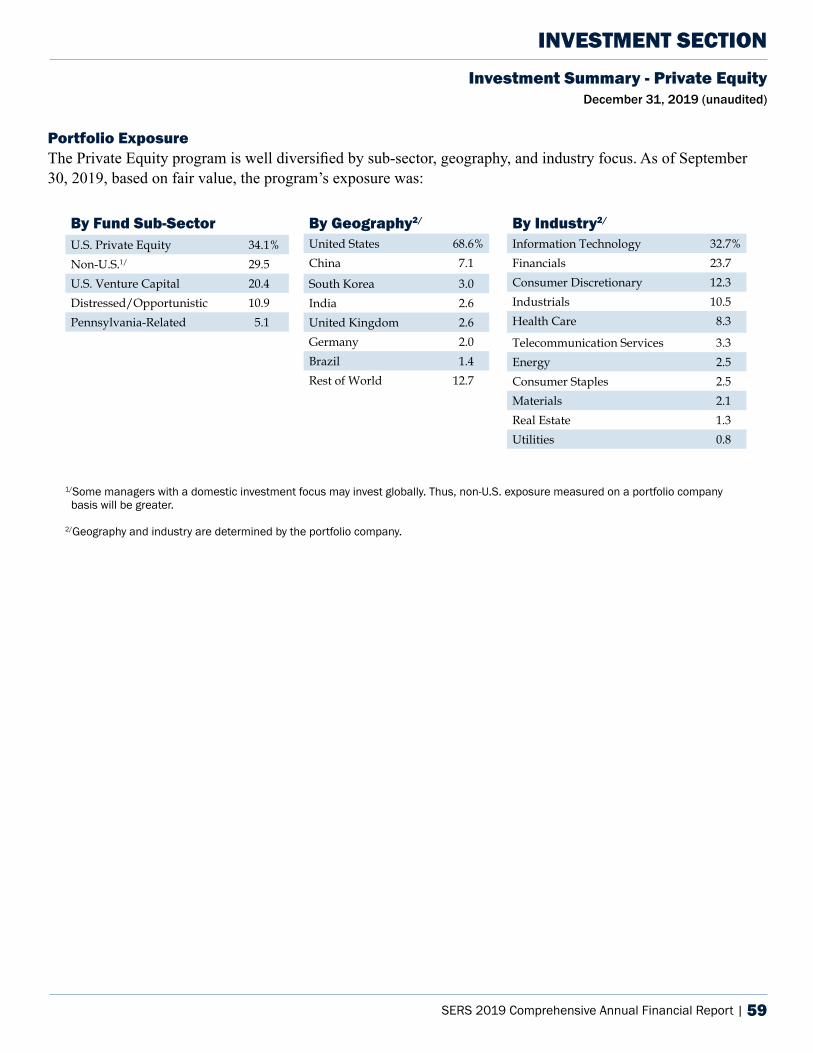
SERS 2019 Comprehensive Annual Financial Report | 59
Investment Summary - Private Equity December 31, 2019 (unaudited)
INVESTMENT SECTION
Portfolio ExposureThe Private Equity program is well diversified by sub-sector, geography, and industry focus. As of September 30, 2019, based on fair value, the program’s exposure was:
By Fund Sub-SectorU.S. Private Equity 34.1%Non-U.S.1/ 29.5U.S. Venture Capital 20.4Distressed/Opportunistic 10.9Pennsylvania-Related 5.1
By Geography2/
United States 68.6%China 7.1
South Korea 3.0India 2.6United Kingdom 2.6Germany 2.0Brazil 1.4Rest of World 12.7
By Industry2/
Information Technology 32.7%Financials 23.7Consumer Discretionary 12.3Industrials 10.5Health Care 8.3
Telecommunication Services 3.3Energy 2.5Consumer Staples 2.5Materials 2.1Real Estate 1.3Utilities 0.8
1/Some managers with a domestic investment focus may invest globally. Thus, non-U.S. exposure measured on a portfolio company basis will be greater.
2/Geography and industry are determined by the portfolio company.
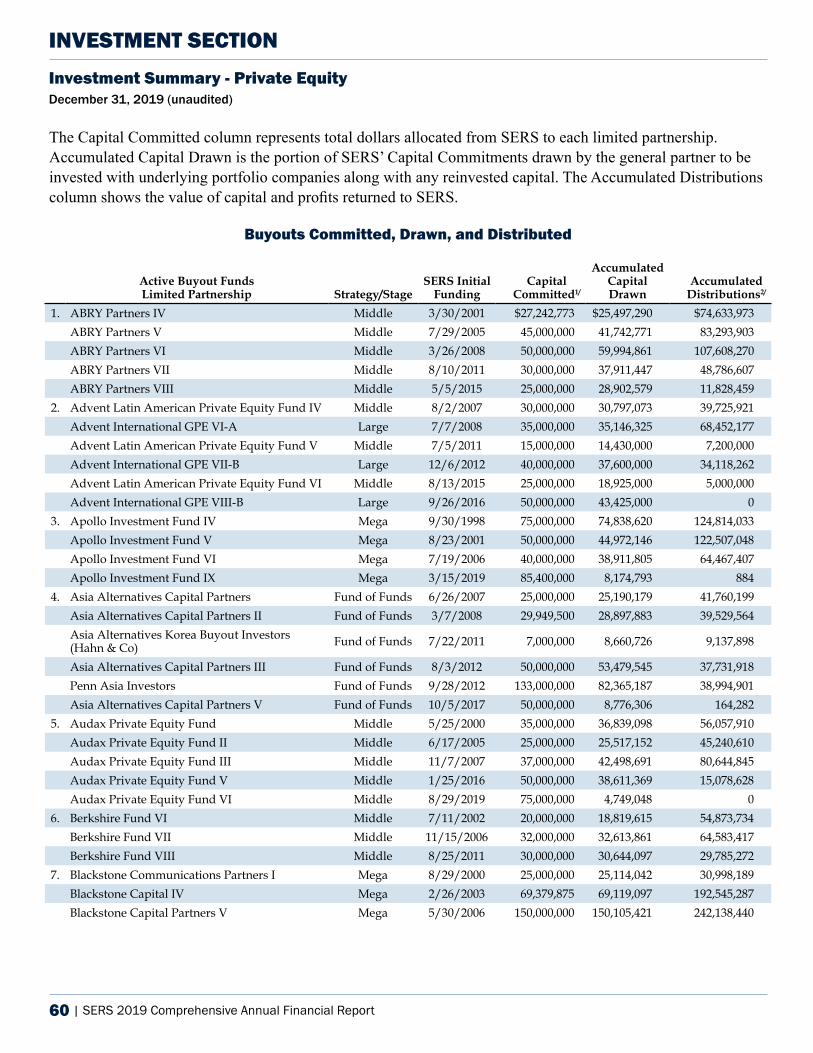
60 | SERS 2019 Comprehensive Annual Financial Report
Investment Summary - Private Equity December 31, 2019 (unaudited)
INVESTMENT SECTION
The Capital Committed column represents total dollars allocated from SERS to each limited partnership. Accumulated Capital Drawn is the portion of SERS’ Capital Commitments drawn by the general partner to be invested with underlying portfolio companies along with any reinvested capital. The Accumulated Distributions column shows the value of capital and profits returned to SERS.
Buyouts Committed, Drawn, and Distributed
Active Buyout Funds Limited Partnership Strategy/Stage
SERS Initial Funding
Capital Committed1/
Accumulated Capital Drawn
Accumulated Distributions2/
1. ABRY Partners IV Middle 3/30/2001 $27,242,773 $25,497,290 $74,633,973ABRY Partners V Middle 7/29/2005 45,000,000 41,742,771 83,293,903 ABRY Partners VI Middle 3/26/2008 50,000,000 59,994,861 107,608,270 ABRY Partners VII Middle 8/10/2011 30,000,000 37,911,447 48,786,607 ABRY Partners VIII Middle 5/5/2015 25,000,000 28,902,579 11,828,459
2. Advent Latin American Private Equity Fund IV Middle 8/2/2007 30,000,000 30,797,073 39,725,921 Advent International GPE VI-A Large 7/7/2008 35,000,000 35,146,325 68,452,177 Advent Latin American Private Equity Fund V Middle 7/5/2011 15,000,000 14,430,000 7,200,000 Advent International GPE VII-B Large 12/6/2012 40,000,000 37,600,000 34,118,262 Advent Latin American Private Equity Fund VI Middle 8/13/2015 25,000,000 18,925,000 5,000,000 Advent International GPE VIII-B Large 9/26/2016 50,000,000 43,425,000 0
3. Apollo Investment Fund IV Mega 9/30/1998 75,000,000 74,838,620 124,814,033 Apollo Investment Fund V Mega 8/23/2001 50,000,000 44,972,146 122,507,048 Apollo Investment Fund VI Mega 7/19/2006 40,000,000 38,911,805 64,467,407 Apollo Investment Fund IX Mega 3/15/2019 85,400,000 8,174,793 884
4. Asia Alternatives Capital Partners Fund of Funds 6/26/2007 25,000,000 25,190,179 41,760,199 Asia Alternatives Capital Partners II Fund of Funds 3/7/2008 29,949,500 28,897,883 39,529,564 Asia Alternatives Korea Buyout Investors (Hahn & Co) Fund of Funds 7/22/2011 7,000,000 8,660,726 9,137,898
Asia Alternatives Capital Partners III Fund of Funds 8/3/2012 50,000,000 53,479,545 37,731,918 Penn Asia Investors Fund of Funds 9/28/2012 133,000,000 82,365,187 38,994,901 Asia Alternatives Capital Partners V Fund of Funds 10/5/2017 50,000,000 8,776,306 164,282
5. Audax Private Equity Fund Middle 5/25/2000 35,000,000 36,839,098 56,057,910 Audax Private Equity Fund II Middle 6/17/2005 25,000,000 25,517,152 45,240,610 Audax Private Equity Fund III Middle 11/7/2007 37,000,000 42,498,691 80,644,845 Audax Private Equity Fund V Middle 1/25/2016 50,000,000 38,611,369 15,078,628 Audax Private Equity Fund VI Middle 8/29/2019 75,000,000 4,749,048 0
6. Berkshire Fund VI Middle 7/11/2002 20,000,000 18,819,615 54,873,734 Berkshire Fund VII Middle 11/15/2006 32,000,000 32,613,861 64,583,417 Berkshire Fund VIII Middle 8/25/2011 30,000,000 30,644,097 29,785,272
7. Blackstone Communications Partners I Mega 8/29/2000 25,000,000 25,114,042 30,998,189 Blackstone Capital IV Mega 2/26/2003 69,379,875 69,119,097 192,545,287 Blackstone Capital Partners V Mega 5/30/2006 150,000,000 150,105,421 242,138,440
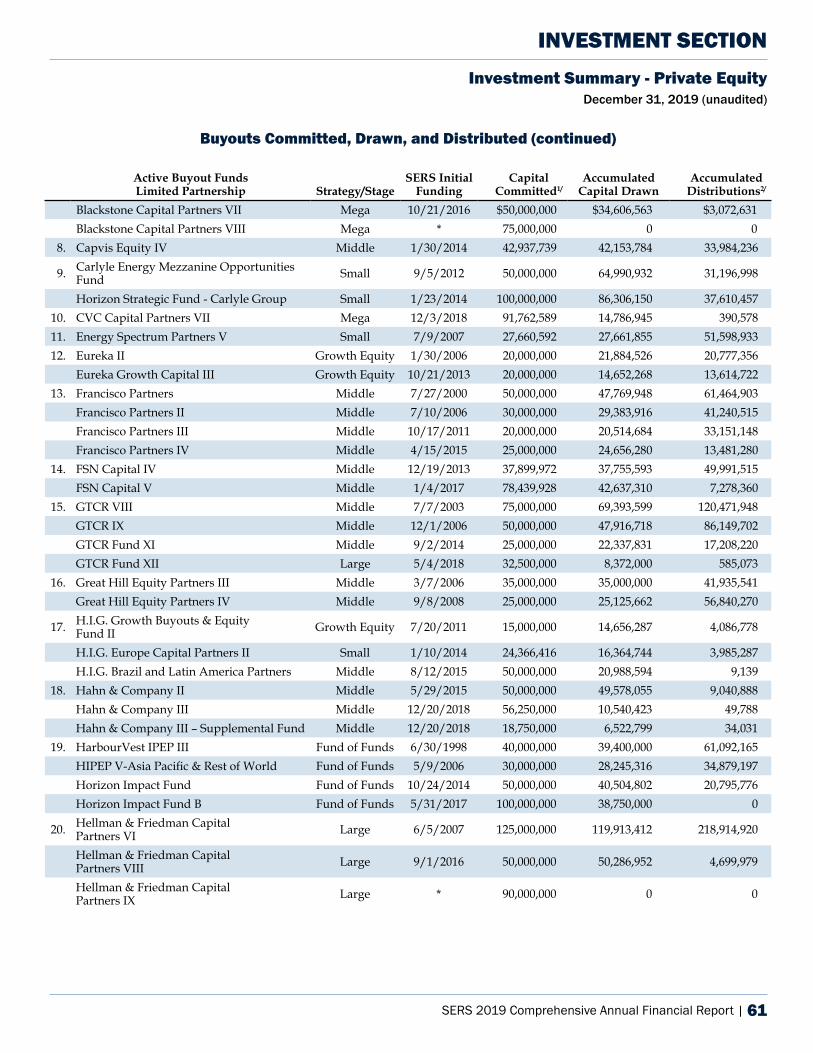
SERS 2019 Comprehensive Annual Financial Report | 61
INVESTMENT SECTIONInvestment Summary - Private Equity
December 31, 2019 (unaudited)
Buyouts Committed, Drawn, and Distributed (continued)
Active Buyout Funds Limited Partnership Strategy/Stage
SERS Initial Funding
Capital Committed1/
Accumulated Capital Drawn
Accumulated Distributions2/
Blackstone Capital Partners VII Mega 10/21/2016 $50,000,000 $34,606,563 $3,072,631 Blackstone Capital Partners VIII Mega * 75,000,000 0 0
8. Capvis Equity IV Middle 1/30/2014 42,937,739 42,153,784 33,984,236
9. Carlyle Energy Mezzanine Opportunities Fund Small 9/5/2012 50,000,000 64,990,932 31,196,998
Horizon Strategic Fund - Carlyle Group Small 1/23/2014 100,000,000 86,306,150 37,610,457 10. CVC Capital Partners VII Mega 12/3/2018 91,762,589 14,786,945 390,578 11. Energy Spectrum Partners V Small 7/9/2007 27,660,592 27,661,855 51,598,933 12. Eureka II Growth Equity 1/30/2006 20,000,000 21,884,526 20,777,356
Eureka Growth Capital III Growth Equity 10/21/2013 20,000,000 14,652,268 13,614,722 13. Francisco Partners Middle 7/27/2000 50,000,000 47,769,948 61,464,903
Francisco Partners II Middle 7/10/2006 30,000,000 29,383,916 41,240,515 Francisco Partners III Middle 10/17/2011 20,000,000 20,514,684 33,151,148 Francisco Partners IV Middle 4/15/2015 25,000,000 24,656,280 13,481,280
14. FSN Capital IV Middle 12/19/2013 37,899,972 37,755,593 49,991,515 FSN Capital V Middle 1/4/2017 78,439,928 42,637,310 7,278,360
15. GTCR VIII Middle 7/7/2003 75,000,000 69,393,599 120,471,948 GTCR IX Middle 12/1/2006 50,000,000 47,916,718 86,149,702 GTCR Fund XI Middle 9/2/2014 25,000,000 22,337,831 17,208,220 GTCR Fund XII Large 5/4/2018 32,500,000 8,372,000 585,073
16. Great Hill Equity Partners III Middle 3/7/2006 35,000,000 35,000,000 41,935,541 Great Hill Equity Partners IV Middle 9/8/2008 25,000,000 25,125,662 56,840,270
17. H.I.G. Growth Buyouts & Equity Fund II Growth Equity 7/20/2011 15,000,000 14,656,287 4,086,778
H.I.G. Europe Capital Partners II Small 1/10/2014 24,366,416 16,364,744 3,985,287 H.I.G. Brazil and Latin America Partners Middle 8/12/2015 50,000,000 20,988,594 9,139
18. Hahn & Company II Middle 5/29/2015 50,000,000 49,578,055 9,040,888 Hahn & Company III Middle 12/20/2018 56,250,000 10,540,423 49,788 Hahn & Company III – Supplemental Fund Middle 12/20/2018 18,750,000 6,522,799 34,031
19. HarbourVest IPEP III Fund of Funds 6/30/1998 40,000,000 39,400,000 61,092,165 HIPEP V-Asia Pacific & Rest of World Fund of Funds 5/9/2006 30,000,000 28,245,316 34,879,197 Horizon Impact Fund Fund of Funds 10/24/2014 50,000,000 40,504,802 20,795,776 Horizon Impact Fund B Fund of Funds 5/31/2017 100,000,000 38,750,000 0
20. Hellman & Friedman Capital Partners VI Large 6/5/2007 125,000,000 119,913,412 218,914,920
Hellman & Friedman Capital Partners VIII Large 9/1/2016 50,000,000 50,286,952 4,699,979
Hellman & Friedman Capital Partners IX Large * 90,000,000 0 0
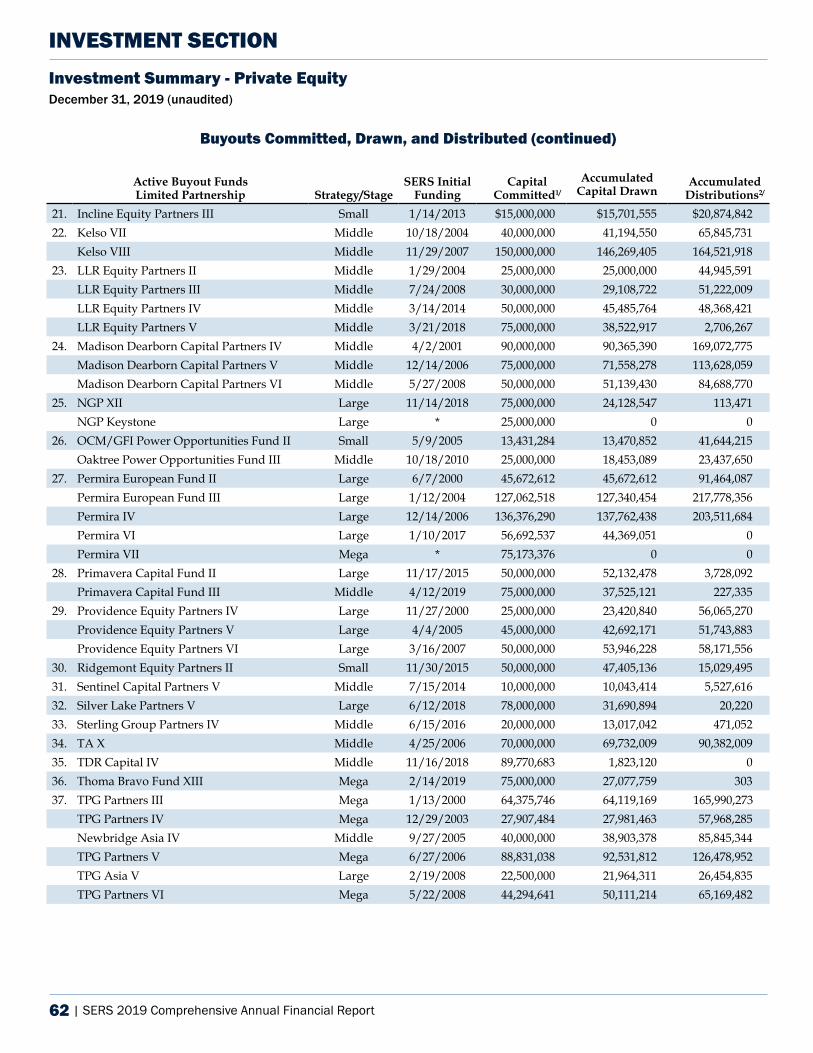
62 | SERS 2019 Comprehensive Annual Financial Report
INVESTMENT SECTIONInvestment Summary - Private Equity December 31, 2019 (unaudited)
Buyouts Committed, Drawn, and Distributed (continued)
Active Buyout Funds Limited Partnership Strategy/Stage
SERS Initial Funding
Capital Committed1/
Accumulated Capital Drawn
Accumulated Distributions2/
21. Incline Equity Partners III Small 1/14/2013 $15,000,000 $15,701,555 $20,874,842 22. Kelso VII Middle 10/18/2004 40,000,000 41,194,550 65,845,731
Kelso VIII Middle 11/29/2007 150,000,000 146,269,405 164,521,918 23. LLR Equity Partners II Middle 1/29/2004 25,000,000 25,000,000 44,945,591
LLR Equity Partners III Middle 7/24/2008 30,000,000 29,108,722 51,222,009 LLR Equity Partners IV Middle 3/14/2014 50,000,000 45,485,764 48,368,421 LLR Equity Partners V Middle 3/21/2018 75,000,000 38,522,917 2,706,267
24. Madison Dearborn Capital Partners IV Middle 4/2/2001 90,000,000 90,365,390 169,072,775 Madison Dearborn Capital Partners V Middle 12/14/2006 75,000,000 71,558,278 113,628,059 Madison Dearborn Capital Partners VI Middle 5/27/2008 50,000,000 51,139,430 84,688,770
25. NGP XII Large 11/14/2018 75,000,000 24,128,547 113,471 NGP Keystone Large * 25,000,000 0 0
26. OCM/GFI Power Opportunities Fund II Small 5/9/2005 13,431,284 13,470,852 41,644,215 Oaktree Power Opportunities Fund III Middle 10/18/2010 25,000,000 18,453,089 23,437,650
27. Permira European Fund II Large 6/7/2000 45,672,612 45,672,612 91,464,087 Permira European Fund III Large 1/12/2004 127,062,518 127,340,454 217,778,356 Permira IV Large 12/14/2006 136,376,290 137,762,438 203,511,684 Permira VI Large 1/10/2017 56,692,537 44,369,051 0Permira VII Mega * 75,173,376 0 0
28. Primavera Capital Fund II Large 11/17/2015 50,000,000 52,132,478 3,728,092 Primavera Capital Fund III Middle 4/12/2019 75,000,000 37,525,121 227,335
29. Providence Equity Partners IV Large 11/27/2000 25,000,000 23,420,840 56,065,270 Providence Equity Partners V Large 4/4/2005 45,000,000 42,692,171 51,743,883 Providence Equity Partners VI Large 3/16/2007 50,000,000 53,946,228 58,171,556
30. Ridgemont Equity Partners II Small 11/30/2015 50,000,000 47,405,136 15,029,495 31. Sentinel Capital Partners V Middle 7/15/2014 10,000,000 10,043,414 5,527,616 32. Silver Lake Partners V Large 6/12/2018 78,000,000 31,690,894 20,220 33. Sterling Group Partners IV Middle 6/15/2016 20,000,000 13,017,042 471,052 34. TA X Middle 4/25/2006 70,000,000 69,732,009 90,382,009 35. TDR Capital IV Middle 11/16/2018 89,770,683 1,823,120 036. Thoma Bravo Fund XIII Mega 2/14/2019 75,000,000 27,077,759 303 37. TPG Partners III Mega 1/13/2000 64,375,746 64,119,169 165,990,273
TPG Partners IV Mega 12/29/2003 27,907,484 27,981,463 57,968,285 Newbridge Asia IV Middle 9/27/2005 40,000,000 38,903,378 85,845,344 TPG Partners V Mega 6/27/2006 88,831,038 92,531,812 126,478,952 TPG Asia V Large 2/19/2008 22,500,000 21,964,311 26,454,835 TPG Partners VI Mega 5/22/2008 44,294,641 50,111,214 65,169,482
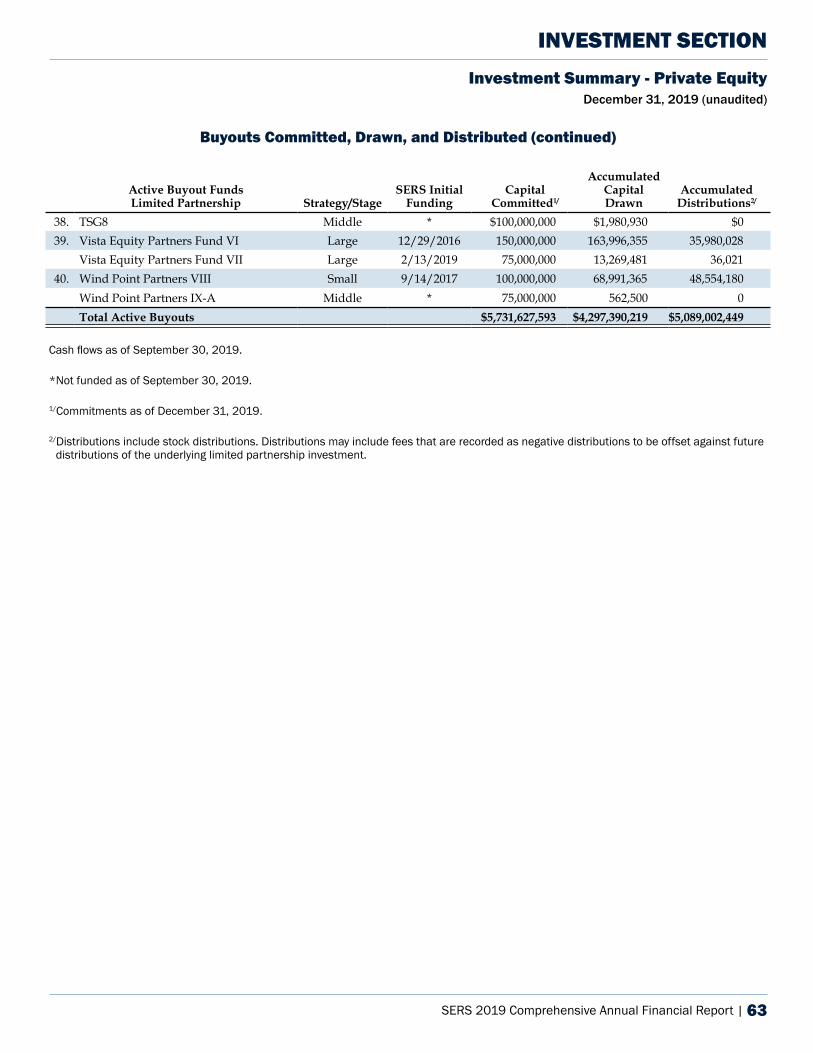
SERS 2019 Comprehensive Annual Financial Report | 63
INVESTMENT SECTIONInvestment Summary - Private Equity
December 31, 2019 (unaudited)
Buyouts Committed, Drawn, and Distributed (continued)
Active Buyout Funds Limited Partnership Strategy/Stage
SERS Initial Funding
Capital Committed1/
Accumulated Capital Drawn
Accumulated Distributions2/
38. TSG8 Middle * $100,000,000 $1,980,930 $039. Vista Equity Partners Fund VI Large 12/29/2016 150,000,000 163,996,355 35,980,028
Vista Equity Partners Fund VII Large 2/13/2019 75,000,000 13,269,481 36,021 40. Wind Point Partners VIII Small 9/14/2017 100,000,000 68,991,365 48,554,180
Wind Point Partners IX-A Middle * 75,000,000 562,500 0Total Active Buyouts $5,731,627,593 $4,297,390,219 $5,089,002,449
Cash flows as of September 30, 2019.
*Not funded as of September 30, 2019.
1/Commitments as of December 31, 2019.
2/Distributions include stock distributions. Distributions may include fees that are recorded as negative distributions to be offset against future distributions of the underlying limited partnership investment.
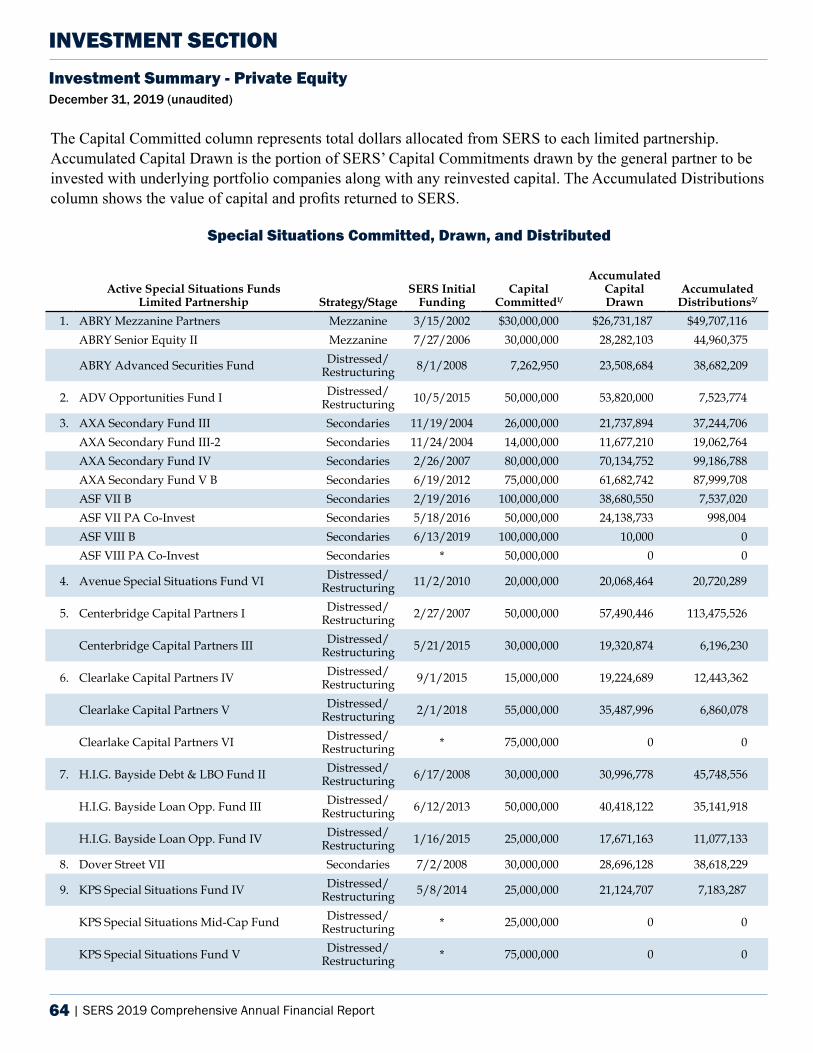
64 | SERS 2019 Comprehensive Annual Financial Report
INVESTMENT SECTIONInvestment Summary - Private Equity December 31, 2019 (unaudited)
The Capital Committed column represents total dollars allocated from SERS to each limited partnership. Accumulated Capital Drawn is the portion of SERS’ Capital Commitments drawn by the general partner to be invested with underlying portfolio companies along with any reinvested capital. The Accumulated Distributions column shows the value of capital and profits returned to SERS.
Special Situations Committed, Drawn, and Distributed
Active Special Situations Funds Limited Partnership Strategy/Stage
SERS Initial Funding
Capital Committed1/
Accumulated Capital Drawn
Accumulated Distributions2/
1. ABRY Mezzanine Partners Mezzanine 3/15/2002 $30,000,000 $26,731,187 $49,707,116ABRY Senior Equity II Mezzanine 7/27/2006 30,000,000 28,282,103 44,960,375
ABRY Advanced Securities Fund Distressed/Restructuring 8/1/2008 7,262,950 23,508,684 38,682,209
2. ADV Opportunities Fund I Distressed/Restructuring 10/5/2015 50,000,000 53,820,000 7,523,774
3. AXA Secondary Fund III Secondaries 11/19/2004 26,000,000 21,737,894 37,244,706 AXA Secondary Fund III-2 Secondaries 11/24/2004 14,000,000 11,677,210 19,062,764 AXA Secondary Fund IV Secondaries 2/26/2007 80,000,000 70,134,752 99,186,788 AXA Secondary Fund V B Secondaries 6/19/2012 75,000,000 61,682,742 87,999,708 ASF VII B Secondaries 2/19/2016 100,000,000 38,680,550 7,537,020 ASF VII PA Co-Invest Secondaries 5/18/2016 50,000,000 24,138,733 998,004 ASF VIII B Secondaries 6/13/2019 100,000,000 10,000 0ASF VIII PA Co-Invest Secondaries * 50,000,000 0 0
4. Avenue Special Situations Fund VI Distressed/Restructuring 11/2/2010 20,000,000 20,068,464 20,720,289
5. Centerbridge Capital Partners I Distressed/Restructuring 2/27/2007 50,000,000 57,490,446 113,475,526
Centerbridge Capital Partners III Distressed/Restructuring 5/21/2015 30,000,000 19,320,874 6,196,230
6. Clearlake Capital Partners IV Distressed/Restructuring 9/1/2015 15,000,000 19,224,689 12,443,362
Clearlake Capital Partners V Distressed/Restructuring 2/1/2018 55,000,000 35,487,996 6,860,078
Clearlake Capital Partners VI Distressed/Restructuring * 75,000,000 0 0
7. H.I.G. Bayside Debt & LBO Fund II Distressed/Restructuring 6/17/2008 30,000,000 30,996,778 45,748,556
H.I.G. Bayside Loan Opp. Fund III Distressed/Restructuring 6/12/2013 50,000,000 40,418,122 35,141,918
H.I.G. Bayside Loan Opp. Fund IV Distressed/Restructuring 1/16/2015 25,000,000 17,671,163 11,077,133
8. Dover Street VII Secondaries 7/2/2008 30,000,000 28,696,128 38,618,229
9. KPS Special Situations Fund IV Distressed/Restructuring 5/8/2014 25,000,000 21,124,707 7,183,287
KPS Special Situations Mid-Cap Fund Distressed/Restructuring * 25,000,000 0 0
KPS Special Situations Fund V Distressed/Restructuring * 75,000,000 0 0
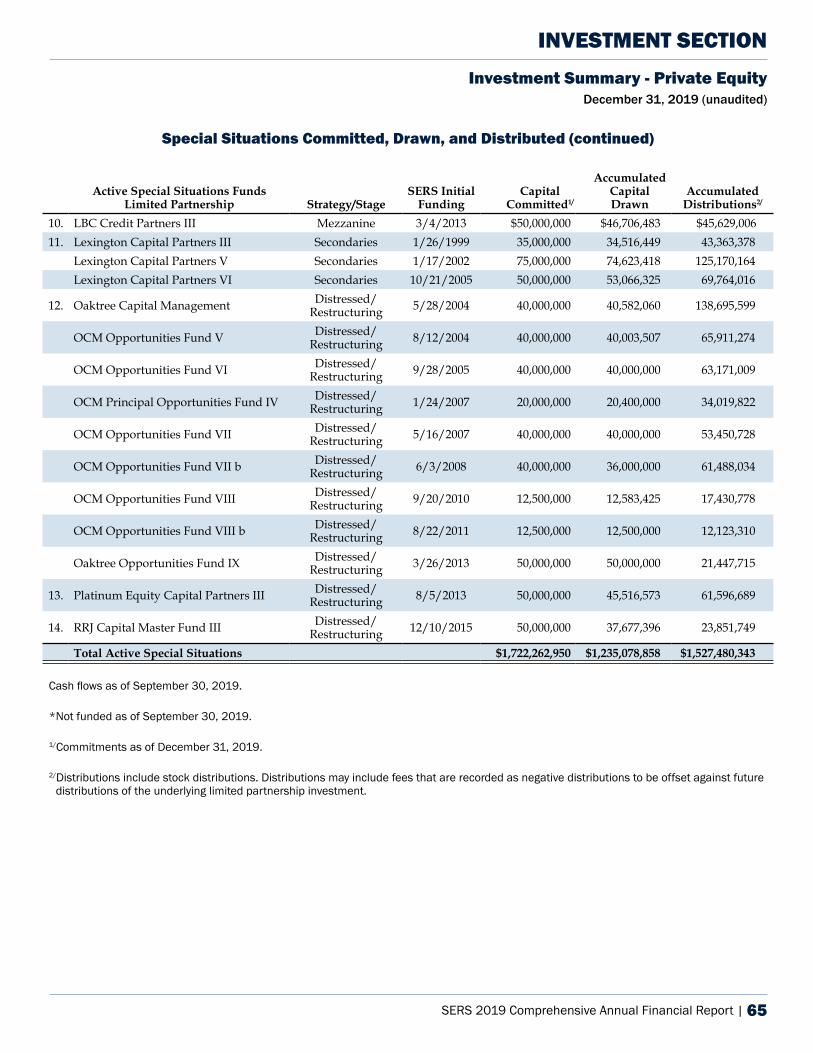
SERS 2019 Comprehensive Annual Financial Report | 65
INVESTMENT SECTIONInvestment Summary - Private Equity
December 31, 2019 (unaudited)
Special Situations Committed, Drawn, and Distributed (continued)
Active Special Situations Funds Limited Partnership Strategy/Stage
SERS Initial Funding
Capital Committed1/
Accumulated Capital Drawn
Accumulated Distributions2/
10. LBC Credit Partners III Mezzanine 3/4/2013 $50,000,000 $46,706,483 $45,629,006 11. Lexington Capital Partners III Secondaries 1/26/1999 35,000,000 34,516,449 43,363,378
Lexington Capital Partners V Secondaries 1/17/2002 75,000,000 74,623,418 125,170,164 Lexington Capital Partners VI Secondaries 10/21/2005 50,000,000 53,066,325 69,764,016
12. Oaktree Capital Management Distressed/Restructuring 5/28/2004 40,000,000 40,582,060 138,695,599
OCM Opportunities Fund V Distressed/Restructuring 8/12/2004 40,000,000 40,003,507 65,911,274
OCM Opportunities Fund VI Distressed/Restructuring 9/28/2005 40,000,000 40,000,000 63,171,009
OCM Principal Opportunities Fund IV Distressed/Restructuring 1/24/2007 20,000,000 20,400,000 34,019,822
OCM Opportunities Fund VII Distressed/Restructuring 5/16/2007 40,000,000 40,000,000 53,450,728
OCM Opportunities Fund VII b Distressed/Restructuring 6/3/2008 40,000,000 36,000,000 61,488,034
OCM Opportunities Fund VIII Distressed/Restructuring 9/20/2010 12,500,000 12,583,425 17,430,778
OCM Opportunities Fund VIII b Distressed/Restructuring 8/22/2011 12,500,000 12,500,000 12,123,310
Oaktree Opportunities Fund IX Distressed/Restructuring 3/26/2013 50,000,000 50,000,000 21,447,715
13. Platinum Equity Capital Partners III Distressed/Restructuring 8/5/2013 50,000,000 45,516,573 61,596,689
14. RRJ Capital Master Fund III Distressed/Restructuring 12/10/2015 50,000,000 37,677,396 23,851,749
Total Active Special Situations $1,722,262,950 $1,235,078,858 $1,527,480,343
Cash flows as of September 30, 2019.
*Not funded as of September 30, 2019.
1/Commitments as of December 31, 2019.
2/Distributions include stock distributions. Distributions may include fees that are recorded as negative distributions to be offset against future distributions of the underlying limited partnership investment.
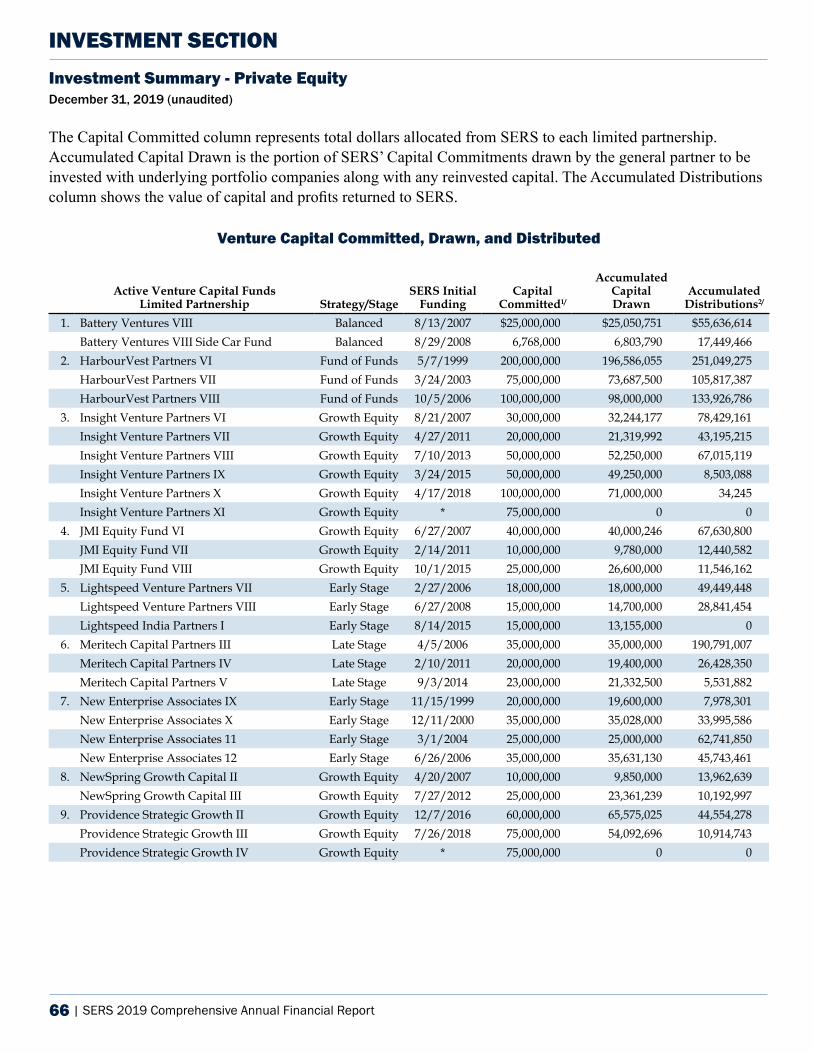
66 | SERS 2019 Comprehensive Annual Financial Report
INVESTMENT SECTIONInvestment Summary - Private Equity December 31, 2019 (unaudited)
The Capital Committed column represents total dollars allocated from SERS to each limited partnership. Accumulated Capital Drawn is the portion of SERS’ Capital Commitments drawn by the general partner to be invested with underlying portfolio companies along with any reinvested capital. The Accumulated Distributions column shows the value of capital and profits returned to SERS.
Venture Capital Committed, Drawn, and Distributed
Active Venture Capital Funds Limited Partnership Strategy/Stage
SERS Initial Funding
Capital Committed1/
Accumulated Capital Drawn
Accumulated Distributions2/
1. Battery Ventures VIII Balanced 8/13/2007 $25,000,000 $25,050,751 $55,636,614Battery Ventures VIII Side Car Fund Balanced 8/29/2008 6,768,000 6,803,790 17,449,466
2. HarbourVest Partners VI Fund of Funds 5/7/1999 200,000,000 196,586,055 251,049,275 HarbourVest Partners VII Fund of Funds 3/24/2003 75,000,000 73,687,500 105,817,387 HarbourVest Partners VIII Fund of Funds 10/5/2006 100,000,000 98,000,000 133,926,786
3. Insight Venture Partners VI Growth Equity 8/21/2007 30,000,000 32,244,177 78,429,161 Insight Venture Partners VII Growth Equity 4/27/2011 20,000,000 21,319,992 43,195,215 Insight Venture Partners VIII Growth Equity 7/10/2013 50,000,000 52,250,000 67,015,119 Insight Venture Partners IX Growth Equity 3/24/2015 50,000,000 49,250,000 8,503,088 Insight Venture Partners X Growth Equity 4/17/2018 100,000,000 71,000,000 34,245 Insight Venture Partners XI Growth Equity * 75,000,000 0 0
4. JMI Equity Fund VI Growth Equity 6/27/2007 40,000,000 40,000,246 67,630,800 JMI Equity Fund VII Growth Equity 2/14/2011 10,000,000 9,780,000 12,440,582 JMI Equity Fund VIII Growth Equity 10/1/2015 25,000,000 26,600,000 11,546,162
5. Lightspeed Venture Partners VII Early Stage 2/27/2006 18,000,000 18,000,000 49,449,448 Lightspeed Venture Partners VIII Early Stage 6/27/2008 15,000,000 14,700,000 28,841,454 Lightspeed India Partners I Early Stage 8/14/2015 15,000,000 13,155,000 0
6. Meritech Capital Partners III Late Stage 4/5/2006 35,000,000 35,000,000 190,791,007 Meritech Capital Partners IV Late Stage 2/10/2011 20,000,000 19,400,000 26,428,350 Meritech Capital Partners V Late Stage 9/3/2014 23,000,000 21,332,500 5,531,882
7. New Enterprise Associates IX Early Stage 11/15/1999 20,000,000 19,600,000 7,978,301 New Enterprise Associates X Early Stage 12/11/2000 35,000,000 35,028,000 33,995,586 New Enterprise Associates 11 Early Stage 3/1/2004 25,000,000 25,000,000 62,741,850 New Enterprise Associates 12 Early Stage 6/26/2006 35,000,000 35,631,130 45,743,461
8. NewSpring Growth Capital II Growth Equity 4/20/2007 10,000,000 9,850,000 13,962,639 NewSpring Growth Capital III Growth Equity 7/27/2012 25,000,000 23,361,239 10,192,997
9. Providence Strategic Growth II Growth Equity 12/7/2016 60,000,000 65,575,025 44,554,278 Providence Strategic Growth III Growth Equity 7/26/2018 75,000,000 54,092,696 10,914,743 Providence Strategic Growth IV Growth Equity * 75,000,000 0 0
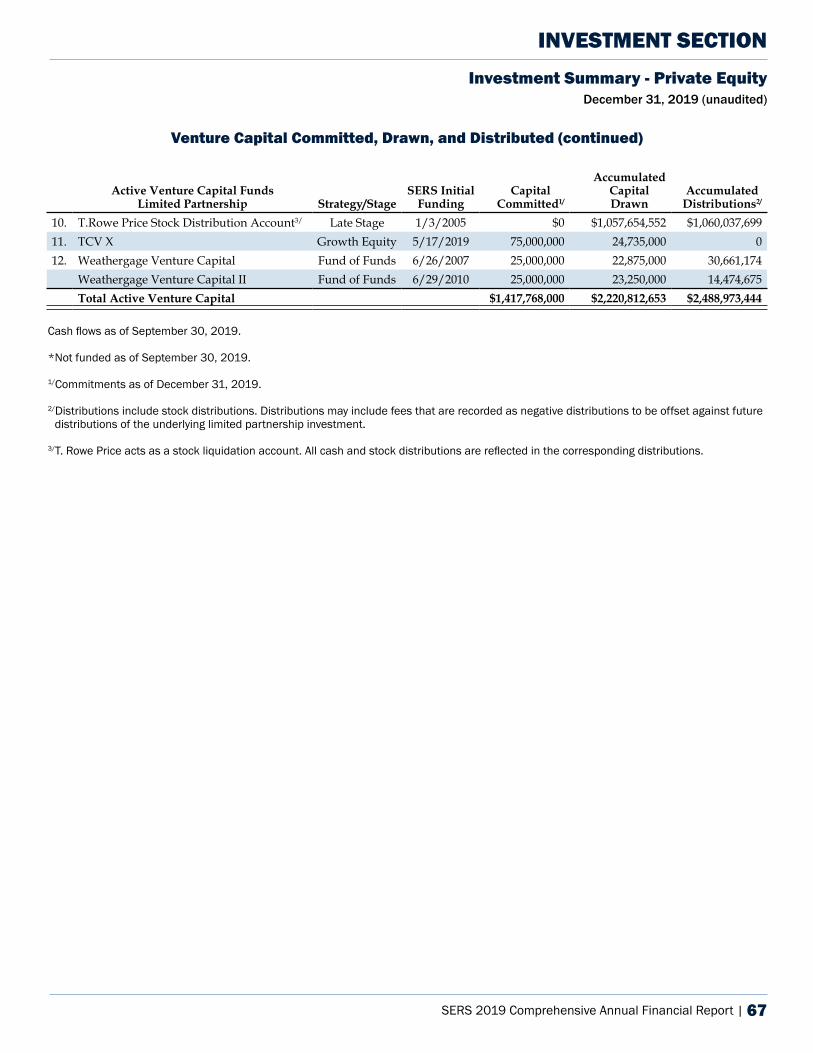
SERS 2019 Comprehensive Annual Financial Report | 67
INVESTMENT SECTIONInvestment Summary - Private Equity
December 31, 2019 (unaudited)
Venture Capital Committed, Drawn, and Distributed (continued)
Active Venture Capital Funds Limited Partnership Strategy/Stage
SERS Initial Funding
Capital Committed1/
Accumulated Capital Drawn
Accumulated Distributions2/
10. T.Rowe Price Stock Distribution Account3/ Late Stage 1/3/2005 $0 $1,057,654,552 $1,060,037,699 11. TCV X Growth Equity 5/17/2019 75,000,000 24,735,000 0 12. Weathergage Venture Capital Fund of Funds 6/26/2007 25,000,000 22,875,000 30,661,174
Weathergage Venture Capital II Fund of Funds 6/29/2010 25,000,000 23,250,000 14,474,675 Total Active Venture Capital $1,417,768,000 $2,220,812,653 $2,488,973,444
Cash flows as of September 30, 2019.
*Not funded as of September 30, 2019.
1/Commitments as of December 31, 2019.
2/Distributions include stock distributions. Distributions may include fees that are recorded as negative distributions to be offset against future distributions of the underlying limited partnership investment.
3/T. Rowe Price acts as a stock liquidation account. All cash and stock distributions are reflected in the corresponding distributions.
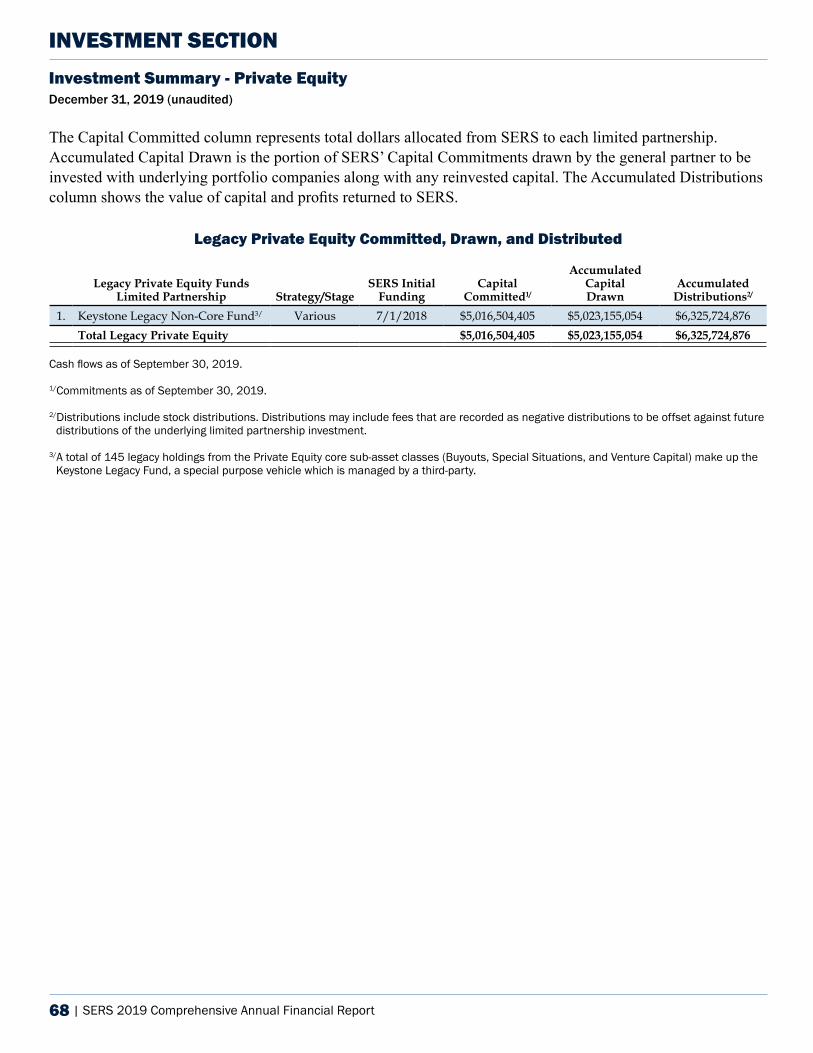
68 | SERS 2019 Comprehensive Annual Financial Report
The Capital Committed column represents total dollars allocated from SERS to each limited partnership. Accumulated Capital Drawn is the portion of SERS’ Capital Commitments drawn by the general partner to be invested with underlying portfolio companies along with any reinvested capital. The Accumulated Distributions column shows the value of capital and profits returned to SERS.
Legacy Private Equity Committed, Drawn, and Distributed
Legacy Private Equity Funds Limited Partnership Strategy/Stage
SERS Initial Funding
Capital Committed1/
Accumulated Capital Drawn
Accumulated Distributions2/
1. Keystone Legacy Non-Core Fund3/ Various 7/1/2018 $5,016,504,405 $5,023,155,054 $6,325,724,876Total Legacy Private Equity $5,016,504,405 $5,023,155,054 $6,325,724,876
Cash flows as of September 30, 2019.
1/Commitments as of September 30, 2019.
2/Distributions include stock distributions. Distributions may include fees that are recorded as negative distributions to be offset against future distributions of the underlying limited partnership investment.
3/A total of 145 legacy holdings from the Private Equity core sub-asset classes (Buyouts, Special Situations, and Venture Capital) make up the Keystone Legacy Fund, a special purpose vehicle which is managed by a third-party.
INVESTMENT SECTIONInvestment Summary - Private Equity December 31, 2019 (unaudited)
SERS 2019 Comprehensive Annual Financial Report | 69
Investment Summary - Global Public EquityDecember 31, 2019 (unaudited)
INVESTMENT SECTION
Role in the SERS FundSERS’ Global Public Equity program seeks high returns through capital appreciation and income fromdividend payments while also improving the total fund’s liquidity. SERS’ Global Public Equity programcontributes a high expected long-term return to the fund but also may be the greatest contributor to near-term volatility.
Program Structure Investments in public equity are achieved through buying and holding publicly-traded securities ofcompanies throughout the developed world and in emerging markets. These companies exhibit a widerange of market capitalizations in many industries and sectors, and offer vastly different equity returnopportunities.
Consistent with continuing cost reduction efforts, SERS has successfully lowered the overall cost of this program by increasing its exposure to index strategies and consolidating portfolios.
ObjectiveThe objective of the Global Public Equity program is to generate annualized net-of-fee returns thatexceed its benchmark, the MSCI All Country World Investable Market Index, over a three- to five-yearperiod.
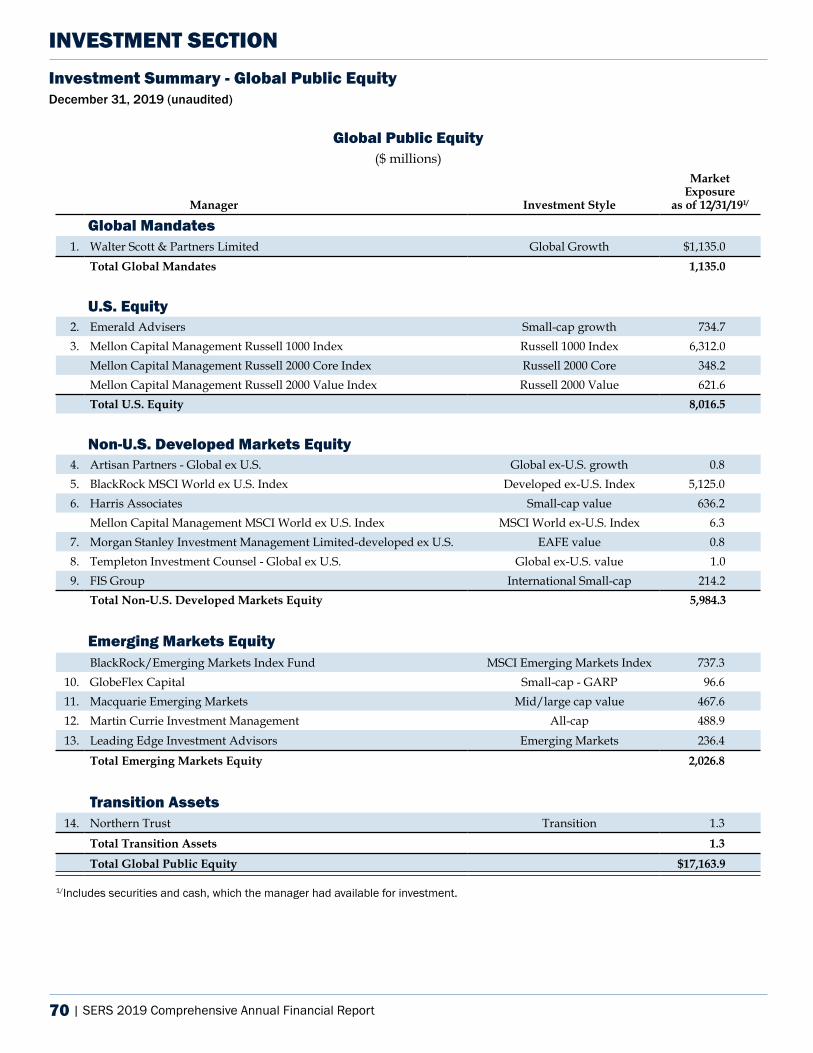
70 | SERS 2019 Comprehensive Annual Financial Report
INVESTMENT SECTIONInvestment Summary - Global Public EquityDecember 31, 2019 (unaudited)
Global Public Equity ($ millions)
Manager Investment Style
Market Exposure
as of 12/31/191/
Global Mandates1. Walter Scott & Partners Limited Global Growth $1,135.0
Total Global Mandates 1,135.0
U.S. Equity2. Emerald Advisers Small-cap growth 734.73. Mellon Capital Management Russell 1000 Index Russell 1000 Index 6,312.0
Mellon Capital Management Russell 2000 Core Index Russell 2000 Core 348.2Mellon Capital Management Russell 2000 Value Index Russell 2000 Value 621.6 Total U.S. Equity 8,016.5
Non-U.S. Developed Markets Equity4. Artisan Partners - Global ex U.S. Global ex-U.S. growth 0.85. BlackRock MSCI World ex U.S. Index Developed ex-U.S. Index 5,125.06. Harris Associates Small-cap value 636.2
Mellon Capital Management MSCI World ex U.S. Index MSCI World ex-U.S. Index 6.37. Morgan Stanley Investment Management Limited-developed ex U.S. EAFE value 0.8 8. Templeton Investment Counsel - Global ex U.S. Global ex-U.S. value 1.0 9. FIS Group International Small-cap 214.2
Total Non-U.S. Developed Markets Equity 5,984.3
Emerging Markets EquityBlackRock/Emerging Markets Index Fund MSCI Emerging Markets Index 737.3
10. GlobeFlex Capital Small-cap - GARP 96.611. Macquarie Emerging Markets Mid/large cap value 467.612. Martin Currie Investment Management All-cap 488.913. Leading Edge Investment Advisors Emerging Markets 236.4
Total Emerging Markets Equity 2,026.8
Transition Assets14. Northern Trust Transition 1.3
Total Transition Assets 1.3 Total Global Public Equity $17,163.9
1/Includes securities and cash, which the manager had available for investment.
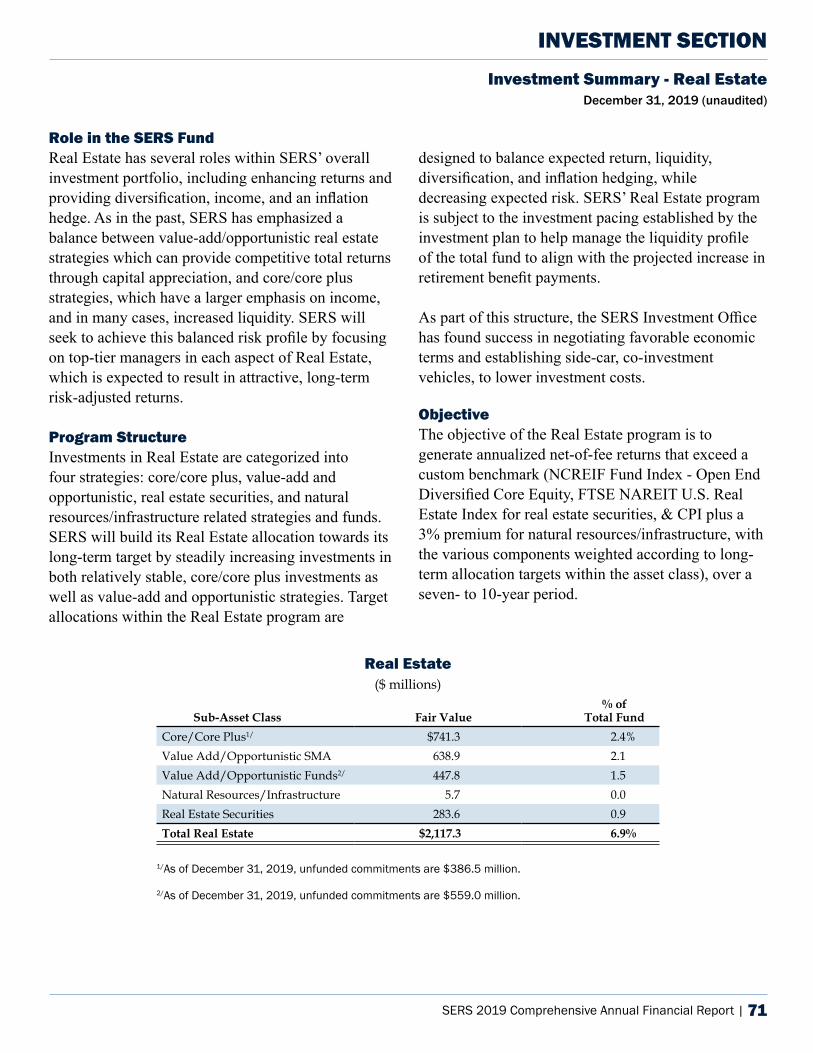
SERS 2019 Comprehensive Annual Financial Report | 71
Investment Summary - Real Estate December 31, 2019 (unaudited)
INVESTMENT SECTION
Role in the SERS Fund Real Estate has several roles within SERS’ overall investment portfolio, including enhancing returns and providing diversification, income, and an inflation hedge. As in the past, SERS has emphasized a balance between value-add/opportunistic real estate strategies which can provide competitive total returns through capital appreciation, and core/core plus strategies, which have a larger emphasis on income, and in many cases, increased liquidity. SERS will seek to achieve this balanced risk profile by focusing on top-tier managers in each aspect of Real Estate, which is expected to result in attractive, long-term risk-adjusted returns.
Program StructureInvestments in Real Estate are categorized into four strategies: core/core plus, value-add and opportunistic, real estate securities, and natural resources/infrastructure related strategies and funds. SERS will build its Real Estate allocation towards its long-term target by steadily increasing investments in both relatively stable, core/core plus investments as well as value-add and opportunistic strategies. Target allocations within the Real Estate program are
designed to balance expected return, liquidity, diversification, and inflation hedging, while decreasing expected risk. SERS’ Real Estate program is subject to the investment pacing established by the investment plan to help manage the liquidity profile of the total fund to align with the projected increase in retirement benefit payments.
As part of this structure, the SERS Investment Office has found success in negotiating favorable economic terms and establishing side-car, co-investment vehicles, to lower investment costs.
ObjectiveThe objective of the Real Estate program is to generate annualized net-of-fee returns that exceed a custom benchmark (NCREIF Fund Index - Open End Diversified Core Equity, FTSE NAREIT U.S. Real Estate Index for real estate securities, & CPI plus a 3% premium for natural resources/infrastructure, with the various components weighted according to long-term allocation targets within the asset class), over a seven- to 10-year period.
Real Estate($ millions)
Sub-Asset Class Fair Value% of
Total FundCore/Core Plus1/ $741.3 2.4%Value Add/Opportunistic SMA 638.9 2.1Value Add/Opportunistic Funds2/ 447.8 1.5Natural Resources/Infrastructure 5.7 0.0Real Estate Securities 283.6 0.9Total Real Estate $2,117.3 6.9%
1/As of December 31, 2019, unfunded commitments are $386.5 million.
2/As of December 31, 2019, unfunded commitments are $559.0 million.
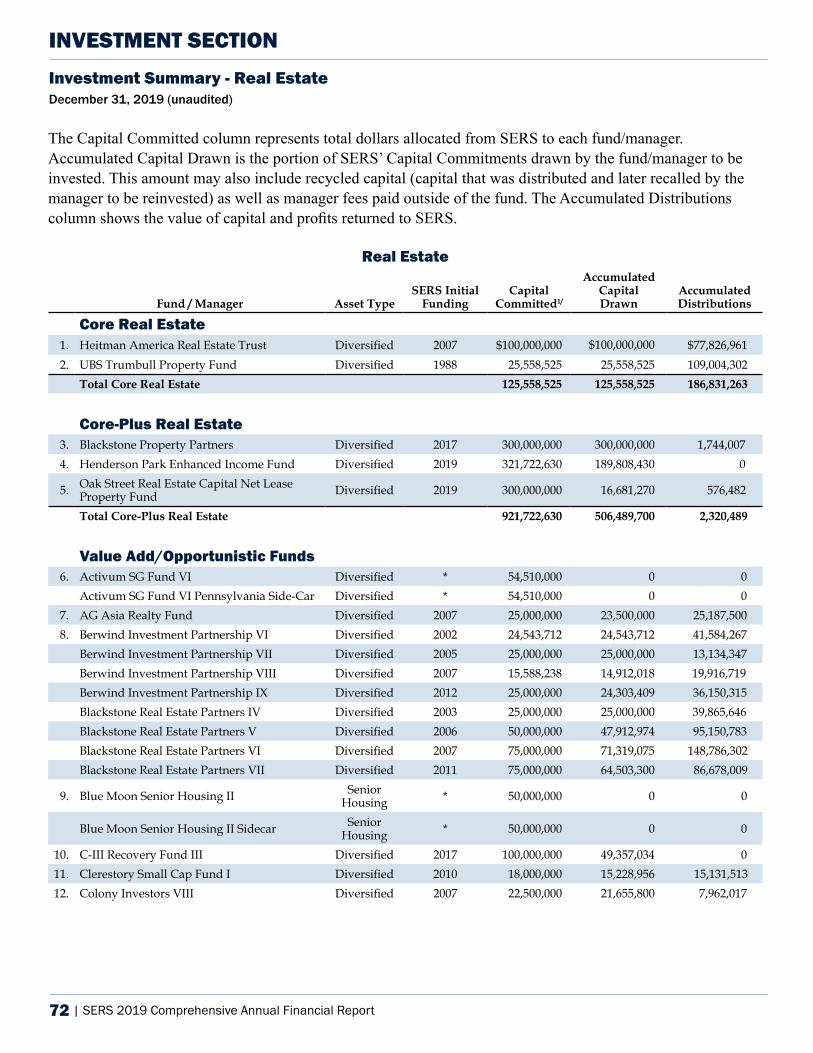
72 | SERS 2019 Comprehensive Annual Financial Report
Investment Summary - Real Estate December 31, 2019 (unaudited)
INVESTMENT SECTION
The Capital Committed column represents total dollars allocated from SERS to each fund/manager. Accumulated Capital Drawn is the portion of SERS’ Capital Commitments drawn by the fund/manager to be invested. This amount may also include recycled capital (capital that was distributed and later recalled by the manager to be reinvested) as well as manager fees paid outside of the fund. The Accumulated Distributions column shows the value of capital and profits returned to SERS.
Real Estate
Fund / Manager Asset TypeSERS Initial
FundingCapital
Committed1/
Accumulated Capital Drawn
Accumulated Distributions
Core Real Estate1. Heitman America Real Estate Trust Diversified 2007 $100,000,000 $100,000,000 $77,826,9612. UBS Trumbull Property Fund Diversified 1988 25,558,525 25,558,525 109,004,302
Total Core Real Estate 125,558,525 125,558,525 186,831,263
Core-Plus Real Estate3. Blackstone Property Partners Diversified 2017 300,000,000 300,000,000 1,744,0074. Henderson Park Enhanced Income Fund Diversified 2019 321,722,630 189,808,430 0
5. Oak Street Real Estate Capital Net Lease Property Fund Diversified 2019 300,000,000 16,681,270 576,482
Total Core-Plus Real Estate 921,722,630 506,489,700 2,320,489
Value Add/Opportunistic Funds6. Activum SG Fund VI Diversified * 54,510,000 0 0
Activum SG Fund VI Pennsylvania Side-Car Diversified * 54,510,000 0 07. AG Asia Realty Fund Diversified 2007 25,000,000 23,500,000 25,187,5008. Berwind Investment Partnership VI Diversified 2002 24,543,712 24,543,712 41,584,267
Berwind Investment Partnership VII Diversified 2005 25,000,000 25,000,000 13,134,347Berwind Investment Partnership VIII Diversified 2007 15,588,238 14,912,018 19,916,719Berwind Investment Partnership IX Diversified 2012 25,000,000 24,303,409 36,150,315Blackstone Real Estate Partners IV Diversified 2003 25,000,000 25,000,000 39,865,646Blackstone Real Estate Partners V Diversified 2006 50,000,000 47,912,974 95,150,783Blackstone Real Estate Partners VI Diversified 2007 75,000,000 71,319,075 148,786,302Blackstone Real Estate Partners VII Diversified 2011 75,000,000 64,503,300 86,678,009
9. Blue Moon Senior Housing II Senior Housing * 50,000,000 0 0
Blue Moon Senior Housing II Sidecar Senior Housing * 50,000,000 0 0
10. C-III Recovery Fund III Diversified 2017 100,000,000 49,357,034 011. Clerestory Small Cap Fund I Diversified 2010 18,000,000 15,228,956 15,131,51312. Colony Investors VIII Diversified 2007 22,500,000 21,655,800 7,962,017
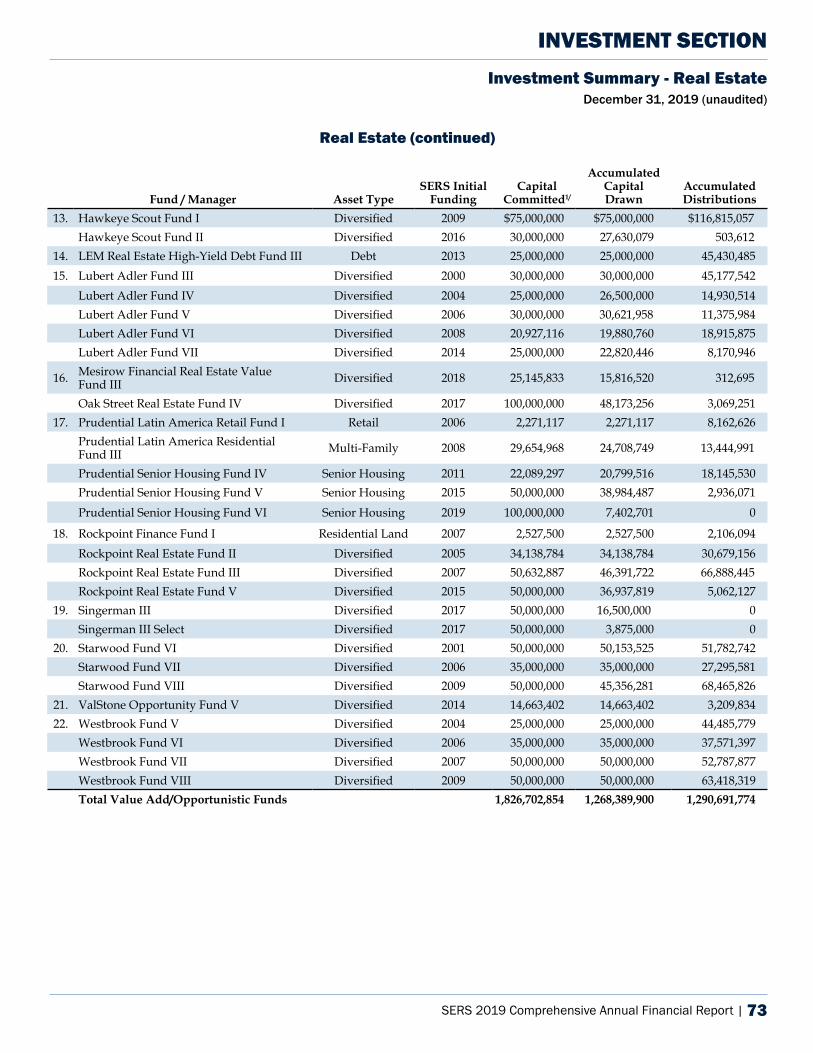
SERS 2019 Comprehensive Annual Financial Report | 73
INVESTMENT SECTIONInvestment Summary - Real Estate
December 31, 2019 (unaudited)
Real Estate (continued)
Fund / Manager Asset TypeSERS Initial
FundingCapital
Committed1/
Accumulated Capital Drawn
Accumulated Distributions
13. Hawkeye Scout Fund I Diversified 2009 $75,000,000 $75,000,000 $116,815,057Hawkeye Scout Fund II Diversified 2016 30,000,000 27,630,079 503,612
14. LEM Real Estate High-Yield Debt Fund III Debt 2013 25,000,000 25,000,000 45,430,48515. Lubert Adler Fund III Diversified 2000 30,000,000 30,000,000 45,177,542
Lubert Adler Fund IV Diversified 2004 25,000,000 26,500,000 14,930,514Lubert Adler Fund V Diversified 2006 30,000,000 30,621,958 11,375,984Lubert Adler Fund VI Diversified 2008 20,927,116 19,880,760 18,915,875Lubert Adler Fund VII Diversified 2014 25,000,000 22,820,446 8,170,946
16. Mesirow Financial Real Estate Value Fund III Diversified 2018 25,145,833 15,816,520 312,695
Oak Street Real Estate Fund IV Diversified 2017 100,000,000 48,173,256 3,069,25117. Prudential Latin America Retail Fund I Retail 2006 2,271,117 2,271,117 8,162,626
Prudential Latin America Residential Fund III Multi-Family 2008 29,654,968 24,708,749 13,444,991
Prudential Senior Housing Fund IV Senior Housing 2011 22,089,297 20,799,516 18,145,530Prudential Senior Housing Fund V Senior Housing 2015 50,000,000 38,984,487 2,936,071Prudential Senior Housing Fund VI Senior Housing 2019 100,000,000 7,402,701 0
18. Rockpoint Finance Fund I Residential Land 2007 2,527,500 2,527,500 2,106,094Rockpoint Real Estate Fund II Diversified 2005 34,138,784 34,138,784 30,679,156Rockpoint Real Estate Fund III Diversified 2007 50,632,887 46,391,722 66,888,445Rockpoint Real Estate Fund V Diversified 2015 50,000,000 36,937,819 5,062,127
19. Singerman III Diversified 2017 50,000,000 16,500,000 0Singerman III Select Diversified 2017 50,000,000 3,875,000 0
20. Starwood Fund VI Diversified 2001 50,000,000 50,153,525 51,782,742Starwood Fund VII Diversified 2006 35,000,000 35,000,000 27,295,581Starwood Fund VIII Diversified 2009 50,000,000 45,356,281 68,465,826
21. ValStone Opportunity Fund V Diversified 2014 14,663,402 14,663,402 3,209,83422. Westbrook Fund V Diversified 2004 25,000,000 25,000,000 44,485,779
Westbrook Fund VI Diversified 2006 35,000,000 35,000,000 37,571,397Westbrook Fund VII Diversified 2007 50,000,000 50,000,000 52,787,877Westbrook Fund VIII Diversified 2009 50,000,000 50,000,000 63,418,319Total Value Add/Opportunistic Funds 1,826,702,854 1,268,389,900 1,290,691,774
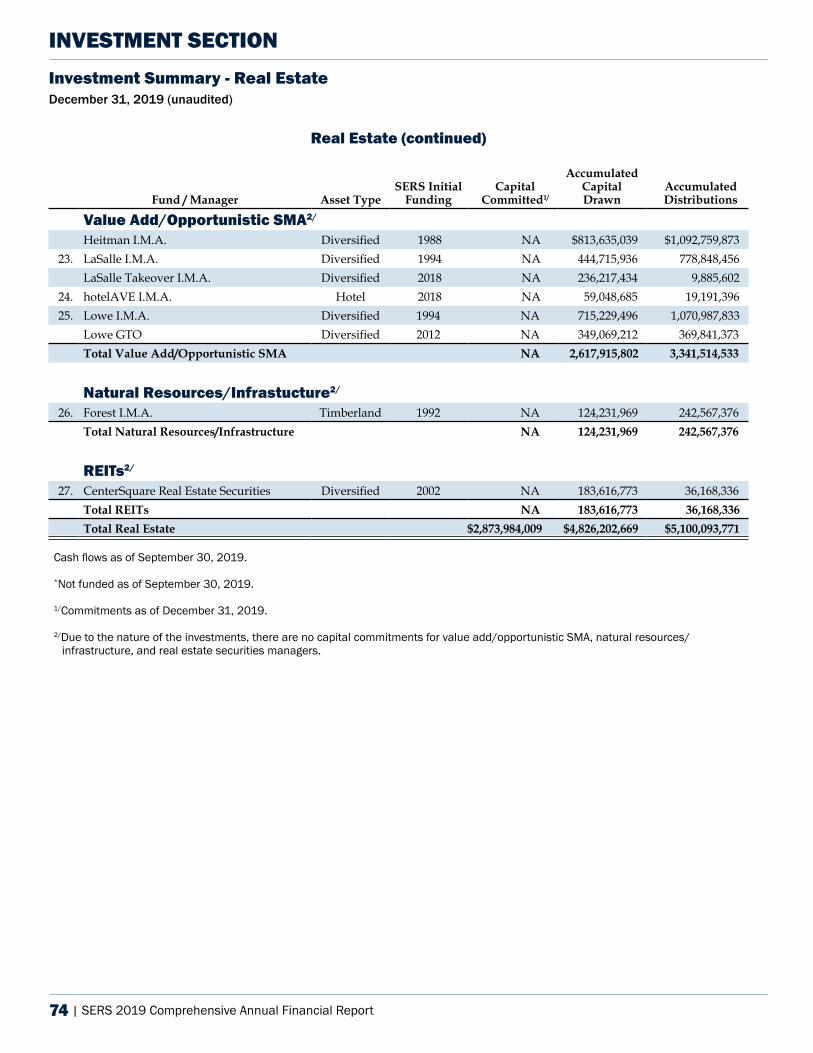
74 | SERS 2019 Comprehensive Annual Financial Report
INVESTMENT SECTIONInvestment Summary - Real Estate December 31, 2019 (unaudited)
Real Estate (continued)
Fund / Manager Asset TypeSERS Initial
FundingCapital
Committed1/
Accumulated Capital Drawn
Accumulated Distributions
Value Add/Opportunistic SMA2/
Heitman I.M.A. Diversified 1988 NA $813,635,039 $1,092,759,87323. LaSalle I.M.A. Diversified 1994 NA 444,715,936 778,848,456
LaSalle Takeover I.M.A. Diversified 2018 NA 236,217,434 9,885,60224. hotelAVE I.M.A. Hotel 2018 NA 59,048,685 19,191,39625. Lowe I.M.A. Diversified 1994 NA 715,229,496 1,070,987,833
Lowe GTO Diversified 2012 NA 349,069,212 369,841,373Total Value Add/Opportunistic SMA NA 2,617,915,802 3,341,514,533
Natural Resources/Infrastucture2/
26. Forest I.M.A. Timberland 1992 NA 124,231,969 242,567,376Total Natural Resources/Infrastructure NA 124,231,969 242,567,376
REITs2/
27. CenterSquare Real Estate Securities Diversified 2002 NA 183,616,773 36,168,336Total REITs NA 183,616,773 36,168,336Total Real Estate $2,873,984,009 $4,826,202,669 $5,100,093,771
Cash flows as of September 30, 2019.
*Not funded as of September 30, 2019.
1/Commitments as of December 31, 2019.
2/Due to the nature of the investments, there are no capital commitments for value add/opportunistic SMA, natural resources/ infrastructure, and real estate securities managers.
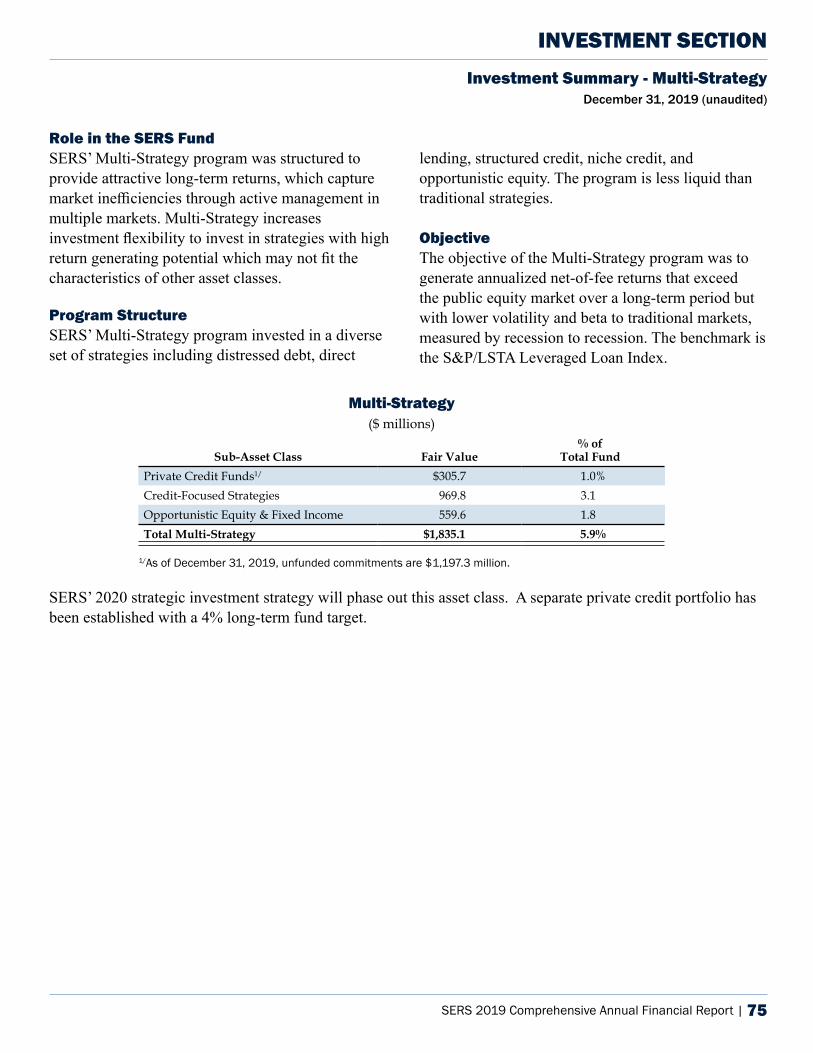
SERS 2019 Comprehensive Annual Financial Report | 75
Investment Summary - Multi-Strategy December 31, 2019 (unaudited)
INVESTMENT SECTION
Role in the SERS Fund SERS’ Multi-Strategy program was structured to provide attractive long-term returns, which capturemarket inefficiencies through active management in multiple markets. Multi-Strategy increasesinvestment flexibility to invest in strategies with high return generating potential which may not fit thecharacteristics of other asset classes.
Program Structure SERS’ Multi-Strategy program invested in a diverse set of strategies including distressed debt, direct
lending, structured credit, niche credit, and opportunistic equity. The program is less liquid thantraditional strategies.
ObjectiveThe objective of the Multi-Strategy program was to generate annualized net-of-fee returns that exceed the public equity market over a long-term period but with lower volatility and beta to traditional markets, measured by recession to recession. The benchmark is the S&P/LSTA Leveraged Loan Index.
Multi-Strategy($ millions)
Sub-Asset Class Fair Value% of
Total FundPrivate Credit Funds1/ $305.7 1.0%Credit-Focused Strategies 969.8 3.1Opportunistic Equity & Fixed Income 559.6 1.8Total Multi-Strategy $1,835.1 5.9%
1/As of December 31, 2019, unfunded commitments are $1,197.3 million.
SERS’ 2020 strategic investment strategy will phase out this asset class. A separate private credit portfolio has been established with a 4% long-term fund target.
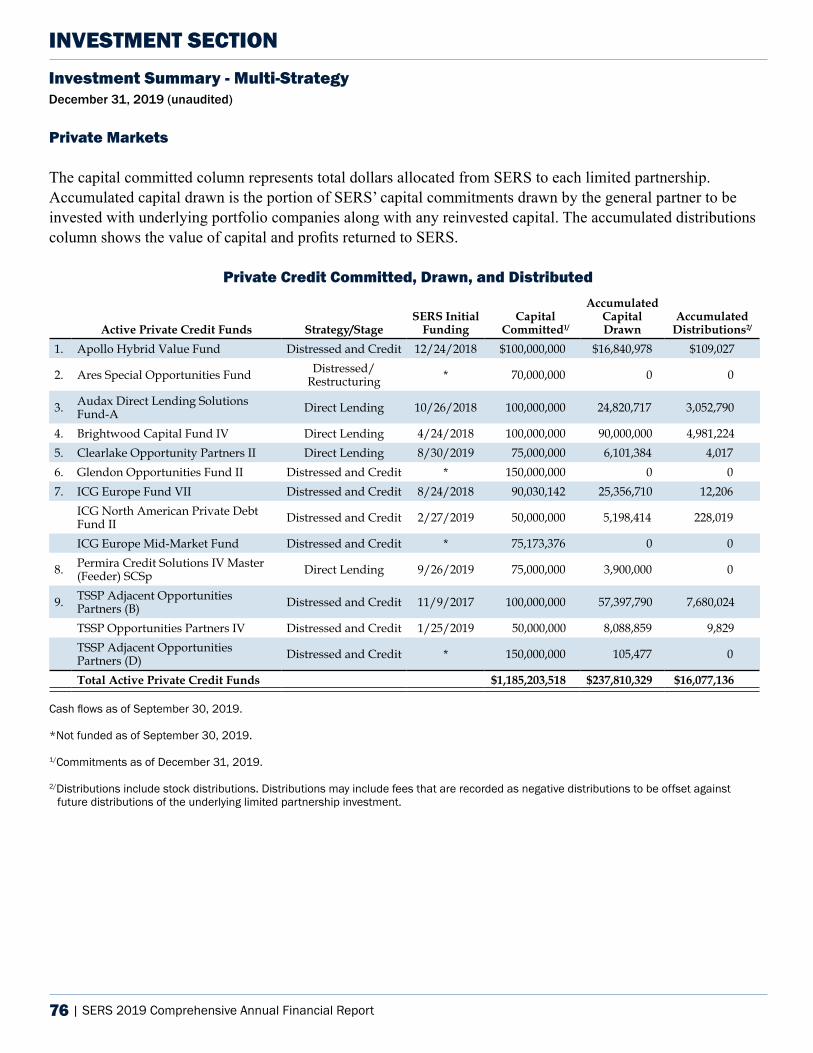
76 | SERS 2019 Comprehensive Annual Financial Report
INVESTMENT SECTIONInvestment Summary - Multi-Strategy December 31, 2019 (unaudited)
Private Markets
The capital committed column represents total dollars allocated from SERS to each limited partnership. Accumulated capital drawn is the portion of SERS’ capital commitments drawn by the general partner to be invested with underlying portfolio companies along with any reinvested capital. The accumulated distributions column shows the value of capital and profits returned to SERS.
Private Credit Committed, Drawn, and Distributed
Active Private Credit Funds Strategy/StageSERS Initial
FundingCapital
Committed1/
Accumulated Capital Drawn
Accumulated Distributions2/
1. Apollo Hybrid Value Fund Distressed and Credit 12/24/2018 $100,000,000 $16,840,978 $109,027
2. Ares Special Opportunities Fund Distressed/Restructuring * 70,000,000 0 0
3. Audax Direct Lending Solutions Fund-A Direct Lending 10/26/2018 100,000,000 24,820,717 3,052,790
4. Brightwood Capital Fund IV Direct Lending 4/24/2018 100,000,000 90,000,000 4,981,224 5. Clearlake Opportunity Partners II Direct Lending 8/30/2019 75,000,000 6,101,384 4,017 6. Glendon Opportunities Fund II Distressed and Credit * 150,000,000 0 0 7. ICG Europe Fund VII Distressed and Credit 8/24/2018 90,030,142 25,356,710 12,206
ICG North American Private Debt Fund II Distressed and Credit 2/27/2019 50,000,000 5,198,414 228,019
ICG Europe Mid-Market Fund Distressed and Credit * 75,173,376 0 0
8. Permira Credit Solutions IV Master (Feeder) SCSp Direct Lending 9/26/2019 75,000,000 3,900,000 0
9. TSSP Adjacent Opportunities Partners (B) Distressed and Credit 11/9/2017 100,000,000 57,397,790 7,680,024
TSSP Opportunities Partners IV Distressed and Credit 1/25/2019 50,000,000 8,088,859 9,829 TSSP Adjacent Opportunities Partners (D) Distressed and Credit * 150,000,000 105,477 0
Total Active Private Credit Funds $1,185,203,518 $237,810,329 $16,077,136
Cash flows as of September 30, 2019.
*Not funded as of September 30, 2019.
1/Commitments as of December 31, 2019.
2/Distributions include stock distributions. Distributions may include fees that are recorded as negative distributions to be offset against future distributions of the underlying limited partnership investment.
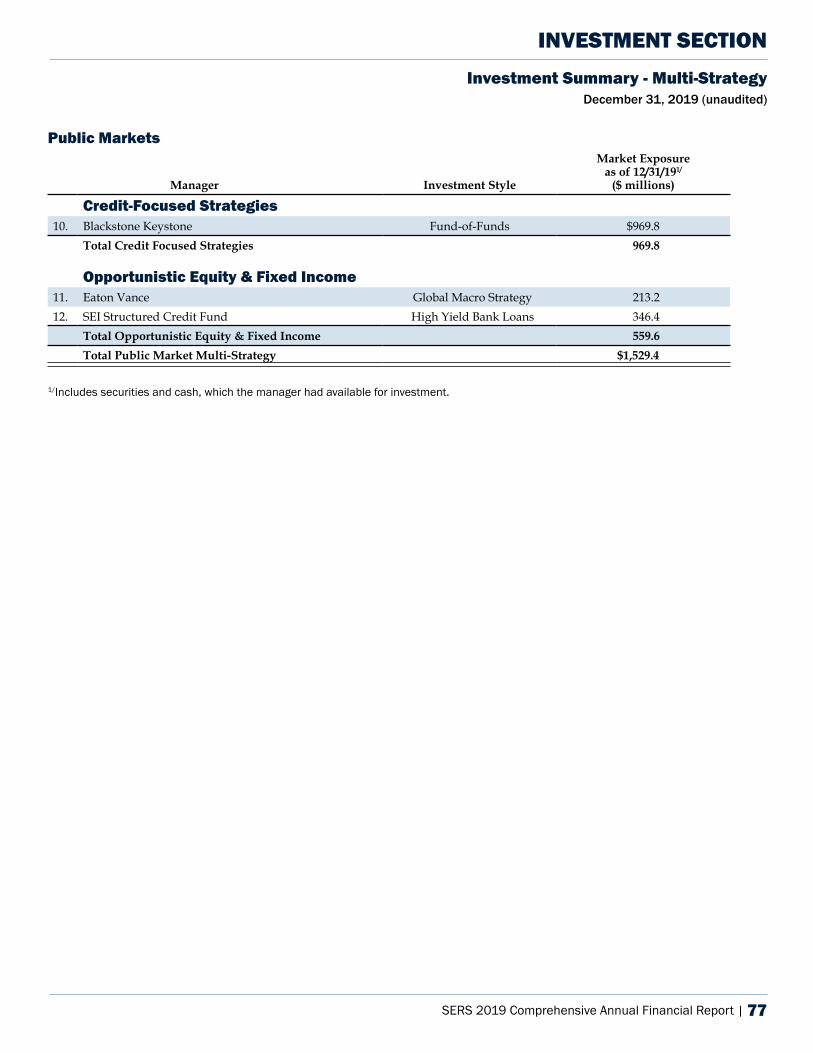
SERS 2019 Comprehensive Annual Financial Report | 77
INVESTMENT SECTIONInvestment Summary - Multi-Strategy
December 31, 2019 (unaudited)
Public Markets
Manager Investment Style
Market Exposure as of 12/31/191/
($ millions)
Credit-Focused Strategies10. Blackstone Keystone Fund-of-Funds $969.8
Total Credit Focused Strategies 969.8
Opportunistic Equity & Fixed Income11. Eaton Vance Global Macro Strategy 213.212. SEI Structured Credit Fund High Yield Bank Loans 346.4
Total Opportunistic Equity & Fixed Income 559.6Total Public Market Multi-Strategy $1,529.4
1/Includes securities and cash, which the manager had available for investment.
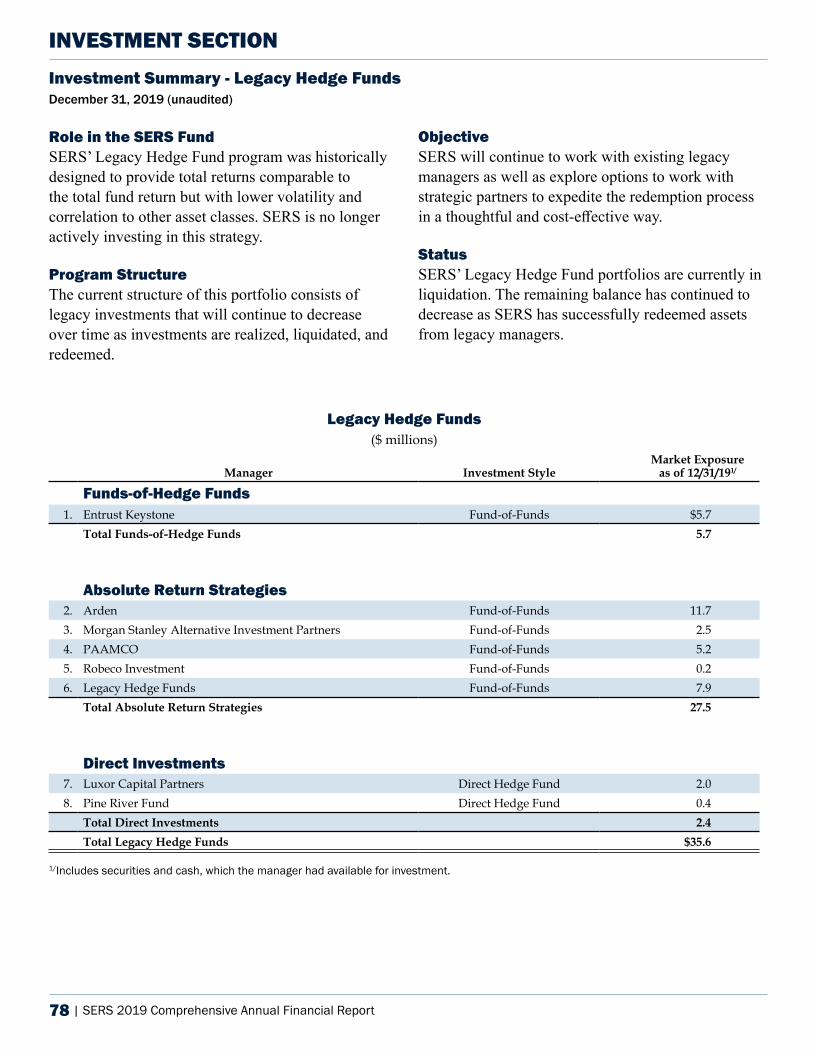
78 | SERS 2019 Comprehensive Annual Financial Report
INVESTMENT SECTIONInvestment Summary - Legacy Hedge Funds December 31, 2019 (unaudited)
Role in the SERS Fund SERS’ Legacy Hedge Fund program was historically designed to provide total returns comparable to the total fund return but with lower volatility and correlation to other asset classes. SERS is no longer actively investing in this strategy.
Program Structure The current structure of this portfolio consists of legacy investments that will continue to decrease over time as investments are realized, liquidated, and redeemed.
Objective SERS will continue to work with existing legacy managers as well as explore options to work with strategic partners to expedite the redemption process in a thoughtful and cost-effective way.
Status SERS’ Legacy Hedge Fund portfolios are currently in liquidation. The remaining balance has continued to decrease as SERS has successfully redeemed assets from legacy managers.
Legacy Hedge Funds ($ millions)
Manager Investment StyleMarket Exposure
as of 12/31/191/
Funds-of-Hedge Funds1. Entrust Keystone Fund-of-Funds $5.7
Total Funds-of-Hedge Funds 5.7
Absolute Return Strategies2. Arden Fund-of-Funds 11.73. Morgan Stanley Alternative Investment Partners Fund-of-Funds 2.54. PAAMCO Fund-of-Funds 5.25. Robeco Investment Fund-of-Funds 0.26. Legacy Hedge Funds Fund-of-Funds 7.9
Total Absolute Return Strategies 27.5
Direct Investments7. Luxor Capital Partners Direct Hedge Fund 2.08. Pine River Fund Direct Hedge Fund 0.4
Total Direct Investments 2.4Total Legacy Hedge Funds $35.6
1/Includes securities and cash, which the manager had available for investment.
SERS 2019 Comprehensive Annual Financial Report | 79
Investment Summary - Fixed Income December 31, 2019 (unaudited)
INVESTMENT SECTION
Role in the SERS FundSERS’ Fixed Income program is structured to:
• Generate income to pay benefits
• Provide additional liquidity to minimize capital impairment risk
• Reduce volatility of the total fund
• Protect SERS against deflation (and inflation via TIPS)
• Contribute total return to SERS when market conditions permit
Program StructureFixed income includes investments in publicly-traded debt obligations of sovereign, quasi-sovereign, and corporate entities. The asset class generates current income and the repayment of principal at maturity.
Shorter duration fixed income has substantially lower volatility than equity, and most fixed income investments have a low correlation with equity returns. SERS’ Fixed Income program is categorized into four strategies and a separate cash allocation to improve transparency on SERS’ unallocated cash amount.
Consistent with continuing cost reduction efforts, SERS has successfully lowered the overall cost of this program by increasing its exposure to index strategies and consolidating portfolios.
Objective The objective of the Fixed Income program is to generate annualized net-of-fee returns that exceed its benchmark, the Bloomberg Barclays U.S. Aggregate Bond Index, over a three- to five-year period.
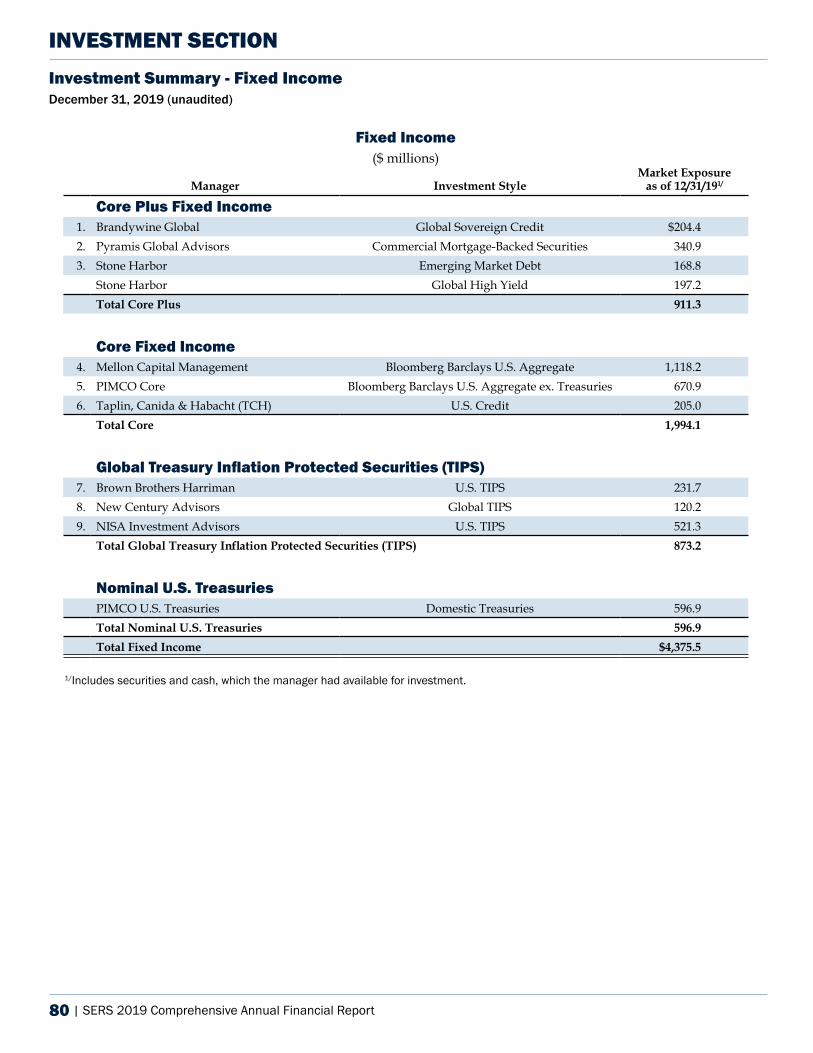
80 | SERS 2019 Comprehensive Annual Financial Report
INVESTMENT SECTIONInvestment Summary - Fixed Income December 31, 2019 (unaudited)
Fixed Income ($ millions)
Manager Investment StyleMarket Exposure
as of 12/31/191/
Core Plus Fixed Income1. Brandywine Global Global Sovereign Credit $204.42. Pyramis Global Advisors Commercial Mortgage-Backed Securities 340.93. Stone Harbor Emerging Market Debt 168.8
Stone Harbor Global High Yield 197.2Total Core Plus 911.3
Core Fixed Income4. Mellon Capital Management Bloomberg Barclays U.S. Aggregate 1,118.2 5. PIMCO Core Bloomberg Barclays U.S. Aggregate ex. Treasuries 670.96. Taplin, Canida & Habacht (TCH) U.S. Credit 205.0
Total Core 1,994.1
Global Treasury Inflation Protected Securities (TIPS)7. Brown Brothers Harriman U.S. TIPS 231.78. New Century Advisors Global TIPS 120.29. NISA Investment Advisors U.S. TIPS 521.3
Total Global Treasury Inflation Protected Securities (TIPS) 873.2
Nominal U.S. TreasuriesPIMCO U.S. Treasuries Domestic Treasuries 596.9Total Nominal U.S. Treasuries 596.9Total Fixed Income $4,375.5
1/Includes securities and cash, which the manager had available for investment.
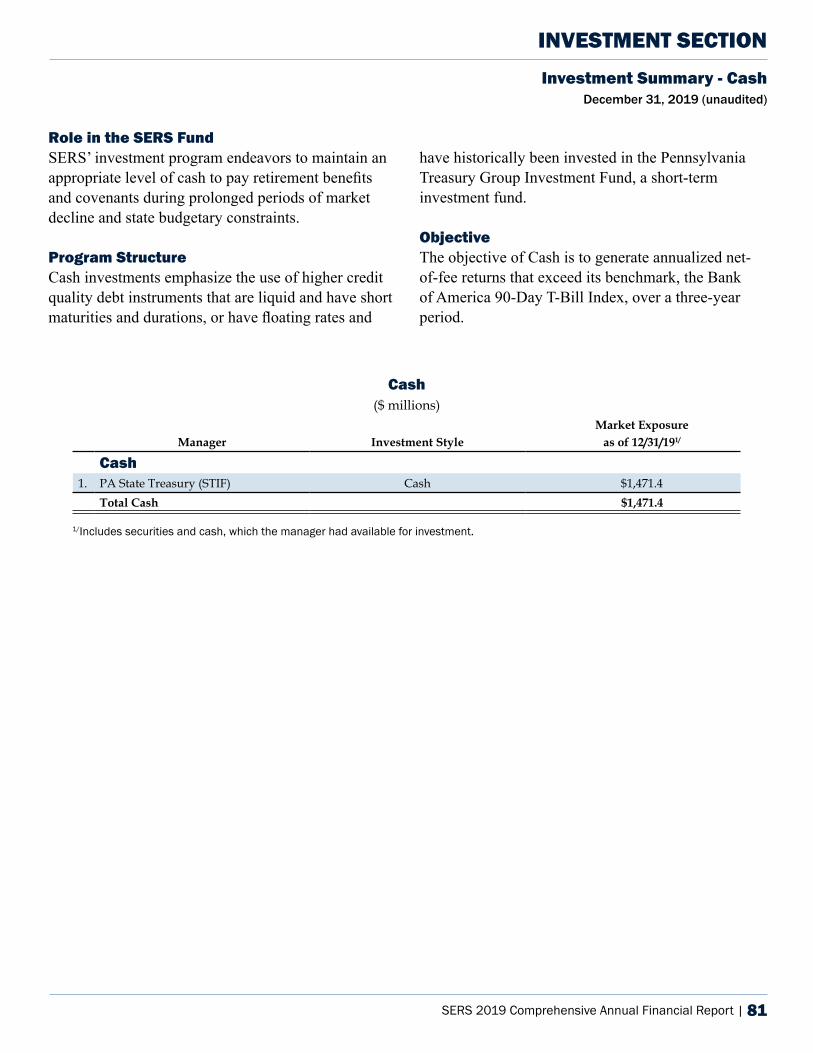
SERS 2019 Comprehensive Annual Financial Report | 81
INVESTMENT SECTIONInvestment Summary - Cash
December 31, 2019 (unaudited)
Role in the SERS FundSERS’ investment program endeavors to maintain an appropriate level of cash to pay retirement benefits and covenants during prolonged periods of market decline and state budgetary constraints.
Program StructureCash investments emphasize the use of higher credit quality debt instruments that are liquid and have short maturities and durations, or have floating rates and
have historically been invested in the Pennsylvania Treasury Group Investment Fund, a short-term investment fund.
Objective The objective of Cash is to generate annualized net-of-fee returns that exceed its benchmark, the Bank of America 90-Day T-Bill Index, over a three-year period.
Cash($ millions)
Manager Investment StyleMarket Exposure
as of 12/31/191/
Cash1. PA State Treasury (STIF) Cash $1,471.4
Total Cash $1,471.4
1/Includes securities and cash, which the manager had available for investment.
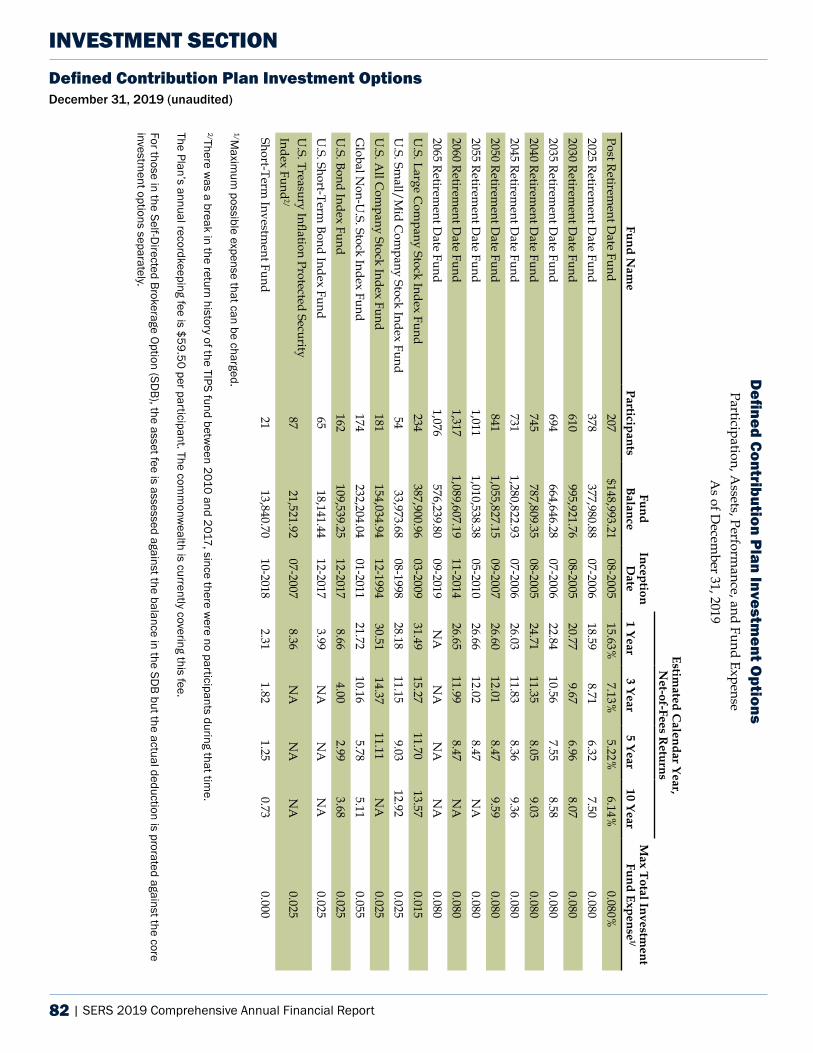
82 | SERS 2019 Comprehensive Annual Financial Report
Defined Contribution Plan Investment Options December 31, 2019 (unaudited)
INVESTMENT SECTIOND
efined Contribution Plan Investment O
ptionsParticipation, A
ssets, Performance, and Fund Expense
As of D
ecember 31, 2019
Estimated C
alendar Year, N
et-of-Fees Returns
Fund Nam
e
ParticipantsFund
BalanceInception
Date
1 Year3 Year
5 Year10 Year
Max Total Investm
ent Fund Expense
1/
Post Retirement D
ate Fund207
$148,993.21 08-2005
15.63%7.13%
5.22%6.14%
0.080%2025 Retirem
ent Date Fund
378 377,980.88
07-2006 18.59
8.71 6.32
7.50 0.080
2030 Retirement D
ate Fund610
995,921.76 08-2005
20.77 9.67
6.96 8.07
0.080 2035 Retirem
ent Date Fund
694 664,646.28
07-2006 22.84
10.56 7.55
8.58 0.080
2040 Retirement D
ate Fund745
787,809.35 08-2005
24.71 11.35
8.05 9.03
0.080 2045 Retirem
ent Date Fund
731 1,280,822.93
07-2006 26.03
11.83 8.36
9.36 0.080
2050 Retirement D
ate Fund841
1,055,827.15 09-2007
26.60 12.01
8.47 9.59
0.080 2055 Retirem
ent Date Fund
1,011 1,010,538.38
05-2010 26.66
12.02 8.47
NA
0.080
2060 Retirement D
ate Fund1,317
1,089,607.19 11-2014
26.65 11.99
8.47 N
A
0.080 2065 Retirem
ent Date Fund
1,076 576,239.80
09-2019 N
A
NA
N
A
NA
0.080
U.S. Large C
ompany Stock Index Fund
234 387,900.96
03-2009 31.49
15.27 11.70
13.57 0.015
U.S. Sm
all/Mid C
ompany Stock Index Fund
54 33,973.68
08-1998 28.18
11.15 9.03
12.92 0.025
U.S. A
ll Com
pany Stock Index Fund181
154,034.94 12-1994
30.51 14.37
11.11 N
A
0.025 G
lobal Non-U
.S. Stock Index Fund174
232,204.04 01-2011
21.72 10.16
5.78 5.11
0.055 U
.S. Bond Index Fund162
109,539.25 12-2017
8.66 4.00
2.99 3.68
0.025 U
.S. Short-Term Bond Index Fund
65 18,141.44
12-2017 3.99
NA
N
A
NA
0.025
U.S. Treasury Inflation Protected Security
Index Fund2/
87 21,521.92
07-2007 8.36
NA
N
A
NA
0.025
Short-Term Investm
ent Fund21
13,840.70 10-2018
2.31 1.82
1.25 0.73
0.000
1/Maxim
um possible expense that can be charged.
2/There was a break in the return history of the TIPS fund betw
een 2010 and 2017, since there were no participants during that tim
e.
The Plan’s annual recordkeeping fee is $59.50 per participant. The comm
onwealth is currently covering this fee.
For those in the Self-Directed Brokerage Option (SD
B), the asset fee is assessed against the balance in the SDB but the actual deduction is prorated against the core
investment options separately.

Actuarial Section
2019
SERS 2019 Comprehensive Annual Financial Report | 83
84 | SERS 2019 Comprehensive Annual Financial Report
SERS 2019 Comprehensive Annual Financial Report | 85
86 | SERS 2019 Comprehensive Annual Financial Report

SERS 2019 Comprehensive Annual Financial Report | 87
Summary of Actuarial Assumptions and MethodsDecember 31, 2019 (unaudited)
ACTUARIAL SECTION
The schedules in this Actuarial Section are reported in accordance with SERS actuarial funding valuationbased on statutory requirements. For funding purposes, actuarial methods are specified by statute while actuarial assumptions are recommended by SERS actuary and approved by the SERS Board, as trustees of the State Employees’ Retirement Fund. The State Employees’ Retirement Code (retirement code), legislated by the General Assembly and signed into law by the Governor, establishes funding policy. The retirement code is administered by the SERS Board. The General Assembly, along with the Governor’s signing, has the authority to amend the retirement code. The Financial Section, except where noted, is reported in accordance with a separate actuarial accounting valuation based on Governmental Accounting Standards Board Statement No. 67 (GASB 67).
For funding purposes, a variation of the entry-age normal actuarial cost method, which is used to determine the liabilities and costs related to SERS benefits, is based on the benefits and contributions for new members rather than for all current members from their date of entry under the entry-age actuarial cost method for financial reporting purposes under GASB 67. Ultimately, this variation for funding purposes should produce approximately the same results as the typical entry-age method over the long run. For funding purposes, a five-year smoothed market value is used as the asset valuation method compared to fair (market) value for financial reporting purposes.
SERS uses amortization periods of 10 years and 30 years with level payments over closed periods. Thecurrent amortization schedules are as follows:
(1) Act 2010-120 established a fresh start amortization of the December 31, 2009, unfunded liability over a 30-year period beginning July 1, 2010, and ending June 30, 2040.
(2) The amortization of the change in liability due to Act 2010-120 over a 30-year period beginning July 1, 2011, and ending on June 30, 2041.
(3) The amortization of changes in liability due to actual experience differing from assumed experience after December 31, 2009, over 30-year periods beginning with the July 1 following the actuarial valuation determining such changes.
(4) The extra contribution to return Act 2017-5 savings.
Actuarial methods and assumptions used for both funding purposes as well as financial reporting purposes include:
• The investment rate of return of 7.125% per year is based on an underlying rate of inflation of 2.6% per year.
• For current and future non-disabled retirees, beneficiaries, and survivors, SERS uses the RP-2000 Male and Female Combined Healthy Mortality Tables projected (using Projection Scale AA) to 2016 for males and to 2020 for females, and then further adjusted to ensure sufficient margin for improvement in certain age ranges. For current and future disabled retirees, SERS uses the RP-2000 Male and Female Disabled Retiree Mortality Tables projected (using Projection Scale AA) to 2021 for males and to 2017 for females. For all pre-retirement active members, the mortality is based on actual SERS experience.
88 | SERS 2019 Comprehensive Annual Financial Report
Summary of Actuarial Assumptions and MethodsDecember 31, 2019 (unaudited)
ACTUARIAL SECTION
• The rates for probability of retirement and the probabilities of withdrawal from active service, including death, before age and service retirements, which are presented in the Schedules of Active Member Valuation Data.
• The projected average salary increases of 5.6% with a range of 3.7% to 8.9%. This increase includes an underlying assumption of 2.6% for inflation. The annual rate of salary increase for promotions and longevity for members is presented in the Schedules of Active Member Valuation Data.
• No cost-of-living adjustments were used in the determination of actuarial valuations. SERS periodically prepares a study using actual experience in order to develop assumptions for use in its actuarial valuations. The latest study dated March 9, 2016 was completed for the period January 1, 2011 through December 31, 2015.
The most recent valuations were based on members of SERS as of December 31, 2019. All census and asset data was supplied by SERS and was subject to reasonable consistency checks. The actuarial computations were prepared by, or under the supervision of, a Member of the American Academy of Actuaries (M.A.A.A.).
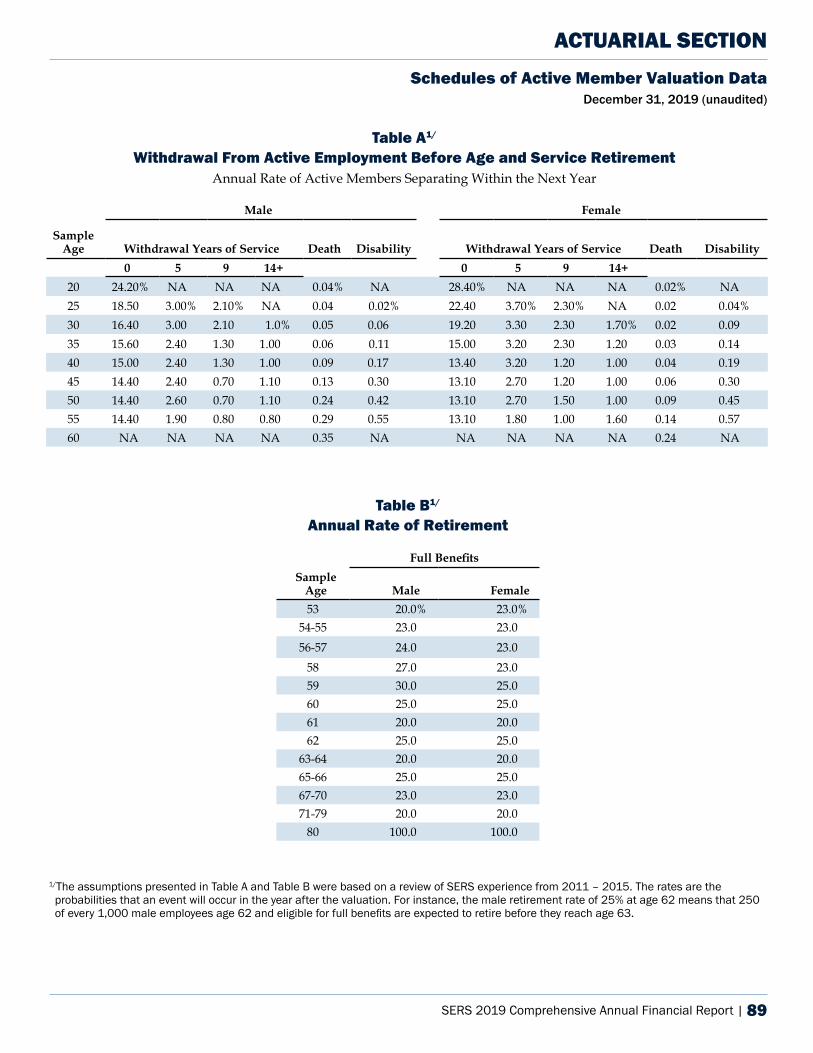
SERS 2019 Comprehensive Annual Financial Report | 89
Schedules of Active Member Valuation Data December 31, 2019 (unaudited)
ACTUARIAL SECTION
Table A1/
Withdrawal From Active Employment Before Age and Service Retirement Annual Rate of Active Members Separating Within the Next Year
Male Female
Sample Age Withdrawal Years of Service Death Disability Withdrawal Years of Service Death Disability
0 5 9 14+ 0 5 9 14+20 24.20% NA NA NA 0.04% NA 28.40% NA NA NA 0.02% NA25 18.50 3.00% 2.10% NA 0.04 0.02% 22.40 3.70% 2.30% NA 0.02 0.04%30 16.40 3.00 2.10 1.0% 0.05 0.06 19.20 3.30 2.30 1.70% 0.02 0.09 35 15.60 2.40 1.30 1.00 0.06 0.11 15.00 3.20 2.30 1.20 0.03 0.14 40 15.00 2.40 1.30 1.00 0.09 0.17 13.40 3.20 1.20 1.00 0.04 0.19 45 14.40 2.40 0.70 1.10 0.13 0.30 13.10 2.70 1.20 1.00 0.06 0.30 50 14.40 2.60 0.70 1.10 0.24 0.42 13.10 2.70 1.50 1.00 0.09 0.45 55 14.40 1.90 0.80 0.80 0.29 0.55 13.10 1.80 1.00 1.60 0.14 0.57 60 NA NA NA NA 0.35 NA NA NA NA NA 0.24 NA
Table B1/ Annual Rate of Retirement
Full BenefitsSample
Age Male Female53 20.0% 23.0%
54-55 23.0 23.0 56-57 24.0 23.0
58 27.0 23.0 59 30.0 25.0 60 25.0 25.0 61 20.0 20.0 62 25.0 25.0
63-64 20.0 20.0 65-66 25.0 25.0 67-70 23.0 23.0 71-79 20.0 20.0
80 100.0 100.0
1/The assumptions presented in Table A and Table B were based on a review of SERS experience from 2011 – 2015. The rates are the probabilities that an event will occur in the year after the valuation. For instance, the male retirement rate of 25% at age 62 means that 250 of every 1,000 male employees age 62 and eligible for full benefits are expected to retire before they reach age 63.
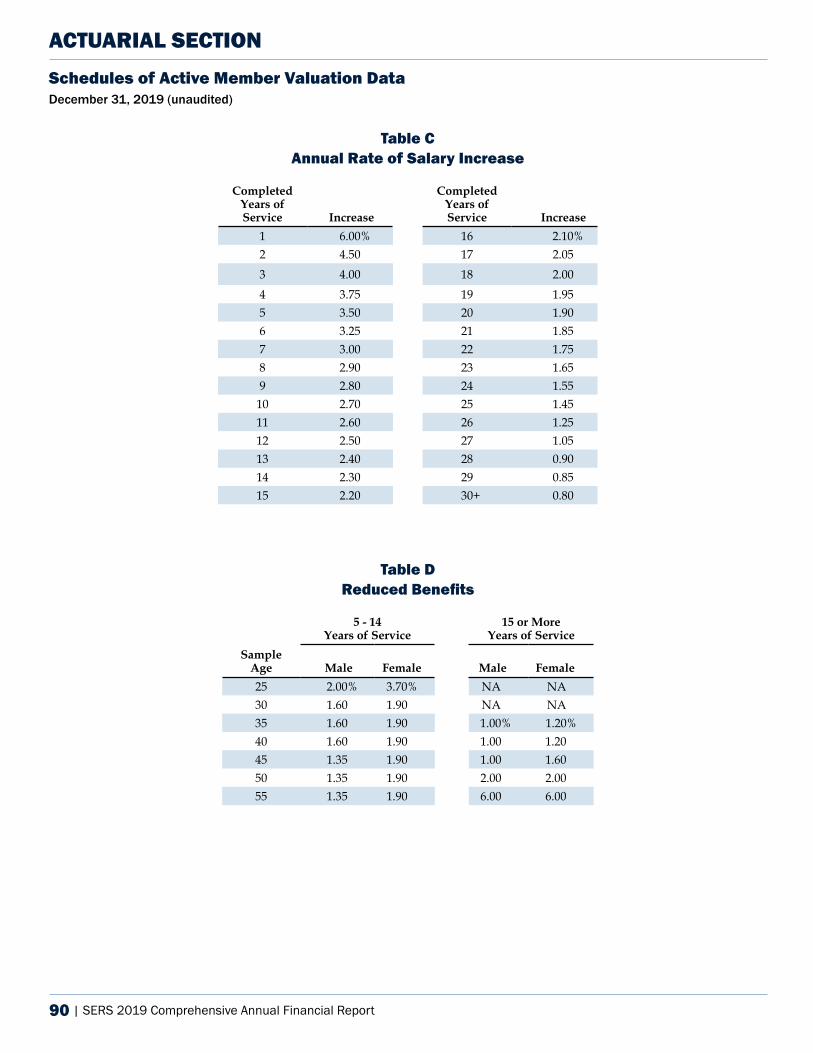
90 | SERS 2019 Comprehensive Annual Financial Report
ACTUARIAL SECTION
Table CAnnual Rate of Salary Increase
Completed Years of Service Increase
Completed Years of Service Increase
1 6.00% 16 2.10%2 4.50 17 2.053 4.00 18 2.004 3.75 19 1.955 3.50 20 1.906 3.25 21 1.857 3.00 22 1.758 2.90 23 1.659 2.80 24 1.55
10 2.70 25 1.4511 2.60 26 1.2512 2.50 27 1.0513 2.40 28 0.9014 2.30 29 0.8515 2.20 30+ 0.80
Table D Reduced Benefits
5 - 14Years of Service
15 or MoreYears of Service
Sample Age Male Female Male Female25 2.00% 3.70% NA NA 30 1.60 1.90 NA NA 35 1.60 1.90 1.00% 1.20%40 1.60 1.90 1.00 1.2045 1.35 1.90 1.00 1.6050 1.35 1.90 2.00 2.0055 1.35 1.90 6.00 6.00
Schedules of Active Member Valuation Data December 31, 2019 (unaudited)
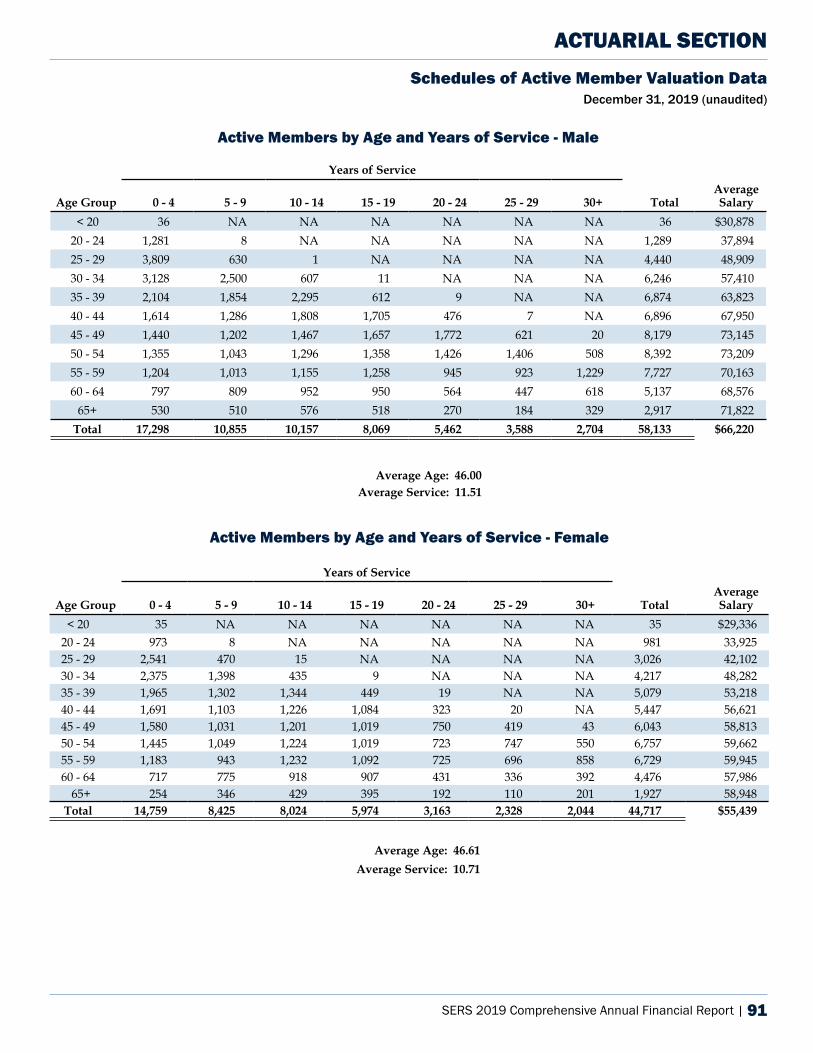
SERS 2019 Comprehensive Annual Financial Report | 91
Active Members by Age and Years of Service - Female
Years of Service
Age Group 0 - 4 5 - 9 10 - 14 15 - 19 20 - 24 25 - 29 30+ TotalAverage Salary
< 20 35 NA NA NA NA NA NA 35 $29,336 20 - 24 973 8 NA NA NA NA NA 981 33,925 25 - 29 2,541 470 15 NA NA NA NA 3,026 42,102 30 - 34 2,375 1,398 435 9 NA NA NA 4,217 48,282 35 - 39 1,965 1,302 1,344 449 19 NA NA 5,079 53,218 40 - 44 1,691 1,103 1,226 1,084 323 20 NA 5,447 56,621 45 - 49 1,580 1,031 1,201 1,019 750 419 43 6,043 58,813 50 - 54 1,445 1,049 1,224 1,019 723 747 550 6,757 59,662 55 - 59 1,183 943 1,232 1,092 725 696 858 6,729 59,945 60 - 64 717 775 918 907 431 336 392 4,476 57,986
65+ 254 346 429 395 192 110 201 1,927 58,948 Total 14,759 8,425 8,024 5,974 3,163 2,328 2,044 44,717 $55,439
Average Age: 46.61Average Service: 10.71
Active Members by Age and Years of Service - Male
Years of Service
Age Group 0 - 4 5 - 9 10 - 14 15 - 19 20 - 24 25 - 29 30+ TotalAverage Salary
< 20 36 NA NA NA NA NA NA 36 $30,878 20 - 24 1,281 8 NA NA NA NA NA 1,289 37,894 25 - 29 3,809 630 1 NA NA NA NA 4,440 48,909 30 - 34 3,128 2,500 607 11 NA NA NA 6,246 57,410 35 - 39 2,104 1,854 2,295 612 9 NA NA 6,874 63,823 40 - 44 1,614 1,286 1,808 1,705 476 7 NA 6,896 67,950 45 - 49 1,440 1,202 1,467 1,657 1,772 621 20 8,179 73,145 50 - 54 1,355 1,043 1,296 1,358 1,426 1,406 508 8,392 73,209 55 - 59 1,204 1,013 1,155 1,258 945 923 1,229 7,727 70,163 60 - 64 797 809 952 950 564 447 618 5,137 68,576
65+ 530 510 576 518 270 184 329 2,917 71,822 Total 17,298 10,855 10,157 8,069 5,462 3,588 2,704 58,133 $66,220
Average Age: 46.00 Average Service: 11.51
ACTUARIAL SECTIONSchedules of Active Member Valuation Data
December 31, 2019 (unaudited)
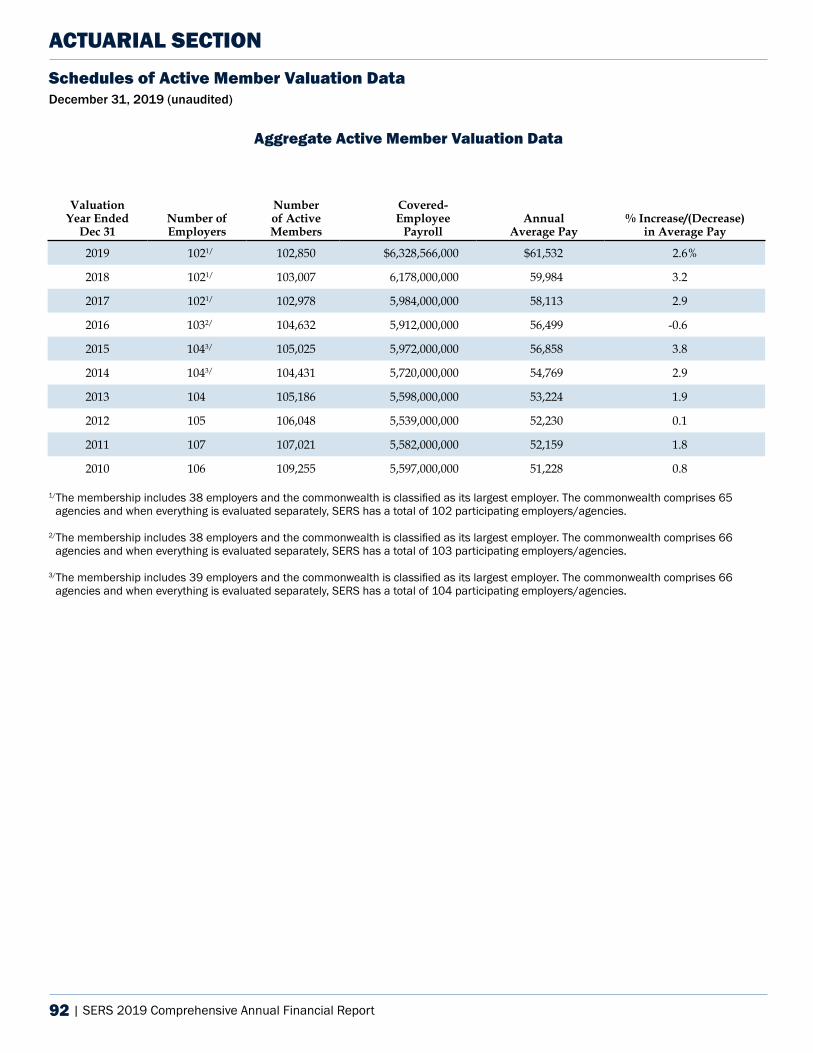
92 | SERS 2019 Comprehensive Annual Financial Report
Schedules of Active Member Valuation DataDecember 31, 2019 (unaudited)
ACTUARIAL SECTION
Aggregate Active Member Valuation Data
Valuation Year Ended
Dec 31Number of Employers
Number of Active Members
Covered-Employee
PayrollAnnual
Average Pay% Increase/(Decrease)
in Average Pay
2019 1021/ 102,850 $6,328,566,000 $61,532 2.6%
2018 1021/ 103,007 6,178,000,000 59,984 3.2
2017 1021/ 102,978 5,984,000,000 58,113 2.9
2016 1032/ 104,632 5,912,000,000 56,499 -0.6
2015 1043/ 105,025 5,972,000,000 56,858 3.8
2014 1043/ 104,431 5,720,000,000 54,769 2.9
2013 104 105,186 5,598,000,000 53,224 1.9
2012 105 106,048 5,539,000,000 52,230 0.1
2011 107 107,021 5,582,000,000 52,159 1.8
2010 106 109,255 5,597,000,000 51,228 0.8
1/The membership includes 38 employers and the commonwealth is classified as its largest employer. The commonwealth comprises 65 agencies and when everything is evaluated separately, SERS has a total of 102 participating employers/agencies.
2/The membership includes 38 employers and the commonwealth is classified as its largest employer. The commonwealth comprises 66 agencies and when everything is evaluated separately, SERS has a total of 103 participating employers/agencies.
3/The membership includes 39 employers and the commonwealth is classified as its largest employer. The commonwealth comprises 66 agencies and when everything is evaluated separately, SERS has a total of 104 participating employers/agencies.
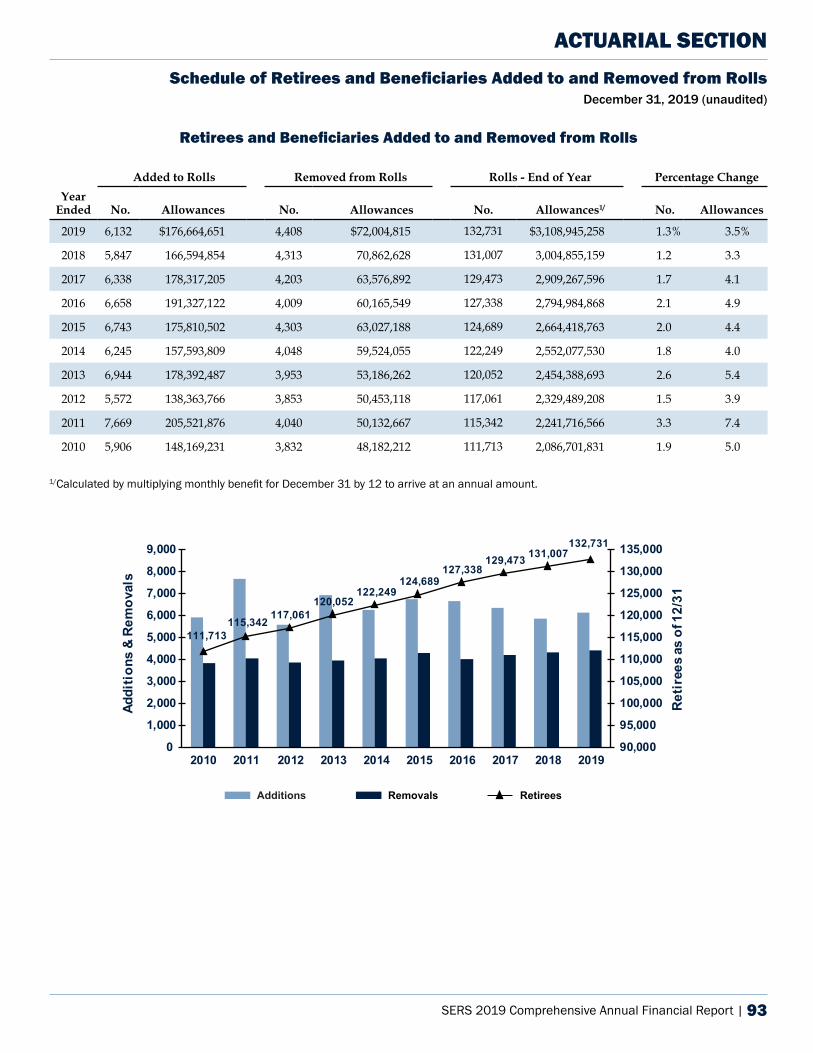
SERS 2019 Comprehensive Annual Financial Report | 93
Retirees and Beneficiaries Added to and Removed from Rolls
Added to Rolls Removed from Rolls Rolls - End of Year Percentage ChangeYear
Ended No. Allowances No. Allowances No. Allowances1/ No. Allowances
2019 6,132 $176,664,651 4,408 $72,004,815 132,731 $3,108,945,258 1.3% 3.5%
2018 5,847 166,594,854 4,313 70,862,628 131,007 3,004,855,159 1.2 3.3
2017 6,338 178,317,205 4,203 63,576,892 129,473 2,909,267,596 1.7 4.1
2016 6,658 191,327,122 4,009 60,165,549 127,338 2,794,984,868 2.1 4.9
2015 6,743 175,810,502 4,303 63,027,188 124,689 2,664,418,763 2.0 4.4
2014 6,245 157,593,809 4,048 59,524,055 122,249 2,552,077,530 1.8 4.0
2013 6,944 178,392,487 3,953 53,186,262 120,052 2,454,388,693 2.6 5.4
2012 5,572 138,363,766 3,853 50,453,118 117,061 2,329,489,208 1.5 3.9
2011 7,669 205,521,876 4,040 50,132,667 115,342 2,241,716,566 3.3 7.4
2010 5,906 148,169,231 3,832 48,182,212 111,713 2,086,701,831 1.9 5.0
ACTUARIAL SECTION
1/Calculated by multiplying monthly benefit for December 31 by 12 to arrive at an annual amount.
Schedule of Retirees and Beneficiaries Added to and Removed from Rolls December 31, 2019 (unaudited)
111,713 115,342
117,061 120,052
122,249 124,689
127,338 129,473 131,007
132,731
90,000
95,000
100,000
105,000
110,000
115,000
120,000
125,000
130,000
135,000
0
1,000
2,000
3,000
4,000
5,000
6,000
7,000
8,000
9,000
2010 2011 2012 2013 2014 2015 2016 2017 2018 2019
Ret
iree
s as
of 1
2/31
Addi
tion
s &
Rem
oval
s
Additions Removals Retirees
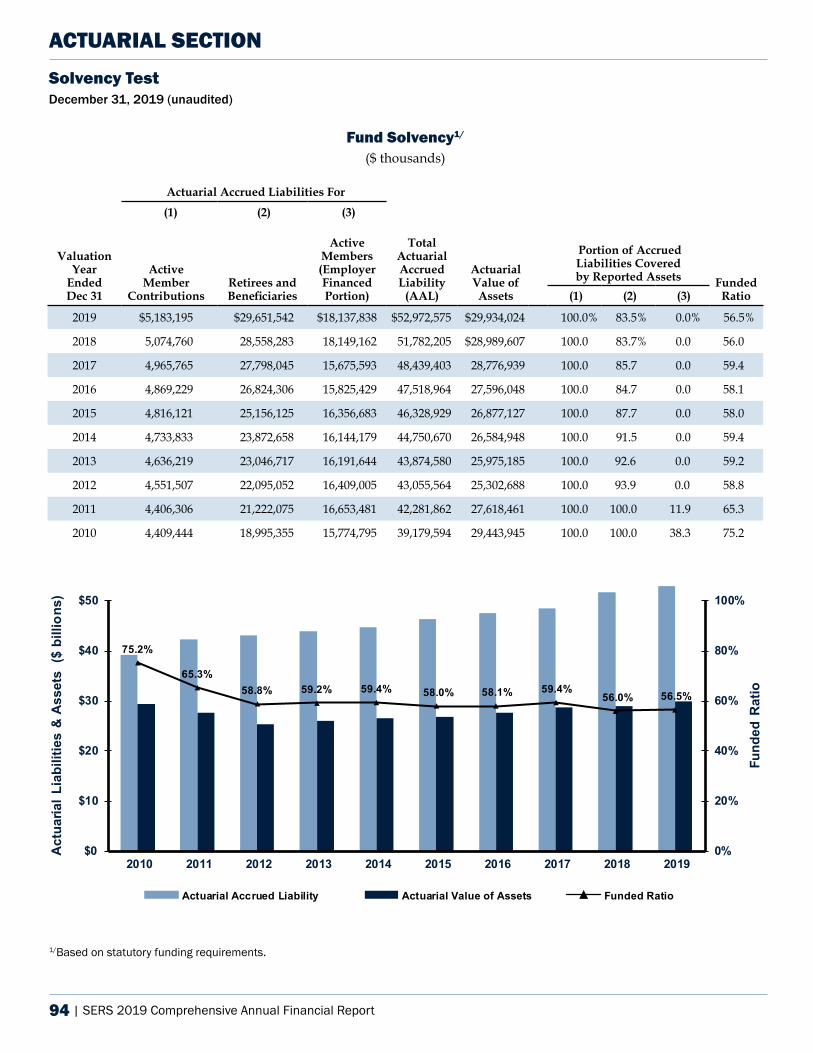
94 | SERS 2019 Comprehensive Annual Financial Report
Fund Solvency1/
($ thousands)
Actuarial Accrued Liabilities For
(1) (2) (3)
Valuation Year
Ended Dec 31
Active Member
ContributionsRetirees and Beneficiaries
Active Members (Employer Financed Portion)
Total Actuarial Accrued Liability
(AAL)
Actuarial Value of Assets
Portion of AccruedLiabilities Coveredby Reported Assets Funded
Ratio (1) (2) (3)
2019 $5,183,195 $29,651,542 $18,137,838 $52,972,575 $29,934,024 100.0% 83.5% 0.0% 56.5%
2018 5,074,760 28,558,283 18,149,162 51,782,205 $28,989,607 100.0 83.7% 0.0 56.0
2017 4,965,765 27,798,045 15,675,593 48,439,403 28,776,939 100.0 85.7 0.0 59.4
2016 4,869,229 26,824,306 15,825,429 47,518,964 27,596,048 100.0 84.7 0.0 58.1
2015 4,816,121 25,156,125 16,356,683 46,328,929 26,877,127 100.0 87.7 0.0 58.0
2014 4,733,833 23,872,658 16,144,179 44,750,670 26,584,948 100.0 91.5 0.0 59.4
2013 4,636,219 23,046,717 16,191,644 43,874,580 25,975,185 100.0 92.6 0.0 59.2
2012 4,551,507 22,095,052 16,409,005 43,055,564 25,302,688 100.0 93.9 0.0 58.8
2011 4,406,306 21,222,075 16,653,481 42,281,862 27,618,461 100.0 100.0 11.9 65.3
2010 4,409,444 18,995,355 15,774,795 39,179,594 29,443,945 100.0 100.0 38.3 75.2
ACTUARIAL SECTIONSolvency TestDecember 31, 2019 (unaudited)
1/Based on statutory funding requirements.
75.2%
65.3%58.8% 59.2% 59.4% 58.0% 58.1% 59.4%
56.0% 56.5%
0%
20%
40%
60%
80%
100%
$0
$10
$20
$30
$40
$50
2010 2011 2012 2013 2014 2015 2016 2017 2018 2019
Fund
ed R
atio
Act
uaria
l Lia
bilit
ies
& A
sset
s ($
bill
ions
)
Actuarial Accrued Liability Actuarial Value of Assets Funded Ratio
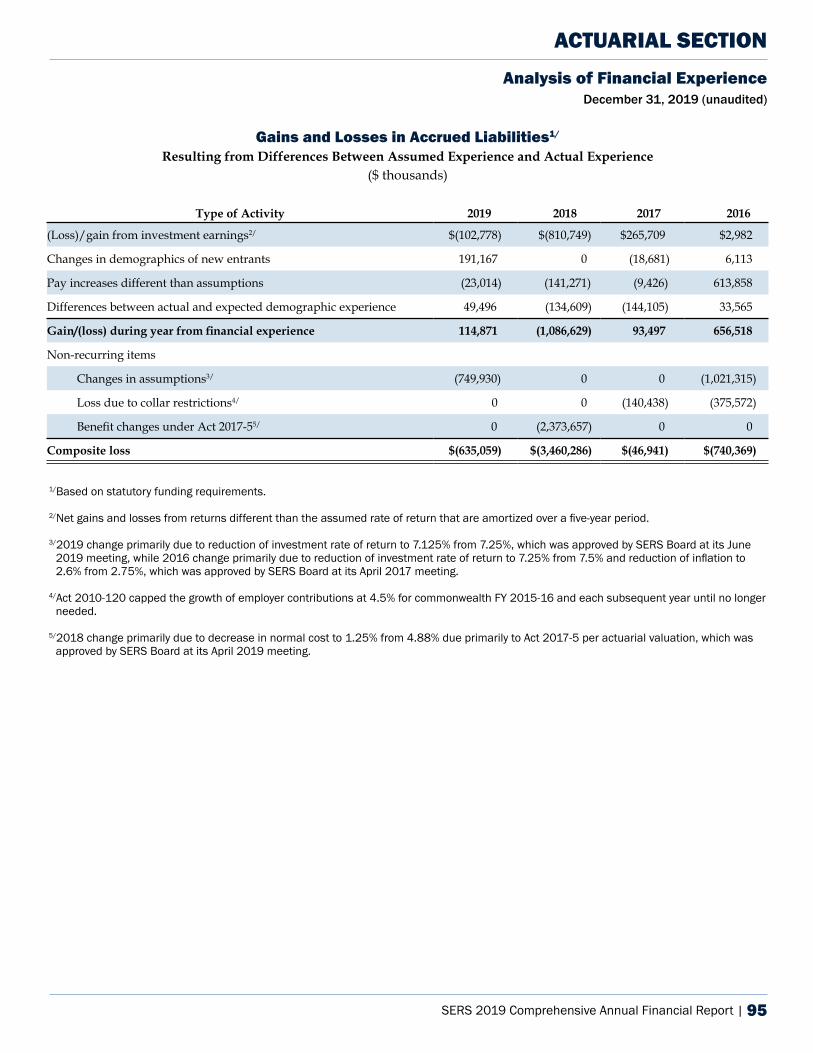
SERS 2019 Comprehensive Annual Financial Report | 95
Gains and Losses in Accrued Liabilities1/
Resulting from Differences Between Assumed Experience and Actual Experience ($ thousands)
Type of Activity 2019 2018 2017 2016
(Loss)/gain from investment earnings2/ $(102,778) $(810,749) $265,709 $2,982
Changes in demographics of new entrants 191,167 0 (18,681) 6,113
Pay increases different than assumptions (23,014) (141,271) (9,426) 613,858
Differences between actual and expected demographic experience 49,496 (134,609) (144,105) 33,565
Gain/(loss) during year from financial experience 114,871 (1,086,629) 93,497 656,518
Non-recurring items
Changes in assumptions3/ (749,930) 0 0 (1,021,315)
Loss due to collar restrictions4/ 0 0 (140,438) (375,572)
Benefit changes under Act 2017-55/ 0 (2,373,657) 0 0
Composite loss $(635,059) $(3,460,286) $(46,941) $(740,369)
1/Based on statutory funding requirements.
2/Net gains and losses from returns different than the assumed rate of return that are amortized over a five-year period.
3/2019 change primarily due to reduction of investment rate of return to 7.125% from 7.25%, which was approved by SERS Board at its June 2019 meeting, while 2016 change primarily due to reduction of investment rate of return to 7.25% from 7.5% and reduction of inflation to 2.6% from 2.75%, which was approved by SERS Board at its April 2017 meeting.
4/Act 2010-120 capped the growth of employer contributions at 4.5% for commonwealth FY 2015-16 and each subsequent year until no longer needed.
5/2018 change primarily due to decrease in normal cost to 1.25% from 4.88% due primarily to Act 2017-5 per actuarial valuation, which was approved by SERS Board at its April 2019 meeting.
ACTUARIAL SECTIONAnalysis of Financial Experience
December 31, 2019 (unaudited)
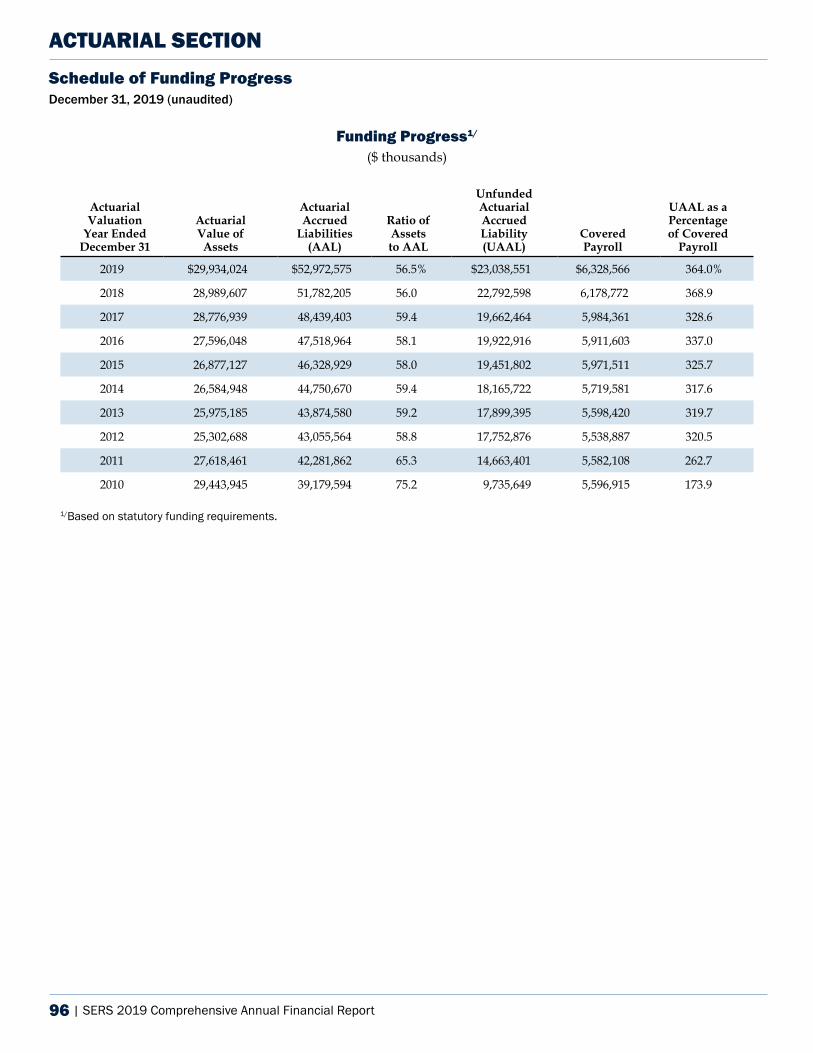
96 | SERS 2019 Comprehensive Annual Financial Report
Funding Progress1/ ($ thousands)
Actuarial Valuation
Year Ended December 31
Actuarial Value of Assets
Actuarial Accrued
Liabilities (AAL)
Ratio of Assets to AAL
Unfunded Actuarial Accrued Liability (UAAL)
Covered Payroll
UAAL as a Percentage of Covered
Payroll
2019 $29,934,024 $52,972,575 56.5% $23,038,551 $6,328,566 364.0%
2018 28,989,607 51,782,205 56.0 22,792,598 6,178,772 368.9
2017 28,776,939 48,439,403 59.4 19,662,464 5,984,361 328.6
2016 27,596,048 47,518,964 58.1 19,922,916 5,911,603 337.0
2015 26,877,127 46,328,929 58.0 19,451,802 5,971,511 325.7
2014 26,584,948 44,750,670 59.4 18,165,722 5,719,581 317.6
2013 25,975,185 43,874,580 59.2 17,899,395 5,598,420 319.7
2012 25,302,688 43,055,564 58.8 17,752,876 5,538,887 320.5
2011 27,618,461 42,281,862 65.3 14,663,401 5,582,108 262.7
2010 29,443,945 39,179,594 75.2 9,735,649 5,596,915 173.9
1/Based on statutory funding requirements.
ACTUARIAL SECTIONSchedule of Funding ProgressDecember 31, 2019 (unaudited)
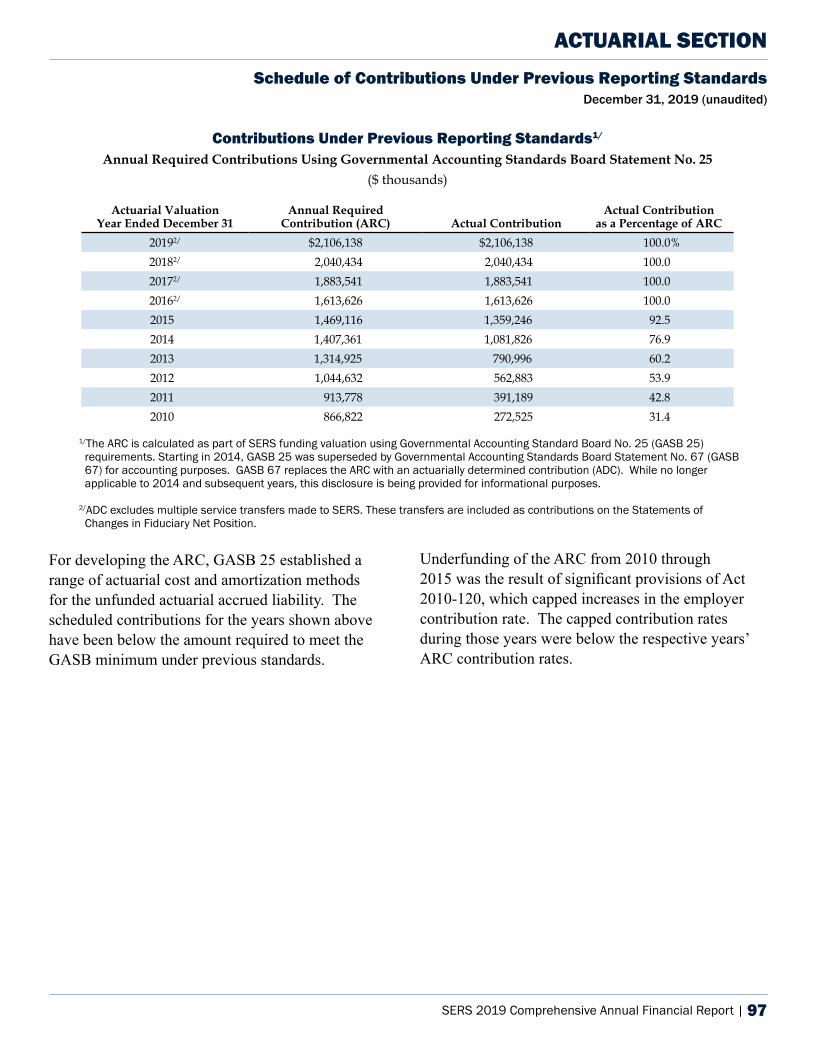
SERS 2019 Comprehensive Annual Financial Report | 97
ACTUARIAL SECTIONSchedule of Contributions Under Previous Reporting Standards
December 31, 2019 (unaudited)
Contributions Under Previous Reporting Standards1/
Annual Required Contributions Using Governmental Accounting Standards Board Statement No. 25($ thousands)
Actuarial Valuation Year Ended December 31
Annual Required Contribution (ARC) Actual Contribution
Actual Contribution as a Percentage of ARC
20192/ $2,106,138 $2,106,138 100.0%20182/ 2,040,434 2,040,434 100.0 20172/ 1,883,541 1,883,541 100.0 20162/ 1,613,626 1,613,626 100.0 2015 1,469,116 1,359,246 92.5 2014 1,407,361 1,081,826 76.9 2013 1,314,925 790,996 60.2 2012 1,044,632 562,883 53.9 2011 913,778 391,189 42.8 2010 866,822 272,525 31.4
1/The ARC is calculated as part of SERS funding valuation using Governmental Accounting Standard Board No. 25 (GASB 25) requirements. Starting in 2014, GASB 25 was superseded by Governmental Accounting Standards Board Statement No. 67 (GASB 67) for accounting purposes. GASB 67 replaces the ARC with an actuarially determined contribution (ADC). While no longer applicable to 2014 and subsequent years, this disclosure is being provided for informational purposes.
2/ADC excludes multiple service transfers made to SERS. These transfers are included as contributions on the Statements of Changes in Fiduciary Net Position.
For developing the ARC, GASB 25 established a range of actuarial cost and amortization methods for the unfunded actuarial accrued liability. The scheduled contributions for the years shown above have been below the amount required to meet the GASB minimum under previous standards.
Underfunding of the ARC from 2010 through 2015 was the result of significant provisions of Act 2010-120, which capped increases in the employer contribution rate. The capped contribution rates during those years were below the respective years’ ARC contribution rates.
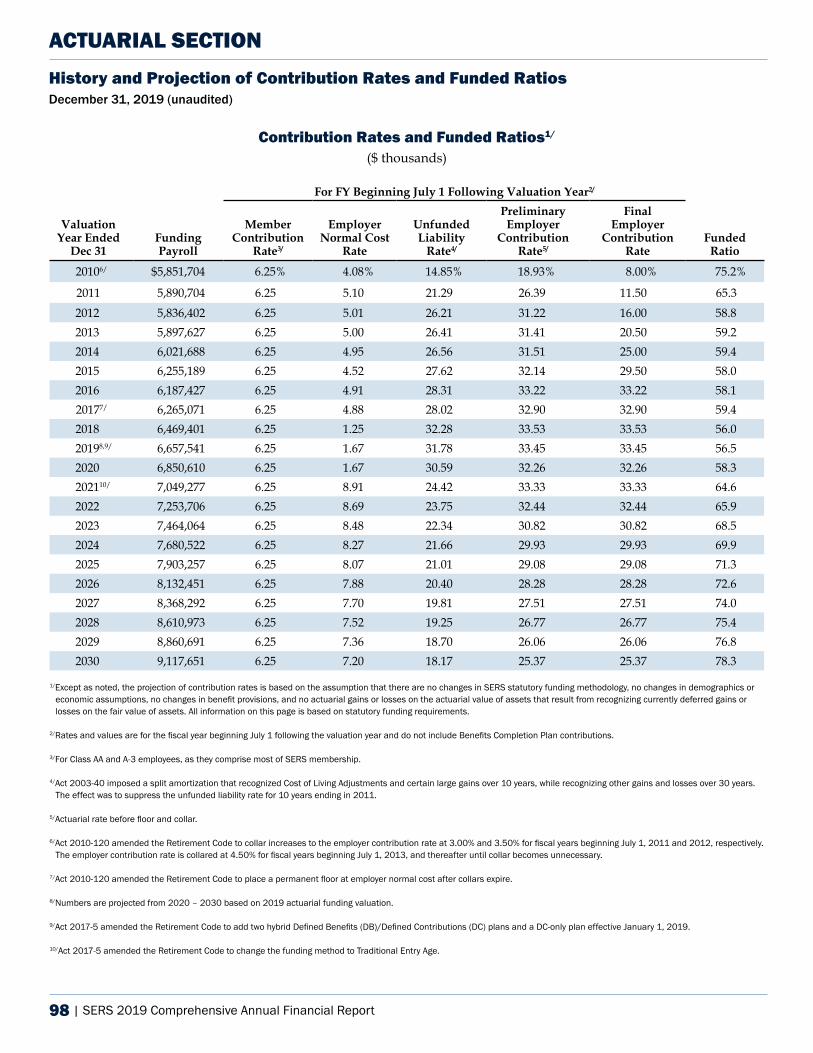
98 | SERS 2019 Comprehensive Annual Financial Report
Contribution Rates and Funded Ratios1/
($ thousands)
For FY Beginning July 1 Following Valuation Year2/
Valuation Year Ended
Dec 31Funding Payroll
Member Contribution
Rate3/
Employer Normal Cost
Rate
Unfunded Liability
Rate4/
Preliminary Employer
Contribution Rate5/
Final Employer
Contribution Rate
Funded Ratio
20106/ $5,851,704 6.25% 4.08% 14.85% 18.93% 8.00% 75.2%
2011 5,890,704 6.25 5.10 21.29 26.39 11.50 65.3 2012 5,836,402 6.25 5.01 26.21 31.22 16.00 58.8 2013 5,897,627 6.25 5.00 26.41 31.41 20.50 59.2 2014 6,021,688 6.25 4.95 26.56 31.51 25.00 59.4 2015 6,255,189 6.25 4.52 27.62 32.14 29.50 58.0 2016 6,187,427 6.25 4.91 28.31 33.22 33.22 58.1 20177/ 6,265,071 6.25 4.88 28.02 32.90 32.90 59.4 2018 6,469,401 6.25 1.25 32.28 33.53 33.53 56.0 20198,9/ 6,657,541 6.25 1.67 31.78 33.45 33.45 56.5 2020 6,850,610 6.25 1.67 30.59 32.26 32.26 58.3 202110/ 7,049,277 6.25 8.91 24.42 33.33 33.33 64.6 2022 7,253,706 6.25 8.69 23.75 32.44 32.44 65.9 2023 7,464,064 6.25 8.48 22.34 30.82 30.82 68.5 2024 7,680,522 6.25 8.27 21.66 29.93 29.93 69.9 2025 7,903,257 6.25 8.07 21.01 29.08 29.08 71.3 2026 8,132,451 6.25 7.88 20.40 28.28 28.28 72.6 2027 8,368,292 6.25 7.70 19.81 27.51 27.51 74.0 2028 8,610,973 6.25 7.52 19.25 26.77 26.77 75.4 2029 8,860,691 6.25 7.36 18.70 26.06 26.06 76.8 2030 9,117,651 6.25 7.20 18.17 25.37 25.37 78.3
1/Except as noted, the projection of contribution rates is based on the assumption that there are no changes in SERS statutory funding methodology, no changes in demographics or economic assumptions, no changes in benefit provisions, and no actuarial gains or losses on the actuarial value of assets that result from recognizing currently deferred gains or losses on the fair value of assets. All information on this page is based on statutory funding requirements.
2/Rates and values are for the fiscal year beginning July 1 following the valuation year and do not include Benefits Completion Plan contributions.
3/For Class AA and A-3 employees, as they comprise most of SERS membership.
4/Act 2003-40 imposed a split amortization that recognized Cost of Living Adjustments and certain large gains over 10 years, while recognizing other gains and losses over 30 years. The effect was to suppress the unfunded liability rate for 10 years ending in 2011.
5/Actuarial rate before floor and collar.
6/Act 2010-120 amended the Retirement Code to collar increases to the employer contribution rate at 3.00% and 3.50% for fiscal years beginning July 1, 2011 and 2012, respectively. The employer contribution rate is collared at 4.50% for fiscal years beginning July 1, 2013, and thereafter until collar becomes unnecessary.
7/Act 2010-120 amended the Retirement Code to place a permanent floor at employer normal cost after collars expire.
8/Numbers are projected from 2020 – 2030 based on 2019 actuarial funding valuation.
9/Act 2017-5 amended the Retirement Code to add two hybrid Defined Benefits (DB)/Defined Contributions (DC) plans and a DC-only plan effective January 1, 2019.
10/Act 2017-5 amended the Retirement Code to change the funding method to Traditional Entry Age.
ACTUARIAL SECTIONHistory and Projection of Contribution Rates and Funded RatiosDecember 31, 2019 (unaudited)
SERS 2019 Comprehensive Annual Financial Report | 99
Summary of Plan ProvisionsDecember 31, 2019 (unaudited)
ACTUARIAL SECTION
Benefit and Contribution ProvisionsSERS makes provisions for retirement, disability, and death benefits for all state employees, except for those specifically excluded under section 5301 of the State Employees’ Retirement Code, and certain other eligible groups. The major provisions may be summarized as follows:
Eligible Employees
Class AAll regular state employees, employees of certain commissions and authorities, employees of state-owned educational institutions, and the Pennsylvania State University (unless such employees have joined the Public School Employees’ Retirement System (PSERS), TIAA, or Alternative Retirement Program (ARP)) hired before July 1, 2001, who did not elect into the class AA membership as of December 31, 2001. This excludes judges and Magisterial District Judges who have elected class E-1 or class E-2.
Class AA All regular state employees who are hired after June 30, 2001, and before January 1, 2011, and former class A state employees hired before July 1, 2001, who elected into class AA as of December 31, 2001. This includes employees of certain commissions and authorities, employees of state-owned educational institutions, and the Pennsylvania State University (unless such employees have joined PSERS, TIAA, or ARP), but excludes state police troopers, judges, Magisterial District Judges, and legislators with class D-4.
Class A-3 All regular state employees who enter SERS membership for the first time on or after January 1, 2011 and before December 31, 2019, and all legislators who became members on or after December 1, 2010; Capitol police and park rangers who became members after July 1, 2011; and state
police officers who became members after July 1, 2012, provided the member did not elect membership in the optional A-4 class within 45 days of becoming a member. After January 1, 2019, class A-3 is only offered to state employees in exempt positions. Exempt positions are as follows:
Class A-4All members who would be class A-3 but elected A-4 within 45 days of becoming a member.
Class A-5All regular state employees who enter SERS membership for the first time on or after January 1, 2019, and SERS members hired before January 1, 2019, who were given a one-time, irrevocable option to elect class A-5 as of April 1, 2019, starting July 1, 2019, while retaining prior class up to July 1, 2019, including members of the General Assembly, judges, and Magisterial District Judges.
Class A-6All members who would be class A-5 but elected A-6 within 45 days of becoming a member, and SERS members hired before January 1, 2019, who were given a one-time, irrevocable option to elect class A-6 as of April 1, 2019, starting July 1, 2019, while retaining prior class up to July 1, 2019.
Defined Contribution-Only PlanAll members who would be class A-5 but elected the defined contribution-only plan within 45 days of becoming a member, and SERS members hired before January 1, 2019, who were given a one-time, irrevocable option to elect defined contribution-only plan as of April 1, 2019, starting July 1, 2019, while retaining prior class up to July 1, 2019. Those members choosing the defined contribution-only plan are not eligible for a benefit from the Defined Benefit Plan; but retire with their contributions, employer contributions if vested with three eligibility points, and any investment earnings on those contributions
100 | SERS 2019 Comprehensive Annual Financial Report
Summary of Plan ProvisionsDecember 31, 2019 (unaudited)
ACTUARIAL SECTION
less investment expenses and fees, however SERS members hired before January 1, 2019, who elected defined contribution-only plan as of April 1, 2019, starting July 1, 2019, still retained their eligibility for a benefit from the Defined Benefit Plan for service up to July 1, 2019.
Class D-4Legislators coming into service after June 30, 2001, and before December 1, 2010, who elect to be SERS members and legislators who elected class D-4 before July 1, 2001.
Class E-1Judges who elect class E-1.
Class E-2Magisterial District Judges who elect class E-2.
Age and Service Requirements for Superannuation (Normal Retirement) in Defined Benefit Plan(Full Formula Benefit)
Class AA/AAge 60 with three years of service; except for members of the General Assembly, enforcementofficers, correction officers, psychiatric security aids, and officers of the Delaware River Port Authority for whom the requirement is age 50 with three years of service. Members of class AA/A with 35 years of credited service are entitled to full formula benefits regardless of age. State police officers can retire on full benefits after age 50 or with 20 years of service. Capitol police and park rangers can retire on full benefits at age 50 with 20 years of Capitol police or park ranger service.
Class A-3/A-4Age 65 for most members and age 55 for members of the General Assembly, enforcement officers,
correction officers, psychiatric security aides, Delaware River Port Authority police officers, officers of the Pennsylvania State Police, and for Capitol police officers and park rangers with 20 or more years of credited service in the classification. Members of class A-3/A-4 are eligible for full formula benefits with 35 years of credited service with a superannuation score of 92.
Class A-5/A-6Age 67, with three years of service; or eligible for full formula benefits with 35 years of credited service with a superannuation score of 97.
Class D-4Age 50, with three years of service.
Class E-1Age 60, with three years of service; or 35 or more years of credited service, regardless of age.
Class E-2Age 60, with three years of service; or 35 or more years of credited service, regardless of age.
Formula for Superannuation (Normal) Annuity in Defined Benefit PlanThe maximum single-life annuity for most members is 2% of the highest three-year average salary of the member multiplied by years and fractions of credited service multiplied by the multiplier of the class of membership. For A-5 and A-6 members the maximum single-life annuity is 2% of an average of the highest five calendar years of the member multiplied by years and fractions of credited service multiplied by the multiplier of the class of membership.
The annuity paid to a member shall not exceed the member’s highest salary during any period of 12 consecutive months of creditable service.
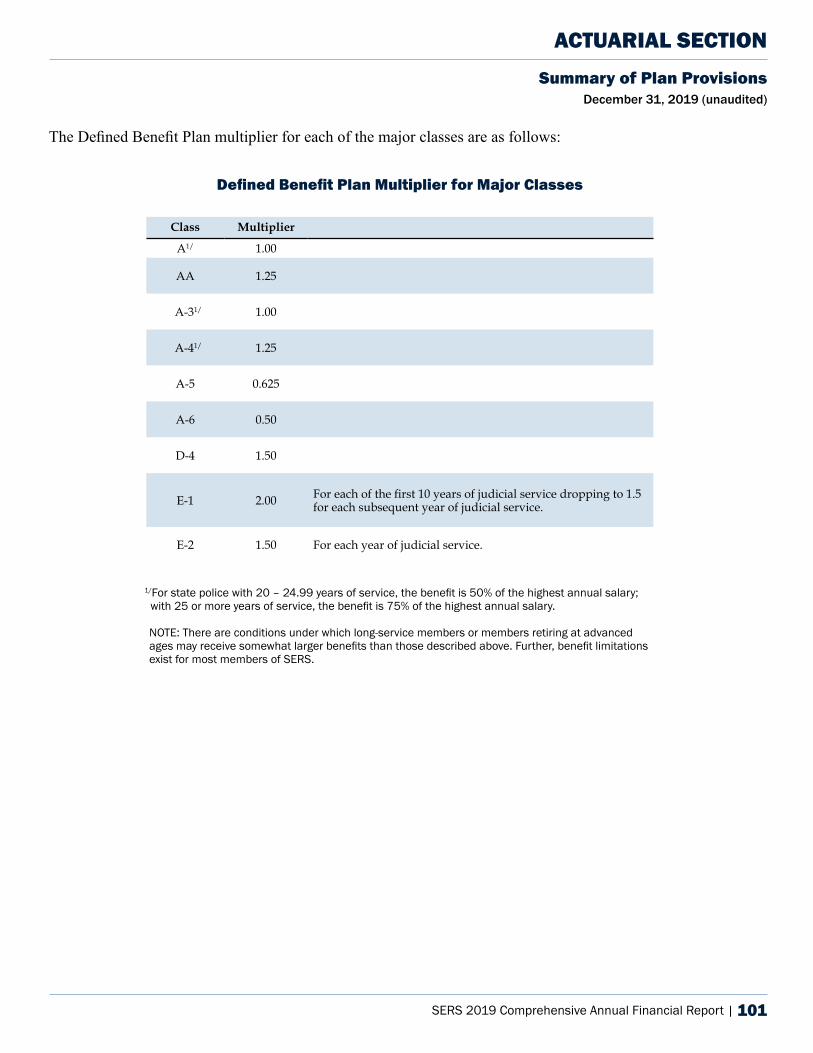
SERS 2019 Comprehensive Annual Financial Report | 101
Summary of Plan ProvisionsDecember 31, 2019 (unaudited)
ACTUARIAL SECTION
Defined Benefit Plan Multiplier for Major Classes
Class Multiplier
A1/ 1.00
AA 1.25
A-31/ 1.00
A-41/ 1.25
A-5 0.625
A-6 0.50
D-4 1.50
E-1 2.00 For each of the first 10 years of judicial service dropping to 1.5 for each subsequent year of judicial service.
E-2 1.50 For each year of judicial service.
1/For state police with 20 – 24.99 years of service, the benefit is 50% of the highest annual salary; with 25 or more years of service, the benefit is 75% of the highest annual salary.
NOTE: There are conditions under which long-service members or members retiring at advanced ages may receive somewhat larger benefits than those described above. Further, benefit limitations exist for most members of SERS.
The Defined Benefit Plan multiplier for each of the major classes are as follows:
Statistical Section
2019
SERS 2019 Comprehensive Annual Financial Report | 102
Statistical Section Narrative December 31, 2019 (unaudited)
STATISTICAL SECTION
The Statistical Section of SERS’ CAFR presents detailed information related to the financial statements, as well as highlights of actuarial valuations. The Statistical Section presents information on the Defined Benefit Plan only since there is limited information available for the recently launched Defined Contribution Plan. The schedules in this section are classified into the following four categories: financial trends, revenue capacity, demographic and economic information and operating information.
Financial TrendsThe Schedule of Trend Data provides key financial, actuarial, and demographic data for 10 years ended December 31, 2019. This data includes items such as employer and member contribution rates; contributions received and benefits paid by SERS; values of assets and liabilities; and the number of annuitants, beneficiaries, and active members.
The Schedule of Additions to Fiduciary Net Position presents the member and employer contributions, as well as the net investment income/loss for the 10 years ended December 31, 2019. SERS investment returns have the most significant impact on fiduciary net position.
The Schedule of Deductions from Fiduciary Net Position presents the benefits, refunds ofcontributions, and administrative expenses for the 10 years ended December 31, 2019. Of these three categories, SERS benefit payments have the most significant impact on the total deductions from fiduciary net position.
The Schedule of Benefit and Refund Deductions from Fiduciary Net Position by Type presents the amount of benefit payments and refunds by type for the 10 years ended December 31, 2019. Most benefit
types are either normal or early, which is determined by the number of years of service and/or age at retirement.
The Schedule of Total Changes in Fiduciary Net Position combines the additions to and deductions from fiduciary net position from the Schedule of Additions to Fiduciary Net Position and Schedule of Deductions from Fiduciary Net Position to arrive at net increase/decrease of changes in fiduciary net position for the 10 years ended December 31, 2019.
Revenue CapacityThe Schedule of Investment Income presents the details of the total net investment income/loss for the 10 years ended December 31, 2019. SERS has two external sources of revenue and one own-source (internal) of revenue. Employer contributions and member contributions, which information is provided for in the Schedule of Additions to Fiduciary Net Position, are the two external sources of revenue, and investment income is SERS’ own-source revenue. Since investment income/loss has the greatest impact to SERS, this schedule provides more detail on the major components of the investment income/loss, which is also disclosed in total on the Schedule of Additions to Fiduciary Net Position.
Demographic and Economic InformationThe Schedule of Active Member Statistics provides the total number of active members, as well as the average age, average service and average salary by gender for the 10 years ended December 31, 2019.
Operating InformationThe Schedule of Retired Members by Type of Benefit presents, for given benefit ranges, the total number of retirees, total monthly benefits, and total number of retirees by retirement type as of December 31, 2019.
103 | SERS 2019 Comprehensive Annual Financial Report
Statistical Section NarrativeDecember 31, 2019 (unaudited)
STATISTICAL SECTION
The Schedule of Retired Members by Option presents, for given benefit ranges, the total number of retirees, total monthly benefits and total number of retirees by retirement option as of December 31, 2019.
The Schedule of Average Monthly Benefit Payments presents, in five-year increments of credited service, the average monthly benefit, average final average salary and number of retired members for the 10 years ended December 31, 2019.
The Schedule of Average Annual Benefit Payments presents, in five-year age increments and by gender, the average annual benefit for each major retirement type as of December 31, 2019.
The Schedule of Employer/Agency Participation provides the number of covered members and the corresponding percentage of participation for the five largest employers/agencies for the 10 years ended December 31, 2019, as well as a listing of additional employers/agencies participating with SERS as of December 31, 2019.
Sources: Unless otherwise noted, the information for these schedules is derived from the Financial Section and ActuarialSection of the Comprehensive Annual Financial Report for the relevant year.
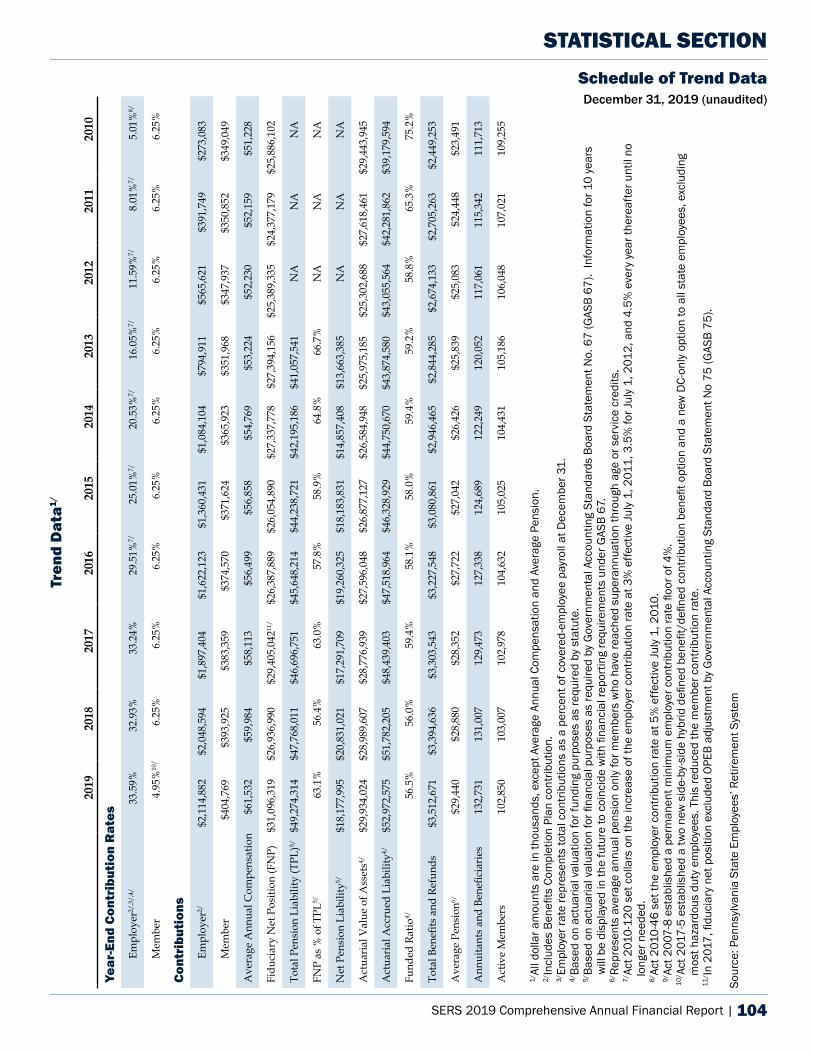
SERS 2019 Comprehensive Annual Financial Report | 104
Tren
d D
ata1/
2019
2018
2017
2016
2015
2014
2013
2012
2011
2010
Year
-End
Con
trib
utio
n R
ates
Empl
oyer
2/,3
/,4/
33.5
9%32
.93%
33.2
4%29
.51%
7/25
.01%
7/20
.53%
7/16
.05%
7/11
.59%
7/8.
01%
7/ 5
.01%
8/
Mem
ber
4.95
%10
/6.
25%
6.25
%6.
25%
6.25
%6.
25%
6.25
%6.
25%
6.25
%6.
25%
Cont
ribu
tion
s
Empl
oyer
2/$2
,114
,882
$2
,048
,594
$1
,897
,404
$1
,622
,123
$1
,360
,431
$1
,084
,104
$7
94,9
11
$565
,621
$3
91,7
49
$273
,083
Mem
ber
$404
,769
$3
93,9
25
$383
,359
$3
74,5
70
$371
,624
$3
65,9
23
$351
,968
$3
47,9
37
$350
,852
$3
49,0
49
Ave
rage
Ann
ual C
ompe
nsat
ion
$61,
532
$59,
984
$58,
113
$56,
499
$56,
858
$54,
769
$53,
224
$52,
230
$52,
159
$51,
228
Fidu
ciar
y N
et P
ositi
on (F
NP)
$31,
096,
319
$26,
936,
990
$29,
405,
04211
/$2
6,38
7,88
9 $2
6,05
4,89
0 $2
7,33
7,77
8 $2
7,39
4,15
6 $2
5,38
9,33
5 $2
4,37
7,17
9 $2
5,88
6,10
2
Tota
l Pen
sion
Lia
bilit
y (T
PL)5/
$49,
274,
314
$47,
768,
011
$46,
696,
751
$45,
648,
214
$44,
238,
721
$42,
195,
186
$41,
057,
541
NA
NA
NA
FNP
as %
of T
PL5/
63.1
%56
.4%
63.0
%57
.8%
58.9
%64
.8%
66.7
%N
AN
AN
A
Net
Pen
sion
Lia
bilit
y5/$1
8,17
7,99
5 $2
0,83
1,02
1 $1
7,29
1,70
9 $1
9,26
0,32
5 $1
8,18
3,83
1 $1
4,85
7,40
8 $1
3,66
3,38
5 N
AN
AN
A
Act
uari
al V
alue
of A
sset
s4/$2
9,93
4,02
4 $2
8,98
9,60
7 $2
8,77
6,93
9 $2
7,59
6,04
8 $2
6,87
7,12
7 $2
6,58
4,94
8 $2
5,97
5,18
5 $2
5,30
2,68
8 $2
7,61
8,46
1 $2
9,44
3,94
5
Act
uari
al A
ccru
ed L
iabi
lity4/
$52,
972,
575
$51,
782,
205
$48,
439,
403
$47,
518,
964
$46,
328,
929
$44,
750,
670
$43,
874,
580
$43,
055,
564
$42,
281,
862
$39,
179,
594
Fund
ed R
atio
4/56
.5%
56.0
%59
.4%
58.1
%58
.0%
59.4
%59
.2%
58.8
%65
.3%
75.2
%
Tota
l Ben
efits
and
Ref
unds
$3,5
12,6
71
$3,3
94,6
36
$3,3
03,5
43
$3,2
27,5
48
$3,0
80,8
61
$2,9
46,4
65
$2,8
44,2
85
$2,6
74,1
33
$2,7
05,2
63
$2,4
49,2
53
Ave
rage
Pen
sion
6/$2
9,44
0 $2
8,88
0 $2
8,35
2 $2
7,72
2 $2
7,04
2 $2
6,42
6 $2
5,83
9 $2
5,08
3 $2
4,44
8 $2
3,49
1
Ann
uita
nts
and
Bene
ficia
ries
132,
731
131,
007
129,
473
127,
338
124,
689
122,
249
120,
052
117,
061
115,
342
111,
713
Act
ive
Mem
bers
102,
850
103,
007
102,
978
104,
632
105,
025
104,
431
105,
186
106,
048
107,
021
109,
255
STATISTICAL SECTIONSchedule of Trend Data December 31, 2019 (unaudited)
1/Al
l dol
lar a
mou
nts
are
in th
ousa
nds,
exc
ept A
vera
ge A
nnua
l Com
pens
atio
n an
d Av
erag
e Pe
nsio
n.2/
Incl
udes
Ben
efits
Com
plet
ion
Plan
con
tribu
tion.
3/Em
ploy
er ra
te re
pres
ents
tota
l con
tribu
tions
as
a pe
rcen
t of c
over
ed-e
mpl
oyee
pay
roll
at D
ecem
ber 3
1.4/
Base
d on
act
uaria
l val
uatio
n fo
r fun
ding
pur
pose
s as
requ
ired
by s
tatu
te.
5/Ba
sed
on a
ctua
rial v
alua
tion
for fi
nanc
ial p
urpo
ses
as re
quire
d by
Gov
ernm
enta
l Acc
ount
ing
Stan
dard
s Bo
ard
Stat
emen
t No.
67
(GAS
B 67
). In
form
atio
n fo
r 10
year
s w
ill b
e di
spla
yed
in th
e fu
ture
to c
oinc
ide
with
fina
ncia
l rep
ortin
g re
quire
men
ts u
nder
GAS
B 67
.6/
Repr
esen
ts a
vera
ge a
nnua
l pen
sion
onl
y fo
r mem
bers
who
hav
e re
ache
d su
pera
nnua
tion
thro
ugh
age
or s
ervi
ce c
redi
ts.
7/Ac
t 201
0-12
0 se
t col
lars
on
the
incr
ease
of t
he e
mpl
oyer
con
tribu
tion
rate
at 3
% e
ffect
ive
July
1, 2
011,
3.5
% fo
r Jul
y 1,
201
2, a
nd 4
.5%
eve
ry y
ear t
here
afte
r unt
il no
lo
nger
nee
ded.
8/Ac
t 201
0-46
set
the
empl
oyer
con
tribu
tion
rate
at 5
% e
ffect
ive
July
1, 2
010.
9/Ac
t 200
7-8
esta
blis
hed
a pe
rman
ent m
inim
um e
mpl
oyer
con
tribu
tion
rate
floo
r of 4
%.
10/ A
ct 2
017-
5 es
tabl
ishe
d a
two
new
sid
e-by
-sid
e hy
brid
defi
ned
bene
fit/d
efine
d co
ntrib
utio
n be
nefit
opt
ion
and
a ne
w D
C-on
ly o
ptio
n to
all
stat
e em
ploy
ees,
exc
ludi
ng
mos
t haz
ardo
us d
uty
empl
oyee
s. T
his
redu
ced
the
mem
ber c
ontri
butio
n ra
te.
11/ In
201
7, fi
duci
ary
net p
ositi
on e
xclu
ded
OPEB
adj
ustm
ent b
y G
over
nmen
tal A
ccou
ntin
g St
anda
rd B
oard
Sta
tem
ent N
o 75
(GAS
B 75
).
Sour
ce: P
enns
ylva
nia
Stat
e Em
ploy
ees’
Ret
irem
ent S
yste
m
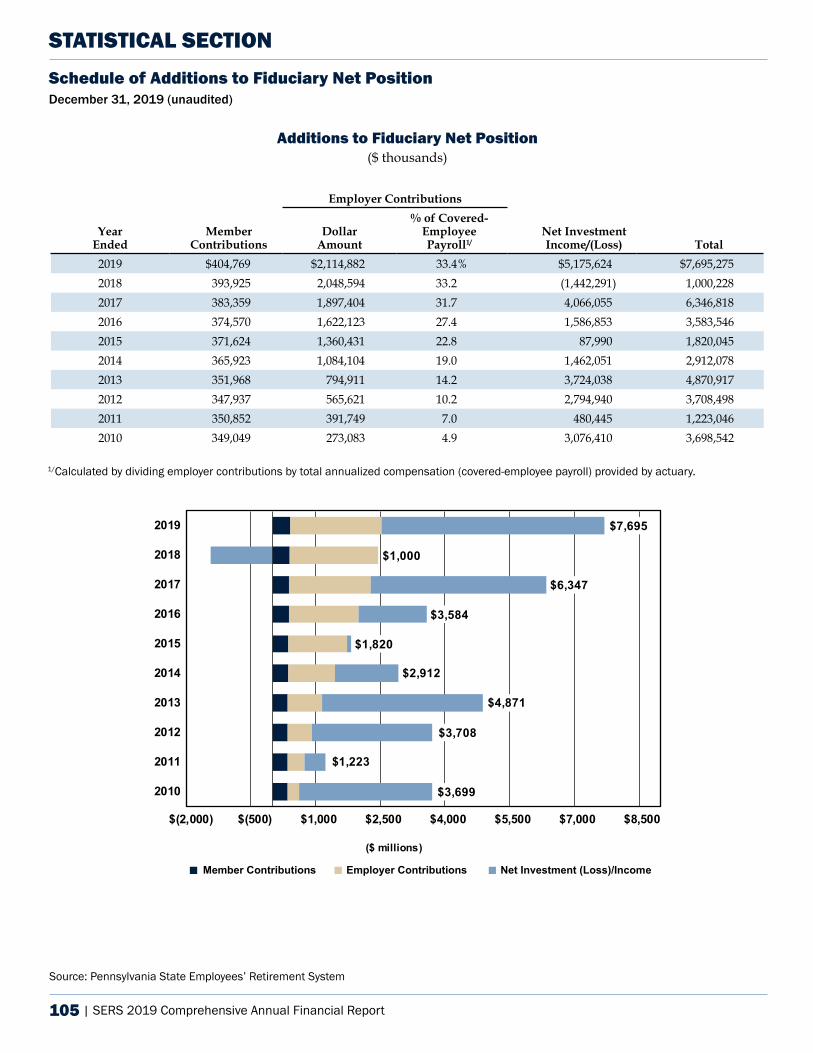
105 | SERS 2019 Comprehensive Annual Financial Report
Additions to Fiduciary Net Position($ thousands)
Employer Contributions
Year Ended
Member Contributions
Dollar Amount
% of Covered-Employee Payroll1/
Net Investment Income/(Loss) Total
2019 $404,769 $2,114,882 33.4% $5,175,624 $7,695,275 2018 393,925 2,048,594 33.2 (1,442,291) 1,000,228 2017 383,359 1,897,404 31.7 4,066,055 6,346,818 2016 374,570 1,622,123 27.4 1,586,853 3,583,546 2015 371,624 1,360,431 22.8 87,990 1,820,045 2014 365,923 1,084,104 19.0 1,462,051 2,912,078 2013 351,968 794,911 14.2 3,724,038 4,870,917 2012 347,937 565,621 10.2 2,794,940 3,708,498 2011 350,852 391,749 7.0 480,445 1,223,046 2010 349,049 273,083 4.9 3,076,410 3,698,542
1/Calculated by dividing employer contributions by total annualized compensation (covered-employee payroll) provided by actuary.
STATISTICAL SECTIONSchedule of Additions to Fiduciary Net PositionDecember 31, 2019 (unaudited)
Source: Pennsylvania State Employees’ Retirement System
$(2,000) $(500) $1,000 $2,500 $4,000 $5,500 $7,000 $8,500
2010
2011
2012
2013
2014
2015
2016
2017
2018
2019
Member Contributions Employer Contributions Net Investment (Loss)/Income
($ millions)
$1,000
$6,347
$3,584
$4,871
$2,912
$3,708
$3,699
$7,695
$1,820
$1,223
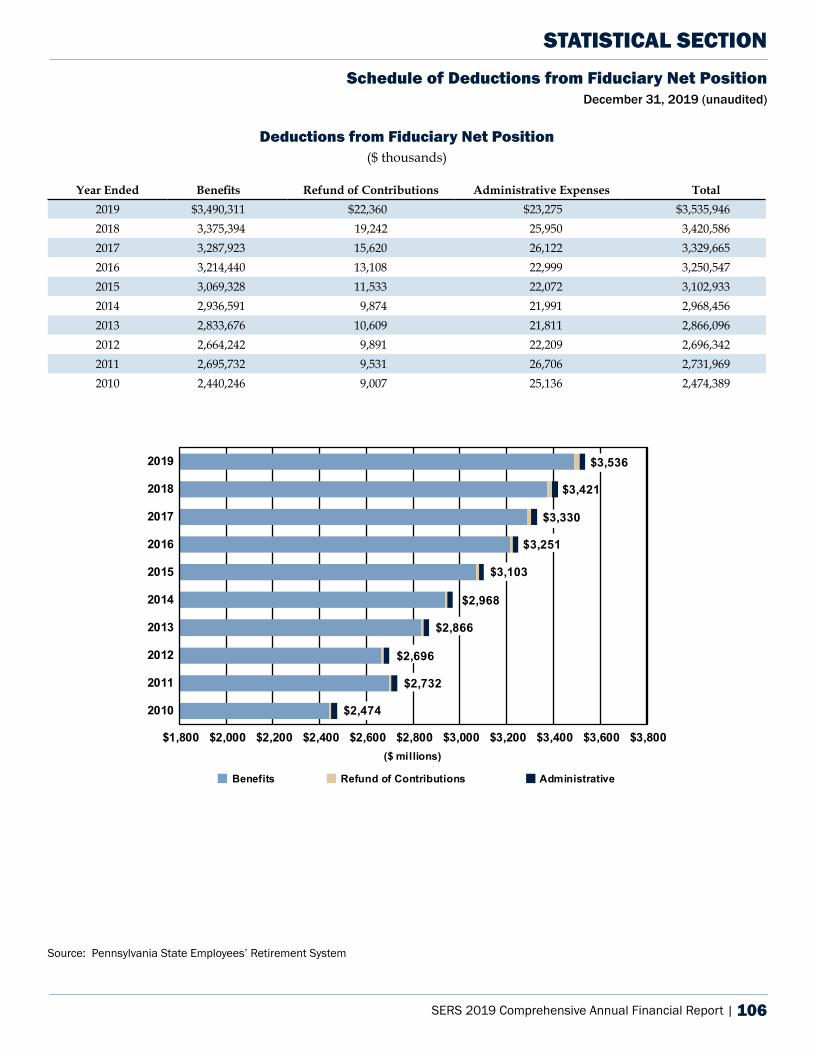
SERS 2019 Comprehensive Annual Financial Report | 106
Deductions from Fiduciary Net Position($ thousands)
Year Ended Benefits Refund of Contributions Administrative Expenses Total2019 $3,490,311 $22,360 $23,275 $3,535,946 2018 3,375,394 19,242 25,950 3,420,586 2017 3,287,923 15,620 26,122 3,329,665 2016 3,214,440 13,108 22,999 3,250,547 2015 3,069,328 11,533 22,072 3,102,933 2014 2,936,591 9,874 21,991 2,968,456 2013 2,833,676 10,609 21,811 2,866,096 2012 2,664,242 9,891 22,209 2,696,342 2011 2,695,732 9,531 26,706 2,731,969 2010 2,440,246 9,007 25,136 2,474,389
Source: Pennsylvania State Employees’ Retirement System
STATISTICAL SECTIONSchedule of Deductions from Fiduciary Net Position
December 31, 2019 (unaudited)
$1,800 $2,000 $2,200 $2,400 $2,600 $2,800 $3,000 $3,200 $3,400 $3,600 $3,800
2010
2011
2012
2013
2014
2015
2016
2017
2018
2019
$2,696
$2,866
$2,968
$3,103
$3,251
$3,330
$3,421
$2,474
$2,732
$3,536
($ millions)
Benefits Refund of Contributions Administrative
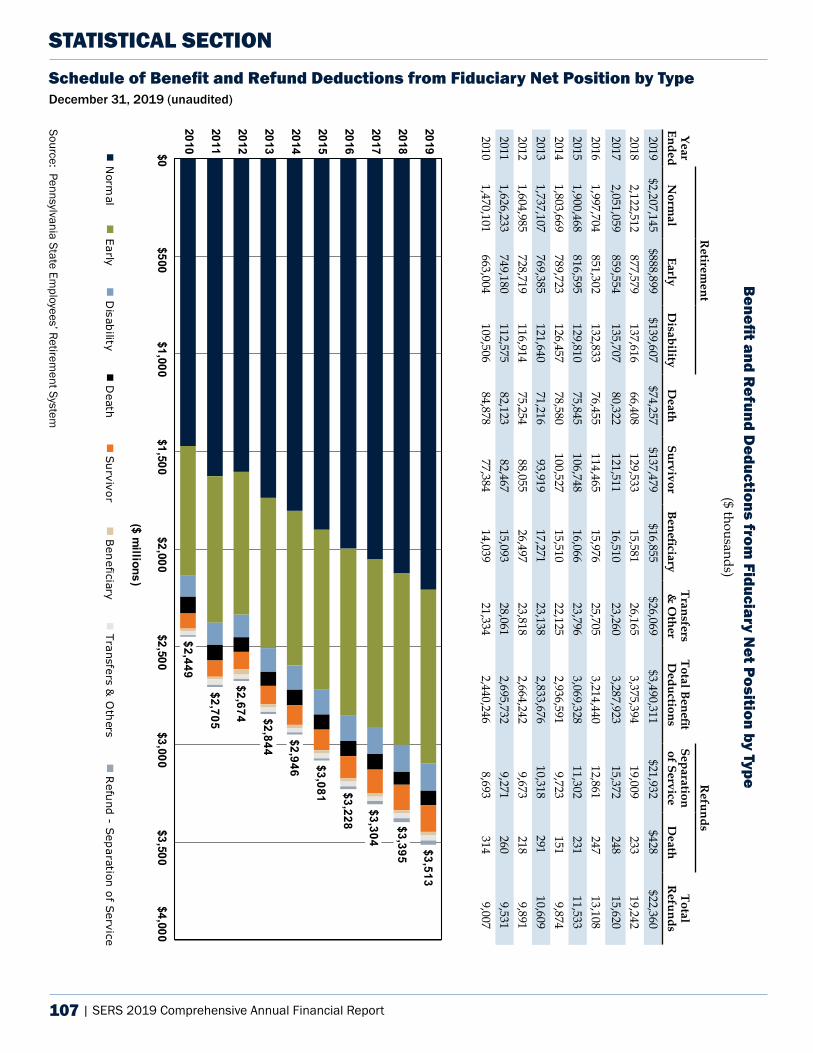
107 | SERS 2019 Comprehensive Annual Financial Report
Benefit and Refund D
eductions from Fiduciary N
et Position by Type ($ thousands)
Retirem
entR
efundsYear
EndedN
ormal
EarlyD
isabilityD
eathSurvivor
BeneficiaryTransfers &
Other
Total Benefit D
eductionsSeparation of Service
Death
Total R
efunds2019
$2,207,145 $888,899
$139,607 $74,257
$137,479 $16,855
$26,069 $3,490,311
$21,932 $428
$22,360 2018
2,122,512 877,579
137,616 66,408
129,533 15,581
26,165 3,375,394
19,009 233
19,242 2017
2,051,059 859,554
135,707 80,322
121,511 16,510
23,260 3,287,923
15,372 248
15,620
20161,997,704
851,302 132,833
76,455 114,465
15,976 25,705
3,214,440 12,861
247 13,108
20151,900,468
816,595 129,810
75,845 106,748
16,066 23,796
3,069,328 11,302
231 11,533
20141,803,669
789,723 126,457
78,580 100,527
15,510 22,125
2,936,591 9,723
151 9,874
20131,737,107
769,385 121,640
71,216 93,919
17,271 23,138
2,833,676 10,318
291 10,609
20121,604,985
728,719 116,914
75,254 88,055
26,497 23,818
2,664,242 9,673
218 9,891
20111,626,233
749,180 112,575
82,123 82,467
15,093 28,061
2,695,732 9,271
260 9,531
20101,470,101
663,004 109,506
84,878 77,384
14,039 21,334
2,440,246 8,693
314 9,007
STATISTICAL SECTIONSchedule of Benefit and Refund Deductions from Fiduciary Net Position by Type December 31, 2019 (unaudited)
Source: Pennsylvania State Employees’ Retirem
ent System
$0$500
$1,000$1,500
$2,000$2,500
$3,000$3,500
$4,000
2010
2011
2012
2013
2014
2015
2016
2017
2018
2019
$2,844
$2,674
$3,081 $3,228
$3,304
$3,395 $3,513
$2,449
$2,705
$2,946
($ millions)
Norm
alEarly
Disab
ilityD
eathSu
rvivor B
eneficiary
Transfers & O
thers
Refu
nd - Sep
aration of Service
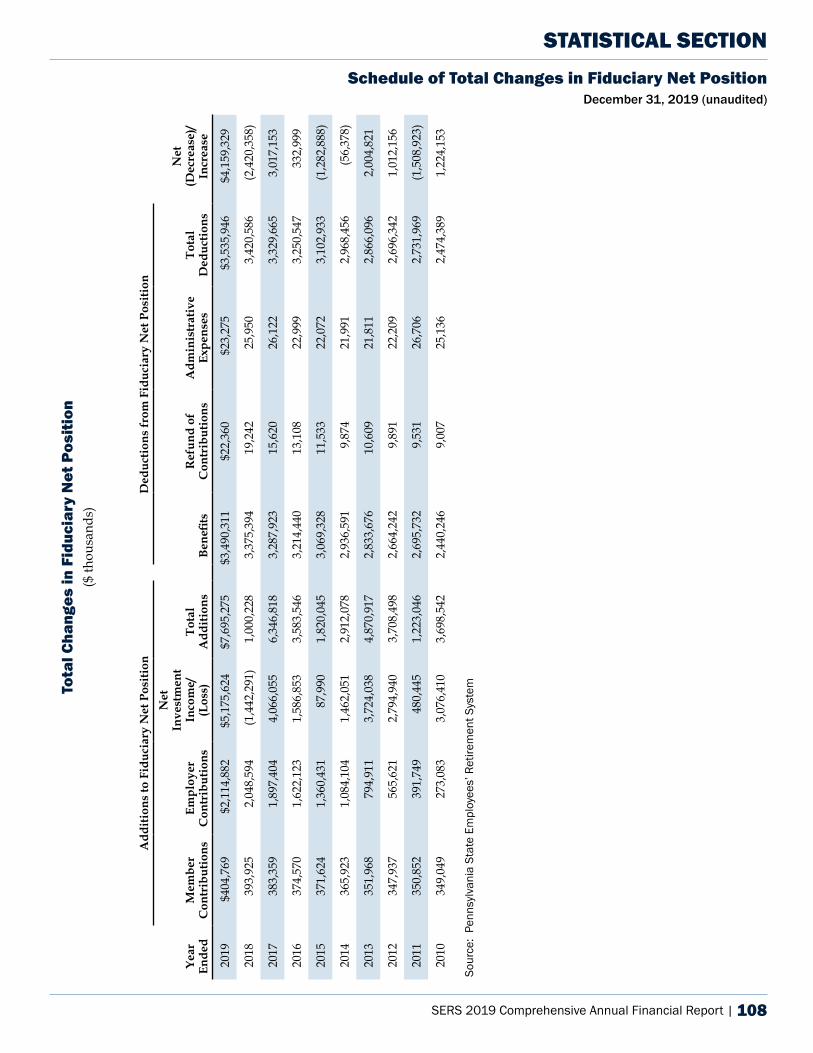
SERS 2019 Comprehensive Annual Financial Report | 108
Tota
l Cha
nges
in F
iduc
iary
Net
Pos
itio
n($
thou
sand
s)
Add
ition
s to
Fid
ucia
ry N
et P
ositi
onD
educ
tions
from
Fid
ucia
ry N
et P
ositi
on
Year
En
ded
Mem
ber
Con
trib
utio
nsEm
ploy
er
Con
trib
utio
ns
Net
Inve
stm
ent
Inco
me/
(Los
s)To
tal
Add
ition
sBe
nefit
sR
efun
d of
C
ontr
ibut
ions
Adm
inis
trat
ive
Expe
nses
Tota
l D
educ
tions
Net
(D
ecre
ase)
/ In
crea
se
2019
$404
,769
$2
,114
,882
$5
,175
,624
$7
,695
,275
$3
,490
,311
$2
2,36
0 $2
3,27
5 $3
,535
,946
$4
,159
,329
2018
393,
925
2,04
8,59
4 (1
,442
,291
)1,
000,
228
3,37
5,39
4 19
,242
25
,950
3,42
0,58
6 (2
,420
,358
)
2017
383,
359
1,89
7,40
4 4,
066,
055
6,34
6,81
8 3,
287,
923
15,6
20
26,1
22
3,32
9,66
5 3,
017,
153
2016
374,
570
1,62
2,12
3 1,
586,
853
3,58
3,54
6 3,
214,
440
13,1
08
22,9
99
3,25
0,54
7 33
2,99
9
2015
371,
624
1,36
0,43
1 87
,990
1,
820,
045
3,06
9,32
8 11
,533
22
,072
3,
102,
933
(1,2
82,8
88)
2014
365,
923
1,08
4,10
4 1,
462,
051
2,91
2,07
8 2,
936,
591
9,87
4 21
,991
2,
968,
456
(56,
378)
2013
351,
968
794,
911
3,72
4,03
8 4,
870,
917
2,83
3,67
6 10
,609
21
,811
2,
866,
096
2,00
4,82
1
2012
347,
937
565,
621
2,79
4,94
0 3,
708,
498
2,66
4,24
2 9,
891
22,2
09
2,69
6,34
2 1,
012,
156
2011
350,
852
391,
749
480,
445
1,22
3,04
6 2,
695,
732
9,53
1 26
,706
2,
731,
969
(1,5
08,9
23)
2010
349,
049
273,
083
3,07
6,41
0 3,
698,
542
2,44
0,24
6 9,
007
25,1
36
2,47
4,38
9 1,
224,
153
STATISTICAL SECTION
Sour
ce:
Penn
sylv
ania
Sta
te E
mpl
oyee
s’ R
etire
men
t Sys
tem
Schedule of Total Changes in Fiduciary Net Position December 31, 2019 (unaudited)
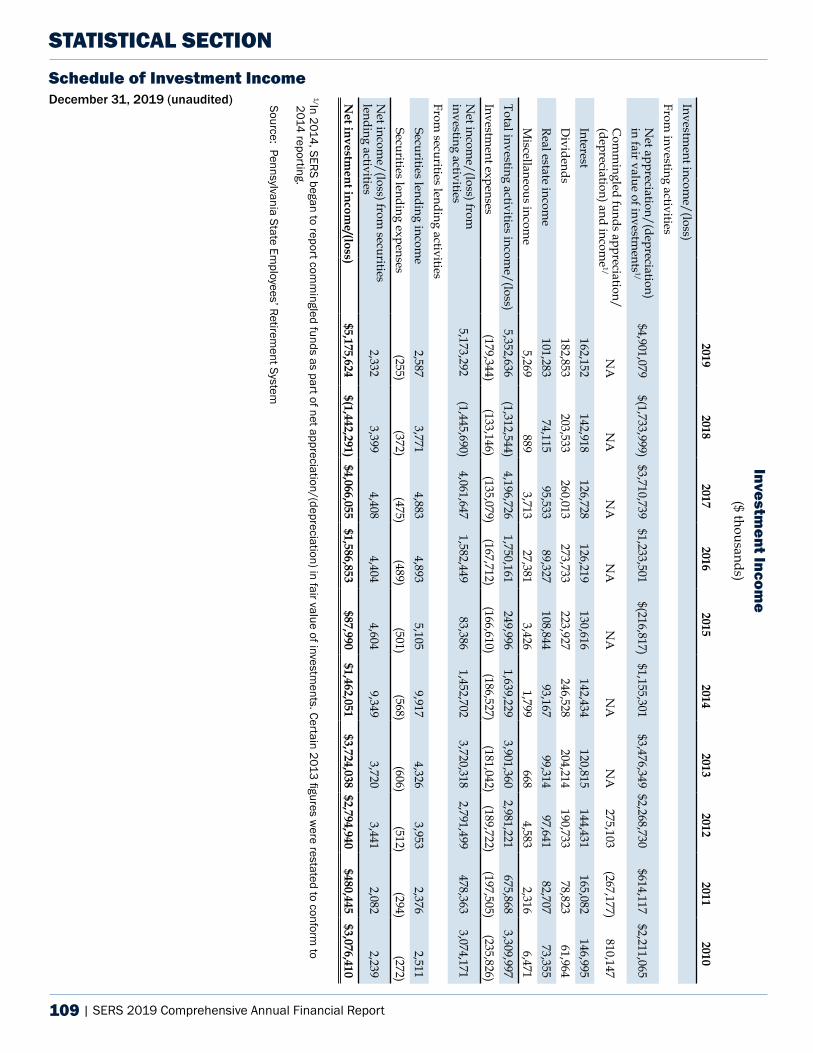
109 | SERS 2019 Comprehensive Annual Financial Report
Investment Incom
e($ thousands)
20192018
20172016
20152014
20132012
20112010
Investment incom
e/(loss)From
investing activitiesN
et appreciation/(depreciation) in fair value of investm
ents1/
$4,901,079 $(1,733,999)
$3,710,739 $1,233,501 $(216,817)
$1,155,301 $3,476,349 $2,268,730
$614,117 $2,211,065
Com
mingled funds appreciation/
(depreciation) and income
1/ N
A
NA
N
A
NA
N
A
NA
N
A
275,103 (267,177)
810,147
Interest 162,152
142,918 126,728
126,219 130,616
142,434 120,815
144,431 165,082
146,995 D
ividends 182,853
203,533 260,013
273,733 223,927
246,528 204,214
190,733 78,823
61,964 Real estate incom
e 101,283
74,115 95,533
89,327 108,844
93,167 99,314
97,641 82,707
73,355 M
iscellaneous income
5,269 889
3,713 27,381
3,426 1,799
668 4,583
2,316 6,471
Total investing activities income/(loss)
5,352,636 (1,312,544)
4,196,726 1,750,161
249,996 1,639,229
3,901,360 2,981,221
675,868 3,309,997
Investment expenses
(179,344) (133,146)
(135,079) (167,712)
(166,610) (186,527)
(181,042) (189,722)
(197,505) (235,826)
Net incom
e/(loss) from
investing activities 5,173,292
(1,445,690) 4,061,647
1,582,449 83,386
1,452,702 3,720,318
2,791,499 478,363
3,074,171
From securities lending activities
Securities lending income
2,587 3,771
4,883 4,893
5,105 9,917
4,326 3,953
2,376 2,511
Securities lending expenses (255)
(372) (475)
(489) (501)
(568) (606)
(512) (294)
(272)N
et income/(loss) from
securities lending activities
2,332 3,399
4,408 4,404
4,604 9,349
3,720 3,441
2,082 2,239
Net investm
ent income/(loss)
$5,175,624 $(1,442,291)
$4,066,055 $1,586,853
$87,990 $1,462,051
$3,724,038 $2,794,940 $480,445 $3,076,410
1/In 2014, SERS began to report comm
ingled funds as part of net appreciation/(depreciation) in fair value of investments. Certain 2013 figures w
ere restated to conform to
2014 reporting.
Source: Pennsylvania State Employees’ Retirem
ent System
STATISTICAL SECTIONSchedule of Investment Income December 31, 2019 (unaudited)
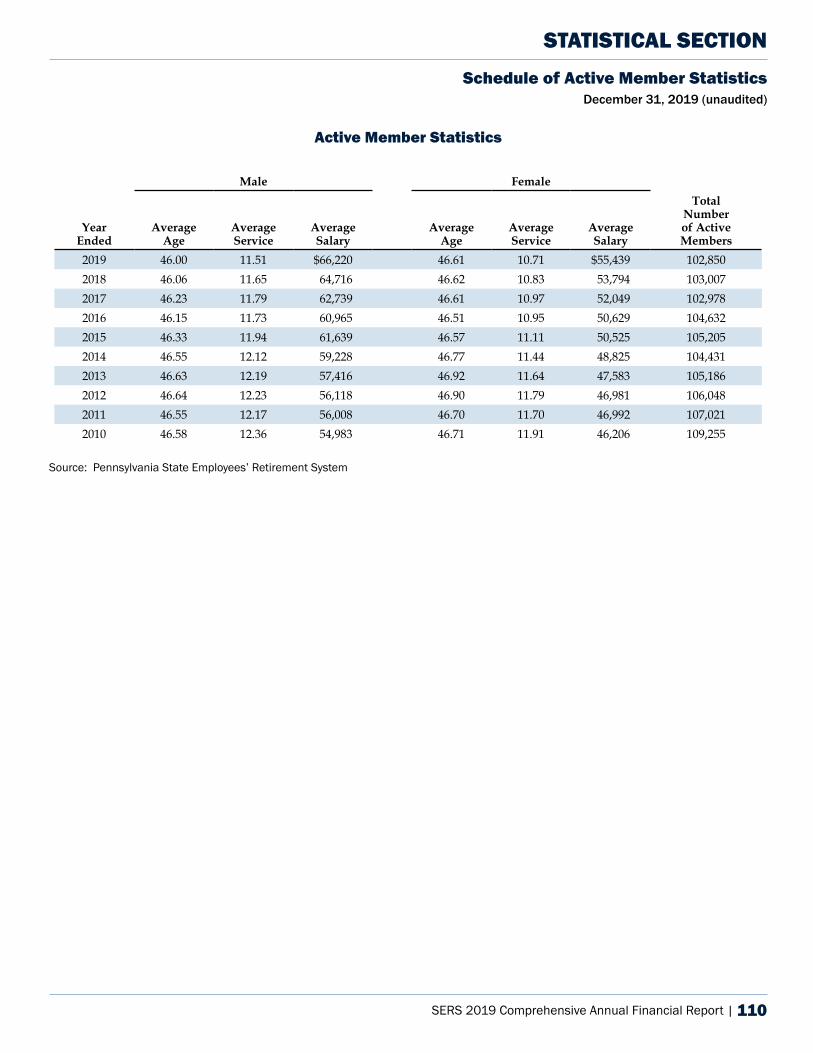
SERS 2019 Comprehensive Annual Financial Report | 110
STATISTICAL SECTIONSchedule of Active Member Statistics
December 31, 2019 (unaudited)
Active Member Statistics
Male Female
Year Ended
Average Age
Average Service
Average Salary
Average Age
Average Service
Average Salary
Total Number of Active Members
2019 46.00 11.51 $66,220 46.61 10.71 $55,439 102,850 2018 46.06 11.65 64,716 46.62 10.83 53,794 103,007 2017 46.23 11.79 62,739 46.61 10.97 52,049 102,978 2016 46.15 11.73 60,965 46.51 10.95 50,629 104,632 2015 46.33 11.94 61,639 46.57 11.11 50,525 105,205 2014 46.55 12.12 59,228 46.77 11.44 48,825 104,431 2013 46.63 12.19 57,416 46.92 11.64 47,583 105,186 2012 46.64 12.23 56,118 46.90 11.79 46,981 106,048 2011 46.55 12.17 56,008 46.70 11.70 46,992 107,021 2010 46.58 12.36 54,983 46.71 11.91 46,206 109,255
Source: Pennsylvania State Employees’ Retirement System
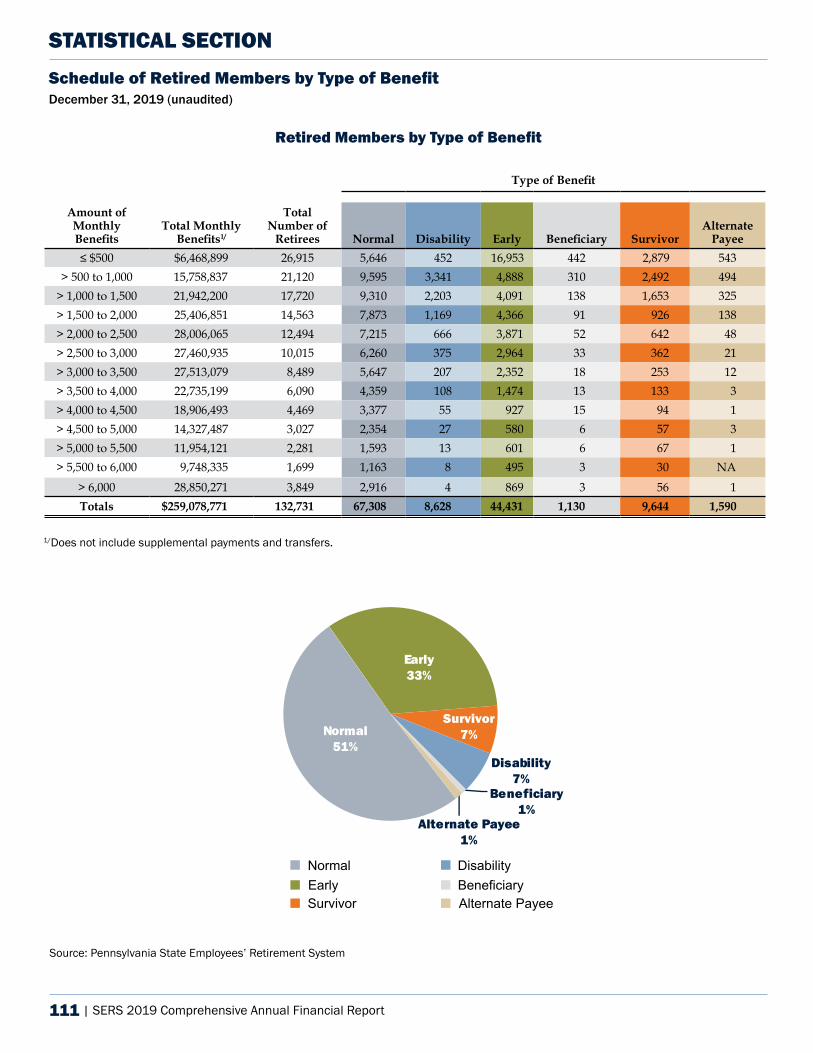
111 | SERS 2019 Comprehensive Annual Financial Report
STATISTICAL SECTION
Source: Pennsylvania State Employees’ Retirement SystemOpt. 1
Retired Members by Type of Benefit
Schedule of Retired Members by Type of Benefit December 31, 2019 (unaudited)
Type of Benefit
Amount of Monthly Benefits
Total Monthly Benefits1/
Total Number of
Retirees Normal Disability Early Beneficiary SurvivorAlternate
Payee≤ $500 $6,468,899 26,915 5,646 452 16,953 442 2,879 543
> 500 to 1,000 15,758,837 21,120 9,595 3,341 4,888 310 2,492 494 > 1,000 to 1,500 21,942,200 17,720 9,310 2,203 4,091 138 1,653 325 > 1,500 to 2,000 25,406,851 14,563 7,873 1,169 4,366 91 926 138 > 2,000 to 2,500 28,006,065 12,494 7,215 666 3,871 52 642 48 > 2,500 to 3,000 27,460,935 10,015 6,260 375 2,964 33 362 21 > 3,000 to 3,500 27,513,079 8,489 5,647 207 2,352 18 253 12 > 3,500 to 4,000 22,735,199 6,090 4,359 108 1,474 13 133 3 > 4,000 to 4,500 18,906,493 4,469 3,377 55 927 15 94 1> 4,500 to 5,000 14,327,487 3,027 2,354 27 580 6 57 3 > 5,000 to 5,500 11,954,121 2,281 1,593 13 601 6 67 1 > 5,500 to 6,000 9,748,335 1,699 1,163 8 495 3 30 NA
> 6,000 28,850,271 3,849 2,916 4 869 3 56 1 Totals $259,078,771 132,731 67,308 8,628 44,431 1,130 9,644 1,590
1/Does not include supplemental payments and transfers.
Early33%
Survivor7%
Disability7%
Beneficiary1%
Alternate Payee1%
Normal51%
Alternate PayeeBeneficiaryDisability
SurvivorEarlyNormal
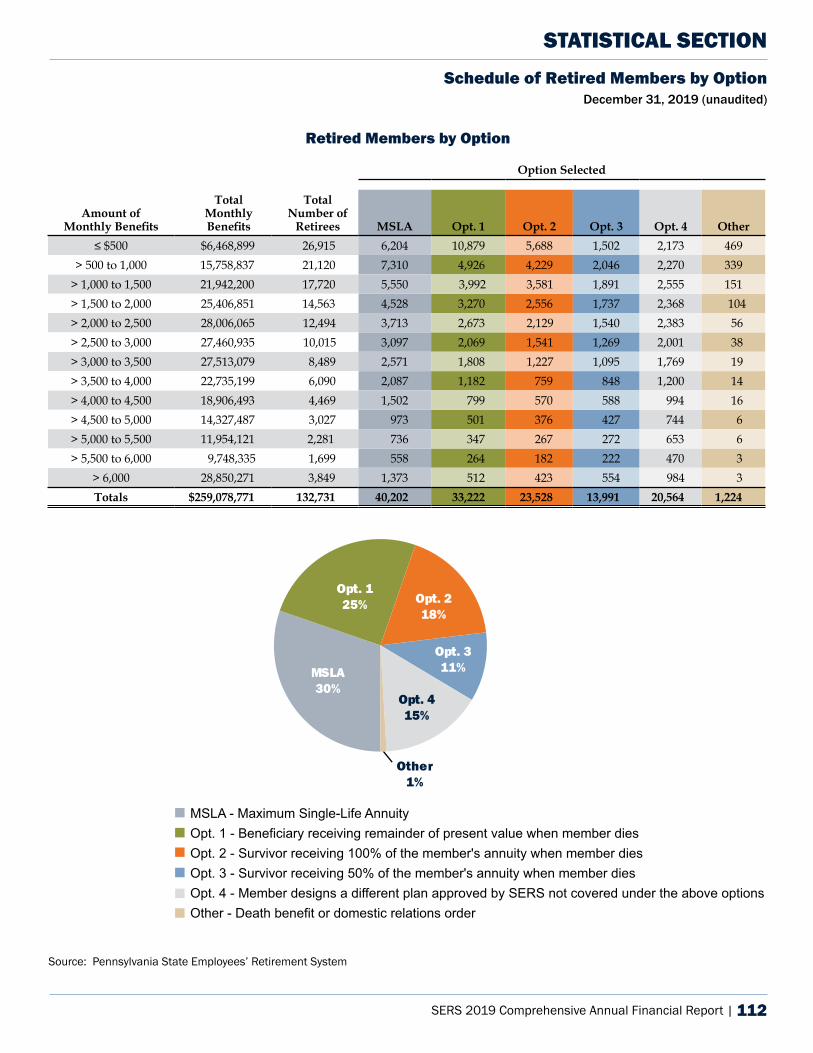
SERS 2019 Comprehensive Annual Financial Report | 112
STATISTICAL SECTION
Source: Pennsylvania State Employees’ Retirement System
Retired Members by Option
Schedule of Retired Members by Option December 31, 2019 (unaudited)
Option Selected
Amount of Monthly Benefits
Total Monthly Benefits
Total Number of
Retirees MSLA Opt. 1 Opt. 2 Opt. 3 Opt. 4 Other≤ $500 $6,468,899 26,915 6,204 10,879 5,688 1,502 2,173 469
> 500 to 1,000 15,758,837 21,120 7,310 4,926 4,229 2,046 2,270 339 > 1,000 to 1,500 21,942,200 17,720 5,550 3,992 3,581 1,891 2,555 151 > 1,500 to 2,000 25,406,851 14,563 4,528 3,270 2,556 1,737 2,368 104 > 2,000 to 2,500 28,006,065 12,494 3,713 2,673 2,129 1,540 2,383 56 > 2,500 to 3,000 27,460,935 10,015 3,097 2,069 1,541 1,269 2,001 38 > 3,000 to 3,500 27,513,079 8,489 2,571 1,808 1,227 1,095 1,769 19 > 3,500 to 4,000 22,735,199 6,090 2,087 1,182 759 848 1,200 14 > 4,000 to 4,500 18,906,493 4,469 1,502 799 570 588 994 16 > 4,500 to 5,000 14,327,487 3,027 973 501 376 427 744 6 > 5,000 to 5,500 11,954,121 2,281 736 347 267 272 653 6 > 5,500 to 6,000 9,748,335 1,699 558 264 182 222 470 3
> 6,000 28,850,271 3,849 1,373 512 423 554 984 3 Totals $259,078,771 132,731 40,202 33,222 23,528 13,991 20,564 1,224
MSLA30%
Opt. 125% Opt. 2
18%
Opt. 311%
Opt. 415%
Other1%
MSLA - Maximum Single-Life AnnuityOpt. 1 - Beneficiary receiving remainder of present value when member diesOpt. 2 - Survivor receiving 100% of the member's annuity when member diesOpt. 3 - Survivor receiving 50% of the member's annuity when member diesOpt. 4 - Member designs a different plan approved by SERS not covered under the above optionsOther - Death benefit or domestic relations order
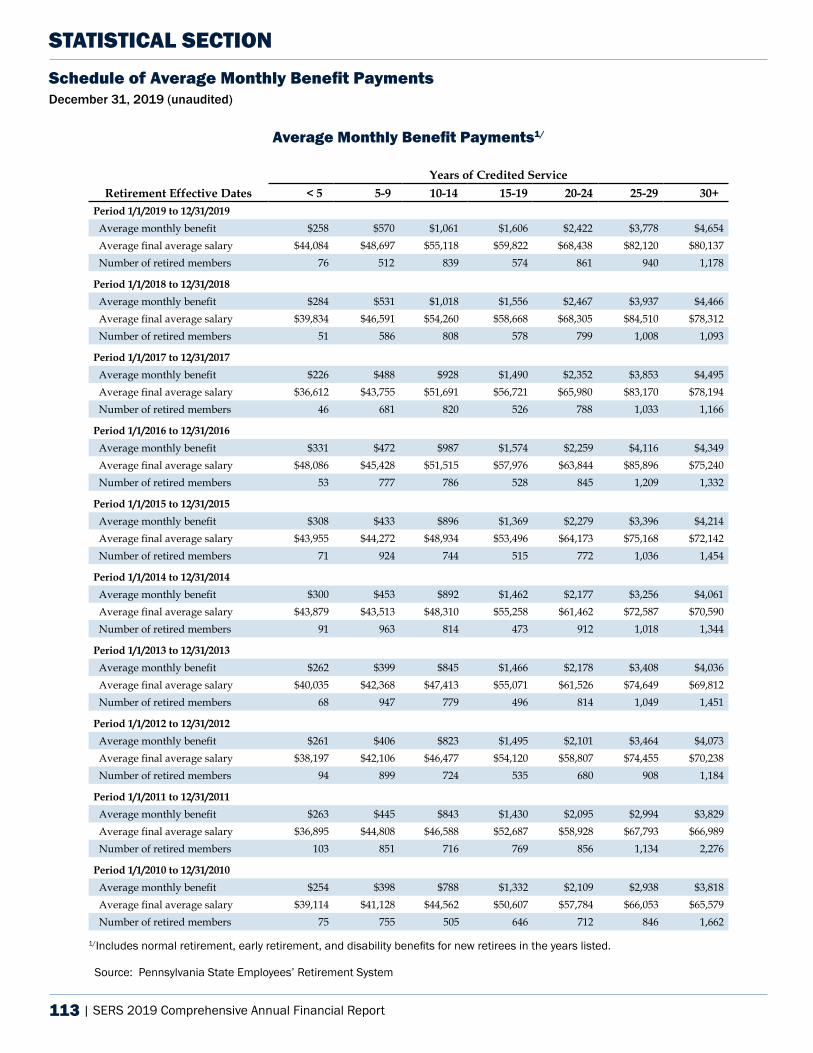
113 | SERS 2019 Comprehensive Annual Financial Report
Average Monthly Benefit Payments1/
Years of Credited ServiceRetirement Effective Dates < 5 5-9 10-14 15-19 20-24 25-29 30+
Period 1/1/2019 to 12/31/2019Average monthly benefit $258 $570 $1,061 $1,606 $2,422 $3,778 $4,654Average final average salary $44,084 $48,697 $55,118 $59,822 $68,438 $82,120 $80,137Number of retired members 76 512 839 574 861 940 1,178
Period 1/1/2018 to 12/31/2018Average monthly benefit $284 $531 $1,018 $1,556 $2,467 $3,937 $4,466Average final average salary $39,834 $46,591 $54,260 $58,668 $68,305 $84,510 $78,312Number of retired members 51 586 808 578 799 1,008 1,093
Period 1/1/2017 to 12/31/2017Average monthly benefit $226 $488 $928 $1,490 $2,352 $3,853 $4,495Average final average salary $36,612 $43,755 $51,691 $56,721 $65,980 $83,170 $78,194Number of retired members 46 681 820 526 788 1,033 1,166
Period 1/1/2016 to 12/31/2016Average monthly benefit $331 $472 $987 $1,574 $2,259 $4,116 $4,349Average final average salary $48,086 $45,428 $51,515 $57,976 $63,844 $85,896 $75,240Number of retired members 53 777 786 528 845 1,209 1,332
Period 1/1/2015 to 12/31/2015Average monthly benefit $308 $433 $896 $1,369 $2,279 $3,396 $4,214Average final average salary $43,955 $44,272 $48,934 $53,496 $64,173 $75,168 $72,142Number of retired members 71 924 744 515 772 1,036 1,454
Period 1/1/2014 to 12/31/2014Average monthly benefit $300 $453 $892 $1,462 $2,177 $3,256 $4,061Average final average salary $43,879 $43,513 $48,310 $55,258 $61,462 $72,587 $70,590Number of retired members 91 963 814 473 912 1,018 1,344
Period 1/1/2013 to 12/31/2013Average monthly benefit $262 $399 $845 $1,466 $2,178 $3,408 $4,036Average final average salary $40,035 $42,368 $47,413 $55,071 $61,526 $74,649 $69,812Number of retired members 68 947 779 496 814 1,049 1,451
Period 1/1/2012 to 12/31/2012Average monthly benefit $261 $406 $823 $1,495 $2,101 $3,464 $4,073Average final average salary $38,197 $42,106 $46,477 $54,120 $58,807 $74,455 $70,238Number of retired members 94 899 724 535 680 908 1,184
Period 1/1/2011 to 12/31/2011Average monthly benefit $263 $445 $843 $1,430 $2,095 $2,994 $3,829Average final average salary $36,895 $44,808 $46,588 $52,687 $58,928 $67,793 $66,989Number of retired members 103 851 716 769 856 1,134 2,276
Period 1/1/2010 to 12/31/2010Average monthly benefit $254 $398 $788 $1,332 $2,109 $2,938 $3,818Average final average salary $39,114 $41,128 $44,562 $50,607 $57,784 $66,053 $65,579Number of retired members 75 755 505 646 712 846 1,662
STATISTICAL SECTIONSchedule of Average Monthly Benefit Payments December 31, 2019 (unaudited)
1/Includes normal retirement, early retirement, and disability benefits for new retirees in the years listed.
Source: Pennsylvania State Employees’ Retirement System
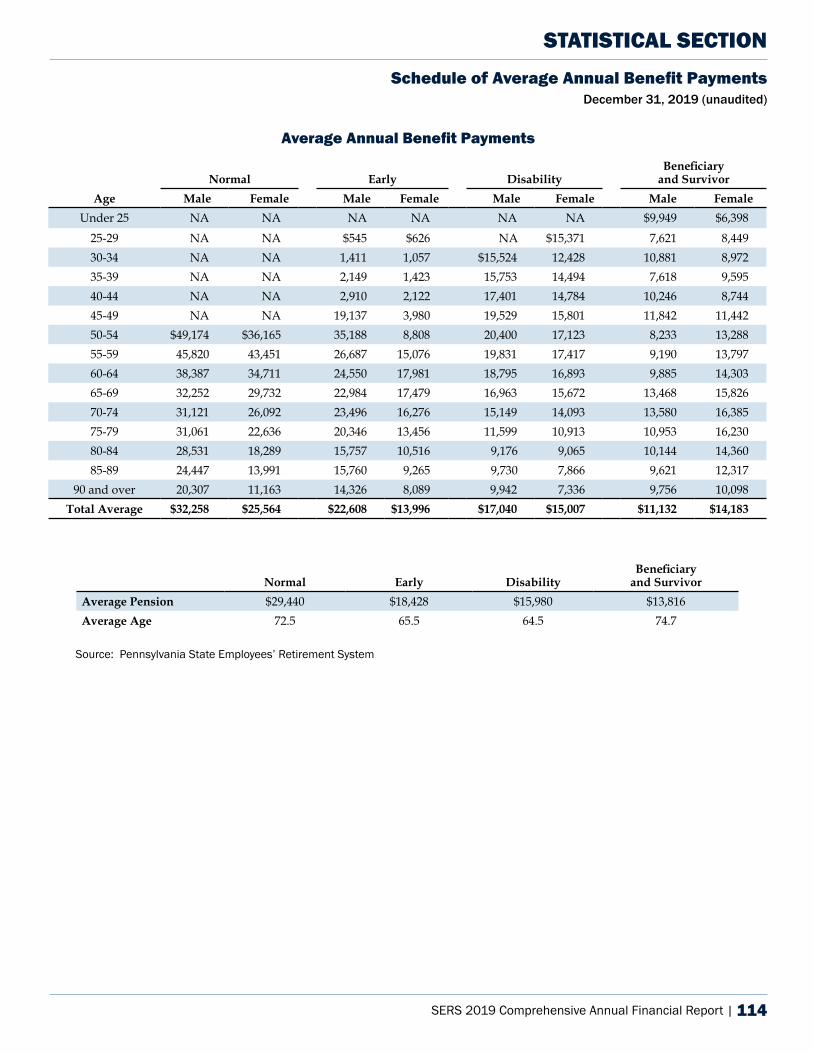
SERS 2019 Comprehensive Annual Financial Report | 114
Normal Early DisabilityBeneficiary
and SurvivorAge Male Female Male Female Male Female Male Female
Under 25 NA NA NA NA NA NA $9,949 $6,398
25-29 NA NA $545 $626 NA $15,371 7,621 8,44930-34 NA NA 1,411 1,057 $15,524 12,428 10,881 8,97235-39 NA NA 2,149 1,423 15,753 14,494 7,618 9,59540-44 NA NA 2,910 2,122 17,401 14,784 10,246 8,74445-49 NA NA 19,137 3,980 19,529 15,801 11,842 11,44250-54 $49,174 $36,165 35,188 8,808 20,400 17,123 8,233 13,28855-59 45,820 43,451 26,687 15,076 19,831 17,417 9,190 13,79760-64 38,387 34,711 24,550 17,981 18,795 16,893 9,885 14,30365-69 32,252 29,732 22,984 17,479 16,963 15,672 13,468 15,82670-74 31,121 26,092 23,496 16,276 15,149 14,093 13,580 16,38575-79 31,061 22,636 20,346 13,456 11,599 10,913 10,953 16,23080-84 28,531 18,289 15,757 10,516 9,176 9,065 10,144 14,36085-89 24,447 13,991 15,760 9,265 9,730 7,866 9,621 12,317
90 and over 20,307 11,163 14,326 8,089 9,942 7,336 9,756 10,098Total Average $32,258 $25,564 $22,608 $13,996 $17,040 $15,007 $11,132 $14,183
Normal Early DisabilityBeneficiary
and SurvivorAverage Pension $29,440 $18,428 $15,980 $13,816 Average Age 72.5 65.5 64.5 74.7
Source: Pennsylvania State Employees’ Retirement System
STATISTICAL SECTION
Average Annual Benefit Payments
Schedule of Average Annual Benefit Payments December 31, 2019 (unaudited)
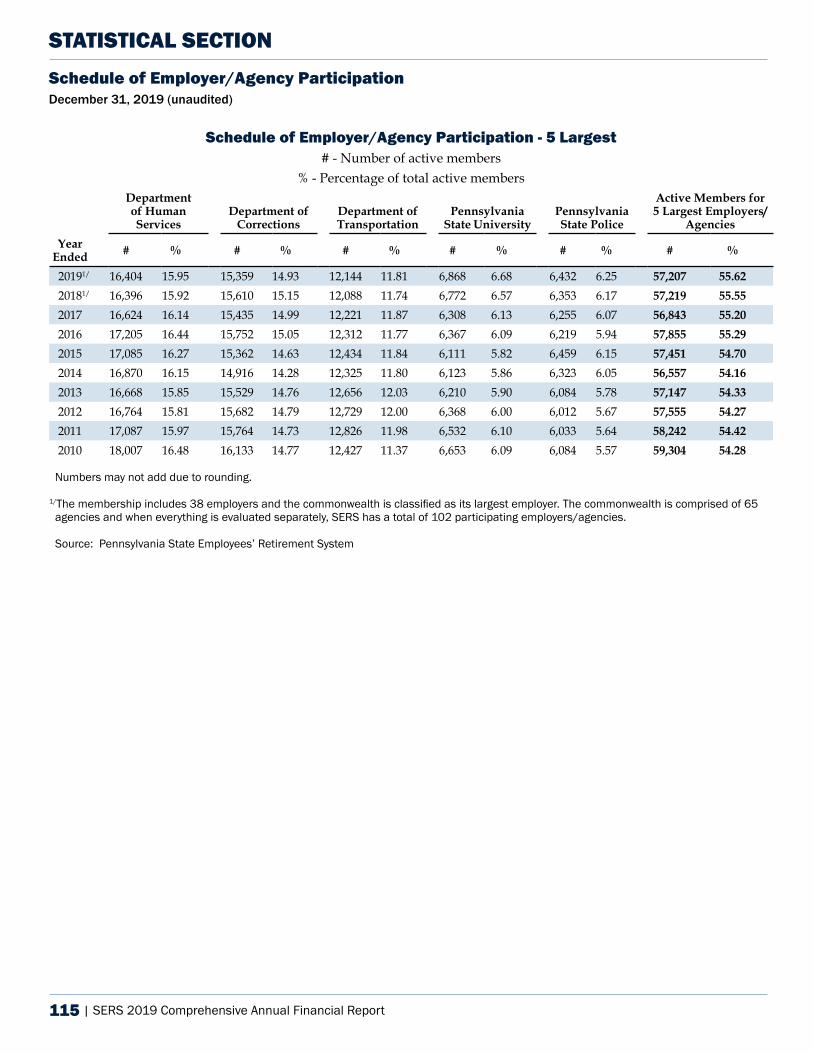
115 | SERS 2019 Comprehensive Annual Financial Report
STATISTICAL SECTIONSchedule of Employer/Agency Participation December 31, 2019 (unaudited)
Schedule of Employer/Agency Participation - 5 Largest # - Number of active members
% - Percentage of total active membersDepartment of Human Services
Department of Corrections
Department of Transportation
Pennsylvania State University
Pennsylvania State Police
Active Members for 5 Largest Employers/
AgenciesYear
Ended # % # % # % # % # % # %
20191/ 16,404 15.95 15,359 14.93 12,144 11.81 6,868 6.68 6,432 6.25 57,207 55.62 20181/ 16,396 15.92 15,610 15.15 12,088 11.74 6,772 6.57 6,353 6.17 57,219 55.55 2017 16,624 16.14 15,435 14.99 12,221 11.87 6,308 6.13 6,255 6.07 56,843 55.20 2016 17,205 16.44 15,752 15.05 12,312 11.77 6,367 6.09 6,219 5.94 57,855 55.29 2015 17,085 16.27 15,362 14.63 12,434 11.84 6,111 5.82 6,459 6.15 57,451 54.70 2014 16,870 16.15 14,916 14.28 12,325 11.80 6,123 5.86 6,323 6.05 56,557 54.16 2013 16,668 15.85 15,529 14.76 12,656 12.03 6,210 5.90 6,084 5.78 57,147 54.33 2012 16,764 15.81 15,682 14.79 12,729 12.00 6,368 6.00 6,012 5.67 57,555 54.27 2011 17,087 15.97 15,764 14.73 12,826 11.98 6,532 6.10 6,033 5.64 58,242 54.42 2010 18,007 16.48 16,133 14.77 12,427 11.37 6,653 6.09 6,084 5.57 59,304 54.28
Numbers may not add due to rounding.
1/The membership includes 38 employers and the commonwealth is classified as its largest employer. The commonwealth is comprised of 65 agencies and when everything is evaluated separately, SERS has a total of 102 participating employers/agencies.
Source: Pennsylvania State Employees’ Retirement System
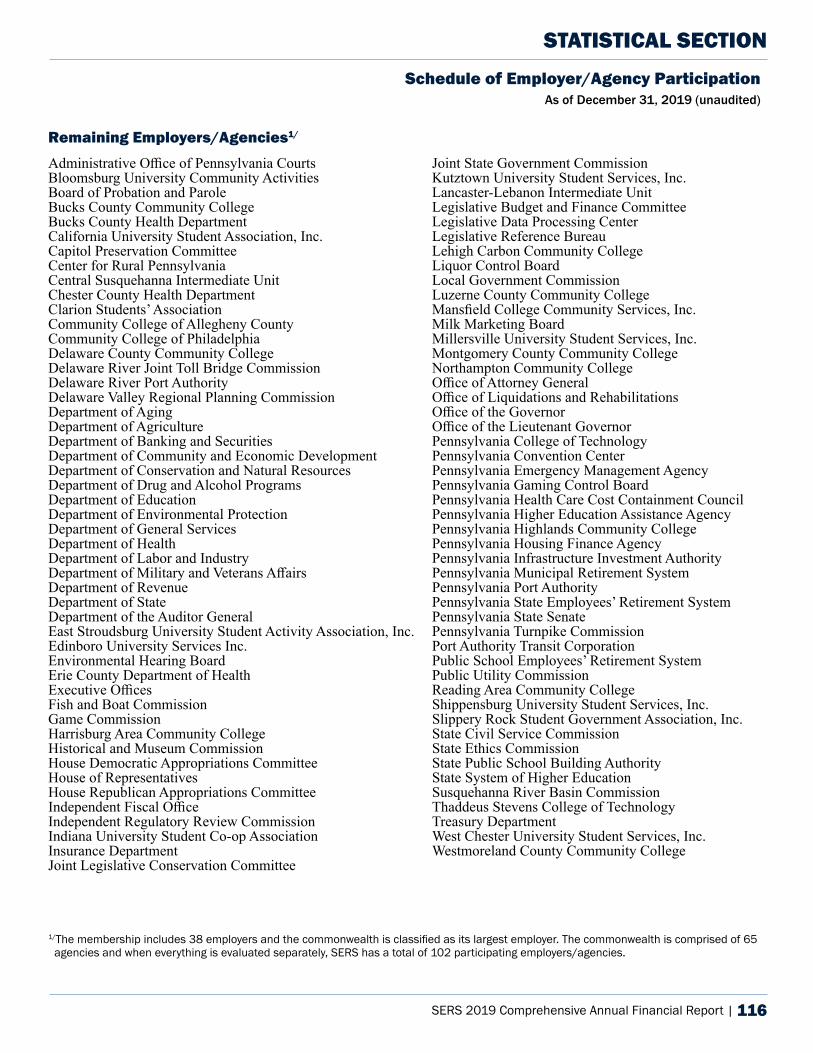
SERS 2019 Comprehensive Annual Financial Report | 116
Remaining Employers/Agencies1/
Administrative Office of Pennsylvania CourtsBloomsburg University Community ActivitiesBoard of Probation and ParoleBucks County Community CollegeBucks County Health DepartmentCalifornia University Student Association, Inc.Capitol Preservation CommitteeCenter for Rural PennsylvaniaCentral Susquehanna Intermediate UnitChester County Health DepartmentClarion Students’ AssociationCommunity College of Allegheny CountyCommunity College of PhiladelphiaDelaware County Community CollegeDelaware River Joint Toll Bridge CommissionDelaware River Port AuthorityDelaware Valley Regional Planning CommissionDepartment of AgingDepartment of AgricultureDepartment of Banking and SecuritiesDepartment of Community and Economic DevelopmentDepartment of Conservation and Natural ResourcesDepartment of Drug and Alcohol ProgramsDepartment of Education Department of Environmental ProtectionDepartment of General ServicesDepartment of HealthDepartment of Labor and IndustryDepartment of Military and Veterans AffairsDepartment of RevenueDepartment of State Department of the Auditor General East Stroudsburg University Student Activity Association, Inc.Edinboro University Services Inc.Environmental Hearing BoardErie County Department of HealthExecutive OfficesFish and Boat CommissionGame CommissionHarrisburg Area Community CollegeHistorical and Museum CommissionHouse Democratic Appropriations CommitteeHouse of RepresentativesHouse Republican Appropriations CommitteeIndependent Fiscal OfficeIndependent Regulatory Review CommissionIndiana University Student Co-op AssociationInsurance DepartmentJoint Legislative Conservation Committee
STATISTICAL SECTION
Schedule of Employer/Agency Participation As of December 31, 2019 (unaudited)
Joint State Government CommissionKutztown University Student Services, Inc.Lancaster-Lebanon Intermediate UnitLegislative Budget and Finance CommitteeLegislative Data Processing CenterLegislative Reference BureauLehigh Carbon Community CollegeLiquor Control BoardLocal Government CommissionLuzerne County Community CollegeMansfield College Community Services, Inc.Milk Marketing BoardMillersville University Student Services, Inc.Montgomery County Community CollegeNorthampton Community CollegeOffice of Attorney GeneralOffice of Liquidations and RehabilitationsOffice of the GovernorOffice of the Lieutenant GovernorPennsylvania College of TechnologyPennsylvania Convention CenterPennsylvania Emergency Management AgencyPennsylvania Gaming Control BoardPennsylvania Health Care Cost Containment CouncilPennsylvania Higher Education Assistance AgencyPennsylvania Highlands Community CollegePennsylvania Housing Finance AgencyPennsylvania Infrastructure Investment AuthorityPennsylvania Municipal Retirement SystemPennsylvania Port AuthorityPennsylvania State Employees’ Retirement SystemPennsylvania State SenatePennsylvania Turnpike CommissionPort Authority Transit CorporationPublic School Employees’ Retirement SystemPublic Utility CommissionReading Area Community CollegeShippensburg University Student Services, Inc.Slippery Rock Student Government Association, Inc.State Civil Service CommissionState Ethics CommissionState Public School Building AuthorityState System of Higher EducationSusquehanna River Basin CommissionThaddeus Stevens College of TechnologyTreasury DepartmentWest Chester University Student Services, Inc.Westmoreland County Community College
1/The membership includes 38 employers and the commonwealth is classified as its largest employer. The commonwealth is comprised of 65 agencies and when everything is evaluated separately, SERS has a total of 102 participating employers/agencies.
State Employees’ Retirement System30 N 3rd St, Suite 150Harrisburg, PA 17101-17161.800.633.5461www.SERS.pa.gov