Embed Size (px)
Citation preview
4,775In 2017SERS retired
members
9,901and welcomed
new members36%of SERS active employees belongto post-Act 120 classes of service
24.1% 12.8%
4.9%
4.7%
1.5% 15.1%
In 2017the SERS
fund returned
(unaudited)
PrivateEquity
Global PublicEquity
2.0%
Cash
FixedIncome
Legacy HedgeFunds
RealEstate
Total FY 18/19 Spending Request
SERS decreased investment fees
2010 2017
IT consulting-system upgrade
real estate
treasury services
postage
legal services
office equipment
$21.7million
$15.2million
SERS paid nearly
in benefits in 2017$3.3 billion
102,978 129,473
$4.5 million$1.7 million$1.3 million$0.7 million$0.7 million$0.2 million
personnel
directed commissions$1.5 million
Samples from operations =
operations
$0.3million
fixed assets
As of Dec 31, 2017 SERS had
annuitantsactive members
$235.6million
(96 basis points)
$130.4million
(47 basis points)
2017 Contributions to the SERS Fund
$1.9 billionemployerscontributed
$383 millionmembers
contributed
$3.9billion
investmentscontributed
SERS average retired member
$28,35272 yearsold
yearsold
receives
per year
SERS average active member
1246 years of service
$35.7 million
Data throughout is estimated/unaudited
Approximate Total Contributions = $6.2 billion
SERS 2018 Supplemental Budget Book
SERS.pa.gov | 1.800.633.5461
SERS 2015 Supplemental Budget BookPrepared for Joseph Torta, Director-Office of Member Services
CONFIDENTIAL
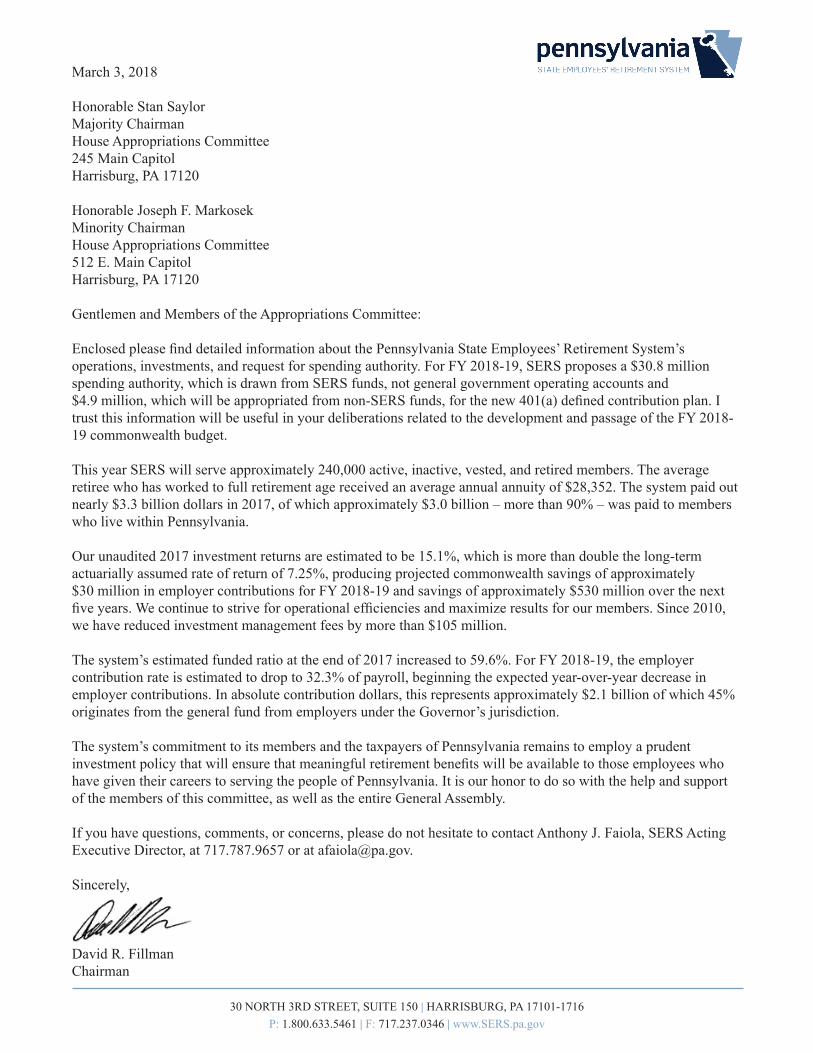
March 3, 2018
Honorable Stan Saylor Majority Chairman House Appropriations Committee 245 Main CapitolHarrisburg, PA 17120
Honorable Joseph F. MarkosekMinority Chairman House Appropriations Committee512 E. Main CapitolHarrisburg, PA 17120
Gentlemen and Members of the Appropriations Committee:
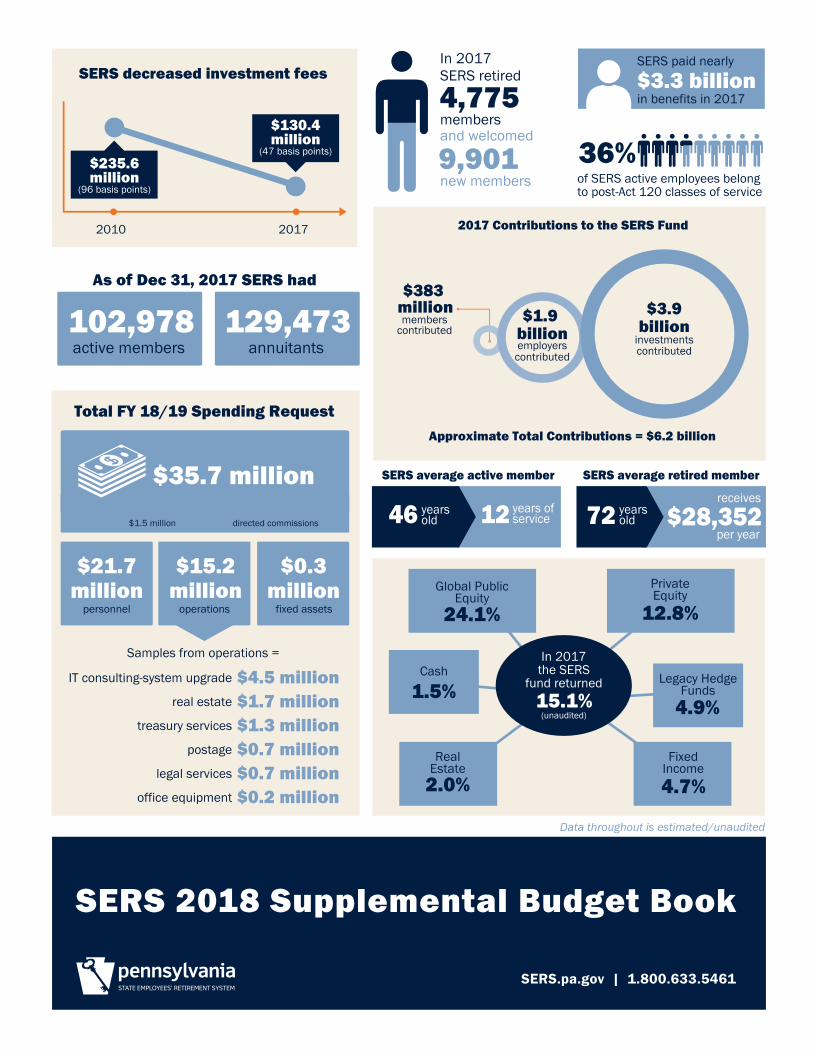
Enclosed please find detailed information about the Pennsylvania State Employees’ Retirement System’s operations, investments, and request for spending authority. For FY 2018-19, SERS proposes a $30.8 million spending authority, which is drawn from SERS funds, not general government operating accounts and $4.9 million, which will be appropriated from non-SERS funds, for the new 401(a) defined contribution plan. I trust this information will be useful in your deliberations related to the development and passage of the FY 2018-19 commonwealth budget.
This year SERS will serve approximately 240,000 active, inactive, vested, and retired members. The average retiree who has worked to full retirement age received an average annual annuity of $28,352. The system paid out nearly $3.3 billion dollars in 2017, of which approximately $3.0 billion – more than 90% – was paid to members who live within Pennsylvania.
Our unaudited 2017 investment returns are estimated to be 15.1%, which is more than double the long-term actuarially assumed rate of return of 7.25%, producing projected commonwealth savings of approximately $30 million in employer contributions for FY 2018-19 and savings of approximately $530 million over the next five years. We continue to strive for operational efficiencies and maximize results for our members. Since 2010, we have reduced investment management fees by more than $105 million.
The system’s estimated funded ratio at the end of 2017 increased to 59.6%. For FY 2018-19, the employer contribution rate is estimated to drop to 32.3% of payroll, beginning the expected year-over-year decrease in employer contributions. In absolute contribution dollars, this represents approximately $2.1 billion of which 45% originates from the general fund from employers under the Governor’s jurisdiction.
The system’s commitment to its members and the taxpayers of Pennsylvania remains to employ a prudent investment policy that will ensure that meaningful retirement benefits will be available to those employees who have given their careers to serving the people of Pennsylvania. It is our honor to do so with the help and support of the members of this committee, as well as the entire General Assembly.
If you have questions, comments, or concerns, please do not hesitate to contact Anthony J. Faiola, SERS Acting Executive Director, at 717.787.9657 or at [email protected].
Sincerely,
David R. FillmanChairman
30 NORTH 3RD STREET, SUITE 150 | HARRISBURG, PA 17101-1716 P: 1.800.633.5461 | F: 717.237.0346 | www.SERS.pa.gov
SERS 2018 SupplEmEntal budgEt bOOK
table of Contents
SERS Organization Mission, Vision & Guiding Principles ............................................ 3 Services & Operations .................................................................... 4 Proposed FY 2018-2019 Administrative Budget ............................ 9 Legislation ....................................................................................... 11
SERS members Demographics as of December 31 .................................................. 12
SERS Fund Funding Process .............................................................................. 14 Actuarial Status ............................................................................... 20 Investment Program ........................................................................ 23 Overview ............................................................................ 23 Performance ....................................................................... 27 Expenses & Fees ................................................................ 30 Portfolio Snapshot | Private Equity .................................... 39 Portfolio Snapshot | Global Public Equity ......................... 54 Portfolio Snapshot | Real Estate ........................................ 56 Portfolio Snapshot | Multi-Strategy .................................. 60 Portfolio Snapshot | Legacy Hedge Funds ........................ 62 Portfolio Snapshot | Fixed Income .................................... 64 Portfolio Snapshot | Cash .................................................. 66 Pennsylvania Investments .................................................. 67 Minority/Woman-Owned Managers and Brokers .............. 70
457 deferred Compensation plan History, Growth & Highlights ......................................................... 71 Performance, Expenses & Fees ....................................................... 74
SERS Organization
SERS 2018 Supplemental Budget Book | 3Data in this publication is unaudited.
Established in 1923, SERS is one of the nation’s oldest and largest statewide retirement plans for public employees, with approximately 240,000 members. SERS is among the largest of public and corporate pension funds, with assets of approximately $29.1 billion as of December 31, 2017.
SERS is responsible for administering the State Employees’ Retirement Code in accordance with the expressed intent of the General Assembly and bears a fiduciary obligation to plan beneficiaries, including state employees and retirees.
State law provides that the administration of the SERS Fund and the fiduciary responsibility for its management be vested in an 11-member board. The management of SERS is the responsibility of the executive director who, with the approval of the board, contracts for professional services and employs the staff needed to operate the system.
mission The mission of SERS is to provide retirement benefits and services to our members through sound administration and prudent investments.
Vision SERS’ vision is to navigate organizational, fiscal, and legislative challenges so that SERS continues to progress toward fully-funded status while enhancing and sustaining effective and responsive member services.
guiding principles
• Demonstrate Integrity• Develop and Empower Employees • Focus on Customer Service• Fulfill Fiduciary Obligations• Lead Innovation and Improvement • Learn from Mistakes• Safeguard Information, Facilities, and Staff• Share Knowledge• Think Strategically
SERS ORganizatiOn
mission, Vision & guiding principles
4 | SERS 2018 Supplemental Budget Book Data in this publication is unaudited.
Services & Operations
The approximately 200 employees who work for the State Employees’ Retirement System share a singular focus: serving SERS members. Some SERS employees serve members by investing and overseeing approximately $29.1 billion. Other SERS employees serve members by ensuring that every monthly payment is made correctly and on time. Still others audit and account for each penny, provide online information, or answer members’ questions in person or over the phone.
Some work is behind-the-scenes, while other work touches members more directly. Examples of services offered to active and vested members include:
• Issuing annual statements of account• Offering individual and group educational sessions about retirement benefits• Helping with the purchase of service, change of beneficiaries, etc.• Calculating retirement, disability, and vesting estimates• Providing one-on-one counseling for those leaving state service• Walking members step-by-step through their retirement experience
Examples of services offered to retired members include:
• Issuing annual statements of account and tax forms• Providing income tax withholding, direct deposit, address change, and other forms, as
requested, as well as assistance in filling out and submitting forms, as needed• Processing changes to retiree health coverage• Helping members understand implications of and, if necessary, effecting pension changes
related to marriage, divorce, or death• Tracking and reissuing payments, if necessary• Assisting spouses, children, and other survivors upon the death of a SERS member
SERS ORganizatiOn
SERS 2018 Supplemental Budget Book | 5Data in this publication is unaudited.
Services & Operations
SERS ORganizatiOn
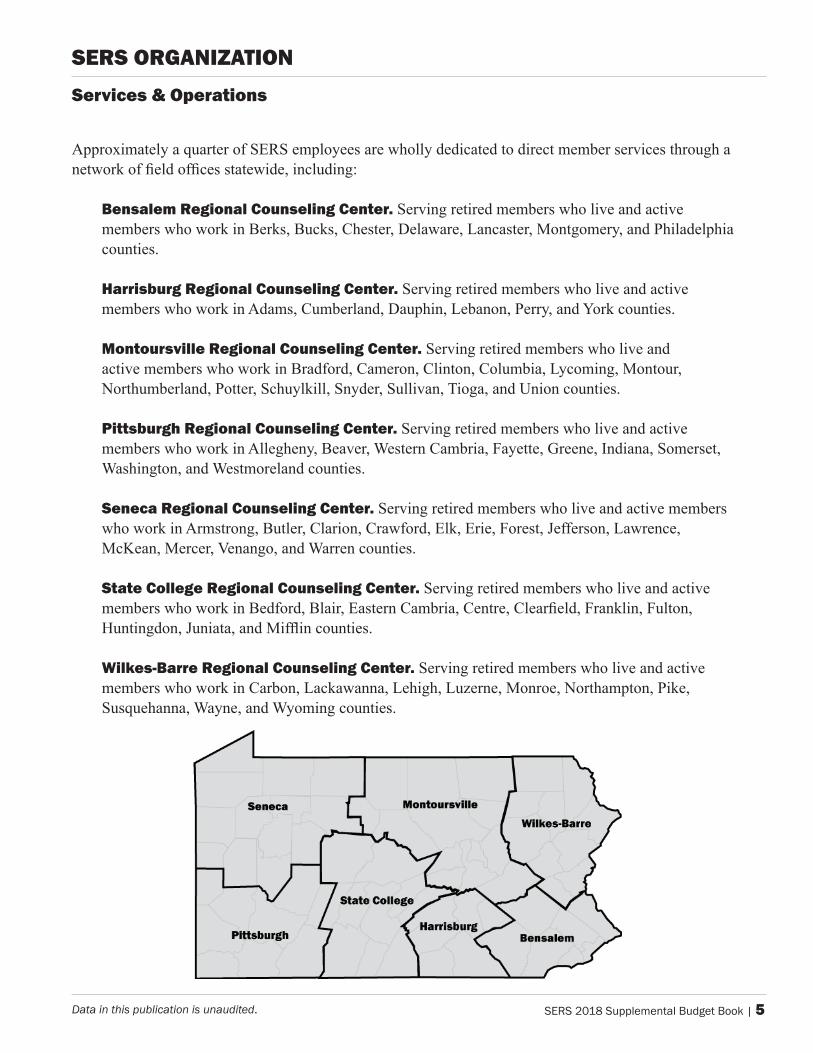
Approximately a quarter of SERS employees are wholly dedicated to direct member services through a network of field offices statewide, including:
bensalem Regional Counseling Center. Serving retired members who live and active members who work in Berks, Bucks, Chester, Delaware, Lancaster, Montgomery, and Philadelphia counties.
Harrisburg Regional Counseling Center. Serving retired members who live and active members who work in Adams, Cumberland, Dauphin, Lebanon, Perry, and York counties.
montoursville Regional Counseling Center. Serving retired members who live and active members who work in Bradford, Cameron, Clinton, Columbia, Lycoming, Montour, Northumberland, Potter, Schuylkill, Snyder, Sullivan, Tioga, and Union counties.
pittsburgh Regional Counseling Center. Serving retired members who live and active members who work in Allegheny, Beaver, Western Cambria, Fayette, Greene, Indiana, Somerset, Washington, and Westmoreland counties.
Seneca Regional Counseling Center. Serving retired members who live and active members who work in Armstrong, Butler, Clarion, Crawford, Elk, Erie, Forest, Jefferson, Lawrence, McKean, Mercer, Venango, and Warren counties.
State College Regional Counseling Center. Serving retired members who live and active members who work in Bedford, Blair, Eastern Cambria, Centre, Clearfield, Franklin, Fulton, Huntingdon, Juniata, and Mifflin counties.
Wilkes-barre Regional Counseling Center. Serving retired members who live and active members who work in Carbon, Lackawanna, Lehigh, Luzerne, Monroe, Northampton, Pike, Susquehanna, Wayne, and Wyoming counties.
6 | SERS 2018 Supplemental Budget Book Data in this publication is unaudited.
Services & Operations
SERS ORganizatiOn
To achieve its mission overall, SERS is organized into the following business units.
The executive office provides strategic leadership and administrative oversight of agency operations. It directly serves the State Employees’ Retirement Board, including facilitating communications, and managing meetings and documentation. The communications and policy office, a component of the executive office, works with the General Assembly on policy-related matters; administers the agency’s right-to-know program; serves as liaison to the media; and offers an array of communications support to the agency.
The office of member services provides direct assistance to SERS active, vested, and retired members as well as their families. It conducts individual and group educational sessions statewide. The office also supports SERS employers and processes member enrollments, retirements, status changes, payments, and a host of other transactions.
The investment office works closely with the State Employees’ Retirement Board to oversee investments in SERS defined benefit, 457 deferred compensation, and 401a defined contribution plans. The office establishes and implements investment policies; sets the strategic asset allocation; monitors fund cash flow, investment managers, fund risks, and performance; and researches and recommends investment opportunities. The office also maintains deep and current expertise related to the analysis of capital and global markets.
The office of finance and administration maintains accounting controls and oversees all SERS funds. It administers all transactions including, for example, member payments; member and employer contributions; investment purchases and sales; and operational expenses. The office also manages facilities and procurement, and oversees the 457 and 401a plans.
The internal audit division tests business processes and internal controls to confirm that they are adequate and operating properly to ensure vigilant stewardship of SERS funds. It performs on-site audits of investment consultants and managers, as deemed necessary. The division also coordinates independent, external audits of SERS on an annual basis and performs special projects at the direction of the State Employees’ Retirement Board and audit committee.
The legal office advises the State Employees’ Retirement Board on matters related to member appeals and administrative hearings, securities actions and litigation matters, and other general legal issues for which the board requests advice. In addition, the office reviews, negotiates, assists in drafting, and finalizes all investment contracts, as well as other general business contracts. The office also provides legal support related to legislative drafting, right-to-know requests, and member transactions.
SERS 2018 Supplemental Budget Book | 7Data in this publication is unaudited.
The office of information technology administers the agency’s computing infrastructure. It ensures the performance and security of complex databases, which contain sensitive personal and financial information and are relied upon to track investments, process payments, and account for funds. The office also links the regional field offices, develops applications to provide members with online access to SERS information, and provides user support.
The human resources division recruits, hires, trains, supports, and assesses the performance of SERS employees. It offers workforce planning, professional development programs, and labor relations services. The division also facilitates annual financial disclosure and ethics processes for SERS board members and staff.
Services & Operations
SERS ORganizatiOn
8 | SERS 2018 Supplemental Budget Book Data in this publication is unaudited.
Services & Operations
SERS ORganizatiOn
Finance & Administration
Communications & Policy Information Technology
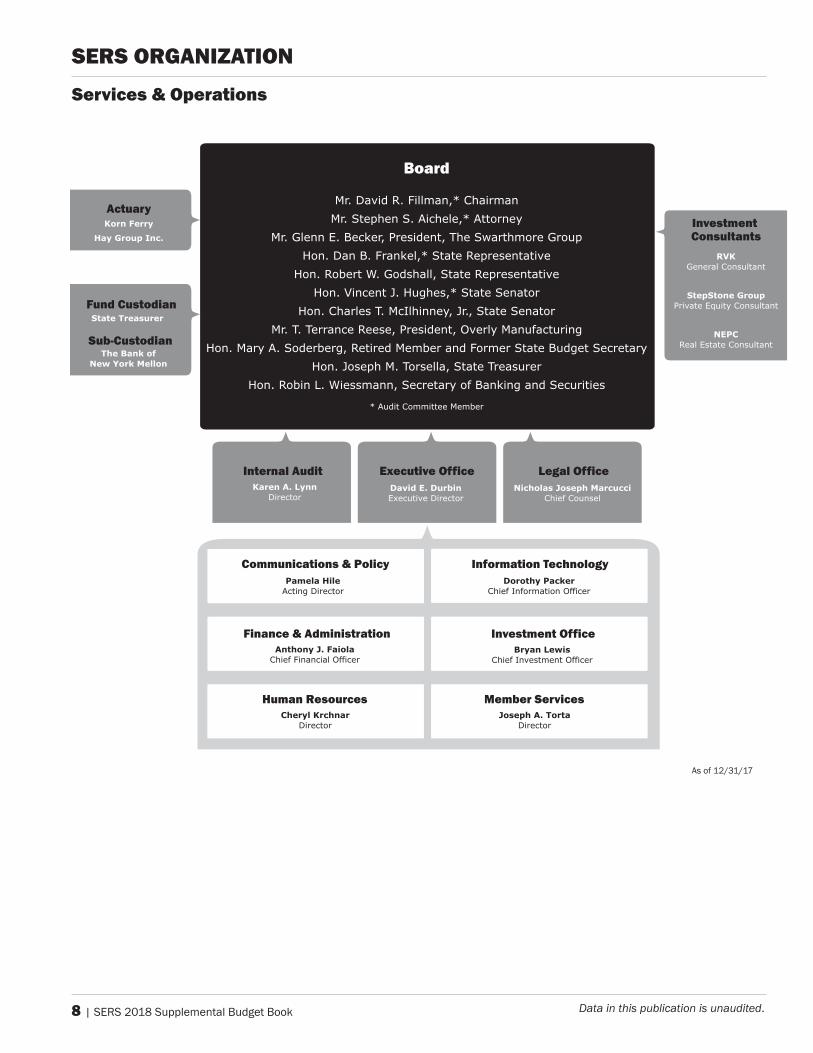
Board
Mr. David R. Fillman,* Chairman
Mr. Stephen S. Aichele,* Attorney
Mr. Glenn E. Becker, President, The Swarthmore Group
Hon. Dan B. Frankel,* State Representative
Hon. Robert W. Godshall, State Representative
Hon. Vincent J. Hughes,* State Senator
Hon. Charles T. McIlhinney, Jr., State Senator
Mr. T. Terrance Reese, President, Overly Manufacturing
Hon. Mary A. Soderberg, Retired Member and Former State Budget Secretary
Hon. Joseph M. Torsella, State Treasurer
Hon. Robin L. Wiessmann, Secretary of Banking and Securities
* Audit Committee Member
As of 12/31/17
Korn Ferry
Hay Group Inc.
Actuary
State Treasurer
Fund Custodian
The Bank of New York Mellon
Sub-Custodian
RVKGeneral Consultant
StepStone GroupPrivate Equity Consultant
NEPCReal Estate Consultant
Investment Consultants
Karen A. LynnDirector
Internal AuditDavid E. DurbinExecutive Director
Executive Office
Bryan LewisChief Investment Officer
Investment Office
Nicholas Joseph MarcucciChief Counsel
Legal Office
Anthony J. FaiolaChief Financial Officer
Joseph A. TortaDirector
Member Services
Pamela HileActing Director
Cheryl KrchnarDirector
Human Resources
Dorothy PackerChief Information Officer
SERS 2018 Supplemental Budget Book | 9Data in this publication is unaudited.
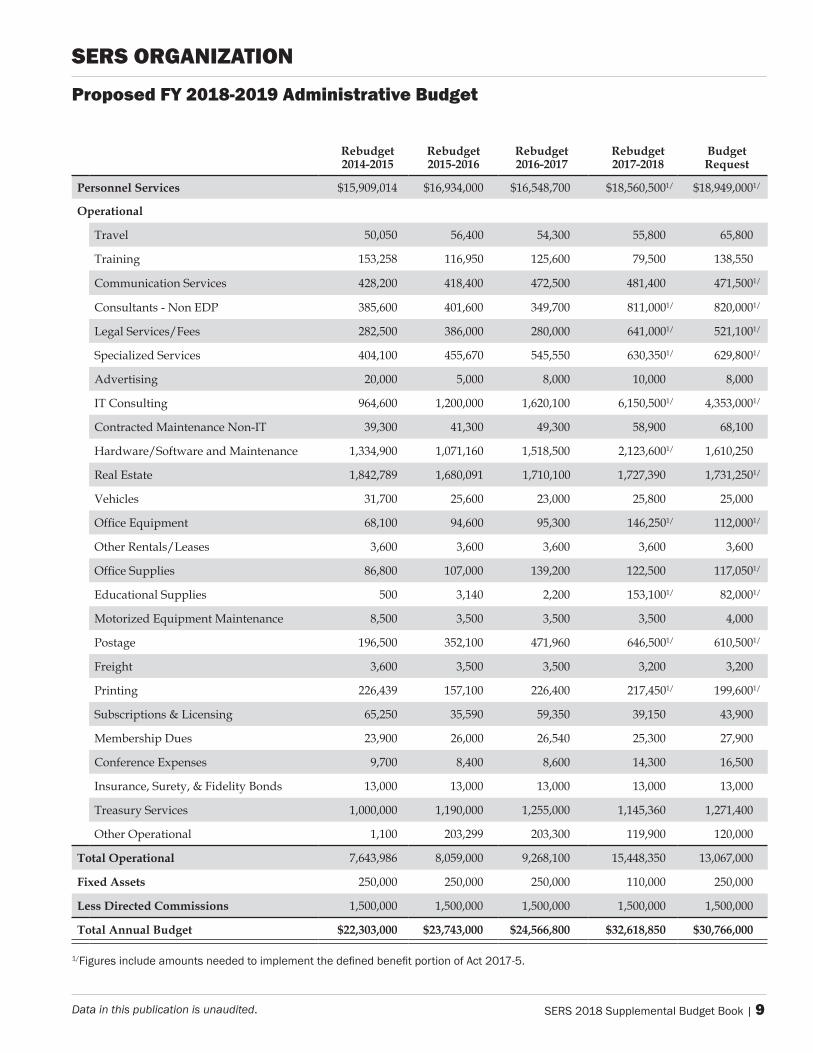
Rebudget 2014-2015
Rebudget 2015-2016
Rebudget 2016-2017
Rebudget 2017-2018
Budget Request
Personnel Services $15,909,014 $16,934,000 $16,548,700 $18,560,5001/ $18,949,0001/
Operational
Travel 50,050 56,400 54,300 55,800 65,800
Training 153,258 116,950 125,600 79,500 138,550
CommunicationServices 428,200 418,400 472,500 481,400 471,5001/
Consultants-NonEDP 385,600 401,600 349,700 811,0001/ 820,0001/
LegalServices/Fees 282,500 386,000 280,000 641,0001/ 521,1001/
SpecializedServices 404,100 455,670 545,550 630,3501/ 629,8001/
Advertising 20,000 5,000 8,000 10,000 8,000
ITConsulting 964,600 1,200,000 1,620,100 6,150,5001/ 4,353,0001/
ContractedMaintenanceNon-IT 39,300 41,300 49,300 58,900 68,100
Hardware/SoftwareandMaintenance 1,334,900 1,071,160 1,518,500 2,123,6001/ 1,610,250
RealEstate 1,842,789 1,680,091 1,710,100 1,727,390 1,731,2501/
Vehicles 31,700 25,600 23,000 25,800 25,000
OfficeEquipment 68,100 94,600 95,300 146,2501/ 112,0001/
OtherRentals/Leases 3,600 3,600 3,600 3,600 3,600
OfficeSupplies 86,800 107,000 139,200 122,500 117,0501/
EducationalSupplies 500 3,140 2,200 153,1001/ 82,0001/
MotorizedEquipmentMaintenance 8,500 3,500 3,500 3,500 4,000
Postage 196,500 352,100 471,960 646,5001/ 610,5001/
Freight 3,600 3,500 3,500 3,200 3,200
Printing 226,439 157,100 226,400 217,4501/ 199,6001/
Subscriptions&Licensing 65,250 35,590 59,350 39,150 43,900
MembershipDues 23,900 26,000 26,540 25,300 27,900
ConferenceExpenses 9,700 8,400 8,600 14,300 16,500
Insurance,Surety,&FidelityBonds 13,000 13,000 13,000 13,000 13,000
TreasuryServices 1,000,000 1,190,000 1,255,000 1,145,360 1,271,400
OtherOperational 1,100 203,299 203,300 119,900 120,000
Total Operational 7,643,986 8,059,000 9,268,100 15,448,350 13,067,000
Fixed Assets 250,000 250,000 250,000 110,000 250,000
Less Directed Commissions 1,500,000 1,500,000 1,500,000 1,500,000 1,500,000
Total Annual Budget $22,303,000 $23,743,000 $24,566,800 $32,618,850 $30,766,000
1/Figures include amounts needed to implement the defined benefit portion of Act 2017-5.
proposed FY 2018-2019 administrative budget
SERS ORganizatiOn
10 | SERS 2018 Supplemental Budget Book Data in this publication is unaudited.
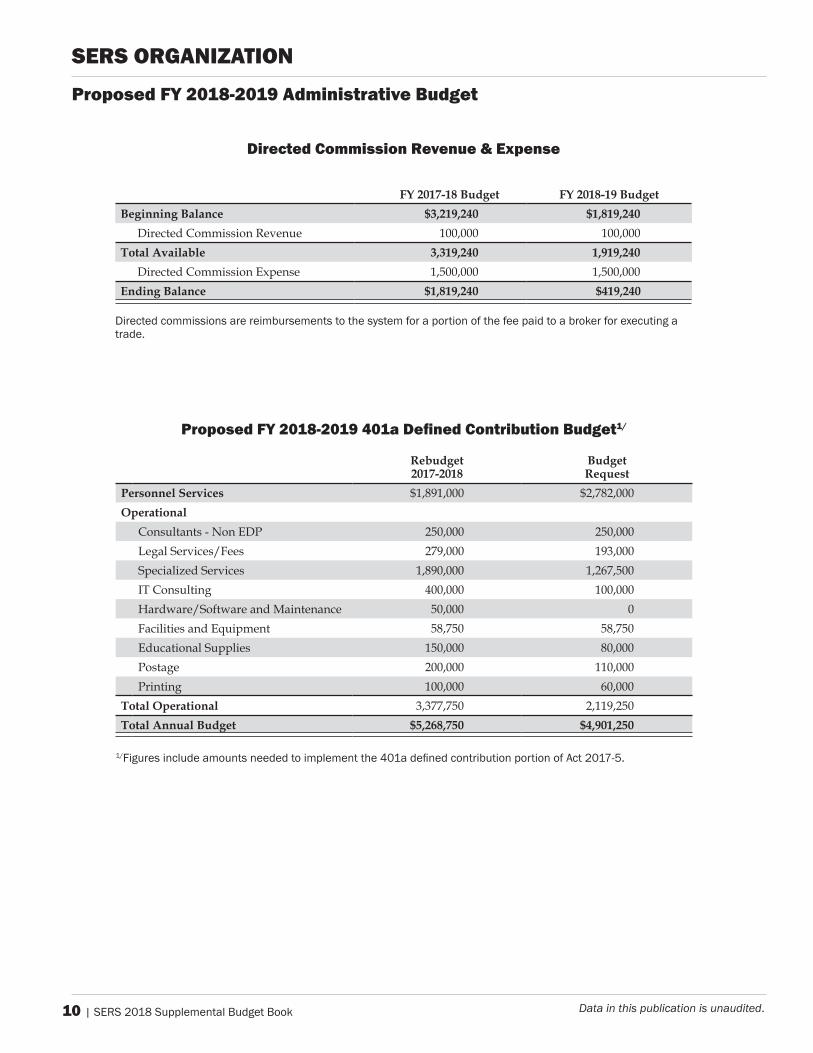
directed Commission Revenue & Expense
FY 2017-18 Budget FY 2018-19 BudgetBeginning Balance $3,219,240 $1,819,240
DirectedCommissionRevenue 100,000 100,000Total Available 3,319,240 1,919,240
DirectedCommissionExpense 1,500,000 1,500,000Ending Balance $1,819,240 $419,240
Directed commissions are reimbursements to the system for a portion of the fee paid to a broker for executing a trade.
proposed FY 2018-2019 administrative budget
SERS ORganizatiOn
Proposed FY 2018-2019 401a Defined Contribution Budget1/
Rebudget 2017-2018
Budget Request
Personnel Services $1,891,000 $2,782,000Operational
Consultants-NonEDP 250,000 250,000LegalServices/Fees 279,000 193,000SpecializedServices 1,890,000 1,267,500ITConsulting 400,000 100,000Hardware/SoftwareandMaintenance 50,000 0FacilitiesandEquipment 58,750 58,750EducationalSupplies 150,000 80,000Postage 200,000 110,000Printing 100,000 60,000
Total Operational 3,377,750 2,119,250Total Annual Budget $5,268,750 $4,901,250
1/Figures include amounts needed to implement the 401a defined contribution portion of Act 2017-5.
SERS 2018 Supplemental Budget Book | 11Data in this publication is unaudited.
SERS ORganizatiOn
legislation
legislation Enacted during 2017
act 2017-5
OverviewOn June 12, 2017, Governor Wolf signed Senate Bill 1, which became Act 2017-5. The law established two new side-by-side hybrid defined benefit (DB)/defined contribution (DC) benefit options and a new DC-only option for all state employees, excluding most hazardous duty employees, who first enter SERS membership on or after January 1, 2019. While most hazardous employees are exempt, those starting on or after January 1, 2019, will have a 10% cap on voluntary overtime that is includable for retirement covered earnings.
Additionally, all current SERS members will have a one-time, irrevocable option to select one of the three new retirement benefit options between January 1, 2019, and March 31, 2019. The newly elected option will be effective July 1, 2019, and generally will apply to all future service.
Funding for FY 2017/18 expenditures to implement the new 401a defined contribution plan was established in Act 2017-44, signed into law on October 30, 2017.
Benefit Enhancements for Members Who Joined SERS Under Act 2010-120 (on or after January 1, 2011) While currently ineligible to do so, those who entered SERS membership on or after January 1, 2011, will be eligible to withdraw their contributions and interest at retirement beginning on July 1, 2019. The law also provides a shared-gain provision to balance the current shared-risk requirement that could change the amount these members contribute toward their retirement benefit. Changes to Financing provisionsEffective with SERS’ December 31, 2021 actuarial valuation, the actuarial funding method to determine the normal cost of benefits each year will change. The normal cost, currently based on the benefits and contributions for the average new employee, will be based on the benefits and contributions for all covered employees from their date of entry.
Any change in SERS’ unfunded accrued liability as a result of the legislation will be funded using a 30-year, level dollar amortization, (rather than the current 10-year, level dollar amortization) beginning July 1, 2019. Moreover, any savings that result from Act 2017-5 will be paid back to SERS as additional contributions to pay down the unfunded accrued liability.
independent legal CounselAct 2017-5 provides the SERS Board with the authority to hire legal counsel, for the board and agency, that is independent of the Office of General Counsel.
pension investment Review and Other Operational provisionsAct 2017-5 also established the Public Pension and Asset Investment Review Commission to study and make recommendations to the General Assembly and the Governor regarding investment performance and investment strategies. The legislation adds the Secretary of Banking and Securities as an ex-officio member of the board and requires board members to obtain eight hours of relevant training annually.

SERS Members
SERS 2018 Supplemental Budget Book | 12Data in this publication is unaudited.
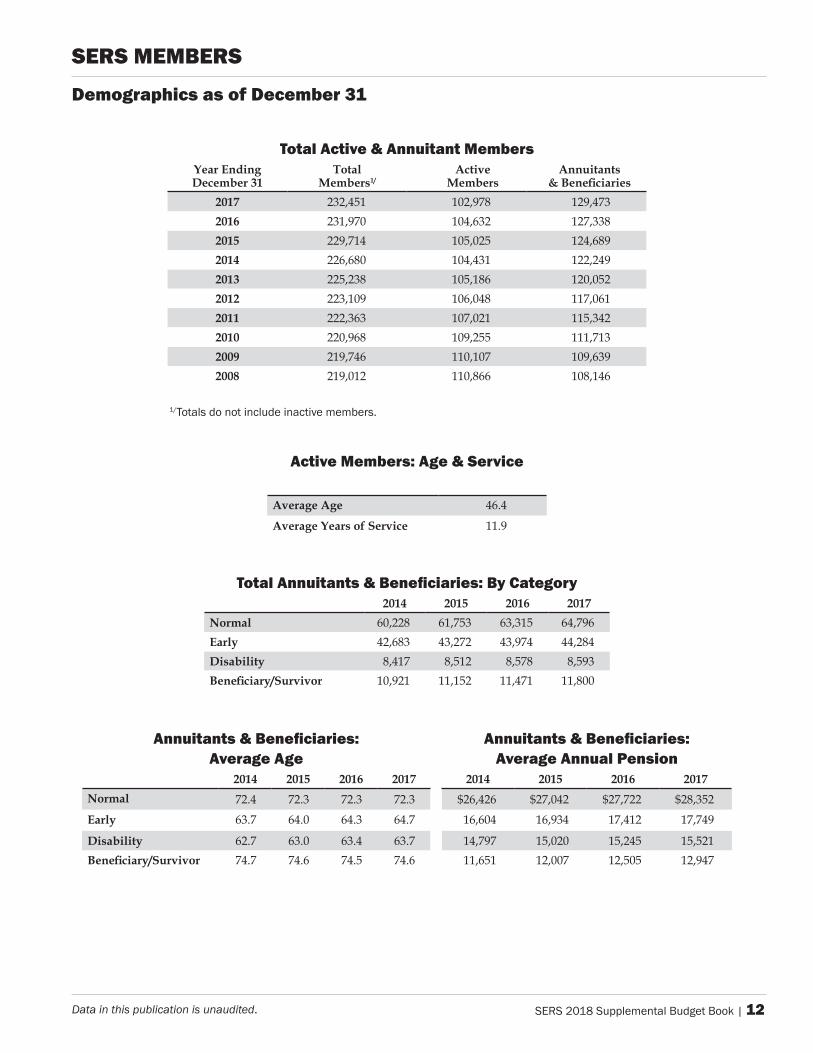
total active & annuitant membersYear Ending December 31
Total Members1/
Active Members
Annuitants & Beneficiaries
2017 232,451 102,978 129,4732016 231,970 104,632 127,3382015 229,714 105,025 124,6892014 226,680 104,431 122,2492013 225,238 105,186 120,0522012 223,109 106,048 117,0612011 222,363 107,021 115,3422010 220,968 109,255 111,7132009 219,746 110,107 109,6392008 219,012 110,866 108,146
active members: age & Service
Average Age 46.4
Average Years of Service 11.9
Annuitants & Beneficiaries: average age
Annuitants & Beneficiaries: average annual pension
2014 2015 2016 2017 2014 2015 2016 2017Normal 72.4 72.3 72.3 72.3 $26,426 $27,042 $27,722 $28,352
Early 63.7 64.0 64.3 64.7 16,604 16,934 17,412 17,749
Disability 62.7 63.0 63.4 63.7 14,797 15,020 15,245 15,521Beneficiary/Survivor 74.7 74.6 74.5 74.6 11,651 12,007 12,505 12,947
1/Totals do not include inactive members.
Total Annuitants & Beneficiaries: By Category2014 2015 2016 2017
Normal 60,228 61,753 63,315 64,796Early 42,683 43,272 43,974 44,284Disability 8,417 8,512 8,578 8,593Beneficiary/Survivor 10,921 11,152 11,471 11,800
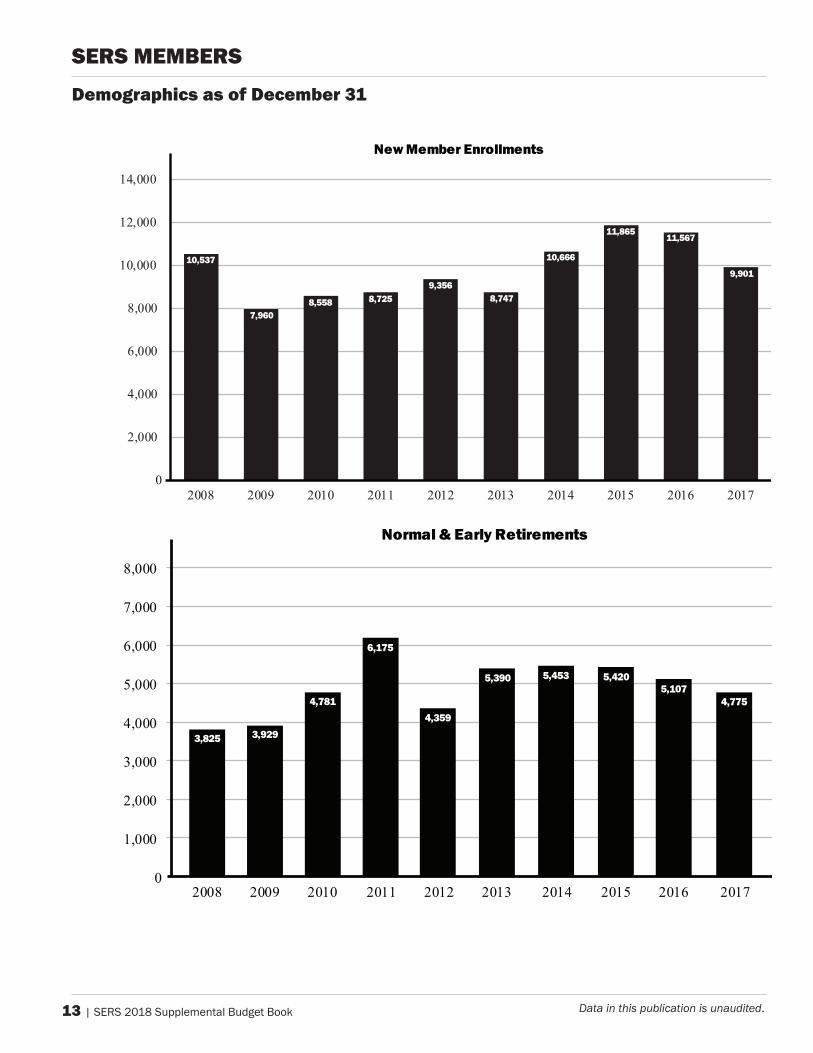
demographics as of december 31
SERS mEmbERS
13 | SERS 2018 Supplemental Budget Book Data in this publication is unaudited.
demographics as of december 31
SERS mEmbERS
10,537
7,960 8,558 8,725
9,356 8,747
10,666
11,865 11,567
9,901
0
2,000
4,000
6,000
8,000
10,000
12,000
14,000
2008 2009 2010 2011 2012 2013 2014 2015 2016 2017
New Member Enrollments
3,825 3,929
4,781
6,175
4,359
5,390 5,453 5,420 5,107
4,775
0
1,000
2,000
3,000
4,000
5,000
6,000
7,000
8,000
Normal & Early Retirements
2008 2009 2010 2011 2012 2013 2014 2015 2016 2017

SERS Fund
SERS 2018 Supplemental Budget Book | 14Data in this publication is unaudited.
SERS Fund
Funding process
Defined Benefit Plan
The Pennsylvania State Employees’ Retirement System currently administers two retirement plans that contribute to the financial security of the commonwealth’s public workforce in its retirement years. Most state employees are required to participate in Pennsylvania’s defined benefit plan. Employees who are eligible to participate in the defined benefit plan may choose to supplement their retirement savings by also voluntarily participating in the 457 deferred compensation plan.
The economic engine of the defined benefit plan is the SERS Fund, which is reviewed in depth in this section. Details about the 457 deferred compensation plan are provided in the last section of this book. In addition to administering the two current plans, the system is working to implement a new plan for most new members beginning in 2019. That new plan is discussed in the Legislation section.
In the defined benefit plan, both the employer and the member pay a certain percentage of the member’s salary to the SERS Fund for as long as the member works for the commonwealth. For FY 2017/18, employers are contributing 33.2% of payroll and most members are paying 6.25%. SERS invests this money to achieve returns to help ensure sufficient funds are available to make payments to current and future retirees. In 2017, SERS earned an estimated 15.1% return on its investments.
When members meet certain milestones—working a specific number of years to achieve vesting, for example—they become eligible to receive monthly retirement payments for the rest of their lives. The payment amount is based on a formula that includes the member’s length of service, age, compensation over a period of time, and an accrual rate, or multiplier that is determined by the General Assembly.
In 2017, SERS made approximately $3.3 billion in benefit payments, approximately $3.0 billion of which stayed in Pennsylvania. The average annual pension paid to a retired member who worked to full retirement age was $28,352.
Determining Adequate Funding for a Defined Benefit Plan
Defined benefit plans are long-term propositions. When underlying principles remain intact, defined benefit plans offer efficient, stable, and sustainable models for growing assets and delivering benefits through complete economic cycles. A standard feature of these types of plans is that employee and employer contributions invested throughout the member’s working career provide sufficient funding to pay for that particular member’s expected lifetime retirement benefit.
Because a defined benefit plan guarantees a monthly payment to every retiree for life, it is impossible to develop precise, before-the-fact costs and cash flows for the plan. The number of people paying into the plan, the amount they earn, how long they work, the number of people retiring, the age at which each person retires, and how long each retiree lives are among the myriad factors that vary from day-to-day, month-to-month, and year-to-year.
15 | SERS 2018 Supplemental Budget Book Data in this publication is unaudited.
Actuarial science is used to develop accurate predictions. It applies available data to a number of interrelated mathematical and statistical methods and uses investment and financial practices to study uncertain future events.
SERS actuarial firm conducts an in-depth investigation and analysis—known as an experience study—of real-world economic and demographic data every five years. Economic assumptions include rates of investment return and salary growth, for example, which are significantly impacted by inflation. Demographic assumptions include workforce, disability, and mortality trends. In 2016, SERS delivered its most recent experience study. It is available at SERS.pa.gov.
The selection of economic and demographic assumptions used is generally guided by the Actuarial Standards Board. In SERS’ case, some very important assumptions—such as the length of time over which investment gains and losses are recognized—are set by Pennsylvania law.
Each year, SERS’ actuarial firm uses the most recent active member and retiree demographic data to determine total expected future obligations. The actuary then compares those obligations to the expected value of the fund’s assets, based on current audited financial statements and future economic assumptions.
This calculation is factored in with the statutorily set member contribution rate and the assumed investment rate of return as the basis for calculating how much employers need to contribute in order to fully fund their employees’ retirement benefits.
Funding Sources & trends
Defined benefit plans are designed to remain stable by receiving three regular funding streams—member contributions, investment earnings, and employer contributions.
Member ContributionsActive members pay a certain percentage of their pay toward their retirement benefit. While different classes of membership pay different rates, most members currently pay 6.25% of their pay. The percentage is set by statute and the rate does not change from year to year. Members’ contributions are
SERS Fund
Funding process
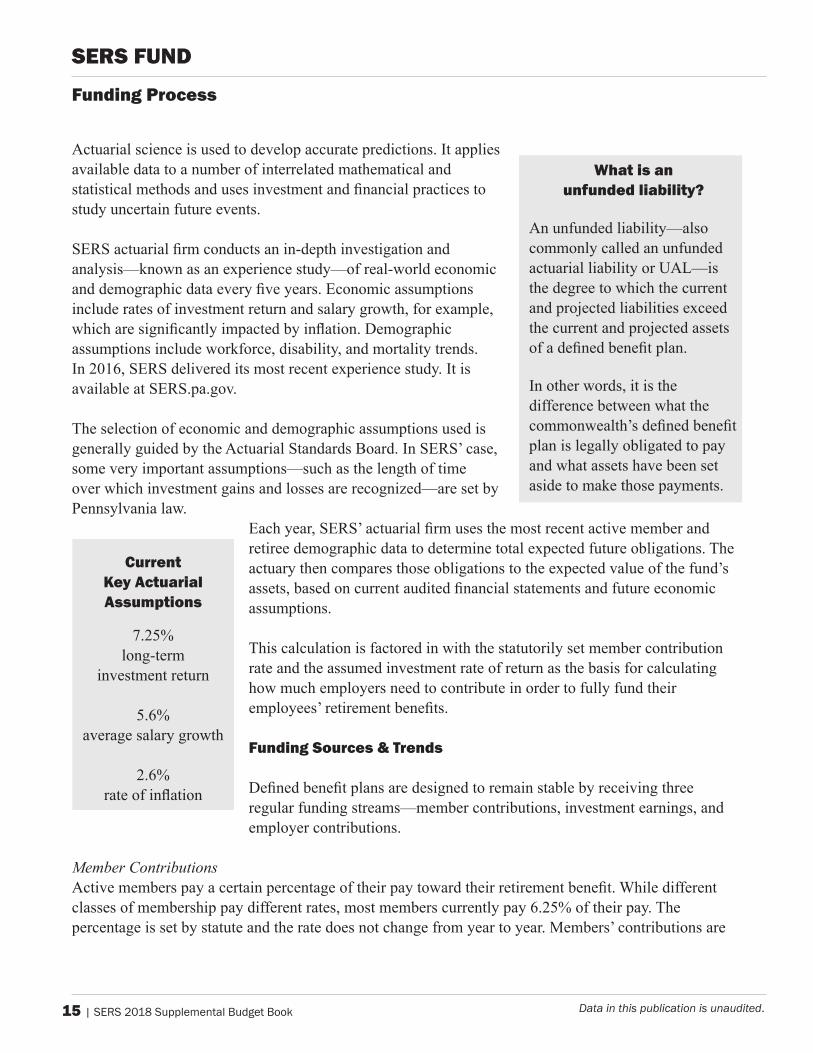
Current Key Actuarial assumptions
7.25%long-term
investment return
5.6%average salary growth
2.6%rate of inflation
What is an unfunded liability?
An unfunded liability—also commonly called an unfunded actuarial liability or UAL—is the degree to which the current and projected liabilities exceed the current and projected assets of a defined benefit plan.
In other words, it is the difference between what the commonwealth’s defined benefit plan is legally obligated to pay and what assets have been set aside to make those payments.
SERS 2018 Supplemental Budget Book | 16Data in this publication is unaudited.
SERS FundFunding process
withheld from their paychecks and sent directly from their employer to SERS. In 2017, member contributions to SERS totaled an estimated $383 million.
Courts have ruled that public retirement benefits may not be retroactively changed in any way that may be a “net detriment” to employees. “Net detriment” has been interpreted as a reduction in benefits already earned, and/or as an increase in member contributions required to maintain such benefits.
There are some instances, however, in which member contributions can increase. For example, Pennsylvania’s Act 2010-120 introduced a “risk sharing” provision whereby if there is a multi-year period of investment returns below the assumed rate and if employers have met their contribution obligations to the pension system, the contributions paid by those who entered SERS membership on or after January 1, 2011, could increase. The additional contribution cannot increase by more than 0.5% in any three-year period and 2% in total. To date, the shared risk provision has not been triggered. It will be reviewed again in 2020, considering investment performance for calendar years 2011 through 2019.
Investment EarningsSERS overall investment objective is to assure adequate fund reserves at the least cost to commonwealth citizens and to protect against the erosion of principal by inflation. SERS seeks to provide investment earnings that meet, or preferably exceed, the assumed rate of return over complete economic cycles. SERS strives to meet this objective by applying acceptable risk parameters and allocations to investments that are diversified by type, industry, quality, and geography.
Investment earnings can vary widely from year to year; the SERS Fund, for example, produced an approximate 25% return in 2003 and experienced more than a 28% loss in 2008’s worldwide downturn. For funding valuation purposes in order to minimize volatility, Pennsylvania law requires that the differences between actual performance and the assumed rate of return be recognized over a five-year period at a rate of 20% per year—a concept often referred to as “smoothing”.
SERS examines and sets its assumed rate of return each year based on global market dynamics, investment performance, and other considerations. For example, in 2009, SERS reduced its assumed rate of return from 8.5% to 8%, largely as a result of 2008’s global economic collapse.
As a result of SERS’ 90-plus years of operation and the trend of people living longer, the system now has more retired members than active members. In 2018, SERS is projected to pay out approximately $90 million more each month than it takes in through member and employer contributions.
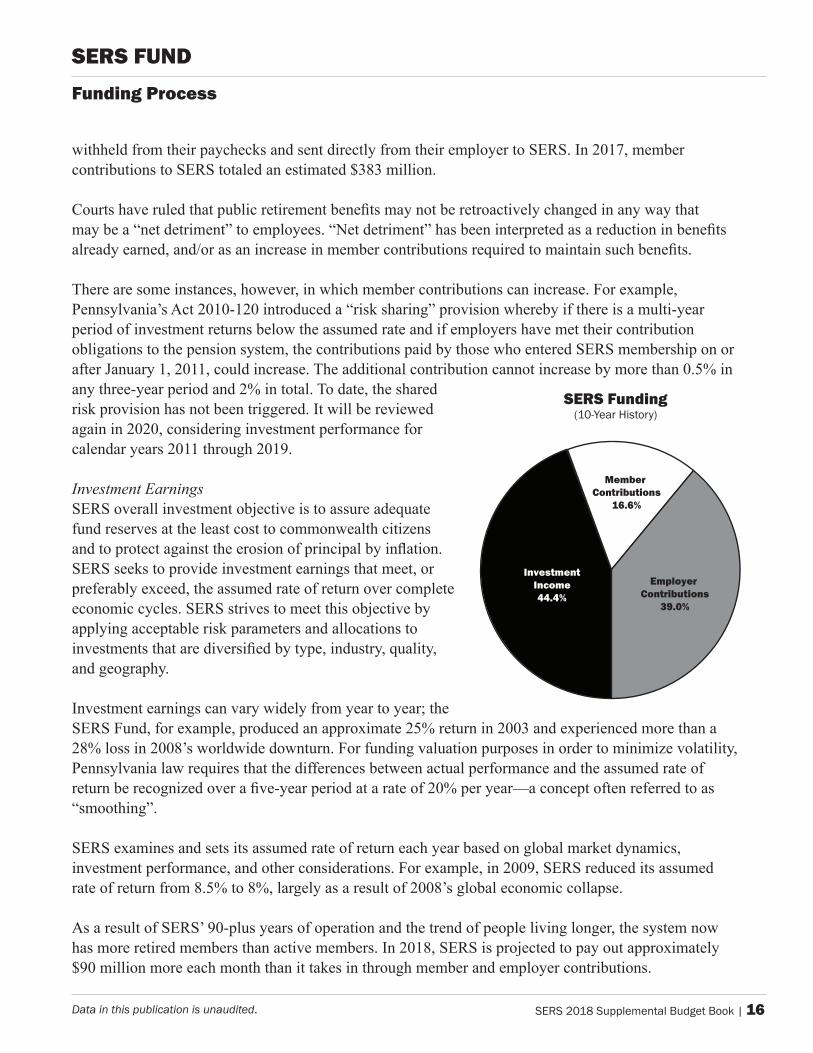
SERS Funding(10-Year History)
InvestmentIncome44.4%
Member Contributions
16.6%
Employer Contributions
39.0%
17 | SERS 2018 Supplemental Budget Book Data in this publication is unaudited.
SERS Fund
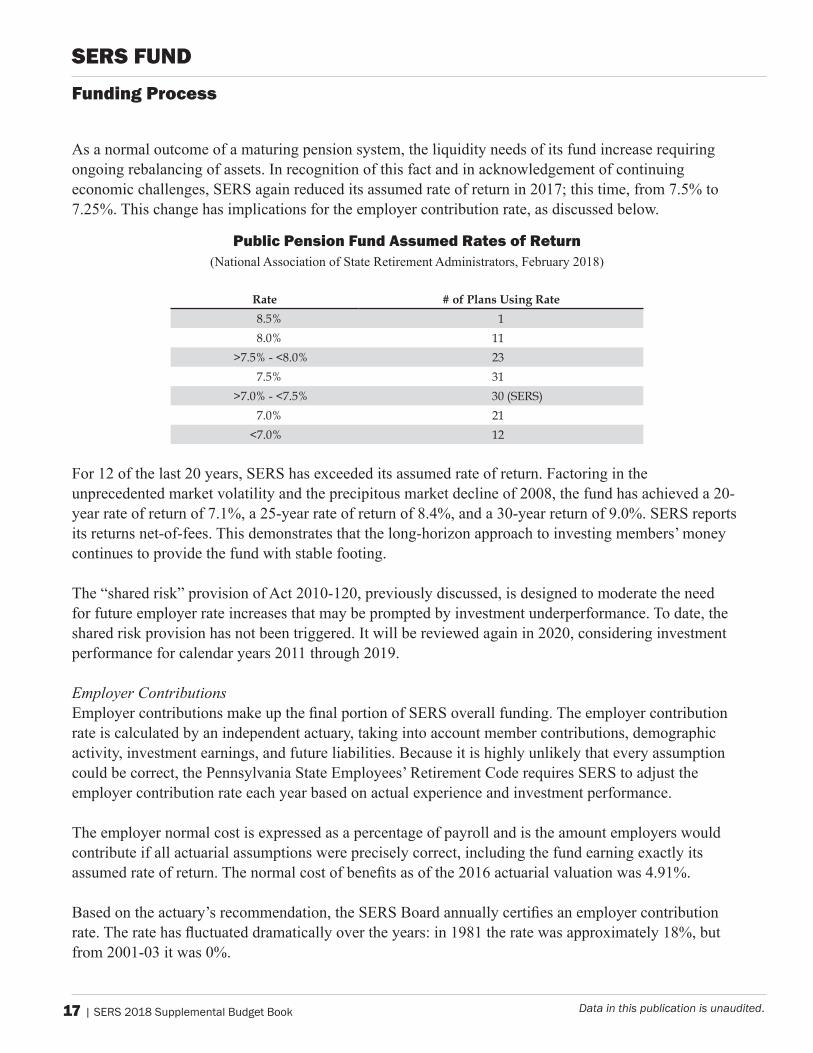
As a normal outcome of a maturing pension system, the liquidity needs of its fund increase requiring ongoing rebalancing of assets. In recognition of this fact and in acknowledgement of continuing economic challenges, SERS again reduced its assumed rate of return in 2017; this time, from 7.5% to 7.25%. This change has implications for the employer contribution rate, as discussed below.
For 12 of the last 20 years, SERS has exceeded its assumed rate of return. Factoring in the unprecedented market volatility and the precipitous market decline of 2008, the fund has achieved a 20-year rate of return of 7.1%, a 25-year rate of return of 8.4%, and a 30-year return of 9.0%. SERS reports its returns net-of-fees. This demonstrates that the long-horizon approach to investing members’ money continues to provide the fund with stable footing.
The “shared risk” provision of Act 2010-120, previously discussed, is designed to moderate the need for future employer rate increases that may be prompted by investment underperformance. To date, the shared risk provision has not been triggered. It will be reviewed again in 2020, considering investment performance for calendar years 2011 through 2019.
Employer ContributionsEmployer contributions make up the final portion of SERS overall funding. The employer contribution rate is calculated by an independent actuary, taking into account member contributions, demographic activity, investment earnings, and future liabilities. Because it is highly unlikely that every assumption could be correct, the Pennsylvania State Employees’ Retirement Code requires SERS to adjust the employer contribution rate each year based on actual experience and investment performance.
The employer normal cost is expressed as a percentage of payroll and is the amount employers would contribute if all actuarial assumptions were precisely correct, including the fund earning exactly its assumed rate of return. The normal cost of benefits as of the 2016 actuarial valuation was 4.91%.
Based on the actuary’s recommendation, the SERS Board annually certifies an employer contribution rate. The rate has fluctuated dramatically over the years: in 1981 the rate was approximately 18%, but from 2001-03 it was 0%.
public pension Fund assumed Rates of Return (National Association of State Retirement Administrators, February 2018)
Rate # of Plans Using Rate8.5% 18.0% 11
>7.5%-<8.0% 237.5% 31
>7.0%-<7.5% 30(SERS)7.0% 21<7.0% 12
Funding process
SERS 2018 Supplemental Budget Book | 18Data in this publication is unaudited.
SERS Fund
The total dollars contributed by employers has varied from year to year. In 1987, employer contributions totaled $366 million, in 2017 that figure was approximately $1.9 billion.
According to the Budget Office, SERS employers under the Governor’s jurisdiction paid less than half of the employers’ total—about 45%—from general funds. About 27% came from special funds; about 15% came from federal funds; and about 13% came from other sources.
The employer contribution rate has two parts: the cost of the benefit for new SERS members in the current year (as applied to all active members) and a contribution toward the unfunded liability. When SERS reduced its assumed rate of return from 7.5% to 7.25% in 2017, the change increased the unfunded liability by approximately $1 billion.
FY 2017-18 was the first year since legislatively-mandated contribution rates were enacted through Act 2010-120 that rate collars were no longer needed and the commonwealth paid the full actuarially required rate. The FY 2018-19 employer contribution is currently projected to drop to 32.3% of payroll. Of that contribution rate, approximately 4.9% will go to fund the benefits of new SERS members in the current year (normal cost) and approximately 27.4% will go to pay toward the unfunded liability.
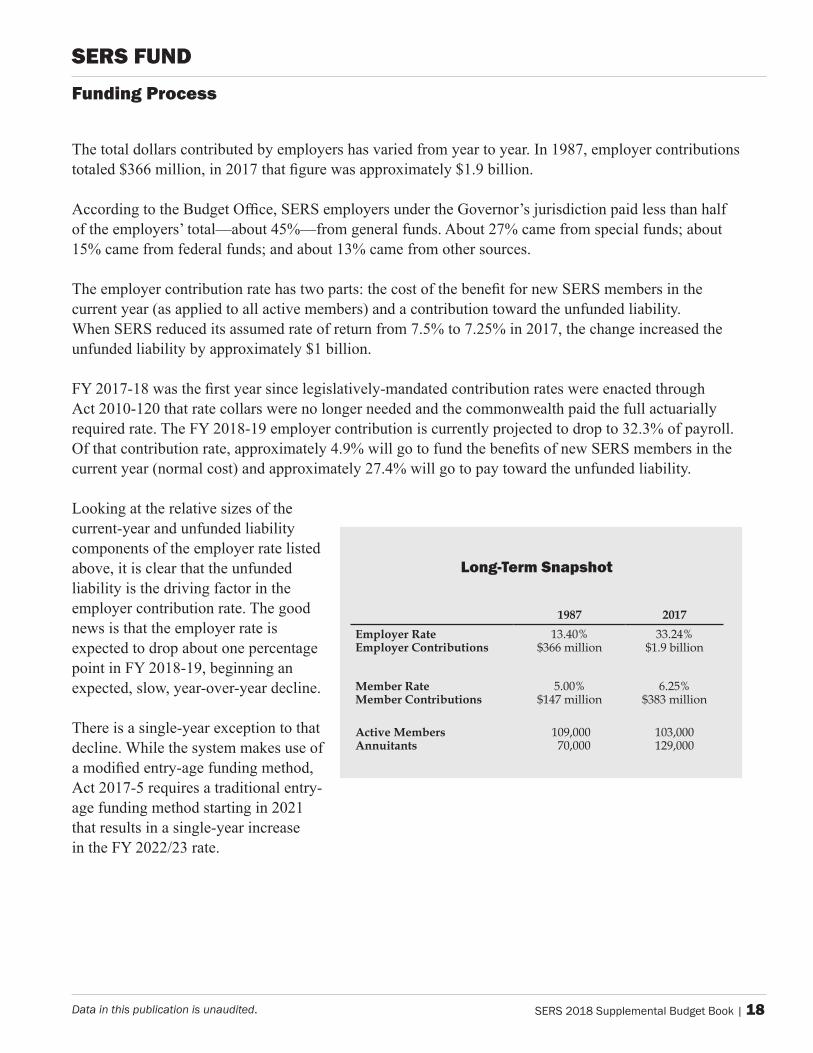
Looking at the relative sizes of the current-year and unfunded liability components of the employer rate listed above, it is clear that the unfunded liability is the driving factor in the employer contribution rate. The good news is that the employer rate is expected to drop about one percentage point in FY 2018-19, beginning an expected, slow, year-over-year decline.
There is a single-year exception to that decline. While the system makes use of a modified entry-age funding method, Act 2017-5 requires a traditional entry-age funding method starting in 2021 that results in a single-year increase in the FY 2022/23 rate.
long-term Snapshot
1987 2017Employer Rate Employer Contributions
13.40%$366million
33.24%$1.9billion
Member Rate Member Contributions
5.00%$147million
6.25%$383million
Active Members Annuitants
109,00070,000
103,000129,000
Funding process
19 | SERS 2018 Supplemental Budget Book Data in this publication is unaudited.
SERS Fund
CY Payout CY Funding Status FY Employer Contribution
ValuationYear Ended
Dec 31
Benefits &Expenses
($ billions)Funded
Ratio
UnfundedLiability
($ billions)FiscalYear
Expected FYPayroll
($ millions)
EmployerContribution
Rate
Expected FYContribution($ millions)
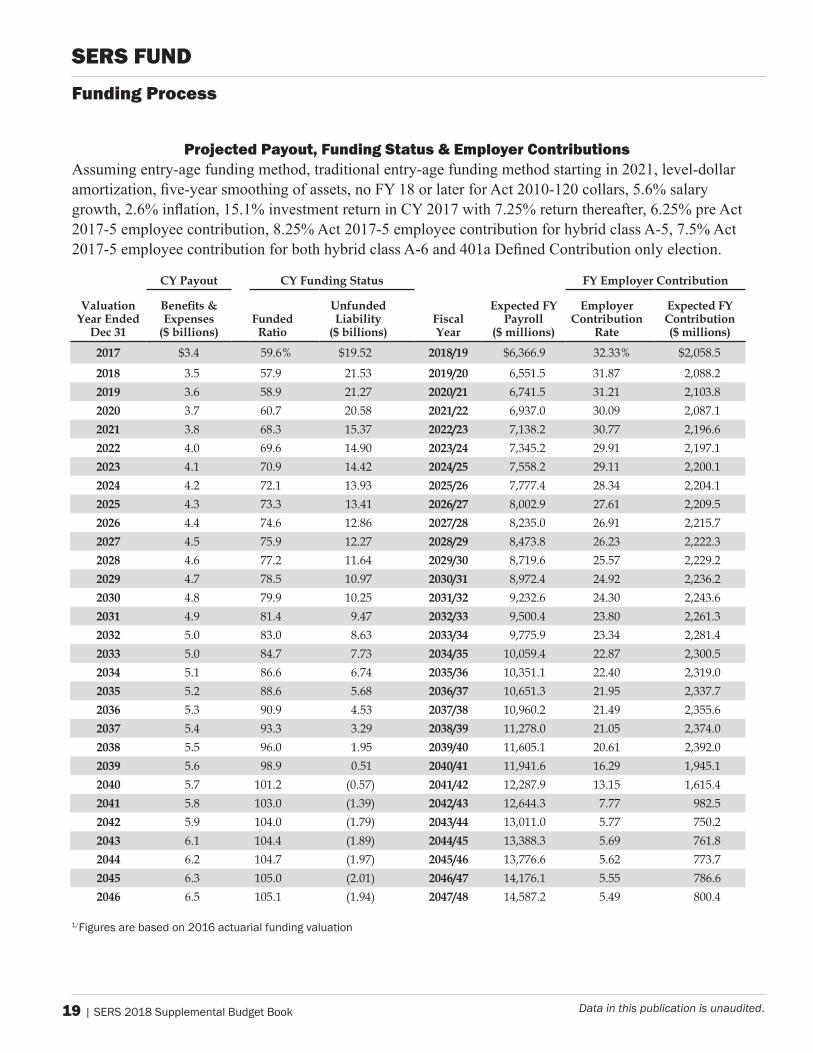
2017 $3.4 59.6% $19.52 2018/19 $6,366.9 32.33% $2,058.5
2018 3.5 57.9 21.53 2019/20 6,551.5 31.87 2,088.22019 3.6 58.9 21.27 2020/21 6,741.5 31.21 2,103.82020 3.7 60.7 20.58 2021/22 6,937.0 30.09 2,087.12021 3.8 68.3 15.37 2022/23 7,138.2 30.77 2,196.62022 4.0 69.6 14.90 2023/24 7,345.2 29.91 2,197.12023 4.1 70.9 14.42 2024/25 7,558.2 29.11 2,200.12024 4.2 72.1 13.93 2025/26 7,777.4 28.34 2,204.12025 4.3 73.3 13.41 2026/27 8,002.9 27.61 2,209.52026 4.4 74.6 12.86 2027/28 8,235.0 26.91 2,215.72027 4.5 75.9 12.27 2028/29 8,473.8 26.23 2,222.32028 4.6 77.2 11.64 2029/30 8,719.6 25.57 2,229.22029 4.7 78.5 10.97 2030/31 8,972.4 24.92 2,236.22030 4.8 79.9 10.25 2031/32 9,232.6 24.30 2,243.62031 4.9 81.4 9.47 2032/33 9,500.4 23.80 2,261.32032 5.0 83.0 8.63 2033/34 9,775.9 23.34 2,281.42033 5.0 84.7 7.73 2034/35 10,059.4 22.87 2,300.52034 5.1 86.6 6.74 2035/36 10,351.1 22.40 2,319.02035 5.2 88.6 5.68 2036/37 10,651.3 21.95 2,337.72036 5.3 90.9 4.53 2037/38 10,960.2 21.49 2,355.62037 5.4 93.3 3.29 2038/39 11,278.0 21.05 2,374.02038 5.5 96.0 1.95 2039/40 11,605.1 20.61 2,392.02039 5.6 98.9 0.51 2040/41 11,941.6 16.29 1,945.12040 5.7 101.2 (0.57) 2041/42 12,287.9 13.15 1,615.42041 5.8 103.0 (1.39) 2042/43 12,644.3 7.77 982.52042 5.9 104.0 (1.79) 2043/44 13,011.0 5.77 750.22043 6.1 104.4 (1.89) 2044/45 13,388.3 5.69 761.82044 6.2 104.7 (1.97) 2045/46 13,776.6 5.62 773.72045 6.3 105.0 (2.01) 2046/47 14,176.1 5.55 786.62046 6.5 105.1 (1.94) 2047/48 14,587.2 5.49 800.4
1/Figures are based on 2016 actuarial funding valuation
Projected Payout, Funding Status & Employer Contributions Assuming entry-age funding method, traditional entry-age funding method starting in 2021, level-dollar amortization, five-year smoothing of assets, no FY 18 or later for Act 2010-120 collars, 5.6% salary growth, 2.6% inflation, 15.1% investment return in CY 2017 with 7.25% return thereafter, 6.25% pre Act 2017-5 employee contribution, 8.25% Act 2017-5 employee contribution for hybrid class A-5, 7.5% Act 2017-5 employee contribution for both hybrid class A-6 and 401a Defined Contribution only election.
Funding process
SERS 2018 Supplemental Budget Book | 20Data in this publication is unaudited.
Restoring SERS Defined Benefit Plan Funding
While the unfunded liability of the system has grown slower than it otherwise would have as a result of the benefit changes in Act 2010-120 and is expected to continue a slower growth as a result of the additional benefit changes that will go into effect in 2019 as a result of Act 2017-5, it will take a couple of years to realize benefits from the lower costs in terms of a decrease in the unfunded liability and an increase in the funded ratio.
The SERS funded ratio will improve as those who entered SERS membership before January 2011 retire and post-January 2011 members continue to grow in number. In 2017, SERS retired 4,775 members and added 9,901 new members. Currently, more than 36% of SERS’ active members belong to the post Act 2010-120 classes of service.
Act 2010-120 projected savings of approximately $1.5 billion over 30 years by reducing the retirement benefit accrual rate, increasing the normal retirement age, eliminating the lump sum withdrawal option, extending the vesting period from five years to 10 years and including other provisions for those who entered SERS membership on or after January 1, 2011. One aspect of Act 2010-20 is that retirement provisions for legislators elected after December 1, 2010, were reduced and made consistent with those of most rank-and-file employees.
Even more impactful, Act 2010-120 also recognized the need for greater rates of employer funding and allowed employer contributions to increase over time. To ensure predictability and to moderate overall budget impacts, the General Assembly set measured intervals for increased employer contribution rates. The good news is that SERS employers have already reached the peak employer contribution rate this year and the rate begins an expected year-over-year decline in FY 2018/19.
Because the employer rate was below actual cost for a number of years, the unfunded liability is expected to grow for a few more years before it begins to decline. As the employer rate has increased, its impact on paying down the liability is dramatic. Such funding is among the most crucial components of the overall, long-term stability of the pension system.
Current Funded Position of SERS Defined Benefit Plan
The funded position of a defined benefit plan is measured by its funded ratio, which is the actuarially calculated value of assets divided by the actuarially calculated sum of retirement benefits earned by all existing SERS members—approximately 240,000 active, inactive, vested, and retired.
In general, a funding ratio of 80% or better is considered “healthy” for a pension system. Per a 2017 Wilshire report, Pennsylvania is among 74 out of 103 other state retirement systems that are currently below the 80% threshold. At the close of 2017, SERS’ estimated funded ratio was 59.6% (actuarial value) or 60.6% (market value).
SERS Fundactuarial Status
21 | SERS 2018 Supplemental Budget Book Data in this publication is unaudited.
SERS Fundactuarial Status
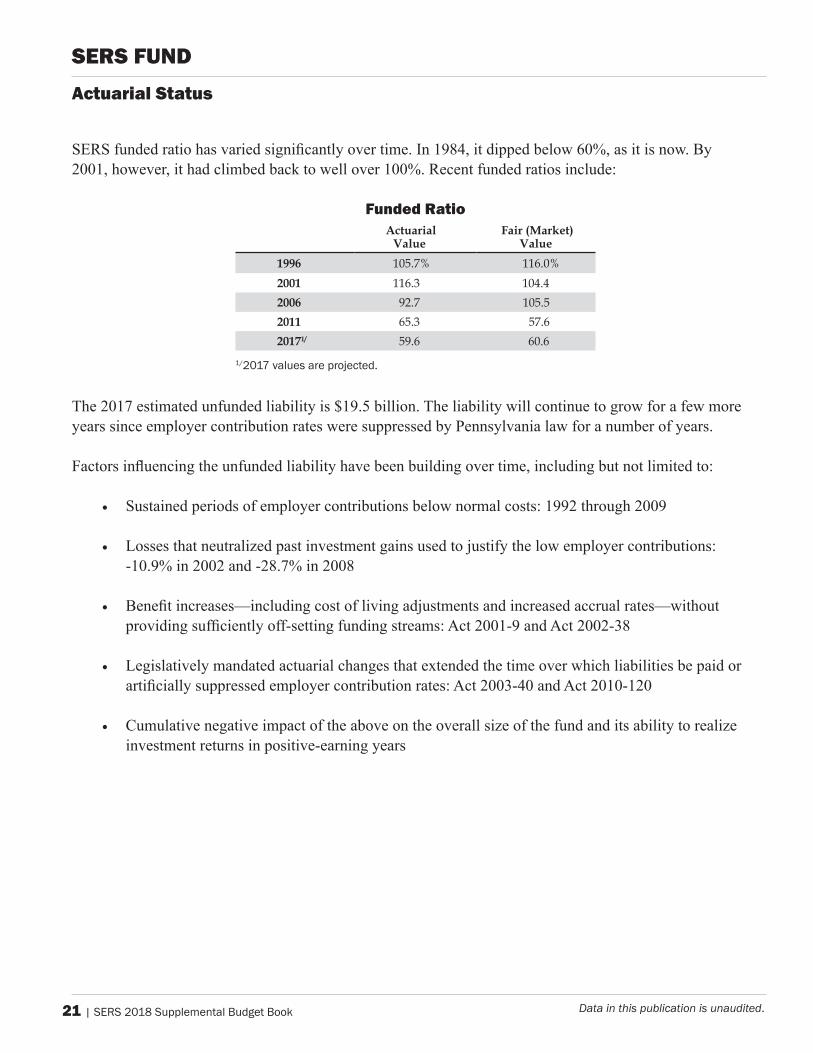
Funded Ratio Actuarial
Value Fair (Market)
Value 1996 105.7% 116.0%2001 116.3 104.42006 92.7 105.52011 65.3 57.620171/ 59.6 60.6
1/2017 values are projected.
SERS funded ratio has varied significantly over time. In 1984, it dipped below 60%, as it is now. By 2001, however, it had climbed back to well over 100%. Recent funded ratios include:
The 2017 estimated unfunded liability is $19.5 billion. The liability will continue to grow for a few more years since employer contribution rates were suppressed by Pennsylvania law for a number of years.
Factors influencing the unfunded liability have been building over time, including but not limited to:
• Sustained periods of employer contributions below normal costs: 1992 through 2009
• Losses that neutralized past investment gains used to justify the low employer contributions: -10.9% in 2002 and -28.7% in 2008
• Benefit increases—including cost of living adjustments and increased accrual rates—without providing sufficiently off-setting funding streams: Act 2001-9 and Act 2002-38
• Legislatively mandated actuarial changes that extended the time over which liabilities be paid or artificially suppressed employer contribution rates: Act 2003-40 and Act 2010-120
• Cumulative negative impact of the above on the overall size of the fund and its ability to realize investment returns in positive-earning years
SERS 2018 Supplemental Budget Book | 22Data in this publication is unaudited.
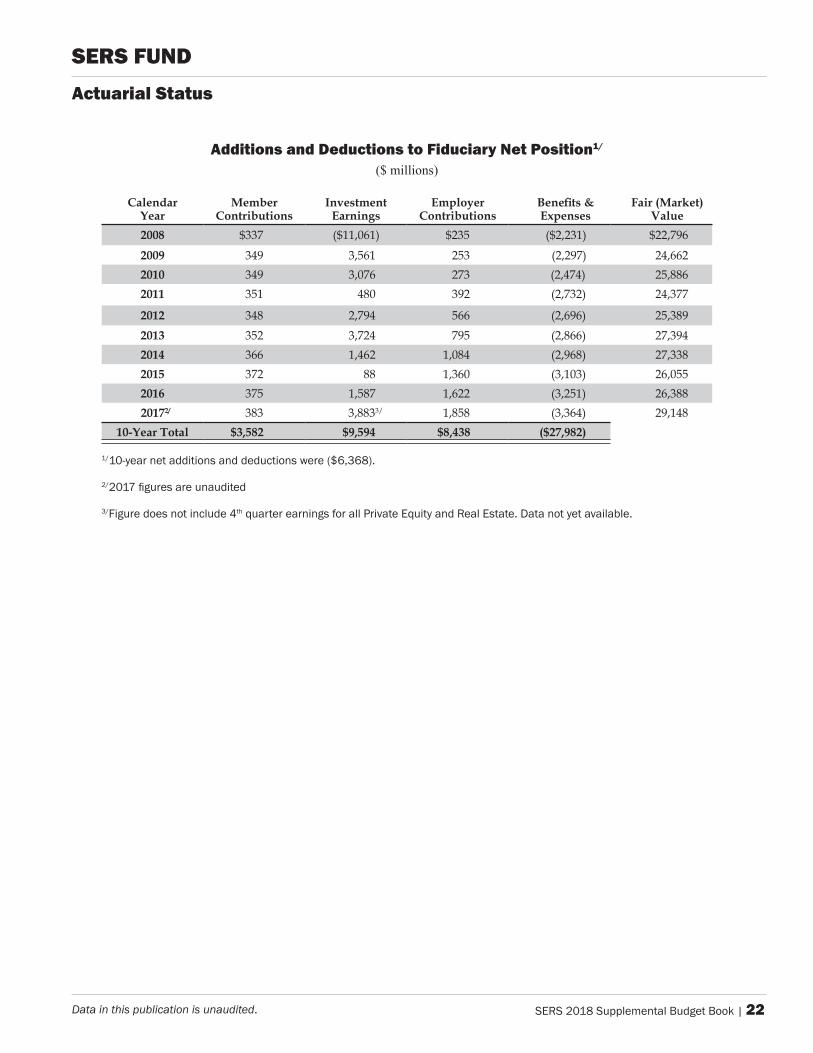
Additions and Deductions to Fiduciary Net Position1/ ($ millions)
Calendar Year
Member Contributions
Investment Earnings
Employer Contributions
Benefits & Expenses
Fair (Market) Value
2008 $337 ($11,061) $235 ($2,231) $22,796
2009 349 3,561 253 (2,297) 24,6622010 349 3,076 273 (2,474) 25,8862011 351 480 392 (2,732) 24,377
2012 348 2,794 566 (2,696) 25,3892013 352 3,724 795 (2,866) 27,3942014 366 1,462 1,084 (2,968) 27,3382015 372 88 1,360 (3,103) 26,0552016 375 1,587 1,622 (3,251) 26,38820172/ 383 3,8833/ 1,858 (3,364) 29,148
10-Year Total $3,582 $9,594 $8,438 ($27,982)
1/10-year net additions and deductions were ($6,368).
2/2017 figures are unaudited
3/Figure does not include 4th quarter earnings for all Private Equity and Real Estate. Data not yet available.
SERS Fundactuarial Status
SERS Fund
Overview
SERS 2018 Supplemental Budget Book | 23Data in this publication is unaudited.
investment program | Overview
Investment Policy
The SERS Board originally adopted a formal Statement of Investment Policy (policy) in 1979. It has been revised periodically to reflect and incorporate legislative changes governing investments and amendments to policies and procedures guiding the investment of the defined benefit portfolio. The policy was last amended in March 2017.
The purpose of the policy is to formalize the board’s investment objectives and policies, and to define the duties and responsibilities of the various individuals and entities involved in the investment process.
The major elements of the policy are:
• The assets of the SERS Fund will be managed with the primary objectives of the payment of benefit obligations to participants in the plans as well as to maximize return with acceptable risk considerations and sufficient liquidity so that employer contributions can be minimized.
• The SERS Fund’s overall investment objective is to provide a total rate of return, over full economic cycles, which achieves SERS long-term, actuarially assumed rate of return consistent with the board’s tolerance for risk.
• The board’s investment authority is governed by the prudent investor standard as set forth in Title 71, Pennsylvania Consolidated Statutes, Section 5931(a).
• The members of the board, employees of the board, and agents thereof shall stand in a fiduciary relationship to the members of the system regarding the investments and disbursements of any of the monies of the fund and shall not profit either directly or indirectly with respect thereto.
• The board employs an investment staff which is responsible to the board to review and analyze the current investment climate, and to recommend adjustments with respect to the policy that are appropriate to take optimum advantage of new conditions and strategies as they arise in the market place. The staff also reviews and analyzes the philosophies, policies, and strategies employed by the investment managers, evaluating the appropriateness of their decision–making processes and their investment styles in relation to present and projected investment horizons.
• The board continually seeks to employ investment managers that possess superior capabilities in the management of assets of public retirement systems. Each manager has full discretion to carry out its investment mandate subject to the investment strategy statement contained in the investment management agreement and will be expected to conduct business on behalf of SERS in accordance with the mandate for which they were retained.
SERS Fund
24 | SERS 2018 Supplemental Budget Book Data in this publication is unaudited.
• SERS will employ investment consultants, who act as fiduciaries to the fund, and who will provide investment consulting services in their respective areas of expertise.
• Where investment characteristics are equivalent, the policy will favor investments that will have a positive impact on the economy of the Commonwealth of Pennsylvania.
• SERS instituted an Emerging Investment Manager Program designed to identify and gain early access to talented investment managers in their early stages to generate above benchmark returns (net of fees).
investment Objectives
As indicated in SERS Statement of Investment Policy, the objectives of the SERS Fund are to provide benefit payments to participants and beneficiaries at the lowest cost to the commonwealth and to fund the program through a carefully planned and executed investment program.
Consistent with achieving these objectives, the board has established the following goals relative to investment performance:
• Achieve a net total return equivalent to the actuarial assumed rate of return, or preferably, in excess of this rate in order to improve the funded ratio of the SERS Fund through investment earnings and favorably impact future employer and employee contribution rates.
• Achieve a net, total long-term return that meets or exceeds an appropriate, composite plan benchmark index on a five- to 10-year rolling time horizon. The composite benchmark index will be based on the asset allocation set forth in the investment plan approved by the board.
investment program | Overview
SERS Fund
SERS 2018 Supplemental Budget Book | 25Data in this publication is unaudited.
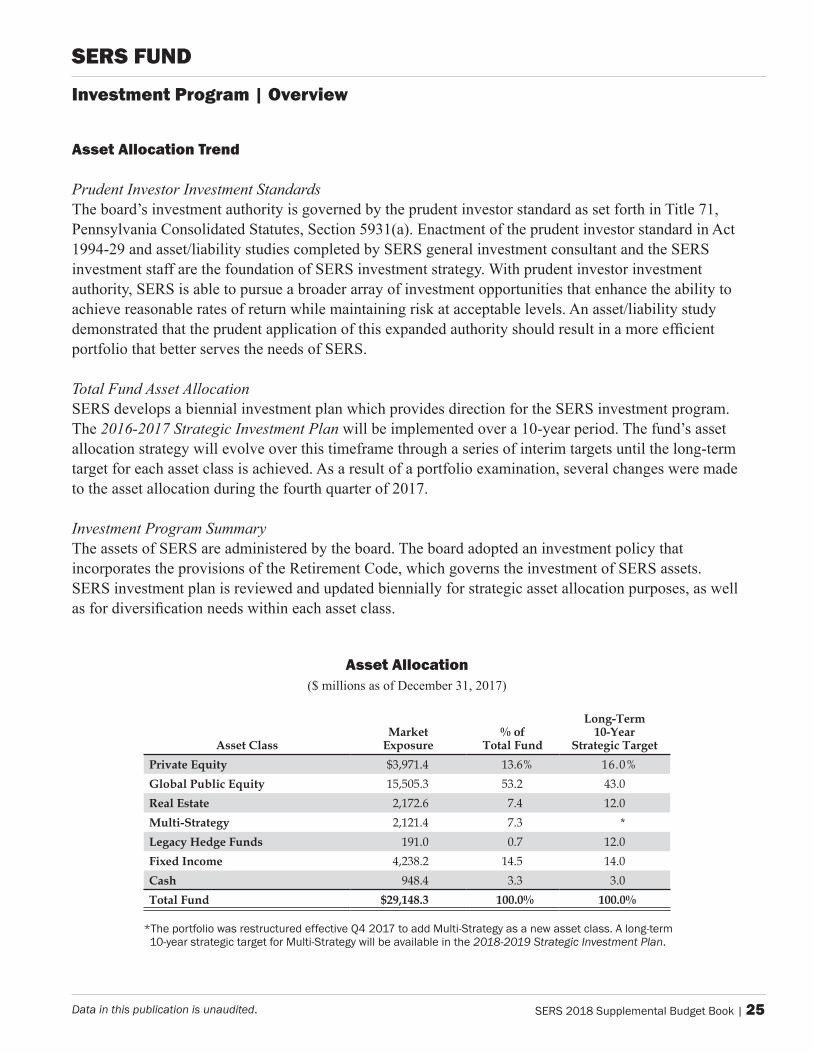
asset allocation trend
Prudent Investor Investment StandardsThe board’s investment authority is governed by the prudent investor standard as set forth in Title 71, Pennsylvania Consolidated Statutes, Section 5931(a). Enactment of the prudent investor standard in Act 1994-29 and asset/liability studies completed by SERS general investment consultant and the SERS investment staff are the foundation of SERS investment strategy. With prudent investor investment authority, SERS is able to pursue a broader array of investment opportunities that enhance the ability to achieve reasonable rates of return while maintaining risk at acceptable levels. An asset/liability study demonstrated that the prudent application of this expanded authority should result in a more efficient portfolio that better serves the needs of SERS.
Total Fund Asset AllocationSERS develops a biennial investment plan which provides direction for the SERS investment program. The 2016-2017 Strategic Investment Plan will be implemented over a 10-year period. The fund’s asset allocation strategy will evolve over this timeframe through a series of interim targets until the long-term target for each asset class is achieved. As a result of a portfolio examination, several changes were made to the asset allocation during the fourth quarter of 2017.
Investment Program SummaryThe assets of SERS are administered by the board. The board adopted an investment policy that incorporates the provisions of the Retirement Code, which governs the investment of SERS assets. SERS investment plan is reviewed and updated biennially for strategic asset allocation purposes, as well as for diversification needs within each asset class.
asset allocation ($ millions as of December 31, 2017)
Long-Term
10-YearStrategic TargetAsset Class
MarketExposure
% ofTotal Fund
Private Equity $3,971.4 13.6% 16.0%Global Public Equity 15,505.3 53.2 43.0Real Estate 2,172.6 7.4 12.0Multi-Strategy 2,121.4 7.3 *Legacy Hedge Funds 191.0 0.7 12.0Fixed Income 4,238.2 14.5 14.0Cash 948.4 3.3 3.0Total Fund $29,148.3 100.0% 100.0%
*The portfolio was restructured effective Q4 2017 to add Multi-Strategy as a new asset class. A long-term 10-year strategic target for Multi-Strategy will be available in the 2018-2019 Strategic Investment Plan.
investment program | Overview
SERS Fund
26 | SERS 2018 Supplemental Budget Book Data in this publication is unaudited.
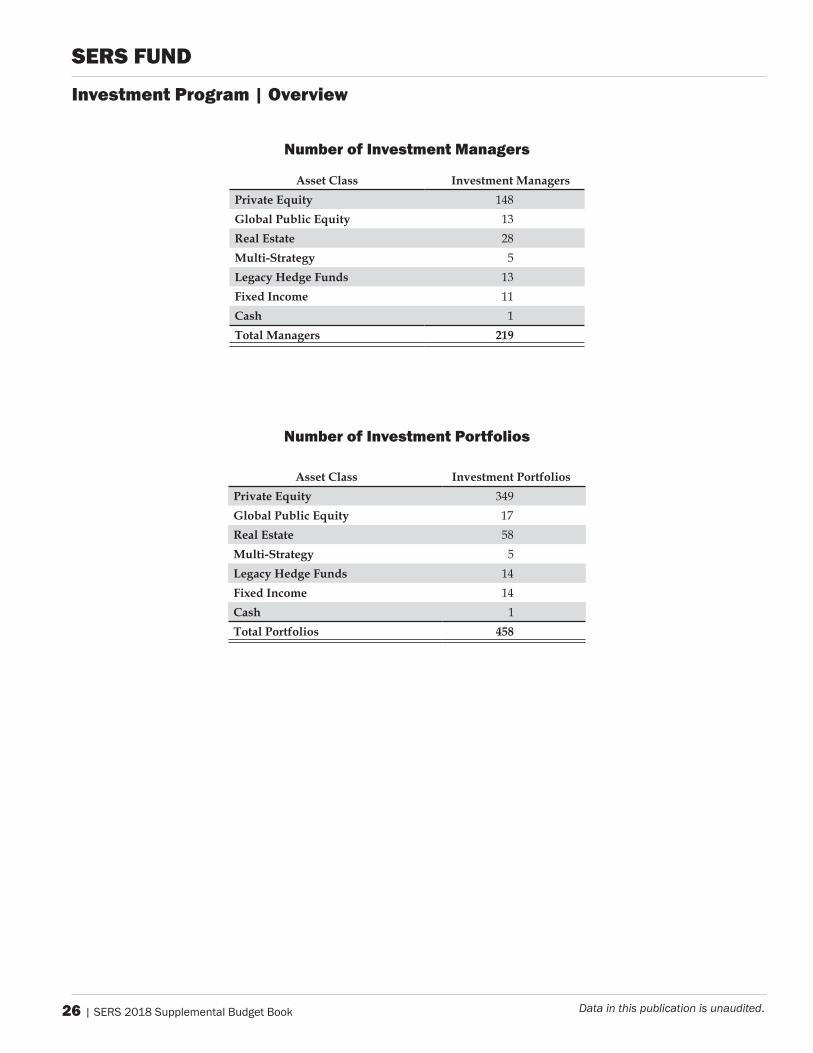
number of investment managers
Asset Class Investment ManagersPrivate Equity 148Global Public Equity 13Real Estate 28Multi-Strategy 5Legacy Hedge Funds 13Fixed Income 11Cash 1Total Managers 219
number of investment portfolios
Asset Class Investment PortfoliosPrivate Equity 349Global Public Equity 17Real Estate 58Multi-Strategy 5Legacy Hedge Funds 14Fixed Income 14Cash 1Total Portfolios 458
investment program | Overview
SERS Fund
SERS Fund
Performance
SERS 2018 Supplemental Budget Book | 27Data in this publication is unaudited.
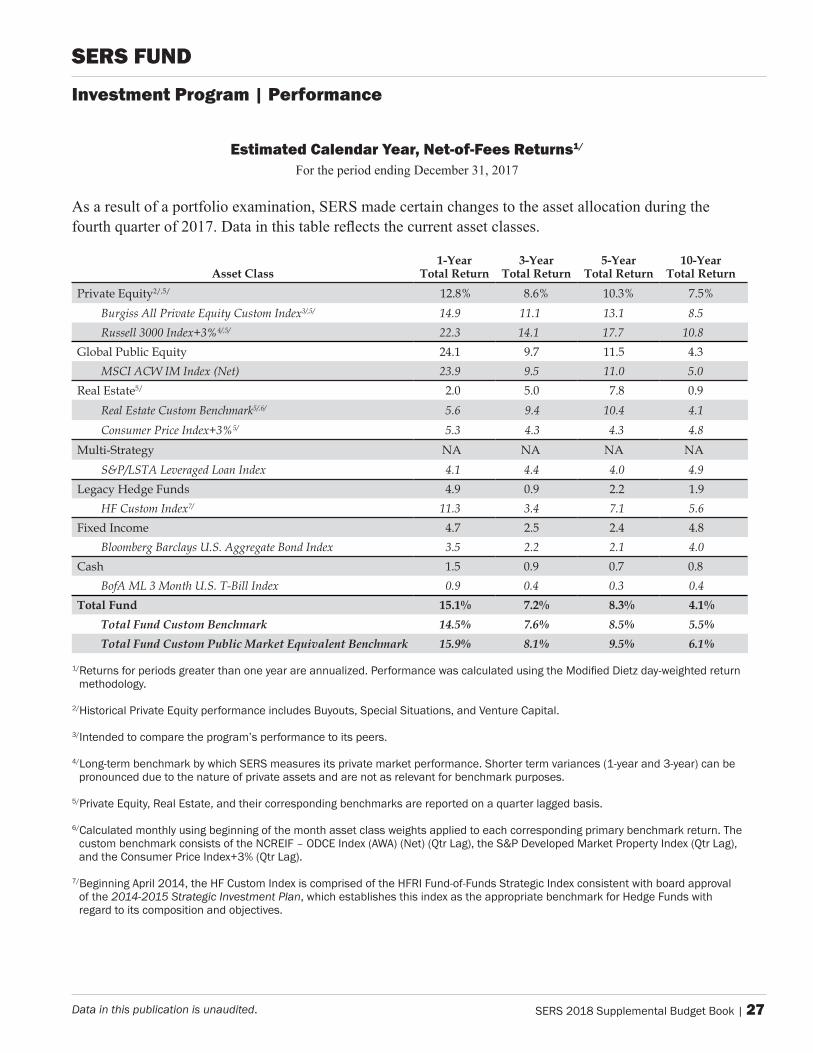
Estimated Calendar Year, net-of-Fees Returns1/ For the period ending December 31, 2017
As a result of a portfolio examination, SERS made certain changes to the asset allocation during the fourth quarter of 2017. Data in this table reflects the current asset classes.
Asset Class1-Year
Total Return3-Year
Total Return5-Year
Total Return10-Year
Total ReturnPrivateEquity2/,5/ 12.8% 8.6% 10.3% 7.5%
Burgiss All Private Equity Custom Index3/,5/ 14.9 11.1 13.1 8.5Russell 3000 Index+3%4/,5/ 22.3 14.1 17.7 10.8
GlobalPublicEquity 24.1 9.7 11.5 4.3MSCI ACW IM Index (Net) 23.9 9.5 11.0 5.0
RealEstate5/ 2.0 5.0 7.8 0.9Real Estate Custom Benchmark5/,6/ 5.6 9.4 10.4 4.1Consumer Price Index+3%5/ 5.3 4.3 4.3 4.8
Multi-Strategy NA NA NA NAS&P/LSTA Leveraged Loan Index 4.1 4.4 4.0 4.9
LegacyHedgeFunds 4.9 0.9 2.2 1.9HF Custom Index7/ 11.3 3.4 7.1 5.6
FixedIncome 4.7 2.5 2.4 4.8Bloomberg Barclays U.S. Aggregate Bond Index 3.5 2.2 2.1 4.0
Cash 1.5 0.9 0.7 0.8BofA ML 3 Month U.S. T-Bill Index 0.9 0.4 0.3 0.4
Total Fund 15.1% 7.2% 8.3% 4.1%Total Fund Custom Benchmark 14.5% 7.6% 8.5% 5.5%Total Fund Custom Public Market Equivalent Benchmark 15.9% 8.1% 9.5% 6.1%
1/Returns for periods greater than one year are annualized. Performance was calculated using the Modified Dietz day-weighted return methodology.
2/Historical Private Equity performance includes Buyouts, Special Situations, and Venture Capital.
3/Intended to compare the program’s performance to its peers.
4/Long-term benchmark by which SERS measures its private market performance. Shorter term variances (1-year and 3-year) can be pronounced due to the nature of private assets and are not as relevant for benchmark purposes.
5/Private Equity, Real Estate, and their corresponding benchmarks are reported on a quarter lagged basis.
6/Calculated monthly using beginning of the month asset class weights applied to each corresponding primary benchmark return. The custom benchmark consists of the NCREIF – ODCE Index (AWA) (Net) (Qtr Lag), the S&P Developed Market Property Index (Qtr Lag), and the Consumer Price Index+3% (Qtr Lag).
7/Beginning April 2014, the HF Custom Index is comprised of the HFRI Fund-of-Funds Strategic Index consistent with board approval of the 2014-2015 Strategic Investment Plan, which establishes this index as the appropriate benchmark for Hedge Funds with regard to its composition and objectives.
investment program | performance
SERS Fund
28 | SERS 2018 Supplemental Budget Book Data in this publication is unaudited.
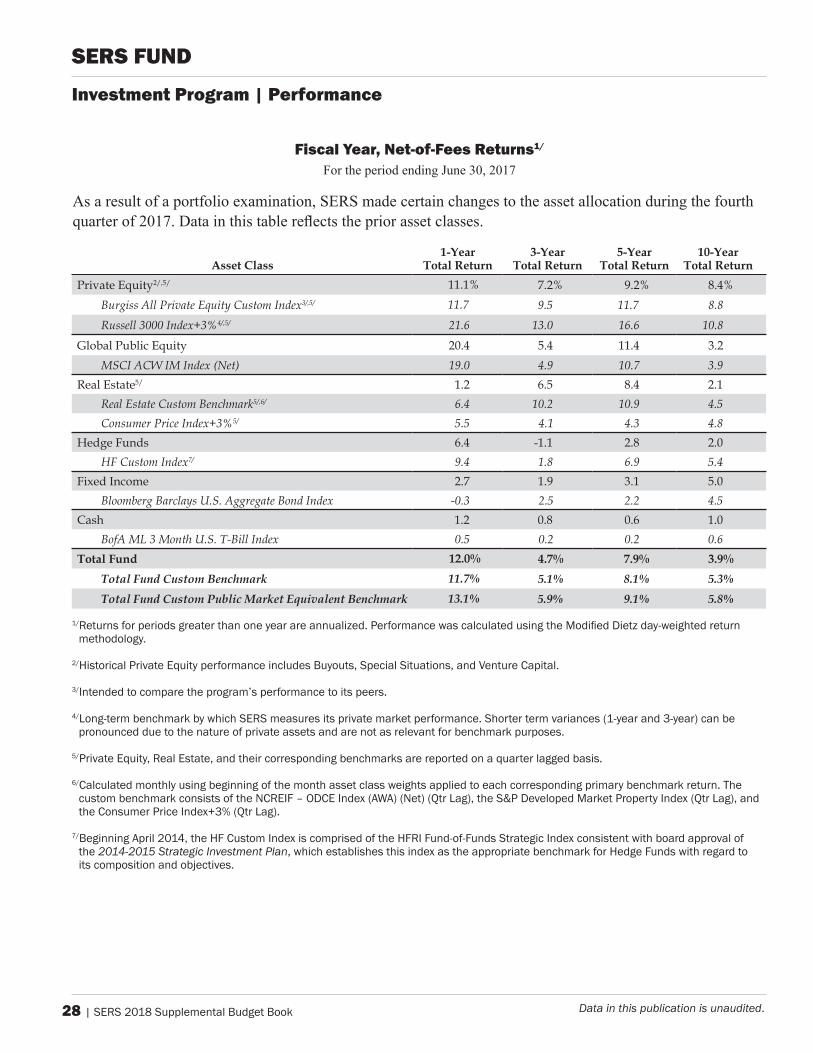
Fiscal Year, net-of-Fees Returns1/ For the period ending June 30, 2017
Asset Class1-Year
Total Return3-Year
Total Return5-Year
Total Return10-Year
Total ReturnPrivateEquity2/,5/ 11.1% 7.2% 9.2% 8.4%
Burgiss All Private Equity Custom Index3/,5/ 11.7 9.5 11.7 8.8Russell 3000 Index+3%4/,5/ 21.6 13.0 16.6 10.8
GlobalPublicEquity 20.4 5.4 11.4 3.2MSCI ACW IM Index (Net) 19.0 4.9 10.7 3.9
RealEstate5/ 1.2 6.5 8.4 2.1Real Estate Custom Benchmark5/,6/ 6.4 10.2 10.9 4.5Consumer Price Index+3%5/ 5.5 4.1 4.3 4.8
HedgeFunds 6.4 -1.1 2.8 2.0HF Custom Index7/ 9.4 1.8 6.9 5.4
FixedIncome 2.7 1.9 3.1 5.0Bloomberg Barclays U.S. Aggregate Bond Index -0.3 2.5 2.2 4.5
Cash 1.2 0.8 0.6 1.0BofA ML 3 Month U.S. T-Bill Index 0.5 0.2 0.2 0.6
Total Fund 12.0% 4.7% 7.9% 3.9%Total Fund Custom Benchmark 11.7% 5.1% 8.1% 5.3%Total Fund Custom Public Market Equivalent Benchmark 13.1% 5.9% 9.1% 5.8%
investment program | performance
SERS Fund
1/Returns for periods greater than one year are annualized. Performance was calculated using the Modified Dietz day-weighted return methodology.
2/Historical Private Equity performance includes Buyouts, Special Situations, and Venture Capital.
3/Intended to compare the program’s performance to its peers.
4/Long-term benchmark by which SERS measures its private market performance. Shorter term variances (1-year and 3-year) can be pronounced due to the nature of private assets and are not as relevant for benchmark purposes.
5/Private Equity, Real Estate, and their corresponding benchmarks are reported on a quarter lagged basis.
6/Calculated monthly using beginning of the month asset class weights applied to each corresponding primary benchmark return. The custom benchmark consists of the NCREIF – ODCE Index (AWA) (Net) (Qtr Lag), the S&P Developed Market Property Index (Qtr Lag), and the Consumer Price Index+3% (Qtr Lag).
7/Beginning April 2014, the HF Custom Index is comprised of the HFRI Fund-of-Funds Strategic Index consistent with board approval of the 2014-2015 Strategic Investment Plan, which establishes this index as the appropriate benchmark for Hedge Funds with regard to its composition and objectives.
As a result of a portfolio examination, SERS made certain changes to the asset allocation during the fourth quarter of 2017. Data in this table reflects the prior asset classes.
SERS 2018 Supplemental Budget Book | 29Data in this publication is unaudited.
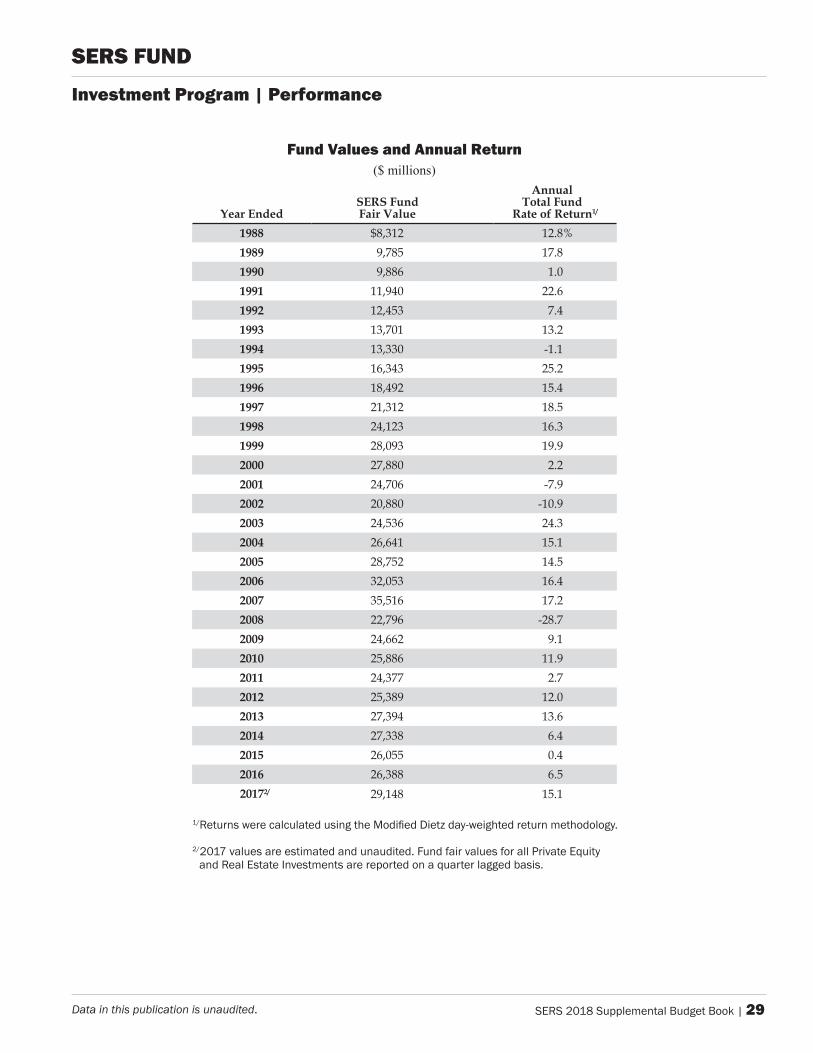
Fund Values and annual Return ($ millions)
Year EndedSERS Fund Fair Value
Annual Total Fund
Rate of Return1/
1988 $8,312 12.8%1989 9,785 17.81990 9,886 1.01991 11,940 22.61992 12,453 7.41993 13,701 13.21994 13,330 -1.11995 16,343 25.21996 18,492 15.41997 21,312 18.51998 24,123 16.31999 28,093 19.92000 27,880 2.22001 24,706 -7.92002 20,880 -10.92003 24,536 24.32004 26,641 15.12005 28,752 14.52006 32,053 16.42007 35,516 17.22008 22,796 -28.72009 24,662 9.12010 25,886 11.92011 24,377 2.72012 25,389 12.02013 27,394 13.62014 27,338 6.42015 26,055 0.42016 26,388 6.520172/ 29,148 15.1
1/Returns were calculated using the Modified Dietz day-weighted return methodology.
2/2017 values are estimated and unaudited. Fund fair values for all Private Equity and Real Estate Investments are reported on a quarter lagged basis.
investment program | performance
SERS Fund
SERS Fund
Expenses & Fees
SERS 2018 Supplemental Budget Book | 30Data in this publication is unaudited.
investment program | Expenses & Fees
SERS Fund
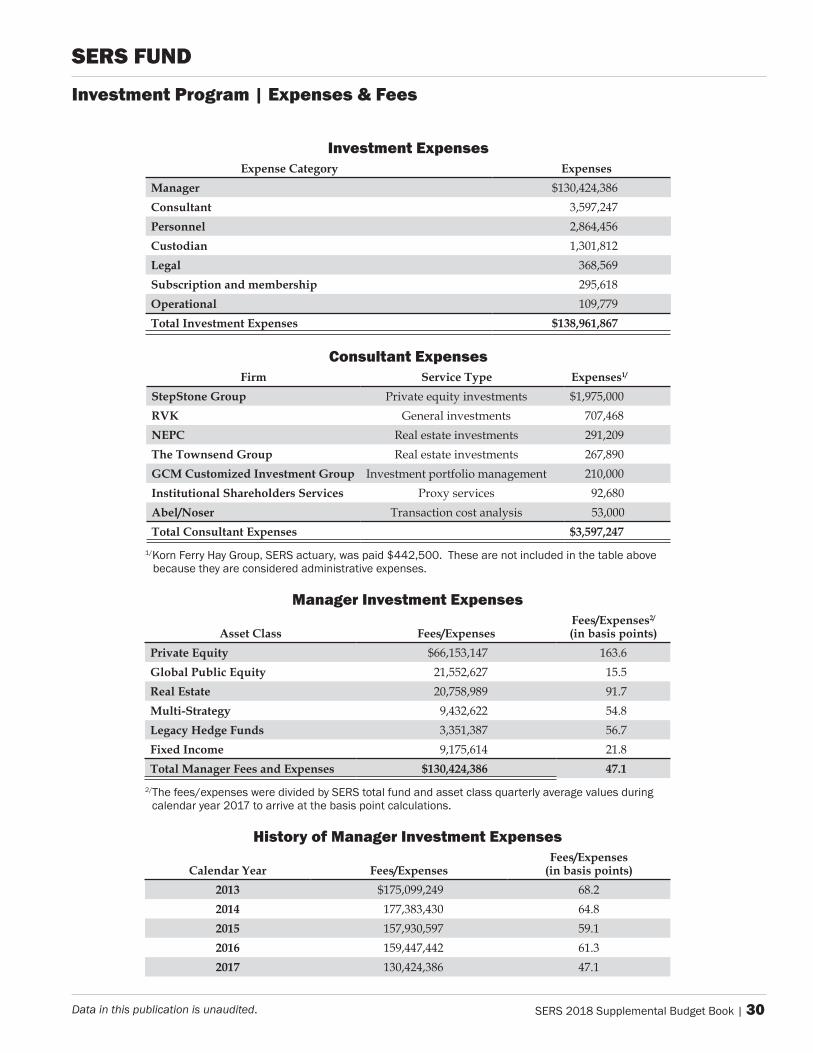
investment ExpensesExpense Category Expenses
Manager $130,424,386Consultant 3,597,247Personnel 2,864,456Custodian 1,301,812Legal 368,569Subscription and membership 295,618Operational 109,779Total Investment Expenses $138,961,867
Consultant ExpensesFirm Service Type Expenses1/
StepStone Group Privateequityinvestments $1,975,000RVK Generalinvestments 707,468NEPC Realestateinvestments 291,209The Townsend Group Realestateinvestments 267,890GCM Customized Investment Group Investmentportfoliomanagement 210,000Institutional Shareholders Services Proxyservices 92,680Abel/Noser Transactioncostanalysis 53,000Total Consultant Expenses $3,597,247
1/Korn Ferry Hay Group, SERS actuary, was paid $442,500. These are not included in the table above because they are considered administrative expenses.
manager investment Expenses
Asset Class Fees/ExpensesFees/Expenses2/ (in basis points)
Private Equity $66,153,147 163.6Global Public Equity 21,552,627 15.5Real Estate 20,758,989 91.7Multi-Strategy 9,432,622 54.8Legacy Hedge Funds 3,351,387 56.7Fixed Income 9,175,614 21.8Total Manager Fees and Expenses $130,424,386 47.1
2/The fees/expenses were divided by SERS total fund and asset class quarterly average values during calendar year 2017 to arrive at the basis point calculations.
History of Manager Investment Expenses
Calendar Year Fees/ExpensesFees/Expenses
(in basis points)2013 $175,099,249 68.22014 177,383,430 64.82015 157,930,597 59.12016 159,447,442 61.32017 130,424,386 47.1
31 | SERS 2018 Supplemental Budget Book Data in this publication is unaudited.
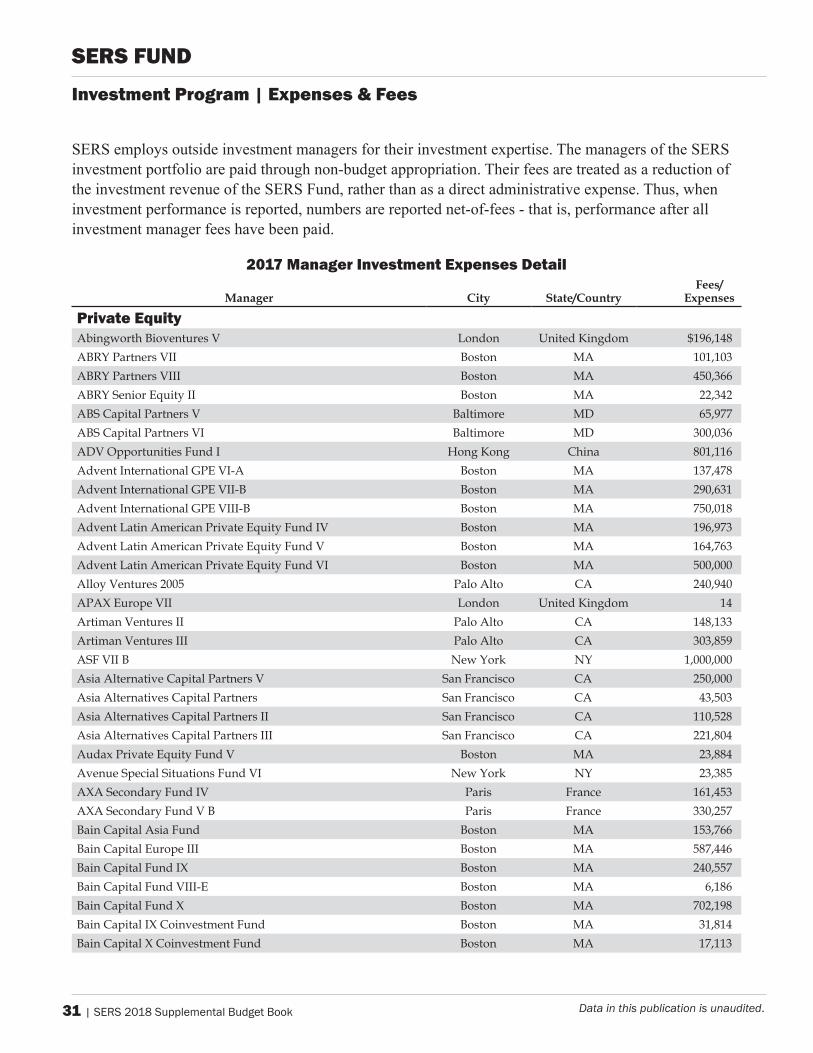
2017 manager investment Expenses detail
Manager City State/CountryFees/
Expenses
Private EquityAbingworthBioventuresV London UnitedKingdom $196,148ABRYPartnersVII Boston MA 101,103ABRYPartnersVIII Boston MA 450,366ABRYSeniorEquityII Boston MA 22,342ABSCapitalPartnersV Baltimore MD 65,977ABSCapitalPartnersVI Baltimore MD 300,036ADVOpportunitiesFundI HongKong China 801,116AdventInternationalGPEVI-A Boston MA 137,478AdventInternationalGPEVII-B Boston MA 290,631AdventInternationalGPEVIII-B Boston MA 750,018AdventLatinAmericanPrivateEquityFundIV Boston MA 196,973AdventLatinAmericanPrivateEquityFundV Boston MA 164,763AdventLatinAmericanPrivateEquityFundVI Boston MA 500,000AlloyVentures2005 PaloAlto CA 240,940APAXEuropeVII London UnitedKingdom 14ArtimanVenturesII PaloAlto CA 148,133ArtimanVenturesIII PaloAlto CA 303,859ASFVIIB NewYork NY 1,000,000AsiaAlternativeCapitalPartnersV SanFrancisco CA 250,000AsiaAlternativesCapitalPartners SanFrancisco CA 43,503AsiaAlternativesCapitalPartnersII SanFrancisco CA 110,528AsiaAlternativesCapitalPartnersIII SanFrancisco CA 221,804AudaxPrivateEquityFundV Boston MA 23,884AvenueSpecialSituationsFundVI NewYork NY 23,385AXASecondaryFundIV Paris France 161,453AXASecondaryFundVB Paris France 330,257BainCapitalAsiaFund Boston MA 153,766BainCapitalEuropeIII Boston MA 587,446BainCapitalFundIX Boston MA 240,557BainCapitalFundVIII-E Boston MA 6,186BainCapitalFundX Boston MA 702,198BainCapitalIXCoinvestmentFund Boston MA 31,814BainCapitalXCoinvestmentFund Boston MA 17,113
SERS employs outside investment managers for their investment expertise. The managers of the SERS investment portfolio are paid through non-budget appropriation. Their fees are treated as a reduction of the investment revenue of the SERS Fund, rather than as a direct administrative expense. Thus, when investment performance is reported, numbers are reported net-of-fees - that is, performance after all investment manager fees have been paid.
investment program | Expenses & Fees
SERS Fund
SERS 2018 Supplemental Budget Book | 32Data in this publication is unaudited.
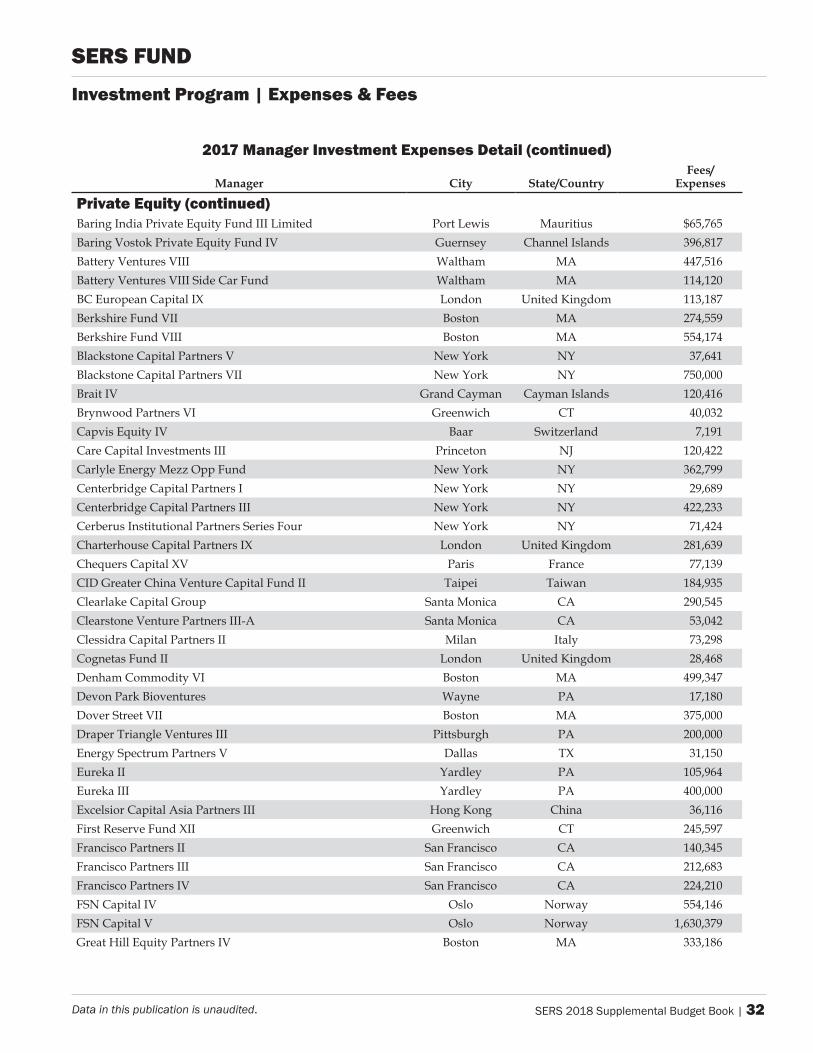
2017 Manager Investment Expenses Detail (continued)
Manager City State/CountryFees/
Expenses
Private Equity (continued)BaringIndiaPrivateEquityFundIIILimited PortLewis Mauritius $65,765BaringVostokPrivateEquityFundIV Guernsey ChannelIslands 396,817BatteryVenturesVIII Waltham MA 447,516BatteryVenturesVIIISideCarFund Waltham MA 114,120BCEuropeanCapitalIX London UnitedKingdom 113,187BerkshireFundVII Boston MA 274,559BerkshireFundVIII Boston MA 554,174BlackstoneCapitalPartnersV NewYork NY 37,641BlackstoneCapitalPartnersVII NewYork NY 750,000BraitIV GrandCayman CaymanIslands 120,416BrynwoodPartnersVI Greenwich CT 40,032CapvisEquityIV Baar Switzerland 7,191CareCapitalInvestmentsIII Princeton NJ 120,422CarlyleEnergyMezzOppFund NewYork NY 362,799CenterbridgeCapitalPartnersI NewYork NY 29,689CenterbridgeCapitalPartnersIII NewYork NY 422,233CerberusInstitutionalPartnersSeriesFour NewYork NY 71,424CharterhouseCapitalPartnersIX London UnitedKingdom 281,639ChequersCapitalXV Paris France 77,139CIDGreaterChinaVentureCapitalFundII Taipei Taiwan 184,935ClearlakeCapitalGroup SantaMonica CA 290,545ClearstoneVenturePartnersIII-A SantaMonica CA 53,042ClessidraCapitalPartnersII Milan Italy 73,298CognetasFundII London UnitedKingdom 28,468DenhamCommodityVI Boston MA 499,347DevonParkBioventures Wayne PA 17,180DoverStreetVII Boston MA 375,000DraperTriangleVenturesIII Pittsburgh PA 200,000EnergySpectrumPartnersV Dallas TX 31,150EurekaII Yardley PA 105,964EurekaIII Yardley PA 400,000ExcelsiorCapitalAsiaPartnersIII HongKong China 36,116FirstReserveFundXII Greenwich CT 245,597FranciscoPartnersII SanFrancisco CA 140,345FranciscoPartnersIII SanFrancisco CA 212,683FranciscoPartnersIV SanFrancisco CA 224,210FSNCapitalIV Oslo Norway 554,146FSNCapitalV Oslo Norway 1,630,379GreatHillEquityPartnersIV Boston MA 333,186
investment program | Expenses & Fees
SERS Fund
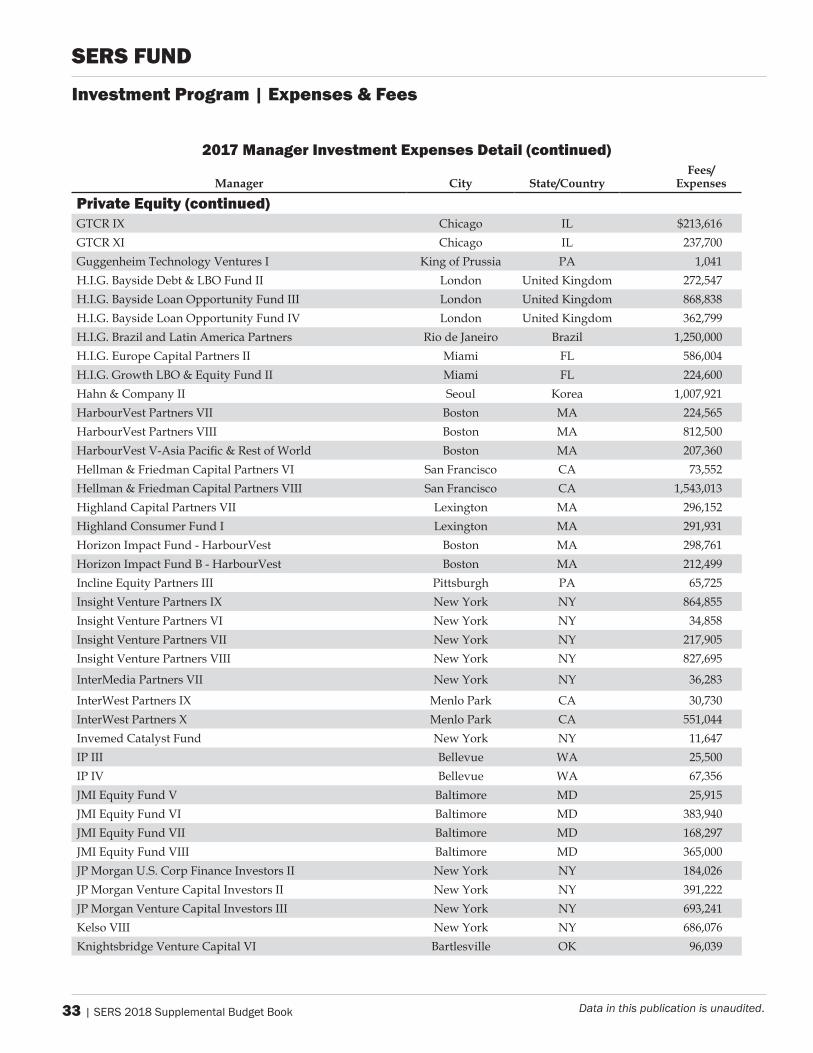
33 | SERS 2018 Supplemental Budget Book Data in this publication is unaudited.
2017 Manager Investment Expenses Detail (continued)
Manager City State/CountryFees/
Expenses
Private Equity (continued)GTCRIX Chicago IL $213,616GTCRXI Chicago IL 237,700GuggenheimTechnologyVenturesI KingofPrussia PA 1,041H.I.G.BaysideDebt&LBOFundII London UnitedKingdom 272,547H.I.G.BaysideLoanOpportunityFundIII London UnitedKingdom 868,838H.I.G.BaysideLoanOpportunityFundIV London UnitedKingdom 362,799H.I.G.BrazilandLatinAmericaPartners RiodeJaneiro Brazil 1,250,000H.I.G.EuropeCapitalPartnersII Miami FL 586,004H.I.G.GrowthLBO&EquityFundII Miami FL 224,600Hahn&CompanyII Seoul Korea 1,007,921HarbourVestPartnersVII Boston MA 224,565HarbourVestPartnersVIII Boston MA 812,500HarbourVestV-AsiaPacific&RestofWorld Boston MA 207,360Hellman&FriedmanCapitalPartnersVI SanFrancisco CA 73,552Hellman&FriedmanCapitalPartnersVIII SanFrancisco CA 1,543,013HighlandCapitalPartnersVII Lexington MA 296,152HighlandConsumerFundI Lexington MA 291,931HorizonImpactFund-HarbourVest Boston MA 298,761HorizonImpactFundB-HarbourVest Boston MA 212,499InclineEquityPartnersIII Pittsburgh PA 65,725InsightVenturePartnersIX NewYork NY 864,855InsightVenturePartnersVI NewYork NY 34,858InsightVenturePartnersVII NewYork NY 217,905InsightVenturePartnersVIII NewYork NY 827,695
InterMediaPartnersVII NewYork NY 36,283
InterWestPartnersIX MenloPark CA 30,730InterWestPartnersX MenloPark CA 551,044InvemedCatalystFund NewYork NY 11,647IPIII Bellevue WA 25,500IPIV Bellevue WA 67,356JMIEquityFundV Baltimore MD 25,915JMIEquityFundVI Baltimore MD 383,940JMIEquityFundVII Baltimore MD 168,297JMIEquityFundVIII Baltimore MD 365,000JPMorganU.S.CorpFinanceInvestorsII NewYork NY 184,026JPMorganVentureCapitalInvestorsII NewYork NY 391,222JPMorganVentureCapitalInvestorsIII NewYork NY 693,241KelsoVIII NewYork NY 686,076KnightsbridgeVentureCapitalVI Bartlesville OK 96,039
investment program | Expenses & Fees
SERS Fund
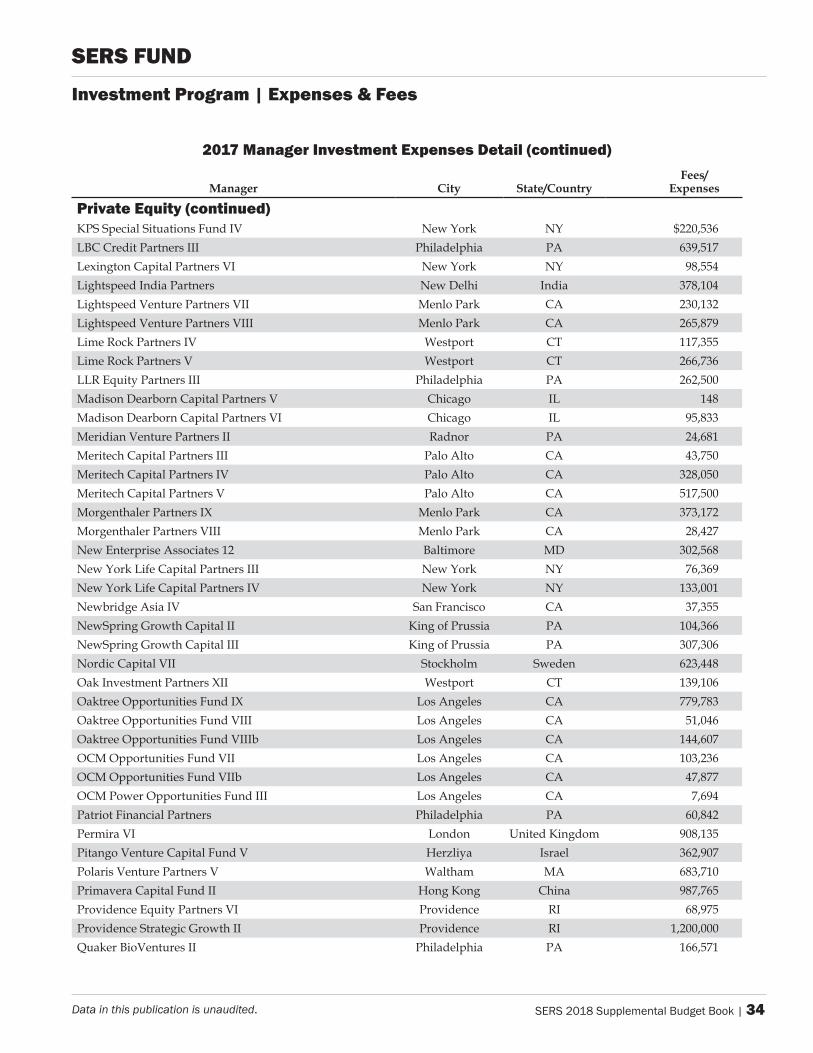
SERS 2018 Supplemental Budget Book | 34Data in this publication is unaudited.
2017 Manager Investment Expenses Detail (continued)
Manager City State/CountryFees/
Expenses
Private Equity (continued)KPSSpecialSituationsFundIV NewYork NY $220,536LBCCreditPartnersIII Philadelphia PA 639,517LexingtonCapitalPartnersVI NewYork NY 98,554LightspeedIndiaPartners NewDelhi India 378,104LightspeedVenturePartnersVII MenloPark CA 230,132LightspeedVenturePartnersVIII MenloPark CA 265,879LimeRockPartnersIV Westport CT 117,355LimeRockPartnersV Westport CT 266,736LLREquityPartnersIII Philadelphia PA 262,500MadisonDearbornCapitalPartnersV Chicago IL 148MadisonDearbornCapitalPartnersVI Chicago IL 95,833MeridianVenturePartnersII Radnor PA 24,681MeritechCapitalPartnersIII PaloAlto CA 43,750MeritechCapitalPartnersIV PaloAlto CA 328,050MeritechCapitalPartnersV PaloAlto CA 517,500MorgenthalerPartnersIX MenloPark CA 373,172MorgenthalerPartnersVIII MenloPark CA 28,427NewEnterpriseAssociates12 Baltimore MD 302,568NewYorkLifeCapitalPartnersIII NewYork NY 76,369NewYorkLifeCapitalPartnersIV NewYork NY 133,001NewbridgeAsiaIV SanFrancisco CA 37,355NewSpringGrowthCapitalII KingofPrussia PA 104,366NewSpringGrowthCapitalIII KingofPrussia PA 307,306NordicCapitalVII Stockholm Sweden 623,448OakInvestmentPartnersXII Westport CT 139,106OaktreeOpportunitiesFundIX LosAngeles CA 779,783OaktreeOpportunitiesFundVIII LosAngeles CA 51,046OaktreeOpportunitiesFundVIIIb LosAngeles CA 144,607OCMOpportunitiesFundVII LosAngeles CA 103,236OCMOpportunitiesFundVIIb LosAngeles CA 47,877OCMPowerOpportunitiesFundIII LosAngeles CA 7,694PatriotFinancialPartners Philadelphia PA 60,842PermiraVI London UnitedKingdom 908,135PitangoVentureCapitalFundV Herzliya Israel 362,907PolarisVenturePartnersV Waltham MA 683,710PrimaveraCapitalFundII HongKong China 987,765ProvidenceEquityPartnersVI Providence RI 68,975ProvidenceStrategicGrowthII Providence RI 1,200,000QuakerBioVenturesII Philadelphia PA 166,571
investment program | Expenses & Fees
SERS Fund
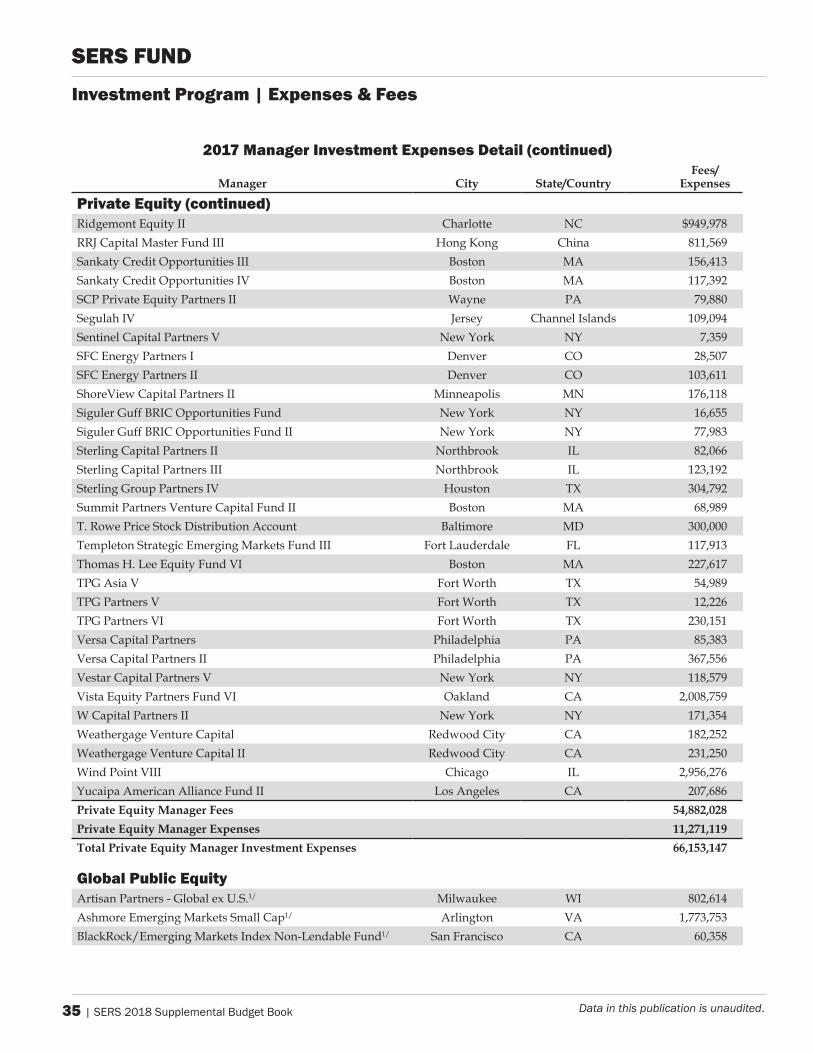
35 | SERS 2018 Supplemental Budget Book Data in this publication is unaudited.
2017 Manager Investment Expenses Detail (continued)
Manager City State/CountryFees/
Expenses
Private Equity (continued)RidgemontEquityII Charlotte NC $949,978RRJCapitalMasterFundIII HongKong China 811,569SankatyCreditOpportunitiesIII Boston MA 156,413SankatyCreditOpportunitiesIV Boston MA 117,392SCPPrivateEquityPartnersII Wayne PA 79,880SegulahIV Jersey ChannelIslands 109,094SentinelCapitalPartnersV NewYork NY 7,359SFCEnergyPartnersI Denver CO 28,507SFCEnergyPartnersII Denver CO 103,611ShoreViewCapitalPartnersII Minneapolis MN 176,118SigulerGuffBRICOpportunitiesFund NewYork NY 16,655SigulerGuffBRICOpportunitiesFundII NewYork NY 77,983SterlingCapitalPartnersII Northbrook IL 82,066SterlingCapitalPartnersIII Northbrook IL 123,192SterlingGroupPartnersIV Houston TX 304,792SummitPartnersVentureCapitalFundII Boston MA 68,989T.RowePriceStockDistributionAccount Baltimore MD 300,000TempletonStrategicEmergingMarketsFundIII FortLauderdale FL 117,913ThomasH.LeeEquityFundVI Boston MA 227,617TPGAsiaV FortWorth TX 54,989TPGPartnersV FortWorth TX 12,226TPGPartnersVI FortWorth TX 230,151VersaCapitalPartners Philadelphia PA 85,383VersaCapitalPartnersII Philadelphia PA 367,556VestarCapitalPartnersV NewYork NY 118,579VistaEquityPartnersFundVI Oakland CA 2,008,759WCapitalPartnersII NewYork NY 171,354WeathergageVentureCapital RedwoodCity CA 182,252WeathergageVentureCapitalII RedwoodCity CA 231,250WindPointVIII Chicago IL 2,956,276YucaipaAmericanAllianceFundII LosAngeles CA 207,686Private Equity Manager Fees 54,882,028 Private Equity Manager Expenses 11,271,119 Total Private Equity Manager Investment Expenses 66,153,147
Global Public EquityArtisanPartners-GlobalexU.S.1/ Milwaukee WI 802,614AshmoreEmergingMarketsSmallCap1/ Arlington VA 1,773,753BlackRock/EmergingMarketsIndexNon-LendableFund1/ SanFrancisco CA 60,358
investment program | Expenses & Fees
SERS Fund
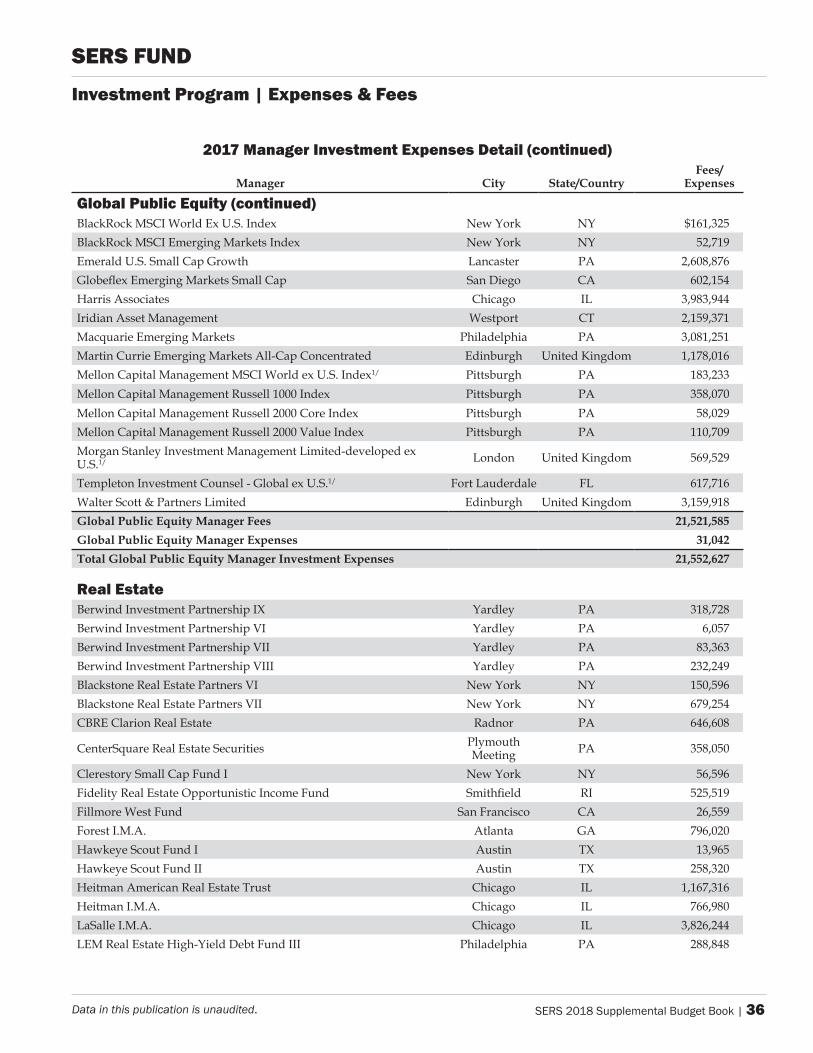
SERS 2018 Supplemental Budget Book | 36Data in this publication is unaudited.
2017 Manager Investment Expenses Detail (continued)
Manager City State/CountryFees/
Expenses
Global Public Equity (continued)BlackRockMSCIWorldExU.S.Index NewYork NY $161,325BlackRockMSCIEmergingMarketsIndex NewYork NY 52,719EmeraldU.S.SmallCapGrowth Lancaster PA 2,608,876GlobeflexEmergingMarketsSmallCap SanDiego CA 602,154HarrisAssociates Chicago IL 3,983,944IridianAssetManagement Westport CT 2,159,371MacquarieEmergingMarkets Philadelphia PA 3,081,251MartinCurrieEmergingMarketsAll-CapConcentrated Edinburgh UnitedKingdom 1,178,016MellonCapitalManagementMSCIWorldexU.S.Index1/ Pittsburgh PA 183,233MellonCapitalManagementRussell1000Index Pittsburgh PA 358,070MellonCapitalManagementRussell2000CoreIndex Pittsburgh PA 58,029MellonCapitalManagementRussell2000ValueIndex Pittsburgh PA 110,709MorganStanleyInvestmentManagementLimited-developedexU.S.1/ London UnitedKingdom 569,529
TempletonInvestmentCounsel-GlobalexU.S.1/ FortLauderdale FL 617,716WalterScott&PartnersLimited Edinburgh UnitedKingdom 3,159,918Global Public Equity Manager Fees 21,521,585 Global Public Equity Manager Expenses 31,042 Total Global Public Equity Manager Investment Expenses 21,552,627
Real EstateBerwindInvestmentPartnershipIX Yardley PA 318,728BerwindInvestmentPartnershipVI Yardley PA 6,057BerwindInvestmentPartnershipVII Yardley PA 83,363BerwindInvestmentPartnershipVIII Yardley PA 232,249BlackstoneRealEstatePartnersVI NewYork NY 150,596BlackstoneRealEstatePartnersVII NewYork NY 679,254CBREClarionRealEstate Radnor PA 646,608
CenterSquareRealEstateSecurities PlymouthMeeting PA 358,050
ClerestorySmallCapFundI NewYork NY 56,596FidelityRealEstateOpportunisticIncomeFund Smithfield RI 525,519FillmoreWestFund SanFrancisco CA 26,559ForestI.M.A. Atlanta GA 796,020HawkeyeScoutFundI Austin TX 13,965HawkeyeScoutFundII Austin TX 258,320HeitmanAmericanRealEstateTrust Chicago IL 1,167,316HeitmanI.M.A. Chicago IL 766,980LaSalleI.M.A. Chicago IL 3,826,244LEMRealEstateHigh-YieldDebtFundIII Philadelphia PA 288,848
investment program | Expenses & Fees
SERS Fund
37 | SERS 2018 Supplemental Budget Book Data in this publication is unaudited.
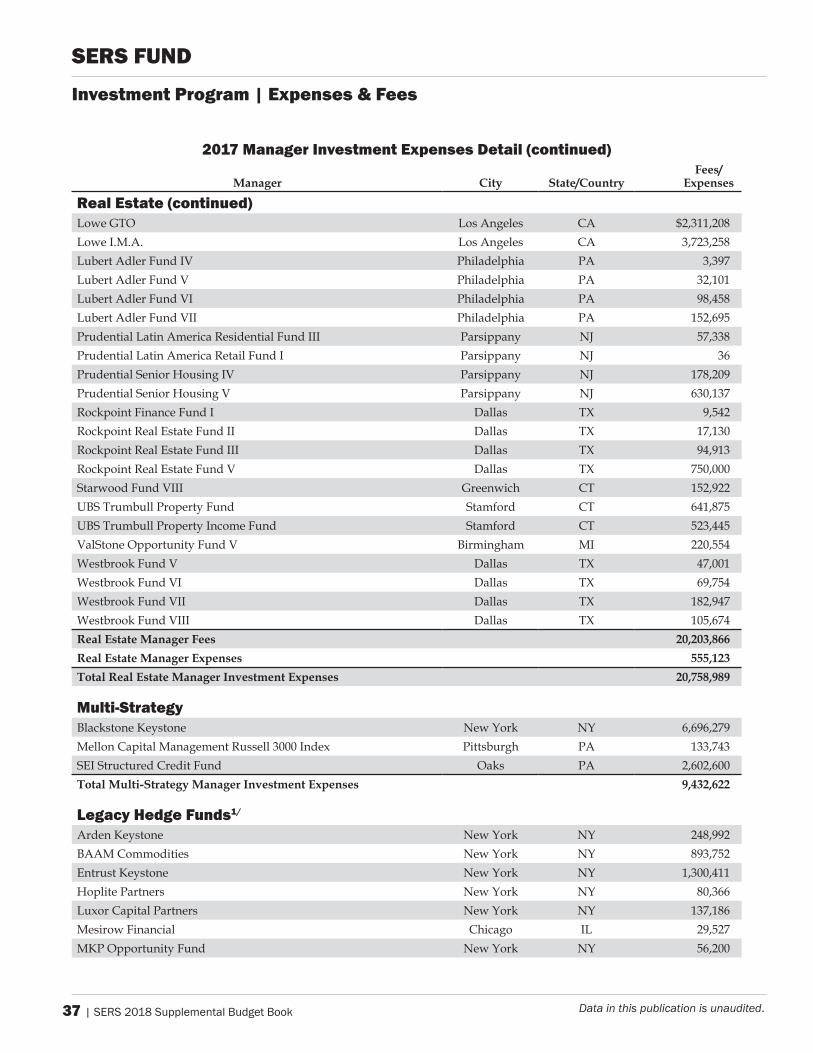
2017 Manager Investment Expenses Detail (continued)
Manager City State/CountryFees/
Expenses
Real Estate (continued)LoweGTO LosAngeles CA $2,311,208LoweI.M.A. LosAngeles CA 3,723,258LubertAdlerFundIV Philadelphia PA 3,397LubertAdlerFundV Philadelphia PA 32,101LubertAdlerFundVI Philadelphia PA 98,458LubertAdlerFundVII Philadelphia PA 152,695PrudentialLatinAmericaResidentialFundIII Parsippany NJ 57,338PrudentialLatinAmericaRetailFundI Parsippany NJ 36PrudentialSeniorHousingIV Parsippany NJ 178,209PrudentialSeniorHousingV Parsippany NJ 630,137RockpointFinanceFundI Dallas TX 9,542RockpointRealEstateFundII Dallas TX 17,130RockpointRealEstateFundIII Dallas TX 94,913RockpointRealEstateFundV Dallas TX 750,000StarwoodFundVIII Greenwich CT 152,922UBSTrumbullPropertyFund Stamford CT 641,875UBSTrumbullPropertyIncomeFund Stamford CT 523,445ValStoneOpportunityFundV Birmingham MI 220,554WestbrookFundV Dallas TX 47,001WestbrookFundVI Dallas TX 69,754WestbrookFundVII Dallas TX 182,947WestbrookFundVIII Dallas TX 105,674Real Estate Manager Fees 20,203,866 Real Estate Manager Expenses 555,123 Total Real Estate Manager Investment Expenses 20,758,989
Multi-StrategyBlackstoneKeystone NewYork NY 6,696,279MellonCapitalManagementRussell3000Index Pittsburgh PA 133,743SEIStructuredCreditFund Oaks PA 2,602,600Total Multi-Strategy Manager Investment Expenses 9,432,622
Legacy Hedge Funds1/
ArdenKeystone NewYork NY 248,992BAAMCommodities NewYork NY 893,752EntrustKeystone NewYork NY 1,300,411HoplitePartners NewYork NY 80,366LuxorCapitalPartners NewYork NY 137,186MesirowFinancial Chicago IL 29,527MKPOpportunityFund NewYork NY 56,200
investment program | Expenses & Fees
SERS Fund
SERS 2018 Supplemental Budget Book | 38Data in this publication is unaudited.
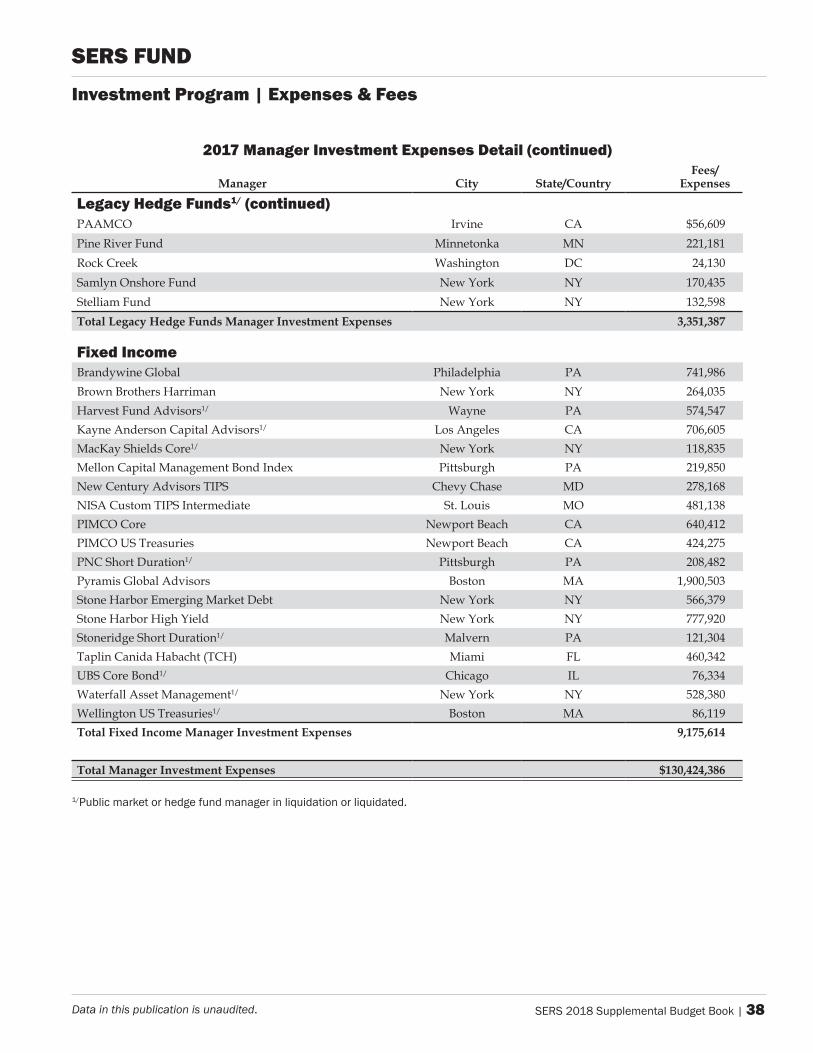
2017 Manager Investment Expenses Detail (continued)
Manager City State/CountryFees/
Expenses
Legacy Hedge Funds1/ (continued)PAAMCO Irvine CA $56,609PineRiverFund Minnetonka MN 221,181RockCreek Washington DC 24,130SamlynOnshoreFund NewYork NY 170,435StelliamFund NewYork NY 132,598Total Legacy Hedge Funds Manager Investment Expenses 3,351,387
Fixed incomeBrandywineGlobal Philadelphia PA 741,986BrownBrothersHarriman NewYork NY 264,035HarvestFundAdvisors1/ Wayne PA 574,547KayneAndersonCapitalAdvisors1/ LosAngeles CA 706,605MacKayShieldsCore1/ NewYork NY 118,835MellonCapitalManagementBondIndex Pittsburgh PA 219,850NewCenturyAdvisorsTIPS ChevyChase MD 278,168NISACustomTIPSIntermediate St.Louis MO 481,138PIMCOCore NewportBeach CA 640,412PIMCOUSTreasuries NewportBeach CA 424,275PNCShortDuration1/ Pittsburgh PA 208,482PyramisGlobalAdvisors Boston MA 1,900,503StoneHarborEmergingMarketDebt NewYork NY 566,379StoneHarborHighYield NewYork NY 777,920StoneridgeShortDuration1/ Malvern PA 121,304TaplinCanidaHabacht(TCH) Miami FL 460,342UBSCoreBond1/ Chicago IL 76,334WaterfallAssetManagement1/ NewYork NY 528,380WellingtonUSTreasuries1/ Boston MA 86,119Total Fixed Income Manager Investment Expenses 9,175,614
Total Manager Investment Expenses $130,424,386
1/Public market or hedge fund manager in liquidation or liquidated.
investment program | Expenses & Fees
SERS Fund

SERS Fund
Portfolio Snapshots
SERS 2018 Supplemental Budget Book | 39Data in this publication is unaudited.
Role in the SERS Fund
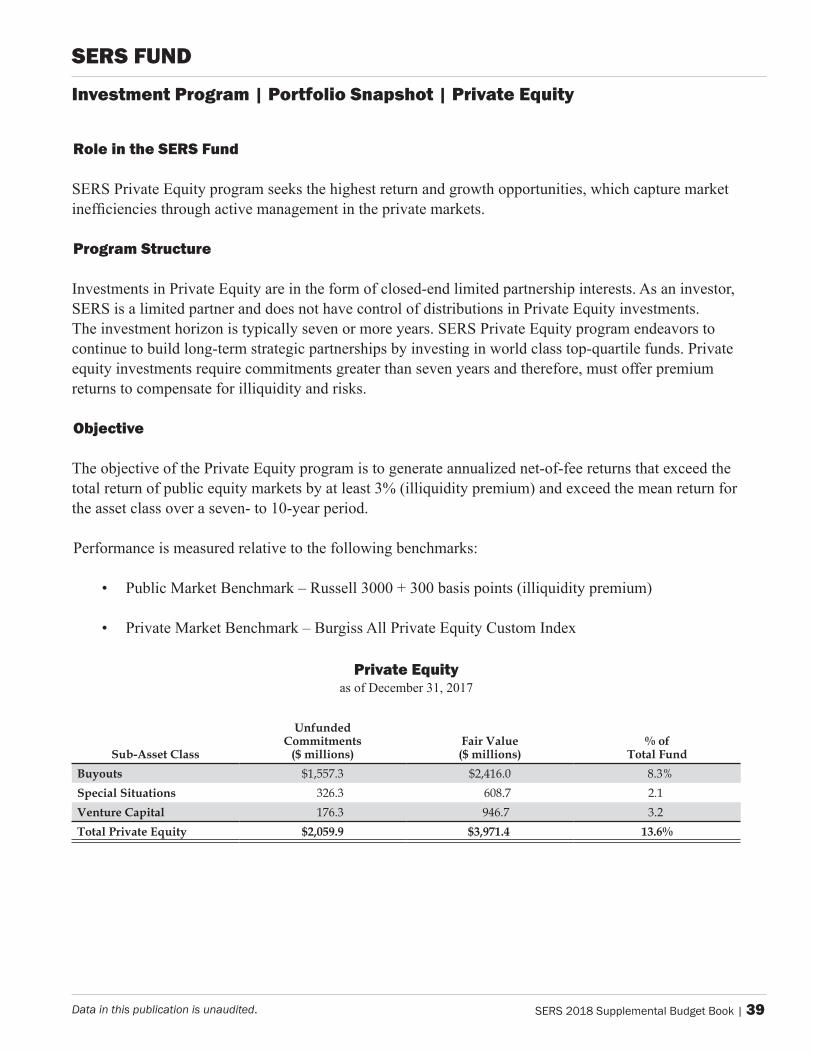
SERS Private Equity program seeks the highest return and growth opportunities, which capture market inefficiencies through active management in the private markets.
program Structure
Investments in Private Equity are in the form of closed-end limited partnership interests. As an investor, SERS is a limited partner and does not have control of distributions in Private Equity investments. The investment horizon is typically seven or more years. SERS Private Equity program endeavors to continue to build long-term strategic partnerships by investing in world class top-quartile funds. Private equity investments require commitments greater than seven years and therefore, must offer premium returns to compensate for illiquidity and risks.
Objective
The objective of the Private Equity program is to generate annualized net-of-fee returns that exceed the total return of public equity markets by at least 3% (illiquidity premium) and exceed the mean return for the asset class over a seven- to 10-year period.
Performance is measured relative to the following benchmarks:
• Public Market Benchmark – Russell 3000 + 300 basis points (illiquidity premium)
• Private Market Benchmark – Burgiss All Private Equity Custom Index
Private Equityas of December 31, 2017
Sub-Asset Class
Unfunded Commitments
($ millions)Fair Value ($ millions)
% of Total Fund
Buyouts $1,557.3 $2,416.0 8.3%Special Situations 326.3 608.7 2.1Venture Capital 176.3 946.7 3.2Total Private Equity $2,059.9 $3,971.4 13.6%
Investment Program | Portfolio Snapshot | Private Equity
SERS Fund
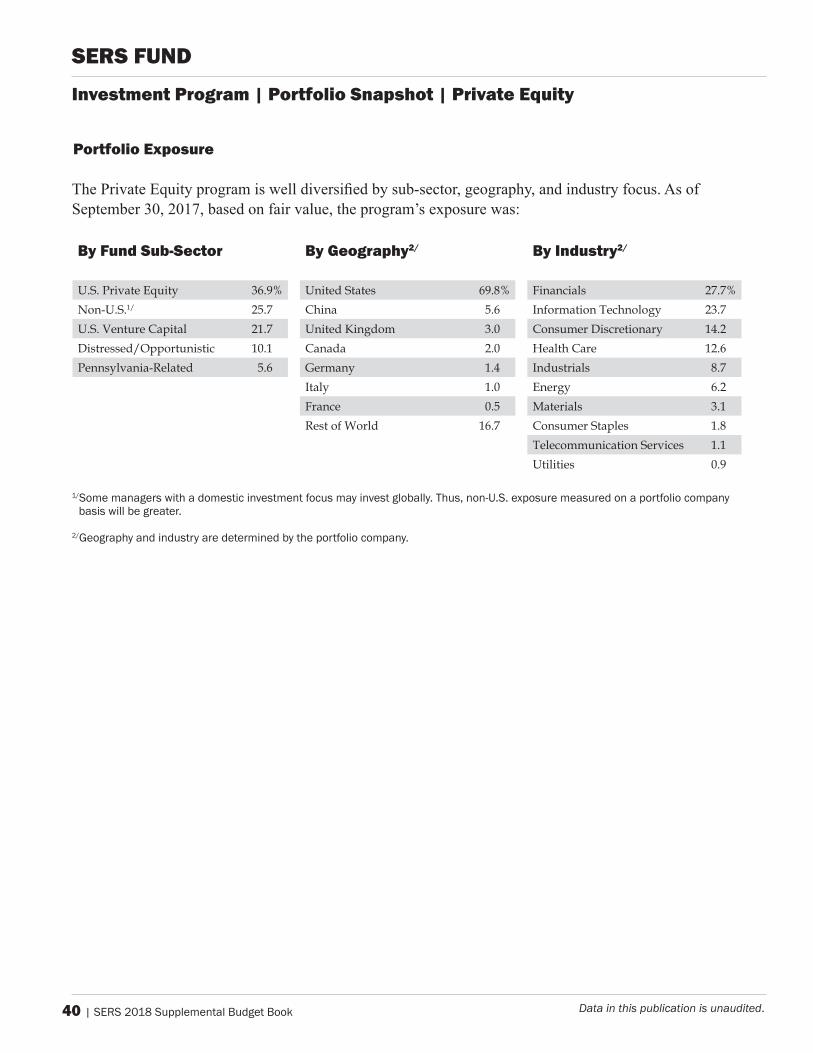
40 | SERS 2018 Supplemental Budget Book Data in this publication is unaudited.
portfolio Exposure
The Private Equity program is well diversified by sub-sector, geography, and industry focus. As of September 30, 2017, based on fair value, the program’s exposure was:
By Fund Sub-Sector By Geography2/ By Industry2/
U.S.PrivateEquity 36.9% UnitedStates 69.8% Financials 27.7%Non-U.S.1/ 25.7 China 5.6 InformationTechnology 23.7U.S.VentureCapital 21.7 UnitedKingdom 3.0 ConsumerDiscretionary 14.2Distressed/Opportunistic 10.1 Canada 2.0 HealthCare 12.6Pennsylvania-Related 5.6 Germany 1.4 Industrials 8.7
Italy 1.0 Energy 6.2France 0.5 Materials 3.1RestofWorld 16.7 ConsumerStaples 1.8
TelecommunicationServices 1.1Utilities 0.9
1/Some managers with a domestic investment focus may invest globally. Thus, non-U.S. exposure measured on a portfolio company basis will be greater.
2/Geography and industry are determined by the portfolio company.
Investment Program | Portfolio Snapshot | Private Equity
SERS Fund

SERS 2018 Supplemental Budget Book | 41Data in this publication is unaudited.
The capital committed column represents total dollars allocated from SERS to each limited partnership. Accumulated capital drawn is the portion of SERS capital commitments drawn by the general partner to be invested with underlying portfolio companies along with any reinvested capital. The accumulated distributions column shows the value of capital and profits returned to SERS.
Buyouts Committed, Drawn, and Distributed
Active Buyouts Funds Limited Partnership Strategy/Stage
SERS Initial Funding
Capital Committed1/
Accumulated Capital Drawn
Accumulated Distributions2/
1. ABRYPartnersIV Middle 3/30/2001 $35,000,000 $25,497,290 $74,633,973ABRYPartnersV Middle 7/29/2005 45,000,000 41,718,374 82,909,286ABRYPartnersVI Middle 3/26/2008 50,000,000 59,841,619 106,026,972ABRYPartnersVII Middle 8/10/2011 30,000,000 36,654,815 39,158,084ABRYPartnersVIII Middle 5/5/2015 25,000,000 22,477,919 3,599,240
2. ABSCapitalPartnersIV GrowthEquity 10/13/2000 35,000,000 30,984,280 68,253,149ABSCapitalPartnersV GrowthEquity 11/14/2005 20,000,000 19,704,037 57,297,716ABSCapitalPartnersVI GrowthEquity 3/13/2009 40,000,000 38,747,792 17,444,057
3. AdventInternationalGPEVI-A Large 7/7/2008 35,000,000 35,146,325 55,248,414AdventInternationalGPEVII-B Large 12/6/2012 40,000,000 36,000,000 15,159,752AdventInternationalGPEVIII-B Large 9/26/2016 50,000,000 22,575,000 0AdventLatinAmericanPrivateEquityFundIV Middle 8/2/2007 30,000,000 30,797,073 33,875,921
AdventLatinAmericanPrivateEquityFundV Middle 5/17/2010 15,000,000 14,355,000 3,675,000
AdventLatinAmericanPrivateEquityFundVI Middle 5/11/2015 25,000,000 9,037,500 5,000,000
4. AlphaPrivateEquityFund4 Small 5/15/2002 26,508,000 35,605,050 77,986,040AlphaPrivateEquityFund5 Small 4/1/2006 57,796,800 65,860,056 94,043,299
5. APAXEuropeV Mega 4/27/2001 53,262,000 70,406,088 150,017,403APAXEuropeVI Mega 5/19/2005 76,349,190 76,478,697 134,550,076APAXEuropeVII Mega 6/27/2007 132,170,235 138,817,717 145,865,152APAXExcelsiorVI Small 7/3/2000 35,000,000 34,151,324 56,569,467
6. ApolloInvestmentFundIV Mega 9/30/1998 75,000,000 74,838,620 124,814,033ApolloInvestmentFundIX Mega * 85,400,000 0 0ApolloInvestmentFundV Mega 8/23/2001 50,000,000 44,972,146 122,268,807ApolloInvestmentFundVI Mega 7/19/2006 40,000,000 38,911,805 53,622,539
7. AsiaAlternativesCapitalPartners FundofFunds 6/26/2007 50,000,000 25,129,085 36,260,022AsiaAlternativesCapitalPartnersII FundofFunds 3/7/2008 50,000,000 28,446,960 22,208,150AsiaAlternativesCapitalPartnersIII FundofFunds 8/3/2012 50,000,000 50,469,728 20,975,634AsiaAlternativesCapitalPartnersV FundofFunds 10/5/2017 50,000,000 0 0AsiaAlternativesKoreaBuyoutInvestors(Hahn&Co) Small 7/22/2011 7,000,000 8,293,455 6,846,837
PennAsiaInvestors FundofFunds 9/28/2012 133,000,000 62,390,350 21,590,2978. AsiaPacificGrowthFundIII GrowthEquity 9/28/1999 15,000,000 15,337,963 16,708,736
Investment Program | Portfolio Snapshot | Private Equity
SERS Fund
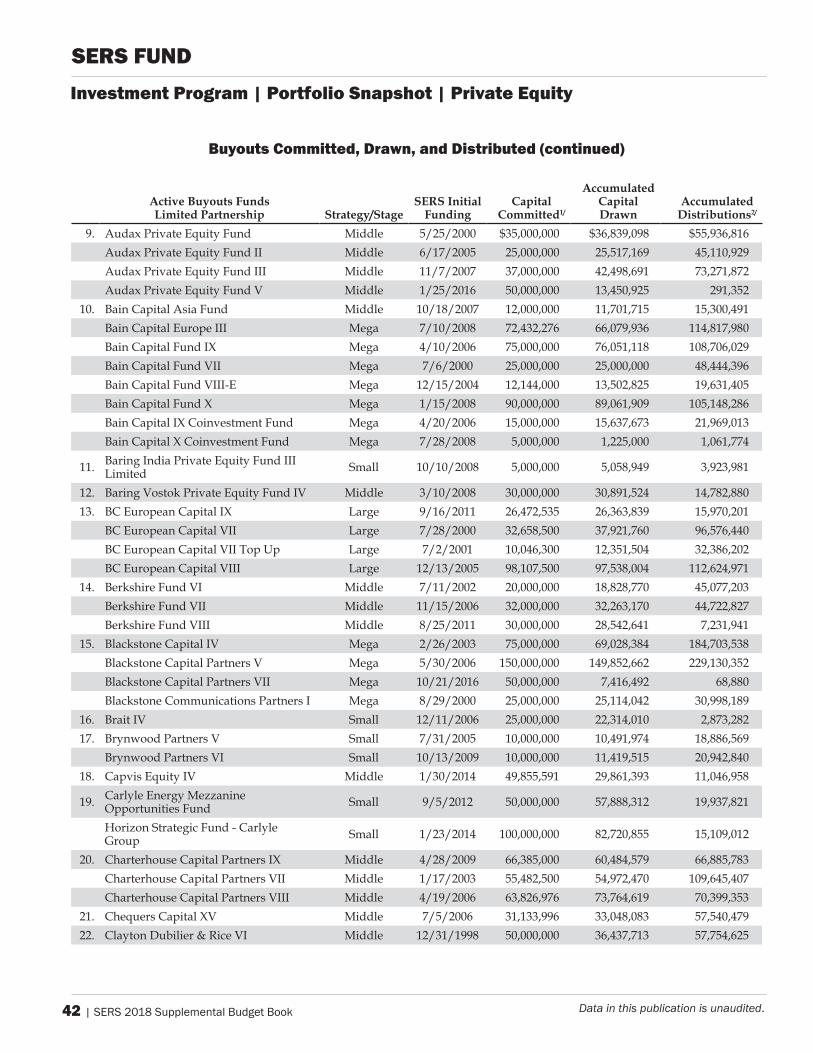
42 | SERS 2018 Supplemental Budget Book Data in this publication is unaudited.
Buyouts Committed, Drawn, and Distributed (continued)
Active Buyouts Funds Limited Partnership Strategy/Stage
SERS Initial Funding
Capital Committed1/
Accumulated Capital Drawn
Accumulated Distributions2/
9. AudaxPrivateEquityFund Middle 5/25/2000 $35,000,000 $36,839,098 $55,936,816AudaxPrivateEquityFundII Middle 6/17/2005 25,000,000 25,517,169 45,110,929AudaxPrivateEquityFundIII Middle 11/7/2007 37,000,000 42,498,691 73,271,872AudaxPrivateEquityFundV Middle 1/25/2016 50,000,000 13,450,925 291,352
10. BainCapitalAsiaFund Middle 10/18/2007 12,000,000 11,701,715 15,300,491BainCapitalEuropeIII Mega 7/10/2008 72,432,276 66,079,936 114,817,980BainCapitalFundIX Mega 4/10/2006 75,000,000 76,051,118 108,706,029BainCapitalFundVII Mega 7/6/2000 25,000,000 25,000,000 48,444,396BainCapitalFundVIII-E Mega 12/15/2004 12,144,000 13,502,825 19,631,405BainCapitalFundX Mega 1/15/2008 90,000,000 89,061,909 105,148,286BainCapitalIXCoinvestmentFund Mega 4/20/2006 15,000,000 15,637,673 21,969,013BainCapitalXCoinvestmentFund Mega 7/28/2008 5,000,000 1,225,000 1,061,774
11. BaringIndiaPrivateEquityFundIIILimited Small 10/10/2008 5,000,000 5,058,949 3,923,981
12. BaringVostokPrivateEquityFundIV Middle 3/10/2008 30,000,000 30,891,524 14,782,88013. BCEuropeanCapitalIX Large 9/16/2011 26,472,535 26,363,839 15,970,201
BCEuropeanCapitalVII Large 7/28/2000 32,658,500 37,921,760 96,576,440BCEuropeanCapitalVIITopUp Large 7/2/2001 10,046,300 12,351,504 32,386,202BCEuropeanCapitalVIII Large 12/13/2005 98,107,500 97,538,004 112,624,971
14. BerkshireFundVI Middle 7/11/2002 20,000,000 18,828,770 45,077,203BerkshireFundVII Middle 11/15/2006 32,000,000 32,263,170 44,722,827BerkshireFundVIII Middle 8/25/2011 30,000,000 28,542,641 7,231,941
15. BlackstoneCapitalIV Mega 2/26/2003 75,000,000 69,028,384 184,703,538BlackstoneCapitalPartnersV Mega 5/30/2006 150,000,000 149,852,662 229,130,352BlackstoneCapitalPartnersVII Mega 10/21/2016 50,000,000 7,416,492 68,880BlackstoneCommunicationsPartnersI Mega 8/29/2000 25,000,000 25,114,042 30,998,189
16. BraitIV Small 12/11/2006 25,000,000 22,314,010 2,873,28217. BrynwoodPartnersV Small 7/31/2005 10,000,000 10,491,974 18,886,569
BrynwoodPartnersVI Small 10/13/2009 10,000,000 11,419,515 20,942,84018. CapvisEquityIV Middle 1/30/2014 49,855,591 29,861,393 11,046,958
19. CarlyleEnergyMezzanineOpportunitiesFund Small 9/5/2012 50,000,000 57,888,312 19,937,821
HorizonStrategicFund-CarlyleGroup Small 1/23/2014 100,000,000 82,720,855 15,109,012
20. CharterhouseCapitalPartnersIX Middle 4/28/2009 66,385,000 60,484,579 66,885,783CharterhouseCapitalPartnersVII Middle 1/17/2003 55,482,500 54,972,470 109,645,407CharterhouseCapitalPartnersVIII Middle 4/19/2006 63,826,976 73,764,619 70,399,353
21. ChequersCapitalXV Middle 7/5/2006 31,133,996 33,048,083 57,540,47922. ClaytonDubilier&RiceVI Middle 12/31/1998 50,000,000 36,437,713 57,754,625
SERS FundInvestment Program | Portfolio Snapshot | Private Equity
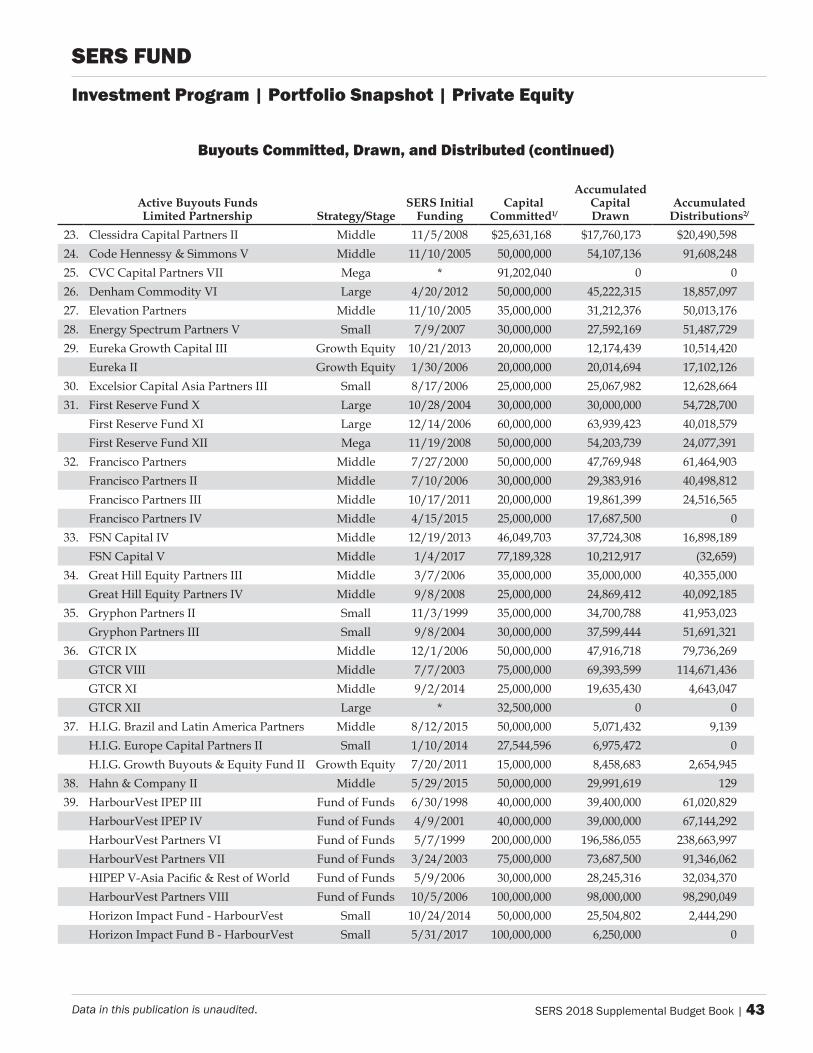
SERS 2018 Supplemental Budget Book | 43Data in this publication is unaudited.
Buyouts Committed, Drawn, and Distributed (continued)
Active Buyouts Funds Limited Partnership Strategy/Stage
SERS Initial Funding
Capital Committed1/
Accumulated Capital Drawn
Accumulated Distributions2/
23. ClessidraCapitalPartnersII Middle 11/5/2008 $25,631,168 $17,760,173 $20,490,59824. CodeHennessy&SimmonsV Middle 11/10/2005 50,000,000 54,107,136 91,608,24825. CVCCapitalPartnersVII Mega * 91,202,040 0 026. DenhamCommodityVI Large 4/20/2012 50,000,000 45,222,315 18,857,09727. ElevationPartners Middle 11/10/2005 35,000,000 31,212,376 50,013,17628. EnergySpectrumPartnersV Small 7/9/2007 30,000,000 27,592,169 51,487,72929. EurekaGrowthCapitalIII GrowthEquity 10/21/2013 20,000,000 12,174,439 10,514,420
EurekaII GrowthEquity 1/30/2006 20,000,000 20,014,694 17,102,12630. ExcelsiorCapitalAsiaPartnersIII Small 8/17/2006 25,000,000 25,067,982 12,628,66431. FirstReserveFundX Large 10/28/2004 30,000,000 30,000,000 54,728,700
FirstReserveFundXI Large 12/14/2006 60,000,000 63,939,423 40,018,579FirstReserveFundXII Mega 11/19/2008 50,000,000 54,203,739 24,077,391
32. FranciscoPartners Middle 7/27/2000 50,000,000 47,769,948 61,464,903FranciscoPartnersII Middle 7/10/2006 30,000,000 29,383,916 40,498,812FranciscoPartnersIII Middle 10/17/2011 20,000,000 19,861,399 24,516,565FranciscoPartnersIV Middle 4/15/2015 25,000,000 17,687,500 0
33. FSNCapitalIV Middle 12/19/2013 46,049,703 37,724,308 16,898,189FSNCapitalV Middle 1/4/2017 77,189,328 10,212,917 (32,659)
34. GreatHillEquityPartnersIII Middle 3/7/2006 35,000,000 35,000,000 40,355,000GreatHillEquityPartnersIV Middle 9/8/2008 25,000,000 24,869,412 40,092,185
35. GryphonPartnersII Small 11/3/1999 35,000,000 34,700,788 41,953,023GryphonPartnersIII Small 9/8/2004 30,000,000 37,599,444 51,691,321
36. GTCRIX Middle 12/1/2006 50,000,000 47,916,718 79,736,269GTCRVIII Middle 7/7/2003 75,000,000 69,393,599 114,671,436GTCRXI Middle 9/2/2014 25,000,000 19,635,430 4,643,047GTCRXII Large * 32,500,000 0 0
37. H.I.G.BrazilandLatinAmericaPartners Middle 8/12/2015 50,000,000 5,071,432 9,139H.I.G.EuropeCapitalPartnersII Small 1/10/2014 27,544,596 6,975,472 0H.I.G.GrowthBuyouts&EquityFundII GrowthEquity 7/20/2011 15,000,000 8,458,683 2,654,945
38. Hahn&CompanyII Middle 5/29/2015 50,000,000 29,991,619 12939. HarbourVestIPEPIII FundofFunds 6/30/1998 40,000,000 39,400,000 61,020,829
HarbourVestIPEPIV FundofFunds 4/9/2001 40,000,000 39,000,000 67,144,292HarbourVestPartnersVI FundofFunds 5/7/1999 200,000,000 196,586,055 238,663,997HarbourVestPartnersVII FundofFunds 3/24/2003 75,000,000 73,687,500 91,346,062HIPEPV-AsiaPacific&RestofWorld FundofFunds 5/9/2006 30,000,000 28,245,316 32,034,370HarbourVestPartnersVIII FundofFunds 10/5/2006 100,000,000 98,000,000 98,290,049HorizonImpactFund-HarbourVest Small 10/24/2014 50,000,000 25,504,802 2,444,290HorizonImpactFundB-HarbourVest Small 5/31/2017 100,000,000 6,250,000 0
Investment Program | Portfolio Snapshot | Private Equity
SERS Fund
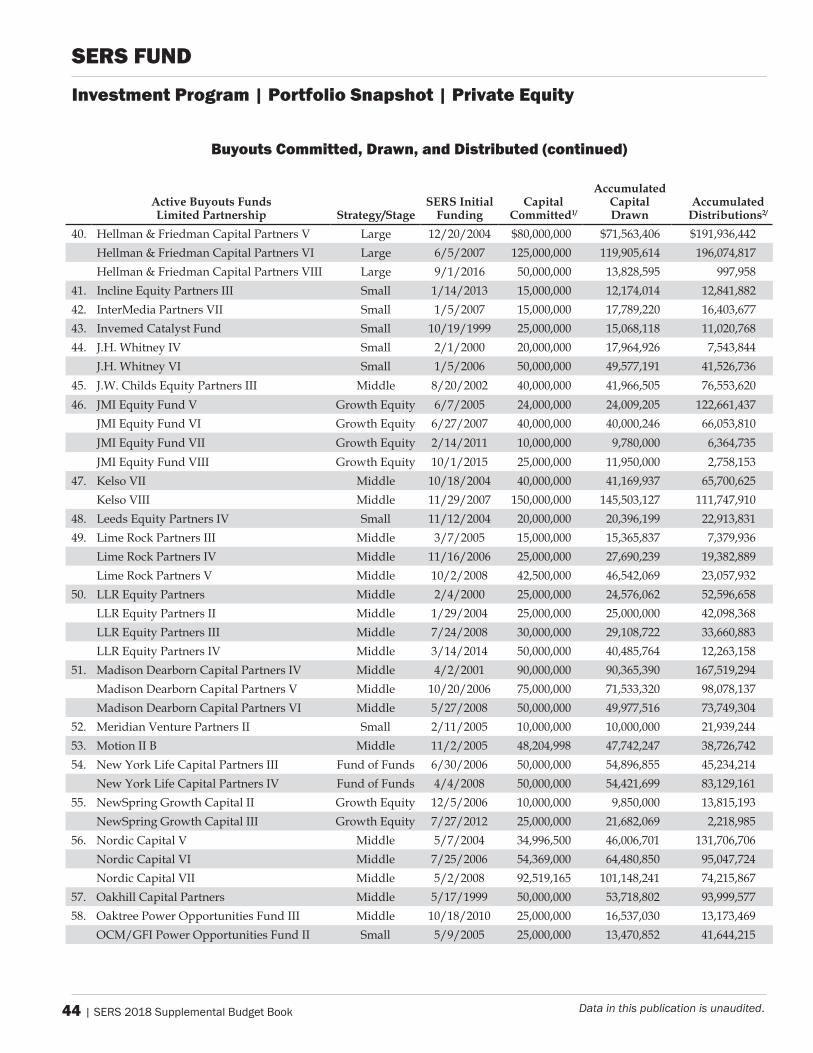
44 | SERS 2018 Supplemental Budget Book Data in this publication is unaudited.
Buyouts Committed, Drawn, and Distributed (continued)
Active Buyouts Funds Limited Partnership Strategy/Stage
SERS Initial Funding
Capital Committed1/
Accumulated Capital Drawn
Accumulated Distributions2/
40. Hellman&FriedmanCapitalPartnersV Large 12/20/2004 $80,000,000 $71,563,406 $191,936,442Hellman&FriedmanCapitalPartnersVI Large 6/5/2007 125,000,000 119,905,614 196,074,817Hellman&FriedmanCapitalPartnersVIII Large 9/1/2016 50,000,000 13,828,595 997,958
41. InclineEquityPartnersIII Small 1/14/2013 15,000,000 12,174,014 12,841,88242. InterMediaPartnersVII Small 1/5/2007 15,000,000 17,789,220 16,403,67743. InvemedCatalystFund Small 10/19/1999 25,000,000 15,068,118 11,020,76844. J.H.WhitneyIV Small 2/1/2000 20,000,000 17,964,926 7,543,844
J.H.WhitneyVI Small 1/5/2006 50,000,000 49,577,191 41,526,73645. J.W.ChildsEquityPartnersIII Middle 8/20/2002 40,000,000 41,966,505 76,553,62046. JMIEquityFundV GrowthEquity 6/7/2005 24,000,000 24,009,205 122,661,437
JMIEquityFundVI GrowthEquity 6/27/2007 40,000,000 40,000,246 66,053,810JMIEquityFundVII GrowthEquity 2/14/2011 10,000,000 9,780,000 6,364,735JMIEquityFundVIII GrowthEquity 10/1/2015 25,000,000 11,950,000 2,758,153
47. KelsoVII Middle 10/18/2004 40,000,000 41,169,937 65,700,625KelsoVIII Middle 11/29/2007 150,000,000 145,503,127 111,747,910
48. LeedsEquityPartnersIV Small 11/12/2004 20,000,000 20,396,199 22,913,83149. LimeRockPartnersIII Middle 3/7/2005 15,000,000 15,365,837 7,379,936
LimeRockPartnersIV Middle 11/16/2006 25,000,000 27,690,239 19,382,889LimeRockPartnersV Middle 10/2/2008 42,500,000 46,542,069 23,057,932
50. LLREquityPartners Middle 2/4/2000 25,000,000 24,576,062 52,596,658LLREquityPartnersII Middle 1/29/2004 25,000,000 25,000,000 42,098,368LLREquityPartnersIII Middle 7/24/2008 30,000,000 29,108,722 33,660,883LLREquityPartnersIV Middle 3/14/2014 50,000,000 40,485,764 12,263,158
51. MadisonDearbornCapitalPartnersIV Middle 4/2/2001 90,000,000 90,365,390 167,519,294MadisonDearbornCapitalPartnersV Middle 10/20/2006 75,000,000 71,533,320 98,078,137MadisonDearbornCapitalPartnersVI Middle 5/27/2008 50,000,000 49,977,516 73,749,304
52. MeridianVenturePartnersII Small 2/11/2005 10,000,000 10,000,000 21,939,24453. MotionIIB Middle 11/2/2005 48,204,998 47,742,247 38,726,74254. NewYorkLifeCapitalPartnersIII FundofFunds 6/30/2006 50,000,000 54,896,855 45,234,214
NewYorkLifeCapitalPartnersIV FundofFunds 4/4/2008 50,000,000 54,421,699 83,129,16155. NewSpringGrowthCapitalII GrowthEquity 12/5/2006 10,000,000 9,850,000 13,815,193
NewSpringGrowthCapitalIII GrowthEquity 7/27/2012 25,000,000 21,682,069 2,218,98556. NordicCapitalV Middle 5/7/2004 34,996,500 46,006,701 131,706,706
NordicCapitalVI Middle 7/25/2006 54,369,000 64,480,850 95,047,724NordicCapitalVII Middle 5/2/2008 92,519,165 101,148,241 74,215,867
57. OakhillCapitalPartners Middle 5/17/1999 50,000,000 53,718,802 93,999,57758. OaktreePowerOpportunitiesFundIII Middle 10/18/2010 25,000,000 16,537,030 13,173,469
OCM/GFIPowerOpportunitiesFundII Small 5/9/2005 25,000,000 13,470,852 41,644,215
SERS Fund
Investment Program | Portfolio Snapshot | Private Equity
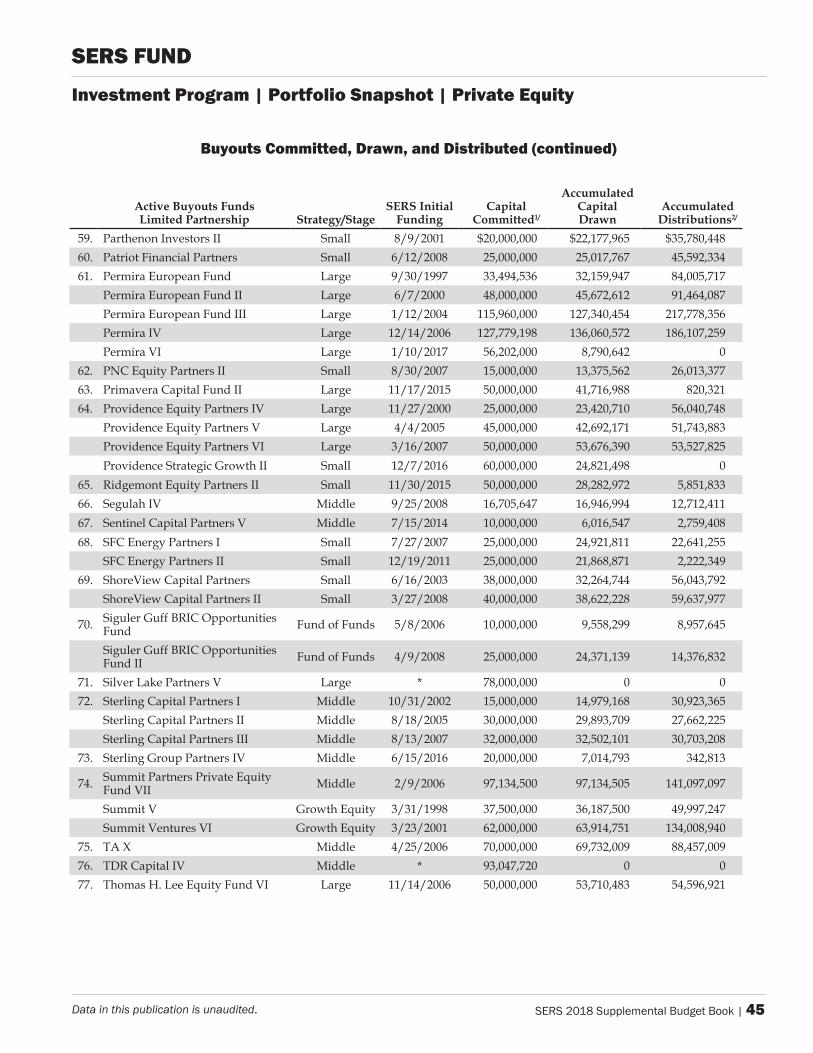
SERS 2018 Supplemental Budget Book | 45Data in this publication is unaudited.
Buyouts Committed, Drawn, and Distributed (continued)
Active Buyouts Funds Limited Partnership Strategy/Stage
SERS Initial Funding
Capital Committed1/
Accumulated Capital Drawn
Accumulated Distributions2/
59. ParthenonInvestorsII Small 8/9/2001 $20,000,000 $22,177,965 $35,780,44860. PatriotFinancialPartners Small 6/12/2008 25,000,000 25,017,767 45,592,33461. PermiraEuropeanFund Large 9/30/1997 33,494,536 32,159,947 84,005,717
PermiraEuropeanFundII Large 6/7/2000 48,000,000 45,672,612 91,464,087PermiraEuropeanFundIII Large 1/12/2004 115,960,000 127,340,454 217,778,356PermiraIV Large 12/14/2006 127,779,198 136,060,572 186,107,259PermiraVI Large 1/10/2017 56,202,000 8,790,642 0
62. PNCEquityPartnersII Small 8/30/2007 15,000,000 13,375,562 26,013,37763. PrimaveraCapitalFundII Large 11/17/2015 50,000,000 41,716,988 820,32164. ProvidenceEquityPartnersIV Large 11/27/2000 25,000,000 23,420,710 56,040,748
ProvidenceEquityPartnersV Large 4/4/2005 45,000,000 42,692,171 51,743,883ProvidenceEquityPartnersVI Large 3/16/2007 50,000,000 53,676,390 53,527,825ProvidenceStrategicGrowthII Small 12/7/2016 60,000,000 24,821,498 0
65. RidgemontEquityPartnersII Small 11/30/2015 50,000,000 28,282,972 5,851,83366. SegulahIV Middle 9/25/2008 16,705,647 16,946,994 12,712,41167. SentinelCapitalPartnersV Middle 7/15/2014 10,000,000 6,016,547 2,759,40868. SFCEnergyPartnersI Small 7/27/2007 25,000,000 24,921,811 22,641,255
SFCEnergyPartnersII Small 12/19/2011 25,000,000 21,868,871 2,222,34969. ShoreViewCapitalPartners Small 6/16/2003 38,000,000 32,264,744 56,043,792
ShoreViewCapitalPartnersII Small 3/27/2008 40,000,000 38,622,228 59,637,977
70. SigulerGuffBRICOpportunitiesFund FundofFunds 5/8/2006 10,000,000 9,558,299 8,957,645
SigulerGuffBRICOpportunitiesFundII FundofFunds 4/9/2008 25,000,000 24,371,139 14,376,832
71. SilverLakePartnersV Large * 78,000,000 0 072. SterlingCapitalPartnersI Middle 10/31/2002 15,000,000 14,979,168 30,923,365
SterlingCapitalPartnersII Middle 8/18/2005 30,000,000 29,893,709 27,662,225SterlingCapitalPartnersIII Middle 8/13/2007 32,000,000 32,502,101 30,703,208
73. SterlingGroupPartnersIV Middle 6/15/2016 20,000,000 7,014,793 342,813
74. SummitPartnersPrivateEquityFundVII Middle 2/9/2006 97,134,500 97,134,505 141,097,097
SummitV GrowthEquity 3/31/1998 37,500,000 36,187,500 49,997,247SummitVenturesVI GrowthEquity 3/23/2001 62,000,000 63,914,751 134,008,940
75. TAX Middle 4/25/2006 70,000,000 69,732,009 88,457,00976. TDRCapitalIV Middle * 93,047,720 0 077. ThomasH.LeeEquityFundVI Large 11/14/2006 50,000,000 53,710,483 54,596,921
Investment Program | Portfolio Snapshot | Private Equity
SERS Fund
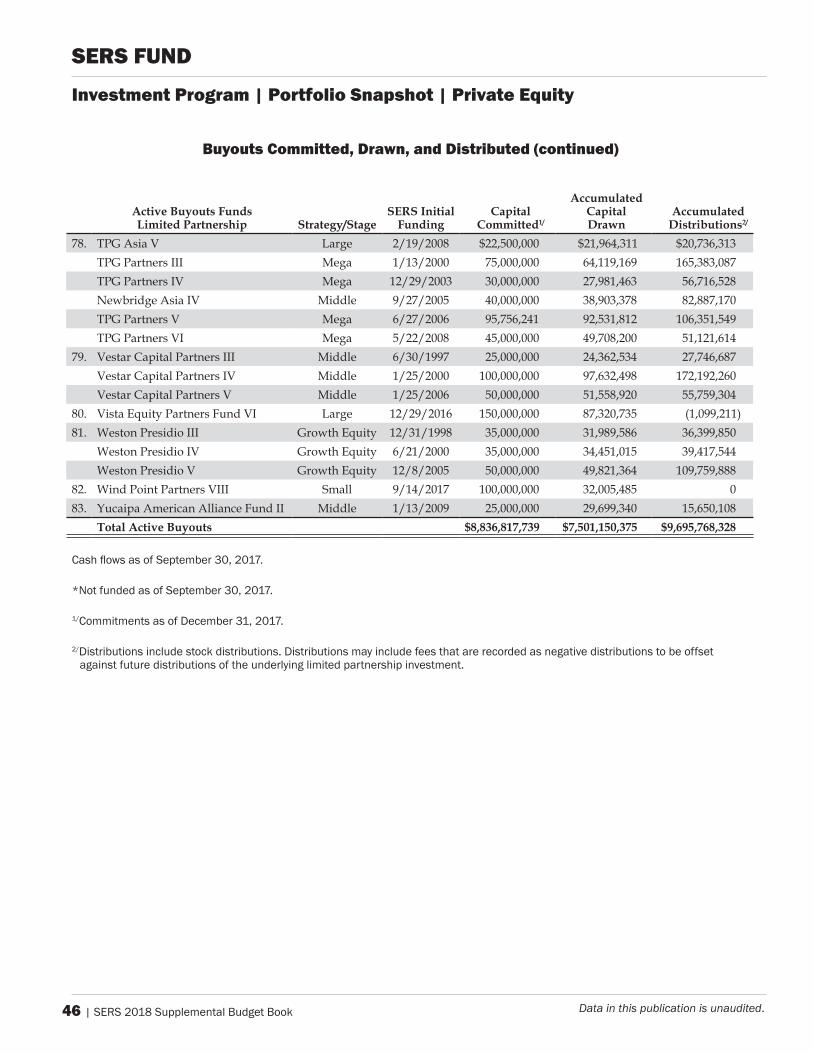
46 | SERS 2018 Supplemental Budget Book Data in this publication is unaudited.
Buyouts Committed, Drawn, and Distributed (continued)
Active Buyouts Funds Limited Partnership Strategy/Stage
SERS Initial Funding
Capital Committed1/
Accumulated Capital Drawn
Accumulated Distributions2/
78. TPGAsiaV Large 2/19/2008 $22,500,000 $21,964,311 $20,736,313TPGPartnersIII Mega 1/13/2000 75,000,000 64,119,169 165,383,087TPGPartnersIV Mega 12/29/2003 30,000,000 27,981,463 56,716,528NewbridgeAsiaIV Middle 9/27/2005 40,000,000 38,903,378 82,887,170TPGPartnersV Mega 6/27/2006 95,756,241 92,531,812 106,351,549TPGPartnersVI Mega 5/22/2008 45,000,000 49,708,200 51,121,614
79. VestarCapitalPartnersIII Middle 6/30/1997 25,000,000 24,362,534 27,746,687VestarCapitalPartnersIV Middle 1/25/2000 100,000,000 97,632,498 172,192,260VestarCapitalPartnersV Middle 1/25/2006 50,000,000 51,558,920 55,759,304
80. VistaEquityPartnersFundVI Large 12/29/2016 150,000,000 87,320,735 (1,099,211)81. WestonPresidioIII GrowthEquity 12/31/1998 35,000,000 31,989,586 36,399,850
WestonPresidioIV GrowthEquity 6/21/2000 35,000,000 34,451,015 39,417,544WestonPresidioV GrowthEquity 12/8/2005 50,000,000 49,821,364 109,759,888
82. WindPointPartnersVIII Small 9/14/2017 100,000,000 32,005,485 083. YucaipaAmericanAllianceFundII Middle 1/13/2009 25,000,000 29,699,340 15,650,108
Total Active Buyouts $8,836,817,739 $7,501,150,375 $9,695,768,328
Cash flows as of September 30, 2017.
*Not funded as of September 30, 2017.
1/Commitments as of December 31, 2017.
2/Distributions include stock distributions. Distributions may include fees that are recorded as negative distributions to be offset against future distributions of the underlying limited partnership investment.
SERS Fund
Investment Program | Portfolio Snapshot | Private Equity
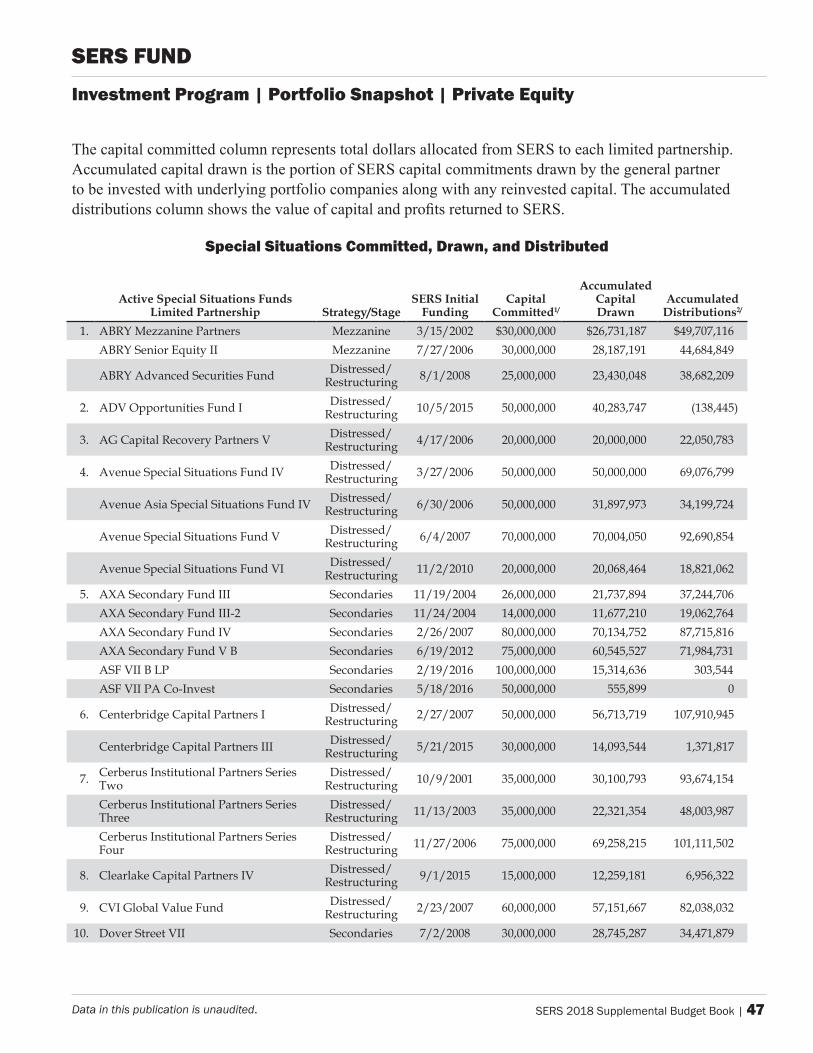
SERS 2018 Supplemental Budget Book | 47Data in this publication is unaudited.
The capital committed column represents total dollars allocated from SERS to each limited partnership. Accumulated capital drawn is the portion of SERS capital commitments drawn by the general partner to be invested with underlying portfolio companies along with any reinvested capital. The accumulated distributions column shows the value of capital and profits returned to SERS.
Special Situations Committed, drawn, and distributed
Active Special Situations Funds Limited Partnership Strategy/Stage
SERS Initial Funding
Capital Committed1/
Accumulated Capital Drawn
Accumulated Distributions2/
1. ABRYMezzaninePartners Mezzanine 3/15/2002 $30,000,000 $26,731,187 $49,707,116ABRYSeniorEquityII Mezzanine 7/27/2006 30,000,000 28,187,191 44,684,849
ABRYAdvancedSecuritiesFund Distressed/Restructuring 8/1/2008 25,000,000 23,430,048 38,682,209
2. ADVOpportunitiesFundI Distressed/Restructuring 10/5/2015 50,000,000 40,283,747 (138,445)
3. AGCapitalRecoveryPartnersV Distressed/Restructuring 4/17/2006 20,000,000 20,000,000 22,050,783
4. AvenueSpecialSituationsFundIV Distressed/Restructuring 3/27/2006 50,000,000 50,000,000 69,076,799
AvenueAsiaSpecialSituationsFundIV Distressed/Restructuring 6/30/2006 50,000,000 31,897,973 34,199,724
AvenueSpecialSituationsFundV Distressed/Restructuring 6/4/2007 70,000,000 70,004,050 92,690,854
AvenueSpecialSituationsFundVI Distressed/Restructuring 11/2/2010 20,000,000 20,068,464 18,821,062
5. AXASecondaryFundIII Secondaries 11/19/2004 26,000,000 21,737,894 37,244,706AXASecondaryFundIII-2 Secondaries 11/24/2004 14,000,000 11,677,210 19,062,764AXASecondaryFundIV Secondaries 2/26/2007 80,000,000 70,134,752 87,715,816AXASecondaryFundVB Secondaries 6/19/2012 75,000,000 60,545,527 71,984,731ASFVIIBLP Secondaries 2/19/2016 100,000,000 15,314,636 303,544ASFVIIPACo-Invest Secondaries 5/18/2016 50,000,000 555,899 0
6. CenterbridgeCapitalPartnersI Distressed/Restructuring 2/27/2007 50,000,000 56,713,719 107,910,945
CenterbridgeCapitalPartnersIII Distressed/Restructuring 5/21/2015 30,000,000 14,093,544 1,371,817
7. CerberusInstitutionalPartnersSeriesTwo
Distressed/Restructuring 10/9/2001 35,000,000 30,100,793 93,674,154
CerberusInstitutionalPartnersSeriesThree
Distressed/Restructuring 11/13/2003 35,000,000 22,321,354 48,003,987
CerberusInstitutionalPartnersSeriesFour
Distressed/Restructuring 11/27/2006 75,000,000 69,258,215 101,111,502
8. ClearlakeCapitalPartnersIV Distressed/Restructuring 9/1/2015 15,000,000 12,259,181 6,956,322
9. CVIGlobalValueFund Distressed/Restructuring 2/23/2007 60,000,000 57,151,667 82,038,032
10. DoverStreetVII Secondaries 7/2/2008 30,000,000 28,745,287 34,471,879
Investment Program | Portfolio Snapshot | Private Equity
SERS Fund
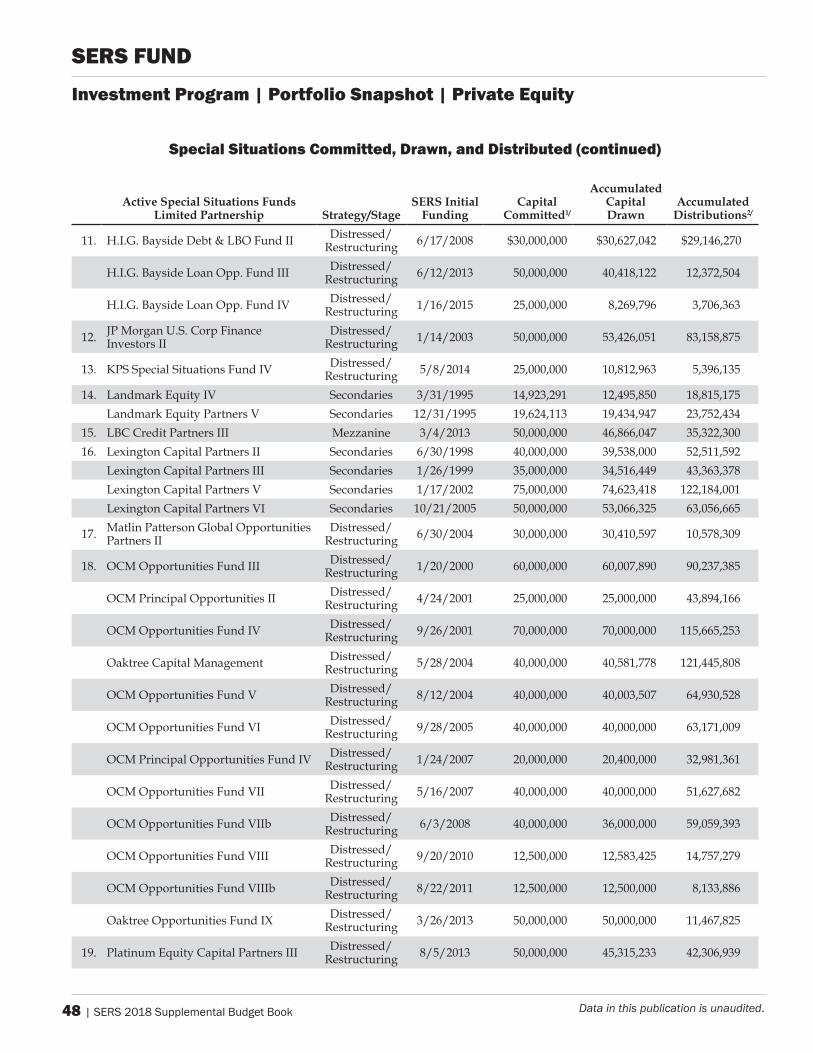
48 | SERS 2018 Supplemental Budget Book Data in this publication is unaudited.
Special Situations Committed, Drawn, and Distributed (continued)
Active Special Situations Funds Limited Partnership Strategy/Stage
SERS Initial Funding
Capital Committed1/
Accumulated Capital Drawn
Accumulated Distributions2/
11. H.I.G.BaysideDebt&LBOFundII Distressed/Restructuring 6/17/2008 $30,000,000 $30,627,042 $29,146,270
H.I.G.BaysideLoanOpp.FundIII Distressed/Restructuring 6/12/2013 50,000,000 40,418,122 12,372,504
H.I.G.BaysideLoanOpp.FundIV Distressed/Restructuring 1/16/2015 25,000,000 8,269,796 3,706,363
12. JPMorganU.S.CorpFinanceInvestorsII
Distressed/Restructuring 1/14/2003 50,000,000 53,426,051 83,158,875
13. KPSSpecialSituationsFundIV Distressed/Restructuring 5/8/2014 25,000,000 10,812,963 5,396,135
14. LandmarkEquityIV Secondaries 3/31/1995 14,923,291 12,495,850 18,815,175LandmarkEquityPartnersV Secondaries 12/31/1995 19,624,113 19,434,947 23,752,434
15. LBCCreditPartnersIII Mezzanine 3/4/2013 50,000,000 46,866,047 35,322,30016. LexingtonCapitalPartnersII Secondaries 6/30/1998 40,000,000 39,538,000 52,511,592
LexingtonCapitalPartnersIII Secondaries 1/26/1999 35,000,000 34,516,449 43,363,378LexingtonCapitalPartnersV Secondaries 1/17/2002 75,000,000 74,623,418 122,184,001LexingtonCapitalPartnersVI Secondaries 10/21/2005 50,000,000 53,066,325 63,056,665
17. MatlinPattersonGlobalOpportunitiesPartnersII
Distressed/Restructuring 6/30/2004 30,000,000 30,410,597 10,578,309
18. OCMOpportunitiesFundIII Distressed/Restructuring 1/20/2000 60,000,000 60,007,890 90,237,385
OCMPrincipalOpportunitiesII Distressed/Restructuring 4/24/2001 25,000,000 25,000,000 43,894,166
OCMOpportunitiesFundIV Distressed/Restructuring 9/26/2001 70,000,000 70,000,000 115,665,253
OaktreeCapitalManagement Distressed/Restructuring 5/28/2004 40,000,000 40,581,778 121,445,808
OCMOpportunitiesFundV Distressed/Restructuring 8/12/2004 40,000,000 40,003,507 64,930,528
OCMOpportunitiesFundVI Distressed/Restructuring 9/28/2005 40,000,000 40,000,000 63,171,009
OCMPrincipalOpportunitiesFundIV Distressed/Restructuring 1/24/2007 20,000,000 20,400,000 32,981,361
OCMOpportunitiesFundVII Distressed/Restructuring 5/16/2007 40,000,000 40,000,000 51,627,682
OCMOpportunitiesFundVIIb Distressed/Restructuring 6/3/2008 40,000,000 36,000,000 59,059,393
OCMOpportunitiesFundVIII Distressed/Restructuring 9/20/2010 12,500,000 12,583,425 14,757,279
OCMOpportunitiesFundVIIIb Distressed/Restructuring 8/22/2011 12,500,000 12,500,000 8,133,886
OaktreeOpportunitiesFundIX Distressed/Restructuring 3/26/2013 50,000,000 50,000,000 11,467,825
19. PlatinumEquityCapitalPartnersIII Distressed/Restructuring 8/5/2013 50,000,000 45,315,233 42,306,939
SERS Fund
Investment Program | Portfolio Snapshot | Private Equity
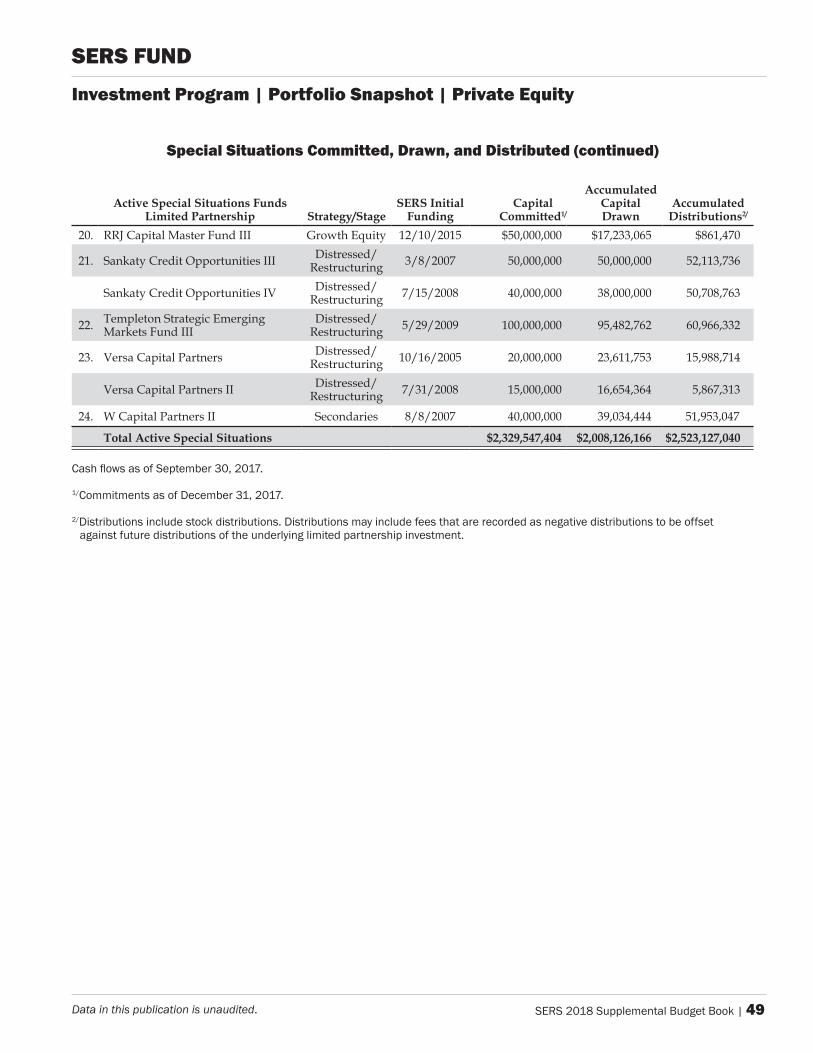
SERS 2018 Supplemental Budget Book | 49Data in this publication is unaudited.
Special Situations Committed, Drawn, and Distributed (continued)
Active Special Situations Funds Limited Partnership Strategy/Stage
SERS Initial Funding
Capital Committed1/
Accumulated Capital Drawn
Accumulated Distributions2/
20. RRJCapitalMasterFundIII GrowthEquity 12/10/2015 $50,000,000 $17,233,065 $861,470
21. SankatyCreditOpportunitiesIII Distressed/Restructuring 3/8/2007 50,000,000 50,000,000 52,113,736
SankatyCreditOpportunitiesIV Distressed/Restructuring 7/15/2008 40,000,000 38,000,000 50,708,763
22. TempletonStrategicEmergingMarketsFundIII
Distressed/Restructuring 5/29/2009 100,000,000 95,482,762 60,966,332
23. VersaCapitalPartners Distressed/Restructuring 10/16/2005 20,000,000 23,611,753 15,988,714
VersaCapitalPartnersII Distressed/Restructuring 7/31/2008 15,000,000 16,654,364 5,867,313
24. WCapitalPartnersII Secondaries 8/8/2007 40,000,000 39,034,444 51,953,047
Total Active Special Situations $2,329,547,404 $2,008,126,166 $2,523,127,040
Cash flows as of September 30, 2017.
1/Commitments as of December 31, 2017.
2/Distributions include stock distributions. Distributions may include fees that are recorded as negative distributions to be offset against future distributions of the underlying limited partnership investment.
SERS Fund
Investment Program | Portfolio Snapshot | Private Equity
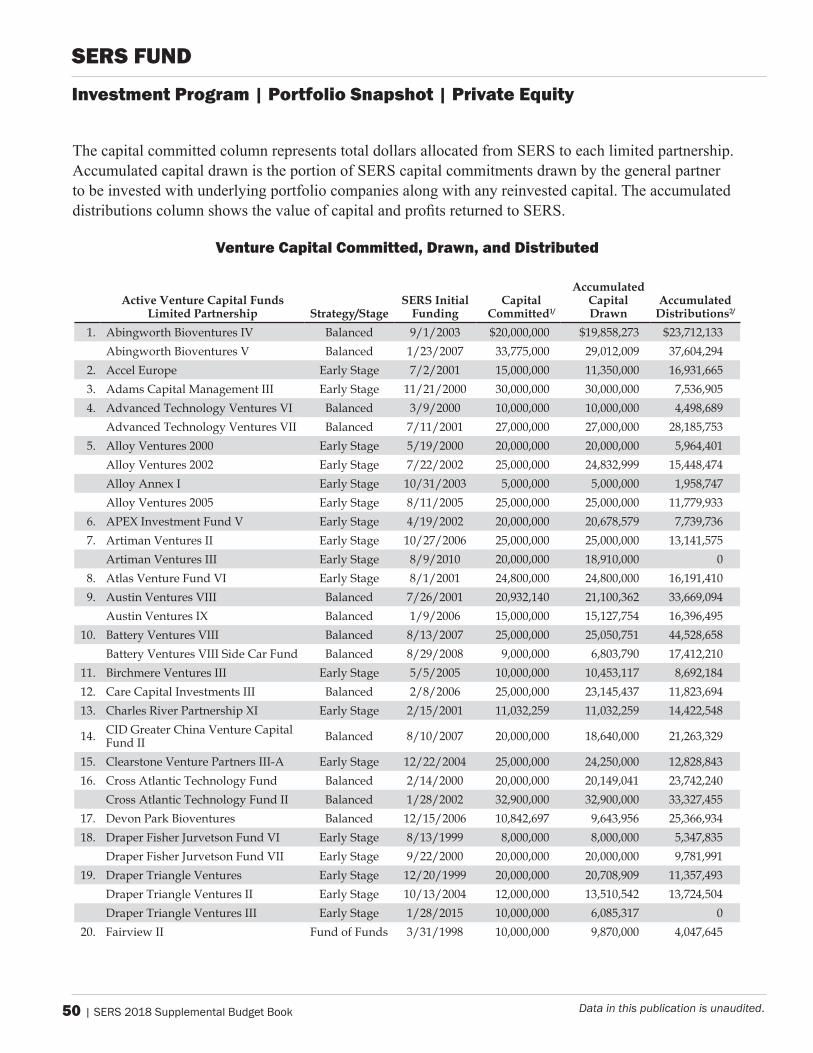
50 | SERS 2018 Supplemental Budget Book Data in this publication is unaudited.
The capital committed column represents total dollars allocated from SERS to each limited partnership. Accumulated capital drawn is the portion of SERS capital commitments drawn by the general partner to be invested with underlying portfolio companies along with any reinvested capital. The accumulated distributions column shows the value of capital and profits returned to SERS.
Venture Capital Committed, drawn, and distributed
Active Venture Capital Funds Limited Partnership Strategy/Stage
SERS Initial Funding
Capital Committed1/
Accumulated Capital Drawn
Accumulated Distributions2/
1. AbingworthBioventuresIV Balanced 9/1/2003 $20,000,000 $19,858,273 $23,712,133AbingworthBioventuresV Balanced 1/23/2007 33,775,000 29,012,009 37,604,294
2. AccelEurope EarlyStage 7/2/2001 15,000,000 11,350,000 16,931,6653. AdamsCapitalManagementIII EarlyStage 11/21/2000 30,000,000 30,000,000 7,536,9054. AdvancedTechnologyVenturesVI Balanced 3/9/2000 10,000,000 10,000,000 4,498,689
AdvancedTechnologyVenturesVII Balanced 7/11/2001 27,000,000 27,000,000 28,185,7535. AlloyVentures2000 EarlyStage 5/19/2000 20,000,000 20,000,000 5,964,401
AlloyVentures2002 EarlyStage 7/22/2002 25,000,000 24,832,999 15,448,474AlloyAnnexI EarlyStage 10/31/2003 5,000,000 5,000,000 1,958,747AlloyVentures2005 EarlyStage 8/11/2005 25,000,000 25,000,000 11,779,933
6. APEXInvestmentFundV EarlyStage 4/19/2002 20,000,000 20,678,579 7,739,7367. ArtimanVenturesII EarlyStage 10/27/2006 25,000,000 25,000,000 13,141,575
ArtimanVenturesIII EarlyStage 8/9/2010 20,000,000 18,910,000 08. AtlasVentureFundVI EarlyStage 8/1/2001 24,800,000 24,800,000 16,191,4109. AustinVenturesVIII Balanced 7/26/2001 20,932,140 21,100,362 33,669,094
AustinVenturesIX Balanced 1/9/2006 15,000,000 15,127,754 16,396,49510. BatteryVenturesVIII Balanced 8/13/2007 25,000,000 25,050,751 44,528,658
BatteryVenturesVIIISideCarFund Balanced 8/29/2008 9,000,000 6,803,790 17,412,21011. BirchmereVenturesIII EarlyStage 5/5/2005 10,000,000 10,453,117 8,692,18412. CareCapitalInvestmentsIII Balanced 2/8/2006 25,000,000 23,145,437 11,823,69413. CharlesRiverPartnershipXI EarlyStage 2/15/2001 11,032,259 11,032,259 14,422,548
14. CIDGreaterChinaVentureCapitalFundII Balanced 8/10/2007 20,000,000 18,640,000 21,263,329
15. ClearstoneVenturePartnersIII-A EarlyStage 12/22/2004 25,000,000 24,250,000 12,828,84316. CrossAtlanticTechnologyFund Balanced 2/14/2000 20,000,000 20,149,041 23,742,240
CrossAtlanticTechnologyFundII Balanced 1/28/2002 32,900,000 32,900,000 33,327,45517. DevonParkBioventures Balanced 12/15/2006 10,842,697 9,643,956 25,366,93418. DraperFisherJurvetsonFundVI EarlyStage 8/13/1999 8,000,000 8,000,000 5,347,835
DraperFisherJurvetsonFundVII EarlyStage 9/22/2000 20,000,000 20,000,000 9,781,99119. DraperTriangleVentures EarlyStage 12/20/1999 20,000,000 20,708,909 11,357,493
DraperTriangleVenturesII EarlyStage 10/13/2004 12,000,000 13,510,542 13,724,504DraperTriangleVenturesIII EarlyStage 1/28/2015 10,000,000 6,085,317 0
20. FairviewII FundofFunds 3/31/1998 10,000,000 9,870,000 4,047,645
SERS Fund
Investment Program | Portfolio Snapshot | Private Equity
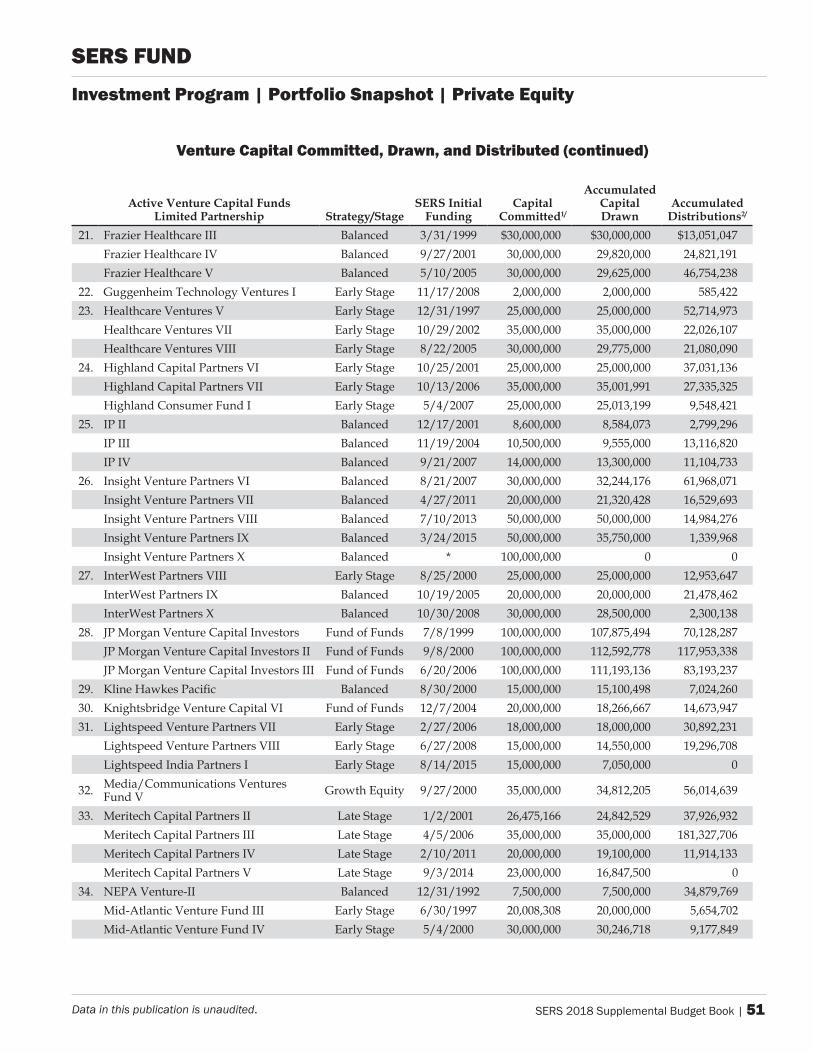
SERS 2018 Supplemental Budget Book | 51Data in this publication is unaudited.
Venture Capital Committed, Drawn, and Distributed (continued)
Active Venture Capital Funds Limited Partnership Strategy/Stage
SERS Initial Funding
Capital Committed1/
Accumulated Capital Drawn
Accumulated Distributions2/
21. FrazierHealthcareIII Balanced 3/31/1999 $30,000,000 $30,000,000 $13,051,047FrazierHealthcareIV Balanced 9/27/2001 30,000,000 29,820,000 24,821,191FrazierHealthcareV Balanced 5/10/2005 30,000,000 29,625,000 46,754,238
22. GuggenheimTechnologyVenturesI EarlyStage 11/17/2008 2,000,000 2,000,000 585,42223. HealthcareVenturesV EarlyStage 12/31/1997 25,000,000 25,000,000 52,714,973
HealthcareVenturesVII EarlyStage 10/29/2002 35,000,000 35,000,000 22,026,107HealthcareVenturesVIII EarlyStage 8/22/2005 30,000,000 29,775,000 21,080,090
24. HighlandCapitalPartnersVI EarlyStage 10/25/2001 25,000,000 25,000,000 37,031,136HighlandCapitalPartnersVII EarlyStage 10/13/2006 35,000,000 35,001,991 27,335,325HighlandConsumerFundI EarlyStage 5/4/2007 25,000,000 25,013,199 9,548,421
25. IPII Balanced 12/17/2001 8,600,000 8,584,073 2,799,296IPIII Balanced 11/19/2004 10,500,000 9,555,000 13,116,820IPIV Balanced 9/21/2007 14,000,000 13,300,000 11,104,733
26. InsightVenturePartnersVI Balanced 8/21/2007 30,000,000 32,244,176 61,968,071InsightVenturePartnersVII Balanced 4/27/2011 20,000,000 21,320,428 16,529,693InsightVenturePartnersVIII Balanced 7/10/2013 50,000,000 50,000,000 14,984,276InsightVenturePartnersIX Balanced 3/24/2015 50,000,000 35,750,000 1,339,968InsightVenturePartnersX Balanced * 100,000,000 0 0
27. InterWestPartnersVIII EarlyStage 8/25/2000 25,000,000 25,000,000 12,953,647InterWestPartnersIX Balanced 10/19/2005 20,000,000 20,000,000 21,478,462InterWestPartnersX Balanced 10/30/2008 30,000,000 28,500,000 2,300,138
28. JPMorganVentureCapitalInvestors FundofFunds 7/8/1999 100,000,000 107,875,494 70,128,287JPMorganVentureCapitalInvestorsII FundofFunds 9/8/2000 100,000,000 112,592,778 117,953,338JPMorganVentureCapitalInvestorsIII FundofFunds 6/20/2006 100,000,000 111,193,136 83,193,237
29. KlineHawkesPacific Balanced 8/30/2000 15,000,000 15,100,498 7,024,26030. KnightsbridgeVentureCapitalVI FundofFunds 12/7/2004 20,000,000 18,266,667 14,673,94731. LightspeedVenturePartnersVII EarlyStage 2/27/2006 18,000,000 18,000,000 30,892,231
LightspeedVenturePartnersVIII EarlyStage 6/27/2008 15,000,000 14,550,000 19,296,708LightspeedIndiaPartnersI EarlyStage 8/14/2015 15,000,000 7,050,000 0
32. Media/CommunicationsVenturesFundV GrowthEquity 9/27/2000 35,000,000 34,812,205 56,014,639
33. MeritechCapitalPartnersII LateStage 1/2/2001 26,475,166 24,842,529 37,926,932MeritechCapitalPartnersIII LateStage 4/5/2006 35,000,000 35,000,000 181,327,706MeritechCapitalPartnersIV LateStage 2/10/2011 20,000,000 19,100,000 11,914,133MeritechCapitalPartnersV LateStage 9/3/2014 23,000,000 16,847,500 0
34. NEPAVenture-II Balanced 12/31/1992 7,500,000 7,500,000 34,879,769Mid-AtlanticVentureFundIII EarlyStage 6/30/1997 20,008,308 20,000,000 5,654,702Mid-AtlanticVentureFundIV EarlyStage 5/4/2000 30,000,000 30,246,718 9,177,849
SERS Fund
Investment Program | Portfolio Snapshot | Private Equity
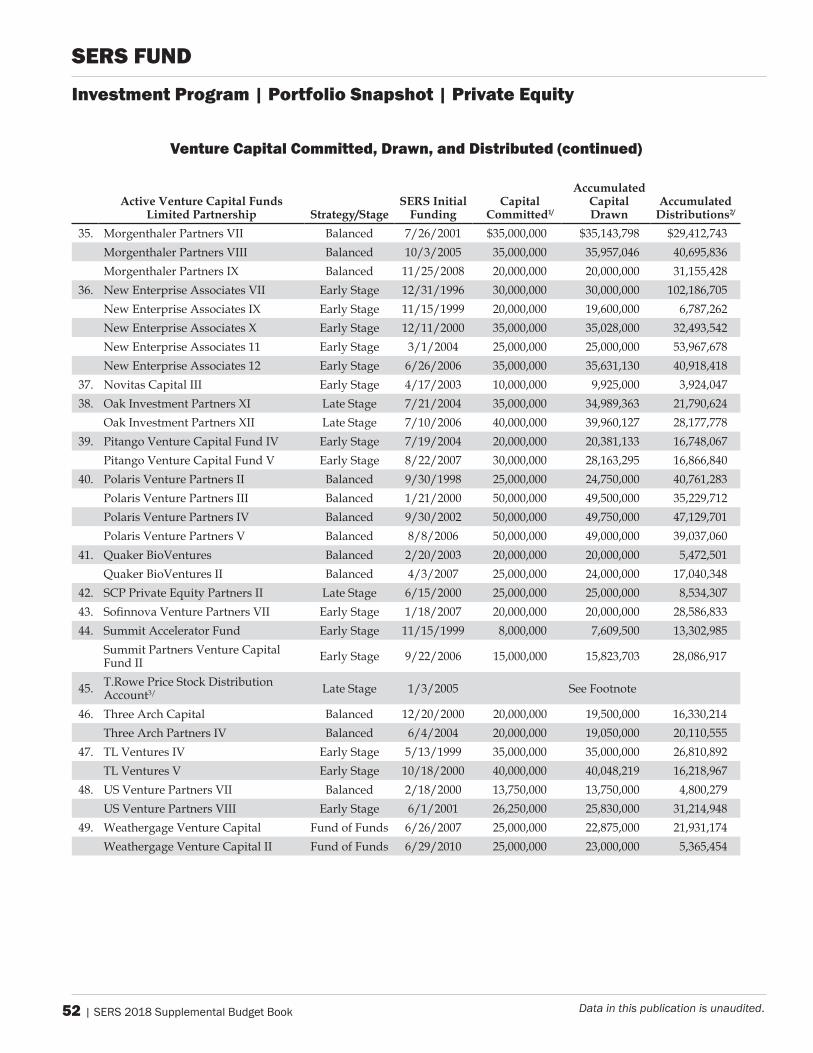
52 | SERS 2018 Supplemental Budget Book Data in this publication is unaudited.
Venture Capital Committed, Drawn, and Distributed (continued)
Active Venture Capital Funds Limited Partnership Strategy/Stage
SERS Initial Funding
Capital Committed1/
Accumulated Capital Drawn
Accumulated Distributions2/
35. MorgenthalerPartnersVII Balanced 7/26/2001 $35,000,000 $35,143,798 $29,412,743MorgenthalerPartnersVIII Balanced 10/3/2005 35,000,000 35,957,046 40,695,836MorgenthalerPartnersIX Balanced 11/25/2008 20,000,000 20,000,000 31,155,428
36. NewEnterpriseAssociatesVII EarlyStage 12/31/1996 30,000,000 30,000,000 102,186,705NewEnterpriseAssociatesIX EarlyStage 11/15/1999 20,000,000 19,600,000 6,787,262NewEnterpriseAssociatesX EarlyStage 12/11/2000 35,000,000 35,028,000 32,493,542NewEnterpriseAssociates11 EarlyStage 3/1/2004 25,000,000 25,000,000 53,967,678NewEnterpriseAssociates12 EarlyStage 6/26/2006 35,000,000 35,631,130 40,918,418
37. NovitasCapitalIII EarlyStage 4/17/2003 10,000,000 9,925,000 3,924,04738. OakInvestmentPartnersXI LateStage 7/21/2004 35,000,000 34,989,363 21,790,624
OakInvestmentPartnersXII LateStage 7/10/2006 40,000,000 39,960,127 28,177,77839. PitangoVentureCapitalFundIV EarlyStage 7/19/2004 20,000,000 20,381,133 16,748,067
PitangoVentureCapitalFundV EarlyStage 8/22/2007 30,000,000 28,163,295 16,866,84040. PolarisVenturePartnersII Balanced 9/30/1998 25,000,000 24,750,000 40,761,283
PolarisVenturePartnersIII Balanced 1/21/2000 50,000,000 49,500,000 35,229,712PolarisVenturePartnersIV Balanced 9/30/2002 50,000,000 49,750,000 47,129,701PolarisVenturePartnersV Balanced 8/8/2006 50,000,000 49,000,000 39,037,060
41. QuakerBioVentures Balanced 2/20/2003 20,000,000 20,000,000 5,472,501QuakerBioVenturesII Balanced 4/3/2007 25,000,000 24,000,000 17,040,348
42. SCPPrivateEquityPartnersII LateStage 6/15/2000 25,000,000 25,000,000 8,534,30743. SofinnovaVenturePartnersVII EarlyStage 1/18/2007 20,000,000 20,000,000 28,586,83344. SummitAcceleratorFund EarlyStage 11/15/1999 8,000,000 7,609,500 13,302,985
SummitPartnersVentureCapitalFundII EarlyStage 9/22/2006 15,000,000 15,823,703 28,086,917
45. T.RowePriceStockDistributionAccount3/ LateStage 1/3/2005 SeeFootnote
46. ThreeArchCapital Balanced 12/20/2000 20,000,000 19,500,000 16,330,214ThreeArchPartnersIV Balanced 6/4/2004 20,000,000 19,050,000 20,110,555
47. TLVenturesIV EarlyStage 5/13/1999 35,000,000 35,000,000 26,810,892TLVenturesV EarlyStage 10/18/2000 40,000,000 40,048,219 16,218,967
48. USVenturePartnersVII Balanced 2/18/2000 13,750,000 13,750,000 4,800,279USVenturePartnersVIII EarlyStage 6/1/2001 26,250,000 25,830,000 31,214,948
49. WeathergageVentureCapital FundofFunds 6/26/2007 25,000,000 22,875,000 21,931,174WeathergageVentureCapitalII FundofFunds 6/29/2010 25,000,000 23,000,000 5,365,454
SERS Fund
Investment Program | Portfolio Snapshot | Private Equity
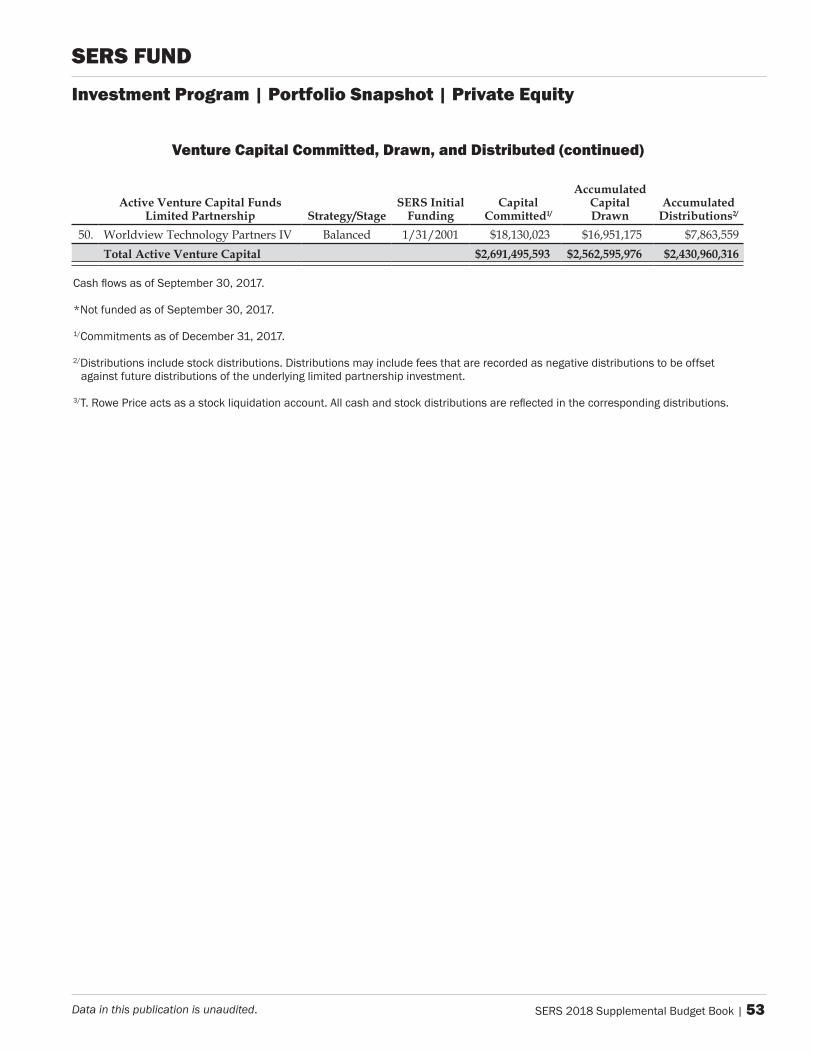
SERS 2018 Supplemental Budget Book | 53Data in this publication is unaudited.
SERS Fund
Venture Capital Committed, Drawn, and Distributed (continued)
Active Venture Capital Funds Limited Partnership Strategy/Stage
SERS Initial Funding
Capital Committed1/
Accumulated Capital Drawn
Accumulated Distributions2/
50. WorldviewTechnologyPartnersIV Balanced 1/31/2001 $18,130,023 $16,951,175 $7,863,559Total Active Venture Capital $2,691,495,593 $2,562,595,976 $2,430,960,316
Cash flows as of September 30, 2017.
*Not funded as of September 30, 2017.
1/Commitments as of December 31, 2017. 2/Distributions include stock distributions. Distributions may include fees that are recorded as negative distributions to be offset
against future distributions of the underlying limited partnership investment. 3/T. Rowe Price acts as a stock liquidation account. All cash and stock distributions are reflected in the corresponding distributions.
Investment Program | Portfolio Snapshot | Private Equity
54 | SERS 2018 Supplemental Budget Book Data in this publication is unaudited.
Role in the SERS Fund
SERS Global Public Equity program seeks high returns through capital appreciation and income from dividend payments while also improving the total fund’s liquidity. SERS Global Public Equity program contributes a high expected long-term return to the fund but also may be the greatest contributor to near-term volatility.
program Structure
Investments in public equity are achieved through buying and holding publicly-traded securities of companies throughout the developed world and in emerging markets. These companies exhibit a wide range of market capitalizations in many industries and sectors, and offer vastly different equity return opportunities.
Objective
The objective of the Global Public Equity program is to generate annualized net-of-fee returns that exceed its benchmark, the MSCI All Country World Investable Market Index, over a three- to five-year period.
Investment Program | Portfolio Snapshot | Global Public Equity
SERS Fund
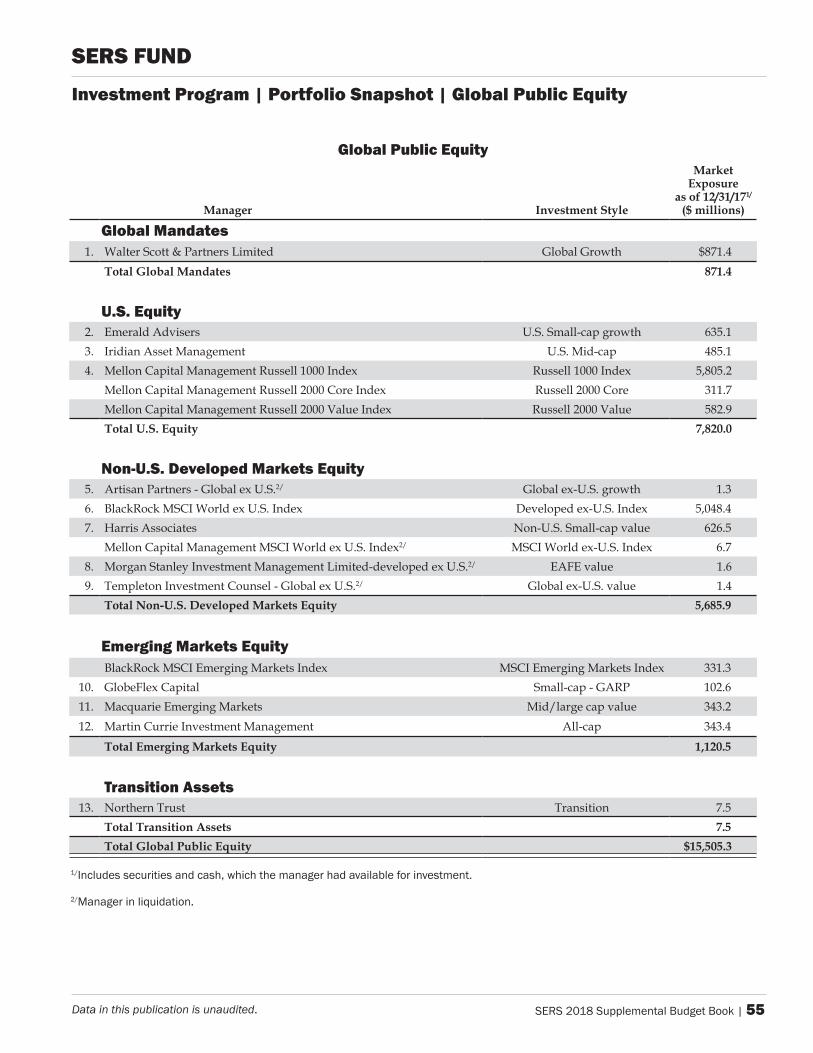
SERS 2018 Supplemental Budget Book | 55Data in this publication is unaudited.
Global Public Equity
Manager Investment Style
Market Exposure
as of 12/31/171/
($ millions)
global mandates1. WalterScott&PartnersLimited GlobalGrowth $871.4
Total Global Mandates 871.4
U.S. Equity2. EmeraldAdvisers U.S.Small-capgrowth 635.13. IridianAssetManagement U.S.Mid-cap 485.14. MellonCapitalManagementRussell1000Index Russell1000Index 5,805.2
MellonCapitalManagementRussell2000CoreIndex Russell2000Core 311.7MellonCapitalManagementRussell2000ValueIndex Russell2000Value 582.9Total U.S. Equity 7,820.0
Non-U.S. Developed Markets Equity5. ArtisanPartners-GlobalexU.S.2/ Globalex-U.S.growth 1.36. BlackRockMSCIWorldexU.S.Index Developedex-U.S.Index 5,048.47. HarrisAssociates Non-U.S.Small-capvalue 626.5
MellonCapitalManagementMSCIWorldexU.S.Index2/ MSCIWorldex-U.S.Index 6.78. MorganStanleyInvestmentManagementLimited-developedexU.S.2/ EAFEvalue 1.69. TempletonInvestmentCounsel-GlobalexU.S.2/ Globalex-U.S.value 1.4
Total Non-U.S. Developed Markets Equity 5,685.9
Emerging Markets EquityBlackRockMSCIEmergingMarketsIndex MSCIEmergingMarketsIndex 331.3
10. GlobeFlexCapital Small-cap-GARP 102.611. MacquarieEmergingMarkets Mid/largecapvalue 343.212. MartinCurrieInvestmentManagement All-cap 343.4
Total Emerging Markets Equity 1,120.5
transition assets13. NorthernTrust Transition 7.5
Total Transition Assets 7.5 Total Global Public Equity $15,505.3
1/Includes securities and cash, which the manager had available for investment.
2/Manager in liquidation.
Investment Program | Portfolio Snapshot | Global Public Equity
SERS Fund
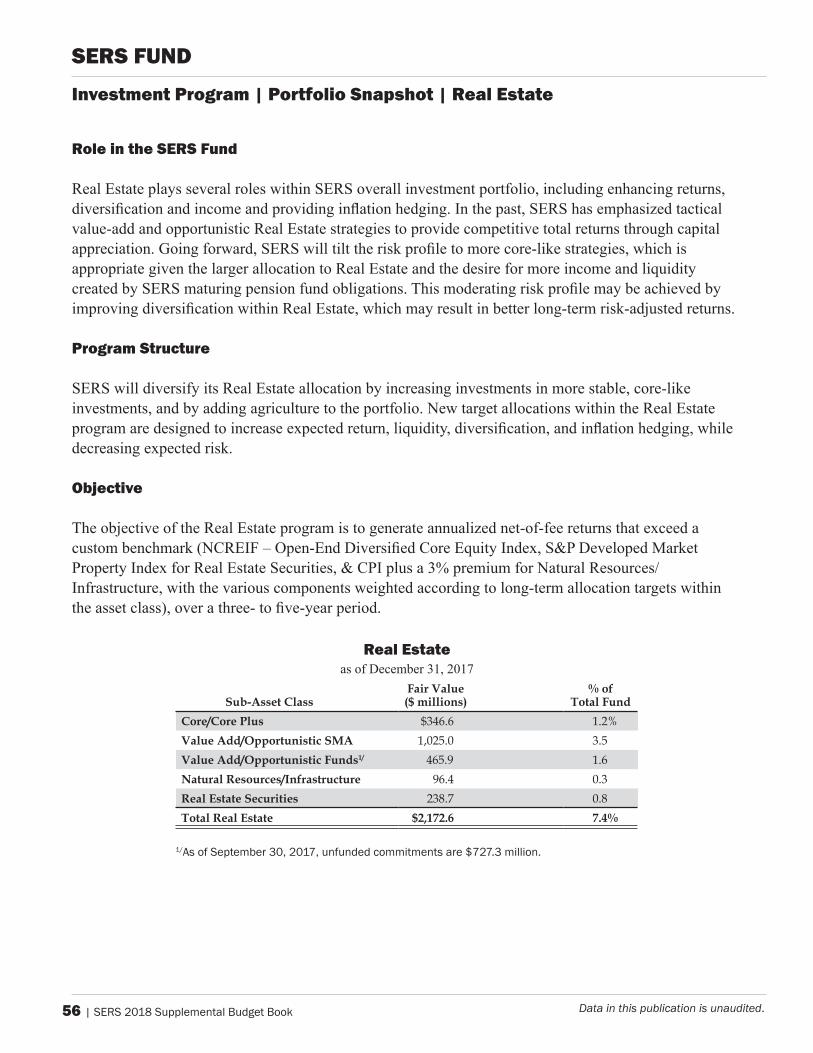
56 | SERS 2018 Supplemental Budget Book Data in this publication is unaudited.
Role in the SERS Fund
Real Estate plays several roles within SERS overall investment portfolio, including enhancing returns, diversification and income and providing inflation hedging. In the past, SERS has emphasized tactical value-add and opportunistic Real Estate strategies to provide competitive total returns through capital appreciation. Going forward, SERS will tilt the risk profile to more core-like strategies, which is appropriate given the larger allocation to Real Estate and the desire for more income and liquidity created by SERS maturing pension fund obligations. This moderating risk profile may be achieved by improving diversification within Real Estate, which may result in better long-term risk-adjusted returns.
program Structure
SERS will diversify its Real Estate allocation by increasing investments in more stable, core-like investments, and by adding agriculture to the portfolio. New target allocations within the Real Estate program are designed to increase expected return, liquidity, diversification, and inflation hedging, while decreasing expected risk.
Objective
The objective of the Real Estate program is to generate annualized net-of-fee returns that exceed a custom benchmark (NCREIF – Open-End Diversified Core Equity Index, S&P Developed Market Property Index for Real Estate Securities, & CPI plus a 3% premium for Natural Resources/Infrastructure, with the various components weighted according to long-term allocation targets within the asset class), over a three- to five-year period.
Real Estateas of December 31, 2017
Sub-Asset ClassFair Value ($ millions)
% of Total Fund
Core/Core Plus $346.6 1.2%Value Add/Opportunistic SMA 1,025.0 3.5Value Add/Opportunistic Funds1/ 465.9 1.6Natural Resources/Infrastructure 96.4 0.3Real Estate Securities 238.7 0.8Total Real Estate $2,172.6 7.4%
1/As of September 30, 2017, unfunded commitments are $727.3 million.
investment program | portfolio Snapshot | Real Estate
SERS Fund
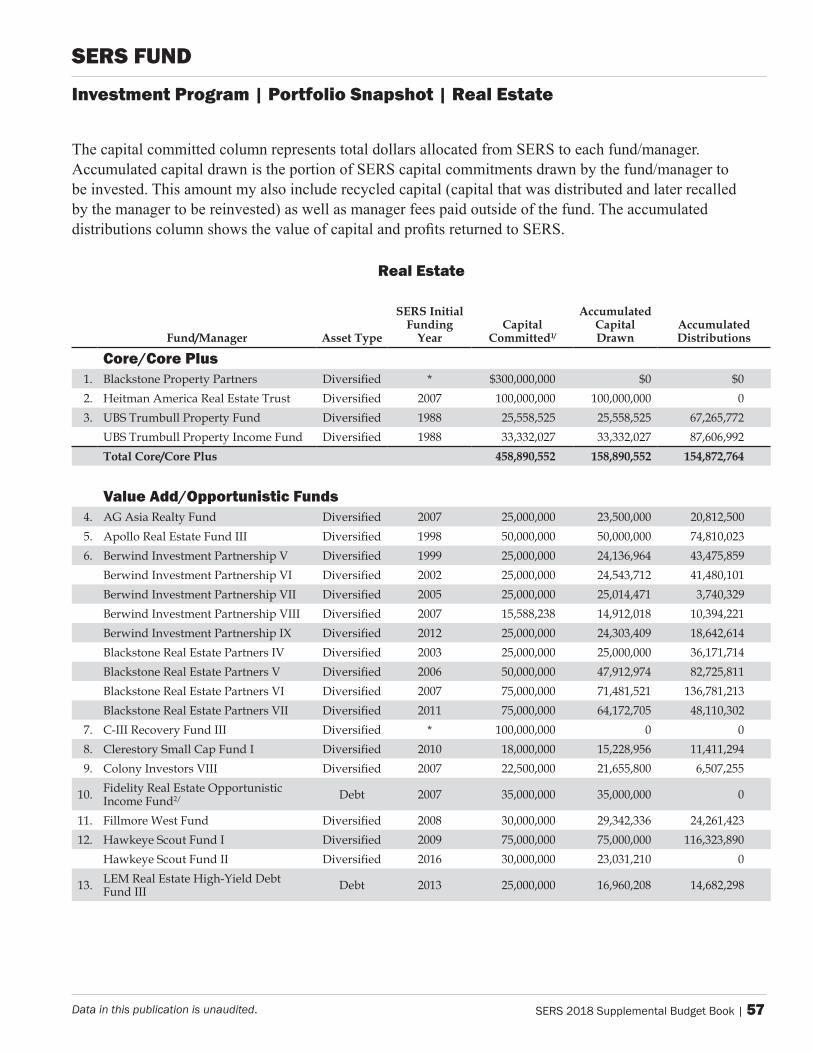
SERS 2018 Supplemental Budget Book | 57Data in this publication is unaudited.
investment program | portfolio Snapshot | Real Estate
SERS Fund
The capital committed column represents total dollars allocated from SERS to each fund/manager. Accumulated capital drawn is the portion of SERS capital commitments drawn by the fund/manager to be invested. This amount my also include recycled capital (capital that was distributed and later recalled by the manager to be reinvested) as well as manager fees paid outside of the fund. The accumulated distributions column shows the value of capital and profits returned to SERS.
Real Estate
Fund/Manager Asset Type
SERS Initial Funding
YearCapital
Committed1/
Accumulated Capital Drawn
Accumulated Distributions
Core/Core plus1. BlackstonePropertyPartners Diversified * $300,000,000 $0 $02. HeitmanAmericaRealEstateTrust Diversified 2007 100,000,000 100,000,000 03. UBSTrumbullPropertyFund Diversified 1988 25,558,525 25,558,525 67,265,772
UBSTrumbullPropertyIncomeFund Diversified 1988 33,332,027 33,332,027 87,606,992Total Core/Core Plus 458,890,552 158,890,552 154,872,764
Value add/Opportunistic Funds4. AGAsiaRealtyFund Diversified 2007 25,000,000 23,500,000 20,812,5005. ApolloRealEstateFundIII Diversified 1998 50,000,000 50,000,000 74,810,0236. BerwindInvestmentPartnershipV Diversified 1999 25,000,000 24,136,964 43,475,859
BerwindInvestmentPartnershipVI Diversified 2002 25,000,000 24,543,712 41,480,101BerwindInvestmentPartnershipVII Diversified 2005 25,000,000 25,014,471 3,740,329BerwindInvestmentPartnershipVIII Diversified 2007 15,588,238 14,912,018 10,394,221BerwindInvestmentPartnershipIX Diversified 2012 25,000,000 24,303,409 18,642,614BlackstoneRealEstatePartnersIV Diversified 2003 25,000,000 25,000,000 36,171,714BlackstoneRealEstatePartnersV Diversified 2006 50,000,000 47,912,974 82,725,811BlackstoneRealEstatePartnersVI Diversified 2007 75,000,000 71,481,521 136,781,213BlackstoneRealEstatePartnersVII Diversified 2011 75,000,000 64,172,705 48,110,302
7. C-IIIRecoveryFundIII Diversified * 100,000,000 0 08. ClerestorySmallCapFundI Diversified 2010 18,000,000 15,228,956 11,411,2949. ColonyInvestorsVIII Diversified 2007 22,500,000 21,655,800 6,507,255
10. FidelityRealEstateOpportunisticIncomeFund2/ Debt 2007 35,000,000 35,000,000 0
11. FillmoreWestFund Diversified 2008 30,000,000 29,342,336 24,261,42312. HawkeyeScoutFundI Diversified 2009 75,000,000 75,000,000 116,323,890
HawkeyeScoutFundII Diversified 2016 30,000,000 23,031,210 0
13. LEMRealEstateHigh-YieldDebtFundIII Debt 2013 25,000,000 16,960,208 14,682,298
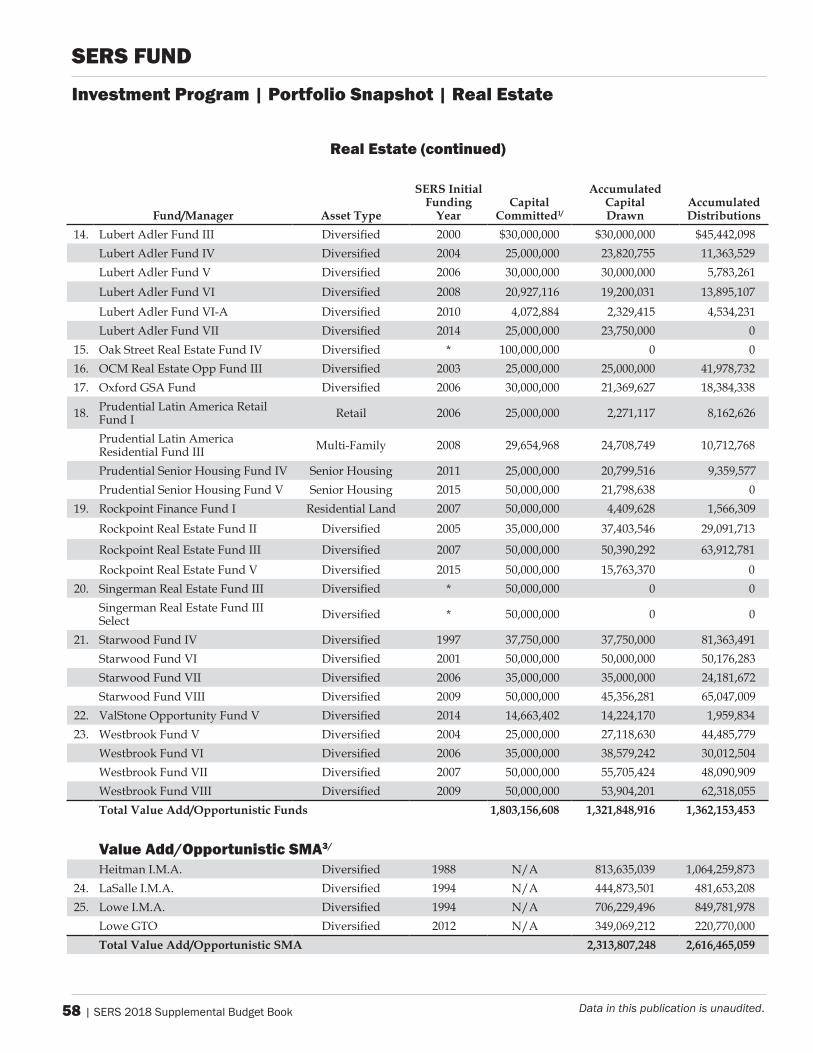
58 | SERS 2018 Supplemental Budget Book Data in this publication is unaudited.
Real Estate (continued)
Fund/Manager Asset Type
SERS Initial Funding
YearCapital
Committed1/
Accumulated Capital Drawn
Accumulated Distributions
14. LubertAdlerFundIII Diversified 2000 $30,000,000 $30,000,000 $45,442,098LubertAdlerFundIV Diversified 2004 25,000,000 23,820,755 11,363,529LubertAdlerFundV Diversified 2006 30,000,000 30,000,000 5,783,261LubertAdlerFundVI Diversified 2008 20,927,116 19,200,031 13,895,107LubertAdlerFundVI-A Diversified 2010 4,072,884 2,329,415 4,534,231LubertAdlerFundVII Diversified 2014 25,000,000 23,750,000 0
15. OakStreetRealEstateFundIV Diversified * 100,000,000 0 016. OCMRealEstateOppFundIII Diversified 2003 25,000,000 25,000,000 41,978,73217. OxfordGSAFund Diversified 2006 30,000,000 21,369,627 18,384,338
18. PrudentialLatinAmericaRetailFundI Retail 2006 25,000,000 2,271,117 8,162,626
PrudentialLatinAmericaResidentialFundIII Multi-Family 2008 29,654,968 24,708,749 10,712,768
PrudentialSeniorHousingFundIV SeniorHousing 2011 25,000,000 20,799,516 9,359,577PrudentialSeniorHousingFundV SeniorHousing 2015 50,000,000 21,798,638 0
19. RockpointFinanceFundI ResidentialLand 2007 50,000,000 4,409,628 1,566,309RockpointRealEstateFundII Diversified 2005 35,000,000 37,403,546 29,091,713
RockpointRealEstateFundIII Diversified 2007 50,000,000 50,390,292 63,912,781RockpointRealEstateFundV Diversified 2015 50,000,000 15,763,370 0
20. SingermanRealEstateFundIII Diversified * 50,000,000 0 0SingermanRealEstateFundIIISelect Diversified * 50,000,000 0 0
21. StarwoodFundIV Diversified 1997 37,750,000 37,750,000 81,363,491StarwoodFundVI Diversified 2001 50,000,000 50,000,000 50,176,283StarwoodFundVII Diversified 2006 35,000,000 35,000,000 24,181,672StarwoodFundVIII Diversified 2009 50,000,000 45,356,281 65,047,009
22. ValStoneOpportunityFundV Diversified 2014 14,663,402 14,224,170 1,959,83423. WestbrookFundV Diversified 2004 25,000,000 27,118,630 44,485,779
WestbrookFundVI Diversified 2006 35,000,000 38,579,242 30,012,504WestbrookFundVII Diversified 2007 50,000,000 55,705,424 48,090,909WestbrookFundVIII Diversified 2009 50,000,000 53,904,201 62,318,055Total Value Add/Opportunistic Funds 1,803,156,608 1,321,848,916 1,362,153,453
Value add/Opportunistic Sma3/
HeitmanI.M.A. Diversified 1988 N/A 813,635,039 1,064,259,87324. LaSalleI.M.A. Diversified 1994 N/A 444,873,501 481,653,20825. LoweI.M.A. Diversified 1994 N/A 706,229,496 849,781,978
LoweGTO Diversified 2012 N/A 349,069,212 220,770,000Total Value Add/Opportunistic SMA 2,313,807,248 2,616,465,059
investment program | portfolio Snapshot | Real Estate
SERS Fund
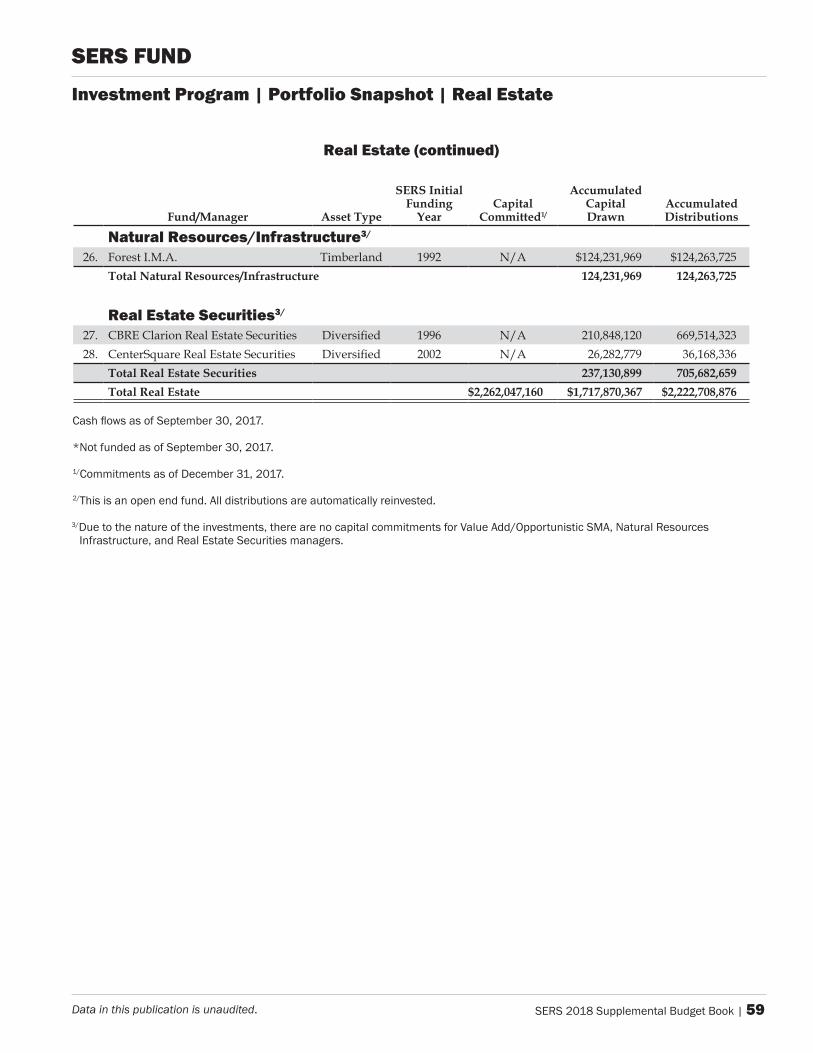
SERS 2018 Supplemental Budget Book | 59Data in this publication is unaudited.
Real Estate (continued)
Fund/Manager Asset Type
SERS Initial Funding
YearCapital
Committed1/
Accumulated Capital Drawn
Accumulated Distributions
natural Resources/infrastructure3/
26. ForestI.M.A. Timberland 1992 N/A $124,231,969 $124,263,725Total Natural Resources/Infrastructure 124,231,969 124,263,725
Real Estate Securities3/
27. CBREClarionRealEstateSecurities Diversified 1996 N/A 210,848,120 669,514,32328. CenterSquareRealEstateSecurities Diversified 2002 N/A 26,282,779 36,168,336
Total Real Estate Securities 237,130,899 705,682,659Total Real Estate $2,262,047,160 $1,717,870,367 $2,222,708,876
Cash flows as of September 30, 2017.
*Not funded as of September 30, 2017.
1/Commitments as of December 31, 2017.
2/This is an open end fund. All distributions are automatically reinvested.
3/Due to the nature of the investments, there are no capital commitments for Value Add/Opportunistic SMA, Natural Resources Infrastructure, and Real Estate Securities managers.
investment program | portfolio Snapshot | Real Estate
SERS Fund
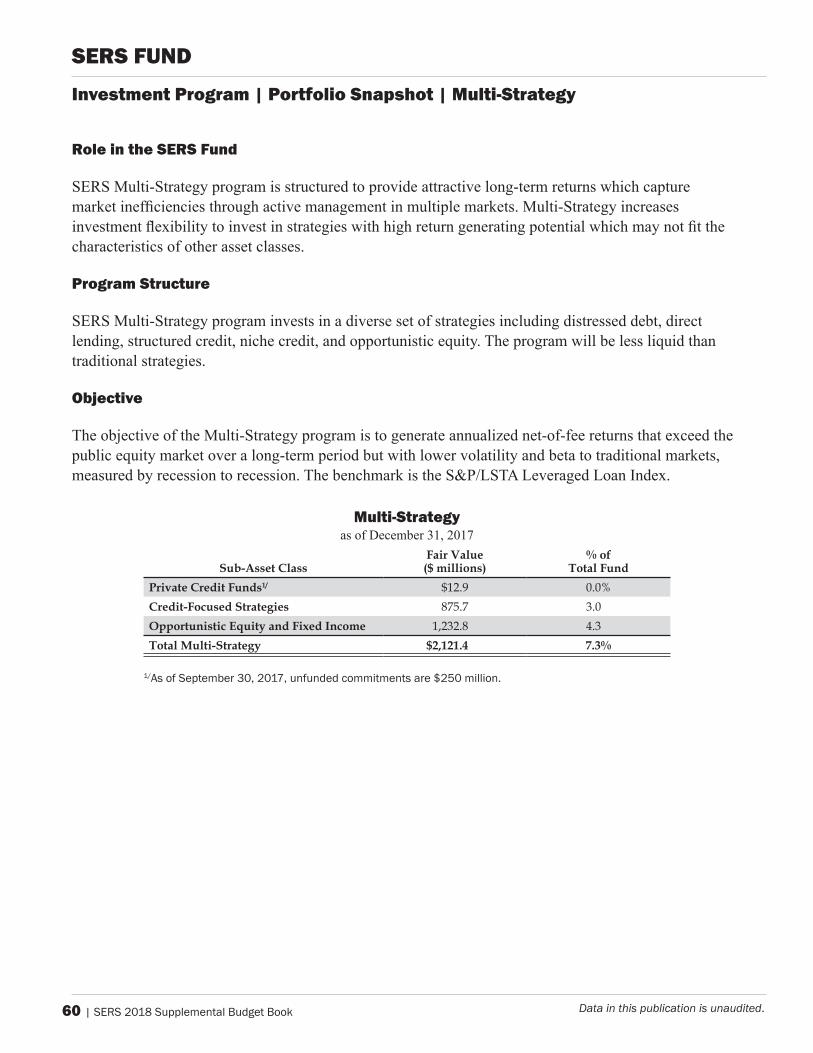
60 | SERS 2018 Supplemental Budget Book Data in this publication is unaudited.
SERS Fund
Investment Program | Portfolio Snapshot | Multi-Strategy
Role in the SERS Fund
SERS Multi-Strategy program is structured to provide attractive long-term returns which capture market inefficiencies through active management in multiple markets. Multi-Strategy increases investment flexibility to invest in strategies with high return generating potential which may not fit the characteristics of other asset classes.
program Structure
SERS Multi-Strategy program invests in a diverse set of strategies including distressed debt, direct lending, structured credit, niche credit, and opportunistic equity. The program will be less liquid than traditional strategies.
Objective
The objective of the Multi-Strategy program is to generate annualized net-of-fee returns that exceed the public equity market over a long-term period but with lower volatility and beta to traditional markets, measured by recession to recession. The benchmark is the S&P/LSTA Leveraged Loan Index.
Multi-Strategyas of December 31, 2017
Sub-Asset ClassFair Value ($ millions)
% of Total Fund
Private Credit Funds1/ $12.9 0.0%Credit-Focused Strategies 875.7 3.0Opportunistic Equity and Fixed Income 1,232.8 4.3Total Multi-Strategy $2,121.4 7.3%
1/As of September 30, 2017, unfunded commitments are $250 million.
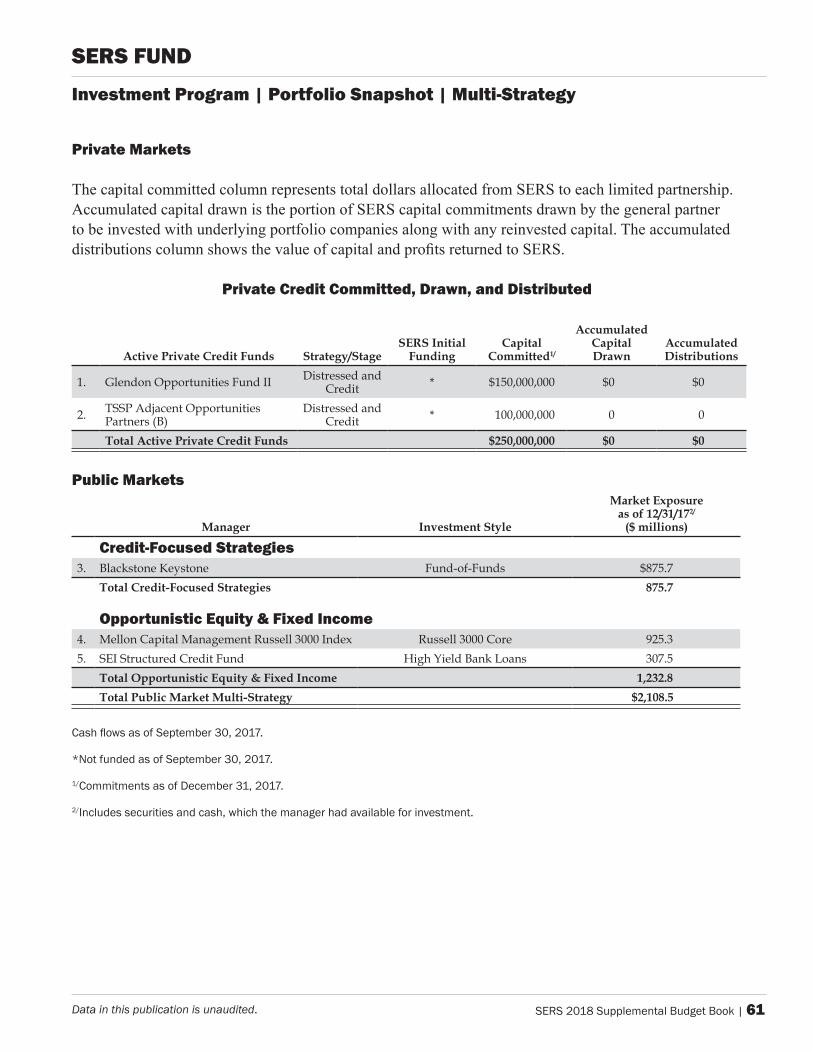
SERS 2018 Supplemental Budget Book | 61Data in this publication is unaudited.
SERS Fund
Investment Program | Portfolio Snapshot | Multi-Strategy
private markets
The capital committed column represents total dollars allocated from SERS to each limited partnership. Accumulated capital drawn is the portion of SERS capital commitments drawn by the general partner to be invested with underlying portfolio companies along with any reinvested capital. The accumulated distributions column shows the value of capital and profits returned to SERS.
private Credit Committed, drawn, and distributed
Active Private Credit Funds Strategy/StageSERS Initial
FundingCapital
Committed1/
Accumulated Capital Drawn
Accumulated Distributions
1. GlendonOpportunitiesFundII DistressedandCredit * $150,000,000 $0 $0
2. TSSPAdjacentOpportunitiesPartners(B)
DistressedandCredit * 100,000,000 0 0
Total Active Private Credit Funds $250,000,000 $0 $0
public markets
Manager Investment Style
Market Exposure as of 12/31/172/
($ millions)
Credit-Focused Strategies3. BlackstoneKeystone Fund-of-Funds $875.7
Total Credit-Focused Strategies 875.7
Opportunistic Equity & Fixed Income4. MellonCapitalManagementRussell3000Index Russell3000Core 925.35. SEIStructuredCreditFund HighYieldBankLoans 307.5
Total Opportunistic Equity & Fixed Income 1,232.8 Total Public Market Multi-Strategy $2,108.5
Cash flows as of September 30, 2017.
*Not funded as of September 30, 2017.
1/Commitments as of December 31, 2017.
2/Includes securities and cash, which the manager had available for investment.
62 | SERS 2018 Supplemental Budget Book Data in this publication is unaudited.
Role in the SERS Fund
SERS Legacy Hedge Fund program included investments designed to provide total returns comparable to the total fund return but with lower volatility and correlation to other asset classes. SERS Legacy Hedge Fund program was designed to provide attractive long-term, risk-adjusted returns, diversification from equity markets, low beta to equity markets, and downside protection during prolonged periods of equity market decline. SERS Legacy Hedge Fund portfolios are currently in liquidation.
program Structure
Investments in hedge funds are achieved through funds-of-hedge funds and direct investment in hedge funds. SERS Legacy Hedge Fund program invests in a diverse set of strategies including long/short equity, global macro, relative value, credit, event driven, and other hedge fund strategies – all with attractive long-term, risk-adjusted returns. The program is designed to target a liquidity profile less than that of public equities but significantly more liquid than private equity.
Objective
The objective of the Legacy Hedge Fund program is to generate annualized net-of-fee returns that exceed its benchmark, the HF Custom Index, over a three- to five-year period.
Investment Program | Portfolio Snapshot | Legacy Hedge Funds
SERS Fund
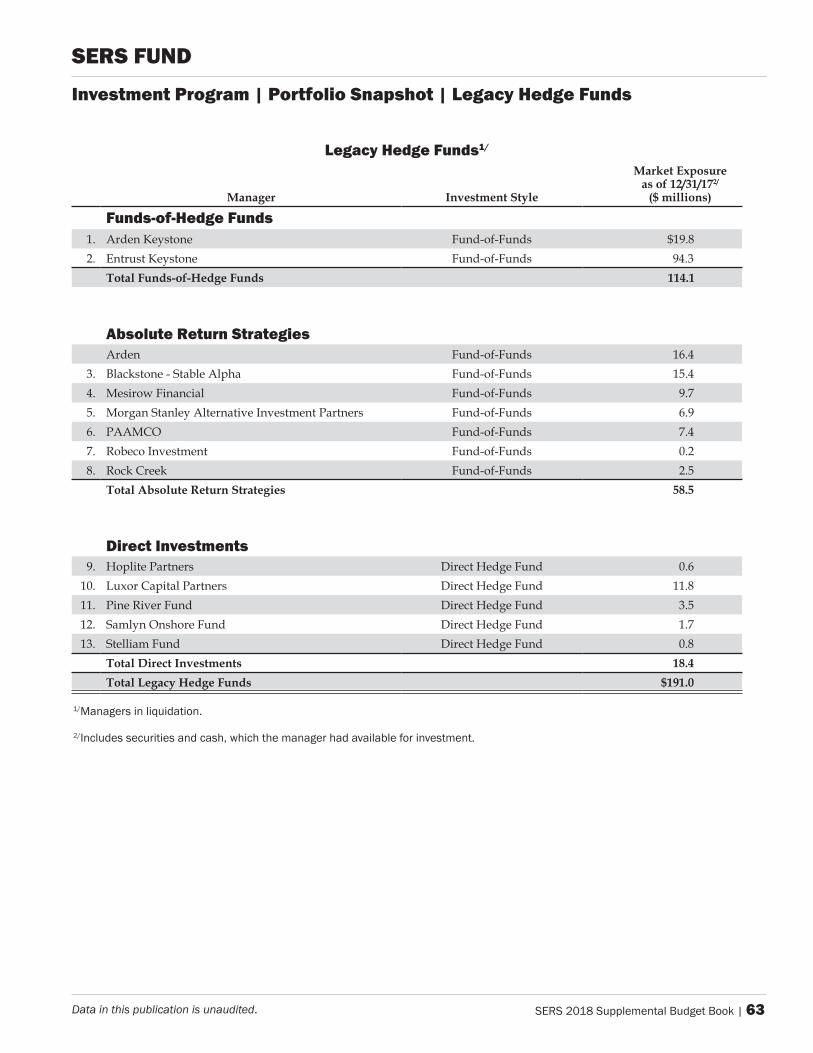
SERS 2018 Supplemental Budget Book | 63Data in this publication is unaudited.
Legacy Hedge Funds1/
Manager Investment Style
Market Exposure as of 12/31/172/
($ millions)
Funds-of-Hedge Funds1. ArdenKeystone Fund-of-Funds $19.82. EntrustKeystone Fund-of-Funds 94.3
Total Funds-of-Hedge Funds 114.1
absolute Return StrategiesArden Fund-of-Funds 16.4
3. Blackstone-StableAlpha Fund-of-Funds 15.44. MesirowFinancial Fund-of-Funds 9.75. MorganStanleyAlternativeInvestmentPartners Fund-of-Funds 6.96. PAAMCO Fund-of-Funds 7.47. RobecoInvestment Fund-of-Funds 0.28. RockCreek Fund-of-Funds 2.5
Total Absolute Return Strategies 58.5
direct investments9. HoplitePartners DirectHedgeFund 0.6
10. LuxorCapitalPartners DirectHedgeFund 11.811. PineRiverFund DirectHedgeFund 3.512. SamlynOnshoreFund DirectHedgeFund 1.713. StelliamFund DirectHedgeFund 0.8
Total Direct Investments 18.4Total Legacy Hedge Funds $191.0
1/Managers in liquidation.
2/Includes securities and cash, which the manager had available for investment.
Investment Program | Portfolio Snapshot | Legacy Hedge Funds
SERS Fund
64 | SERS 2018 Supplemental Budget Book Data in this publication is unaudited.
Role in the SERS Fund
SERS Fixed Income program is structured to:
• Generate income to pay benefits
• Provide additional liquidity to minimize capital impairment risk
• Reduce volatility of the total fund
• Protect SERS against deflation (and inflation via TIPS)
• Contribute total return to SERS when market conditions permit
program Structure
Fixed income includes investments in publicly-traded debt obligations of sovereign, quasi-sovereign, and corporate entities. The asset class generates current income and the repayment of principal at maturity. Shorter duration fixed income has substantially lower volatility than equity, and most fixed income investments have a low correlation with equity returns. SERS Fixed Income program is categorized into five strategies and a separate cash allocation to improve transparency on SERS unallocated cash amount.
Objective
The objective of the Fixed Income program is to generate annualized net-of-fee returns that exceed its benchmark, the Bloomberg Barclays U.S. Aggregate Bond Index, over a three- to five-year period.
investment program | portfolio Snapshot | Fixed income
SERS Fund
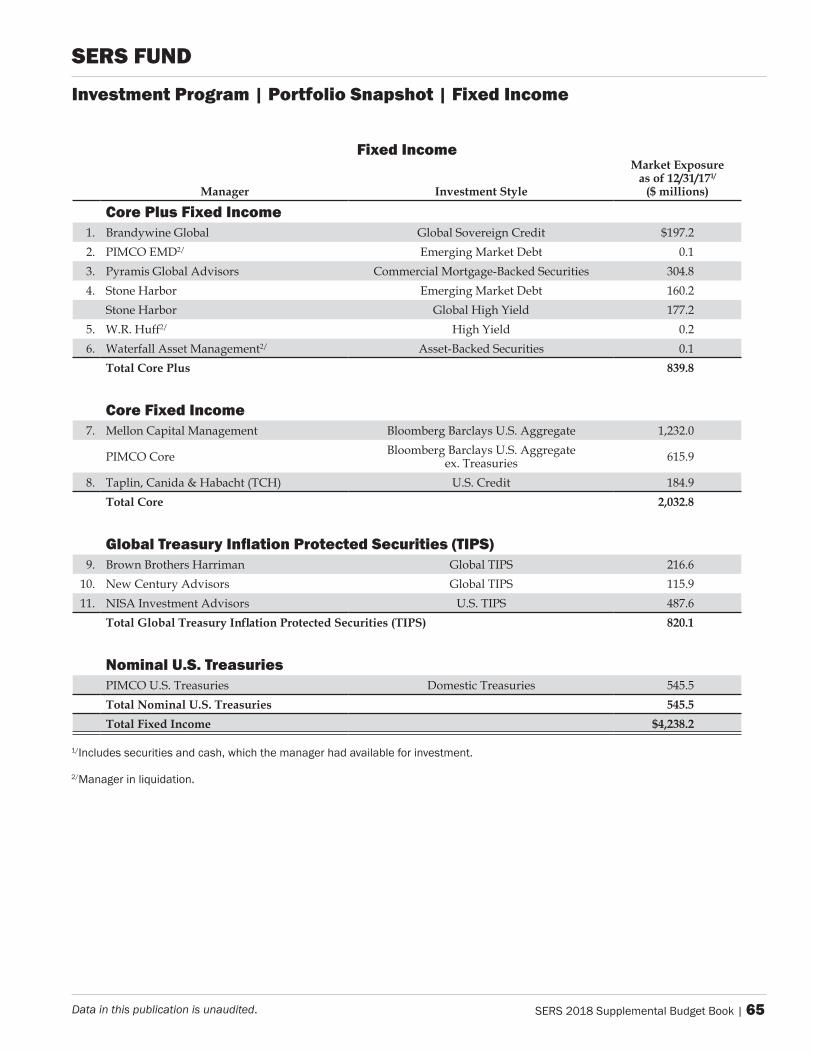
SERS 2018 Supplemental Budget Book | 65Data in this publication is unaudited.
Fixed income
Manager Investment Style
Market Exposure as of 12/31/171/
($ millions)
Core plus Fixed income1. BrandywineGlobal GlobalSovereignCredit $197.22. PIMCOEMD2/ EmergingMarketDebt 0.13. PyramisGlobalAdvisors CommercialMortgage-BackedSecurities 304.84. StoneHarbor EmergingMarketDebt 160.2
StoneHarbor GlobalHighYield 177.25. W.R.Huff2/ HighYield 0.26. WaterfallAssetManagement2/ Asset-BackedSecurities 0.1
Total Core Plus 839.8
Core Fixed income7. MellonCapitalManagement BloombergBarclaysU.S.Aggregate 1,232.0
PIMCOCore BloombergBarclaysU.S.Aggregateex.Treasuries 615.9
8. Taplin,Canida&Habacht(TCH) U.S.Credit 184.9Total Core 2,032.8
Global Treasury Inflation Protected Securities (TIPS)9. BrownBrothersHarriman GlobalTIPS 216.6
10. NewCenturyAdvisors GlobalTIPS 115.911. NISAInvestmentAdvisors U.S.TIPS 487.6
Total Global Treasury Inflation Protected Securities (TIPS) 820.1
nominal u.S. treasuriesPIMCOU.S.Treasuries DomesticTreasuries 545.5Total Nominal U.S. Treasuries 545.5Total Fixed Income $4,238.2
1/Includes securities and cash, which the manager had available for investment.
2/Manager in liquidation.
investment program | portfolio Snapshot | Fixed income
SERS Fund
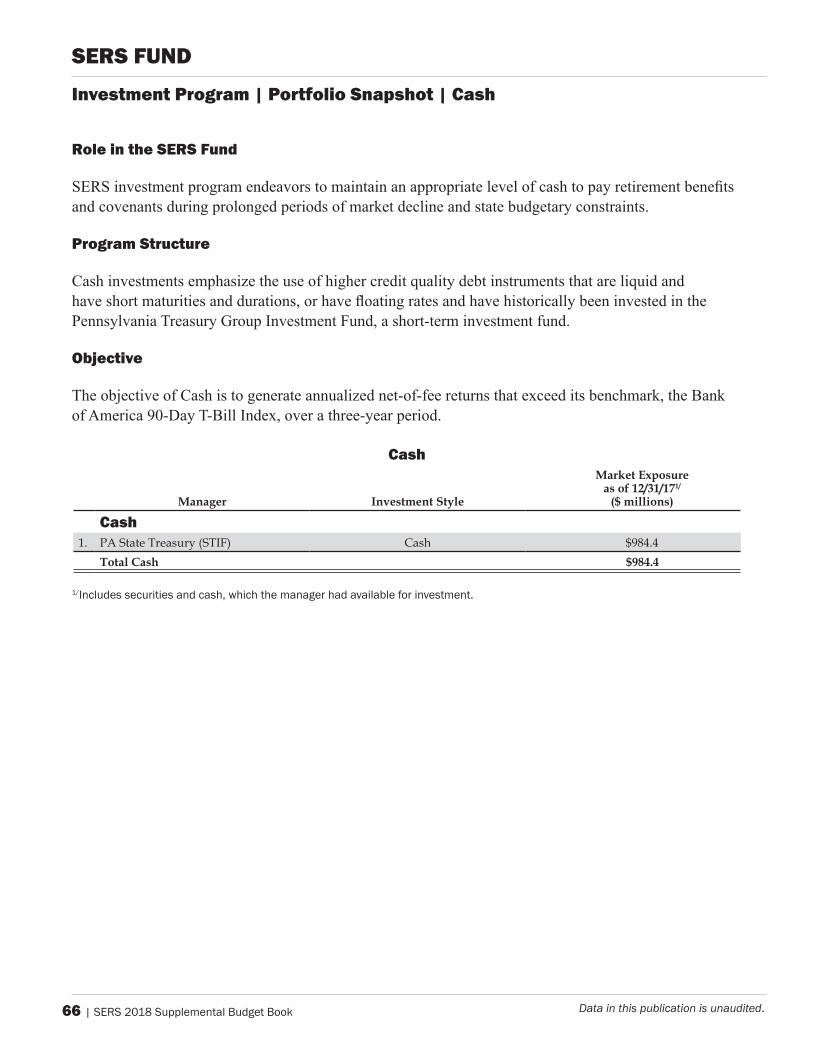
66 | SERS 2018 Supplemental Budget Book Data in this publication is unaudited.
investment program | portfolio Snapshot | Cash
SERS Fund
Role in the SERS Fund
SERS investment program endeavors to maintain an appropriate level of cash to pay retirement benefits and covenants during prolonged periods of market decline and state budgetary constraints.
program Structure
Cash investments emphasize the use of higher credit quality debt instruments that are liquid and have short maturities and durations, or have floating rates and have historically been invested in the Pennsylvania Treasury Group Investment Fund, a short-term investment fund.
Objective
The objective of Cash is to generate annualized net-of-fee returns that exceed its benchmark, the Bank of America 90-Day T-Bill Index, over a three-year period.
Cash
Manager Investment Style
Market Exposure as of 12/31/171/
($ millions)
Cash1. PAStateTreasury(STIF) Cash $984.4
Total Cash $984.4
1/Includes securities and cash, which the manager had available for investment.
SERS Fund
Pennsylvania Investments
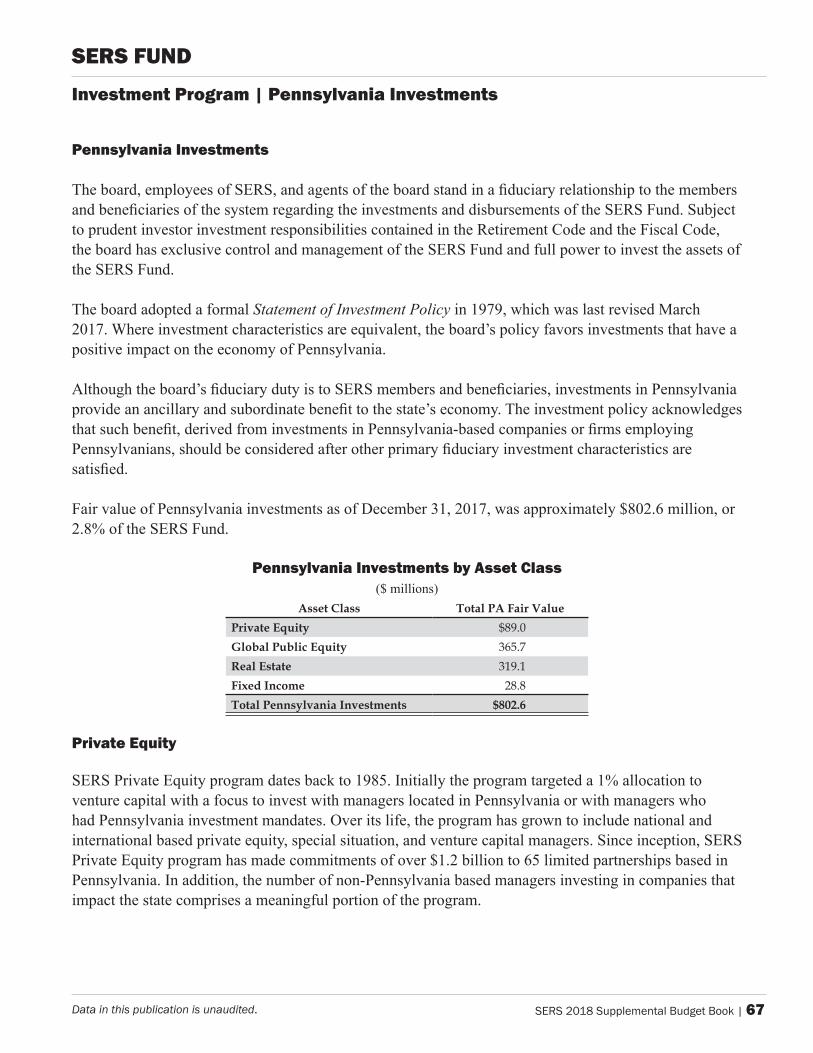
SERS 2018 Supplemental Budget Book | 67Data in this publication is unaudited.
Pennsylvania Investments The board, employees of SERS, and agents of the board stand in a fiduciary relationship to the members and beneficiaries of the system regarding the investments and disbursements of the SERS Fund. Subject to prudent investor investment responsibilities contained in the Retirement Code and the Fiscal Code, the board has exclusive control and management of the SERS Fund and full power to invest the assets of the SERS Fund.
The board adopted a formal Statement of Investment Policy in 1979, which was last revised March 2017. Where investment characteristics are equivalent, the board’s policy favors investments that have a positive impact on the economy of Pennsylvania.
Although the board’s fiduciary duty is to SERS members and beneficiaries, investments in Pennsylvania provide an ancillary and subordinate benefit to the state’s economy. The investment policy acknowledges that such benefit, derived from investments in Pennsylvania-based companies or firms employing Pennsylvanians, should be considered after other primary fiduciary investment characteristics are satisfied.
Fair value of Pennsylvania investments as of December 31, 2017, was approximately $802.6 million, or 2.8% of the SERS Fund.
Pennsylvania Investments by Asset Class ($ millions)
Asset Class Total PA Fair ValuePrivate Equity $89.0Global Public Equity 365.7Real Estate 319.1Fixed Income 28.8Total Pennsylvania Investments $802.6
Private Equity
SERS Private Equity program dates back to 1985. Initially the program targeted a 1% allocation to venture capital with a focus to invest with managers located in Pennsylvania or with managers who had Pennsylvania investment mandates. Over its life, the program has grown to include national and international based private equity, special situation, and venture capital managers. Since inception, SERS Private Equity program has made commitments of over $1.2 billion to 65 limited partnerships based in Pennsylvania. In addition, the number of non-Pennsylvania based managers investing in companies that impact the state comprises a meaningful portion of the program.
Investment Program | Pennsylvania Investments
SERS Fund
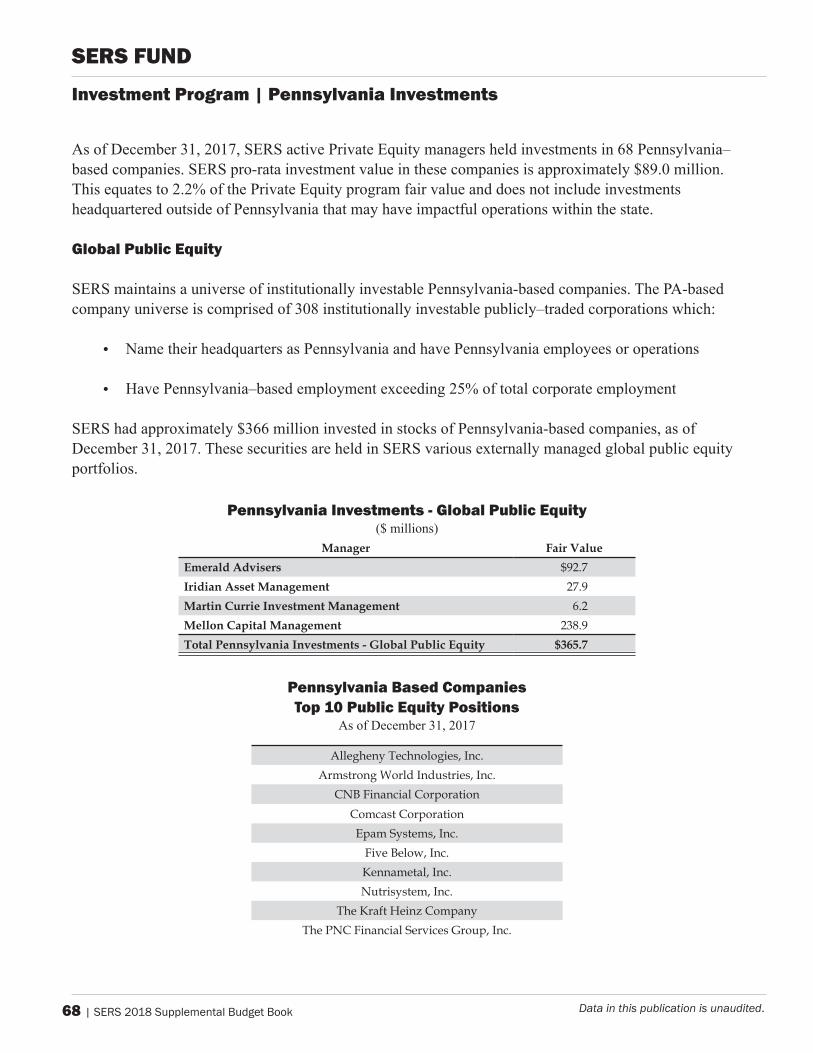
68 | SERS 2018 Supplemental Budget Book Data in this publication is unaudited.
Investment Program | Pennsylvania Investments
SERS Fund
As of December 31, 2017, SERS active Private Equity managers held investments in 68 Pennsylvania–based companies. SERS pro-rata investment value in these companies is approximately $89.0 million. This equates to 2.2% of the Private Equity program fair value and does not include investments headquartered outside of Pennsylvania that may have impactful operations within the state.
Global Public Equity
SERS maintains a universe of institutionally investable Pennsylvania-based companies. The PA-based company universe is comprised of 308 institutionally investable publicly–traded corporations which:
• Name their headquarters as Pennsylvania and have Pennsylvania employees or operations
• Have Pennsylvania–based employment exceeding 25% of total corporate employment
SERS had approximately $366 million invested in stocks of Pennsylvania-based companies, as of December 31, 2017. These securities are held in SERS various externally managed global public equity portfolios.
Pennsylvania Investments - Global Public Equity($ millions)
Manager Fair ValueEmerald Advisers $92.7Iridian Asset Management 27.9Martin Currie Investment Management 6.2Mellon Capital Management 238.9Total Pennsylvania Investments - Global Public Equity $365.7
Pennsylvania Based CompaniesTop 10 Public Equity Positions
As of December 31, 2017
AlleghenyTechnologies,Inc.ArmstrongWorldIndustries,Inc.
CNBFinancialCorporationComcastCorporationEpamSystems,Inc.FiveBelow,Inc.Kennametal,Inc.Nutrisystem,Inc.
TheKraftHeinzCompanyThePNCFinancialServicesGroup,Inc.
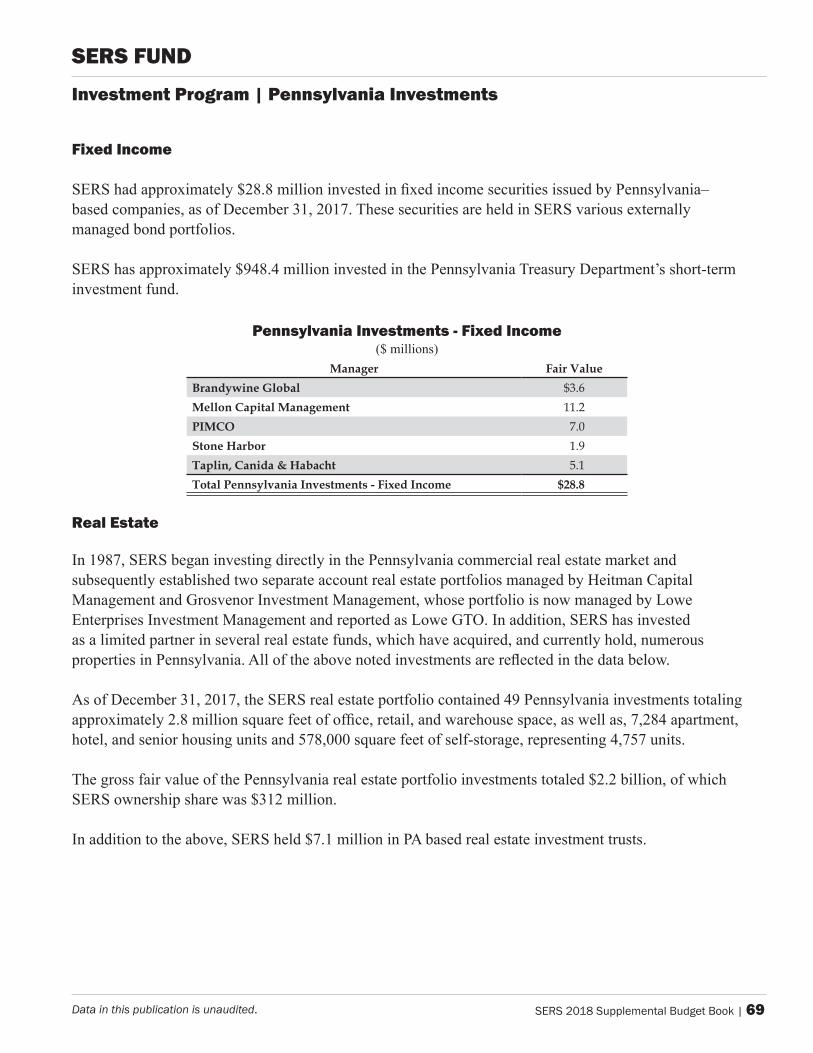
SERS 2018 Supplemental Budget Book | 69Data in this publication is unaudited.
Investment Program | Pennsylvania Investments
SERS Fund
Fixed income
SERS had approximately $28.8 million invested in fixed income securities issued by Pennsylvania–based companies, as of December 31, 2017. These securities are held in SERS various externally managed bond portfolios.
SERS has approximately $948.4 million invested in the Pennsylvania Treasury Department’s short-term investment fund.
Pennsylvania Investments - Fixed Income($ millions)
Manager Fair ValueBrandywine Global $3.6Mellon Capital Management 11.2PIMCO 7.0Stone Harbor 1.9Taplin, Canida & Habacht 5.1Total Pennsylvania Investments - Fixed Income $28.8
Real Estate
In 1987, SERS began investing directly in the Pennsylvania commercial real estate market and subsequently established two separate account real estate portfolios managed by Heitman Capital Management and Grosvenor Investment Management, whose portfolio is now managed by Lowe Enterprises Investment Management and reported as Lowe GTO. In addition, SERS has invested as a limited partner in several real estate funds, which have acquired, and currently hold, numerous properties in Pennsylvania. All of the above noted investments are reflected in the data below.
As of December 31, 2017, the SERS real estate portfolio contained 49 Pennsylvania investments totaling approximately 2.8 million square feet of office, retail, and warehouse space, as well as, 7,284 apartment, hotel, and senior housing units and 578,000 square feet of self-storage, representing 4,757 units.
The gross fair value of the Pennsylvania real estate portfolio investments totaled $2.2 billion, of which SERS ownership share was $312 million.
In addition to the above, SERS held $7.1 million in PA based real estate investment trusts.
SERS Fund
Minority/Woman-Owned Managers and Brokers
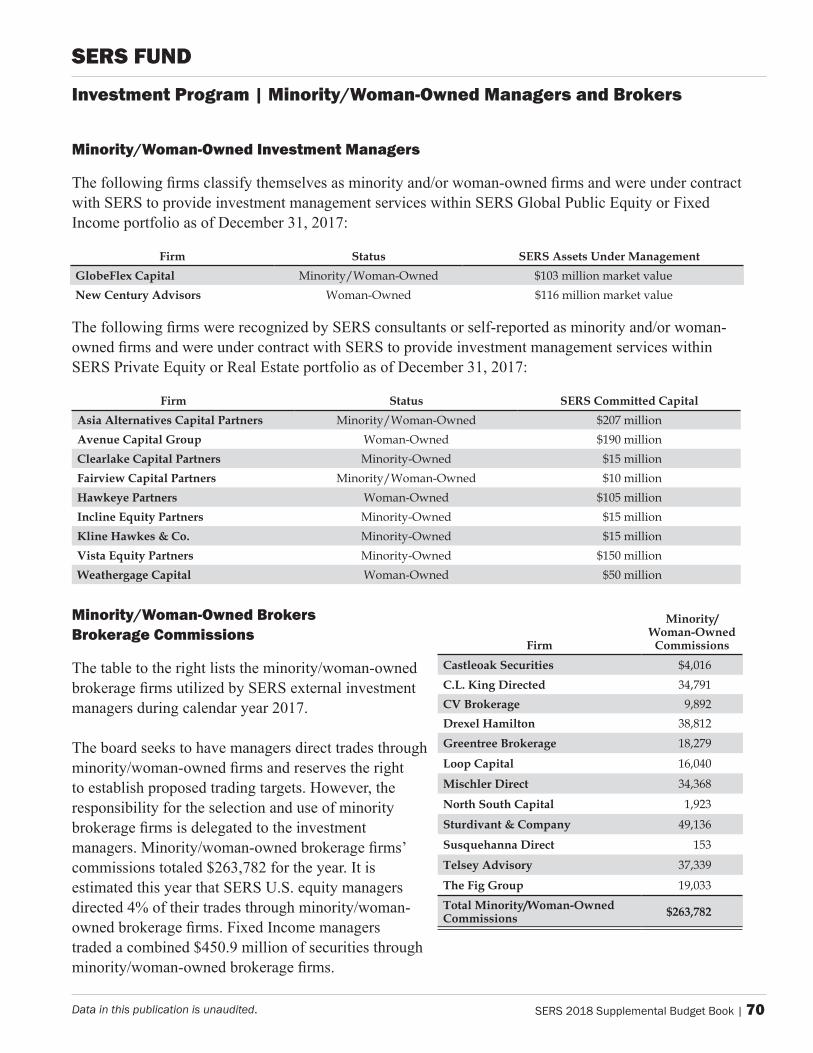
SERS 2018 Supplemental Budget Book | 70Data in this publication is unaudited.
Firm
Minority/ Woman-Owned
CommissionsCastleoak Securities $4,016C.L. King Directed 34,791CV Brokerage 9,892Drexel Hamilton 38,812Greentree Brokerage 18,279
Loop Capital 16,040
Mischler Direct 34,368
North South Capital 1,923
Sturdivant & Company 49,136
Susquehanna Direct 153
Telsey Advisory 37,339
The Fig Group 19,033Total Minority/Woman-Owned Commissions $263,782
Minority/Woman-Owned Investment Managers
The following firms classify themselves as minority and/or woman-owned firms and were under contract with SERS to provide investment management services within SERS Global Public Equity or Fixed Income portfolio as of December 31, 2017:
Firm Status SERS Assets Under ManagementGlobeFlex Capital Minority/Woman-Owned $103millionmarketvalueNew Century Advisors Woman-Owned $116millionmarketvalue
The following firms were recognized by SERS consultants or self-reported as minority and/or woman-owned firms and were under contract with SERS to provide investment management services within SERS Private Equity or Real Estate portfolio as of December 31, 2017:
Firm Status SERS Committed CapitalAsia Alternatives Capital Partners Minority/Woman-Owned $207millionAvenue Capital Group Woman-Owned $190millionClearlake Capital Partners Minority-Owned $15millionFairview Capital Partners Minority/Woman-Owned $10millionHawkeye Partners Woman-Owned $105millionIncline Equity Partners Minority-Owned $15millionKline Hawkes & Co. Minority-Owned $15millionVista Equity Partners Minority-Owned $150millionWeathergage Capital Woman-Owned $50million
Minority/Woman-Owned Brokers brokerage Commissions
The table to the right lists the minority/woman-owned brokerage firms utilized by SERS external investment managers during calendar year 2017.
The board seeks to have managers direct trades through minority/woman-owned firms and reserves the right to establish proposed trading targets. However, the responsibility for the selection and use of minority brokerage firms is delegated to the investment managers. Minority/woman-owned brokerage firms’ commissions totaled $263,782 for the year. It is estimated this year that SERS U.S. equity managers directed 4% of their trades through minority/woman-owned brokerage firms. Fixed Income managers traded a combined $450.9 million of securities through minority/woman-owned brokerage firms.
Investment Program | Minority/Woman-Owned Managers and Brokers
SERS Fund
457 Deferred Compensation Plan
SERS 2018 Supplemental Budget Book | 71Data in this publication is unaudited.
As indicated earlier in this book, the Pennsylvania State Employees’ Retirement System administers two retirement plans to help safeguard the financial security of the commonwealth’s public workforce in its retirement years. Most state employees are required to participate in Pennsylvania’s defined benefit plan. Most employees who are eligible to participate in the defined benefit plan may choose to augment their retirement savings by also voluntarily participating in the 457 deferred compensation plan (457 plan).
The economic engine of the defined benefit plan is the SERS Fund, which is reviewed in-depth in the previous section. Details about 457 plan are provided here.
457 Plan History
Act 1987-81 charged the SERS Board with establishing and managing a 457 plan for the commonwealth’s employees and officers. The 457 plan allows employees to voluntarily build retirement savings and achieve certain tax advantages by deferring a portion of their salaries to selected investment options.
The 457 plan was established as a trust and is administered in accordance with Internal Revenue Code Section 457(b). The array of investment options from which participants may choose is examined, selected, and overseen by the SERS Board.
SERS uses a competitive request-for-proposals process to retain a third-party administrator for the 457 plan. Responsibilities of the third-party administrator include, but are not limited to, marketing the 457 plan, maintaining participant records, and counseling participants with regard to the benefit offered. The most recent competitive process was conducted and a contract was awarded in 2013 to Great-West Life & Annuity Insurance Company, which has retained this role since 2003. Today, Empower Retirement is the brand name for the company’s retirement services division, and Great-West Financial is the brand for its insurance, annuity, and investment businesses.
The cost of administering the 457 plan is extremely low and is borne solely by participants, using no commonwealth funds.
In 2012, the 457 plan began accepting deferrals into designated Roth accounts. Participants pay federal income tax on the amount of their Roth deferrals at the time of investment and then qualified distributions from their Roth accounts are tax-free in retirement.
In October 2014, the plan document was amended to allow in-plan conversions of assets to Roth assets.
In 2017, the SERS Board selected Invesco Advisers to take over the 457 plan’s Stable Value Fund from Weaver C. Barksdale.
History, Growth & Highlights
457 DeferreD ComPensation Plan
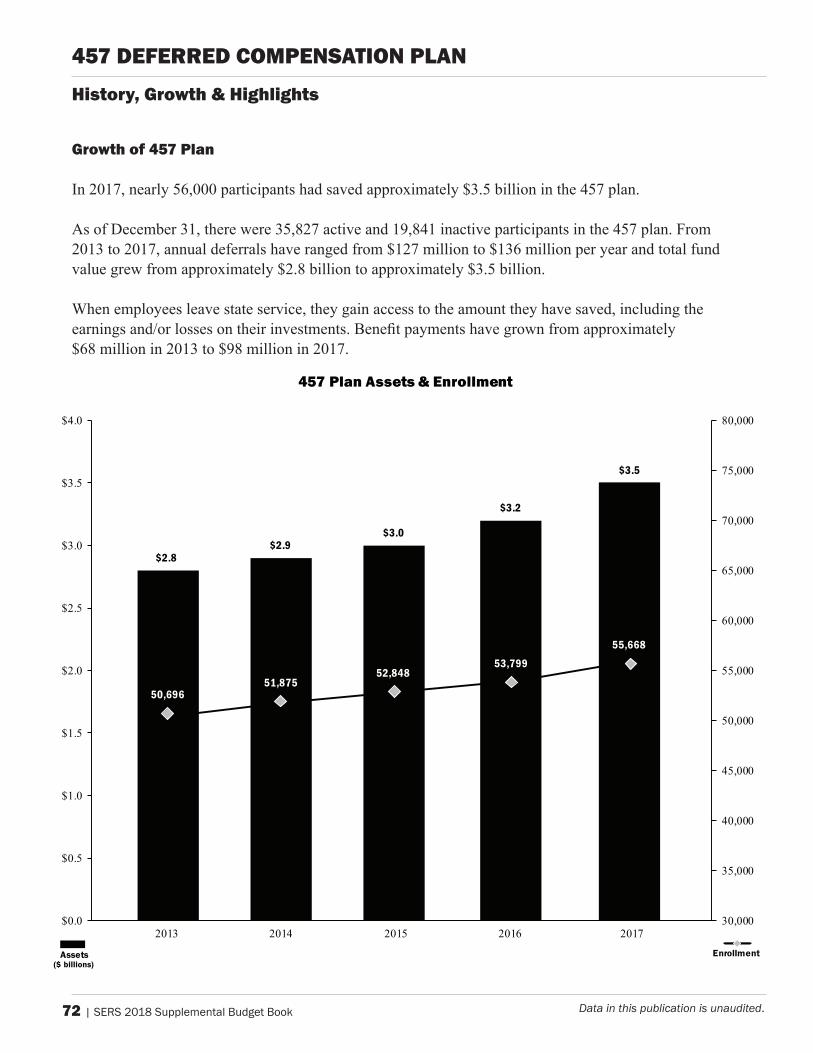
72 | SERS 2018 Supplemental Budget Book Data in this publication is unaudited.
growth of 457 plan
In 2017, nearly 56,000 participants had saved approximately $3.5 billion in the 457 plan.
As of December 31, there were 35,827 active and 19,841 inactive participants in the 457 plan. From 2013 to 2017, annual deferrals have ranged from $127 million to $136 million per year and total fund value grew from approximately $2.8 billion to approximately $3.5 billion.
When employees leave state service, they gain access to the amount they have saved, including the earnings and/or losses on their investments. Benefit payments have grown from approximately $68 million in 2013 to $98 million in 2017.
History, Growth & Highlights
457 dEFERREd COmpEnSatiOn plan
$2.8 $2.9
$3.0
$3.2
$3.5
50,696 51,875
52,848 53,799
55,668
30,000
35,000
40,000
45,000
50,000
55,000
60,000
65,000
70,000
75,000
80,000
$0.0
$0.5
$1.0
$1.5
$2.0
$2.5
$3.0
$3.5
$4.0
2013 2014 2015 2016 2017
457 Plan Assets & Enrollment
Assets($ billions)
Enrollment
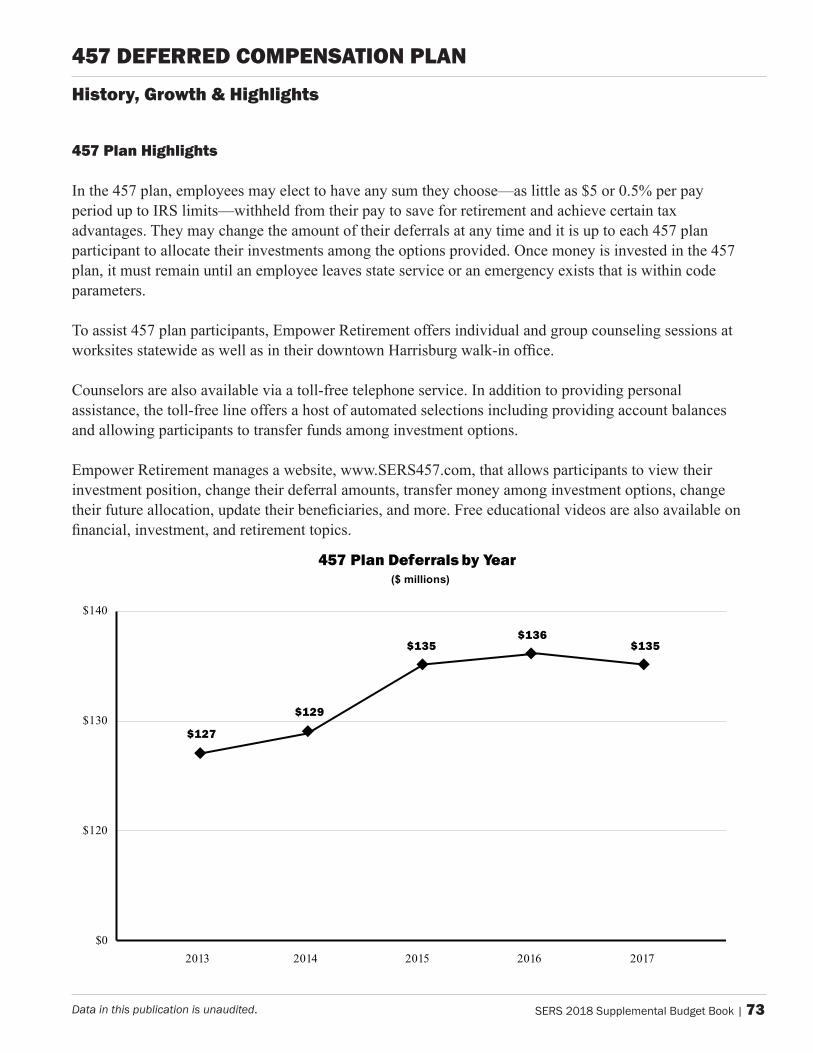
SERS 2018 Supplemental Budget Book | 73Data in this publication is unaudited.
457 plan Highlights
In the 457 plan, employees may elect to have any sum they choose—as little as $5 or 0.5% per pay period up to IRS limits—withheld from their pay to save for retirement and achieve certain tax advantages. They may change the amount of their deferrals at any time and it is up to each 457 plan participant to allocate their investments among the options provided. Once money is invested in the 457 plan, it must remain until an employee leaves state service or an emergency exists that is within code parameters.
To assist 457 plan participants, Empower Retirement offers individual and group counseling sessions at worksites statewide as well as in their downtown Harrisburg walk-in office.
Counselors are also available via a toll-free telephone service. In addition to providing personal assistance, the toll-free line offers a host of automated selections including providing account balances and allowing participants to transfer funds among investment options. Empower Retirement manages a website, www.SERS457.com, that allows participants to view their investment position, change their deferral amounts, transfer money among investment options, change their future allocation, update their beneficiaries, and more. Free educational videos are also available on financial, investment, and retirement topics.
History, Growth & Highlights
457 dEFERREd COmpEnSatiOn plan
$127
$129
$135$136
$135
$0
$120
$130
$140
2013 2014 2015 2016 2017
457 Plan Deferrals by Year($ millions)
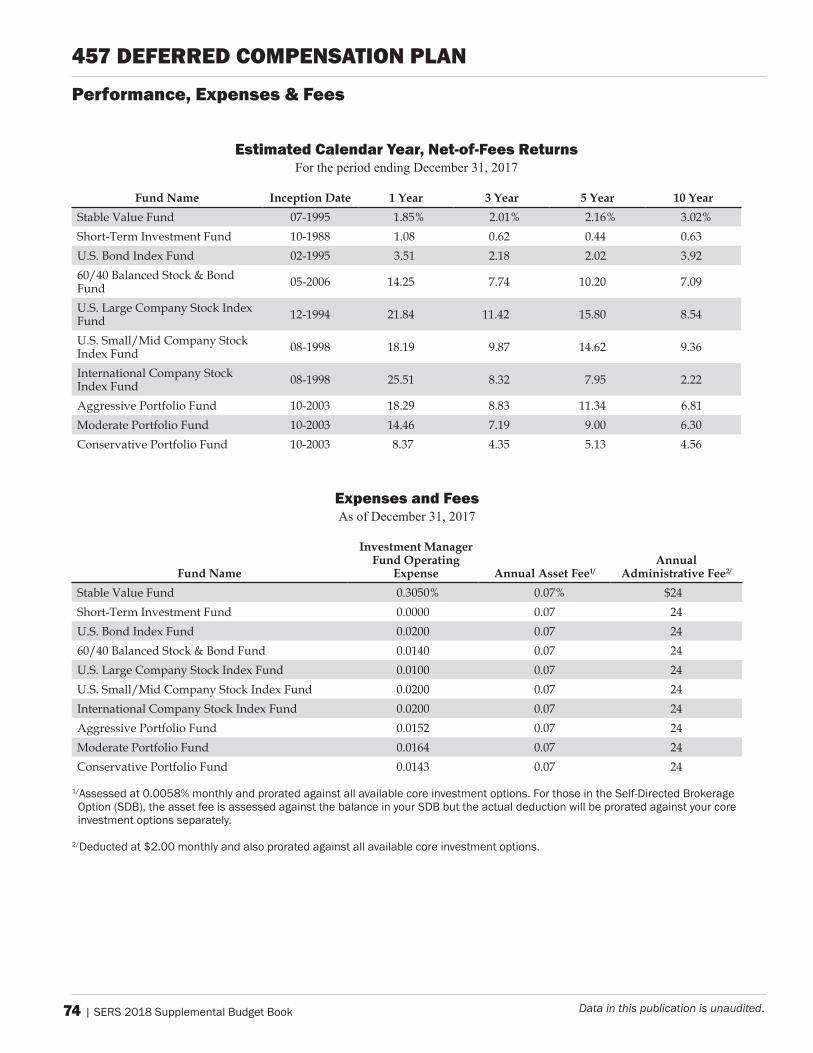
74 | SERS 2018 Supplemental Budget Book Data in this publication is unaudited.
performance, Expenses & Fees
457 dEFERREd COmpEnSatiOn plan
Estimated Calendar Year, net-of-Fees Returns For the period ending December 31, 2017
Fund Name Inception Date 1 Year 3 Year 5 Year 10 YearStableValueFund 07-1995 1.85% 2.01% 2.16% 3.02%Short-TermInvestmentFund 10-1988 1.08 0.62 0.44 0.63U.S.BondIndexFund 02-1995 3.51 2.18 2.02 3.9260/40BalancedStock&BondFund 05-2006 14.25 7.74 10.20 7.09
U.S.LargeCompanyStockIndexFund 12-1994 21.84 11.42 15.80 8.54
U.S.Small/MidCompanyStockIndexFund 08-1998 18.19 9.87 14.62 9.36
InternationalCompanyStockIndexFund 08-1998 25.51 8.32 7.95 2.22
AggressivePortfolioFund 10-2003 18.29 8.83 11.34 6.81ModeratePortfolioFund 10-2003 14.46 7.19 9.00 6.30ConservativePortfolioFund 10-2003 8.37 4.35 5.13 4.56
Expenses and Fees As of December 31, 2017
Fund Name
Investment Manager Fund Operating
Expense Annual Asset Fee1/Annual
Administrative Fee2/
StableValueFund 0.3050% 0.07% $24Short-TermInvestmentFund 0.0000 0.07 24U.S.BondIndexFund 0.0200 0.07 2460/40BalancedStock&BondFund 0.0140 0.07 24U.S.LargeCompanyStockIndexFund 0.0100 0.07 24U.S.Small/MidCompanyStockIndexFund 0.0200 0.07 24InternationalCompanyStockIndexFund 0.0200 0.07 24AggressivePortfolioFund 0.0152 0.07 24ModeratePortfolioFund 0.0164 0.07 24ConservativePortfolioFund 0.0143 0.07 24
1/Assessed at 0.0058% monthly and prorated against all available core investment options. For those in the Self-Directed Brokerage Option (SDB), the asset fee is assessed against the balance in your SDB but the actual deduction will be prorated against your core investment options separately.
2/Deducted at $2.00 monthly and also prorated against all available core investment options.