Embed Size (px)
Citation preview

Adventist Health St. Helena Adventist Health Vallejo Community Health Needs Assessment
2019

2019 Community Health Needs Assessment | 2
2019 Community Health Needs Assessment
Adventist Health St. Helena and Adventist Health Vallejo
Ms. Karla Newton, Community Health Project Manager
With technical assistance from:
Laura Acosta, MPH HC2 Strategies, Inc.
James Martinez, Ed.D., MPH
Smith Hill Global Consulting, LLC

2019 Community Health Needs Assessment | 3
Executive Summary .................................................................................................................................. 4
Acknowledgments ..................................................................................................................................... 6
Letter from President................................................................................................................................. 7
Introduction ............................................................................................................................................... 8
Community Profile .................................................................................................................................. 12
CHNA Overview ..................................................................................................................................... 18
Social & Economic Factors ..................................................................................................................... 20
Health System ........................................................................................................................................ 28
Public Health and Prevention ................................................................................................................. 36
Physical Environment ............................................................................................................................ 40
Voices from the Community .................................................................................................................... 43
Prioritization of Health Needs ................................................................................................................ 49
Addressing Identified Needs ................................................................................................................... 53
2016 Evaluation ...................................................................................................................................... 54
Approval ................................................................................................................................................. 67
Appendices .............................................................................................................................................
A: Qualifications of Consultants ............................................................................................................. 68 B: Glossary of Terms ............................................................................................................................. 69 C: Data Sources Cited ............................................................................................................................74
D: Description of Key Informants and Focus Groups ............................................................................. 75
E: Asset Inventory and Community Resources ...................................................................................... 78
Table of Contents

2019 Community Health Needs Assessment | 4
Empowering our Communities
Adventist Health St. Helena (AHSH) and Adventist Health Vallejo (AHV) would like to thank you for the opportunity to work with our communities to conduct a formal Community Health Needs Assessment to acquire knowledge of the pressing health needs, identify community assets, and hear from all members of the community. This CHNA will help us develop strategies to address the priority needs of the communities we serve. The goals of this assessment are to:
• Engage public health and community stakeholders, including low-income, minority and other under served populations.
• Assess and understand the community’s health issues and needs.
• Understand the health behaviors, risk factors and social determinants that impact health.
• Identify community resources and collaborate with community partners to develop collective strategies.
• Use findings to develop and implement a Community Health Plan (implementation strategy) based on the hospital’s prioritized issues.
Partnering with our Communities for Better Health
While conducting the CHNA, we solicited feedback and input from a broad range of stakeholders. Contributors to our CHNA process included:
Executive Summary
• Abode Services
• Napa Valley Unified School District - St. Helena School District
• Rianda House
• Up Valley Family Centers
Data Sources
Primary and secondary data sources are included in this report. A significant portion of the data for this assessment was collected through reports generated through CARES Engagement Network CHNA (https://engagementnetwork.org/assessment/). Other sources include California Department of Public Health, County Health Rankings & Road maps, and California Environmental Protection Agency’s Office of Environmental Health Hazard Assessment. When feasible, health metrics have been further compared to estimates for the state or national benchmarks, such as the Healthy People 2020 objectives.

2019 Community Health Needs Assessment | 5
Adventist Health St. Helena and Adventist Health Vallejo worked to identify relevant key informants and topical focus groups to gather more insightful data and aid in describing the community. Key informants and focus groups were purposefully chosen to represent medically under-served, low-income, or minority populations in our community, to better direct our investments and form partnerships. All limitations inherent in these sources remain present for this assessment. Results of the qualitative analysis, as well as a description of participants, can be found in Appendix D.
Top Priorities Identified in Partnership with our Communities
On September 24, 2019, HC2 Strategies, Inc. facilitated a strategy meeting with the Adventist Health St. Helena Mission Integration Sub Committee to review the results of the CHNA and determine the top 4 priority needs that the hospital will address over the next three years. To aid in determining the priority health needs, the Mission Integration Sub Committee, that includes community leaders, agreed on the criteria below to consider when making a decision. The criteria listed recognize the need for a combination of information types (e.g., health indicators and primary data) as well as consideration of issues such as practicality, feasibility, and mission alignment.
Mental and Behavioral Health
Chronic Diseases
Housing and Homelessness
Access to Healthcare
• Addresses disparities of subgroups
• Availability of evidence or practice-based approaches
• Community assets and internal resources for addressing needs
• Feasibility of intervention
• Identified community need
• Importance to community
• Magnitude
• Mission alignment and resources of hospitals
• Opportunity for partnership
• Opportunity to intervene at population level
• Severity
• Solution could impact multiple problems
• Anxiety
• Stress
• Depression
• Substance Abuse
• Obesity
• Diabetes
• Cancer
• Access to providers - including specialist, dentist, optometrist
• Affordable insurance

2019 Community Health Needs Assessment | 6
This report was made possible through the leadership of Adventist Health St. Helena (AHSH) located in St. Helena, California as part of Adventist Health (https://www.adventisthealth.org/). Under the leadership of Ms. Karla Newton, she collaborated with Ms. Laura Acosta of HC2 Strategies, Inc. to conduct key informant interviews, focus groups, and establish priority health needs for the 2019-2022 community health needs assessment cycle.
The analysis method and rankings were invaluable in providing “at a glance” information for informed decision making. A significant portion of the data for this assessment was collected through reports generated through CARES Engagement Network CHNA (https:// engagementnetwork.org/assessment/). Other sources include California Department of Public Health, County Health Rankings & Road maps, and California Environmental Protection Agency’s Office of Environmental Health Hazard Assessment. When feasible, health metrics have been further compared to estimates for the state or national benchmarks, such as the Healthy People 2020 objectives.
Finally, we would like to thank our community members, organizations and all those who gave input for this report through key informant interviews and focus groups. Their perspectives ensure that we are taking into consideration the most vulnerable in our communities to better create initiatives, more meaningful partnerships, and strategic investments into our communities.
Acknowledgments

2019 Community Health Needs Assessment | 7
Dear Friends and Colleagues,
As President of Adventist Health St. Helena, I am pleased to share our Community Health Needs Assessment with you. Working together, investing deeply and strategically in the work of whole-person health improvement, evaluation must be a top priority.
Studies tell us that health education, the conditions in which people live, learn, work and age will affect their health. Social determinants such as housing, literacy, early childhood experiences, income and social support among others can influence our residents’ lifelong health and well-being for generations to come.
Improving community health requires expertise and engagement that goes beyond traditional medical care provided on a hospital campus. It requires the wisdom and collaboration of a multitude of disciplines joining forces, working together, to develop and execute impactful strategies in order to ensure that our community health interventions are sustainable.
The 2019 Community Health Needs Assessment was conducted in partnership with community organizations through rigorous assessment, community and stakeholder perspectives and data analysis, to provide insight to the health of our community. This process has helped us identify areas where we can work together with our partners to achieve better health outcomes in our region.
We invite you to join us in implementing solutions to improve our community health and continue to build a sustainable, healthy community improving the life of everyone in Napa County.
Steven Herber, MD President
Letter from President

2019 Community Health Needs Assessment | 8
Introduction
The Community Health Needs Assessment (CHNA) represents our commitment to improving health outcomes in our community through rigorous assessment of health status in our market, incorporation of stakeholder’s perspectives, and adoption of related implementation strategies to address priority health needs. The CHNA is conducted not only to partner for improved health outcomes but also to satisfy our annual community benefit obligations by meeting requirements that are outlined in section 501(r)(3) of the Federal IRS Code, as well as, under the Affordable Care Act of 2010. The goals of this assessment are to:
• Engage public health and community stakeholders including low-income, minority and other under served populations
• Assess and understand the community’s health issues and needs
• Understand the health behaviors, risk factors and social determinants that impact health
• Identify community resources and collaborate with community partners
• Use Assessment findings to develop and implement a Community Health Plan (implementation strategy) based on the Hospital’s prioritized issues.
Adventist Health Overview
Adventist Health St. Helena and Adventist Health Vallejo are affiliates of Adventist Health, a faith-based, nonprofit integrated health system serving more than 80 communities on the West Coast and Hawaii. Community has always been at the center of Adventist Health’s mission. Founded on Seventh-day Adventist heritage and values, Adventist Health provides compassionate community care. Adventist Health entities include:
• 20 hospitals with more than 3,200 beds
• More than 280 clinics (hospital-based, rural health and physician clinics)
• 13 home care agencies and seven hospice agencies
• Four joint-venture retirement centers
• Compassionate and talented team of 35,000 associates, medical staff physicians, allied health professionals and volunteers

2019 Community Health Needs Assessment | 9
We owe much of our heritage and organizational success to the Seventh-day Adventist Church, which has long been a promoter of prevention and whole person care. Inspired by our belief in the loving and healing power of Jesus Christ, we aim to bring physical, mental and spiritual health and healing to our neighbors of all faiths. Every individual, regardless of his/her personal beliefs, is welcome in our facilities. We are also eager to collaborate with members of other faiths to enhance the health of the communities we serve.
Our commitment to quality health care stems from our heritage, which dates back to 1866 when the first Seventh-day Adventist health care facility opened in Battle Creek, Michigan. There, dedicated pioneers promoted the “radical” concepts of proper nutrition, exercise and sanitation. Early on, the facility was devoted to prevention as well as healing. They called it a sanitarium, a place where patients—and their families—could learn to be well.
More than a century later, the health care system sponsored by the Seventh-day Adventist Church circles the globe with more than 170 hospitals and more than 500 clinics, nursing homes and dispensaries worldwide. And the same vision to treat the whole person—mind, body and spirit—continues to provide the foundation for our progressive approach to health care.
Hospital Identifying Information
Mailing Address: 10 Woodland Road, St. Helena, CA 94574
Contact Information: Karla Newton, 707-967-7512
Website: adventisthealth.org/st-helena/

2019 Community Health Needs Assessment | 10
St. Helena is a 151-bed full-service, nonprofit, community hospital renowned for excellence in cardiac care and a holistic approach to healing. Offering expertly skilled doctors, the latest medical technology and highly-trained staff, Adventist Health St. Helena serves as a regional center for cancer care, cardiac services, orthopedics, general surgery, obstetrics, plastic and reconstructive surgery, sleep disorders, home care and women’s services. A comprehensive range of acute care, behavioral health and wellness programs draw patients from the San Francisco Bay Area and beyond.
Healthcare facilities and services that can respond to the health needs of the community include:
• Adventist Heart & Vascular Institute – Hidden Valley Lake, St. Helena
• Behavioral Health (Adventist Health Vallejo)
• Coon Joint Replacement Institute – St. Helena
• Lifestyle Medicine Institute – Lifestyle Medicine – St. Helena
• St. Helena Medical Specialties Family Practice – St. Helena
• St. Helena Medical Specialties Family Practice and Psychology – Calistoga
• St. Helena Medical Specialties General Surgery – St. Helena
• St. Helena Medical Specialties Nephrology/Internal Medicine/Neurology – St. Helena
• St. Helena Women’s Center – OB/GYN - St. Helena & Napa
• St. Helena Medical Specialties Orthopedics – St. Helena
• St. Helena Medical Specialties Plastic Surgery – St. Helena
• St. Helena Medical Specialties – Pulmonology and Gastroenterology – St. Helena

2019 Community Health Needs Assessment | 11
Adventist Health Vallejo
The Adventist Health Vallejo Center for Behavioral Health offers a range of behavioral health services in Vallejo, California. Our campus is a freestanding 61-bed facility offering short-term psychiatric care for children, adolescents and adults. We also offer partial hospitalization programs for adults. In addition, we offer a 32-bed unit at Adventist Health St. Helena which provides in-patient adult and senior mental health services as well.
Treatments include::
• Adult In-Patient Services- Active therapeutic program includes psychotherapy groups, educational groups, and treatment. Group therapy focuses on developing social, communication and daily living skills. The program also includes physical activities and exercise.
• Child/Adolescent Mental Health Services – There are separate age-specific areas for 3 to 12-year-olds and 13 to 18- year-olds. The program features safe, nurturing environments with age appropriate staff supervision, comprehensive clinical care, a gym and play area, and education groups, which help to develop social and communication skills, family group meetings and therapy sessions.
• Intensive Outpatient Program – Utilizing a team approach which includes psychiatrists, nurses, therapists and social workers, the program includes individual and group psychotherapy, medication management, coping skills and individual skill building.
• Partial Hospitalization – The program is offered five days per week for six hours per day over the course of four to six weeks. It includes individual and group psychotherapy, family therapy, medication management and education groups. The objective is to increase level of function and help patients gain new skills for interaction, communication and other daily living activities.
Mailing Address: 525 Oregon Street, Vallejo, CA 94590
Contact Information: 707-648-2200
Website: adventisthealth.org/vallejo/
2019 Community Health Needs Assessment | 12
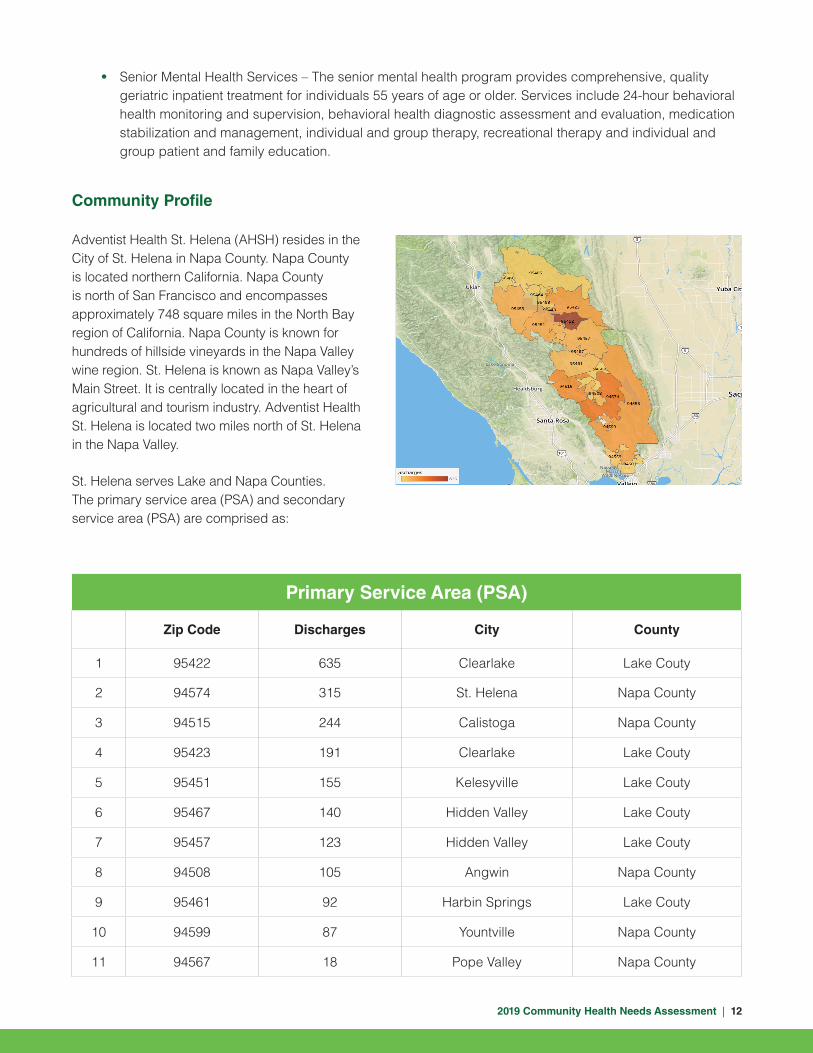
Community Profile
Adventist Health St. Helena (AHSH) resides in the City of St. Helena in Napa County. Napa County is located northern California. Napa County is north of San Francisco and encompasses approximately 748 square miles in the North Bay region of California. Napa County is known for hundreds of hillside vineyards in the Napa Valley wine region. St. Helena is known as Napa Valley’s Main Street. It is centrally located in the heart of agricultural and tourism industry. Adventist Health St. Helena is located two miles north of St. Helena in the Napa Valley.
St. Helena serves Lake and Napa Counties. The primary service area (PSA) and secondary service area (PSA) are comprised as:
Primary Service Area (PSA)
Zip Code Discharges City County
1 95422 635 Clearlake Lake Couty
2 94574 315 St. Helena Napa County
3 94515 244 Calistoga Napa County
4 95423 191 Clearlake Lake Couty
5 95451 155 Kelesyville Lake Couty
6 95467 140 Hidden Valley Lake Couty
7 95457 123 Hidden Valley Lake Couty
8 94508 105 Angwin Napa County
9 95461 92 Harbin Springs Lake Couty
10 94599 87 Yountville Napa County
11 94567 18 Pope Valley Napa County
• Senior Mental Health Services – The senior mental health program provides comprehensive, quality geriatric inpatient treatment for individuals 55 years of age or older. Services include 24-hour behavioral health monitoring and supervision, behavioral health diagnostic assessment and evaluation, medication stabilization and management, individual and group therapy, recreational therapy and individual and group patient and family education.

2019 Community Health Needs Assessment | 13
Secondary Service Area (SSA)
Zip Code Discharges City County
14 94558 191 Napa Napa County
15 95453 129 Lakeport Lake Couty
16 94559 57 Napa Napa County
17 95458 47 Bartlett Springs Lake Couty
18 95485 31 Bartlett Springs Lake Couty
19 95464 29 Lucerne Lake Couty
20 94503 20 American Canyon Napa County
21 95493 1 Cooper Lake Couty
Total 2623
Primary Service Area (PSA)
Zip Code Discharges City County
12 94576 8 Deer Park Napa County
13 95443 5 Glenhaven Lake Couty

2019 Community Health Needs Assessment | 14
Community Quick Facts – Lake County
Key Facts
Income
Education
67,857Population
2.4Average Household Size
46.9Median Age
$46,480Median Household Income
Indicator Value
<$15,000 19.9%
$15,000 – $24,999 12.0%
$25,000 – $34,999 8.2%
$35,000 – $49,999 12.2%
$50,000 – $74,999 19.0%
$75,000 – $99,999 11.2%
$100,000 – $149,999 12.0%
$150,000 – $199,999 3.3%
$200,000+ 2.2%
Households by Income
Unemployment
$74,499Median Net Worth
$46,480Per Capita Income
Bachelors/Grad/Prof DegreeSome College
High School Graduate
No High School Diploma
14% 16%39%31%Data Source: Esri Report, 2019. U..S. Census Bureau, Census 2010 Summary File 1. Esri forecasts for 2018 and 2023.
4.3%Unemployment
Rate
5.5%CA

2019 Community Health Needs Assessment | 15
Community Quick Facts – Lake County
5.5% 5.8% 6.2%
12.3% 12.5% 12.3% 12.8%13.6%
10.7%
5.5%
2.7%
0%
2%
4%
6%
8%
10%
12%
14%
16%
0-4 5-9 10-14 15-24 25-34 35-44 45-54 55-64 65-74 75-84 85+
2019 Populaiton by Age
67.5%
2.3%0.8%8.7%
0.3%
15.9%4.6%
34.9%
2019 Population by Race/Ethnicity
White Black American Indian Asian
Pacific Islander Some Other Race Two or More Races Hispanic Origin

2019 Community Health Needs Assessment | 16
Community Quick Facts – Napa County
Key Facts
Income
Education
140,314Population
2.7Average Household Size
41.1Median Age
$88,457Median Household Income
$88,457Median Household Income
Indicator Value
<$15,000 5.8%
$15,000 – $24,999 3.8%
$25,000 – $34,999 5.9%
$35,000 – $49,999 11.4%
$50,000 – $74,999 15.2%
$75,000 – $99,999 13.1%
$100,000 – $149,999 19.3%
$150,000 – $199,999 12.3%
$200,000+ 13.2%
Households by Income
Unemployment
$42,459Per Capita Income
Bachelors/Grad/Prof DegreeSome College
High School Graduate
No High School Diploma
14% 36%31%18%Data Source: Esri Report, 2019. U..S. Census Bureau, Census 2010 Summary File 1. Esri forecasts for 2018 and 2023.
2.3%Unemployment
Rate
5.5%CA
2019 Community Health Needs Assessment | 17
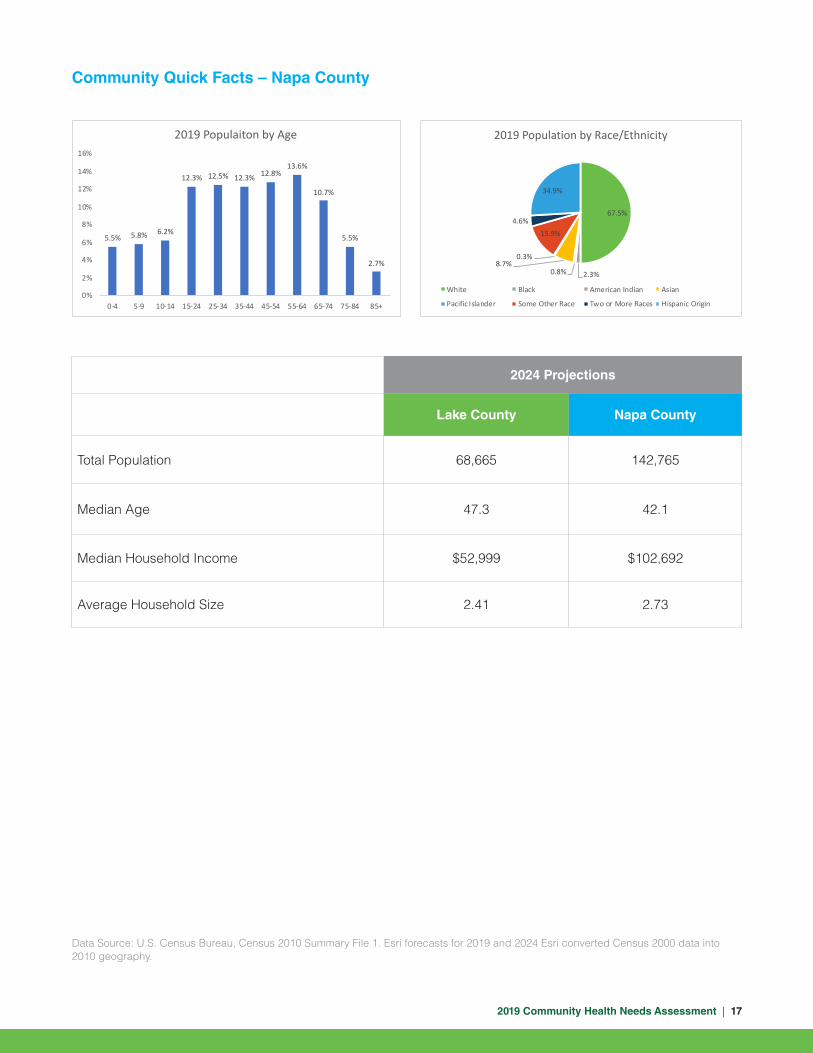
Community Quick Facts – Napa County
2024 Projections
Lake County Napa County
Total Population 68,665 142,765
Median Age 47.3 42.1
Median Household Income $52,999 $102,692
Average Household Size 2.41 2.73
Data Source: U.S. Census Bureau, Census 2010 Summary File 1. Esri forecasts for 2019 and 2024 Esri converted Census 2000 data into 2010 geography.
5.5% 5.8% 6.2%
12.3% 12.5% 12.3% 12.8%13.6%
10.7%
5.5%
2.7%
0%
2%
4%
6%
8%
10%
12%
14%
16%
0-4 5-9 10-14 15-24 25-34 35-44 45-54 55-64 65-74 75-84 85+
2019 Populaiton by Age
67.5%
2.3%0.8%8.7%
0.3%
15.9%4.6%
34.9%
2019 Population by Race/Ethnicity
White Black American Indian Asian
Pacific Islander Some Other Race Two or More Races Hispanic Origin

2019 Community Health Needs Assessment | 18
Developing metrics for population health interventions are imperative for continued success in elevating the health status of our communities. Including metrics from multiple sectors ensures a holistic assessment that views the health of a community through multiple sectors, helping to identify everyone’s role in making improvements. The community health needs assessment (CHNA) ensures we can target our community investments into interventions that best address the needs of our community. The domains used in this regional CHNA encompass national and state community health indicators. While we recognize that health status is a product of multiple factors, each domain influences the next and through systematic and collective action improved health can be achieved. The domains explored in the CHNA are :
• Social and Economic Factors: Indicators that provide information on social structures and economic systems. Examples include poverty, educational attainment, and workforce development.
• Health Systems: Indicators that provide information on health system structure, function, and access. Examples include health professional shortage areas, health coverage, and vital statistics.
• Public Health and Prevention: Indicators that provide information on health behaviors and outcomes, injury, and chronic disease. Examples include cigarette smoking, diabetes rates, substance abuse, physical activity, and motor vehicle crashes.
• Physical Environment: Indicators that provide information on natural resources, climate change, and the built environment.
Secondary Data Sources
A significant portion of the data for this assessment was collected through reports generated through CARES Engagement Network CHNA (https:// engagementnetwork.org/assessment/). Other sources include California Department of Public Health, County Health Rankings & Road maps, and California Environmental Protection Agency’s Office of Environmental Health Hazard Assessment. When feasible, health metrics have been further compared to estimates for the state or national benchmarks, such as the Healthy People 2020 objectives.
Social & Economic Factors
Physical Environment
Health Systems
Public Health and Prevention
CHNA Overview
2019 Community Health Needs Assessment | 19
Primary Data Sources
To validate data and ensure a broad representation of the community, Adventist Health St. Helena conducted key informant interviews and focus groups to gather more rich data and aid in describing the community. Results of the qualitative analysis can be found later in this document.
Data Limitations and Gaps
It should be noted that the survey results are not based on a stratified random sample of residents throughout Lake and Napa County. The perspectives captured in this data simply represent the community members who agreed to participate and have an interest. In addition, this assessment relies on several national and state entities with publicly available data. All limitations inherent in these sources remain present for this assessment.

2019 Community Health Needs Assessment | 20
Note: Head Start facility data is acquired from the US Department of Health and Human Services (HHS) 2018 Head Start locator. Population data is from the 2010 US Decennial Census. Data Source: CARES Engagement Network (2019). US Department of Health & Human Services, Administration for Children and Families. 2018. Retrieved. Retrieved May. Retrieved May 2019 from https:// engagementnetwork.org/assessment/
Social & Economic Factors
Health starts in our homes, schools, workplaces, neighborhoods, and communities. We know that taking care of ourselves by eating well, staying active, establishing a medical home, living a smoke-free life, getting recommended immunizations and screenings, seeing a medical provider regularly and when sick, all influence health. Our health is also determined in part by access to social and economic opportunities. Positive health outcomes are influenced by the resources and support available in our homes, neighborhoods and communities, as well as the quality of our schooling, safety of our workplaces, cleanliness of our water, environment and our social interactions and relationships. The conditions in which we live explain in part why some Americans are healthier than others and why some are not as healthy as they could be.
Social determinants of health are environmental conditions in which people are born, live, learn, work, play, worship, and age. These determinants affect a wide range of health, functioning, and quality-of-life outcomes and risks. Conditions (e.g., social, economic, and physical) in these various environments and settings (e.g., school, church, workplace, and neighborhood) are referred to as “place.” In addition to the more material attributes of “place,” the patterns of social engagement and sense of security and well-being are also affected by where people live. Quality of life resources can have a significant influence on population health outcomes. Examples of these resources include safe and affordable housing, access to education, public safety, availability of healthy foods, local emergency/health services, and an environment free of life-threatening toxins. This section details the indicators related to social and economic factors in our community which play a role in maintaining good health .
Education
Early education is an important factor in health status. Independent of its relationship to behavior, education influences a person’s ability to access and understand health information. Education is also correlated with a host of preventable poor health outcomes, including increased rates of childhood illness, respiratory illness, renal and liver disease, and diabetes, to name a few. Higher educational levels are associated with lower morbidity and mortality.
For every 10,000 children, AHSH PSA (34.5) has a higher rate of Head Start Facilities as compared to Lake County (13.8) and Napa County (6.2).
34.5
13.8
6.2 5.9
0
5
10
15
20
25
30
35
40
PSA Lake County Napa County California
Head Start ProgramsRate (Per 10,000 Children)

2019 Community Health Needs Assessment | 21
Data Source: CARES Engagement Network (2019). US Department of Education, EDFacts. Accessed via DATA.GOV. 2016-17. Retrieved May 2019 from https:// engagementnetwork.org/assessment/
Data Source: CARES Engagement Network (2019). US Census Bureau, American Community Survey. 2013-17. Retrieved May 2019 from https:// engagementnetwork.org/assessment/
Data Source: CARES Engagement Network (2019). US Census Bureau, American Community Survey. 2013-17. Retrieved May 2019 from https:// engagementnetwork.org/assessment/
Student Reading Proficiency
A report published by the Anne E. Casey Foundation found that children who do not read proficiently by the end of third grade are four times more likely to leave school without a diploma than a proficient reader. At the end of the 2017 school year, testing for fourth graders found that far more students scored ‘Not proficient’ or worse on standardized reading testing, than ‘Proficient’ or better in Lake County (76.4%), this average was higher than AHSH PSA (72.6%) and Napa County (59.1%). AHSH PSA (27.4%) showed a higher proportion of fourth graders who demonstrated “Proficient” or Better than Lake County (23.6%) but not Napa County (40.9%).
Graduation from high school or a post-secondary education such as receiving a Bachelor’s or Associates degree is linked to better health outcomes and increased earning potential. Estimates for those aged 25 and older without a high school diploma in AHSH PSA (14.2%) is lower than Lake County (15.3%) but higher than Napa County (12.3%).
When examining attainment of a Bachelor’s Degree or higher, one finds that the proportion is higher in AHSH PSA (25.4%) as compared to Lake County (15.3%) but lower than Napa County (34.6%).
14.2%15.3%
12.3%
17.5%
0%2%4%6%8%
10%12%14%16%18%20%
PSA Lake County Napa County California
Percent Population Age 25+ with No High School Diploma
25.4%
15.3%
34.6%32.6%
0%
5%
10%
15%
20%
25%
30%
35%
40%
PSA Lake County Napa County California
Percent Population with Bachelors Degree or Higher
27.4%23.6%
40.9%44.8%
72.6%76.4%
59.1%55.2%
0%
10%
20%
30%40%
50%
60%
70%
80%
90%
PSA Lake County Napa County California
Student Reading Proficiency (4th Grade)
Percentage of Students Scoring 'Proficient' or Better
Percentage of Students Scoring 'Not Proficient' or Worse

2019 Community Health Needs Assessment | 22
Employment
Addressing unemployment levels is important to community development. Unemployment can lead to financial instability and serve as a barrier to health care access and utilization. Many people secure health insurance through an employer, however, even with Medicaid expansion, the lack of gainful employment may prevent some from affording medical office co-pays or medications.
When looking at unemployment figures, AHSH PSA (8.2%) has a lower percentage of population age 16- 19 not in school and not employed as compared to Lake County (12.5%) but higher than Napa County (3.7%).
Measures of Poverty
Poverty is a particularly strong risk factor for disease and death, especially among children. Children who grow up in poverty are eight times more likely to die from homicide, five times more likely to have a physical or mental health problem, and twice as likely to be killed in an accident. Additionally, family poverty is consistently correlated with high rates of teenage pregnancy, failure to earn a high school diploma, and violent crimes.
AHSH PSA has a lower percentage of total population and children under age 18 living under the 100% federal poverty level at 27.6% and 19.2%, respectively as compared to Lake County. However, these estimates are higher than Napa County.
Data Source: CARES Engagement Network (2019). US Census Bureau, American Community Survey. 2013-17. Retrieved May 2019 from https:// engagementnetwork.org/assessment/
Data Source: CARES Engagement Network (2019). US Census Bureau, American Community Survey. 2013-17. Retrieved May 2019 from https:// engagementnetwork.org/assessment/
31.6%27.6%
22.8%19.2%
8.9%
8.2%
20.8%
15.1%
Lake County Napa County California
Children Under 100% Federal Poverty Level
Population Under 100% Federal Poverty Level
PSA
8.2%
12.5%
3.7%
7.0%
0%
2%
4%
6%
8%
10%
12%
14%
PSA Lake County Napa County California
Percentage of Population Age 16-19 Not in School and Not Employed

2019 Community Health Needs Assessment | 23
The chart to the right displays two other measures of poverty; the percentage of population receiving supplemental nutritional assistance program (SNAP) benefits, and percentage of population receiving public assistance income.
Public assistance income includes general assistance and Temporary Assistance to Needy Families (TANF). Separate payments received for hospital or other medical care (vendor payments) are excluded. This does not include Supplemental Security Income (SSI) or non-cash benefits such as Food Stamps.
These indicators are relevant because they assess vulnerable populations which are more likely to have multiple health access, health status, and social support needs. When combined with poverty data, providers can use this measure to identify gaps in eligibility and enrollment.
Across the two-county region, Napa County has a lower percentage of populations receiving Public Assistance Income at 1.7% and SNAP benefits at 5.1% as compared to Lake County and the state estimate of 3.6% and 11.2%, respectively.
Housing and Homelessness
A lack of affordable housing and the limited scale of housing assistance programs have contributed to the current housing crisis and to homelessness. The lack of affordable housing leads to high rent burdens (rents which absorb a high proportion of income), overcrowding, and substandard housing. These phenomena, in turn, have not only forced many people to become homeless; they have put a large and growing number of people at risk of becoming homeless.
Housing Affordability
Quality of housing has a major impact on overall health. High housing costs may force trade-offs between affordable housing and other needs. According to the 2018 Napa County: Housing as a Health Issue report, states that Napa County is ranked at one of the nation’s least affordable area with the average rent for a one-bedroom apartment exceeds $2,300—more than double what is considered affordable. In addition, the wait time for Section 8 affordable housing in Napa is extremely long: Currently, city of Napa staff are helping people who have been on the list for more than six years.
Data Source: CARES Engagement Network (2019). US Census Bureau, American Community Survey. 2013-17. US Census Bureau, Small Area Income & Poverty Estimates. 2015. Retrieved May 2019 from https:// engagementnetwork.org/assessment/
4.4%
1.7%
3.6%
18.5%
5.1%
11.2%
0%
2%
4%
6%
8%
10%
12%
14%
16%
18%
20%
Lake County Napa County California
Public Assistance Income Population Receiving SNAP Benefits
2019 Community Health Needs Assessment | 24
Data Source: CARES Engagement Network (2019). US Census Bureau, American Community Survey. 2013-17. Retrieved May 2019 from https:// engagementnetwork.org/assessment/
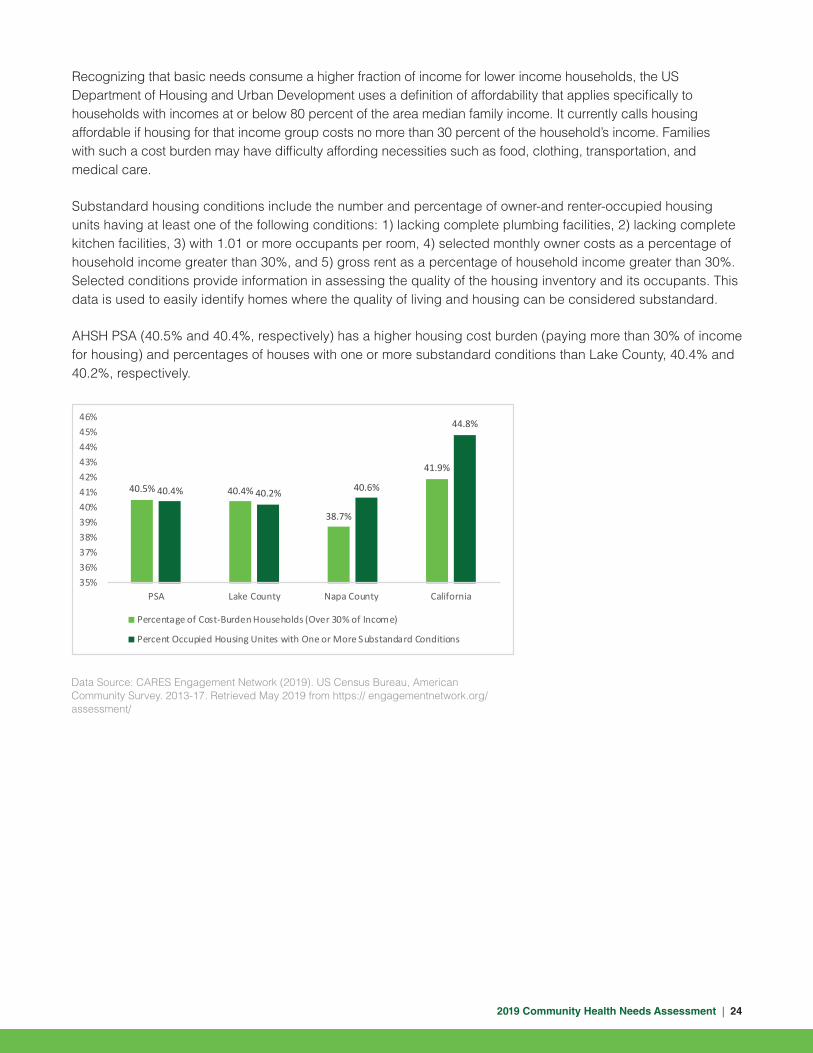
Recognizing that basic needs consume a higher fraction of income for lower income households, the US Department of Housing and Urban Development uses a definition of affordability that applies specifically to households with incomes at or below 80 percent of the area median family income. It currently calls housing affordable if housing for that income group costs no more than 30 percent of the household’s income. Families with such a cost burden may have difficulty affording necessities such as food, clothing, transportation, and medical care.
Substandard housing conditions include the number and percentage of owner-and renter-occupied housing units having at least one of the following conditions: 1) lacking complete plumbing facilities, 2) lacking complete kitchen facilities, 3) with 1.01 or more occupants per room, 4) selected monthly owner costs as a percentage of household income greater than 30%, and 5) gross rent as a percentage of household income greater than 30%. Selected conditions provide information in assessing the quality of the housing inventory and its occupants. This data is used to easily identify homes where the quality of living and housing can be considered substandard.
AHSH PSA (40.5% and 40.4%, respectively) has a higher housing cost burden (paying more than 30% of income for housing) and percentages of houses with one or more substandard conditions than Lake County, 40.4% and 40.2%, respectively.
40.5% 40.4%
38.7%
41.9%
40.4% 40.2% 40.6%
44.8%
35%36%37%38%39%40%41%42%43%44%45%46%
PSA Lake County Napa County California
Percentage of Cost-Burden Households (Over 30% of Income)
Percent Occupied Housing Unites with One or More Substandard Conditions

2019 Community Health Needs Assessment | 25
Homelessness and Health
When looking at the homeless population by various conditions and experiences, one finds that the largest portions suffer from chronic homelessness, mental illness, or substance abuse. A smaller, but still substantial portion have experienced domestic violence/intimate partner violence or have a physical disability. Homelessness results in high levels of stress, which put individuals and families at greater risk of violence and injury, food insecurity, unhealthy food options, infectious disease and frequent moves, which have been linked with negative childhood events such as abuse, neglect, household dysfunction and increased likelihood of smoking and suicide in children.
According to the 2019 Homeless report conducted by Napa Continuum of Care (CoC), on the night of January 22nd and the early morning of the 23rd, community leaders such as City and County staff, law enforcement, volunteers, and other in Napa conducted the annual PIT count and measured the prevalence of homelessness across the geographic area of the CoC. Community members collected information on individuals and families residing in emergency shelters and transitional housing, as well as people sleeping on the streets or sidewalks, in cars, abandoned buildings, parks, or other areas not meant for human habitation. New to the 2019 count was the implementation of an observation tool and an earlier surveying time in the morning. The overall findings were:
2019 Napa PIT Count Night of January 22-morning of 23, 2019
2018 2017
Total persons experiencing homeless 323 322
Sheltered count 172 168
Unsheltered count 151 154
Chronic Homelessness 149 158
Youth - Number of unsheltered unaccompanied youth increased 15 5
Youth - Sheltered persons in youth-headed households 8 11
Unsheltered veterans (including their families) 7 13
Sheltered veterans 8 10
Data Source: 2018 Update of the Napa Plan to end Homelessness Napa Continuum of Care. Retrieved May 2019 from https://www.countyofnapa.org/DocumentCenter/View/10896/Napa-Homeless-Plan-Update---Final-Draft-PDF
Respondents were also asked if they had been in Napa less than six months. If so, they were asked to identify their prior residence. The report finds that of the 145 responses to questions about their length of time in Napa 132 or 91% - had been in Napa for more than one year, 45% had been in Napa for more than ten years, approximately one-third – have been in Napa for more than 20 years.
Lastly, the table and graph below highlights the age of those counted, compared to the 2018 count, 2019 showed an increase in children under 18, ages 18-24 and adults between 45-65 and a decrease for respondents who were 25-44 and older adults who were 65+.

2019 Community Health Needs Assessment | 26
13
36
2119
46
Total Years
Less than 1 year 1-5 years 6-10 years 11-20 years More than 20 years
AgeAges 2019 2018
0-17 34 29
18-24 25 16
25-44 104 128
45-64 131 129
65+ 12 19
Violence and Injury Prevention
According to the Centers for Disease Prevention and Control, injury is the leading cause of death for children and adults between the ages of 1 and 45. Injury not only includes violence, but also unintentional injuries, such as harm caused by motor vehicle crashes.
When looking at violent crimes across the two-county region, Napa County had the highest counts of reports from 2014 to 2017. Comparatively, Lake County had the lowest reports during that same time period. When examining rates of substantiated child abuse cases, between 2012 and 2015, Lake County had the highest number of cases in 2013 at 8.4 per 1,000 and the lowest rate at 6 per 1,000 in 2012. Conversely, Napa had the highest number of cases in 2014 and 2015 at 8.1 and the lowest rate at 6.1 per 1,000. During the same time period, both counties were lower than the state rates.
For unintentional injuries, Lake County had a higher rate of drug-induced deaths (age-adjusted) per 100,000 at 40.4 than the state estimate of 12.7.
Violent Crimes 2014 2015 2016 2017
Lake County 307 346 379 396
Napa County 534 587 598 597
Note: Rates in red are the worst outcomes as compared to the state estimates. Data Source: State of California Department of Justice (2019). Open Justice Online Database. Retrieved May 2019 from Source: https://openjustice.doj.ca.gov/data
Rate of Substantiated Child Abuse per 1,000 2012 2013 2014 2015
Lake County 6 8.4 6.6 6.6
Napa County 6.1 6.7 8.1 8.1
California 9.3 9.2 9 8.4
Note: Rates in red are the worst outcomes as compared to the state. Data Source: Annie E. Casey Foundation (2019). Kids Count Data Center. Retrieved May 2019 from https:// datacenter. kidscount.org/

2019 Community Health Needs Assessment | 27
Note: *Rates are deemed unreliable when based on fewer than 20 data elements. Data Source: California Department of Public Health, County Health Status Profiles 2019, Individual County Data Sheets. 2015-2017 Death Files. Retrieved from https://www.cdph.ca.gov/Programs/CHSI/Pages/Individual-County-Data-Sheets.aspx
Lake County Napa County California HP 2020
Drug-Induced Deaths, Age-Adjusted Death Rate per 100,000
40.4 10.4* 12.7 11.3
Motor Vehicle Traffic Crashes, Age- Adjusted Death Rate per 100,000
26.2* 7.6* 9.5 12.4
How is the Region Doing?
• AHSH PSA (34.5) has a higher rate of Head Start Facilities as compared to Lake County (13.8) and Napa County (6.2).
• At the end of the 2017 school year, testing for fourth graders found that far more students scored ‘Not proficient’ or worse on standardized reading testing, than ‘Proficient’ or better in Lake County (76.4%), this average was higher than AHSH PSA (72.6%) and Napa County (59.1%).
• When looking at unemployment figures, Napa County has a lower percent of unemployed adults at 2.3% compared to the state estimate of 4.7%. Napa County (3.7%) has a lower percentage of Young People Not in School and Not Working, youth ages 16-19 years old than Lake County (12.5%) and also compared to 7.0% for the state.
• Across the two-county region, Lake County has the highest percentage of total population and children under age 18 living under the 100% federal poverty level at 31.6% and 22.8%, compared the state estimate of 20.8% and 15.1%, respectively.
• Across the two-county region, Napa County has a lower percentage of populations receiving Public Assistance Income at 1.7% and SNAP benefits at 5.1% as compared to Lake County and the state estimate of 3.6% and 11.2%, respectively.
2019 Community Health Needs Assessment | 28
A strong health system is one in which patients receive efficient coordinated care for a variety of illnesses and appropriate follow-up care to prevent unnecessary hospitalizations. In order to strengthen linkages to care, we must first understand the current state of our health system. This begins by understanding the outcomes associated with receiving or not receiving good maternal health care, as well as how one accesses the health care system.
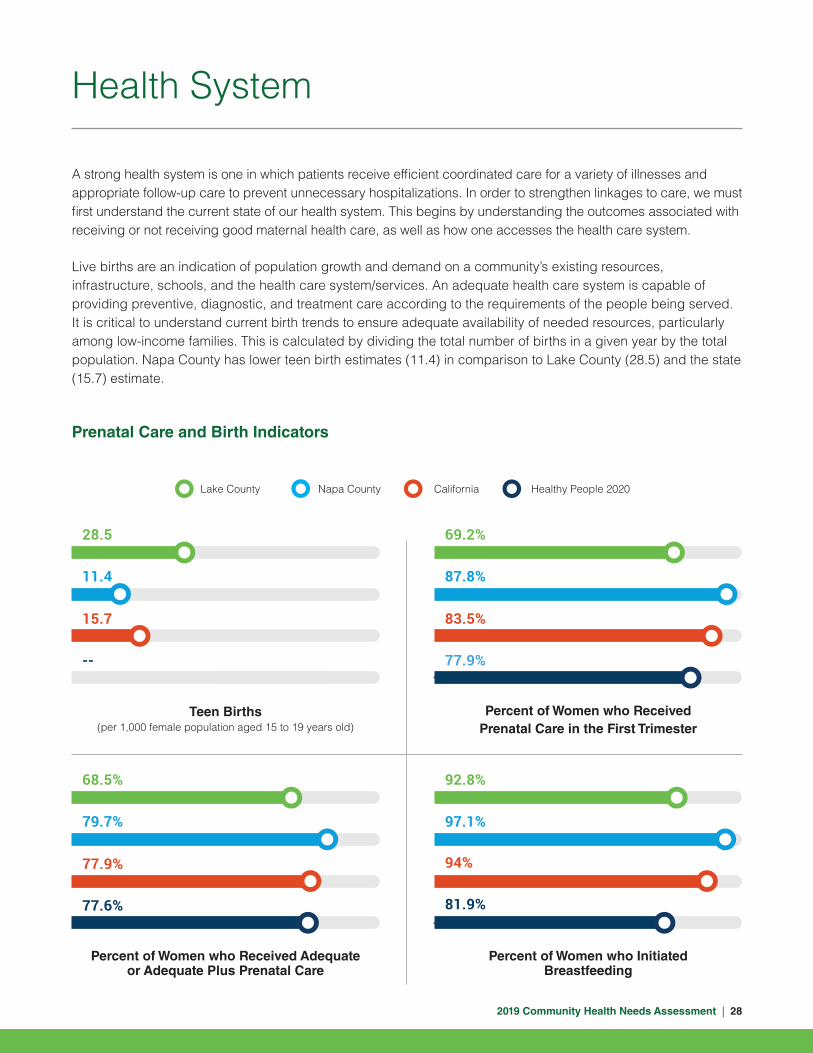
Live births are an indication of population growth and demand on a community’s existing resources, infrastructure, schools, and the health care system/services. An adequate health care system is capable of providing preventive, diagnostic, and treatment care according to the requirements of the people being served. It is critical to understand current birth trends to ensure adequate availability of needed resources, particularly among low-income families. This is calculated by dividing the total number of births in a given year by the total population. Napa County has lower teen birth estimates (11.4) in comparison to Lake County (28.5) and the state (15.7) estimate.
Prenatal Care and Birth Indicators
Health System
Teen Births (per 1,000 female population aged 15 to 19 years old)
Percent of Women who Received Adequate or Adequate Plus Prenatal Care
Percent of Women who ReceivedPrenatal Care in the First Trimester
Percent of Women who Initiated Breastfeeding
Lake County Napa County California Healthy People 2020
28.5 69.2%
92.8%68.5%
11.4 87.8%
97.1%79.7%
15.7 83.5%
94%77.9%
-- 77.9%
81.9%77.6%

2019 Community Health Needs Assessment | 29
Percent of Low Weight Births (Under 2,500g)
Infant Mortality Rate (per 1,000 live births)
Prenatal Care and Outcomes After Birth (Continue)
“Early prenatal care,” is care started in the 1st trimester (1-3 months). Adequacy of prenatal care calculations are based on the Adequacy of Prenatal Care Utilization Index (APNCU), which measures the utilization of prenatal care based on the timing of initiation of such care using the month prenatal care began as reported on the birth certificate and the ratio of the actual number of visits reported on the birth certificate to the expected number of visits. Adequate-Plus care is defined as prenatal care begun by the 4th month of pregnancy and 110% or more of recommended visits received. Adequate-Plus is defined as prenatal care begun by the 4th month of pregnancy and 80-109% of recommended visits received. These indicators are relevant because engaging in prenatal care decreases the likelihood of maternal and infant health risks. These indicators can also highlight a lack of access to preventive care, a lack of health knowledge, insufficient provider outreach, and/or social barriers preventing utilization of health care services. For indicators of prenatal care denoted in the graphs (early first trimester prenatal care and adequate care), in the two-county region, Napa County demonstrated a higher proportion of woman receiving prenatal care and adequate care at 87.8% and 79.7%, respectively. In contrast, Lake County held lower proportions of women receiving prenatal care and adequate care at 69.2% and 68.5%, respectively. Notably, Napa County estimates meet the Healthy People 2020 performance target of 77.9% and 77.6%, respectively.
Breastfeeding has many health benefits for both the mother and infant. Breastfeeding protects against diarrhea and common childhood illnesses such as pneumonia, and may also have longer-term health benefits, such as reducing the risk of overweight and obesity in childhood and adolescence. Across the two-county region, Napa County demonstrated a higher proportion of women across the region initiating breastfeeding at 97.1%, exceeding the Healthy People 2020 performance target for 81.9% of infants to have “ever been breastfed.” It’s also important to note that Lake County also exceeded the Healthy People 2020 performance target.
Low birth weight is indicative of the general health of newborns and often a key determinant of survival, health, and development. Infants born at low birth weights are at a heightened risk of complications, including infections, neurological disorders, Sudden Infant Death Syndrome, and even chronic diseases. Napa County (5.6%) had a lower proportion of low birth weights than the state estimate of 6.9% and the Healthy People 2020 goal of 7.8%.
Note:. (*) Rates are deemed unreliable when based on fewer than 20 data elements. Data Source: California Department of Public Health, County Health Status Profiles 2019, Individual County Data Sheets. 2014-2016 Birth Records. 2015-2017 Death Files. 2014-2016 Birth Cohort-Perinatal Outcome Files. Retrieved from https://www.cdph.ca.gov/Programs/CHSI/Pages/Individual-County-Data-Sheets.aspx
Lake County Napa County California Healthy People 2020
6.1% --
5.6% --
6.9% 4.4
7.8% 6.0

2019 Community Health Needs Assessment | 30
Finally, the infant mortality rate (IMR) is critical as it is indicative of the existence of broader issues pertaining to access to care and maternal child health. These rates can further provide metrics of community health outcomes and areas of needed services and interventions. In the two-county region, Lake and Napa County did not have any data reference because its rates are deemed unreliable when based on fewer than 20 data elements.
Access to Health Care
Access to health care is arguably the most critical component of measuring community health. Access can be measured at both the individual level (i.e., health insurance coverage, Medicaid coverage) and at the system level (i.e., primary care provider rate, health professional shortage areas). When an individual has the means to secure treatment and quality comprehensive treatment is readily available, then access to health care is highest. Understanding provider rates per 100,000 population can be useful for determining areas in most need of providers and potential stresses on existing providers.
Across each provider indicator (dental, mental health, and primary care per 100,000 population), Napa County recorded higher proportions of providers to population for dental (89.4), mental health providers (497.9) and primary care providers (94.3). Lake County has the lowest proportion of providers for dental and primary care providers per 100,000 population.
Access to Health Care
Lake County Napa County California
Dentists Rate per 100,000 Population 45.1 89.4 83.4
Mental Health Care Provider Rate per 100,000 Population
342.4 497.9 327.8
Primary Care Provider Rate per 100,000 Population
46.8 94.3 78.5
Note: Rates in red are the poorest outcomes as compared to the state. Rates in green are the best outcomes as compared to the state. Data Source: Robert Wood Johnson Foundation (2019). County Health Rankings and Road maps. Retrieved May 2019 from http://www.countyhealthrankings.org

2019 Community Health Needs Assessment | 31
Health Insurance
Insurance coverage is also an important indicator to consider when determining the health of a community or health system. Lack of insurance is a key barrier to health care access, regular primary care, specialty care, and other health services contributing to poor health status. Additionally, knowing the proportion of the population receiving Medi-Cal is important. This information allows for an assessment of vulnerable populations most likely to have multiple health access, health status, and social support needs. When combined with poverty data, providers can use this measure to identify gaps in eligibility and enrollment.
Across the two-county region, Napa County has the lowest percentage of persons covered through Medi-Cal and percentage of uninsured persons at 18.6% and 7.5%, respectively. The estimates are lower than the state at 27.3% and 10.5%, respectively.
Community Health Centers
Community Health Centers (CHCs) are community assets that provide health care to vulnerable populations in areas designated as medically under-served. Per the California Primary Care Association, the term Community Health Center (CHC) includes Federally Qualified Health Centers (FQHCs), FQHC Look-Alikes, Migrant Health Centers, Rural and Frontier Health Centers, and Free Clinics. CHCs are an essential segment of the safety-net. In many California counties, these clinics provide a significant proportion of comprehensive primary care services to those who receive partial subsidies or are uninsured.
AHSH PSA (3.04) has lower rates of FQHCs for every 100,000 people than Lake (4.64) and Napa (5.86) County. Looking at the raw counts, Napa County had the largest number of CHCs (10) in comparison to Lake County at (1).
Note: Unknown means that the type of population served is unknown. Data Source: Health Resources and Services Administration (2019). Health Center Service Delivery and Look–Alike Sites Data Download. Retrieved May 2019 from https://data.hrsa.gov/data/download
Data Source: CARES Engagement Network (2019). US Census Bureau, American Community Survey. 2013-17. Retrieved May 2019 from https:// engagementnetwork.org/assessment/
Health Center Site Population Type-Description
Lake County Napa County
Rural 1 1
Urban -- 3
Unknown -- 6
Total Number of Community Health Centers 1 10
41.2%
18.6%
27.3%
11.9%7.5%
10.5%
0%5%
10%15%
20%25%
30%35%
40%45%
Lake County Napa County California
Insurance Coverage Estimates
Percent of Insured Population Receiving Medi-Cal Percent Uninsured Population

2019 Community Health Needs Assessment | 32
Preventable Hospital Events
Ambulatory or primary care sensitive conditions (ACS) are those conditions for which hospital admission could be prevented by interventions in primary care. This indicator reports the discharge rate (per 1,000 Medicare enrollees) for conditions that are ACS. ACS conditions include pneumonia, dehydration, asthma, diabetes, and other conditions which could have been prevented if adequate primary care resources were available and accessed by those patients. This indicator is relevant because analysis of ACS discharges demonstrates a possible “return on investment” from interventions that reduce admissions through better access to primary care resources. AHSH PSA (37.7) has lower discharge rates than Lake County (41.7) but higher than Napa County (29.5) per 1,000 Medicare enrollees.
Note: Rates in red are the poorest outcome in comparison to the state. Data Source: CARES Engagement Network (2019). Dartmouth College Institute for Health Policy & Clinical Practice, Dartmouth Atlas of Health Care. 2015. Retrieved May 2019 from https:// engagementnetwork.org/assessment/
Data Source: CARES Engagement Network (2019). US Department of Health & Human Services, Center for Medicare & Medicaid Services, Provider of Services File. December 2018. Retrieved May 2019 from https:// engagementnetwork.org/assessment/
Ambulatory Care Sensitive Condition Discharge Rate Per 1,000 Medicare Enrollees
PSA Lake County Napa County California
37.7 41.7 29.5 36.2
3.04
4.64
5.86
2.91
0
1
2
3
4
5
6
7
PSA Lake County Napa County California
Rate of Federally Qualified Health Centers per 100,000 Population
2019 Community Health Needs Assessment | 33
Note: Rates in red are the poorest outcome in comparison to the state. Rates in green are the best outcome in comparison to the state. Data Sources: California Department of Public Health, California Breathing. County Asthma Data Tool, 2017. Retrieved from https://www.cdph.ca.gov/Programs/CCDPHP/DEODC/EHIB/CPE/Pages/ CaliforniaBreathingData.aspx. Lucile. (Ed and hospit)
Note: (*) No data available on site. Percentages in red are the poorest outcome in comparison to the state. Percentages in green are the best outcomes in comparison to the state. Data Source: California Department of Public Health, California Breathing. County Asthma Data Tool, 2015-2016. Retrieved May 2019 from https://www.cdph.ca.gov/Programs/CCDPHP/DEODC/EHIB/CPE/Pages/ CaliforniaBreathingData.aspx
Asthma
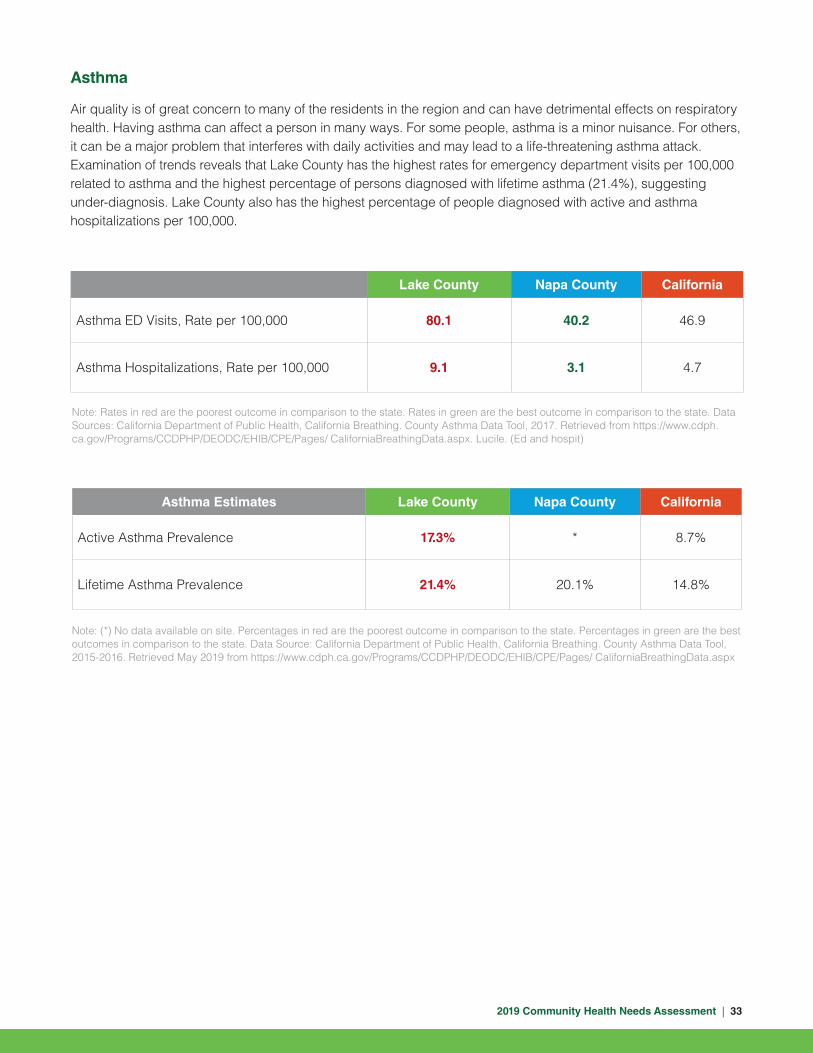
Air quality is of great concern to many of the residents in the region and can have detrimental effects on respiratory health. Having asthma can affect a person in many ways. For some people, asthma is a minor nuisance. For others, it can be a major problem that interferes with daily activities and may lead to a life-threatening asthma attack. Examination of trends reveals that Lake County has the highest rates for emergency department visits per 100,000 related to asthma and the highest percentage of persons diagnosed with lifetime asthma (21.4%), suggesting under-diagnosis. Lake County also has the highest percentage of people diagnosed with active and asthma hospitalizations per 100,000.
Lake County Napa County California
Asthma ED Visits, Rate per 100,000 80.1 40.2 46.9
Asthma Hospitalizations, Rate per 100,000 9.1 3.1 4.7
Asthma Estimates Lake County Napa County California
Active Asthma Prevalence 17.3% * 8.7%
Lifetime Asthma Prevalence 21.4% 20.1% 14.8%

2019 Community Health Needs Assessment | 34
Mortality
Health status and health care utilization measures are central indicators of the performance of the health care system. Health status measures the level of wellness and illness, while health care utilization is the use of services by people for the purpose of preventing and curing health problems. The leading causes of death in the United States are overwhelmingly the result of chronic and preventable disease. Nearly 75% of all deaths in the United States are attributed to ten causes, with the top three of these accounting for over 50% of all deaths. According to the Centers for Disease Control and Prevention, the top three causes of death in the U.S. in 2016 were from heart disease, cancer, and unintentional injuries.
The first two leading causes of death for Lake and Napa County are coronary heart disease and unintentional injuries. The third, fourth, fifth and sixth causes of death in the counties varied in terms of order, however, for each county these rankings were comprised of mortality rates for chronic lower respiratory disease, stroke, lung cancer, Alzheimer’s Disease and drug induced deaths.
The seventh, eighth and ninth causes of deaths are attributable to suicide, prostate cancer, female breast cancer, diabetes and chronic liver disease and cirrhosis.
Lastly, the tenth leading causes of death for Lake County is Alzheimer’s Disease and colorectal cancer. Although for Napa County, Alzheimer’s Disease ranked at number four.
Leading Causes of Death (Age-Adjusted Rates per 100,000 Population)
Mortality Lake County Napa County California
1 Coronary Heart Disease – 105.7 Coronary Heart Disease – 86.2 Coronary Heart Disease - 87.4
2Accidents (Unintentional Injuries) – 89.6
Accidents (Unintentional Injuries) – 35.7
Cerebrovascular Disease (Stroke) – 36.3
3Chronic Lower Respiratory Disease – 58.6
Cerebrovascular Disease (Stroke) 35.0 Alzheimer’s Disease – 35.7
4 Lung Cancer – 46.7 Alzheimer’s Disease – 31.2Accidents (Unintentional Injuries) – 32.2
5Cerebrovascular Disease (Stroke) 45.7
Lung Cancer – 30.6Chronic Lower Respiratory Disease – 32.0
6 Drug Induced Deaths – 40.4Chronic Lower Respiratory Disease – 26.9
Lung Cancer – 27.5
7 Suicide – 29.3 Prostate Cancer – 26.6 Diabetes – 21.2
8 Female Breast Cancer – 29.2* Diabetes – 19.0 Prostate Cancer – 19.4
9Chronic Liver Disease and Cirrhosis – 28.2
Female Breast Cancer – 18.0* Female Breast Cancer – 18.9
10 Alzheimer’s Disease – 26.5 Colorectal Cancer – 11.6 Influenza/Pneumonia – 14.2
Note: * is defined as Rates are deemed unreliable when based on fewer than 20 data elements. Data Source: California Department of Public Health, County Health Status Profiles 2019, Individual County Data Sheets. 2014-2017 Death Files. Retrieved May 2019 from https://www.cdph.ca.gov/Programs/CHSI/Pages/Individual-County-Data-Sheets.aspx

2019 Community Health Needs Assessment | 35
How is the Region Doing?
• Napa County has lower teen birth estimates (11.4) in comparison to Lake County (28.5) and the state (15.7) estimate.
• Across the two-counties, Napa County demonstrated a higher proportion of women across the region initiating breastfeeding at 97.1%, exceeding the Healthy People 2020 performance target for 81.9% of infants to have “ever been breastfed.”
• Napa County demonstrated a higher proportion of woman receiving prenatal care and adequate care at 79.7% in comparison to Lake County at 68.5%. Notably, Napa County estimates meet the Healthy People 2020 performance target of 77.9% and 77.6%, respectively.
• Across each provider indicator (dental, mental health, and primary care per 100,000 population), Napa County recorded higher proportions of providers to population for dentist (89.4), mental health providers (497.9) and primary care providers (94.3) than Lake County and the state estimate at 83.4 per 100,000 population.
• Lake County has the highest rates for emergency department visits per 100,000 related to asthma and the highest percentage of persons diagnosed with lifetime asthma (21.4%), suggesting under-diagnosis. Lake County also has the highest percentage of people diagnosed with active asthma 17.3% as compared to the state at 8.7%.
• The first two leading causes of death for Lake and Napa County are coronary heart disease and unintentional injuries.

2019 Community Health Needs Assessment | 36
18.3%3.5 3.514.1% 4.4 4.2
17.5%3.6 3.4
Public health is the science of protecting and improving the health of people and their communities. This work is achieved by promoting healthy lifestyles, researching disease and injury prevention, and detecting, preventing and responding to infectious diseases. When these factors are addressed, a community will enjoy an overall higher level of physical and emotional well-being.
Health Status
Health status is determined by more than the presence or absence of any disease. It is comprised of a number of factors, including measures of healthy life expectancy, years of potential life lost, self-assessed health status, chronic disease prevalence, measures of functioning, physical illness, and mental well-being. These measures go hand-in-hand with measures related to health behaviors such as physical activity, nutrition, and alcohol consumption. Measuring health behaviors provides a deeper understanding of health status.
When looking at overall health status, across the two-region counties, Napa County had a lower proportion (14.1%) of adults who rate their health as “fair” or “poor,” than the state estimate of 17.5%, while Lake County had a proportion of 18.3%. Lake County (4.4) had a higher number of poor mental health days reported in a 30-day period than the state estimate of 3.5. The rate of poor physical health days within a reported 30-day period was slightly lower in Napa County (3.4 in a 30-day period) than Lake County (4.2 in a 30-day period) and the state estimate of 3.5.
Physical Activity
Increased physical activity is associated with lower risks of type 2 diabetes, cancer, stroke, hypertension,cardiovascular disease, and premature mortality, independent of obesity. Individuals who live closer to sidewalks, parks, and gyms are more likely to exercise. In California, 17.2% of adults answered “yes” to the question: “During the past month, other than your regular job, did you participate in any physical activities or exercises such as running, calisthenics, golf, gardening, or walking for exercise?” In Napa County, the percentages of people who responded they participated in leisure-time physical activity was 16.2%, this percentage is better than the state estimate. Conversely, Lake County has a higher percentage at 18.3%.
Public Health and Prevention
Adults Reporting Poor or Fair Health Poor Mental Health Days Poor Physical Health Days
Lake County Napa County California
Data Source: Robert Wood Johnson Foundation (2019). County Health Rankings and Roadmaps. Retrieved May 2019 from http://www.countyhealthrankings.org

2019 Community Health Needs Assessment | 37
When considering populations who have adequate access to locations for physical activity, figures vary between the county and state. Access to exercise opportunities is defined as the percentage of individuals in a county who live reasonably close to a location for physical activity. Locations for physical activity are defined as parks or recreational facilities. Napa County had a slightly lower percentage of individuals with adequate access to exercise opportunities at 92.4%, while Lake County had an even lower percentage (68.4%) as compared to the state at 93%.
Chronic Disease
Successfully managing risk factors for chronic diseases is important for preventing unnecessary hospitalizations. According to the Centers for Disease Control and Prevention (CDC), six in ten Americans live with at least one chronic disease, like heart disease, cancer, stroke, or diabetes. These and other chronic diseases are the leading causes of death and disability in America, and they are also a leading driver of health care costs.
AHSH PSA Medicare population has the lowest rates of depression (16.4%) and heart disease (24.4%) as compared to Lake County (16.6% and 25.8%, respectively). AHSH PSA had higher rates of diabetes as compared to Lake and Napa County (21.6% and 22.2%, respectively).
Sexually Transmitted Infections
Sexually transmitted infections (STIs) are passed from one person to another through intimate physical contact and from sexual activity. STIs are very common. The causes of STIs are bacteria, parasites, yeast, and viruses. In fact, CDC averages 20 million new infections occur every year in the United States. Understanding the rate of STIs are important because they are measures of poor health status, indicate a lack of sexual health education, and indicate the prevalence of unsafe sex practices.
AHSH PSA had lower rates per 100,000 population for chlamydia (308.9) and gonorrhea (58.3) incidence as compared to Lake County (442.8 and 314.3, respectively) but higher rates than Napa County (308.9 and 58.3, respectively). HiV estimates for AHSH PSA were lower than Lake and Napa County.
Chronic Disease Indicators PSA Lake County Napa County California
Adults with a Body Mass Index Greater than 30
* 23.2% 21.1% 22.5%
Medicare Population with Depression 16.4% 16.6% 15.9% 15.8%
Medicare Population with Diabetes 21.7% 21.6% 22.2% 27.2%
Medicare Population with Heart Disease 25.4% 25.8% 24.4% 24.7%
Data Source: Note: Percentages in red are the poorest outcome in comparison to the state. Percentages in green are the best outcomes in comparison to the state. CARES Engagement Network (2019). National Center for Chronic Disease Prevention and Health Promotion.2015.US Department of Health & Human Services, Center for Medicare & Medicaid Services, 2017. Retrieved May 2019 from https:// engagementnetwork.org/assessment/

2019 Community Health Needs Assessment | 38
Data Source: CARES Engagement Network (2019). US Department of Health & Human Services, Health Indicators Warehouse. Centers for Disease Control and Prevention, National Center for HIV/AIDS, Viral Hepatitis, STD, and TB Prevention. 2016. Retrieved May 2019 from https:// engagementnetwork.org/assessment/
Data Source: Robert Wood Johnson Foundation (2019). County Health Rankings and Roadmaps. Retrieved May 2019 from http://www.countyhealthrankings.org
Rate per 100,000 Population PSA Lake County Napa County California
Chlamydia Incidence 394.7 442.8 308.9 506.2
Gonorrhea Incidence 221.7 314.3 58.3 164.9
HIV Prevalence .24 236.9 238.5 376.4
Alcohol and Tobacco Use
Alcohol and/or tobacco use has major adverse impacts on individuals, families and communities. The effects of abuse are cumulative, contributing to costly social, physical, mental, and public health problems.
According to recent averages, Napa County has the highest percentage (17%) of adults who engaged in binge or heavy drinking within the last 30 days than Lake County and the state estimate. Percentages of adults who are current smokers in Lake County is higher 15.4% than Napa County, 10.9%, and the statewide average of 11%.
Percent of Adults Reporting Binge or Heavy Drinking
Percent of Adults who are Current Smokers
Lake County Napa County California
17% 15.4%
20.1% 10.9%
17.8% 11.0%

2019 Community Health Needs Assessment | 39
How is the Region Doing?
• Napa County had a lower proportion, 14.1%, of adults who rate their health as “fair” or “poor,” than the state estimate of 17.5%, Lake County had a proportion of 18.3%. Lake County (4.4) had a higher number of poor mental health days reported in a 30-day period than the state estimate of 3.5. The rate of poor physical health days within a reported 30-day period was slightly lower in Napa County (3.4) than Lake County (4.2) and the state estimate of 3.5.
• Napa County had a slightly lower percentage of individuals with adequate access to exercise opportunities at 92.4%, while Lake County had an even lower percentage (68.4%) as compared to the state at 93%.
• AHSH PSA Medicare population has the lowest rates of depression (16.4%) and heart disease (24.4%) as compared to Lake County (16.6% and 25.8%, respectively). AHSH PSA had higher rates of diabetes as compared to Lake and Napa County (21.6% and 22.2%, respectively).
• AHSH PSA had lower rates per 100,000 population for chlamydia (308.9) and gonorrhea (58.3) incidence as compared to Lake County (442.8 and 314.3, respectively) but higher rates than Napa County (308.9 and 58.3, respectively).
• Napa County has the highest percentage (19.1%) of adults who engaged in binge or heavy drinking within the last 30 days than Lake County and the state estimate. Percentages of adults who are current smokers in Lake County is higher 15.4% than Napa County (10.9%) and the statewide average of 11%.

2019 Community Health Needs Assessment | 40
We interact with the environment constantly, therefore our physical environment can affect our health behaviors, quality of life, years of healthy life lived, and health disparities. The World Health Organization (WHO) defines environment, as “all the physical, chemical, and biological factors external to a person, and all the related behaviors.” This can include air quality and exposure to toxic substances as well as the built environment (human-made surroundings) and housing.
CalEnviroScreen is a science-based mapping tool that was developed by the California Environmental Protection Agency’s Office of Environmental Health Hazard Assessment. This tool helps identify California communities that are affected by many sources of pollution and that are particularly vulnerable to pollution’s effects. CalEnviroScreen uses environmental, health, and socioeconomic information to produce a numerical score for each census tract in the state. A census tract with a high score (colored dark orange to dark red) is one that experiences higher pollution burden and vulnerability than census tracts with lo w scores (colored shades of green). Indicators that are considered include but are not limited to, ozone, PM 2.5, drinking water quality, pesticides, and hazardous waste.
Lake County ranked 35-40% and Napa County ranked 35-40% percentile on the CalEnviroScreen 3.0 index for pollution. This means that these areas have a moderate pollution burden, populations especially sensitive to these factors, and socioeconomic factors that increase vulnerability to pollution.
Physical Environment
Data Source: Office of Environmental Health Hazard Assessment. CalEnviroScreen 3.0 Overall Results and Individual Indicator Maps, June 2018. Retrieved May 2019 from https://oehha.ca.gov/calenviroscreen/maps-data
Lake County
Napa County
CalEnviroScreen 3.0 Results (June2018 Update)
91 - 100% (Highest Scores)
91 - 90%
71 - 80%
61 - 70%
51 - 60%
41 - 50%
31 - 40%
21 - 30%
11 - 20%
1 - 10% (Lowest Scrores)

2019 Community Health Needs Assessment | 41
Retail Food Environment
Understanding the retail food environment is important to determining access to healthy foods for populations and overall environmental influences on dietary behaviors.
Three indicators are important to consider: the fast food restaurant rate, the grocery store rate, and the number of retailers authorized to accept Supplemental Nutrition Assistance Program benefits (all calculated as establishments per 100,000 population). Areas with a high fast food rate, low grocery store rate, and low SNAP authorized retailers will inevitably have populations with higher rates of food insecurity, due to lack of access to healthy and affordable foods. AHSH PSA had the lowest fast food restaurant rate, grocery store rate, and SNAP authorized retailers as compared to Lake and Napa County per 100,000 population.
Food Insecurity
The US Department of Agriculture defines food insecurity as a lack of access, at times, to enough food for an active, healthy life for all household members and limited or uncertain availability of nutritionally adequate foods. Food insecurity may reflect a household’s need to choose between important basic needs, such as housing or medical bills, and purchasing nutritionally adequate foods.
Food insecurity averages in Lake County for the overall population (15.6%) and children (23.2%) are higher than reported averages for the state (11% and 18.1%, respectively). These averages are higher than Napa County.
Data Source: CARES Engagement Network (2019). US Census Bureau, County Business Patterns. Additional data analysis by CARES. 2016. US Department of Agriculture, Food and Nutrition Service, USDA - SNAP Retailer Locator. Additional data analysis by CARES. 2019. Retrieved May 2019 from https:// engagementnetwork.org/assessment/
Data Source: Feeding America (2016). Map the Meal Gap, Online Tool.Retrieved May 2019 from http://map.feedingamerica.org/.
Overall Food Insecurity, Percentages
Children Food Insecurity, Percentages
15.6%
8%
Fast Food Restaurant Rate per 100,000 Population
51.0348.6
60.08
80.51
Grocery Store Rate per 100,000 Population
37.1136.4529.31
21.14
11%
SNAP Authorized Retailers per 100,000 Population
10.366.844.91 6.54
23.2%
13.8%18.1%
Lake CountyPSA Napa County California
Lake County Napa County California

2019 Community Health Needs Assessment | 42
Built Environment
The term “built environment” refers to the human-made surroundings that provide the setting for human activity, ranging in scale from buildings to parks. It has been defined as “the human-made space in which people live, work, and recreate on a day-to-day basis.” Factors to consider include access to recreational facilities and fitness centers and access to broadband internet access. Access to high-speed internet is important because access to technology opens up opportunities for employment and education. Access to recreational facilities encourages physical activity and other healthy behaviors.
AHSH PSA (86.6%) had higher access to high-speed Internet as compared to Lake County (93.9%). AHSH PSA had higher recreational facilities (21.43) as compared to Lake and Napa County (9.28 and 16.85, respectively).
Data Source: CARES Engagement Network (2019). National Broadband Map. Dec. 2017. US Census Bureau, County Business Patterns. Additional data analysis by CARES. 2016. Retrieved May 2019 from https:// engagementnetwork.org/assessment/
How is the region doing?
• Lake County ranked 35-40% and Napa County ranked 35-40% percentile on the CalEnviroScreen 3.0 index for pollution. This means that these areas have a moderate pollution burden, populations especially sensitive to these factors, and socioeconomic factors that increase vulnerability to pollution.
• AHSH PSA had the lowest fast food restaurant rate, grocery store rate, and SNAP authorized retailers as compared to Lake and Napa County per 100,000 population.
• Food insecurity averages in Lake County for the overall population (15.6%) and children (23.2%) are higher than reported averages for the state (11% and 18.1%, respectively). These averages are higher than Napa County.
• AHSH PSA (86.6%) had higher access to high-speed Internet as compared to Lake County (93.9%). AHSH PSA had higher recreational facilities (21.43) as compared to Lake and Napa County (9.28 and 16.85, respectively).
84.6%86.6%
21.43%
9.28
93.9%
16.85
97.7%
10.75
Napa County CaliforniaLake CountyPSA
Broadband Access (Access to DL Speeds Greater than 25MBPS)
Recreational Facilities (Establishments per 100,000 Population)

2019 Community Health Needs Assessment | 43
A CHNA would not be complete without hearing from the local community. Those chosen to provide input, represent the diversity of our community and those who are medically underserved, low-income and minority populations.
Overview
From December 6, 2018 to April 8, 2019, focus groups and key informant interviews were administered. Approximately 46 people were surveyed to obtain input from the community in the form of 4 focus groups (with a total of 36 focus group participants) and 15 key informant interviews. A full description of key informants and focus group participants can be found in the Appendix D of this document.
Focus Group
Focus group participants were end-users of programs and services provided by AHSH. Populations represented by focus group members included Promotoras, seniors, low-income, homeless/at-risk and representatives from the education sector. The majority of focus group participants live in Napa County, specifically in Santa Rosa, Yountville, St. Helena, and Calistoga.
Key Informant Interview
Key informant interviews consisted of key leaders in our community from an array of agencies, including those that serve children, homeless populations, seniors and community at large populations. Additionally, key informant interviews were conducted with representatives from the non-profit, educational, homeless, law enforcement, and faith-based sectors. The majority of the people interviewed serve residents in Napa County, specifically in in Santa Rosa, Yountville, St. Helena, and Calistoga. Additional localities identified for the service areas were Rutherford, Ronald Park, Deer Park and Hope Valley. Most key informants hold titles such as Executive Directors or Presidents, Superintendent, Mayor, and Head Pastor.
Methodology
To determine focus groups and key informants, AHSH team members were provided with a list of sample sectors for consideration that included: community-based organizations, local businesses, foundation/funders, school board/districts, city council, public health department, law enforcement, legal, faith-based organizations, and hospital leaders. Additionally, they were asked to consider the following criteria:
• Does this person represent a vulnerable populations?
• Does this person represent the uninsured/underinsured population?
• Does this person’s role transcend more than one county?
• Do we have representation from all sectors?
• Does it meet the requirement of community health needs assessments?
• Does this person’s role cross sectors?
Voices from the Community

2019 Community Health Needs Assessment | 44
Additionally, they were asked to consider the following populations for inclusion in focus groups: those dealing with mental health issues or substance abuse, minorities, low-income, uninsured/underinsured, and youth populations. While members considered potential groups and venues, they were asked to keep the following criteria in mind:
• Does this focus group represent a medically underserved, low income, or minority population(s)?
• Can this focus group speak to pressing health care issues in our community (i.e. children’s health, mental health, or access to care)?
• Does this focus groups represent diverse populations or health issues?
• Can this focus group speak to the social determinants of health in our community?
Objectives
Through engaging the community our objective was to discover strategies in which our hospital could collaborate to better serve communities and elevate the health status of our region. To better understand the needs, the focus groups and key informant interviews concentrated on these themes:
• Visions of a Healthy Community
• Health and Social Needs
• Existing Resources
• Barriers to Accessing Resources
• Hospital Perception and Opportunities
Additionally, key informants were asked about the greatest health and social needs of children, services that could improve health in the community, barriers for clients from an organizational perspective, and for any additional feedback.
Findings — Significant Health and Social Needs
The focus groups, key informants, and surveys contained questions about the most significant health needs in the community. Based on those responses, prioritization was given to issues most frequently mentioned. The top five mentioned below are a combination of all three data sources based on frequency of response.
The priority needs were identified by first creating codebooks based on the focus group, key informant interviews, and open text responses from the online survey. The codebooks assisted in combining the separate themes for comparison and analysis. The three sources were coordinated to supply richer interpretation when applicable. Using secondary sources, county information was gathered and compared with the themes found in the focus groups, key informant interviews, and surveys. Table 1 displays the separate ranking of most frequently mentioned health issues by focus group and key informant interviews. The overarching themes based on the amount of times the issue was mentioned across all three data sources are:

2019 Community Health Needs Assessment | 45
Focus Groups Key Informant Interviews
1 Mental Health Mental Health
2 Access to Healthcare Access to Healthcare
3 Chronic Diseases Housing
4 Dental Chronic Disease
5 Vision Nutrition
Supporting Quotes
“…one of the biggest drivers of lost productivity meaning, people’s missing work due to disability is depression. Well, that obviously links to emotional health. So, people’s ability to have healthy relationships whether it’s with their family, whether it’s at school, whether it’s on the job, whether it’s in the community, is they have to have the ability to deal with mental health issues that arise most commonly it’s depression anxiety. Both of which are can are often byproducts of trauma or stress. And we live in a very stressful world.”
“For me, I think it’s access. Not to health care but it’s access to doctors. I spent over 13 months trying to find a neurologist. The doctors were kind of pushed out of the hospital and then eventually pushed off into the community and they added office space and then eventually they got pushed out of there. And now I’m down on the Santa Rosa for some, I’m in Napa for some. So, the specialty areas were pushed out.”
“There’s a lot of, like other communities, there’s a lot of obesity across the board not just childhood but adults and older adults. It’s just that the problem that we are battling across the board, across the world. But it’s definitely here as well.”
“Housing is a theme that just comes up repeatedly no matter what meeting you’re in. I think there is a lack of affordable housing in Napa County, especially for workforce and young families and housing costs are very very high. And that cost burden really interferes with people’s ability to meet their other basic needs like food, health care and medications for older adults to be able to stay in their communities so that that influences the social connectedness.”
“…food -insecurity food access and food insecurity. So, people not being able to access affordable, healthy nutritious food.”
Table 1. Order of Most Frequently Mentioned Issues by Data Source Type
2019 Community Health Needs Assessment | 46
Findings by Themes
Visions of a Healthy Community
The main themes surrounding the vision of a healthy community is collaborative, inclusive, all-encompassing at addressing social, emotional, health, and environmental needs of the residents within the community according to key informant and focus group participants. This theme was characterized by affordable and quality housing, affordable and access to healthy foods, safe neighborhoods, walkability, clean air and water environment that is free from pesticides, and inclusivity regardless of race and sexual orientation. Additionally, a community that has accessible healthcare that includes not only physical structures such as clinics and hospitals, but also access to diverse medical specialties, to information and activities that contribute to good health and education complete the vision of a healthy community.
Supporting Quotes
“A community where such factors as environment, education, water, food, transportation, chemical use etc. are all factored in to provide the highest possible quality of life and long-term health for our community.”
“I would say my vision of a healthy community is one where you have broad measures of health and you look at health from a larger perspective. Meaning, physical, mental emotional, that people have basic needs food, clothing, shelter that it’s accessible and affordable and that they have opportunities for recreation. So, I think all the different components are socially connected. They have meaningful relationships. There’re opportunities for education and employment. There are good environmental standards.”
Social Factors
Homeless and working poor were two of the main themes that emerged as social factors that were frequently mentioned by focus group participants and key informants. Income and education were intertwined with ability to afford housing, seeking health and social services, and food insecurity. Additionally, working poor, according to respondents includes the inability to afford housing and other basic necessities while employed, not having enough time to spend with children due to working multiple jobs, inconsistent employment schedules (seasonality), and not being able to afford co-pays and/or insurance.
Supporting Quotes
“I have friends who are living in their car with kids. It’s not illegal to be homeless with your child. it’s not a danger to your child.”
“…I think there’s a tremendous amount of stress right now in the immigrant community. Which makes up a large segment of the population in Napa Valley. They are just under a lot of stress and strain and there’s a lot of political stuff impacting their community that’s been extremely difficult.”
“We’re in a high cost of living area and our compensation levels are not what they are in other parts of the Napa Valley.”
2019 Community Health Needs Assessment | 47
Health Needs of Children
Among key informants and focus groups, responses included social, emotional, and mental health aspects of children’s health and well-being. The biggest health issues among children was physical activity, obesity, and lack of activities. Additionally, housing, nutrition education, social/emotional resources, quality education, stress/anxiety, emergency pediatric care, quality and affordable infant and preschool were mentioned.
Supporting Quotes
“Don’t just look at the academics, look at the whole child - social, physical, emotional and the mental health part of it – everything.”
“I think the housing situation is important. You know, we know, that when children have to repeatedly move housing to different communities or schools, that can have impacts on education and behavior problems and also the possibility that children are living in substandard housing.”
“I think for our school aged youth, one of the things that we’ve heard quite a bit is that there’s just not enough kind of recreational things for them to do that are free and accessible after school or during the summers. So that’s a concern and it can lead to kind of more problematic behaviors like using substances or obesity.”
Existing Community Assets and Resources
The most commonly mentioned community assets and resources was the spectrum of organizations that are working to make the community better. They were proud that they have a mixture of social and educational services to meet senior needs as well as those of working adults. Some of the main resources and assets mentioned by focus groups were after school sports, WIC services, food banks, city park and recreation offerings, and the Boys and Girls Club.
Supporting Quotes
“We really have a pretty amazing spectrum of organizations and agencies that are all individually trying to meet facets of what are perceived needs.”
Barriers to Access
The greatest responses to barriers to access include financial resources, immigration status, and availability of clinical, specialty, and social support resources. Additionally, lack of transportation, language barriers, limited knowledge of available resources, the increased distance people must travel for care, perceived social and economic limitations and disparities, and insurance coverage were also mentioned as barriers across key informant and focus group respondents.
Supporting Quotes
“I think the community works a lot to pay for services. The stress we feel to pay for rent, to pay for health services. I’d rather wait until I absolutely have to. If I go to the doctors, the services are there but the insurance and co-pays are very expensive. Not just here in Calistoga, I think it’s the stress of the high cost of all the services.”

2019 Community Health Needs Assessment | 48
“Public transportation is tough around here. So, getting to and from the hospital or to and from appointments, and again, you know a lot of our patients come from hours and hours away. So, a lot of times they might be here, but their family is not able to be involved in their treatment because they can’t get here.”
“Income disparities, access opportunities are more available to those with greater means. Access to transportation maybe a parent who has the freedom to transport their kids to various activities, there are very affluent families and then those living in special neighborhoods with low income housing and, you know, that may be exacerbated by only one car and dad has that at work or both parents are working and there’s nobody to get help the kids get access to these things.”
Hospital Perception and Opportunities
Positive perceptions of the hospital were indicated by both focus group and key informant respondents. There were several comments related to recent improvement by the hospital regarding community outreach efforts within the community and at schools through health fairs and other health education forums. Opportunities identified include communication and partnerships that involved collaborating with others. As one key informant mentioned, operating in silos does not help with population health. Additionally, some focus group respondents still want to see more involvement from the hospital at different levels within the community.
Supporting Quotes
“I think it’s a tremendous asset personally to have St. Helena Hospital as well funded for this size of the community, it’s probably unheard of.”
“I think they could be present; I think they could be more involved on other levels of the community.”
“I think it’s a recognition that you can’t operate in a silo. You can’t do that out of from a silo you have to be partnering, leveraging resources. You have to be collaborating because population health is really driven by social determinants of health. And part of that is within the purview of a hospital and part of that involves other entities and players. So, if we all buy into the concept of population health broadly physical, mental, emotional and all different levels then I think it requires us to join forces and work together and I think.”

2019 Community Health Needs Assessment | 49
Prioritization of Health Needs
Priority health issue and baseline data
On September 24, 2019 the Mission Integration Sub Committee met to collectively review the findings of this assessment and prioritize the top priority needs Adventist Health St. Helena and partners involved will address over the next three years.
Identified community health needs
Priority Health Issue Rationale/Contributing Factors
Mental and Behavioral Health
• Anxiety
• Stress
• Depression
• Substance Abuse
Mental and behavioral health was the number one mentioned health needs among the focus groups and key informant interviews. Anxiety, stress, and depression were consistently mentioned across both groups of respondents.
Napa county is slightly higher than the state average and Lake County is 1.25% higher than the state average in poor mental health days.
Lake County (29.3) has a significantly higher mortality rate per 100,000 people than Napa County (10.1) and the state (10.4) mortality rates.
Among the Medicare population, depression for Lake County (16.6%) is slightly higher than Napa County (15.9%) or the state (15.8%) estimate.
Age-adjusted drug induced deaths in Lake County (40.4) are approximately 3.5-4% higher than Napa County (10.4) or state (12.7) estimates.
Access to Health Care
• Providers (including specialist - dentists/optometrists)
• Affordable insurance
As a critical component of measuring community health, access to health care was the second highest mentioned across the focus groups and key informant interviews. This theme encompassed higher visits to the emergency room as a result of limited specialist resources in the community.
Care providers, specifically geriatric, pediatric, and mental health, were most frequently mentioned in the focus groups and key informant interviews.
Asthma related ED visits are an indicator of managed asthmatic problems and access to primary care providers. Lake County (80.1) is almost double Napa county (40.2) or the state (46.9) visit rate per 100,000 people.
The mental health provider rate in Lake County (342.4) is slightly higher than the state (327.8) but significantly less that Napa County (497.9) per 100,000 people.
Dental providers for Lake County (45.1) are nearly half the state (83.4) estimate and Napa County (89.4) per 100,000 population.

2019 Community Health Needs Assessment | 50
Priority Health Issue Rationale/Contributing Factors
Chronic Disease
• Obesity
• Diabetes
• Cancer
Obesity and Diabetes were the most frequently mentioned chronic diseases across age groups and focus group and key informant respondents.
Napa County Medicare population has the lowest rates of obesity (21.1%) and heart disease (24.4%) as compared to the state.
The amount of exercise is an indicator of obesity. Access to exercise opportunities is significantly lower in Lake County (64.8%) than in Napa (92.4%), which is closest to the state (93%) estimate.
Diabetes is in the top 10 leading causes of death for Napa County.
Multiple forms of cancer appear for Lake and Napa counties in the top 10 leading causes of death. Lung Cancer is ranked higher than any other forms of cancer between the two counties.
Housing and Homelessness
High cost of living and homelessness were frequently mentioned across focus group and key informant participants as a major health need. Inadequate housing or moving frequently is a stressor that affects the total well-being of an individual. Housing intersects with mental health, chronic disease, nutrition, and ability to access consistent care.
Residents in both Lake County (40.4%) and Napa County (38.7%) counties experience cost-burdened households that are slightly lower than the state (41.9%) estimate.
Access to Healthy Foods
Fast food restaurants and grocery stores rates per 100,000 are indicators for obesity. Lake and Napa counties are lower in fast food restaurant rates (51.03, 60.08) and higher in grocery store rates (37.11, 29.31) than the state (80.51, 21.14).
Food insecurity directly correlates with nutrition. Lake County (15.6%) has a higher percentage of overall food insecurity than Napa County (8.0%), which is lower than the state.
Children’s food insecurity is significantly higher for Lake County (23.2%) than Napa County (13.8%) or the state (18.1%).
SNAP authorized retailers in Lake County is higher than Napa County and higher than the state estimate.

2019 Community Health Needs Assessment | 51
Prioritization process and criteria
On September 24, the Adventist Health St. Helena Mission Integration Sub Committee met to collectively review the findings of this assessment and determined the top priority needs that Adventist Health St. Helena and partners involved will address over the next three years. Stakeholders agreed on the criteria below to consider when making a decision. The criteria listed recognize the need for a combination of information types (e.g, health indicators and primary data) as well as consideration of issues such as practicality, feasibility, and mission alignment.
• Addresses disparities of subgroups
• Availability of evidence or practice-based approaches
• Existing resources and programs to address problems
• Feasibility of intervention
• Identified community need
• Importance to community
• Magnitude
• Mission alignment and resources of hospitals
• Opportunity for partnership
• Opportunity to intervene at population level
• Severity
• Solution could impact multiple problems
After tallying the results, there was a discussion to validate the needs. The top priority needs for 2019-2022 are:
Access to healthcare
Mental and behavioral health
Housing and Homelessness
• Access to providers - including specialist, dentist, optometrist
• Affordable insurance
• Anxiety
• Stress
• Depression
• Substance Abuse
Chronic disease
• Obesity
• Diabetes
• Cancer

2019 Community Health Needs Assessment | 52
• Karla Newton
• Dr. Steve Herber
• Dr. Timothy Lyons
• Jodi Brownfield
• Alfonso Trejo, Jr.
• Nelu Nedelea
• Pacific Union College – Angwin
• Fabio Maia
• Adventist Health Corporate
• Shelly Trumbo (by phone)
• Community Leaders
• Jenny Ocon – Up Valley Family Center
• Julie Spencer -Rianda House
• Rob Weiss – Mentis
The voting members in attendance were:

2019 Community Health Needs Assessment | 53
Plan development
Adventist Health St. Helena will develop strategies to address each need identified in this community health needs assessment. Strategies will be documented in a community health improvement plan (CHIP). The CHIP will describe how AHSH plans to address the health needs and plans to commit, potential partners, and metrics used to evaluate success. If AHSH does not intend to address the need, the CHIP will explain why.
The CHIP will describe the strategies intended to address the health needs and anticipated impact and partnerships. Partnerships are an important to addressing health needs, the CHIP will also describe any planned collaboration between AHSH and other facilities/organizations in addressing the health needs. The improvement plan will be made available May 2020.
Addressing Identified Needs
Top Health Needs Identified for 2019-2022:
Access to healthcare
Mental and behavioral health
Housing and Homelessness
• Access to providers - including specialist, dentist, optometrist
• Affordable insurance
• Anxiety
• Stress
• Depression
• Substance Abuse
Chronic disease
• Obesity
• Diabetes
• Cancer

2019 Community Health Needs Assessment | 54
Evaluating our efforts encourages accountability to the communities we serve and allows us to share our successes. This section evaluates the impact of actions that were taken to address the significant health needs identified in the prior community health needs assessment and associated implementation strategy (i.e. community health improvement plan) for 2017-2018. These outcomes are related to priority needs that were identified in the 2016 CHNA cycle.
Adventist Health St. Helena identified specific multi-year community benefit strategies to direct its resources and work with others in achieving unmet needs in the area. The following tables provide an update on progress made over the past cycle in meeting the measurable metrics targeted for 2017-2018. Results for 2019 have yet to be completed. More detailed and complete findings can be found in hospital’s implementation plan/community benefit report.
Priority Need: Mental Health
Intervention: Utilize the Center for Behavioral Health in Vallejo to expand services in Napa and Solano
Counties - Opened a new Behavioral Wellness Center in Vacaville, California.
Adventist Health Vallejo recognized the need to expand access to mental health services in Solano County. After extensive research, it was determined there was high demand for an intensive outpatient program focused on adults suffering from debilitating symptoms of mental illness. Launched in December of 2017, the Behavioral Wellness Center allows individuals to receive thorough treatment in a less restrictive environment than that which is offered in inpatient treatment or residential care. Yet, it provides a more structured therapeutic setting than that which is typically offered in a traditional outpatient setting.
Led by a multidisciplinary team, the Center offers evidence-based, innovative programs, including cognitive behavior therapy and dialectical behavioral therapy. Flexible treatment options, combined with convenient, flexible schedules will help meet patients’ needs so they can access care close to home.
Intervention: Recruited three psychiatrists to provide mental health services at Adventist Health Vallejo and Adventist Health St. Helena to serve children, adults and seniors
In an effort to expand access to treatment options for mental health disorders, Adventist Health St. Helena and Adventist Health Vallejo worked together to recruit three new physicians, including Sarah B. Benington, DO, Julie Oldroyd, MD and Heather Lewerenz, MD. These three physicians bring exceptional skills and talent and helped us to meet the growing needs of inpatient psychiatric care. In 2017, they were able to conduct more than 1,750 patient visits combined at both Adventist Health St. Helena and Adventist Health Vallejo.
2016 Evaluation

2019 Community Health Needs Assessment | 55
Intervention: Sponsored Mentis, an organization that provides mental health services for teens.
In an effort to expand access and increase awareness of mental health disorders, Adventist Health St. Helena proudly sponsored Mentis, Napa’s center for mental health services to expand access to mental health services and counseling for children in 2018. Mentis’ School-Based Program works closely with the Napa, Calistoga, Howell Mountain and St. Helena to provide counseling to children and teens in elementary, middle and high schools struggling with depression, violence, and family conflicts that are causing emotional, behavioral and academic problems. Mentis’ therapists work closely with the student and their families to address and resolve problems that are having a significant impact on high risk youth in Napa County.
Intervention: Provide inpatient mental health care for seniors.
Adventist Health St. Helena is working to reduce the gap in services available for our community as it relates to mental health. Our dedicated senior behavioral health unit provides inpatient mental health services for those in need and is the only unit of its kind in the North Bay.
Intervention: Increased outpatient mental health services by expanding available appointments and hours.
Transitioned Dr. Haycraft from part-time inpatient hospital and part-time outpatient clinic setting to full-time clinic setting allowing for additional appointments in clinic and increasing access to immediate mental health resources.
Intervention: Provided community education from an expert psychologist in gun violence to address
community fears and help heal after a tragic gun violence incident in the community.
In response to the horrific and tragic gun violence incident that occurred at the Yountville Veterans Home in early 2018, Adventist Health St. Helena held a free community wide presentation and education session in English and Spanish led by expert psychologist Dr. Amy Barnhorst. Approximately 80 community members attended. Dr. Barnhorst addressed the current status and capabilities of our mental health system, gun control and how mental health actually relates to gun violence in the United States. She also discussed healing after such event and resources that are available in the community to all members.
Partner:
• Mentis
Measured Impact

2019 Community Health Needs Assessment | 56
ObjectiveBaseline
MeasurementPerformance Target Intervention
Measurement Update
Expand access with an intensive outpatient program offered via the new Behavioral Wellness Center
2017: 0 0 for 2017 48 Patient visits
Increase access to inpatient services in Napa and Solano County by recruiting three physicians
2017: 0 1,500 patient visits 1,750 patient visits in 2017
AH finance
Create awareness, educate and provide access to mental health services in Napa County through sponsorship of Mentis
2017: 956 individuals 956 will be made aware of mental health disorders through educational programs
48 Patient visits
Increase awareness and treatment of mental health in Napa Valley
2018: # of patients served for mental health services
100% of persons who need services are able to access needed services
55 Patients/Clients
Increase awareness and treatment of mental health in schools through Teens Connect and Mentis
2018: 300 individuals in target audience
100% awareness 300 Mentis
Increase outpatient services
2018: Patient visits 100% of persons who need services are able to access needed services
936 patient visits Patients/Clients

2019 Community Health Needs Assessment | 57
Priority Need: Obesity and Diabetes
Intervention: Farmer’s Market
Through local growers, Adventist Health St. Helena sourced farm fresh produce for a monthly farmers’ market available onsite at Café 1878. Employees and community members received food demonstrations and had the option to purchase farm fresh produce once a month.
• 2018 - Total number of people served is approximately 480 people.
• 2017 - Total number of people served is approximately 480 people
Intervention: Wellness Fair for St Helena Unified School District
Adventist Health St. Helena worked together with the St. Helena Unified School District to put together a wellness curriculum that teaches students about mind, body and spirit health. The day’s events included education on health snacks, sleep, exercise interventions provided by TakeTEN, and Adventist Health St. Helena’s lifestyle medicine program that specializes in helping people to optimize their health through lifestyle and ten proven health habits.
• 2018 - Total number of people served is approximately 285 students.
• 2017 - Total number of people served is approximately 600 students..2017 - Number of Community Members Served: 69.
Intervention: Lead community partners to pursue Blue Zones in Upper Napa Valley
Adventist Health St. Helena opened the eyes of the upper valley community leaders on the benefits of becoming a Blue Zone. Through a series of meetings extended over a 90-day time period. The project was very well received – so much in fact that scope of the project has expanded geographically to include the entire county. At this stage Blue Zones has presented a revised proposal based on a revised scope of work for the entire county and we are awaiting responses from key leaders on next steps to initiate fundraising for the project.
• 2017 - More than 120 leaders of business, government, restaurant, hotel, wine industry, education and city officials participated to help find how we can work together to help our community live longer, healthier and more active lives.
Intervention: Utilize physicians, integrative medicine specialists, and nutritionists to educate parents and
students on health-related topics
Adventist Health St. Helena proudly sponsored a series of educational events that helped to educate the public on variety of health topics taught by physicians and dietitians. The Awaken Series is one example of many in which we brought subject matter experts to the community on prevention and quality of life topics as it relates to cancer. In addition, in 2017 we sponsored a monthly Heart Lecture Series whereby we were able to bring in leading cardiac experts who focused their talks on new treatment options for Afib, valves and atherosclerosis.
2019 Community Health Needs Assessment | 58
• 2018 - Total number of people served is approximately 90 community members. In addition, a monthly senior health education series in Calistoga was sponsored that highlights different health-related and self-care topics presented by specialists in each field.
• 2017 - Total number of people served is approximately 273 community members (207 community members in Napa County. We also conducted a lecture on orthopedics and joint replacement which served a total of 109 community members in Napa County and 110 community members in Solano County. We also participated in several educational events surrounding women’s heart health, in conjunction with the American Heart Association. Through these events we were able to serve a total of 67 community members).
Intervention: Include prenatal and early life nutrition as a topic in prenatal programs
Adventist Health St. Helena extended prenatal and early life nutrition into its curriculum of its series of twenty free child birth education classes offered over the year. This program teaches them the importance of prenatal health and good nutrition to optimize the health of both the expectant mother and their newly born child.
• 2018 - Total number of people served is approximately 260 mothers and fathers.
• 2017 - Total number of people served is approximately 260 mothers and fathers.
Intervention: Enhance diabetes education program to accommodate for more of the community, including
Spanish speaking patients
Adventist Health St. Helena provided our community with access to a free four-week diabetes education class in St. Helena. The free class series helps participant learn how simple lifestyle choices can make all the difference. Plus, participants have an opportunity to meet one on one with a registered dietitian where they work together to tailor a plan around the participant’s health and lifestyle.
• 2018 - Total number of people served is approximately 47 community members.
• 2017 - Total number of people served is approximately 184 community members
Intervention: Provide free community exercise programs to encourage physical fitness and weight management.
Together with the City of St. Helena Parks and Recreation department, we were able to introduce a free exercise class where members gathered in the park on a weekly basis, encouraging community members to get outside, get moving and take control of their health.
• 2018 - Total number of people served is approximately 130 community members.
• 2017 - Total number of people served is approximately 273 community members (207 community members in Napa County. We also conducted a lecture on orthopedics and joint replacement which served a total of 109 community members in Napa County and 110 community members in Solano County. We also participated in several educational events surrounding women’s heart health, in conjunction with the American Heart Association. Through these events we were able to serve a total of 67 community members).

2019 Community Health Needs Assessment | 59
Partners:
Measured Impact
• St. Helena Unified School District
• Blue Zones
• Napa County Health Department
• American Heart Association
• Up Valley Family Centers
• City of St. Helena Parks and Recreation
ObjectiveBaseline
MeasurementPerformance Target Intervention
Measurement Update
St. Helena Unified School District
What is the objective?
Participation of students
600 students 600 students School roster
Introduce Blue Zones
What is the objective?
Engagement with the community leaders
2017: Initiation of project
600 students School roster
Diabetes Education Classes
# of participants 2017: 150 2017: Self-Reported
School roster
Increase accessibility to healthy foods
2018: 0 2017: 150 600 students School roster
Increase education about healthy eating and active living
Knowledge of healthy foods and exercise patterns
2017: 200 people to participate in classes
2018:
2017: 575 participants in community education events in Napa County
2017: Patients/Clients
Increase opportunities for physical activity
0 2018: % of person participating in opportunities
2017: Patients/Clients
School roster

2019 Community Health Needs Assessment | 60
Priority Need – Access to Health Care
Intervention: Recruited seven physicians into the network to provide specialty services, including urology,
cardiology, cardiac electrophysiology and psychiatry.
Measured Impact
ObjectiveBaseline
MeasurementPerformance Target Intervention
Measurement Update
Expand accessibility to care
2017: 0 2017: Recruit seven physicians
Dr. Andreossi, Urology
Dr. Potter, General Surgery
Dr. John Laird, Interventional Cardiology
Dr. Dan Kaiser, MD, Cardiac Electrophysiology
Dr. Sarah Benington, DO, Psychiatry
Dr. Heather Lewerenz, Psychiatry
Dr. Julie Oldroyd, Psychiatry
2017: The total number of patient visits between all seven physicians in 2017 was 4,242 patient visits.
Self reported

2019 Community Health Needs Assessment | 61
Priority Need – Access to Health Care and Dental Care (Dental Care was added in 2018)
Intervention: Launched Dare to C.A.R.E program providing free heart and vascular
screening for seniors
Adventist Heart & Vascular Institute launched Dare to C.A.R.E, a free screening for those who qualify to detect carotid artery disease, abdominal aortic aneurysm, renal artery disease and extremity artery disease. This ultrasound screening provides the public with education about the unrecognized risks of vascular disease. Countless lives can be saved by teaching people about vascular disease and options they have for pre-emptive treatment. Adventist Heart & Vascular Institute launched Dare to C.A.R.E, a free screening for those who qualify to detect carotid artery disease, abdominal aortic aneurysm, renal artery disease and extremity artery disease. This ultrasound screening provides the public with education about the unrecognized risks of vascular disease. Countless lives can be saved by teaching people about vascular disease and options they have for pre-emptive treatment.
• 2018 Total number of people served a total of 21 screenings completed in 2018 in Calistoga, CA.
Intervention: Provide specialty care and surgical services to low-income, uninsured patients
Adventist Health St. Helena is a proud partner of Operation Access. Together with other community partners we are able to provide quality specialty care for low-income, uninsured patients. This work improves individual lives as well as the community as a whole. In 2017, the physicians who provide services includes Abhishek Choudhary, MD, Gastroenterology Stephanie Kekulawela, MD, General Surgery John H. Kirk, MD, Gynecology, Eugene Lam, MD, Gastroenterology Mark Potter, MD, General Surgery Andreas Sakopoulos, MD, Cardiothoracic Surgery and Huber Anesthesiology Group. Six physician volunteers provided 37 surgical and diagnostic procedures for 30 individuals at Adventist Health St. Helena. Of those who benefited from the services, 97% of the patients were very satisfied with their experience and 96% reported improved health, 90% reported that it improved their ability to work and 93% reported that it improved their quality of life.
Partners:
• Operation Access
Measured Impact
ObjectiveBaseline
MeasurementPerformance Target Intervention
Measurement Update
Expand accessibility to surgical and specialty care
2018: % of persons with a primary care doctor
2018: 100% of persons with an assigned doctor
2018: 37 2018: Patients/clients

2019 Community Health Needs Assessment | 62
Priority Need – Cancers
Intervention: Implemented a comprehensive hereditary cancer screening program offered through clinics throughout Napa county. Implementation of a Hereditary Cancer Risk Assessment (HCRA).
To support the program, Candace Westgate, DO, unified a team of specialists in the fields of oncology, oncologic surgery, plastic surgery, hematology, internal medicine, obstetrics, gynecology, dermatology and gastroenterology to work together to launch the county-wide effort. Through HCRA screenings offered through primary care clinics, patients learned if they are predisposed to familial and hereditary cancers. This has proven to improve patient care and population outcomes by assisting patients who have a suspected hereditary cancer syndrome in the early identification of cancer.
Through the support of the Hereditary Cancer Consortium those patients who tested positive are now able to access specialty care to ensure adequate surveillance and/or screenings to align with their type of cancer and condition.
• 2017: More than 454 patients who elected to participate in the Hereditary Cancer Risk Assessment
(HCRA). A total of 28 patients tested positive and are now undergoing increased surveillance or tests to
understand the extent of their risk, while 426 patients tested negative and can feel confident in knowing
they are not at risk of hereditary cancer syndrome.
Intervention: Prevention – Provide access to lung cancer screening program throughout Napa and Lake counties.
Adventist Health St. Helena continues to offer patients access to the Lung Nodule and Early Detection Lung Cancer Screening Program, a program designed to promote earlier detection, more accurate treatment options with early detection, access to advanced technologies and procedures for diagnosis and treatment of lung cancer and the dedicated support of a specialized Lung Health Nurse Navigator.
To support the program, Adventist Health St. Helena provided access to reduced dose CT screenings. According to the New England Journal of Medicine, early CT screenings have proven to increase survival rates by as much as 30% compared to traditional chest x-rays. To make this technology more accessible to all patients, we are offering a discounted rate for high risk patients who qualify.
As part of the program, the hospital continued to offer access to the iLogic Lung Navigation System from Super Dimension which uses Electromagnetic Navigation Bronchosocopy (ENB) to provide a minimally invasive pathway to peripheral lung nodules. With this technology, our physicians are better able to locate, test, and plan treatment for lung nodules and lymph nodes difficult to access with traditional bronchoscopy.
In addition, the program also includes Endobronchial Ultrasound (EBUS), a relatively new procedure used in the diagnosis of lung cancer, lung infections, and other diseases that cause enlarged lymph nodes or masses in the chest. EBUS is a minimally invasive procedure, so patients can have it on an outpatient basis. It is proven to be highly effective. Technology allows physicians to sample central lung masses and lymph nodes with the help of ultrasound guidance.

2019 Community Health Needs Assessment | 63
Intervention: Prevention – Provide access to education around early detection and prevention.
The Martin-O’Neil Cancer Center sponsors a series of educational events for the community focused on cancer prevention. In 2017, the series included topics such as quality of life, and the power of prevention with a plant based diet, among other topics. The events have brought in hundreds of community members to learn from leading experts and is relied upon for family members whose loved ones are undergoing treatment themselves.
• 2017 - Approximately 276 community members attended the program.
Intervention: Prevention – Provide access to support services to individuals undergoing treatment for cancer
and/or caregivers or family members who are supporting a loved one who is undergoing treatment for cancer
• Integrative Cancer Support Services are an integral part of the Martin-O’Neil Cancer Center. They provide
patients with emotional, physical and spiritual support through all stages of cancer survivorship. The
following support services help to strengthen the body, nurture hope and courage, and enrich the spirit:
• Acupuncture
Proven to be a valuable treatment for a number of side effects associated with cancer treatment such as
anxiety, depression, fatigue, insomnia, nausea, neuropathy or pain. We treated 580 patients in the year
2017 alone with acupuncture.
• Massage Therapy / Aromatherapy
Our Cancer Center offers daily therapeutic massage to patients, their family members and caregivers
to relieve stress, reduce pain and anxiety and encourage overall relaxation. In addition, we offer the
practice of using natural oils to enhance psychological and physical wellbeing. These are skillfully
offered by our massage staff to enhance the healing process.
A high percentage of patients in the Martin-O’Neil Cancer Center utilize both of these services as they
are offered throughout the day in the both the lobby and infusion areas. We provide every new patient
two complimentary full body massages.
• Art Therapy
Expressive art therapy groups are designed to allow individuals to experience thoughts, feelings and
emotions through the art making process. The classes are offered the last Wednesday of the month,
February - November. Approximately 96 patients participated in Art Therapy in 2017.
• Food of Love
A complimentary food support program whereby nutrient dense, delicious meals are provided to Martin-
O’Neil Cancer Center patients. The Center provided 960 meals in 2017.
• Nutrition Counseling
Our Oncology Certified Registered Dietitian will meet with you and discuss your personal nutritional
needs and guide you with specific dietary recommendations.

2019 Community Health Needs Assessment | 64
• Patient Counseling
An Oncology Board Certified Licensed Clinical Social Worker meets with you and/ or your loved ones to
assess your emotional well-being and provide support as needed.
• 2017 - Total number of people served is approximately 672 community member and participated actively
in the services listed above, whether it was a patient or a family member or friend of a patient.
Intervention: Partnered with ZERO Prostate Cancer to promote education and awareness of prostate cancer
prevention and treatment to approximately 3,600 community members
In 2018, Adventist Health St. Helena’s Martin O’Neil Cancer Center is a proud sponsor of the Zero Prostate Cancer Napa Valley, where a team of staff members, physicians and community members participate in a 5k or 10k walk/run to raise awareness and promote prostate cancer screening. All proceeds provide research for new treatments, free prostate cancer testing, and education for men and families about prostate cancer
Intervention: Held first-ever Turkey Trot to promote the importance of early hereditary cancer screening and
educate the community on the AHEAD (Adventist Health Early All-Around Detection) Program for early detection and treatment of genetic cancers
Founded by Dr. Candace Westgate, an obstetrician and gynecologist, our AHEAD program sponsored the first-ever Turkey Trot in St. Helena promoting health, community and the importance of early hereditary cancer screening for genetic cancers
• 2018 - Total number of people served is approximately 150 participants in the first year.
Intervention: Community wide education through the Awaken Series
The Martin-O’Neil Cancer Center held community wide education and support programs throughout 2018 that focused on topics like self-awareness and the importance of genetic screening. During the genetic cancer discussion participants were made aware of genetic screenings available to them.
Partners:
• Myriad Genetics
• Super Dimension

2019 Community Health Needs Assessment | 65
Measured Impact
ObjectiveBaseline
MeasurementPerformance Target Intervention
Measurement Update
Increase access to diagnosis of lung cancer screening
2017: 0
2018: NA
2017: 200 low dose CT screenings
2017:
206 underwent low dose lung screenings.
3 patients diagnosed with lung cancer
Self reported
Identify patients who are predisposed to hereditary cancer syndrome
Increase awareness among patients who present as high risk
2017: 500 patients who undergo HCRA screening
2018: NA
2017: 443 patients were tested/32 tested positive
Patients/Clients
Increase awareness of interventions that prevent cancer
2017: # of attendees 2017: 150 attendees 600 students School roster
Provide cancer support services for patients diagnoses with cancer and their caregivers
# of participants 2017: 500 participants
2018: 200 participants
2017: 672 participants
2018: 248 participants
Patients/Clients
Increase in number of cases identified through genetic testing
# of genetic tests that result in gene positive outcomes
Genetic tests that test positive
2018: Out of 440 genetic tests, 39 patients tested positive
Patients/Clients
Partners:
• Myriad Genetics
• SuperDimension

2019 Community Health Needs Assessment | 66
Priority Need - Access to shelter and respite care for the homeless
Adventist Health St. Helena is proud to support and be a part of Catholic Charities Shelter and Housing Department’s initiative to operate the Nightingale Center, a medical respite center for patients from Queen of the Valley and Adventist Health St. Helena Hospital. The center is designed to help patients who have no place to go to continue with their recovery. The Nightingale House will help patients to be released to a safe and stable environment to minimize recidivism. This facility will have 11 beds to provide temporary on-site residential medical care.
Partners:
• Gasser Foundation
• Catholic Charities
Measured Impact
Transportation Program for Seniors
Transportation is a major barrier to healthcare access for many seniors. A recent survey by HAPI (Healthy Aging Population Initiative) indicated that transportation challenges are the leading concern from patients in this population. As a note: 24% of the population of St. Helena is senior, and 22% of Calistoga.
In partnership with Rianda House and Molly’s Angels, Adventist Health St. Helena sponsored a pilot with on-demand ride service Lyft for seniors facing transportation challenges getting to and from their appointments at the hospital. The program was very successful and was able to provide approximately 41 rides for seniors.
Partners:
• Rianda House
• Molly’s Angels
ObjectiveBaseline
MeasurementPerformance Target Intervention
Measurement Update
Increase access to care for the homeless
# of patients served by the Medical Respite Care Facility
2018: 100% of persons who need services are able to access needed services
2018: Estimated number of patients served is 336
2018: Patients/Clients

2019 Community Health Needs Assessment | 67
This community health needs assessment was adopted on 10/17/19 by the Adventist Health System/West Board of Directors. The final report was made widely available on December 31, 2019.
2019 CHNA Approval
CHNA/CHP contact:
Karla Newton, Community Health Program Manager
Adventist Health St. Helena & AH Vallejo 10 Woodland Road St. Helena, CA 94574 4
Phone number: (707) 363-3589 Email: [email protected]
To request a copy, provide comments or view electronic copies of current and previous community health needs assessments or community benefit implementation strategies, please visit the Community Benefits section on our website at https://www.adventisthealth.org/ about-us/community-benefit/.

2019 Community Health Needs Assessment | 68
HC2 Strategies, Inc. is a strategy consulting company that works with health systems and hospitals, physician groups, communities and other non-profit organizations across the country to connect and transform the health and well-being of their communities. They work to integrate the clinical and social aspects of community health to improve equity and reduce health disparities.
Laura Acosta, MPH, HC2 Strategies, Inc.
Laura Acosta has experience in healthcare administration, community-based activities, faith communities, and healthy communities initiatives. She provides leadership to various community-based activities focused on improving the quality of life for Inland Empire, California residents. She has extensive knowledge and experience with community benefits, community health needs assessments, and community health plans. Ms. Acosta earned her bachelor degree in Business Administration, and a Master in Public Health from Loma Linda University with a focus in policy and leadership. She has been involved in leadership programs with the Inland Empire Economic Partnership and Healthcare Executives of Southern California, and has been actively involved in experience design.
Jaynie Boren, HC2 Strategies, Inc.
Jaynie is a strategy and business development executive with more than 25 years of progressive leadership responsibility in planning, growing market share, creating new revenue opportunities, and facilitating relationships and joint ventures for independent hospitals, major integrated healthcare delivery systems and tertiary medical centers.
She has the ability to bring individuals with diverse interests together to achieve corporate and business objectives. Jaynie is an executive that can bring together her outstanding market research, planning, marketing, strategy, project development, implementation, and relationship building skills. She has documented success in building strategic plans and working with teams to assure implementation of goals.
James A. Martinez, Ed.D., MPH
James earned a master’s degree in epidemiology and a doctoral degree in health education from Columbia University, NY. He is a population health data expert using data to tell the community story. He teaches courses in database design, cartography and GIS applications in public health practice at Loma Linda University Health. He is also a program manager at the Inland Empire Health Plan.
He also works on a community-lead partnership with local government on developing a countywide health improvement framework, and asset mapping applications to promote networks of healthy communities and real-time community health management platforms for hospital emergency department visits and solutions for preventing readmissions.
Appendix A: Qualifications of Consultants

2019 Community Health Needs Assessment | 69
Appendix B: Glossary of Terms
Ambulatory Care Sensitive Conditions (ACSC)
A set of 28 medical conditions/diagnoses “for which timely and effective outpatient care can help to reduce the risks of hospitalization by either preventing the onset of an illness or condition, controlling an acute episodic illness or condition, or managing a chronic disease or condition.” Examples of ACSCs include:
Benchmark
A benchmark is a measurement that serves as a standard by which other measurements and/or statistics may be measured or judged. A “benchmark” indicates a standard by which a community can determine whether well the community is performing well in comparison to the standard for specific health outcomes.
Community Resources
Community resources include organizations, people, partnerships, facilities, funding, policies, regulations, and a community’s collective experience. Any positive aspect of the community is an asset that can be leveraged to develop effective solutions.
• Angina
• Aspiration
• Asthma
• Cellulitis
• Congestive heart failure
• Constipation
• Convulsions/epilepsy
• COPD
• Dehydration and gastroenteritis
• Dental conditions
• Diabetes complications
• Ear, nose and throat infections
• Gangrene
• Gastro-oesophageal reflux disease
• Hypertension
• Iron deficiency anemia
• Influenza
• Nutritional deficiencies
• Pelvic inflammatory disease
• Perforated/bleeding ulcers
• Pneumonia and other acute LRTI
• Tuberculosis and other vaccine preventable
• UTI/pyelonephritis

2019 Community Health Needs Assessment | 70
Federal Poverty Level
The set minimum amount of gross income that a family needs for food, clothing, transportation, shelter and other necessities. In the United States, this level is determined by the Department of Health and Human Services and used to determine financial eligibility for certain federal programs. One can calculate various percentage multiples of the guidelines by taking the current guidelines and multiplying each number by 1.25 for 125 percent, 1.50 for 150 percent, etc. 150%, 300%, and 400% are included in the table below.
2019 Poverty Guidelines for the 48 Continental United States, Annual Salary
Persons in Family/Household Size
Poverty Guideline (Level)
150% of the FPL
300% of the FPL
400% of the FPL
1 $12,490 $18,735 $37,470 $49,9602 $16,910 $25,365 $50,730 $67,6403 $21,330 $31,995 $63,990 $85,3204 $25,750 $38,625 $77,250 $103,0005 $30,170 $45,255 $90,510 $120,6806 $34,590 $51,885 $103,770 $138,3607 $39,010 $58,515 $117,030 $156,0408 $43,430 $65,145 $130,290 $173,720
For families/households with more than 8 persons, add $4,420 for each additional person.
2019 Poverty Guidelines for the 48 Continental United States, Monthly Salary
Persons in Family/Household Size
Poverty Guideline (Level)
150% of the FPL
300% of the FPL
400% of the FPL
1 $1,041 $1,561 $3,123 $4,1632 $1,409 $2,114 $4,228 $5,6373 $1,778 $2,666 $5,333 $7,1104 $2,146 $3,219 $6,438 $8,5835 $2,514 $3,771 $7,543 $10,0576 $2,883 $4,324 $8,648 $11,5307 $3,251 $4,876 $9,753 $13,0038 $3,619 $5,429 $10,858 $14,477

2019 Community Health Needs Assessment | 71
Federally Qualified Health Center
Federally Qualified Health Centers are community-based health care providers that receive funds from the Health Resources & Services Administration Health Center Program to provide primary care services in underserved areas. They must meet a stringent set of requirements, including providing care on a sliding fee scale based on ability to pay and operating under a governing board that includes patients. Federally Qualified Health Centers may be Community Health Centers, Migrant Health Centers, Health Care for the Homeless, and Health Centers for Residents of Public Housing.
Focus Group
A group of people questioned together about their opinions on an issue. For this CHNA, focus groups answered questions related to components of a healthy community and issues in their community.
Food insecurity
A lack of consistent access to food resulting in reduced quality, variety, or desirability of diet or multiple indications of disrupted eating patterns and reduced food intake.
Housing Cost Burden
Measures the percentage of household income spent on mortgage costs or gross rent. The US Department of Housing and Urban Development currently defines housing as affordable if housing for that income group costs no more than 30 percent of the household’s income. Families who pay more than 30 percent of their income for housing are considered cost burdened; families who pay more than 50 percent of their income for housing are severely cost burdened.
Health indicator
A single measure that is reported on regularly and that provides relevant and actionable information about population health and/or health system performance and characteristics. An indicator can provide comparable information, as well as track progress and performance over time.
Healthy People 2020
Healthy People 2020 provides science-based, 10-year national objectives for improving the health of all Americans. For three decades, Healthy People has established benchmarks and monitored progress over time to encourage collaborations across communities and sectors, empower individuals toward making informed health decisions, and measure the impact of prevention activities.

2019 Community Health Needs Assessment | 72
Housing Units with Substandard Conditions
Housing that poses a risk to the health, safety or physical well-being of occupants, neighbors, or visitors. Substandard housing increases risk of disease, crime, social isolation and poor mental health. Substandard housing is associated with one or more of the following conditions:
1. Is dilapidated;
2. Does not have operable indoor plumbing;
3. Does not have a usable flush toilet inside the unit for the exclusive use of a family;
4. Does not have a usable bathtub or shower inside the unit for the exclusive use of a family;
5. Does not have electricity, or has inadequate or unsafe electrical service;
6. Does not have a safe or adequate source of heat;
7. Should, but does not, have a kitchen; or
8. Has been declared unfit for habitation by an agency or unit of government.
Infant Mortality Rate
Expressed as a rate per 1,000 births, this is defined as the death of a child prior to its first birthday (should be read, for example, as 7.8 infant deaths for every 1,000 births).
Low Birth Weight
Expressed as a rate per 1,000 births, this refers to infants born with a weight between 1,500 and 2,500 grams or between 3.3 and 5.5 pounds. Very low birth weight infants are born with a weight less than 1,500 grams.
Prenatal Care
Adequacy of prenatal care calculations are based on the Adequacy of Prenatal Care Utilization Index (APNCU), which measures the utilization of prenatal care on two dimensions. The first dimension, adequacy of initiation of prenatal care, measures the timing of initiation using the month prenatal care began reported on the birth certificate. The second dimension, adequacy of received services, is measured by taking the ratio of the actual number of visits reported on the birth certificate to the expected number of visits. The expected number of visits is based on the American College of Obstetrics and Gynecology prenatal care visitations standards for uncomplicated pregnancies (1), and is adjusted for the gestational age at initiation of care and for the gestational age at delivery. The two dimensions are combined into a single summary index, and grouped into four categories: Adequate Plus, Adequate, Intermediate, and Inadequate.
• Adequate Plus: Prenatal care begun by the 4th month of pregnancy and 110% or more of recommended visits received.
• Adequate: Prenatal care begun by the 4th month of pregnancy and 80-109% of recommended visits received.

2019 Community Health Needs Assessment | 73
• Intermediate: Prenatal care begun by the 4th month of pregnancy and 50-79% of recommended visits received.
• Inadequate: Prenatal care begun after the 4th month of pregnancy or less than 50% of recommended visits received.
Primary Data
Primary data are new data collected or observed directly from first-hand experience. They are typically qualitative (not numerical) in nature. For this CHNA, primary data were collected through focus groups and key informant interviews.
Secondary Data
Data that has already been collected and published by another party. Typically, secondary data collected for CHNAs is quantitative (numerical) in nature (for example, data collected by a local or state department of health, the Centers for Disease Control and Prevention, or a state department of education).
Teen Birth Rate
Expressed as a rate per 1,000 births, this refers to the quantity of live births by teenagers who are between the ages of 15 and 19.

2019 Community Health Needs Assessment | 74
Annie E. Casey Foundation (2018). Kids Count Data Center. Retrieved from https://datacenter.kidscount. org/.
California Department of Public Health, California Breathing. County Asthma Data Tool, 2015-2016. Retrieved from https://www.cdph.ca.gov/ Pro-grams/CCDPHP/DEODC/EHIB/CPE/Pages/CaliforniaBreathingData.aspx
California Department of Public Health, County Health Status Profiles 2018, Individual County Data Sheets. 2011-2016 Death Files. Retrieved from https://www.cdph.ca.gov/Programs/CHSI/Pages/ Individual-County-Data-Sheets.aspx
CARES Engagement Network (2019) CARES CHNA Report. Retrieved from https:// engagementnetwork.org/assessment/.
Federal Bureau of Investigation, Uniform Crime Reporting Program, Retrieved from https://ucr.fbi.gov
Feeding America, Map the Meal Gap, 2016, Retrieved from http://map.feedingamerica.org/
National Income Low Housing Coalition, Out of Reach 2018: California, Retrieved from https://reports.nlihc.org/oor/california
Office of Environmental Health Hazard Assessment. CalEnviroScreen 3.0 Overall Results and Individual Indicator Maps, June 2018. Retrieved from https://oehha.ca.gov/calenviroscreen/maps-data
Robert Wood Johnson Foundation, County Health Rankings and Roadmaps, 2018, Retrieved from http://www. countyhealthrankings.org
State of California Department of Justice (2018). OpenJustice Online Database. Retrieved from https:// openjustice.doj.ca.gov/
Appendix C: Data Sources Cited

2019 Community Health Needs Assessment | 75
This assessment would not have been possible without input from our community. This section outlines the community leaders that served as key informants for this assessment, as well as a description of the focus groups convened.
• 46 total participants
• 4 focus groups (total of 31 focus group participants)
• 15 key informants
Description of Focus Groups
Appendix D: Description of Key Informants and Focus Groups
2019 Focus Group
Organization Location Populations Served Language # of Participants
UpValley Family Centers
1608 Lake St, Calistoga, CA 94515
Promotoras Spanish 8
Rianda House1475 Main St, St. Helena, CA 94574
Seniors English 8
Napa Valley Unified School D - St. Helena School District
1316 Hillview Place, St. Helena, CA 94574
Teachers and staff English 9
Abode Services100 Hartle Court , Napa, CA 94559
Homeless English 6

2019 Community Health Needs Assessment | 76
2019 Key Informant Contact List
Name Title Organization Sector Population Served
Amy Zuniga Head PastorGrace Episcopal Church
Faith CommunityCommunity at
large
Chris Canning Mayor City of Calistoga GovernmentCity of Calistoga
residents
Emma MoyerSenior Program Manager
Abode ServicesHomeless housing
Homeless shelters and
outreach programs in Napa County
Geoff Ellsworth
Mayor City of St. Helena City CouncilCity of St. Helena
residents
Heather Lewerenz, MD
Behavioral Health Physician
Adventist Health St. Helena
Hospital Health
Indira LopezProgram Director
Up Valley Family Centers
Non-profit - Family Resource
Center
Upper Valley- Napa & Sonoma County residents
Jennifer Henn, PhD
Public Health Manager - Chronic Disease and Health Equity
Napa County Public Health
Public HealthNapa County
residents
Jenny OconExecutive Director
UpValley Family Centers
Community based non-profit
Hispanic, migrants,
underserved, families, children,
seniors
Julie SpencerExecutive Director
Rianda HouseCommunity
based non-profitNapa County
seniors
Marylou Wilson, PhD
Superintendent St. Helena UnifiedEducation - TK- 12
School aged children & families
Description of Key Informants

2019 Community Health Needs Assessment | 77
2019 Key Informant Contact List
Name Title Organization Sector Population Served
Rob WeissExecutive Director
MentisBilingual mental health services
Napa County residents
Robert Cushman, PhD
President and CEO
Pacific Union College
Education - Liberal Arts
College
PUC students and staff/
community at large
Rodney Look, MD
Chief of Emergency Services
Adventist Health St. Helena
HospitalNapa County
residents
Steve Herber, MD
PresidentAdventist Health St. Helena
HospitalLake and Napa
County residents
Tim FoleyInterim Police Chief
City of St. Helena Law enforcementCity of St.
Helena residents
2019 Community Health Needs Assessment | 78
Appendix E: Asset Inventory and Community Resources
Catholic Charities of the Diocese of Santa Rosa
Napa, CA 94558
(707) 528-8712
www.srcharities.org
Collabria Care
Napa, CA 94559
(707) 258-9080
http://collabriacare.org/
Community Health Initiative
2140 Jefferson Street, Suite D
Napa, CA 94559
(707) 227-0830
Fax (707) 226-9923
COPE Family Center
707 Randolph Street
Napa, CA 94559
(707) 252-1123
Girls on the Run Napa & Solano
Napa, CA 94558
(707) 637-8909
www.gotrnapasolano.org
Leukemia and Lymphoma Society
101 Montgomery Street Suite 750
San Francisco, CA 94104
(415) 6251100
Molly’s Angels of Napa Valley
433 Soscol Ave #100, Napa, CA 94559
(707) 224-8971
Napa County Bicycle Coalition
Napa, CA 94558
(707) 812-1770
www.napabike.org
Napa Valley Vine Trail Coalition
Napa, CA 94558
(707) 252-3547
http://www.vinetrail.org
Nimbus Arts
649 Main St, St Helena, CA 94574
(707) 963-5278
OLE Health
Napa, CA 94558
(707) 254-1770
www.olehealth.org
Operation Access
(415) 733-0004
Pacific Union College
(707) 965-6313
Rianda House Senior Activity Center
St. Helena, CA 94574
(707) 963-8555
www.riandahouse.org
St. Helena Chamber of Commerce
(707) 963-4456

2019 Community Health Needs Assessment | 79
St. Helena Soroptomist
PO Box 1007 St. Helena, CA 94574
Email: [email protected]
St. Helena Unified School District
2198, 465 Main St, St Helena, CA 94574
Phone: (707) 967-2708
UpValley Family Centers of Napa County
St. Helena, CA 94574
(707) 965-5010
www.upvalleyfamilycenters.org
Zero Prostate Cancer Napa Valley
818-473-53511
UpValley Community Leaders
(707) 965-5010 ext. 200
Healthy Aging Population Initiative (HAPI)
(707) 258-9087
UpValley Senior Collaborative
(707) 963.8555 ext. 105
Park Rx
(707) 967-2736
Live Healthy Napa County
(510) 305-2854
Monrovia Group
(707) 967-2701

2019 CHNA approval This community health needs assessment was adopted on by the Adventist Health System/West Board of Directors. The final report was made widely available on December 31, 2019.
CHNA/CHIS contact:
Karla Newton, Community Health Program Manager
Adventist Health St. Helena & AH Vallejo 10 Woodland Road St. Helena, CA 94574
Phone: (707) 363-3589Email: [email protected] request a copy, provide comments or view electronic copies of current and previous community health needs assessments or community benefit implementation strategies, please visit the Community Benefits section on our website at https://www.adventisthealth.org/about-us/community-benefit/

10 Woodland Road
St. Helena, CA 94574