Embed Size (px)
Citation preview

CONNECT WITH MAGNA
magna.com
Magna International Inc.
337 Magna Drive
Aurora, Ontario
Canada L4G 7K1
Telephone: (905) 726-2462
FSC CERT ADDED BY PRINTER
2019Annual Report
MAGNA INTERNATIONAL INC.

Leading the Way in an Evolving Industry
In an ever-changing world, Magna continues to be a leader
in the global auto industry. Our innovative thinking and
world-class manufacturing – more than ever – help advance
mobility products and technologies for a greener future.
Strategic and sustainable decisions allow us to anticipate
changes, utilize an ambitious and entrepreneurial employee
base and adapt as needed, all while continuing to grow the
company and create shareholder value.

27$39.4
13,000 engineers
countries 165,000+employees
346 manufacturing / assembly facilities
billion in sales
0waste to landfill
by 2022
80+different innovative
processes

MESSAGE FROM THE CHIEF EXECUTIVE OFFICER
Sustainable from the Start
Don Walker
Growing Magna into a $40 billion company hasn’t happened by accident. Our commitment to world-class manufacturing, innovation and our people, all within an entrepreneurial culture, have been central to our strategy for creating sustained value. It’s also a stabilizing force in times of economic downturn and uncertainty.
Although production efficiencies and cost consciousness have been part of our operational mindset from the start, we have further increased our efforts to save resources and the planet. We are focused on big initiatives, such as powertrain electrification, as well as other important steps like energy-reduction efforts and increasing recycling in our facilities around the world.
Sustainability and innovation go hand-in-hand. We are executing long-term product strategies that require investment of our resources today, in order to achieve returns in the years to come. For Magna this means continuing to invest in powertrain electrification, autonomous driving and vehicle lightweighting to name just a few.
As we progress through this decade in these transformative times, we will continue to address economic, social, environmental and regulatory changes:
• By delivering products that help our customers achieve their sustainability goals, including cutting vehicle emissions and improving fuel economy.
• Through green initiatives focused on exceeding regulatory requirements in our manufacturing divisions. We are targeting water and energy conservation, waste management and emission controls, all efforts that bolster our reputation for world-class manufacturing.
• By doing things right today, so that our company and the next generation have a future. That includes continuing to cultivate a diverse and inclusive workforce in which our employees bring together their rich perspectives and vital talents for the common good of the organization. We will also continue to be good partners in the communities in which we live and work.
We are committed to delivering a safer, cleaner and smarter future for all who share the road and the world. It is what drives our business decisions and fuels our innovations. More importantly, it enables us to continue to create value for all our stakeholders, including our employees, customers and investors.
Chief Executive Officer

SUSTAINABILITY EMBEDDED IN EVERYTHING WE DO
Sustainability has been a part of the company’s strategy from the start, from our products to operations to culture. Here are just a few of the ways we continue to deliver on that strategy:
• We help automakers reduce vehicle emissions and improve fuel economy, including through our new family of transmissions, which offers a highly versatile and scalable platform that can accommodate 80% of the global volume of front-wheel-drive vehicles.
• Our recyclable modules provide up to 25% weight savings compared to traditional versions and allow for broader design flexibility.
• More than 70% of Magna’s facilities have switched to energy-efficient LEDs.
• More than 65% of our manufacturing plants have active Energy Teams in place with a goal to grow that to 100% by the end of 2021.
On-site gardens at several Magna divisions are irrigated with recycled wastewater.
Magna employees lead many local sustainability initiatives, including beekeeping in their spare time, an effort that has spread to some of our production facilities in Europe. Starting in 2020, we will sponsor beehives at ten of our facilities.
Hundreds of Magna employees dedicate thousands of hours to volunteering in organizations such as Engineers Without Borders and FIRST Robotics.

As a global mobility technology company, Magna is uniquely positioned to meet the needs of the market today while addressing the challenges of future mobility. We remain committed to striking a balance between investing for the future and continuing to drive our results in the near term.
Our expertise and leading technologies across our portfolio, together with our agility, provide the foundation for our competitive business model. This supports our ability to create value over the long-term even as our industry faces significant change and near-term challenges.
As we progress through this decade, Magna expects to continue to capitalize on key trends, including electrification, autonomy and light-weighting. We have a long history of developing products and processes to help solve our customers’ problems and support them in making lighter, cleaner, safer and smarter vehicles.
Our capital strategy is to maintain a strong balance sheet, ample liquidity and high investment-grade credit ratings. At December 31, 2019, we had over $4 billion of available liquidity, between cash and credit lines. This strategy allows us to invest prudently for growth through organic opportunities, innovation spending and acquisitions that fit our strategy, as well as to return capital to shareholders. It also leaves us well-positioned in times of economic downturn.
We have returned a significant amount of capital to shareholders for many years. In fact, over the past three years we’ve returned $5.7 billion to shareholders in the form of share repurchases and dividends, including over $1.7 billion in 2019.
Going forward, we anticipate:
• Further sales growth, driven by our strong positioningrelative to industry trends;
• Generating strong free cash flow1, reflecting theconversion of our sales growth together with adisciplined approach to capital spending; and
• Continued return of capital to shareholders, throughboth share repurchases and dividends. Our dividendincrease in respect of the fourth quarter of 2019represented the eleventh consecutive year of dividendincreases for Magna.
Our balanced approach should create value for shareholders, while providing us with the flexibility to pursue strategic opportunities, as Magna plays a key role in the new mobility ecosystem.
MESSAGE FROM THE CHIEF FINANCIAL OFFICER
A Balanced Approach in a Time of Unprecedented Change
Vince Galifi
1 Free cash flow is a non-GAAP financial measure. Free cash flow represents cash from operating activities plus proceeds from normal course dispositions of fixed and other assets minus capital spending minus investments in other assets.
Chief Financial Officer

2018
SALESU.S. $ MILLIONS
DILUTED EPSU.S. $
CASH FLOW FROM OPERATING ACTIVITIESU.S. $ MILLIONS
RETURN ON EQUITY1 RETURN ON INVESTED CAPITAL1, 2 DIVIDENDS PAID PER SHARE3
U.S. $
2019 2018 2019 2018 2019
2018 2019 2018 2019 2015 2016 2017 2018 2019
40,827 39,431
14.9%
0.881.00
1.10
6.615.59
3,7183,960
10.1%
15.5%
19.7%
1.321.46
KEY FIGURES AT-A-GLANCE
1 Return on Equity and Return on Invested Capital are non-GAAP financial measures. Definitions and reconciliations to the most directly comparable financial measures calculated in accordance with U.S. GAAP, can be found in the company’s Annual Report for the Year Ended December 31, 2019, in the Management’s Discussion and Analysis of Results of Operations and Financial Position section. The Magna International Inc. 2019 Annual Report has been posted on the company’s website through the investors link at www.magna.com.
2 The recognition of operating lease right-of-use assets during 2019 in accordance with the adoption of Accounting Standards Codification 842 – Leases negatively impacted 2019 Return on Invested Capital by 1.0%.
3 A two-for-one stock split was approved February 24, 2015. Dividends are shown on a post-stock split basis.
2018
SALESU.S. $ MILLIONS
DILUTED EPSU.S. $
CASH FLOW FROM OPERATING ACTIVITIESU.S. $ MILLIONS
RETURN ON EQUITY1 RETURN ON INVESTED CAPITAL1, 2 DIVIDENDS PAID PER SHARE3
U.S. $
2019 2018 2019 2018 2019
2018 2019 2018 2019 2015 2016 2017 2018 2019
40,827 39,431
14.9%
0.881.00
1.10
6.615.59
3,7183,960
10.1%
15.5%
19.7%
1.321.46

The automobile of today and tomorrow represents much more than just mobility. It’s a technology platform that promotes cutting-edge innovations, societal changes, personal freedoms and brings numerous new opportunities to our industry and to Magna.
As we enter a new decade, I am confident Magna is in a great position to help our customers drive change, deliver technologies consumers don’t even know they need yet, and secure tangible results for our stakeholders.
We are solving some of the most complex problems in this transformative era. Aligned with our customer, product and geographic strategy, our innovation approach focuses on three key trends:
• Driver Assistance: Creating solutions that improve safety and provide a more comfortable driving experience. Our technologies give drivers active guidance with a 360° view of their environment with the ability to detect various objects and predict their dynamic behavior around the vehicle and on its path.
• Electrification: Developing powertrain innovations that are both modular and scalable – serving as building blocks to provide competitive solutions to automakers facing electric/hybrid powertrain proliferation.
• Smart Mobility: Accommodating a variety of new mobility use cases like enhancing the occupant experience by making seats more flexible and reconfigurable.
We are also at the forefront of new technology opportunities such as paving the way for cost-effective, uniform and flexible light sources utilizing micro LEDs to enable high-volume applications in the mobility space.
However, our innovation strategy doesn’t just focus on products. We continue to work on expanding the use of advanced materials and enhancing manufacturing processes. We are committed to lightweighting the vehicle through the use of a variety of mixed materials to help improve fuel economy and reduce emissions. We are also launching advanced technologies in areas such as robotics, artificial intelligence and augmented reality to improve efficiency in our manufacturing facilities around the world.
Beyond our product design, development and manufacturing, it’s our employees who drive our business, including 13,000 Magna engineers who make up one-third of our salaried workforce. Their talent and skillsets enable us to envision future mobility and understand how it will continue to transform our world.
Backed by more than six decades of experience in the automotive industry, we have more product and systems knowledge, including complete-vehicle expertise, than any other supplier. It’s that capability, along with our culture and entrepreneurial-minded employees, that allows us to operate like a start-up and innovate as a technology company.
MESSAGE FROM THE PRESIDENT
Driving Transformational Change
Swamy Kotagiri President

Magna’s company of entrepreneurs and open-for-business mentality are driving change in nearly every part of a vehicle, from seating to lighting to powertrain.
It is fascinating to imagine what the future will bring with the growth of electrified and autonomous vehicles and smart mobility. To better envision the coming shift in the way we move people and goods, see some of our latest innovations below that are leading the way.
Powertrain Electrification
With a focus on vehicle electrification, Magna has developed an array of modular and scalable electrified powertrain products designed to help automakers meet increasingly stringent tailpipe emissions regulations around the world. These products include both 48-volt (mild hybrid) and high-voltage (full/plug-in hybrids and electric vehicles) variants.
Magna’s ever-expanding portfolio of electrified products begins with a family of high-voltage electric propulsion systems. For example, we are launching production of electric-vehicle axles in China for a European automaker.
Magna is also focused on electrified transmission systems and is now industrializing an innovative solution for BMW that packages a modular and scalable 48-volt traction motor inside an automatic dual-clutch transmission. This innovative new product allows automakers to offer a mild hybrid option for their front-wheel drive vehicles, while reducing CO2 emissions and increasing functionality.
Battery Frame Technology
With our expertise in body structures and exteriors, we developed an industry-first, multi-material battery tray that uses advanced composites and metals to meet the requirements for electric and hybrid vehicles. The battery tray is a key component of vehicle electrification which protects the batteries from physical damage within a sealed environment. The multi-material battery tray concept eliminates the need for complex machining and leak-proof welds.
REIMAGINING THE FUTURE

ADAS Features
More than 100 vehicle models on the road today have Magna ADAS (Advanced Driver Assistance Systems) features. As we continue to deliver new autonomous capabilities including our 3D Surround View Systems, Advanced Trailering and Autonomous Valet, we are meeting the growing demand from automakers and consumers seeking to integrate these technologies into their vehicles. Magna’s solid-state LiDAR solution will debut with BMW, and we are ready to bring to market our new high-definition ICON RADAR.
The military-grade ICON RADAR is a new generation of auto-qualified RADAR that improves ADAS features and moves a step closer towards an autonomous future.
Whether it’s cameras, LiDAR or RADAR, Magna’s materials and design expertise enables seamless integration of ADAS features in vehicle exteriors without sacrificing design.
Flexible Lighting
Magna is sparking a revolution in automotive lighting through a joint venture with Rohinni, an Idaho company developing ways to create “endless possibilities” with light that goes far beyond conventional LEDs.
When paired with Magna’s world-class electronics manufacturing and automotive styling expertise, the combination is expected to produce modern lighting magic.
By using thin-film micro and mini LEDs on flexible material as thin as a piece of paper, Magna Rohinni Automotive provides high-performance, flexible lighting that opens up new possibilities for design and brand distinction.
SMARTACCESSTM
Magna’s SMARTACCESS™ gives drivers and passengers a more intuitive way to enter and exit a vehicle, thanks to multiple HMI (Human Machine Interfaces) solutions and features which rely on motion and the sense of touch inside and outside the car. The cutting-edge technology bolsters and further differentiates Magna’s mechatronics product offerings, both today and in the future as the new mobility ecosystem continues to evolve.

December 31, 2019
MAGNA INTERNATIONAL INC.
Management’s Discussion andAnalysis of Results of Operationsand Financial Position
Unless otherwise noted, all amounts in this Management’s Discussion and Analysis of Results of Operations and
Financial Position [‘‘MD&A’’] are in U.S. dollars and all tabular amounts are in millions of U.S. dollars, except per share
figures, which are in U.S. dollars. When we use the terms ‘‘we’’, ‘‘us’’, ‘‘our’’ or ‘‘Magna’’, we are referring to Magna
International Inc. and its subsidiaries and jointly controlled entities, unless the context otherwise requires.
This MD&A should be read in conjunction with the audited consolidated financial statements and MD&A for the year
ended December 31, 2019 included in our 2019 Annual Report to Shareholders. The most recent updates to our
accounting policies, including the impact of the adoption of Accounting Standards Codification 842 – Leases, can be
found in Note 2 of our audited consolidated financial statements for the year ended December 31, 2019.
This MD&A may contain statements that are forward looking. Refer to the ‘‘Forward-Looking Statements’’ section in
this MD&A for a more detailed discussion of our use of forward-looking statements.
This MD&A has been prepared as at March 5, 2020.
MAGNA INTERNATIONAL INC. 1

USE OF NON-GAAP FINANCIAL MEASURES
A 40-day labour strike at General Motors [‘‘GM’’], which began late in September of 2019 and extended into late October, had a negative impact on
North American light vehicle production and consequently negatively impacted our sales and profitability for 2019.
Total sales decreased 3% to $39.4 billion in 2019, compared to $40.8 billion in 2018. Our sales in 2019 were negatively impacted by, among other
factors, the weakening of a number of currencies against the U.S. dollar, the divestiture of our Fluid Pressure & Controls [‘‘FP&C’’] business in the first
quarter of 2019 and the impact of the labour strike at GM. Excluding the impact of foreign currency translation and divestitures, net of acquisitions,
sales increased $636 million or 2%. This compares favourably to global light vehicle production, which declined 4%. This sales increase was
primarily a result of the launch of new programs, in particular in our Complete Vehicles segment.
Diluted earnings per share and adjusted diluted earnings per share were $5.59 and $6.05, respectively. Adjusted diluted earnings per share
decreased 10% from 2018, largely reflecting increased engineering and other costs in our advanced driver assistance systems [‘‘ADAS’’] business,
the labour strike at GM, lower equity income, higher net commodity costs, higher spending associated with electrification, autonomy and research &
development and higher net warranty costs. These were partially offset by lower incentive compensation, increased earnings in our Complete
Vehicles business and the impact of a lower share count.
Other expense, net in 2019 of $240 million consisted of:
· a $700 million non-cash impairment of assets in our three Getrag joint venture investments;
· restructuring charges of $31 million;
· asset impairment charges of $27 million in our Electronics operations; and
· net losses on investments of $6 million, including net unrealized gains of $17 million related to the revaluation of our private equity investments
and net losses of $23 million related to the revaluation and sale of our investment in Lyft, Inc. [‘‘Lyft’’].
Cash from operating activities was a record $4.0 billion, eclipsing our previous record from 2018 of $3.7 billion.
We continued to invest for our future, including:
· $1.4 billion for fixed assets;
· $394 million in investment and other asset spending; and
· $105 million to acquire VIZA GECA, S.L. [‘‘VIZA’’], a Spain-based supplier of seat structures and related systems.
We returned $1.7 billion to shareholders in 2019 through $1.3 billion in share repurchases and $449 million in dividends.
Our Board of Directors increased our quarterly dividend by 10% to $0.40 per share reflecting continued confidence in Magna’s future.
BMW awarded us the largest production order for transmission technologies in Magna’s history for dual-clutch transmissions, including hybrid
variants.
In addition to results presented in accordance with accounting principles generally accepted in the United States of America [‘‘U.S. GAAP’’], this report
includes the use of Adjusted EBIT, Adjusted EBIT as a percentage of sales, Adjusted diluted earnings per share, Return on Invested Capital, Adjusted
Return on Invested Capital and Return on Equity [collectively, the ‘‘Non-GAAP Measures’’]. We believe these non-GAAP financial measures provide
additional information that is useful to investors in understanding our underlying performance and trends through the same financial measures
employed by our management for this purpose. Readers should be aware that Non-GAAP Measures have no standardized meaning under U.S. GAAP
and accordingly may not be comparable to the calculation of similar measures by other companies. We believe that Return on Invested Capital and
Return on Equity are useful to both management and investors in their analysis of our results of operations and reflect our ability to generate returns.
Similarly, we believe that Adjusted EBIT, Adjusted EBIT as a percentage of sales, Adjusted diluted earnings per share and Adjusted Return on Invested
Capital provide useful information to our investors for measuring our operational performance as they exclude certain items that are not reflective of
ongoing operating profit or loss and facilitate a comparison with prior periods. The presentation of any Non-GAAP Measures should not be considered
in isolation or as a substitute for our related financial results prepared in accordance with U.S. GAAP. Non-GAAP financial measures are presented
together with the most directly comparable U.S. GAAP financial measure, and a reconciliation to the most directly comparable U.S. GAAP financial
measure, can be found in the ‘‘Non-GAAP Financial Measures Reconciliation’’ section of this MD&A.
HIGHLIGHTS
•
•
•
•
These were partially offset by a $524 million gain on the sale of our FP&C business.
•
•
•
•
•
FORWARD-LOOKING STATEMENTS
Certain statements in this MD&A constitute ‘‘forward-looking information’’ or ‘‘forward-looking statements’’ (collectively, ‘‘forward-looking statements’’)
and are intended to provide information about management’s current expectations and plans. Such forward-looking statements may not be
appropriate for other purposes. Forward-looking statements may include financial and other projections, as well as statements regarding our future
plans, objectives or economic performance, or the assumptions underlying any of the foregoing, and other statements that are not recitations of
historical fact. We use words such as ‘‘may’’, ‘‘would’’, ‘‘could’’, ‘‘should’’, ‘‘will’’, ‘‘likely’’, ‘‘expect’’, ‘‘anticipate’’, ‘‘believe’’, ‘‘intend’’, ‘‘plan’’, ‘‘aim’’,
‘‘forecast’’, ‘‘outlook’’, ‘‘project’’, ‘‘estimate’’, ‘‘target’’ and similar expressions suggesting future outcomes or events to identify forward-looking
statements. Our forward-looking statements are based on information currently available to us, and are based on assumptions and analyses made by
us in light of our experience and our perception of historical trends, current conditions and expected future developments, as well as other factors we
believe are appropriate in the circumstances. Forward-looking statements in this MD&A include, but are not limited to discussions related to the
implementation of our business strategy.
2 ANNUAL REPORT 2019

OUR BUSINESS(1)
challenges in commercializing certain ADAS programs due to the inherent technical complexity and rigorous OEM timelines for development, testingand validation, as reflected in higher than expected development, testing and validation costs in our Magna Electronics business;deteriorating production volumes in some of our primary markets;
shifting OEM and consumer preferences for certain types of transmissions, together with OEM pricing pressures, transmission insourcing by certainChinese OEMs and other factors which collectively impacted the performance of our equity-accounted transmission joint ventures in that market;lost production related to a 40-day labour strike at GM facilities in the U.S.;
elevated OEM product warranty expectations and product recall levels, as reflected in the net increase in our warranty costs; andtrade and tariff disputes.
impact of the recent COVID-19 (Coronavirus) epidemic, including potential impact on global or regional economic growth, consumer confidence,
supply chains, workforce, or otherwise;continuation of elevated product warranty expectations and product recall levels, together with a deteriorating market for product recall insurance;accelerating production of hybrid and electric vehicles, driven primarily by regulatory requirements rather than market demand, resulting in
uncertainty regarding consumer acceptance of such vehicles;production overcapacity in the Chinese market;continuing macroeconomic challenges in China; and
potential consolidation of OEMs or further expansion of cooperative alliances among OEMs or between OEMs and ‘‘mobility-as-a-service’’ [‘‘MaaS’’]providers.
While we believe we have a reasonable basis for making such forward-looking statements, they are not a guarantee of future performance or outcomes.
Whether actual results and developments conform to our expectations and predictions is subject to a number of risks, assumptions and uncertainties,many of which are beyond our control, and the effects of which can be difficult to predict, including the risk factors which are described later in
this MD&A.
OVERVIEW
We are a mobility technology company. We have more than 165,000 entrepreneurial-minded employees and 346 manufacturing operations and94 product development, engineering and sales centres in 27 countries. We have complete vehicle engineering and contract manufacturing expertise,as well as product capabilities which include body, chassis, exterior, seating, powertrain, active driver assistance, electronics, mechatronics, mirrors,
lighting and roof systems. Magna also has electronic and software capabilities across many of these areas. Our common shares trade on the TorontoStock Exchange (MG) and the New York Stock Exchange (MGA).
INDUSTRY TRENDS
Our operating results are primarily dependent on the levels of North American, European and Chinese car and light truck production by our customers.While we supply systems and components to every major original equipment manufacturer [‘‘OEM’’], we do not supply systems and components for
every vehicle, nor is the value of our content consistent from one vehicle to the next. As a result, customer and program mix relative to market trends, aswell as the value of our content on specific vehicle production programs, are also important drivers of our results.
OEM production volumes are generally aligned with vehicle sales levels. Overall vehicle sales levels are significantly affected by changes in consumerconfidence levels, which may in turn be impacted by consumer perceptions and general trends related to the job, housing and stock markets, as well asother macroeconomic factors. Additional factors impacting vehicle sales levels, and thus production volumes in North America, Europe and China,
include: interest rates and/or availability of credit; fuel and energy prices; relative currency values; regulatory restrictions on use of vehicles in certainmegacities; and other factors. Production volumes in different regions may be impacted by a range of factors which vary from one region to the next,including: general economic and political conditions; labour disruptions; free trade arrangements; tariffs; relative currency values; commodities prices;
supply chains and infrastructure; availability and relative cost of skilled labour; regulatory considerations, including those related to environmentalemissions and safety standards; and other factors.
While the foregoing economic, political and other factors are part of the general context in which the global automotive industry operates, there were anumber of significant industry trends that impacted us during 2019, including:
•
•
•
•
••
Looking ahead, a number of industry trends are expected to create near-term opportunities and risks for automotive suppliers, including:
•
••
••
•
We continue to implement a business strategy which is rooted in our best assessment as to the rate and direction of change in the automotive industry,including with respect to trends related to vehicle electrification and autonomy, as well as MaaS. For example, to support our customers’ needs forsolutions which improve the carbon footprint of their vehicles, we are focused on delivering lightweight products and materials, efficient transmissions
and active aerodynamics, as well as hybrid/electric drive systems. Additionally, we are building on our market leadership in camera-based ADAS, toprovide driving solutions incorporating cameras, radar, LiDAR (for advanced applications) and domain controllers, which can be scaled to offer greaterlevels of automated driving functionality. We are also working with traditional OEMs and MaaS market entrants on potential new mobility solutions
which leverage our complete vehicle know-how, potentially including our complete vehicle assembly expertise.
Our short- and medium-term operational success, as well as our ability to create long-term value through our business strategy, are subject to anumber of risks and uncertainties which are discussed later in this MD&A.
(1) Manufacturing operations, product development, engineering and sales centres and employee figures include certain operations accounted for under the equity method.
MAGNA INTERNATIONAL INC. 3

6MAR202008165916
AVERAGE FOREIGN EXCHANGE
SALES
lower global light vehicle production, including the impact of the labour strike at GM during 2019;
the impact of lower assembly volumes on the BMW 5-Series;
the end of production of certain programs; and
net customer price concessions subsequent to 2018.
RESULTS OF OPERATIONS
2019 2018 Change
1 Canadian dollar equals U.S. dollars 0.754 0.771 – 2%
1 euro equals U.S. dollars 1.119 1.181 – 5%
1 Chinese renminbi equals U.S. dollars 0.145 0.151 – 4%
The preceding table reflects the average foreign exchange rates between the most common currencies in which we conduct business and our
U.S. dollar reporting currency. The changes in these foreign exchange rates for the year ended December 31, 2019 impacted the reported U.S. dollar
amounts of our sales, expenses and income.
The results of operations for which the functional currency is not the U.S. dollar are translated into U.S. dollars using the average exchange rates for the
relevant period. Throughout this MD&A, reference is made to the impact of translation of foreign operations on reported U.S. dollar amounts
where relevant.
LIGHT VEHICLE PRODUCTION VOLUMES
Our operating results are mostly dependent on light vehicle production in the regions reflected in the table below:
Light Vehicle Production Volumes (thousands of units)
2019 2018 Change
North America 16,353 17,041 – 4%
Europe 21,411 22,141 – 3%
China 24,758 26,333 – 6%
RESULTS OF OPERATIONSFOR THE YEAR ENDED DECEMER 31, 2019
Sales
2018
$40,827
2019
$39,431
$30,000
$42,000
- 3%
Sales decreased 3% or $1.40 billion to $39.43 billion for 2019 compared to $40.83 billion for 2018. The weakening of foreign currencies against the
U.S. dollar, including the euro, Canadian dollar, Chinese renminbi and Turkish lira decreased sales by $1.28 billion. In addition, divestitures, net of
acquisitions, during or subsequent to 2018 decreased sales by $749 million.
Excluding the impact of foreign currency translation and divestitures, net of acquisitions, sales increased $637 million due to the launch of programs, in
particular in our Complete Vehicles segment, during or subsequent to 2018. This was partially offset by:
•
•
•
•
The changes in sales are discussed further in the ‘‘Segment Analysis’’ section of this MD&A.
4 ANNUAL REPORT 2019

COST OF GOODS SOLD
higher material, direct labour and overhead costs, primarily due to higher sales in our Complete Vehicles segment, which has a higher average
material content compared to sales than our consolidated average;
higher engineering costs in our ADAS business in our Power & Vision segment, substantially associated with three programs that will be utilizing new
technologies;
higher net commodity costs;
higher spending associated with electrification, autonomy and research & development; and
higher net warranty costs of $45 million.
lower material, direct labour and overhead costs associated with the lower vehicle production due to the labour strike at GM during 2019;
higher favourable commercial items;
lower launch costs; and
ongoing productivity initiatives.
DEPRECIATION AND AMORTIZATION
increased capital deployed at existing facilities to support the launch of programs during or subsequent to 2018; and
higher amortization in our ADAS business as a result of amortizing 100% of capital spending associated with two programs that will be utilizing new
technologies.
a $41 million net decrease in reported U.S. dollar depreciation and amortization mainly due to the weakening of the euro, Chinese renminbi and
Canadian dollar, each against the U.S. dollar; and
divestitures, net of acquisitions, during or subsequent to 2018 which decreased depreciation and amortization by $29 million.
SELLING, GENERAL AND ADMINISTRATIVE [‘‘SG&A’’]
a general increase in SG&A costs to support the growth in sales, excluding divestitures, net of acquisitions;
higher labour and benefit costs;
a favourable settlement reported during 2018 relating to the acquisition of Getrag;
lower foreign exchange gains in 2019 compared to 2018; and
a $16 million write-down during 2019 of fixed assets in our Electronics business associated with certain ADAS programs that are utilizing new
technologies.
a $55 million net decrease in the reported U.S. dollar SG&A expense primarily due to the weakening of the euro, Chinese renminbi and Canadian
dollar, each against the U.S. dollar;
lower incentive compensation;
divestitures, net of acquisitions, during or subsequent to 2018 which decreased SG&A by $20 million; and
higher net gains on the sale of assets in 2019 compared to 2018.
2019 2018 Change
Material $ 24,585 $ 25,355 $ (770)
Direct labour 2,815 2,953 (138)
Overhead 6,622 6,747 (125)
Cost of goods sold $ 34,022 $ 35,055 $ (1,033)
Cost of goods sold decreased $1.03 billion to $34.02 billion for 2019 compared to $35.06 billion for 2018. The weakening of foreign currencies against
the U.S. dollar, including the euro, Canadian dollar, Chinese renminbi and Turkish lira decreased cost of goods sold by $1.13 billion. In addition,
divestitures, net of acquisitions, during or subsequent to 2018 decreased cost of goods sold by $666 million.
Excluding the impact of foreign currency translation and divestitures, net of acquisitions, cost of goods sold increased by $766 million primarily as a
result of:
•
•
•
•
•
These factors were partially offset by:
•
•
•
•
Depreciation and amortization costs increased $67 million to $1.35 billion for 2019 compared to $1.28 billion for 2018. The higher depreciation and
amortization was primarily a result of:
•
•
These factors were partially offset by:
•
•
SG&A expense as a percentage of sales was 4.3% for 2019 compared to 4.1% for 2018. SG&A expense increased $33 million to $1,697 million for 2019
compared to $1,664 million for 2018, primarily as a result of:
•
•
•
•
•
These factors were partially offset by:
•
•
•
•
MAGNA INTERNATIONAL INC. 5

INTEREST EXPENSE, NET
EQUITY INCOME
OTHER EXPENSE, NET
(1) Impairment of assets
(2) Restructuring
During 2019, we recorded net interest expense of $82 million compared to $93 million for 2018. The $11 million decrease is primarily as a result of a
decline in borrowings, higher interest income earned on favourable tax settlements during 2019 compared to 2018 and higher cash balances.
Equity income decreased $99 million to $178 million for 2019 compared to $277 million for 2018, primarily due to lower sales, net favourable
commercial items during 2018, a favourable change in reserves for uncertain tax positions during 2018, and a write-down of assets during 2019 at a
certain facility. These factors were partially offset by improved operational performance at a certain facility, lower depreciation and amortization related
to fair value increments as a result of the impairment of investments during 2019, lower net warranty costs, and a write-down of inventory and
receivables relating to one customer during 2018 at a certain facility.
During the years ended December 31, 2019 and 2018, we recorded Other expense, net items as follows:
2019 2018
Net Income Diluted Net Income Diluted
Operating Attributable Earnings Operating Attributable Earnings
Income to Magna per Share Income to Magna per Share
Impairment of assets(1) $ 727 $ 557 $ 1.76 $ 74 $ 71 $ 0.21
Restructuring(2) 31 31 0.10 45 43 0.12
Net losses (gains) on investments(3) 6 5 0.02 (56) (53) (0.15)
Gain on sale of business(4) (524) (447) (1.42) – – –
Other expense, net $ 240 $ 146 $ 0.46 $ 63 $ 61 $ 0.18
During 2019, we recorded impairment charges of $700 million on our investments in Getrag (Jiangxi) Transmission Co., Ltd. and Dongfeng Getrag
Transmission Co. Ltd. in China, and on our investment in Getrag Ford Transmission GmbH [‘‘GFT’’] in Europe. The impairment reflected lower than
expected sales, increased pricing pressure in the Chinese market, declines in volume projections for the foreseeable future for manual
transmissions and DCTs in China and manual transmissions in Europe, and in-sourcing of transmissions by certain Chinese OEMs. The impairment
was recorded within our Power & Vision segment as follows:
Other Expense $ 700
Tax effect on Other Expense (36)
Net loss 664
Loss attributable to non-controlling interests related to Other Expense (127)
Net loss attributable to Magna International Inc. $ 537
We also recorded asset impairment charges during 2019 of $27 million [$20 million after tax] in our Electronics operations which are included in our
Power & Vision segment.
During 2018, we recorded an impairment charge of $60 million [$59 million after tax] on our investment in GFT. The impairment reflected the
expected further industry volume decline in manual transmissions, which make up substantially all of the volume production in the joint venture.
We also recorded fixed asset impairment charges during 2018 of $14 million [$12 million after tax] related to a certain Body Exteriors & Structures
facility.
During 2019, we recorded restructuring charges of $31 million [$31 million after tax] related to certain European Body Exteriors & Structures
operations.
During 2018, we recorded restructuring charges of $25 million [$23 million after tax] related to certain European Body Exteriors & Structures
facilities and $20 million [$20 million after tax] related to certain European Power & Vision facilities.
6 ANNUAL REPORT 2019

(3) Net losses (gains) on investments
(4) Gain on sale of business
INCOME FROM OPERATIONS BEFORE INCOME TAXES
INCOME TAXES
2019 2018
Income Taxes as reported $ 591 26.6% $ 619 21.0%
Tax effect on Other expense, net (33) (3.9) 2 (0.4)
Other Tax Items – – 27 0.9
$ 558 22.7% $ 648 21.5%
During 2018, we had the following ‘‘Other Tax Items’’:
we reassessed our positions in deferred taxes in anticipation of the selling of our global FP&C business in 2019, recognizing a $21 million net
reduction in deferred tax expense;
we released a portion of our valuation allowance against our deferred tax assets in India, which generated a reduction in income tax expense of
$17 million; and
we completed our analysis of the impact of the Tax Cuts and Jobs Act enacted in the United States during 2017 and recorded a net increase in
income tax expense of $11 million.
higher accrued tax on undistributed foreign earnings;
a change in mix of earnings resulting in proportionally lower income earned in jurisdictions with lower income tax rates;
a net increase in reserves for uncertain tax positions; and
a decrease in equity income.
In 2019, we recorded net losses of $6 million [$5 million after tax]. This includes net unrealized gains of $17 million [$15 million after tax] related to
the revaluation of private equity investments and net losses of $23 million [$20 million after tax] related to the revaluation and sale of our investment
in Lyft.
In 2018, we recorded an unrealized gain of $56 million [$53 million after tax] on the revaluation of private equity investments, of which $46 million
[$46 million after tax] related to our investment in Lyft.
During 2019, we recorded a gain of $524 million [$447 million after tax] on the sale of our global FP&C business which was previously reported
within our Power & Vision segment.
Income from operations before income taxes was $2.22 billion for 2019 compared to $2.95 billion for 2018. This $728 million decrease is a result of the
following changes, each as discussed above:
2019 2018 Change
Sales $ 39,431 $ 40,827 $ (1,396)
Costs and expenses
Cost of goods sold 34,022 35,055 (1,033)
Depreciation and amortization 1,345 1,278 67
Selling, general & administrative 1,697 1,664 33
Interest expense, net 82 93 (11)
Equity income (178) (277) 99
Other expense, net 240 63 177
Income from operations before income taxes $ 2,223 $ 2,951 $ (728)
•
•
•
Excluding the Tax effect on Other expense, net and Other Tax Items, our effective income tax rate increased to 22.7% for 2019 compared to 21.5% for
2018, primarily as a result of:
•
•
•
•
These factors were partially offset by an increase in research and development credits and a reduction in non-deductible expenses.
MAGNA INTERNATIONAL INC. 7

6MAR202008165399 6MAR202008165011
LOSS (INCOME) ATTRIBUTABLE TO NON-CONTROLLING INTERESTS
NET INCOME ATTRIBUTABLE TO MAGNA INTERNATIONAL INC.
EARNINGS PER SHARE
Loss attributable to non-controlling interests was $133 million for 2019 compared to income attributable to non-controlling interests of $36 million for
2018. Excluding the $127 million loss attributable to non-controlling interests relating to the impairment of assets recorded in 2019, the remaining
$42 million change was primarily due to decreased profits at certain Power & Vision operations in China partially offset by increased profits at certain
Body Exteriors & Structures operations in China.
Net income attributable to Magna International Inc. decreased $531 million to $1.8 billion for 2019 compared to $2.3 billion for 2018, as a result of: a
decrease in income from operations before income taxes of $728 million; partially offset by a loss attributable to non-controlling interests of $133 million
in 2019 compared to income attributable to non-controlling interests of $36 million in 2018; and a decrease in income taxes of $28 million.
Diluted earnings per share Adjusted diluted earnings per share
2018
$6.61
2019
$5.59
$4.00
$7.00 - 15%
2018
$6.71
2019
$6.05
$4.00
$7.00 - 10%
2019 2018 Change
Earnings per Common Share
Basic $ 5.61 $ 6.65 – 16%
Diluted $ 5.59 $ 6.61 – 15%
Weighted average number of Common Shares outstanding (millions)
Basic 314.7 345.4 – 9%
Diluted 315.8 347.5 – 9%
Adjusted diluted earnings per share $ 6.05 $ 6.71 – 10%
Diluted earnings per share decreased $1.02 to $5.59 for 2019 compared to $6.61 for 2018 as a result of the decrease in net income attributable to
Magna International Inc., as discussed above, partially offset by a decrease in the weighted average number of diluted shares outstanding during 2019.
The decrease in the weighted average number of diluted shares outstanding was primarily due to the purchase and cancellation of Common Shares,
during or subsequent to 2018, pursuant to our normal course issuer bids.
Other expense, net, after tax and loss attributable to non-controlling interests related to the impairment of assets negatively impacted diluted earnings
per share by $0.46 in 2019, while Other expense, net, after tax, and Other Tax Items negatively impacted diluted earnings per share by $0.10 in 2018.
These amounts are discussed in the ‘‘Other expense, net’’, ‘‘Loss (income) attributable to non-controlling interests’’ and ‘‘Income Taxes’’ sections.
Adjusted diluted earnings per share, as reconciled in the ‘‘Non-GAAP Financial Measures Reconciliation’’ section, decreased $0.66 to $6.05 for 2019
compared to $6.71 for 2018.
8 ANNUAL REPORT 2019
19MAR202019190650
ADJUSTED EBIT AS A PERCENTAGE OF SALES
higher engineering costs in our ADAS business in our Power & Vision segment, substantially associated with three programs that will be utilizing new
technologies;
the labour strike at GM during 2019;
lower equity income;
lower scrap steel and aluminum recoveries and higher commodity costs;
higher spending associated with electrification, autonomy and research & development;
higher net warranty costs; and
higher pre-operating costs incurred at new facilities.
lower incentive compensation and employee profit sharing;
higher favourable commercial items; and
lower launch costs.
NON-GAAP PERFORMANCE MEASURESFOR THE YEAR ENDED DECEMBER 31, 2019
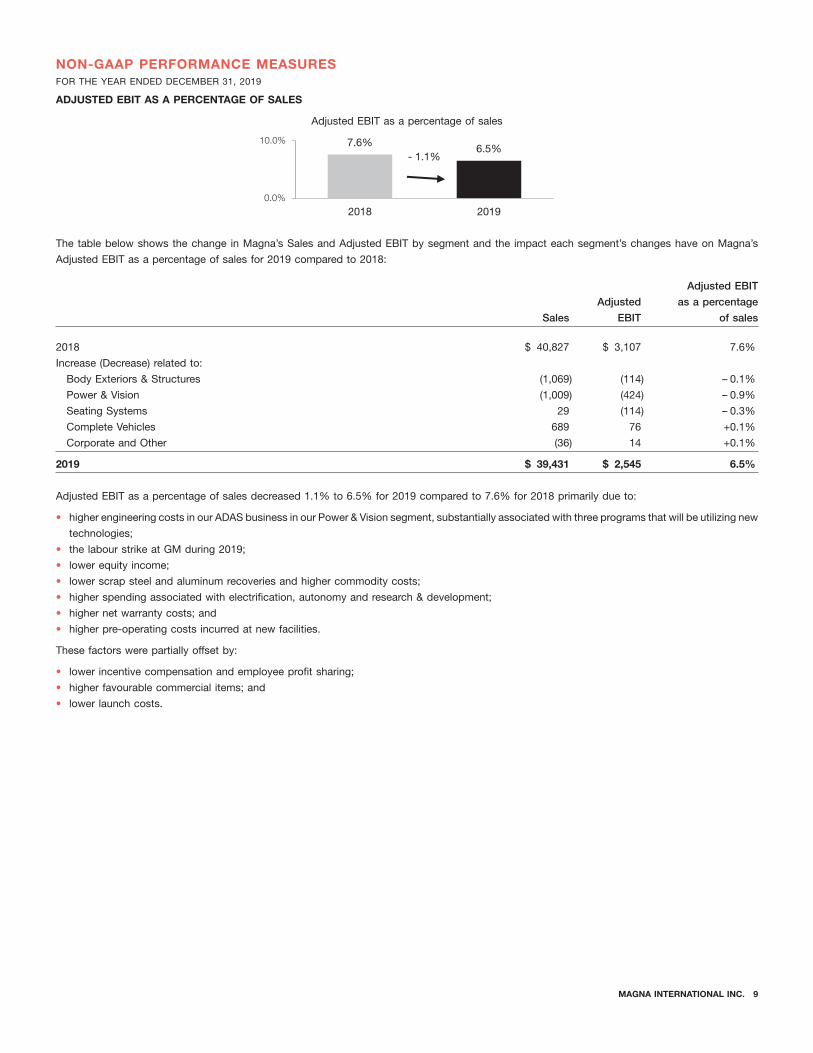
Adjusted EBIT as a percentage of sales
2018
7.6%
2019
6.5%
0.0%
10.0%
- 1.1%
The table below shows the change in Magna’s Sales and Adjusted EBIT by segment and the impact each segment’s changes have on Magna’s
Adjusted EBIT as a percentage of sales for 2019 compared to 2018:
Adjusted EBIT
Adjusted as a percentage
Sales EBIT of sales
2018 $ 40,827 $ 3,107 7.6%
Increase (Decrease) related to:
Body Exteriors & Structures (1,069) (114) – 0.1%
Power & Vision (1,009) (424) – 0.9%
Seating Systems 29 (114) – 0.3%
Complete Vehicles 689 76 +0.1%
Corporate and Other (36) 14 +0.1%
2019 $ 39,431 $ 2,545 6.5%
Adjusted EBIT as a percentage of sales decreased 1.1% to 6.5% for 2019 compared to 7.6% for 2018 primarily due to:
•
•
•
•
•
•
•
These factors were partially offset by:
•
•
•
MAGNA INTERNATIONAL INC. 9

19MAR202019190521 19MAR202019190259
19MAR202019190909
RETURN ON INVESTED CAPITAL
the recognition of operating lease right-of-use assets during 2019 in accordance with the adoption of the accounting standard Accounting
Standards Codification 842 – Leases; and
an increase in our investment in fixed assets to refurbish or replace assets consumed in the normal course of business and for manufacturing
equipment for programs that will be launching subsequent to 2019.
the net weakening of foreign currencies against the U.S. dollar;
the sale of our FP&C business during 2019, including the associated assets and liabilities formerly classified as held for sale; and
the impairment of assets recorded in 2019, as described in the Other expense, net section.
RETURN ON EQUITY
Return on Invested Capital Adjusted Return on Invested Capital
2018
14.9%
2019
10.1%
0.0%
20.0% - 4.8%
2018
15.2%
2019
11.8%
0.0%
20.0% - 3.4%
Return on Invested Capital was 10.1% for 2019 compared to 14.9% for 2018. The 4.8% decrease includes a 1.4% negative impact due to the change
in Other expense, net, after tax and Other Tax Items. Adjusted Return on Invested Capital decreased 3.4% to 11.8% for 2019 compared to 15.2% for
2018 as a result of a decrease in Adjusted After-tax operating profits and higher Average Invested Capital. The recognition of operating lease
right-of-use assets during 2019 in accordance with the adoption of the accounting standard Accounting Standards Codification 842 – Leases
negatively impacted Adjusted Return on Invested Capital by 1.0%.
Average Invested Capital increased $637 million to $16.73 billion for 2019 compared to $16.10 billion for 2018, primarily due to:
•
•
These factors were partially offset by:
•
•
•
Return on Equity
2018
19.7%
2019
15.5%
0.0%
25.0%
- 4.2%
Return on Equity was 15.5% for 2019 compared to 19.7% for 2018. This 4.2% decrease was due to lower net income attributable to Magna, partially
offset by lower average shareholders’ equity. The change in Other expense, net, after tax, and Other Tax Items negatively impacted Return on Equity
by 0.7%.
10 ANNUAL REPORT 2019

19MAR202019190390
BODY EXTERIORS & STRUCTURES
SEGMENT ANALYSIS
We are a global automotive supplier that has complete vehicle engineering and contract manufacturing expertise, as well as product capabilities which
include body, chassis, exterior, seating, powertrain, active driver assistance, electronics, mechatronics, mirrors, lighting and roof systems. Magna also
has electronic and software capabilities across many of these areas.
Our business is managed under operating segments which have been determined on the basis of technological opportunities, product similarities, as
well as market and operating factors. Our internal financial reporting is aligned with the way our business is managed. Accordingly, we report key
internal operating performance measures for Body Exteriors & Structures, Power & Vision, Seating Systems, and Complete Vehicles for presentation to
our chief operating decision maker to use in the assessment of operating performance, allocation of resources, and to help plan our long-term strategic
direction and future global growth.
Our chief operating decision maker uses Adjusted EBIT as the measure of segment profit or loss, since we believe Adjusted EBIT is the most
appropriate measure of operational profitability or loss for our reportable segments. Adjusted EBIT has been reconciled in the ‘‘Non-GAAP Financial
Measures Reconciliation’’ section included in this MD&A.
Sales Adjusted EBIT
2019 2018 Change 2019 2018 Change
Body Exteriors & Structures $ 16,458 $ 17,527 $ (1,069) $ 1,299 $ 1,413 $ (114)
Power & Vision 11,312 12,321 (1,009) 747 1,171 (424)
Seating Systems 5,577 5,548 29 312 426 (114)
Complete Vehicles 6,707 6,018 689 144 68 76
Corporate and Other (623) (587) (36) 43 29 14
Total reportable segments $ 39,431 $ 40,827 $ (1,396) $ 2,545 $ 3,107 $ (562)
2019 2018 Change
Sales $ 16,458 $ 17,527 $ (1,069) – 6%
Adjusted EBIT $ 1,299 $ 1,413 $ (114) – 8%
Adjusted EBIT as a percentage of sales 7.9% 8.1% – 0.2%
Sales
2018
$17,527
2019
$16,458
$10,000
$20,000
- 6%
Sales – Body Exteriors & Structures
Sales for Body Exteriors & Structures decreased 6% or $1.07 billion to $16.46 billion for 2019 compared to $17.53 billion for 2018, primarily as a
result of:
• lower global light vehicle production, including the impact of the labour strike at GM during 2019;
• a $392 million decrease in reported U.S. dollar sales primarily as a result of the weakening of the euro, Canadian dollar, Chinese renminbi, British
pound and Brazilian real, each against the U.S. dollar;
• the end of production of certain programs, including the Chevrolet Cruze; and
• net customer price concessions subsequent to 2018.
These factors were partially offset by the launch of programs during or subsequent to 2018, including the:
• Ford Ranger;
• GMC Sierra and Chevrolet Silverado;
• Jeep Gladiator;
• Chevrolet Blazer and Cadillac XT6; and
• BMW X3.
MAGNA INTERNATIONAL INC. 11

6MAR202008165139 19MAR202019190780
Adjusted EBIT as a percentage of sales – Body Exteriors & Structures
POWER & VISION
Adjusted EBIT Adjusted EBIT as a percentage of sales
2018
$1,413
2019
$1,299
$1,000
$1,500 - 8%
2018
8.1%
2019
7.9%
5.0%
10.0% - 0.2%
Adjusted EBIT – Body Exteriors & Structures
Adjusted EBIT for Body Exteriors & Structures decreased $114 million to $1.30 billion for 2019 compared to $1.41 billion for 2018, primarily as a
result of:
• reduced earnings due to lower sales, primarily due to the labour strike at GM during 2019;
• lower scrap steel and aluminum recoveries and higher commodity costs;
• favourable customer pricing resolutions in 2018;
• higher net warranty costs of $26 million;
• a $22 million decrease in reported U.S. dollar Adjusted EBIT as a result of the weakening of certain foreign currencies against the U.S. dollar
including the euro, Canadian dollar and Chinese renminbi; and
• net customer price concessions subsequent to 2018.
These factors were partially offset by:
• lower launch costs;
• lower employee profit sharing;
• productivity and efficiency improvements, including at certain previously underperforming facilities;
• a fire at a Tier 1 supplier in North America during 2018 which disrupted vehicle production; and
• inefficiencies during 2018 at plants that have been closed subsequent to 2018.
Adjusted EBIT as a percentage of sales for Body Exteriors & Structures decreased 0.2% to 7.9% for 2019 compared to 8.1% for 2018, primarily as a
result of:
• the labour strike at GM during 2019;
• lower scrap steel and aluminum recoveries and higher commodity costs;
• favourable customer pricing resolutions in 2018; and
• higher net warranty costs.
These factors were partially offset by:
• lower launch costs;
• productivity and efficiency improvements, including at certain previously underperforming facilities;
• lower employee profit sharing; and
• inefficiencies during 2018 at plants that have been closed subsequent to 2018.
2019 2018 Change
Sales $ 11,312 $ 12,321 $ (1,009) – 8%
Adjusted EBIT $ 747 $ 1,171 $ (424) – 36%
Adjusted EBIT as a percentage of sales 6.6% 9.5% – 2.9%
12 ANNUAL REPORT 2019
19MAR202019191296
6MAR202008165657 6MAR202008165787
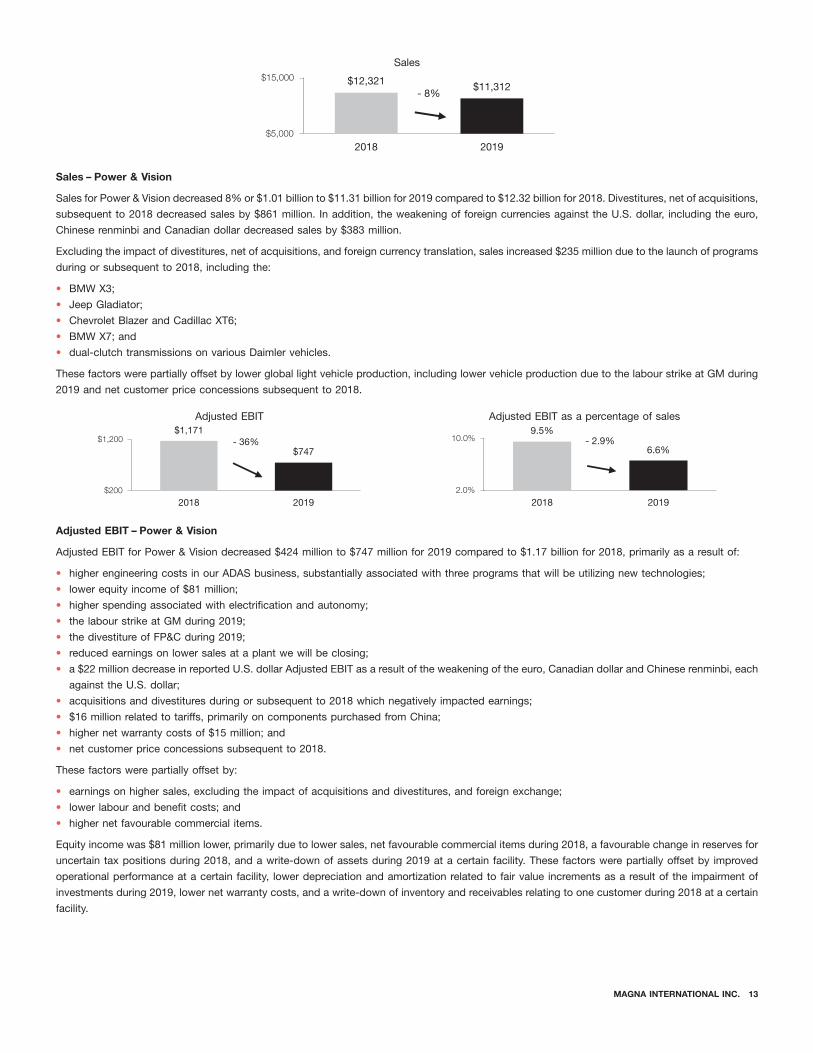
Sales
2018
$12,321
2019
$11,312
$5,000
$15,000
- 8%
Sales – Power & Vision
Sales for Power & Vision decreased 8% or $1.01 billion to $11.31 billion for 2019 compared to $12.32 billion for 2018. Divestitures, net of acquisitions,
subsequent to 2018 decreased sales by $861 million. In addition, the weakening of foreign currencies against the U.S. dollar, including the euro,
Chinese renminbi and Canadian dollar decreased sales by $383 million.
Excluding the impact of divestitures, net of acquisitions, and foreign currency translation, sales increased $235 million due to the launch of programs
during or subsequent to 2018, including the:
• BMW X3;
• Jeep Gladiator;
• Chevrolet Blazer and Cadillac XT6;
• BMW X7; and
• dual-clutch transmissions on various Daimler vehicles.
These factors were partially offset by lower global light vehicle production, including lower vehicle production due to the labour strike at GM during
2019 and net customer price concessions subsequent to 2018.
Adjusted EBIT Adjusted EBIT as a percentage of sales
2018
$1,171
2019
$747
$200
$1,200 - 36%
2018
9.5%
2019
6.6%
2.0%
10.0% - 2.9%
Adjusted EBIT – Power & Vision
Adjusted EBIT for Power & Vision decreased $424 million to $747 million for 2019 compared to $1.17 billion for 2018, primarily as a result of:
• higher engineering costs in our ADAS business, substantially associated with three programs that will be utilizing new technologies;
• lower equity income of $81 million;
• higher spending associated with electrification and autonomy;
• the labour strike at GM during 2019;
• the divestiture of FP&C during 2019;
• reduced earnings on lower sales at a plant we will be closing;
• a $22 million decrease in reported U.S. dollar Adjusted EBIT as a result of the weakening of the euro, Canadian dollar and Chinese renminbi, each
against the U.S. dollar;
• acquisitions and divestitures during or subsequent to 2018 which negatively impacted earnings;
• $16 million related to tariffs, primarily on components purchased from China;
• higher net warranty costs of $15 million; and
• net customer price concessions subsequent to 2018.
These factors were partially offset by:
• earnings on higher sales, excluding the impact of acquisitions and divestitures, and foreign exchange;
• lower labour and benefit costs; and
• higher net favourable commercial items.
Equity income was $81 million lower, primarily due to lower sales, net favourable commercial items during 2018, a favourable change in reserves for
uncertain tax positions during 2018, and a write-down of assets during 2019 at a certain facility. These factors were partially offset by improved
operational performance at a certain facility, lower depreciation and amortization related to fair value increments as a result of the impairment of
investments during 2019, lower net warranty costs, and a write-down of inventory and receivables relating to one customer during 2018 at a certain
facility.
MAGNA INTERNATIONAL INC. 13

6MAR202003354093
19MAR202019191425 19MAR202019191554
SEATING SYSTEMS
·
·
·
Adjusted EBIT as a percentage of sales – Power & Vision
Adjusted EBIT as a percentage of sales for Power & Vision decreased 2.9% to 6.6% for 2019 compared to 9.5% for 2018, primarily as a result of:
• higher engineering costs in our ADAS business, substantially associated with three programs that will be utilizing new technologies;
• lower equity income;
• higher spending associated with electrification and autonomy;
• acquisitions and divestitures during or subsequent to 2018; and
• the labour strike at GM during 2019.
These factors were partially offset by the divestiture of FP&C during 2019.
2019 2018 Change
Sales $ 5,577 $ 5,548 $ 29 +1%
Adjusted EBIT $ 312 $ 426 $ (114) – 27%
Adjusted EBIT as a percentage of sales 5.6% 7.7% – 2.1%
Sales
2018
$5,548
2019
$5,577
$2,000
$6,000 + 1%
Sales – Seating Systems
Sales for Seating Systems increased 1% or $29 million to $5.58 billion for 2019 compared to $5.55 billion for 2018, primarily as a result of:
• the launch of programs at new facilities during or subsequent to 2018, including the:
BMW X5;
BMW X7; and
BMW 1-series; and
• an acquisition subsequent to 2018 which increased sales by $108 million.
These factors were partially offset by:
• the end of production of certain programs, including the Chevrolet Cruze;
• a $149 million decrease in reported U.S. dollar sales, primarily as a result of the weakening of the euro, Turkish lira, Canadian dollar, Brazilian real and
Chinese renminbi, each against the U.S. dollar;
• lower global light vehicle production, including the impact of the labour strike at GM during 2019; and
• net customer price concessions subsequent to 2018.
Adjusted EBIT as a percentage of salesAdjusted EBIT
2018
$426
2019
$312
$200
$500- 27%
2018
7.7%
2019
5.6%
0.0%
10.0%- 2.1%
Adjusted EBIT – Seating Systems
Adjusted EBIT for Seating Systems decreased $114 million to $312 million for 2019 compared to $426 million for 2018, primarily as a result of:
• reduced earnings due to lower sales at a number of established facilities;
• higher commodity costs;
• lower foreign exchange gains in 2019 compared to 2018;
• the labour strike at GM during 2019;
• launch costs and operational inefficiencies at a new facility;
14 ANNUAL REPORT 2019

19MAR202019191939 19MAR202019192067
COMPLETE VEHICLES
• higher launch costs;
• a $8 million decrease in reported U.S. dollar Adjusted EBIT, primarily due to the weakening of the Canadian dollar and Turkish lira, each against the
U.S. dollar; and
• net customer price concessions subsequent to 2018.
These factors were partially offset by higher favourable commercial items, income from an acquisition during 2019 and a gain on the sale of assets
in 2019.
Adjusted EBIT as a percentage of sales – Seating Systems
Adjusted EBIT as a percentage of sales for Seating Systems decreased 2.1% to 5.6% for 2019 compared to 7.7% for 2018, primarily as a result of:
• launch costs and operational inefficiencies at a new facility;
• reduced earnings due to lower sales at a number of established facilities;
• higher commodity costs;
• lower foreign exchange gains in 2019 compared to 2018;
• higher launch costs; and
• the labour strike at GM during 2019.
These factors were partially offset by higher favourable commercial items and a gain on the sale of assets in 2019.
2019 2018 Change
Complete Vehicle Assembly Volumes (thousands of units)(i) 158.5 144.6 13.9 +10%
Sales $ 6,707 $ 6,018 $ 689 +11%
Adjusted EBIT $ 144 $ 68 $ 76 +112%
Adjusted EBIT as a percentage of sales 2.1% 1.1% +1%
(i) Vehicles produced at our Complete Vehicle operations are included in Europe Light Vehicle Production volumes.
Complete Vehicle
Assembly Volumes
Sales (thousands of units)
2018
$6,018
2019
$6,707
$-
$7,000 + 11%
2018
144.6
2019
158.5
-
160.0 + 10%
Sales – Complete Vehicles
Sales for Complete Vehicles increased 11% or $689 million to $6.71 billion for 2019 compared to $6.02 billion for 2018 and assembly volumes
increased 10% or fourteen thousand units.
The increase in Complete Vehicle sales is primarily due to the launch of:
• the BMW Z4 program during the fourth quarter of 2018;
• the Jaguar I-Pace program during the first quarter of 2018;
• the new Mercedes-Benz G-Class program during the second quarter of 2018; and
• the Toyota Supra program during the first quarter of 2019.
These factors were partially offset by:
• the impact of lower assembly volumes on the BMW 5-Series and Jaguar E-Pace; and
• a $389 million decrease in reported U.S. dollar sales as a result of the weakening of the euro against the U.S. dollar.
MAGNA INTERNATIONAL INC. 15

19MAR202019191684 19MAR202019191812
Adjusted EBIT Adjusted EBIT as a percentage of sales
2018
$68
2019
$144
$-
$150 + 112%
2018
1.1%
2019
2.1%
0.0%
3.0% + 1.0%
Adjusted EBIT – Complete Vehicles
Adjusted EBIT for Complete Vehicles increased $76 million to $144 million for 2019 compared to $68 million for 2018, primarily as a result of:
• earnings on higher sales;
• lower launch and other costs; and
• lower spending associated with research & development.
These factors were partially offset by an $8 million decrease in reported U.S. dollar Adjusted EBIT due to the weakening of the euro against the
U.S. dollar and restructuring and downsizing costs incurred during 2019.
Adjusted EBIT as a percentage of sales – Complete Vehicles
Adjusted EBIT as a percentage of sales for Complete Vehicles increased 1.0% to 2.1% for 2019 compared to 1.1% for 2018, primarily as a result of
lower launch and other costs and earnings on higher sales.
CORPORATE AND OTHER
Adjusted EBIT in Corporate and Other increased $14 million to $43 million for 2019 compared to $29 million for 2018 primarily as a result of:
• lower incentive compensation;
• a gain on the sale of an asset in 2019;
• a $7 million favourable impact of foreign exchange gains in 2019 compared to foreign exchange losses in 2018 related to the re-measurement of net
deferred tax assets that are maintained in a currency other than their functional currency; and
• an increase in fees recorded from our divisions.
These factors were partially offset by:
• higher labour and benefit costs;
• higher spending associated with corporate research & development;
• an increase in expected costs payable related to a divestiture; and
• higher sponsorship costs.
16 ANNUAL REPORT 2019

19MAR202019191167
OPERATING ACTIVITIES
Cash provided from operating activities
a $281 million decrease in cash paid for material and overhead;
a $240 million decrease in cash paid for labour;
a $186 million decrease in cash paid for taxes; and
lower net interest expense of $11 million as discussed in the Interest Expense, net section above.
a $413 million decrease in cash received from customers; and
lower dividends received from equity method investments of $63 million.
Changes in operating assets and liabilities
a $629 million decrease in accounts receivable due to lower sales and timing of receipts;
a $104 million decrease in inventories due to volume decrease and new product launches;
a $97 million increase in other accrued liabilities due to an increase in net warranty accruals, partially offset by a decrease in accrued indirect
taxes; and
a $96 million increase in income taxes payable.
a $519 million decrease in accounts payable due to lower sales and timing of payments;
a $34 million decrease in accrued salaries and wages; and
a $21 million increase in prepaid expense.
FINANCIAL CONDITION, LIQUIDITY AND CAPITAL RESOURCES
Cash provided from operating activities
2018
$3,718
2019
$3,960
$1,000
$5,000+ 7%
2019 2018 Change
Net income $ 1,632 $ 2,332
Items not involving current cash flows 1,976 1,539
3,608 3,871 $ (263)
Changes in operating assets and liabilities 352 (153) 505
Cash provided from operating activities $ 3,960 $ 3,718 $ 242
We generated cash from operating activities of $4.0 billion during 2019. The $242 million increase compared to 2018, was primarily as a result of:
•
•
•
•
These factors were partially offset by:
•
•
Cash provided from operating assets and liabilities amounted to $352 million in 2019. The net increase in cash was primarily as a result of:
•
•
•
•
These factors were partially offset by:
•
•
•
MAGNA INTERNATIONAL INC. 17

19MAR202019191038
INVESTING ACTIVITIES
Fixed assets, investments, other assets and intangible assets additions
Acquisitions
Proceeds from sale of (investments in) Lyft
Proceeds from dispositions
Proceeds on sale of business
FINANCING ACTIVITIES
Cash used for investing activities
2018
$(2,276)
2019
$(434)
$(3,000)
$-
- 81%
2019 2018 Change
Fixed asset additions $ (1,441) $ (1,650)
Investments, other assets and intangible assets (394) (481)
Fixed assets, investments, other assets and intangible assets additions (1,835) (2,131)
Acquisitions (147) (148)
Proceeds from sale of (investments in) Lyft 231 (220)
Proceeds from dispositions 185 223
Proceeds on sale of business 1,132 –
Cash used for investing activities $ (434) $ (2,276) $ 1,842
Cash used for investing activities was lower for 2019 compared to 2018 primarily due to the proceeds on the sale of FP&C during 2019 and proceeds
from the sale of our investments in Lyft.
In 2019, we invested $1.4 billion in fixed assets. While investments were made to refurbish or replace assets consumed in the normal course of
business and for productivity improvements, a large portion of the investment in 2019 was for manufacturing equipment for programs that launched
during 2019, or that will be launching subsequent to 2019. In addition, we invested: $310 million in other assets related primarily to reimbursable
tooling, planning, and engineering costs for programs that launched during 2019 or will be launching subsequent to 2019; $45 million in intangible
assets, primarily related to software; and $39 million in investments, primarily related to equity method investments.
During 2019, we acquired 100% of the equity interest in VIZA for consideration of $99 million.
In 2019, we sold 5.4 million shares of Lyft for proceeds of $231 million.
In 2019, $185 million of proceeds related to normal course fixed and other asset disposals.
The $1.1 billion of proceeds related to the sale of FP&C business during 2019.
2019 2018 Change
Issues of debt $ 47 $ 172
(Decrease) increase in short-term borrowings (1,124) 866
Repayments of debt (149) (171)
Contributions to subsidiaries by non-controlling interests 4 4
Issue of Common Shares on exercise of stock options 44 50
Shares repurchased for tax withholdings on vesting of equity awards (9) (16)
Repurchase of Common Shares (1,289) (1,831)
Dividends paid to non-controlling interest (22) (69)
Dividends paid (449) (448)
Cash used for financing activities $ (2,947) $ (1,443) $ (1,504)
18 ANNUAL REPORT 2019

FINANCING RESOURCES
$1.63 billion of net income earned in 2019; and
a $102 million net unrealized gain on cash flow hedges.
$1.29 billion repurchase and cancellation of 25.8 million Common Shares during 2019;
$449 million of dividends paid during 2019; and
$18 million net unrealized loss on translation of our net investment in foreign operations whose functional currency is not U.S. dollars.
CASH RESOURCES
The decrease in short-term borrowings were related primarily to a $903 million decrease in U.S. commercial paper [the ‘‘U.S. Program’’] and an
$160 million decrease in euro-commercial paper [the ‘‘Euro Program’’] during 2019.
Repurchases of Common Shares during 2019 were related to 25.8 million Common Shares repurchased under normal course issuer bids for aggregate
cash consideration of $1.3 billion.
Cash dividends paid per Common Share were $1.46 for 2019, for a total of $449 million compared to cash dividends paid per Common Share of $1.32
for 2018, for a total of $448 million.
As at As at
December 31, December 31,
2019 2018 Change
Liabilities
Short-term borrowings $ – $ 1,098
Long-term debt due within one year 106 201
Current portion of operating lease liabilities 225 –
Long-term debt 3,062 3,084
Operating lease liabilities 1,601 –
4,994 4,383 $ 611
Non-controlling interests 300 458 (158)
Shareholders’ equity 10,831 10,701 130
Total capitalization $ 16,125 $ 15,542 $ 583
Total capitalization increased by $583 million to $16.13 billion as at December 31, 2019 compared to $15.54 billion at December 31, 2018, primarily as a
result of a $611 million increase in liabilities and a $130 million increase in shareholder’s equity, partially offset by a $158 million decrease in
non-controlling interest.
The increase in liabilities related primarily to the recognition of $225 million of current operating lease liabilities and $1.60 billion of operating lease
liabilities during 2019 in accordance with the adoption of the accounting standard Accounting Standards Codification 842 – Leases, partially offset by a
$903 million decrease in the U.S. Program and a $160 million decrease in the Euro Program during 2019.
The increase in shareholder’s equity was primarily as a result of:
•
•
These factors were partially offset by:
•
•
•
The decrease in non-controlling interest was primarily as a result of the impairment of equity-accounted assets recorded in 2019 and dividends paid
during 2019 partially offset by a loss attributable to non-controlling interests in 2019.
During 2019 our cash resources, including restricted cash equivalents, increased by $590 million to $1.39 billion, primarily as a result of cash provided
from operating activities partially offset by cash used for investing and financing activities, as discussed above. In addition to our cash resources at
December 31, 2019, we had term and operating lines of credit totalling $3.3 billion, of which $3.1 billion was unused and available.
MAGNA INTERNATIONAL INC. 19

MAXIMUM NUMBER OF SHARES ISSUABLE
CONTRACTUAL OBLIGATIONS
The following table presents the maximum number of shares that would be outstanding if all of the outstanding options at March 7, 2020
were exercised:
Common Shares 301,768,927
Stock options(i) 9,745,110
311,514,037
(i) Options to purchase Common Shares are exercisable by the holder in accordance with the vesting provisions and upon payment of the exercise price as may be determined from time to time pursuantto our stock option plans.
A purchase obligation is defined as an agreement to purchase goods or services that is enforceable and legally binding on us and that specifies all
significant terms, including: fixed or minimum quantities to be purchased; fixed, minimum or variable price provisions; and the approximate timing of
the transaction. Consistent with our customer obligations, substantially all of our purchases are made under purchase orders with our suppliers which
are requirements based and accordingly do not specify minimum quantities. Other long-term liabilities are defined as long-term liabilities that are
recorded on our consolidated balance sheet. Based on this definition, the following table includes only those contracts which include fixed or minimum
obligations.
At December 31, 2019, we had contractual obligations requiring annual payments as follows:
2021- 2023-
2020 2022 2024 Thereafter Total
Operating leases $ 297 $ 517 $ 415 $ 1,126 $ 2,355
Long-term debt 106 371 1,370 1,321 3,168
Unconditional purchase obligations:
Materials and services 2,737 1,286 918 253 5,194
Capital 978 198 75 19 1,270
Total contractual obligations $ 4,118 $ 2,372 $ 2,778 $ 2,719 $ 11,987
Our unfunded obligations with respect to employee future benefit plans, which have been actuarially determined, were $656 million at December 31,
2019. These obligations are as follows:
Termination and
Pension Retirement Long Service
Liability Liability Arrangements Total
Projected benefit obligation $ 659 $ 29 $ 446 $ 1,134
Less plan assets (478) – – (478)
Unfunded amount $ 181 $ 29 $ 446 $ 656
As of December 31, 2019, we had no off-balance sheet arrangements that have, or are reasonably likely to have, a current or future material effect on
our consolidated financial condition, results of operations, liquidity, capital expenditures, or capital resources.
20 ANNUAL REPORT 2019
Foreign Currency Activities
Our North American operations negotiate sales contracts with OEMs for payment in U.S. dollars and Canadian dollars. Materials and equipment are
purchased in various currencies depending upon competitive factors, including relative currency values. Our North American operations use labour and
materials which are paid for in U.S. dollars, Canadian dollars, Mexican pesos and euros. Our Mexican operations generally use the U.S. dollar as the
functional currency.
Our European operations negotiate sales contracts with OEMs for payment principally in euros and British pounds. The European operations’ material,
equipment and labour are paid for principally in euros, British pounds, U.S. dollars, Czech korunas, Polish zlotys and Hungarian forint.
We employ hedging programs, primarily through the use of foreign exchange forward contracts, in an effort to manage our foreign exchange exposure,
which arises when manufacturing facilities have committed to the delivery of products for which the selling price or material purchases have been
quoted in foreign currencies and for labour in countries where their local currency is not their functional currency. These commitments represent our
contractual obligations to deliver products over the duration of the product programs, which can last a number of years. The amount and timing of the
forward contracts will be dependent upon a number of factors, including anticipated production delivery schedules and anticipated production costs,
which may be paid in the foreign currency. Despite these measures, significant long-term fluctuations in relative currency values, in particular a
significant change in the relative values of the U.S. dollar, Canadian dollar, euro or Chinese renminbi, could have an adverse effect on our profitability
and financial condition (as discussed throughout this MD&A).
MAGNA INTERNATIONAL INC. 21

ADJUSTED EBIT
ADJUSTED EBIT AS A PERCENTAGE OF SALES
ADJUSTED DILUTED EARNINGS PER SHARE
NON-GAAP FINANCIAL MEASURES RECONCILIATION
Adjusted EBIT is discussed in the ‘‘Segment Analysis’’ section. The following table reconciles net income to Adjusted EBIT:
2019 2018
Net Income $ 1,632 $ 2,332
Add:
Interest Expense, net 82 93
Other Expense, net 240 63
Income Taxes 591 619
Adjusted EBIT $ 2,545 $ 3,107
Adjusted EBIT as a percentage of sales is discussed in the ‘‘Non-GAAP Performance Measures’’ section and is calculated in the table below:
2019 2018
Sales $ 39,431 $ 40,827
Adjusted EBIT $ 2,545 $ 3,107
Adjusted EBIT as a percentage of sales 6.5% 7.6%
Adjusted diluted earnings per share has been discussed in the ‘‘Earnings per Share’’ section. The following table reconciles net income attributable to
Magna International Inc. to Adjusted diluted earnings per share:
2019 2018
Net income attributable to Magna International Inc. $ 1,765 $ 2,296
Add (deduct):
Other Expense, net 240 63
Tax effect on Other Expense, net 33 (2)
Loss attributable to non-controlling interests related to Other Expense, net (127) –
Other Tax Items – (27)
Adjusted net income attributable to Magna International Inc. 1,911 2,330
Diluted weighted average number of Common Shares outstanding during the period (millions) 315.8 347.5
Adjusted diluted earnings per share $ 6.05 $ 6.71
22 ANNUAL REPORT 2019
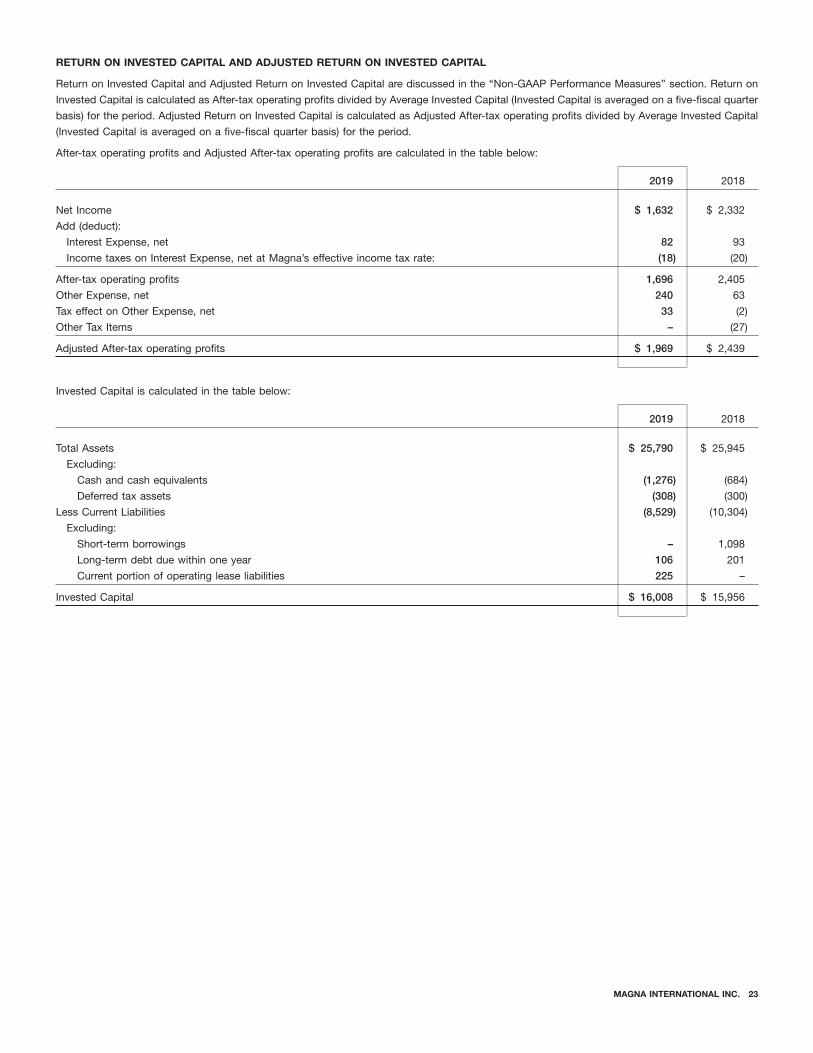
RETURN ON INVESTED CAPITAL AND ADJUSTED RETURN ON INVESTED CAPITAL
Return on Invested Capital and Adjusted Return on Invested Capital are discussed in the ‘‘Non-GAAP Performance Measures’’ section. Return on
Invested Capital is calculated as After-tax operating profits divided by Average Invested Capital (Invested Capital is averaged on a five-fiscal quarter
basis) for the period. Adjusted Return on Invested Capital is calculated as Adjusted After-tax operating profits divided by Average Invested Capital
(Invested Capital is averaged on a five-fiscal quarter basis) for the period.
After-tax operating profits and Adjusted After-tax operating profits are calculated in the table below:
2019 2018
Net Income $ 1,632 $ 2,332
Add (deduct):
Interest Expense, net 82 93
Income taxes on Interest Expense, net at Magna’s effective income tax rate: (18) (20)
After-tax operating profits 1,696 2,405
Other Expense, net 240 63
Tax effect on Other Expense, net 33 (2)
Other Tax Items – (27)
Adjusted After-tax operating profits $ 1,969 $ 2,439
Invested Capital is calculated in the table below:
2019 2018
Total Assets $ 25,790 $ 25,945
Excluding:
Cash and cash equivalents (1,276) (684)
Deferred tax assets (308) (300)
Less Current Liabilities (8,529) (10,304)
Excluding:
Short-term borrowings – 1,098
Long-term debt due within one year 106 201
Current portion of operating lease liabilities 225 –
Invested Capital $ 16,008 $ 15,956
MAGNA INTERNATIONAL INC. 23

RETURN ON EQUITY
Return on Invested Capital is calculated in the table below:
2019 2018
After-tax operating profits $ 1,696 $ 2,405
Average Invested Capital $ 16,732 $ 16,095
Return on Invested Capital 10.1% 14.9%
Adjusted Return on Invested Capital is calculated in the table below:
2019 2018
Adjusted After-tax operating profits $ 1,969 $ 2,439
Average Invested Capital $ 16,732 $ 16,095
Adjusted Return on Invested Capital 11.8% 15.2%
Return on Equity is discussed in the ‘‘Non-GAAP Performance Measures’’ section and is calculated in the table below:
2019 2018
Net income attributable to Magna International Inc. $ 1,765 $ 2,296
Average Shareholders’ Equity $ 11,412 $ 11,663
Return on Equity 15.5% 19.7%
24 ANNUAL REPORT 2019

IMPAIRMENT ASSESSMENTS – EQUITY METHOD INVESTMENTS, GOODWILL AND OTHER LONG-LIVED ASSET
WARRANTY
SIGNIFICANT ACCOUNTING POLICIES AND CRITICAL ACCOUNTING ESTIMATES
Our significant accounting policies are more fully described in Note 1, ‘‘Significant Accounting Policies’’, to the consolidated financial statements
included in this Report. The preparation of the audited consolidated financial statements requires management to make estimates and assumptions
that affect the reported amounts of assets, liabilities, revenues and expenses and the related disclosure of contingent assets and liabilities, as of the
date of the consolidated financial statements. These estimates and assumptions are based on our historical experience, and various other
assumptions we believe to be reasonable in the circumstances. Since these estimates and assumptions are subject to an inherent degree of
uncertainty, actual results in these areas may differ significantly from our estimates.
We believe the following critical accounting policies and estimates affect the more subjective or complex judgements and estimates used in the
preparation of our consolidated financial statements and accompanying notes. Management has discussed the development and selection of the
following critical accounting policies with the Audit Committee of the Board of Directors, and the Audit Committee has reviewed our disclosure relating
to critical accounting policies in this MD&A.
As of December 31, 2019, and 2018, we had equity method investments of $1.1 billion and $1.9 billion, respectively. We monitor our investments for
indicators of other-than-temporary declines in value on an ongoing basis in accordance with U.S. GAAP. If we determine that an other-than-temporary
decline in value has occurred, we recognize an impairment loss, which is measured as the difference between the book value and the fair value of
the investment.
During the third quarter of 2019, we concluded that there were other-than-temporary declines in value related to our investments in Getrag (Jiangxi)
Transmission Co., Ltd. and Dongfeng Getrag Transmission Co. Ltd. in China, which make both manual transmissions and dual clutch transmissions,
and in our investment in Getrag Ford Transmission GmbH in Europe which makes manual transmissions. As a result, we recorded a $700 million
non-cash impairment charge within Other expense, net. The impairment was measured under an income approach, utilizing discounted cash flows to
derive the fair value of our investments. The inputs utilized in the analyses were classified as Level 3 inputs within the fair value hierarchy as defined in
ASC 820, ‘‘Fair Value Measurement’’ and primarily consist of expected revenues and costs, estimated production volumes, future growth rates and
appropriate discount rates (based on weighted average cost of capital). To the extent that future profitability continues to decline as compared to
forecasted profitability or if adverse changes occur to key assumptions or other fair value measurement inputs, additional impairment of our equity
method investments could occur in the future. Refer to Note 4, Other Expense, Net of the notes to the consolidated financial statements for additional
information.
We review goodwill at the reporting unit level for impairment in the fourth quarter of each year or more frequently if events or changes in circumstances
indicate that goodwill might be impaired. Goodwill impairment is assessed based on a comparison of the fair value of a reporting unit to the underlying
carrying value of the reporting unit’s net assets, including goodwill. If a reporting unit’s carrying amount exceeds its fair value, an impairment is
recognized based on that difference. The fair value of a reporting unit is determined using the estimated discounted future cash flows of the
reporting unit.
In addition to our review of goodwill, we evaluate fixed assets and other long-lived assets for impairment whenever indicators of impairment exist.
Indicators of impairment include the bankruptcy of a significant customer or the early termination, loss, renegotiation of the terms of, or delay in the
implementation of, any significant production contract. If the sum of the future cash flows expected to result from the asset, undiscounted and without
interest charges, is less than the reported value of the asset, an asset impairment may be recognized in the consolidated financial statements. The
amount of impairment to be recognized is calculated by subtracting the fair value of the asset from the reported value of the asset.
We believe that accounting estimates related to equity method investments, goodwill and long-lived asset impairment assessments are ‘‘critical
accounting estimates’’ because: (i) they are subject to significant measurement uncertainty and are susceptible to change as management is required
to make forward-looking assumptions regarding the impact of improvement plans on current operations, in-sourcing and other new business
opportunities, program pricing and cost assumptions on current and future business, the timing of new program launches and future forecasted
production volumes; and (ii) any resulting impairment loss could have a material impact on our consolidated net income and on the amount of assets
reported in our consolidated balance sheet.
We record product warranty costs, which include product liability and recall costs. Under most customer agreements, we only account for existing or
probable claims on product default issues when amounts related to such issues are probable and reasonably estimable. Under certain complete
vehicle assembly, powertrain systems, and electronics contracts, we record an estimate of future warranty-related costs based on the terms of the
specific customer agreements and/or the Company’s warranty experience.
Product liability and recall provisions are established based on our best estimate of the amounts necessary to settle existing claims, which typically
take into account: the number of units that may be returned; the cost of the product being replaced; labour to remove and replace the defective part;
and the customer’s administrative costs relating to the recall. In making this estimate, judgement is also required as to the ultimate negotiated sharing
of the cost between us, the customer and, in some cases a supplier.
Due to the uncertain nature of the net costs, actual product liability costs could be materially different from our best estimates of future costs.
MAGNA INTERNATIONAL INC. 25

INCOME TAXES
EMPLOYEE FUTURE BENEFIT PLANS
NORMAL COURSE ISSUER BID
DISCLOSURE CONTROLS AND PROCEDURES
The determination of our tax liabilities involves dealing with uncertainties in the application of complex tax laws. Significant judgement and estimates
are required in determining our provision for income taxes, deferred tax assets and liabilities, and liabilities for unrecognized tax benefits. We recognize
tax benefits from uncertain tax positions only if it is more likely than not that the tax position will be sustained on examination by the taxing authorities,
based on the technical merits of the position. The tax benefits recognized in the financial statements from such positions are then measured based on
the largest benefit that has a greater than 50% likelihood of being realized upon ultimate settlement.
At December 31, 2019, we had gross unrecognized tax benefits of $192 million excluding interest and penalties, of which $174 million, if recognized,
would affect our effective tax rate. The gross unrecognized tax benefits differ from the amount that would affect our effective tax rate due primarily to
the impact of the valuation allowance on deferred tax assets.
Deferred tax assets and liabilities are recognized for the estimated future tax effects attributable to temporary differences between financial statement
carrying value of existing assets and liabilities and their respective tax bases and tax loss and credit carryforwards. Deferred tax assets and liabilities are
measured using the enacted tax rates and laws that will be in effect when the differences are expected to reverse. Accounting standards require that we
assess whether valuation allowances should be established or maintained against our deferred income tax assets, based on consideration of all
available evidence, using a ‘‘more-likely-than-not’’ standard. The factors used to assess the likelihood of realization are: history of losses, forecasts of
future pre-tax income and tax planning strategies that could be implemented to realize the deferred tax assets. On a quarterly basis, we evaluate the
realizability of deferred tax assets by assessing our valuation allowances and by adjusting the amount of such allowances as necessary. We use tax
planning strategies to realize deferred tax assets in order to avoid the potential loss of these tax benefits. Changes in our estimates, due to unforeseen
events or otherwise, could have a material impact on our financial condition and results of operations. Refer to Note 13, Income Taxes of the notes to
the consolidated financial statements for additional information.
The determination of the obligation and expense for defined benefit pension, termination and long service arrangements and other post-retirement
benefits, such as retiree healthcare and medical benefits, is dependent on the selection of certain assumptions used by actuaries in calculating such
amounts. Those assumptions include, among others, the discount rate, expected long-term rate of return on plan assets and rates of increase in
compensation costs. Actual results that differ from the assumptions used are accumulated and amortized over future periods and therefore impact the
recognized expense in future periods. Significant changes in assumptions or significant plan amendments could materially affect our future employee
benefit obligations and future expense.
At December 31, 2019, we had past service costs and actuarial experience losses of $255 million included in accumulated other comprehensive
income that will be amortized to future employee benefit expense over the expected average remaining service life of employees or over the expected
average life expectancy of retired employees, depending on the status of the plan.
SUBSEQUENT EVENT
Subsequent to December 31, 2019, we purchased 1,955,518 Common Shares for cancellation and 177,103 Common Shares to satisfy stock-based
compensation awards, each under our existing normal course issuer bid for cash consideration of $101 million.
COMMITMENTS AND CONTINGENCIES
From time to time, we may be contingently liable for litigation, legal and/or regulatory actions and proceedings and other claims. Refer to note 24 of our
audited consolidated financial statements for the year ended December 31, 2019, which describes these claims.
For a discussion of risk factors relating to legal and other claims/actions against us, refer to ‘‘Item 5. Risk Factors’’ in our Annual Information Form and
Annual Report on Form 40-F, each in respect of the year ended December 31, 2018.
CONTROLS AND PROCEDURES
Disclosure controls and procedures (as defined in Rules 13a-15(e) and 15d-15(e) under the Securities Exchange Act of 1934, as amended [the
‘‘Exchange Act’’], are designed to ensure that material information required to be disclosed in reports filed or submitted under the Exchange Act is
recorded, processed, summarized and reported on a timely basis, and that such information is accumulated and communicated to senior
management, including the Company’s Chief Executive Officer and Chief Financial Officer, as appropriate, to enable them to make timely decisions
regarding required disclosure of such information. We have conducted an evaluation of our disclosure controls and procedures as of December 31,
2019, under the supervision, and with the participation of our Chief Executive Officer and our Chief Financial Officer. Based on this evaluation, our Chief
Executive Officer and our Chief Financial Officer have concluded that our disclosure controls and procedures (as this term is defined in the rules
adopted by Canadian securities regulatory authorities and the United States Securities and Exchange Commission [‘‘SEC’’]) are effective as of
December 31, 2019.
26 ANNUAL REPORT 2019

MANAGEMENT’S ANNUAL REPORT ON INTERNAL CONTROL OVER FINANCIAL REPORTING
CHANGES IN INTERNAL CONTROLS OVER FINANCIAL REPORTING
Internal control over financial reporting is a process designed to provide reasonable, but not absolute, assurance regarding the reliability of financial
reporting and preparation of financial statements for external purposes in accordance with U.S. GAAP. Our management is responsible for establishing
and maintaining adequate internal control over financial reporting. Due to its inherent limitations, internal control over financial reporting may not
prevent or detect misstatements on a timely basis. Additionally, projections of any evaluation of the effectiveness of internal control over financial
reporting to future periods are subject to the risk that the controls may become inadequate because of changes in conditions, or that the degree of
compliance with the policies or procedures may deteriorate. Our management used the Committee of Sponsoring Organizations of the Treadway
Commission [‘‘COSO’’] Internal Control – Integrated Framework (2013) to evaluate the effectiveness of internal control over financial reporting. Based
on this evaluation, our Chief Executive Officer and our Chief Financial Officer have assessed the effectiveness of our internal control over financial
reporting and concluded that, as at December 31, 2019, such internal control over financial reporting is effective. The Company’s internal control over
financial reporting as of December 31, 2019, has been audited by Deloitte LLP, Independent Registered Public Accounting Firm who also audited the
Company’s consolidated financial statements for the year ended December 31, 2019. Deloitte LLP expressed an unqualified opinion on the
effectiveness of the Company’s internal control over financial reporting. This report precedes our audited consolidated financial statements for the year
ended December 31, 2019.
There have been no changes in our internal controls over financial reporting that occurred during 2019 that have materially affected, or are reasonably
likely to materially affect, our internal control over financial reporting.
MAGNA INTERNATIONAL INC. 27
RISKS RELATED TO THE AUTOMOTIVE INDUSTRY
Economic Cyclicality: The global automotive industry is cyclical, with the potential for regional differences in timing of expansion and contraction
of economic cycles. A worsening of economic, political, or other conditions in North America, Europe or China, including as a result of the COVID-19
(Coronavirus) epidemic, may result in lower consumer confidence, which typically translates into lower vehicle sales and production levels. A
significant decline in vehicle production volumes from current levels could have a material adverse effect on our profitability and financial condition.
Regional Volumes Declines: North America, Europe and China are key automotive producing regions for us, and our operating results are
primarily dependent on car and light truck production by our customers in these regions. A significant or sustained decline in vehicle production
volumes in any or all of these geographic regions could have a material adverse effect on our operations, sales and profitability.
Intense Competition: The automotive supply industry is highly competitive and becoming more so. Some of our competitors have higher or more
rapidly growing market share than we do in certain product or geographic markets. Additionally, a number of established electronics and
semiconductor companies have entered or expanded their presence in the automotive industry, while disruptive technology innovators have been
introducing novel product and service solutions which traditional automotive suppliers may not be able to match. Failure to successfully compete
with existing or new competitors, including failure to grow our electronics content, could affect our ability to fully implement our business strategy.
Trade Agreements: The global growth of the automotive industry has been aided by the free movement of goods, services, people and capital
through bilateral and regional trade agreements, particularly in North America and Europe. Introduction of measures which impede free trade could
have a material adverse effect on our operations and profitability.
Trade Disputes/Tariffs: International trade disputes could, among other things, reduce demand for and production of vehicles, disrupt global
supply chains, distort commodity pricing, impair the ability of automotive suppliers and vehicle manufacturers to make efficient long-term
investment decisions, create volatility in relative foreign exchange rates, and contribute to stock market volatility. A trade dispute between the
United States and China led to the imposition by the United States of tariffs on a broad range of Chinese-origin imports into the U.S., and retaliatory
tariffs by China on certain U.S.-origin imports into China, including automobiles. Although the first phase of a trade agreement was recently reached
between the U.S. and China, some of these tariffs remain in place. The continuation of these or other tariffs and/or escalation of trade disputes which
interfere with automotive supply chains could have an adverse effect on our operations and profitability.
CUSTOMER AND SUPPLIER RELATED RISKS
Customer Concentration: Although we supply parts to all of the leading OEMs, a significant majority of our sales are to six customers: General
Motors, BMW, Ford, Fiat Chrysler, Daimler and Volkswagen. In light of the amount of business we currently have with these six customers, our
opportunities for incremental growth with them in North America, Europe and China may be limited. While we continue to diversify our business,
there is no assurance we will be successful. Shifts in market share away from our top customers could have a material adverse effect on our
profitability.
Customer Consolidation and Cooperation: There have been a number of examples of OEM consolidation in recent years, including the
proposed merger of PSA and Fiat Chrysler. Additionally, competing OEMs are increasingly cooperating and collaborating in different ways to save
costs, including through joint purchasing activities, platform sharing, powertrain sharing, joint R&D and regional joint ventures. While OEM
consolidation and cooperation may present opportunities, they also present a risk that we could lose future business or experience even greater
pricing pressure on certain production programs, either of which could have an adverse effect on our profitability.
Market Shifts: While we supply parts for a wide variety of vehicles produced globally, we do not supply parts for all vehicles produced, nor is the
number or value of parts evenly distributed among the vehicles for which we do supply parts. Shifts in market shares away from vehicles on which
we have significant content, as well as vehicle segments in which our sales may be more heavily concentrated, could have a material adverse effect
on our profitability.
Consumer Take Rate Shifts: Shifts in consumer preferences may impact ‘‘take rates’’ for certain types of products we sell. Examples of such
products include: manual and dual-clutch transmissions; all-wheel drive systems; power liftgates; active aerodynamics systems; advanced driver
assistance systems; and complete vehicles with certain option packages or option choices. Where shifts in consumer preferences result in higher
‘‘take rates’’ for products that we do not sell or for products we sell at a lower margin, our profitability may be adversely affected.
MANUFACTURING / OPERATIONAL RISKS
Product Launch: The launch of production is a complex process, the success of which depends on a wide range of factors, including: the timing
of design changes by our customers relative to start of production; production readiness of our and our suppliers’ manufacturing facilities;
robustness of manufacturing processes; launch volumes; quality and production readiness of tooling and equipment; employees; and initial product
quality. Our failure to successfully launch material new or takeover business could have a material adverse effect on our profitability and reputation.
RISK FACTORS
Our short and medium-term operational success, as well as our ability to create long-term value through our business strategy, are subject to risks and
uncertainties. The following are the more significant such risks:
•
•
•
•
•
•
•
•
•
•
28 ANNUAL REPORT 2019

Operational Underperformance: From time to time, we may have operating divisions which are not performing at expected levels of profitability.
The complexity of automotive manufacturing operations often makes it difficult to achieve a quick turnaround of underperforming divisions.
Significant underperformance of one or more operating divisions could have a material adverse effect on our profitability and operations.
Restructuring Costs: We may sell some product lines and/or downsize, close or sell some of our operating divisions. By taking such actions, we
may incur restructuring, downsizing and/or other significant non-recurring costs. These costs may be higher in some countries than others and
could have a material adverse effect on our profitability.
Impairments: We have recorded significant impairment charges related to equity interests in joint ventures, goodwill and long-lived assets in the
past, and may do so again in the future. The early termination, loss, renegotiation of the terms of, or delay in the implementation of, any significant
production contract could be indicators of impairment, as may the technological obsolescence of any of our products or production assets. In
conducting our impairment analysis, we make forward-looking assumptions regarding: the impact of turnaround plans on underperforming
operations; new business opportunities; program price and cost assumptions on current and future business; the timing and success of new
program launches; and forecast production volumes. To the extent such forward-looking assumptions are not met, any resulting impairment loss
could have a material adverse effect on our profitability.
Supply Disruptions: Events which prevent us from supplying products to our customers could result in a range of potential adverse
consequences, including penalties or business interruption claims by our customers, loss of business and reputational damage. At present, there is
a risk that production stoppages related to the COVID-19 (Coronavirus) epidemic could result in supply disruptions both within China and with
respect to components made in China or elsewhere. A prolonged supply disruption could have a material adverse effect on our operations and
profitability.
Skilled Labour Attraction/Retention: Our business depends on our ability to attract, develop and retain experienced and highly skilled
personnel. Such personnel are in high demand in some of the areas in which we compete, and competition for employees with certain types of skills
may be intense. For example, due to the rapid changes in the automotive industry, particularly in response to electrification, autonomous driving and
MaaS trends, we have a growing need for personnel with software and other technical skills, and we may face substantial competition for such
personnel, including from traditional software industry companies. From time to time, we complete acquisitions that assist us in meeting our needs
for skilled labour. The inability to attract and/or retain highly-skilled personnel, including in connection with completed acquisitions, could have an
adverse effect on our operations and our ability to fully implement our business strategy.
IT SECURITY / CYBERSECURITY
IT / Cybersecurity Breach: Although we have established and continue to enhance security controls intended to protect our IT systems and
infrastructure, there is no guarantee that such security measures will be effective in preventing unauthorized physical access or cyber attacks. A
significant breach of our IT systems could: result in theft of funds; cause disruptions in our manufacturing operations; lead to the loss, destruction or
inappropriate use of sensitive data; or result in theft of our, our customers’ or our suppliers’ intellectual property or confidential information. The
occurrence of any of the foregoing could adversely affect our operations and/or reputation, and could lead to claims against us that could have a
material adverse effect on our profitability.
Product Cybersecurity: The risk of vehicle cyber attacks has risen with the proliferation of technology designed to connect vehicles to external
networks. Although systems-level cybersecurity controls and protections are typically specified by our OEM customers, we cannot provide
assurance that such controls and protections will be effective in preventing cyber intrusion through one of our products. Furthermore, an OEM
customer may still seek to hold us financially responsible, even where the OEM specified the cybersecurity controls and protections. Any such cyber
intrusion could cause reputational damage and lead to claims against us that have an adverse effect on our profitability.
PRICING RISKS
Quote / Pricing Assumptions: The time between award of new production business and start of production typically ranges between two and
four years. Since product pricing is typically determined at the time of award, we are subject to significant pricing risk due to changes in input costs
and quote assumptions between the time of award and start of production. The inability to quote effectively, or the occurrence of a material change
in input cost or other quote assumptions between program award and production, could have an adverse effect on our profitability.
Customer Pricing Pressure: We face ongoing pricing pressure from OEMs, including through: quoting pre-requirements; long-term supply
agreements with mutually agreed price reductions over the life of the agreement; non-contractual annual price concession demands; pressure to
absorb costs related to product design, engineering and tooling, and/or amortize such costs through the piece price for the product; and OEM
refusal to fully offset inflationary price increases. OEMs possess significant leverage over their suppliers due to their purchasing power and the highly
competitive nature of the automotive supply industry. As a result of the broad portfolio of parts we supply to our six largest OEM customers, such
customers may be able to exert greater leverage over us as compared to our competitors. We attempt to offset price concessions and costs in a
number of ways, including through negotiations with our customers, improved operating efficiencies and cost reduction efforts. Our inability to fully
offset price concessions, absorb design, engineering and tooling costs, and/or fully recover such costs over the life of production, could have a
material adverse effect on our profitability.
•
•
•
•
•
•
•
•
•
MAGNA INTERNATIONAL INC. 29

Commodity Price Volatility: Prices for certain key raw materials and commodities used in our parts, including steel, aluminum and resin, can be
volatile. To the extent we are unable to offset commodity price increases by: passing such increases to our customers, by engineering products with
reduced commodity content, implementing hedging strategies, or otherwise, such additional commodity costs could have an adverse effect on our
profitability.
Scrap Steel / Aluminum Price Volatility: Some of our manufacturing facilities generate a significant amount of scrap steel or scrap aluminum in
their manufacturing processes, but recover some of the value through the sale of such scrap. Scrap steel and scrap aluminum prices can also be
volatile and don’t necessarily move in the same direction as steel or aluminum prices. Declines in scrap steel/aluminum prices from time to time
could have an adverse effect on our profitability.
WARRANTY RISK
Repair / Replacement Costs: We are responsible for repair and replacement costs of defective products we supply to our customers. Certain of
our products, such as transmissions, typically have a higher unit cost in the event of replacement. Other products, such as side door latches, are
supplied in multiples of two or four for a single vehicle, which could result in significant cost in the event all need to be replaced. Our OEM customers
and/or government regulators have the ability to initiate recalls of safety products, which will also place us at risk for the administrative costs of the
recall, even in situations where we dispute the need for a recall or responsibility for any alleged defect. The obligation to repair or replace defective
products could have a material adverse effect on our operations and profitability. To the extent such obligation arises as a result of a product recall,
we may face reputational damage, and the combination of administrative and product replacement costs could have a material adverse effect on our
profitability.
Warranty Provisions: Warranty provisions for our powertrain systems, electronics and complete vehicle programs are established on the basis of
our or our customers’ warranty experience with the applicable type of product and, in some cases, the terms in the applicable customer agreements.
Warranty provisions for our other products are based on our best estimate of the amounts necessary to settle existing or probable claims related to
product defects. Actual warranty experience which results in costs that exceed our warranty provisions, could have an adverse effect on our
profitability.
Product Liability: We cannot guarantee that the design, engineering, testing, validation and manufacturing measures we employ to ensure
high-quality products will be completely effective, particularly as electronic content and product complexity increases. In the event that our products
fail to perform as expected and such failure results in, or is alleged to result in, bodily injury and/or property damage or other losses, product liability
claims may be brought against us. The defense of product liability claims, particularly class action claims in North America, may be costly and
judgements against us could impair our reputation and have a material adverse effect on our profitability.
ACQUISITION RISKS
Inherent Merger and Acquisition Risks: Acquisitions are subject to a range of inherent risks, including the assumption of incremental regulatory/
compliance, pricing, supply chain, commodities, labour relations, litigation, environmental, pensions, warranty, recall, IT, tax or other risks. While the
conduct of due diligence on an acquisition target is intended to mitigate such risks, these efforts may not always prove to be sufficient in identifying
all risks and liabilities related to the acquisition, including as a result of: limited access to information; time constraints for conducting due diligence;
inability to access target company facilities and/or personnel; or other limitations in the due diligence process. Additionally, we may identify risks and
liabilities that we are not able to sufficiently mitigate through appropriate contractual or other protections. The realization of any such risks could
have a material adverse effect on our profitability.
OTHER BUSINESS RISKS
Joint Ventures: We conduct certain of our operations through joint ventures under contractual arrangements under which we share management
responsibilities with one or more partners. Joint venture operations carry a range of risks, including those relating to: failure of our joint venture
partner(s) to satisfy contractual obligations; potential conflicts between us and our joint venture partner(s); strategic objectives of joint venture
partners that may differ from our own; potential delays in decision-making; a limited ability to implement some or all of our policies, practices and
controls, or to control legal and regulatory compliance, within the joint venture(s); and other risks inherent to non-wholly-owned operations. The
likelihood of such occurrences and their potential effect on us vary depending on the joint venture arrangement, however, the occurrence of any such
risks could have an adverse effect on our operations, profitability and reputation.
Technology and Innovation: While we continue to invest in technology and innovation which we believe will be critical to our long-term growth,
the automotive industry is experiencing rapid technological change and significant disruption. Our ability to anticipate changes in technology and to
successfully develop and introduce new and enhanced products and/or manufacturing processes on a timely basis will be a significant factor in our
ability to remain competitive. If we are unsuccessful or are less successful than our competitors in consistently developing innovative products and/
or processes, we may be placed at a competitive disadvantage and may not be able to recover some or all of our investments and costs, which could
have a material adverse effect on our profitability and financial condition and ability to fully implement our business strategy.
•
•
•
•
•
•
•
•
30 ANNUAL REPORT 2019

Private Equity Investments in Technology Companies: In addition to our development activities, we have invested in various technology
companies and private equity or venture capital funds that invest in such companies. Such investments are an important element of our long-term
strategy and we may make further investments in such companies. Investing in such companies involves a high degree of risk, including the
potential loss of some or all of our investment value. In addition, there is typically currently no public market for the shares of such investments, and
we may be unable to monetize our investments in the future. The realization of such investment-related risks could have an adverse effect on our
profitability and financial condition.
Evolving Business Risk Profile: The risk profile of our business continues to evolve with the increasing importance to us of product areas such as
powertrain, ADAS and electronics. As our business evolves, we may face new or heightened risks, including: challenges in quoting for profitable
returns on products with leading-edge technologies for which we may not have significant quoting experience; rigorous testing and validation
requirements from OEM customers for complex new products; increased warranty and recall risks on new products and leading-edge technologies;
increased product liability risks; heightened risk of technological obsolescence of some of our products, processes and/or assets; and difficulties in
attracting or retaining employees with critical skills in high-demand areas. Realization of one or more such risks could have a material adverse effect
on our operations, profitability or financial condition.
Risks of Doing Business in Foreign Markets: The establishment of manufacturing operations in new markets carries a number of potential risks,
including those relating to: political, civil and economic instability and uncertainty; corruption risks; high inflation and our ability to recover inflation-
related cost increases; trade, customs and tax risks; expropriation risks; currency exchange rates; currency controls; limitations on the repatriation
of funds; insufficient infrastructure; competition to attract and retain qualified employees; and other risks associated with conducting business
internationally. Expansion of our business in non-traditional markets is an important element of our long-term strategy and, as a result, our exposure
to the risks described above may be greater in the future. The likelihood of such occurrences and their potential effect on us vary from country to
country and are unpredictable, however, the occurrence of any such risks could have an adverse effect on our operations, profitability and financial
condition.
Relative Foreign Exchange Rates: Our profitability is affected by movements of our U.S. dollar reporting currency against the Canadian dollar,
the euro, the Chinese renminbi and other currencies in which we generate revenues and incur expenses. Significant long-term fluctuations in relative
currency values, in particular a significant change in the relative values of the U.S. dollar, Canadian dollar, euro or Chinese renminbi, could have an
adverse effect on our profitability and financial condition and any sustained change in such relative currency values could adversely impact our
competitiveness in certain geographic regions.
Financial Flexibility: The occurrence of an economic shock not contemplated in our business plan, a rapid deterioration of conditions or a
prolonged recession could result in the depletion of our cash resources, which could have a material adverse effect on our operations and financial
condition.
Credit Ratings Changes: There is no assurance that any credit rating currently assigned to us will remain in effect for any period of time or that any
rating will not be revised or withdrawn entirely by a rating agency in the future. A downgrade in the credit ratings assigned to us by one or more
agencies could increase our cost of borrowing or impact our ability to negotiate loans, which could have an adverse effect on our profitability,
financial condition and the trading price of our Common Shares.
LEGAL, REGULATORY AND OTHER RISKS
Legal and Regulatory Proceedings: From time to time, we may become involved in regulatory proceedings, or become liable for legal,
contractual and other claims by various parties, including customers, suppliers, former employees, class action plaintiffs and others. Depending on
the nature or duration of any potential proceedings or claims, we may incur substantial costs and expenses, be required to devote significant
management time and resources to the matters, and suffer reputational damage as a result of regulatory proceedings. On an ongoing basis, we
attempt to assess the likelihood of any adverse judgements or outcomes to these proceedings or claims, although it is difficult to predict final
outcomes with any degree of certainty. Except as disclosed from time to time in our consolidated financial statements and/or our MD&A, we do not
believe that any of the proceedings or claims to which we are currently a party will have a material adverse effect on our profitability; however, we
cannot provide any assurance to this effect.
Changes in Laws: A significant change in the current regulatory environment in our principal markets, including changes in tax and other laws
which impose additional costs on automotive manufacturers or consumers, could have an adverse effect on our profitability.
•
•
•
•
•
•
•
•
MAGNA INTERNATIONAL INC. 31

SELECTED QUARTERLY CONSOLIDATED FINANCIAL DATA
The following selected consolidated financial data has been prepared in accordance with U.S. GAAP.
For the three month periods ended
Mar 31, Jun 30, Sep 30, Dec 31,
2019 2019 2019 2019
Sales $ 10,591 $ 10,126 $ 9,319 $ 9,395
Net income (loss) $ 1,101 $ 450 $ (364) $ 445
Earnings (loss) per Common Share
Basic $ 3.40 $ 1.42 $ (0.75) $ 1.44
Diluted $ 3.39 $ 1.42 $ (0.75) $ 1.43
For the three month periods ended
Mar 31, Jun 30, Sep 30, Dec 31,
2018 2018 2018 2018
Sales $ 10,792 $ 10,280 $ 9,618 $ 10,137
Net income $ 669 $ 636 $ 560 $ 467
Earnings per Common Share
Basic $ 1.84 $ 1.78 $ 1.63 $ 1.37
Diluted $ 1.83 $ 1.77 $ 1.62 $ 1.37
The third quarter of the year is generally affected by the normal seasonal effects of lower vehicle production volumes as a result of OEM summer
shutdowns.
Included in the quarterly net income attributable to Magna International Inc. are the following Other Expense, net items that have been discussed
above:
For the three month periods ended
Mar 31, Jun 30, Sep 30, Dec 31,
2019 2019 2019 2019
Restructuring $ 14 $ 7 $ 7 $ 3
Impairment of assets – – 727 –
Net (gains) losses on investments (177) 67 127 (11)
Gain on sale of business (516) (6) (2) –
$ (679) $ 68 $ 859 $ (8)
For the three month periods ended
Mar 31, Jun 30, Sep 30, Dec 31,
2018 2018 2018 2018
Restructuring $ 3 $ 17 $ 2 $ 23
Impairment of assets – – – 74
Net gains on investments – (56) – –
$ 3 $ (39) $ 2 $ 97
For more information regarding our quarter over quarter results, please refer to our first, second and third quarter 2019 quarterly reports which are
available through the internet on the Canadian Securities Administrators’ System for Electronic Document Analysis and Retrieval [‘‘SEDAR’’] which can
be accessed at www.sedar.com.
32 ANNUAL REPORT 2019

Opinion on the Financial Statements
We have audited the accompanying consolidated balance sheets of Magna International Inc. and subsidiaries (the ‘‘Company’’) as of December 31,
2019 and 2018, the related consolidated statements of income, comprehensive income, changes in equity, and cash flows, for each of the two years in
the period ended December 31, 2019, and the related notes (collectively referred to as the ‘‘financial statements’’). In our opinion, the financial
statements present fairly, in all material respects, the financial position of the Company as of December 31, 2019 and 2018, and the results of its
operations and its cash flows for each of the two years in the period ended December 31, 2019, in conformity with accounting principles generally
accepted in the United States of America.
Basis for Opinion
These financial statements are the responsibility of the Company’s management. Our responsibility is to express an opinion on the Company’s financial
statements based on our audits. We are a public accounting firm registered with the PCAOB and are required to be independent with respect to the
Company in accordance with the U.S. federal securities laws and the applicable rules and regulations of the Securities and Exchange Commission and
the PCAOB.
Critical Audit Matter
The critical audit matter communicated below is a matter arising from the current-period audit of the financial statements that was communicated or
required to be communicated to the audit committee and that (1) relates to accounts or disclosures that are material to the financial statements and
(2) involved our especially challenging, subjective, or complex judgments. The communication of critical audit matters does not alter in any way our
opinion on the financial statements, taken as a whole, and we are not, by communicating the critical audit matter below, providing a separate opinion on
the critical audit matter or on the accounts or disclosures to which it relates.
Equity Method Investments – Refer to Notes 1 and 4 to the Financial Statements
Critical Audit Matter Description
The Company monitors its equity method investments for indicators of other-than-temporary declines in value on an ongoing basis and determined
that indicators of impairment were present related to its investments in Getrag (Jiangxi) Transmission Co., Ltd, Getrag Ford Transmission GmbH, and
Dongfeng Getrag Transmission Co. Ltd (collectively, ‘‘the investments’’). The Company undertook an impairment analysis to determine the fair values of
the investments utilizing an income approach based on discounted cash flows to derive the respective fair values of the investments and concluded
there was an impairment loss. Key management estimates utilized in the analyses were forecasted revenues, terminal growth rates, and discount rates.
How the Critical Audit Matter Was Addressed in the Audit
Our audit procedures related to discount rates, terminal growth rates, and forecasts of future revenues used to estimate the fair values of the
investments included the following, among others:
Evaluated the effectiveness of controls over management’s impairment evaluation of the investments, including those over the determination of the
investments’ fair value calculations. This included controls related to management’s selection of discount rates, terminal growth rates and forecasts
of future revenues.
Evaluated management’s ability to accurately forecast future revenues by comparing actual results to the historical forecasts made for the
investments.
REPORT OF INDEPENDENT REGISTERED PUBLIC ACCOUNTING FIRM
To the Shareholders and the Board of Directors of Magna International Inc.
We have also audited, in accordance with the standards of the Public Company Accounting Oversight Board (United States) (PCAOB), the Company’s
internal control over financial reporting as of December 31, 2019, based on criteria established in Internal Control – Integrated Framework (2013) issued
by the Committee of Sponsoring Organizations of the Treadway Commission and our report dated March 5, 2020, expressed an unqualified opinion on
the Company’s internal control over financial reporting.
We conducted our audits in accordance with the standards of the PCAOB. Those standards require that we plan and perform the audit to obtain
reasonable assurance about whether the financial statements are free of material misstatement, whether due to error or fraud. Our audits included
performing procedures to assess the risks of material misstatement of the financial statements, whether due to error or fraud, and performing
procedures that respond to those risks. Such procedures included examining, on a test basis, evidence regarding the amounts and disclosures in the
financial statements. Our audits also included evaluating the accounting principles used and significant estimates made by management, as well as
evaluating the overall presentation of the financial statements. We believe that our audits provide a reasonable basis for our opinion.
There were significant estimates and assumptions made by management to estimate the fair values of the investments. Performing audit procedures to
evaluate the reasonableness of management’s estimates and assumptions related to the selection of discount rates, terminal growth rates and
forecasts of future revenues required a high degree of auditor judgment and an increased extent of effort, including the need to involve fair value
specialists.
•
•
MAGNA INTERNATIONAL INC. 33

21FEB201423172215
Evaluated the reasonableness of management’s revenue forecasts by comparing the forecasts to:
· Forecasted information underlying the business plans of the equity method investments as well as industry reports
· External volume forecasts for the automotive industry
· Signed contracts, or letters of intent, where applicable
With the assistance of fair value specialists, evaluated the reasonableness of the (1) discount rates and (2) terminal growth rates, including testing the
source information underlying the determination of the discount rates and terminal growth rates, and developing a range of independent estimates
and comparing those to the discount rates and terminal growth rates selected by management.
•
•
Chartered Professional Accountants
Licensed Public Accountants
Toronto, Canada
March 5, 2020
We have served as the Company’s auditor since 2014.
34 ANNUAL REPORT 2019

21FEB201423172215
Opinion on Internal Control over Financial Reporting
We have audited the internal control over financial reporting of Magna International Inc. and subsidiaries (the ‘‘Company’’) as of December 31, 2019,
based on criteria established in Internal Control – Integrated Framework (2013) issued by the Committee of Sponsoring Organizations of the Treadway
Commission (COSO). In our opinion, the Company maintained, in all material respects, effective internal control over financial reporting as of
December 31, 2019, based on criteria established in Internal Control – Integrated Framework (2013) issued by COSO.
Basis for Opinion
The Company’s management is responsible for maintaining effective internal control over financial reporting and for its assessment of the effectiveness
of internal control over financial reporting, included in the accompanying Management’s Annual Report on Internal Control over Financial Reporting.
Our responsibility is to express an opinion on the Company’s internal control over financial reporting based on our audit. We are a public accounting
firm registered with the PCAOB and are required to be independent with respect to the Company in accordance with the U.S. federal securities laws
and the applicable rules and regulations of the Securities and Exchange Commission and the PCAOB.
Definition and Limitations of Internal Control over Financial Reporting
A company’s internal control over financial reporting is a process designed to provide reasonable assurance regarding the reliability of financial
reporting and the preparation of financial statements for external purposes in accordance with generally accepted accounting principles. A company’s
internal control over financial reporting includes those policies and procedures that (1) pertain to the maintenance of records that, in reasonable detail,
accurately and fairly reflect the transactions and dispositions of the assets of the company; (2) provide reasonable assurance that transactions are
recorded as necessary to permit preparation of financial statements in accordance with generally accepted accounting principles, and that receipts
and expenditures of the company are being made only in accordance with authorizations of management and directors of the company; and (3) provide
reasonable assurance regarding prevention or timely detection of unauthorized acquisition, use, or disposition of the company’s assets that could have
a material effect on the financial statements.
REPORT OF INDEPENDENT REGISTERED PUBLIC ACCOUNTING FIRM
To the Shareholders and the Board of Directors of Magna International Inc.
We have also audited, in accordance with the standards of the Public Company Accounting Oversight Board (United States) (PCAOB), the consolidated
financial statements as of and for the year ended December 31, 2019 of the Company and our report dated March 5, 2020, expressed an unqualified
opinion on those financial statements.
We conducted our audit in accordance with the standards of the PCAOB. Those standards require that we plan and perform the audit to obtain
reasonable assurance about whether effective internal control over financial reporting was maintained in all material respects. Our audit included
obtaining an understanding of internal control over financial reporting, assessing the risk that a material weakness exists, testing and evaluating the
design and operating effectiveness of internal control based on the assessed risk, and performing such other procedures as we considered necessary
in the circumstances. We believe that our audit provides a reasonable basis for our opinion.
Because of its inherent limitations, internal control over financial reporting may not prevent or detect misstatements. Also, projections of any evaluation
of effectiveness to future periods are subject to the risk that controls may become inadequate because of changes in conditions, or that the degree of
compliance with the policies or procedures may deteriorate.
Chartered Professional Accountants
Licensed Public Accountants
Toronto, Canada
March 5, 2020
MAGNA INTERNATIONAL INC. 35

See accompanying notes
[U.S. dollars in millions, except per share figures]
Years ended December 31, Note 2019 2018
Sales $ 39,431 $ 40,827
Costs and expenses
Cost of goods sold 34,022 35,055
Depreciation and amortization 1,345 1,278
Selling, general and administrative 1,697 1,664
Interest expense, net 17 82 93
Equity income (178) (277)
Other expense, net 4 240 63
Income from operations before income taxes 2,223 2,951
Income taxes 12 591 619
Net income 1,632 2,332
Loss (income) attributable to non-controlling interests 4 133 (36)
Net income attributable to Magna International Inc. $ 1,765 $ 2,296
Earnings per Common Share: 5
Basic $ 5.61 $ 6.65
Diluted $ 5.59 $ 6.61
Weighted average number of Common Shares outstanding during the year
[in millions]: 5
Basic 314.7 345.4
Diluted 315.8 347.5
36 ANNUAL REPORT 2019
MAGNA INTERNATIONAL INC.
CONSOLIDATED STATEMENTS OF INCOME

See accompanying notes
[U.S. dollars in millions]
Years ended December 31, Note 2019 2018
Net income $ 1,632 $ 2,332
Other comprehensive income (loss), net of tax: 22
Net unrealized loss on translation of net investment in foreign operations (25) (515)
Net unrealized gain (loss) on cash flow hedges 102 (106)
Reclassification of net loss (gain) on cash flow hedges to net income 4 (1)
Reclassification of net loss on pensions to net income 8 6
Pension and post-retirement benefits (47) (13)
Other comprehensive income (loss) 42 (629)
Comprehensive income 1,674 1,703
Comprehensive loss (income) attributable to non-controlling interests 140 (11)
Comprehensive income attributable to Magna International Inc. $ 1,814 $ 1,692
MAGNA INTERNATIONAL INC. 37
MAGNA INTERNATIONAL INC.
CONSOLIDATED STATEMENTS OF COMPREHENSIVE INCOME

18MAR202010394026 13MAR201805331951
[U.S. dollars in millions, except shares issued]
As at December 31, Note 2019 2018
ASSETSCurrent assetsCash and cash equivalents 6 $ 1,276 $ 684Accounts receivable 5,927 6,548Inventories 8 3,304 3,403Prepaid expenses and other 6, 17 238 193Income taxes receivable – 57Assets held for sale 3 – 949
10,745 11,834Investments 9 1,210 2,189Fixed assets, net 10 8,260 8,095Operating lease right-of-use assets 18 1,811 –Intangible assets, net 13 484 560Goodwill 7, 11 1,976 1,979Deferred tax assets 12 308 300Other assets 14, 19 996 988
$ 25,790 $ 25,945
LIABILITIES AND SHAREHOLDERS’ EQUITYCurrent liabilitiesShort-term borrowings 17 $ – $ 1,098Accounts payable 5,628 6,094Accrued salaries and wages 15 753 769Other accrued liabilities 16 1,800 1,734Income taxes payable 17 –Long-term debt due within one year 17 106 201Current portion of operating lease liabilities 18 225 –Liabilities held for sale 3 – 408
8,529 10,304Long-term debt 17 3,062 3,084Operating lease liabilities 18 1,601 –Long-term employee benefit liabilities 19 677 597Other long-term liabilities 20 371 400Deferred tax liabilities 12 419 401
14,659 14,786
Shareholders’ equityCommon Shares [issued: 2019 – 303,250,415; 2018 – 327,339,095] 21 3,198 3,380Contributed surplus 127 120Retained earnings 8,596 8,376Accumulated other comprehensive loss 22 (1,090) (1,175)
10,831 10,701Non-controlling interests 300 458
11,131 11,159
$ 25,790 $ 25,945
Commitments and contingencies [notes 17, 18, 23 and 24]
See accompanying notes
On behalf of the Board:
Robert F. MacLellan William L. YoungDirector Chairman of the Board
38 ANNUAL REPORT 2019
MAGNA INTERNATIONAL INC.CONSOLIDATED BALANCE SHEETS

See accompanying notes
[U.S. dollars in millions]
Years ended December 31, Note 2019 2018
OPERATING ACTIVITIES
Net income $ 1,632 $ 2,332
Items not involving current cash flows 6 1,976 1,539
3,608 3,871
Changes in operating assets and liabilities 6 352 (153)
Cash provided from operating activities 3,960 3,718
INVESTMENT ACTIVITIES
Fixed asset additions (1,441) (1,650)
Proceeds from sale of (investment in) Lyft, Inc. 4 231 (220)
Increase in investments, other assets and intangible assets (394) (481)
Proceeds from dispositions 185 223
Acquisitions 7 (147) (148)
Proceeds on sale of business 3 1,132 –
Cash used for investing activities (434) (2,276)
FINANCING ACTIVITIES
Issues of debt 17 47 172
(Decrease) increase in short-term borrowings (1,124) 866
Repayments of debt 17 (149) (171)
Issue of Common Share on exercise of stock options 44 50
Shares repurchased for tax withholdings on vesting of equity awards (9) (16)
Repurchase of Common Shares 21 (1,289) (1,831)
Contributions to subsidiaries by non-controlling interests 4 4
Dividends paid to non-controlling interests (22) (69)
Dividends paid (449) (448)
Cash used for financing activities (2,947) (1,443)
Effect of exchange rate changes on cash, cash equivalents and restricted cash equivalents 11 (36)
Net increase (decrease) in cash, cash equivalents and restricted cash equivalents during the year 590 (37)
Cash, cash equivalents and restricted cash equivalents beginning of year 802 839
Cash, cash equivalents and restricted cash equivalents, end of year 6 $ 1,392 $ 802
MAGNA INTERNATIONAL INC. 39
MAGNA INTERNATIONAL INC.
CONSOLIDATED STATEMENTS OF CASH FLOWS

See accompanying notes
Common Shares
Non-
[U.S. dollars in millions, except number Stated Contributed Retained controlling Total
of common shares] Number Value Surplus Earnings AOCL[i] Interests Equity
[in millions]
Balance, December 31, 2017 358.1 $ 3,617 $ 119 $ 8,077 $ (600) $ 502 $ 11,715
Net income 2,296 36 2,332
Other comprehensive loss (604) (25) (629)
Shares issued on exercise of stock options 1.3 60 (10) 50
Release of stock and stock units 0.6 30 (30) –
Shares repurchased for tax withholdings
on vesting of equity awards (0.3) (3) (13) (16)
Repurchase and cancellation under
normal course issuer bids [note 21] (32.6) (334) (1,526) 29 (1,831)
Stock-based compensation expense 41 41
Acquisition 10 10
Contribution by non-controlling interest 4 4
Dividends paid to non-controlling interests (69) (69)
Dividends paid [$1.32 per share] 0.2 10 (458) (448)
Balance, December 31, 2018 327.3 $ 3,380 $ 120 $ 8,376 $ (1,175) $ 458 $ 11,159
Adoption of ASU No. 2016-02 [note 2] (25) (25)
Balance, December 31, 2018, as adjusted 327.3 $ 3,380 $ 120 $ 8,351 $ (1,175) $ 458 $ 11,134
Net income 1,765 (133) 1,632
Other comprehensive income 49 (7) 42
Contribution by non-controlling interests 4 4
Sale of business [note 3] 8 8
Shares issued on exercise of stock options 1.2 53 (9) 44
Release of stock and stock units 0.3 20 (20) –
Shares repurchased for tax withholdings on
vesting of equity awards (0.1) (2) (7) (9)
Repurchase and cancellation under
normal course issuer bids [note 21] (25.8) (268) (1,049) 28 (1,289)
Stock-based compensation expense 36 36
Dividends paid to non-controlling interests (22) (22)
Dividends paid [$1.46 per share] 0.3 15 (464) (449)
Balance, December 31, 2019 303.2 $ 3,198 $ 127 $ 8,596 $ (1,090) $ 300 $ 11,131
[i] AOCL is Accumulated Other Comprehensive Loss.
40 ANNUAL REPORT 2019
MAGNA INTERNATIONAL INC.
CONSOLIDATED STATEMENTS OF CHANGES IN EQUITY

Principles of consolidation
Foreign currency translation
Cash and cash equivalents
Inventories
Investments
MAGNA INTERNATIONAL INC.
NOTES TO CONSOLIDATED FINANCIAL STATEMENTS
[All amounts in U.S. dollars and all tabular amounts in millions, except per share figures, unless otherwise noted]
1. SIGNIFICANT ACCOUNTING POLICIES
Magna International Inc. [collectively ‘‘Magna’’ or the ‘‘Company’’] is a global automotive supplier which has complete vehicle engineering and contract
manufacturing expertise, as well as product capabilities which include body, chassis, exterior, seating, powertrain, active driver assistance, electronics,
mirrors & lighting, mechatronics and roof systems. Magna also has electronic and software capabilities across many of these areas.
The consolidated financial statements have been prepared in U.S. dollars following accounting principles generally accepted in the United States
[‘‘GAAP’’].
The Consolidated Financial Statements include the accounts of Magna and its subsidiaries in which Magna has a controlling financial interest and is the
primary beneficiary. The Company presents non-controlling interests as a separate component within Shareholders’ equity in the Consolidated
Balance Sheets. All intercompany balances and transactions have been eliminated.
The Company operates globally, which gives rise to a risk that its earnings and cash flows may be adversely impacted by fluctuations in foreign
exchange rates.
Assets and liabilities of the Company’s operations having a functional currency other than the U.S. dollar are translated into U.S. dollars using the
exchange rate in effect at year end, and revenues and expenses are translated at the average rate during the year. Exchange gains or losses on
translation of the Company’s net investment in these operations are included in comprehensive income and are deferred in accumulated other
comprehensive loss. Foreign exchange gains or losses on debt that was designated as a hedge of the Company’s net investment in these operations
are also recorded in accumulated other comprehensive loss.
Foreign exchange gains and losses on transactions occurring in a currency other than an operation’s functional currency are reflected in income,
except for gains and losses on foreign exchange contracts used to hedge specific future commitments in foreign currencies and on intercompany
balances which are designated as long-term investments. In particular, the Company uses foreign exchange forward contracts for the sole purpose of
hedging certain of the Company’s future committed foreign currency based outflows and inflows. Most of the Company’s foreign exchange contracts
are subject to master netting arrangements that provide for the net settlement of contracts, by counterparty, in the event of default or termination. All
derivative instruments, including foreign exchange contracts, are recorded on the consolidated balance sheet at fair value. The fair values of derivatives
are recorded on a gross basis in prepaid expenses and other, other assets, other accrued liabilities or other long-term liabilities. To the extent that cash
flow hedges are effective, the change in their fair value is recorded in other comprehensive income; any ineffective portion is recorded in net income.
Amounts accumulated in other comprehensive loss are reclassified to net income in the period in which the hedged item affects net income.
If the Company’s foreign exchange forward contracts cease to be effective as hedges, for example if projected foreign cash inflows or outflows
declined significantly, gains or losses pertaining to the portion of the hedging transactions in excess of projected foreign currency denominated cash
flows would be recognized in income at the time this condition was identified.
Cash and cash equivalents include cash on account, demand deposits and short-term investments with remaining maturities of less than three months
at acquisition.
Production inventories and tooling inventories manufactured in-house are valued at the lower of cost determined substantially on a first-in, first-out
basis, or net realizable value. Cost includes the cost of materials plus direct labour applied to the product and the applicable share of manufacturing
overhead.
The Company accounts for investments in companies over which it has the ability to exercise significant influence, but does not hold a controlling
financial interest, under the equity method [‘‘Equity method investments’’]. The Company monitors its equity method investments for indicators of
other-than-temporary declines in value on an ongoing basis. If the Company determines that an other-than-temporary decline in value has occurred, it
recognizes an impairment loss, which is measured as the difference between the book value and the fair value of the investment. Fair value is generally
determined using an income approach based on discounted cash flows. The inputs utilized in the analyses are classified as Level 3 inputs within the fair
value hierarchy as defined in ASC 820, ‘‘Fair Value Measurement’’ and primarily consist of expected investee revenue and costs, estimated production
volumes and discount rates.
The Company also has investments in private and publicly traded technology companies over which it does not have the ability to exercise significant
influence. The Company has elected to use the measurement alternative, defined as cost, less impairments, adjusted by observable price changes to
MAGNA INTERNATIONAL INC. 41

Long-lived assets
Goodwill
Tooling and Pre-Production Engineering Costs Related to Long-Term Supply Agreements
Warranty
Income taxes
measure the private equity investments. The Company values its investments in publicly traded equity securities using the closing price on the
measurement date, as reported on the stock exchange on which the securities are traded.
Private equity investments are subject to impairment reviews conducted on a quarterly basis. The Company’s impairment analysis considers both
qualitative and quantitative factors that may have a significant impact on the investee’s fair value. Upon determining that an impairment may exist, the
security’s fair value is calculated and compared to its carrying value. An impairment is recognized immediately if the carrying value exceeds the
fair value.
Fixed assets are recorded at historical cost. Depreciation is provided on a straight-line basis over the estimated useful lives of fixed assets at annual
rates of 21⁄2% to 5% for buildings, 7% to 10% for general purpose equipment and 10% to 33% for special purpose equipment.
Finite-lived intangible assets, which have arisen principally through acquisitions, include customer relationship intangibles and patents and licences.
These finite-lived intangible assets are amortized on a straight-line basis over their estimated useful lives which range from 4 to 15 years.
The Company assesses fixed and finite-lived intangible assets for recoverability whenever indicators of impairment exist. If the carrying value of the
asset exceeds the estimated undiscounted cash flows from the use of the asset, then an impairment loss is recognized to write the asset down to fair
value. The fair value of fixed and finite-lived intangible assets is generally determined using estimated discounted future cash flows.
Goodwill represents the excess of the cost of an acquired enterprise over the fair value of the identifiable assets acquired and liabilities assumed less
any subsequent write-downs for impairment. Goodwill is reviewed for impairment in the fourth quarter of each year, or more frequently if indicators of
potential impairment exist. Goodwill impairment is assessed based on a comparison of the fair value of a reporting unit to the underlying carrying value
of the reporting unit’s net assets, including goodwill. When the carrying amount of the reporting unit exceeds its fair value, an impairment is recognized
based on that difference. The fair value of a reporting unit is determined using its estimated discounted future cash flows.
The Company incurs pre-production engineering and tooling costs related to the products produced for its customers under long-term supply
agreements. Customer reimbursements for tooling and pre-production engineering activities that are part of a long-term supply arrangement are
accounted for as a reduction of cost. Pre-production costs related to long-term supply arrangements with a contractual guarantee for reimbursement
are included in the Company’s Other assets.
The Company expenses all pre-production engineering costs for which reimbursement is not contractually guaranteed by the customer. All tooling
costs related to customer-owned tools for which reimbursement is not contractually guaranteed by the customer or for which the Company does not
have a non-cancelable right to use the tooling are also expensed.
The Company has assurance warranties and records product warranty liabilities based on its individual customer agreements. Under most customer
agreements, the Company only accounts for existing or probable claims on product default issues when amounts related to such issues are probable
and reasonably estimable. However, for certain complete vehicle assembly, powertrain systems and electronics contracts, the Company records an
estimate of future warranty-related costs based on the terms of the specific customer agreements and/or the Company’s warranty experience. Product
liability and recall provisions are established based on the Company’s best estimate of the amounts necessary to settle existing claims which typically
take into account: the number of units that may be returned; the cost of the product being replaced; labour to remove and replace the defective part;
and the customer’s administrative costs relating to the recall. Judgement is also required as to the ultimate negotiated sharing of the cost between the
Company, the customer and, in some cases, a supplier to the Company.
When a decision to recall a product has been made or is probable, the Company’s portion of the estimated cost of the recall is recorded as a charge to
income in that period. The Company monitors warranty activity on an ongoing basis and adjusts reserve balances when it is probable that future
warranty costs will be different than those previously estimated.
The Company uses the liability method of tax allocation to account for income taxes. Under the liability method of tax allocation, deferred tax assets
and liabilities are determined based on differences between the financial reporting and tax bases of assets and liabilities and are measured using the
enacted tax rates and laws that will be in effect when the differences are expected to reverse.
No deferred tax liability is recorded for taxes on undistributed earnings and translation adjustments of foreign subsidiaries if these items are either
considered to be reinvested for the foreseeable future or if they are available for repatriation and are not subject to further tax on remittance. Taxes are
recorded on such foreign undistributed earnings and translation adjustments when it becomes apparent that such earnings will be distributed in the
foreseeable future and the Company will incur further tax on remittance.
Recognition of uncertain tax positions is dependent on whether it is more-likely-than-not that a tax position taken or expected to be taken in a tax return
will be sustained upon examination, including resolution of any related appeals or litigation processes, based on the technical merits of the position. A
42 ANNUAL REPORT 2019

Leases
Employee future benefit plans
Revenue recognition
tax position that meets the more-likely-than-not recognition threshold is measured at the largest amount of tax benefit that is greater than 50% likely of
being realized upon ultimate settlement. The Company recognizes interest and penalties related to uncertain tax positions in income tax expense.
The Company determines if an arrangement is a lease or contains a lease at inception. Leases with an initial term of 12 months or less are considered
short-term and are not recorded on the balance sheet. The Company recognizes operating lease expense for these leases on a straight-line basis over
the lease term.
Operating lease right-of-use [‘‘ROU’’] assets and operating lease liabilities are recognized based on the present value of the future lease payments over
the lease term at the commencement date. As the rate implicit in the lease is not readily determinable for the Company’s operating leases, an
incremental borrowing rate is generally used to determine the present value of future lease payments. The incremental borrowing rate for each lease is
based on the Company’s estimated borrowing rate over a similar term to that of the lease payments, adjusted for various factors including
collateralization, location and currency.
A majority of the Company’s leases for manufacturing facilities are subject to variable lease-related payments, such as escalation clauses based on
consumer price index rates or other similar indices. Variable payments that are based on an index or a rate are included in the recognition of the
Company’s ROU assets and lease liabilities using the index or rate at lease commencement. Subsequent changes to these lease payments due to rate
or index updates are recorded as lease expense in the period incurred.
The Company’s lease agreements generally exclude non-lease components. As a result, non-lease components are accounted for separately for all
classes of assets and expensed as incurred. In addition, the Company’s lease agreements do not contain any material residual value guarantees or
material restrictive covenants.
The cost of providing benefits through defined benefit pensions, lump sum termination and long service payment arrangements, and post-retirement
benefits other than pensions is actuarially determined and recognized in income using the projected benefit method pro-rated on service and
management’s best estimate of expected plan investment performance, salary escalation, retirement ages of employees and, with respect to medical
benefits, expected health care costs. Differences arising from plan amendments, changes in assumptions and experience gains and losses that are
greater than 10% of the greater of: [i] the accrued benefit obligation at the beginning of the year; and [ii] the fair value [or market related value] of plan
assets at the beginning of the year, are recognized in income over the expected average remaining service life of employees. Gains related to plan
curtailments are recognized when the event giving rise to the curtailment has occurred. Plan assets are valued at fair value. The cost of providing
benefits through defined contribution pension plans is charged to income in the period in respect of which contributions become payable.
The funded status of the plans is measured as the difference between the plan assets at fair value and the projected benefit obligation [‘‘PBO’’]. The
aggregate of all overfunded plans is recorded in other assets, and the aggregate of all underfunded plans in long-term employee benefit liabilities. The
portion of the amount by which the actuarial present value of benefits included in the PBO exceeds the fair value of plan assets, payable in the next
twelve months, is reflected in other accrued liabilities.
The Company enters into contracts with its customers to provide production parts or assembled vehicles. Contracts do not commit the customer to a
specified quantity of products; however, the Company is generally required to fulfill its customers’ purchasing requirements for the production life of the
vehicle. Contracts do not typically become a performance obligation until the Company receives either a purchase order and/or a customer release for
a specific number of parts or assembled vehicles at a specified price. While long-term supply agreements may range from five to seven years, contracts
may be terminated by customers at any time. Historically, terminations have been minimal. Contracts may also provide for annual price reductions over
the production life of the vehicle, and prices are adjusted on an ongoing basis to reflect changes in product content/cost and other commercial factors.
Revenue is recognized at a point in time when control of the parts produced or assembled vehicles are transferred to the customer according to the
terms of the contract. The amount of revenue recognized reflects the consideration that the Company expects to be entitled to in exchange for those
products based on purchase orders, annual price reductions and ongoing price adjustments [some of which is accounted for as variable
consideration]. The Company uses the expected value method, taking into account historical data and the status of current negotiations, to estimate
the amount to which it expects to be entitled. Significant changes to the Company’s estimates of variable consideration are not expected.
The Company’s complete vehicle assembly contracts with customers are complex and often include promises to transfer multiple products and
services to a customer, some of which may be implicitly contracted for. For these complex arrangements, each good or service is evaluated to
determine whether it represents a distinct performance obligation, and whether it should be characterized as revenue or reimbursement of costs
incurred. The total transaction price is then allocated to the distinct performance obligations based on the expected cost or cost plus a margin
approach and recognized as revenue as discussed above.
The Company also performs tooling and engineering activities for its customers that are not part of a long-term production arrangement. Tooling and
engineering revenue are recognized at a point in time or over time depending, among other considerations, on whether the Company has an
enforceable right to payment plus a reasonable profit, for performance completed to date. Over-time recognition utilizes costs incurred to date relative
to total estimated costs at completion, to measure progress toward satisfying performance obligations. Revenue is recognized as control is transferred
MAGNA INTERNATIONAL INC. 43

Contract Assets and Liabilities
Government assistance
Research and development
Earnings per Common Share
Use of estimates
to customers, in an amount that reflects the consideration the Company expects to be entitled to in exchange for those goods and services. Total
tooling and engineering sales were $749.1 million [2018 – $824.6 million] for the year ended December 31, 2019.
The Company’s customers pay for products received in accordance with payment terms that are customary in the industry, typically 30 to 90 days. The
Company’s contracts with its customers do not have significant financing components.
Amounts billed to customers related to shipping and handling costs are included in Sales in the Consolidated Statements of Income. Shipping and
handling costs are accounted for as fulfillment costs and are included in Cost of goods sold in the Consolidated Statements of Income.
Taxes assessed by a governmental authority that are both imposed on, and concurrent with, a specific revenue-producing transaction that are
collected by the Company from a customer are excluded from revenue.
The Company does not disclose the value of unsatisfied performance obligations for [i] contracts with an original expected length of one year or less,
and [ii] contracts for which it recognizes revenue at the amount to which it has the right to invoice for services performed.
The Company’s contract assets include both billed and unbilled accounts receivable and are included in the Accounts Receivable balance. Unbilled
amounts typically result from sales of standalone tooling and engineering activities where revenue recognized exceeds the amount billed to the
customer. Amounts may not exceed their net realizable value. As at December 31, 2019, the Company’s unbilled accounts receivable balance was
$318 million [2018 – $293 million]. Accounts receivable related to production, tooling and engineering sales were $4.5 billion as of December 31, 2019
[2018 – $4.3 billion]. Contract assets do not include the costs of obtaining or fulfilling a contract with a customer, as these amounts are generally
expensed as incurred.
Customer advances are recorded as deferred revenue [a contract liability]. For the years ended December 31, 2019 and 2018, the contract liability
balances were $199 million and $176 million, respectively. During the year ended December 31, 2019, the Company recognized $91 million of
previously recorded contract liabilities into revenue as performance obligations were satisfied. There were no significant amounts included in contract
liabilities recognized in revenue during the year ended December 31, 2018.
The Company makes periodic applications for financial assistance under available government assistance programs in the various jurisdictions that the
Company operates. Grants relating to capital expenditures are reflected as a reduction of the cost of the related assets. Grants relating to current
operating expenditures are generally recorded as a reduction of the related expense at the time the eligible expenses are incurred. The Company also
receives tax credits and tax super allowances, the benefits of which are recorded as a reduction of income tax expense. In addition, the Company
receives loans which are recorded as liabilities in amounts equal to the cash received. When a government loan is issued to the Company at a below-
market rate of interest, the loan is initially recorded at its net present value, and accreted to its face value over the period of the loan. The benefit of the
below-market rate of interest is accounted for like a government grant. It is measured as the difference between the initial carrying value of the loan and
the cash proceeds received.
Costs incurred in connection with research and development activities, to the extent not recoverable from the Company’s customers, are charged to
expense as incurred. For the years ended December 31, 2019 and 2018, research and development costs charged to expense were approximately
$640 million and $588 million, respectively.
Basic earnings per Common Share are calculated on net income attributable to Magna International Inc. using the weighted average number of
Common Shares outstanding during the year.
Diluted earnings per Common Share are calculated on the weighted average number of Common Shares outstanding, including an adjustment for
stock options outstanding using the treasury stock method.
Common Shares that have not been released under the Company’s restricted stock plan or are being held in trust for purposes of the Company’s
restricted stock unit program have been excluded from the calculation of basic earnings per share but have been included in the calculation of diluted
earnings per share.
The preparation of the consolidated financial statements in conformity with GAAP requires management to make estimates and assumptions that
affect the amounts reported and disclosed in the consolidated financial statements and accompanying notes. Actual results could differ from those
estimates.
Certain amounts in the prior period comparatives have been reclassified to conform with current period presentation.
44 ANNUAL REPORT 2019

ACCOUNTING CHANGES
Leases
2. ACCOUNTING STANDARDS
In February 2016, the FASB issued ASU No. 2016-02, ‘‘Leases: Topic 842 (ASU 2016-02)’’, to supersede nearly all existing lease guidance under GAAP.
The Company adopted the standard on January 1, 2019 using a modified retrospective transition approach, without restatement of the comparative
period’s financial information, as permitted by the transition guidance. The adoption of the new standard resulted in a cumulative-effect adjustment to
retained earnings of $25 million. The Company elected certain practical expedients including not to reassess whether any expired or existing contract is
or contains a lease, the lease classification of any expired or existing lease, and not to reassess any initial direct costs for any existing leases. In
addition, the Company elected to use the hindsight, practical expedient.
The most significant impact on the Consolidated Financial Statements was the recognition of ROU assets and lease liabilities for operating leases,
while the accounting for finance leases remained substantially unchanged. On January 1, 2019, the Company recognized operating lease liabilities of
$1.8 billion and ROU assets of $1.8 billion based on the present value of the remaining lease payments over the lease term. The adoption of the new
standard did not have a material impact on the Company’s results of operations or cash flows.
3. SALE OF BUSINESS
On March 29, 2019, the Company completed the sale of its global Fluid Pressure & Controls [‘‘FP&C’’] business to Hanon Systems for total
consideration of $1.23 billion. The business was included in the Company’s Power & Vision segment and did not meet the criteria to be classified as a
discontinued operation.
The following table summarizes the carrying value of the major classes of assets and liabilities of the FP&C business which were reflected as held for
sale in the consolidated balance sheets at December 31, 2018:
December 31,
2018
Accounts receivable $ 258
Inventories 140
Prepaid expenses and other 4
Investments 4
Fixed assets, net 320
Goodwill 157
Deferred tax assets 17
Other assets 11
Intangibles 38
Assets held for sale $ 949
Accounts payable $ 226
Accrued salaries and wages 30
Other accrued liabilities 76
Income taxes payable 6
Long-term employee benefit liabilities 62
Other long-term liabilities 3
Deferred tax liabilities 5
Liabilities held for sale $ 408
During 2019, the Company recognized a gain on the sale within other expense, net as follows:
Proceeds on disposal, net of transaction costs $ 1,180
Net assets disposed 656
Gain included in other expense, net [note 4] 524
Income taxes 77
Gain on divestiture, net of tax $ 447
MAGNA INTERNATIONAL INC. 45

[a] Impairment of assets
[b] Restructuring
[c] Net losses (gains) on investments
4. OTHER EXPENSE, NET
Other expense, net consists of significant items such as: impairment charges; restructuring charges generally related to significant plant closures or
consolidations; net losses (gains) on investments; gains or losses on disposal of facilities or businesses; and other items not reflective of on-going
operating profit or loss. Other expense, net consists of:
2019 2018
Impairment of assets [a] $ 727 $ 74
Restructuring [b] 31 45
Net losses (gains) on investments [c] 6 (56)
Gain on sale of business [note 3] (524) –
Other expense, net $ 240 $ 63
During 2019, the Company concluded that indicators of impairment were present within the Power & Vision segment related to its equity-
accounted investments in Getrag (Jiangxi) Transmission Co., Ltd. and Dongfeng Getrag Transmission Co. Ltd. in China, which make both manual
transmissions and dual-clutch transmissions [‘‘DCTs’’], and its equity-accounted investment Getrag Ford Transmission GmbH [‘‘GFT’’] in Europe
which makes manual transmissions. The conclusion was based on lower than expected sales, increased pricing pressure in the China market,
declines in volume projections for the foreseeable future for manual transmissions and DCTs in China and manual transmissions in Europe, and
in-sourcing of transmissions by certain Chinese OEMs. Accordingly, the Company deemed there to be an other-than-temporary decline, and
undertook an impairment analysis to determine the fair value of the investments utilizing discounted cash flows to derive fair values. Based on the
analyses, the carrying value of the Company’s investments exceeded fair value by $700 million. Including the $36 million impact of income taxes
and the $127 million attributable to non-controlling interest, the non-cash impairment charge included in net income attributable to the Company
was $537 million.
For the year ended December 31, 2019, the Company also recorded asset impairment charges of $27 million [$20 million after tax] in its Electronics
operations which are included in the Company’s Power & Vision segment.
During 2018, the Company concluded that indicators of impairment were present related to its investment in GFT and undertook an impairment
analysis to determine the fair value of the investment. Based on the difference between the fair value and the carrying value of the investment in
GFT, the Company recorded an other-than-temporary impairment charge of $60 million [$59 million after tax].
For the year ended December 31, 2018, the Company also recorded fixed asset impairment charges of $14 million [$12 million after tax] related to a
certain Body Exteriors & Structures facility.
During 2019, the Company recorded net restructuring charges of $31 million [$31 million after tax] for its Body Exteriors & Structures operations.
During 2018, the Company recorded net restructuring charges of $20 million, and $25 million [$20 million and $23 million after tax], respectively, for
its Power & Vision and Body Exteriors & Structures operations.
During 2019, the Company recorded net losses of $6 million [$5 million after tax]. This includes net unrealized gains of $17 million [$15 million after
tax] related to the revaluation of its private equity investments and net losses of $23 million [$20 million after tax] related to its investment in Lyft, Inc.
[‘‘Lyft’’].
Also, during 2019, the Company sold 5.4 million shares of its publicly traded equity securities in Lyft for proceeds of $231 million.
During 2018, the Company recorded an unrealized gain of $56 million [$53 million after tax] on the revaluation of its private equity investments of
which $46 million [$46 million after tax] related to its investment in Lyft.
46 ANNUAL REPORT 2019

[a] Diluted earnings per Common Share exclude 4.0 million [2018 – 0.8 million] Common Shares issuable under the Company’s Incentive Stock Option
Plan because these options were not ‘‘in-the-money’’. The dilutive effect of participating securities using the two-class method was excluded from
the calculation of earnings per share because the effect would be immaterial.
[a] Cash, cash equivalents and restricted cash equivalents consist of:
[b] Items not involving current cash flows:
5. EARNINGS PER SHARE
Earnings per share are computed as follows:
2019 2018
Basic earnings per Common Share:
Net income attributable to Magna International Inc. $ 1,765 $ 2,296
Weighted average number of Common Shares outstanding during the year 314.7 345.4
Basic earnings per Common Share $ 5.61 $ 6.65
Diluted earnings per Common Share:
Net income attributable to Magna International Inc. $ 1,765 $ 2,296
Weighted average number of Common Shares outstanding during the year 314.7 345.4
Adjustments:
Stock options and restricted stock [a] 1.1 2.1
315.8 347.5
Diluted earnings per Common Share $ 5.59 $ 6.61
6. DETAILS OF CASH FROM OPERATING ACTIVITIES
2019 2018
Bank term deposits and bankers’ acceptances $ 724 $ 314
Cash 552 370
Cash and cash equivalents $ 1,276 $ 684
Restricted cash equivalents included in prepaid expenses [note 17] 116 118
$ 1,392 $ 802
2019 2018
Depreciation and amortization $ 1,345 $ 1,278
Amortization of other assets included in cost of goods sold 257 172
Impairment charges [note 4] 727 74
Other non-cash charges 89 7
Deferred income taxes [note 12] 7 31
Dividends received in excess of equity income 69 33
Non-cash portion of Other expense, net [note 4] (518) (56)
$ 1,976 $ 1,539
MAGNA INTERNATIONAL INC. 47

[c] Changes in operating assets and liabilities:
2019 2018
Accounts receivable $ 629 $ (351)
Inventories 104 (92)
Prepaid expenses and other (21) 9
Accounts payable (519) 265
Accrued salaries and wages (34) (3)
Other accrued liabilities 97 105
Income taxes payable 96 (86)
$ 352 $ (153)
7. BUSINESS ACQUISITIONS
Acquisition in the year ended December 31, 2019
On April 29, 2019, the Company’s Seating Systems segment completed the acquisition of 100% of the equity interest in VIZA GECA, S.L. [‘‘VIZA’’], a
Spain-based supplier of seat structures and related systems. The purchase price was $99 million [net of $13 million cash acquired] and is subject to
customary purchase price adjustments, and was accounted for as a business combination.
Adjustments were recorded in the fourth quarter of 2019 for changes in the estimated values of fixed assets, intangible assets, other assets, and
deferred tax liabilities from the amounts disclosed as of June 30, 2019. The preliminary purchase price allocations may be subsequently adjusted to
reflect final valuation results and other adjustments.
Acquisition in the year ended December 31, 2018
On October 31, 2018, the Company’s Power & Vision segment completed the acquisition of 100% of the equity interest in OLSA S.p.A. [‘‘OLSA’’], a
global company which designs, engineers and manufactures tail lamps and other lighting products. The purchase price was $152 million [net of
$17 million cash acquired] and was accounted for as a business combination.
In the fourth quarter of 2019, the Company finalized the purchase price and amounts recognized for the assets acquired and liabilities assumed.
The following table summarizes the net amounts recognized for assets acquired and liabilities assumed for these and other small acquisitions at their
estimated fair values:
Adjustments Allocation at
to 2018 2019 December 31,
acquisitions Acquisitions 2019
Cash $ – $ 13 $ 13
Non-cash working capital 2 10 12
Fixed assets – 113 113
Goodwill (10) 22 12
Other assets – 1 1
Intangibles – 12 12
Deferred tax assets – 2 2
Long-term debt – (8) (8)
Other long-term liabilities – (1) (1)
Deferred tax liabilities 8 (4) 4
Consideration paid – 160 160
Less: Cash acquired – (13) (13)
Net cash outflow $ – $ 147 $ 147
The adjustments were not significant for any period presented after the acquisition dates.
Recognized goodwill is attributable to the assembled workforce, expected synergies and other intangible assets that do not qualify for separate
recognition. Intangible assets consist primarily of amounts recognized for the fair value of customer contracts and are being amortized on a straight-line
basis over an eight to ten-year estimated useful life.
48 ANNUAL REPORT 2019

These entities have been included in our consolidated results of operations since their respective acquisition dates. Full year pro forma results of
operations have not been presented because the effects of these acquisitions, individually and in aggregate, were not material to the Company’s
consolidated results of operations.
8. INVENTORIES
Inventories consist of:
2019 2018
Raw materials and supplies $ 1,201 $ 1,282
Work-in-process 339 331
Finished goods 425 408
Tooling and engineering 1,339 1,382
$ 3,304 $ 3,403
Tooling and engineering inventory represents costs incurred on tooling and engineering services contracts in excess of billed and unbilled amounts
included in accounts receivable.
9. INVESTMENTS
2019 2018
Equity method investments [a] $ 1,107 $ 1,862
Private equity investments 95 323
Other 8 4
$ 1,210 $ 2,189
[a] The ownership percentages and carrying values of the Company’s principal equity method investments at December 31 were as follows [in millions,
except percentages]:
2019 2018
Litens Automotive Partnership [i] 76.7% $ 212 $ 188
Getrag (Jiangxi) Transmission Co., Ltd [i] 66.7% $ 540 $ 1,107
Getrag Ford Transmission GmbH 50.0% $ 100 $ 268
Dongfeng Getrag Transmission Co. Ltd [‘‘DGT’’] [ii] 50.0% $ 47 $ 72
Hubei HAPM MAGNA Seating Systems Co., Ltd. 49.9% $ 113 $ 117
[i] The Company accounts for its investments under the equity method of accounting as a result of significant participating rights that prevent
control.
[ii] DGT is a variable interest entity [‘‘VIE’’] and depends on the Company and the Dongfeng Motor Group Company for any additional cash needs.
The Company cannot make key operating decisions considered to be most significant to the VIE, and is therefore not considered to be the
primary beneficiary. The Company’s known maximum exposure to loss approximated the carrying value of our investment balance as at
December 31, 2019.
MAGNA INTERNATIONAL INC. 49

A summary of the total financial results, as reported by the Company’s equity method investees, in the aggregate, at December 31 was as follows:
Summarized Balance Sheets
2019 2018
Current assets $ 1,680 $ 1,914
Non-current assets $ 3,573 $ 3,870
Current liabilities $ 1,266 $ 1,500
Long-term liabilities $ 994 $ 1,131
Summarized Income Statements
2019 2018
Sales $ 4,142 $ 5,133
Cost of goods sold & expenses 3,949 4,765
Net income $ 193 $ 368
Sales to equity method investees were approximately $113 million and $379 million for the years ended December 31, 2019 and 2018, respectively.
10. FIXED ASSETS
Fixed assets consist of:
2019 2018
Cost
Land $ 219 $ 229
Buildings 2,413 2,205
Machinery and equipment 15,368 14,396
18,000 16,830
Accumulated depreciation
Buildings (945) (810)
Machinery and equipment (8,795) (7,925)
$ 8,260 $ 8,095
Included in the cost of fixed assets are construction in progress expenditures of $0.9 billion [2018 – $1.0 billion] that have not been depreciated.
50 ANNUAL REPORT 2019

11. GOODWILL
The following is a continuity of the Company’s goodwill by segment:
Body
Exteriors & Power & Seating Complete
Structures Vision Systems Vehicles Total
Balance, December 31, 2017 $ 463 $ 1,365 $ 153 $ 118 $ 2,099
Acquisitions 16 109 – – 125
Assets held for sale – (157) – – (157)
Foreign exchange and other (20) (57) (6) (5) (88)
Balance, December 31, 2018 459 1,260 147 113 1,979
Acquisitions [note 7] – (9) 21 – 12
Foreign exchange and other (1) (13) 1 (2) (15)
Balance, December 31, 2019 $ 458 $ 1,238 $ 169 $ 111 $ 1,976
12. INCOME TAXES
[a] The provision for income taxes differs from the expense that would be obtained by applying the Canadian statutory income tax rate as a result of
the following:
2019 2018
Canadian statutory income tax rate 26.5% 26.5%
Impairment of investments [note 4] 8.2 0.6
Tax on repatriation of foreign earnings 1.9 2.7
Net effect of losses not benefited 0.8 0.4
Foreign rate differentials (3.3) (2.9)
Non-taxable capital gains[i] (2.5) (0.4)
Research and development tax credits (2.4) (1.7)
Earnings of equity accounted investees (1.3) (1.6)
Reserve for uncertain tax positions (0.5) (1.5)
Manufacturing and processing profits deduction (0.4) (0.3)
Valuation allowance on deferred tax assets[ii] – (1.8)
US tax reform[iii] – 0.4
Others (0.4) 0.6
Effective income tax rate 26.6% 21.0%
[i] During the year ended December 31, 2019, the Company had non-taxable capital gains mainly related to the sale of the FP&C business [note 3].
[ii] GAAP requires that the Company assess whether valuation allowances should be established or maintained against its deferred tax assets,
based on consideration of all available evidence, using a ‘‘more-likely-than-not’’ standard. The factors the Company uses to assess the
likelihood of realization are its history of losses, forecasts of future pre-tax income and tax planning strategies that could be implemented to
realize the deferred tax assets.
During the year ended December 31, 2018, the Company released certain of its valuation allowance against deferred tax assets on its Canadian
capital losses as a result of the anticipated capital gain from the sale of the FP&C business [note 3]. Additionally, the Company released the
valuation allowance set up against deferred tax assets in India. The net effect of these valuation allowance releases was $52 million.
[iii] On December 22, 2017, the United States enacted the Tax Cuts and Jobs Act [the ‘‘US Tax Reform’’]. At December 31, 2017, in accordance
with guidance provided by Securities and Exchange Commission Staff Accounting Bulletin No. 118 [‘‘SAB 118’’], the Company made a
reasonable estimate of its effects and recognized a provisional $23 million net reduction in income tax expense. In the fourth quarter of 2018,
the Company completed its analysis of the tax impact and recorded a net increase of $11 million in income tax expense.
MAGNA INTERNATIONAL INC. 51

[b] The details of income before income taxes by jurisdiction are as follows:
[c] The details of the income tax provision are as follows:
[d] Deferred income taxes have been provided on temporary differences, which consist of the following:
2019 2018
Canadian $ 583 $ 631
Foreign 1,640 2,320
$ 2,223 $ 2,951
2019 2018
Current
Canadian $ 117 $ 125
Foreign 467 466
584 591
Deferred
Canadian 3 24
Foreign 4 4
7 28
$ 591 $ 619
2019 2018
Tax depreciation in excess of book depreciation $ 7 $ 32
Book amortization (in excess of) less than tax amortization 43 (1)
Liabilities currently not deductible for tax (43) –
Net tax losses benefited 29 (9)
Change in valuation allowance on deferred tax assets 1 (52)
Tax on undistributed foreign earnings 1 34
US tax reform – 16
Others (31) 8
$ 7 $ 28
52 ANNUAL REPORT 2019

[e] Deferred tax assets and liabilities consist of the following temporary differences:
[f] The Company has provided for deferred income taxes for the estimated tax cost of distributable earnings of its subsidiaries. Deferred income taxes
have not been provided on approximately $5.73 billion of undistributed earnings of certain foreign subsidiaries, as the Company has concluded that
such earnings should not give rise to additional tax liabilities upon repatriation or are indefinitely reinvested. A determination of the amount of the
unrecognized tax liability relating to the remittance of such undistributed earnings is not practicable.
[g] Income taxes paid in cash [net of refunds] were $484 million for the year ended December 31, 2019 [2018 – $665 million].
[h] As of December 31, 2019, the Company had domestic and foreign operating loss carryforwards of $2.43 billion and tax credit carryforwards of
$70 million. Approximately $1.67 billion of the operating losses can be carried forward indefinitely. The remaining operating losses and tax credit
carryforwards expire between 2020 and 2039.
2019 2018
Assets
Tax benefit of loss carryforwards $ 622 $ 660
Operating lease liabilities 452 –
Liabilities currently not deductible for tax 234 150
Tax credit carryforwards 70 57
Unrealized loss on foreign exchange hedges and retirement liabilities 69 106
Others 41 12
1,488 985
Valuation allowance against tax benefit of loss carryforwards (515) (506)
Other valuation allowance (170) (152)
$ 803 $ 327
Liabilities
Operating lease right-of-use assets 447 –
Tax depreciation in excess of book depreciation 242 220
Tax on undistributed foreign earnings 137 141
Other assets book value in excess of tax values 66 50
Unrealized gain on foreign exchange hedges and retirement liabilities 18 8
Unrealized gain on remeasurement of investments 4 9
914 428
Net deferred tax liabilities $ (111) $ (101)
The net deferred tax liabilities are presented on the consolidated balance sheet in the following categories:
2019 2018
Long-term deferred tax assets $ 308 $ 300
Long-term deferred tax liabilities (419) (401)
$ (111) $ (101)
MAGNA INTERNATIONAL INC. 53

[i] As at December 31, 2019 and 2018, the Company’s gross unrecognized tax benefits were $192 million and $198 million, respectively [excluding
interest and penalties], of which $174 million and $183 million, respectively, if recognized, would affect the Company’s effective tax rate. The gross
unrecognized tax benefits differ from the amount that would affect the Company’s effective tax rate due primarily to the impact of the valuation
allowance on deferred tax assets. A summary of the changes in gross unrecognized tax benefits is as follows:
2019 2018
Balance, beginning of year $ 198 $ 243
Increase based on tax positions related to current year 21 20
Decrease based on tax positions of prior years (2) (3)
Increase related to acquisitions 3 8
Settlements (4) (13)
Statute expirations (21) (50)
Foreign currency translation (3) (7)
$ 192 $ 198
The Company recognizes interest and penalties with respect to unrecognized tax benefits as income tax expense. As at December 31, 2019 and
2018, the Company had recorded interest and penalties on the unrecognized tax benefits of $46 million and $39 million, respectively, which reflects
an increase in expenses related to changes in its reserves for interest and penalties of $7 million in 2019 and a decrease of $6 million in expenses
related to changes in its reserves for interest and penalties in 2018.
The Company operates in multiple jurisdictions, and its tax returns are periodically audited or subject to review by both domestic and foreign tax
authorities. During the next twelve months, it is reasonably possible that, as a result of audit settlements, the conclusion of current examinations
and the expiration of the statute of limitations in several jurisdictions, the Company may decrease the amount of its gross unrecognized tax benefits
[including interest and penalties] by approximately $32 million, of which $24 million, if recognized, would affect its effective tax rate.
The Company considers its significant tax jurisdictions to include Canada, the United States, Austria, Germany and Mexico. With few exceptions,
the Company remains subject to income tax examination in Germany for years after 2007, Mexico for years after 2013, Canada for years after 2014,
U.S. federal jurisdiction for years after 2015, and in Austria for years after 2015.
13. INTANGIBLE ASSETS
Intangible assets were as follows:
Estimated weighted
average useful
life in years 2019 2018
Cost
Customer relationship intangibles [note 7] 9 $ 429 $ 415
Computer software 1 396 291
Patent and licenses 11 264 340
1,089 1,046
Accumulated depreciation
Customer relationship intangibles [note 7] (216) (191)
Computer software (310) (219)
Patent and licenses (79) (76)
$ 484 $ 560
The Company recorded approximately $93 million and $84 million of amortization expense related to finite-lived intangible assets for the years ended
December 31, 2019 and 2018, respectively. The Company currently estimates annual amortization expense to be $85 million for 2020, $66 million for
2021, $53 million for 2022, $47 million for 2023 and $43 million for 2024.
54 ANNUAL REPORT 2019

Short-term borrowings
[a] Credit Facilities
[b] Commercial Paper Program
14. OTHER ASSETS
Other assets consist of:
2019 2018
Preproduction costs related to long-term supply agreements $ 683 $ 741
Long-term receivables 217 198
Pension overfunded status [note 19[a]] 22 18
Unrealized gain on cash flow hedges [note 23] 24 9
Other, net 50 22
$ 996 $ 988
15. EMPLOYEE EQUITY AND PROFIT PARTICIPATION PROGRAM
During the year ended December 31, 2019, a trust which exists to make orderly purchases of the Company’s shares for employees for transfer to the
Employee Equity and Profit Participation Program [‘‘EEPPP’’], borrowed up to $37 million [2018 – $34 million] from the Company to facilitate the
purchase of Common Shares. At December 31, 2019, the trust’s indebtedness to Magna was $37 million [2018 – $34 million]. The Company nets the
receivable from the trust with the Company’s accrued EEPPP payable in accrued wages and salaries.
16. WARRANTY
The following is a continuity of the Company’s warranty accruals:
2019 2018
Balance, beginning of year $ 208 $ 255
Expense, net 142 98
Settlements (105) (111)
Foreign exchange and other 7 (7)
Acquisitions – 2
Liabilities held for sale [note 3] – (29)
$ 252 $ 208
17. DEBT
The Company utilizes credit facilities and commercial paper programs as needed for its short-term working capital fluctuations. As of December 31,
2019, there were no short-term borrowings outstanding. For the year ended December 31, 2018 short-term borrowings totaled $1,098 million,
consisting of $35 million in bank indebtedness and $1,063 million in commercial paper.
The Company has an agreement for a credit facility that is drawn in euros that is secured with a USD cash deposit of 105% of the outstanding
balance. As at December 31, 2019, the amount drawn was $110 million [2018 – $112 million] and the related restricted cash equivalent deposit was
$116 million [2018 – $118 million]. Given that the credit agreement includes a netting arrangement that provides for the legal right of setoff, the
remaining net deposit of $6 million [2018 – $6 million] is included in the prepaid expenses and other balance [note 6].
On May 24, 2019, the Company amended and restated its $300 million, 364 day syndicated revolving credit facility, including an extension of the
maturity date to June 22, 2020 with an additional one-year term-out option available at maturity. The facility can be drawn in U.S. dollars or
Canadian dollars. As of December 31, 2019, the Company has not borrowed any funds under this credit facility.
The Company has a U.S. commercial paper program [the ‘‘U.S. Program’’] and a euro-commercial paper program [the ‘‘euro-Program’’]. Under the
U.S. Program, the Company may issue U.S. commercial paper notes [the ‘‘U.S. notes’’] up to a maximum aggregate amount of U.S. $1 billion. The
U.S. Program is supported by the Company’s existing global credit facility. The proceeds from the issuance of the U.S. notes are being used for
general corporate purposes. There were no amounts outstanding as of December 31, 2019. As at December 31, 2018, $903 million of U.S. notes
were outstanding, with a weighted-average interest rate of 3.00%, and maturities less than three months.
Under the euro-Program, the Company may issue euro-commercial paper notes [the ‘‘euro notes’’] up to a maximum aggregate amount of
e500 million or its equivalent in alternative currencies. The euro notes issued are guaranteed by the Company’s existing global credit facility. There
MAGNA INTERNATIONAL INC. 55

[a] The Company’s long-term debt, which is substantially uncollateralized, consists of the following:
[b] Future principal repayments on long-term debt are estimated to be as follows:
[c] All of the Senior Notes pay a fixed rate of interest semi-annually except for the e550 million and e600 million Senior Notes which pay a fixed rate of
interest annually. The Senior Notes are unsecured obligations and do not include any financial covenants. The Company may redeem the Senior
Notes in whole or in part at any time, at specified redemption prices determined in accordance with the terms of each of the respective indentures
governing the Senior Notes. All of the Senior Notes were issued for general corporate purposes.
[d] The Company’s $2.75 billion revolving credit facility matures on June 24, 2024. The facility includes a $200 million Asian tranche, a $100 million
Mexican tranche and a tranche for Canada, U.S. and Europe, which is fully transferable between jurisdictions and can be drawn in U.S. dollars,
Canadian dollars or euros.
[e] Interest expense, net includes:
[f] Interest paid in cash was $103 million for the year ended December 31, 2019 [2018 – $115 million].
were no amounts outstanding as of December 31, 2019. As of December 31, 2018, $160 million [e140 million] of euro notes were outstanding, with
a negative weighted-average interest rate of 0.24%, and maturities less than three months.
Long-term borrowings
2019 2018
Senior Notes [note 17 [c]]
$750 million Senior Notes due 2024 at 3.625% $ 747 $ 746
$650 million Senior Notes due 2025 at 4.150% 645 644
e550 million Senior Notes due 2023 at 1.900% 615 627
e600 million Senior Notes due 2027 at 1.500% 670 683
Cdn$425 million Senior Notes due 2022 at 3.100% 327 311
Bank term debt at a weighted average interest rate of approximately 4.97% [2018 – 4.89%],
denominated primarily in Chinese renminbi, Brazilian real, euro and Indian rupee 105 153
Government loans at a weighted average interest rate of approximately 1.63% [2018 – 2.18%],
denominated primarily in euro, Canadian dollar and Brazilian real 48 109
Other 11 12
3,168 3,285
Less due within one year 106 201
$ 3,062 $ 3,084
2020 $ 106
2021 33
2022 338
2023 619
2024 751
Thereafter 1,321
$ 3,168
2019 2018
Interest expense
Current $ 17 $ 24
Long-term 87 89
104 113
Interest income (22) (20)
Interest expense, net $ 82 $ 93
56 ANNUAL REPORT 2019

18. LEASES
The Company has entered into leases primarily for real estate, manufacturing equipment and vehicles with terms that range from 1 year to 33 years,
excluding land use rights which generally extend over 90 years. These leases often include options to extend the term of the lease for up to 12 years or
to terminate the lease within 1 year. When it is reasonably certain that the option will be exercised, the impact of the option is included in the lease term
for purposes of determining total future lease payments.
Costs associated with the Company’s operating lease expense were as follows:
2019
Operating lease expense $ 316
Short-term lease expense 25
Variable lease expense 27
Total lease expense $ 368
Supplemental information related to the Company’s operating leases was as follows:
2019
Operating cash flows – cash paid relating to operating leases $ 344
Right-of-use assets obtained in exchange for new operating lease liabilities 104
Weighted-average remaining lease term – operating leases, in years 11 years
Weighted-average discount rate – operating leases 4.8%
At December 31, 2019, the Company had commitments under operating leases requiring annual payments as follows:
Total
2020 $ 297
2021 270
2022 247
2023 221
2024 194
2025 and thereafter 1,126
2,355
Less: amount representing interest 529
Total lease liabilities $ 1,826
Current operating liabilities $ 225
Non-current operating lease liabilities 1,601
Total lease liabilities $ 1,826
As of December 31, 2019, the Company has additional operating leases, primarily for manufacturing facilities, that have not yet commenced of
$22 million. These operating leases will commence during 2020 and have lease terms of 1 to 8 years.
The Company’s future minimum lease commitments, as of December 31, 2018, under Accounting Standard Codification Topic 840, the predecessor to
Topic 842, were as follows:
Total
2019 $ 310
2020 283
2021 254
2022 230
2023 199
Thereafter 714
$ 1,990
MAGNA INTERNATIONAL INC. 57

[a] Defined benefit pension plans
For the year ended December 31, 2018, operating lease expense was $330 million reflected in Cost of good sold and $31 million in Selling, general and
administrative expenses, respectively, in the consolidated statement of income.
The Company’s finance leases were not material for any of the periods presented.
19. LONG-TERM EMPLOYEE BENEFIT LIABILITIES
Long-term employee benefit liabilities consist of:
2019 2018
Defined benefit pension plans and other [a] $ 203 $ 184
Termination and long service arrangements [b] 437 381
Retirement medical benefits plans [c] 27 27
Other long-term employee benefits 10 5
Long-term employee benefit obligations $ 677 $ 597
The Company sponsors a number of defined benefit pension plans and similar arrangements for its employees. All pension plans are funded to at
least the minimum legal funding requirements, while European defined benefit pension plans are unfunded.
The weighted average significant actuarial assumptions adopted in measuring the Company’s obligations and costs are as follows:
2019 2018
Projected benefit obligation
Discount rate 2.5% 3.1%
Rate of compensation increase 2.6% 2.5%
Net periodic benefit cost
Discount rate 3.2% 2.8%
Rate of compensation increase 2.6% 2.5%
Expected return on plan assets 4.9% 5.8%
58 ANNUAL REPORT 2019

[i] The asset allocation of the Company’s defined benefit pension plans at December 31, 2019 and the target allocation for 2020 is as follows:
[ii] Includes $58 million of long-term employee benefit liabilities and $2 million of accrued salaries and wages which were reclassified to liabilities
held for sale.
Information about the Company’s defined benefit pension plans is as follows:
2019 2018
Projected benefit obligation
Beginning of year $ 633 $ 687
Current service cost 11 14
Interest cost 20 18
Actuarial losses (gains) and changes in actuarial assumptions 79 (33)
Benefits paid (21) (24)
Divestiture (68) –
Foreign exchange 5 (29)
End of year 659 633
Plan assets at fair value[i]
Beginning of year 406 443
Return on plan assets 78 (11)
Employer contributions 11 12
Benefits paid (17) (19)
Divestiture (10) –
Foreign exchange 10 (19)
End of year 478 406
Ending funded status $ 181 $ 227
Amounts recorded in the consolidated balance sheet
Non-current asset [note 14] $ (23) $ (18)
Current liability 1 1
Liabilities held for sale [note 3][ii] – 60
Non-current liability 203 184
Net amount $ 181 $ 227
Amounts recorded in accumulated other comprehensive income
Unrecognized actuarial losses $ (141) $ (134)
Net periodic benefit cost
Current service cost $ 11 $ 14
Interest cost 20 18
Return on plan assets (19) (25)
Actuarial losses 4 4
Net periodic benefit cost $ 16 $ 11
2020 2019
Fixed income securities 55-75% 59%
Equity securities 25-45% 37%
Cash and cash equivalents 0-10% 4%
100% 100%
Substantially all of the plan assets’ fair value has been determined using significant observable inputs [level 2] from indirect market prices on
regulated financial exchanges.
The expected rate of return on plan assets was determined by considering the Company’s current investment mix, the historic performance of
these investment categories and expected future performance of these investment categories.
MAGNA INTERNATIONAL INC. 59

[b] Termination and long service arrangements
[c] Retirement medical benefits plans
Pursuant to labour laws and national labour agreements in certain European countries and Mexico, the Company is obligated to provide lump sum
termination payments to employees on retirement or involuntary termination, and long service payments contingent upon persons reaching a
predefined number of years of service.
The weighted average significant actuarial assumptions adopted in measuring the Company’s projected termination and long service benefit
obligations and net periodic benefit cost are as follows:
2019 2018
Discount rate 2.1% 2.8%
Rate of compensation increase 3.1% 2.9%
Information about the Company’s termination and long service arrangements is as follows:
2019 2018
Projected benefit obligation
Beginning of year $ 394 $ 378
Current service cost 29 22
Interest cost 10 8
Actuarial losses and changes in actuarial assumptions 39 14
Benefits paid (19) (14)
(Divestiture) acquisition (3) 2
Foreign exchange (4) (16)
Ending funded status $ 446 $ 394
Amounts recorded in the consolidated balance sheet
Current liability $ 9 $ 9
Liabilities held for sale [note 3] – 4
Non-current liability 437 381
Net amount $ 446 $ 394
Amounts recorded in accumulated other comprehensive income
Unrecognized actuarial losses $ (124) $ (88)
Net periodic benefit cost
Current service cost $ 29 $ 22
Interest cost 10 8
Actuarial losses (gains) 4 (1)
Net periodic benefit cost $ 43 $ 29
The Company sponsors a number of retirement medical plans which were assumed on certain acquisitions in prior years. These plans are frozen to
new employees and incur no current service costs.
In addition, the Company sponsors a retirement medical benefits plan that was amended during 2009 such that substantially all employees retiring
on or after August 1, 2009 no longer participate in the plan.
The weighted average discount rates used in measuring the Company’s projected retirement medical benefit obligations and net periodic benefit
cost are as follows:
2019 2018
Retirement medical benefit obligations 3.1% 4.0%
Net periodic benefit cost 4.0% 3.4%
Health care cost inflation 6.8% 6.8%
60 ANNUAL REPORT 2019

[d] Future benefit payments
Information about the Company’s retirement medical benefits plans are as follows:
2019 2018
Projected benefit obligation
Beginning of year $ 29 $ 33
Interest cost 1 1
Actuarial gains and changes in actuarial assumptions – (3)
Benefits paid (1) (1)
Foreign exchange – (1)
Ending funded status $ 29 $ 29
Amounts recorded in the consolidated balance sheet
Current liability $ 2 $ 2
Non-current liability 27 27
Net amount $ 29 $ 29
Amounts recorded in accumulated other comprehensive income
Unrecognized actuarial gains 11 12
Total accumulated other comprehensive income $ 11 $ 12
Net periodic benefit cost
Interest cost $ 1 $ 1
Actuarial gains (1) (1)
Net periodic benefit cost $ – $ –
The effect of a one-percentage point increase or decrease in health care trend rates would not have a significant impact on the Company’s
net income.
Termination
Defined and long Retirement
benefit service medical
pension plans arrangements benefits plans Total
Expected employer contributions – 2020 $ 11 $ 9 $ 2 $ 22
Expected benefit payments:
2020 $ 22 $ 10 $ 1 $ 33
2021 22 11 2 35
2022 23 11 2 35
2023 23 14 2 39
2024 24 18 2 43
Thereafter 131 119 8 250
$ 245 $ 183 $ 17 $ 435
MAGNA INTERNATIONAL INC. 61

[a] At December 31, 2019, the Company’s authorized, issued and outstanding capital stock are as follows:
Preference shares – issuable in series –
Common Shares –
[i] Each share is entitled to one vote per share at all meetings of shareholders.
[ii] Each share shall participate equally as to dividends.
[b] On November 12, 2019, the Toronto Stock Exchange [‘‘TSX’’] accepted the Company’s Notice of Intention to Make a Normal Course Issuer Bid
relating to the purchase for cancellation, as well as purchases to fund the Company’s stock-based compensation awards or programs and/or the
Company’s obligations to its deferred profit sharing plans, of up to 30.3 million Magna Common Shares [the ‘‘2019 Bid’’], representing
approximately 10% of the Company’s public float of Common Shares. The Bid commenced on November 15, 2019 and will terminate no later than
November 14, 2020.
[c] The following table presents the maximum number of shares that would be outstanding if all the dilutive instruments outstanding at March 5, 2020were exercised or converted:
20. OTHER LONG-TERM LIABILITIES
Other long-term liabilities consist of:
2019 2018
Long-term portion of fair value of hedges [note 23] $ 8 $ 40
Long-term portion of income taxes payable 234 205
Asset retirement obligation 34 33
Deferred revenue 74 106
Long-term lease inducements [note 18] – 16
Other 21 –
$ 371 $ 400
21. CAPITAL STOCK
The Company’s authorized capital stock includes 99,760,000 preference shares, issuable in series. None of these shares are currently issued
or outstanding.
Common Shares without par value [unlimited amount authorized] have the following attributes:
Previously, the Company had Normal Course Issuer Bids in place for the 12 month periods beginning in November 2018 and 2017.
The following is a summary of the Normal Course Issuer Bids [number of shares in the table below are expressed in whole numbers]:
2019 2018
Maximum
number Shares Cash Shares Cash
of shares purchased amount purchased amount
2017 Bid 35,800,000 – $ – 26,630,243 $ 1,544
2018 Bid 33,200,000 23,401,457 1,159 6,014,041 287
2019 Bid 30,283,500 2,367,106 130 – –
25,768,563 $ 1,289 32,644,284 $ 1,831
Common Shares 301,768,927
Stock options(i) 9,745,110
311,514,037
(i) Options to purchase Common Shares are exercisable by the holder in accordance with the vesting provisions and upon payment of the
exercise price as may be determined from time to time pursuant to the Company’s stock option plans.
62 ANNUAL REPORT 2019

[a] The effects on net income of amounts reclassified from AOCL, with presentation location, were as follows:
22. ACCUMULATED OTHER COMPREHENSIVE LOSS
The following is a continuity schedule of accumulated other comprehensive loss:
2019 2018
Accumulated net unrealized loss on translation of net investment in foreign operations
Balance, beginning of year $ (917) $ (456)
Net unrealized loss (18) (490)
Repurchase of shares under normal course issuer bids [note 21] 28 29
Balance, end of year (907) (917)
Accumulated net unrealized gain (loss) on cash flow hedges [b]
Balance, beginning of year (68) 39
Net unrealized gain (loss) 102 (106)
Reclassification of net loss (gain) to net income [a] 4 (1)
Balance, end of year 38 (68)
Accumulated net unrealized loss on other long-term liabilities [b]
Balance, beginning of year (190) (183)
Net unrealized loss (47) (13)
Reclassification of net loss to net income [a] 8 6
Sale of business 8 –
Balance, end of year (221) (190)
Total accumulated other comprehensive loss [c] $ (1,090) $ (1,175)
2019 2018
Cash flow hedges
Sales $ (38) $ (6)
Cost of sales 33 7
Income tax 1 –
Net of tax (4) 1
Other long-term liabilities
Cost of sales (9) (7)
Income tax 1 1
Net of tax (8) (6)
Total loss reclassified to net income $ (12) $ (5)
MAGNA INTERNATIONAL INC. 63

[b] The amount of income tax benefit that has been allocated to each component of other comprehensive loss is as follows:
[c] The amount of other comprehensive loss that is expected to be reclassified to net income during 2020 is $37 million.
[a] Foreign exchange contracts
2019 2018
Accumulated net unrealized loss on translation of net investment in foreign operations
Balance, end of year $ 7 $ 7
Accumulated net unrealized (gain) loss on cash flow hedges
Balance, beginning of year 23 (12)
Net unrealized (gain) loss (36) 35
Reclassification of net loss to net income (1) –
Balance, end of year (14) 23
Accumulated net unrealized loss on other long-term liabilities
Balance, beginning of year 21 17
Net unrealized loss 15 5
Reclassification of net loss to net income (1) (1)
Balance, end of year 35 21
Total income tax benefit $ 28 $ 51
23. FINANCIAL INSTRUMENTS
At December 31, 2019, the Company had outstanding foreign exchange forward contracts representing commitments to buy and sell various
foreign currencies. Significant commitments are as follows:
For Canadian dollars For U.S. dollars
U.S. dollar Weighted Peso Weighted
Buy (Sell) amount average rate amount average rate
2020 173 1.31238 6,271 0.04824
2020 (759) 0.76562 (25) 20.37835
2021 19 1.31855 2,749 0.04624
2021 (479) 0.76856 – –
2022 6 1.32105 1,074 0.04675
2022 (263) 0.76649 – –
2023 (52) 0.76140 – –
2024 (14) 0.75235 – –
(1,369) 10,069
64 ANNUAL REPORT 2019

[b] Financial assets and liabilities
For euros
Czech
U.S. dollar Weighted koruna Weighted
Buy (Sell) amount average rate amount average rate
2020 196 0.85601 4,582 0.03834
2020 (117) 1.15358 – –
2021 89 0.82944 2,576 0.03757
2021 (34) 1.21681 – –
2022 48 0.81676 468 0.03762
2022 (4) 1.21233 – –
2023 23 0.81607 – –
2023 (2) 1.19193 – –
2024 7 0.83511 – –
206 7,626
Based on forward foreign exchange rates as at December 31, 2019 for contracts with similar remaining terms to maturity, the gains and losses
relating to the Company’s foreign exchange forward contracts recognized in other comprehensive income are approximately $70 million and
$18 million, respectively [note 22].
The Company does not enter into foreign exchange forward contracts for speculative purposes.
The Company’s financial assets and liabilities consist of the following:
2019 2018
Financial assets
Cash and cash equivalents $ 1,276 $ 684
Restricted cash equivalents 116 118
Accounts receivable 5,927 6,548
Publicly traded and private equity investments 99 323
Severance investments 1 3
Long-term receivables included in other assets [note 14] 217 198
Financial assets held for sale [note 3]
Accounts receivable held for sale – 258
Severance investments held for sale – 1
$ 7,636 $ 8,133
Financial liabilities
Bank indebtedness [note 17] $ – $ 35
Commercial paper [note 17] – 1,063
Long-term debt (including portion due within one year) 3,168 3,285
Accounts payable 5,628 6,094
Financial liabilities held for sale [note 3]
Accounts payable held for sale – 226
$ 8,796 $ 10,703
Derivatives designated as effective hedges, measured at fair value
Foreign currency contracts
Prepaid expenses and other $ 46 $ 25
Other assets 24 9
Other accrued liabilities (10) (61)
Other long-term liabilities (8) (40)
$ 52 $ (67)
MAGNA INTERNATIONAL INC. 65

[c] Derivatives designated as effective hedges, measured at fair value
[d] Fair value
Cash and cash equivalents, restricted cash equivalents, accounts receivable, short-term borrowings and accounts payable.
Publicly traded and private equity securities
Term debt
Senior Notes
[e] Credit risk
The Company presents derivatives that are designated as effective hedges at gross fair values in the consolidated balance sheets. However,
master netting and other similar arrangements allow net settlements under certain conditions. The following table shows the Company’s derivative
foreign currency contracts at gross fair value as reflected in the consolidated balance sheets and the unrecognized impacts of master netting
arrangements:
Gross Gross
amounts amounts not
presented in offset in
consolidated consolidated Net
balance sheets balance sheets amounts
December 31, 2019
Assets $ 70 $ 15 $ 55
Liabilities $ (18) $ (15) $ (3)
December 31, 2018
Assets $ 34 $ 33 $ 1
Liabilities $ (101) $ (33) $ (68)
The Company determined the estimated fair values of its financial instruments based on valuation methodologies it believes are appropriate;
however, considerable judgment is required to develop these estimates. Accordingly, these estimated fair values are not necessarily indicative of
the amounts the Company could realize in a current market exchange. The estimated fair value amounts can be materially affected by the use of
different assumptions or methodologies. The methods and assumptions used to estimate the fair value of financial instruments are described
below:
Due to the short period to maturity of the instruments, the carrying values as presented in the consolidated balance sheets are reasonable
estimates of fair values.
The fair value of the Company’s investments in publicly traded equity securities is determined using the closing price on the measurement date, as
reported on the stock exchange on which the securities are traded. [Level 1 input based on the GAAP fair value hierarchy.]
The Company estimates the value of its private equity securities based on valuation methods using the observable transaction price at the
transaction date and other observable inputs including rights and obligations of the securities held by the Company. [Level 3 input based on the
GAAP fair value hierarchy.]
The Company’s term debt includes $106 million due within one year. Due to the short period to maturity of this debt, the carrying value as presented
in the consolidated balance sheet is a reasonable estimate of its fair value.
The fair value of our Senior Notes are classified as Level 1 when we use quoted prices in active markets and Level 2 when the quoted prices are
from less active markets or when other observable inputs are used to determine fair value. At December 31, 2019, the net book value of the
Company’s Senior Notes was $3.02 billion and the estimated fair value was $3.20 billion, determined using Level 2 inputs.
The Company’s financial assets that are exposed to credit risk consist primarily of cash and cash equivalents, restricted cash equivalents [net of the
euro drawn amount], accounts receivable, held-to-maturity investments and foreign exchange and commodity forward contracts with positive
fair values.
Cash and cash equivalents and restricted cash equivalents, which consist of short-term investments, are only invested in bank term deposits and
bank commercial paper with an investment grade credit rating. Credit risk is further reduced by limiting the amount which is invested in certain
governments or any major financial institution.
The Company is also exposed to credit risk from the potential default by any of its counterparties on its foreign exchange forward contracts. The
Company mitigates this credit risk by dealing with counterparties who are major financial institutions that the Company anticipates will satisfy their
obligations under the contracts.
66 ANNUAL REPORT 2019

[f] Currency risk
[g] Interest rate risk
[a] In September 2014, the Conselho Administrativo de Defesa Economica [‘‘CADE’’], Brazil’s Federal competition authority, attended at one of the
Company’s operating divisions in Brazil to obtain information in connection with an ongoing antitrust investigation relating to suppliers of
automotive door latches and related products [‘‘access mechanisms’’].
[b] The Company is at risk for product warranty costs, which include product liability and recall costs, and is currently experiencing increased
customer pressure to assume greater warranty responsibility. For most types of products, the Company only accounts for existing or probable
product warranty claims. However, for certain complete vehicle assembly, powertrain systems and electronics contracts, the Company records an
estimate of future warranty-related costs based on the terms of the specific customer agreements and/or the Company’s warranty experience.
Product liability and recall provisions are established based on the Company’s best estimate of the amounts necessary to settle existing claims,
which typically take into account: the number of units that may be returned; the cost of the product being replaced; labour to remove and replace
the defective part; and the customer’s administrative costs relating to the recall. Where applicable, such provisions are booked net of recoveries
from sub-suppliers and along with related insurance recoveries. Due to the uncertain nature of the net costs, actual product liability costs could be
materially different from the Company’s best estimates of future costs [note 16].
In the normal course of business, the Company is exposed to credit risk from its customers, substantially all of which are in the automotive industry
and are subject to credit risks associated with the automotive industry. For the year ended December 31, 2019, sales to the Company’s six largest
customers represented 77% [2018 – 77%] of the Company’s total sales; and substantially all of its sales are to customers in which the Company
has ongoing contractual relationships.
The Company is exposed to fluctuations in foreign exchange rates when manufacturing facilities have committed to the delivery of products for
which the selling price has been quoted in currencies other than the facilities’ functional currency, and when materials and equipment are
purchased in currencies other than the facilities’ functional currency. In an effort to manage this net foreign exchange exposure, the Company
employs hedging programs, primarily through the use of foreign exchange forward contracts [note 23[a]].
The Company is not exposed to significant interest rate risk due to the short-term maturity of its monetary current assets and current liabilities. In
particular, the amount of interest income earned on cash and cash equivalents is impacted more by investment decisions made and the demands
to have available cash on hand, than by movements in interest rates over a given period.
In addition, the Company is not exposed to interest rate risk on its term debt and Senior Notes as the interest rates on these instruments are fixed.
24. CONTINGENCIES
From time to time, the Company may become involved in regulatory proceedings, or become liable for legal, contractual and other claims by various
parties, including customers, suppliers, former employees, class action plaintiffs and others. On an ongoing basis, the Company attempts to assess
the likelihood of any adverse judgments or outcomes to these proceedings or claims, together with potential ranges of probable costs and losses. A
determination of the provision required, if any, for these contingencies is made after analysis of each individual issue. The required provision may
change in the future due to new developments in each matter or changes in approach such as a change in settlement strategy in dealing with
these matters.
In May 2019, CADE informed the Company that it completed its preliminary investigation and, based on a review of the evidence, has commenced
a formal administrative proceeding into alleged anticompetitive behaviour relating to access mechanisms involving the Company.
Administrative proceedings of this nature can often continue for several years. At this time, management is unable to predict the duration or
outcome of the Brazilian administrative proceeding, including whether any operating divisions of the Company will be found liable for any violation
of law or the extent or magnitude of any liability, if any.
In the event that wrongful conduct is found, CADE may impose administrative penalties or fines taking into account several mitigating and
aggravating factors. Administrative fines are tied to the sales in Brazil of the applicable Magna companies in the fiscal year prior to the
commencement of the formal administrative proceeding. Magna could also be subject to restitution settlements, civil proceedings and other
consequences, including reputational damage.
The Company’s policy is to comply with all applicable laws, including antitrust and competition laws. The Company has completed its previously
announced global review focused on antitrust risk and does not currently anticipate any material liabilities in connection with the review.
MAGNA INTERNATIONAL INC. 67

[a] Magna is a global automotive supplier which has complete vehicle engineering and contract manufacturing expertise, as well as product
capabilities which include body, chassis, exterior, seating, powertrain, active driver assistance, electronics, mirrors & lighting, mechatronics and
roof systems. Magna also has electronic and software capabilities across many of these areas.
[a] The following tables show segment information for the Company’s reporting segments and a reconciliation of Adjusted EBIT to the Company’s
consolidated income before income taxes:
25. SEGMENTED INFORMATION
The Company is organized under four operating segments: Body Exteriors & Structures, Power & Vision, Seating Systems and Complete Vehicles.
These segments have been determined on the basis of technological opportunities, product similarities, and market and operating factors, and are
also the Company’s reportable segments.
The Company’s chief operating decision maker uses Adjusted Earnings before Interest and Income Taxes [‘‘Adjusted EBIT’’] as the measure of
segment profit or loss, since management believes Adjusted EBIT is the most appropriate measure of operational profitability or loss for its
reporting segments. Adjusted EBIT is calculated by taking net income and adding back income taxes, interest expense, net, and other
expense, net.
The accounting policies of each segment are the same as those set out under ‘‘Significant Accounting Policies’’ [note 1]. All intersegment sales and
transfers are accounted for at fair market value.
2019
Depreciation Equity
Total External Adjusted and (income)
sales sales EBIT amortization loss
Body Exteriors & Structures $ 16,458 $ 16,110 $ 1,299 $ 710 $ (3)
Power & Vision 11,312 11,103 747 464 (174)
Seating Systems 5,577 5,548 312 66 (4)
Complete Vehicles 6,707 6,661 144 84 (1)
Corporate & Other[i] (623) 9 43 21 4
Total Reportable Segments $ 39,431 $ 39,431 $ 2,545 $ 1,345 $ (178)
2018
Depreciation
Total External Adjusted and Equity
sales sales EBIT amortization income
Body Exteriors & Structures $ 17,527 $ 17,220 $ 1,413 $ 701 $ (12)
Power & Vision 12,321 12,086 1,171 435 (261)
Seating Systems 5,548 5,546 426 57 (3)
Complete Vehicles 6,018 5,968 68 65 –
Corporate & Other[i] (587) 7 29 20 (1)
Total Reportable Segments $ 40,827 $ 40,827 $ 3,107 $ 1,278 $ (277)
2019
Fixed Fixed
Net asset, asset
assets Investments Goodwill net additions
Body Exteriors & Structure $ 7,906 $ 31 $ 458 $ 4,827 $ 713
Power & Vision 5,626 899 1,238 2,299 577
Seating Systems 1,219 134 169 412 76
Complete Vehicles 735 2 111 593 69
Corporate & Other[i] 468 144 – 129 6
Total Reportable Segments $ 15,954 $ 1,210 $ 1,976 $ 8,260 $ 1,441
68 ANNUAL REPORT 2019

[i] Included in Corporate and Other Adjusted EBIT are intercompany fees charged to the automotive segments.
[ii] Includes $541 million of net assets held for sale.
[b] The following table reconciles Net income from operations to Adjusted EBIT:
[c] The following table shows Net Assets for the Company’s reporting segments:
2018
Fixed Fixed
Net asset, asset
assets Investments Goodwill net additions
Body Exteriors & Structure $ 7,142 $ 34 $ 459 $ 4,825 $ 730
Power & Vision[ii] 6,703 1,680 1,260 2,151 655
Seating Systems 815 135 147 330 78
Complete Vehicles 605 2 113 622 170
Corporate & Other[i] 563 338 – 167 17
Total Reportable Segments $ 15,828 $ 2,189 $ 1,979 $ 8,095 $ 1,650
2019 2018
Net Income $ 1,632 $ 2,332
Add:
Interest expense, net 82 93
Other expense, net 240 63
Income taxes 591 619
Adjusted EBIT $ 2,545 $ 3,107
2019 2018
Total Assets $ 25,790 $ 25,945
Deduct assets not included in segment net assets:
Cash and cash equivalents (1,276) (684)
Deferred tax assets (308) (300)
Long-term receivables from joint venture partners (71) (71)
Income taxes receivable – (57)
Deduct liabilities included in segment net assets:
Accounts Payable (5,628) (6,094)
Accrued salaries and wages (753) (769)
Other accrued liabilities (1,800) (1,734)
Liabilities held for sale – (408)
Segment Net Assets $ 15,954 $ 15,828
MAGNA INTERNATIONAL INC. 69

[d] The following table aggregates external revenues by customer as follows:
[e] The following table summarizes external revenues and long-lived assets by geographic region:
Normal Course Issuer Bid
2019 2018
General Motors $ 5,732 $ 6,303
BMW 5,469 4,826
Ford Motor Company 5,270 5,721
Fiat Chrysler Automobiles 5,173 5,693
Daimler AG 4,887 4,687
Volkswagen 4,001 4,128
Other 8,899 9,469
$ 39,431 $ 40,827
External Sales Fixed Assets, Net
2019 2018 2019 2018
North America
United States $ 9,702 $ 10,043 $ 1,661 $ 1,359
Canada 5,353 5,886 993 1,001
Mexico 4,294 4,618 1,287 1,275
19,349 20,547 3,941 3,635
Europe
Austria 8,279 7,750 872 938
Germany 4,878 4,893 1,090 1,271
Czech Republic 899 764 276 257
Poland 689 694 201 200
Italy 527 850 244 288
United Kingdom 422 517 209 191
Russia 434 424 134 138
Spain 431 382 79 47
Turkey 293 291 10 8
France 201 219 55 46
Slovakia 139 127 223 71
Other Europe 139 144 215 221
17,331 17,055 3,608 3,676
Asia Pacific
China 1,947 2,152 528 588
India 144 180 98 106
Korea 44 158 1 21
Other Asia Pacific 29 50 4 3
2,164 2,540 631 718
Rest of World 587 685 80 66
$ 39,431 $ 40,827 $ 8,260 $ 8,095
26. SUBSEQUENT EVENT
Subsequent to December 31, 2019, the Company purchased 1,955,518 Common Shares for cancellation and 177,103 Common Shares to satisfy
stock-based compensation awards, each under an existing normal course issuer bid for cash consideration of $101 million.
70 ANNUAL REPORT 2019

Share Information
Distribution of Shares held by Registered Shareholders
Dividends
MAGNA INTERNATIONAL INC.
Supplementary Financial and Share Information
Financial Summary
(U.S. dollars in millions, except per share figures)
(unaudited)
Years ended December 31,
2019 2018 2017 2016 2015
Total sales 39,431 40,827 36,588 36,445 32,134
Depreciation and amortization 1,345 1,278 1,184 1,056 802
Net income attributable to Magna International Inc. from continuing
operations 1,765 2,296 2,196 2,031 1,946
Diluted earnings per Common Share from continuing operations 5.59 6.61 5.87 5.16 4.72
Weighted average number of Common Shares outstanding – Diluted 315.8 347.5 373.9 393.2 412.7
Cash dividend paid per share 1.46 1.32 1.10 1.00 0.88
Cash flow from operations 3,960 3,718 3,346 3,266 2,332
Capital expenditures 1,441 1,650 1,875 1,807 1,591
Working capital 2,216 1,530 1,957 1,468 3,868
Fixed assets, net 8,260 8,095 8,176 7,022 5,948
Total assets 25,790 25,945 25,468 22,566 19,687
Long-term debt 3,062 3,084 3,195 2,394 2,327
Shareholders’ equity 11,131 11,159 11,712 10,219 9,117
Long-term debt to equity ratio 0.28:1 0.28:1 0.27:1 0.23:1 0.26:1
The Common Shares are listed and traded in Canada on the Toronto Stock Exchange (‘‘TSX’’) under the stock symbol ‘‘MG’’ and in the United States on
the New York Stock Exchange (‘‘NYSE’’) under the stock symbol ‘‘MGA’’. As of February 29, 2020, there were 1,285 registered holders of
Common Shares.
Common Shares
Canada 75.17%
United States 24.80%
Other 0.03%
Dividends for 2019 on Magna’s Common Shares were paid on each of March 22, June 7, September 6 and December 6 at a rate of U.S.$0.365 per
Common Share. Magna’s dividends have been designated as ‘‘eligible dividends’’ as defined in subsection 89(1) of the Income Tax Act (Canada) and,
accordingly, are eligible for an enhanced tax credit. Additional details are found on Magna’s website (www.magna.com), under ‘‘Company – Investors –
Shareholder Information – Dividends’’.
MAGNA INTERNATIONAL INC. 71

Price Range of Shares
The following table sets forth, for the years indicated, the high and low sales prices and volumes of Common Shares traded in each case as reported by
the TSX and NYSE, respectively.
Common Shares (TSX) (Cdn$) Stock Symbol ‘‘MG’’
Year ended December 31, 2019 Year ended December 31, 2018
Quarter Volume High Low Volume High Low
1st 54,122,123 72.63 59.48 66,663,208 74.86 63.63
2nd 60,117,270 76.11 57.34 60,140,550 87.13 69.78
3rd 52,521,128 72.30 60.57 68,562,603 81.27 67.63
4th 46,709,827 75.25 65.25 79,159,170 74.40 58.74
Common Shares (NYSE) (US$) Stock Symbol ‘‘MGA’’
Year ended December 31, 2019 Year ended December 31, 2018
Quarter Volume High Low Volume High Low
1st 67,660,484 55.09 44.02 83,866,053 59.99 50.78
2nd 76,106,212 56.92 42.51 72,562,177 67.47 53.91
3rd 59,411,273 54.65 46.27 81,571,294 61.65 51.34
4th 47,590,914 57.09 48.97 94,173,736 57.85 42.88
72 ANNUAL REPORT 2019

As a “foreign private issuer” listed on the New York Stock Exchange (NYSE), Magna is required to disclose the significant ways in which its corporate governance practices differ from those to be followed by U.S. domestic issuers under the NYSE listing standards. Please see the corporate governance section of our website (www.magna.com) for our Statement of Significant Corporate Governance Differences (NYSE). Additionally, please refer to the Management Information Circular/Proxy Statement for our 2020 Annual Meeting of Shareholders for a description of our corporate governance practices in comparison with the requirements and guidelines of the Canadian Securities Administrators.
Shareholders wishing to communicate with the non-management members of the Magna Board of Directors may do so by contacting the Chairman of the Board through the office of Magna’s Corporate Secretary at 337 Magna Drive, Aurora, Ontario, Canada L4G 7K1 (905) 726-7070. Shareholders wishing to obtain a copy of Magna’s Notice of Intention to Make a Normal Course Issuer Bid, referred to in Note 21 to the consolidated financial statements contained in this Annual Report, may do so by contacting Magna’s Corporate Secretary.
The 2020 Annual Meeting of Shareholders The 2020 Annual Meeting of Shareholders will be held on Thursday, May 7, 2020, commencing at 10:00 a.m. (Eastern Daylight Time). Due to the COVID-19 pandemic, the meeting is being conducted as a virtual-only meeting accessible at www.virtualshareholdermeeting.com/MGA2020.
Annual Report Additional copies of this 2019 Annual Report or copies of our quarterly reports may be obtained from: The Corporate Secretary, Magna International Inc., 337 Magna Drive, Aurora, Ontario, Canada L4G 7K1 or www.magna.com. Copies of financial data and other publicly filed documents are available through the internet on the Canadian Securities Administrators’ System for Electronic Document Analysis and Retrieval (SEDAR) which can be accessed at www.sedar.com and on the United States Securities and Exchange Commission’s Electronic Data Gathering, Analysis and Retrieval System (EDGAR), which can be accessed at www.sec.gov.
©Magna International Inc. 2020. Magna and the logo are registered trademarks of Magna International Inc.
Directors
William L. Young
(Chairman of the Board)
Scott B. Bonham
Peter G. Bowie
Mary S. Chan
Hon. V. Peter Harder, P.C.
Dr. Kurt J. Lauk
Robert F. MacLellan
Cynthia A. Niekamp
William A. Ruh
Dr. Indira V. Samarasekera
Donald J. Walker
Lisa S. Westlake
Executive Officers
Donald J. Walker
Chief Executive Officer
Seetarama Swamy Kotagiri
President, Magna International and
President, Magna Power and Vision
Vincent J. Galifi
Chief Financial Officer
Tommy J. Skudutis
Chief Operating Officer
James J. Tobin, Sr.
President, Magna Asia
Guenther F. Apfalter
President, Magna Europe and
President, Magna Steyr
Mark Dong
President, Magna China
Aaron D. McCarthy
Chief Human Resources Officer
Eric J. Wilds
Chief Sales & Marketing Officer
Riccardo C. Trecoce
Chief Legal Officer
Joanne N. Horibe
Chief Compliance Officer
CORPORATE DIRECTORY
Corporate Office
Magna International Inc.
337 Magna Drive
Aurora, Ontario
Canada L4G 7K1
Telephone: (905) 726-2462
magna.com
Transfer Agent and Registrar
Computershare Trust Company
of Canada
100 University Avenue, 8th Floor
Toronto, Ontario, Canada M5J 2Y1
Telephone: 1 (800) 564-6253
Computershare Trust Company N.A.
462 S. 4th Street
Louisville, Kentucky
USA 40202
Telephone: 1 (800) 962-4284
From all other countries
Telephone: 1 (514) 982-7555
www.computershare.com
Exchange Listings
Common Shares
Toronto Stock Exchange MG
New York Stock Exchange MGA

CONNECT WITH MAGNA
magna.com
Magna International Inc.
337 Magna Drive
Aurora, Ontario
Canada L4G 7K1
Telephone: (905) 726-2462
2019Annual Report
MAGNA INTERNATIONAL INC.