Embed Size (px)
Citation preview

Revised 10/6/20: College Going Rate formula numerator date changed from Fall 2018 to Fall 2019 and denominator changed from SY2017-18 changed to SY2018-19.
2019-20 STRIVE HI MEASURES AND CALCULATIONS
Technical Guide
Overview
The 2019-20 Strive HI Performance System (Strive HI) is designed to measure performance of our
schools using key federal and state indicators to best support success for all students. It is
comprised of measures aligned with (1) federal law, the Every Student Succeeds Act (ESSA), and (2)
Student Success Indicators as presented in the Hawaii Department of Education & Board of
Education 2017-2020 Strategic Plan. This document explains Strive HI measures and how they are
calculated. Please refer to the Glossary of Terms and Acronyms at the end of this document for
further terminology information.
In 2019-20, Hawaii, like all states nationally, was granted waivers pertaining to certain ESSA
requirements including a waiver from required statewide assessments. As a result, a number of
2020 Strive HI test related results are not available/reported. These include proficiency, growth,
gap, and 3rd and 8th grade literacy.
2019-20 Strive HI Measures
School Type Measure What
Elementary and
Middle/ Intermediate
Schools
Academic Achievement
Percent meeting LA standards*
Percent meeting math standards*
Percent meeting science standards
School Growth*
ELA median growth percentile for SBA
Math median growth percentile for SBA
Percent meeting HSA-Alt growth expectations
for ELA
Percent meeting HSA-Alt growth expectations
for math
Percent meeting KAEO growth expectations
for LA
Percent meeting KAEO growth expectations
for math
Chronic Absenteeism* Percent chronically absent
English Language Proficiency* Percent meeting ELP growth to target
School Climate Percent reporting positively on the Panorama

2
Student Perception Survey
Inclusion Rate
Percent of special education students in
general education classes for 80% or more of
the school day
Third and Eighth Grade Literacy Percent Above or At/Near who are meeting
grade level standards for reading
Achievement Gap
Difference in LA and math proficiency rates for
high needs (economically disadvantaged, special
needs, English Learners) and non-high needs
students
High Schools
Academic Achievement
Percent meeting LA standards*
Percent meeting math standards*
Percent meeting science standards
Graduation Rate* Four-Year graduation rate (ACGR)
Chronic Absenteeism* Percent chronically absent
English Language Proficiency* Percent meeting ELP growth to target
School Climate Percent reporting positively on the Panorama
Student Perception Survey
Inclusion Rate
Percent of special education students in
general education classes for 80% or more of
the school day
Ninth Grade On-Track Percent of first-time 9th graders promoted to
10th grade on time
Achievement Gap
Difference in LA and math proficiency rates for
high needs (economically disadvantaged, special
needs, English Learners) and non-high needs
students
CTE Concentrator Percent of 12th grade students completing a
CTE Program of Study
College-Going Graduates Percent of high school graduates enrolling in a
post-secondary institution by the following Fall
* Measures applied for ESSA Accountability determinations. For ESSA Accountability, when the current year All Students n-size
does not meet 20, up to two prior years of data are pooled to meet the minimum n-size. If after pooling prior years data the n-
size is still not met, a result is not calculated and the measure is treated as missing data denoted with a double hyphen (--).

3
Strive HI Measures
Academic Achievement
Elementary Middle/Intermediate High
LA proficiency rate LA proficiency rate LA proficiency rate
Math proficiency rate Math proficiency rate Math proficiency rate
Science proficiency rate Science proficiency rate Science proficiency rate
What (elementary, middle/intermediate, high schools)
Three content areas comprise Academic Achievement: Proficiency rates for language arts,
math and science. Assessment results applied for proficiency include the following:
Smarter Balanced Assessments in ELA and math for grades 3 – 8 and 11.
HSA alternate assessments for grades 3 – 8 and 11 in ELA and math, and science
for grades 5, 8 and 11
Kaiapuni Assessment of Educational Outcomes (KAEO) for grades 3 – 8 in
Hawaiian language arts and math, and science (grade 5 and 8)
NGSS science (grades 5 and 8)
Biology I end-of-course (EOC) exam (high school only)
1 Students considered Full School Year (FSY) students were enrolled at the same school from the Official
Enrollment Count (OEC) Date of 8/19/19 through 3/13/20 (end of the 3rd
quarter).
How (elementary, middle/intermediate, high schools)
The proficiency rate (except for Bio I EOC) is based on the number of Full School Year
(FSY)1 students taking the test and receiving a valid test score (denominator). The
numerator consists of the number of those students who are proficient (numerator).
Proficiency Rate = # FSY students proficient
# of FSY students with valid test score
Proficiency for the Biology I EOC exam is based on the students taking the exam, both
FSY and non-FSY students.
Biology I Proficiency Rate =
# of students proficient
# of students taking the exam

4
School Growth
Elementary Middle/Intermediate High
LA MGP (SBA) and % Meeting Growth (HSA-Alt & KAEO) LA MGP (SBA) and % Meeting Growth (HSA-Alt & KAEO)
N/A
Math MGP (SBA) and % Meeting Growth (HSA-Alt & KAEO) Math MGP (SBA) and % Meeting Growth (HSA-Alt & KAEO)
What (elementary, middle/intermediate)
Beginning 2017-18, the U.S. Department of Education required growth results for LA and
math for students taking the HSA-Alternate Assessment or Kaiapuni Assessment of
Educational Outcomes (KAEO). Median growth percentiles (MGP) for SBA students
continue to be reported.
Median Growth Percentiles (MGP) for SBA Students
MGPs indicate a school’s median (middle) student growth percentile (SGP) which
ranges from 99 – 1. Therefore, an ELA MGP of 54 means half of its students had a
growth percentile of 54 or higher. Alternatively stated, half of the students had
growth of 54 or below. For more information, go to:
http://www.hawaiipublicschools.org/VisionForSuccess/SchoolDataAndReports/Grow
th-Model/Pages/home.aspx
Transition Matrix Model for HSA-Alt and KAEO Students
The percent of HSA-Alt and KAEO students meeting growth is based on transition
matrices comparing students’ proficiency levels between the current and prior year.
Who (elementary and middle/intermediate schools)
Only students enrolled for the current FSY who have SBA, HSA-Alt or KAEO results for at
least the current and prior year.2 Students repeating a tested grade level are not included in
the calculation.
2 A minimum of two consecutive years of test scores are necessary to generate growth.

5
How (elementary, middle/intermediate schools)
Median Growth Percentiles (MGP) for SBA Students
Rank order a school’s student growth percentiles and select the median value. This
is the school’s median growth percentile.
School A School B
88 70
School A’s median growth percentile = 48
School B’s median growth percentile = 51
87 67
61 55
48 51
40 48
38 47
20 41
Transition Matrix Model for HSA-Alt and KAEO Students
Based on the Transition Matrix, students demonstrating one year of growth serve as
the numerator total. The denominator is based on all students taking the HSA-Alt
or KAEO. Cells denoting “Yes” count as meeting growth expectations.
HSA-Alt
Current Year Proficiency Level
1 2 3 4
Prior Year Proficiency
Level
1 No Yes Yes Yes
2 No No Yes Yes
3 No No Yes Yes
4 No No No Yes
KAEO
Current Year Proficiency Level
1 2 3 4
Prior Year Proficiency
Level
1 No Yes Yes Yes
2 No Yes Yes Yes
3 No No Yes Yes
4 No No No Yes
Graduation Rate
Elementary Middle/Intermediate High
N/A N/A Four-Year Graduation Rate
What (high schools)
High schools’ prior year Four-Year Adjusted Cohort Graduation Rate (ACGR). The 2019
graduating cohort is used for 2019-20 Strive HI ESSA Accountability determinations.
Who (high schools)
Students comprising the 2018-19 graduating cohort. The cohort includes students,
who entered the 9th grade for the first time in SY2015-16, plus students transferring
into the cohort, less students transferring out of the cohort during the four-year
period.
6
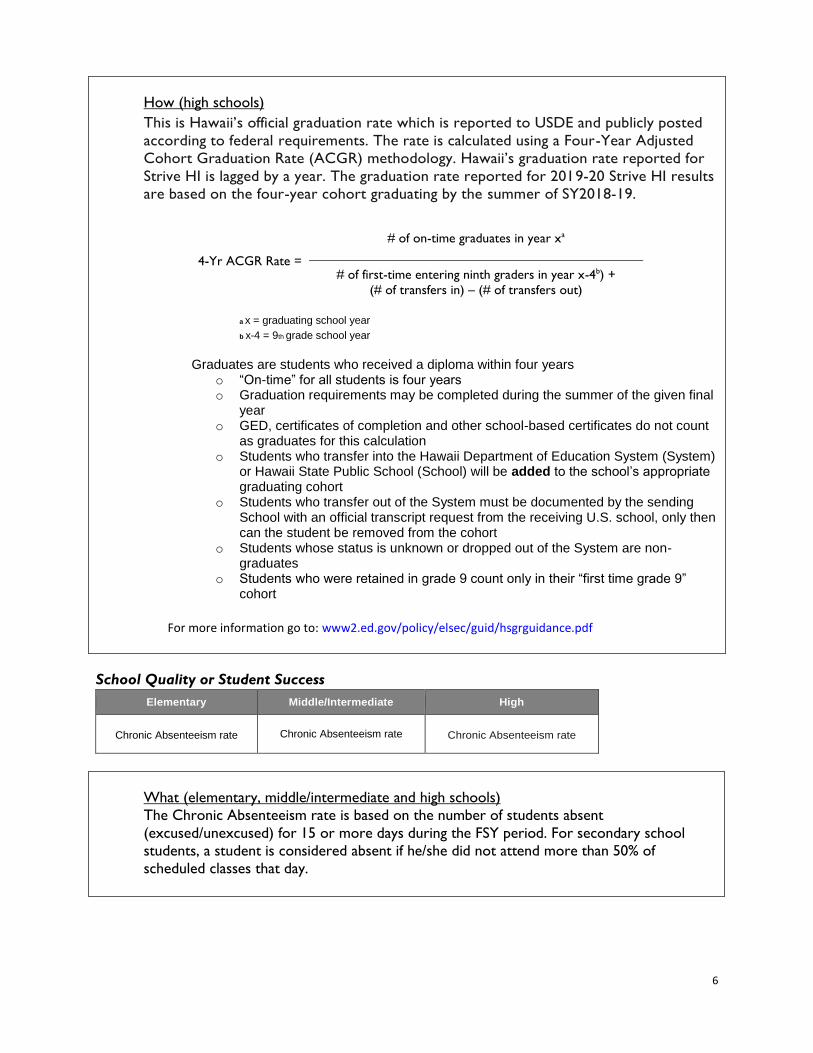
How (high schools)
This is Hawaii’s official graduation rate which is reported to USDE and publicly posted
according to federal requirements. The rate is calculated using a Four-Year Adjusted
Cohort Graduation Rate (ACGR) methodology. Hawaii’s graduation rate reported for
Strive HI is lagged by a year. The graduation rate reported for 2019-20 Strive HI results
are based on the four-year cohort graduating by the summer of SY2018-19.
a x = graduating school year
b x-4 = 9th grade school year Graduates are students who received a diploma within four years
o “On-time” for all students is four years o Graduation requirements may be completed during the summer of the given final
year o GED, certificates of completion and other school-based certificates do not count
as graduates for this calculation o Students who transfer into the Hawaii Department of Education System (System)
or Hawaii State Public School (School) will be added to the school’s appropriate graduating cohort
o Students who transfer out of the System must be documented by the sending School with an official transcript request from the receiving U.S. school, only then can the student be removed from the cohort
o Students whose status is unknown or dropped out of the System are non-graduates
o Students who were retained in grade 9 count only in their “first time grade 9” cohort
For more information go to: www2.ed.gov/policy/elsec/guid/hsgrguidance.pdf
4-Yr ACGR Rate =
# of on-time graduates in year xa
# of first-time entering ninth graders in year x-4b) +
(# of transfers in) – (# of transfers out)
School Quality or Student Success
Elementary Middle/Intermediate High
Chronic Absenteeism rate Chronic Absenteeism rate Chronic Absenteeism rate
What (elementary, middle/intermediate and high schools)
The Chronic Absenteeism rate is based on the number of students absent
(excused/unexcused) for 15 or more days during the FSY period. For secondary school
students, a student is considered absent if he/she did not attend more than 50% of
scheduled classes that day.

7
Who (elementary, middle/intermediate and high schools)
Only students enrolled for the FSY are included in these calculations.
How (elementary, middle/intermediate and high schools)
Chronic absenteeism is based on the number of FSY students enrolled at a school
(denominator). The numerator comprises of the number of those FSY students that were
absent, excused or unexcused, for 15 or more days during the FSY period.
Chronic Absenteeism Rate = # of FSY students with 15 or more days absent
# of FSY students enrolled at a school
Progress to English Language Proficiency
Elementary Middle/Intermediate High
% of students meeting
growth to target
Pro% of students meeting growth to target
% of students meeting
growth to target
What (elementary, middle/intermediate, high schools)
Progress to English Language Proficiency is based on the % of students who are proficient
or on-track to proficiency on the ACCESS for ELLs.
Who (elementary, middle/intermediate and high schools)
All students (FSY and non-FSY) taking the ACCESS for ELLs for two or more consecutive
years. Because first year results are for baseline purposes, students’ second (or last tested)
year results that either meet or are on-track to meet proficiency are counted towards the
rate.
How (elementary, middle/intermediate and high schools)
For more information go to DOE Memos and Notices, December 19, 2017, School Year 2017-18 English
Learner Growth to Target School and Student Level Accountability Calculations.
ELP Growth to Target Rate =
# of students meeting or on-track
to meet proficiency
# of students taking the ACCESS for ELLs who are proficient in the
current year and students who took it in the current and prior year
8
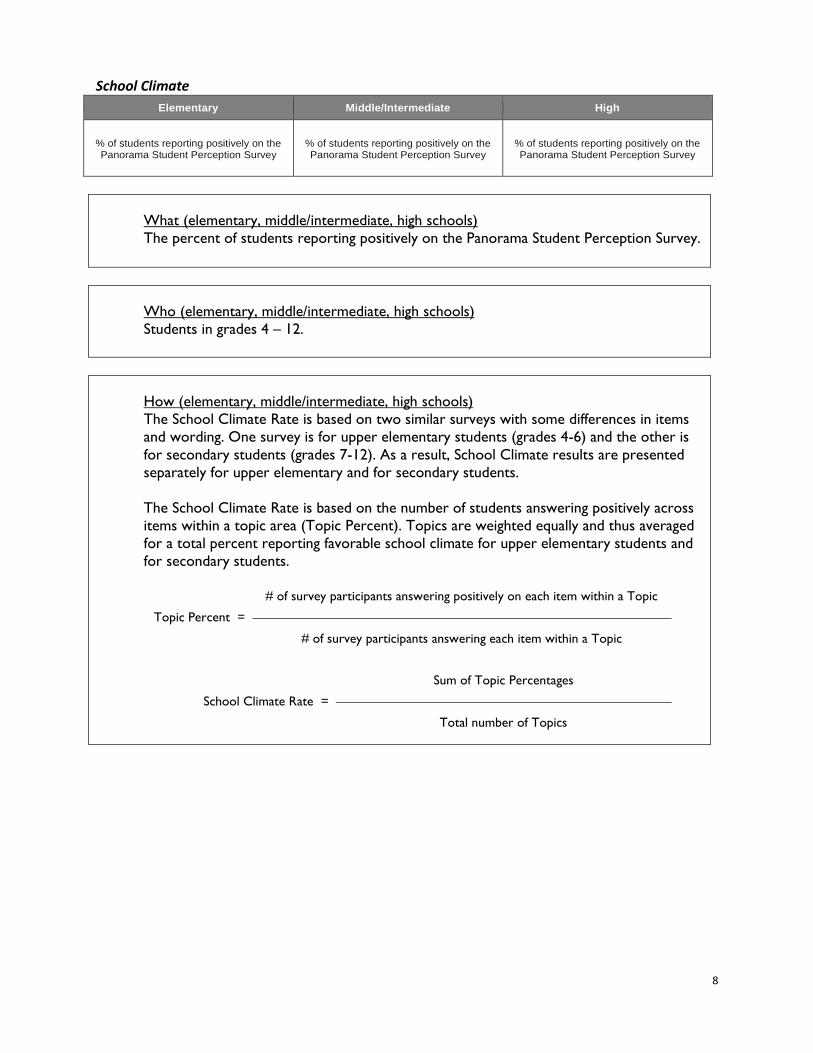
School Climate
Elementary Middle/Intermediate High
% of students reporting positively on the Panorama Student Perception Survey
% of students reporting positively on the Panorama Student Perception Survey
% of students reporting positively on the Panorama Student Perception Survey
What (elementary, middle/intermediate, high schools)
The percent of students reporting positively on the Panorama Student Perception Survey.
Who (elementary, middle/intermediate, high schools)
Students in grades 4 – 12.
How (elementary, middle/intermediate, high schools)
The School Climate Rate is based on two similar surveys with some differences in items
and wording. One survey is for upper elementary students (grades 4-6) and the other is
for secondary students (grades 7-12). As a result, School Climate results are presented
separately for upper elementary and for secondary students.
The School Climate Rate is based on the number of students answering positively across
items within a topic area (Topic Percent). Topics are weighted equally and thus averaged
for a total percent reporting favorable school climate for upper elementary students and
for secondary students.
Topic Percent =
# of survey participants answering positively on each item within a Topic
# of survey participants answering each item within a Topic
School Climate Rate =
Sum of Topic Percentages
Total number of Topics

9
Inclusion Rate
Elementary Middle/Intermediate High
% of students in general education classrooms for 80% or more of the
school day
% of students in general education classrooms for 80% or more of the
school day
% of students in general education classrooms for 80% or more of the
school day
What (elementary, middle/intermediate, high schools)
The percent of students with disabilities that were inside a general education classroom for
80 percent or more of the school day.
This includes students with disabilities placed in:
Regular class with special education/related services provided within regular classes
Regular class with special education/related services outside regular classes
Regular class with special education services provided in resource rooms
Who (elementary, middle/intermediate, high schools)
Students who are IDEA eligible from ages 6 through 21.
How (elementary, middle/intermediate, high schools)
Data are gathered from the December 1st Child Count, which is verified by school level
personnel and reported to the Office of Special Education Programs.
Special Education Inclusion Rate =
# of IDEA students in general education
80% or more of the school day
# of students with IEP aged 6–21 years
Third and Eighth Grade Literacy
Elementary Middle/Intermediate High
% Above or At/Near meeting
3rd grade level standards for reading
% Above or At/Near meeting
8th grade level standards for reading
N/A
What (elementary, middle/intermediate)
The percent of third or eighth grade students Above or At/Near meeting grade level
standards for reading, aka, reading claim level (3 = Above, 2 = At/Near, 1 = Below).
Who (elementary, middle/intermediate)
Third and eighth grade FSY students who took the SBA ELA are included in this calculation.

10
How (elementary, middle/intermediate)
The rate is derived from the number of FSY students taking the SBA ELA who achieved
Above or At/Near for reading, over the total number of FSY students taking the SBA ELA.
Reading Literacy Rate =
# of FSY (3rd or 8th grade) students achieving Above or
At/Near for meeting reading standards
# of FSY (3rd or 8th grade) students taking the SBA ELA
Ninth Grade On-Track
Elementary Middle/Intermediate High
N/A N/A % of first-time 9
th graders
promoted to 10th grade on time
What (high schools)
Percent of first-time 9th graders who promote to 10th grade by the following school year.
Who (high schools)
First-Time 9th graders enrolled at the beginning of the school year. Repeats, mid-year in-
system transfers, and undocumented mainland transfers are excluded.
How (high schools)
The rate is based on students enrolled as first-time 9th graders on the beginning of the year Official Enrollment Count (OEC) (denominator). These students enrolled on the subsequent year OEC as 10th graders comprise the numerator.
Ninth Grade On-Track =
# of first-time 9th graders who promote to
10th grade by the following school year
# of first-time 9th graders

11
Achievement Gap
Elementary Middle/Intermediate High
LA Proficiency Gap LA Proficiency Gap LA Proficiency Gap
Math Proficiency Gap Math Proficiency Gap Math Proficiency Gap
What (elementary, middle/intermediate, high schools)
The point difference between the proficiency rates of non-high needs versus high-needs
students. The gap rate is based on proficiency results for students participating in one of the
following assessments.
Smarter Balanced Assessments in ELA and math
HSA alternate assessments in ELA and math
Kaiapuni Assessment of Educational Outcomes (KAEO) in Hawaii language arts and
math
Who (elementary, middle/intermediate, high schools)
Only FSY students who tested are included in this calculation. The gap rate is a comparison
between Non-High Need (NHN) and High Need (HN) students.
High Need students include the following FSY students who tested:
o Economically disadvantaged students
o Students with disabilities (IDEA only)
o English Language Learners
o Recently exited (2 years) English Language Learners
Non-High Need students comprise of all remaining FSY students who tested.
How (elementary, middle/intermediate, high schools)
The gap rate compares the proficiency rates between the NHN and HN subgroups. The
rate is expressed as a percentage point difference between the two subgroups’ proficiency
rates.
Example
1. NHN % Proficient = 70%
2. HN % Proficient = 40%
3. Achievement Gap = (70% - 40%) = 30 percentage points
Achievement Gap = (NHN % Proficient – HN % Proficient)

12
CTE Concentrator
Elementary Middle/Intermediate High
N/A N/A % of 12
th grade students completing
a CTE Program of Study
What (high schools)
Percent of 12th grade students completing a CTE Program of Study with a grade of D or
higher.
Who (high schools)
Grade 12 FSY students.
How (high schools)
The CTE Concentrator Rate is based on 12th grade FSY students enrolled at a school (denominator). The numerator comprises of 12th grade students who completed a CTE Program of Study with a grade of D or higher.
CTE Concentrator Rate =
# of 12th grade FSY students completing a CTE Program of Study with
a grade of D or higher
# of 12th grade FSY students enrolled at a school
College-Going Graduates
Elementary Middle/Intermediate High
N/A N/A % of graduates enrolling in a post-secondary
institution by the following Fall
What (high schools)
Percent of graduates who enroll in a post-secondary institution by the following Fall.
Includes vocational or trade schools and two- or four-year colleges.
Who (high schools)
All prior school year high school diploma graduates. Post-Secondary enrollment is based on
data reported by the National Student Clearinghouse in collaboration with Hawaii P-20.

13
How (high schools)
The College Going Rate is based on students graduating the school year prior (denominator) who then enrolled into a post-secondary institution by the following Fall (numerator).
College Going Rate =
# enrolling in a post-secondary institution by Fall 2019
# of graduates in SY2018-19
Reporting Results
Strive HI results are reported annually for all Hawaii public schools. Most schools’ results are
reported as is; however, there are several conditions where data are suppressed or adjusted.
Minimum n-size requirement
While the large majority of reports display all of a school’s Strive HI results, there are schools
where some data are not reported due to too few students. Such schools are often small and do
not have enough students to meet the minimum n-size of 20. Where an n-size of 20 is not met with
current year All Students data, up to two prior years of data are pooled to meet the n-size
requirement to report. This pooling is applied to the following measures: LA and Math Proficiency,
ELA and Math Median Growth Percentiles3, Chronic Absenteeism, English Language Proficiency, and
Graduation Rates.
If after prior year(s) pooling an n-size of 20 or more students cannot be met, results for that
measure are denoted in reports by a double hyphen (--). In other instances, a particular measure
may not be applicable to any of the students at the school, e.g., the English Language Proficiency
measure in a school without English Learners. In these instances, such missing data are also denoted
by a double hyphen (--). Last, when a result may compromise student privacy, e.g., 0% proficiency,
such results are suppressed and also denoted by a double hyphen.
FSY Participation Rate Penalty
In an effort to ensure Strive HI results reflect a valid composition of each school’s population, LA
and math participation (SBA, HSA-Alt, KAEO) is monitored and a penalty applied when the All
Students rate drops below 95% participation. This penalty is based only on FSY students, where the
number of students dropping the participation rate below 95% is coded as non-proficient. For
example, 200 FSY students should have tested but only 180 tested that resulted in a participation
rate of 90% (180/200). To meet the 95% requirement, an additional 10 students should have tested:
190/200 = 95%. Incidentally, of the 180 who tested, 90 were proficient resulting in a proficiency
rate of 50%. Because the participation requirement of 95% was not met by 10 students, 10 non-
proficient students are added to the school proficiency rate denominator, effectively reducing the
school’s proficiency from 50% to (90 / (180 +10)) = 47.37%
3 Beginning 2018-19, prior year pooling will be applied to the Percent Meeting Growth measure for HSA-Alt and
KAEO students.
14
The Accountability Data Center (ADC): Strive HI Student-Level Access
Student-Level rosters used to generate Strive HI results are available on the secure, sign-in portion
of the Accountability Data Center (ADC). Where data are missing or suppressed on Strive HI
reports, the individual students and their results underlying the missing/suppressed data can be
reviewed on or exported from the ADC. All school principals and principal designated staff have
access to the sign-in portion of the ADC. Please know that the ADC also allows public access to
Strive HI data that are aggregated at the school-level, and where necessary, suppressed according to
FERPA requirements. For ADC secure, sign-in access requests or questions about this Technical
Guide, contact Glenn Nochi, Evaluation Specialist, via email at [email protected] or at (808)
733-4008.
15
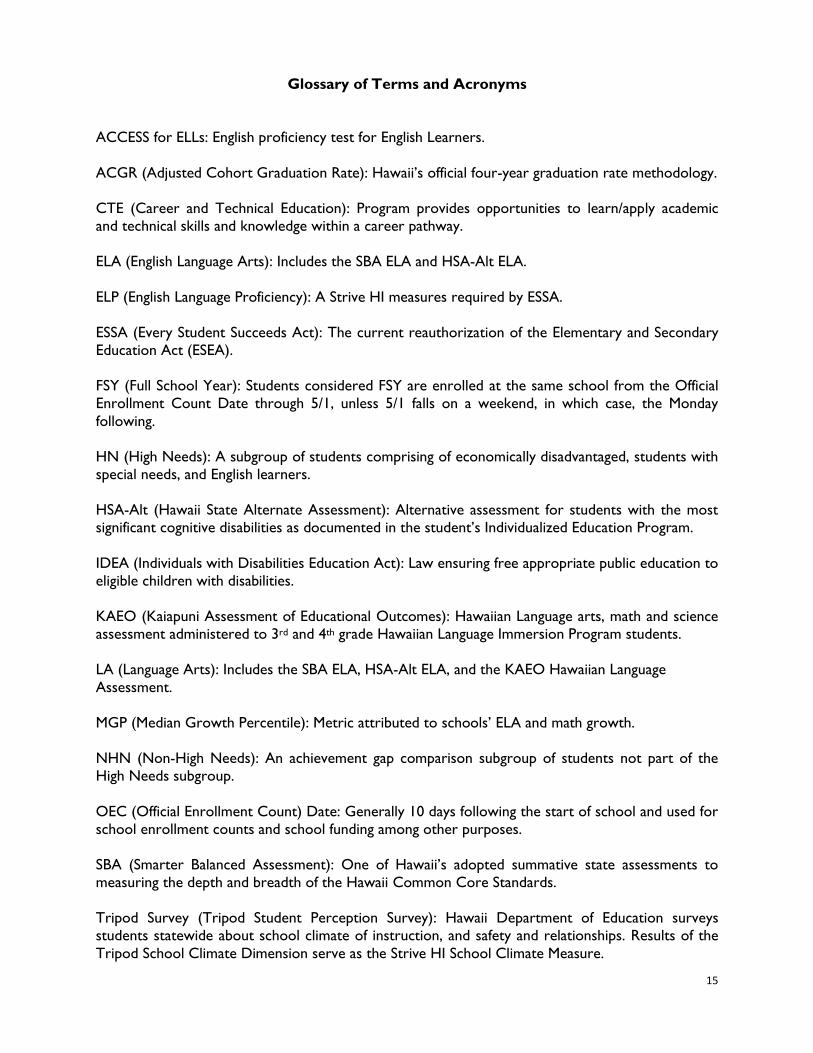
Glossary of Terms and Acronyms
ACCESS for ELLs: English proficiency test for English Learners.
ACGR (Adjusted Cohort Graduation Rate): Hawaii’s official four-year graduation rate methodology.
CTE (Career and Technical Education): Program provides opportunities to learn/apply academic
and technical skills and knowledge within a career pathway.
ELA (English Language Arts): Includes the SBA ELA and HSA-Alt ELA.
ELP (English Language Proficiency): A Strive HI measures required by ESSA.
ESSA (Every Student Succeeds Act): The current reauthorization of the Elementary and Secondary
Education Act (ESEA).
FSY (Full School Year): Students considered FSY are enrolled at the same school from the Official
Enrollment Count Date through 5/1, unless 5/1 falls on a weekend, in which case, the Monday
following.
HN (High Needs): A subgroup of students comprising of economically disadvantaged, students with
special needs, and English learners.
HSA-Alt (Hawaii State Alternate Assessment): Alternative assessment for students with the most
significant cognitive disabilities as documented in the student’s Individualized Education Program.
IDEA (Individuals with Disabilities Education Act): Law ensuring free appropriate public education to
eligible children with disabilities.
KAEO (Kaiapuni Assessment of Educational Outcomes): Hawaiian Language arts, math and science
assessment administered to 3rd and 4th grade Hawaiian Language Immersion Program students.
LA (Language Arts): Includes the SBA ELA, HSA-Alt ELA, and the KAEO Hawaiian Language
Assessment.
MGP (Median Growth Percentile): Metric attributed to schools’ ELA and math growth.
NHN (Non-High Needs): An achievement gap comparison subgroup of students not part of the
High Needs subgroup.
OEC (Official Enrollment Count) Date: Generally 10 days following the start of school and used for
school enrollment counts and school funding among other purposes.
SBA (Smarter Balanced Assessment): One of Hawaii’s adopted summative state assessments to
measuring the depth and breadth of the Hawaii Common Core Standards.
Tripod Survey (Tripod Student Perception Survey): Hawaii Department of Education surveys
students statewide about school climate of instruction, and safety and relationships. Results of the
Tripod School Climate Dimension serve as the Strive HI School Climate Measure.