Embed Size (px)
Citation preview
February 2019
Fiscal Update and Economic StatementIncludes Path to Balance
2018–19 Third Quarter

Treasury Board and Finance, Government of Alberta2018–19 Third Quarter Fiscal Update and Economic Statement, Includes Path to Balance
February 2019
Additional copies of this report may be obtained by visiting our website at: www.alberta.ca/budget-documents.aspx

2018 –19 Third Quarter Fiscal Update and Economic Statement 3
Table of Contents
Fiscal Update and Economic Statement . . . . . . . . . . . . . . . . . . . . . . . . . . 5
2018 –19 Third Quarter Highlights . . . . . . . . . . . . . . . . . . . . . . . . . . . . . . . . . . . . . . . . . . . . . . . . . . . . . . 5
2018 –19 Third Quarter Fiscal Update
Fiscal Plan Highlights . . . . . . . . . . . . . . . . . . . . . . . . . . . . . . . . . . . . . . . . . . . . . . . . . . . . . . . . . . . . . . . 6
Fiscal Plan Summary . . . . . . . . . . . . . . . . . . . . . . . . . . . . . . . . . . . . . . . . . . . . . . . . . . . . . . . . . . . . . . . 6
Revenue and Expense Highlights . . . . . . . . . . . . . . . . . . . . . . . . . . . . . . . . . . . . . . . . . . . . . . . . . . . . . 7
Assets and Liabilities . . . . . . . . . . . . . . . . . . . . . . . . . . . . . . . . . . . . . . . . . . . . . . . . . . . . . . . . . . . . . . . 8
Balance Sheet Summary . . . . . . . . . . . . . . . . . . . . . . . . . . . . . . . . . . . . . . . . . . . . . . . . . . . . . . . . . . . . 8
Revenue . . . . . . . . . . . . . . . . . . . . . . . . . . . . . . . . . . . . . . . . . . . . . . . . . . . . . . . . . . . . . . . . . . . . . . . . . 9
Operating Expense by Ministry . . . . . . . . . . . . . . . . . . . . . . . . . . . . . . . . . . . . . . . . . . . . . . . . . . . . . . . . 10
DebtServicingCosts . . . . . . . . . . . . . . . . . . . . . . . . . . . . . . . . . . . . . . . . . . . . . . . . . . . . . . . . . . . . . . . 10
Disaster / Emergency Assistance Expense . . . . . . . . . . . . . . . . . . . . . . . . . . . . . . . . . . . . . . . . . . . . . . . 11
Capital Amortization Expense . . . . . . . . . . . . . . . . . . . . . . . . . . . . . . . . . . . . . . . . . . . . . . . . . . . . . . . . . 11
Financing Requirements . . . . . . . . . . . . . . . . . . . . . . . . . . . . . . . . . . . . . . . . . . . . . . . . . . . . . . . . . . . . 11
Contingency Account . . . . . . . . . . . . . . . . . . . . . . . . . . . . . . . . . . . . . . . . . . . . . . . . . . . . . . . . . . . . . . . 12
Inventory Consumption Expense . . . . . . . . . . . . . . . . . . . . . . . . . . . . . . . . . . . . . . . . . . . . . . . . . . . . . . 12
Inventory Acquisition . . . . . . . . . . . . . . . . . . . . . . . . . . . . . . . . . . . . . . . . . . . . . . . . . . . . . . . . . . . . . . . 12
Capital Plan Highlights . . . . . . . . . . . . . . . . . . . . . . . . . . . . . . . . . . . . . . . . . . . . . . . . . . . . . . . . . . . . . . 13
Capital Plan Summary . . . . . . . . . . . . . . . . . . . . . . . . . . . . . . . . . . . . . . . . . . . . . . . . . . . . . . . . . . . . . . 13
Economic Outlook
Growth slows amid pipeline constraints . . . . . . . . . . . . . . . . . . . . . . . . . . . . . . . . . . . . . . . . . . . . . . . . . 14
Key Energy and Economic Assumptions . . . . . . . . . . . . . . . . . . . . . . . . . . . . . . . . . . . . . . . . . . . . . . . . . 16
Reporting Methodology and Legislative Compliance . . . . . . . . . . . . . . . . . . . . . . . . . . . . . . . . . . . . . . . 17
Notes on restatements of numbers . . . . . . . . . . . . . . . . . . . . . . . . . . . . . . . . . . . . . . . . . . . . . . . . . . . . . . . . 18
Note: Amounts presented in tables may not add to totals due to rounding.
...continued

2018 –19 Third Quarter Fiscal Update and Economic Statement4
Path to Balance . . . . . . . . . . . . . . . . . . . . . . . . . . . . . . . . . . . . . . . . . . . . . . 19
Introduction . . . . . . . . . . . . . . . . . . . . . . . . . . . . . . . . . . . . . . . . . . . . . . . . . . . . . . . . . . . . . . . . . . . . . . . . . 21
Economic and Revenue Outlook . . . . . . . . . . . . . . . . . . . . . . . . . . . . . . . . . . . . . . . . . . . . . . . . . . . . . . . . 22
Progress Has Been Made . . . . . . . . . . . . . . . . . . . . . . . . . . . . . . . . . . . . . . . . . . . . . . . . . . . . . . . . . . . . 22
Market Access Creates Headwinds in 2019 . . . . . . . . . . . . . . . . . . . . . . . . . . . . . . . . . . . . . . . . . . . . . . 23
Lack of Pipelines Weighs on Alberta Oil Prices . . . . . . . . . . . . . . . . . . . . . . . . . . . . . . . . . . . . . . . . . . . . 23
Global Oil Prices to Remain Well Below 2014 Levels . . . . . . . . . . . . . . . . . . . . . . . . . . . . . . . . . . . . . . . 24
Solid Fundamentals Support Medium Term Growth . . . . . . . . . . . . . . . . . . . . . . . . . . . . . . . . . . . . . . . . 24
Growth Broadens, Manufacturing Expands . . . . . . . . . . . . . . . . . . . . . . . . . . . . . . . . . . . . . . . . . . . . . . . 24
Labour Market Resilient . . . . . . . . . . . . . . . . . . . . . . . . . . . . . . . . . . . . . . . . . . . . . . . . . . . . . . . . . . . . . 25
Revenue Improves as Economy Moves into Expansion . . . . . . . . . . . . . . . . . . . . . . . . . . . . . . . . . . . . . 26
The Fiscal Challenge . . . . . . . . . . . . . . . . . . . . . . . . . . . . . . . . . . . . . . . . . . . . . . . . . . . . . . . . . . . . . . . . . . 27
Weathering Volatility . . . . . . . . . . . . . . . . . . . . . . . . . . . . . . . . . . . . . . . . . . . . . . . . . . . . . . . . . . . . . . . . 27
LongLastingEffectsofOilPriceShock . . . . . . . . . . . . . . . . . . . . . . . . . . . . . . . . . . . . . . . . . . . . . . . . . . 28
Government’s Response to the Downturn . . . . . . . . . . . . . . . . . . . . . . . . . . . . . . . . . . . . . . . . . . . . . . . . 29
Looking Forward: The Path to Balance . . . . . . . . . . . . . . . . . . . . . . . . . . . . . . . . . . . . . . . . . . . . . . . . . . . 30
1)EnhancedMarketAccessandMoreDiversifiedEconomy . . . . . . . . . . . . . . . . . . . . . . . . . . . . . . . . . 30
2) Protecting Core Public Services While Containing Costs . . . . . . . . . . . . . . . . . . . . . . . . . . . . . . . . . . 31
3) A Fairer and More Stable Revenue Structure that Maintains Alberta’s Tax Advantage . . . . . . . . . . . . 34
Stabilization and Decline in Debt Burden . . . . . . . . . . . . . . . . . . . . . . . . . . . . . . . . . . . . . . . . . . . . . . . . 35
Table of Contents, continued
2018 –19 Third Quarter Fiscal Update and Economic Statement 5
2018 –19 Third Quarter Highlights
Deficit lowerThe2018-19deficitisnowforecastat $6 .9 billion, $1 .9 billion lower than estimated in Budget 2018 .
● Total revenue of $49 .6 billion is forecast, up $1 .8 billion from budget, due primarily to higher resource revenue, personal income tax revenue and federal transfers, partially offset by lower investment income and corporate income tax revenue .
● Total expense of $56 .6 billion is forecast, up $398 million from Budget 2018, with $271 million of this due to provision of disaster assistance for wildfires, floods and the agriculture sector .
● Operating expense increases of a net $96 million include funding for caseloads, costs per case and indexation of social programs for children, seniors, low income and disabled Albertans, as well as for the Lubicon Lake First Nation settlement, pipeline advocacy, Ministerial Panel on Child Intervention recommendations, Legal Aid, rural crime initiatives and municipal support for cannabis legalization .
● Other expense is decreasing by a net $93 million, primarily due to reduced debt servicing costs and capital grants .
● 2018-19 Capital Plan spending is forecast at $6 .6 billion, a slight increase from budget due mainly to re-profiling to meet revised project timelines .
● Mainly as a result of the lower deficit, borrowing for the 2018-19 Fiscal Plan and Capital Plan is now projected to be $2 billion lower than initially estimated in Budget 2018 .
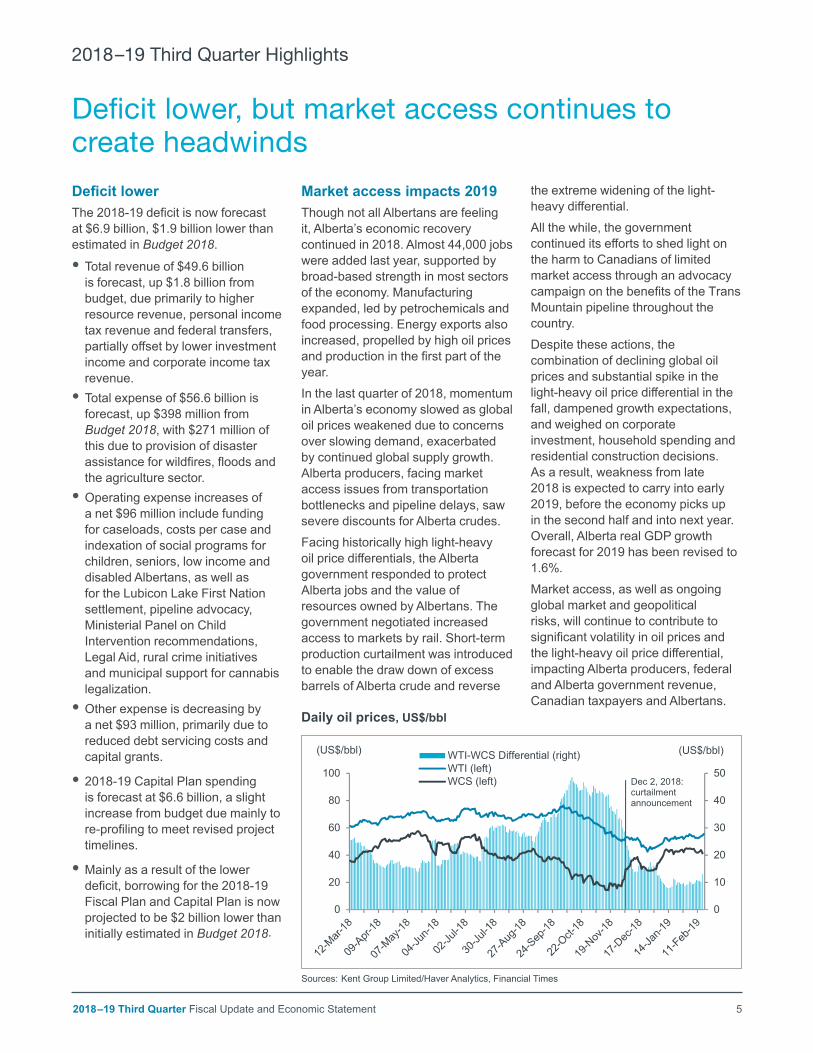
Market access impacts 2019Though not all Albertans are feeling it, Alberta’s economic recovery continued in 2018 . Almost 44,000 jobs were added last year, supported by broad-based strength in most sectors of the economy . Manufacturing expanded, led by petrochemicals and food processing . Energy exports also increased, propelled by high oil prices andproductioninthefirstpartoftheyear .In the last quarter of 2018, momentum in Alberta’s economy slowed as global oil prices weakened due to concerns over slowing demand, exacerbated by continued global supply growth . Alberta producers, facing market access issues from transportation bottlenecks and pipeline delays, saw severe discounts for Alberta crudes . Facing historically high light-heavy oilpricedifferentials,theAlbertagovernment responded to protect Alberta jobs and the value of resources owned by Albertans . The government negotiated increased access to markets by rail . Short-term production curtailment was introduced to enable the draw down of excess barrels of Alberta crude and reverse
the extreme widening of the light-heavydifferential.All the while, the government continueditseffortstoshedlightonthe harm to Canadians of limited market access through an advocacy campaignonthebenefitsoftheTransMountain pipeline throughout the country .Despite these actions, the combination of declining global oil prices and substantial spike in the light-heavyoilpricedifferentialinthefall, dampened growth expectations, and weighed on corporate investment, household spending and residential construction decisions . As a result, weakness from late 2018 is expected to carry into early 2019, before the economy picks up in the second half and into next year . Overall, Alberta real GDP growth forecast for 2019 has been revised to 1 .6%.
Market access, as well as ongoing global market and geopolitical risks, will continue to contribute to significantvolatilityinoilpricesandthelight-heavyoilpricedifferential,impacting Alberta producers, federal and Alberta government revenue, Canadian taxpayers and Albertans .
Deficit lower, but market access continues to create headwinds
Sources: Kent Group Limited/Haver Analytics, Financial Times
Q2 2016 ‐ Second Quarter Fiscal and Economic Overview PDF name: chrt_01.pdf
WCS prices under pressureDaily energy prices, US$/bbl
Source: Kent Group Limited/Haver Analytics, Financial Times
chrt_01
0
10
20
30
40
50
0
20
40
60
80
100
(US$/bbl)(US$/bbl) WTI-WCS Differential (right)WTI (left)WCS (left) Dec 2, 2018:
curtailment announcement
\\ter‐fin‐fs‐01\Publications\_Economics_publications\Quarterly Economic Statement\Q3_EconomicUpdate_2018‐19\Source_documents\: Q3‐2019‐20_Fiscal and Economic Overview (Econ):Chart 1 wtiwcs Last updated: 2019‐02‐20: 9:58 AM
Daily oil prices, US$/bbl

2018 –19 Third Quarter Fiscal Update and Economic Statement6
Fiscal Plan HighlightsA deficit of $6 .9 billion is forecast for 2018-19, $1 .9 billion lower than estimated in Budget 2018, due mainly to higher revenue . The $0 .5 billion risk adjustment has been removed .
Total revenue of $49 .6 billion is forecast, up $1 .8 billion from budget, with increases in resource revenue, personal income tax and federal transferspartlyoffsetbylowerinvestment income and corporate income tax revenue .
Total expense of $56 .6 billion has increased $398 million from budget, primarily due to disaster assistance, pension provisions and operating expense:
● Total operating expense is forecast at $48 .9 billion, a net $96 million increase from budget . Increases of $228 million mainly reflect Trans Mountain pipeline advocacy, the Lubicon Lake First Nation
settlement, and caseload growth and indexation of social programs . These are partly offset by a decrease of $132 million in Climate Leadership Plan (CLP) operating expense, mainly from $85 million transfered to CLP capital, and from reduced program requirements .
● Disaster assistance is $271 million higher than budget, with increases for wildfire fighting, agriculture and municipal flood support .
● Capital grants have decreased by a net $51 million, primarily due to re-profiling carbon capture and storage projects and federally-funded municipal infrastructure programs to future years .
● Other expense is a net $81 million higher than budget . The reduction in unfunded pension liabilities has decreased $123 million (increasing expense), partly offset by lower debt servicing costs of $48 million .
Capital Plan support is forecast at $6 .6 billion, a $119 million increase from budget . Decreases fromre-profilingofhealth,housing,federally-funded municipal grants, carbon capture and storage and otherprojects,arelargelyoffsetbyremoving the budgeted $391 million cashflowadjustment,asintended.Direct borrowing for the 2018-19 Fiscal Plan is now estimated to be $4 .8 billion, $2 .2 billion lower than budget, due primarily to the lower deficit.DirectborrowingfortheCapital Plan is forecast at $4 billion, $261 million higher than budget, due mainly to the increased Capital Plan and lower funding from the Alberta Social Housing Corporation .
pdf named: 3Q_18-19_is-cp.pdf 2018-19, 3rd Quarter Fiscal Update
Fiscal Plan Summary(millions of dollars)
Change2017-18 from
Income Statement Actual Budget Forecast BudgetRevenue
Income tax revenue 14,223 15,938 16,225 287 Other tax revenue 6,538 6,961 6,864 (97) Non-renewable resource revenue 4,980 3,829 5,521 1,692 Other revenue 21,553 21,152 21,039 (113)
Total Revenue 47,295 47,879 49,649 1,770
ExpenseOperating expense 46,229 47,765 47,986 221 Climate Leadership Plan operating expense 521 1,035 903 (132) Crude-by-rail operating expense - - 7 7 Disaster assistance (with operating support for 2013 flood / 2016 Wood Buffalo fire) 439 206 477 271 Capital grants (including 2013 flood support) 3,628 1,706 1,635 (71) Climate Leadership Plan capital grants 394 423 444 20 Amortization / inventory consumption / disposal losses 3,282 3,434 3,440 6 General debt servicing costs 659 1,027 981 (46) Capital Plan debt servicing costs 761 895 893 (2) Pension provisions (593) (310) (187) 123
Total Expense 55,318 56,181 56,579 398 Risk Adjustment - (500) - 500 Surplus / (Deficit) (8,023) (8,802) (6,930) 1,872
Capital PlanCapital grants 3,628 1,706 1,635 (71) Capital investment 4,974 4,123 4,301 178 Climate Leadership Plan (capital grants) 394 423 444 20 Climate Leadership Plan (capital investment) 25 192 184 (8)
Total Capital Plan 9,021 6,444 6,563 119
Fiscal Year2018-19
M:\MinShare\PublnsProd\CorpFin\OBM.PUBLNS-2018-19\2018-19_Q3-Report\3Q_18-19_source-files\3Q_18-19_ Report tables.xlsx /FP Sum - IncSt 2/12/2019/8:42 PM
2018–19 Third Quarter Fiscal Update
Fiscal Plan Summary (millions of dollars)
2018 –19 Third Quarter Fiscal Update and Economic Statement 7
Total Revenue is forecast to be $49 .6 billion, $1 .8 billion higher than estimated in Budget 2018 .
● Resource revenue is forecast to be $5 .5 billion, $1 .7 billion higher than estimated in budget, mainly due to a lower US-Canadian dollar exchange rate and increased oil prices, partly offset by a wider light-heavy oil price differential .
● Bitumen royalties are forecast at $3 .4 billion, $1 .6 billion higher than budget . The West Texas Intermediate (WTI) oil price is forecast at US$62 per barrel, up $3 from budget . The monthly average for the first ten months of the fiscal year (April 2018 to January 2019) has been US$64 .01, and is anticipated to average US$52 .26 per barrel for February and March . The exchange rate is forecast at 76US¢/Cdn$, 4 cents lower than budget . The light-heavy oil price differential has swung dramatically this fiscal year, but is now expected to average US$23 .50 per barrel, US$1 .10 wider than budget .
● Natural gas and by-products royalties of $446 million are forecast, $95 million lower than budget, mainly due to lower natural gas prices . The Alberta Reference Price is forecast at Cdn$1 .30 per gigajoule, down 70 cents .
● Personal income tax revenue is forecast at $12 .1 billion, an increase of $750 million from budget due primarily to higher-than-expected 2017 assessments . The updated 2017 results elevate the base used to forecast future years, and require a positive $464 million prior-years’ adjustment (the 2017 portion of 2016-17 and 2017-18 revenue was under-reported) .
● Corporate income tax revenue is forecast at $4 .1 billion, a decrease of $463 million from budget due to weaker gross cash receipts, reflecting the impacts of the wider light-heavy oil price differential
and related slowdown in economic activity .
● Other tax revenue is forecast at $6 .9 billion, $97 million lower than budget, due mainly to a revised forecast for the carbon levy .
● Federal transfers are forecast at $8 .4 billion, a $150 million increase from budget, comprising mainly a $252 million fiscal stabilization payment arising from the revenue decline in 2016-17, and $15 million for municipal flood disaster support, partly offset by re-profiling municipal infrastructure transfers, lower agriculture insurance premiums and reductions in health and social transfers .
● Investment income is forecast at $2 .5 billion, $343 million lower, due to weaker market returns and to reduced Alberta Capital Finance Authority (ACFA) income from lower payments on loan swaps (a similar impact on debt swaps decreases debt servicing costs) .
● Total revenue from other sources is forecast at $10 .1 billion, $80 million higher than budget . Increases from the Balancing Pool and AGLC, are mostly offset by decreases in ATB Financial and Alberta Petroleum Marketing Commission net income, from higher credit loss provisions and the delay in opening the Sturgeon Refinery . Increases in Alberta Health Services (AHS) fees, from out-of-province patients, and in timber rentals and fees, from higher lumber prices, are partly offset by lower agriculture insurance revenue, primarily from lower premium rates . Lower revenue from emissions reduction compliance payments is more than offset by higher revenue from AHS, mainly from WCB for service provision, and from pension plans for their share of external investment management costs .
Total Expense is forecast to be $56 .6 billion, $398 million higher than estimated in Budget 2018 .
● Total operating expense (including Climate Leadership Plan and crude-by-rail) is forecast at $48 .9 billion, a net increase of $96 million from budget .
● Operating expense increases of a net $221 million include funding for implementation of child intervention panel recommendations, indexation and caseload growth in various social programs, the Lubicon Lake First Nation settlement, contaminated site remediation, enhanced indigenous consultation, Legal Aid improvements, municipal support for cannabis legalization, public advocacy on Trans Mountain pipeline benefits, rural crime initiatives, election enumeration costs, partly offset by various decreases primarily from lower agriculture insurance indemnities .
● CLP operating expense has decreased by $132 million, mainly from transfers to capital .
● Capital grants are forecast at $2 .1 billion, $51 million lower than budget, due mainly to re-profiling carbon capture and storage and federally-funded municipal grants to future years, partly offset by increases mainly due to transfers from CLP operating expense .
● Disaster assistance of $477 million is forecast, with $200 million in agriculture support from spring drought and fall snow conditions, $193 million for wildfire fighting, and municipal support for spring flooding of $81 million . These are partially offset by re-profiling floodway relocation support .
● Other expense is forecast to be a net $81 million higher than budget . The reduction in unfunded pension liabilities is now estimated to be $123 million lower than expected (increasing expense), while debt servicing costs are estimated to be down $48 million, mainly from reduced 2018-19 borrowing requirements and lower ACFA swap costs .
Revenue and Expense Highlights

2018 –19 Third Quarter Fiscal Update and Economic Statement8
Assets and Liabilities
a Budgetnumbershavebeenrestatedtoreflect2017-18actualresults.
Financial Assets of $77 billion are forecast for March 31, 2019, an increase of $6 billion from 2018 .
● Heritage Fund, endowment and other fund assets are increasing by $0 .4 billion, from inflation-proofing and net income retention .
● Consistent with government policy and to take advantage of current market opportunities, $6 .3 billion has been pre-borrowed for 2019-20 . This cash is retained in the Contingency Account . More details are provided on page 10 .
● Assets of self-supporting lending organizations (Agriculture Financial Services Corporation {AFSC} and Alberta Capital Finance Authority) are increasing $437 million .
● Cash of $55 million in the Capital Plan financing account is being withdrawn to fund capital spending .
● Other financial assets are increasing a net $0 .5 billion .
Liabilities of $105 .1 billion are forecast for March 31, 2019 . Fiscal Plan and Capital Plan liabilities on March 31, 2019 are forecast at $58 .6 billion . This includes $6 .3 billion in advance borrowing for 2019-20 reported as a financial asset .
● Direct borrowing for the 2018-19 Fiscal Plan is now forecast to be $4 .8 billion, $2 .2 billion lower than estimated in budget .
● Liabilities for capital projects on March 31, 2019 are forecast to be $4 .1 billion higher than they were on March 31, 2018, due to direct borrowing of $4 billion, alternative financing of $92 million, less principal repayments on completed private-public partnership projects (P3s) of $64 million .
● Self-supporting lending organization liabilities are increasing $266 million . AFSC assets exceed liabilities by about $3 billion .
● Other liabilities are decreasing by $0 .5 billion, while government obligations for pension plan liabilities are down $0 .2 billion .
Net financial debt(thedifferencebetweenfinancialassetsandliabilities) on March 31, 2019 is estimated to be $28 .1 billion .Capital and other non-financial assets of $50 .9 billion are forecast for March 31, 2019, a $1 .9 billion net increase from March 31, 2018 . Thisreflects:additionof$4.5billionin capital assets less $2 .5 billion in amortization; addition of $1 billion in inventory assets (e .g . vaccines, highway maintenance gravel) less consumption of $1 billion; addition of $0 .3 billion in crude-by-rail pre-paid expense; and a net increase of $0 .5 billion in deferred capital contributions .
Net Assets of $22 .7 billion are forecast for March 31, 2019, a $6 .9 billion decrease from 2018, reflectingthedeficitfor2018-19.pdf named: 3Q_18-19_bs.pdf 2018-19, 3rd Quarter Fiscal Update
Balance Sheet Summary(millions of dollars)
Change2018 from
Actual Budgeta Forecast 2018Financial Assets
Heritage Fund, endowment and other funds 20,306 20,763 20,726 420 Contingency Account 1,661 - 6,342 4,681 Self-supporting lending organizations 21,471 22,592 21,908 437 Capital Plan financing account 55 55 - (55) Other financial assets (includes SUCH sector) 27,484 28,555 27,997 513
Total Financial Assets 70,977 71,965 76,973 5,996 Liabilities
Liabilities for capital projects 29,339 33,192 33,419 4,080 Debt for pre-1992 Teachers' Pension Plan 944 944 944 - Direct borrowing for the Fiscal Plan 13,079 20,117 24,240 11,161 Self-supporting lending organizations 18,661 19,451 18,927 266 Other liabilities (includes SUCH sector) 18,868 18,726 18,327 (541) Pension liabilities 9,430 9,120 9,243 (187)
Total Liabilities 90,321 101,550 105,100 14,779 Net Financial Assets / (Debt) (19,344) (29,585) (28,127) (8,783)
Capital / other non-financial assets 52,024 53,854 54,337 2,313 Spent deferred capital contributions (3,009) (3,400) (3,469) (460)
Net Assets 29,671 20,869 22,741 (6,930) Change in Net Assets (before adjustments) (8,023) (8,802) (6,930) 1,093
At March 312019
M:\MinShare\PublnsProd\CorpFin\OBM.PUBLNS-2018-19\2018-19_Q3-Report\3Q_18-19_source-files\3Q_18-19_ Report tables.xlsx /FP Sum BalSh 2/20/2019/9:44 PM
Balance Sheet Summary (millions of dollars)

2018 –19 Third Quarter Fiscal Update and Economic Statement 9
pdf named: 3Q_18-19_rev.pdf 2018-19, 3rd Quarter Fiscal Update
Revenue(millions of dollars)
Change2017-18 from
Actual Budget Forecast BudgetIncome Taxes
Personal income tax 10,775 11,387 12,137 750 Corporate income tax 3,448 4,551 4,088 (463)
14,223 15,938 16,225 287 Other Taxes
Education property tax 2,450 2,446 2,446 - Fuel tax 1,399 1,414 1,412 (2) Tobacco / cannabis taxes 908 932 919 (13) Insurance taxes 582 641 626 (15) Freehold mineral rights tax 67 87 71 (16) Tourism levy 85 85 88 3 Carbon levy 1,046 1,356 1,302 (54)
6,538 6,961 6,864 (97) Non-Renewable Resource Revenue
Bitumen royalty 2,643 1,785 3,387 1,602 Crude oil royalty 965 1,053 1,171 118 Natural gas and by-products royalty 645 541 446 (95) Bonuses and sales of Crown leases 564 327 369 42 Rentals and fees / coal royalty 164 123 148 25
4,980 3,829 5,521 1,692 Transfers from Government of Canada
Canada Health Transfer 4,325 4,521 4,461 (60) Canada Social Transfer 1,600 1,657 1,637 (20) Direct transfers to SUCH sector / Alberta Innovates Corp. 482 520 520 - Agriculture support programs 349 308 295 (13) Infrastructure support 391 510 471 (39) Labour market agreements 233 250 250 - Other 226 452 734 282
7,606 8,218 8,368 150 Investment Income
Alberta Heritage Savings Trust Fund 1,926 1,653 1,374 (279) Endowment funds 427 336 283 (53) Alberta Capital Finance Authority 245 345 323 (22) Agriculture Financial Services Corporation 122 135 135 - Other (includes SUCH sector / Contingency Account) 405 415 426 11
3,126 2,884 2,541 (343) Net Income from Government Business Enterprises
AGLC – Gaming / lottery 1,417 1,439 1,466 27 AGLC – Liquor / cannabis 866 794 808 14 ATB Financial 278 242 157 (85) Balancing Pool 763 161 253 92 Other – CUDGCo / APMC 63 141 102 (39)
3,387 2,777 2,786 9 Premiums, Fees and Licences
Post-secondary institution tuition fees 1,202 1,237 1,237 - Health / school board fees and charges 711 664 686 22 Motor vehicle licences 508 513 514 1 Crop, hail and livestock insurance premiums 348 375 319 (56) Energy industry levies 292 333 333 - Other (includes land titles, land and grazing, health benefits premiums) 779 733 819 86
3,839 3,854 3,908 54 Other
SUCH sector sales, rentals and services 1,010 1,040 1,082 42 SUCH sector fundraising, donations and gifts 823 639 639 - AIMCo investment management charges 383 342 357 15 Fines and penalties 215 225 225 - Refunds of expense 463 195 196 1 Climate change and emissions management 250 541 485 (56) Miscellaneous 451 437 452 15
3,595 3,419 3,436 17 Total Revenue 47,295 47,879 49,649 1,770
Fiscal Year2018-19
2/12/2019/8:44 PM
Revenue (millions of dollars)

2018 –19 Third Quarter Fiscal Update and Economic Statement10
pdf named: 3Q_18-19_dbs.pdf 2018-19, 3Q Fiscal Update
Debt Servicing Costs(millions of dollars)
Change2017-18 fromActual Budget Forecast Budget
GeneralAdvanced Education – post-secondary institutions 39 42 44 2 Agriculture and Forestry – Agriculture Financial Services Corporation 68 71 71 - Education – school boards 13 10 9 (1) Health – Alberta Health Services 16 16 16 - Seniors and Housing – Alberta Social Housing Corporation 6 5 5 - Treasury Board and Finance – Alberta Capital Finance Authority / other 517 883 836 (47)
Total general debt servicing costs 659 1,027 981 (46) Capital Plan
Education – Alberta Schools Alternative Procurement P3s 29 28 28 - Transportation – ring road P3s 94 92 92 - Treasury Board and Finance – direct borrowing 638 775 773 (2)
Total Capital Plan debt servicing costs 761 895 893 (2) Total Debt Servicing Costs 1,420 1,921 1,874 (47)
Fiscal Year2018-19
M:\MinShare\PublnsProd\CorpFin\OBM.PUBLNS-2018-19\2018-19_Q3-Report\3Q_18-19_source-files\3Q_18-19_ Report tables.xlsx /Debt Servicing Costs 8 2/10/2019/7:39 PM
Debt Servicing Costs (millions of dollars)
pdf named: 3Q_18-19_rev.pdf 2018-19, 3rd Quarter Fiscal Update
Operating Expense by Ministry(millions of dollars)
Change2017-18 from
Actual Budget Forecast BudgetAdvanced Education 5,512 5,604 5,583 (21) Agriculture and Forestry 962 1,045 991 (54) Children's Services 1,401 1,470 1,493 23 Community and Social Services 3,428 3,621 3,649 28 Culture and Tourism 293 298 299 1 Economic Development and Trade 284 277 286 9 Education 7,905 7,993 7,993 - Energy 435 473 487 14 Environment and Parks 417 411 463 52 Executive Council 16 17 17 - Health 19,759 20,563 20,563 - Indigenous Relations 167 180 204 24 Infrastructure 490 489 489 - Justice and Solicitor General 1,405 1,430 1,464 34 Labour 185 219 216 (3) Municipal Affairs 233 258 273 15 Seniors and Housing 593 608 625 17 Service Alberta 509 564 580 16 Status of Women 7 7 7 - Transportation 454 432 441 9 Treasury Board and Finance 1,654 1,644 1,694 50 Legislative Assembly 117 161 170 9 Operating Expense – excluding Climate Leadership Plan / crude-by-rail 46,229 47,765 47,986 221 Crude-by-rail (Energy) - - 7 7 Climate Leadership Plan:
Agriculture and Forestry 11 42 42 - Economic Development and Trade 2 46 24 (22) Energy 34 106 92 (14) Environment and Parks 151 280 189 (91) Indigenous Relations 16 20 17 (3) Treasury Board and Finance 306 532 531 (1) Other (Infrastructure / Labour / Service Alberta / Transportation) 2 8 8 -
Total Climate Leadership Plan Operating Expense 521 1,035 903 (132) Total Operating Expense 46,750 48,800 48,896 96
Fiscal Year2018-19
2/11/2019/9:37 PM
Operating Expense by Ministry (millions of dollars)

2018 –19 Third Quarter Fiscal Update and Economic Statement 11
pdf named: 3Q_18-19_rev.pdf 2018-19, 3rd Quarter Fiscal Update
Disaster / Emergency Assistance Expense(millions of dollars)
Change2017-18 fromActual Budget Forecast Budget
Agriculture and Forestry – wildfires 201 - 193 193 Agriculture and Forestry – agriculture indemnities / AgriStability 207 - 200 200 Municipal Affairs – Wood Buffalo wildfire / other 23 1 82 81 2013 Alberta flood assistance (Comm. and Soc. Serv. / Envt. / Ind. Rel. / Infra.) 7 5 2 (3) Unallocated - 200 - (200) Total Disaster / Emergency Assistance 439 206 477 271
Fiscal Year2018-19
2/10/2019/7:37 PM
Disaster / Emergency Assistance Expense (millions of dollars)
pdf named: 3Q_18-19_rev.pdf 2018-19, 3rd Quarter Fiscal Update
Capital Amortization Expense(millions of dollars)
Change2017-18 fromActual Budget Forecast Budget
Advanced Education 496 537 537 - Agriculture and Forestry 24 28 28 - Economic Development and Trade 5 8 7 (1) Education 372 354 354 - Energy 16 14 14 - Environment and Parks 49 70 70 - Health 554 551 551 - Infrastructure 108 121 122 1 Justice and Solicitor General 3 6 6 - Seniors and Housing 36 39 35 (4) Service Alberta 92 127 127 - Transportation 555 586 586 - Treasury Board and Finance 20 22 22 - Other a 7 13 14 1 Total Amortization Expense 2,337 2,477 2,473 (4)
Fiscal Year2018-19
2/10/2019/7:38 PM
Capital Amortization Expense (millions of dollars)
a Other includes Children’s Services, Culture and Tourism, Community and Social Services, Indigenous Relations, Labour, Legislative Assembly and Municipal Affairs .
pdf named: 3Q_18-19_finr.pdf 2018-19, 3Q Fiscal Update
2018-19 Financing Requirements a
(millions of dollars)
Actual Increase in Budget Change to Increase inFinancing Maturities Financing Estimate Estimate Forecast Maturities Financing
Financing Requirements Direct borrowing for the Capital Plan 5,434 - 5,434 4,272 261 4,533 (500) 4,033 Direct borrowing for the Fiscal Plan 4,494 - 4,494 7,038 4,123 11,161 - 11,161 Cash Reserve 5,000 - 5,000 5,000 - 5,000 (5,000) - Borrowing for the Orphan Well Association 50 - 50 145 - 145 (50) 95 Borrowing for working capital 82 (1,150) (1,068) 1,000 (900) 100 (82) 18 Borrowing for government organizations and business enterprises:
Agriculture Financial Services Corp. 183 (169) 14 406 (108) 298 (271) 27 Alberta Capital Finance Authority 4,162 (4,167) (5) 3,760 399 4,159 (3,720) 439 Alberta Petroleum Marketing Comm. 445 (331) 114 675 44 719 (445) 274 ATB Financial 2,769 (1,000) 1,769 3,000 (6) 2,994 (2,974) 20 Balancing Pool 804 (232) 572 810 16 826 (804) 22
Total Financing Requirements 23,423 (7,049) 16,374 26,106 3,829 29,935 (13,846) 16,089
2017-18 2018-19
M:\MinShare\PublnsProd\CorpFin\OBM.PUBLNS-2018-19\2018-19_Q3-Report\3Q_18-19_source-files\3Q_18-19_ Report tables.xlsx /Financing Rqts 9 2/20/2019/9:45 PM
a Includesbothnewfinancingrequirementsandmoneymarketandlong-termdebtmaturities.Long-termdebtissuanceisforecasttobe$19.6billionfor2018-19and for 2019-20 pre-borrowing . Approximately $19 .1 billion has been borrowed to date (February 20, 2019) .
Financing Requirements a (millions of dollars)
2018 –19 Third Quarter Fiscal Update and Economic Statement12
pdf named: 3Q_18-19_ContAcct.pdf 2018-19, 3Q Fiscal Update
Contingency Account(millions of dollars)
Change2017-18 fromActual Budget Forecast Budget
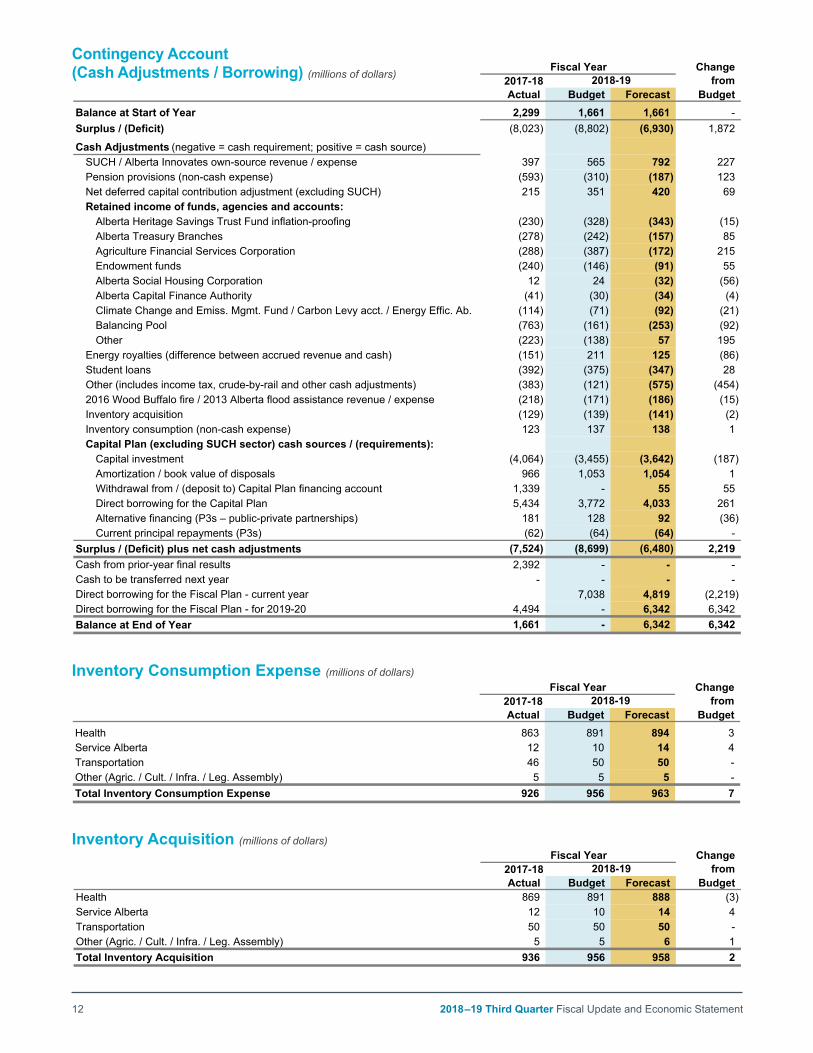
Balance at Start of Year 2,299 1,661 1,661 - Surplus / (Deficit) (8,023) (8,802) (6,930) 1,872
Cash Adjustments (negative = cash requirement; positive = cash source)SUCH / Alberta Innovates own-source revenue / expense 397 565 792 227 Pension provisions (non-cash expense) (593) (310) (187) 123 Net deferred capital contribution adjustment (excluding SUCH) 215 351 420 69 Retained income of funds, agencies and accounts:
Alberta Heritage Savings Trust Fund inflation-proofing (230) (328) (343) (15) Alberta Treasury Branches (278) (242) (157) 85 Agriculture Financial Services Corporation (288) (387) (172) 215 Endowment funds (240) (146) (91) 55 Alberta Social Housing Corporation 12 24 (32) (56) Alberta Capital Finance Authority (41) (30) (34) (4) Climate Change and Emiss. Mgmt. Fund / Carbon Levy acct. / Energy Effic. Ab. (114) (71) (92) (21) Balancing Pool (763) (161) (253) (92) Other (223) (138) 57 195
Energy royalties (difference between accrued revenue and cash) (151) 211 125 (86) Student loans (392) (375) (347) 28 Other (includes income tax, crude-by-rail and other cash adjustments) (383) (121) (575) (454) 2016 Wood Buffalo fire / 2013 Alberta flood assistance revenue / expense (218) (171) (186) (15) Inventory acquisition (129) (139) (141) (2) Inventory consumption (non-cash expense) 123 137 138 1 Capital Plan (excluding SUCH sector) cash sources / (requirements):
Capital investment (4,064) (3,455) (3,642) (187) Amortization / book value of disposals 966 1,053 1,054 1 Withdrawal from / (deposit to) Capital Plan financing account 1,339 - 55 55 Direct borrowing for the Capital Plan 5,434 3,772 4,033 261 Alternative financing (P3s – public-private partnerships) 181 128 92 (36) Current principal repayments (P3s) (62) (64) (64) -
Surplus / (Deficit) plus net cash adjustments (7,524) (8,699) (6,480) 2,219 Cash from prior-year final results 2,392 - - - Cash to be transferred next year - - - - Direct borrowing for the Fiscal Plan - current year 7,038 4,819 (2,219) Direct borrowing for the Fiscal Plan - for 2019-20 4,494 - 6,342 6,342 Balance at End of Year 1,661 - 6,342 6,342
Fiscal Year2018-19
M:\MinShare\PublnsProd\CorpFin\OBM.PUBLNS-2018-19\2018-19_Q3-Report\3Q_18-19_source-files\3Q_18-19_ Report tables.xlsx /Contingency Account 9 2/20/2019/9:45 PM
Contingency Account (Cash Adjustments / Borrowing) (millions of dollars)
Inventory Acquisition (millions of dollars)
pdf named: 3Q_18-19_rev.pdf 2018-19, 3rd Quarter Fiscal Update
Inventory Acquisition(millions of dollars)
Change2017-18 fromActual Budget Forecast Budget
Health 869 891 888 (3) Service Alberta 12 10 14 4 Transportation 50 50 50 - Other (Agric. / Cult. / Infra. / Leg. Assembly) 5 5 6 1 Total Inventory Acquisition 936 956 958 2
Fiscal Year2018-19
2/11/2019/9:37 PM
pdf named: 3Q_18-19_rev.pdf 2018-19, 3rd Quarter Fiscal Update
Inventory Consumption Expense(millions of dollars)
Change2017-18 fromActual Budget Forecast Budget
Health 863 891 894 3 Service Alberta 12 10 14 4 Transportation 46 50 50 - Other (Agric. / Cult. / Infra. / Leg. Assembly) 5 5 5 - Total Inventory Consumption Expense 926 956 963 7
Fiscal Year2018-19
2/10/2019/7:38 PM
Inventory Consumption Expense (millions of dollars)

2018 –19 Third Quarter Fiscal Update and Economic Statement 13
pdf named: 3Q_18-19_rev.pdf 2018-19, 3rd Quarter Fiscal Update
Capital Plan (millions of dollars)
Change2017-18 from
By Ministry Actual Budget Forecast Budget
Advanced Education 921 714 761 47 Agriculture and Forestry 50 39 40 1 Community and Social Services 1 2 2 - Culture and Tourism 67 76 87 11 Economic Development and Trade 8 10 10 - Education 1,229 744 736 (8) Energy 73 194 151 (43) Environment and Parks 187 65 71 6 Health 1,000 1,338 1,208 (130) Indigenous Relations 8 8 8 - Infrastructure 212 220 192 (28) Justice and Solicitor General 4 10 10 - Labour 3 2 3 1 Municipal Affairs 2,248 892 889 (3) Seniors and Housing 191 259 203 (56) Service Alberta 126 117 123 6 Transportation 2,233 1,481 1,387 (94) Treasury Board and Finance 13 18 17 (1) Legislative Assembly 2 3 3 - Contingency / unallocated - (391) - 391 2013 Alberta flood assistance (Envt. and Parks / Health / Infr. / Trans.) 24 29 35 6 Climate Leadership Plan:
Energy - 95 31 (64) Environment and Parks 189 20 97 77 Indigenous Relations 22 34 40 6 Infrastructure - 28 29 1 Transportation 189 405 405 - Other (Ad. Ed. / Agric. / Ec. Dev. / Hlth. / Mun. Aff. / Snrs. / Serv. Ab.) 19 34 25 (9)
Total Capital Plan 9,021 6,444 6,563 119
Capital Plan FinancingCash received / assets donated for capital purposes 732 969 935 (34) Retained income of funds and agencies (53) 101 (26) (127) SUCH sector self-financed 935 860 842 (18) Climate Leadership Plan 418 615 628 13 Book value capital asset disposals / grants-in-kind 35 - 4 4 Alternative financing (P3s) 181 128 92 (36) Capital Plan financing account withdrawal / (deposit) 1,339 - 55 55 Direct borrowing 5,434 3,772 4,033 261 Total Capital Plan Financing 9,021 6,444 6,563 119
Fiscal Year2018-19
3/11/2019/1:05 PM
Capital Plan Summary (millions of dollars)
2018-19 Capital Plan spending is forecast to be $6 .6 billion, $119 million above the Budget 2018 estimate .Re-profilingofhealth,education,housing, carbon capture and storage, federally-funded municipal and other projects, to match cash-flowtimelines,arelargelyoffsetbyremoving the $391 million budgeted cashflowadjustment,asintended.Main increases include several
post-secondary institution projects, including the NAIT purchase of Blatchford land, several projects under the Investing in Canada Infrastructure program, and Climate Leadership Plan (CLP) projects funded from CLP operating expense transfers .
Factors impacting project progress include the pace of construction, project scope, land conditions,
timing related to tendering, planning and permitting, and rate of project identification,approvalandconstruction under federal programs . Direct borrowing of $4 billion is forecast, an increase of $261 million from budget, due primarily to the increase to the Capital Plan and to lower spending by and funding from the Alberta Social Housing Corporation .
Capital Plan Highlights
2018 –19 Third Quarter Fiscal Update and Economic Statement14
Growth slows amid pipeline constraints
Sources: Kent Group Limited, Financial Times, Haver Analytics
Q2 2016 ‐ Second Quarter Fiscal and Economic Overview PDF name: chrt_01.pdf
WCS prices under pressureDaily energy prices, US$/bbl
Source: Kent Group Limited/Haver Analytics, Financial Times
chrt_01
0
10
20
30
40
50
0
20
40
60
80
100
(US$/bbl)(US$/bbl) WTI-WCS Differential (right)WTI (left)WCS (left) Dec 2, 2018:
curtailment announcement
\\ter‐fin‐fs‐01\Publications\_Economics_publications\Quarterly Economic Statement\Q3_EconomicUpdate_2018‐19\Source_documents\: Q3‐2019‐20_Fiscal and Economic Overview (Econ):Chart 1 wtiwcs Last updated: 2019‐02‐20: 9:58 AM
Figure 1. Daily oil prices
Economic Outlook
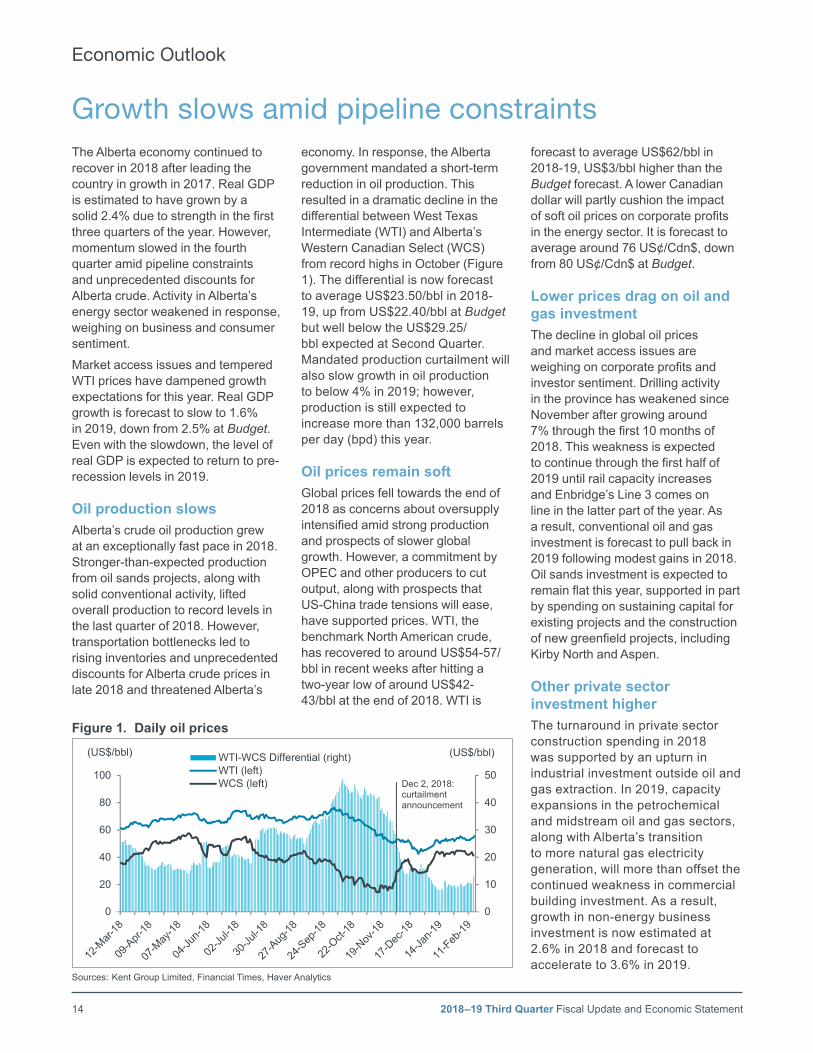
The Alberta economy continued to recover in 2018 after leading the country in growth in 2017. Real GDP is estimated to have grown by a solid 2.4% due to strength in the first three quarters of the year. However, momentum slowed in the fourth quarter amid pipeline constraints and unprecedented discounts for Alberta crude. Activity in Alberta’s energy sector weakened in response, weighing on business and consumer sentiment.
Market access issues and tempered WTI prices have dampened growth expectations for this year. Real GDP growth is forecast to slow to 1.6% in 2019, down from 2.5% at Budget. Even with the slowdown, the level of real GDP is expected to return to pre-recession levels in 2019.
Oil production slowsAlberta’s crude oil production grew at an exceptionally fast pace in 2018. Stronger-than-expected production from oil sands projects, along with solid conventional activity, lifted overall production to record levels in the last quarter of 2018. However, transportation bottlenecks led to rising inventories and unprecedented discounts for Alberta crude prices in late 2018 and threatened Alberta’s
economy. In response, the Alberta government mandated a short-term reduction in oil production. This resulted in a dramatic decline in the differential between West Texas Intermediate (WTI) and Alberta’s Western Canadian Select (WCS) from record highs in October (Figure 1). The differential is now forecast to average US$23.50/bbl in 2018-19, up from US$22.40/bbl at Budget but well below the US$29.25/bbl expected at Second Quarter. Mandated production curtailment will also slow growth in oil production to below 4% in 2019; however, production is still expected to increase more than 132,000 barrels per day (bpd) this year.
Oil prices remain softGlobal prices fell towards the end of 2018 as concerns about oversupply intensified amid strong production and prospects of slower global growth. However, a commitment by OPEC and other producers to cut output, along with prospects that US-China trade tensions will ease, have supported prices. WTI, the benchmark North American crude, has recovered to around US$54-57/bbl in recent weeks after hitting a two-year low of around US$42-43/bbl at the end of 2018. WTI is
forecast to average US$62/bbl in 2018-19, US$3/bbl higher than the Budget forecast. A lower Canadian dollar will partly cushion the impact of soft oil prices on corporate profits in the energy sector. It is forecast to average around 76 US¢/Cdn$, down from 80 US¢/Cdn$ at Budget.
Lower prices drag on oil and gas investmentThe decline in global oil prices and market access issues are weighing on corporate profits and investor sentiment. Drilling activity in the province has weakened since November after growing around 7% through the first 10 months of 2018. This weakness is expected to continue through the first half of 2019 until rail capacity increases and Enbridge’s Line 3 comes on line in the latter part of the year. As a result, conventional oil and gas investment is forecast to pull back in 2019 following modest gains in 2018. Oil sands investment is expected to remain flat this year, supported in part by spending on sustaining capital for existing projects and the construction of new greenfield projects, including Kirby North and Aspen.
Other private sector investment higherThe turnaround in private sector construction spending in 2018 was supported by an upturn in industrial investment outside oil and gas extraction. In 2019, capacity expansions in the petrochemical and midstream oil and gas sectors, along with Alberta’s transition to more natural gas electricity generation, will more than offset the continued weakness in commercial building investment. As a result, growth in non-energy business investment is now estimated at 2.6% in 2018 and forecast to accelerate to 3.6% in 2019.
2018 –19 Third Quarter Fiscal Update and Economic Statement 15
Source: Statistics Canada
Q2 2016 ‐ Second Quarter Fiscal and Economic Overview PDF name: chrt_03.pdf
Business output indicatorsAlberta Merchandise Exports and Manufacturing Shipments
Source: Statistics Canada
chrt_02 Jun‐12Jul‐12
Aug‐12Sep‐12Oct‐12Nov‐12Dec‐12Jan‐13Feb‐13Mar‐13Apr‐13May‐13Jun‐13Jul‐13
Aug‐13Sep‐13Oct‐13Nov‐13Dec‐13Jan‐14Feb‐14Mar‐14Apr‐14May‐14
4.5
5.0
5.5
6.0
6.5
7.0
5.0
6.0
7.0
8.0
9.0
10.0
11.0($billions)($billions)
Exports (left)
Manufacturing Shipments (right)
\\ter‐fin‐fs‐01\Publications\_Economics_publications\Quarterly Economic Statement\Q3_EconomicUpdate_2018‐19\Source_documents\: Q3‐2019‐20_Fiscal and Economic Overview (Econ):Chart 2 Exports Mfg Last updated: 2019‐02‐14: 2:29 PM
Figure 2. Alberta business indicators
Source: Statistics Canada
Gradual recovery in labour marketAlberta employment level & unemployment rate
Source: Statistics Canada -48 *M na_ .excel_lastAndrea .DESC
.LSOURCEchrt_03 Jan-15 Jan-15
Feb-15 Feb-15Mar-15 Mar-15Apr-15 Apr-15May-15 May-15Jun-15 Jun-15Jul-15 Jul-15Aug-15 Aug-15Sep-15 Sep-15Oct-15 Oct-15Nov-15 Nov-15Dec-15 Dec-15Jan-16 Jan-16Feb-16 Feb-16Mar-16 Mar-16Apr-16 Apr-16May-16 May-16Jun-16 Jun-16Jul-16 Jul-16Aug-16 Aug-16Sep-16 Sep-16Oct-16 Oct-16
2
4
6
8
10
2.19
2.22
2.25
2.28
2.31
2.34
2.37(%)(millions) Employment (Left)
Unemployment Rate (Right)
Figure 3. Alberta employment and unemployment rate
Economic Outlook
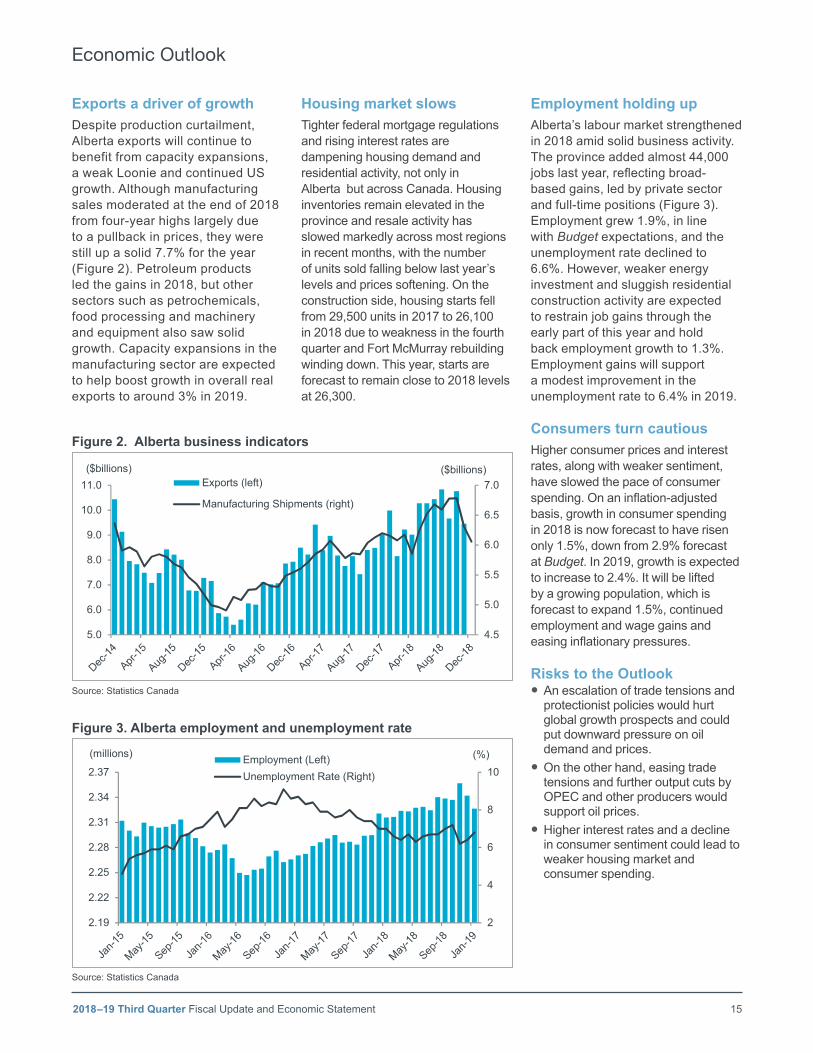
Exports a driver of growthDespite production curtailment, Alberta exports will continue to benefit from capacity expansions, a weak Loonie and continued US growth. Although manufacturing sales moderated at the end of 2018 from four-year highs largely due to a pullback in prices, they were still up a solid 7.7% for the year (Figure 2). Petroleum products led the gains in 2018, but other sectors such as petrochemicals, food processing and machinery and equipment also saw solid growth. Capacity expansions in the manufacturing sector are expected to help boost growth in overall real exports to around 3% in 2019.
Housing market slowsTighter federal mortgage regulations and rising interest rates are dampening housing demand and residential activity, not only in Alberta but across Canada. Housing inventories remain elevated in the province and resale activity has slowed markedly across most regions in recent months, with the number of units sold falling below last year’s levels and prices softening. On the construction side, housing starts fell from 29,500 units in 2017 to 26,100 in 2018 due to weakness in the fourth quarter and Fort McMurray rebuilding winding down. This year, starts are forecast to remain close to 2018 levels at 26,300.
Employment holding upAlberta’s labour market strengthened in 2018 amid solid business activity. The province added almost 44,000 jobs last year, reflecting broad-based gains, led by private sector and full-time positions (Figure 3). Employment grew 1.9%, in line with Budget expectations, and the unemployment rate declined to 6.6%. However, weaker energy investment and sluggish residential construction activity are expected to restrain job gains through the early part of this year and hold back employment growth to 1.3%. Employment gains will support a modest improvement in the unemployment rate to 6.4% in 2019.
Consumers turn cautiousHigher consumer prices and interest rates, along with weaker sentiment, have slowed the pace of consumer spending. On an inflation-adjusted basis, growth in consumer spending in 2018 is now forecast to have risen only 1.5%, down from 2.9% forecast at Budget. In 2019, growth is expected to increase to 2.4%. It will be lifted by a growing population, which is forecast to expand 1.5%, continued employment and wage gains and easing inflationary pressures.
Risks to the Outlook ● An escalation of trade tensions and protectionist policies would hurt global growth prospects and could put downward pressure on oil demand and prices.
● On the other hand, easing trade tensions and further output cuts by OPEC and other producers would support oil prices.
● Higher interest rates and a decline in consumer sentiment could lead to weaker housing market and consumer spending.

2018 –19 Third Quarter Fiscal Update and Economic Statement16
Fiscal Year Assumptions 2017‑18 Actual2018‑19
9 Month Actual
2018‑19 Fiscal Year
Budget 3rd Quarter
Prices
Crude Oil Price
WTI (US$/bbl) 53.69 65.40 59.00 62.00
Light-Heavy Differential (US$/bbl) 14.40 26.98 22.40 23.50
WCS @ Hardisty (Cdn$/bbl) 50.38 49.99 46.00 50.40
Natural Gas Price
Alberta Reference Price (Cdn$/Gj) 1.82 1.15 2.00 1.30
Production
Conventional crude oil (000s barrlels/day) 456 N/A 461 497
Raw bitumen (000s barrels/day) 2,804 N/A 3,163 3,051
Natural Gas (billions of cubic feet) 4,254 N/A 4,502 4,352
Interest rates
3-month Canada treasury bills (per cent) 0.85 1.44 1.60 1.50
10-year Canada bonds (per cent) 1.91 2.30 2.50 2.30
Exchange Rate (US¢/Cdn$) 78.0 76.6 80.0 76.2
Key Energy and Economic Assumptions
Calendar Year Assumptions2017 Calendar Year 2018 Calendar Year 2019 Calendar Year
Budget Actual Budget3rd
QuarterBudget
3rd Quarter
Gross Domestic Product
Nominal (per cent change) 6.8 10.0 4.7 4.7 4.3 1.4
Real (per cent change) 4.5 4.4 2.7 2.4 2.5 1.6
Other Indicators
Employment (thousands) 2,287 2,287 2,333 2,331a 2,372 2,361
per cent change 1.0 1.0 2.0 1.9a 1.7 1.3
Unemployment Rate (per cent) 7.8 7.8 6.8 6.6a 6.2 6.4
Average Weekly Earnings (per cent change) 1.0 1.0 2.4 1.9 2.9 2.1
Primary Household Income (per cent change) 4.4 3.0 4.5 4.5 4.7 3.8
Net Corporate Operating Surplus (per cent change) 90.6 247.5 19.1 14.2 9.8 -8.5
Housing Starts (number of units) 29,500 29,500 30,200 26,100a 32,000 26,300
Alberta Consumer Price Index (per cent change) 1.6 1.6 2.1 2.4a 1.9 1.6
Population (July 1st, thousands) 4,286 4,244 4,348 4,307a 4,413 4,374
per cent change 1.2 1.1 1.4 1.5a 1.5 1.5a Actuals

2018 –19 Third Quarter Fiscal Update and Economic Statement 17
Method of ConsolidationThe 2018‑19 Third Quarter Fiscal Update and Economic Statement reports on the same scope, using the same method of consolidation, as presented in Budget 2018. This is also the same scope and consolidation approach used in the Consolidated Financial Statements in the Government of Alberta Annual Report .
The results of all government departments, funds and agencies, except those designated as government business enterprises, are consolidated on a line-by-line basis . Revenue and expense transactions between consolidated entities have been eliminated .
The accounts of provincial agencies designated as government business enterprises areincludedonthemodifiedequity basis, computed in accordance with International Financial Reporting Standards applicable to those entities .
Basis of Financial ReportingTheconsolidatedfiscalsummaryreports revenue (including gains from disposal of tangible capital assets), expense (including amortization, inventory consumption, loss on disposal and write-down of tangible capitalassets),andsurplus/(deficit).
Revenue and expense are recorded using the accrual basis of accounting . Cash received for goods or services which have not been provided by period end is recorded as unearned revenue .
Transfers received for capital purposes, and donated capital assets, are recorded as “deferred capital contributions” when the cash or asset is received, and recognized in revenue over the related asset’s usefullife(ineffectmatchingtheasset’s amortization expense) .
Expense includes the province’s cash payments towards the unfunded pension liabilities, and the non-cash change in unfunded pension liabilities .
Debt servicing costs include interest payable, and amortization of issue costs and discounts / premiums on debt issues .
Compliance with LegislationThe Fiscal Planning and Transparency Act (FPTA) requires a public report on the accuracy of theFiscalPlanforafiscalyearonor before February 28 . The FPTA gives the President of Treasury Board and Minister of Finance discretion over the form of the report .
The 2018‑19 Third Quarter Fiscal Update and Economic Statement includes comparisons between the Budget 2018 estimates and firstquarterforecastsforrevenueand expense (including details and categories of each); the surplus / (deficit);theContingencyAccountbalance and cash adjustments; a summary balance sheet; the Capital Plan;andfinancing(borrowing)requirements . An updated Alberta economic outlook, with associated assumptions, is also provided .
Under the FPTA, operating expense increases, excluding those for dedicated revenue-operating expense, collective bargaining or other remuneration settlements, First Nations settlements, or increases funded by reserves of school boards, post-secondary institutions or Alberta Health Services, are limited to 1% of budgeted operating expense .
The forecast provided in this report is in compliance with the requirements of the FPTA .
Reporting Methodology and Legislative Compliance

2018 –19 Third Quarter Fiscal Update and Economic Statement18
Notes on restatements of numbers: ● 2017-18 Actuals for Service Alberta operating expense and capital grants have been restated as $5 million in operating expense should have been reported as capital grants . There is no change to total expense or the deficit .
● 2017-18 Actuals for operating expense have been restated to reflect corrected transfers between ministries and Service Alberta for Information Management and Technology services, implemented as part of Budget 2018. These were properly reflected in 2018-19 budget numbers . A second phase of these transfers was implemented pursuant to Order in Council 297/2018 (October 3, 2018) under the Government Organization Act. The total impacts, none of which change total expense, the deficit or borrowing amounts, are: operating expense: $244 million in 2017-18 and $163 million in 2018-19; amortization expense: $32 million in 2017-18 and $26 million in 2018-19; capital investment: $22 million in 2017-18 and $12 million in 2018-19 .
● 2017-18 Actual and 2018-19 Budget numbers have been restated, pursuant to Order in Council 297/2018 (October 3, 2018) under the Government Organization Act, to reflect the following transfers, none of which change total expense, the deficit or borrowing amounts:
■ Freedom of Information and Protection of Privacy services from ministries to Service Alberta (operating expense: $11 million in 2017-18 and $11 million in 2018-19);
■ Human Resource services from ministries to Treasury Board and Finance (operating expense: $49 million in 2017-18 and $51 million in 2018-19) .

19
Third Quarter Update
Path to Balance

20
BLANK PAGE

21PATH TO BALANCE | THIRD QUARTER UPDATE
Government action will continue to improve the value of Alberta’s energy resources.
IntroductionAfter the worst recession in a generation, Alberta’s economy is recovering. Employment has surpassed pre-recession levels, and real GDP will fully recover this year. But there is more work ahead. The recovery is not being felt at every kitchen table, given the size and duration of the oil price shock and persistent market access challenges. Some indicators have fully recovered including retail sales, employment and exports, but others continue to lag.
Last year, Alberta’s economic momentum was interrupted by severe market access challenges, a failure of successive governments in Ottawa. By late 2018, the discount on Alberta’s oil widened to record levels, putting jobs and the value of resources Albertans own at risk.
The Alberta government moved quickly and decisively to improve the value of Alberta’s resources. In the short term, the government has temporarily curtailed production, bolstering Alberta oil prices. Over the medium term, it is investing in crude-by-rail, providing critical takeaway capacity until pipelines are built. The government will continue to fight for pipelines and invest in adding more value to our oil and gas resources.
Despite ongoing volatility, the government has not wavered in its commitment to return the budget to balance by 2023–24. The government has already made significant progress; in 2018–19, the deficit is expected to be nearly $4 billion below 2016–17 levels. The deficit is expected to come in better than the budget forecast for the second straight year (Chart 1).
The government has outperformed on deficit reduction the last two years because of prudent revenue forecasts and careful spending management. Revenue has far exceeded the government’s projections over the last year two years and the Path to Balance continues to be based on prudent assumptions. Sufficient pipeline access is not assumed for budget purposes until the second Chart 1: Deficit lower than Budget forecast for second straight year
Alberta Budget Deficit
Source: Government of Alberta; *2018‐19 is an estimate, other years are actuals
chrt_01
-6.1
-10.5 -10.5
-8.8
-6.4
-10.8
-8.0-6.9
-12
-10
-8
-6
-4
-2
0
2015-16 2016-17 2017-18 2018-19
Forecast at Budget Actual/Estimate*($billions)
Chart 1: Deficit lower than Budget forecast for second straight yearAlberta Budget Deficit
Source: Government of Alberta. *2018–19 is an estimate, other years are actuals.
In 2018–19, the deficit is estimated to be $1.9 billion lower than the Budget 2018 forecast.
Path to Balance

22 PATH TO BALANCE | THIRD QUARTER UPDATE
half of 2022 (keeping the differential wide) and the carbon price is not assumed to increase above the current $30/tonne.
While Alberta is on the right track, it has been a difficult path. The oil price collapse of 2014–2015 was the deepest and most prolonged in Canadian history. WTI oil prices fell more than 70% from their peak levels, and are still only half of where they were in 2014.
The government refused to make a bad situation worse through drastic cuts that would have put thousands more out of work. Instead, government invested in infrastructure and made life more affordable by capping electricity prices, freezing tuition, reducing school fees and launching the Alberta Child Benefit.
The government acted as a shock absorber when needed most. Higher infrastructure investment put Albertans back to work and built badly needed schools, roads and hospitals. Stable funding was maintained for critical public services and efficiencies were found. The taxation system was made more fair, while still maintaining a significant tax advantage over other provinces.
Even with the continued inability of the federal government to get a pipeline built and lower oil prices, the government is on track to balance by 2023–24. Alberta’s balance sheet is currently the strongest in the country and is expected to remain stronger than any other province today when the government reaches balance.
The Path to Balance is based on three pillars:1) enhancing market access and diversifying the economy, 2) protecting core services while containing costs, and 3) a fairer revenue structure that maintains Alberta’s tax advantage.
Economic and Revenue Outlook
PROGRESS HAS BEEN MADE
After the worst recession in decades, Alberta’s economy is recovering. The economy performed well for most of 2018, the second year of recovery coming out of the two-year recession. Following a nation-leading increase of 4.4% in 2017, real GDP grew by an estimated 2.4%, underpinned by broad-based strength in business activity. Jobs have come back – there were nearly 80,000 more Albertans working in January 2019 than during the low point of the recession. Most of the jobs added over this period have been in full-time, private sector positions. The oil and gas industry is recovering despite ongoing market access challenges – oil production grew by almost 10% last year. And the recovery has spread to other sectors: manufacturing shipments were up by almost 8% in 2018 and international exports by 17.6% through 11 months of the year.
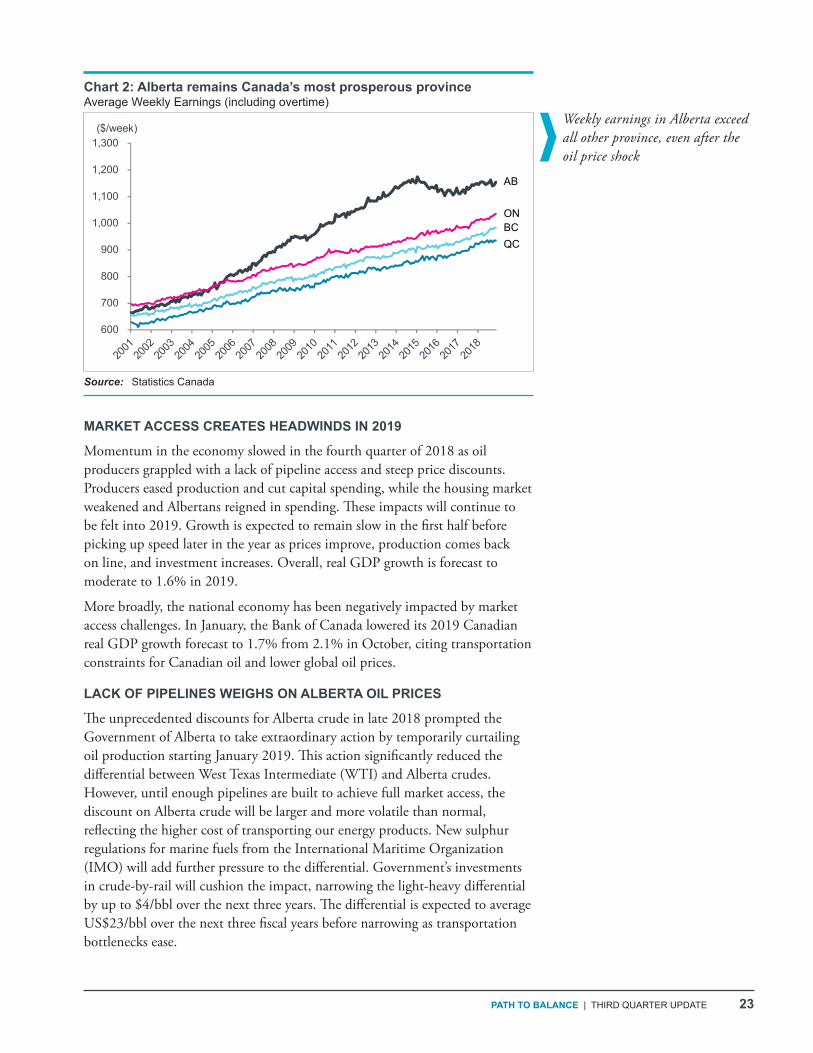
Alberta remains the strongest economy in Canada, outperforming all other provinces on a number of key economic metrics in 2018, including highest average weekly earnings (Chart 2), highest GDP per capita, and highest employment rate.
While the economy has improved, not every Albertan is feeling the effects of the recovery. Some indicators, like unemployment and construction activity, continue to lag—a reflection of the prolonged oil price shock and chronic market access challenges.
Government was there when needed most, and will continue to provide stable services while
finding efficiencies.
23PATH TO BALANCE | THIRD QUARTER UPDATE
MARKET ACCESS CREATES HEADWINDS IN 2019
Momentum in the economy slowed in the fourth quarter of 2018 as oil producers grappled with a lack of pipeline access and steep price discounts. Producers eased production and cut capital spending, while the housing market weakened and Albertans reigned in spending. These impacts will continue to be felt into 2019. Growth is expected to remain slow in the first half before picking up speed later in the year as prices improve, production comes back on line, and investment increases. Overall, real GDP growth is forecast to moderate to 1.6% in 2019.
More broadly, the national economy has been negatively impacted by market access challenges. In January, the Bank of Canada lowered its 2019 Canadian real GDP growth forecast to 1.7% from 2.1% in October, citing transportation constraints for Canadian oil and lower global oil prices.
LACK OF PIPELINES WEIGHS ON ALBERTA OIL PRICES
The unprecedented discounts for Alberta crude in late 2018 prompted the Government of Alberta to take extraordinary action by temporarily curtailing oil production starting January 2019. This action significantly reduced the differential between West Texas Intermediate (WTI) and Alberta crudes. However, until enough pipelines are built to achieve full market access, the discount on Alberta crude will be larger and more volatile than normal, reflecting the higher cost of transporting our energy products. New sulphur regulations for marine fuels from the International Maritime Organization (IMO) will add further pressure to the differential. Government’s investments in crude-by-rail will cushion the impact, narrowing the light-heavy differential by up to $4/bbl over the next three years. The differential is expected to average US$23/bbl over the next three fiscal years before narrowing as transportation bottlenecks ease.
Source: Statistics Canada
Chart 2: Alberta remains Canada’s most prosperous provinceAverage Weekly Earnings (including overtime)
Source: Statistics Canada
chrt_02Note: Alberta line was specifically made to be thicker than the other provinces
600
700
800
900
1,000
1,100
1,200
1,300
AB
ONBCQC
($/week)
\\ter‐fin‐fs‐01\Publications\_Economics_publications\Quarterly Economic Statement\Q3_EconomicUpdate_2018‐19\Path‐to‐Balance_2019\SourceDocs\Path_to_Balance_Charts/Path_to_Balance_Charts
Chart 2: Alberta remains Canada’s most prosperous province Average Weekly Earnings (including overtime)
Weekly earnings in Alberta exceed all other province, even after the oil price shock

24 PATH TO BALANCE | THIRD QUARTER UPDATE
GLOBAL OIL PRICES TO REMAIN WELL BELOW 2014 LEVELS
The global oil market remains well-supplied, given ample low-cost OPEC output and strong gains in non-OPEC production, led by the US. WTI is expected to post only modest improvements, averaging US$59/bbl in 2019–20 and gradually improving to US$72/bbl by 2023–24, well below the levels seen prior to the downturn (Chart 3). As a result, while energy investment is expected to improve over the medium term, it will still be significantly lower than 2014 levels due to the weaker outlook for oil prices and ongoing market access issues.
SOLID FUNDAMENTALS SUPPORT MEDIUM TERM GROWTH
After slowing in 2019, Alberta’s economy is expected to bounce back in 2020 and resume growing at a solid pace (Chart 4). Real GDP is forecast to expand by 2.9%, propelled by oil production returning to full capacity and increasing manufacturing output. Strengthening domestic demand, including gains in business investment and consumer spending, will underpin growth of around 2.6% in the following four years. A relatively young and fast-growing population, high levels of capital stock, as well as rising investment and exports will support Alberta’s growth prospects. On average, forecasters expect Alberta to lead provinces in real GDP growth over the medium to long-term.
GROWTH BROADENS, MANUFACTURING EXPANDS
As the economy continues to adjust to lower oil prices, sectors outside of oil and gas extraction are expected to contribute to economic growth and job creation. Overall, business investment outside of oil and gas is forecast to grow by 3.6% in 2019 and accelerate to 5.5% in 2020 and around 4% over the medium term.
Investment will be buoyed by the construction of three petrochemical facilities approved under the Petrochemicals Diversification Program (PDP), valued at
Chart 3: Oil prices will be lower for longerNorth American and Alberta Heavy Oil Prices
Source: Alberta Government; e‐estimate, f‐forecast
chrt_03
2004 *Y.DESC.TN.LSOURCE20042005200620072008200920102011201220132014201520162017
20182019f2020f2021f
20
30
40
50
60
70
80
90
100
110(US$/bbl)
West Texas Intermediate
Western Canada Select
Chart 3: Oil prices will be lower for longerNorth American and Alberta Heavy Oil Prices
Source: Alberta Government; e-estimate, f-forecast
Oil prices are expected to stay well below 2010–2014 levels over the
forecast period.

25PATH TO BALANCE | THIRD QUARTER UPDATE
$10 billion in total. Further, a $2 billion investment has also been announced under the Partial Upgrading Program, which will help alleviate pipeline bottlenecks and increase the value of Alberta’s resources. Overall, $12 billion in additional upgrading and petrochemical investment has been leveraged under these programs.
Alberta is also getting a boost from midstream energy infrastructure projects, including crude-by-rail for oil production, as well as pipelines and processing facilities to support strong production growth from liquids-rich gas plays in western Alberta and northeast BC. At the same time, the province’s transition to gas fired generation has led to the construction of pipelines that connect natural gas to electricity generation plants and investment into renewable energy.
Food manufacturing, which was a bright spot in the economy during the downturn and into the recovery, is set to expand further this year with the opening of the $360 million Cavendish Farms potato processing plant in Lethbridge. Capacity expansions in petrochemical and food manufacturing are expected to support growth in real manufacturing exports to 3.6% in 2019 and average 3.1% between 2020 and 2024. The manufacturing sector is expected to become an increasingly important driver of export growth for the province (Chart 5).
LABOUR MARKET RESILIENT
Alberta’s labour market has strengthened over the past two years following the 2015–16 recession. Increases in full-time and private sector employment underpinned the recovery, alongside broad-based gains across most sectors of the economy. While employment growth will slow in 2019 with the weakness in the energy and construction sectors, the labour market is expected to remain resilient and continue improving over the medium term. Employment growth is forecast to accelerate to 1.9% next year before moderating to a still solid pace of 1.6%
Chart 4: Growth to improve after 2019, unemployment to declineAlberta Real GDP Growth and Unemployment Rate
Sources: Statistics Canada, Treasury Board and Finance; e‐estimate, f‐forecast
chrt_04
-4
-2
0
2
4
6
8
10Real GDP Growth
Unemployment Rate
(%)
Chart 4: Growth to improve after 2019, unemployment to declineAlberta Real GDP Growth and Unemployment Rate
Sources: Statistics Canada, Alberta Treasury Board and Finance; e-estimate, f-forecast
Economic growth is forecast to accelerate in 2020 and remain solid.

26 PATH TO BALANCE | THIRD QUARTER UPDATE
between 2021 and 2024. An expanding population will support Alberta’s labour force. With robust natural increase and strong immigration, population growth is forecast at 1.5% in 2019 and average 1.7% over the medium-term, far outpacing the national average.
A steady improvement in the unemployment rate to around 5% by 2023 will be supported by employment gains and a decline in the labour force participation rate, as a growing share of Albertans reach retirement age. Even so, Alberta will continue to have very favourable demographics with its relatively young population. Lower unemployment will help buoy growth in average weekly earnings, which is forecast to rise at about 3% per year over the medium-term.
REVENUE IMPROVES AS ECONOMY MOVES INTO EXPANSION
Alberta budget revenues are expected to remain relatively flat in 2019–20, reflecting market access headwinds and lower oil prices. Looking ahead, revenue growth is expected to pick up, supported by Alberta’s expanding economy and rising incomes.
A stronger labour market will lift wages and employment, driving up personal income tax revenue. Along with higher prices and production, expanding industries outside the energy sector will support corporate tax revenue over the medium term. Other revenues, like fuel taxes and the tourism levy, will also expand as activity picks up and the population grows.
Following a decline in 2019–20, non-renewable resource (NRR) revenues are forecast to improve significantly. They will be boosted by higher WTI oil prices and rising production. In addition, around 10 oil sands projects are forecast to reach payout and pay higher royalties by 2023–24. Given current uncertainty around market access, a prudent budgeting approach has been taken to forecast Alberta heavy oil prices. The light-heavy differential is expected to remain elevated above US$20/bbl until 2022–23.
Chart 5: Manufacturing exports picking upAlberta Real Manufacturing Exports
Sources: Statistics Canada and Alberta Treasury Board and Finance; e‐estimate, f‐forecast
chrt_05
30
35
40
45
50
(2012$billion)
Chart 5: Manufacturing exports picking upAlberta Real Manufacturing Exports
Sources: Statistics Canada, Alberta Treasury Board and Finance; e-estimate, f-forecast
The manufacturing sector to become an increasingly important
driver of export growth in Alberta.

27PATH TO BALANCE | THIRD QUARTER UPDATE
The Fiscal ChallengeEarlier this decade, when oil prices were high and the economy was growing, the budget remained unbalanced and savings were not put aside for the future. Between 2010–11 and 2014–15, for example, oil prices averaged US$90/ bbl, while the economy grew more than 5% per year – more than double the national average. Royalty revenues averaged $9.3 billion per year, more than 20% of total revenue. Yet, over this period, the government ran deficits in all but one fiscal year.
WEATHERING VOLATILITY
Alberta’s revenue is far more volatile and susceptible to swings in commodity and financial markets than any other major province (Chart 6). While resource revenues are most sensitive, taxes and other sources of revenue are also impacted by movements in resource prices and the broader economy.
Government must carefully plan through the revenue highs and lows, recognizing that demand for critical services continues to grow. Even during the downturn when oil prices fell over 70% and resource revenues plummeted, Alberta’s population outpaced the national average, and will continue to do so in the future (Chart 7).
Amid extreme volatility, this government in the last three years has provided stable funding for core public services, including health care, education and social services. It has also budgeted based on prudent revenue assumptions. In contrast, previous governments had volatile year-to-year spending, which only exacerbated the impact of the revenue roller coaster.
Chart 6: Alberta's revenues are highly volatileProvincial Total Revenues, Year-Over-Year Growth
Source: Statistics Canada Government Finance Statistics and Provincial AccountsChrt_06
-30
-20
-10
0
10
20
30
40
50(%) QC ON AB BC
Chart 6: Alberta’s revenues are highly volatileProvincial Total Revenues, Year-Over-Year Growth
Source: Statistics Canada Government Finance Statistics and Provincial Accounts
The Alberta government must carefully manage through extreme revenue volatility.

28 PATH TO BALANCE | THIRD QUARTER UPDATE
LONG LASTING EFFECTS OF OIL PRICE SHOCK
The fiscal impact of the 2015 oil price collapse will linger for some time. Oil prices are widely expected to be “lower for longer” due to ample and lower-cost global supplies of crude. Moreover, the discount on Alberta crude will be larger than normal until new pipelines are built.
The largest impact is on resource revenues. In 2019–20, they will be around 60% of 2014–15 levels. Even as oil prices improve and oil production continues to increase, the share of resource revenue in total revenue will remain well below historical norms.
More broadly, the oil shock has hit Alberta businesses and families hard. While earnings remained highest among the provinces, they declined during the recession, hurting tax and other government revenue. Nominal GDP, the broadest measure of income, fell $75 billion (or 20%) between 2014 and 2016, and is not expected to return to 2014 levels until 2021.
Sources: Statistics Canada Demography Division, Alberta Treasury Board and Finance, Conference Board of Canada; f-forecast
Chart 7: Alberta’s population growth to remain solidAverage Annual Population Growth
Sources: Statistics Canada Demography Division, Alberta Treasury Board and Fi
chrt_07
2013‐2018 AlbertaCanada
2018‐2023fAlbertaCanada
0.00.20.40.60.81.01.21.41.61.82.0
Alberta Canada Alberta Canada
2013-2018 2018-2023f
(%)
Chart 7: Alberta’s population growth to remain solidAverage Annual Population Growth
Alberta’s population growth will continue to outpace the national average over the medium-term.
29PATH TO BALANCE | THIRD QUARTER UPDATE
Government’s Response to the DownturnFaced with a deep recession and a massive shortfall in revenues, this government chose to help Albertans weather the storm by supporting public services Albertans rely on and creating jobs.
A critical step was avoiding the province’s history of volatile swings in spending from one year to the next. Since 2015–16, operating expense (excluding Climate Leadership Plan initiatives) posted stable and moderate growth of 3-3.8% per year, averaging 3.4% over the time period. This is well below the 4.6% average increase in the previous six years, which included two years of more than 6% increases. Moderate increases were achieved despite spending pressures from high growth in specific populations, including school-aged children, Albertans with disabilities, and a jump in income support case loads arising from the recession.
In addition to providing stable funding for core public services, government carefully and prudently found savings and eliminated waste. It focused on the two largest areas of spending: health, government’s largest program area, and public sector compensation, which makes up over half of government’s operating expense. Spending growth in health was contained at just over 3% per year between 2015–16 and 2018–19.
Practical agreements were negotiated with public sector unions like the Alberta Teachers’ Association and United Nurses of Alberta. Salaries were frozen for Alberta public service managers and political staff and a hiring restraint was put in place across the public service to keep the size of the Alberta Public Service flat. At agencies, boards and commissions (ABCs), government slashed salaries and eliminated perks and bonuses for some of the highest paid executives.
The government also chose to stimulate the economy during the downturn through a nation-leading capital plan, delivering on recommendations from former Bank of Canada governor David Dodge. The government took advantage of record-low interest rates, a strong balance sheet and lower cost pressures to make long-term investments and put Albertans back to work building badly needed schools, hospitals and roads. The government supported Alberta small businesses, lowering the small business tax rate from 3% to 2%, now tied for second lowest in the country.
Government protected vulnerable Albertans during the downturn and recovery by making life more affordable. These measures included introducing the Alberta Child Benefit and enhancing the Alberta Family Employment Tax Credit in 2015; freezing tuition for a fifth straight year effective February, 2019; raising the minimum wage to $15 per hour in October, 2018; indexing Assured Income for the Severely Handicapped (AISH), income support and senior benefits to cost of living increases starting January 2019; reducing school fees; and creating affordable child care spaces.

30 PATH TO BALANCE | THIRD QUARTER UPDATE
Looking Forward: The Path to BalanceDuring the downturn, the government’s priority was helping Albertans weather the storm. As the economy continues to recover, the government is focused on returning Alberta’s budget to balance by 2023–24.
The Path to Balance Plan will protect the services Albertans rely on, create jobs and diversify the economy. The Plan is based on three pillars: 1) enhanced market access and more diversified economy; 2) stable funding for core public services and cost containment; and 3) a fairer revenue structure while maintaining Alberta’s tax advantage.
1) ENHANCED MARKET ACCESS AND MORE DIVERSIFIED ECONOMY
The Path to Balance will be underpinned by a growing and more diversified economy. In addition to making significant investments in infrastructure during the downturn, the government has taken a number of steps to promote growth and diversification and create jobs, including:
✦ Temporary curtailment of oil production and investments in crude-by-rail to address short and medium term market access challenges and improve the value of Alberta’s energy resources. The government continues to fight for pipelines, the only long-term solution. Approval has already been secured for two key energy infrastructure projects—Line 3 and Trans Mountain expansion (TMX)—and the government will continue to push for construction of TMX and Keystone XL.
✦ Encouraging more value-added energy production in Alberta. The government has announced significant new investments in the Petroleum Diversification Program (PDP), petrochemical feedstock infrastructure, partial upgrading, and expressions of interest in additional refinery activity. These actions are already paying off, including $10 billion in new petrochemical investments approved under PDP.
✦ Investing $100 million over five years to attract more artificial intelligence-based high-tech companies to invest in Alberta. This builds on last year’s investment of $50 million to create 3,000 new high-tech training seats at post-secondary institutions across the province.
✦ Launched three tax incentives—the Alberta Investor Tax Credit, the Capital Investment Tax Credit and the Interactive Digital Media Tax Credit—to improve access to capital, promote innovation and encourage job creation.
✦ Implemented a new energy royalty framework that is fair and competitive, and provides long-term certainty to the oil and gas industry.

31PATH TO BALANCE | THIRD QUARTER UPDATE
2) PROTECTING CORE PUBLIC SERVICES WHILE CONTAINING COSTS
The government has avoided the previous government’s history of volatile swings in spending from one year to the next. Instead, the government has targeted to keep operating expenses stable around population growth plus inflation while protecting the services Alberta families rely on (Chart 8). Operating expense is expected to rise 3% per year, on average, from 2018–19 to 2023–24, well below historical growth. To maintain lower operating expense growth, government is containing costs by focusing on its two largest areas of spending—public sector compensation and health—while finding efficiencies across government.
Cost containment and eliminating waste will support the path to balance, but not at the expense of critical public services. Government continues to invest in health, education and programs for vulnerable Albertans. This includes: indexing key benefit programs, including AISH and seniors benefits, introducing affordable childcare, funding enrollment and reducing school fees. There are also increased investments in Legal Aid, post-secondary technology spaces, the Rural Crime Reduction Strategy, and the Public Action Plan for the Ministerial Panel on Child Intervention.
Chart 8: Stable funding growth below population growth and inflationOperating Expense Growth
Sources: Government of Alberta; e‐estimate, f‐forecast
chrt_082009‐102010‐112011‐122012‐132013‐142014‐152015‐162016‐172017‐182018‐19e2019‐20f2020‐21f2021‐22f2022‐23f2023‐24f
0
1
2
3
4
5
6
7
(%)
Chart 8: Stable funding targeted for predictable service delivery Operating Expense Growth
Source: Government of Alberta; e-estimate, f-forecast
Operating spending has grown at a moderate and stable rate since 2015–16, and is forecast to grow below population growth and inflation.

32 PATH TO BALANCE | THIRD QUARTER UPDATE
Health
The government has made significant progress controlling health costs, which accounts for about 40% of Alberta’s budget, through targeted strategies. Health operating expense has seen steady and predictable population-based funding growth of just over 3% annually over the last three fiscal years (Chart 9). A new funding framework has been signed with the Alberta Pharmacists’ Association that saves $150 million and slows spending growth in government-sponsored drug programs. Alberta has also saved more than $100 million over the last three years by negotiating lower generic drug prices. Alberta Health Services (AHS) has reduced costs through operational best practices (approximately $163 million) and savings of almost $50 million have been achieved in health administrative services in 2017–18.
Without sacrificing quality care or frontline services, curbed spending freed up health dollars to invest in more community based health care, including mental health and addiction services, primary health care, and home care. Important investments into Alberta’s continuing care system are on track to achieve the government’s commitment to build 2,000 long-term care and dementia spaces. Chart 9: Stable health spending
Source: Alberta Treasury Board and Finance; e‐estimate, f‐forecast
0
5
10
15
20
25
30
($billion)
Chart 9: Stable health spending
Source: Alberta Treasury Board and Finance; e-estimate, f-forecast

33PATH TO BALANCE | THIRD QUARTER UPDATE
Finding Efficiencies and Eliminating Waste
Continuous improvement is focused on ongoing efforts to achieve the greatest efficiencies and effectiveness across government. Corporate services such as communications, information technologies, finance and human resources are being consolidated and modernized so they are more effective and deliver high levels of service that ultimately support Albertans. Opportunities to contract-in services are also being considered where efficiencies can be achieved.
The review of ABCs has led to the elimination or consolidation of 66 ABCs, and salaries have been reduced and bonuses eliminated for some of the highest paid executives of Alberta’s ABCs.
Discretionary spending is being tightly controlled across government. Spending on travel, conferences, advertising, publications and hospitality has declined 24% over the last four fiscal years.
Capital
The government chose to put Albertans to work and stimulate the economy during the downturn, delivering on the recommendations from former Bank of Canada Governor David Dodge.
David Dodge indicated that as the economy recovers, the government should normalize spending. Consistent with his recommendations, government continues to return the capital plan to more normal levels. After averaging $7 billion over the last five fiscal years, the capital plan is expected to moderate to $5.6 billion by 2023–24. The government will leverage the federal Investing in Canada Infrastructure Program (ICIP) for key infrastructure projects, including public transit investments like the Green Line.
Government introduced the City Charters Fiscal Framework Act, which links funding for capital projects in Edmonton and Calgary to changes in provincial revenues and fuel sales. The legislation provides Edmonton and Calgary with a baseline of $500 million per year and replaces the cities’ Municipal Sustainability Initiative (MSI) funding when the program is complete in 2022. The framework also includes a regional fund designed to foster collaboration and economic development, and a long-term transit investment plan. The Government continues to discuss with other municipalities a funding arrangement to replace MSI. The Path to Balance includes ongoing funding for other municipalities under the Basic Municipal Transportation Grant.

34 PATH TO BALANCE | THIRD QUARTER UPDATE
3) A FAIRER AND MORE STABLE REVENUE STRUCTURE THAT MAINTAINS ALBERTA’S TAX ADVANTAGE
The government is committed to a tax system that is fair and encourages economic growth. Alberta continues to have a significant tax advantage. Albertans and Alberta businesses pay at least $11.8 billion less in taxes than they would if they faced the same tax system of any other province. For example, a one-income couple earning $75,000 and raising two children pays around $4,300 less taxes in Alberta than in BC and about $4,600 less than in Ontario (Chart 10).
At the same time, the government recognizes the need to ensure there are stable funding sources for critical programs and that the taxation system is fair. It has taken a balanced approach, introducing measures that raise revenue but still maintain Alberta’s overall tax advantage and keep life affordable for Albertans. Measures introduced include:
✦ A more progressive, multiple-rate personal income tax structure was introduced in October 2015, with higher rates on incomes above $125,000. Only the top 7% of income earners saw increases. This measure is anticipated to raise $800–900 million in 2019–20 alone, with the amount increasing over time as the economy improves. Even with the increase, Albertans will continue to pay the lowest overall taxes among provinces. Lower and middle income households did not see their income taxes increase and also benefited from the new Alberta Child Benefit (ACB) and the enhancement to the Alberta Family and Employment Tax Credit (AFETC), which provide over $200 million in additional benefits each year.
Chart 10: Alberta’s Tax Advantage, 2018Provincial Taxes, One Income Couple with Two Children, $75K employment income
Source: Alberta Treasury Board and Financechrt_10
0
1,000
2,000
3,000
4,000
5,000
6,000
7,000
8,000
AB BC SK ON QC
Provincial Taxes PaidAlberta Tax Advantage
($)
Chart 10: Alberta’s Tax Advantage, 2018Provincial Taxes, One Income Couple with Two Children, $75K employment income
Source: Alberta Treasury Board and Finance
A typical one-income couple with two children, earning $75,000
in employment income, pays around $4,300 less in taxes than
in BC and about $4,600 less than in Ontario.

35PATH TO BALANCE | THIRD QUARTER UPDATE
Chart 11: Balance sheet remains strongNet Debt to GDP
Sources: Royal Bank of Canada, Alberta Treasury Board and Finance; e‐estimate, f‐forecast
chrt_11
http://www.rbc.com/economics/economic‐reports/pdf/canadian‐fiscal/prov_fiscal.pdf
0
5
10
15
20
25
30
35
40
45
50(%) Interprovincial Comparison, 2017-18 Alberta, 2017-18 to 2023-24
Chart 11: Balance sheet remains strong Net Debt to GDP
Sources: Royal Bank of Canada, Alberta Treasury Board and Finance; e-estimate, f-forecast
Alberta’s net debt-to-GDP is expected to remain low.
✦ The general corporate income tax rate, which applies to larger corporations earning income, was raised two percentage points to 12% in July 2015, tied for third-lowest among the provinces in 2018. This measure is anticipated to raise $300–400 million in 2019–20 alone. Alberta’s corporate tax system remains among the most competitive in Canada, with no payroll or retail sales tax.
✦ Other revenue measures, introduced in Budget 2015, raise more than $100 million per year, including a $5/carton increase in tobacco taxes, a 5% increase in the standard liquor mark-ups and a 4¢/litre increase in locomotive fuel taxes to match the same increase introduced on gasoline and diesel in March 2015.
STABILIZATION AND DECLINE IN DEBT BURDEN
Alberta’s balance sheet is currently the strongest in the country and is expected to remain stronger than any other province today when the government reaches balance (Chart 11). The province’s net debt-to-GDP ratio, a widely used measure of the debt burden, is projected to stabilize and then decline to 13% by 2023–24. This is well below the 39% ratio in Ontario and 42% in Quebec for 2017–18.

36 PATH TO BALANCE | THIRD QUARTER UPDATE
$ Billions2014-15 Actuals
2015-16 Actuals
2016-17 Actuals
2017-18 Actuals
2018-19 Estimate
2019-20 Forecast
2020-21 Forecast
2021-22 Forecast
2022-23 Projection
2023-24 Projection
Revenue 49.5 42.6 42.3 47.3 49.6 51.6 56.5 61.1 63.5 67.4
Taxes 21.4 20.7 20.2 20.8 23.1 23.4 25.2 27.0 28.8 30.5
Non-Renewable Resource Revenue
8.9 2.8 3.1 5.0 5.5 5.3 5.5 7.3 9.4 12.3
Other Revenue 19.1 19.1 19.0 21.6 21.0 22.9 25.8 26.8 25.3 24.6
Operating Expense 42.0 43.3 44.7 46.2 48.0 49.5 50.8 52.2 54.1 55.8
% change 4.3 3.0 3.1 3.5 3.8 3.1 2.5 2.8 3.7 3.0
CPI inflation + population growth (%)
4.3 2.7 2.4 2.8 3.9 3.3 3.6 3.7 3.7 3.7
Total Expense 48.4 49.1 53.1 55.3 56.5 59.5 63.6 66.4 66.4 66.5
Surplus (Deficit) 1.1 (6.4) (10.8) (8.0) (6.9) (7.9) (7.1) (5.3) (2.9) 0.9
Capital Plan 6.2 6.6 6.6 9.0 6.6 6.4 6.8 7.1 6.4 5.6
Before Investing in Canada Plan (ICIP)
6.2 6.5 6.6 5.9 5.1
ICIP 0.2 0.3 0.5 0.5 0.5
Fiscal / Capital Plan Debt 12.9 20.0 33.3 43.4 58.6 64.1 75.9 85.5 92.1 94.8
Net Financial Debt* (13.1) (3.9) 8.9 19.3 28.1 37.7 46.6 53.4 56.9 56.1
% GDP (3.5) (1.2) 3.0 5.8 8.1 10.7 12.6 13.7 13.9 13.0
Path to Balance Fiscal Metrics
* Net financial debt measures the health of the balance sheet and accounts for Alberta’s significant financial assets. As such, net debt-to-GDP is a more appropriate measure for inter-provincial comparisons than debt-to-GDP.

37PATH TO BALANCE | THIRD QUARTER UPDATE
Fiscal Year2014-15 Actuals
2015-16 Actuals"
2016-17 Actuals
2017-18 Actuals
2018-19 Estimate
2019-20 Forecast
2020-21 Forecast
2021-22 Forecast
2022-23 Projection
2023-24 Projection
Crude Oil Pricesa
WTI (US$/bbl) 80.5 45.0 47.9 53.7 62.0 59 65 70 70 72
Light-Heavy Differential (US$/bbl)
17.3 13.4 13.9 14.4 23.5 19.9 24.2 24.4 19.5 17.5
Exchange Rate (US¢/Cdn$)a
88.1 76.4 76.2 78.0 76.2 77 78 79 80 80
Energy and Economic Metrics
a Actual
a Forecasts have been rounded
Calendar Year2014
Actuals2015
Actuals2016
Actuals2017
Actuals2018
Estimate2019
Forecast2020
Forecast2021
Forecast2022
Forecast2023
Projection2024
Projection
Gross Domestic Product
Nominal (billions of dollars) 376.6 323.8 301.7 331.9 347.4 352.3 370.3 390.8 410.6 431.4 452.7
% change 10.0 -14.0 -6.8 10.0 4.7 1.4 5.1 5.5 5.1 5.1 4.9
Real (billions of 2012 dollars) 349.7 336.8 322.7 336.8 344.7 350.3 360.4 370.1 379.7 389.7 399.7
% change 5.9 -3.7 -4.2 4.4 2.4 1.6 2.9 2.7 2.6 2.6 2.6
Other Indicators
Employment (thousands) 2,275 2,301 2,264 2,287 2,331a 2,361 2,406 2,448 2,487 2,524 2,562
% change 2.2 1.2 -1.6 1.0 1.9a 1.3 1.9 1.7 1.6 1.5 1.5
Unemployment Rate (%) 4.7 6.0 8.1 7.8 6.6a 6.4 5.9 5.5 5.2 5.1 5.0
Alberta Consumer Price Index (% change)
2.6 1.2 1.1 1.5 2.4a 1.6 1.8 2.0 2.0 2.0 2.0
Population Growth (% change)
2.6 1.5 1.2 1.1 1.5a 1.5 1.6 1.7 1.7 1.7 1.7