Embed Size (px)
Citation preview

2018 Value ofIT CertificationExplore our latest research to discover the impact of certification on the lives and careers of thousands of respondents across the globe.
Table of contents2
Introduction..........................................................................
Overview.................................................................................
Key findings:
Reasons for becoming certified...........................
Benefits from certification....................................
Certification and training.......................................
Certification specialty areas.................................
Certification purchase behaviors........................
Training methods and learning materials........
Future ambitions......................................................
Conclusion.................................................................
Appendix:
Demographics..........................................................
World region..............................................................
Industries...................................................................
Employer size...........................................................
About Pearson VUE.............................................................
3
4
5-6
7-8
9-10
11
12
13-14
15
16
17
18
19
20
21
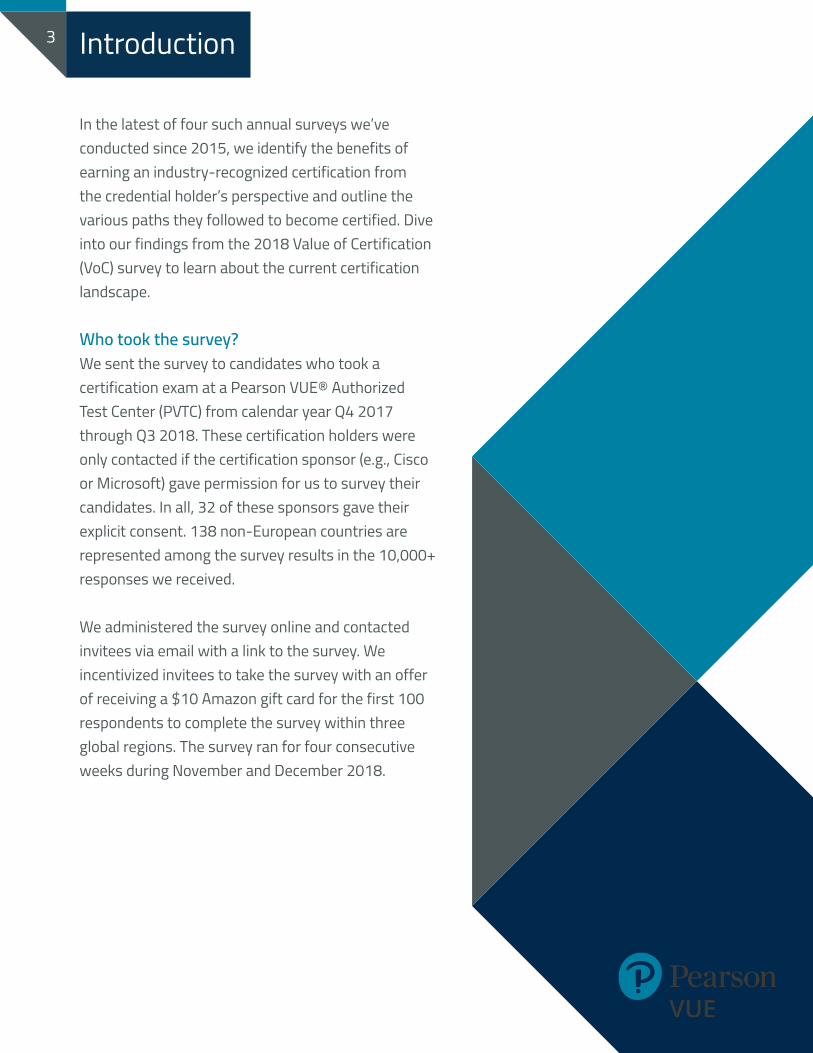
Introduction3
In the latest of four such annual surveys we’ve conducted since 2015, we identify the benefits of earning an industry-recognized certification from the credential holder’s perspective and outline the various paths they followed to become certified. Dive into our findings from the 2018 Value of Certification (VoC) survey to learn about the current certification landscape.
Who took the survey?We sent the survey to candidates who took a certification exam at a Pearson VUE® Authorized Test Center (PVTC) from calendar year Q4 2017 through Q3 2018. These certification holders were only contacted if the certification sponsor (e.g., Cisco or Microsoft) gave permission for us to survey their candidates. In all, 32 of these sponsors gave their explicit consent. 138 non-European countries are represented among the survey results in the 10,000+ responses we received.
We administered the survey online and contacted invitees via email with a link to the survey. We incentivized invitees to take the survey with an offer of receiving a $10 Amazon gift card for the first 100 respondents to complete the survey within three global regions. The survey ran for four consecutive weeks during November and December 2018.
Overview
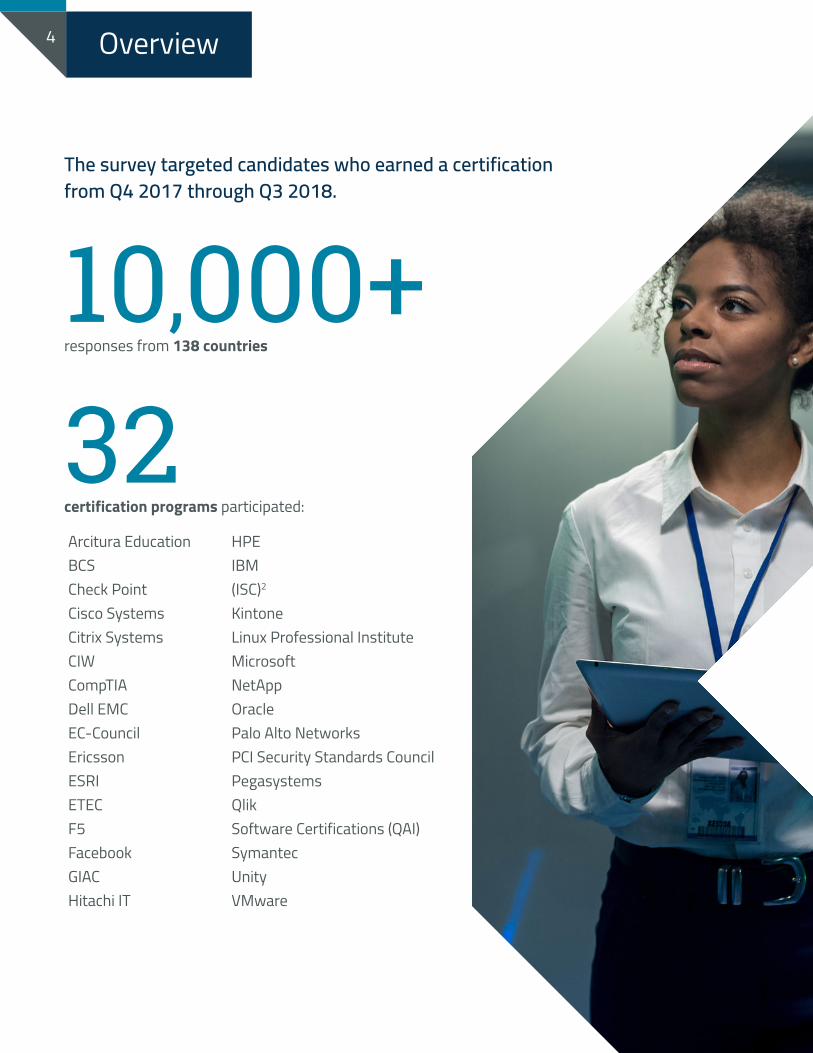
The survey targeted candidates who earned a certification from Q4 2017 through Q3 2018.
Arcitura EducationBCSCheck PointCisco SystemsCitrix SystemsCIWCompTIADell EMCEC-CouncilEricssonESRIETECF5 FacebookGIACHitachi IT
HPE IBM(ISC)2
KintoneLinux Professional InstituteMicrosoftNetAppOraclePalo Alto NetworksPCI Security Standards CouncilPegasystemsQlikSoftware Certifications (QAI)SymantecUnity VMware
4
10,000+responses from 138 countries
32certification programs participated:
Key findings: Reasons for becoming certified
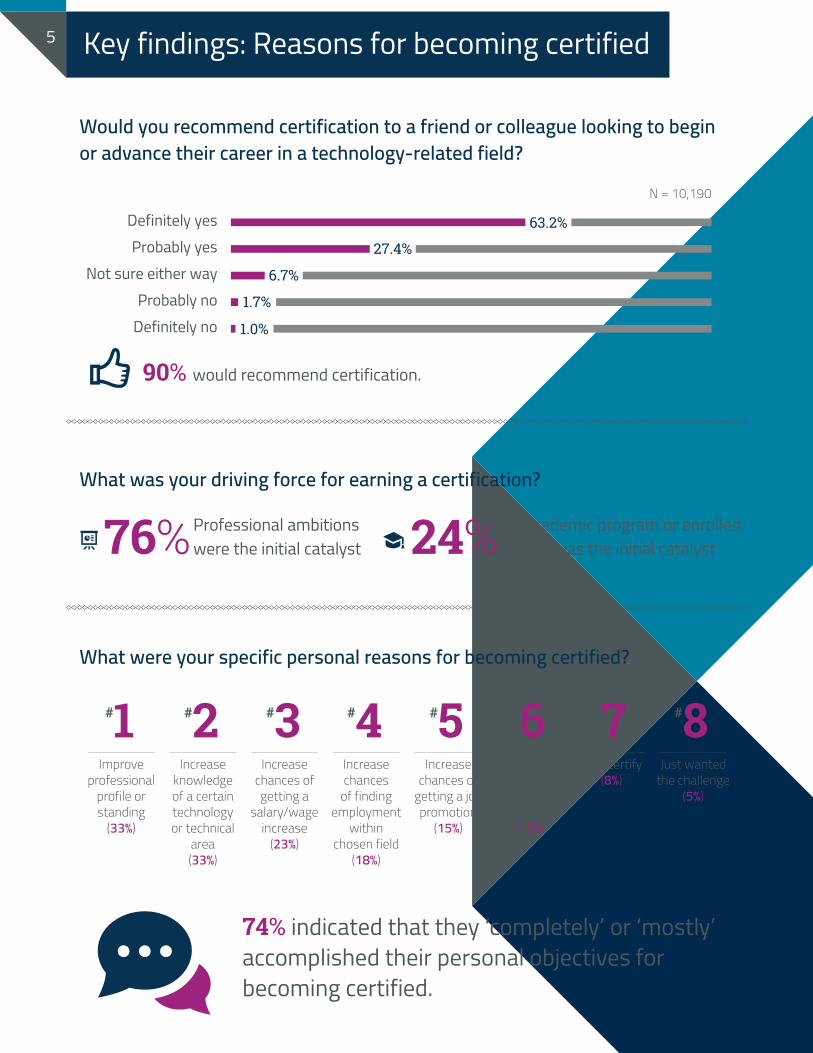
Would you recommend certification to a friend or colleague looking to begin or advance their career in a technology-related field?
Definitely yesProbably yes
Not sure either wayProbably no
Definitely no
63.2%
27.4%
6.7%
1.7%
1.0%
N = 10,190
What was your driving force for earning a certification?
An academic program or enrolled course was the initial catalyst
Professional ambitions were the initial catalyst76% 24%
What were your specific personal reasons for becoming certified?
Improve professional
profile or standing
(33%)
#2 #3 #4 #5 #6 #7 #8Increase
knowledge of a certain technology or technical
area(33%)
Increase chances of getting a
salary/wage increase
(23%)
Increase chances
of finding employment
within chosen field
(18%)
Increase chances of
getting a job promotion
(15%)
Gain entrance
into chosen field(13%)
To recertify (8%)
Just wanted the challenge
(5%)
#1
74% indicated that they ‘completely’ or ‘mostly’ accomplished their personal objectives for becoming certified.
5
90% would recommend certification.

Why did they pursue certification?Nearly 75% of respondents reported that they actively pursued certification on their own (internally driven), whereas the remaining respondents reported that certification was an indirect result of an academic program or course in which they were enrolled (externally driven).
Among those who were internally driven, 33% cited improving their professional profile or standing and 33% cited increasing their technical knowledge as the top reasons to become certified. 74% of respondents who cited any reason for becoming certified indicated that they ‘completely’ or ‘mostly’ accomplished their objectives by becoming certified.
What benefits did they realize?Respondents reported realizing three types of benefits from their certification(s): extrinsic (tangible), intrinsic (personal), and practical (on-the-job). The latter two types of benefits were reported most frequently.
The vast majority of respondents also indicated that the myriad benefits they obtained through the process of becoming certified — such as earning more professional credibility or retaining knowledge for longer — exceed the benefits they would’ve obtained if they’d gone through training without certification.
“Nearlythree-fourths
of respondents reported that they
actively sought out certification
on their own”
Key findings: Reasons for becoming certified6
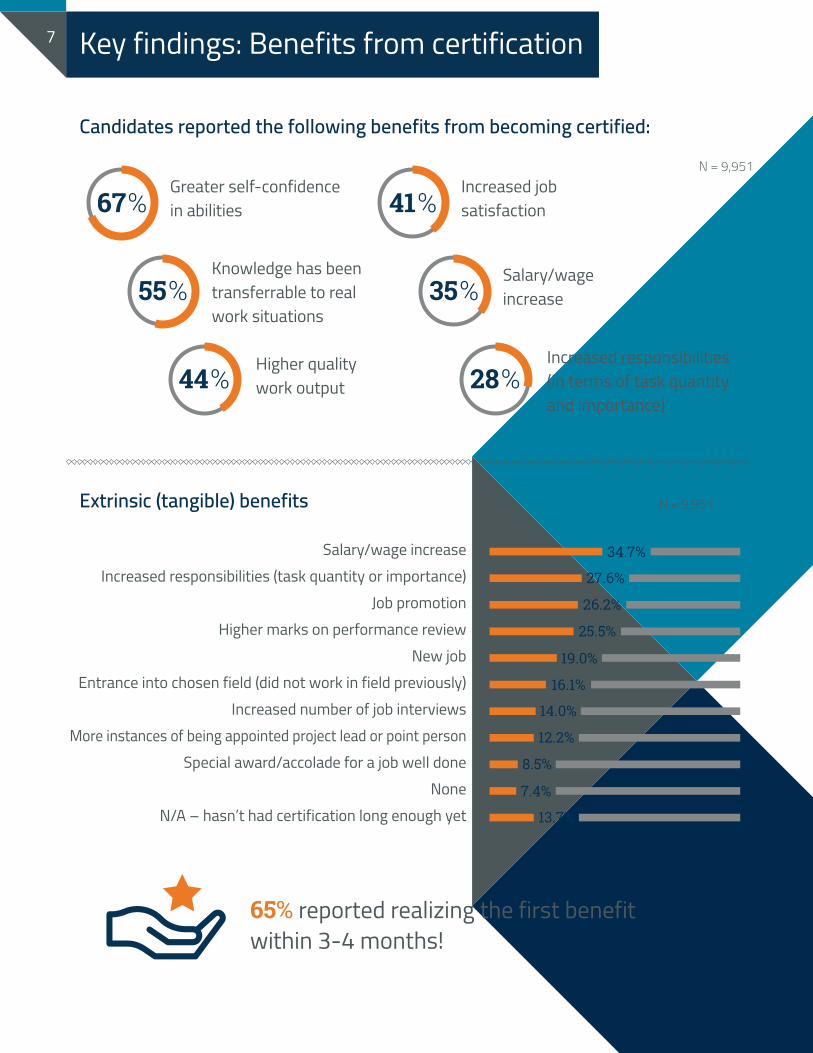
Candidates reported the following benefits from becoming certified:
N = 9,951
Knowledge has been transferrable to real work situations
Salary/wageincrease
Greater self-confidence in abilities
Increased jobsatisfaction
Higher qualitywork output
Increased responsibilities(in terms of task quantityand importance)
67%
55%
44%
41%
35%
28%
Extrinsic (tangible) benefits
Salary/wage increaseIncreased responsibilities (task quantity or importance)
Job promotionHigher marks on performance review
New jobEntrance into chosen field (did not work in field previously)
Increased number of job interviewsMore instances of being appointed project lead or point person
Special award/accolade for a job well doneNone
N/A – hasn’t had certification long enough yet
34.7%
27.6%
26.2%
25.5%
19.0%
16.1%
14.0%
12.2%
8.5%
7.4%
13.7%
N = 9,951
65% reported realizing the first benefit within 3-4 months!
Key findings: Benefits from certification7
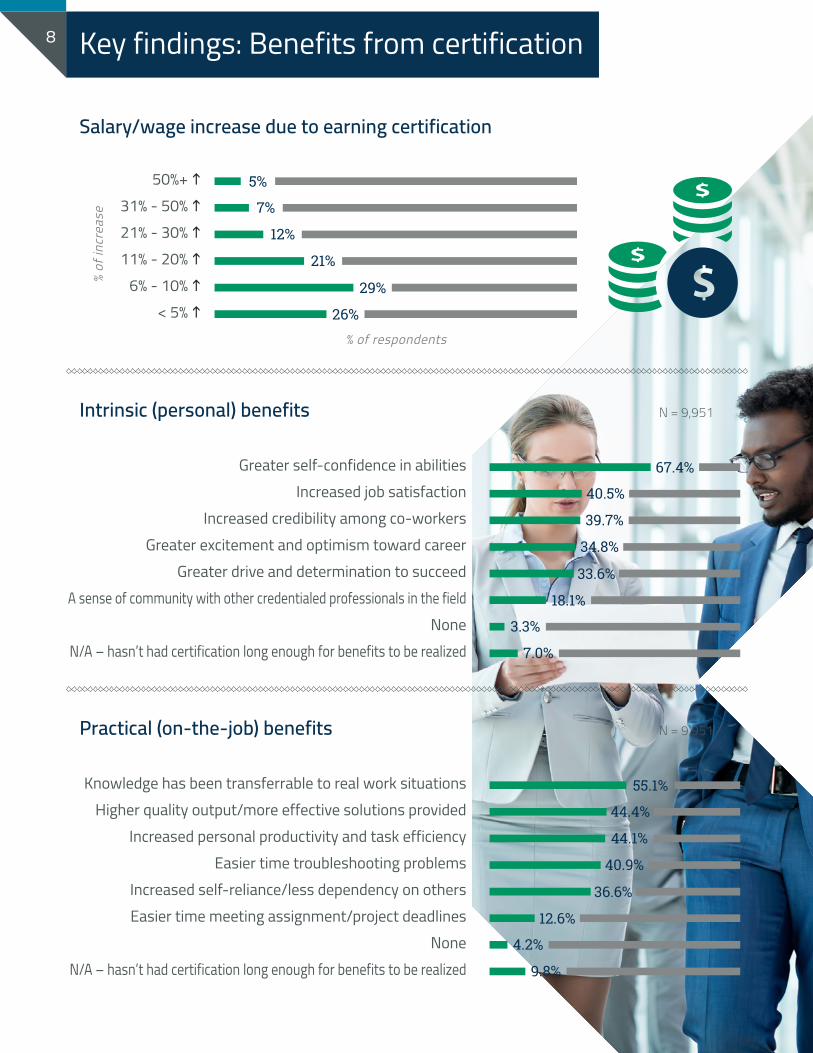
Salary/wage increase due to earning certification
Intrinsic (personal) benefits
Greater self-confidence in abilitiesIncreased job satisfaction
Increased credibility among co-workersGreater excitement and optimism toward career
Greater drive and determination to succeedA sense of community with other credentialed professionals in the field
NoneN/A – hasn’t had certification long enough for benefits to be realized
67.4%
40.5%
39.7%
34.8%
33.6%
18.1%
3.3%
7.0%
Practical (on-the-job) benefits
Knowledge has been transferrable to real work situationsHigher quality output/more effective solutions provided
Increased personal productivity and task efficiencyEasier time troubleshooting problems
Increased self-reliance/less dependency on othersEasier time meeting assignment/project deadlines
NoneN/A – hasn’t had certification long enough for benefits to be realized
55.1%
44.4%
44.1%
40.9%
36.6%
12.6%
4.2%
9.8%
N = 9,951
N = 9,951
50%+ h 31% - 50% h21% - 30% h11% - 20% h
6% - 10% h< 5% h
5%
7%
12%
21%
29%
26%
% of
incr
ease
% of respondents
Key findings: Benefits from certification8
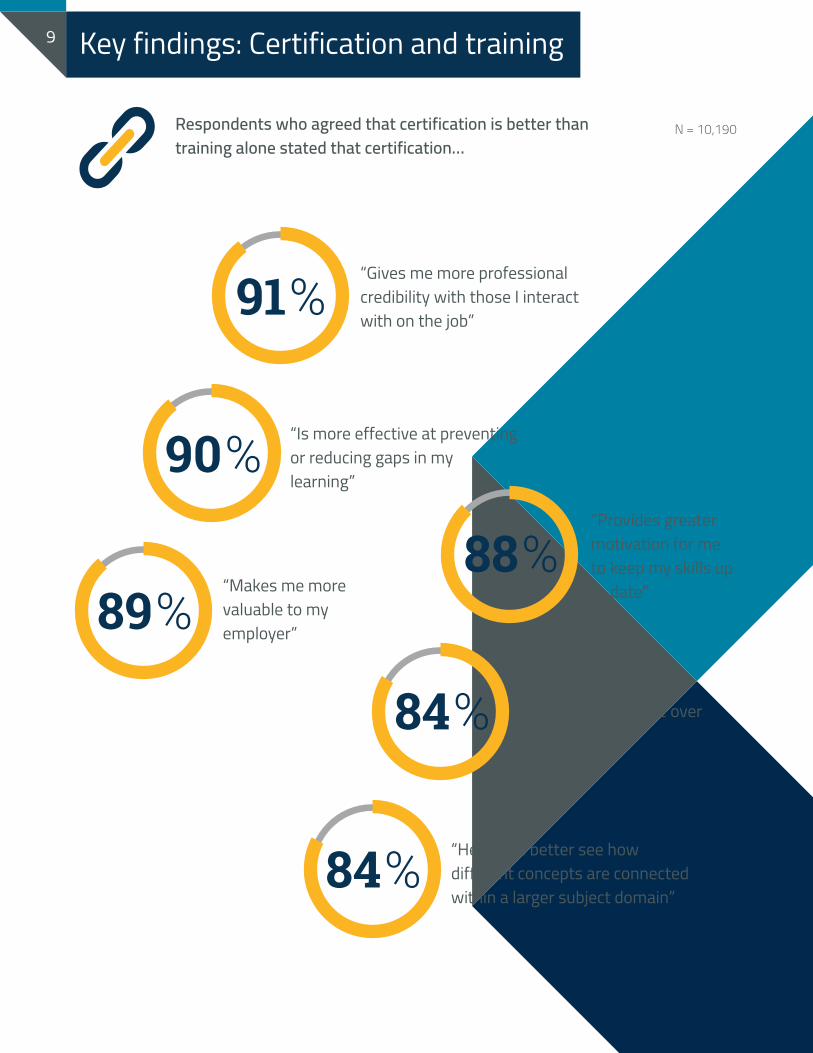
Respondents who agreed that certification is better than training alone stated that certification…
N = 10,190
“Is more effective at preventing or reducing gaps in my learning”
“Helps me retain acquired knowledge over a longer period”
“Gives me more professional credibility with those I interact with on the job”
“Provides greater motivation for me to keep my skills up to date”“Makes me more
valuable to my employer”
“Helps me better see how different concepts are connected within a larger subject domain”
91%
90%
89%
84%
88%
84%
Key findings: Certification and training9
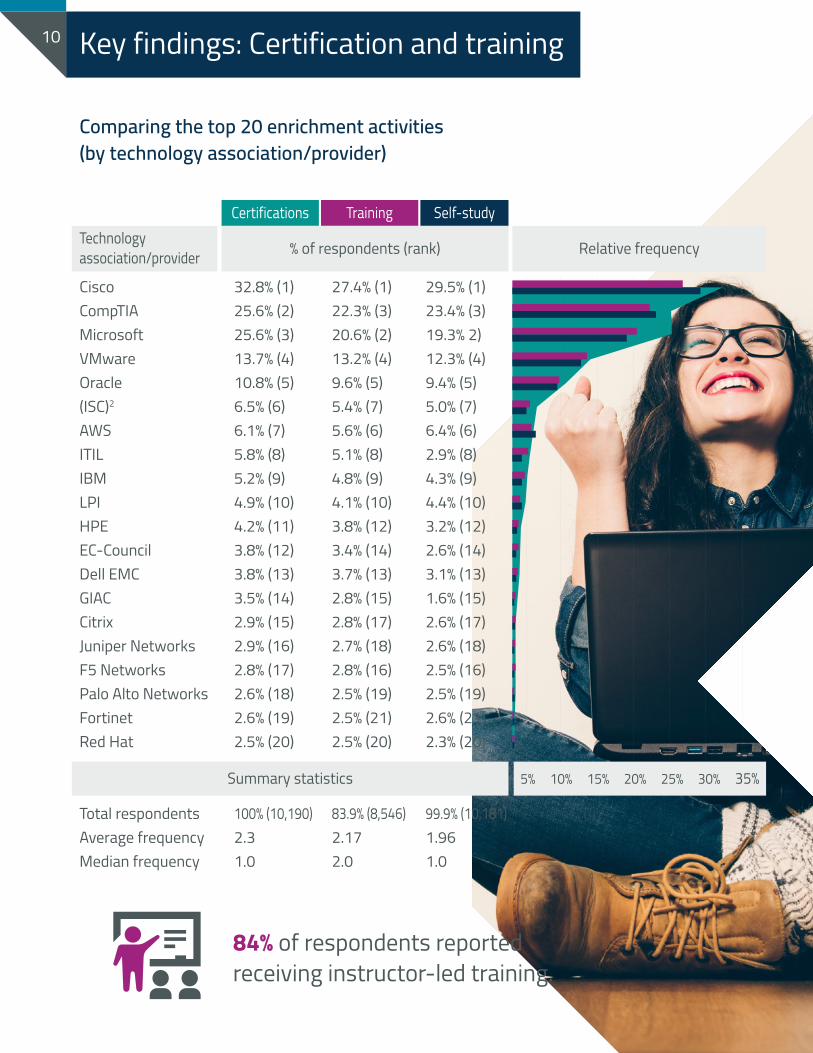
Comparing the top 20 enrichment activities(by technology association/provider)
CiscoCompTIAMicrosoftVMwareOracle(ISC)2
AWSITILIBMLPIHPEEC-CouncilDell EMCGIACCitrixJuniper NetworksF5 NetworksPalo Alto NetworksFortinetRed Hat
Total respondentsAverage frequencyMedian frequency
32.8% (1)25.6% (2)25.6% (3)13.7% (4)10.8% (5)6.5% (6)6.1% (7)5.8% (8)5.2% (9)4.9% (10)4.2% (11)3.8% (12)3.8% (13)3.5% (14)2.9% (15)2.9% (16)2.8% (17)2.6% (18)2.6% (19)2.5% (20)
100% (10,190)2.3 1.0
27.4% (1)22.3% (3)20.6% (2)13.2% (4)9.6% (5)5.4% (7)5.6% (6)5.1% (8)4.8% (9)4.1% (10)3.8% (12)3.4% (14)3.7% (13)2.8% (15)2.8% (17)2.7% (18)2.8% (16)2.5% (19)2.5% (21)2.5% (20)
83.9% (8,546)2.17 2.0
29.5% (1)23.4% (3)19.3% 2)12.3% (4)9.4% (5)5.0% (7)6.4% (6)2.9% (8)4.3% (9)4.4% (10)3.2% (12)2.6% (14)3.1% (13)1.6% (15)2.6% (17)2.6% (18)2.5% (16)2.5% (19)2.6% (21)2.3% (20)
99.9% (10,181)1.96 1.0
Certifications Training Self-studyTechnologyassociation/provider % of respondents (rank) Relative frequency
Summary statistics 5% 10% 15% 20% 25% 30% 35%
84% of respondents reported receiving instructor-led training.
Key findings: Certification and training10
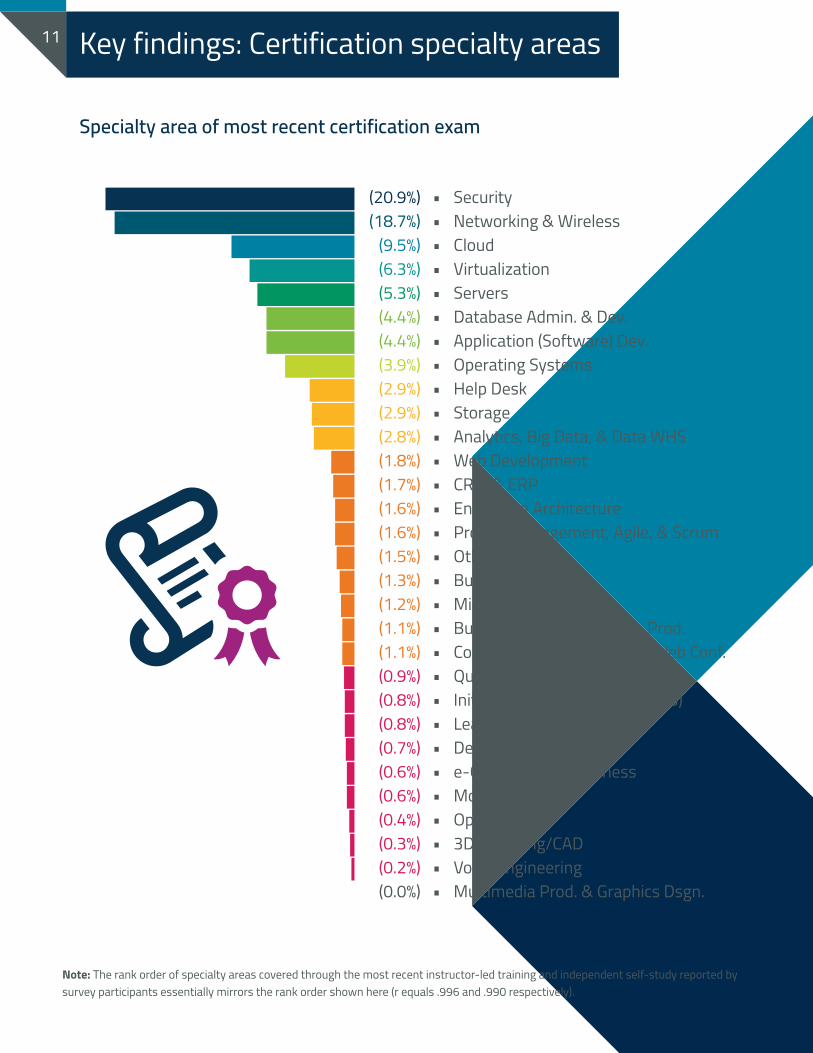
Specialty area of most recent certification exam
••••••••••••••••••••••••••••••
Security Networking & Wireless Cloud Virtualization Servers Database Admin. & Dev. Application (Software) Dev. Operating Systems Help Desk Storage Analytics, Big Data, & Data WHS Web Development CRM & ERP Enterprise Architecture Project Management, Agile, & Scrum Other Business Skills Middleware Business Apps. & Desktop Prod. Collab., Telephony, & Video/Web Conf. Quality Assurance Initiatives (laaS, loT, PaaS, SaaS) Leadership & Management DevOps e-Commerce/e-Business Mobile Open Source 3D Modeling/CAD Voice Engineering Multimedia Prod. & Graphics Dsgn.
(20.9%)(18.7%)
(9.5%)(6.3%)(5.3%)(4.4%)(4.4%)(3.9%)(2.9%)(2.9%)(2.8%)(1.8%)(1.7%)(1.6%)(1.6%)(1.5%)(1.3%)(1.2%)(1.1%)(1.1%)(0.9%)(0.8%)(0.8%)(0.7%)(0.6%)(0.6%)(0.4%)(0.3%)(0.2%)(0.0%)
Note: The rank order of specialty areas covered through the most recent instructor-led training and independent self-study reported by survey participants essentially mirrors the rank order shown here (r equals .996 and .990 respectively).
Key findings: Certification specialty areas11
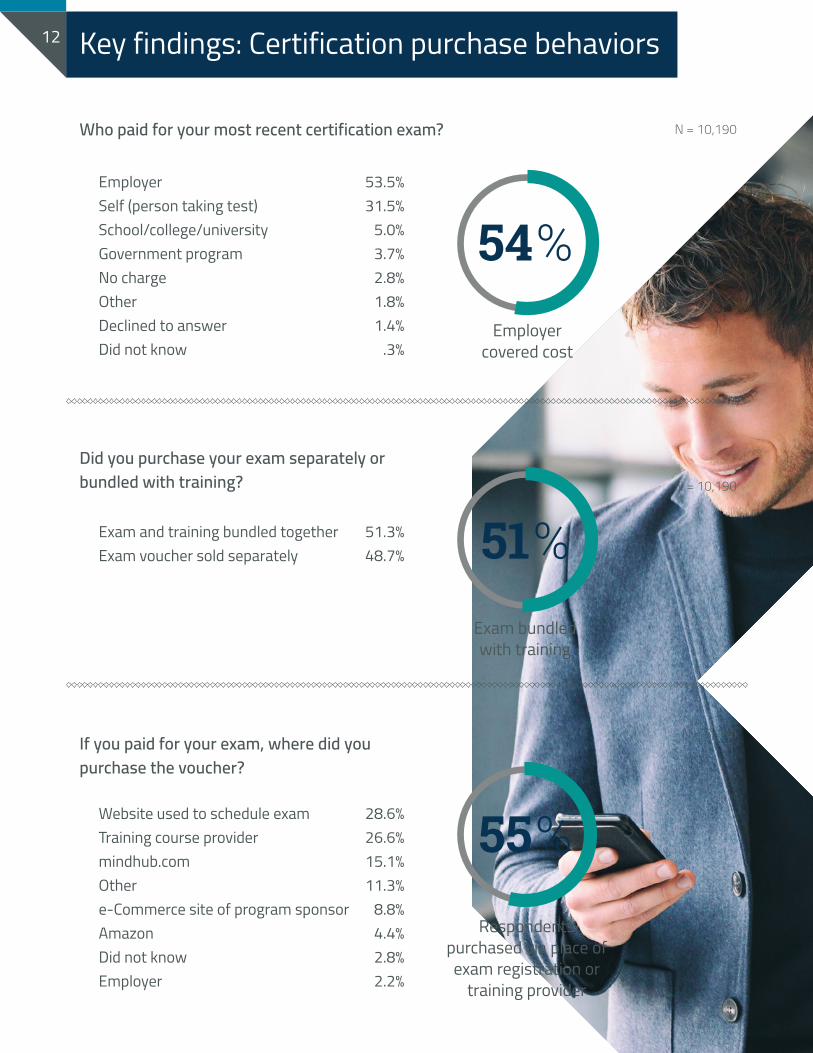
N = 10,190
EmployerSelf (person taking test)School/college/universityGovernment programNo chargeOtherDeclined to answerDid not know
53.5%31.5%
5.0%3.7%2.8%1.8%1.4%
.3%
54%Employer
covered cost
Website used to schedule examTraining course providermindhub.comOthere-Commerce site of program sponsorAmazonDid not knowEmployer
28.6%26.6%15.1%11.3%
8.8%4.4% 2.8% 2.2%
55%Respondents
purchased via place of exam registration or
training provider
Exam and training bundled togetherExam voucher sold separately
51.3% 48.7% 51%
Exam bundled with training
N = 10,190
N = 3,199
Key findings: Certification purchase behaviors12
If you paid for your exam, where did you purchase the voucher?
Did you purchase your exam separately or bundled with training?
Who paid for your most recent certification exam?
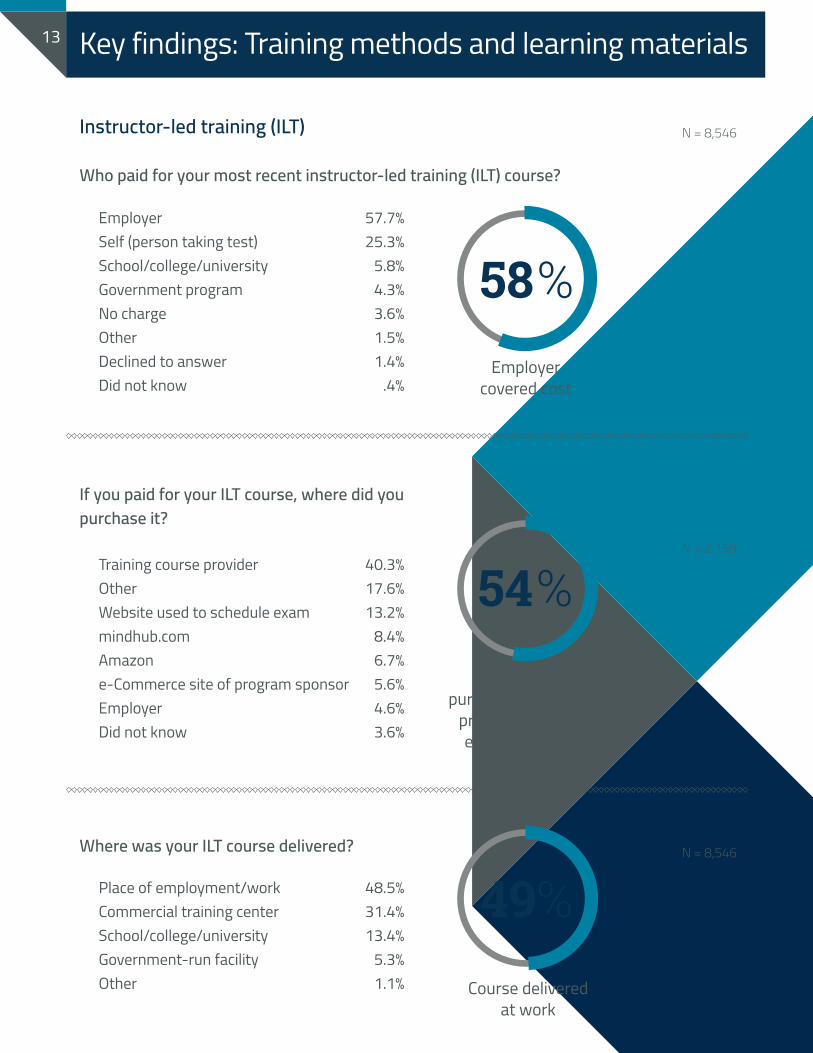
EmployerSelf (person taking test)School/college/universityGovernment programNo chargeOtherDeclined to answerDid not know
57.7%25.3%
5.8% 4.3%3.6%1.5%1.4%
.4%
Instructor-led training (ILT)
Who paid for your most recent instructor-led training (ILT) course?
58%Employer
covered cost
Training course providerOtherWebsite used to schedule exammindhub.comAmazone-Commerce site of program sponsorEmployerDid not know
40.3%17.6%13.2%
8.4%6.7% 5.6%4.6%3.6%
54%Respondents
purchased via training provider or place of exam registration
Place of employment/workCommercial training centerSchool/college/universityGovernment-run facilityOther
48.5%31.4%13.4%
5.3%1.1%
49%Course delivered
at work
Where was your ILT course delivered?
If you paid for your ILT course, where did you purchase it?
N = 8,546
N = 8,546
N = 2,159
Key findings: Training methods and learning materials13
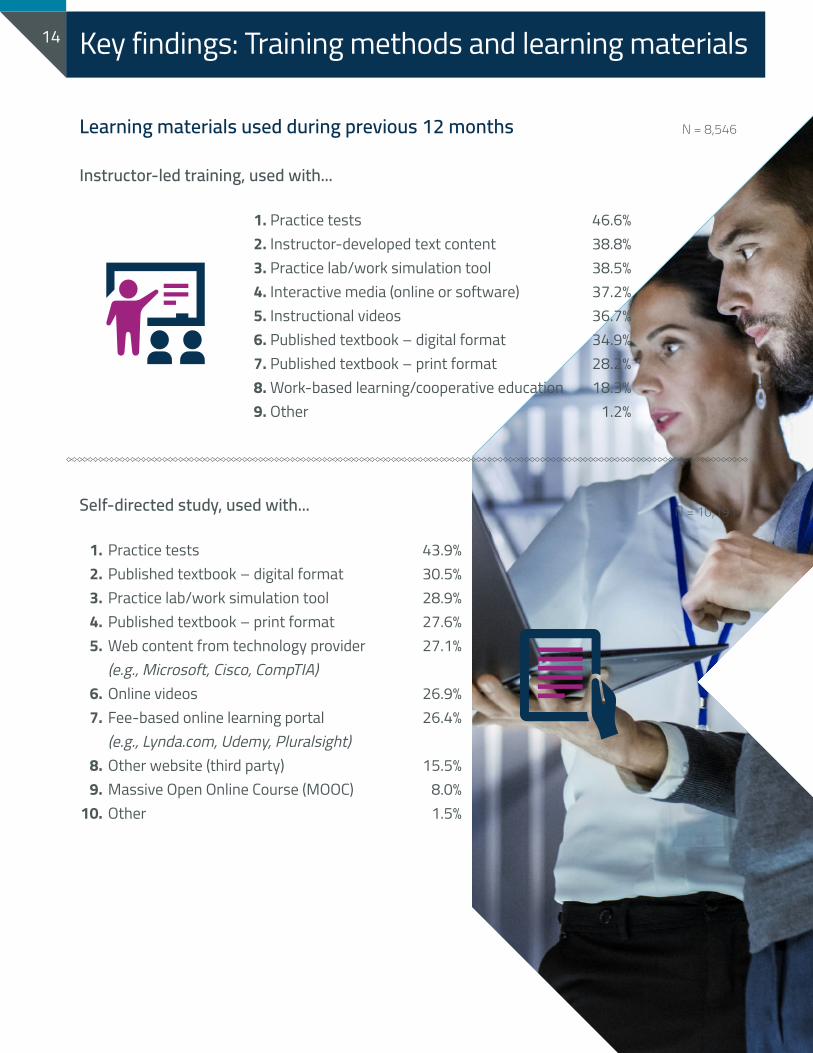
Learning materials used during previous 12 months
Instructor-led training, used with...
Self-directed study, used with...
Practice testsPublished textbook – digital formatPractice lab/work simulation toolPublished textbook – print formatWeb content from technology provider(e.g., Microsoft, Cisco, CompTIA)Online videosFee-based online learning portal(e.g., Lynda.com, Udemy, Pluralsight)Other website (third party)Massive Open Online Course (MOOC)Other
N = 8,546
1. Practice tests2. Instructor-developed text content3. Practice lab/work simulation tool4. Interactive media (online or software)5. Instructional videos6. Published textbook – digital format7. Published textbook – print format8. Work-based learning/cooperative education9. Other
46.6% 38.8%38.5%37.2%36.7%34.9%28.2%18.3%
1.2%
43.9% 30.5%28.9%27.6%27.1%
26.9%26.4%
15.5%8.0%1.5%
N = 10,191
1.2.3.4.5.
6.7.
8.9.
10.
Key findings: Training methods and learning materials14
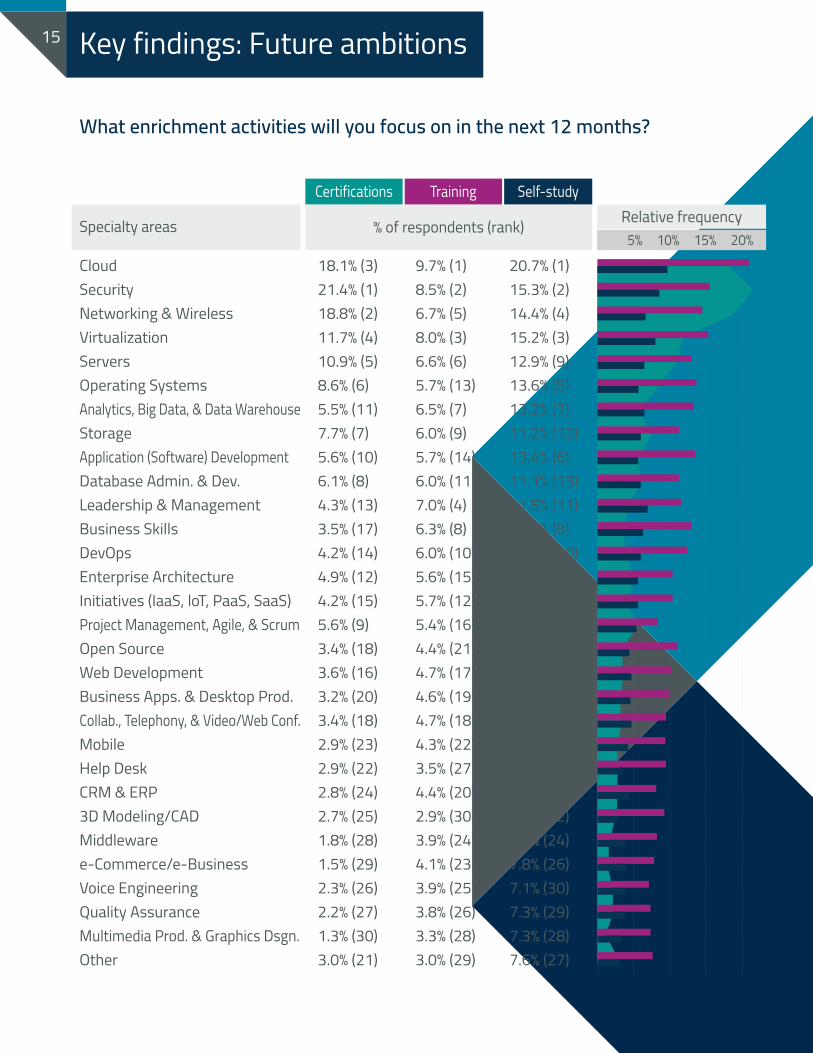
What enrichment activities will you focus on in the next 12 months?
CloudSecurityNetworking & WirelessVirtualizationServersOperating SystemsAnalytics, Big Data, & Data WarehouseStorageApplication (Software) DevelopmentDatabase Admin. & Dev.Leadership & ManagementBusiness SkillsDevOpsEnterprise ArchitectureInitiatives (IaaS, loT, PaaS, SaaS)Project Management, Agile, & ScrumOpen SourceWeb DevelopmentBusiness Apps. & Desktop Prod.Collab., Telephony, & Video/Web Conf. MobileHelp DeskCRM & ERP3D Modeling/CADMiddlewaree-Commerce/e-BusinessVoice EngineeringQuality AssuranceMultimedia Prod. & Graphics Dsgn.Other
18.1% (3)21.4% (1)18.8% (2)11.7% (4)10.9% (5)8.6% (6)5.5% (11)7.7% (7)5.6% (10)6.1% (8)4.3% (13)3.5% (17)4.2% (14)4.9% (12)4.2% (15)5.6% (9)3.4% (18)3.6% (16)3.2% (20)3.4% (18)2.9% (23)2.9% (22)2.8% (24)2.7% (25)1.8% (28)1.5% (29)2.3% (26)2.2% (27)1.3% (30)3.0% (21)
9.7% (1)8.5% (2)6.7% (5)8.0% (3)6.6% (6)5.7% (13)6.5% (7)6.0% (9)5.7% (14)6.0% (11)7.0% (4)6.3% (8)6.0% (10)5.6% (15)5.7% (12)5.4% (16)4.4% (21)4.7% (17)4.6% (19)4.7% (18)4.3% (22)3.5% (27)4.4% (20)2.9% (30)3.9% (24)4.1% (23)3.9% (25)3.8% (26)3.3% (28)3.0% (29)
20.7% (1)15.3% (2)14.4% (4)15.2% (3)12.9% (9)13.6% (5)13.2% (7)11.2% (12)13.4% (6)11.1% (13)11.5% (11)12.9% (8)12.3% (10)10.3% (15)10.2% (17)8.3% (23)11.0% (14)10.3% (16)10.0% (18)9.4% (19)9.4% (21)9.4% (20)8.1% (25)9.3% (22)8.2% (24)7.8% (26)7.1% (30)7.3% (29)7.3% (28)7.6% (27)
Certifications Training Self-study
Specialty areas % of respondents (rank) Relative frequency5% 10% 15% 20%
Key findings: Future ambitions15
Conclusion16
One thing is clear from our survey findings: certification holders attach great value to their certification achievements. Respondents from our survey reported receiving multiple benefits by becoming certified, and at multiple levels — extrinsic, intrinsic, and practical.
Certification helped open doors to greater professional opportunities for these individuals and empowered them in a variety of ways, including increasing their self-confidence and lending them more credibility in the workplace.
We also learned that the vast majority of respondents feel that certification is superior to training alone in several ways, including allowing certification holders to develop deeper technical skills, have stronger influence among their professional colleagues, and foster a greater sense of commitment to continued learning and skill development.
With the continued emphasis on skill development that we see in our latest research — especially in the IT space — we anticipate that the relevance and efficacy of certification will only continue to grow in the coming years.
“The findings from the Value of Certification
survey show that there continues to be immense
value in becoming certified.”
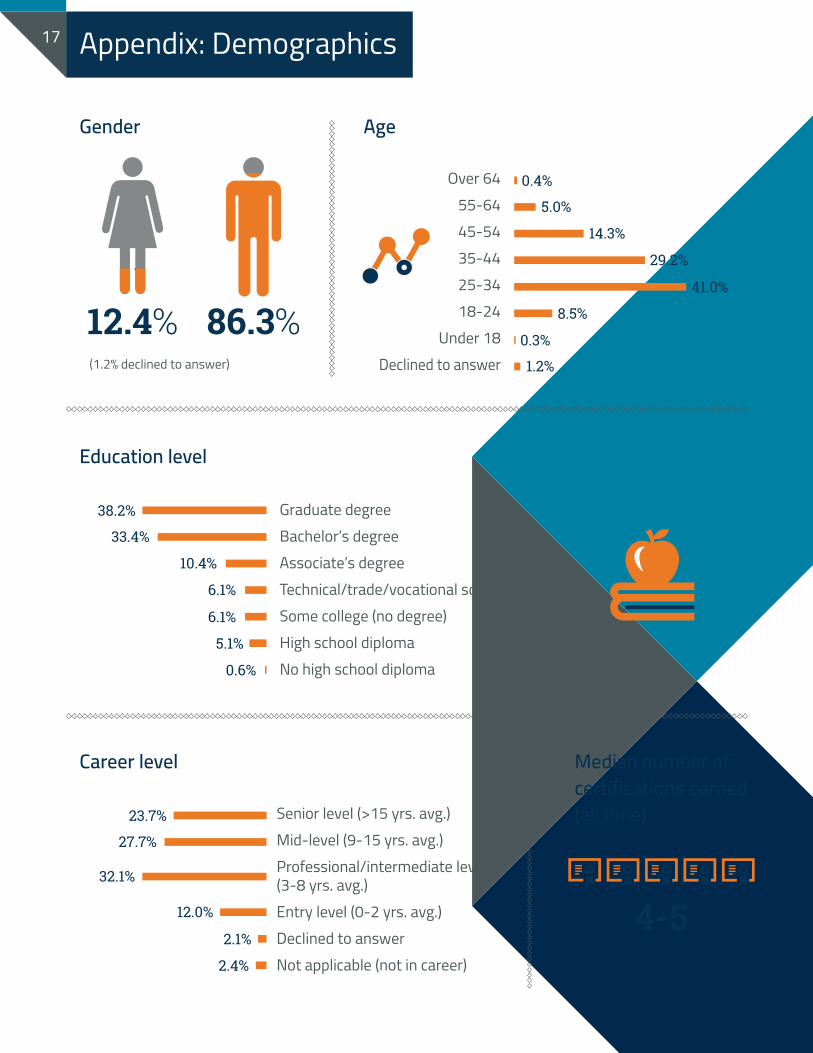
Appendix: Demographics17
Gender
Education level
Graduate degreeBachelor’s degreeAssociate’s degreeTechnical/trade/vocational school certificateSome college (no degree)High school diplomaNo high school diploma
38.2%
33.4%
10.4%
6.1%
6.1%
5.1%
0.6%
Career level
Senior level (>15 yrs. avg.)Mid-level (9-15 yrs. avg.)Professional/intermediate level(3-8 yrs. avg.)Entry level (0-2 yrs. avg.)Declined to answerNot applicable (not in career)
23.7%
27.7%
32.1%
12.0%
2.1%
2.4%
Age
Over 6455-6445-5435-4425-3418-24
Under 18Declined to answer
0.4%
5.0%
14.3%
29.2%
41.0%
8.5%
0.3%
1.2%
86.3%(1.2% declined to answer)
12.4%
Median number ofcertifications earned(all time)
4-5
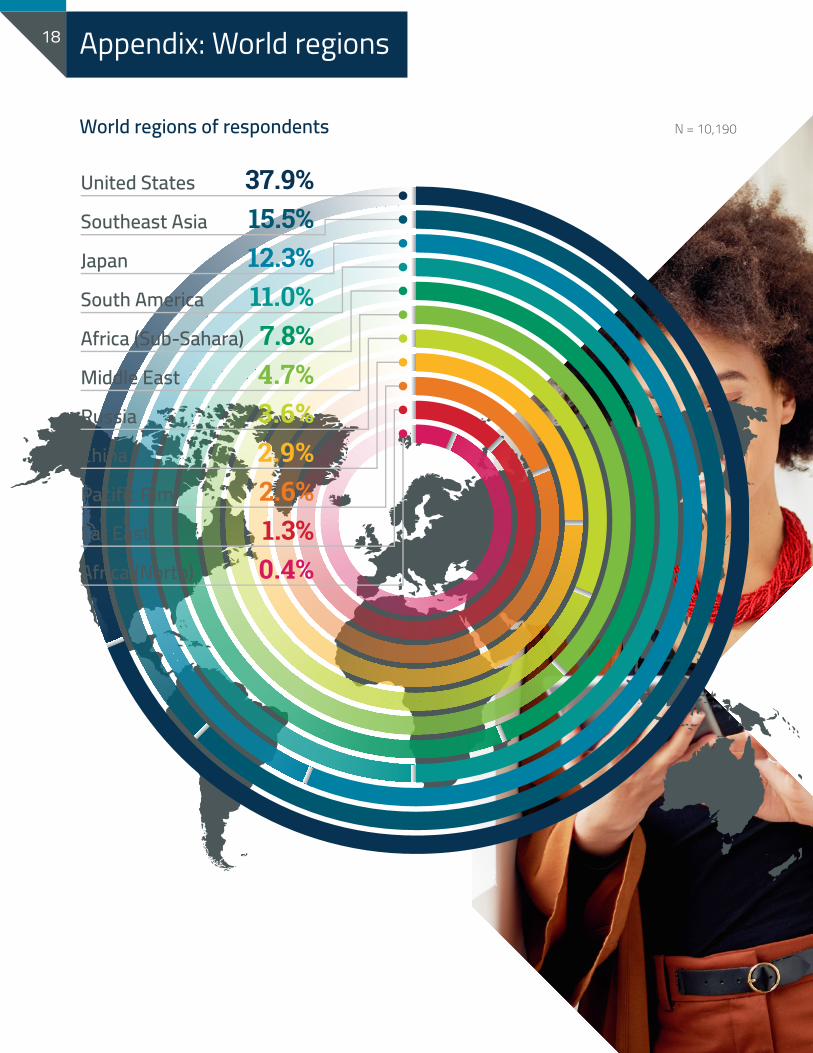
Appendix: World regions18
N = 10,190World regions of respondents
United States
Southeast Asia
Japan
South America
Africa (Sub-Sahara)
Middle East
Russia
China
Pacific Rim
Far East
Africa (North)
37.9%15.5%12.3%11.0%7.8%4.7%3.6%2.9%2.6%1.3%0.4%
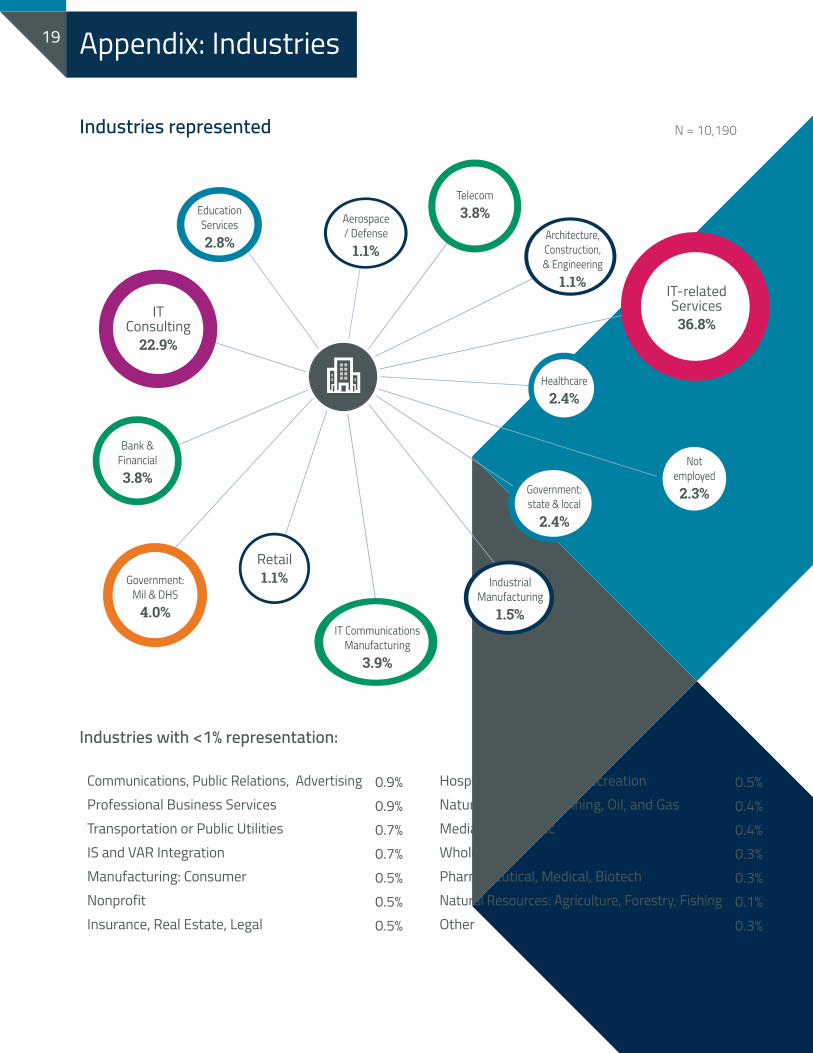
Appendix: Industries19
Industries represented N = 10,190
Communications, Public Relations, AdvertisingProfessional Business ServicesTransportation or Public Utilities IS and VAR IntegrationManufacturing: ConsumerNonprofit Insurance, Real Estate, Legal
0.9% 0.9%0.7%0.7%0.5%0.5%0.5%
Industries with <1% representation:
IT-related Services36.8%
ITConsulting
22.9%
Architecture, Construction,& Engineering
1.1%
Aerospace/ Defense
1.1%
Retail1.1% Industrial
Manufacturing1.5%
Healthcare2.4%
Government:state & local
2.4%
EducationServices2.8%
Bank &Financial3.8%
IT CommunicationsManufacturing
3.9%
Government:Mil & DHS
4.0%
Telecom3.8%
Notemployed2.3%
Hospitality, Travel, and RecreationNatural Resources: Mining, Oil, and GasMedia, Firm, MusicWholesalePharmaceutical, Medical, BiotechNatural Resources: Agriculture, Forestry, FishingOther
0.5%0.4%0.4%0.3%0.3%0.1%0.3%

Appendix: Employer size20
Employer size in terms of headcount
Less than 1010-4950-99100-199200-499500-9991,000-1,9992,000-4,9995,000-9,99910,000 or more
4.8%
9.9%7.4% 8.4%
9.9% 9.2%7.2%
8.7% 8.3%
26.1%
# of employees
-
+
N = 10,190
About Pearson VUE21
Pearson VUE has been a pioneer in the computer-based testing industry for decades, delivering more than 15 million certification and licensure exams annually in every industry from academia and admissions to IT and healthcare. We are the global leaders in developing and delivering high-stakes exams via the world’s most comprehensive network of nearly 20,000 highly secure test centers in 180 countries. Our leadership in the assessment industry is a result of our collaborative partnerships with a broad range of clients, from leading technology firms to government and regulatory agencies. For more information, please visit PearsonVUE.com.
Leading the assessment industry
©2019 Pearson Education, Inc. or its affiliate(s). All rights reserved.