Embed Size (px)
Citation preview

2018 tax planning tables
Investment and Insurance Products:
NOT FDIC Insured NO Bank Guarantee MAY Lose Value
1 2018 tax planning tables
•
•
•
•
•
•
•
2018 important deadlinesLast day to …January 16
Pay fourth-quarter 2017 federal individual estimated income tax
January 25Buy in to close a short-against-the-box position (regular-way settlement) for 2017
April 1Take 2017 required minimum distribution (RMD) from traditional IRAs if you reached age 701/2 in 2017
April 17• File 2017 federal individual income tax return (or make payment
with extension)• Pay first-quarter 2018 federal individual estimated income tax• Make 2017 contribution to traditional IRA, Roth IRA, or
Education Savings Account (ESA)
June 15Pay second-quarter 2018 federal individual estimated income tax
September 17Pay third-quarter 2018 federal individual estimated income tax
October 15File 2017 federal individual income tax return subject to automatic extensions
November 30Double up to avoid violating the “wash sale” rule
December 31• Sell stock or listed options to realize a gain or loss• Take 2018 RMDs from traditional IRAs and most qualified plans
if you reached age 701/2 before 2018• Complete a Roth IRA conversion• Complete a 529 plan contribution• Sell shares acquired through the 2018 exercise of incentive stock
options (ISOs) in disqualifying disposition to limit alternative minimum tax (AMT) exposure
• Complete gifts for the current calendar year (charitable or other)
22018 tax planning tables
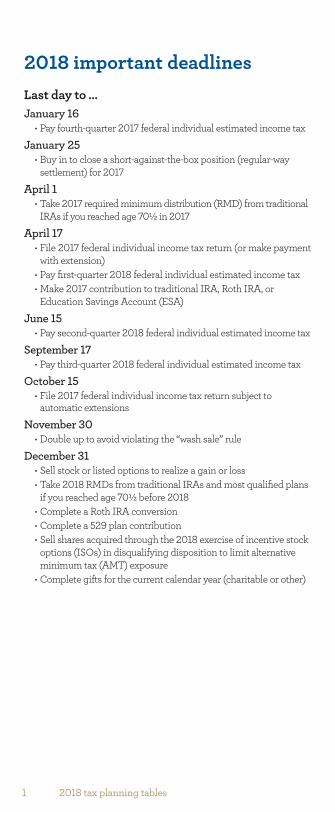
2018 income tax rate schedules*
* Taxable income is income after all deductions (including either itemized or standard deduction).
Married taxpayer filing jointly/surviving spouseTaxable income* Tax
Over But not over Pay+ % on excess
Of the amount over
$ 0 $ 19,050 $ 0.00 10% $ 0
$ 19,050 $ 77,400 $ 1,905.00 12% $ 19,050
$ 77,400 $ 165,000 $ 8,907.00 22% $ 77,400
$ 165,000 $ 315,000 $ 28,179.00 24% $ 165,000
$ 315,000 $ 400,000 $ 64,179.00 32% $ 315,000
$ 400,000 $ 600,000 $ 91,379.00 35% $ 400,000
$ 600,000 – $ 161,379.00 37% $ 600,000
Single taxpayerTaxable income* Tax
Over But not over Pay+ % on excess
Of the amount over
$ 0 $ 9,525 $ 0 10% $ 0
$ 9,525 $ 38,700 $ 952.50 12% $ 9,525
$ 38,700 $ 82,500 $ 4,453.50 22% $ 38,700
$ 82,500 $ 157,500 $ 14,089.50 24% $ 82,500
$ 157,500 $ 200,000 $ 32,089.50 32% $ 157,500
$ 200,000 $ 500,000 $ 45,689.50 35% $ 200,000
$ 500,000 – $ 150,689.50 37% $ 500,000
Head of householdTaxable income* Tax
Over But not over Pay+ % on excess
Of the amount over
$ 0 $ 13,600 $ 0 10% $ 0
$ 13,600 $ 51,800 $ 1,360.00 12% $ 13,600
$ 51,800 $ 82,500 $ 5,944.00 22% $ 51,800
$ 82,500 $ 157,500 $ 12,698.00 24% $ 82,500
$ 157,500 $ 200,000 $ 30,698.00 32% $ 157,500
$ 200,000 $ 500,000 $ 44,298.00 35% $ 200,000
$ 500,000 – $149,298.00 37% $ 500,000
Married taxpayer filing separatelyTaxable income* Tax
Over But not over Pay+ % on excess
Of the amount over
$ 0 $ 9,525 $ 0 10% $ 0
$ 9,525 $ 38,700 $ 952.50 12% $ 9,525
$ 38,700 $ 82,500 $ 4,453.50 22% $ 38,700
$ 82,500 $ 157,500 $ 14,089.50 24% $ 82,500
$ 157,500 $ 200,000 $ 32,089.50 32% $ 157,500
$ 200,000 $ 300,000 $ 45,689.50 35% $ 200,000
$ 300,000 – $ 80,689.50 37% $ 300,000
3 2018 tax planning tables
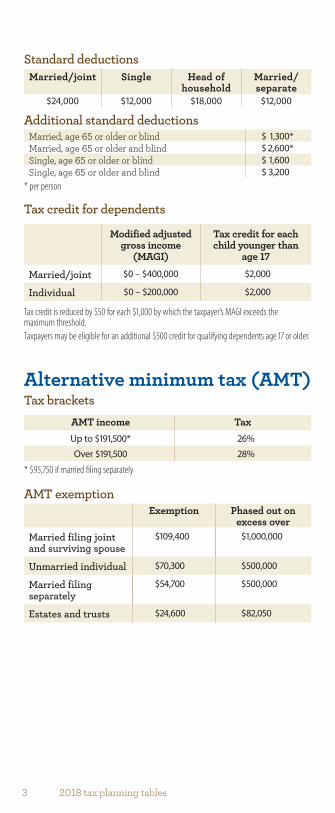
Standard deductionsMarried/joint Single Head of
household Married/separate
$24,000 $12,000 $18,000 $12,000
Additional standard deductionsMarried, age 65 or older or blind $ 1,300*Married, age 65 or older and blind $ 2,600*Single, age 65 or older or blind $ 1,600Single, age 65 or older and blind $ 3,200
* per person
Tax credit for dependents
Modified adjusted gross income
(MAGI)
Tax credit for each child younger than
age 17
Married/joint $0 – $400,000 $2,000
Individual $0 – $200,000 $2,000
Tax credit is reduced by $50 for each $1,000 by which the taxpayer’s MAGI exceeds the maximum threshold.Taxpayers may be eligible for an additional $500 credit for qualifying dependents age 17 or older.
Alternative minimum tax (AMT)Tax brackets
AMT income TaxUp to $191,500* 26%
Over $191,500 28%
* $95,750 if married filing separately
AMT exemptionExemption Phased out on
excess overMarried filing joint and surviving spouse
$109,400 $1,000,000
Unmarried individual $70,300 $500,000
Married filing separately
$54,700 $500,000
Estates and trusts $24,600 $82,050
42018 tax planning tables
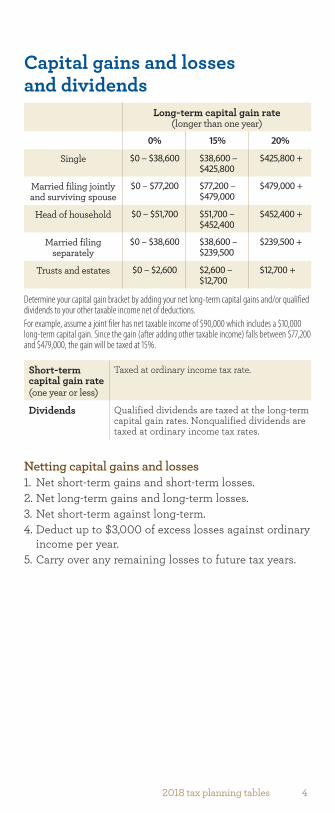
Capital gains and losses and dividends
Long-term capital gain rate (longer than one year)
0% 15% 20%
Single $0 – $38,600 $38,600 – $425,800
$425,800 +
Married filing jointly and surviving spouse
$0 – $77,200 $77,200 – $479,000
$479,000 +
Head of household $0 – $51,700 $51,700 – $452,400
$452,400 +
Married filing separately
$0 – $38,600 $38,600 – $239,500
$239,500 +
Trusts and estates $0 – $2,600 $2,600 – $12,700
$12,700 +
Determine your capital gain bracket by adding your net long-term capital gains and/or qualified dividends to your other taxable income net of deductions.For example, assume a joint filer has net taxable income of $90,000 which includes a $10,000 long-term capital gain. Since the gain (after adding other taxable income) falls between $77,200 and $479,000, the gain will be taxed at 15%.
Short-term capital gain rate(one year or less)
Taxed at ordinary income tax rate.
Dividends Qualified dividends are taxed at the long-term capital gain rates. Nonqualified dividends are taxed at ordinary income tax rates.
Netting capital gains and losses1. Net short-term gains and short-term losses.2. Net long-term gains and long-term losses.3. Net short-term against long-term.4. Deduct up to $3,000 of excess losses against ordinary
income per year.5. Carry over any remaining losses to future tax years.
5 2018 tax planning tables
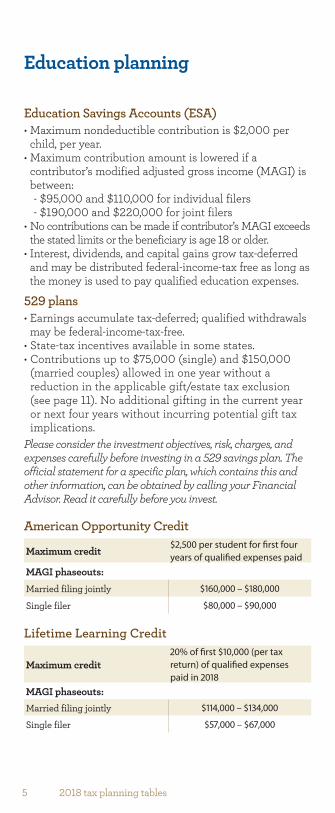
Education planning
Education Savings Accounts (ESA)• Maximum nondeductible contribution is $2,000 per
child, per year.• Maximum contribution amount is lowered if a
contributor’s modified adjusted gross income (MAGI) is between:- $95,000 and $110,000 for individual filers- $190,000 and $220,000 for joint filers
• No contributions can be made if contributor’s MAGI exceeds the stated limits or the beneficiary is age 18 or older.
• Interest, dividends, and capital gains grow tax-deferred and may be distributed federal-income-tax free as long as the money is used to pay qualified education expenses.
529 plans• Earnings accumulate tax-deferred; qualified withdrawals
may be federal-income-tax-free.• State-tax incentives available in some states.• Contributions up to $75,000 (single) and $150,000
(married couples) allowed in one year without a reduction in the applicable gift/estate tax exclusion (see page 11). No additional gifting in the current year or next four years without incurring potential gift tax implications.
Please consider the investment objectives, risk, charges, and expenses carefully before investing in a 529 savings plan. The official statement for a specific plan, which contains this and other information, can be obtained by calling your Financial Advisor. Read it carefully before you invest.
American Opportunity Credit
Maximum credit $2,500 per student for first four years of qualified expenses paid
MAGI phaseouts:Married filing jointly $160,000 – $180,000
Single filer $80,000 – $90,000
Lifetime Learning Credit
Maximum credit20% of first $10,000 (per tax return) of qualified expenses paid in 2018
MAGI phaseouts:Married filing jointly $114,000 – $134,000
Single filer $57,000 – $67,000
62018 tax planning tables
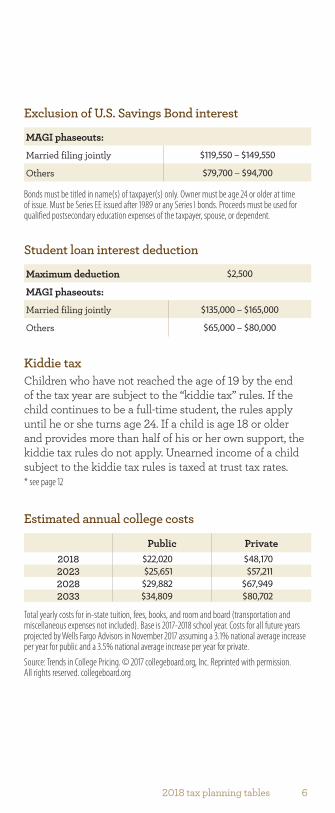
Exclusion of U.S. Savings Bond interest
MAGI phaseouts:
Married filing jointly $119,550 – $149,550
Others $79,700 – $94,700
Bonds must be titled in name(s) of taxpayer(s) only. Owner must be age 24 or older at time of issue. Must be Series EE issued after 1989 or any Series I bonds. Proceeds must be used for qualified postsecondary education expenses of the taxpayer, spouse, or dependent.
Student loan interest deduction
Maximum deduction $2,500
MAGI phaseouts:
Married filing jointly $135,000 – $165,000
Others $65,000 – $80,000
Kiddie taxChildren who have not reached the age of 19 by the end of the tax year are subject to the “kiddie tax” rules. If the child continues to be a full-time student, the rules apply until he or she turns age 24. If a child is age 18 or older and provides more than half of his or her own support, the kiddie tax rules do not apply. Unearned income of a child subject to the kiddie tax rules is taxed at trust tax rates.* see page 12
Estimated annual college costs
Public Private2018 $22,020 $48,1702023 $25,651 $57,2112028 $29,882 $67,9492033 $34,809 $80,702
Total yearly costs for in-state tuition, fees, books, and room and board (transportation and miscellaneous expenses not included). Base is 2017-2018 school year. Costs for all future years projected by Wells Fargo Advisors in November 2017 assuming a 3.1% national average increase per year for public and a 3.5% national average increase per year for private. Source: Trends in College Pricing. © 2017 collegeboard.org, Inc. Reprinted with permission.All rights reserved. collegeboard.org
7 2018 tax planning tables
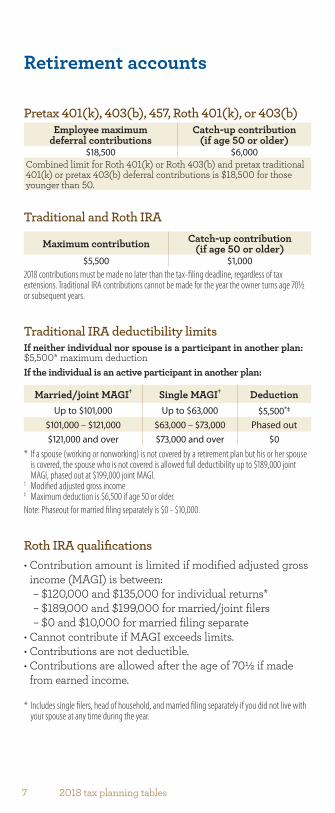
Retirement accounts
Pretax 401(k), 403(b), 457, Roth 401(k), or 403(b)Employee maximum
deferral contributionsCatch-up contribution
(if age 50 or older)$18,500 $6,000
Combined limit for Roth 401(k) or Roth 403(b) and pretax traditional 401(k) or pretax 403(b) deferral contributions is $18,500 for those younger than 50.
Traditional and Roth IRA
Maximum contribution Catch-up contribution (if age 50 or older)
$5,500 $1,0002018 contributions must be made no later than the tax-filing deadline, regardless of tax extensions. Traditional IRA contributions cannot be made for the year the owner turns age 70½ or subsequent years.
Traditional IRA deductibility limitsIf neither individual nor spouse is a participant in another plan: $5,500* maximum deduction
* If a spouse (working or nonworking) is not covered by a retirement plan but his or her spouse is covered, the spouse who is not covered is allowed full deductibility up to $189,000 joint MAGI, phased out at $199,000 joint MAGI.
If the individual is an active participant in another plan:
Married/joint MAGI† Single MAGI† DeductionUp to $101,000 Up to $63,000 $5,500*‡
$101,000 – $121,000 $63,000 – $73,000 Phased out$121,000 and over $73,000 and over $0
† Modified adjusted gross income‡ Maximum deduction is $6,500 if age 50 or older.Note: Phaseout for married filing separately is $0 - $10,000.
Roth IRA qualifications• Contribution amount is limited if modified adjusted gross
income (MAGI) is between:– $120,000 and $135,000 for individual returns*– $189,000 and $199,000 for married/joint filers– $0 and $10,000 for married filing separate
• Cannot contribute if MAGI exceeds limits.• Contributions are not deductible.• Contributions are allowed after the age of 701/2 if made
from earned income.
* Includes single filers, head of household, and married filing separately if you did not live with your spouse at any time during the year.
82018 tax planning tables
AgeLife
Expectancy Factor
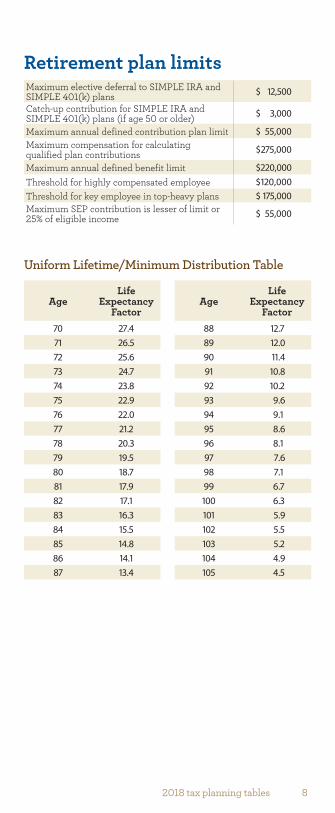
Retirement plan limitsMaximum elective deferral to SIMPLE IRA and SIMPLE 401(k) plans $ 12,500
Catch-up contribution for SIMPLE IRA and SIMPLE 401(k) plans (if age 50 or older) $ 3,000
Maximum annual defined contribution plan limit $ 55,000Maximum compensation for calculating qualified plan contributions $ 275,000
Maximum annual defined benefit limit $ 220,000Threshold for highly compensated employee $ 120,000Threshold for key employee in top-heavy plans $ 175,000Maximum SEP contribution is lesser of limit or 25% of eligible income $ 55,000
Uniform Lifetime/Minimum Distribution Table
AgeLife
Expectancy Factor
70 27.471 26.572 25.673 24.774 23.875 22.976 22.077 21.278 20.379 19.580 18.781 17.982 17.183 16.384 15.585 14.886 14.187 13.4
88 12.789 12.090 11.491 10.892 10.293 9.694 9.195 8.696 8.197 7.698 7.199 6.7100 6.3101 5.9102 5.5103 5.2104 4.9105 4.5
9 2018 tax planning tables
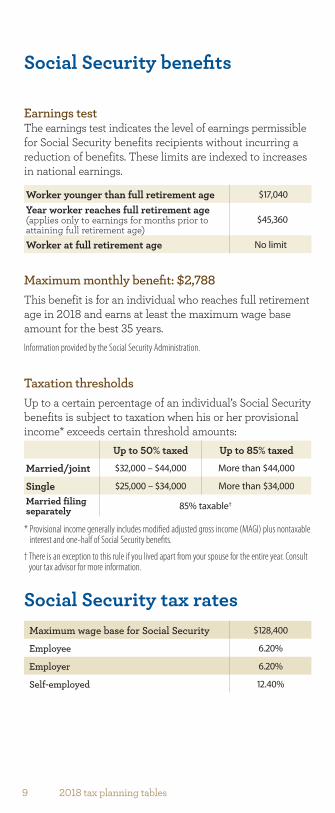
Social Security benefits
Earnings testThe earnings test indicates the level of earnings permissible for Social Security benefits recipients without incurring a reduction of benefits. These limits are indexed to increases in national earnings.
Worker younger than full retirement age $17,040
Year worker reaches full retirement age (applies only to earnings for months prior to attaining full retirement age)
$45,360
Worker at full retirement age No limit
Maximum monthly benefit: $2,788This benefit is for an individual who reaches full retirement age in 2018 and earns at least the maximum wage base amount for the best 35 years. Information provided by the Social Security Administration.
Taxation thresholdsUp to a certain percentage of an individual’s Social Security benefits is subject to taxation when his or her provisional income* exceeds certain threshold amounts:
* Provisional income generally includes modified adjusted gross income (MAGI) plus nontaxable interest and one-half of Social Security benefits.
Up to 50% taxed Up to 85% taxed
Married/joint $32,000 – $44,000 More than $44,000
Single $25,000 – $34,000 More than $34,000
Married filing separately 85% taxable†
† There is an exception to this rule if you lived apart from your spouse for the entire year. Consult your tax advisor for more information.
Social Security tax ratesMaximum wage base for Social Security $128,400
Employee 6.20%
Employer 6.20%
Self-employed 12.40%
102018 tax planning tables
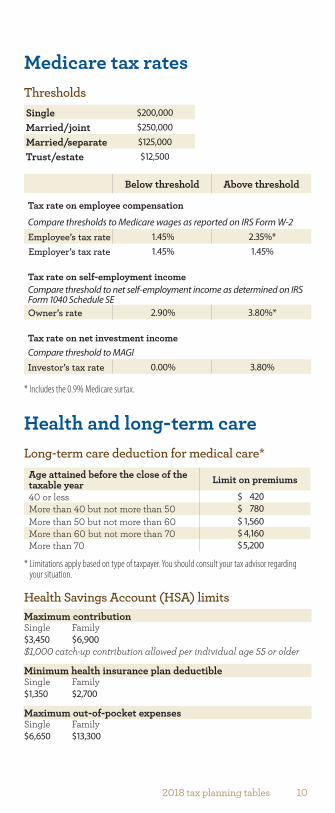
Medicare tax ratesThresholdsSingle $200,000
Married/joint $250,000
Married/separate $125,000
Trust/estate $12,500
Below threshold Above threshold
Tax rate on employee compensation
Compare thresholds to Medicare wages as reported on IRS Form W-2Employee’s tax rate 1.45% 2.35%*Employer’s tax rate 1.45% 1.45%
Tax rate on self-employment incomeCompare threshold to net self-employment income as determined on IRS Form 1040 Schedule SEOwner’s rate 2.90% 3.80%*
Tax rate on net investment incomeCompare threshold to MAGIInvestor’s tax rate 0.00% 3.80%
* Includes the 0.9% Medicare surtax.
Health and long-term careLong-term care deduction for medical care*
* Limitations apply based on type of taxpayer. You should consult your tax advisor regarding your situation.
Age attained before the close of the taxable year Limit on premiums
40 or less $ 420More than 40 but not more than 50 $ 780More than 50 but not more than 60 $ 1,560More than 60 but not more than 70 $ 4,160More than 70 $ 5,200
Health Savings Account (HSA) limitsMaximum contributionSingle Family$3,450 $6,900$1,000 catch-up contribution allowed per individual age 55 or older
Minimum health insurance plan deductibleSingle Family$1,350 $2,700
Maximum out-of-pocket expensesSingle Family$6,650 $13,300
11 2018 tax planning tables
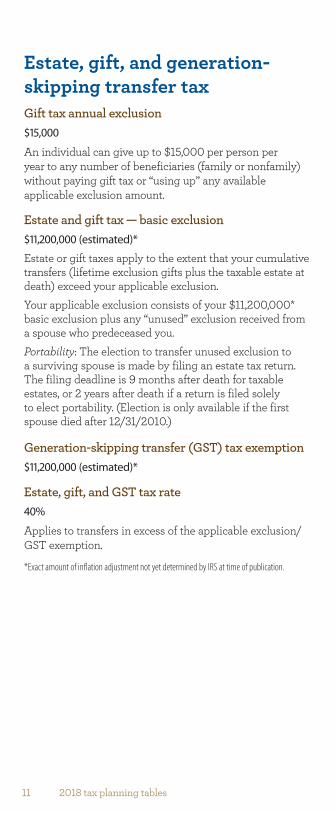
Estate, gift, and generation-skipping transfer taxGift tax annual exclusion$15,000
An individual can give up to $15,000 per person per year to any number of beneficiaries (family or nonfamily) without paying gift tax or “using up” any available applicable exclusion amount.
Estate and gift tax — basic exclusion$11,200,000 (estimated)*
*Exact amount of inflation adjustment not yet determined by IRS at time of publication.
Estate or gift taxes apply to the extent that your cumulative transfers (lifetime exclusion gifts plus the taxable estate at death) exceed your applicable exclusion.Your applicable exclusion consists of your $11,200,000* basic exclusion plus any “unused” exclusion received from a spouse who predeceased you.Portability: The election to transfer unused exclusion to a surviving spouse is made by filing an estate tax return. The filing deadline is 9 months after death for taxable estates, or 2 years after death if a return is filed solely to elect portability. (Election is only available if the first spouse died after 12/31/2010.)
Generation-skipping transfer (GST) tax exemption$11,200,000 (estimated)*
Estate, gift, and GST tax rate40%
Applies to transfers in excess of the applicable exclusion/GST exemption.
122018 tax planning tables
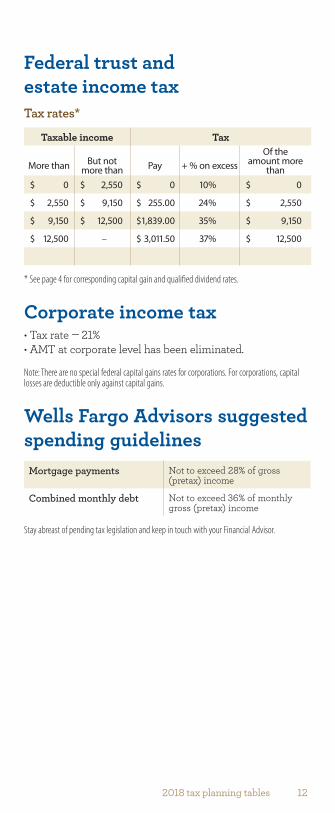
Federal trust and estate income taxTax rates*
* See page 4 for corresponding capital gain and qualified dividend rates.
Taxable income Tax
More than But not more than Pay + % on excess
Of the amount more
than$ 0 $ 2,550 $ 0 10% $ 0
$ 2,550 $ 9,150 $ 255.00 24% $ 2,550
$ 9,150 $ 12,500 $ 1,839.00 35% $ 9,150
$ 12,500 – $ 3,011.50 37% $ 12,500
Corporate income tax• Tax rate — 21%• AMT at corporate level has been eliminated.
Note: There are no special federal capital gains rates for corporations. For corporations, capital losses are deductible only against capital gains.
Wells Fargo Advisors suggested spending guidelines
Mortgage payments Not to exceed 28% of gross (pretax) income
Combined monthly debt Not to exceed 36% of monthly gross (pretax) income
Stay abreast of pending tax legislation and keep in touch with your Financial Advisor.
13 2018 tax planning tables
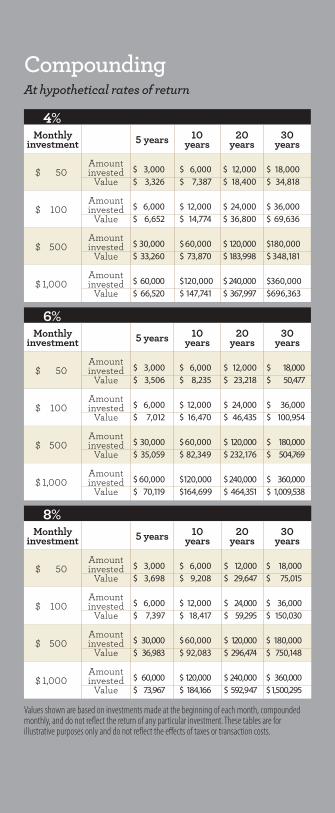
CompoundingAt hypothetical rates of return
4%Monthly
investment 5 years 10 years
20 years
30 years
$ 50Amount invested $ 3,000 $ 6,000 $ 12,000 $ 18,000
Value $ 3,326 $ 7,387 $ 18,400 $ 34,818
$ 100Amount invested $ 6,000 $ 12,000 $ 24,000 $ 36,000
Value $ 6,652 $ 14,774 $ 36,800 $ 69,636
$ 500Amount invested $ 30,000 $ 60,000 $ 120,000 $ 180,000
Value $ 33,260 $ 73,870 $ 183,998 $ 348,181
$ 1,000Amount invested $ 60,000 $ 120,000 $ 240,000 $ 360,000
Value $ 66,520 $ 147,741 $ 367,997 $ 696,363
6%Monthly
investment 5 years 10 years
20 years
30 years
$ 50Amount invested $ 3,000 $ 6,000 $ 12,000 $ 18,000
Value $ 3,506 $ 8,235 $ 23,218 $ 50,477
$ 100Amount invested $ 6,000 $ 12,000 $ 24,000 $ 36,000
Value $ 7,012 $ 16,470 $ 46,435 $ 100,954
$ 500Amount invested $ 30,000 $ 60,000 $ 120,000 $ 180,000
Value $ 35,059 $ 82,349 $ 232,176 $ 504,769
$ 1,000Amount invested $ 60,000 $ 120,000 $ 240,000 $ 360,000
Value $ 70,119 $ 164,699 $ 464,351 $ 1,009,538
8%Monthly
investment 5 years 10 years
20 years
30 years
$ 50Amount invested $ 3,000 $ 6,000 $ 12,000 $ 18,000
Value $ 3,698 $ 9,208 $ 29,647 $ 75,015
$ 100Amount invested $ 6,000 $ 12,000 $ 24,000 $ 36,000
Value $ 7,397 $ 18,417 $ 59,295 $ 150,030
$ 500Amount invested $ 30,000 $ 60,000 $ 120,000 $ 180,000
Value $ 36,983 $ 92,083 $ 296,474 $ 750,148
$ 1,000Amount invested $ 60,000 $ 120,000 $ 240,000 $ 360,000
Value $ 73,967 $ 184,166 $ 592,947 $ 1,500,295
Values shown are based on investments made at the beginning of each month, compounded monthly, and do not reflect the return of any particular investment. These tables are for illustrative purposes only and do not reflect the effects of taxes or transaction costs.

This page has been intentionally left blank
142018 tax planning tables

Wells Fargo Advisors does not render legal or tax advice. While this reference guide is not intended to replace your discussions with your appointed tax advisor, it may help you comprehend the tax implications of your investments and plan tax efficiently.
Wells Fargo Advisors is a trade name used by Wells Fargo Clearing Services, LLC and Wells Fargo Advisors Financial Network, LLC, Members SIPC, separate registered broker-dealers and nonbank affiliates of Wells Fargo & Company.
© 2017 Wells Fargo Clearing Services, LLC All rights reserved. IHA-51051010118-02348 594432 (1 ea.)
1005
96-v
1