Embed Size (px)
Citation preview
2018DRINKING WATERQUALITY REPORT
2 3
Sincerely,
Mami HaraGeneral Manager/CEOSeattle Public Utilities
Seattle has some of the best water in the nation—water that is fresh, safe and tastes great.
Around the country, concerns about the safety of public water supplies remain high. But Seattle is different. Our water comes from pristine and protected watersheds, high in the Cascade Mountains. It is treated and monitored using the best science available and delivered to your tap through carefully maintained infrastructure.
These treasured resources enable us to deliver clean, safe and delicious drinking water to more than 1.5 million people every day. But the real reason Seattleites can depend on the safety and quality of the water they use every day is the many skilled and dedicated people who makeit possible:
• Hydrologists, biologists, educators and maintenance crews manage 100,000 acres of watershed;
• Chemists, microbiologists and other water quality experts test 20,000+ samples annually to keep your water safe;
• Seismic engineers and other experts are developing plans that will significantly increase our system’s seismic resiliency;
• Water pipe workers install, maintain and repair water mains, transmission pipelines, fire hydrants and more to ensure our water keeps flowing;
• Community engagement leaders connect with diverse communities, new residents and underserved populations to better understand and respond to community needs and values; and
• Residents like you conserve water and support investments to manage and protect our water system.
I’m pleased to share this year’s Drinking Water Quality Report with you. I hope it helps answer questions you may have about the quality of your drinking water, and helps you better understand the care and commitment that goes into delivering some of the best water inthe nation. Enjoy.
3
4
6
8
10
12
14
16
18
Letter to Our Customers
Water Quality Q & A
Seattle’s Water: Past, Present & Future
About Lead, PFAS and Additional Reporting
Better Than Bottled
What’s in the Water
2018 Results
Conservation & Coupon
Customer Resources, Get Involved!
A Letter to Our Customers
Seattle Public Utilities | 2018 Drinking Water Quality Report
4 5
Is Seattle’s drinking water safe? This report is about the quality and safety of your drinking water, and it’s official—Seattle’s water is clean, safe and tastes great. You can drink it from the tap!
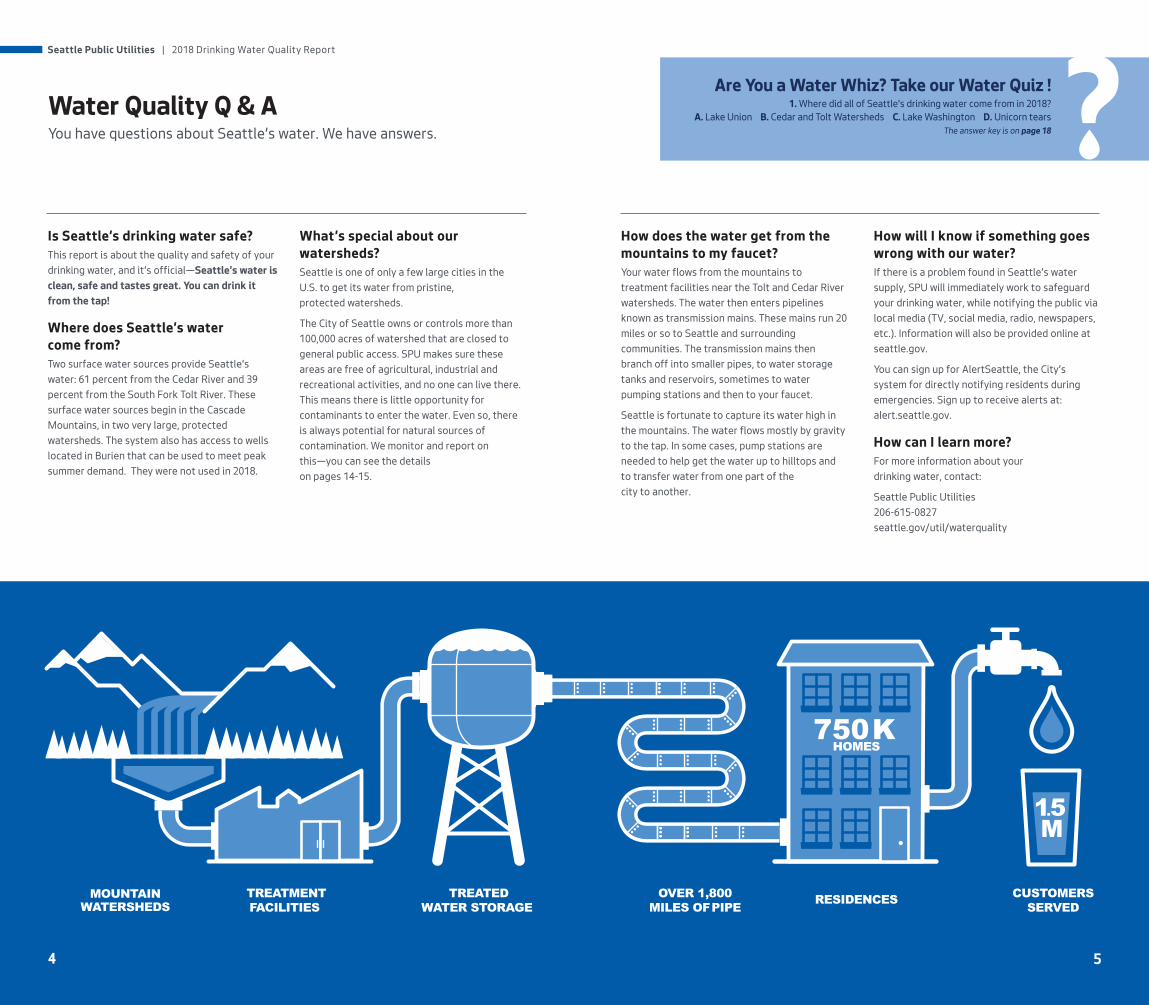
Where does Seattle’s water come from?Two surface water sources provide Seattle’s water: 61 percent from the Cedar River and 39 percent from the South Fork Tolt River. These surface water sources begin in the Cascade Mountains, in two very large, protected watersheds. The system also has access to wells located in Burien that can be used to meet peak summer demand. They were not used in 2018.
What’s special about our watersheds?Seattle is one of only a few large cities in the U.S. to get its water from pristine, protected watersheds.
The City of Seattle owns or controls more than 100,000 acres of watershed that are closed to general public access. SPU makes sure these areas are free of agricultural, industrial and recreational activities, and no one can live there. This means there is little opportunity for contaminants to enter the water. Even so, there is always potential for natural sources of contamination. We monitor and report on this—you can see the details on pages 14-15.
Water Quality Q & AYou have questions about Seattle’s water. We have answers.
TREATMENTFACILITIES
MOUNTAINWATERSHEDS
CUSTOMERSSERVED
750K
TREATEDWATER STORAGE RESIDENCES
HOMES
OVER 1,800MILES OF PIPE
1.5M
How does the water get from the mountains to my faucet?Your water flows from the mountains to treatment facilities near the Tolt and Cedar River watersheds. The water then enters pipelines known as transmission mains. These mains run 20 miles or so to Seattle and surrounding communities. The transmission mains then branch off into smaller pipes, to water storage tanks and reservoirs, sometimes to water pumping stations and then to your faucet.
Seattle is fortunate to capture its water high in the mountains. The water flows mostly by gravity to the tap. In some cases, pump stations are needed to help get the water up to hilltops and to transfer water from one part of the city to another.
How will I know if something goes wrong with our water?If there is a problem found in Seattle’s water supply, SPU will immediately work to safeguard your drinking water, while notifying the public via local media (TV, social media, radio, newspapers, etc.). Information will also be provided online at seattle.gov.
You can sign up for AlertSeattle, the City’s system for directly notifying residents during emergencies. Sign up to receive alerts at: alert.seattle.gov.
How can I learn more?For more information about your drinking water, contact:
Seattle Public Utilities206-615-0827seattle.gov/util/waterquality
Are You a Water Whiz? Take our Water Quiz !1. Where did all of Seattle’s drinking water come from in 2018?
A. Lake Union B. Cedar and Tolt Watersheds C. Lake Washington D. Unicorn tearsThe answer key is on page 18
Seattle Public Utilities | 2018 Drinking Water Quality Report
6 7
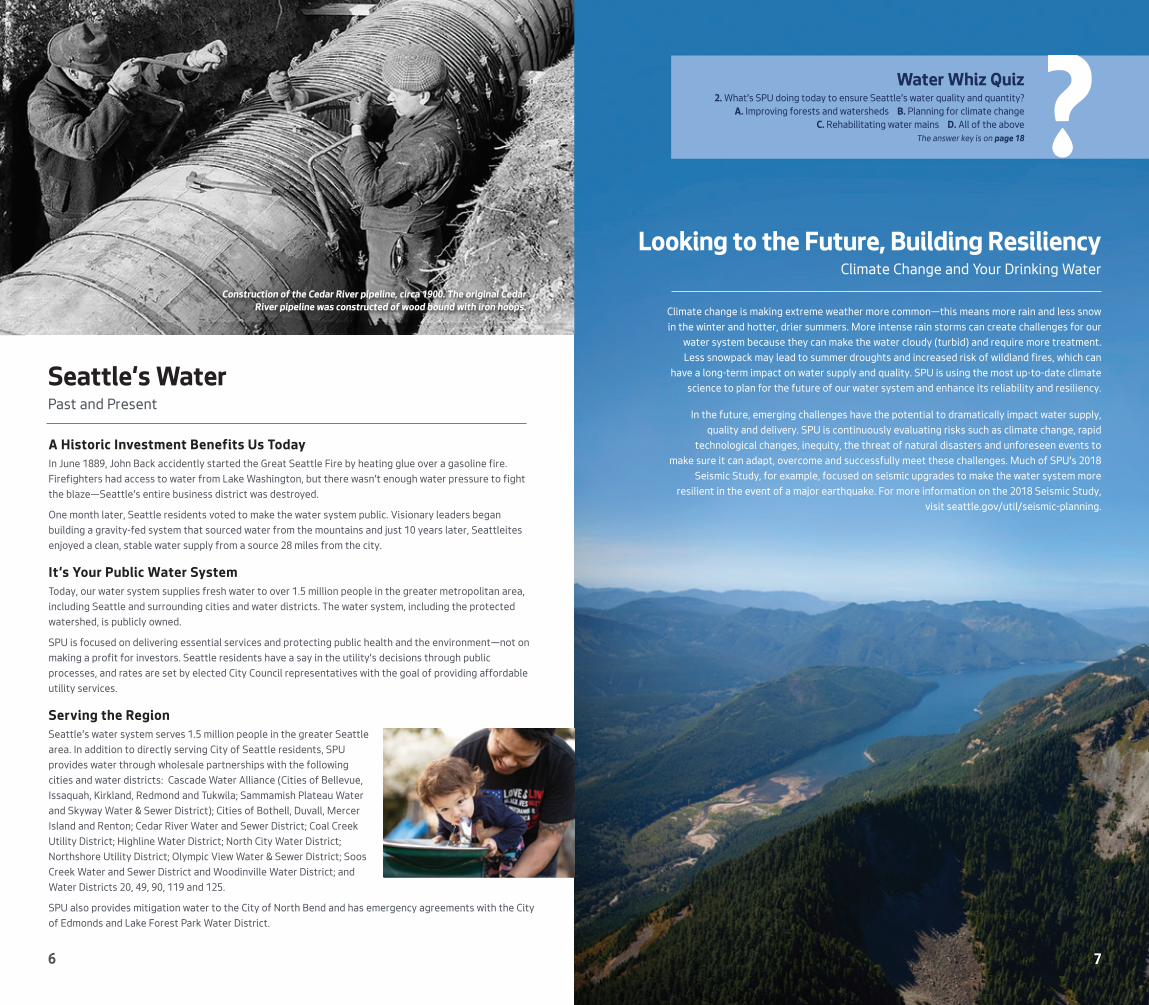
A Historic Investment Benefits Us TodayIn June 1889, John Back accidently started the Great Seattle Fire by heating glue over a gasoline fire. Firefighters had access to water from Lake Washington, but there wasn’t enough water pressure to fight the blaze—Seattle’s entire business district was destroyed.
One month later, Seattle residents voted to make the water system public. Visionary leaders began building a gravity-fed system that sourced water from the mountains and just 10 years later, Seattleites enjoyed a clean, stable water supply from a source 28 miles from the city.
It’s Your Public Water SystemToday, our water system supplies fresh water to over 1.5 million people in the greater metropolitan area, including Seattle and surrounding cities and water districts. The water system, including the protected watershed, is publicly owned.
SPU is focused on delivering essential services and protecting public health and the environment—not on making a profit for investors. Seattle residents have a say in the utility’s decisions through public processes, and rates are set by elected City Council representatives with the goal of providing affordable utility services.
Serving the RegionSeattle’s water system serves 1.5 million people in the greater Seattle area. In addition to directly serving City of Seattle residents, SPU provides water through wholesale partnerships with the following cities and water districts: Cascade Water Alliance (Cities of Bellevue, Issaquah, Kirkland, Redmond and Tukwila; Sammamish Plateau Water and Skyway Water & Sewer District); Cities of Bothell, Duvall, Mercer Island and Renton; Cedar River Water and Sewer District; Coal Creek Utility District; Highline Water District; North City Water District; Northshore Utility District; Olympic View Water & Sewer District; Soos Creek Water and Sewer District and Woodinville Water District; and Water Districts 20, 49, 90, 119 and 125.
SPU also provides mitigation water to the City of North Bend and has emergency agreements with the City of Edmonds and Lake Forest Park Water District.
Water Whiz Quiz2. What’s SPU doing today to ensure Seattle’s water quality and quantity?
A. Improving forests and watersheds B. Planning for climate change C. Rehabilitating water mains D. All of the above
The answer key is on page 18
Climate change is making extreme weather more common—this means more rain and less snow in the winter and hotter, drier summers. More intense rain storms can create challenges for our
water system because they can make the water cloudy (turbid) and require more treatment. Less snowpack may lead to summer droughts and increased risk of wildland fires, which can
have a long-term impact on water supply and quality. SPU is using the most up-to-date climate science to plan for the future of our water system and enhance its reliability and resiliency.
In the future, emerging challenges have the potential to dramatically impact water supply,
quality and delivery. SPU is continuously evaluating risks such as climate change, rapid technological changes, inequity, the threat of natural disasters and unforeseen events to
make sure it can adapt, overcome and successfully meet these challenges. Much of SPU’s 2018 Seismic Study, for example, focused on seismic upgrades to make the water system more
resilient in the event of a major earthquake. For more information on the 2018 Seismic Study, visit seattle.gov/util/seismic-planning.
Looking to the Future, Building ResiliencyClimate Change and Your Drinking Water
Seattle’s Water Past and Present
Construction of the Cedar River pipeline, circa 1900. The original Cedar River pipeline was constructed of wood bound with iron hoops.
8 9
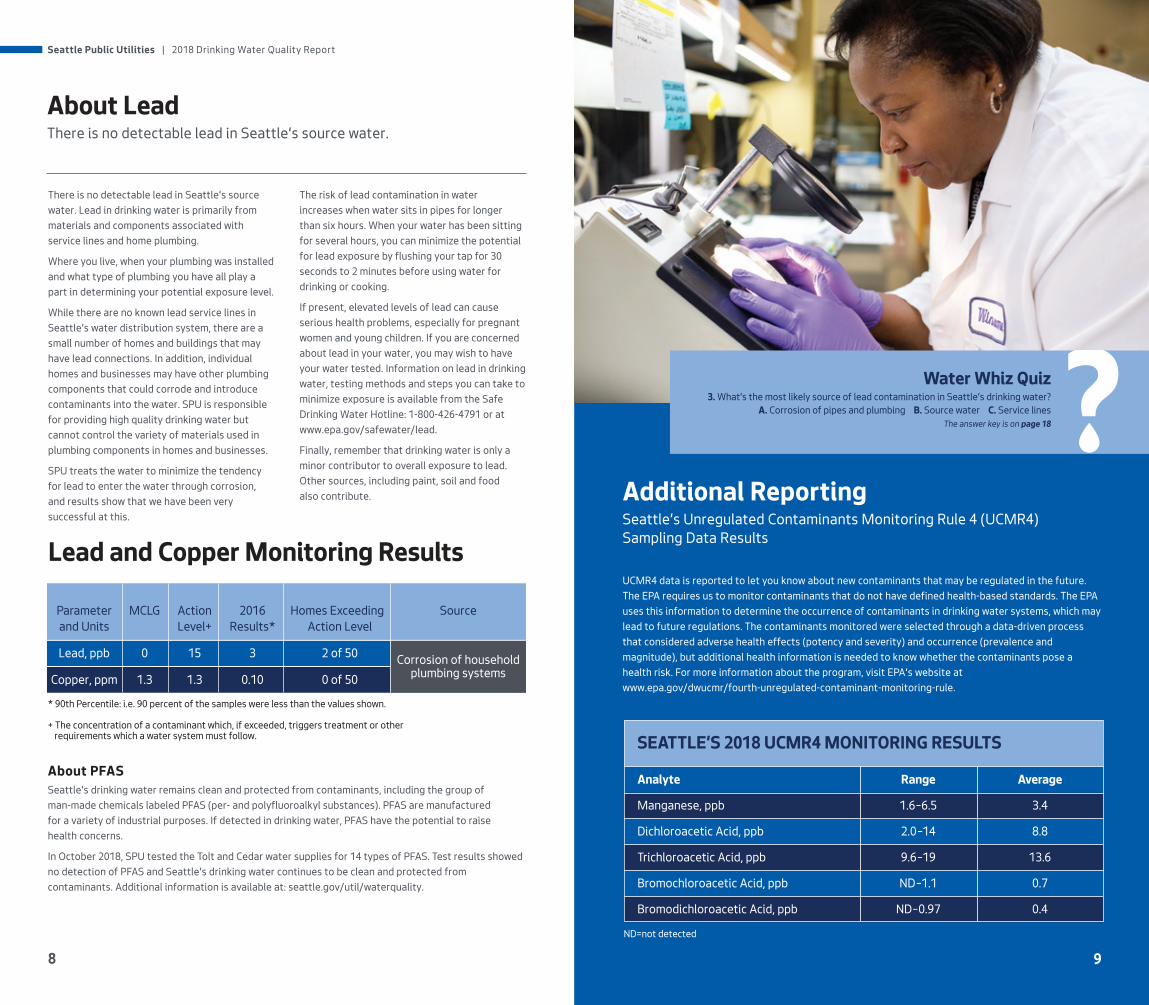
There is no detectable lead in Seattle’s source water. Lead in drinking water is primarily from materials and components associated with service lines and home plumbing.
Where you live, when your plumbing was installed and what type of plumbing you have all play a part in determining your potential exposure level.
While there are no known lead service lines in Seattle’s water distribution system, there are a small number of homes and buildings that may have lead connections. In addition, individual homes and businesses may have other plumbing components that could corrode and introduce contaminants into the water. SPU is responsible for providing high quality drinking water but cannot control the variety of materials used in plumbing components in homes and businesses.
SPU treats the water to minimize the tendency for lead to enter the water through corrosion, and results show that we have been very successful at this.
About PFASSeattle’s drinking water remains clean and protected from contaminants, including the group of man-made chemicals labeled PFAS (per- and polyfluoroalkyl substances). PFAS are manufactured for a variety of industrial purposes. If detected in drinking water, PFAS have the potential to raise health concerns.
In October 2018, SPU tested the Tolt and Cedar water supplies for 14 types of PFAS. Test results showed no detection of PFAS and Seattle's drinking water continues to be clean and protected from contaminants. Additional information is available at: seattle.gov/util/waterquality.
Lead and Copper Monitoring Results
Parameter MCLG Action 2016 Homes Exceeding Source and Units Level+ Results* Action Level
Lead, ppb 0 15 3 2 of 50 Corrosion of household Copper, ppm 1.3 1.3 0.10 0 of 50 plumbing systems
The risk of lead contamination in water increases when water sits in pipes for longerthan six hours. When your water has been sitting for several hours, you can minimize the potential for lead exposure by flushing your tap for 30 seconds to 2 minutes before using water for drinking or cooking.
If present, elevated levels of lead can cause serious health problems, especially for pregnant women and young children. If you are concerned about lead in your water, you may wish to have your water tested. Information on lead in drinking water, testing methods and steps you can take to minimize exposure is available from the Safe Drinking Water Hotline: 1-800-426-4791 or at www.epa.gov/safewater/lead.
Finally, remember that drinking water is only a minor contributor to overall exposure to lead. Other sources, including paint, soil and food also contribute.
About Lead There is no detectable lead in Seattle’s source water.
Water Whiz Quiz3. What’s the most likely source of lead contamination in Seattle’s drinking water?
A. Corrosion of pipes and plumbing B. Source water C. Service linesThe answer key is on page 18
Analyte Range Average
Manganese, ppb 1.6–6.5 3.4
Dichloroacetic Acid, ppb 2.0–14 8.8
Trichloroacetic Acid, ppb 9.6–19 13.6
Bromochloroacetic Acid, ppb ND–1.1 0.7
Bromodichloroacetic Acid, ppb ND–0.97 0.4
SEATTLE’S 2018 UCMR4 MONITORING RESULTS
Additional Reporting Seattle’s Unregulated Contaminants Monitoring Rule 4 (UCMR4) Sampling Data Results
UCMR4 data is reported to let you know about new contaminants that may be regulated in the future. The EPA requires us to monitor contaminants that do not have defined health-based standards. The EPA uses this information to determine the occurrence of contaminants in drinking water systems, which may lead to future regulations. The contaminants monitored were selected through a data-driven process that considered adverse health effects (potency and severity) and occurrence (prevalence and magnitude), but additional health information is needed to know whether the contaminants pose a health risk. For more information about the program, visit EPA’s website at www.epa.gov/dwucmr/fourth-unregulated-contaminant-monitoring-rule.
* 90th Percentile: i.e. 90 percent of the samples were less than the values shown.
+ The concentration of a contaminant which, if exceeded, triggers treatment or otherrequirements which a water system must follow.
ND=not detected
Seattle Public Utilities | 2018 Drinking Water Quality Report
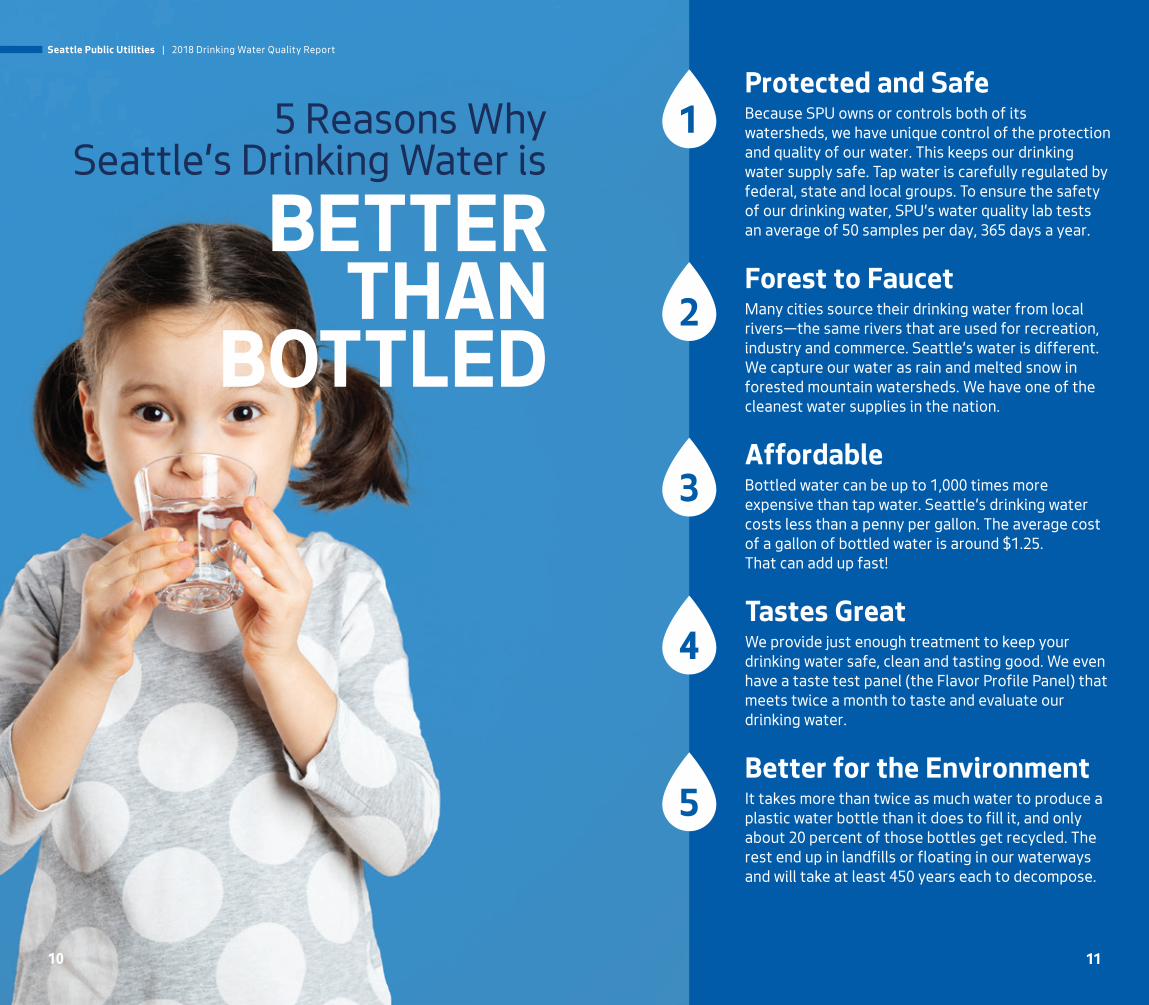
Protected and Safe Because SPU owns or controls both of its watersheds, we have unique control of the protection and quality of our water. This keeps our drinking water supply safe. Tap water is carefully regulated by federal, state and local groups. To ensure the safety of our drinking water, SPU’s water quality lab tests an average of 50 samples per day, 365 days a year.
Forest to FaucetMany cities source their drinking water from local rivers—the same rivers that are used for recreation, industry and commerce. Seattle’s water is different. We capture our water as rain and melted snow in forested mountain watersheds. We have one of the cleanest water supplies in the nation.
AffordableBottled water can be up to 1,000 times more expensive than tap water. Seattle’s drinking water costs less than a penny per gallon. The average cost of a gallon of bottled water is around $1.25.That can add up fast!
Tastes Great We provide just enough treatment to keep your drinking water safe, clean and tasting good. We even have a taste test panel (the Flavor Profile Panel) that meets twice a month to taste and evaluate our drinking water.
Better for the EnvironmentIt takes more than twice as much water to produce a plastic water bottle than it does to fill it, and only about 20 percent of those bottles get recycled. The rest end up in landfills or floating in our waterways and will take at least 450 years each to decompose.
1
2
3
4
5
10 11
We share the water of the Tolt and Cedar rivers with salmon, trout and many other species. Using water wisely helps ensure we’ll have enough water to support freshwater habitat for generations to come. It’s particularly important to conserve water in the summer and fall months when streamflows are naturally low and adult salmon are returning to rivers to spawn.
Conservation starts long before the water reaches your tap. SPU produced 45.6 billion gallons of treated drinking water in 2018. Of that, 2.4 billion gallons were lost to leakage. While that may sound like a lot, it’s only 5.2% of the total, and considered relatively low.
To encourage efficient water use, the Saving Water Partnership (SWP)—SPU and 18 water utility partners—set a six-year conservation goal: reduce per capita use from current levels so that the SWP’s total average annual retail water use is less than 105 million gallons per day (mgd) from 2013 through 2018 despite forecasted population growth. In 2018, our customers met this goal, using 96.5 mgd.
The SWP is here to help you use water wisely. We offer tips, assistance and rebates to help our customers use water wisely. Go to savingwater.org.
BETTER THAN
BOTTLED
5 Reasons WhySeattle’s Drinking Water is
Seattle Public Utilities | 2018 Drinking Water Quality Report
12 13
We share the water of the Tolt and Cedar rivers with salmon, trout and many other species. Using water wisely helps ensure we’ll have enough water to support freshwater habitat for generations to come. It’s particularly important to conserve water in the summer and fall months when streamflows are naturally low and adult salmon are returning to rivers to spawn.
Conservation starts long before the water reaches your tap. SPU produced 45.6 billion gallons of treated drinking water in 2018. Of that, 2.4 billion gallons were lost to leakage. While that may sound like a lot, it’s only 5.2% of the total, and considered relatively low.
To encourage efficient water use, the Saving Water Partnership (SWP)—SPU and 18 water utility partners—set a six-year conservation goal: reduce per capita use from current levels so that the SWP’s total average annual retail water use is less than 105 million gallons per day (mgd) from 2013 through 2018 despite forecasted population growth. In 2018, our customers met this goal, using 96.5 mgd.
The SWP is here to help you use water wisely. We offer tips, assistance and rebates to help our customers use water wisely. Go to savingwater.org.
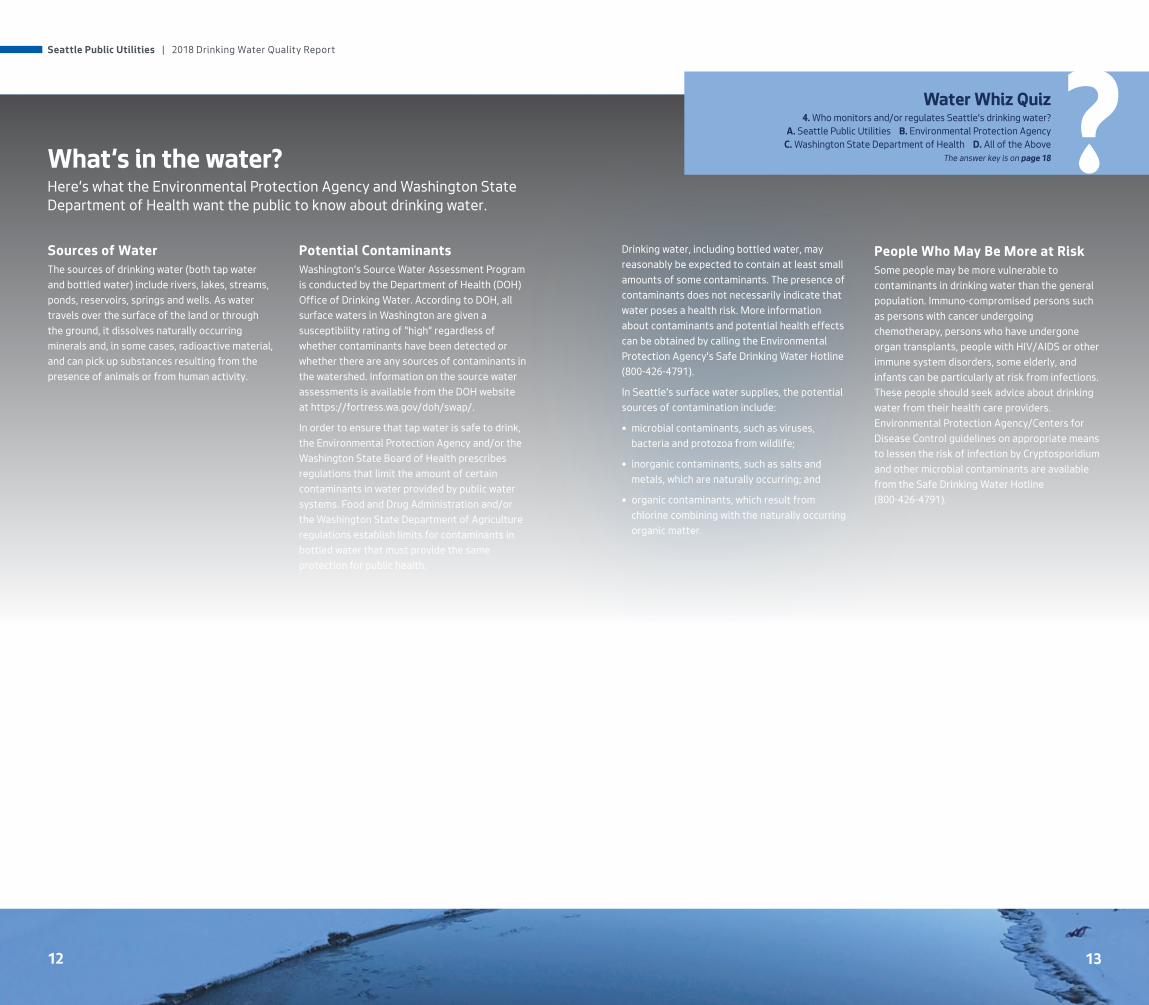
Sources of WaterThe sources of drinking water (both tap water and bottled water) include rivers, lakes, streams, ponds, reservoirs, springs and wells. As water travels over the surface of the land or through the ground, it dissolves naturally occurring minerals and, in some cases, radioactive material, and can pick up substances resulting from the presence of animals or from human activity.
Potential ContaminantsWashington’s Source Water Assessment Program is conducted by the Department of Health (DOH) Office of Drinking Water. According to DOH, all surface waters in Washington are given a susceptibility rating of “high” regardless of whether contaminants have been detected or whether there are any sources of contaminants in the watershed. Information on the source water assessments is available from the DOH website at https://fortress.wa.gov/doh/swap/.
In order to ensure that tap water is safe to drink, the Environmental Protection Agency and/or the Washington State Board of Health prescribes regulations that limit the amount of certain contaminants in water provided by public water systems. Food and Drug Administration and/or the Washington State Department of Agriculture regulations establish limits for contaminants in bottled water that must provide the same protection for public health.
What’s in the water? Here’s what the Environmental Protection Agency and Washington State Department of Health want the public to know about drinking water.
Drinking water, including bottled water, may reasonably be expected to contain at least small amounts of some contaminants. The presence of contaminants does not necessarily indicate that water poses a health risk. More information about contaminants and potential health effects can be obtained by calling the Environmental Protection Agency's Safe Drinking Water Hotline (800-426-4791).
In Seattle’s surface water supplies, the potential sources of contamination include:
• microbial contaminants, such as viruses, bacteria and protozoa from wildlife;
• inorganic contaminants, such as salts and metals, which are naturally occurring; and
• organic contaminants, which result from chlorine combining with the naturally occurring organic matter.
People Who May Be More at RiskSome people may be more vulnerable to contaminants in drinking water than the general population. Immuno-compromised persons such as persons with cancer undergoing chemotherapy, persons who have undergone organ transplants, people with HIV/AIDS or other immune system disorders, some elderly, and infants can be particularly at risk from infections. These people should seek advice about drinking water from their health care providers. Environmental Protection Agency/Centers for Disease Control guidelines on appropriate means to lessen the risk of infection by Cryptosporidium and other microbial contaminants are available from the Safe Drinking Water Hotline (800-426-4791).
Water Whiz Quiz4. Who monitors and/or regulates Seattle’s drinking water?
A. Seattle Public Utilities B. Environmental Protection Agency C. Washington State Department of Health D. All of the Above
The answer key is on page 18
Seattle Public Utilities | 2018 Drinking Water Quality Report
Seattle Public Utilities | 2018 Drinking Water Quality Report
14 15
MCLG: Maximum Contaminant Level Goal - The level of a contaminant in drinking water below which there is no known or expected risk to health. MCLGs allow for a margin of safety.
MCL: Maximum Contaminant Level - The highest level of a contaminant that is allowed in drinking water. MCLs are set as close to the MCLGsas feasible using the best availabletreatment technology.
MRDL: Maximum Residual Disinfectant Level - The highest level of a disinfectant allowed in drinking water. There is convincing evidence that addition of a disinfectant is necessary for control of microbial contaminants.
MRDLG: Maximum Residual Disinfectant Level Goal - The level of a drinking water disinfectant below which there is no known or expected risk to health. MRDLGs do not reflect the benefits of the use of disinfectants to control microbial contaminants.
DEFINITIONS
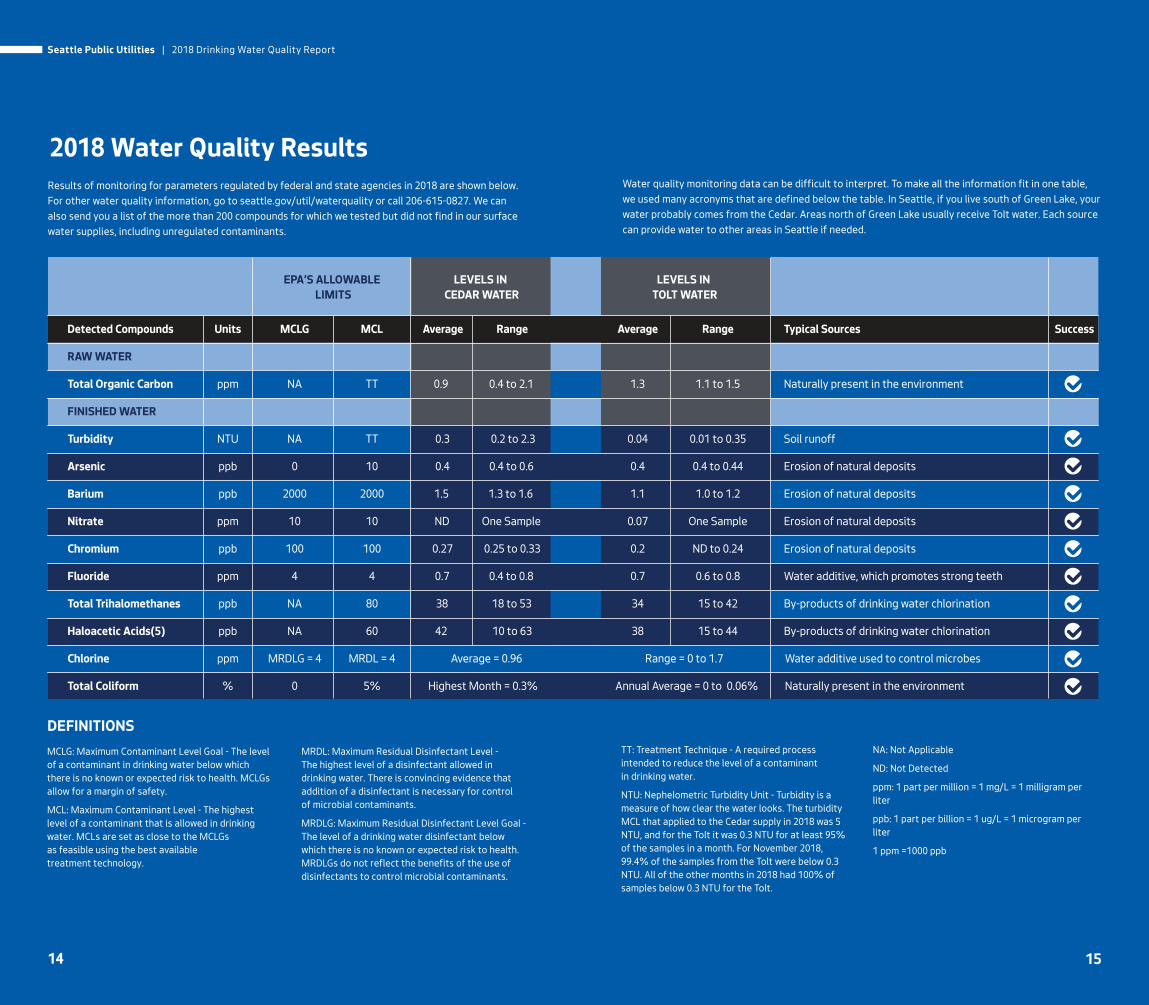
Results of monitoring for parameters regulated by federal and state agencies in 2018 are shown below. For other water quality information, go to seattle.gov/util/waterquality or call 206-615-0827. We can also send you a list of the more than 200 compounds for which we tested but did not find in our surface water supplies, including unregulated contaminants.
EPA’S ALLOWABLE LEVELS IN LEVELS IN LIMITS CEDAR WATER TOLT WATER
Detected Compounds Units MCLG MCL Average Range Average Range Typical Sources Success
RAW WATER
Total Organic Carbon ppm NA TT 0.9 0.4 to 2.1 1.3 1.1 to 1.5 Naturally present in the environment
FINISHED WATER
Turbidity NTU NA TT 0.3 0.2 to 2.3 0.04 0.01 to 0.35 Soil runoff
Arsenic ppb 0 10 0.4 0.4 to 0.6 0.4 0.4 to 0.44 Erosion of natural deposits
Barium ppb 2000 2000 1.5 1.3 to 1.6 1.1 1.0 to 1.2 Erosion of natural deposits
Nitrate ppm 10 10 ND One Sample 0.07 One Sample Erosion of natural deposits
Chromium ppb 100 100 0.27 0.25 to 0.33 0.2 ND to 0.24 Erosion of natural deposits
Fluoride ppm 4 4 0.7 0.4 to 0.8 0.7 0.6 to 0.8 Water additive, which promotes strong teeth
Total Trihalomethanes ppb NA 80 38 18 to 53 34 15 to 42 By-products of drinking water chlorination
Haloacetic Acids(5) ppb NA 60 42 10 to 63 38 15 to 44 By-products of drinking water chlorination
Chlorine ppm MRDLG = 4 MRDL = 4 Average = 0.96 Range = 0 to 1.7 Water additive used to control microbes
Total Coliform % 0 5% Highest Month = 0.3% Annual Average = 0 to 0.06% Naturally present in the environment
2018 Water Quality Results
We share the water of the Tolt and Cedar rivers with salmon, trout and many other species. Using water wisely helps ensure we’ll have enough water to support freshwater habitat for generations to come. It’s particularly important to conserve water in the summer and fall months when streamflows are naturally low and adult salmon are returning to rivers to spawn.
Conservation starts long before the water reaches your tap. SPU produced 45.6 billion gallons of treated drinking water in 2018. Of that, 2.4 billion gallons were lost to leakage. While that may sound like a lot, it’s only 5.2% of the total, and considered relatively low.
To encourage efficient water use, the Saving Water Partnership (SWP)—SPU and 18 water utility partners—set a six-year conservation goal: reduce per capita use from current levels so that the SWP’s total average annual retail water use is less than 105 million gallons per day (mgd) from 2013 through 2018 despite forecasted population growth. In 2018, our customers met this goal, using 96.5 mgd.
The SWP is here to help you use water wisely. We offer tips, assistance and rebates to help our customers use water wisely. Go to savingwater.org.
Water quality monitoring data can be difficult to interpret. To make all the information fit in one table, we used many acronyms that are defined below the table. In Seattle, if you live south of Green Lake, your water probably comes from the Cedar. Areas north of Green Lake usually receive Tolt water. Each source can provide water to other areas in Seattle if needed.
TT: Treatment Technique - A required process intended to reduce the level of a contaminantin drinking water.
NTU: Nephelometric Turbidity Unit - Turbidity is a measure of how clear the water looks. The turbidity MCL that applied to the Cedar supply in 2018 was 5 NTU, and for the Tolt it was 0.3 NTU for at least 95% of the samples in a month. For November 2018, 99.4% of the samples from the Tolt were below 0.3 NTU. All of the other months in 2018 had 100% of samples below 0.3 NTU for the Tolt.
NA: Not Applicable
ND: Not Detected
ppm: 1 part per million = 1 mg/L = 1 milligram per liter
ppb: 1 part per billion = 1 ug/L = 1 microgram per liter
1 ppm =1000 ppb
Seattle Public Utilities | 2018 Drinking Water Quality Report
Seattle Public Utilities | 2018 Drinking Water Quality Report

16 17
We share the water of the Tolt and Cedar rivers with salmon, trout and many other species. Using water wisely helps ensure we’ll have enough water to support freshwater habitat for generations to come. It’s particularly important to conserve water in the summer and fall months when streamflows are naturally low and adult salmon are returning to rivers to spawn.
Conservation starts long before the water reaches your tap. SPU produced 45.6 billion gallons of treated drinking water in 2018. Of that, 2.4 billion gallons were lost to leakage. While that may sound like a lot, it’s only 5.2% of the total, and considered relatively low.
To encourage efficient water use, the Saving Water Partnership (SWP)—SPU and 18 water utility partners—set a six-year conservation goal: reduce per capita use from current levels so that the SWP’s total average annual retail water use is less than 105 million gallons per day (mgd) from 2013 through 2018 despite forecasted population growth. In 2018, our customers met this goal, using 96.5 mgd.
The SWP is here to help you use water wisely. We offer tips, assistance and rebates to help our customers use water wisely. Go to savingwater.org.
Visit the Cedar River WatershedWhen you know more about your water system, you’re more likely to conserve and appreciate it. A short drive up I-90 to the Cascades brings you to one of our protected watersheds. Starting at our Cedar River Watershed Education Center, you and your family can join a tour and experience the beauty of old growth forests, waterfalls and awesome views.
You Can Help Conserve Water and Save Habitats
Water Whiz Quiz5. What’s a great way to save water at home or work?
A. Check for and fix leaks B. Wash full loads of laundry and dishes C. Turn off the tap while brushing your teeth D. Learn more at savingwater.org E. All of the above
The answer key is on page 18
$5 The Cedar River Watershed Education Center is only 35 miles east of Seattle, at beautiful Rattlesnake Lake. The Center is open year-round, Tuesday-Sunday from 10am to 5pm. Visiting the Center is free.
Guided tours of the Watershed are available July–September. ($10 adults; $5 youth & seniors ages 55 and older.)
CEDAR RIVER WATERSHED EDUCATION TOURRegister and redeem at: seattle.gov/util/crwec Click on “Programs and Tours” PROMO CODE: WATER Valid July-September 2019. $5 OFF
WATERSHED TOURS
EACH TICKET
Seattle Public Utilities | 2018 Drinking Water Quality Report
Seattle Public Utilities | 2018 Drinking Water Quality Report
18 19
Customer Resources
Water Whiz Answer Key1. B 2. D 3. A 4. D 5. E
WATER QUALITY
Learn more about water quality online at: seattle.gov/util/waterquality
Report urgent concerns, such as water outages, discolored water or hydrant leaks to SPU’s 24-hour Operations Response Center at: (206) 386-1800
Ask questions about Seattle’s water quality, such as information about chlorine or fluoride at: (206) 615-0827
Ask general water quality questions via the Environmental Protection Agency's Safe Drinking Water Hotline at: (800) 426-4791
Learn more about Source Water Assessments at: https://fortress.wa.gov/doh/swap/
CONSERVATION & REBATES
Explore tips, assistance, and rebates to help you save water at: savingwater.org
Water saving rebates are available for residential and commercial customers. Learn more at: savingwater.org/rebates or call (206) 684-SAVE.
Income-qualified homeowners may be eligible for a free toilet and installation. Learn more at: seattle.gov/util/freetoilets or call Minor Home Repair at (206) 448-5751.
Learn how to find and fix leaks at: seattle.gov/util/fixaleak
BILLING
Manage your account at: seattle.gov/util/paymybill
Income-qualified customers can save 50-60 percent off their SPU and City Light bills through the Utility Discount Program. Call (206) 684-0268 or go to seattle.gov/mybill.
Get help paying your bill through SPU’s Emergency Assistance Program at: seattle.gov/utilities/services/my-account/payments-and-bills/emergency-assistance
Speak with a representative: Monday – Friday (7:30 am – 6 pm) at: (206) 684-3000; (800) 862-1181 (out of area)
EMERGENCY ALERTS
Sign up at: alert.seattle.gov
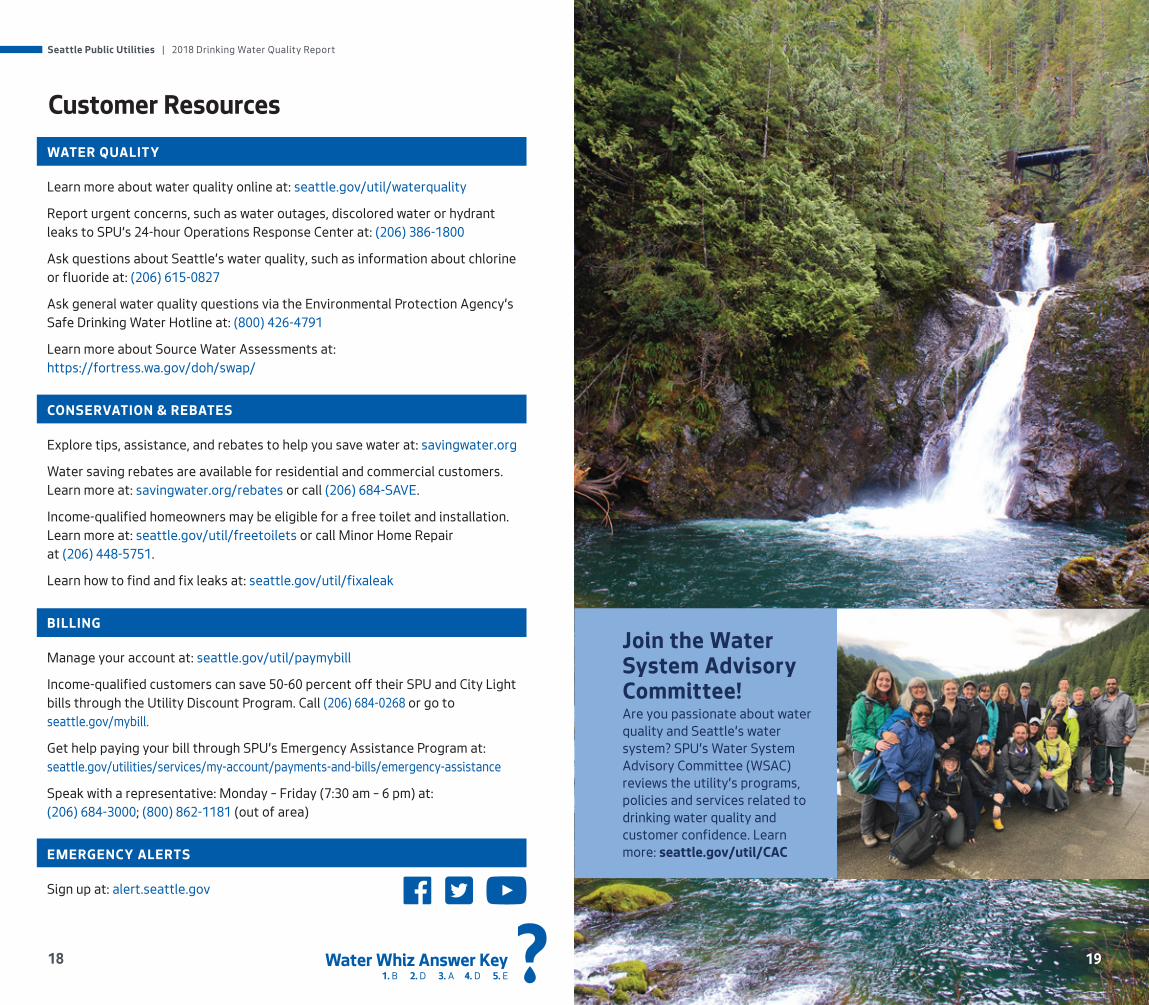
Join the Water System Advisory Committee!Are you passionate about water quality and Seattle’s water system? SPU’s Water System Advisory Committee (WSAC) reviews the utility’s programs, policies and services related to drinking water quality and customer confidence. Learn more: seattle.gov/util/CAC
Seattle Public Utilities | 2018 Drinking Water Quality Report
Con
tact
Sea
ttle
Pub
lic U
tiliti
esse
attle
.gov
/util
/Em
ailU
s | (
206)
684
-300
0 | s
eattl
e.go
v/ut
ilitie
s
Sea
ttle
Pub
lic U
tilit
ies
700
Fifth
Ave
nue,
Sui
te 4
900
P.O
. Box
340
18S
eattl
e, W
A 98
124-
4018
For t
rans
latio
n se
rvic
es p
leas
e ca
ll 20
6-68
4-30
00.
Para
ser
vici
os d
e tra
ducc
ión
favo
r lla
mar
al 2
06-6
84-3
000.
Để
nhận
các
dịc
h vụ
dịc
h th
uật,
vui l
òng
gọi s
ố 20
6-68
4-30
00.
如需
翻译
服务
,请
拨打
206-
684-
3000
.
如需
翻譯
服務
,請
撥打
206
-684
-300
0.
Si a
ad u
hes
hid
adee
go tu
rjuba
an fa
dlan
wac
206
-684
-300
0.
Para
sa
mga
ser
bisy
o ng
pag
sasa
lin-w
ika,
man
gyar
i lan
g tu
maw
ag s
a 20
6-68
4-30
00.
번역
서비
스를
원하
시면
206
-684
-300
0로 전
화 연
락하
시기
바랍
니다
.
You
are
rece
ivin
g th
is re
port
as p
art o
f a fe
dera
l req
uire
men
t for
mun
icip
al w
ater
sy
stem
s. T
his
repo
rt co
sts
abou
t 32
cent
s to
pro
duce
and
mai
l to
you.
P
rinte
d on
FS
C C
ertif
ied
pape
r con
sist
ing
of 3
0% P
ost C
onsu
mer
Rec
over
ed F
iber
(P
CR
F) a
nd 7
0% v
irgin
fibe
r sou
rced
from
sus
tain
ably
man
aged
fore
sts.
PRES
OR
TED
STA
ND
ARD
US
POST
AGE
PAID
SEAT
TLE,
WA
PER
MIT
NO
. 600
0
Plan
a tr
ip to
exp
lore
you
rw
ater
shed
and
lear
n m
ore
abou
t you
r wat
er s
uppl
y
CO
UPO
N IN
SID
E!