Embed Size (px)
Citation preview

Full Year 2018
2018
Results13 March 2019
1

Full Year 2018
Disclaimer
This document and the information herein does not constitute an offer to sell, to buy or to exchange, nor an invitation to make an offer to buy, to sell or to
exchange, nor a recommendation or advice, regarding any security issued by the Inditex Group.
This document contains forward-looking statements. All statements other than statements of historical fact included herein, including, without limitation,
those regarding our financial position, business strategy, management plans and objectives for future operations are forward-looking statements. Any such
forward-looking statements are subject to risk and uncertainty and thus could differ materially from actual results.
Some of these risks include, amongst others, ongoing competitive pressure in the sector, consumer tastes and spending trends, economic, political,
regulatory and trade conditions in the markets where the Inditex Group is present or in the countries where the Group’s products are manufactured or
distributed.
The risks and uncertainties that could affect the forward-looking statements are difficult to predict. The company assumes no obligation to publicly revise or
update its forward-looking statements in the case of unexpected changes, events or circumstances that could affect them. Given the uncertainties of
forward-looking statements, we caution readers not to place undue reliance on these statements.
For a discussion of these and other factors that may affect forward looking statements and the Inditex Group’s business, financial conditions and results of
operations, see the documents and information communicated by the company to the Comisión Nacional del Mercado de Valores (the Spanish Securities
Commission).
The contents of this disclaimer should be taken into account by all persons or entities.
2

Full Year 2018 3
Overview

Full Year 2018
2018: Continue developing our long term strategic initiatives
Highly differentiated model at the forefront of fashion and sustainability
Global fully integrated Store & Online
Unique customer experience
Strong cash generation and lower capital intensity
Global growth opportunities
4

Full Year 2018
2018: Strong operating performance
Satisfactory sales growth +7% in local currencies
LFL sales +4%
Online sales +27% to €3.2 billion (12% of sales / 14% in markets with online)
EBITDA €5.5 bn, +11% in local currencies
Accelerating free cash flow
New dividend policy. Proposed dividend increase +17%
5

Full Year 2018
Unique business model: Global fully integrated Store & Online
6

Full Year 2018
Unique business model: Global fully integrated Store & Online
Unique customer experience
Central inventory
Distribution to all stores worldwide twice a week
Highly differentiated stores: 90% of store portfolio optimised 2012-2018
Global online same day/next day
7

Full Year 2018
Strength of business model reflected in LFL consistency
8
+4% LFL on a demanding comparable
Positive LFL in both stores and online
Positive LFL across all geographical areas and concepts

Full Year 2018
New space in prime locations globally grew 8% (4.7% Net)
9

Full Year 2018
Store optimisation a key competitive advantage
10
Store optimisation 2012-2018
Gross openings 3,364
Refurbishments 2,374
Enlargements 1,019
Absorptions (1,401)

Full Year 2018
Highly prominent and differentiated stores 2018
11
Corso Vittorio Emanuele, Milano

Full Year 2018
Highly prominent and differentiated stores 2018
12
Boulevard Haussmann, Paris

Full Year 2018
Highly prominent and differentiated stores 2018
13
Vittorio Emanuele, MilanKarl Johans Gate, Oslo

Full Year 2018
Highly prominent and differentiated stores 2018
14
Gran Vía, Bilbao

Full Year 2018
Highly prominent and differentiated stores 2019
15
Vittorio Emanuele, MilanHudson Yards, New York

Full Year 2018
Seamless Store & Online integration
16
Stratford, LondonClick & Collect, Zara Corso Vittorio Emanuele Milano
Full Year 2018
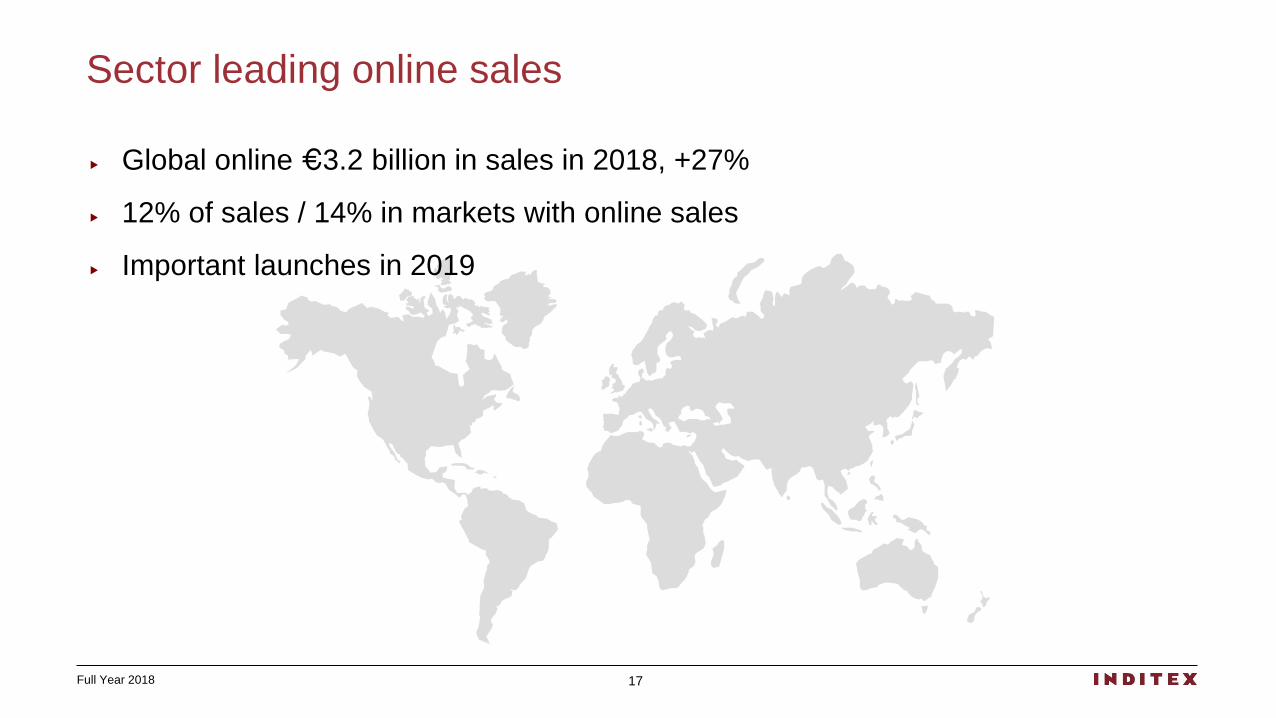
Sector leading online sales
17
Global online €3.2 billion in sales in 2018, +27%
12% of sales / 14% in markets with online sales
Important launches in 2019

Full Year 2018
2020 Global online
18
Full global integration
Central inventory + Online stockrooms + Store network
Same day delivery metropolitan areas / Next day global standard

Full Year 2018 19
Financial
Summary

Full Year 2018
Full Year 2018
20
€ million FY18 FY17 18/17 LC
Net sales 26,145 25,336 3% 7%
Gross profit 14,816 14,260 4% 8%
EBITDA 5,457 5,277 3% 11%
EBIT 4,357 4,314 1% 9%
Net income 3,444 3,368 2% 12%
Good operating performance

Full Year 2018
Satisfactory sales growth
21
€ million FY18 FY17 18/17
Net sales 26,145 25,336 3%
+7% sales growth in local currencies
Strong LFL performance
Euro strength vs. all key currencies

Full Year 2018
-5%
-3%
-1%
1%
1Q2018 2Q2018 3Q2018 4Q2018 1Q2019E 2Q2019
Currency impact on sales
22
-3.5% currency on sales in FY2018
At current exchange rates, currency expected to be slightly positive in FY2019

Full Year 2018
Global Store & Online sales in 2018
23
16% Spain
16%Americas
45% Europe
ex-Spain
23%Asia &
RoW

Full Year 2018
Disciplined execution shown in gross margin
24
FY18 FY17 18/17
Gross margin 56.7% 56.3% +39 bps
Strong execution of the model
Gross profit growth of +4% to €14.8 bn
Sustained commercial policies

Full Year 2018
Tight control of operating expenses
25
€ million FY18 18/17
Operating expenses 9,329 4%

Full Year 2018
Depreciation & Amortisation
26
€ million FY18 FY17 18/17
Depreciation & Amortisation (1,100) (963) 14%
FY17 includes sale of 15 premises
FY18 store absorption costs provisioned in 2017 impairment

Full Year 2018
Flexible business model
27
€ million FY18 18/17
Inventory 2,716 1%
Receivables 820 5%
Payables (5,251) 4%
Operating working capital (1,715) 8%
Net Cash & Equivalents 6,705 5%

Full Year 2018
Cash flow
28
€ million FY18 FY17 18/17
Cash from operations 4,029 3,961 2%
CAPEX - Ordinary 1,512 1,545 (2%)
Dividends 2,335 2,127 10%
Net Cash & Equivalents 6,705 6,387 5%

Full Year 2018
IFRS 16
29
Starting FY19
Changes in presentation, no impact on cashflow or business
IFRS 16 will result in:
An estimated increase of 2-4% in FY19 net income vs former IAS 17
Lease liabilities of €6.5bn-€6.9bn
We will provide further details prior to the publication of 1Q19 results

Full Year 2018 30
Concepts

Full Year 2018
Zara & Zara Home
Inditex has decided to integrate the reporting of Zara Home operations into Zara
due to the increasing synergies
The goal is to leverage operational and brand management of the store and online
platform in a combined manner
We plan to progressively incorporate Zara Home products on the Zara website in
some markets from next Autumn/Winter onwards
31

Full Year 2018
Store & Online sales by concept
32
Zara
Pull&Bear
Massimo Dutti
Bershka
Stradivarius
Oysho
Uterque
Sales

Full Year 2018
EBIT by concept
33
€ million EBIT EBIT/ sales ROCE
Zara + Zara Home 3,122 17% 28%
Pull&Bear 300 16% 48%
Massimo Dutti 258 14% 36%
Bershka 327 15% 50%
Stradivarius 259 17% 50%
Oysho 86 15% 40%
Uterqüe 5 5% 11%
Total EBIT 4,357 17% 31%

Full Year 2018
Concepts
Continued growth for the concepts
Strong performance of Pull&Bear and Stradivarius
34
Full Year 2018 35
Outlook

Full Year 2018
2012
Store optimisation plan*Larger more prominent stores
*Enlargements/Absorptions
*All key global flagships/New Images
Global Online
RFID launch
Upgrade HQs/Logistics
Increased organic growth
Lower capital intensity
Strategic initiatives
36
2018
Global Online +27%
€3.2 bn 12% of sales
Zara online globally
RFID complete in Zara
Massimo Dutti and Uterqüe
Zara one global integrated stock
Upgrade HQs/Logistics
Lower capital intensity
2020e
Strong growth opportunity
Global online
Global RFID
Global stock integration
Upgrade HQs/Logistics
Increased organic growth
Lower capital intensity
Global fully integrated Store & Online

Full Year 2018
Global growth opportunities
Highly differentiated business model
Global fully integrated Store & Online
Unique customer experience
Strong cash flow generation and lower capital intensity
Strong growth opportunities
37

Full Year 2018
Global online
All key markets same day/next day
38
Full Year 2018
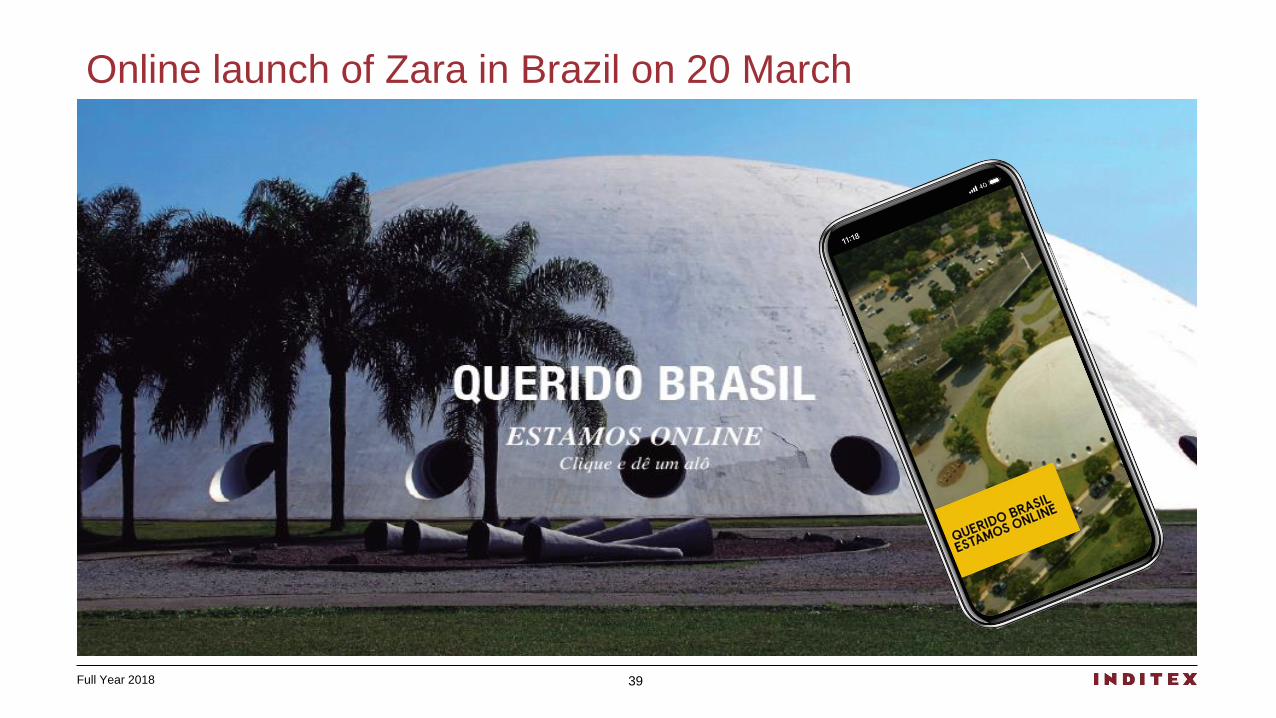
Online launch of Zara in Brazil on 20 March
39

Full Year 2018
Online launches of Zara in Middle East in May
40
East Nanjing Road

Full Year 2018
Store & Online: Campaign 19
41
Photography Steven Meisel, Art Direction Fabien Baron / Karl Templer

Full Year 2018
Store & Online: Collection 01
42
East Nanjing Road
Featuring Giorgia Tordini

Full Year 2018 43
Photography Gregory Harris. Featuring Tim Schuhmacher
Store & Online: Shades of Beige

Full Year 2018 44
East Nanjing Road
Store & Online: Kids Campaign
Photography Mario Sorrenti
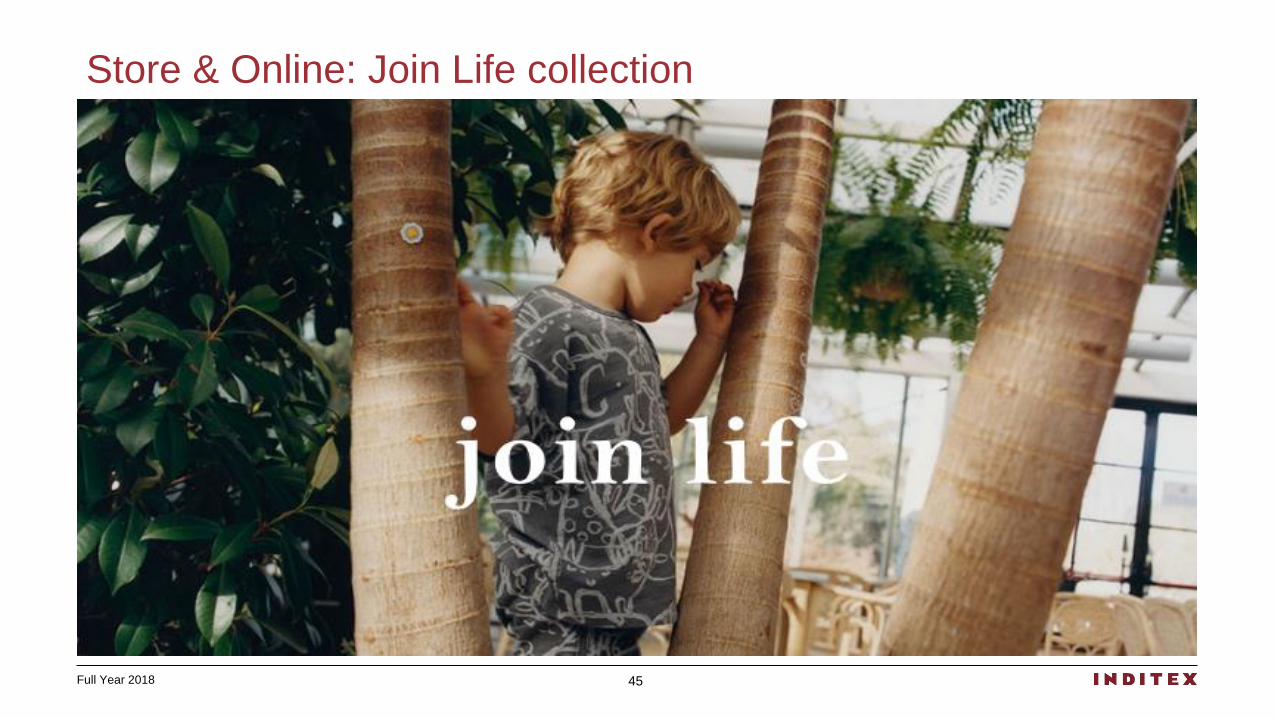
Full Year 2018 45
East Nanjing Road
Store & Online: Join Life collection
Full Year 2018
Strong differentiation of stores
Global fully integrated Store & Online
Highly differentiated stores: Larger and more prominent
RFID
Click & Collect
46

Full Year 2018
Sustainability & Circular Economy
47

Full Year 2018
New Dividend Policy
Predictable attractive shareholder remuneration
Increase of ordinary payout to 60% from 50%
A total bonus dividend of €1 per share to be paid in relation to FY2018, FY2019 and FY2020
48
Full Year 2018
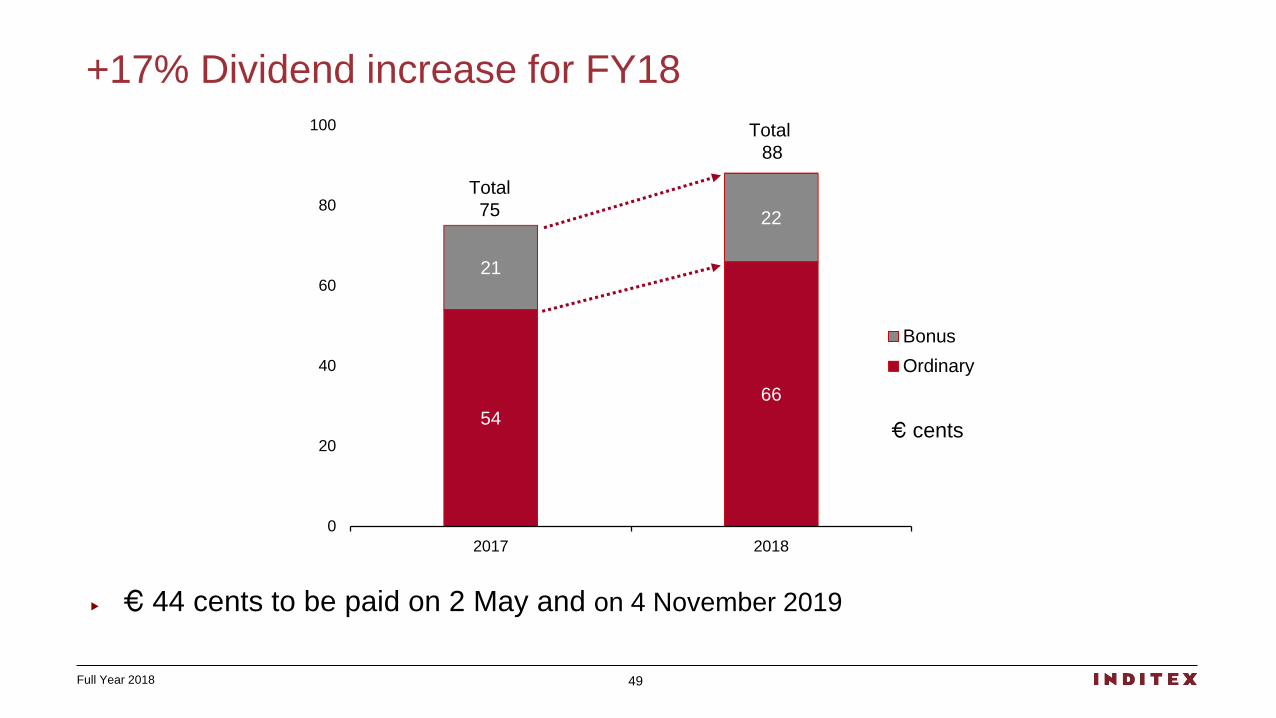
+17% Dividend increase for FY18
€ 44 cents to be paid on 2 May and on 4 November 2019
49
54
66
21
22
0
20
40
60
80
100
2017 2018
Bonus
Ordinary
Total
75
Total
88
€ cents

Full Year 2018
+17% Dividend increase for FY18
50
€
DPS
2.2 2.87 9.6
13.416.8
21 2124
3236
4448
52
60
68
75
88
2001 2002 2003 2004 2005 2006 2007 2008 2009 2010 2011 2012 2013 2014 2015 2016 2017 2018
€ce
nts
2001-2018: 24% CAGR
Accumulated dividends of ~€20bn paid out

Full Year 2018
FY2019 Outlook
Global fully integrated Store & Online
Strong organic growth. Increased differentiation of the model
LFL sales are expected to increase 4%-6%
Lower capital intensity required. Ordinary Capex c.€1.4 bn
5%-6% gross new space in prime locations. c.300 gross openings / selectiveabsorption of c.250
Strong free cash flow generation
Store and Online sales in local currencies increased by 7% from 1 February to9 March 2019
51

Full Year 2018
2018
Results13 March 2019
52