Embed Size (px)
Citation preview
Prepared for:
New Brunswick Environment & Local Government 20 McGloin Street, Fredericton, NB 22-Mar-19
2018 Parlee Beach and Shediac Bay Watershed Water Quality Results Final Report Fredericton, NB Project # TA1980803
‘Wood’ is a trading name for John Wood Group PLC and its subsidiaries
Wood Environment & Infrastructure Solutions, a Division of Wood Canada Limited
495 Prospect Street, Suite 1 Fredericton, NB E3B 9M4
Canada T: 506-458-1000
www.woodplc.com
22-Mar-19
Dr. Don Fox Manager, Water Science NB Department of Environment & Local Government Fredericton, NB E3B 5H1
Dear Dr. Fox,
Re: Final Report: 2018 Parlee Beach and Shediac Bay Watershed Water Quality Results Wood Environment & Infrastructure Solutions, a Division of Wood Canada Limited (Wood), is pleased to submit this final report to Environment & Local Government.
We trust that this report meets your expectations. Please contact us at your convenience with any comments or questions.
Sincerely,
Wood Environment & Infrastructure Solutions, a Division of Wood Canada Limited Jacques Paynter, FEC, P.Eng. Principal Project Manager Direct Tel.: (506) 450-0843 Mobile (506) 451-5780 E-mail: [email protected] JP/cjy
2018 Parlee Beach and Shediac Bay Watershed Water Quality Results Final Report Fredericton, NB
Project # TA1980803
Prepared for: New Brunswick Environment & Local Government 20 McGloin Street, Fredericton, NB
Prepared by: Wood Environment & Infrastructure Solutions, a Division of Wood Canada Limited 495 Prospect Street, Suite 1 Fredericton, NB E3B 9M4 Canada T: 506-458-1000
22-Mar-19
Copyright and non-disclosure notice The contents and layout of this report are subject to copyright owned by Wood (© Wood Environment & Infrastructure Solutions, a Division of Wood Canada Limited). save to the extent that copyright has been legally assigned by us to another party or is used by Wood under license. To the extent that we own the copyright in this report, it may not be copied or used without our prior written agreement for any purpose other than the purpose indicated in this report. The methodology (if any) contained in this report is provided to you in confidence and must not be disclosed or copied to third parties without the prior written agreement of Wood. Disclosure of that information may constitute an actionable breach of confidence or may otherwise prejudice our commercial interests. Any third party who obtains access to this report by any means will, in any event, be subject to the Third Party Disclaimer set out below.
Third-party disclaimer Any disclosure of this report to a third party is subject to this disclaimer. The report was prepared by Wood at the instruction of, and for use by, our client named on the front of the report. It does not in any way constitute advice to any third party who is able to access it by any means. Wood excludes to the fullest extent lawfully permitted all liability whatsoever for any loss or damage howsoever arising from reliance on the contents of this report. We do not however exclude our liability (if any) for personal injury or death resulting from our negligence, for fraud or any other matter in relation to which we cannot legally exclude liability.
2018 Parlee Beach and Shediac Bay Watershed Water Quality Results Final Report
Project # TA1980803 | 3/22/2019 Page ii
Table of Contents 1.0 Introduction ........................................................................................................................................................................... 1
1.1 Regional Setting .................................................................................................................................................. 1 1.2 Work Scope ........................................................................................................................................................... 1
2.0 Watershed Reconnaissance Survey and Water Sampling Program ................................................................ 2 2.1 Overview ................................................................................................................................................................. 2 2.2 Results – Agriculture Sites ............................................................................................................................... 2 2.3 Results – Fresh Water Sites ............................................................................................................................. 5 2.4 Results – Marine Sites ....................................................................................................................................... 9 2.5 Results – Stormwater Sites ............................................................................................................................11 2.6 Summary Analysis .............................................................................................................................................15
3.0 Water Quality at Parlee Beach ......................................................................................................................................18 3.1 Test Results ..........................................................................................................................................................18 3.2 Precipitation and Geometric Mean of Bacteria Counts .....................................................................19 3.3 Wind and Bacteria Counts .............................................................................................................................28
4.0 Conclusions ..........................................................................................................................................................................33 5.0 Closing ...................................................................................................................................................................................33
List of Figures Figure 2.1 Shediac watershed Monitoring Stations 2018 ......................................................................................... 2 Figure 2.2a Agriculture Sites................................................................................................................................................... 4 Figure 2.3a Fresh Water Sites (FW1 – FW5)...................................................................................................................... 7 Figure 2.3b Fresh Water Sites (FW6 – FW11) ................................................................................................................... 8 Figure 2.4a Marine Sites (M1 – M4).................................................................................................................................. 10 Figure 2.5a Stormwater Sites (SW1 – SW5) ................................................................................................................... 13 Figure 2.5b Stormwater Sites (SW6 – SW9) ................................................................................................................... 14 Figure 2.6a E. coli Geometric Mean 2018 ....................................................................................................................... 16 Figure 2.6b E. coli Geometric Mean 2017 ....................................................................................................................... 17 Figure 3.2a Rainfall and E. coli GM – May and June .................................................................................................. 20 Figure 3.2b Rainfall and E. coli GM – July ....................................................................................................................... 21 Figure 3.2c Rainfall and E. coli GM – August ................................................................................................................ 22 Figure 3.2d Rainfall and E. coli GM – September and October ............................................................................. 23 Figure 3.2e Rainfall and Enterococcus GM – May and June ................................................................................... 24 Figure 3.2f Rainfall and Enterococcus GM – July ........................................................................................................ 25 Figure 3.2g Rainfall and Enterococcus GM – August ................................................................................................. 26 Figure 3.2h Rainfall and Enterococcus GM – September and October .............................................................. 27 Figure 3.3a Wind Direction and Speed – June ............................................................................................................. 28 Figure 3.3b Wind Direction and Speed – July ............................................................................................................... 29 Figure 3.3c Wind Direction and Speed – August ........................................................................................................ 30 Figure 3.3d Wind Direction and Speed – September ................................................................................................ 31 Figure 3.3e Wind Direction and Speed – October ...................................................................................................... 32
2018 Parlee Beach and Shediac Bay Watershed Water Quality Results Final Report
Project # TA1980803 | 3/22/2019 Page iii
List of Tables Table 2.1 Agriculture Sites Frequency of Exceedances Single-Sample-Maximum Guideline Value
2018 .......................................................................................................................................................................... 3 Table 2.2 Agriculture Sites Frequency of Exceedances Single-Sample-Maximum Guideline Value
2017 .......................................................................................................................................................................... 3 Table 2.3 Fresh Water Sites Frequency of Exceedances Single-Sample-Maximum Guideline Value
2018 .......................................................................................................................................................................... 5 Table 2.4 Fresh Water Sites Frequency of Exceedances Single-Sample-Maximum Guideline Value
2017 .......................................................................................................................................................................... 6 Table 2.5 Marine Sites Frequency of Exceedances Single-Sample-Maximum Guideline Value 2018 ... 9 Table 2.6 Marine Sites Frequency of Exceedances Single-Sample-Maximum Guideline Value 2017 ... 9 Table 2.7 Stormwater Sites Frequency of Exceedances Single-Sample-Maximum Guideline Value
2018 ....................................................................................................................................................................... 11 Table 2.8 Stormwater Sites Frequency of Exceedances Single-Sample-Maximum Guideline Value
2017 ....................................................................................................................................................................... 12 Table 2.9 All Sites Frequency of Exceedances Single-Sample-Maximum Guideline Value 2018 ......... 15 Table 2.10 All Sites Frequency of Exceedances Single-Sample-Maximum Guideline Value 2017 ......... 15 Table 3.1 Enterococcus Exceedances Single-Sample-Maximum Guideline Value 2018 ......................... 18 Table 3.2 Enterococcus Exceedances Geometric Mean Guideline Value 2018 ........................................... 19
List of Acronyms AG Agricultural FIB Fecal Indicator Bacteria FW Freshwater M Marine MPN Most Probable Number SW Stormwater Wood Wood Environment & Infrastructure Solutions, a Division of Wood Canada Limited
2018 Parlee Beach and Shediac Bay Watershed Water Quality Results Final Report
Project # TA1980803 | 3/22/2019 Page 1
1.0 Introduction Wood Environment & Infrastructure Solutions, a Division of Wood Canada Limited (Wood), has been retained by New Brunswick Environment & Local Government to interpret and report on the 2018 Parlee Beach and Shediac Bay Watershed Water Quality Results.
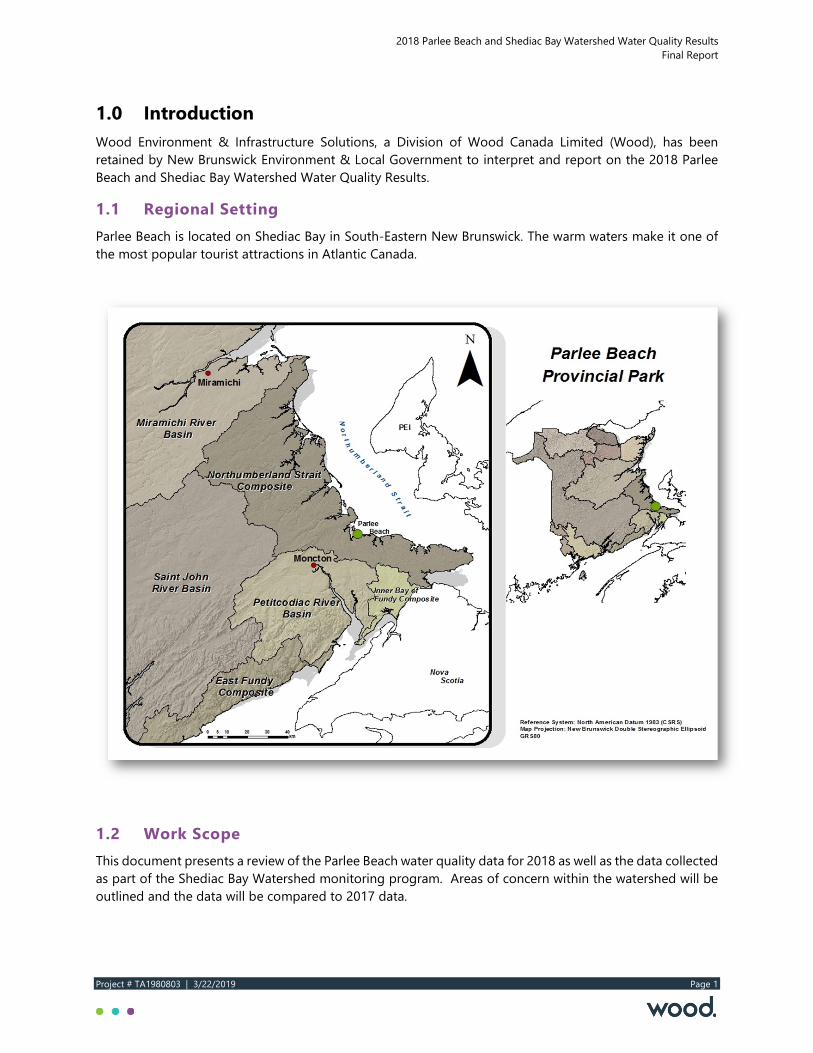
1.1 Regional Setting Parlee Beach is located on Shediac Bay in South-Eastern New Brunswick. The warm waters make it one of the most popular tourist attractions in Atlantic Canada.
1.2 Work Scope This document presents a review of the Parlee Beach water quality data for 2018 as well as the data collected as part of the Shediac Bay Watershed monitoring program. Areas of concern within the watershed will be outlined and the data will be compared to 2017 data.
2018 Parlee Beach and Shediac Bay Watershed Water Quality Results Final Report
Project # TA1980803 | 3/22/2019 Page 2
2.0 Watershed Reconnaissance Survey and Water Sampling Program
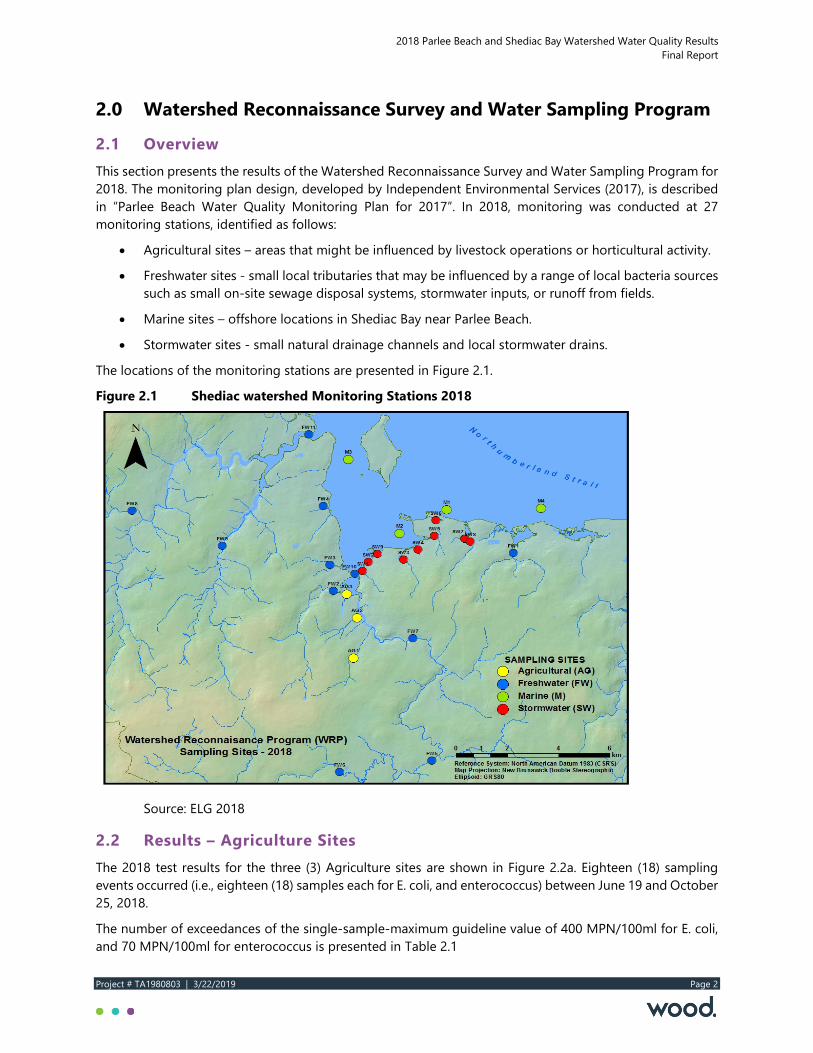
2.1 Overview This section presents the results of the Watershed Reconnaissance Survey and Water Sampling Program for 2018. The monitoring plan design, developed by Independent Environmental Services (2017), is described in “Parlee Beach Water Quality Monitoring Plan for 2017”. In 2018, monitoring was conducted at 27 monitoring stations, identified as follows:
• Agricultural sites – areas that might be influenced by livestock operations or horticultural activity.
• Freshwater sites - small local tributaries that may be influenced by a range of local bacteria sources such as small on-site sewage disposal systems, stormwater inputs, or runoff from fields.
• Marine sites – offshore locations in Shediac Bay near Parlee Beach.
• Stormwater sites - small natural drainage channels and local stormwater drains.
The locations of the monitoring stations are presented in Figure 2.1.
Figure 2.1 Shediac watershed Monitoring Stations 2018
Source: ELG 2018
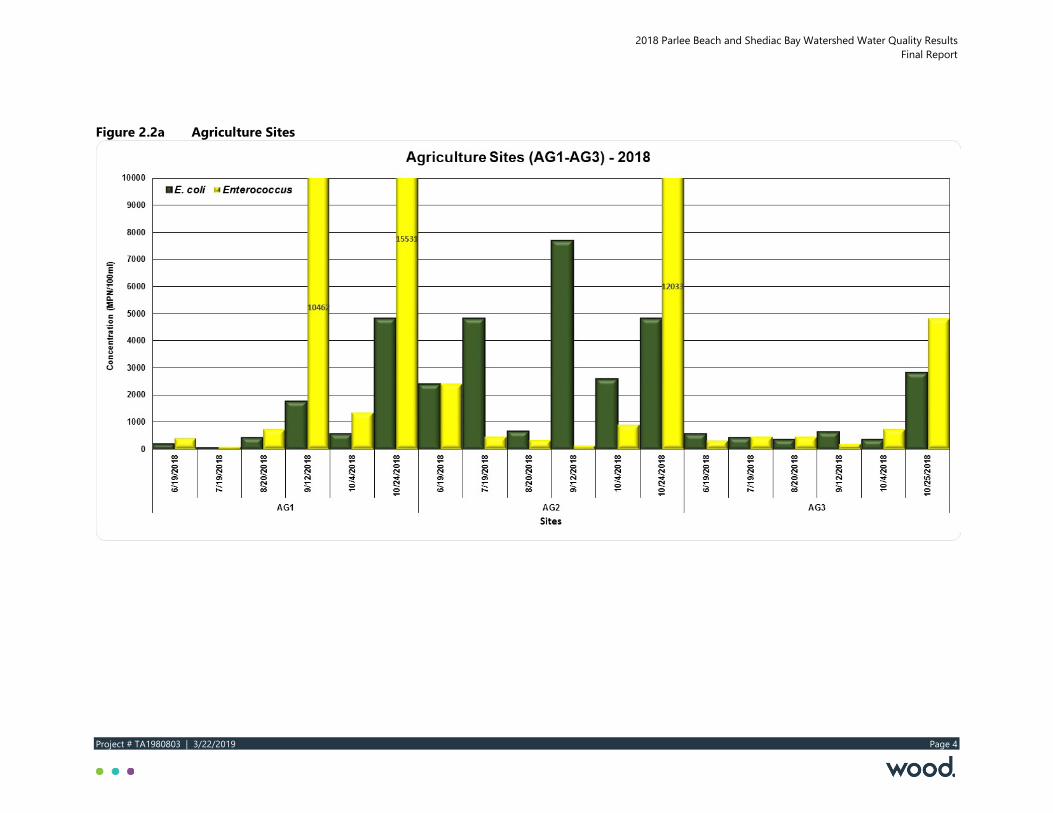
2.2 Results – Agriculture Sites The 2018 test results for the three (3) Agriculture sites are shown in Figure 2.2a. Eighteen (18) sampling events occurred (i.e., eighteen (18) samples each for E. coli, and enterococcus) between June 19 and October 25, 2018.
The number of exceedances of the single-sample-maximum guideline value of 400 MPN/100ml for E. coli, and 70 MPN/100ml for enterococcus is presented in Table 2.1
2018 Parlee Beach and Shediac Bay Watershed Water Quality Results Final Report
Project # TA1980803 | 3/22/2019 Page 3
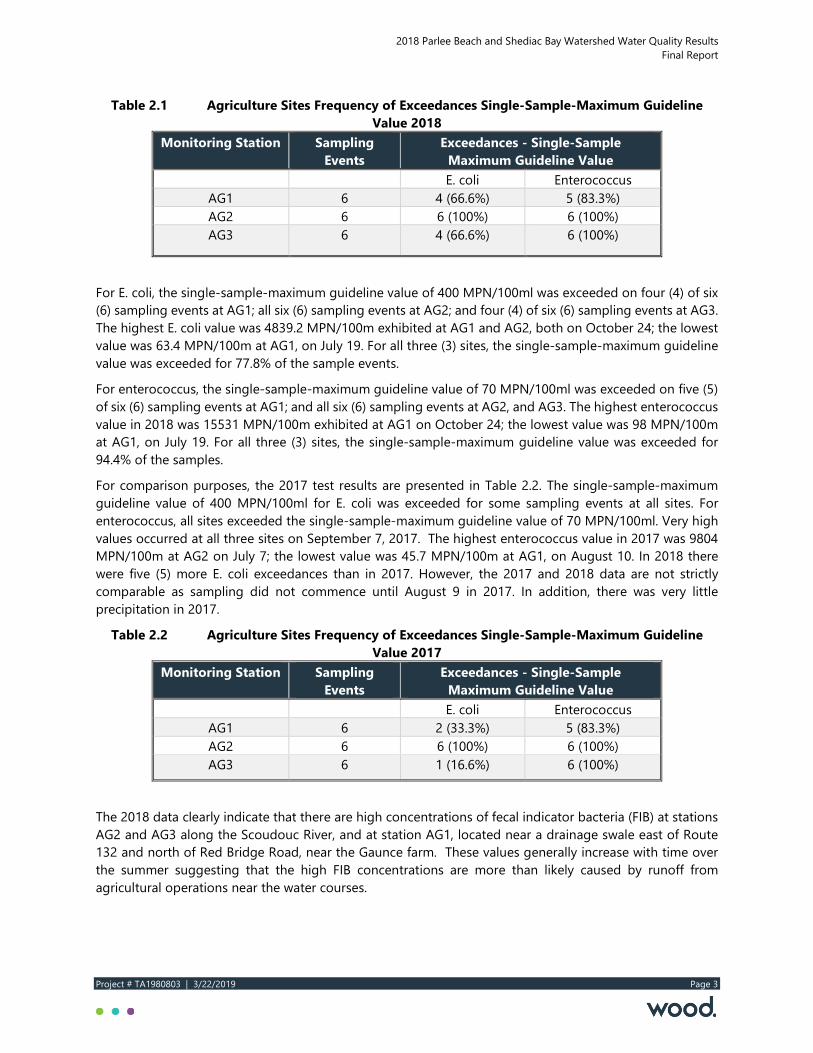
Table 2.1 Agriculture Sites Frequency of Exceedances Single-Sample-Maximum Guideline Value 2018
Monitoring Station Sampling Events
Exceedances - Single-Sample Maximum Guideline Value
E. coli Enterococcus AG1 6 4 (66.6%) 5 (83.3%) AG2 6 6 (100%) 6 (100%) AG3 6 4 (66.6%) 6 (100%)
For E. coli, the single-sample-maximum guideline value of 400 MPN/100ml was exceeded on four (4) of six (6) sampling events at AG1; all six (6) sampling events at AG2; and four (4) of six (6) sampling events at AG3. The highest E. coli value was 4839.2 MPN/100m exhibited at AG1 and AG2, both on October 24; the lowest value was 63.4 MPN/100m at AG1, on July 19. For all three (3) sites, the single-sample-maximum guideline value was exceeded for 77.8% of the sample events.
For enterococcus, the single-sample-maximum guideline value of 70 MPN/100ml was exceeded on five (5) of six (6) sampling events at AG1; and all six (6) sampling events at AG2, and AG3. The highest enterococcus value in 2018 was 15531 MPN/100m exhibited at AG1 on October 24; the lowest value was 98 MPN/100m at AG1, on July 19. For all three (3) sites, the single-sample-maximum guideline value was exceeded for 94.4% of the samples.
For comparison purposes, the 2017 test results are presented in Table 2.2. The single-sample-maximum guideline value of 400 MPN/100ml for E. coli was exceeded for some sampling events at all sites. For enterococcus, all sites exceeded the single-sample-maximum guideline value of 70 MPN/100ml. Very high values occurred at all three sites on September 7, 2017. The highest enterococcus value in 2017 was 9804 MPN/100m at AG2 on July 7; the lowest value was 45.7 MPN/100m at AG1, on August 10. In 2018 there were five (5) more E. coli exceedances than in 2017. However, the 2017 and 2018 data are not strictly comparable as sampling did not commence until August 9 in 2017. In addition, there was very little precipitation in 2017.
Table 2.2 Agriculture Sites Frequency of Exceedances Single-Sample-Maximum Guideline Value 2017
Monitoring Station Sampling Events
Exceedances - Single-Sample Maximum Guideline Value
E. coli Enterococcus AG1 6 2 (33.3%) 5 (83.3%) AG2 6 6 (100%) 6 (100%) AG3 6 1 (16.6%) 6 (100%)
The 2018 data clearly indicate that there are high concentrations of fecal indicator bacteria (FIB) at stations AG2 and AG3 along the Scoudouc River, and at station AG1, located near a drainage swale east of Route 132 and north of Red Bridge Road, near the Gaunce farm. These values generally increase with time over the summer suggesting that the high FIB concentrations are more than likely caused by runoff from agricultural operations near the water courses.
2018 Parlee Beach and Shediac Bay Watershed Water Quality Results Final Report
Project # TA1980803 | 3/22/2019 Page 4
Figure 2.2a Agriculture Sites
2018 Parlee Beach and Shediac Bay Watershed Water Quality Results Final Report
Project # TA1980803 | 3/22/2019 Page 5
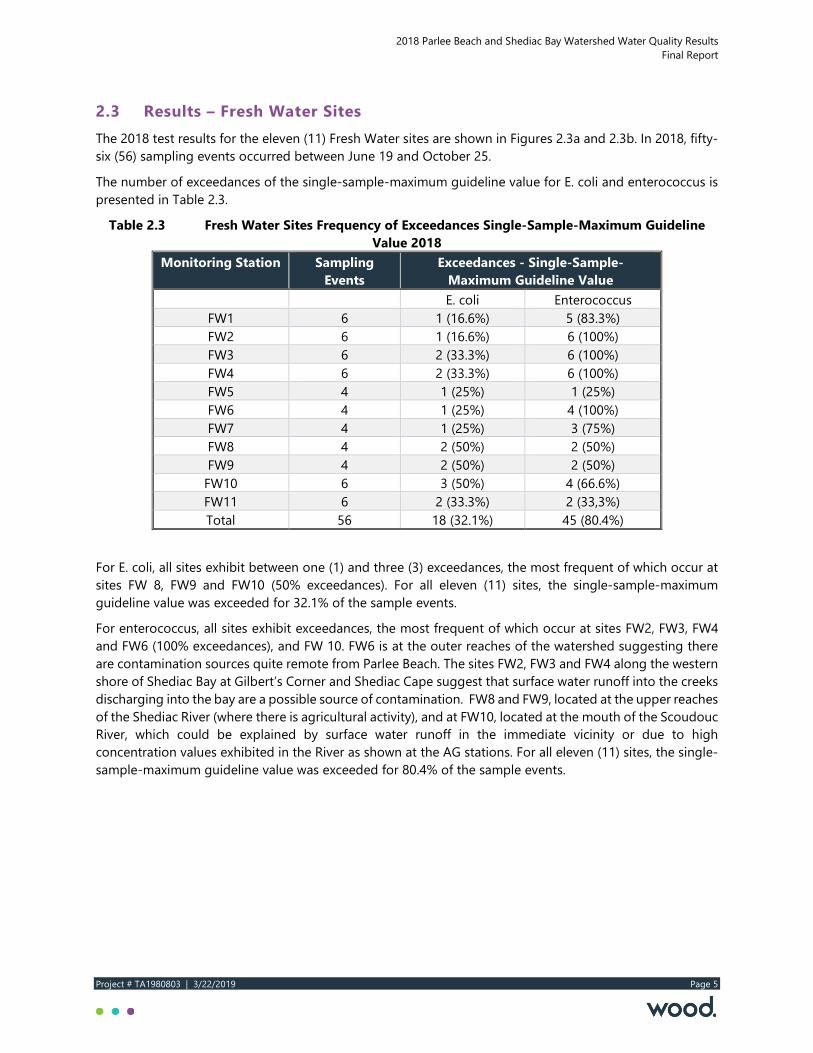
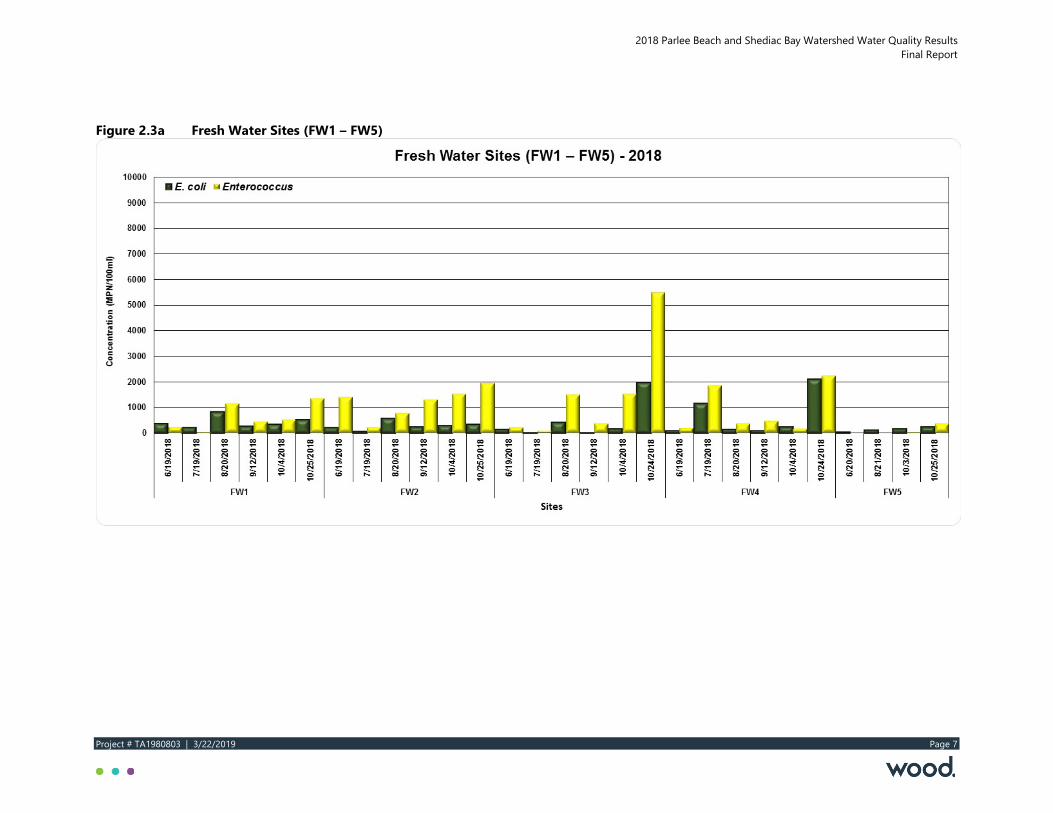
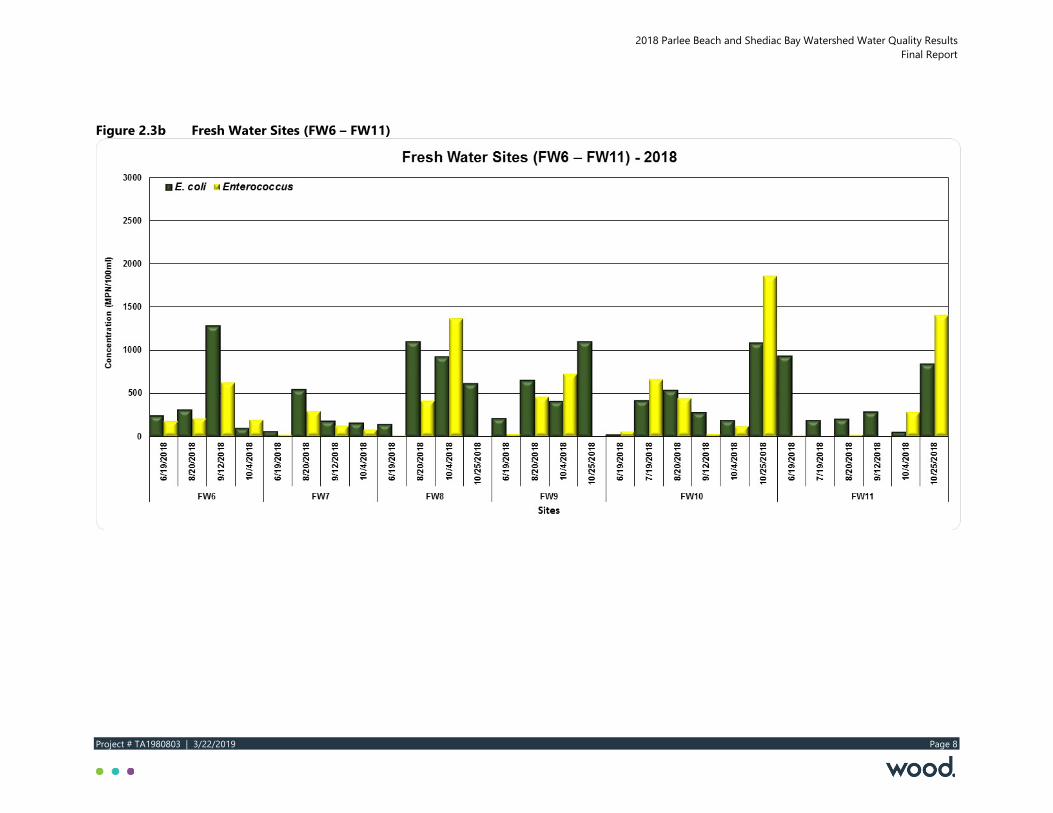
2.3 Results – Fresh Water Sites The 2018 test results for the eleven (11) Fresh Water sites are shown in Figures 2.3a and 2.3b. In 2018, fifty-six (56) sampling events occurred between June 19 and October 25.
The number of exceedances of the single-sample-maximum guideline value for E. coli and enterococcus is presented in Table 2.3.
Table 2.3 Fresh Water Sites Frequency of Exceedances Single-Sample-Maximum Guideline Value 2018
Monitoring Station Sampling Events
Exceedances - Single-Sample- Maximum Guideline Value
E. coli Enterococcus FW1 6 1 (16.6%) 5 (83.3%) FW2 6 1 (16.6%) 6 (100%) FW3 6 2 (33.3%) 6 (100%) FW4 6 2 (33.3%) 6 (100%) FW5 4 1 (25%) 1 (25%) FW6 4 1 (25%) 4 (100%) FW7 4 1 (25%) 3 (75%) FW8 4 2 (50%) 2 (50%) FW9 4 2 (50%) 2 (50%)
FW10 6 3 (50%) 4 (66.6%) FW11 6 2 (33.3%) 2 (33,3%) Total 56 18 (32.1%) 45 (80.4%)
For E. coli, all sites exhibit between one (1) and three (3) exceedances, the most frequent of which occur at sites FW 8, FW9 and FW10 (50% exceedances). For all eleven (11) sites, the single-sample-maximum guideline value was exceeded for 32.1% of the sample events.
For enterococcus, all sites exhibit exceedances, the most frequent of which occur at sites FW2, FW3, FW4 and FW6 (100% exceedances), and FW 10. FW6 is at the outer reaches of the watershed suggesting there are contamination sources quite remote from Parlee Beach. The sites FW2, FW3 and FW4 along the western shore of Shediac Bay at Gilbert’s Corner and Shediac Cape suggest that surface water runoff into the creeks discharging into the bay are a possible source of contamination. FW8 and FW9, located at the upper reaches of the Shediac River (where there is agricultural activity), and at FW10, located at the mouth of the Scoudouc River, which could be explained by surface water runoff in the immediate vicinity or due to high concentration values exhibited in the River as shown at the AG stations. For all eleven (11) sites, the single-sample-maximum guideline value was exceeded for 80.4% of the sample events.
2018 Parlee Beach and Shediac Bay Watershed Water Quality Results Final Report
Project # TA1980803 | 3/22/2019 Page 6
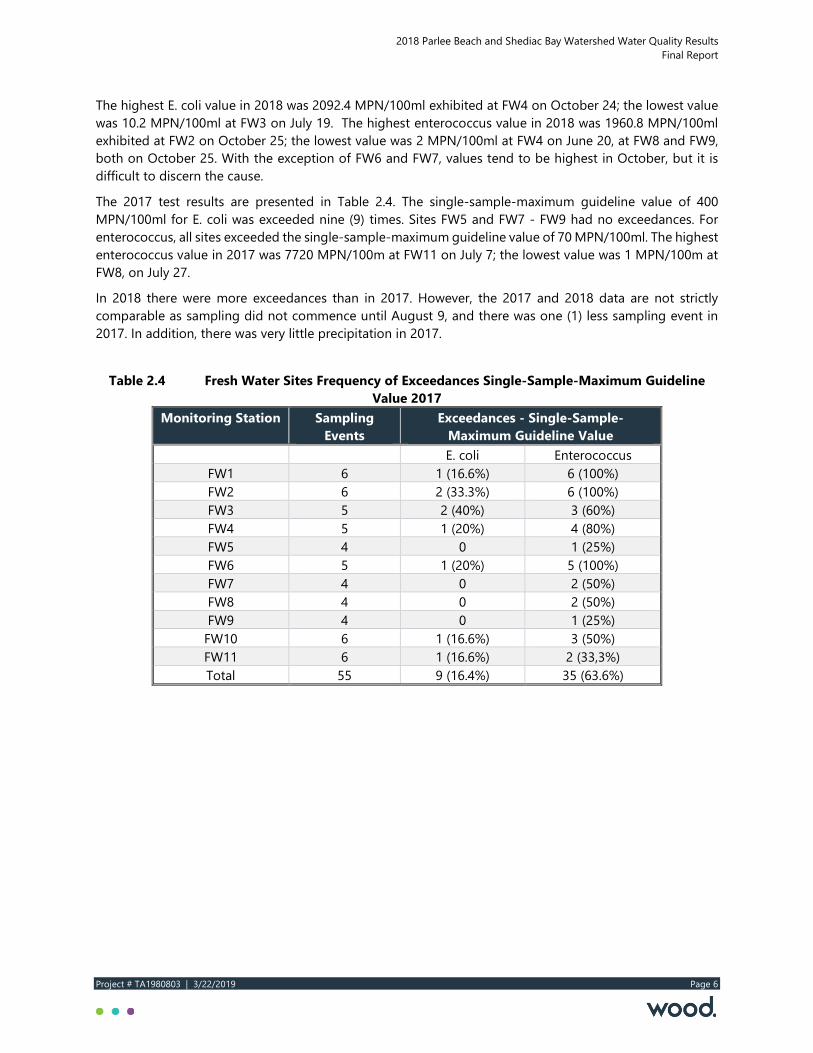
The highest E. coli value in 2018 was 2092.4 MPN/100ml exhibited at FW4 on October 24; the lowest value was 10.2 MPN/100ml at FW3 on July 19. The highest enterococcus value in 2018 was 1960.8 MPN/100ml exhibited at FW2 on October 25; the lowest value was 2 MPN/100ml at FW4 on June 20, at FW8 and FW9, both on October 25. With the exception of FW6 and FW7, values tend to be highest in October, but it is difficult to discern the cause.
The 2017 test results are presented in Table 2.4. The single-sample-maximum guideline value of 400 MPN/100ml for E. coli was exceeded nine (9) times. Sites FW5 and FW7 - FW9 had no exceedances. For enterococcus, all sites exceeded the single-sample-maximum guideline value of 70 MPN/100ml. The highest enterococcus value in 2017 was 7720 MPN/100m at FW11 on July 7; the lowest value was 1 MPN/100m at FW8, on July 27.
In 2018 there were more exceedances than in 2017. However, the 2017 and 2018 data are not strictly comparable as sampling did not commence until August 9, and there was one (1) less sampling event in 2017. In addition, there was very little precipitation in 2017.
Table 2.4 Fresh Water Sites Frequency of Exceedances Single-Sample-Maximum Guideline
Value 2017 Monitoring Station Sampling
Events Exceedances - Single-Sample-
Maximum Guideline Value E. coli Enterococcus
FW1 6 1 (16.6%) 6 (100%) FW2 6 2 (33.3%) 6 (100%) FW3 5 2 (40%) 3 (60%) FW4 5 1 (20%) 4 (80%) FW5 4 0 1 (25%) FW6 5 1 (20%) 5 (100%) FW7 4 0 2 (50%) FW8 4 0 2 (50%) FW9 4 0 1 (25%)
FW10 6 1 (16.6%) 3 (50%) FW11 6 1 (16.6%) 2 (33,3%) Total 55 9 (16.4%) 35 (63.6%)
2018 Parlee Beach and Shediac Bay Watershed Water Quality Results Final Report
Project # TA1980803 | 3/22/2019 Page 7
Figure 2.3a Fresh Water Sites (FW1 – FW5)
2018 Parlee Beach and Shediac Bay Watershed Water Quality Results Final Report
Project # TA1980803 | 3/22/2019 Page 8
Figure 2.3b Fresh Water Sites (FW6 – FW11)
2018 Parlee Beach and Shediac Bay Watershed Water Quality Results Final Report
Project # TA1980803 | 3/22/2019 Page 9
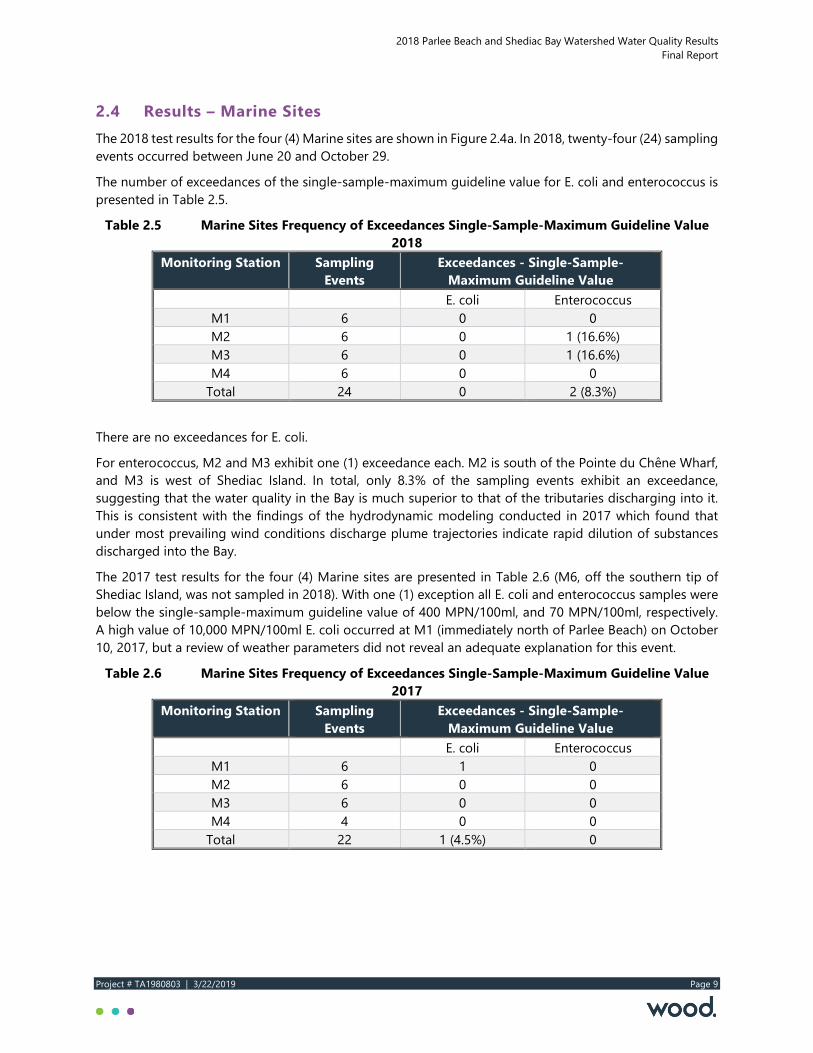
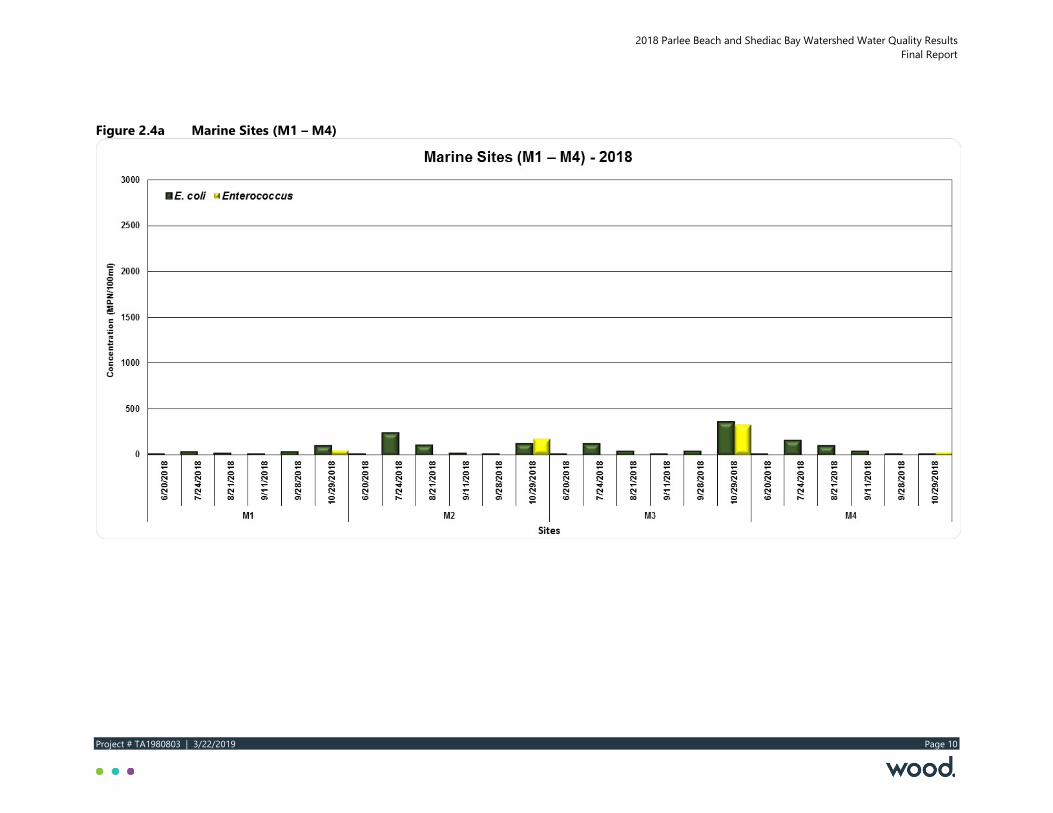
2.4 Results – Marine Sites The 2018 test results for the four (4) Marine sites are shown in Figure 2.4a. In 2018, twenty-four (24) sampling events occurred between June 20 and October 29.
The number of exceedances of the single-sample-maximum guideline value for E. coli and enterococcus is presented in Table 2.5.
Table 2.5 Marine Sites Frequency of Exceedances Single-Sample-Maximum Guideline Value 2018
Monitoring Station Sampling Events
Exceedances - Single-Sample- Maximum Guideline Value
E. coli Enterococcus M1 6 0 0 M2 6 0 1 (16.6%) M3 6 0 1 (16.6%) M4 6 0 0
Total 24 0 2 (8.3%)
There are no exceedances for E. coli.
For enterococcus, M2 and M3 exhibit one (1) exceedance each. M2 is south of the Pointe du Chêne Wharf, and M3 is west of Shediac Island. In total, only 8.3% of the sampling events exhibit an exceedance, suggesting that the water quality in the Bay is much superior to that of the tributaries discharging into it. This is consistent with the findings of the hydrodynamic modeling conducted in 2017 which found that under most prevailing wind conditions discharge plume trajectories indicate rapid dilution of substances discharged into the Bay.
The 2017 test results for the four (4) Marine sites are presented in Table 2.6 (M6, off the southern tip of Shediac Island, was not sampled in 2018). With one (1) exception all E. coli and enterococcus samples were below the single-sample-maximum guideline value of 400 MPN/100ml, and 70 MPN/100ml, respectively. A high value of 10,000 MPN/100ml E. coli occurred at M1 (immediately north of Parlee Beach) on October 10, 2017, but a review of weather parameters did not reveal an adequate explanation for this event.
Table 2.6 Marine Sites Frequency of Exceedances Single-Sample-Maximum Guideline Value 2017
Monitoring Station Sampling Events
Exceedances - Single-Sample- Maximum Guideline Value
E. coli Enterococcus M1 6 1 0 M2 6 0 0 M3 6 0 0 M4 4 0 0
Total 22 1 (4.5%) 0
2018 Parlee Beach and Shediac Bay Watershed Water Quality Results Final Report
Project # TA1980803 | 3/22/2019 Page 10
Figure 2.4a Marine Sites (M1 – M4)
2018 Parlee Beach and Shediac Bay Watershed Water Quality Results Final Report
Project # TA1980803 | 3/22/2019 Page 11
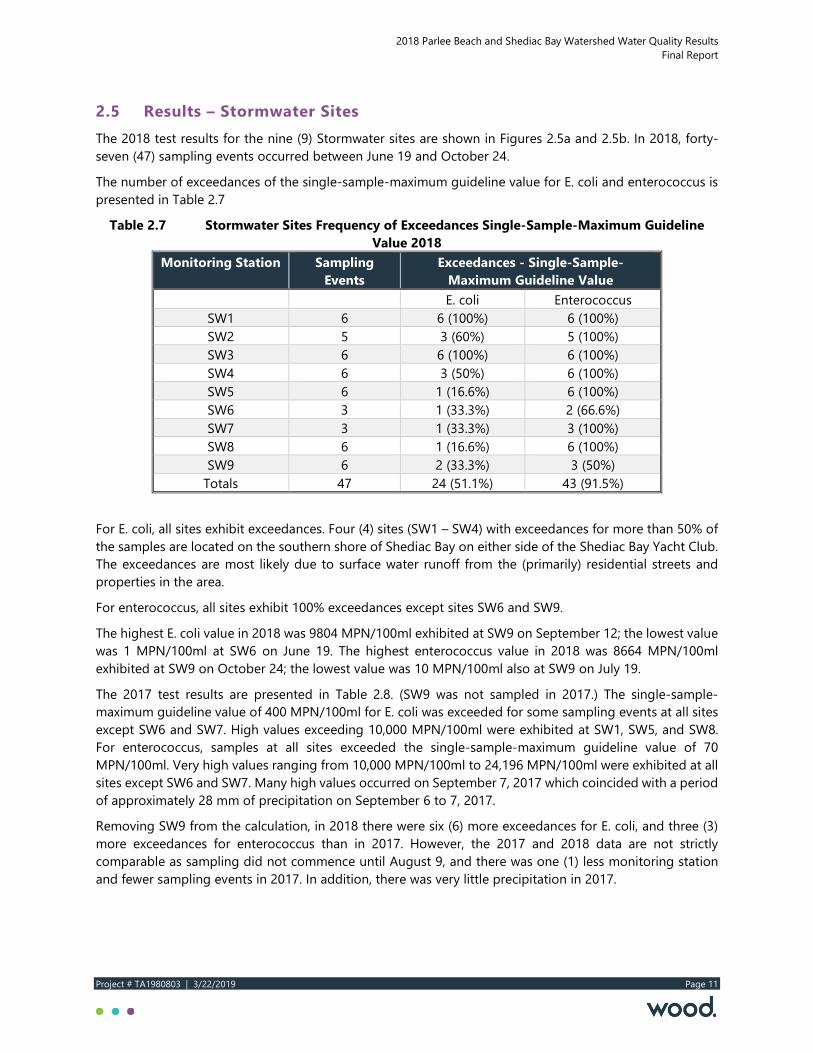
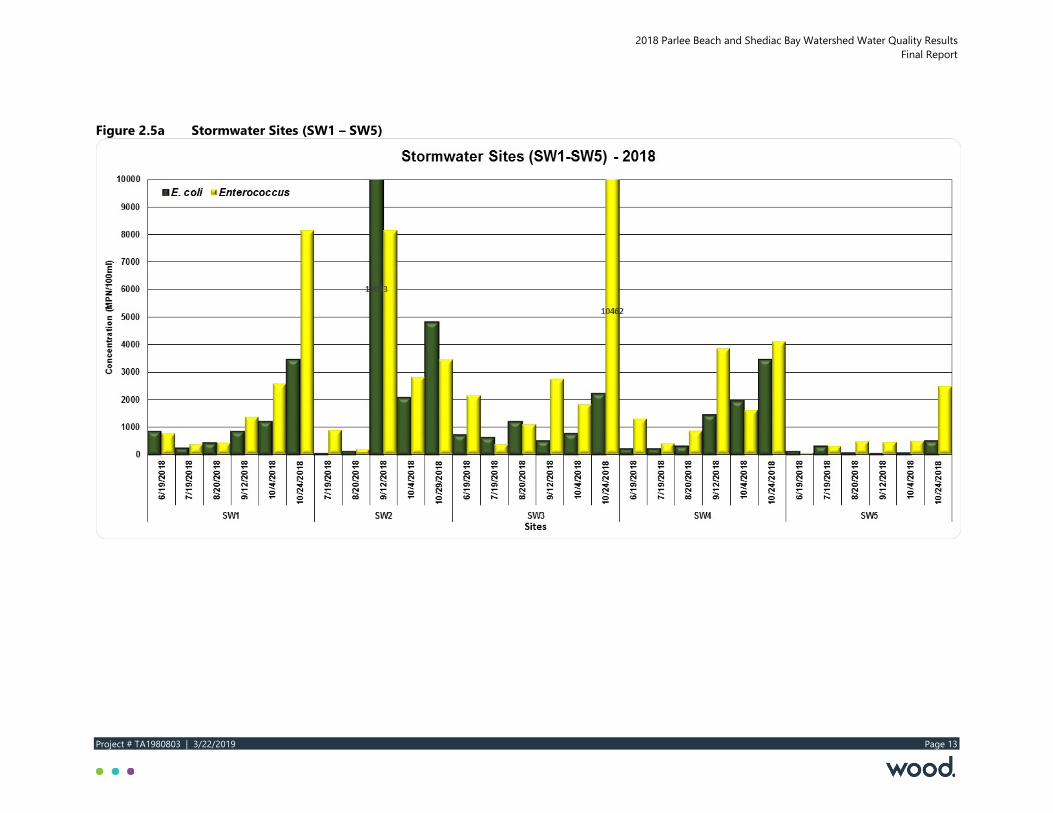
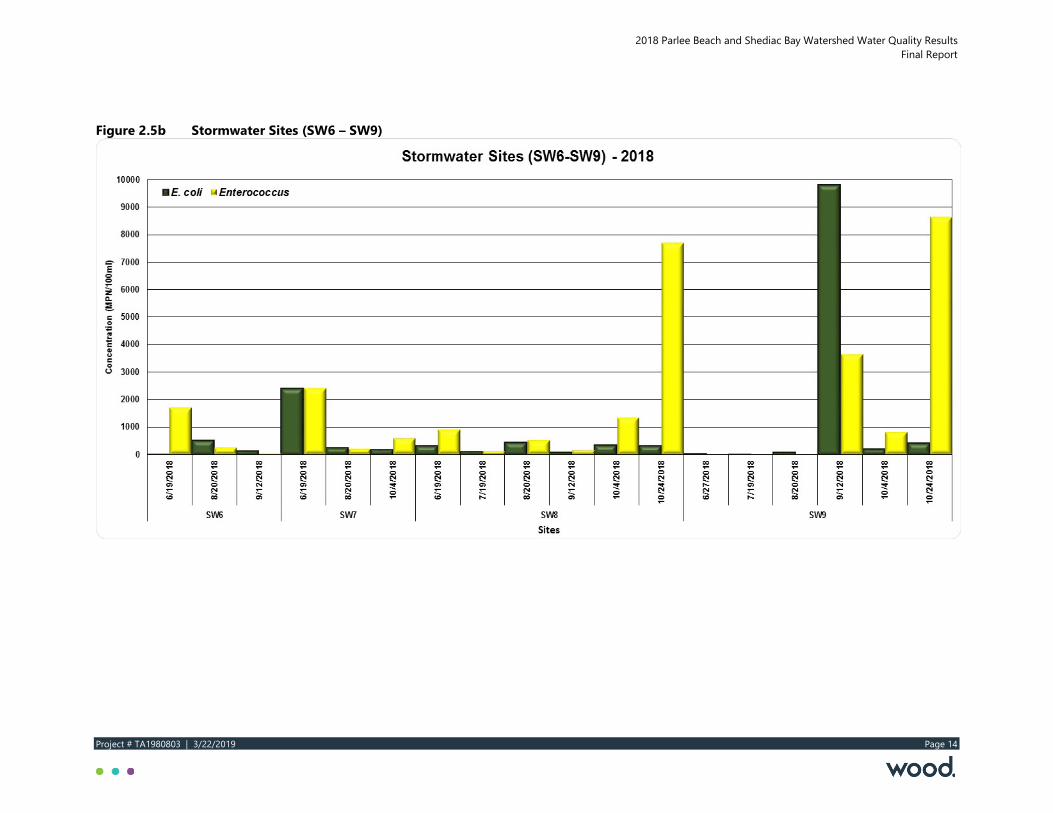
2.5 Results – Stormwater Sites The 2018 test results for the nine (9) Stormwater sites are shown in Figures 2.5a and 2.5b. In 2018, forty-seven (47) sampling events occurred between June 19 and October 24.
The number of exceedances of the single-sample-maximum guideline value for E. coli and enterococcus is presented in Table 2.7
Table 2.7 Stormwater Sites Frequency of Exceedances Single-Sample-Maximum Guideline Value 2018
Monitoring Station Sampling Events
Exceedances - Single-Sample-Maximum Guideline Value
E. coli Enterococcus SW1 6 6 (100%) 6 (100%) SW2 5 3 (60%) 5 (100%) SW3 6 6 (100%) 6 (100%) SW4 6 3 (50%) 6 (100%) SW5 6 1 (16.6%) 6 (100%) SW6 3 1 (33.3%) 2 (66.6%) SW7 3 1 (33.3%) 3 (100%) SW8 6 1 (16.6%) 6 (100%) SW9 6 2 (33.3%) 3 (50%)
Totals 47 24 (51.1%) 43 (91.5%)
For E. coli, all sites exhibit exceedances. Four (4) sites (SW1 – SW4) with exceedances for more than 50% of the samples are located on the southern shore of Shediac Bay on either side of the Shediac Bay Yacht Club. The exceedances are most likely due to surface water runoff from the (primarily) residential streets and properties in the area.
For enterococcus, all sites exhibit 100% exceedances except sites SW6 and SW9.
The highest E. coli value in 2018 was 9804 MPN/100ml exhibited at SW9 on September 12; the lowest value was 1 MPN/100ml at SW6 on June 19. The highest enterococcus value in 2018 was 8664 MPN/100ml exhibited at SW9 on October 24; the lowest value was 10 MPN/100ml also at SW9 on July 19.
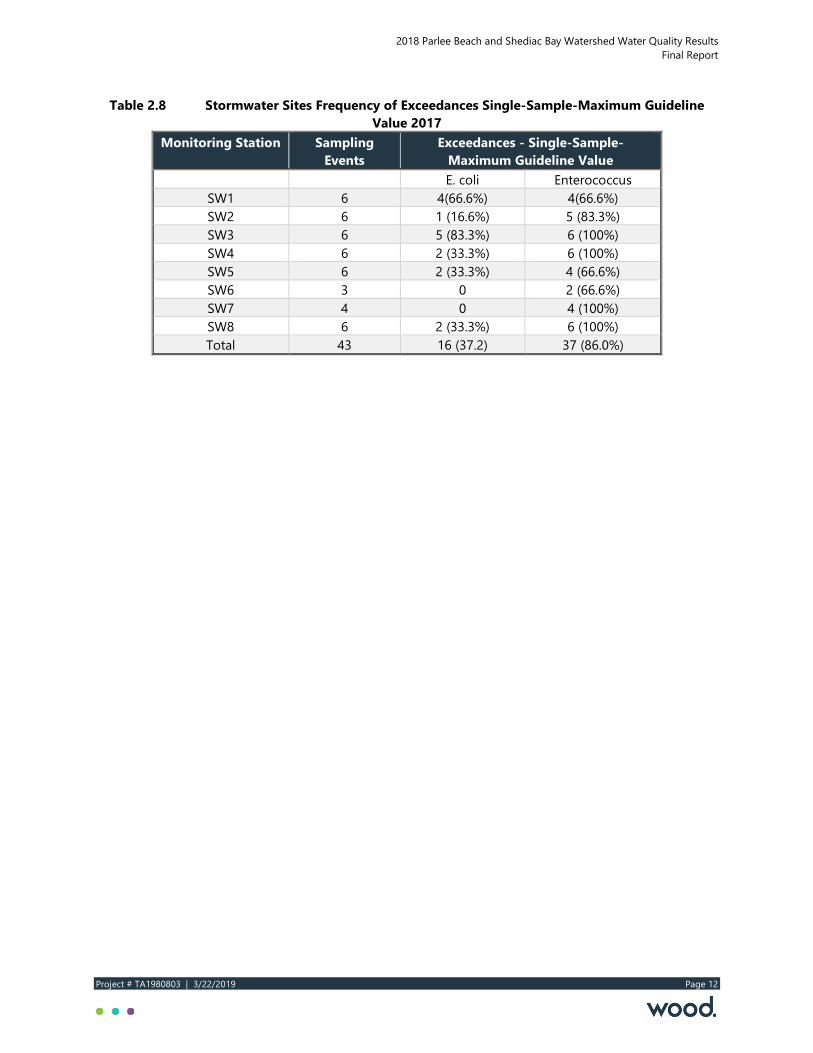
The 2017 test results are presented in Table 2.8. (SW9 was not sampled in 2017.) The single-sample-maximum guideline value of 400 MPN/100ml for E. coli was exceeded for some sampling events at all sites except SW6 and SW7. High values exceeding 10,000 MPN/100ml were exhibited at SW1, SW5, and SW8. For enterococcus, samples at all sites exceeded the single-sample-maximum guideline value of 70 MPN/100ml. Very high values ranging from 10,000 MPN/100ml to 24,196 MPN/100ml were exhibited at all sites except SW6 and SW7. Many high values occurred on September 7, 2017 which coincided with a period of approximately 28 mm of precipitation on September 6 to 7, 2017.
Removing SW9 from the calculation, in 2018 there were six (6) more exceedances for E. coli, and three (3) more exceedances for enterococcus than in 2017. However, the 2017 and 2018 data are not strictly comparable as sampling did not commence until August 9, and there was one (1) less monitoring station and fewer sampling events in 2017. In addition, there was very little precipitation in 2017.
2018 Parlee Beach and Shediac Bay Watershed Water Quality Results Final Report
Project # TA1980803 | 3/22/2019 Page 12
Table 2.8 Stormwater Sites Frequency of Exceedances Single-Sample-Maximum Guideline Value 2017
Monitoring Station Sampling Events
Exceedances - Single-Sample-Maximum Guideline Value
E. coli Enterococcus SW1 6 4(66.6%) 4(66.6%) SW2 6 1 (16.6%) 5 (83.3%) SW3 6 5 (83.3%) 6 (100%) SW4 6 2 (33.3%) 6 (100%) SW5 6 2 (33.3%) 4 (66.6%) SW6 3 0 2 (66.6%) SW7 4 0 4 (100%) SW8 6 2 (33.3%) 6 (100%) Total 43 16 (37.2) 37 (86.0%)
2018 Parlee Beach and Shediac Bay Watershed Water Quality Results Final Report
Project # TA1980803 | 3/22/2019 Page 13
Figure 2.5a Stormwater Sites (SW1 – SW5)
2018 Parlee Beach and Shediac Bay Watershed Water Quality Results Final Report
Project # TA1980803 | 3/22/2019 Page 14
Figure 2.5b Stormwater Sites (SW6 – SW9)
2018 Parlee Beach and Shediac Bay Watershed Water Quality Results Final Report
Project # TA1980803 | 3/22/2019 Page 15
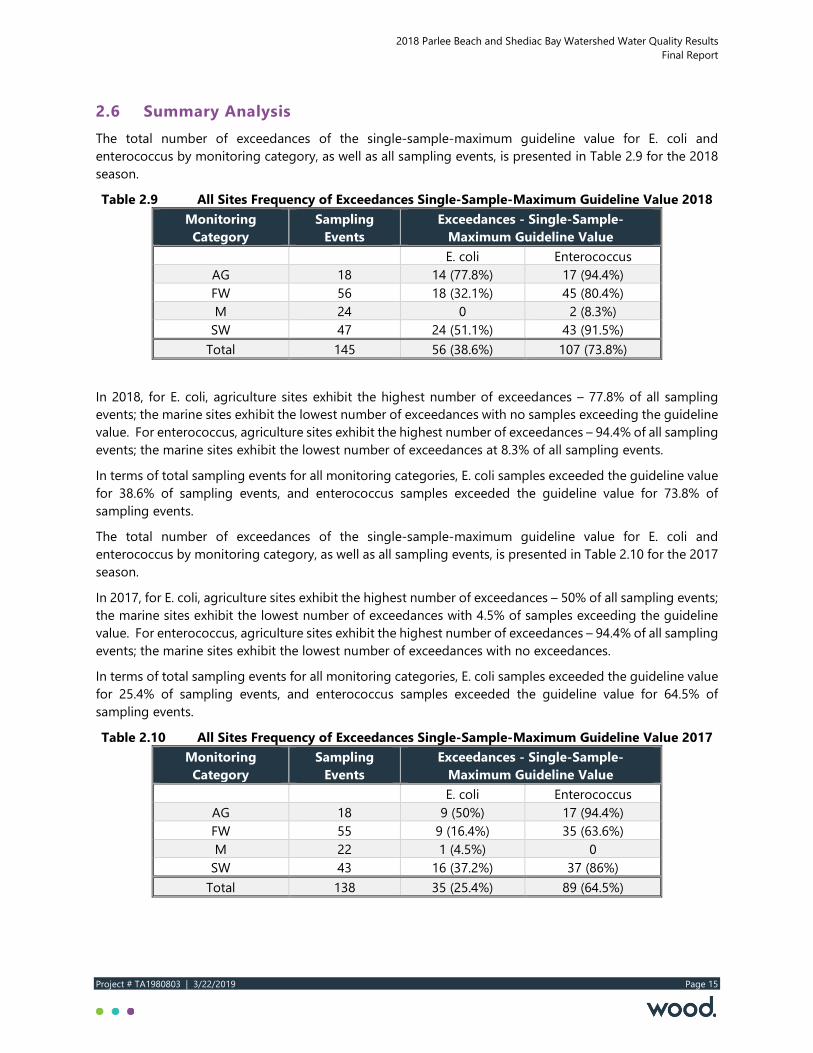
2.6 Summary Analysis The total number of exceedances of the single-sample-maximum guideline value for E. coli and enterococcus by monitoring category, as well as all sampling events, is presented in Table 2.9 for the 2018 season.
Table 2.9 All Sites Frequency of Exceedances Single-Sample-Maximum Guideline Value 2018 Monitoring
Category Sampling
Events Exceedances - Single-Sample-
Maximum Guideline Value E. coli Enterococcus
AG 18 14 (77.8%) 17 (94.4%) FW 56 18 (32.1%) 45 (80.4%) M 24 0 2 (8.3%)
SW 47 24 (51.1%) 43 (91.5%) Total 145 56 (38.6%) 107 (73.8%)
In 2018, for E. coli, agriculture sites exhibit the highest number of exceedances – 77.8% of all sampling events; the marine sites exhibit the lowest number of exceedances with no samples exceeding the guideline value. For enterococcus, agriculture sites exhibit the highest number of exceedances – 94.4% of all sampling events; the marine sites exhibit the lowest number of exceedances at 8.3% of all sampling events.
In terms of total sampling events for all monitoring categories, E. coli samples exceeded the guideline value for 38.6% of sampling events, and enterococcus samples exceeded the guideline value for 73.8% of sampling events.
The total number of exceedances of the single-sample-maximum guideline value for E. coli and enterococcus by monitoring category, as well as all sampling events, is presented in Table 2.10 for the 2017 season.
In 2017, for E. coli, agriculture sites exhibit the highest number of exceedances – 50% of all sampling events; the marine sites exhibit the lowest number of exceedances with 4.5% of samples exceeding the guideline value. For enterococcus, agriculture sites exhibit the highest number of exceedances – 94.4% of all sampling events; the marine sites exhibit the lowest number of exceedances with no exceedances.
In terms of total sampling events for all monitoring categories, E. coli samples exceeded the guideline value for 25.4% of sampling events, and enterococcus samples exceeded the guideline value for 64.5% of sampling events.
Table 2.10 All Sites Frequency of Exceedances Single-Sample-Maximum Guideline Value 2017 Monitoring
Category Sampling
Events Exceedances - Single-Sample-
Maximum Guideline Value E. coli Enterococcus
AG 18 9 (50%) 17 (94.4%) FW 55 9 (16.4%) 35 (63.6%) M 22 1 (4.5%) 0
SW 43 16 (37.2%) 37 (86%) Total 138 35 (25.4%) 89 (64.5%)
2018 Parlee Beach and Shediac Bay Watershed Water Quality Results Final Report
Project # TA1980803 | 3/22/2019 Page 16
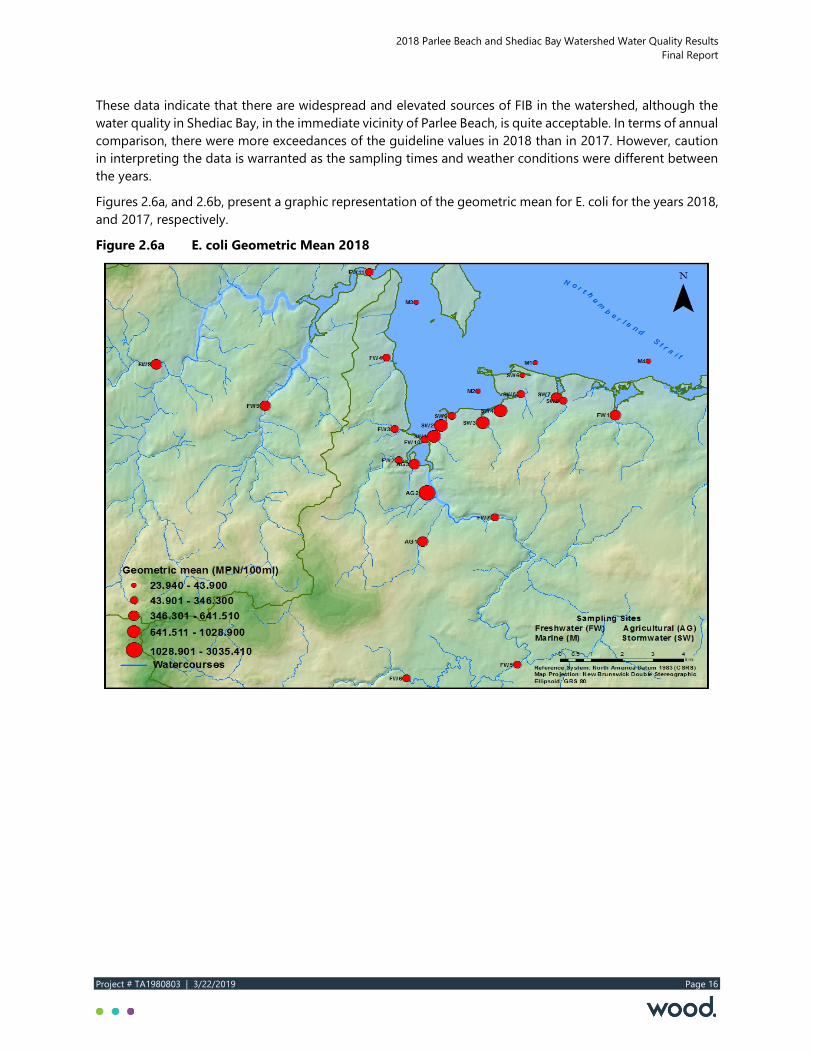
These data indicate that there are widespread and elevated sources of FIB in the watershed, although the water quality in Shediac Bay, in the immediate vicinity of Parlee Beach, is quite acceptable. In terms of annual comparison, there were more exceedances of the guideline values in 2018 than in 2017. However, caution in interpreting the data is warranted as the sampling times and weather conditions were different between the years.
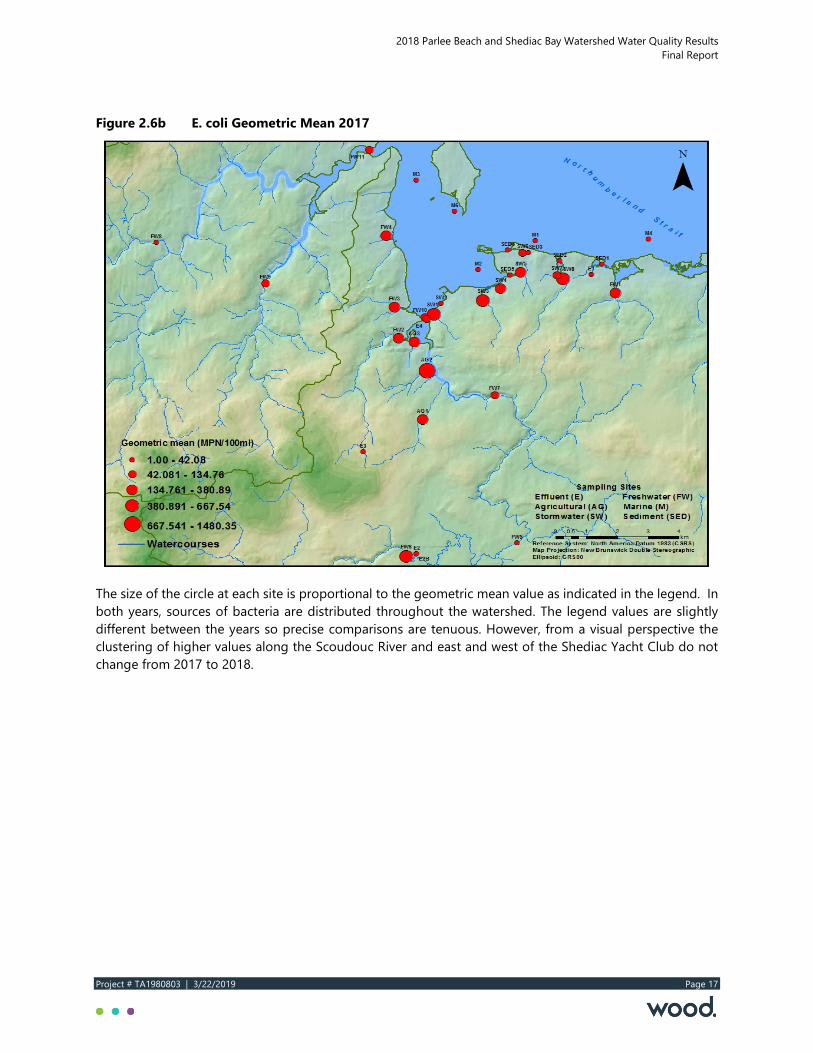
Figures 2.6a, and 2.6b, present a graphic representation of the geometric mean for E. coli for the years 2018, and 2017, respectively.
Figure 2.6a E. coli Geometric Mean 2018
2018 Parlee Beach and Shediac Bay Watershed Water Quality Results Final Report
Project # TA1980803 | 3/22/2019 Page 17
Figure 2.6b E. coli Geometric Mean 2017
The size of the circle at each site is proportional to the geometric mean value as indicated in the legend. In both years, sources of bacteria are distributed throughout the watershed. The legend values are slightly different between the years so precise comparisons are tenuous. However, from a visual perspective the clustering of higher values along the Scoudouc River and east and west of the Shediac Yacht Club do not change from 2017 to 2018.
2018 Parlee Beach and Shediac Bay Watershed Water Quality Results Final Report
Project # TA1980803 | 3/22/2019 Page 18
3.0 Water Quality at Parlee Beach
3.1 Test Results In 2018, water samples were collected daily (unless hindered by weather), from the same five (5) stations spread out equidistant along the beach as prescribed in the 2017 Water Quality Monitoring Protocol, from May 22 to October 10.
For E. coli, there were no exceedances of the single-sample-maximum guideline value of 400 MPN/100ml or the geometric mean of 200 MPN/100ml during 2018.
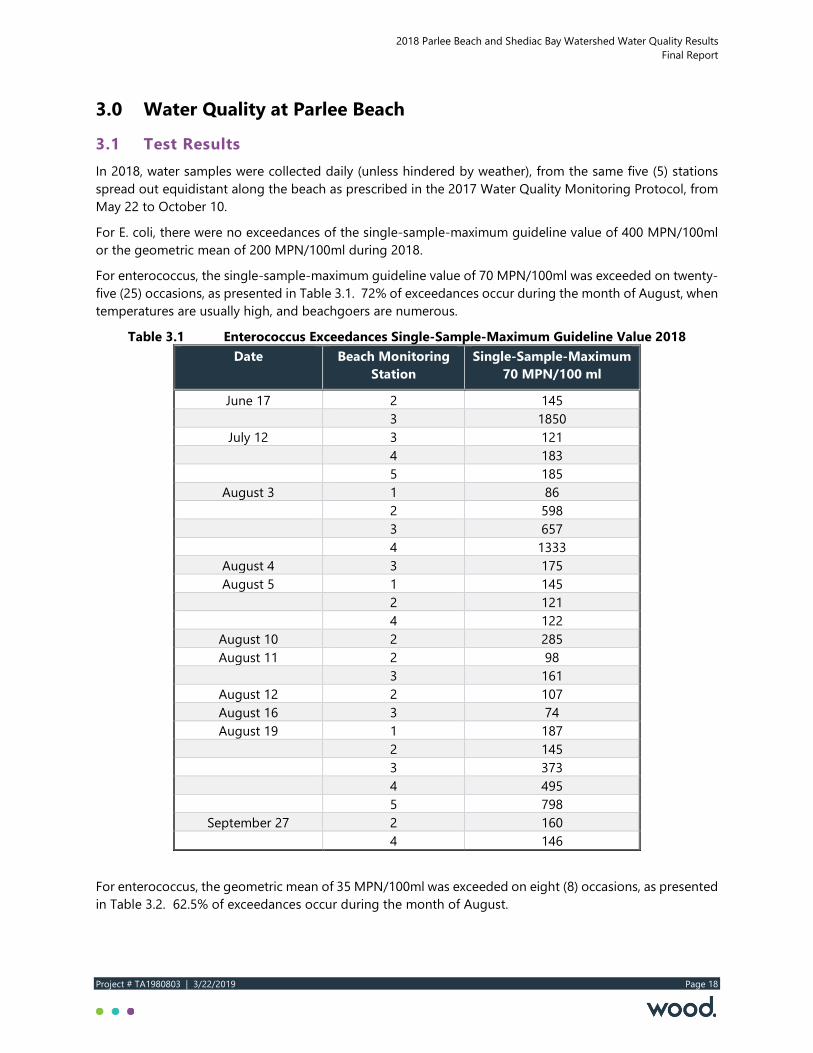
For enterococcus, the single-sample-maximum guideline value of 70 MPN/100ml was exceeded on twenty-five (25) occasions, as presented in Table 3.1. 72% of exceedances occur during the month of August, when temperatures are usually high, and beachgoers are numerous.
Table 3.1 Enterococcus Exceedances Single-Sample-Maximum Guideline Value 2018 Date Beach Monitoring
Station Single-Sample-Maximum
70 MPN/100 ml
June 17 2 145 3 1850
July 12 3 121 4 183 5 185
August 3 1 86 2 598 3 657 4 1333
August 4 3 175 August 5 1 145
2 121 4 122
August 10 2 285 August 11 2 98
3 161 August 12 2 107 August 16 3 74 August 19 1 187
2 145 3 373 4 495 5 798
September 27 2 160 4 146
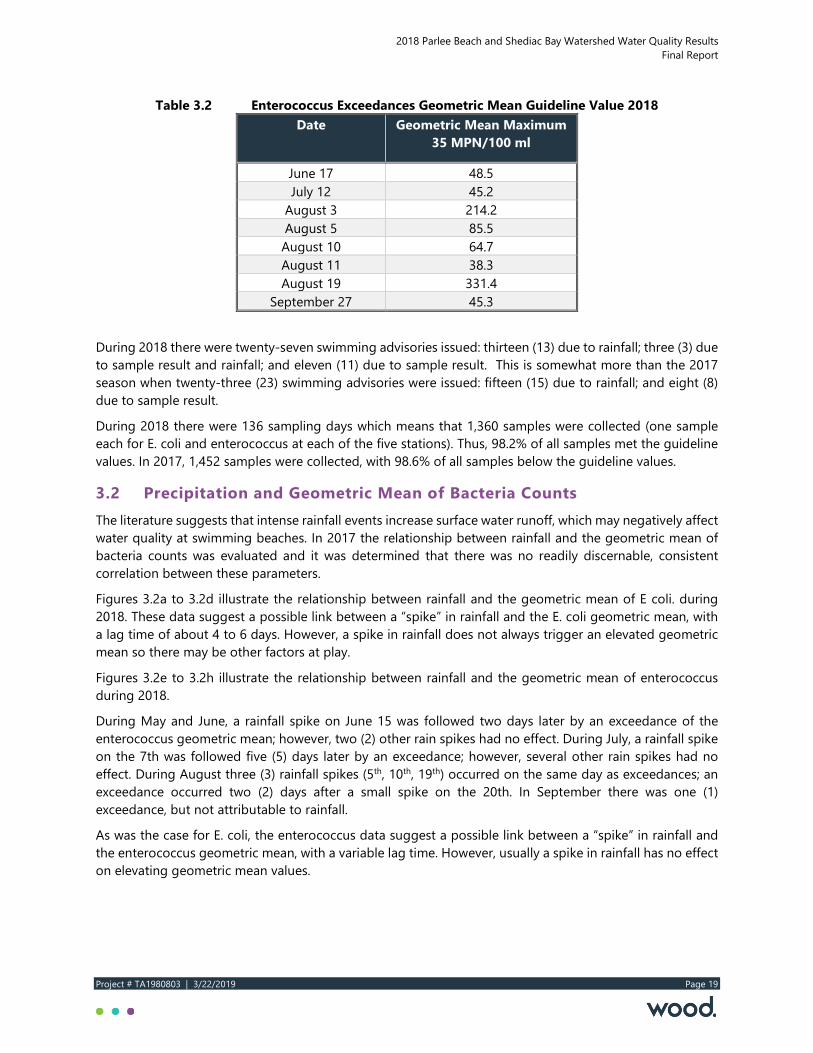
For enterococcus, the geometric mean of 35 MPN/100ml was exceeded on eight (8) occasions, as presented in Table 3.2. 62.5% of exceedances occur during the month of August.
2018 Parlee Beach and Shediac Bay Watershed Water Quality Results Final Report
Project # TA1980803 | 3/22/2019 Page 19
Table 3.2 Enterococcus Exceedances Geometric Mean Guideline Value 2018 Date Geometric Mean Maximum
35 MPN/100 ml
June 17 48.5 July 12 45.2
August 3 214.2 August 5 85.5 August 10 64.7 August 11 38.3 August 19 331.4
September 27 45.3
During 2018 there were twenty-seven swimming advisories issued: thirteen (13) due to rainfall; three (3) due to sample result and rainfall; and eleven (11) due to sample result. This is somewhat more than the 2017 season when twenty-three (23) swimming advisories were issued: fifteen (15) due to rainfall; and eight (8) due to sample result.
During 2018 there were 136 sampling days which means that 1,360 samples were collected (one sample each for E. coli and enterococcus at each of the five stations). Thus, 98.2% of all samples met the guideline values. In 2017, 1,452 samples were collected, with 98.6% of all samples below the guideline values.
3.2 Precipitation and Geometric Mean of Bacteria Counts The literature suggests that intense rainfall events increase surface water runoff, which may negatively affect water quality at swimming beaches. In 2017 the relationship between rainfall and the geometric mean of bacteria counts was evaluated and it was determined that there was no readily discernable, consistent correlation between these parameters.
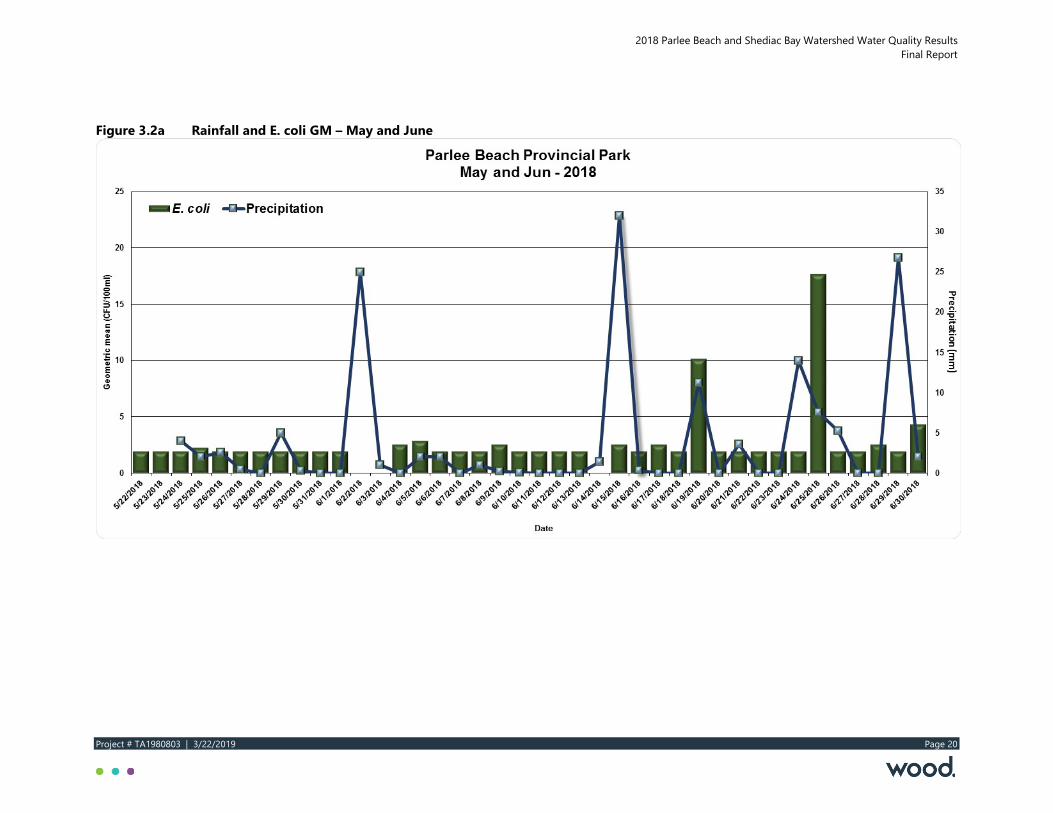
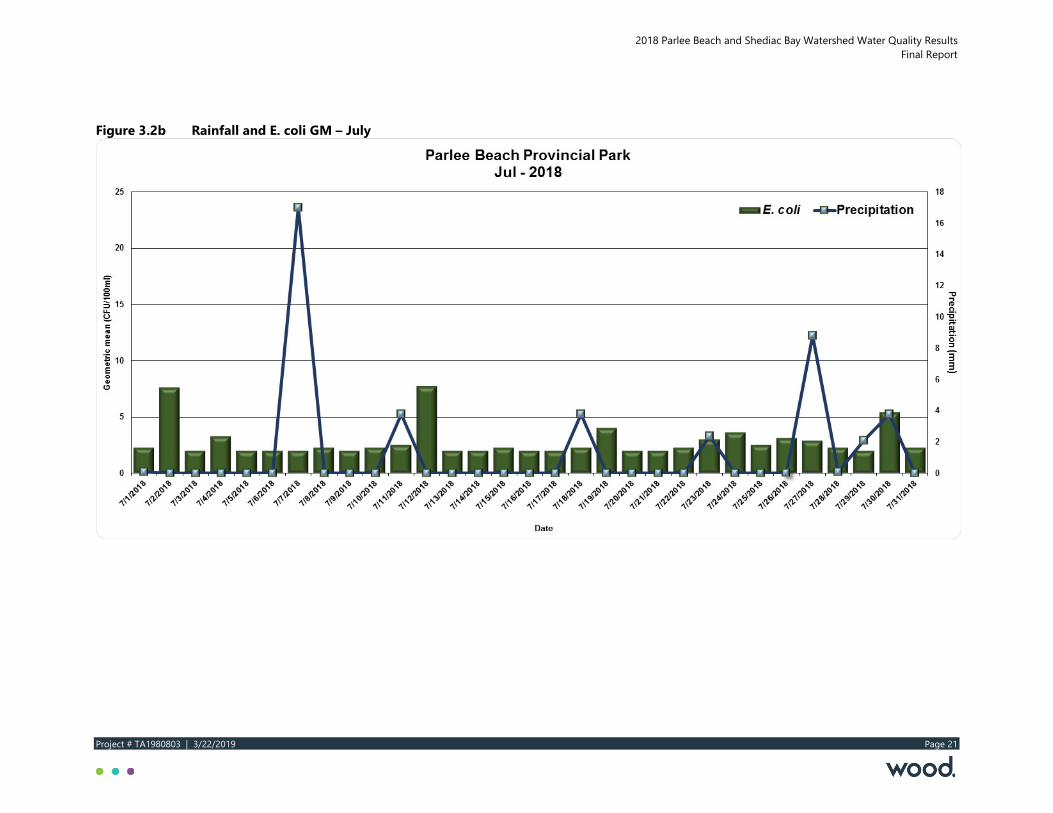
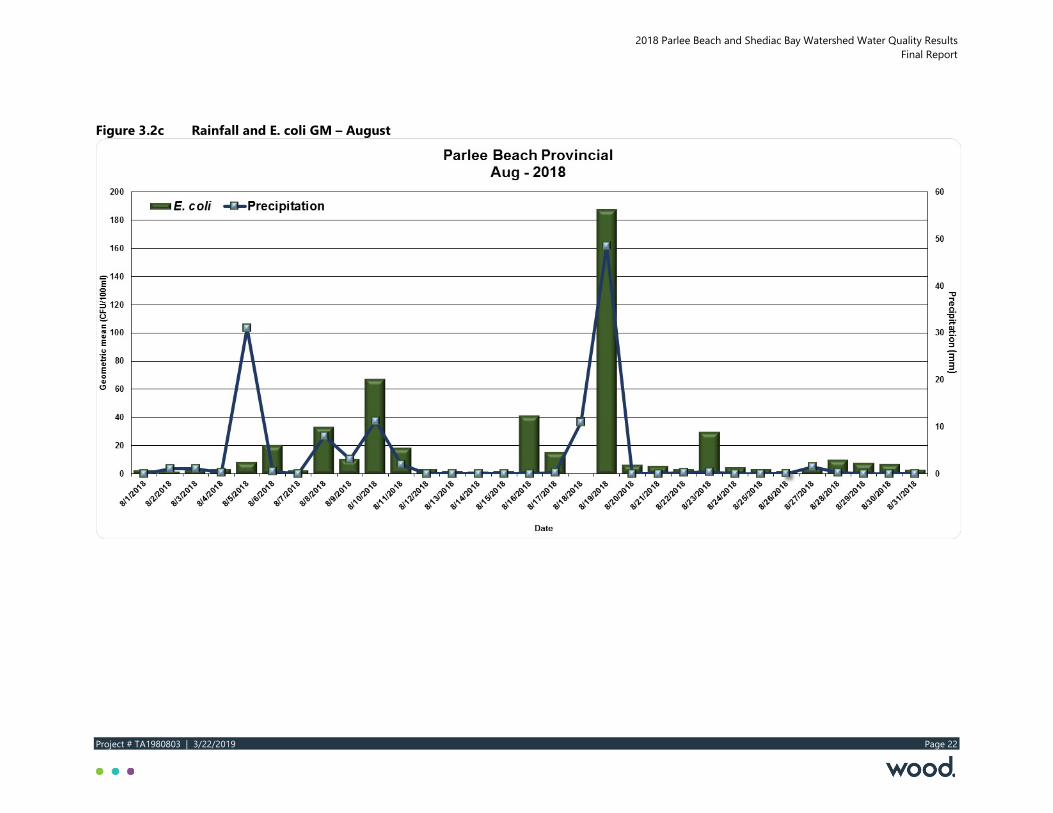
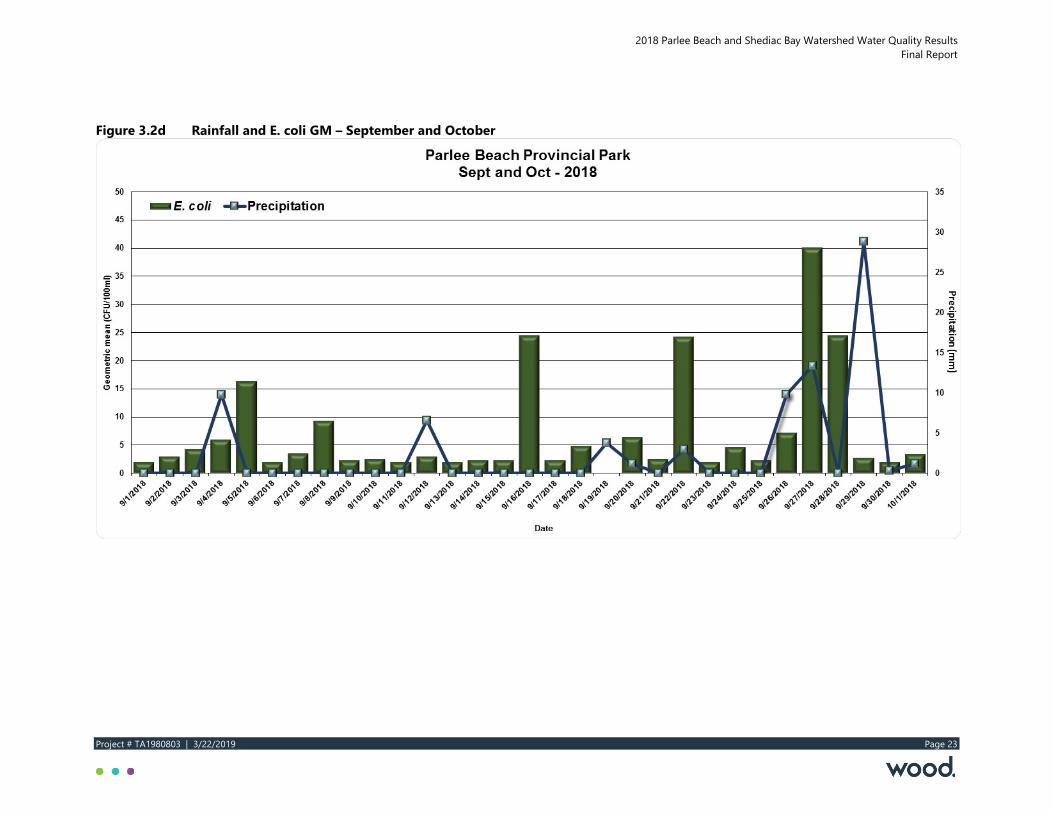
Figures 3.2a to 3.2d illustrate the relationship between rainfall and the geometric mean of E coli. during 2018. These data suggest a possible link between a “spike” in rainfall and the E. coli geometric mean, with a lag time of about 4 to 6 days. However, a spike in rainfall does not always trigger an elevated geometric mean so there may be other factors at play.
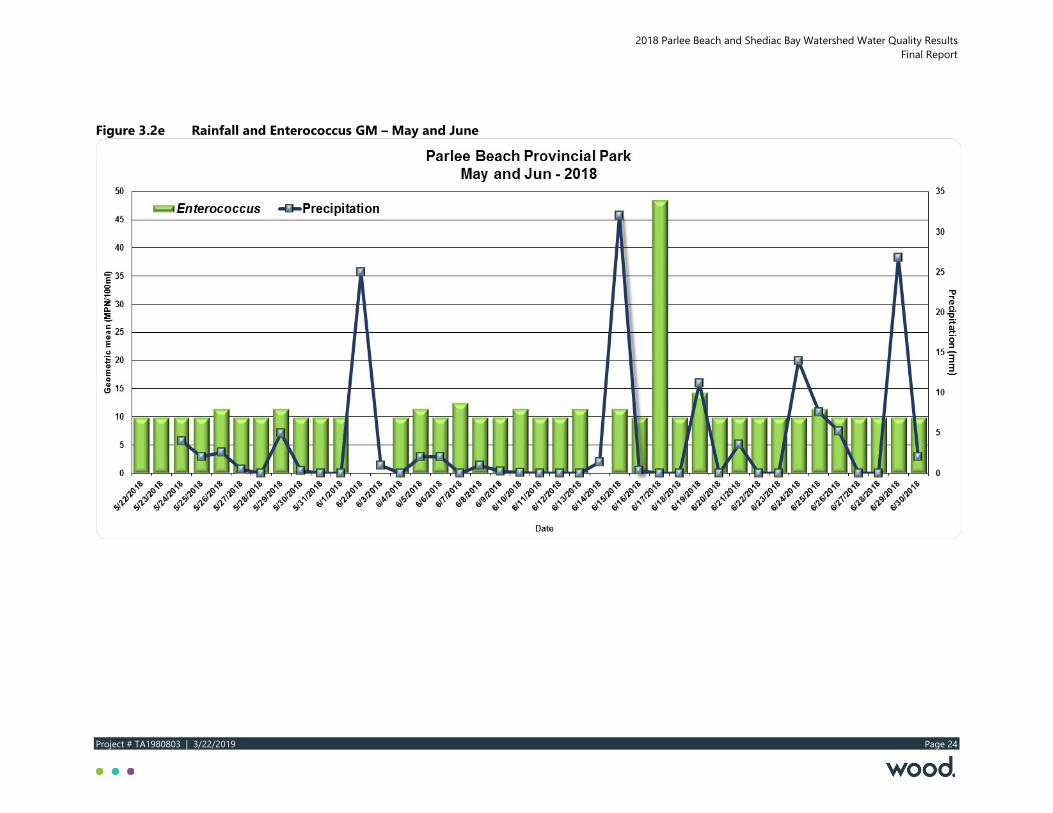
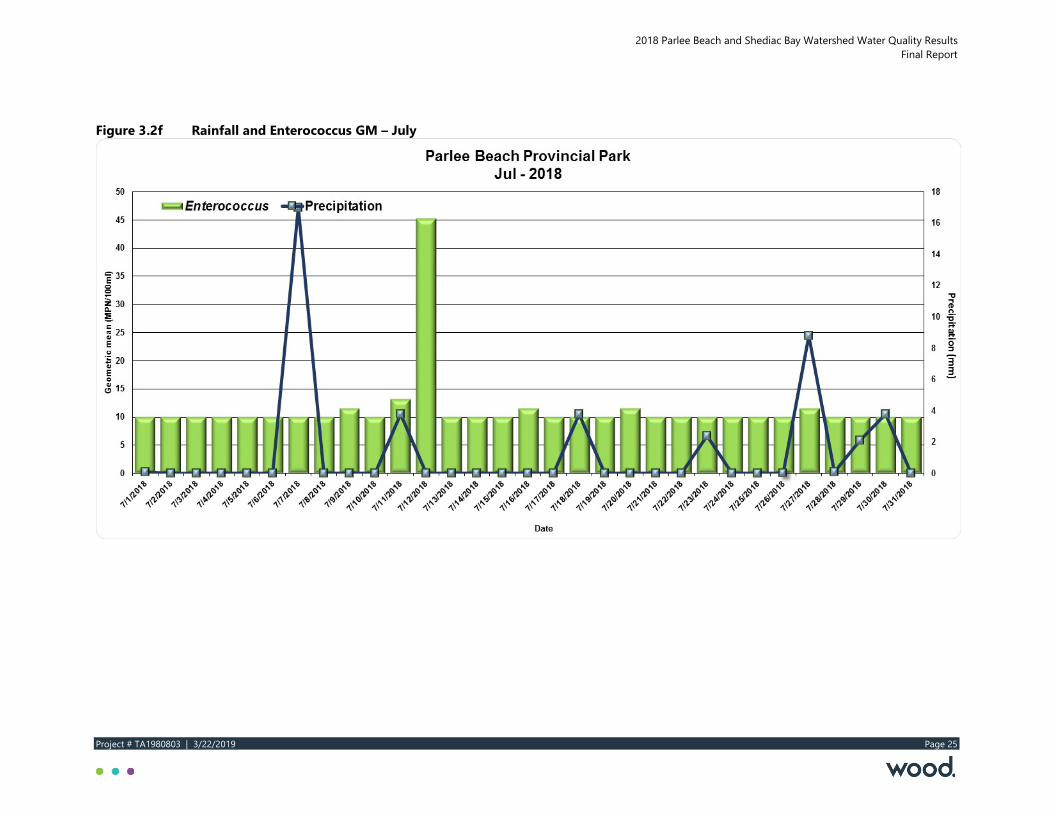
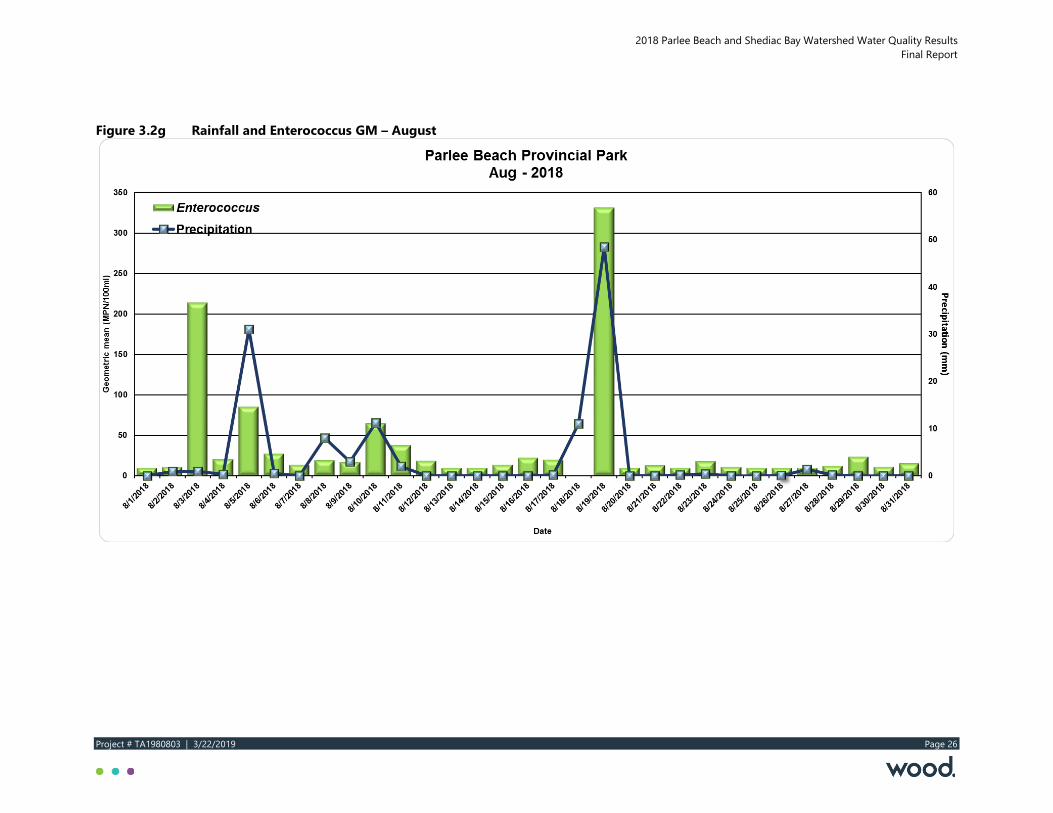
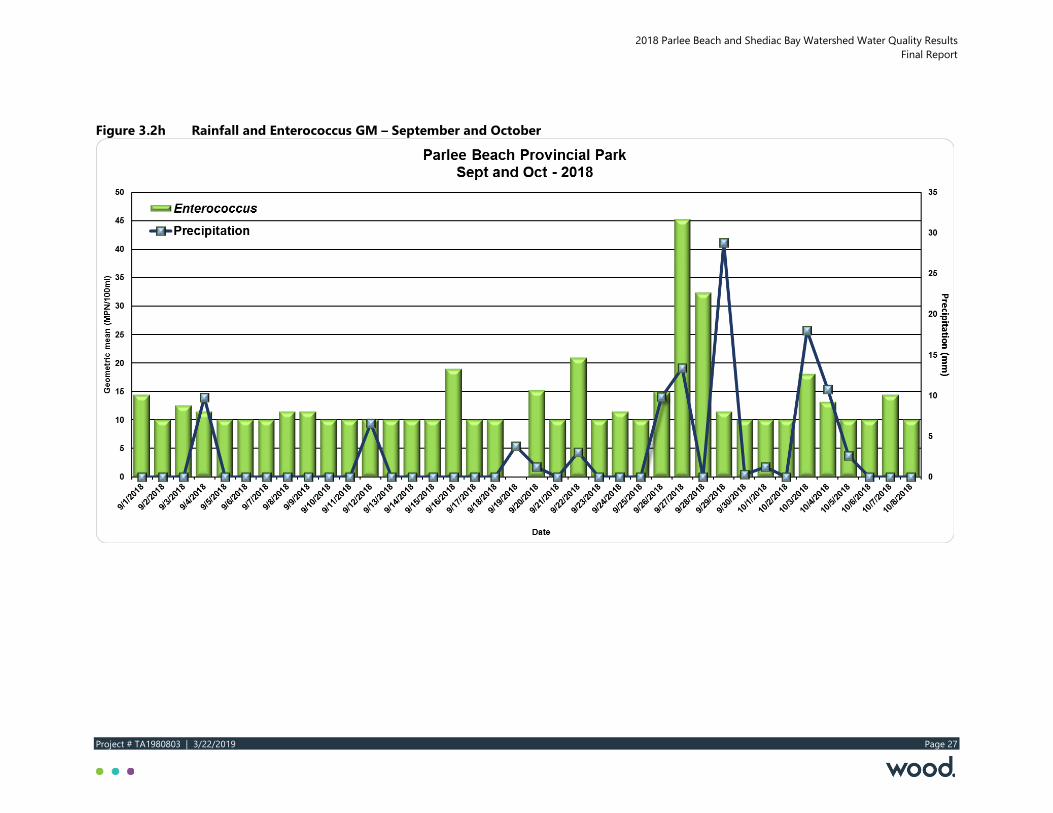
Figures 3.2e to 3.2h illustrate the relationship between rainfall and the geometric mean of enterococcus during 2018.
During May and June, a rainfall spike on June 15 was followed two days later by an exceedance of the enterococcus geometric mean; however, two (2) other rain spikes had no effect. During July, a rainfall spike on the 7th was followed five (5) days later by an exceedance; however, several other rain spikes had no effect. During August three (3) rainfall spikes (5th, 10th, 19th) occurred on the same day as exceedances; an exceedance occurred two (2) days after a small spike on the 20th. In September there was one (1) exceedance, but not attributable to rainfall.
As was the case for E. coli, the enterococcus data suggest a possible link between a “spike” in rainfall and the enterococcus geometric mean, with a variable lag time. However, usually a spike in rainfall has no effect on elevating geometric mean values.
2018 Parlee Beach and Shediac Bay Watershed Water Quality Results Final Report
Project # TA1980803 | 3/22/2019 Page 20
Figure 3.2a Rainfall and E. coli GM – May and June
2018 Parlee Beach and Shediac Bay Watershed Water Quality Results Final Report
Project # TA1980803 | 3/22/2019 Page 21
Figure 3.2b Rainfall and E. coli GM – July
2018 Parlee Beach and Shediac Bay Watershed Water Quality Results Final Report
Project # TA1980803 | 3/22/2019 Page 22
Figure 3.2c Rainfall and E. coli GM – August
2018 Parlee Beach and Shediac Bay Watershed Water Quality Results Final Report
Project # TA1980803 | 3/22/2019 Page 23
Figure 3.2d Rainfall and E. coli GM – September and October
2018 Parlee Beach and Shediac Bay Watershed Water Quality Results Final Report
Project # TA1980803 | 3/22/2019 Page 24
Figure 3.2e Rainfall and Enterococcus GM – May and June
2018 Parlee Beach and Shediac Bay Watershed Water Quality Results Final Report
Project # TA1980803 | 3/22/2019 Page 25
Figure 3.2f Rainfall and Enterococcus GM – July
2018 Parlee Beach and Shediac Bay Watershed Water Quality Results Final Report
Project # TA1980803 | 3/22/2019 Page 26
Figure 3.2g Rainfall and Enterococcus GM – August
2018 Parlee Beach and Shediac Bay Watershed Water Quality Results Final Report
Project # TA1980803 | 3/22/2019 Page 27
Figure 3.2h Rainfall and Enterococcus GM – September and October
2018 Parlee Beach and Shediac Bay Watershed Water Quality Results Final Report
Project # TA1980803 | 3/22/2019 Page 28
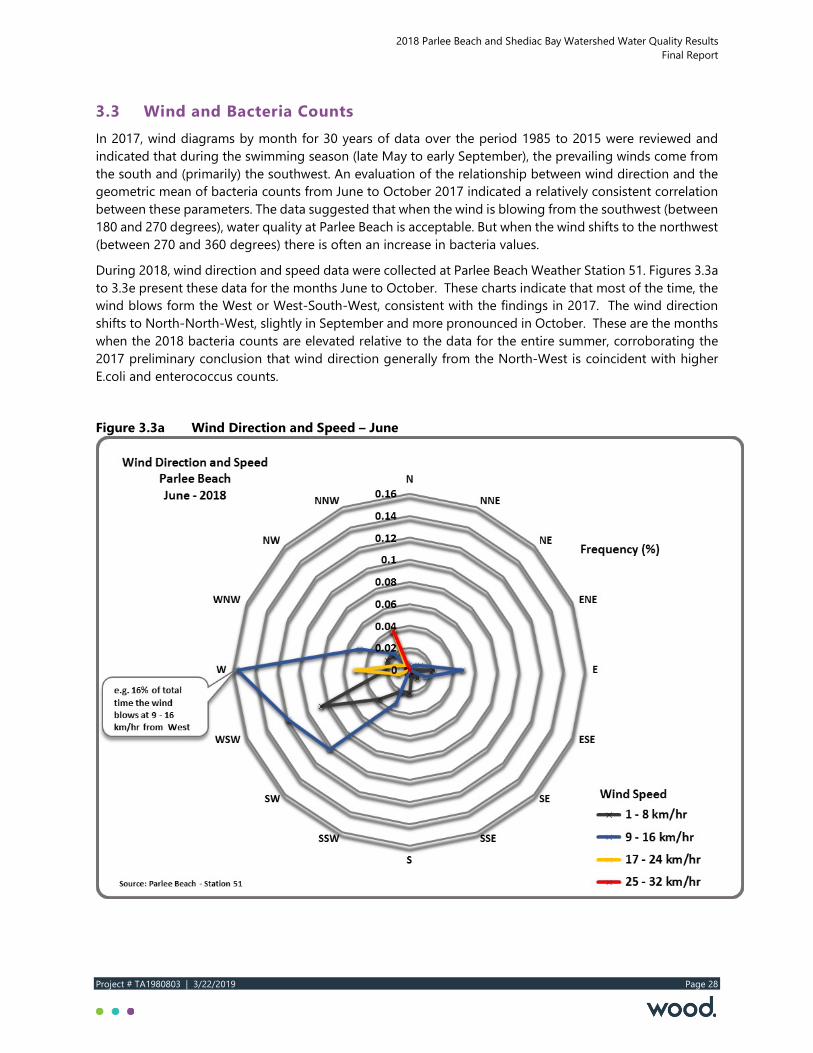
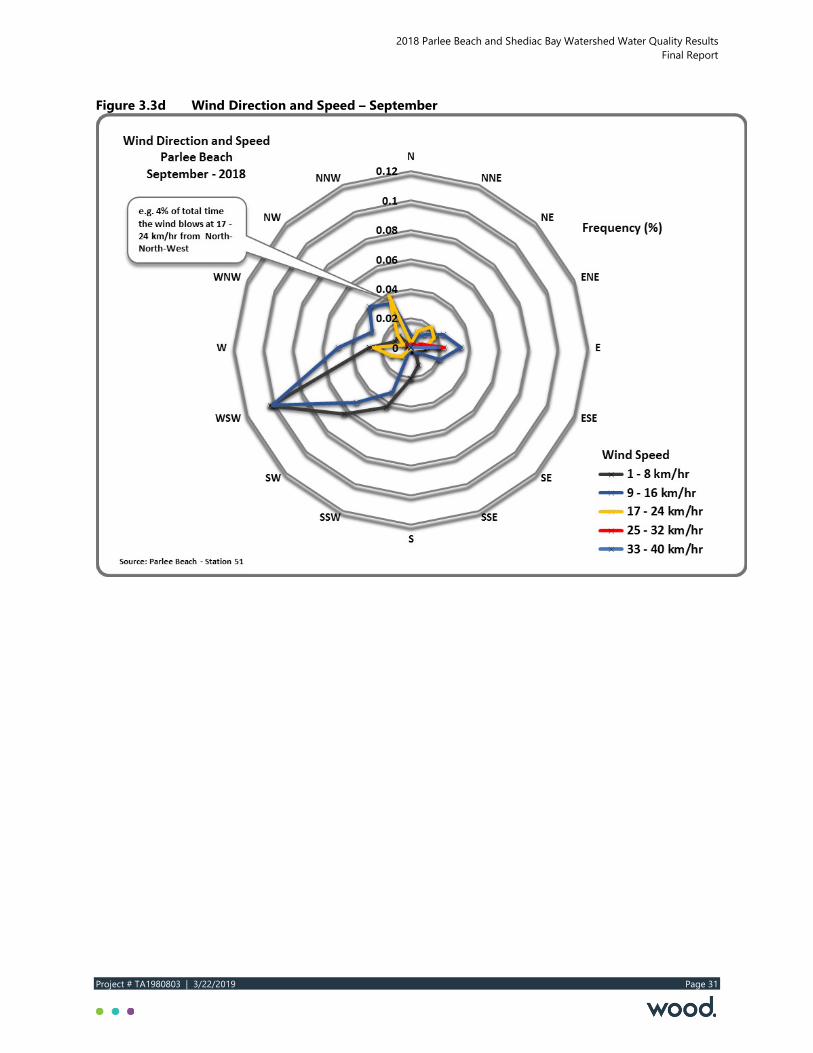
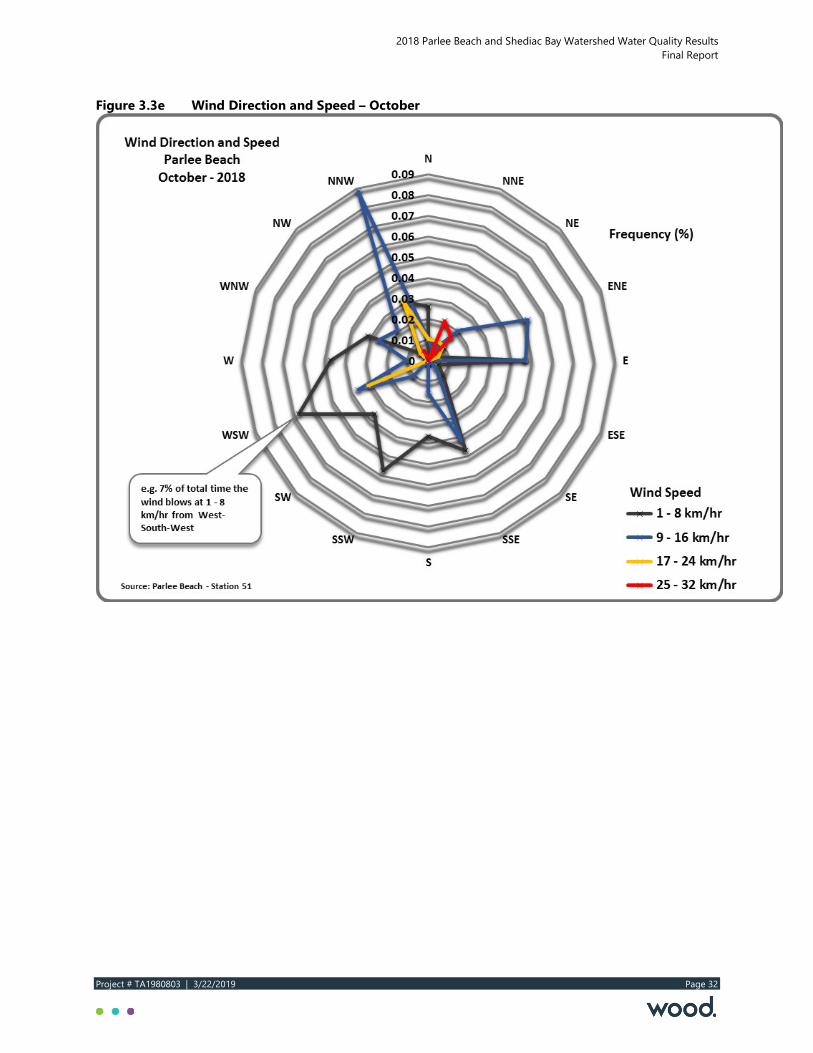
3.3 Wind and Bacteria Counts In 2017, wind diagrams by month for 30 years of data over the period 1985 to 2015 were reviewed and indicated that during the swimming season (late May to early September), the prevailing winds come from the south and (primarily) the southwest. An evaluation of the relationship between wind direction and the geometric mean of bacteria counts from June to October 2017 indicated a relatively consistent correlation between these parameters. The data suggested that when the wind is blowing from the southwest (between 180 and 270 degrees), water quality at Parlee Beach is acceptable. But when the wind shifts to the northwest (between 270 and 360 degrees) there is often an increase in bacteria values.
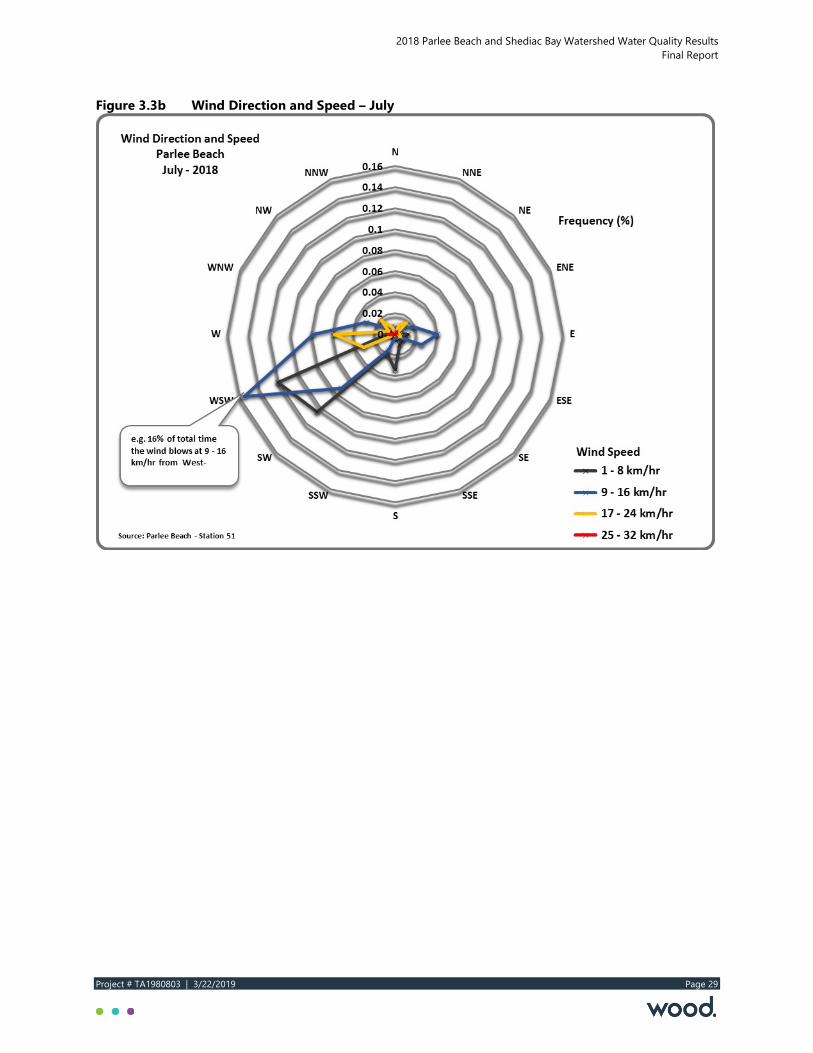
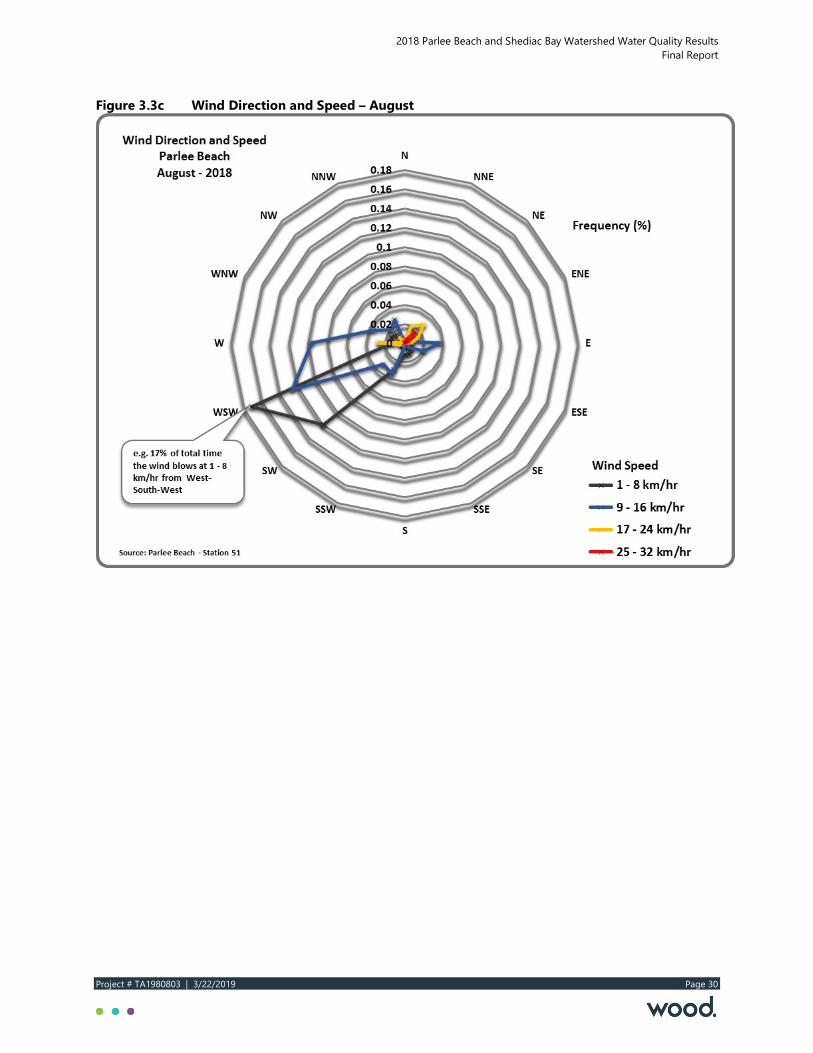
During 2018, wind direction and speed data were collected at Parlee Beach Weather Station 51. Figures 3.3a to 3.3e present these data for the months June to October. These charts indicate that most of the time, the wind blows form the West or West-South-West, consistent with the findings in 2017. The wind direction shifts to North-North-West, slightly in September and more pronounced in October. These are the months when the 2018 bacteria counts are elevated relative to the data for the entire summer, corroborating the 2017 preliminary conclusion that wind direction generally from the North-West is coincident with higher E.coli and enterococcus counts.
Figure 3.3a Wind Direction and Speed – June
2018 Parlee Beach and Shediac Bay Watershed Water Quality Results Final Report
Project # TA1980803 | 3/22/2019 Page 29
Figure 3.3b Wind Direction and Speed – July
2018 Parlee Beach and Shediac Bay Watershed Water Quality Results Final Report
Project # TA1980803 | 3/22/2019 Page 30
Figure 3.3c Wind Direction and Speed – August
2018 Parlee Beach and Shediac Bay Watershed Water Quality Results Final Report
Project # TA1980803 | 3/22/2019 Page 31
Figure 3.3d Wind Direction and Speed – September
2018 Parlee Beach and Shediac Bay Watershed Water Quality Results Final Report
Project # TA1980803 | 3/22/2019 Page 32
Figure 3.3e Wind Direction and Speed – October
2018 Parlee Beach and Shediac Bay Watershed Water Quality Results Final Report
Project # TA1980803 | 3/22/2019 Page 33
4.0 Conclusions Based on an assessment of the 2018 data and information, the conclusions of the 2017 Parlee Beach Water Quality Steering Committee remain valid. These conclusions, slightly rephrased, are as follows:
• Based on the samples collected in 2018, concentrations of E. coli and enterococcus in the waters of Shediac Bay and at Parlee Beach are generally lower than the values stated in the Guidelines for Canadian Recreational Water Quality.
• Based on the samples collected in 2018, high concentrations of E. coli and enterococcus have been identified throughout the Shediac Bay Watershed (the terrestrial basin which drains into Shediac Bay).
• The small agreement between precipitation and contaminant, and wind and contaminant suggests something else needs to be included in the analysis. Or, the analysis needs to be narrowed to specific highest source locations, as well as examine the source and pathway.
• There are different types of sources of bacteria distributed throughout the Shediac Bay Watershed. Based on the samples collected in 2018 it would appear reasonable to conclude that surface water run-off from agriculture and urban areas are the dominant sources.
• To improve water quality in the Shediac Bay Watershed and reduce “No Swimming Advisories”, at Parlee Beach, the bacteria sources which exist throughout the Watershed should be addressed.
5.0 Closing This report represents an interpretation and analysis of data collected in the Shediac Bay Watershed, and graphics prepared by the New Brunswick Department of Environment and Local Government. This document is intended to be a stand-alone report that provides a fulsome understanding of the water quality conditions in Shediac Bay and at Parlee Beach. The supporting data are available upon request.
Wood Environment & Infrastructure Solutions, a Division of Wood Canada Limited
Prepared by: Reviewed by:
Jacques Paynter, FEC, P.Eng., Principal Project Manager
Gil Violette Senior Associate Hydrogeologist