Embed Size (px)
Citation preview
.
TABLE OF CONTENTS EXECUTIVE SUMMARY 3
1. PARKING DATA COLLECTION 6 1.1 Objective of Parking Data Collection 6 1.2 Area of Study 6 1.3 Process of Collecting Data 6 1.4 Key Parking Performance Indicators 8
1.4.1 Parking Turnover 8 1.4.2 Average Length of Stay 8 1.4.3 Type of User (Visitor versus Non-Visitor) 8
1.5 Estimated Margin of Error 8 1.6 Results from Collection of Data 9
1.6.1 Parking Occupancy 9 1.6.2 Parking Turnover 12 1.6.3 Average Length of Stay 13 1.6.4 Type of User 14
1.7 Bear Street Parkade Comparison 14 1.8 Weather Comparison 15
2. EXISTING & FUTURE PARKING REQUIREMENTS 16 2.1 Peak Parking Demand 16 2.2 Practical Supply & Estimated Surplus/Deficiency 16 2.3 Current & Future Parking Surplus/Shortfall using assumptions from Bunt & Associates 2012 Transportation Master Plan 17
3. IMPROVEMENTS & RECOMMENDATIONS 18 3.1 Management of Recreational Vehicles (RV) Parking 18 3.2 Solutions to Lower Demand for Parking Spaces 18
3.2.1 Implementation Paid Parking Program 18 3.2.2 Implementation of Free Licence Plate Entry Time Limit Parking 18 3.2.3 Combination of Free and Pay Parking 19 3.2.4 Increase of Transit and Other Modes of Transportation 19 3.2.5 Stricter Enforcement of Infractions to Time Limit Parking 20 3.2.6 Increase the Supply – Build a Parking Structure 20
3.3 Implementation of a Resident Parking Permit Program 21 APPENDIX 22 2014 Week 1 and 2 Summary 2015 Week 1 and 2 Summary 2016 Week 1 and 2 Summary 2017 Week 1 and 2 Summary 2018 Week 1 and 2 Complete Data
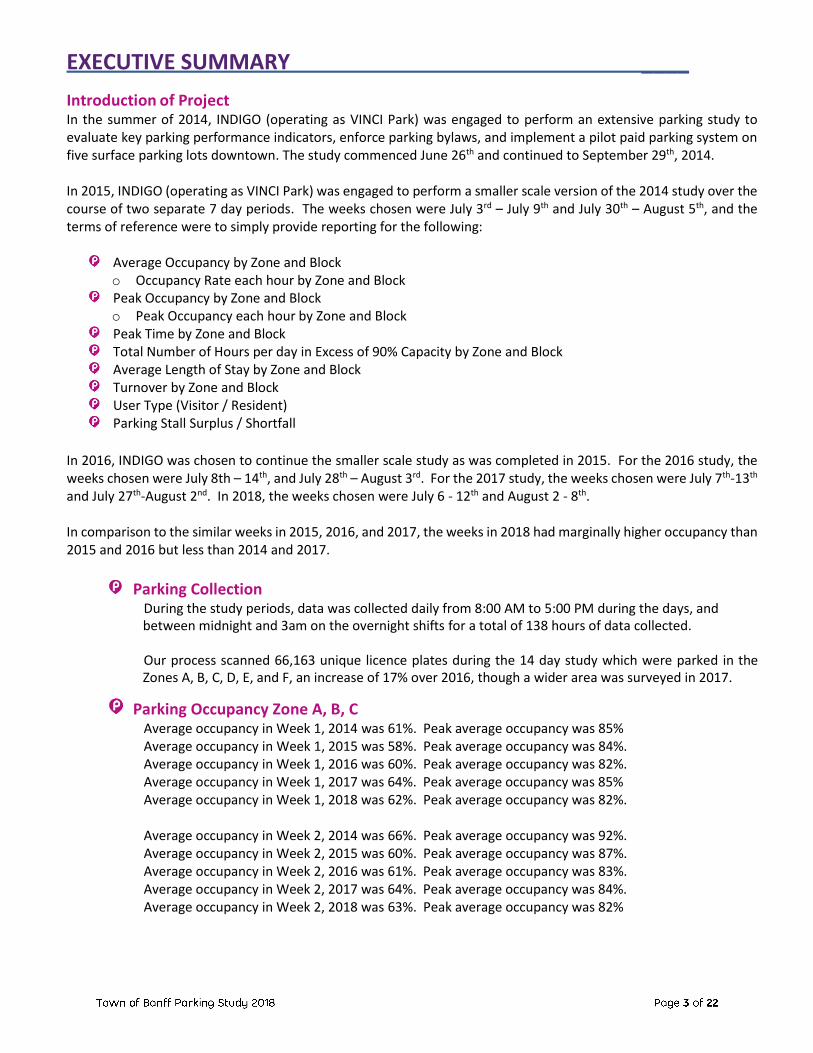
EXECUTIVE SUMMARY ____
Introduction of Project In the summer of 2014, INDIGO (operating as VINCI Park) was engaged to perform an extensive parking study to evaluate key parking performance indicators, enforce parking bylaws, and implement a pilot paid parking system on five surface parking lots downtown. The study commenced June 26th and continued to September 29th, 2014. In 2015, INDIGO (operating as VINCI Park) was engaged to perform a smaller scale version of the 2014 study over the course of two separate 7 day periods. The weeks chosen were July 3rd – July 9th and July 30th – August 5th, and the terms of reference were to simply provide reporting for the following:
Average Occupancy by Zone and Block o Occupancy Rate each hour by Zone and Block
Peak Occupancy by Zone and Block o Peak Occupancy each hour by Zone and Block
Peak Time by Zone and Block Total Number of Hours per day in Excess of 90% Capacity by Zone and Block Average Length of Stay by Zone and Block Turnover by Zone and Block User Type (Visitor / Resident) Parking Stall Surplus / Shortfall
In 2016, INDIGO was chosen to continue the smaller scale study as was completed in 2015. For the 2016 study, the weeks chosen were July 8th – 14th, and July 28th – August 3rd. For the 2017 study, the weeks chosen were July 7th-13th and July 27th-August 2nd. In 2018, the weeks chosen were July 6 - 12th and August 2 - 8th.
In comparison to the similar weeks in 2015, 2016, and 2017, the weeks in 2018 had marginally higher occupancy than 2015 and 2016 but less than 2014 and 2017.
Parking Collection During the study periods, data was collected daily from 8:00 AM to 5:00 PM during the days, and between midnight and 3am on the overnight shifts for a total of 138 hours of data collected.
Our process scanned 66,163 unique licence plates during the 14 day study which were parked in the Zones A, B, C, D, E, and F, an increase of 17% over 2016, though a wider area was surveyed in 2017.
Parking Occupancy Zone A, B, C
Average occupancy in Week 1, 2014 was 61%. Peak average occupancy was 85% Average occupancy in Week 1, 2015 was 58%. Peak average occupancy was 84%. Average occupancy in Week 1, 2016 was 60%. Peak average occupancy was 82%. Average occupancy in Week 1, 2017 was 64%. Peak average occupancy was 85% Average occupancy in Week 1, 2018 was 62%. Peak average occupancy was 82%.
Average occupancy in Week 2, 2014 was 66%. Peak average occupancy was 92%. Average occupancy in Week 2, 2015 was 60%. Peak average occupancy was 87%. Average occupancy in Week 2, 2016 was 61%. Peak average occupancy was 83%. Average occupancy in Week 2, 2017 was 64%. Peak average occupancy was 84%. Average occupancy in Week 2, 2018 was 63%. Peak average occupancy was 82%
Peak Time Between the hours of 1:00 PM and 2:00 PM in all five years.
Number of Hours Exceeding 90% On average, with all zones combined together, overall parking spaces did not exceed 90% capacity during the study period in 2015-2018. In 2014, Week 2, two hours exceeded 90%.
Parking Turnover Zones A, B, C Average turnover in Week 1, 2014 was 3.19. Average turnover in Week 1, 2015 was 2.80. Average turnover in Week 1, 2016 was 2.80. Average turnover in Week 1, 2017 was 3.03. Average turnover in Week 1, 2018 was 2.99. Average turnover in Week 2, 2014 was 3.16. Average turnover in Week 2, 2015 was 2.88.
Average turnover in Week 2, 2016 was 2.88. Average turnover in Week 2, 2017 was 3.03. Average turnover in Week 2, 2018 was 2.96.
Average Length of Stay Zones A, B, C Average length of stay in Week 1, 2014 was 113 minutes. Average length of stay in Week 1, 2015 was 104 minutes. Average length of stay in Week 1, 2016 was 109 minutes. Average length of stay in Week 1, 2017 was 113 minutes. Average length of stay in Week 1, 2018 was 110 minutes.
Average length of stay in Week 2, 2014 was 110 minutes. Average length of stay in Week 2, 2015 was 96 minutes. Average length of stay in Week 2, 2016 was 107 minutes.
Average length of stay in Week 2, 2017 was 117 minutes. Average length of stay in Week 2, 2018 was 115 minutes.
Parking Surplus or Deficiency Zones A, B, C Based on a target of 95% occupancy as set by INDIGO:
In Week 1, 2014 there was an average peak surplus of 158 parking spaces.
In Week 1, 2015 there was an average peak surplus of 174 parking spaces.
In Week 1, 2016 there was an average peak surplus of 205 parking spaces.
In Week 1, 2017 there was an average peak surplus of 158 parking spaces.
In Week 1, 2018 there was an average peak surplus of 132 parking spaces.
In Week 2, 2014 there was an average peak surplus of 47 parking spaces.
In Week 2, 2015 there was an average peak surplus of 127 parking spaces.
In Week 2, 2016 there was an average peak surplus of 190 parking spaces.
In Week 2, 2017 there was an average peak surplus of 174 parking spaces.
In Week 2, 2018 there was an average peak surplus of 150 parking spaces.
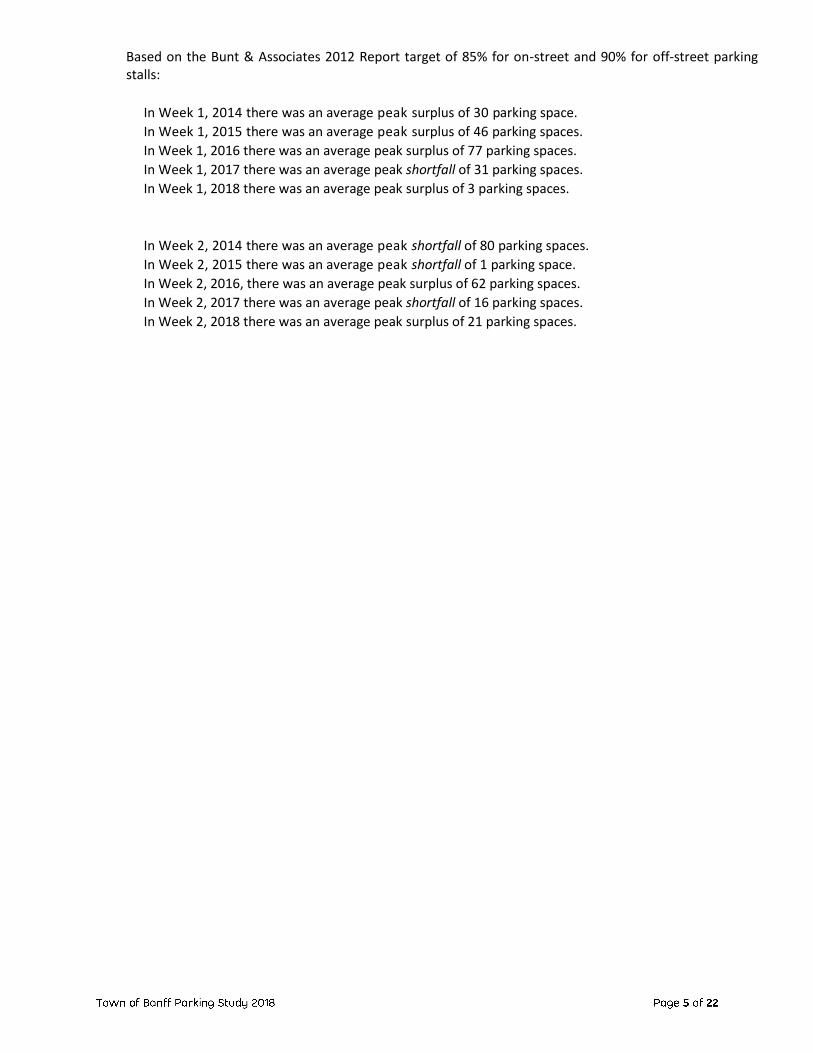
Based on the Bunt & Associates 2012 Report target of 85% for on-street and 90% for off-street parking stalls:
In Week 1, 2014 there was an average peak surplus of 30 parking space.
In Week 1, 2015 there was an average peak surplus of 46 parking spaces.
In Week 1, 2016 there was an average peak surplus of 77 parking spaces.
In Week 1, 2017 there was an average peak shortfall of 31 parking spaces.
In Week 1, 2018 there was an average peak surplus of 3 parking spaces.
In Week 2, 2014 there was an average peak shortfall of 80 parking spaces.
In Week 2, 2015 there was an average peak shortfall of 1 parking space.
In Week 2, 2016, there was an average peak surplus of 62 parking spaces.
In Week 2, 2017 there was an average peak shortfall of 16 parking spaces.
In Week 2, 2018 there was an average peak surplus of 21 parking spaces.
1. PARKING DATA COLLECTION
1.1 Objective of Parking Data Collection As there is a perception of a shortage of parking, especially during the summer months, it was
essential that a thorough parking study be performed in order to obtain current parking related data.
The data obtained can be used by the Town of Banff administration in order to recommend future
solutions and improvements to Town Council in order to formulate and plan to alleviate traffic
and parking congestion and to plan for future growth of economic activity in the Town of Banff.
The parking study was carried out on a daily basis from July 6 - 12, 2018 and August 2 - 8, 2018. Data
presented in this report is being compared to similar weeks in 2014 (June 30 – July 6, & July 28 –
August 3), 2015 (July 3 – 9 & July 28 – August 3), 2016 (July 28 - August 3), and 2017 (July 7 – 13 &
July 27 – August 2)
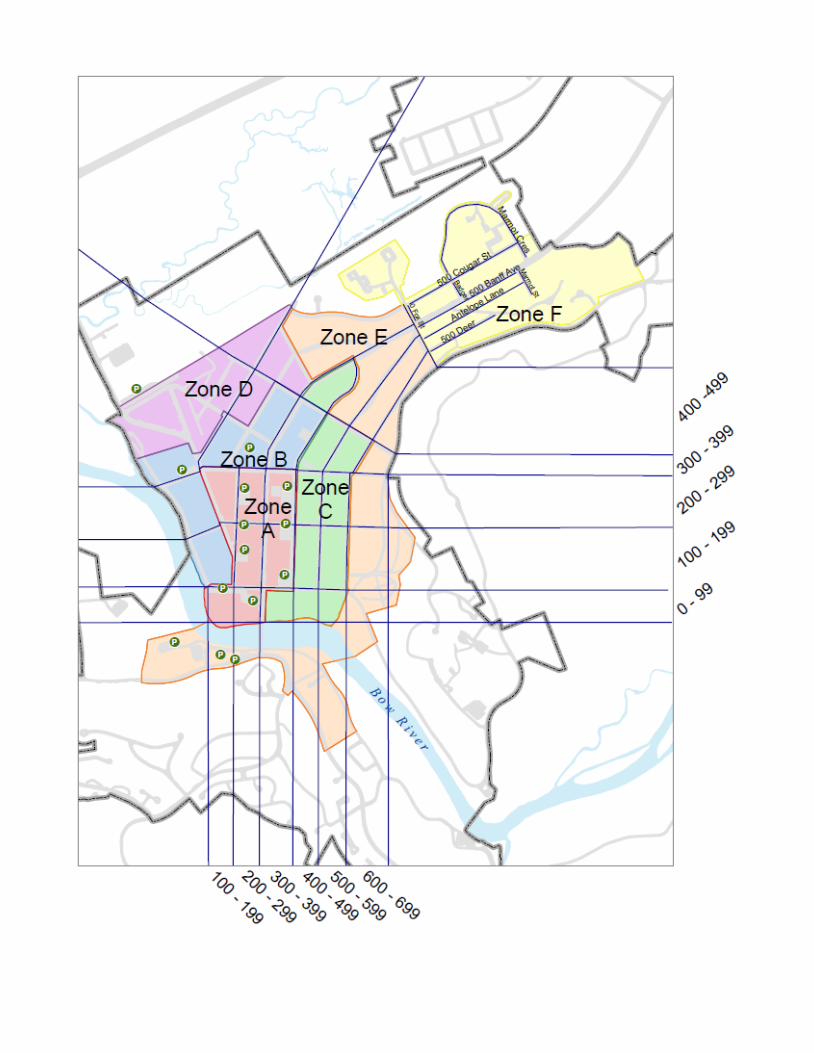
1.2 Area of Study As directed by the Town of Banff we focused our parking data collection services to the areas known
as Zone A, Zone B, and Zone C. The data we collected was an in-depth study of each street block
within each zone. We summarized each street by location as it referenced to each zone. We also
summarized within each zone the on-street and off-street locations. Finally we summarized the total
of all parking in each zone as well as zones A, B, and C together. Zones A, B, and C were inspected
daily. Zones C, D, E, and F were selected for spot checks of on-street occupancy on select Wednesday
and Saturday early morning periods as well to try and gauge local parking habits.
Refer to Page 7 for map of study areas.
1.3 Process of Collecting Data
We utilized two methods to collect all the parking related data for this project. These two methods are as follows:
a. Mobile LPR Vehicle Driver – We deployed a license plate recognition camera technology mounted to a vehicle that was utilized for the collection of data for all on- street parking spaces. The route the vehicle took approximately 45 to 60 minutes depending on traffic. The license plate scanned each vehicles license plate and stored this information in a database. Then the data collected was analyzed to ascertain the key parking performance indicators as described in the following sections.
b. Manually – We performed a physical count methodology to record license plates. This was deployed on most of the surface parking lots. The route took approximately 45 to 60 minutes depending on how busy each parking lot was at the time of the data being collected. This information was uploaded into the same database used for the mobile LPR system.
1.4 Key Parking Performance Indicators
All the data collected during this period of time was analyzed for the following key parking
performance indicators:
Occupancy Parking Turnover Average Length of Stay Type of User (Visitor or Non-visitor)
1.4.1 Parking Turnover Parking Turnover is defined as the estimated number of vehicles that use each parking stall
throughout a period of time. The period of time we used was between the hours of 8:00 am
– 5:00 pm. Parking turnover is calculated by counting the number of vehicles observed in a
given time frame, and dividing by the number of parking spaces in the facility.
1.4.2 Average Length of Stay Average Length of Stay is defined as the estimated duration of time a vehicle utilizes a parking
space. As we visit each area approximately once per hour, it is not possible to obtain precise
time of stay, but rather a range.
1.4.3 Type of User (Visitor versus Non-Visitor) We attempted to identify each vehicle by type of user. We categorized the type of user in two groups
as visitors and non-visitors. Visitors are all those coming to Banff on vacation or a leisure day trip. A
non-visitor would be a resident, commuter, or someone otherwise working in Banff. This was
a challenge so we had to resort to several assumptions. As a result the margin of error is much higher
for this data collected.
1.5 Estimated Margin of Error With any parking study or collection of data there will be a margin of error. This is caused by the
systems implemented. The system that we implemented was the most efficient and effective system
in order to retrieve as much data as possible.
Some of the results that cause this margin of error are the inaccuracy of the vehicles circulating and
performing vehicle counts on an hourly basis. Vehicles could come and go between visits creating a
margin of error. In addition to the timing of the visits the reliability of the effectiveness of capturing
and reading of vehicle license plate by the mobile LPR system can be vulnerable. For example, some
very dirty or damaged license plates are not read effectively. Also vehicles parked illegally in no
parking zones could be recorded. In any event we have estimated the margin of errors to be as
follows:
Occupancy: +/- 2% - 5% Turnover: +/- 0.10 – 0.15 Average Length of Stay: +/- 20 - 30 minutes
Type of User: +/- 10% - 25%
1.6 Results from Collection of Data We have provided the raw data in chart form from the Parking Collection study, excluding the Cascade Parkade which was not studied, and will summarize our findings as follows:
a. 2014 User Paid Pilot Parking Locations b. ZONE A - Off-Street Locations c. ZONE A – On-Street Parking d. ZONE A – Total of all Parking e. ZONE B – Off-Street Locations f. ZONE B – On-Street Parking g. ZONE B – Total of all Parking h. ZONE C – Total of all Parking i. ZONE A, B, C – Sum of all Parking
1.6.1 Parking Occupancy Parking Occupancy is defined as a percentage of the number of occupied parking spaces at
any given time during the day. When evaluating any parking operation we use either the
average or peak occupancy to determine the demand for any parking facility. For this parking
study we collected the following occupancy statistics:
1. Average Occupancy by Hour, Day, & Week 2. Peak Occupancy & Peak Time of Day 3. Number of Hours Occupancy exceeded 90%
Five year charts begin on the following page.
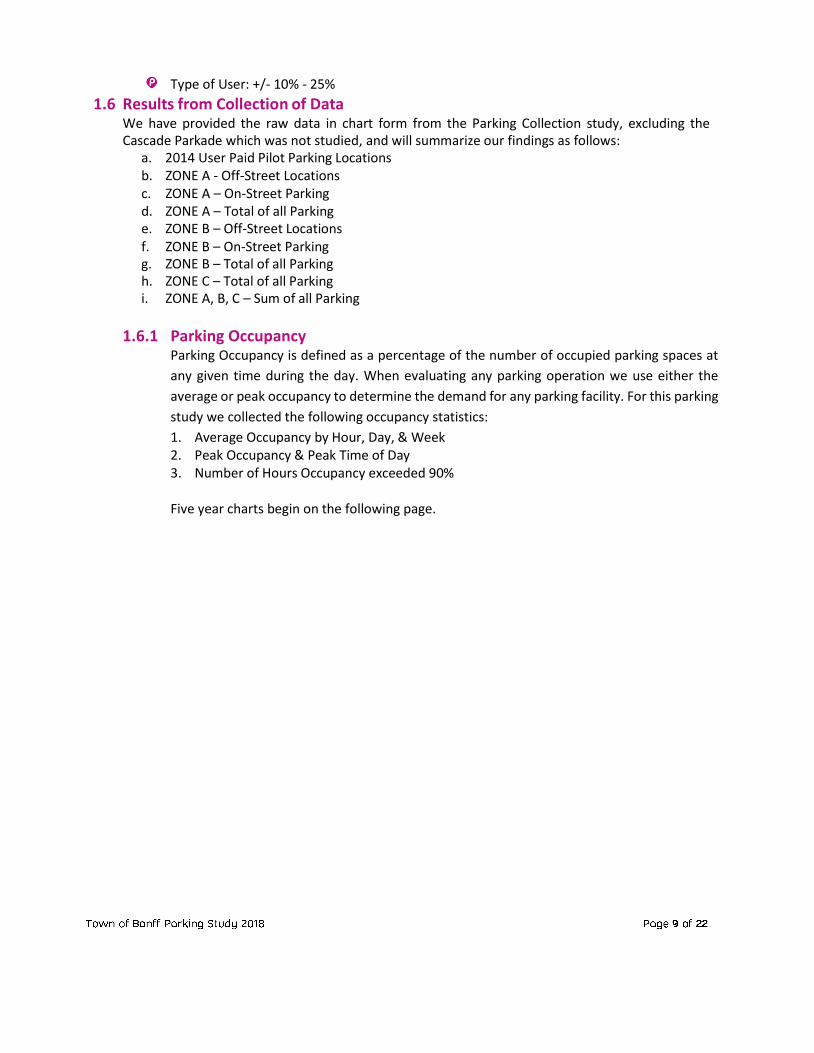
PARKING OCCUPANCY
2014 Week 1
2015 Week 1
2016 Week 1
2017 Week 1
2018 Week 1
2014 Week 2
2015 Week 2
2016 Week 2
2017 Week 2
2018 Week 2
June 30 - July 6
July 3 - 9 July 8 - 14 July 7 - 13 July 6 - 12 July 28- Aug3 (Pay Parking)
July 30 – August 5
July 28 – August 3
July 27 – August 2
Aug 2 - 8
User Paid Pilot (2014)
Avg (%)
Hrs => 90%
71% 71% 64% 68% 57% 71% 70% 64% 63% 60% 20 22 4 12 0 28 20 12 14 4
Zone A On-Street Avg (%)
Peak Peak (Time)
Hrs => 90%
70% 75% 71% 72% 72% 77% 71% 70% 73% 72% 91% 98% 91% 92% 95% 100% 92% 92% 92% 94%
12:55 14:00 14:00 16:00 14:00 14:00 13:00 14:00 14:00 14:00 4 13 4 6 7 15 3 3 4 14
Zone A Off-Street Avg (%)
Peak Peak (Time) Hrs => 90%
69% 61% 61% 65% 60% 65% 66% 64% 64% 59% 100% 97% 92% 96% 91% 100% 99% 92% 94% 86% 14:00 15:00 13:00 13:00 13:00 15:00 14:00 13:00
14:00 14:00
5 6 1 8 1 4 13 4 8 0
Zone A Total Avg (%)
Peak Peak (Time) Hrs => 90%
65% 66% 64% 67% 64% 68% 68% 66% 67% 63% 95% 95% 89% 92% 90% 98% 95% 91% 91% 87%
14:00 15:00 13:00 13:00 13:00 15:00 14:00 13:00 14:00 14:00 4 3 1 3 1 5 8 2 3 0
Zone B On-Street Avg (%)
Peak Peak (Time)
Hrs => 90%
46% 45% 52% 58% 57% 62% 49% 53% 58% 58% 67% 100% 78% 84% 81% 89% 76% 76% 82% 81% 13:10 14:00 14:00 13:00 14:00 14:00 14:00 14:00 14:00 15:00
0 1 0 0 0 2 0 0 0 0
Zone B Off-Street Avg (%)
Peak Peak (Time) Hrs => 90%
76% 65% 76% 79% 73% 82% 77% 79% 79% 73% 100% 100% 100% 100% 100% 100% 100% 100% 100% 100% 13:00 14:00 14:00 15:00 13:00 14:00 13:00 11:00 11:00 13:00
25 28 33 30 24 28 25 38 45 28
Zone B Total Avg (%)
Peak Peak (Time)
Hrs => 90%
50% 48% 54% 60% 58% 66% 51% 56% 60% 59% 78% 100% 80% 85% 80% 90% 76% 78% 82% 82%
13:00 14:00 14:00 13:00 14:00 14:00 14:00 14:00
14:00 15:00 0 1 0 0 0 4 0 0 0 0
Zone C Total
Avg (%)
Peak Peak (Time) Hrs => 90%
50% 59% 56% 62% 62% 60% 54% 56% 63% 65% 90% 100% 77% 79% 79% 86% 82% 81% 80% 82%
12:36 14:00 14:00 14:00 14:00 14:00 14:00 14:00 16:00 14:00 0 4 0 0 0 0 0 0 0 0
Zone A, B, C Total
Avg (%)
Peak Peak (Time) Hrs => 90%
58% 60% 60% 64% 62% 66% 60% 61% 64% 63% 84% 85% 82% 85% 82% 92% 87% 83% 84% 82%
14:00 14:00 14:00 13:00 13:00 14:00 14:00 14:00 14:00 14:00
0 0 0 0 0 2 0 0 0 0
Overall in 2018, Zone A, B and C combined had 0.5% higher average occupancy, than 2017. Peak Time was between 13:00 and 14:00. The 2014 user pay lots increased 11% in Week 1, and dropped 3% in Week 2 compared to 2017. INDIGO believes that the digital signage advertising parking spaces places a role in the lower occupancy of the lots. It is recommended to ensure the counters are properly calibrated so that it accurately reflects the actual stalls available in the lot. Overall in 2018, there was at no time where the town of Banff experienced greater than 90% occupancy in Zones A, B and C combined. Zone A on and off street, as well as Zone B off-street did achieve greater than 90% peak occupancy however.
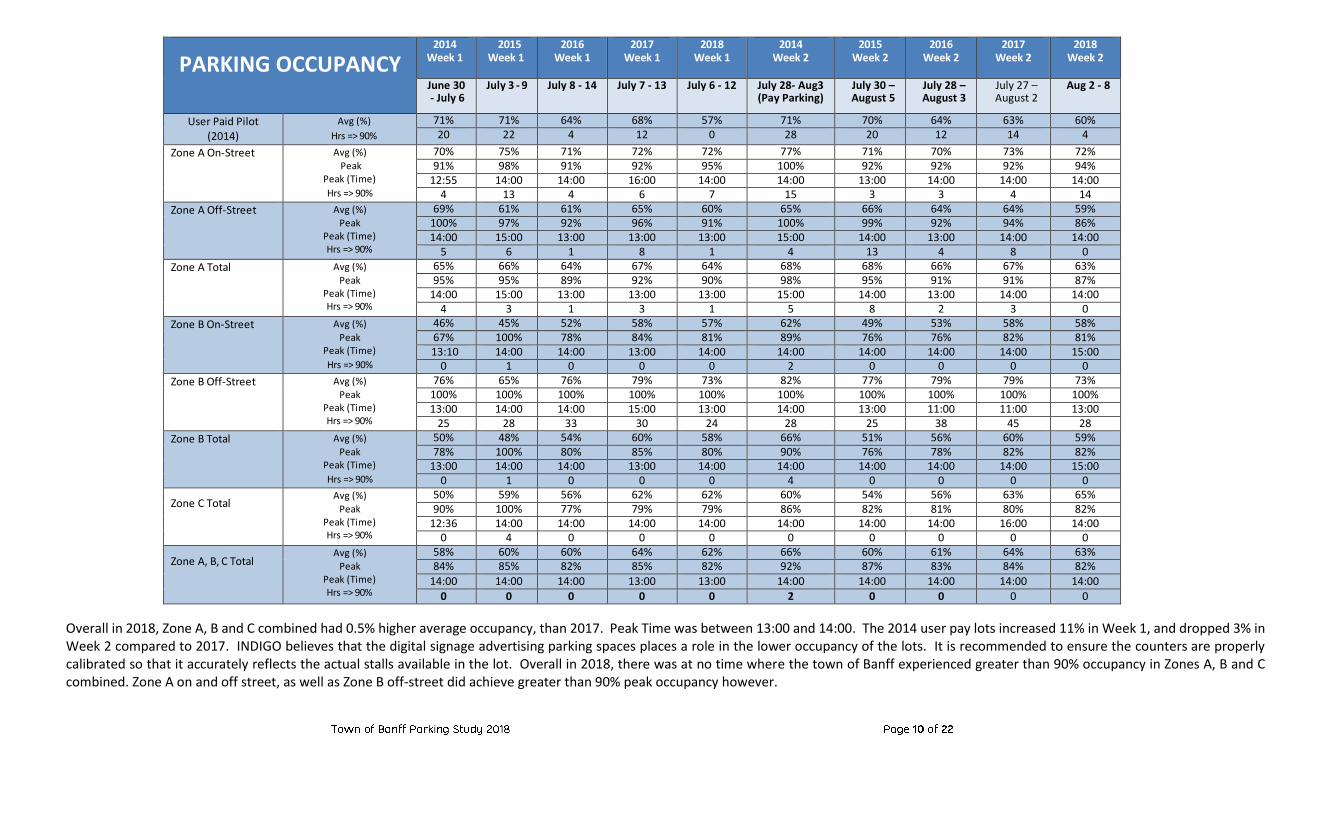
Average Occupancy
by Hour & Zone
Time of
Day
2014 Week 1
2015 Week 1
2016 Week 1
2017 Week 1
2018 Week 1
2014 Week 2
2015 Week 2
2016 Week 2
2017 Week 2
2018 Week 2
June 30 – July 6
July 3 - 9 July 8 - 14 July 7 - 13 July 6 – 12 July 28 – Aug 3 (Pay Parking)
July 30 – August 5
July 28 – August 3
July 27 – August 2
August 2 - 8
Zone A 8AM 34% 27% 24% 26% 28% 34% 24% 26% 28% 26% 9AM 38% 41% 38% 41% 41% 46% 38% 38% 37% 39%
10AM 49% 53% 52% 57% 53% 54% 54% 52% 53% 51% 11AM 66% 69% 66% 72% 64% 63% 69% 68% 69% 66% 12AM 74% 78% 80% 82% 73% 77% 79% 81% 81% 73% 1PM 79% 83% 82% 87% 78% 81% 88% 86% 82% 76% 2PM 85% 84% 82% 83% 77% 85% 90% 83% 83% 81% 3PM 84% 82% 77% 78% 76% 86% 85% 81% 81% 78% 4PM 79% 74% 75% 78% 75% 81% 79% 75% 83% 76% 5PM 73% 64% 66% 69% 66% 74% 70% 69% 74% 65%
Average 66% 65% 64% 67% 63% 68% 68% 66% 67% 63% Zone B 8AM 18% 28% 26% 31% 32% 47% 27% 22% 34% 32%
9AM 31% 39% 37% 44% 41% 41% 35% 39% 42% 40% 10AM 37% 46% 48% 49% 47% 42% 41% 44% 50% 46% 11AM 44% 49% 58% 61% 60% 65% 54% 57% 62% 60% 12AM 62% 55% 62% 67% 64% 75% 60% 67% 64% 69% 1PM 60% 59% 68% 75% 68% 80% 66% 68% 69% 71% 2PM 67% 57% 69% 72% 70% 83% 67% 70% 77% 70% 3PM 60% 56% 65% 71% 70% 81% 62% 69% 72% 72% 4PM 58% 51% 61% 71% 68% 77% 55% 64% 70% 70% 5PM 53% 42% 50% 62% 61% 69% 47% 55% 59% 65%
Average 48% 48% 54% 60% 58% 66% 51% 56% 60% 59% Zone C 8AM 51% 48% 51% 51% 57% 52% 45% 53% 57% 54%
9AM 50% 47% 52% 58% 58% 49% 51% 57% 57% 60% 10AM 54% 47% 51% 59% 55% 45% 49% 58% 59% 63% 11AM 59% 49% 53% 59% 61% 50% 57% 54% 61% 67% 12AM 63% 53% 54% 61% 62% 61% 55% 56% 61% 62% 1PM 64% 52% 60% 64% 69% 69% 58% 61% 61% 67% 2PM 70% 55% 63% 69% 69% 71% 62% 69% 68% 78% 3PM 57% 54% 62% 64% 65% 68% 60% 57% 71% 67% 4PM 62% 52% 59% 66% 64% 66% 57% 53% 72% 67% 5PM 66% 49% 53% 68% 59% 67% 50% 47% 59% 63%
Average 59% 50% 56% 62% 62% 60% 54% 56% 63% 65% Zone ABC 8AM 37% 32% 31% 33% 36% 37% 30% 32% 36% 34%
9AM 40% 42% 41% 46% 45% 45% 40% 42% 43% 44% 10AM 46% 50% 50% 55% 52% 50% 49% 52% 53% 53% 11AM 59% 59% 61% 66% 62% 61% 62% 62% 66% 65% 12AM 68% 66% 69% 74% 68% 73% 69% 72% 72% 69% 1PM 71% 70% 74% 78% 74% 78% 76% 76% 74% 73% 2PM 78% 71% 75% 77% 74% 81% 77% 77% 78% 78% 3PM 73% 69% 70% 73% 72% 80% 73% 72% 76% 74% 4PM 70% 63% 68% 73% 71% 76% 68% 67% 77% 72% 5PM 66% 55% 59% 67% 63% 71% 60% 61% 67% 65%
Average 61% 58% 60% 64% 62% 66% 60% 61% 64% 63%
Zone A occupancy was 4% lower, Zone B was an average of 1.5% lower, while Zone C occupancy was on average 1% higher than 2017. Over all, occupancy was an average of 1.5% lower than in 2017.
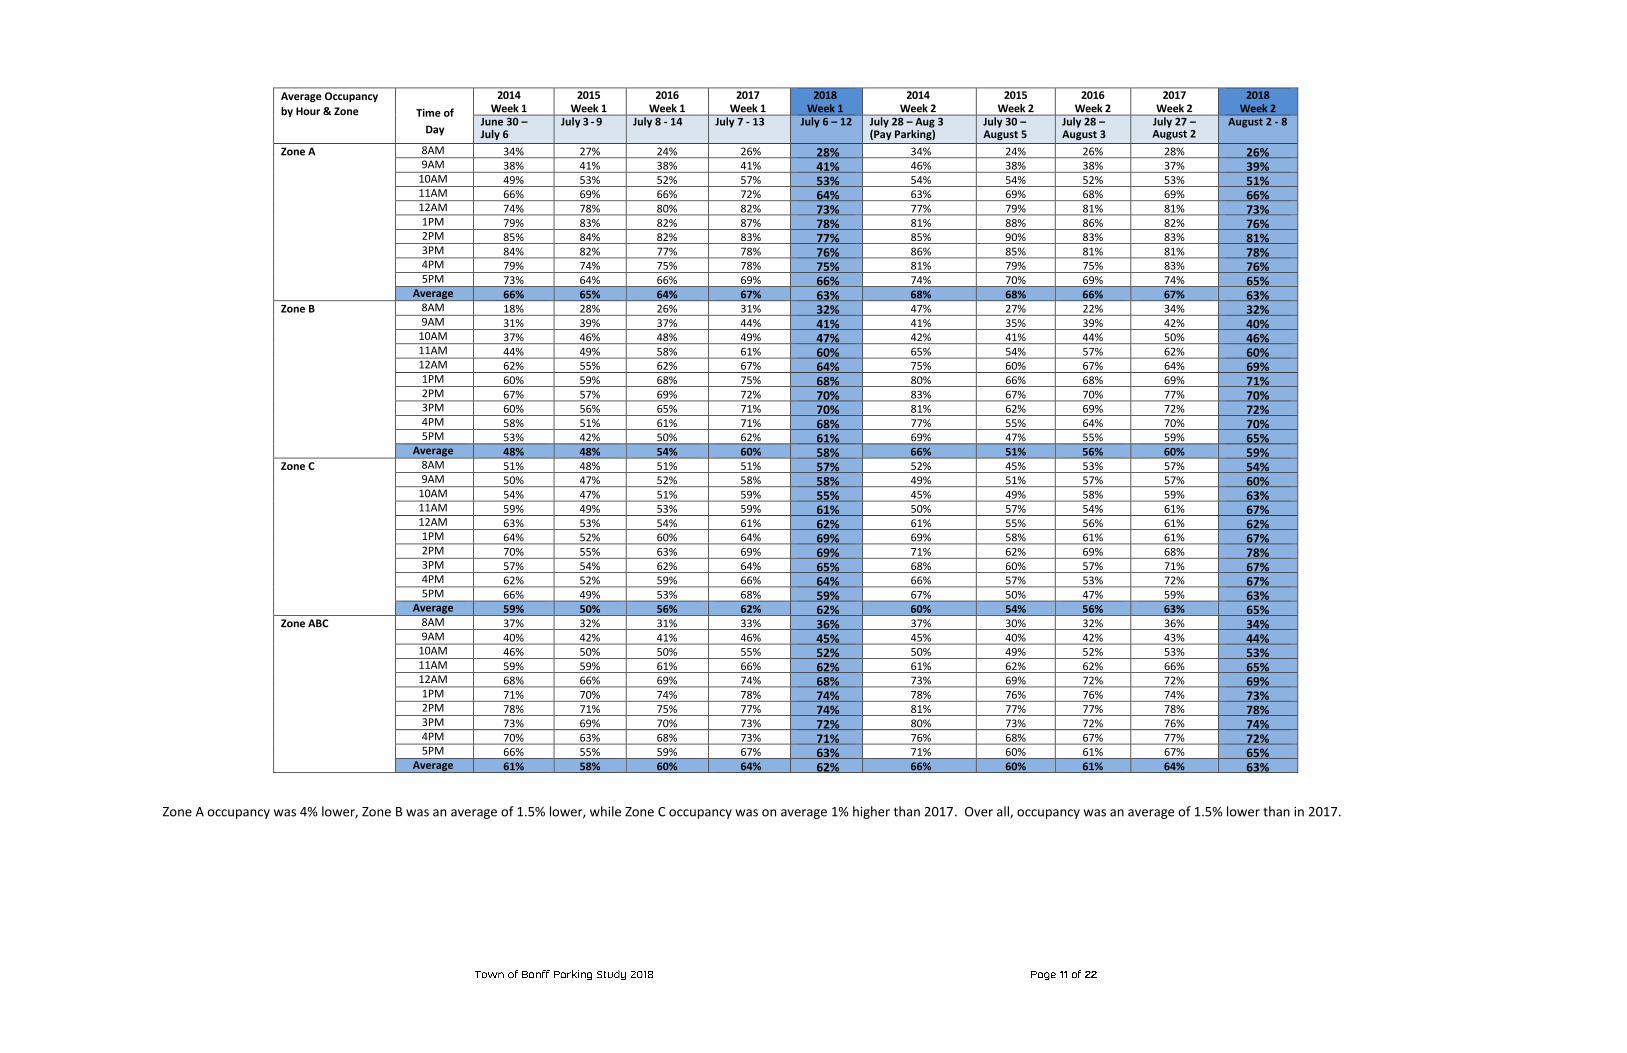
1.6.2 Parking Turnover When evaluating each parking area or street we find the parking turnover varies between a maximum of 8.0 turns on 200 Wolf Street to a minimum of 1.13 turns on 100 Otter. Average turnover
was down by 0.5 from 2017, but still higher than levels seen in 2015 and 2016. Turnover did show an increase in Zone A on-street, Zone B on-street, and in Zone B overall. Zone C showed a
negligible decrease of 0.01 vehicles turning over per day.
AVERAGE
TURNOVER
Week 1 2014 (Jun 30 – Jul 6)
Week 1 2015 (Jul 3-9)
Week 1 2016 (Jul 8 – 14)
Week 1 2017 (Jul 7 – 13)
Week 1 2018 (July 6 – 12)
Week 2 2014 (Jul 28 – Aug 3)
Week 2 2015 (Jul 30-Aug 5)
Week 2 2016 (Jul 28 – Aug 3)
Week 2 2017 (Jul 27 – Aug 2)
Week 2 2018 August 2 - 8
Average Turnover Change in 2018
Avg Turn
Vehicles/ day
Avg Turn
Vehicles/
day
Avg Turn
Vehicles/
day
Avg Turn
Vehicles/ day
Avg Turn
Vehicles/ day
Avg Turn
Vehicles/
day
Avg Turn
Vehicles /
day
Avg Turn
Vehicles /
day
Avg Turn
Vehicles/ day
Avg Turn
Vehicles/ day
User Paid Pilot 2014 4.7 1,160 4.0 973 3.5 859 3.73 915 3.39 811 4.2 1,023 3.9 942 3.5 844 3.47 851 3.29 787 -0.26 Zone A On-Street 4.7 1,454 4.4 1,079 4.5 1,116 4.74 1,223 4.88 1,165 5.5 1,530 4.4 1,097 4.5 1,127 4.64 1,198 4.93 1,208 +0.22 Zone A Off-Street 3.5 1,971 3.2 1,793 3.0 1,658 3.17 1,772 2.97 1,643 3.3 1,863 3.2 1,791 3.0 1,684 3.08 1,721 2.80 1,551 -0.24 Zone A Total 3.9 3,425 3.6 2,872 3.4 2,774 3.67 2,996 3.55 2,808 4.1 3,393 3.6 2,888 3.5 2,810 3.57 2,919 3.38 2,759 -0.16 Zone B On-Street 2.2 759 2.0 713 2.3 806 2.59 910 2.80 983 2.3 811 2.3 795 2.4 852 2.70 949 2.76 970 +0.14 Zone B Off-Street 3.8 130 4.1 138 4.4 150 4.31 147 3.98 135 3.8 128 4.1 139 4.3 145 4.77 162 4.49 153 -0.31 Zone B Total 2.3 889 2.2 851 2.5 956 2.74 1,057 2.91 1,118 2.4 939 2.4 934 2.6 998 2.89 1,111 2.92 1,123 +0.1 Zone C Total 2.0 720 1.7 628 1.9 690 2.04 736 2.11 823 1.8 658 1.8 654 2.1 740 2.11 759 2.06 802 +0.01
Zone A, B, C Total 3.1 5,034 2.8 4,350 2.8 4,421 3.03 4,788 2.99 4,749 3.2 4,990 2.9 4,476 2.9 4,548 3.03 4,790 2.96 4,684 -0.5
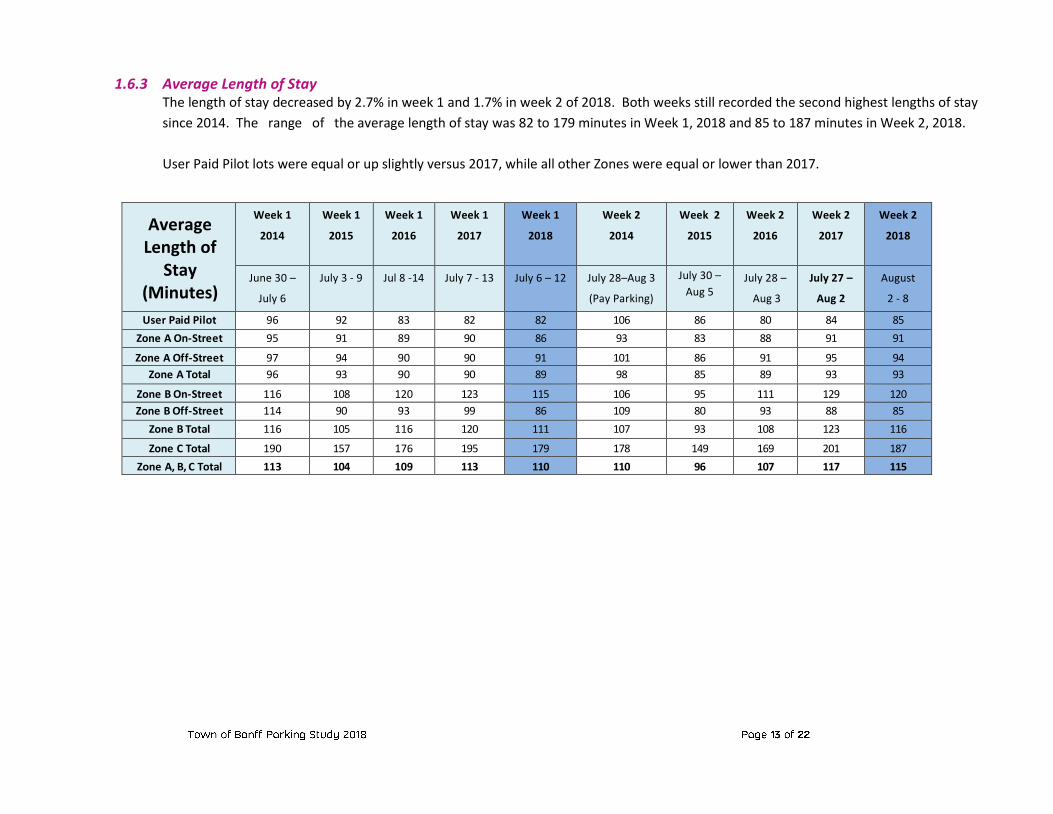
1.6.3 Average Length of Stay The length of stay decreased by 2.7% in week 1 and 1.7% in week 2 of 2018. Both weeks still recorded the second highest lengths of stay
since 2014. The range of the average length of stay was 82 to 179 minutes in Week 1, 2018 and 85 to 187 minutes in Week 2, 2018.
User Paid Pilot lots were equal or up slightly versus 2017, while all other Zones were equal or lower than 2017.
Average Length of
Stay (Minutes)
Week 1
2014
Week 1
2015
Week 1
2016
Week 1
2017
Week 1
2018
Week 2
2014
Week 2
2015
Week 2
2016
Week 2
2017
Week 2
2018
June 30 –
July 6
July 3 - 9 Jul 8 -14 July 7 - 13 July 6 – 12 July 28–Aug 3
(Pay Parking)
July 30 –
Aug 5 July 28 –
Aug 3
July 27 –
Aug 2
August
2 - 8
User Paid Pilot 96 92 83 82 82 106 86 80 84 85
Zone A On-Street 95 91 89 90 86 93 83 88 91 91
Zone A Off-Street 97 94 90 90 91 101 86 91 95 94
Zone A Total 96 93 90 90 89 98 85 89 93 93
Zone B On-Street 116 108 120 123 115 106 95 111 129 120
Zone B Off-Street 114 90 93 99 86 109 80 93 88 85
Zone B Total 116 105 116 120 111 107 93 108 123 116
Zone C Total 190 157 176 195 179 178 149 169 201 187
Zone A, B, C Total 113 104 109 113 110 110 96
107 117 115
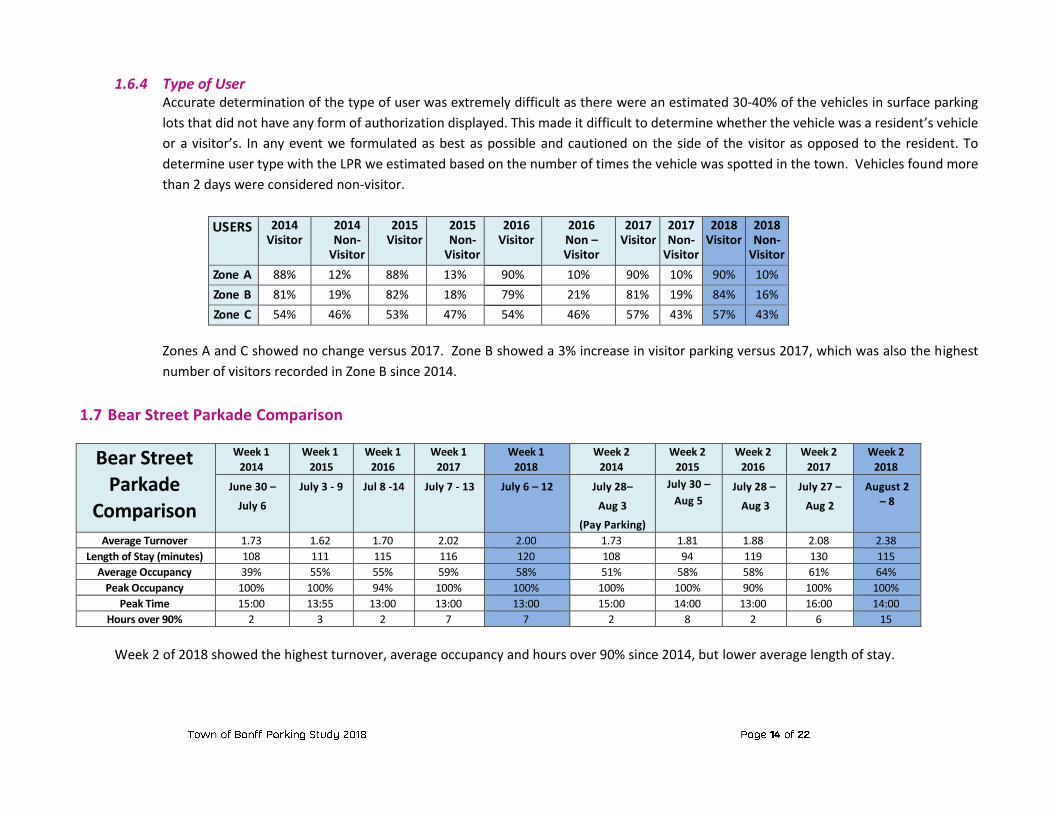
1.6.4 Type of User Accurate determination of the type of user was extremely difficult as there were an estimated 30-40% of the vehicles in surface parking
lots that did not have any form of authorization displayed. This made it difficult to determine whether the vehicle was a resident’s vehicle
or a visitor’s. In any event we formulated as best as possible and cautioned on the side of the visitor as opposed to the resident. To
determine user type with the LPR we estimated based on the number of times the vehicle was spotted in the town. Vehicles found more
than 2 days were considered non-visitor.
USERS 2014 Visitor
2014 Non-
Visitor
2015 Visitor
2015 Non-
Visitor
2016 Visitor
2016 Non – Visitor
2017 Visitor
2017 Non-
Visitor
2018 Visitor
2018 Non-
Visitor
Zone A 88% 12% 88% 13% 90% 10% 90% 10% 90% 10%
Zone B 81% 19% 82% 18% 79% 21% 81% 19% 84% 16%
Zone C 54% 46% 53% 47% 54% 46% 57% 43% 57% 43%
Zones A and C showed no change versus 2017. Zone B showed a 3% increase in visitor parking versus 2017, which was also the highest
number of visitors recorded in Zone B since 2014.
1.7 Bear Street Parkade Comparison
Bear Street Parkade
Comparison
Week 1
2014
Week 1
2015
Week 1
2016
Week 1
2017
Week 1
2018
Week 2
2014
Week 2
2015
Week 2
2016
Week 2
2017
Week 2
2018
June 30 –
July 6
July 3 - 9 Jul 8 -14 July 7 - 13 July 6 – 12 July 28–
Aug 3
(Pay Parking)
July 30 –
Aug 5 July 28 –
Aug 3
July 27 –
Aug 2
August 2 – 8
Average Turnover 1.73 1.62 1.70 2.02 2.00 1.73 1.81 1.88 2.08 2.38
Length of Stay (minutes) 108 111 115 116 120 108 94 119 130 115
Average Occupancy 39% 55% 55% 59% 58% 51% 58% 58% 61% 64%
Peak Occupancy 100% 100% 94% 100% 100% 100% 100% 90% 100% 100%
Peak Time 15:00 13:55 13:00 13:00 13:00 15:00 14:00 13:00 16:00 14:00
Hours over 90% 2 3 2 7 7 2 8 2 6 15
Week 2 of 2018 showed the highest turnover, average occupancy and hours over 90% since 2014, but lower average length of stay.
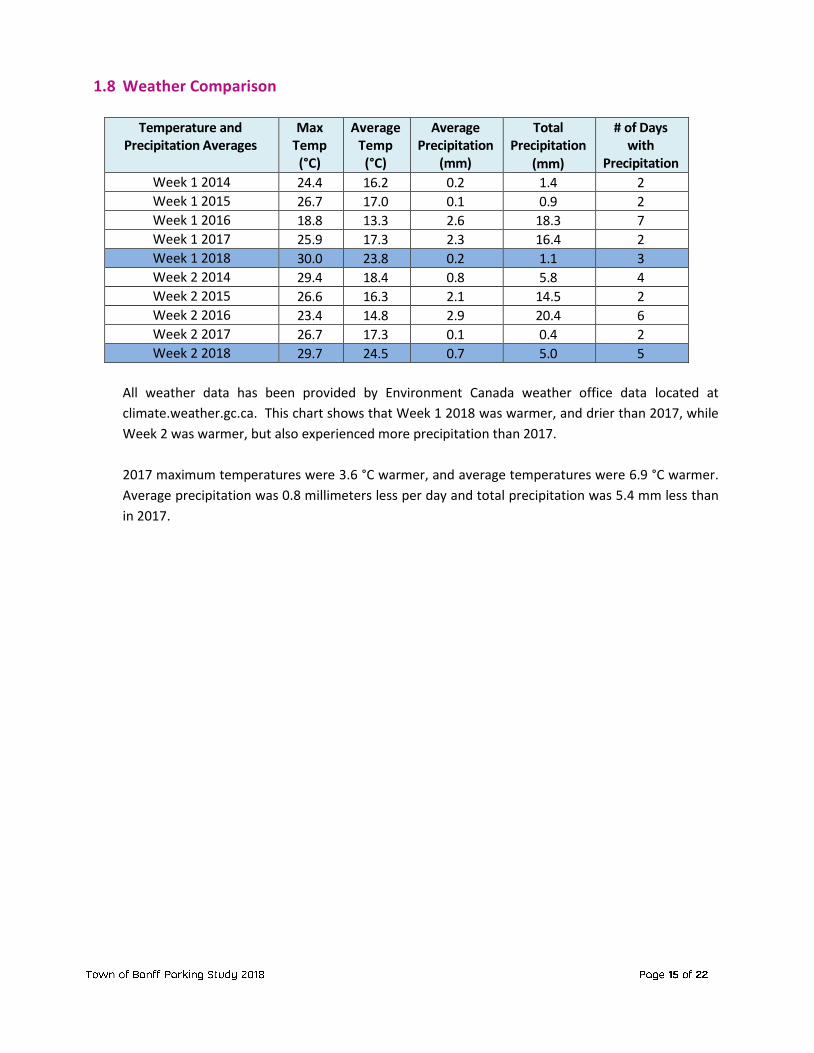
1.8 Weather Comparison
Temperature and Precipitation Averages
Max Temp (°C)
Average Temp (°C)
Average Precipitation
(mm)
Total Precipitation
(mm)
# of Days with
Precipitation
Week 1 2014 24.4 16.2 0.2 1.4 2
Week 1 2015 26.7 17.0 0.1 0.9 2
Week 1 2016 18.8 13.3 2.6 18.3 7
Week 1 2017 25.9 17.3 2.3 16.4 2
Week 1 2018 30.0 23.8 0.2 1.1 3
Week 2 2014 29.4 18.4 0.8 5.8 4
Week 2 2015 26.6 16.3 2.1 14.5 2
Week 2 2016 23.4 14.8 2.9 20.4 6
Week 2 2017 26.7 17.3 0.1 0.4 2
Week 2 2018 29.7 24.5 0.7 5.0 5
All weather data has been provided by Environment Canada weather office data located at
climate.weather.gc.ca. This chart shows that Week 1 2018 was warmer, and drier than 2017, while
Week 2 was warmer, but also experienced more precipitation than 2017.
2017 maximum temperatures were 3.6 °C warmer, and average temperatures were 6.9 °C warmer.
Average precipitation was 0.8 millimeters less per day and total precipitation was 5.4 mm less than
in 2017.
2. EXISTING & FUTURE PARKING REQUIREMENTS
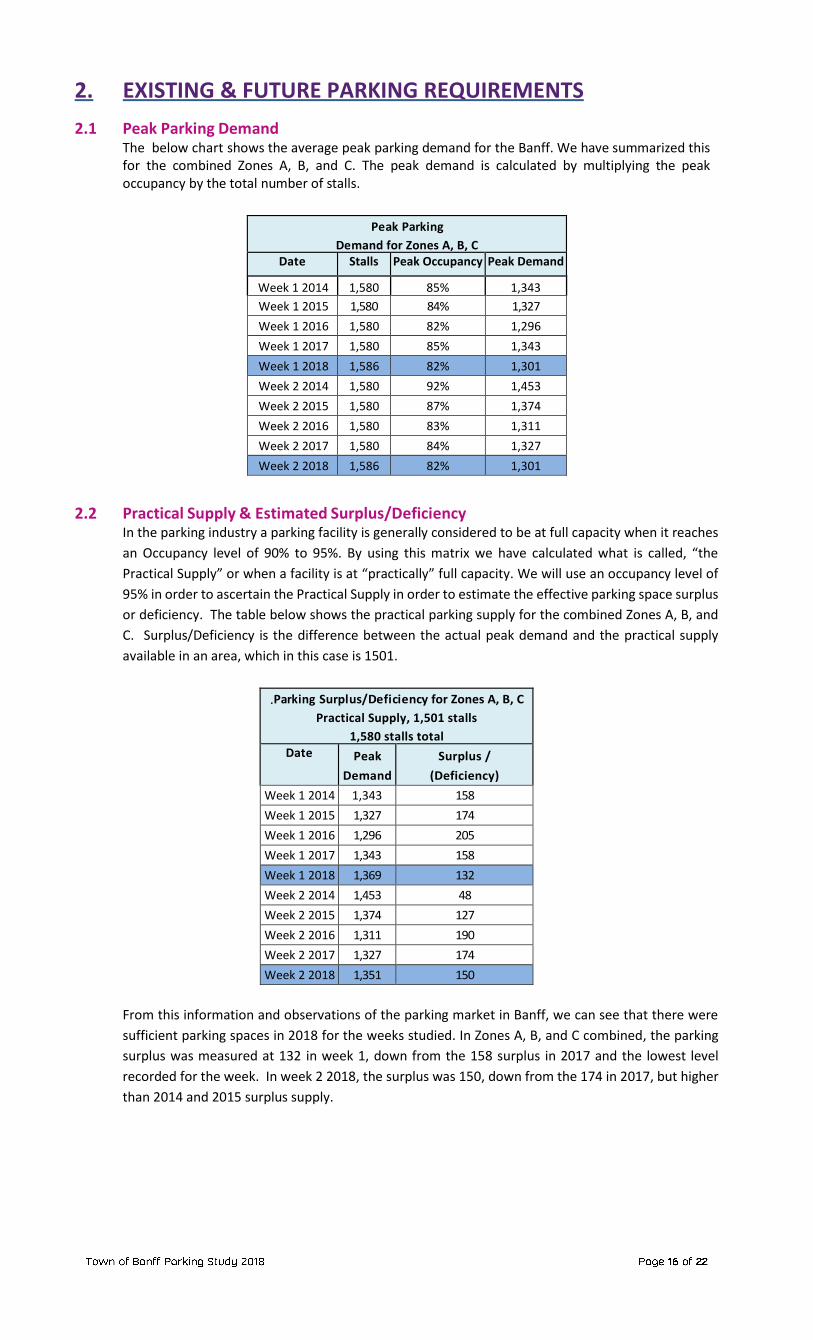
2.1 Peak Parking Demand The below chart shows the average peak parking demand for the Banff. We have summarized this for the combined Zones A, B, and C. The peak demand is calculated by multiplying the peak occupancy by the total number of stalls.
2.2 Practical Supply & Estimated Surplus/Deficiency In the parking industry a parking facility is generally considered to be at full capacity when it reaches
an Occupancy level of 90% to 95%. By using this matrix we have calculated what is called, “the
Practical Supply” or when a facility is at “practically” full capacity. We will use an occupancy level of
95% in order to ascertain the Practical Supply in order to estimate the effective parking space surplus
or deficiency. The table below shows the practical parking supply for the combined Zones A, B, and
C. Surplus/Deficiency is the difference between the actual peak demand and the practical supply
available in an area, which in this case is 1501.
.Parking Surplus/Deficiency for Zones A, B, C
Practical Supply, 1,501 stalls
1,580 stalls total
Date Peak
Demand
Surplus /
(Deficiency)
Week 1 2014 1,343 158
Week 1 2015 1,327 174
Week 1 2016 1,296 205
Week 1 2017 1,343 158
Week 1 2018 1,369 132
Week 2 2014 1,453 48
Week 2 2015 1,374 127
Week 2 2016 1,311 190
Week 2 2017 1,327 174
Week 2 2018 1,351 150
From this information and observations of the parking market in Banff, we can see that there were
sufficient parking spaces in 2018 for the weeks studied. In Zones A, B, and C combined, the parking
surplus was measured at 132 in week 1, down from the 158 surplus in 2017 and the lowest level
recorded for the week. In week 2 2018, the surplus was 150, down from the 174 in 2017, but higher
than 2014 and 2015 surplus supply.
Peak Parking
Demand for Zones A, B, C Date Stalls Peak Occupancy Peak Demand
Week 1 2014
1,580 85% 1,343
Week 1 2015 1,580 84% 1,327
Week 1 2016 1,580 82% 1,296
Week 1 2017 1,580 85% 1,343
Week 1 2018 1,586 82% 1,301
Week 2 2014 1,580 92% 1,453
Week 2 2015 1,580 87% 1,374
Week 2 2016 1,580 83% 1,311
Week 2 2017 1,580 84% 1,327
Week 2 2018 1,586 82% 1,301
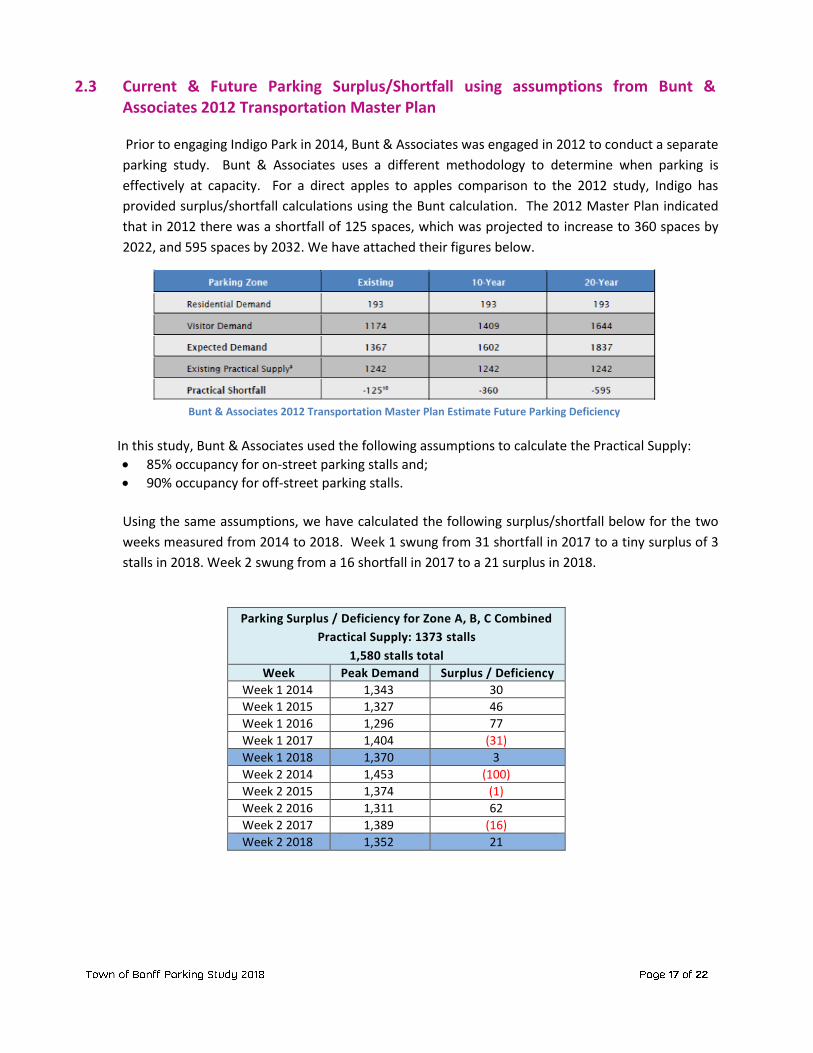
2.3 Current & Future Parking Surplus/Shortfall using assumptions from Bunt & Associates 2012 Transportation Master Plan
Prior to engaging Indigo Park in 2014, Bunt & Associates was engaged in 2012 to conduct a separate
parking study. Bunt & Associates uses a different methodology to determine when parking is
effectively at capacity. For a direct apples to apples comparison to the 2012 study, Indigo has
provided surplus/shortfall calculations using the Bunt calculation. The 2012 Master Plan indicated
that in 2012 there was a shortfall of 125 spaces, which was projected to increase to 360 spaces by
2022, and 595 spaces by 2032. We have attached their figures below.
Bunt & Associates 2012 Transportation Master Plan Estimate Future Parking Deficiency
In this study, Bunt & Associates used the following assumptions to calculate the Practical Supply:
85% occupancy for on-street parking stalls and;
90% occupancy for off-street parking stalls.
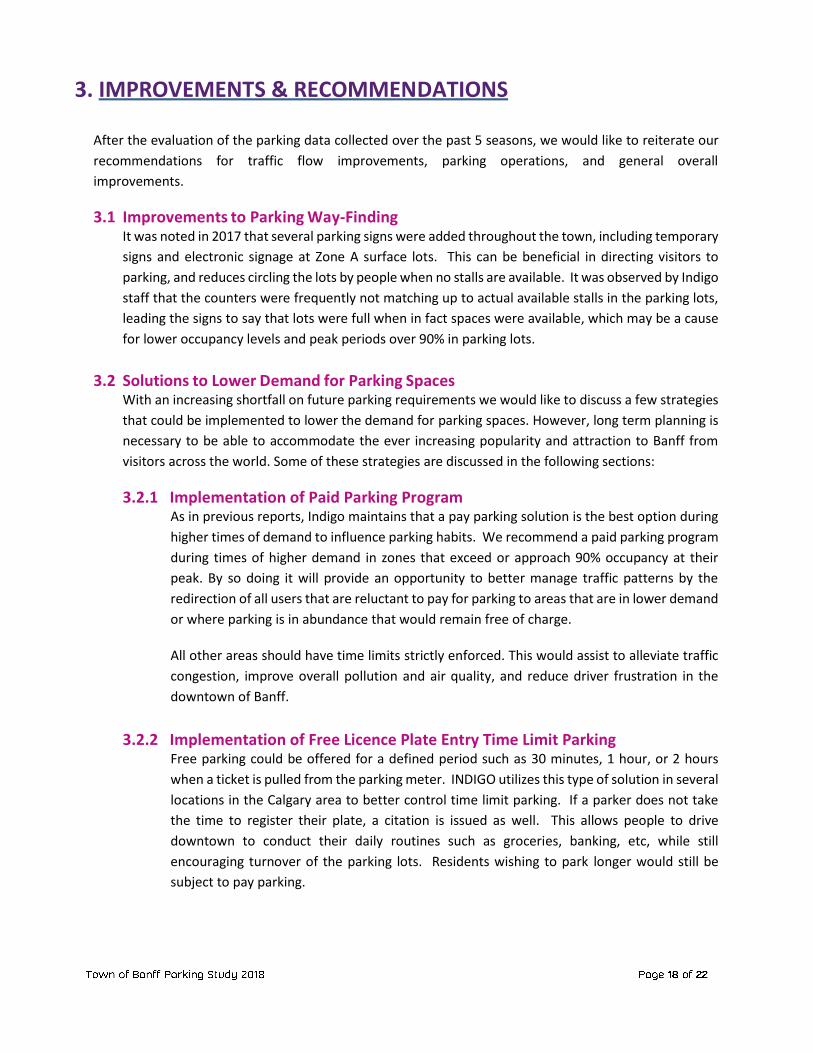
Using the same assumptions, we have calculated the following surplus/shortfall below for the two
weeks measured from 2014 to 2018. Week 1 swung from 31 shortfall in 2017 to a tiny surplus of 3
stalls in 2018. Week 2 swung from a 16 shortfall in 2017 to a 21 surplus in 2018.
Parking Surplus / Deficiency for Zone A, B, C Combined
Practical Supply: 1373 stalls
1,580 stalls total
Week Peak Demand Surplus / Deficiency
Week 1 2014 1,343 30
Week 1 2015 1,327 46
Week 1 2016 1,296 77
Week 1 2017 1,404 (31)
Week 1 2018 1,370 3
Week 2 2014 1,453 (100)
Week 2 2015 1,374 (1)
Week 2 2016 1,311 62
Week 2 2017 1,389 (16)
Week 2 2018 1,352 21
3. IMPROVEMENTS & RECOMMENDATIONS
After the evaluation of the parking data collected over the past 5 seasons, we would like to reiterate our
recommendations for traffic flow improvements, parking operations, and general overall
improvements.
3.1 Improvements to Parking Way-Finding It was noted in 2017 that several parking signs were added throughout the town, including temporary
signs and electronic signage at Zone A surface lots. This can be beneficial in directing visitors to
parking, and reduces circling the lots by people when no stalls are available. It was observed by Indigo
staff that the counters were frequently not matching up to actual available stalls in the parking lots,
leading the signs to say that lots were full when in fact spaces were available, which may be a cause
for lower occupancy levels and peak periods over 90% in parking lots.
3.2 Solutions to Lower Demand for Parking Spaces With an increasing shortfall on future parking requirements we would like to discuss a few strategies
that could be implemented to lower the demand for parking spaces. However, long term planning is
necessary to be able to accommodate the ever increasing popularity and attraction to Banff from
visitors across the world. Some of these strategies are discussed in the following sections:
3.2.1 Implementation of Paid Parking Program As in previous reports, Indigo maintains that a pay parking solution is the best option during
higher times of demand to influence parking habits. We recommend a paid parking program
during times of higher demand in zones that exceed or approach 90% occupancy at their
peak. By so doing it will provide an opportunity to better manage traffic patterns by the
redirection of all users that are reluctant to pay for parking to areas that are in lower demand
or where parking is in abundance that would remain free of charge.
All other areas should have time limits strictly enforced. This would assist to alleviate traffic
congestion, improve overall pollution and air quality, and reduce driver frustration in the
downtown of Banff.
3.2.2 Implementation of Free Licence Plate Entry Time Limit Parking Free parking could be offered for a defined period such as 30 minutes, 1 hour, or 2 hours
when a ticket is pulled from the parking meter. INDIGO utilizes this type of solution in several
locations in the Calgary area to better control time limit parking. If a parker does not take
the time to register their plate, a citation is issued as well. This allows people to drive
downtown to conduct their daily routines such as groceries, banking, etc, while still
encouraging turnover of the parking lots. Residents wishing to park longer would still be
subject to pay parking.
3.2.3 Combination of Free and Pay Parking
A hybrid of the previous parking strategies can be implemented where the non-peak hours
of the day can simply be free licence plate registration, but have the peak hours require pay
parking.
In addition, long term parking can still be discouraged with pay parking by offering an
escalated parking fee structure. As an example 3 hours was identified as the ideal time for
the majority of resident short term trips, and visitor stays. The first 3 hours could be $2 per
hour as they were in 2014, followed by $4 or more per hour the next 2 hours, and $6 per hour
after that, and so on. Actual values could be determined based on data collected through
LPR technology, visitor, and resident feedback.
3.2.4 Increase of Transit & Other Modes of Transportation
Increasing the appeal of transit is a method to assist in the lowering of the demand of parking
spaces. With a very efficient transit system ridership should increase and mobility of people
should improve. A major issue with the marketability and feasibility of transit is the
competition of free parking. If parking remains free it is difficult to encourage people to take
alternative modes of transportation, including transit as it is too easy for locals to just drive
and park for free.
Encouragement of other modes of transportation is also a good investment. An effective
advertising campaign can assist in the encouragement of locals and visitors alike to consider
alternative modes of transportation.
Some of the alternatives that can be advertised may include some of the following:
Bus or Transit Walking Bicycling (Bike Lanes) Bike Sharing Car pooling Car Sharing Park and Walk
With the advertising and encouragement of using alternative modes of transportation,
consideration must be given to accommodate an increase in use of bicycles and pedestrians.
There may need to be investments to improve pathway networks and bicycle stands in the
downtown area.
3.2.5 Stricter Enforcement of Infractions to Time Limit Parking INDIGO experienced many parkers that neglected to adhere to the time limits on-street and
off-street. With a stricter no tolerance approach, especially in surface lots, and an increase in
enforcement policing this would become a more effective method to control the inventory
of parking by not permitting extended stay and encouraging turnover of parking spaces. If
drivers continue to neglect the parking regulations towing and impounding of vehicles could
be considered as a last resort.
Overall, in Week 1 2018, 3.7% of parkers, and in Week 2 2018, 3.2% of parkers stayed longer
than the 3 hour posted limit in surface parking lots. On average, 27 vehicles per day stayed
longer than the posted limit for a total average of 107 parking hours per day. On-street rules
vary by block face, but in Zone A, 4.4% of parkers stayed longer than 4 hours, which is 48
vehicles per day for a total average of 293 parking hours per day. In Zone B, 10.9% of people
stayed longer than 4 hours, which translates to 101 vehicles per day for a total average of
644 parking hours per day.
3.2.6 Increase the Supply – Build Parking Structure Another method to meet the demand of parking is to increase the supply. The easiest method
is to build a parking structure or surface parking lot. Both of these options have a tremendous
cost associated with them which would ultimately be passed down to the taxpayers in Banff.
We also know that the existing Parkade, Bear Street Parkade is currently underutilized at all
but the busiest times in the town, due to many users preferring surface and on- street parking
to parking structures, though use is improving. Reducing the surface parking to make way for
a parking structure is not only expensive but will be a less desired choice for drivers.
Additionally, a parking structure is likely to increase traffic congestion on the routes leading
to and from the access point to the parkade.
In any event, we will provide several locations or improvements that can increase the number
of parking stalls by means of the construction of a parking structure.
1. Increase the number of parking spaces in the Bear Street Parkade by adding additional
levels to the structure or removing the “Monthly only” section of the garage and opening it
up for public parking.
2. Construction of new Parking Structure at Beaver 200 surface lot. This would be the
preferred location as it has a closer proximity to downtown and provide an easier access of
all vehicles entering the town from Banff Avenue.
3. Construction of new Parking Structure at Lynx & Wolf (Hospital Lot). This is not as
desirable as the Beaver Street location but could provide a longer term solution, and provide
greater parking for hospital users as well.
4. Park’s Canada Surface Lot. Even though this is a small lot it could also be a good site for
a parking structure so long as the first level and Banff Ave maintains a retail component.
5. Construction of a parkade at any of the surface lots located at Bear 100, Bear 200, Central
Park, and Beaver 100 at Caribou and Buffalo or elsewhere within Zones A, B or C would create
additional parking but is also likely to increase traffic congestion by directing traffic to areas
where the road system is already congested. Intercept parking outside the downtown core
should be pursued in favour of construction of a downtown parkade.
3.3 Implementation of Resident Parking Permit Program One of the challenges as mentioned earlier is the identification of a resident as opposed to
a commuter from Canmore, and a visitor. A portion of residents display a resident pass hanging from
the rear view mirror. This is an excellent method to identify whether or not the vehicle belongs to a
resident or not. However, there are many that do not display or have this pass displayed. With the
implementation of a resident parking program the Town would be able to;
offer discounts, free parking or other benefits to all residents to all residents, and/or;
Better control visitor parking in residential areas by implementing shorter time limits for all
vehicles except residents of the block – who could be permitted 72 hour stays as per the current
by-law.

APPENDIX
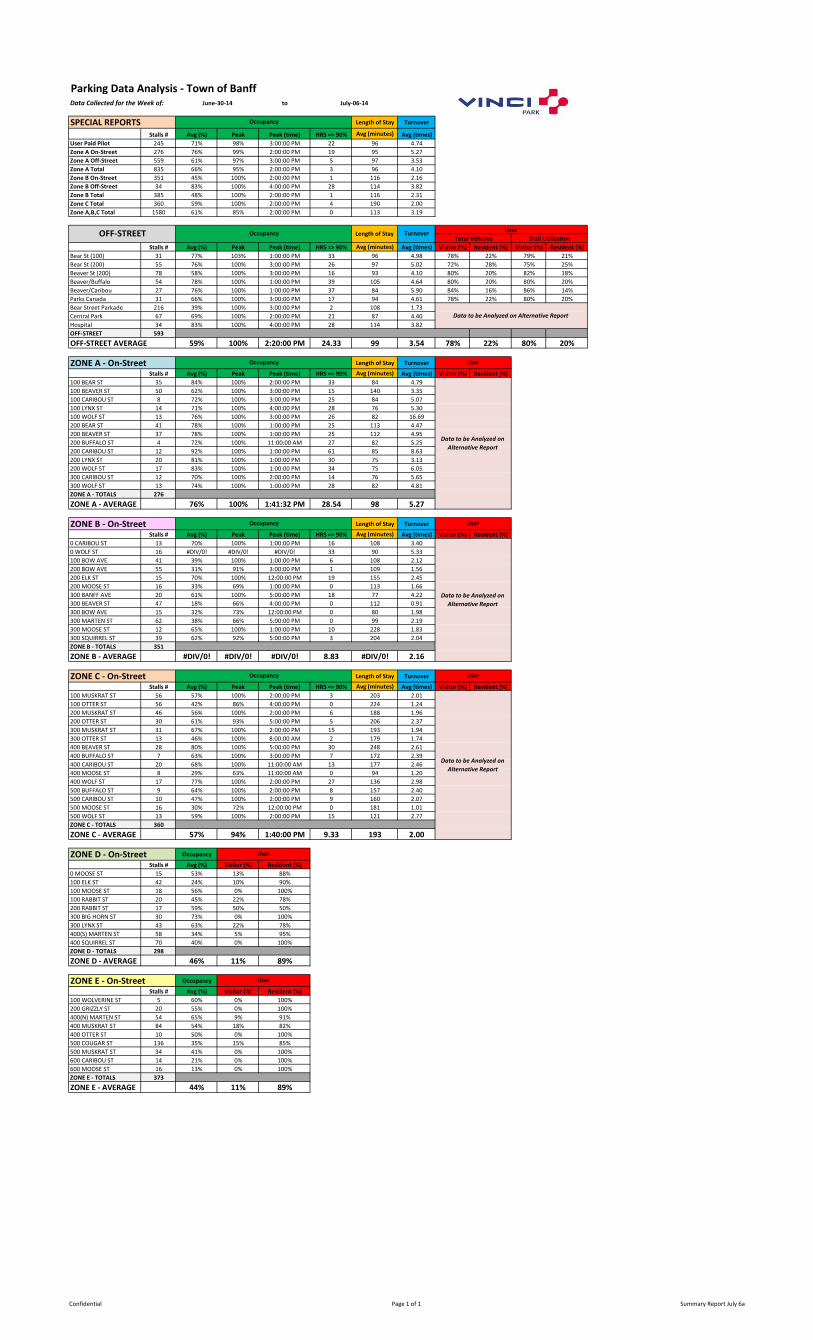
Parking Data Analysis - Town of BanffData Collected for the Week of: to
SPECIAL REPORTS Length of Stay Turnover
Stalls # Avg (%) Peak Peak (time) HRS => 90% Avg (minutes) Avg (times)
User Paid Pilot 245 71% 98% 3:00:00 PM 22 96 4.74
Zone A On-Street 276 76% 99% 2:00:00 PM 19 95 5.27
Zone A Off-Street 559 61% 97% 3:00:00 PM 5 97 3.53
Zone A Total 835 66% 95% 2:00:00 PM 3 96 4.10
Zone B On-Street 351 45% 100% 2:00:00 PM 1 116 2.16
Zone B Off-Street 34 83% 100% 4:00:00 PM 28 114 3.82
Zone B Total 385 48% 100% 2:00:00 PM 1 116 2.31
Zone C Total 360 59% 100% 2:00:00 PM 4 190 2.00
Zone A,B,C Total 1580 61% 85% 2:00:00 PM 0 113 3.19
Stalls # Avg (%) Peak Peak (time) HRS => 90% Avg (minutes) Avg (times) Visitor (%) Resident (%) Visitor (%) Resident (%)
Bear St (100) 31 77% 103% 1:00:00 PM 33 96 4.98 78% 22% 79% 21%
Bear St (200) 55 76% 100% 3:00:00 PM 26 97 5.02 72% 28% 75% 25%
Beaver St (200) 78 58% 100% 3:00:00 PM 16 93 4.10 80% 20% 82% 18%
Beaver/Buffalo 54 78% 100% 1:00:00 PM 39 105 4.64 80% 20% 80% 20%
Beaver/Caribou 27 76% 100% 1:00:00 PM 37 84 5.90 84% 16% 86% 14%
Parks Canada 31 66% 100% 3:00:00 PM 17 94 4.61 78% 22% 80% 20%
Bear Street Parkade 216 39% 100% 3:00:00 PM 2 108 1.73
Central Park 67 69% 100% 2:00:00 PM 21 87 4.40
Hospital 34 83% 100% 4:00:00 PM 28 114 3.82
OFF-STREET 593
OFF-STREET AVERAGE 59% 100% 2:20:00 PM 24.33 99 3.54 78% 22% 80% 20%
ZONE A - On-Street Length of Stay Turnover
Stalls # Avg (%) Peak Peak (time) HRS => 90% Avg (minutes) Avg (times) Visitor (%) Resident (%)
100 BEAR ST 35 84% 100% 2:00:00 PM 33 84 4.79
100 BEAVER ST 50 62% 100% 3:00:00 PM 15 140 3.35
100 CARIBOU ST 8 72% 100% 3:00:00 PM 25 84 5.07
100 LYNX ST 14 71% 100% 4:00:00 PM 28 76 5.30
100 WOLF ST 13 76% 100% 3:00:00 PM 26 82 16.69
200 BEAR ST 41 78% 100% 1:00:00 PM 25 113 4.47
200 BEAVER ST 37 78% 100% 1:00:00 PM 25 112 4.95
200 BUFFALO ST 4 72% 100% 11:00:00 AM 27 82 5.25
200 CARIBOU ST 12 92% 100% 1:00:00 PM 61 85 8.63
200 LYNX ST 20 81% 100% 1:00:00 PM 30 75 3.13
200 WOLF ST 17 83% 100% 1:00:00 PM 34 75 6.05
300 CARIBOU ST 12 70% 100% 2:00:00 PM 14 76 5.65
300 WOLF ST 13 74% 100% 1:00:00 PM 28 82 4.81
ZONE A - TOTALS 276
ZONE A - AVERAGE 76% 100% 1:41:32 PM 28.54 98 5.27
ZONE B - On-Street Length of Stay Turnover
Stalls # Avg (%) Peak Peak (time) HRS => 90% Avg (minutes) Avg (times) Visitor (%) Resident (%)
0 CARIBOU ST 13 70% 100% 1:00:00 PM 16 108 3.40
0 WOLF ST 16 #DIV/0! #DIV/0! #DIV/0! 33 90 5.33
100 BOW AVE 41 39% 100% 1:00:00 PM 6 108 2.12
200 BOW AVE 55 31% 91% 3:00:00 PM 1 109 1.56
200 ELK ST 15 70% 100% 12:00:00 PM 19 155 2.45
200 MOOSE ST 16 33% 69% 1:00:00 PM 0 113 1.66
300 BANFF AVE 20 61% 100% 5:00:00 PM 18 77 4.22
300 BEAVER ST 47 18% 66% 4:00:00 PM 0 112 0.91
300 BOW AVE 15 32% 73% 12:00:00 PM 0 80 1.98
300 MARTEN ST 62 38% 66% 5:00:00 PM 0 99 2.19
300 MOOSE ST 12 65% 100% 1:00:00 PM 10 228 1.83
300 SQUIRREL ST 39 62% 92% 5:00:00 PM 3 204 2.04
ZONE B - TOTALS 351
ZONE B - AVERAGE #DIV/0! #DIV/0! #DIV/0! 8.83 #DIV/0! 2.16
ZONE C - On-Street Length of Stay Turnover
Stalls # Avg (%) Peak Peak (time) HRS => 90% Avg (minutes) Avg (times) Visitor (%) Resident (%)
100 MUSKRAT ST 56 57% 100% 2:00:00 PM 3 203 2.01
100 OTTER ST 56 42% 86% 4:00:00 PM 0 224 1.24
200 MUSKRAT ST 46 56% 100% 2:00:00 PM 6 188 1.96
200 OTTER ST 30 61% 93% 5:00:00 PM 5 206 2.37
300 MUSKRAT ST 31 67% 100% 2:00:00 PM 15 193 1.94
300 OTTER ST 13 46% 100% 8:00:00 AM 2 179 1.74
400 BEAVER ST 28 80% 100% 5:00:00 PM 30 248 2.61
400 BUFFALO ST 7 63% 100% 3:00:00 PM 7 172 2.39
400 CARIBOU ST 20 68% 100% 11:00:00 AM 13 177 2.46
400 MOOSE ST 8 29% 63% 11:00:00 AM 0 94 1.20
400 WOLF ST 17 77% 100% 2:00:00 PM 27 136 2.98
500 BUFFALO ST 9 64% 100% 2:00:00 PM 8 157 2.40
500 CARIBOU ST 10 47% 100% 2:00:00 PM 9 160 2.07
500 MOOSE ST 16 30% 72% 12:00:00 PM 0 181 1.01
500 WOLF ST 13 59% 100% 2:00:00 PM 15 121 2.77
ZONE C - TOTALS 360
ZONE C - AVERAGE 57% 94% 1:40:00 PM 9.33 193 2.00
ZONE D - On-Street Occupancy
Stalls # Avg (%) Visitor (%) Resident (%)
0 MOOSE ST 15 53% 13% 88%
100 ELK ST 42 24% 10% 90%
100 MOOSE ST 18 56% 0% 100%
100 RABBIT ST 20 45% 22% 78%
200 RABBIT ST 17 59% 50% 50%
300 BIG HORN ST 30 73% 0% 100%
300 LYNX ST 43 63% 22% 78%
400(S) MARTEN ST 58 34% 5% 95%
400 SQUIRREL ST 70 40% 0% 100%
ZONE D - TOTALS 298
ZONE D - AVERAGE 46% 11% 89%
ZONE E - On-Street Occupancy
Stalls # Avg (%) Visitor (%) Resident (%)
100 WOLVERINE ST 5 60% 0% 100%
200 GRIZZLY ST 20 55% 0% 100%
400(N) MARTEN ST 54 65% 9% 91%
400 MUSKRAT ST 84 54% 18% 82%
400 OTTER ST 10 50% 0% 100%
500 COUGAR ST 136 35% 15% 85%
500 MUSKRAT ST 34 41% 0% 100%
600 CARIBOU ST 14 21% 0% 100%
600 MOOSE ST 16 13% 0% 100%
ZONE E - TOTALS 373
ZONE E - AVERAGE 44% 11% 89%
Data to be Analyzed on Alternative Report
User
Total Vehicles Stall UtilizationOFF-STREET Occupancy Length of Stay Turnover
June-30-14 July-06-14
User
Occupancy
Occupancy
Occupancy
User
User
User
User
Data to be Analyzed on
Alternative Report
Data to be Analyzed on
Alternative Report
Data to be Analyzed on
Alternative Report
Occupancy
Confidential Page 1 of 1 Summary Report July 6a
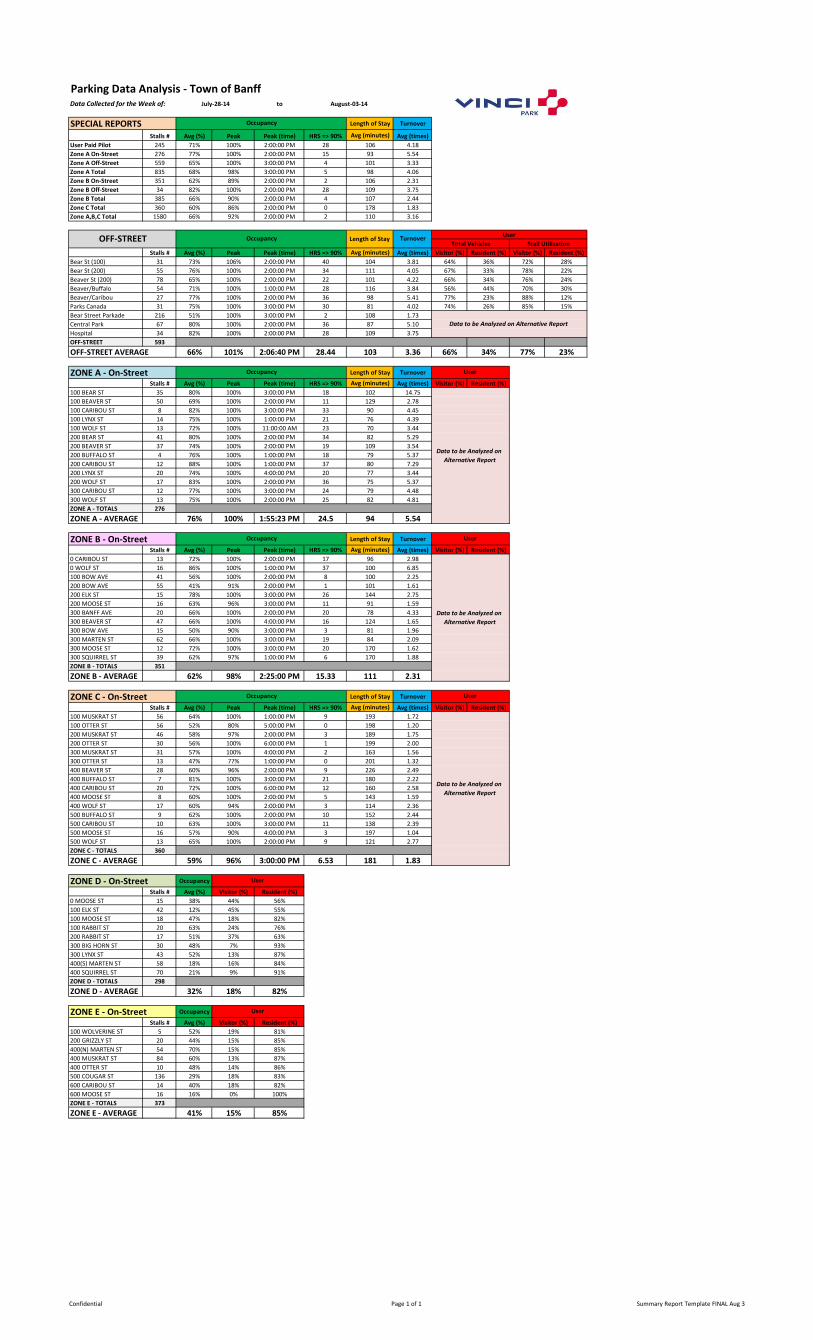
Parking Data Analysis - Town of BanffData Collected for the Week of: to
SPECIAL REPORTS Length of Stay Turnover
Stalls # Avg (%) Peak Peak (time) HRS => 90% Avg (minutes) Avg (times)
User Paid Pilot 245 71% 100% 2:00:00 PM 28 106 4.18
Zone A On-Street 276 77% 100% 2:00:00 PM 15 93 5.54
Zone A Off-Street 559 65% 100% 3:00:00 PM 4 101 3.33
Zone A Total 835 68% 98% 3:00:00 PM 5 98 4.06
Zone B On-Street 351 62% 89% 2:00:00 PM 2 106 2.31
Zone B Off-Street 34 82% 100% 2:00:00 PM 28 109 3.75
Zone B Total 385 66% 90% 2:00:00 PM 4 107 2.44
Zone C Total 360 60% 86% 2:00:00 PM 0 178 1.83
Zone A,B,C Total 1580 66% 92% 2:00:00 PM 2 110 3.16
Stalls # Avg (%) Peak Peak (time) HRS => 90% Avg (minutes) Avg (times) Visitor (%) Resident (%) Visitor (%) Resident (%)
Bear St (100) 31 73% 106% 2:00:00 PM 40 104 3.81 64% 36% 72% 28%
Bear St (200) 55 76% 100% 2:00:00 PM 34 111 4.05 67% 33% 78% 22%
Beaver St (200) 78 65% 100% 2:00:00 PM 22 101 4.22 66% 34% 76% 24%
Beaver/Buffalo 54 71% 100% 1:00:00 PM 28 116 3.84 56% 44% 70% 30%
Beaver/Caribou 27 77% 100% 2:00:00 PM 36 98 5.41 77% 23% 88% 12%
Parks Canada 31 75% 100% 3:00:00 PM 30 81 4.02 74% 26% 85% 15%
Bear Street Parkade 216 51% 100% 3:00:00 PM 2 108 1.73
Central Park 67 80% 100% 2:00:00 PM 36 87 5.10
Hospital 34 82% 100% 2:00:00 PM 28 109 3.75
OFF-STREET 593
OFF-STREET AVERAGE 66% 101% 2:06:40 PM 28.44 103 3.36 66% 34% 77% 23%
ZONE A - On-Street Length of Stay Turnover
Stalls # Avg (%) Peak Peak (time) HRS => 90% Avg (minutes) Avg (times) Visitor (%) Resident (%)
100 BEAR ST 35 80% 100% 3:00:00 PM 18 102 14.75
100 BEAVER ST 50 69% 100% 2:00:00 PM 11 129 2.78
100 CARIBOU ST 8 82% 100% 3:00:00 PM 33 90 4.45
100 LYNX ST 14 75% 100% 1:00:00 PM 21 76 4.39
100 WOLF ST 13 72% 100% 11:00:00 AM 23 70 3.44
200 BEAR ST 41 80% 100% 2:00:00 PM 34 82 5.29
200 BEAVER ST 37 74% 100% 2:00:00 PM 19 109 3.54
200 BUFFALO ST 4 76% 100% 1:00:00 PM 18 79 5.37
200 CARIBOU ST 12 88% 100% 1:00:00 PM 37 80 7.29
200 LYNX ST 20 74% 100% 4:00:00 PM 20 77 3.44
200 WOLF ST 17 83% 100% 2:00:00 PM 36 75 5.37
300 CARIBOU ST 12 77% 100% 3:00:00 PM 24 79 4.48
300 WOLF ST 13 75% 100% 2:00:00 PM 25 82 4.81
ZONE A - TOTALS 276
ZONE A - AVERAGE 76% 100% 1:55:23 PM 24.5 94 5.54
ZONE B - On-Street Length of Stay Turnover
Stalls # Avg (%) Peak Peak (time) HRS => 90% Avg (minutes) Avg (times) Visitor (%) Resident (%)
0 CARIBOU ST 13 72% 100% 2:00:00 PM 17 96 2.98
0 WOLF ST 16 86% 100% 1:00:00 PM 37 100 6.85
100 BOW AVE 41 56% 100% 2:00:00 PM 8 100 2.25
200 BOW AVE 55 41% 91% 2:00:00 PM 1 101 1.61
200 ELK ST 15 78% 100% 3:00:00 PM 26 144 2.75
200 MOOSE ST 16 63% 96% 3:00:00 PM 11 91 1.59
300 BANFF AVE 20 66% 100% 2:00:00 PM 20 78 4.33
300 BEAVER ST 47 66% 100% 4:00:00 PM 16 124 1.65
300 BOW AVE 15 50% 90% 3:00:00 PM 3 81 1.96
300 MARTEN ST 62 66% 100% 3:00:00 PM 19 84 2.09
300 MOOSE ST 12 72% 100% 3:00:00 PM 20 170 1.62
300 SQUIRREL ST 39 62% 97% 1:00:00 PM 6 170 1.88
ZONE B - TOTALS 351
ZONE B - AVERAGE 62% 98% 2:25:00 PM 15.33 111 2.31
ZONE C - On-Street Length of Stay Turnover
Stalls # Avg (%) Peak Peak (time) HRS => 90% Avg (minutes) Avg (times) Visitor (%) Resident (%)
100 MUSKRAT ST 56 64% 100% 1:00:00 PM 9 193 1.72
100 OTTER ST 56 52% 80% 5:00:00 PM 0 198 1.20
200 MUSKRAT ST 46 58% 97% 2:00:00 PM 3 189 1.75
200 OTTER ST 30 56% 100% 6:00:00 PM 1 199 2.00
300 MUSKRAT ST 31 57% 100% 4:00:00 PM 2 163 1.56
300 OTTER ST 13 47% 77% 1:00:00 PM 0 201 1.32
400 BEAVER ST 28 60% 96% 2:00:00 PM 9 226 2.49
400 BUFFALO ST 7 81% 100% 3:00:00 PM 21 180 2.22
400 CARIBOU ST 20 72% 100% 6:00:00 PM 12 160 2.58
400 MOOSE ST 8 60% 100% 2:00:00 PM 5 143 1.59
400 WOLF ST 17 60% 94% 2:00:00 PM 3 114 2.36
500 BUFFALO ST 9 62% 100% 2:00:00 PM 10 152 2.44
500 CARIBOU ST 10 63% 100% 3:00:00 PM 11 138 2.39
500 MOOSE ST 16 57% 90% 4:00:00 PM 3 197 1.04
500 WOLF ST 13 65% 100% 2:00:00 PM 9 121 2.77
ZONE C - TOTALS 360
ZONE C - AVERAGE 59% 96% 3:00:00 PM 6.53 181 1.83
ZONE D - On-Street Occupancy
Stalls # Avg (%) Visitor (%) Resident (%)
0 MOOSE ST 15 38% 44% 56%
100 ELK ST 42 12% 45% 55%
100 MOOSE ST 18 47% 18% 82%
100 RABBIT ST 20 63% 24% 76%
200 RABBIT ST 17 51% 37% 63%
300 BIG HORN ST 30 48% 7% 93%
300 LYNX ST 43 52% 13% 87%
400(S) MARTEN ST 58 18% 16% 84%
400 SQUIRREL ST 70 21% 9% 91%
ZONE D - TOTALS 298
ZONE D - AVERAGE 32% 18% 82%
ZONE E - On-Street Occupancy
Stalls # Avg (%) Visitor (%) Resident (%)
100 WOLVERINE ST 5 52% 19% 81%
200 GRIZZLY ST 20 44% 15% 85%
400(N) MARTEN ST 54 70% 15% 85%
400 MUSKRAT ST 84 60% 13% 87%
400 OTTER ST 10 48% 14% 86%
500 COUGAR ST 136 29% 18% 83%
600 CARIBOU ST 14 40% 18% 82%
600 MOOSE ST 16 16% 0% 100%
ZONE E - TOTALS 373
ZONE E - AVERAGE 41% 15% 85%
Data to be Analyzed on Alternative Report
User
Total Vehicles Stall UtilizationOFF-STREET Occupancy Length of Stay Turnover
July-28-14 August-03-14
User
Occupancy
Occupancy
Occupancy
User
User
User
User
Data to be Analyzed on
Alternative Report
Data to be Analyzed on
Alternative Report
Data to be Analyzed on
Alternative Report
Occupancy
Confidential Page 1 of 1 Summary Report Template FINAL Aug 3

Parking Data Analysis - Town of BanffData Collected for the Week of: to
SPECIAL REPORTS Length of Stay Turnover
Stalls # Avg (%) Peak Peak (time) HRS => 90% Avg (minutes) Avg (times)
User Paid Pilot 245 71% 98% 14:00 20 92 3.97
Zone A On-Street 276 70% 91% 14:00 4 91 4.35
Zone A Off-Street 559 64% 98% 14:00 5 94 3.21
Zone A Total 835 65% 95% 14:00 4 93 3.56
Zone B On-Street 351 46% 67% 13:00 0 108 2.03
Zone B Off-Street 34 76% 100% 13:00 25 90 4.06
Zone B Total 385 48% 70% 13:00 0 105 2.21
Zone C Total 360 50% 78% 14:00 0 157 1.74
Zone A,B,C Total 1580 58% 84% 14:00 0 104 2.80
Stalls # Avg (%) Peak Peak (time) HRS => 90% Avg (minutes) Avg (times) Visitor (%) Resident (%) Visitor (%) Resident (%)
Bear St (100) 31 68% 100% 14:00 17 96 4.13 72% 28% 78% 22%
Bear St (200) 55 69% 100% 13:00 25 108 3.37 78% 22% 76% 24%
Beaver St (200) 78 66% 100% 12:00 15 81 4.14 79% 21% 88% 12%
Beaver/Buffalo 54 65% 100% 14:00 17 98 3.37 82% 18% 80% 20%
Beaver/Caribou 27 82% 100% 14:00 36 86 5.70 71% 29% 93% 7%
Parks Canada 31 74% 100% 14:00 21 91 4.48 76% 24% 88% 12%
Bear Street Parkade 216 55% 100% 13:00 3 111 1.62 79% 23% 87% 13%
Central Park 67 62% 100% 13:00 13 83 4.95 83% 17% 88% 12%
Hospital 34 76% 100% 13:00 25 90 4.06 92% 8% 90% 10%
OFF-STREET 593
OFF-STREET AVERAGE 63% 100% 13:20 19.11 97 3.26 79% 21% 86% 14%
ZONE A - On-Street Length of Stay Turnover
Stalls # Avg (%) Peak Peak (time) HRS => 90% Avg (minutes) Avg (times) Visitor (%) Resident (%)
100 BEAR ST 35 68% 100% 15:00 18 111 3.44 88% 12%
100 BEAVER ST 50 62% 100% 14:00 6 106 3.08 74% 26%
100 CARIBOU ST 8 76% 100% 12:00 21 83 4.19 91% 9%
100 LYNX ST 14 65% 100% 13:00 14 75 4.72 96% 4%
100 WOLF ST 13 45% 100% 15:00 5 80 3.02 94% 6%
200 BEAR ST 41 63% 100% 11:00 14 72 4.41 93% 7%
200 BEAVER ST 37 75% 100% 12:00 19 116 3.66 77% 23%
200 BUFFALO ST 4 68% 100% 15:00 20 75 4.46 95% 5%
200 CARIBOU ST 12 89% 100% 11:00 45 82 9.38 93% 7%
200 LYNX ST 20 80% 100% 12:00 35 80 7.27 94% 6%
200 WOLF ST 17 82% 100% 13:00 30 79 5.51 94% 6%
300 CARIBOU ST 12 71% 100% 12:00 14 82 5.36 88% 12%
300 WOLF ST 13 79% 100% 13:00 30 81 5.27 96% 4%
ZONE A - TOTALS 276
ZONE A - AVERAGE 69% 100% 12:55 20.85 92 3.91 87% 13%
ZONE B - On-Street Length of Stay Turnover
Stalls # Avg (%) Peak Peak (time) HRS => 90% Avg (minutes) Avg (times) Visitor (%) Resident (%)
0 CARIBOU ST 13 58% 100% 14:00 7 100 2.90 90% 10%
0 WOLF ST 16 74% 100% 12:00 23 106 4.22 93% 7%
100 BOW AVE 41 64% 100% 14:00 9 93 1.59 100% 0%
200 BOW AVE 55 27% 82% 14:00 0 99 1.10 100% 0%
200 ELK ST 15 71% 100% 13:00 20 157 3.24 57% 43%
200 MOOSE ST 16 21% 69% 9:00 0 100 1.30 74% 26%
300 BANFF AVE 20 71% 100% 15:00 21 92 4.45 82% 18%
300 BEAVER ST 47 28% 85% 12:00 0 112 1.30 73% 27%
300 BOW AVE 15 30% 67% 13:00 0 75 1.90 96% 4%
300 MARTEN ST 62 34% 63% 15:00 0 85 2.02 84% 16%
300 MOOSE ST 12 59% 100% 13:00 6 207 1.90 48% 52%
300 SQUIRREL ST 39 65% 100% 14:00 12 140 2.43 51% 49%
ZONE B - TOTALS 351
ZONE B - AVERAGE 46% 89% 13:10 8.17 112 2.03 81% 19%
ZONE C - On-Street Length of Stay Turnover
Stalls # Avg (%) Peak Peak (time) HRS => 90% Avg (minutes) Avg (times) Visitor (%) Resident (%)
100 MUSKRAT ST 56 59% 100% 12:00 2 160 1.80 51% 49%
100 OTTER ST 56 35% 86% 8:00 0 163 1.03 39% 61%
200 MUSKRAT ST 46 46% 98% 14:00 1 145 1.64 53% 47%
200 OTTER ST 30 44% 100% 8:00 3 168 1.75 42% 58%
300 MUSKRAT ST 31 42% 71% 15:00 0 144 1.61 55% 45%
300 OTTER ST 13 26% 54% 17:00 0 142 1.36 41% 59%
400 BEAVER ST 28 67% 100% 17:00 5 204 2.84 38% 62%
400 BUFFALO ST 7 67% 100% 10:00 8 156 2.31 62% 38%
400 CARIBOU ST 20 79% 100% 13:00 26 168 2.22 66% 34%
400 MOOSE ST 8 57% 100% 13:00 3 161 1.48 63% 37%
400 WOLF ST 17 72% 100% 13:00 11 129 2.55 76% 24%
500 BUFFALO ST 9 67% 100% 11:00 8 146 2.02 60% 40%
500 CARIBOU ST 10 53% 100% 13:00 9 122 1.77 76% 24%
500 MOOSE ST 16 20% 44% 12:00 0 173 0.61 60% 40%
500 WOLF ST 13 57% 100% 13:00 8 111 2.56 84% 16%
ZONE C - TOTALS 360
ZONE C - AVERAGE 50% 90% 12:36 5.60 157 1.74 53% 47%
July-03-15 July-09-15
Total Vehicles
Occupancy
Occupancy
Occupancy
User
User
User
Occupancy
OFF-STREET Occupancy Length of Stay TurnoverUser
Stall Utilization
Confidential Page 1 of 1 Banff Report July 3-9, 2015
Parking Data Analysis - Town of BanffData Collected for the Week of: to
SPECIAL REPORTS Length of Stay Turnover
Stalls # Avg (%) Peak Peak (time) HRS => 90% Avg (minutes) Avg (times)
User Paid Pilot 245 70% 100% 14:00 20 86 3.85
Zone A On-Street 276 71% 92% 13:00 3 83 4.42
Zone A Off-Street 559 66% 99% 14:00 13 86 3.20
Zone A Total 835 68% 95% 14:00 8 85 3.58
Zone B On-Street 351 49% 76% 14:00 0 95 2.26
Zone B Off-Street 34 77% 100% 13:00 25 80 4.10
Zone B Total 385 51% 76% 14:00 0 93 2.43
Zone C Total 360 54% 82% 14:00 0 149 1.82
Zone A,B,C Total 1580 60% 87% 14:00 0 96 2.88
Stalls # Avg (%) Peak Peak (time) HRS => 90% Avg (minutes) Avg (times) Visitor (%) Resident (%) Visitor (%) Resident (%)
Bear St (100) 31 74% 100% 14:00 22 93 4.24 91% 9% 82% 18%
Bear St (200) 55 73% 100% 14:00 15 79 3.54 88% 12% 82% 18%
Beaver St (200) 78 66% 100% 14:00 16 83 3.57 91% 9% 94% 6%
Beaver/Buffalo 54 67% 100% 14:00 20 92 4.02 93% 7% 91% 9%
Beaver/Caribou 27 77% 100% 14:00 27 81 5.51 97% 3% 91% 9%
Parks Canada 31 74% 100% 13:00 24 84 4.37 90% 10% 91% 9%
Bear Street Parkade 216 58% 100% 14:00 8 94 1.81 79% 23% 87% 13%
Central Park 67 75% 100% 14:00 30 79 4.81 83% 17% 88% 12%
Hospital 34 77% 100% 13:00 25 80 4.10 92% 8% 90% 10%
OFF-STREET 593
OFF-STREET AVERAGE 67% 100% 13:46 20.78 87 3.26 86% 14% 88% 12%
ZONE A - On-Street Length of Stay Turnover
Stalls # Avg (%) Peak Peak (time) HRS => 90% Avg (minutes) Avg (times) Visitor (%) Resident (%)
100 BEAR ST 35 61% 100% 14:00 6 86 3.61 96% 4%
100 BEAVER ST 50 66% 100% 15:00 8 107 2.86 76% 24%
100 CARIBOU ST 8 80% 100% 13:00 31 79 4.04 84% 16%
100 LYNX ST 14 71% 100% 13:00 22 73 4.56 98% 2%
100 WOLF ST 13 57% 92% 15:00 3 71 3.51 99% 1%
200 BEAR ST 41 72% 100% 13:00 18 71 4.94 92% 8%
200 BEAVER ST 37 73% 100% 14:00 14 108 3.40 78% 22%
200 BUFFALO ST 4 67% 100% 12:00 19 74 4.54 95% 5%
200 CARIBOU ST 12 90% 100% 9:00 44 78 9.27 91% 9%
200 LYNX ST 20 77% 100% 13:00 28 72 7.91 96% 4%
200 WOLF ST 17 83% 100% 14:00 24 74 6.18 93% 7%
300 CARIBOU ST 12 68% 100% 11:00 17 75 5.00 93% 7%
300 WOLF ST 13 79% 100% 13:00 28 73 5.87 96% 4%
ZONE A - TOTALS 276
ZONE A - AVERAGE 71% 99% 13:00 20.15 85 3.97 89% 11%
ZONE B - On-Street Length of Stay Turnover
Stalls # Avg (%) Peak Peak (time) HRS => 90% Avg (minutes) Avg (times) Visitor (%) Resident (%)
0 CARIBOU ST 13 62% 100% 15:00 7 77 3.24 86% 14%
0 WOLF ST 16 83% 100% 12:00 35 84 6.05 95% 5%
100 BOW AVE 41 68% 100% 12:00 25 87 2.63 93% 7%
200 BOW AVE 55 38% 93% 14:00 3 78 1.52 100% 0%
200 ELK ST 15 77% 100% 11:00 21 146 3.30 59% 41%
200 MOOSE ST 16 24% 56% 9:00 0 96 1.38 83% 17%
300 BANFF AVE 20 72% 100% 13:00 21 82 4.37 82% 18%
300 BEAVER ST 47 30% 57% 13:00 0 109 1.22 71% 29%
300 BOW AVE 15 36% 73% 14:00 0 80 2.08 97% 3%
300 MARTEN ST 62 32% 77% 14:00 0 84 1.80 84% 16%
300 MOOSE ST 12 61% 100% 13:00 8 159 2.14 64% 36%
300 SQUIRREL ST 39 65% 100% 14:00 6 125 2.27 56% 44%
ZONE B - TOTALS 351
ZONE B - AVERAGE 49% 88% 12:50 10.50 99 2.26 82% 18%
ZONE C - On-Street Length of Stay Turnover
Stalls # Avg (%) Peak Peak (time) HRS => 90% Avg (minutes) Avg (times) Visitor (%) Resident (%)
100 MUSKRAT ST 56 71% 100% 13:00 8 159 2.07 46% 54%
100 OTTER ST 56 38% 78% 12:00 0 157 1.04 45% 55%
200 MUSKRAT ST 46 46% 93% 14:00 1 147 1.58 55% 45%
200 OTTER ST 30 46% 90% 9:00 1 155 1.63 44% 56%
300 MUSKRAT ST 31 43% 68% 14:00 0 144 1.62 55% 45%
300 OTTER ST 13 29% 85% 9:00 0 133 1.53 47% 53%
400 BEAVER ST 28 76% 100% 13:00 15 175 2.94 40% 60%
400 BUFFALO ST 7 78% 100% 14:00 20 150 2.73 66% 34%
400 CARIBOU ST 20 79% 100% 14:00 32 166 2.29 62% 38%
400 MOOSE ST 8 63% 100% 14:00 7 125 2.25 74% 26%
400 WOLF ST 17 69% 100% 15:00 7 110 2.40 77% 23%
500 BUFFALO ST 9 71% 100% 12:00 9 140 2.29 64% 36%
500 CARIBOU ST 10 56% 100% 15:00 12 120 2.10 72% 28%
500 MOOSE ST 16 13% 38% 12:00 0 130 0.52 85% 15%
500 WOLF ST 13 64% 100% 12:00 9 115 2.48 74% 26%
ZONE C - TOTALS 360
ZONE C - AVERAGE 54% 90% 12:48 8.07 150 1.82 54% 46%
OFF-STREET Occupancy Length of Stay TurnoverUser
Stall Utilization
User
User
User
Occupancy
July-30-15 August-05-15
Total Vehicles
Occupancy
Occupancy
Occupancy
Confidential Page 1 of 1 Banff Report July 30-Aug 5, 2015
Parking Data Analysis - Town of BanffData Collected for the Week of: to
SPECIAL REPORTS Length of Stay Turnover
Stalls # Avg (%) Peak Peak (time) HRS => 90% Avg (minutes) Avg (times) Notes:
User Paid Pilot 245 64% 93% 13:00 4 83 3.51
Zone A On-Street 276 71% 91% 14:00 4 89 4.50
Zone A Off-Street 559 61% 92% 13:00 1 90 2.97
Zone A Total 835 64% 89% 13:00 1 90 3.44
Zone B On-Street 351 52% 78% 14:00 0 120 2.30
Zone B Off-Street 34 76% 100% 14:00 33 93 4.42
Zone B Total 385 54% 80% 14:00 0 116 2.48
Zone C Total 360 56% 77% 14:00 0 176 1.92
Zone A,B,C Total 1580 60% 82% 14:00 0 109 2.80
Stalls # Avg (%) Peak Peak (time) HRS => 90% Avg (minutes) Avg (times) Visitor (%) Resident (%) Visitor (%) Resident (%)
Bear St (100) 31 68% 100% 14:00 12 86 3.99 90% 10% 79% 21%
Bear St (200) 55 78% 100% 13:00 13 84 4.14 87% 13% 78% 22%
Beaver St (200) 78 63% 100% 12:00 15 79 3.71 92% 8% 85% 15%
Beaver/Buffalo 54 53% 92% 13:00 1 82 2.87 94% 6% 87% 13%
Beaver/Caribou 27 63% 100% 11:00 6 91 3.56 93% 7% 82% 18%
Parks Canada 31 64% 100% 14:00 4 78 3.94 91% 9% 83% 17%
Bear Street Parkade 216 55% 94% 13:00 2 115 1.70 91% 9% 71% 29%
Central Park 67 71% 100% 12:00 20 85 4.61 95% 5% 85% 15%
Hospital 34 76% 100% 14:00 33 93 4.42 92% 8% 90% 10%
OFF-STREET 593
OFF-STREET AVERAGE 62% 98% 12:53 11.78 94 3.05 92% 8% 79% 21%
ZONE A - On-Street Length of Stay Turnover
Stalls # Avg (%) Peak Peak (time) HRS => 90% Avg (minutes) Avg (times) Visitor (%) Resident (%)
100 BEAR ST 35 72% 100% 12:00 24 74 4.74 92% 8%
100 BEAVER ST 50 65% 98% 14:00 11 141 2.76 73% 27%
100 CARIBOU ST 8 52% 100% 13:00 3 69 3.44 99% 1%
100 LYNX ST 14 80% 100% 12:00 40 81 4.87 97% 3%
100 WOLF ST 13 42% 92% 10:00 1 73 3.19 97% 3%
200 BEAR ST 41 72% 100% 10:00 20 77 5.61 91% 9%
200 BEAVER ST 37 76% 100% 12:00 31 117 3.55 81% 19%
200 BUFFALO ST 4 70% 100% 11:00 17 67 4.04 99% 1%
200 CARIBOU ST 12 86% 100% 12:00 43 82 7.88 91% 9%
200 LYNX ST 20 82% 100% 12:00 40 77 9.49 93% 7%
200 WOLF ST 17 80% 100% 11:00 29 81 5.50 93% 7%
300 CARIBOU ST 12 57% 100% 12:00 8 80 4.11 90% 10%
300 WOLF ST 13 81% 100% 11:00 32 75 5.74 93% 7%
ZONE A - TOTALS 276
ZONE A - AVERAGE 71% 99% 11:41 23.00 93 4.04 88% 12%
ZONE B - On-Street Length of Stay Turnover
Stalls # Avg (%) Peak Peak (time) HRS => 90% Avg (minutes) Avg (times) Visitor (%) Resident (%)
0 CARIBOU ST 13 26% 85% 12:00 0 83 1.29 98% 2%
0 WOLF ST 16 75% 100% 14:00 32 113 4.26 92% 8%
100 BOW AVE 41 72% 100% 14:00 31 110 3.20 88% 12%
200 BOW AVE 55 42% 84% 14:00 0 102 1.92 90% 10%
200 ELK ST 15 85% 100% 11:00 45 215 3.11 59% 41%
200 MOOSE ST 16 44% 88% 11:00 0 124 1.91 68% 32%
300 BANFF AVE 20 65% 100% 13:00 22 82 4.33 89% 11%
300 BEAVER ST 47 37% 77% 14:00 0 148 1.38 74% 26%
300 BOW AVE 15 35% 87% 13:00 0 73 1.96 95% 5%
300 MARTEN ST 62 37% 65% 11:00 0 97 2.08 84% 16%
300 MOOSE ST 12 62% 100% 9:00 12 197 2.07 46% 54%
300 SQUIRREL ST 39 66% 100% 11:00 5 180 2.10 55% 45%
ZONE B - TOTALS 351
ZONE B - AVERAGE 51% 91% 12:15 12.25 129 2.30 79% 21%
ZONE C - On-Street Length of Stay Turnover
Stalls # Avg (%) Peak Peak (time) HRS => 90% Avg (minutes) Avg (times) Visitor (%) Resident (%)
100 MUSKRAT ST 56 67% 100% 15:00 2 218 1.78 51% 49%
100 OTTER ST 56 39% 61% 8:00 0 193 1.15 41% 59%
200 MUSKRAT ST 46 56% 91% 14:00 1 173 1.75 62% 38%
200 OTTER ST 30 51% 100% 8:00 1 166 1.91 50% 50%
300 MUSKRAT ST 31 42% 74% 14:00 0 165 1.51 59% 41%
300 OTTER ST 13 37% 85% 16:00 0 143 1.56 37% 63%
400 BEAVER ST 28 65% 96% 12:00 3 222 2.97 38% 62%
400 BUFFALO ST 7 76% 100% 14:00 21 179 2.51 69% 31%
400 CARIBOU ST 20 74% 100% 13:00 24 159 2.67 63% 37%
400 MOOSE ST 8 87% 100% 8:00 34 183 3.14 56% 44%
400 WOLF ST 17 72% 100% 14:00 14 138 2.53 71% 29%
500 BUFFALO ST 9 70% 100% 14:00 17 135 2.81 74% 26%
500 CARIBOU ST 10 57% 100% 14:00 11 142 2.37 78% 22%
500 MOOSE ST 16 30% 56% 9:00 0 180 0.96 46% 54%
500 WOLF ST 13 63% 100% 14:00 17 116 2.67 80% 20%
ZONE C - TOTALS 360
ZONE C - AVERAGE 56% 91% 12:28 9.67 179 1.92 54% 46%
OFF-STREET Occupancy Length of Stay TurnoverUser
Stall Utilization
User
User
User
Occupancy
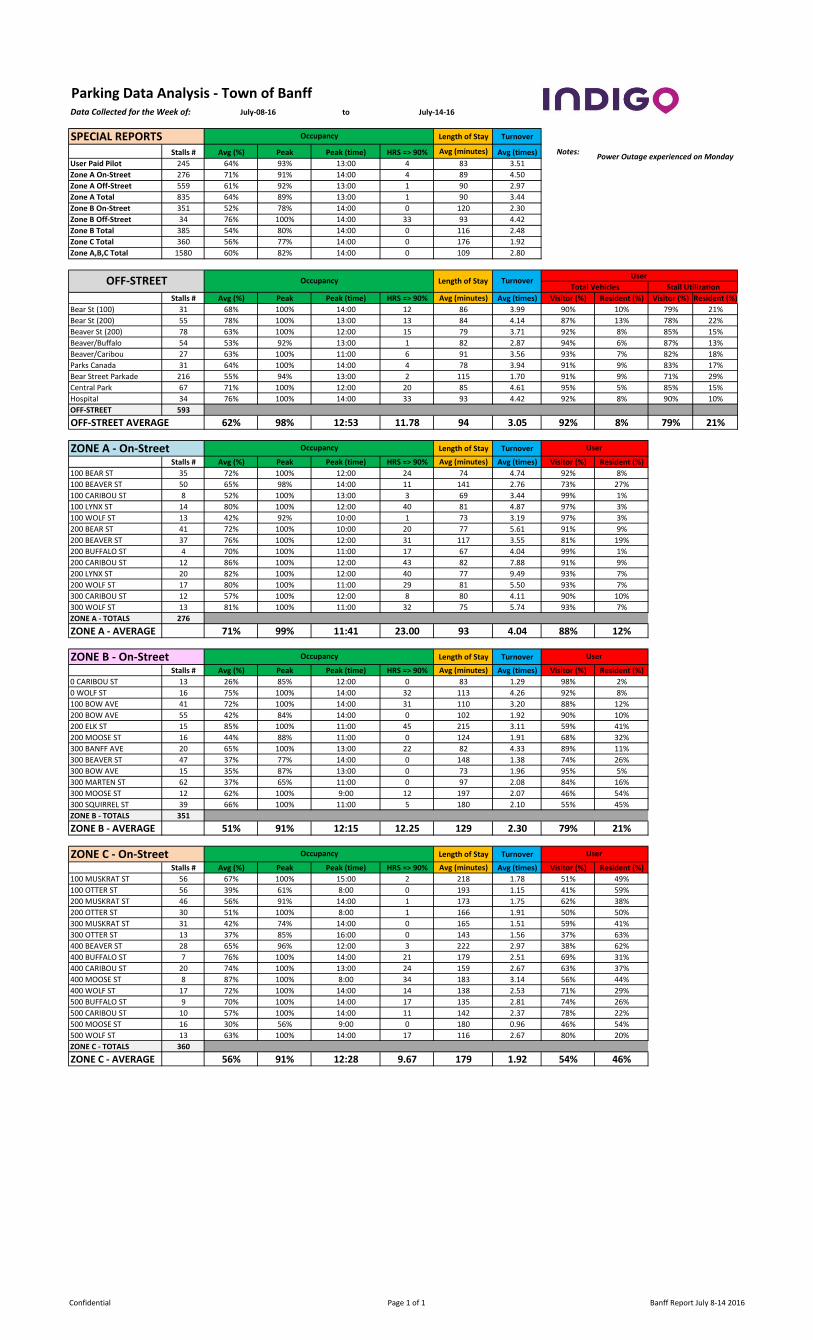
July-08-16 July-14-16
Total Vehicles
Occupancy
Occupancy
Occupancy
Power Outage experienced on Monday
Confidential Page 1 of 1 Banff Report July 8-14 2016
Parking Data Analysis - Town of BanffData Collected for the Week of: to
SPECIAL REPORTS Length of Stay Turnover
Stalls # Avg (%) Peak Peak (time) HRS => 90% Avg (minutes) Avg (times)
User Paid Pilot 245 64% 98% 13:00 12 80 3.45
Zone A On-Street 276 70% 92% 14:00 3 88 4.54
Zone A Off-Street 559 64% 92% 13:00 4 91 3.01
Zone A Total 835 66% 91% 13:00 2 89 3.48
Zone B On-Street 351 53% 76% 14:00 0 111 2.43
Zone B Off-Street 34 79% 100% 11:00 38 93 4.27
Zone B Total 385 56% 78% 14:00 0 108 2.59
Zone C Total 360 56% 81% 14:00 0 169 2.05
Zone A,B,C Total 1580 61% 83% 14:00 0 107 2.88
Stalls # Avg (%) Peak Peak (time) HRS => 90% Avg (minutes) Avg (times) Visitor (%) Resident (%) Visitor (%) Resident (%)
Bear St (100) 31 67% 100% 13:00 15 82 3.86 93% 7% 84% 16%
Bear St (200) 55 77% 100% 12:00 17 84 4.01 86% 14% 75% 25%
Beaver St (200) 78 62% 100% 14:00 21 76 3.69 92% 8% 85% 15%
Beaver/Buffalo 54 57% 100% 13:00 6 76 2.94 97% 3% 91% 9%
Beaver/Caribou 27 61% 100% 15:00 3 84 3.31 96% 4% 87% 13%
Parks Canada 31 66% 100% 13:00 13 83 3.72 90% 10% 79% 21%
Bear Street Parkade 216 58% 90% 13:00 2 119 1.88 92% 8% 81% 19%
Central Park 67 79% 100% 11:00 31 86 4.75 94% 6% 85% 15%
Hospital 34 79% 100% 11:00 38 93 4.27 93% 7% 87% 13%
OFF-STREET 593
OFF-STREET AVERAGE 65% 99% 12:46 16.22 95 3.08 92% 8% 83% 17%
ZONE A - On-Street Length of Stay Turnover
Stalls # Avg (%) Peak Peak (time) HRS => 90% Avg (minutes) Avg (times) Visitor (%) Resident (%)
100 BEAR ST 35 76% 100% 15:00 24 79 4.82 95% 5%
100 BEAVER ST 50 64% 100% 14:00 11 135 2.77 76% 24%
100 CARIBOU ST 8 51% 100% 11:00 9 72 2.77 95% 5%
100 LYNX ST 14 78% 100% 14:00 33 74 5.23 97% 3%
100 WOLF ST 13 52% 100% 15:00 5 72 3.90 98% 2%
200 BEAR ST 41 74% 100% 13:00 20 71 6.03 91% 9%
200 BEAVER ST 37 72% 100% 14:00 22 111 3.41 85% 15%
200 BUFFALO ST 4 48% 100% 14:00 7 70 3.25 100% 0%
200 CARIBOU ST 12 83% 100% 14:00 43 92 7.20 89% 11%
200 LYNX ST 20 81% 100% 15:00 40 75 9.70 96% 4%
200 WOLF ST 17 80% 100% 13:00 32 80 5.99 94% 6%
300 CARIBOU ST 12 59% 100% 14:00 12 76 4.49 93% 7%
300 WOLF ST 13 77% 100% 13:00 25 77 5.37 95% 5%
ZONE A - TOTALS 276
ZONE A - AVERAGE 71% 100% 13:46 21.77 91 4.08 90% 10%
ZONE B - On-Street Length of Stay Turnover
Stalls # Avg (%) Peak Peak (time) HRS => 90% Avg (minutes) Avg (times) Visitor (%) Resident (%)
0 CARIBOU ST 13 7% 85% 11:00 0 84 0.57 96% 4%
0 WOLF ST 16 67% 100% 14:00 19 90 3.38 94% 6%
100 BOW AVE 41 70% 100% 15:00 31 111 3.18 91% 9%
200 BOW AVE 55 44% 87% 16:00 0 100 2.04 93% 7%
200 ELK ST 15 87% 100% 12:00 45 200 3.15 62% 38%
200 MOOSE ST 16 50% 94% 10:00 1 107 2.49 84% 16%
300 BANFF AVE 20 67% 100% 13:00 24 74 4.90 93% 7%
300 BEAVER ST 47 36% 70% 14:00 0 118 1.66 81% 19%
300 BOW AVE 15 48% 100% 13:00 10 72 2.95 92% 8%
300 MARTEN ST 62 39% 68% 12:00 0 93 2.21 84% 16%
300 MOOSE ST 12 55% 92% 9:00 4 190 1.79 47% 53%
300 SQUIRREL ST 39 68% 100% 9:00 8 166 2.35 57% 43%
ZONE B - TOTALS 351
ZONE B - AVERAGE 51% 91% 12:20 11.83 119 2.43 82% 18%
ZONE C - On-Street Length of Stay Turnover
Stalls # Avg (%) Peak Peak (time) HRS => 90% Avg (minutes) Avg (times) Visitor (%) Resident (%)
100 MUSKRAT ST 56 66% 96% 14:00 3 206 1.93 51% 49%
100 OTTER ST 56 35% 71% 8:00 0 174 1.18 44% 56%
200 MUSKRAT ST 46 56% 98% 14:00 4 142 2.07 64% 36%
200 OTTER ST 30 64% 100% 14:00 20 182 2.17 46% 54%
300 MUSKRAT ST 31 42% 74% 14:00 0 159 1.60 50% 50%
300 OTTER ST 13 51% 100% 9:00 9 151 2.08 41% 59%
400 BEAVER ST 28 64% 100% 11:00 5 219 2.93 45% 55%
400 BUFFALO ST 7 79% 100% 11:00 23 195 2.51 76% 24%
400 CARIBOU ST 20 72% 100% 14:00 17 175 2.44 69% 31%
400 MOOSE ST 8 87% 100% 10:00 32 163 3.66 58% 42%
400 WOLF ST 17 65% 100% 12:00 6 136 2.29 78% 22%
500 BUFFALO ST 9 67% 100% 14:00 11 135 2.67 79% 21%
500 CARIBOU ST 10 67% 100% 14:00 18 138 3.44 71% 29%
500 MOOSE ST 16 32% 88% 14:00 0 159 1.20 63% 37%
500 WOLF ST 13 64% 100% 12:00 13 117 2.68 75% 25%
ZONE C - TOTALS 360
ZONE C - AVERAGE 56% 95% 12:20 10.73 171.989482 2.05 56% 44%
OFF-STREET Occupancy Length of Stay TurnoverUser
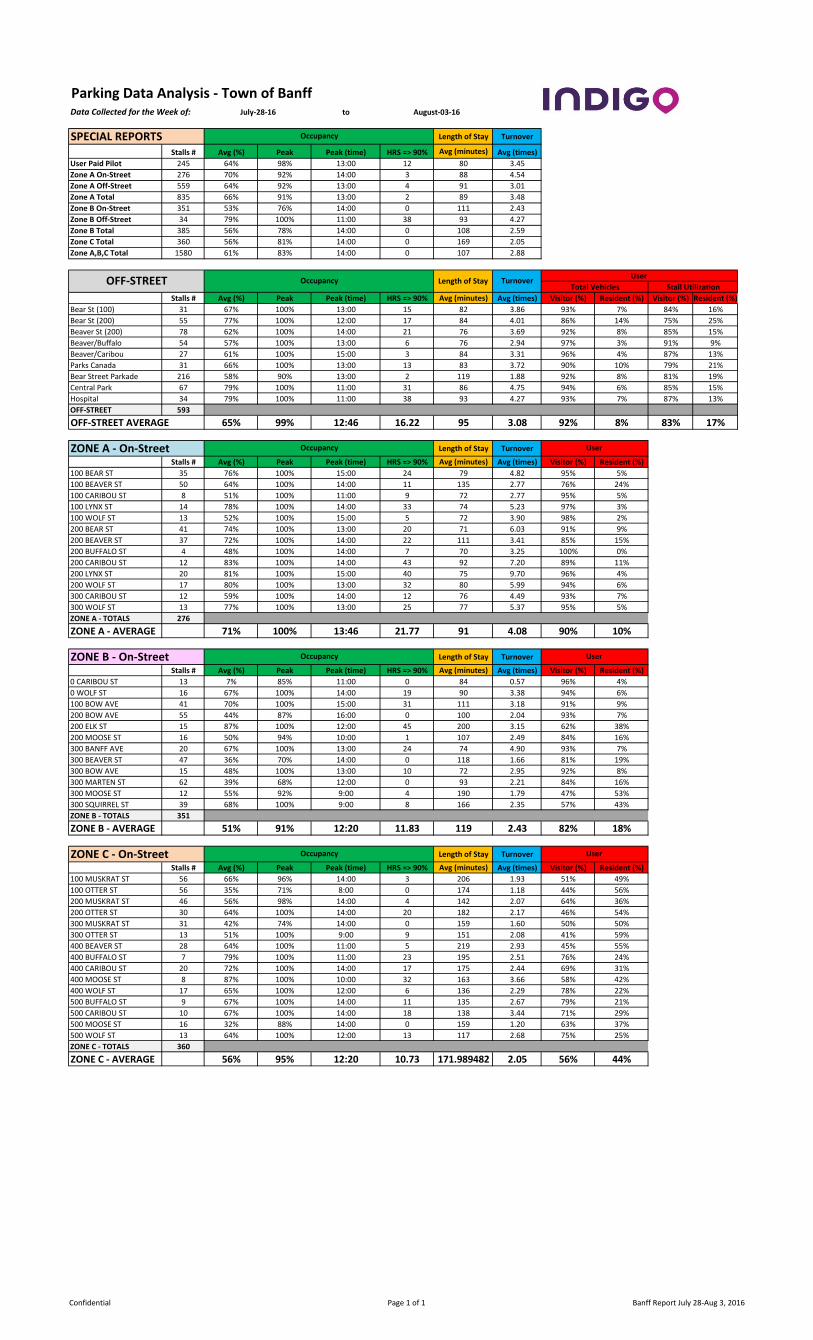
Stall Utilization
User
User
User
Occupancy
July-28-16 August-03-16
Total Vehicles
Occupancy
Occupancy
Occupancy
Confidential Page 1 of 1 Banff Report July 28-Aug 3, 2016
Data Collected for the Week of: to
Length of Stay Turnover
Stalls # Avg (%) Peak Peak (time) HRS => 90% Avg (minutes) Avg (times) Notes:
User Paid Pilot 245 68% 95% 13:00 12 82 3.73
Zone A On-Street 276 72% 92% 16:00 6 90 4.74
Zone A Off-Street 559 65% 96% 13:00 8 90 3.17
Zone A Total 835 67% 92% 13:00 3 90 3.67
Zone B On-Street 351 58% 84% 13:00 0 123 2.59
Zone B Off-Street 34 79% 100% 15:00 30 99 4.31
Zone B Total 385 60% 85% 13:00 0 120 2.74
Zone C Total 360 62% 79% 14:00 0 195 2.04
Zone A,B,C Total 1580 64% 85% 13:00 0 113 3.03
Stalls # Avg (%) Peak Peak (time) HRS => 90% Avg (minutes) Avg (times) Visitor (%) Resident (%) Visitor (%) Resident (%)
Bear St (100) 31 72% 100% 14:00 22 79 4.45 89% 11% 84% 16%
Bear St (200) 55 77% 100% 15:00 20 84 4.03 91% 9% 87% 14%
Beaver St (200) 78 65% 100% 12:00 17 83 3.82 90% 10% 85% 15%
Beaver/Buffalo 54 58% 100% 13:00 6 81 2.99 91% 9% 86% 14%
Beaver/Caribou 27 77% 100% 13:00 23 86 4.72 94% 6% 90% 10%
Parks Canada 31 64% 97% 13:00 7 77 4.17 93% 7% 88% 12%
Bear Street Parkade 216 59% 100% 13:00 7 116 2.02 78% 22% 60% 40%
Central Park 67 74% 100% 13:00 24 78 4.37 95% 5% 85% 15%
Hospital 34 79% 100% 15:00 30 99 4.31 92% 8% 90% 10%
OFF-STREET 593
66% 100% 13:26 17.33 94 3.24 87% 13% 77% 23%
ZONE A - On-Street Length of Stay Turnover
Stalls # Avg (%) Peak Peak (time) HRS => 90% Avg (minutes) Avg (times) Visitor (%) Resident (%)
100 BEAR ST 35 78% 100% 14:00 40 81 4.88 93% 7%
100 BEAVER ST 50 67% 100% 16:00 12 123 3.32 80% 20%
100 CARIBOU ST 8 65% 100% 12:00 15 74 2.96 97% 3%
100 LYNX ST 14 77% 100% 16:00 41 87 5.27 98% 2%
100 WOLF ST 13 41% 92% 11:00 1 72 3.27 98% 2%
200 BEAR ST 41 75% 100% 13:00 28 76 6.16 91% 9%
200 BEAVER ST 37 76% 100% 16:00 23 127 3.70 84% 16%
200 BUFFALO ST 4 74% 100% 11:00 25 68 5.43 98% 2%
200 CARIBOU ST 12 88% 100% 14:00 51 92 8.90 89% 11%
200 LYNX ST 20 69% 100% 12:00 24 76 5.77 94% 6%
200 WOLF ST 17 84% 100% 15:00 35 78 6.41 94% 6%
300 CARIBOU ST 12 65% 100% 13:00 20 78 5.11 97% 3%
300 WOLF ST 13 73% 100% 14:00 23 76 5.12 96% 4%
ZONE A - TOTALS 276
ZONE A - AVERAGE 72% 99% 13:36 26.00 93 4.43 90% 10%
ZONE B - On-Street Length of Stay Turnover
Stalls # Avg (%) Peak Peak (time) HRS => 90% Avg (minutes) Avg (times) Visitor (%) Resident (%)
0 CARIBOU ST 13 65% 100% 13:00 18 82 3.45 95% 5%
0 WOLF ST 16 72% 100% 16:00 17 109 3.81 92% 8%
100 BOW AVE 41 79% 100% 16:00 42 134 3.47 84% 16%
200 BOW AVE 55 53% 89% 14:00 0 125 2.42 87% 13%
200 ELK ST 15 88% 100% 15:00 46 147 3.40 62% 38%
200 MOOSE ST 16 41% 75% 13:00 0 102 2.17 86% 14%
300 BANFF AVE 20 59% 100% 14:00 16 72 4.35 94% 6%
300 BEAVER ST 47 49% 100% 13:00 1 157 1.86 74% 26%
300 BOW AVE 15 48% 100% 13:00 4 83 2.31 96% 4%
300 MARTEN ST 62 44% 71% 17:00 0 101 2.46 85% 15%
300 MOOSE ST 12 72% 100% 13:00 10 219 1.96 48% 52%
300 SQUIRREL ST 39 70% 100% 9:00 2 194 2.38 57% 43%
ZONE B - TOTALS 351
ZONE B - AVERAGE 59% 95% 13:50 13.00 133 2.59 80% 20%
ZONE C - On-Street Length of Stay Turnover
Stalls # Avg (%) Peak Peak (time) HRS => 90% Avg (minutes) Avg (times) Visitor (%) Resident (%)
100 MUSKRAT ST 56 66% 96% 16:00 4 207 1.98 57% 43%
100 OTTER ST 56 44% 86% 16:00 0 235 1.17 47% 53%
200 MUSKRAT ST 46 64% 91% 13:00 2 202 1.99 60% 40%
200 OTTER ST 30 60% 100% 14:00 6 196 2.05 48% 52%
300 MUSKRAT ST 31 53% 77% 16:00 0 195 1.71 60% 40%
300 OTTER ST 13 30% 77% 17:00 0 156 1.40 54% 46%
400 BEAVER ST 28 85% 100% 9:00 39 229 2.81 43% 57%
400 BUFFALO ST 7 74% 100% 14:00 16 185 2.43 69% 31%
400 CARIBOU ST 20 75% 100% 11:00 24 186 2.62 65% 35%
400 MOOSE ST 8 93% 100% 17:00 48 154 3.75 55% 45%
400 WOLF ST 17 70% 100% 14:00 11 166 2.52 71% 29%
500 BUFFALO ST 9 74% 100% 15:00 24 170 2.44 67% 33%
500 CARIBOU ST 10 63% 100% 12:00 17 180 2.60 61% 39%
500 MOOSE ST 16 49% 100% 12:00 1 228 1.42 55% 45%
500 WOLF ST 13 74% 100% 17:00 25 140 3.34 80% 20%
ZONE C - TOTALS 360
ZONE C - AVERAGE 62% 95% 14:12 14.47 199 2.04 57% 43%
Total Vehicles
Occupancy
Occupancy
Occupancy
User
Stall Utilization
300 Squirrel was closed Friday and most
of Saturday for construction
Turnover
Occupancy
Length of Stay
User
User
User
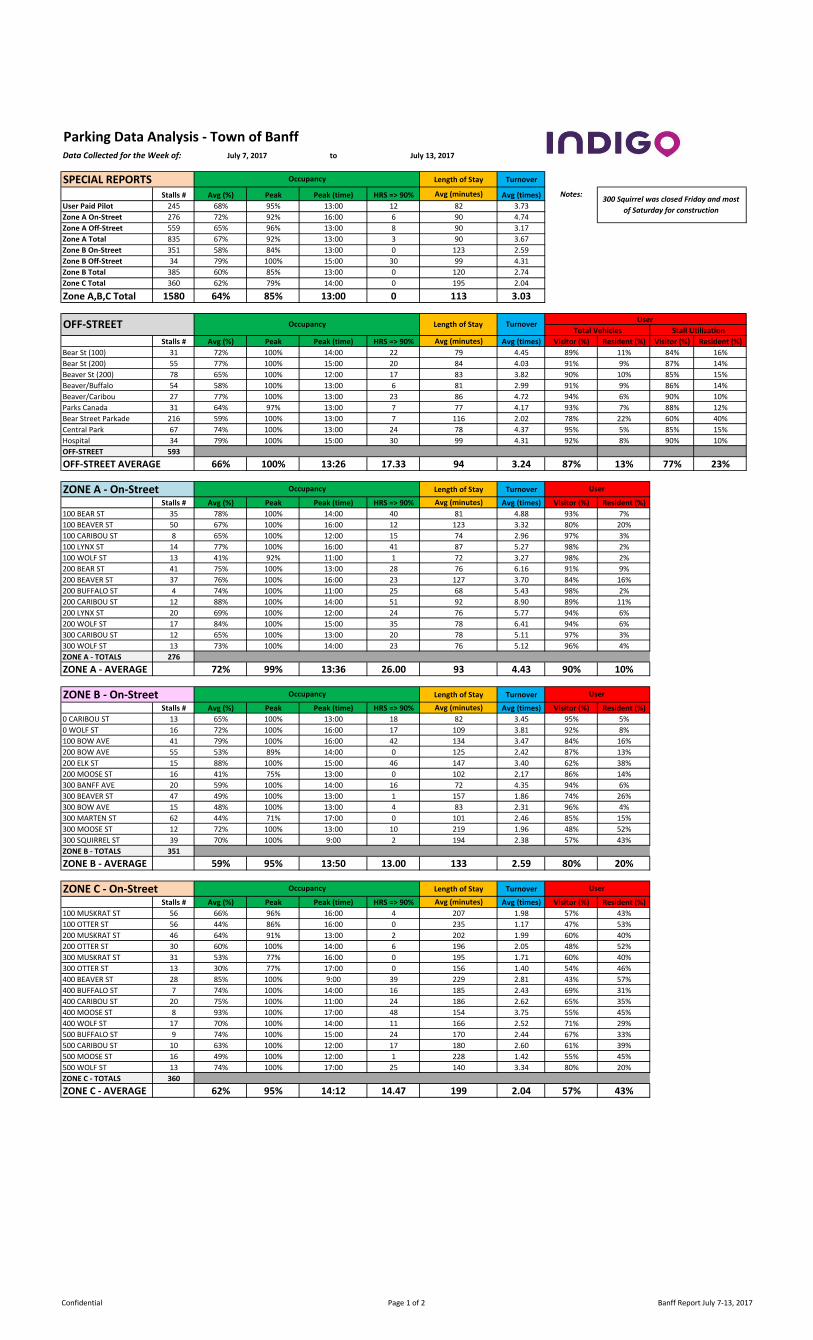
Parking Data Analysis - Town of Banff
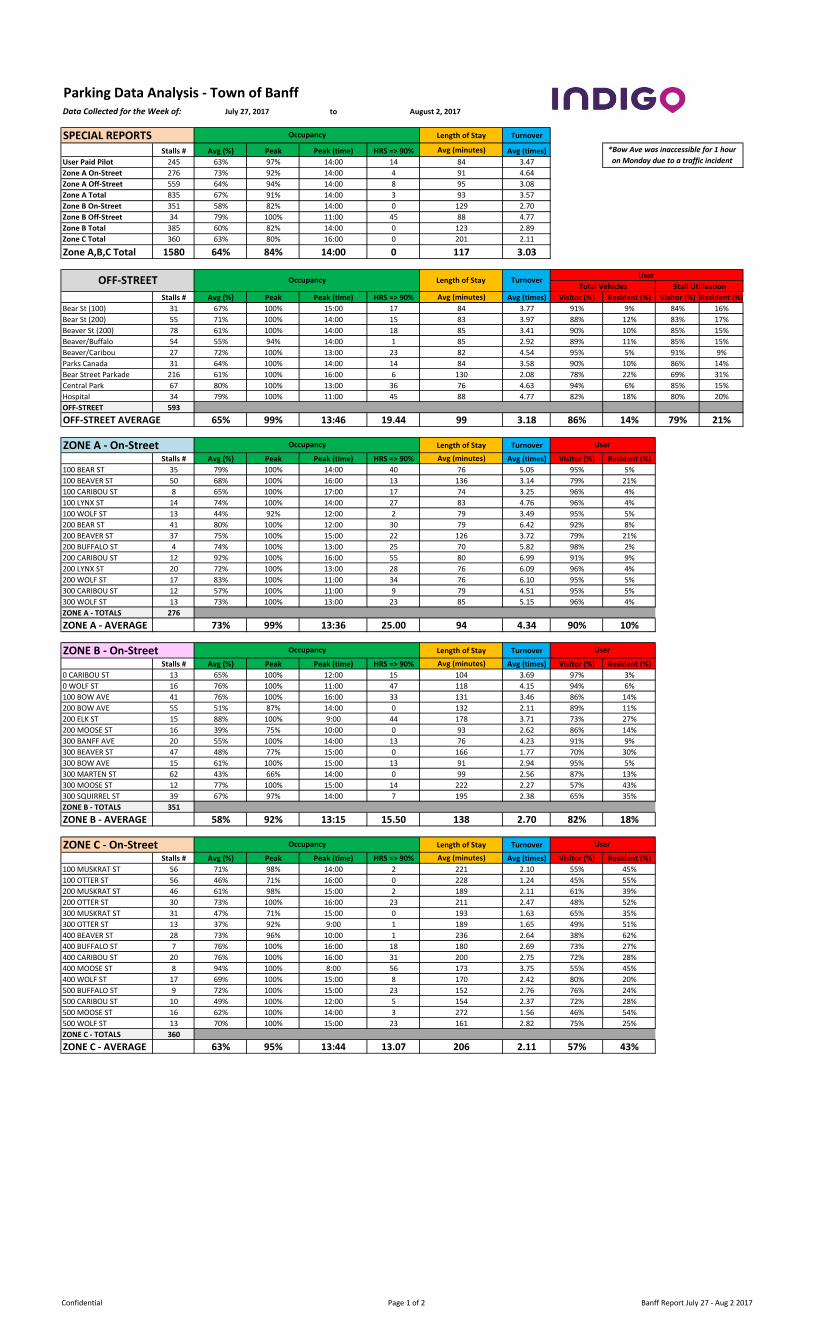
SPECIAL REPORTS
OFF-STREET AVERAGE
OFF-STREET Occupancy
July 7, 2017 July 13, 2017
Confidential Page 1 of 2 Banff Report July 7-13, 2017
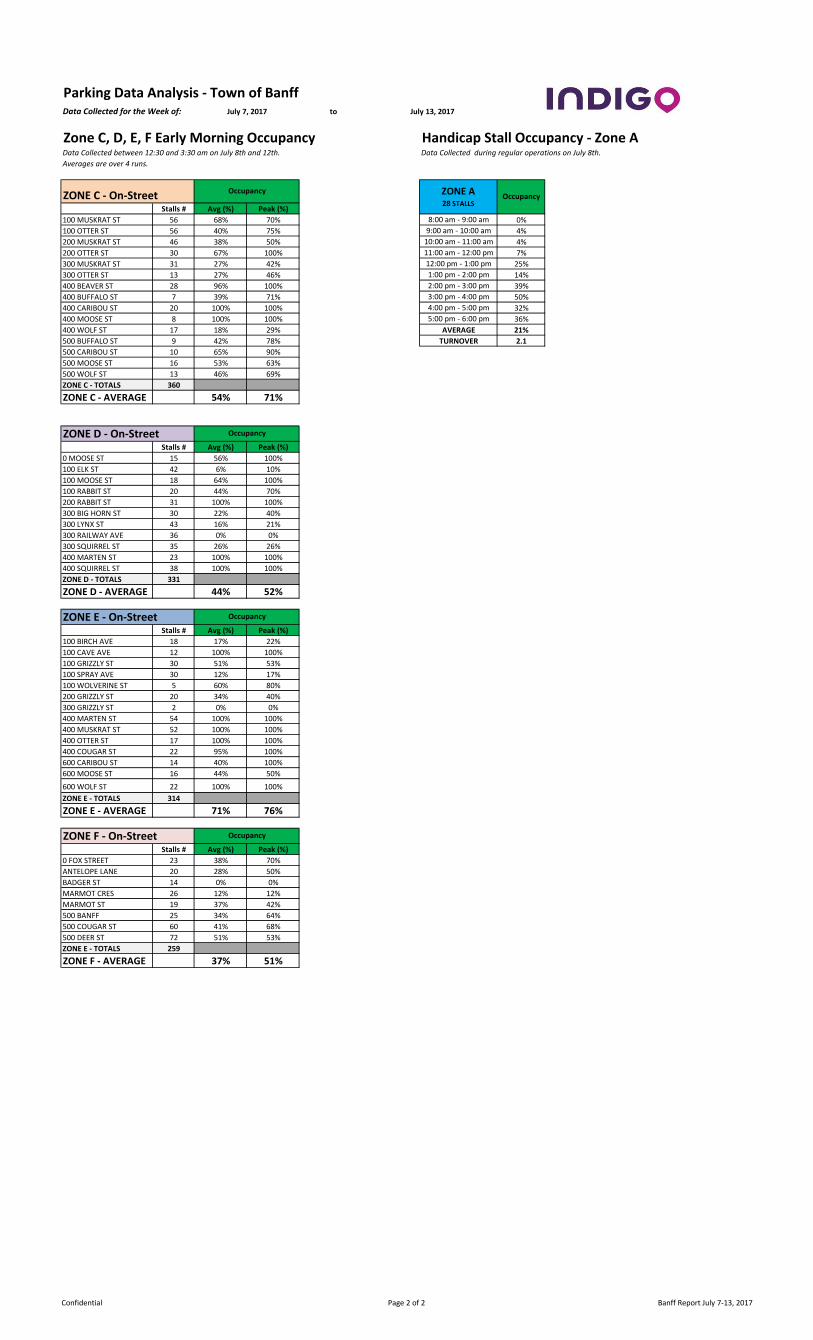
Data Collected for the Week of: to
Parking Data Analysis - Town of BanffJuly 7, 2017 July 13, 2017
Zone C, D, E, F Early Morning Occupancy Handicap Stall Occupancy - Zone AData Collected between 12:30 and 3:30 am on July 8th and 12th. Data Collected during regular operations on July 8th.
Averages are over 4 runs.
ZONE C - On-Street Stalls # Avg (%) Peak (%)
100 MUSKRAT ST 56 68% 70% 8:00 am - 9:00 am 0%
100 OTTER ST 56 40% 75% 9:00 am - 10:00 am 4%
200 MUSKRAT ST 46 38% 50% 10:00 am - 11:00 am 4%
200 OTTER ST 30 67% 100% 11:00 am - 12:00 pm 7%
300 MUSKRAT ST 31 27% 42% 12:00 pm - 1:00 pm 25%
300 OTTER ST 13 27% 46% 1:00 pm - 2:00 pm 14%
400 BEAVER ST 28 96% 100% 2:00 pm - 3:00 pm 39%
400 BUFFALO ST 7 39% 71% 3:00 pm - 4:00 pm 50%
400 CARIBOU ST 20 100% 100% 4:00 pm - 5:00 pm 32%
400 MOOSE ST 8 100% 100% 5:00 pm - 6:00 pm 36%
400 WOLF ST 17 18% 29% AVERAGE 21%
500 BUFFALO ST 9 42% 78% TURNOVER 2.1
500 CARIBOU ST 10 65% 90%
500 MOOSE ST 16 53% 63%
500 WOLF ST 13 46% 69%
ZONE C - TOTALS 360
ZONE C - AVERAGE 54% 71%
ZONE D - On-Street Stalls # Avg (%) Peak (%)
0 MOOSE ST 15 56% 100%
100 ELK ST 42 6% 10%
100 MOOSE ST 18 64% 100%
100 RABBIT ST 20 44% 70%
200 RABBIT ST 31 100% 100%
300 BIG HORN ST 30 22% 40%
300 LYNX ST 43 16% 21%
300 RAILWAY AVE 36 0% 0%
300 SQUIRREL ST 35 26% 26%
400 MARTEN ST 23 100% 100%
400 SQUIRREL ST 38 100% 100%
ZONE D - TOTALS 331
ZONE D - AVERAGE 44% 52%
ZONE E - On-Street Stalls # Avg (%) Peak (%)
100 BIRCH AVE 18 17% 22%
100 CAVE AVE 12 100% 100%
100 GRIZZLY ST 30 51% 53%
100 SPRAY AVE 30 12% 17%
100 WOLVERINE ST 5 60% 80%
200 GRIZZLY ST 20 34% 40%
300 GRIZZLY ST 2 0% 0%
400 MARTEN ST 54 100% 100%
400 MUSKRAT ST 52 100% 100%
400 OTTER ST 17 100% 100%
400 COUGAR ST 22 95% 100%
600 CARIBOU ST 14 40% 100%
600 MOOSE ST 16 44% 50%
600 WOLF ST 22 100% 100%
ZONE E - TOTALS 314
ZONE E - AVERAGE 71% 76%
ZONE F - On-Street Stalls # Avg (%) Peak (%)
0 FOX STREET 23 38% 70%
ANTELOPE LANE 20 28% 50%
BADGER ST 14 0% 0%
MARMOT CRES 26 12% 12%
MARMOT ST 19 37% 42%
500 BANFF 25 34% 64%
500 COUGAR ST 60 41% 68%
500 DEER ST 72 51% 53%
ZONE E - TOTALS 259
ZONE F - AVERAGE 37% 51%
OccupancyZONE A28 STALLS
Occupancy
Occupancy
Occupancy
Occupancy
Confidential Page 2 of 2 Banff Report July 7-13, 2017
Parking Data Analysis - Town of BanffData Collected for the Week of: to
SPECIAL REPORTS Length of Stay Turnover
Stalls # Avg (%) Peak Peak (time) HRS => 90% Avg (minutes) Avg (times)
User Paid Pilot 245 63% 97% 14:00 14 84 3.47
Zone A On-Street 276 73% 92% 14:00 4 91 4.64
Zone A Off-Street 559 64% 94% 14:00 8 95 3.08
Zone A Total 835 67% 91% 14:00 3 93 3.57
Zone B On-Street 351 58% 82% 14:00 0 129 2.70
Zone B Off-Street 34 79% 100% 11:00 45 88 4.77
Zone B Total 385 60% 82% 14:00 0 123 2.89
Zone C Total 360 63% 80% 16:00 0 201 2.11
Zone A,B,C Total 1580 64% 84% 14:00 0 117 3.03
Stalls # Avg (%) Peak Peak (time) HRS => 90% Avg (minutes) Avg (times) Visitor (%) Resident (%) Visitor (%) Resident (%)
Bear St (100) 31 67% 100% 15:00 17 84 3.77 91% 9% 84% 16%
Bear St (200) 55 71% 100% 14:00 15 83 3.97 88% 12% 83% 17%
Beaver St (200) 78 61% 100% 14:00 18 85 3.41 90% 10% 85% 15%
Beaver/Buffalo 54 55% 94% 14:00 1 85 2.92 89% 11% 85% 15%
Beaver/Caribou 27 72% 100% 13:00 23 82 4.54 95% 5% 91% 9%
Parks Canada 31 64% 100% 14:00 14 84 3.58 90% 10% 86% 14%
Bear Street Parkade 216 61% 100% 16:00 6 130 2.08 78% 22% 69% 31%
Central Park 67 80% 100% 13:00 36 76 4.63 94% 6% 85% 15%
Hospital 34 79% 100% 11:00 45 88 4.77 82% 18% 80% 20%
OFF-STREET 593
OFF-STREET AVERAGE 65% 99% 13:46 19.44 99 3.18 86% 14% 79% 21%
ZONE A - On-Street Length of Stay Turnover
Stalls # Avg (%) Peak Peak (time) HRS => 90% Avg (minutes) Avg (times) Visitor (%) Resident (%)
100 BEAR ST 35 79% 100% 14:00 40 76 5.05 95% 5%
100 BEAVER ST 50 68% 100% 16:00 13 136 3.14 79% 21%
100 CARIBOU ST 8 65% 100% 17:00 17 74 3.25 96% 4%
100 LYNX ST 14 74% 100% 14:00 27 83 4.76 96% 4%
100 WOLF ST 13 44% 92% 12:00 2 79 3.49 95% 5%
200 BEAR ST 41 80% 100% 12:00 30 79 6.42 92% 8%
200 BEAVER ST 37 75% 100% 15:00 22 126 3.72 79% 21%
200 BUFFALO ST 4 74% 100% 13:00 25 70 5.82 98% 2%
200 CARIBOU ST 12 92% 100% 16:00 55 80 6.99 91% 9%
200 LYNX ST 20 72% 100% 13:00 28 76 6.09 96% 4%
200 WOLF ST 17 83% 100% 11:00 34 76 6.10 95% 5%
300 CARIBOU ST 12 57% 100% 11:00 9 79 4.51 95% 5%
300 WOLF ST 13 73% 100% 13:00 23 85 5.15 96% 4%
ZONE A - TOTALS 276
ZONE A - AVERAGE 73% 99% 13:36 25.00 94 4.34 90% 10%
ZONE B - On-Street Length of Stay Turnover
Stalls # Avg (%) Peak Peak (time) HRS => 90% Avg (minutes) Avg (times) Visitor (%) Resident (%)
0 CARIBOU ST 13 65% 100% 12:00 15 104 3.69 97% 3%
0 WOLF ST 16 76% 100% 11:00 47 118 4.15 94% 6%
100 BOW AVE 41 76% 100% 16:00 33 131 3.46 86% 14%
200 BOW AVE 55 51% 87% 14:00 0 132 2.11 89% 11%
200 ELK ST 15 88% 100% 9:00 44 178 3.71 73% 27%
200 MOOSE ST 16 39% 75% 10:00 0 93 2.62 86% 14%
300 BANFF AVE 20 55% 100% 14:00 13 76 4.23 91% 9%
300 BEAVER ST 47 48% 77% 15:00 0 166 1.77 70% 30%
300 BOW AVE 15 61% 100% 15:00 13 91 2.94 95% 5%
300 MARTEN ST 62 43% 66% 14:00 0 99 2.56 87% 13%
300 MOOSE ST 12 77% 100% 15:00 14 222 2.27 57% 43%
300 SQUIRREL ST 39 67% 97% 14:00 7 195 2.38 65% 35%
ZONE B - TOTALS 351
ZONE B - AVERAGE 58% 92% 13:15 15.50 138 2.70 82% 18%
ZONE C - On-Street Length of Stay Turnover
Stalls # Avg (%) Peak Peak (time) HRS => 90% Avg (minutes) Avg (times) Visitor (%) Resident (%)
100 MUSKRAT ST 56 71% 98% 14:00 2 221 2.10 55% 45%
100 OTTER ST 56 46% 71% 16:00 0 228 1.24 45% 55%
200 MUSKRAT ST 46 61% 98% 15:00 2 189 2.11 61% 39%
200 OTTER ST 30 73% 100% 16:00 23 211 2.47 48% 52%
300 MUSKRAT ST 31 47% 71% 15:00 0 193 1.63 65% 35%
300 OTTER ST 13 37% 92% 9:00 1 189 1.65 49% 51%
400 BEAVER ST 28 73% 96% 10:00 1 236 2.64 38% 62%
400 BUFFALO ST 7 76% 100% 16:00 18 180 2.69 73% 27%
400 CARIBOU ST 20 76% 100% 16:00 31 200 2.75 72% 28%
400 MOOSE ST 8 94% 100% 8:00 56 173 3.75 55% 45%
400 WOLF ST 17 69% 100% 15:00 8 170 2.42 80% 20%
500 BUFFALO ST 9 72% 100% 15:00 23 152 2.76 76% 24%
500 CARIBOU ST 10 49% 100% 12:00 5 154 2.37 72% 28%
500 MOOSE ST 16 62% 100% 14:00 3 272 1.56 46% 54%
500 WOLF ST 13 70% 100% 15:00 23 161 2.82 75% 25%
ZONE C - TOTALS 360
ZONE C - AVERAGE 63% 95% 13:44 13.07 206 2.11 57% 43%
OFF-STREET Occupancy Length of Stay TurnoverUser
Stall UtilizationTotal Vehicles
User
User
User
*Bow Ave was inaccessible for 1 hour
on Monday due to a traffic incident
July 27, 2017 August 2, 2017
Occupancy
Occupancy
Occupancy
Occupancy
Confidential Page 1 of 2 Banff Report July 27 - Aug 2 2017
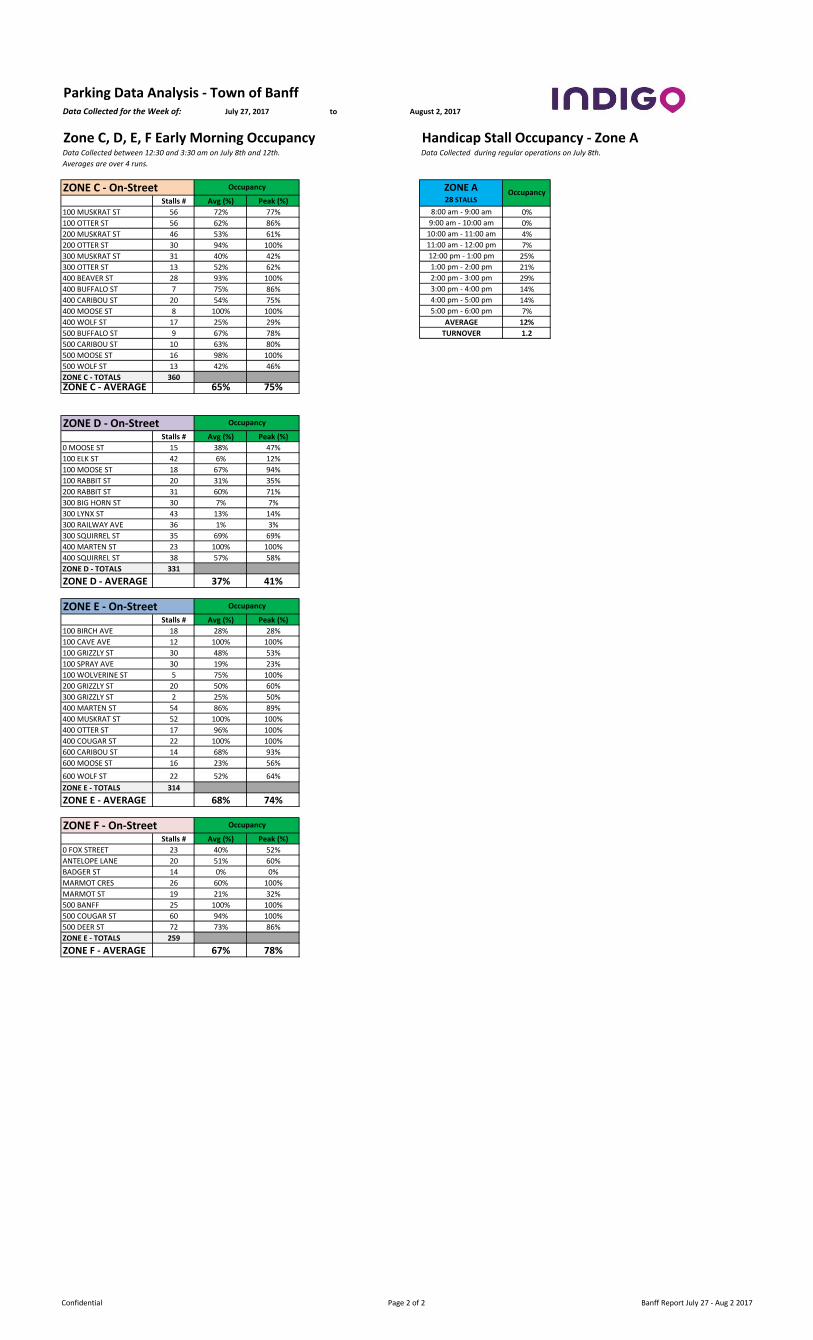
Parking Data Analysis - Town of BanffData Collected for the Week of: toJuly 27, 2017 August 2, 2017
Zone C, D, E, F Early Morning Occupancy Handicap Stall Occupancy - Zone AData Collected between 12:30 and 3:30 am on July 8th and 12th. Data Collected during regular operations on July 8th.
Averages are over 4 runs.
ZONE C - On-Street Stalls # Avg (%) Peak (%)
100 MUSKRAT ST 56 72% 77% 8:00 am - 9:00 am 0%
100 OTTER ST 56 62% 86% 9:00 am - 10:00 am 0%
200 MUSKRAT ST 46 53% 61% 10:00 am - 11:00 am 4%
200 OTTER ST 30 94% 100% 11:00 am - 12:00 pm 7%
300 MUSKRAT ST 31 40% 42% 12:00 pm - 1:00 pm 25%
300 OTTER ST 13 52% 62% 1:00 pm - 2:00 pm 21%
400 BEAVER ST 28 93% 100% 2:00 pm - 3:00 pm 29%
400 BUFFALO ST 7 75% 86% 3:00 pm - 4:00 pm 14%
400 CARIBOU ST 20 54% 75% 4:00 pm - 5:00 pm 14%
400 MOOSE ST 8 100% 100% 5:00 pm - 6:00 pm 7%
400 WOLF ST 17 25% 29% AVERAGE 12%
500 BUFFALO ST 9 67% 78% TURNOVER 1.2
500 CARIBOU ST 10 63% 80%
500 MOOSE ST 16 98% 100%
500 WOLF ST 13 42% 46%
ZONE C - TOTALS 360
ZONE C - AVERAGE 65% 75%
ZONE D - On-Street Stalls # Avg (%) Peak (%)
0 MOOSE ST 15 38% 47%
100 ELK ST 42 6% 12%
100 MOOSE ST 18 67% 94%
100 RABBIT ST 20 31% 35%
200 RABBIT ST 31 60% 71%
300 BIG HORN ST 30 7% 7%
300 LYNX ST 43 13% 14%
300 RAILWAY AVE 36 1% 3%
300 SQUIRREL ST 35 69% 69%
400 MARTEN ST 23 100% 100%
400 SQUIRREL ST 38 57% 58%
ZONE D - TOTALS 331
ZONE D - AVERAGE 37% 41%
ZONE E - On-Street Stalls # Avg (%) Peak (%)
100 BIRCH AVE 18 28% 28%
100 CAVE AVE 12 100% 100%
100 GRIZZLY ST 30 48% 53%
100 SPRAY AVE 30 19% 23%
100 WOLVERINE ST 5 75% 100%
200 GRIZZLY ST 20 50% 60%
300 GRIZZLY ST 2 25% 50%
400 MARTEN ST 54 86% 89%
400 MUSKRAT ST 52 100% 100%
400 OTTER ST 17 96% 100%
400 COUGAR ST 22 100% 100%
600 CARIBOU ST 14 68% 93%
600 MOOSE ST 16 23% 56%
600 WOLF ST 22 52% 64%
ZONE E - TOTALS 314
ZONE E - AVERAGE 68% 74%
ZONE F - On-Street Stalls # Avg (%) Peak (%)
0 FOX STREET 23 40% 52%
ANTELOPE LANE 20 51% 60%
BADGER ST 14 0% 0%
MARMOT CRES 26 60% 100%
MARMOT ST 19 21% 32%
500 BANFF 25 100% 100%
500 COUGAR ST 60 94% 100%
500 DEER ST 72 73% 86%
ZONE E - TOTALS 259
ZONE F - AVERAGE 67% 78%
Occupancy
Occupancy
Occupancy
Occupancy ZONE A28 STALLS
Occupancy
Confidential Page 2 of 2 Banff Report July 27 - Aug 2 2017
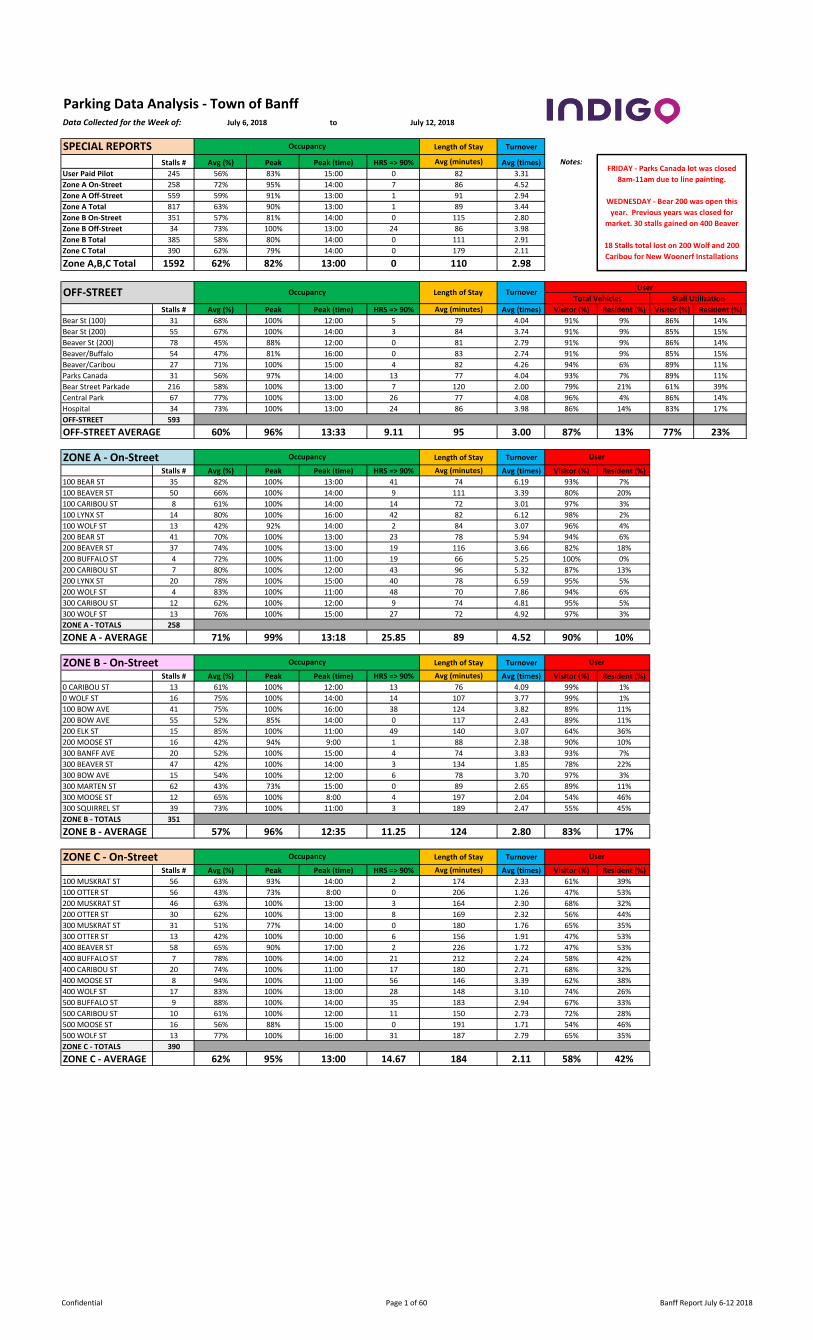
Data Collected for the Week of: to
Length of Stay Turnover
Stalls # Avg (%) Peak Peak (time) HRS => 90% Avg (minutes) Avg (times) Notes:
User Paid Pilot 245 56% 83% 15:00 0 82 3.31
Zone A On-Street 258 72% 95% 14:00 7 86 4.52
Zone A Off-Street 559 59% 91% 13:00 1 91 2.94
Zone A Total 817 63% 90% 13:00 1 89 3.44
Zone B On-Street 351 57% 81% 14:00 0 115 2.80
Zone B Off-Street 34 73% 100% 13:00 24 86 3.98
Zone B Total 385 58% 80% 14:00 0 111 2.91
Zone C Total 390 62% 79% 14:00 0 179 2.11
Zone A,B,C Total 1592 62% 82% 13:00 0 110 2.98
Stalls # Avg (%) Peak Peak (time) HRS => 90% Avg (minutes) Avg (times) Visitor (%) Resident (%) Visitor (%) Resident (%)
Bear St (100) 31 68% 100% 12:00 5 79 4.04 91% 9% 86% 14%
Bear St (200) 55 67% 100% 14:00 3 84 3.74 91% 9% 85% 15%
Beaver St (200) 78 45% 88% 12:00 0 81 2.79 91% 9% 86% 14%
Beaver/Buffalo 54 47% 81% 16:00 0 83 2.74 91% 9% 85% 15%
Beaver/Caribou 27 71% 100% 15:00 4 82 4.26 94% 6% 89% 11%
Parks Canada 31 56% 97% 14:00 13 77 4.04 93% 7% 89% 11%
Bear Street Parkade 216 58% 100% 13:00 7 120 2.00 79% 21% 61% 39%
Central Park 67 77% 100% 13:00 26 77 4.08 96% 4% 86% 14%
Hospital 34 73% 100% 13:00 24 86 3.98 86% 14% 83% 17%
OFF-STREET 593
60% 96% 13:33 9.11 95 3.00 87% 13% 77% 23%
ZONE A - On-Street Length of Stay Turnover
Stalls # Avg (%) Peak Peak (time) HRS => 90% Avg (minutes) Avg (times) Visitor (%) Resident (%)
100 BEAR ST 35 82% 100% 13:00 41 74 6.19 93% 7%
100 BEAVER ST 50 66% 100% 14:00 9 111 3.39 80% 20%
100 CARIBOU ST 8 61% 100% 14:00 14 72 3.01 97% 3%
100 LYNX ST 14 80% 100% 16:00 42 82 6.12 98% 2%
100 WOLF ST 13 42% 92% 14:00 2 84 3.07 96% 4%
200 BEAR ST 41 70% 100% 13:00 23 78 5.94 94% 6%
200 BEAVER ST 37 74% 100% 13:00 19 116 3.66 82% 18%
200 BUFFALO ST 4 72% 100% 11:00 19 66 5.25 100% 0%
200 CARIBOU ST 7 80% 100% 12:00 43 96 5.32 87% 13%
200 LYNX ST 20 78% 100% 15:00 40 78 6.59 95% 5%
200 WOLF ST 4 83% 100% 11:00 48 70 7.86 94% 6%
300 CARIBOU ST 12 62% 100% 12:00 9 74 4.81 95% 5%
300 WOLF ST 13 76% 100% 15:00 27 72 4.92 97% 3%
ZONE A - TOTALS 258
ZONE A - AVERAGE 71% 99% 13:18 25.85 89 4.52 90% 10%
ZONE B - On-Street Length of Stay Turnover
Stalls # Avg (%) Peak Peak (time) HRS => 90% Avg (minutes) Avg (times) Visitor (%) Resident (%)
0 CARIBOU ST 13 61% 100% 12:00 13 76 4.09 99% 1%
0 WOLF ST 16 75% 100% 14:00 14 107 3.77 99% 1%
100 BOW AVE 41 75% 100% 16:00 38 124 3.82 89% 11%
200 BOW AVE 55 52% 85% 14:00 0 117 2.43 89% 11%
200 ELK ST 15 85% 100% 11:00 49 140 3.07 64% 36%
200 MOOSE ST 16 42% 94% 9:00 1 88 2.38 90% 10%
300 BANFF AVE 20 52% 100% 15:00 4 74 3.83 93% 7%
300 BEAVER ST 47 42% 100% 14:00 3 134 1.85 78% 22%
300 BOW AVE 15 54% 100% 12:00 6 78 3.70 97% 3%
300 MARTEN ST 62 43% 73% 15:00 0 89 2.65 89% 11%
300 MOOSE ST 12 65% 100% 8:00 4 197 2.04 54% 46%
300 SQUIRREL ST 39 73% 100% 11:00 3 189 2.47 55% 45%
ZONE B - TOTALS 351
ZONE B - AVERAGE 57% 96% 12:35 11.25 124 2.80 83% 17%
ZONE C - On-Street Length of Stay Turnover
Stalls # Avg (%) Peak Peak (time) HRS => 90% Avg (minutes) Avg (times) Visitor (%) Resident (%)
100 MUSKRAT ST 56 63% 93% 14:00 2 174 2.33 61% 39%
100 OTTER ST 56 43% 73% 8:00 0 206 1.26 47% 53%
200 MUSKRAT ST 46 63% 100% 13:00 3 164 2.30 68% 32%
200 OTTER ST 30 62% 100% 13:00 8 169 2.32 56% 44%
300 MUSKRAT ST 31 51% 77% 14:00 0 180 1.76 65% 35%
300 OTTER ST 13 42% 100% 10:00 6 156 1.91 47% 53%
400 BEAVER ST 58 65% 90% 17:00 2 226 1.72 47% 53%
400 BUFFALO ST 7 78% 100% 14:00 21 212 2.24 58% 42%
400 CARIBOU ST 20 74% 100% 11:00 17 180 2.71 68% 32%
400 MOOSE ST 8 94% 100% 11:00 56 146 3.39 62% 38%
400 WOLF ST 17 83% 100% 13:00 28 148 3.10 74% 26%
500 BUFFALO ST 9 88% 100% 14:00 35 183 2.94 67% 33%
500 CARIBOU ST 10 61% 100% 12:00 11 150 2.73 72% 28%
500 MOOSE ST 16 56% 88% 15:00 0 191 1.71 54% 46%
500 WOLF ST 13 77% 100% 16:00 31 187 2.79 65% 35%
ZONE C - TOTALS 390
ZONE C - AVERAGE 62% 95% 13:00 14.67 184 2.11 58% 42%
Parking Data Analysis - Town of Banff
SPECIAL REPORTS
OFF-STREET AVERAGE
OFF-STREET Occupancy
July 6, 2018 July 12, 2018
User
User
User
Total Vehicles
Occupancy
Occupancy
Occupancy
User
Stall UtilizationTurnover
Occupancy
Length of Stay
FRIDAY - Parks Canada lot was closed
8am-11am due to line painting.
WEDNESDAY - Bear 200 was open this
year. Previous years was closed for
market. 30 stalls gained on 400 Beaver
18 Stalls total lost on 200 Wolf and 200
Caribou for New Woonerf Installations
Confidential Page 1 of 60 Banff Report July 6-12 2018
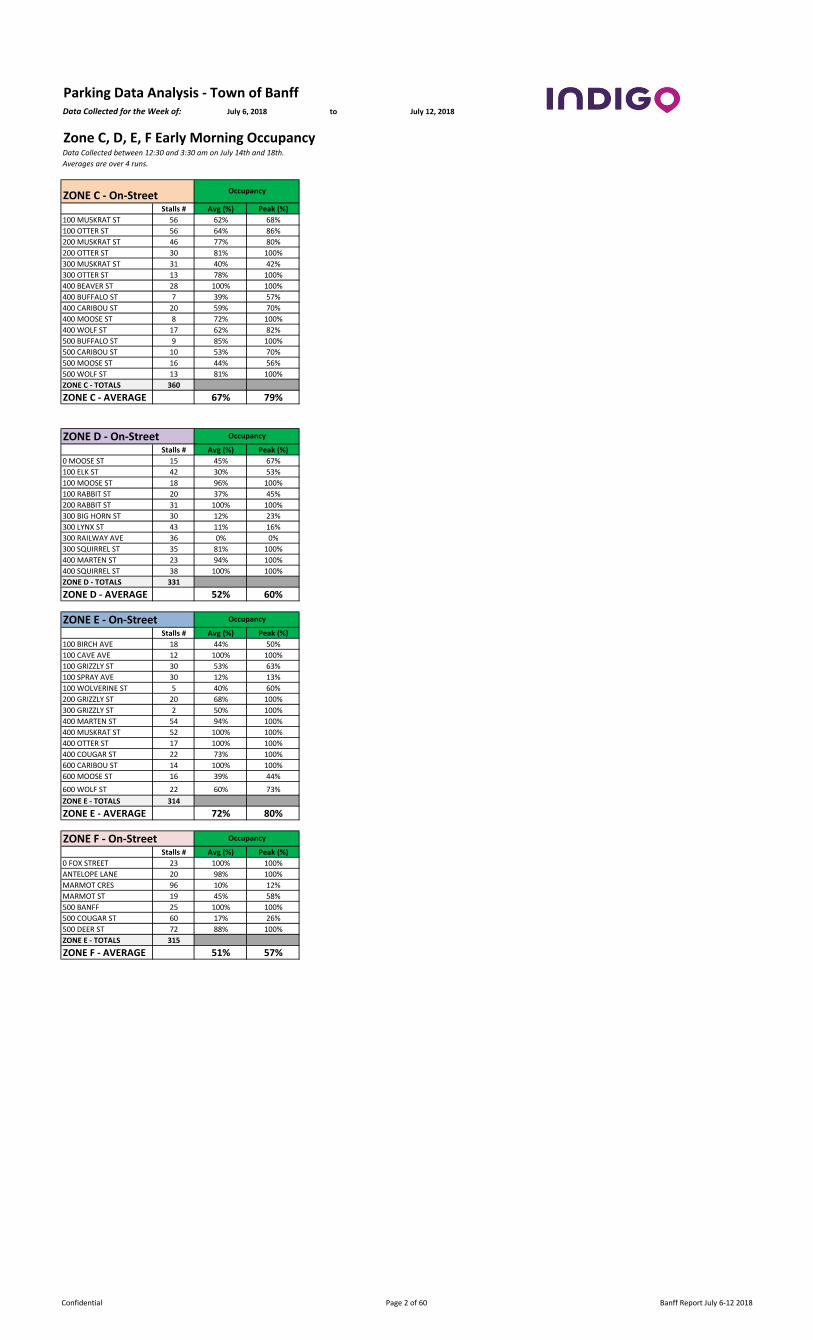
Data Collected for the Week of: to
Parking Data Analysis - Town of BanffJuly 6, 2018 July 12, 2018
Zone C, D, E, F Early Morning OccupancyData Collected between 12:30 and 3:30 am on July 14th and 18th.
Averages are over 4 runs.
ZONE C - On-Street Stalls # Avg (%) Peak (%)
100 MUSKRAT ST 56 62% 68%
100 OTTER ST 56 64% 86%
200 MUSKRAT ST 46 77% 80%
200 OTTER ST 30 81% 100%
300 MUSKRAT ST 31 40% 42%
300 OTTER ST 13 78% 100%
400 BEAVER ST 28 100% 100%
400 BUFFALO ST 7 39% 57%
400 CARIBOU ST 20 59% 70%
400 MOOSE ST 8 72% 100%
400 WOLF ST 17 62% 82%
500 BUFFALO ST 9 85% 100%
500 CARIBOU ST 10 53% 70%
500 MOOSE ST 16 44% 56%
500 WOLF ST 13 81% 100%
ZONE C - TOTALS 360
ZONE C - AVERAGE 67% 79%
ZONE D - On-Street Stalls # Avg (%) Peak (%)
0 MOOSE ST 15 45% 67%
100 ELK ST 42 30% 53%
100 MOOSE ST 18 96% 100%
100 RABBIT ST 20 37% 45%
200 RABBIT ST 31 100% 100%
300 BIG HORN ST 30 12% 23%
300 LYNX ST 43 11% 16%
300 RAILWAY AVE 36 0% 0%
300 SQUIRREL ST 35 81% 100%
400 MARTEN ST 23 94% 100%
400 SQUIRREL ST 38 100% 100%
ZONE D - TOTALS 331
ZONE D - AVERAGE 52% 60%
ZONE E - On-Street Stalls # Avg (%) Peak (%)
100 BIRCH AVE 18 44% 50%
100 CAVE AVE 12 100% 100%
100 GRIZZLY ST 30 53% 63%
100 SPRAY AVE 30 12% 13%
100 WOLVERINE ST 5 40% 60%
200 GRIZZLY ST 20 68% 100%
300 GRIZZLY ST 2 50% 100%
400 MARTEN ST 54 94% 100%
400 MUSKRAT ST 52 100% 100%
400 OTTER ST 17 100% 100%
400 COUGAR ST 22 73% 100%
600 CARIBOU ST 14 100% 100%
600 MOOSE ST 16 39% 44%
600 WOLF ST 22 60% 73%
ZONE E - TOTALS 314
ZONE E - AVERAGE 72% 80%
ZONE F - On-Street Stalls # Avg (%) Peak (%)
0 FOX STREET 23 100% 100%
ANTELOPE LANE 20 98% 100%
MARMOT CRES 96 10% 12%
MARMOT ST 19 45% 58%
500 BANFF 25 100% 100%
500 COUGAR ST 60 17% 26%
500 DEER ST 72 88% 100%
ZONE E - TOTALS 315
ZONE F - AVERAGE 51% 57%
Occupancy
Occupancy
Occupancy
Occupancy
Confidential Page 2 of 60 Banff Report July 6-12 2018
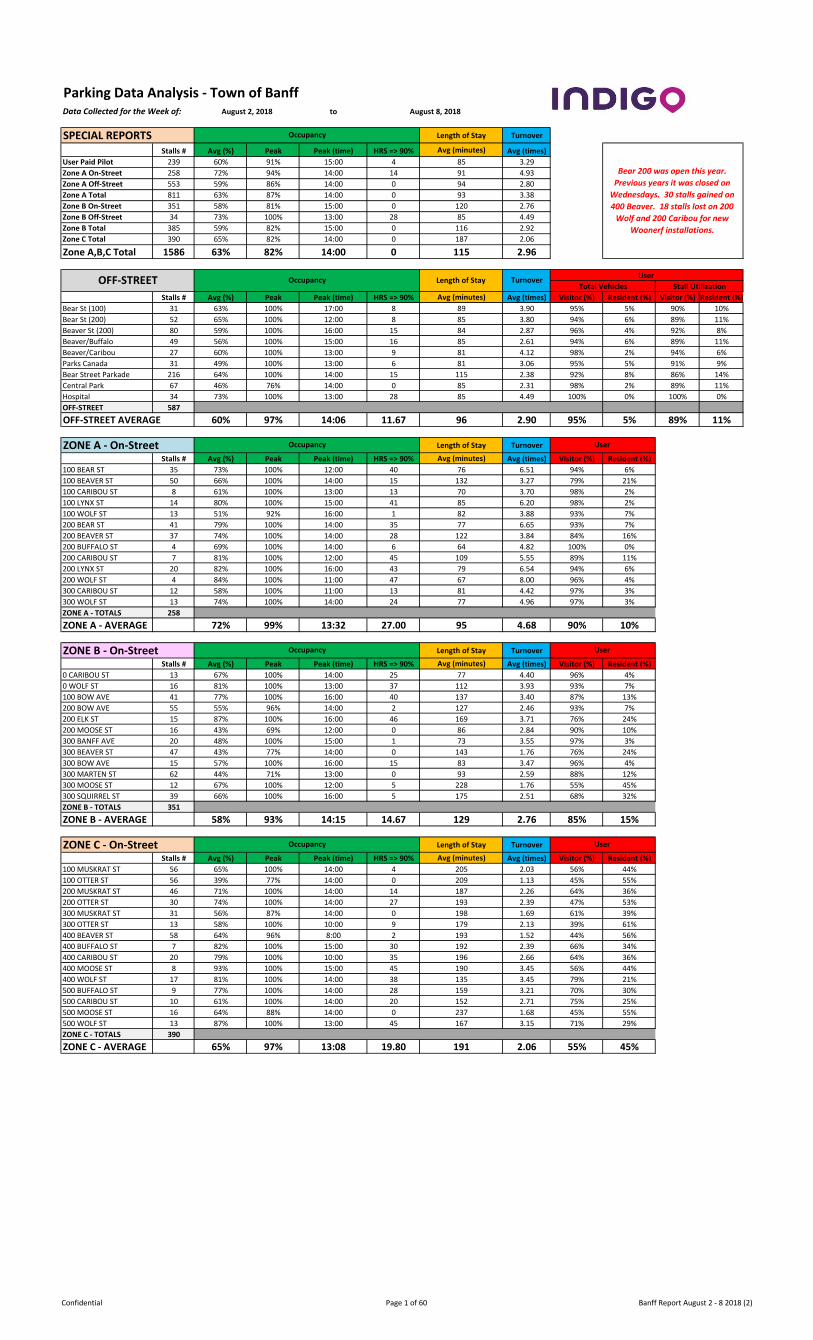
Parking Data Analysis - Town of BanffData Collected for the Week of: to
SPECIAL REPORTS Length of Stay Turnover
Stalls # Avg (%) Peak Peak (time) HRS => 90% Avg (minutes) Avg (times)
User Paid Pilot 239 60% 91% 15:00 4 85 3.29
Zone A On-Street 258 72% 94% 14:00 14 91 4.93
Zone A Off-Street 553 59% 86% 14:00 0 94 2.80
Zone A Total 811 63% 87% 14:00 0 93 3.38
Zone B On-Street 351 58% 81% 15:00 0 120 2.76
Zone B Off-Street 34 73% 100% 13:00 28 85 4.49
Zone B Total 385 59% 82% 15:00 0 116 2.92
Zone C Total 390 65% 82% 14:00 0 187 2.06
Zone A,B,C Total 1586 63% 82% 14:00 0 115 2.96
Stalls # Avg (%) Peak Peak (time) HRS => 90% Avg (minutes) Avg (times) Visitor (%) Resident (%) Visitor (%) Resident (%)
Bear St (100) 31 63% 100% 17:00 8 89 3.90 95% 5% 90% 10%
Bear St (200) 52 65% 100% 12:00 8 85 3.80 94% 6% 89% 11%
Beaver St (200) 80 59% 100% 16:00 15 84 2.87 96% 4% 92% 8%
Beaver/Buffalo 49 56% 100% 15:00 16 85 2.61 94% 6% 89% 11%
Beaver/Caribou 27 60% 100% 13:00 9 81 4.12 98% 2% 94% 6%
Parks Canada 31 49% 100% 13:00 6 81 3.06 95% 5% 91% 9%
Bear Street Parkade 216 64% 100% 14:00 15 115 2.38 92% 8% 86% 14%
Central Park 67 46% 76% 14:00 0 85 2.31 98% 2% 89% 11%
Hospital 34 73% 100% 13:00 28 85 4.49 100% 0% 100% 0%
OFF-STREET 587
OFF-STREET AVERAGE 60% 97% 14:06 11.67 96 2.90 95% 5% 89% 11%
ZONE A - On-Street Length of Stay Turnover
Stalls # Avg (%) Peak Peak (time) HRS => 90% Avg (minutes) Avg (times) Visitor (%) Resident (%)
100 BEAR ST 35 73% 100% 12:00 40 76 6.51 94% 6%
100 BEAVER ST 50 66% 100% 14:00 15 132 3.27 79% 21%
100 CARIBOU ST 8 61% 100% 13:00 13 70 3.70 98% 2%
100 LYNX ST 14 80% 100% 15:00 41 85 6.20 98% 2%
100 WOLF ST 13 51% 92% 16:00 1 82 3.88 93% 7%
200 BEAR ST 41 79% 100% 14:00 35 77 6.65 93% 7%
200 BEAVER ST 37 74% 100% 14:00 28 122 3.84 84% 16%
200 BUFFALO ST 4 69% 100% 14:00 6 64 4.82 100% 0%
200 CARIBOU ST 7 81% 100% 12:00 45 109 5.55 89% 11%
200 LYNX ST 20 82% 100% 16:00 43 79 6.54 94% 6%
200 WOLF ST 4 84% 100% 11:00 47 67 8.00 96% 4%
300 CARIBOU ST 12 58% 100% 11:00 13 81 4.42 97% 3%
300 WOLF ST 13 74% 100% 14:00 24 77 4.96 97% 3%
ZONE A - TOTALS 258
ZONE A - AVERAGE 72% 99% 13:32 27.00 95 4.68 90% 10%
ZONE B - On-Street Length of Stay Turnover
Stalls # Avg (%) Peak Peak (time) HRS => 90% Avg (minutes) Avg (times) Visitor (%) Resident (%)
0 CARIBOU ST 13 67% 100% 14:00 25 77 4.40 96% 4%
0 WOLF ST 16 81% 100% 13:00 37 112 3.93 93% 7%
100 BOW AVE 41 77% 100% 16:00 40 137 3.40 87% 13%
200 BOW AVE 55 55% 96% 14:00 2 127 2.46 93% 7%
200 ELK ST 15 87% 100% 16:00 46 169 3.71 76% 24%
200 MOOSE ST 16 43% 69% 12:00 0 86 2.84 90% 10%
300 BANFF AVE 20 48% 100% 15:00 1 73 3.55 97% 3%
300 BEAVER ST 47 43% 77% 14:00 0 143 1.76 76% 24%
300 BOW AVE 15 57% 100% 16:00 15 83 3.47 96% 4%
300 MARTEN ST 62 44% 71% 13:00 0 93 2.59 88% 12%
300 MOOSE ST 12 67% 100% 12:00 5 228 1.76 55% 45%
300 SQUIRREL ST 39 66% 100% 16:00 5 175 2.51 68% 32%
ZONE B - TOTALS 351
ZONE B - AVERAGE 58% 93% 14:15 14.67 129 2.76 85% 15%
ZONE C - On-Street Length of Stay Turnover
Stalls # Avg (%) Peak Peak (time) HRS => 90% Avg (minutes) Avg (times) Visitor (%) Resident (%)
100 MUSKRAT ST 56 65% 100% 14:00 4 205 2.03 56% 44%
100 OTTER ST 56 39% 77% 14:00 0 209 1.13 45% 55%
200 MUSKRAT ST 46 71% 100% 14:00 14 187 2.26 64% 36%
200 OTTER ST 30 74% 100% 14:00 27 193 2.39 47% 53%
300 MUSKRAT ST 31 56% 87% 14:00 0 198 1.69 61% 39%
300 OTTER ST 13 58% 100% 10:00 9 179 2.13 39% 61%
400 BEAVER ST 58 64% 96% 8:00 2 193 1.52 44% 56%
400 BUFFALO ST 7 82% 100% 15:00 30 192 2.39 66% 34%
400 CARIBOU ST 20 79% 100% 10:00 35 196 2.66 64% 36%
400 MOOSE ST 8 93% 100% 15:00 45 190 3.45 56% 44%
400 WOLF ST 17 81% 100% 14:00 38 135 3.45 79% 21%
500 BUFFALO ST 9 77% 100% 14:00 28 159 3.21 70% 30%
500 CARIBOU ST 10 61% 100% 14:00 20 152 2.71 75% 25%
500 MOOSE ST 16 64% 88% 14:00 0 237 1.68 45% 55%
500 WOLF ST 13 87% 100% 13:00 45 167 3.15 71% 29%
ZONE C - TOTALS 390
ZONE C - AVERAGE 65% 97% 13:08 19.80 191 2.06 55% 45%
Bear 200 was open this year.
Previous years it was closed on
Wednesdays. 30 stalls gained on
400 Beaver. 18 stalls lost on 200
Wolf and 200 Caribou for new
Woonerf installations.
August 2, 2018 August 8, 2018
Occupancy
Occupancy
Occupancy
Occupancy User
User
User
OFF-STREET Occupancy Length of Stay TurnoverUser
Stall UtilizationTotal Vehicles
Confidential Page 1 of 60 Banff Report August 2 - 8 2018 (2)
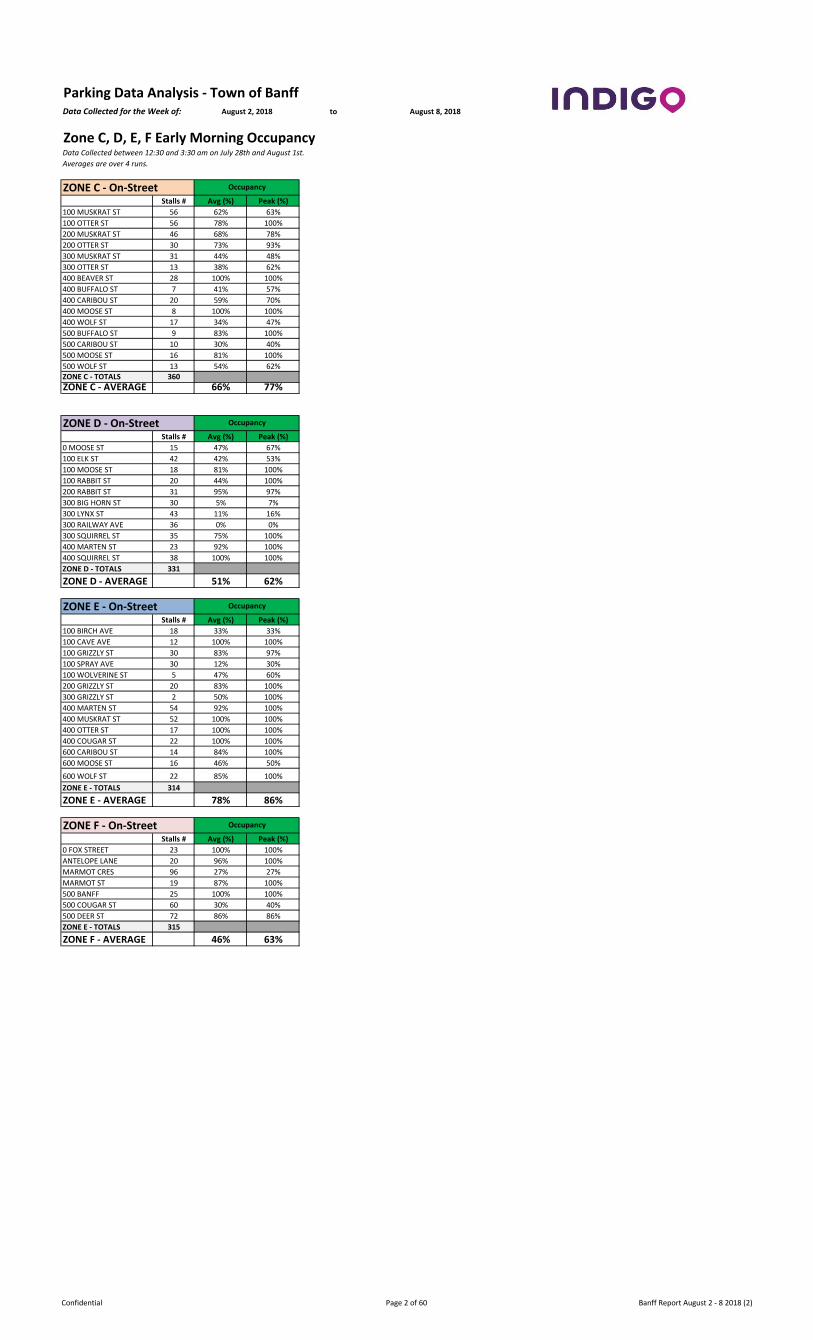
Parking Data Analysis - Town of BanffData Collected for the Week of: toAugust 2, 2018 August 8, 2018
Zone C, D, E, F Early Morning OccupancyData Collected between 12:30 and 3:30 am on July 28th and August 1st.
Averages are over 4 runs.
ZONE C - On-Street Stalls # Avg (%) Peak (%)
100 MUSKRAT ST 56 62% 63%
100 OTTER ST 56 78% 100%
200 MUSKRAT ST 46 68% 78%
200 OTTER ST 30 73% 93%
300 MUSKRAT ST 31 44% 48%
300 OTTER ST 13 38% 62%
400 BEAVER ST 28 100% 100%
400 BUFFALO ST 7 41% 57%
400 CARIBOU ST 20 59% 70%
400 MOOSE ST 8 100% 100%
400 WOLF ST 17 34% 47%
500 BUFFALO ST 9 83% 100%
500 CARIBOU ST 10 30% 40%
500 MOOSE ST 16 81% 100%
500 WOLF ST 13 54% 62%ZONE C - TOTALS 360
ZONE C - AVERAGE 66% 77%
ZONE D - On-Street Stalls # Avg (%) Peak (%)
0 MOOSE ST 15 47% 67%
100 ELK ST 42 42% 53%
100 MOOSE ST 18 81% 100%
100 RABBIT ST 20 44% 100%
200 RABBIT ST 31 95% 97%
300 BIG HORN ST 30 5% 7%
300 LYNX ST 43 11% 16%
300 RAILWAY AVE 36 0% 0%
300 SQUIRREL ST 35 75% 100%
400 MARTEN ST 23 92% 100%
400 SQUIRREL ST 38 100% 100%
ZONE D - TOTALS 331
ZONE D - AVERAGE 51% 62%
ZONE E - On-Street Stalls # Avg (%) Peak (%)
100 BIRCH AVE 18 33% 33%
100 CAVE AVE 12 100% 100%
100 GRIZZLY ST 30 83% 97%
100 SPRAY AVE 30 12% 30%
100 WOLVERINE ST 5 47% 60%
200 GRIZZLY ST 20 83% 100%
300 GRIZZLY ST 2 50% 100%
400 MARTEN ST 54 92% 100%
400 MUSKRAT ST 52 100% 100%
400 OTTER ST 17 100% 100%
400 COUGAR ST 22 100% 100%
600 CARIBOU ST 14 84% 100%
600 MOOSE ST 16 46% 50%
600 WOLF ST 22 85% 100%
ZONE E - TOTALS 314
ZONE E - AVERAGE 78% 86%
ZONE F - On-Street Stalls # Avg (%) Peak (%)
0 FOX STREET 23 100% 100%
ANTELOPE LANE 20 96% 100%
MARMOT CRES 96 27% 27%
MARMOT ST 19 87% 100%
500 BANFF 25 100% 100%
500 COUGAR ST 60 30% 40%
500 DEER ST 72 86% 86%
ZONE E - TOTALS 315
ZONE F - AVERAGE 46% 63%
Occupancy
Occupancy
Occupancy
Occupancy
Confidential Page 2 of 60 Banff Report August 2 - 8 2018 (2)