Embed Size (px)
Citation preview
ISO-NE PUBLIC
D E C E M B E R 1 3 , 2 0 1 7
Load Forecast Group
NEPOOL Load Forecast Committee
2018 Economic and Draft Annual Energy Forecast
ISO-NE PUBLIC
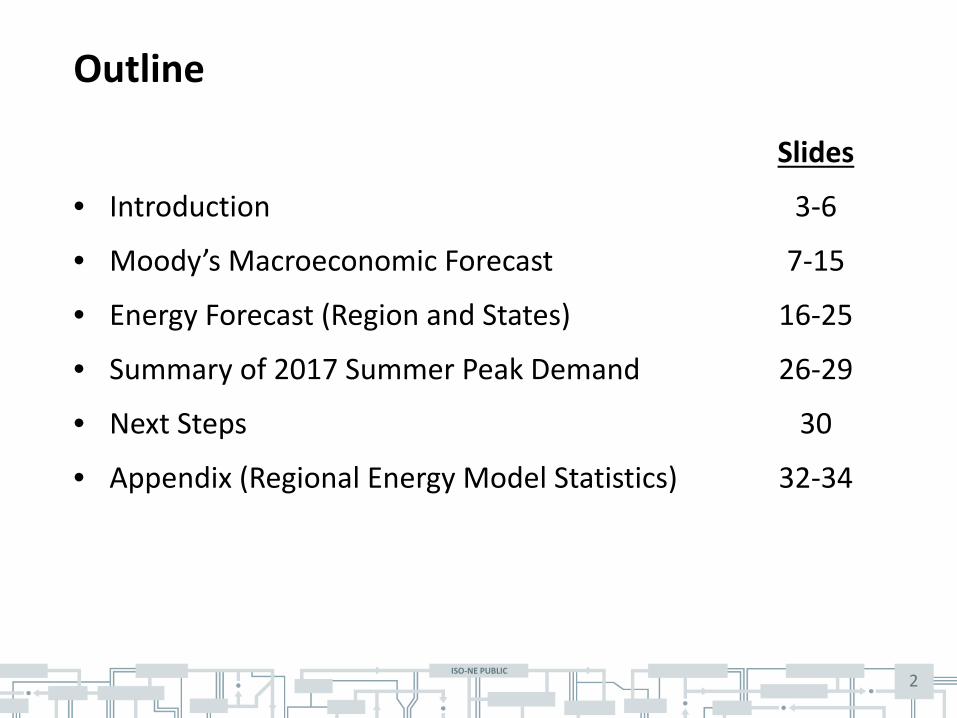
Outline
Slides
• Introduction 3-6
• Moody’s Macroeconomic Forecast 7-15
• Energy Forecast (Region and States) 16-25
• Summary of 2017 Summer Peak Demand 26-29
• Next Steps 30
• Appendix (Regional Energy Model Statistics) 32-34
2
ISO-NE PUBLIC 3
Introduction
• ISO has developed draft 2018 energy forecasts for discussion with the Load Forecast Committee
• ISO uses reconstituted loads to estimate both gross annual energy and gross peak demand forecast models – Reconstitution is done for load reductions from passive demand
resources (PDR), price responsive demand resources (PRD), behind-the-meter PV (BTM PV), and any OP4/Audit events
– The term “gross” load implies reconstitution – The term “net” load implies net of PDR, PRD and BTM PV and is
representative of demand observed in real-time
• All forecasts described herein are draft and subject to change
ISO-NE PUBLIC 4
2018 Load Forecast Development Timeline
• Activities completed to date: – October 2017 – Received Moody’s Macroeconomic Forecast – November 2017 – Published Moody’s forecast to LFC website:
https://www.iso-ne.com/static-assets/documents/2017/11/econ_variable_comp_2017fcst_vs_2016fcst.xlsx
• November 16, 2017 – Moody’s presentation at PAC: https://www.iso-ne.com/static-assets/documents/2017/11/a3_moodys_2017_economic_update.pdf
– December 2017 – ISO published Summer 2017 Weather Normal Peak Load report: https://www.iso-ne.com/isoexpress/web/reports/load-and-demand/-/tree/summer-and-winter-normalized-peaks
• LFC meetings: – December 13, 2017 – Moody’s forecast, draft energy forecast, 2017 summer peak
review – February 7, 2018 – Final draft energy forecast and draft summer peak forecast – March 28, 2018 – Final draft seasonal peak forecasts – July 2018 – Summer LFC meeting (date TBD)
• Other stakeholder meetings: – March 14, 2018 – PAC – April 26, 2018 – PAC
• May 1, 2018 – Final forecast published in 2018 CELT report
ISO-NE PUBLIC 5
2018 Preliminary Energy Forecast
• Energy models were estimated using reconstituted annual energy from 1990-2017 (28 years)
• Energy models use the updated Moody’s macroeconomic forecast published in October 2017 – Bureau of Economic Analysis revised some historical values
• ISO assumes normal weather for the energy forecast – Normal weather is defined as the 20 year average from 1996-2015
• Some data was estimated to develop preliminary forecasts – Monthly energy (November-December 2017) – BTM PV reconstitution data (September-December 2017) – PDR reconstitution data (November-December 2017)
• Preliminary net energy forecast values are based on the 2017 EE and BTM PV forecasts
• The energy forecast is an input into the peak demand forecast • Regional energy forecast model details and statistics are included in
Appendix
ISO-NE PUBLIC 6
Observations on Preliminary 2018 Forecast • Moody’s forecasts roughly the same economic growth in the
region (2017-2026 CAGR of 1.95%) relative to their previous forecast (2017-2026 CAGR of 1.89%) – Feds will increase interest rates, with values reaching 4% by end of decade – Assume tax cuts pass Congress, and will in turn increase deficit – Oil prices increase slowly to $55-$60/barrel; natural gas prices remain low
• The preliminary regional gross energy forecast is approximately 0.3% higher in 2026 than the 2017 CELT forecast – Percent differences vary over the forecast horizon and across states
• Net energy forecasts presented herein are illustrative and will change when the 2018 EE and BTM PV forecasts are developed – These forecasts are developed annually as part of the EE Forecast Working
Group (EEFWG) and Distributed Generation Forecast Working Group (DGFWG) stakeholder processes
ISO-NE PUBLIC ISO-NE PUBLIC
MOODY’S MACROECONOMIC FORECAST (PUBLISHED OCTOBER 2017) Gross State Product (GSP) – New England and States
7
ISO-NE PUBLIC 8
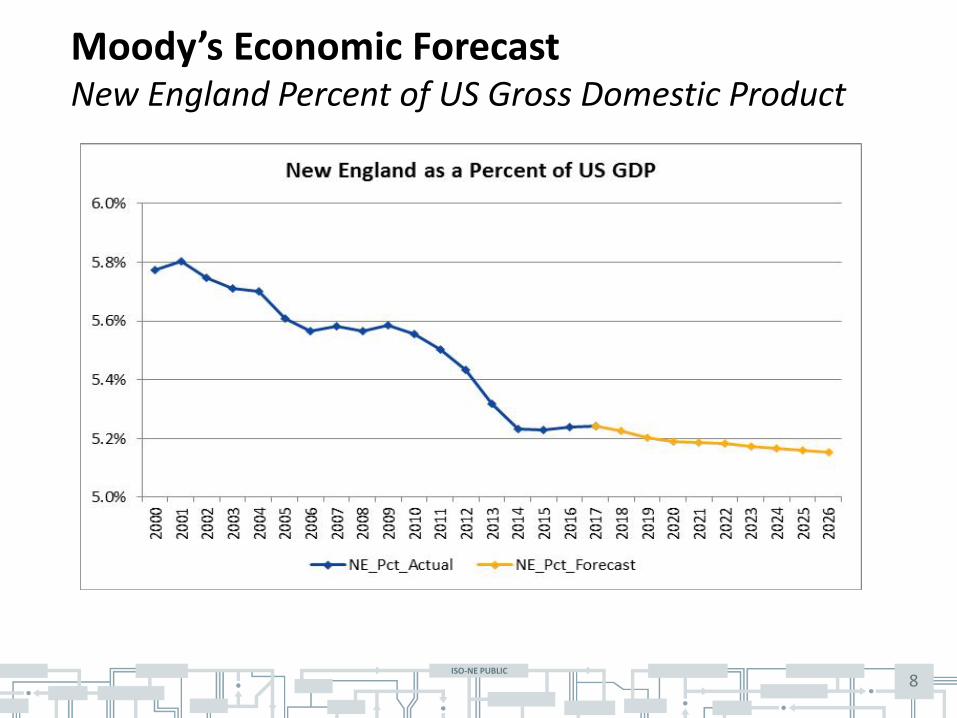
Moody’s Economic Forecast New England Percent of US Gross Domestic Product
ISO-NE PUBLIC 9
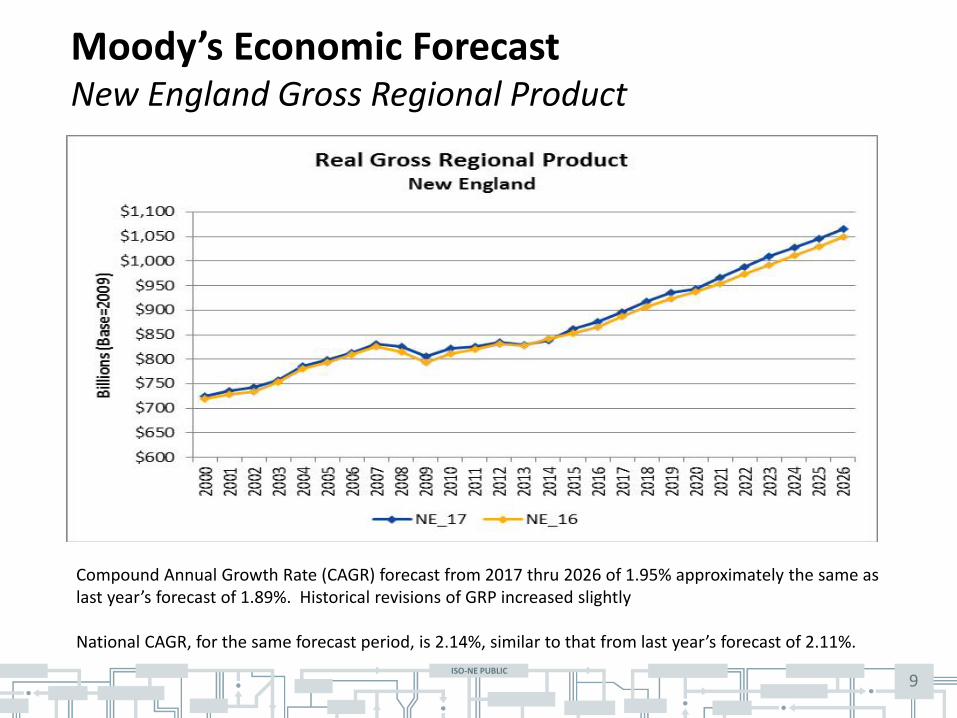
Moody’s Economic Forecast New England Gross Regional Product
Compound Annual Growth Rate (CAGR) forecast from 2017 thru 2026 of 1.95% approximately the same as last year’s forecast of 1.89%. Historical revisions of GRP increased slightly National CAGR, for the same forecast period, is 2.14%, similar to that from last year’s forecast of 2.11%.
ISO-NE PUBLIC 10
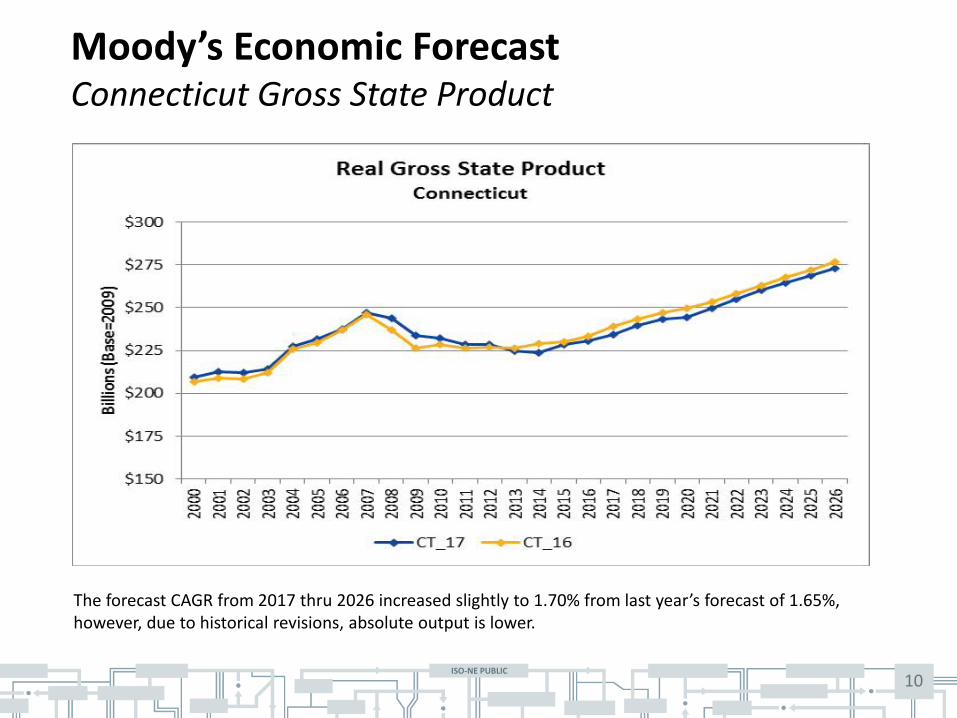
Moody’s Economic Forecast Connecticut Gross State Product
The forecast CAGR from 2017 thru 2026 increased slightly to 1.70% from last year’s forecast of 1.65%, however, due to historical revisions, absolute output is lower.
ISO-NE PUBLIC 11
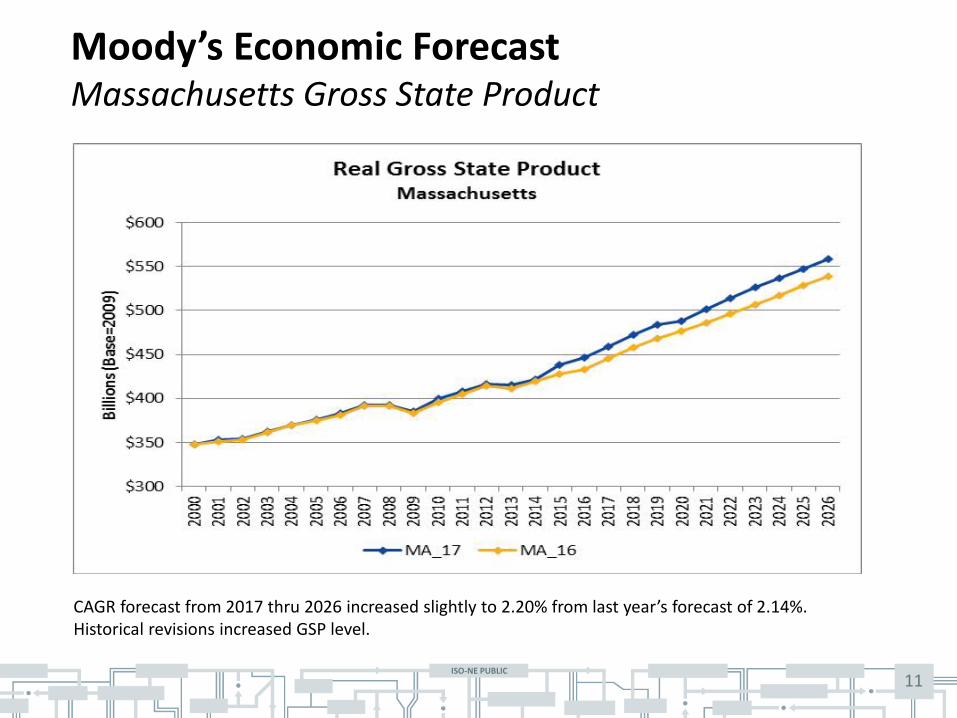
Moody’s Economic Forecast Massachusetts Gross State Product
CAGR forecast from 2017 thru 2026 increased slightly to 2.20% from last year’s forecast of 2.14%. Historical revisions increased GSP level.
ISO-NE PUBLIC 12
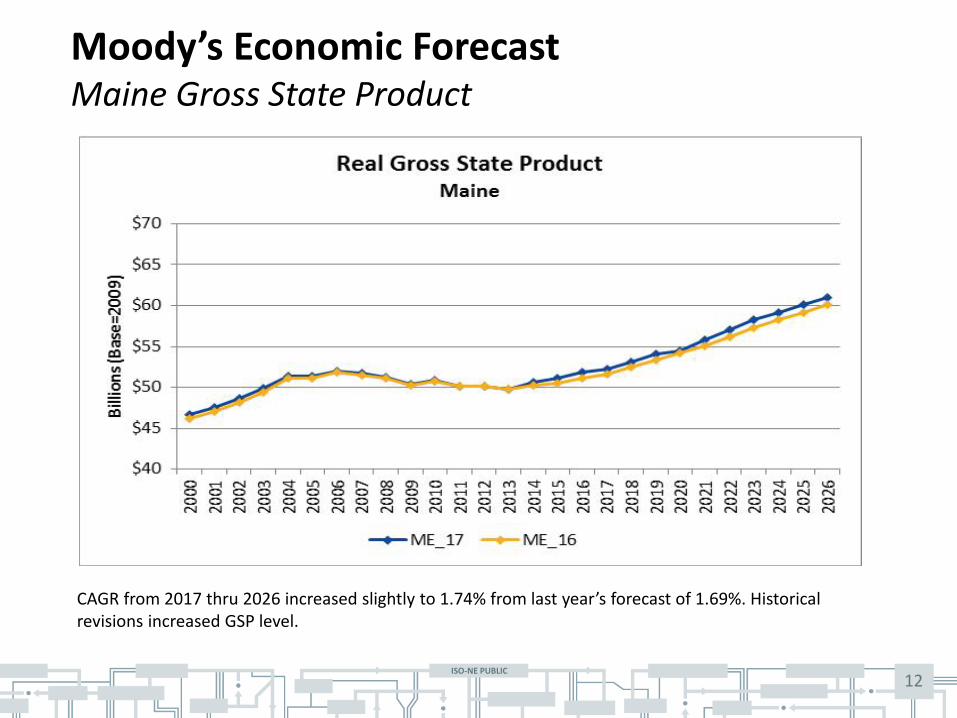
Moody’s Economic Forecast Maine Gross State Product
CAGR from 2017 thru 2026 increased slightly to 1.74% from last year’s forecast of 1.69%. Historical revisions increased GSP level.
ISO-NE PUBLIC 13
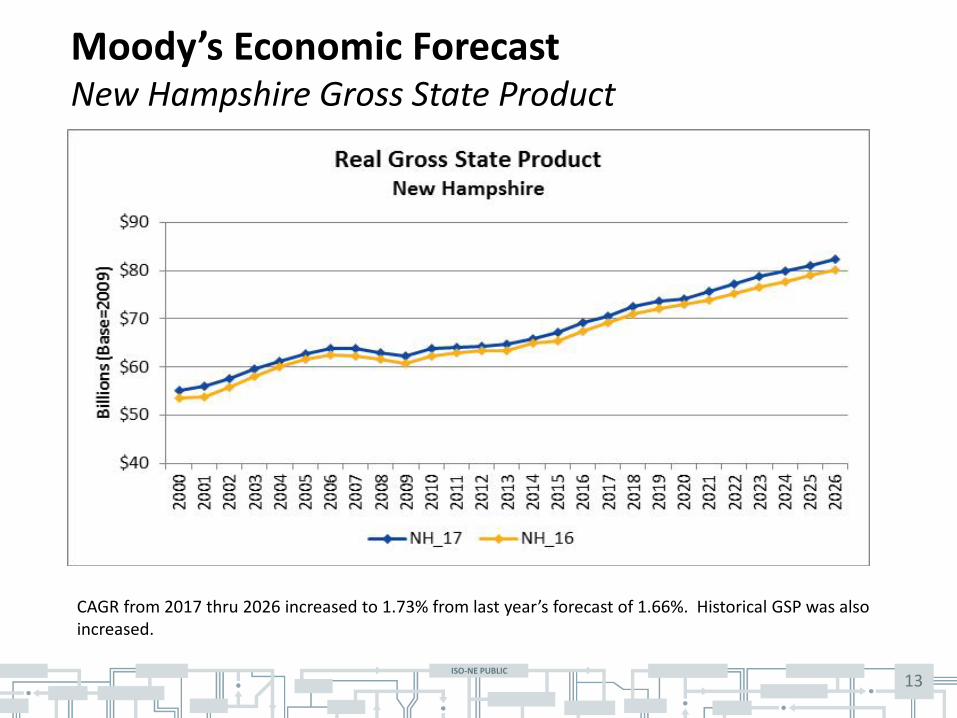
Moody’s Economic Forecast New Hampshire Gross State Product
CAGR from 2017 thru 2026 increased to 1.73% from last year’s forecast of 1.66%. Historical GSP was also increased.
ISO-NE PUBLIC 14
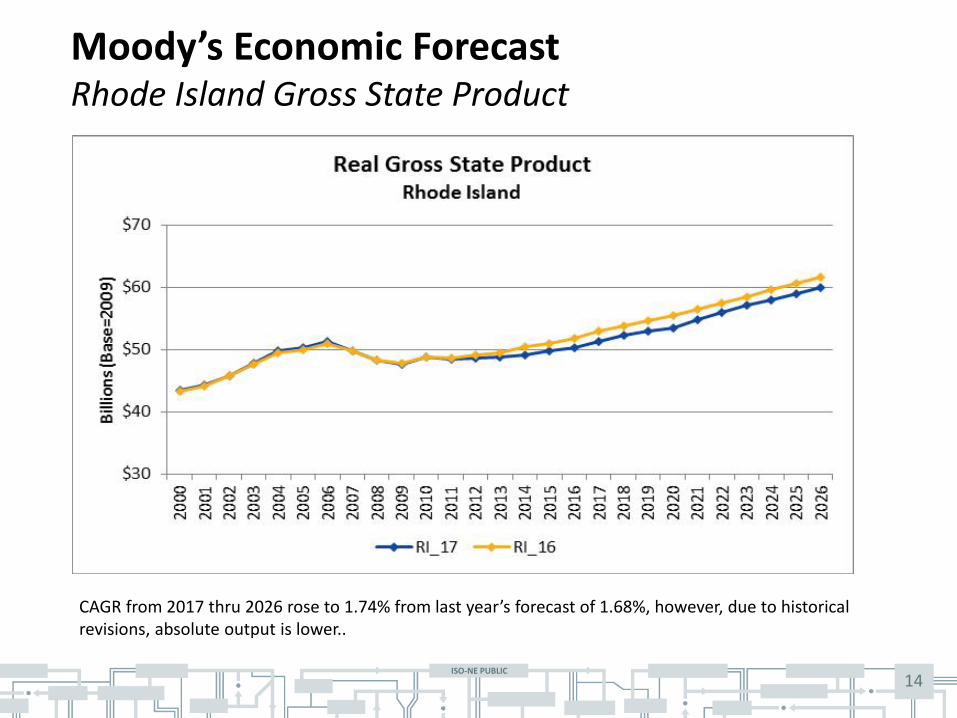
Moody’s Economic Forecast Rhode Island Gross State Product
CAGR from 2017 thru 2026 rose to 1.74% from last year’s forecast of 1.68%, however, due to historical revisions, absolute output is lower..
ISO-NE PUBLIC 15
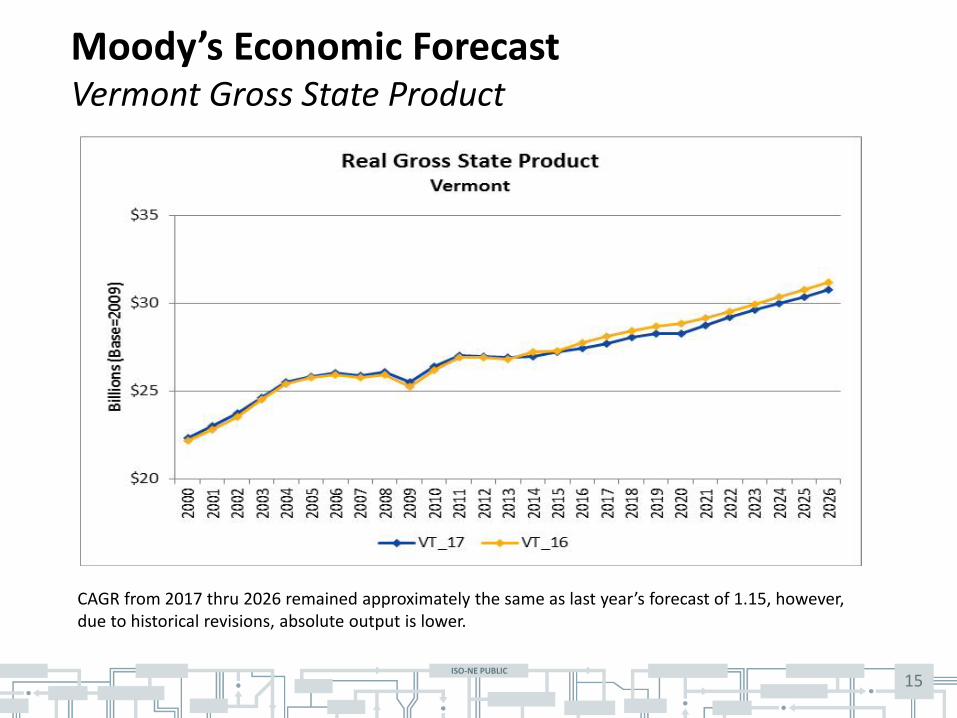
Moody’s Economic Forecast Vermont Gross State Product
CAGR from 2017 thru 2026 remained approximately the same as last year’s forecast of 1.15, however, due to historical revisions, absolute output is lower.
ISO-NE PUBLIC ISO-NE PUBLIC
PRELIMINARY 2018 GROSS ENERGY FORECAST New England and States
16
ISO-NE PUBLIC 17
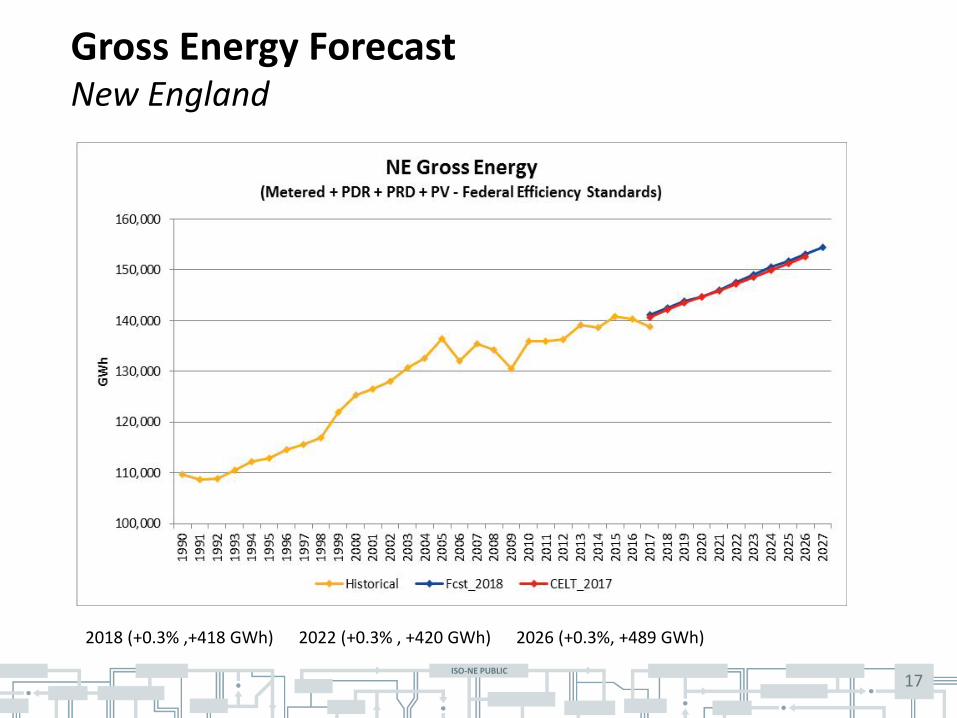
Gross Energy Forecast New England
2018 (+0.3% ,+418 GWh) 2022 (+0.3% , +420 GWh) 2026 (+0.3%, +489 GWh)
ISO-NE PUBLIC 18
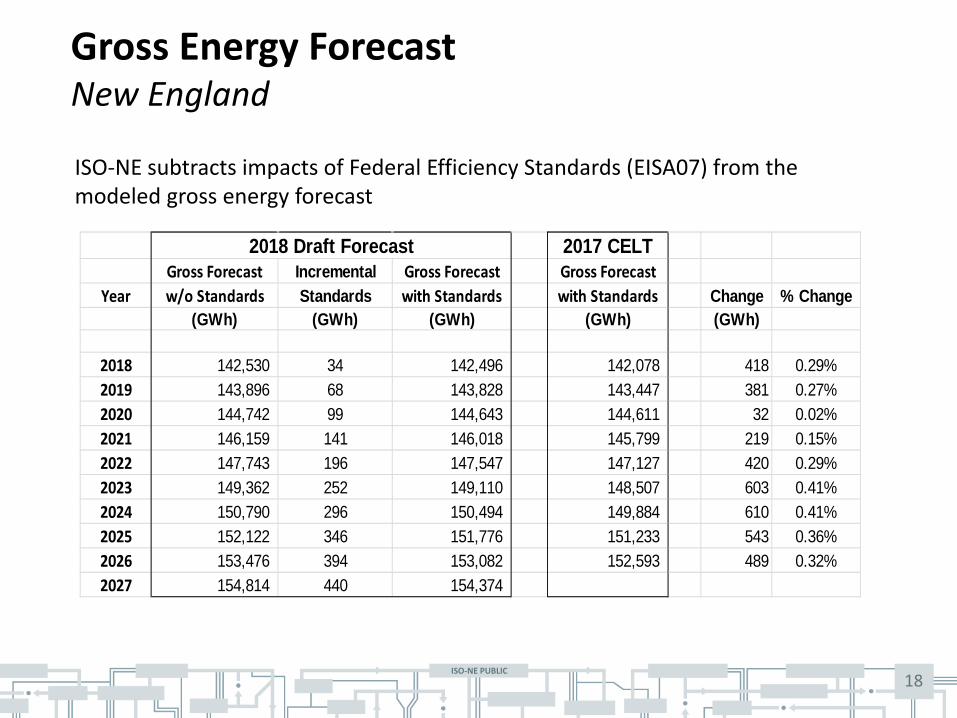
Gross Energy Forecast New England
ISO-NE subtracts impacts of Federal Efficiency Standards (EISA07) from the modeled gross energy forecast
2017 CELTGross Forecast Incremental Gross Forecast Gross Forecast
Year w/o Standards Standards with Standards with Standards Change % Change(GWh) (GWh) (GWh) (GWh) (GWh)
2018 142,530 34 142,496 142,078 418 0.29%2019 143,896 68 143,828 143,447 381 0.27%2020 144,742 99 144,643 144,611 32 0.02%2021 146,159 141 146,018 145,799 219 0.15%2022 147,743 196 147,547 147,127 420 0.29%2023 149,362 252 149,110 148,507 603 0.41%2024 150,790 296 150,494 149,884 610 0.41%2025 152,122 346 151,776 151,233 543 0.36%2026 153,476 394 153,082 152,593 489 0.32%2027 154,814 440 154,374
2018 Draft Forecast
ISO-NE PUBLIC 19
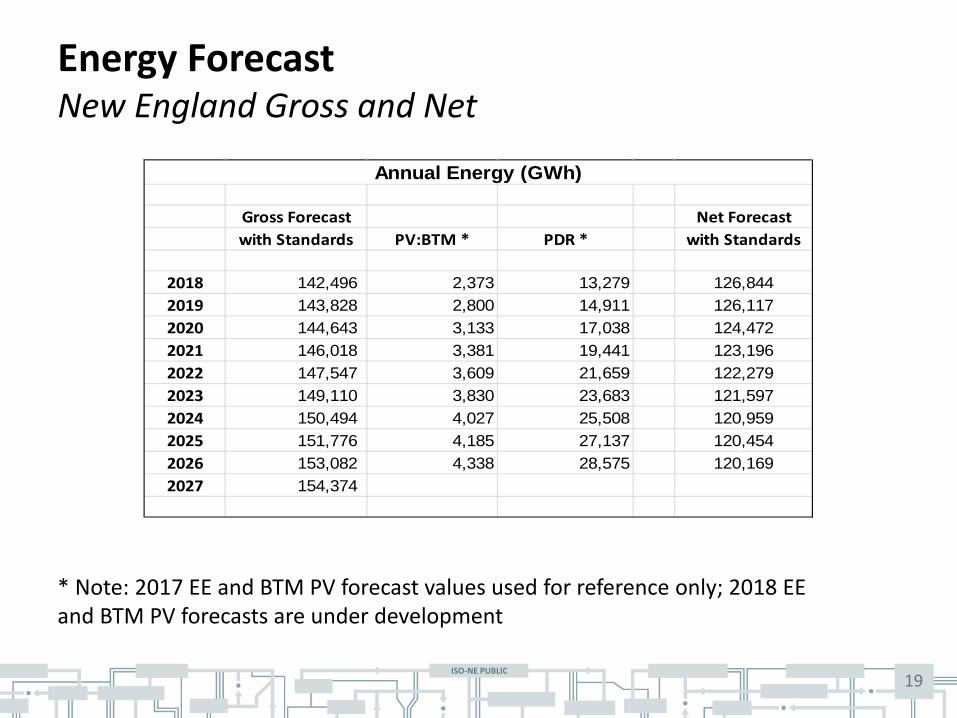
* Note: 2017 EE and BTM PV forecast values used for reference only; 2018 EE and BTM PV forecasts are under development
Energy Forecast New England Gross and Net
Gross Forecast Net Forecastwith Standards PV:BTM * PDR * with Standards
2018 142,496 2,373 13,279 126,8442019 143,828 2,800 14,911 126,1172020 144,643 3,133 17,038 124,4722021 146,018 3,381 19,441 123,1962022 147,547 3,609 21,659 122,2792023 149,110 3,830 23,683 121,5972024 150,494 4,027 25,508 120,9592025 151,776 4,185 27,137 120,4542026 153,082 4,338 28,575 120,1692027 154,374
Annual Energy (GWh)
ISO-NE PUBLIC 20
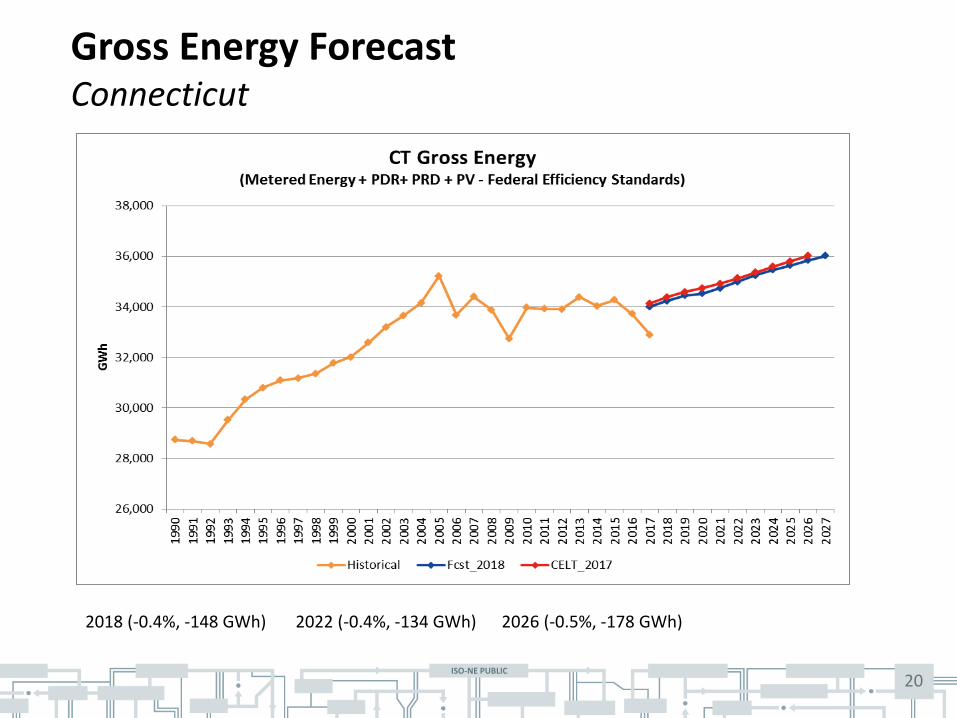
Gross Energy Forecast Connecticut
2018 (-0.4%, -148 GWh) 2022 (-0.4%, -134 GWh) 2026 (-0.5%, -178 GWh)
ISO-NE PUBLIC 21
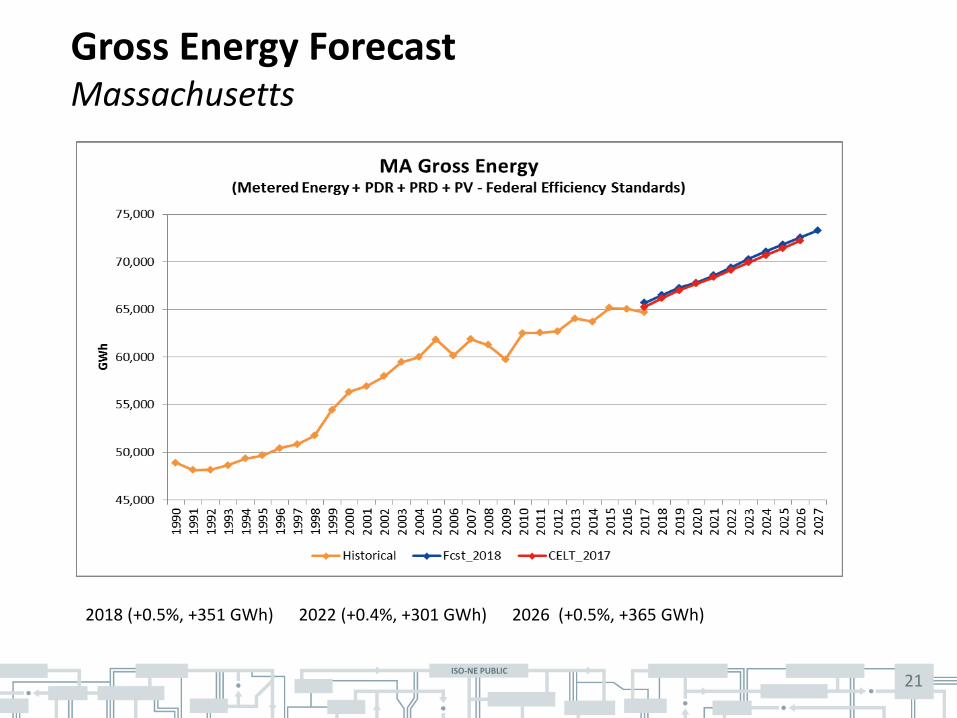
Gross Energy Forecast Massachusetts
2018 (+0.5%, +351 GWh) 2022 (+0.4%, +301 GWh) 2026 (+0.5%, +365 GWh)
ISO-NE PUBLIC 22
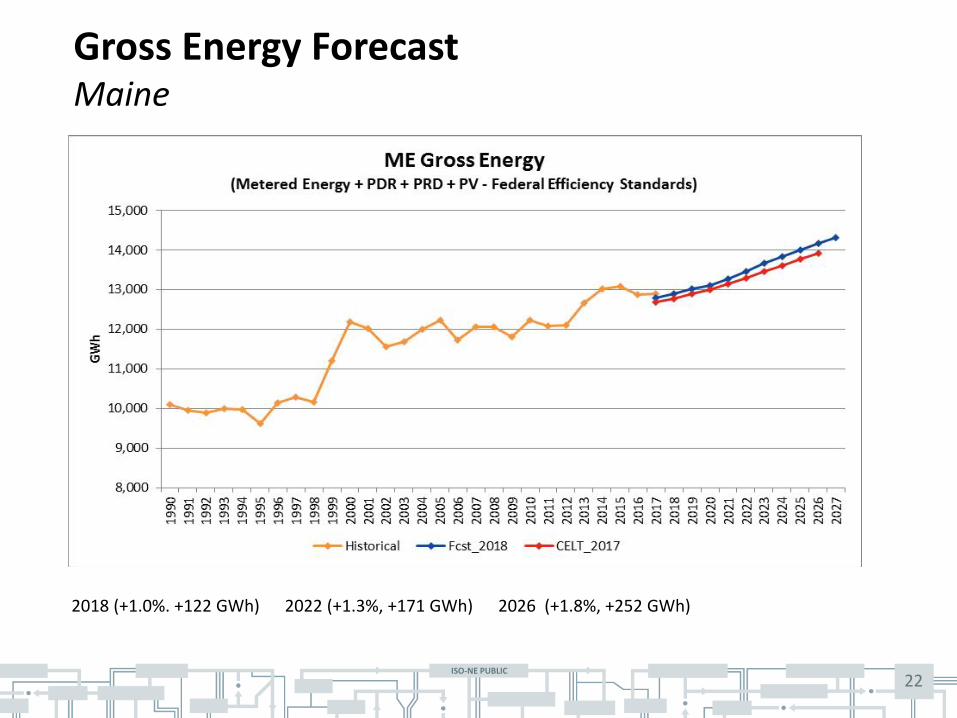
Gross Energy Forecast Maine
2018 (+1.0%. +122 GWh) 2022 (+1.3%, +171 GWh) 2026 (+1.8%, +252 GWh)
ISO-NE PUBLIC 23
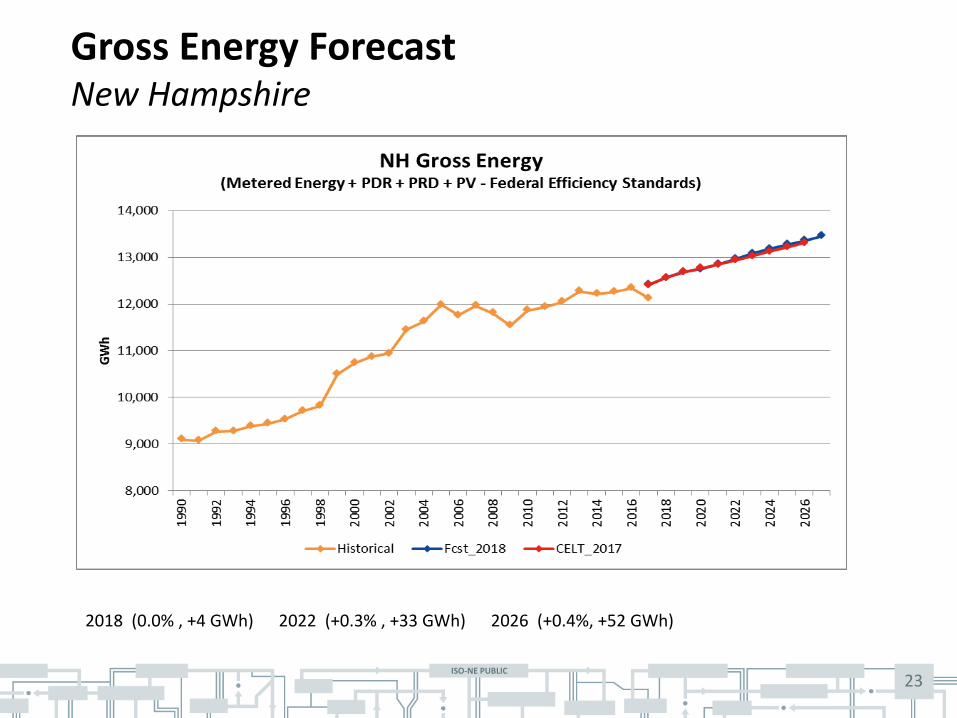
Gross Energy Forecast New Hampshire
2018 (0.0% , +4 GWh) 2022 (+0.3% , +33 GWh) 2026 (+0.4%, +52 GWh)
ISO-NE PUBLIC 24
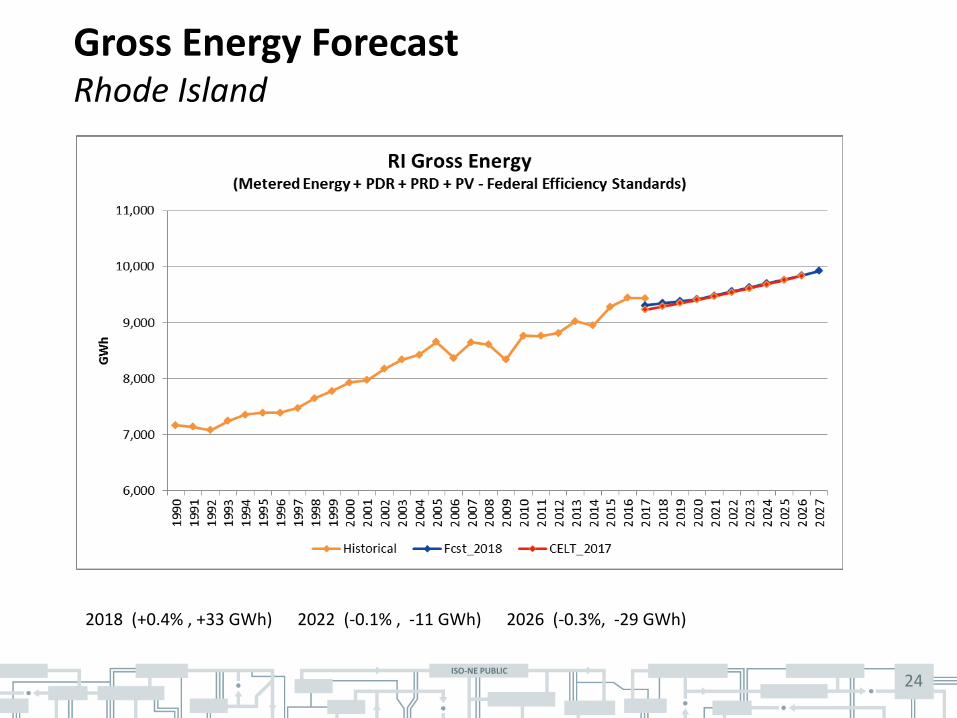
Gross Energy Forecast Rhode Island
2018 (+0.4% , +33 GWh) 2022 (-0.1% , -11 GWh) 2026 (-0.3%, -29 GWh)

ISO-NE PUBLIC 25
Gross Energy Forecast Vermont
2018 (+0.8% , +56 GWh) 2022 (+0.8% , +60 GWh) 2026 (+0.4%, +27 GWh)
ISO-NE PUBLIC ISO-NE PUBLIC
SUMMARY OF 2017 SUMMER PEAK DEMAND
26
ISO-NE PUBLIC 27
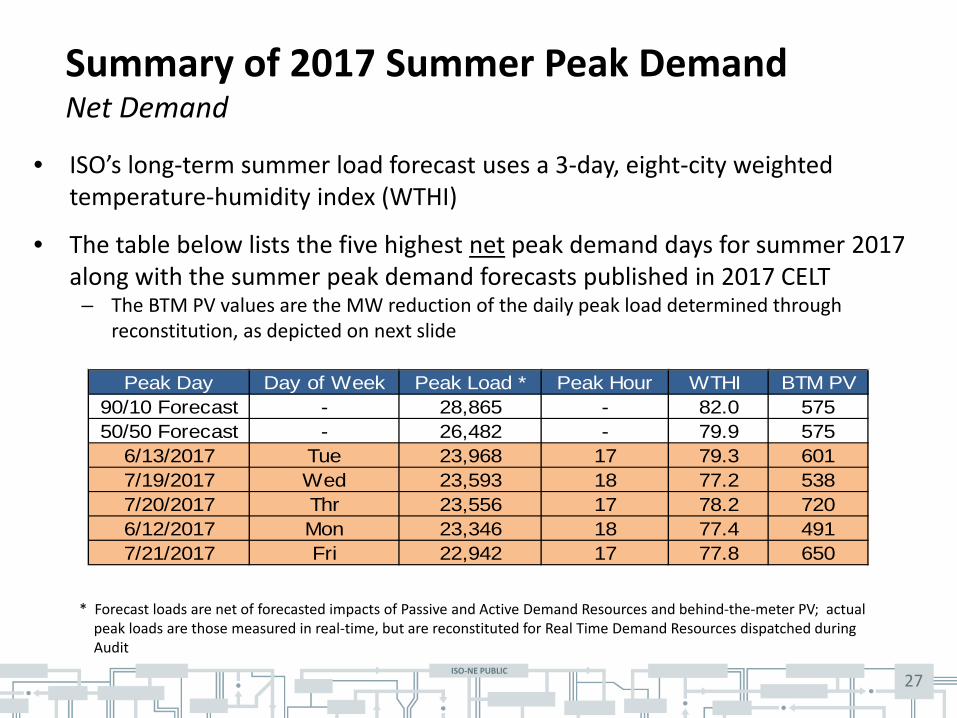
Summary of 2017 Summer Peak Demand Net Demand
• ISO’s long-term summer load forecast uses a 3-day, eight-city weighted temperature-humidity index (WTHI)
• The table below lists the five highest net peak demand days for summer 2017 along with the summer peak demand forecasts published in 2017 CELT
– The BTM PV values are the MW reduction of the daily peak load determined through reconstitution, as depicted on next slide
* Forecast loads are net of forecasted impacts of Passive and Active Demand Resources and behind-the-meter PV; actual peak loads are those measured in real-time, but are reconstituted for Real Time Demand Resources dispatched during
Audit
Peak Day Day of Week Peak Load * Peak Hour WTHI BTM PV90/10 Forecast - 28,865 - 82.0 57550/50 Forecast - 26,482 - 79.9 575
6/13/2017 Tue 23,968 17 79.3 6017/19/2017 Wed 23,593 18 77.2 5387/20/2017 Thr 23,556 17 78.2 7206/12/2017 Mon 23,346 18 77.4 4917/21/2017 Fri 22,942 17 77.8 650
ISO-NE PUBLIC 28
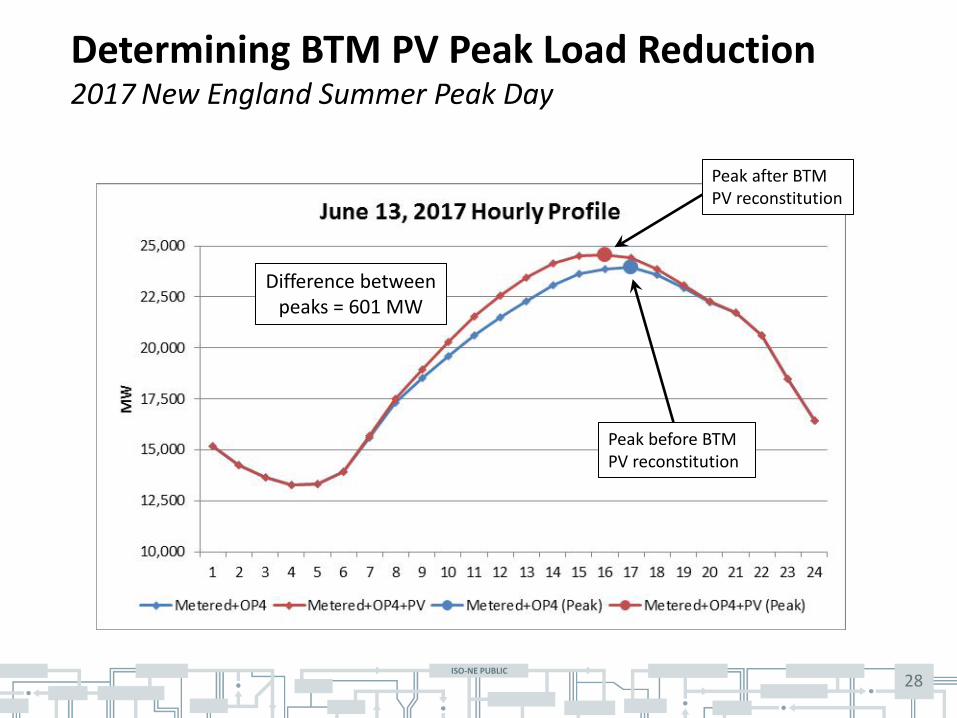
Determining BTM PV Peak Load Reduction 2017 New England Summer Peak Day
Peak before BTM PV reconstitution
Peak after BTM PV reconstitution
Difference between peaks = 601 MW
ISO-NE PUBLIC 29
• The observed system peak load on June 13th was 2,514 MW lower than the 2017 CELT net 50/50 forecast
– Observed weather at ISO’s eight weather stations was less severe (WTHI=79.3) than the weather assumed for the 50/50 long-term load forecast (WTHI=79.9)
• Using CELT 2017 forecast model coefficients, the difference between forecast and actual can be attributed to two factors:
1. Peak occurred in June – if the same June peak WTHI value (79.3) were to occur in either July or August, the peak would have been 2,050 MW higher
2. Peak hour WTHI value less than 50/50 WTHI value - an increase of 0.6 degrees in the WTHI, the difference between the June peak WTHI value and the 50/50 value, would lead to an increase of demand by about 630 MW
• Adding back the adjustments described above to the June 13th peak value results in a adjusted peak of 26,648 MW which is 166 MW (0.6%) higher than the 2017 CELT net 50/50 forecast of 26,482 MW
2017 Summer Peak – Tuesday, June 13, 2017 Observed Load vs. Forecast
ISO-NE PUBLIC 30
Next Steps
• Next LFC meeting is February 7, 2018 – Final draft energy forecast and draft summer peak forecast will be
discussed
• The final forecast will be published as part of the 2017 CELT by May 1st

ISO-NE PUBLIC 31
ISO-NE PUBLIC ISO-NE PUBLIC
APPENDIX Regional Energy Forecast Model Details/Statistics
32
ISO-NE PUBLIC 33
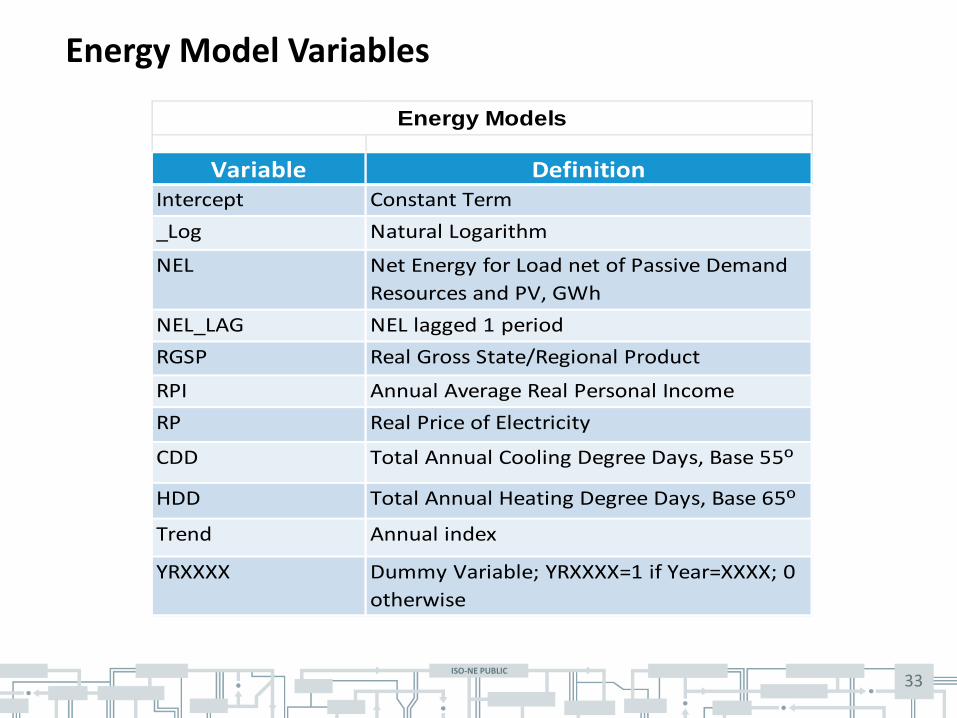
Energy Model Variables
Variable Definition Intercept Constant Term _Log Natural Logarithm
NEL Net Energy for Load net of Passive Demand Resources and PV, GWh
NEL_LAG NEL lagged 1 period RGSP Real Gross State/Regional Product
RPI Annual Average Real Personal Income RP Real Price of Electricity
CDD Total Annual Cooling Degree Days, Base 55º
HDD Total Annual Heating Degree Days, Base 65º
Trend Annual index
YRXXXX Dummy Variable; YRXXXX=1 if Year=XXXX; 0 otherwise
Energy Models
ISO-NE PUBLIC 34
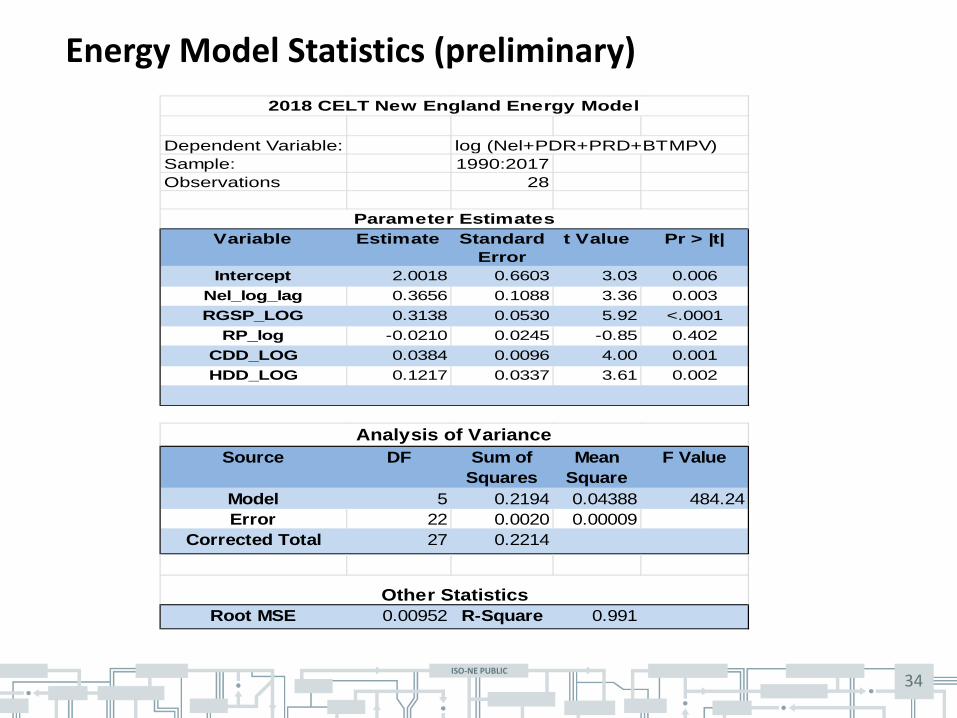
Energy Model Statistics (preliminary)
Dependent Variable: log (Nel+PDR+PRD+BTMPV)Sample: 1990:2017Observations 28
Variable Estimate Standard Error
t Value Pr > |t|
Intercept 2.0018 0.6603 3.03 0.006Nel_log_lag 0.3656 0.1088 3.36 0.003RGSP_LOG 0.3138 0.0530 5.92 <.0001
RP_log -0.0210 0.0245 -0.85 0.402CDD_LOG 0.0384 0.0096 4.00 0.001HDD_LOG 0.1217 0.0337 3.61 0.002
Parameter Estimates
2018 CELT New England Energy Model
Sum of MeanSquares Square
Model 5 0.2194 0.04388 484.24Error 22 0.0020 0.00009
Corrected Total 27 0.2214
Root MSE 0.00952 R-Square 0.991Other Statistics
Source DF F ValueAnalysis of Variance