Embed Size (px)
Citation preview
DRAFTSystemReoperationStudy
Forecast‐BasedOperationsAnalysis
Technical Report
Prepared for
Department of Water Resources
by
1771 Tribute Road, Suite A Sacramento, CA 95815
916/456-4400 (phone) • 916/456-0253 (fax)
Contents
1 Background 11.1 System Reoperation . . . . . . . . . . . . . . . . . . . . . . . . . . . . . . . . . . . 11.2 Forecast-Based Operation . . . . . . . . . . . . . . . . . . . . . . . . . . . . . . . . 1
2 Purpose 32.1 Water Supply Enhancement . . . . . . . . . . . . . . . . . . . . . . . . . . . . . . . 32.2 Flood Control Enhancement . . . . . . . . . . . . . . . . . . . . . . . . . . . . . . 3
3 Watershed and Reservoir Characteristics 53.1 Sacramento River Watershed (Shasta Reservoir) . . . . . . . . . . . . . . . . . . . . 63.2 Upper Feather River Watershed (Oroville Reservoir) . . . . . . . . . . . . . . . . . . 63.3 Yuba River Watershed (New Bullards Bar Reservoir) . . . . . . . . . . . . . . . . . 63.4 American River Watershed (Folsom Reservoir) . . . . . . . . . . . . . . . . . . . . . 73.5 Merced River Watershed (New Exchequer Reservoir) . . . . . . . . . . . . . . . . . 7
4 Reservoir Operation Zones 8
5 Evaluation of Forecast Reliability 10
6 Water Supply Enhancement 136.1 Methodology . . . . . . . . . . . . . . . . . . . . . . . . . . . . . . . . . . . . . . . 136.2 Analysis Assumptions . . . . . . . . . . . . . . . . . . . . . . . . . . . . . . . . . . 136.3 Reservoir Operations Model . . . . . . . . . . . . . . . . . . . . . . . . . . . . . . . 15
6.3.1 Historical Reservoir Data . . . . . . . . . . . . . . . . . . . . . . . . . . . . 156.3.2 Water Supply Enhancement Zones . . . . . . . . . . . . . . . . . . . . . . . 156.3.3 Flood Space Evacuation Zones . . . . . . . . . . . . . . . . . . . . . . . . . 166.3.4 Other Simulation Regions . . . . . . . . . . . . . . . . . . . . . . . . . . . . 166.3.5 Reoperated Outflow . . . . . . . . . . . . . . . . . . . . . . . . . . . . . . . 16
6.4 Results . . . . . . . . . . . . . . . . . . . . . . . . . . . . . . . . . . . . . . . . . . 176.4.1 Reoperation Outflow and Storage . . . . . . . . . . . . . . . . . . . . . . . . 176.4.2 Refill Potential . . . . . . . . . . . . . . . . . . . . . . . . . . . . . . . . . . 206.4.3 Monthly Storage Effects . . . . . . . . . . . . . . . . . . . . . . . . . . . . . 22
6.5 Evaluation of Benefits . . . . . . . . . . . . . . . . . . . . . . . . . . . . . . . . . . 276.6 Recommendations for Further Study . . . . . . . . . . . . . . . . . . . . . . . . . . 27
7 Flood Control Enhancement 287.1 Shasta . . . . . . . . . . . . . . . . . . . . . . . . . . . . . . . . . . . . . . . . . . 287.2 Oroville . . . . . . . . . . . . . . . . . . . . . . . . . . . . . . . . . . . . . . . . . 297.3 New Bullards Bar . . . . . . . . . . . . . . . . . . . . . . . . . . . . . . . . . . . . 297.4 Folsom . . . . . . . . . . . . . . . . . . . . . . . . . . . . . . . . . . . . . . . . . . 297.5 Recommendations for Further Study . . . . . . . . . . . . . . . . . . . . . . . . . . 29
iii
Contents
References 31
Appendices
A Reoperation Plots 33A.1 Shasta . . . . . . . . . . . . . . . . . . . . . . . . . . . . . . . . . . . . . . . . . . 34A.2 Oroville . . . . . . . . . . . . . . . . . . . . . . . . . . . . . . . . . . . . . . . . . 64A.3 New Bullards Bar . . . . . . . . . . . . . . . . . . . . . . . . . . . . . . . . . . . . 86A.4 Folsom . . . . . . . . . . . . . . . . . . . . . . . . . . . . . . . . . . . . . . . . . . 108
B Monthly Effects Evaluation 137B.1 Modeling the Reoperation . . . . . . . . . . . . . . . . . . . . . . . . . . . . . . . . 137
B.1.1 Parameters . . . . . . . . . . . . . . . . . . . . . . . . . . . . . . . . . . . . 137B.1.2 Plots . . . . . . . . . . . . . . . . . . . . . . . . . . . . . . . . . . . . . . . 137
B.2 Effects . . . . . . . . . . . . . . . . . . . . . . . . . . . . . . . . . . . . . . . . . . 147
iv
List of Tables
4.1 Reservoir Operation Zones . . . . . . . . . . . . . . . . . . . . . . . . . . . . . . . 8
6.1 Parameters for Reoperation Procedure . . . . . . . . . . . . . . . . . . . . . . . . . 156.2 Summary of Base Outflow Conditions . . . . . . . . . . . . . . . . . . . . . . . . . 176.3 Summary of Reoperation Results . . . . . . . . . . . . . . . . . . . . . . . . . . . . 20
7.1 Evaluation of Watershed Flood Control System Components with Regard to Abilityto Implement F-BO . . . . . . . . . . . . . . . . . . . . . . . . . . . . . . . . . . . 28
v
List of Figures
1.1 Depiction of reservoir space allocations under (a) typical operating paradigm and (b)forecast-based operation. . . . . . . . . . . . . . . . . . . . . . . . . . . . . . . . . 2
3.1 Study region . . . . . . . . . . . . . . . . . . . . . . . . . . . . . . . . . . . . . . . 5
4.1 Typical reservoir operation diagram . . . . . . . . . . . . . . . . . . . . . . . . . . . 9
5.1 Forecast accuracy for Folsom . . . . . . . . . . . . . . . . . . . . . . . . . . . . . . 105.2 Forecast accuracy for New Bullards Bar . . . . . . . . . . . . . . . . . . . . . . . . 115.3 Forecast accuracy for Oroville . . . . . . . . . . . . . . . . . . . . . . . . . . . . . . 115.4 Forecast accuracy for Shasta . . . . . . . . . . . . . . . . . . . . . . . . . . . . . . 12
6.1 Example reservoir operations plot for Shasta . . . . . . . . . . . . . . . . . . . . . . 186.2 Example reservoir operations plot for Oroville . . . . . . . . . . . . . . . . . . . . . 186.3 Example reservoir operations plot for New Bullards Bar . . . . . . . . . . . . . . . . 196.4 Example reservoir operations plot for Folsom . . . . . . . . . . . . . . . . . . . . . . 206.5 Exceedance plots for spring refill storage values at Folsom . . . . . . . . . . . . . . . 236.6 Exceedance plots for spring refill storage values at New Bullards Bar . . . . . . . . . 236.7 Exceedance plots for spring refill storage values at Oroville . . . . . . . . . . . . . . 246.8 Exceedance plots for spring refill storage values at Shasta . . . . . . . . . . . . . . . 246.9 Exceedance plots for end-of-month storage values at Folsom . . . . . . . . . . . . . 256.10 Exceedance plots for end-of-month storage values at New Bullards Bar . . . . . . . . 256.11 Exceedance plots for end-of-month storage values at Oroville . . . . . . . . . . . . . 266.12 Exceedance plots for end-of-month storage values at Shasta . . . . . . . . . . . . . 26
vi
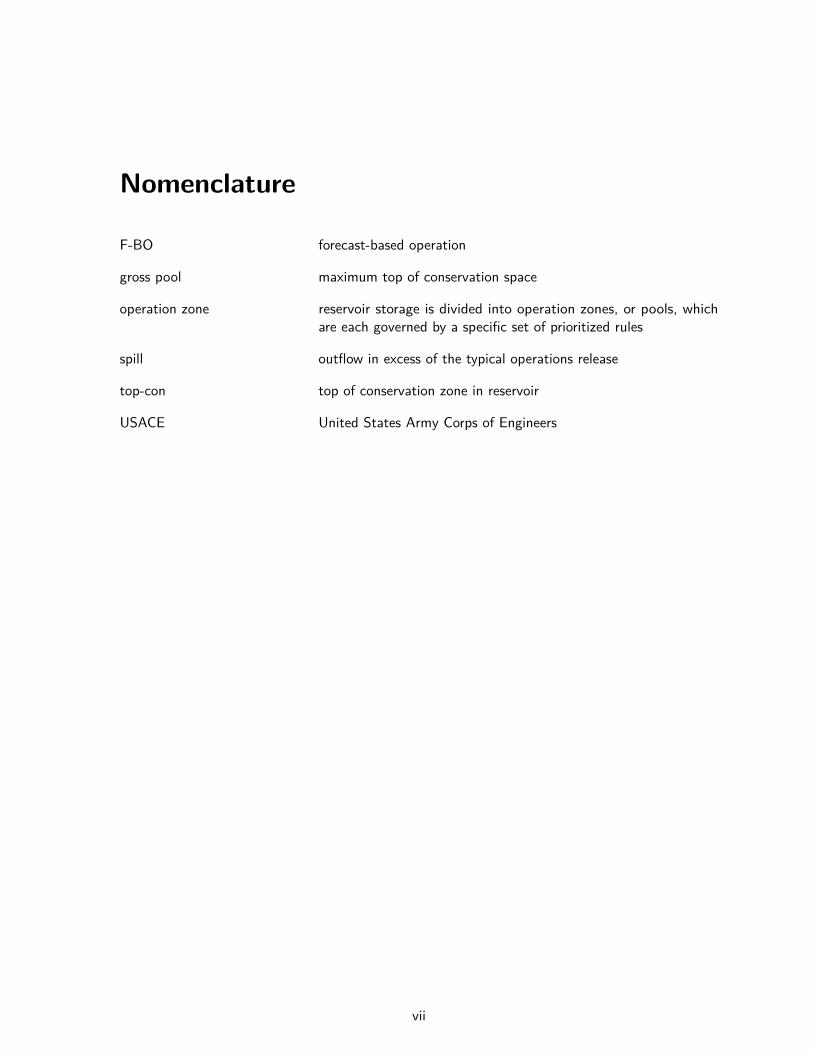
Nomenclature
F-BO forecast-based operation
gross pool maximum top of conservation space
operation zone reservoir storage is divided into operation zones, or pools, whichare each governed by a specific set of prioritized rules
spill outflow in excess of the typical operations release
top-con top of conservation zone in reservoir
USACE United States Army Corps of Engineers
vii
��
��1 Background
1.1 System Reoperation
The System Reoperation Study (“Reoperation Study”) is investigating changes in operations andother strategies that may result in improved system performance in terms of additional water supply,flood hazard reduction, and ecosystem protection and restoration. It is recognized that existingreservoir operations are typically based on meeting all or some of these three objectives. As such, theReoperation Study focuses on modifications to existing operations and expansion of these benefits.The Reoperation Study team has developed several reoperation components to evaluate at selectriver/reservoir systems to quantify benefits and improve understanding of the trade-offs involved.
MBK Engineers is providing technical, strategic, and coordination support for the Reoperation Study.An analysis of Forecast-Based Operation (F-BO) is part of that support. The following reportsummarizes this effort.
1.2 Forecast-Based Operation
F-BO can be applied to any reservoir with a traditional water supply and flood control space allocationparadigm. The incorporation of weather forecasts allows for greater flexibility in the management ofthe reservoir’s space (flood control versus conservation) and inherently increases the opportunitiesfor gaining additional water supply and flood control benefits through its implementation.
System reoperation is informed by historical flood patterns and utilizes records of inflow, outflow,and storage in the reservoirs to develop modified rules for flood releases. Changes to historicaloperations of the reservoirs is expected to reveal potential for additional water supply storage. Withimprovements to many of the reservoir facilities, such as increased release capacity, operations areno longer required to be as conservative as they once were. By reducing outflow and allowing anincrease in water storage, significant improvements in water supply can be achieved. However, caremust be taken so that sufficient water can still be evacuated in the event of a significant forecastedflood.
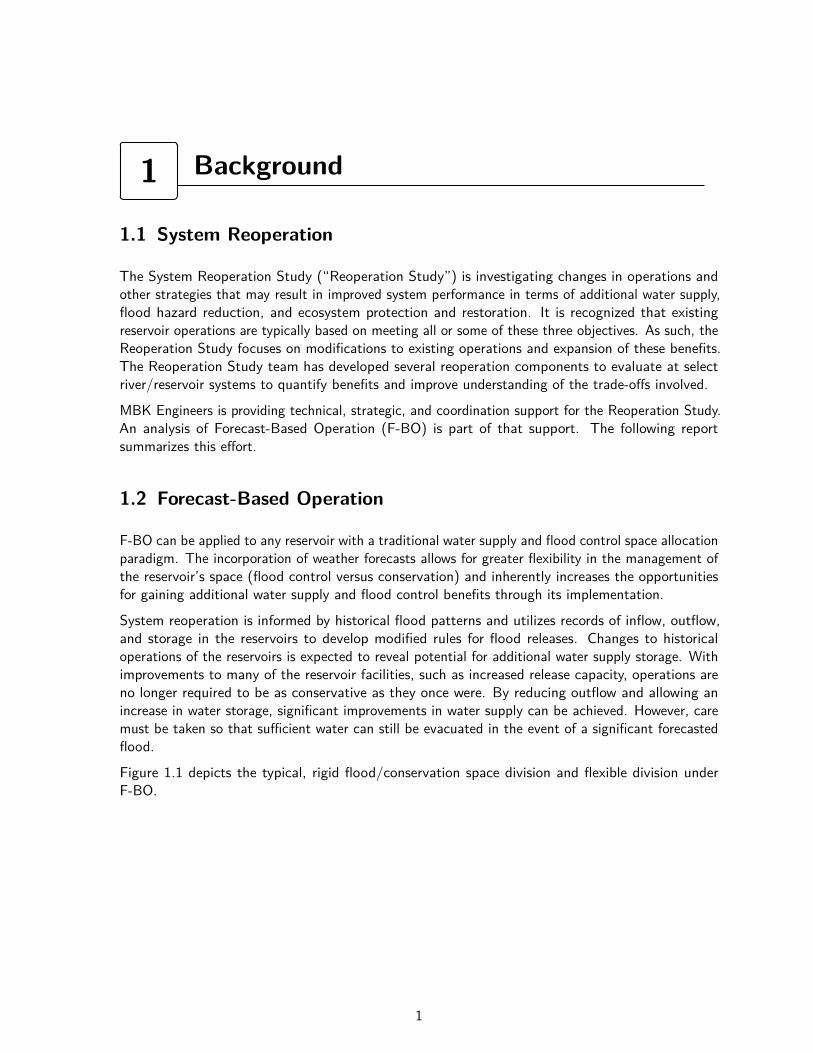
Figure 1.1 depicts the typical, rigid flood/conservation space division and flexible division underF-BO.
1
1: Background
Figure 1.1. Depiction of reservoir space allocations under (a) typical operating paradigm and (b)forecast-based operation.
Conservation
Flood Control
(a)
Conservation
Variable
Flood Control
(b)
2
��
��2 Purpose
The F-BO portion of the system reoperation study evaluated the potential in reoperating the systemreservoirs for two primary purposes:
1. Enhancement of water supply through the relaxation of traditional reservoir flood control rules
2. Enhancement of the flood protection provided by each reservoir.
2.1 Water Supply Enhancement
Reoperation allows additional water to be stored in the reservoir temporarily. Reducing regions of“spill,” or times when outflow exceeds the standard operations release, offers a potential for increasedstorage throughout the year. This may improve water supply after the reservoir fills in the spring.Using spill to define potential times for reoperation resulted in increased storage during periods wherea historical spill was deemed unnecessary.
It is proposed that the portion of the analysis aimed to enhance water supply through theimplementation of F-BO consist of the following components:
1. Review historical reservoir storage data and flood space requirements to determine when relaxedflood control space requirements could have potentially provided additional water supply duringthe subsequent season.
2. Develop parameters for F-BO flood space relaxation. Parameters will represent a reasonablelevel of assumed flood risk (e.g., flood space reduction will be of comparable volume to thatwhich can be evacuated within several days when a significant flood event is forecast and thereserved flood space must increase).
3. Evaluate historical benefits possible with proposed F-BO flood space relaxation approach.
4. Integrate flood space reduction results (end-of-month flood control targets) with system-widemodeling to make use of anticipated water supply gained through F-BO.
2.2 Flood Control Enhancement
The flood management benefits of F-BO vary greatly by river system. The portion of the analysisaimed to enhance flood control through the implementation of F-BO is proposed to consist of thefollowing components:
1. Review and compare historical reservoir storage and river flow data with flood rules and spacerequirements to determine when additional flood control storage or modification of flood ruleparameters would have been beneficial to enhance flood control.
2. Identify factors at each reservoir potentially limiting F-BO effectiveness (e.g., limited outletcapacity or insufficient flood space).
3
2: Purpose
3. Coordinate with National Weather Service/State California-Nevada River Forecast Centerto assess level of confidence in using operational weather and reservoir inflow forecasts fordecision-making at reservoirs.
4. Develop comparison of each reservoir’s potential for use of F-BO to enhance flood control.The comparison will identify the reservoirs’ potential in each of several areas (flood space,outlet capacity, channel capacity, etc.).
4
��
��3 Watershed and Reservoir Characteristics
The following rivers and reservoirs were included in the forecast-based operations analysis performedfor the system reoperation study:
• Sacramento River / Shasta Dam• Feather River / Oroville Dam• North Yuba River / New Bullards Bar Dam• American River / Folsom Dam• Merced River / New Exchequer Dam
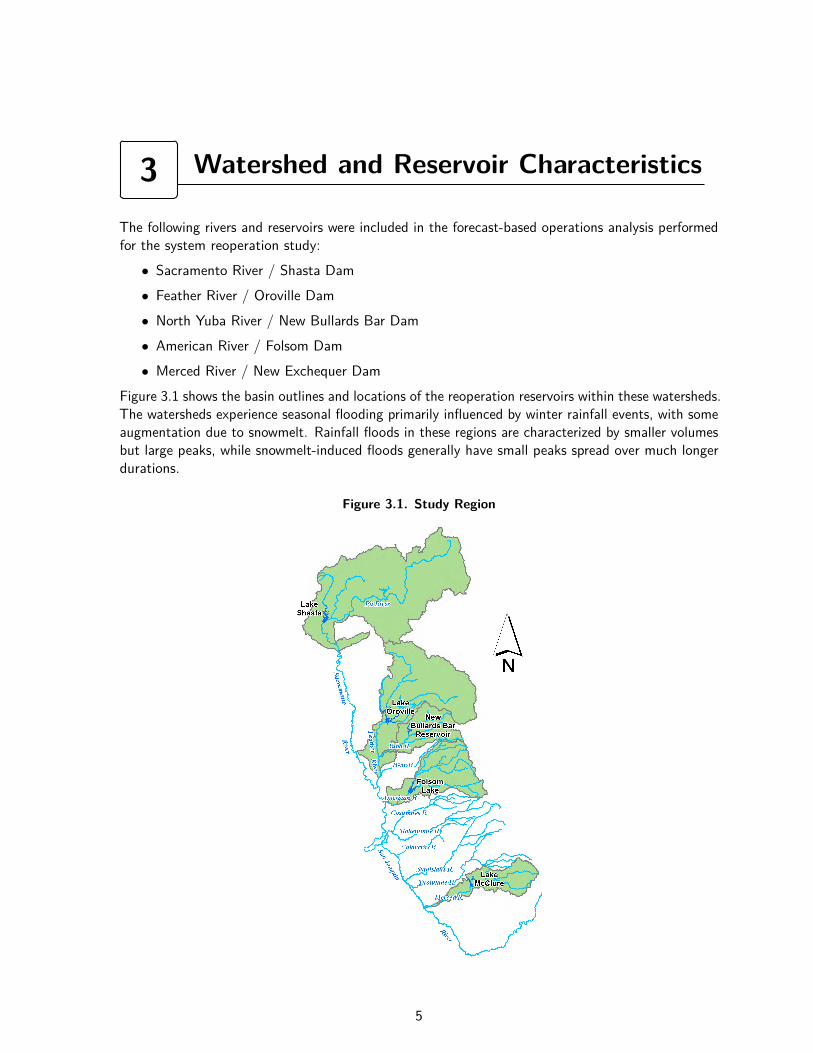
Figure 3.1 shows the basin outlines and locations of the reoperation reservoirs within these watersheds.The watersheds experience seasonal flooding primarily influenced by winter rainfall events, with someaugmentation due to snowmelt. Rainfall floods in these regions are characterized by smaller volumesbut large peaks, while snowmelt-induced floods generally have small peaks spread over much longerdurations.
Figure 3.1. Study Region
5
3: Watershed and Reservoir Characteristics
3.1 Sacramento River Watershed (Shasta Reservoir)
Shasta Dam and Reservoir (Shasta) are located on the Sacramento River below its confluencewith the Pit River, about 10 miles north of Redding, CA. The mainstem originates in the KlamathMountains and flows through Central California. The Sacramento River drains over 27,500 squaremiles and ends in the Delta. Shasta is a key unit of the Central Valley Project (CVP); irrigationdiversions and power generation at Shasta are integrated into the CVP.Though a number of small privately owned irrigation dams and several private hydroelectric powergeneration facilities exist on the Pit River and its tributaries, none of these contribute significantly tostorage upstream of Shasta Reservoir.Shasta is owned and operated by the United States Bureau of Reclamation (Reclamation). Floodcontrol operation procedures are coordinated with input from United States Army Corps of Engineers(USACE). The California Department of Water Resources (DWR) coordinates irrigation diversionsfrom Shasta and also provides hydrologic forecasting services. The California Department of Fishand Wildlife (CDFW) coordinates fishery releases with Reclamation. The National Weather Service(NWS) provides hydrologic forecast support.
3.2 Upper Feather River Watershed (Oroville Reservoir)
Oroville Dam and Reservoir (Oroville) were constructed as a unit of the Feather River Project (part ofthe State Water Project, or SWP) for the purposes of developing water supply, flood control, powergeneration, recreation and conservation on the Feather River, a tributary of the Sacramento River.The Upper Feather River Watershed drains 3,611 square miles of the eastern side of the SacramentoRiver Valley and northern end of the Sierra Nevada Range. Flood peaks on streams in the basinabove Oroville are often delayed by numerous upstream checkdams, diversions and reservoirs. Whenhigh flows in the Feather coincide with large flows in downstream tributaries, channel capacity may beexceeded. Many of the storage reservoirs upstream of Oroville are maintained for power generationfacilities managed by PG&E. The combined capacity of all upstream reservoirs is close to 2,000,000acre-feet. Several of the upstream reservoirs may influence runoff volumes at Oroville during largefloods, though most are negligible.DWR operates Oroville with input from USACE for flood control procedures and CDFW for fisheryreleases. The operation of Oroville by DWR is closely coordinated with YCWA’s operation of NewBullards Bar in order to meet safe objective downstream channel capacities during the flood season.
3.3 Yuba River Watershed (New Bullards Bar Reservoir)
New Bullards Bar Dam and Reservoir (New Bullards Bar) regulate over a third (36%) of the YubaRiver Watershed, a drainage area of about 1,350 square miles which lies entirely on the westernslope of the Sierra Nevada. There are no reservoirs upstream of New Bullards Bar on the Yuba,but nearly 20 reservoirs with over 1,000 acre-feet of storage exist in the Yuba Watershed. Thesereservoirs contain no flood control space but may significantly reduce volumes of rainfall runoff toNew Bullards Bar early in the season.The operation of New Bullards Bar by the Yuba County Water Agency (YCWA) is closely coordinatedwith DWR’s operation of Oroville in order to meet safe objective channel capacities downstream of
6
3: Watershed and Reservoir Characteristics
the two reservoirs during flood season. DWR provides assistance with hydrologic forecasting. Floodcontrol operations are coordinated with USACE, which also provides hydrologic forecasting. Fisheryreleases are coordinated with CDFW.
3.4 American River Watershed (Folsom Reservoir)
Folsom Dam and Reservoir (Folsom) regulate the majority of the water passing through the AmericanRiver Watershed. This watershed originates in the Sierra Nevada range and drains toward the deltain California’s Central Valley. The Upper American River Watershed houses several reservoirs thatwere developed primarily for hydropower production but also provide some flood protection andwater supply. Hell-Hole, French Meadows, and Union Valley Reservoirs can be used to transfer floodprotection credit to Folsom Reservoir, thus reducing Folsom’s flood space requirement.
The operation of Folsom is managed by Reclamation, with flood control operations input providedby USACE and the Sacramento Area Flood Control Agency (SAFCA). The United States Fishand Wildlife Service (USFWS) and CDFW coordinate fishery releases for Folsom with Reclamation.Hydrologic forecasting is provided by NWS and DWR, (USACE-SPK, 1987).
3.5 Merced River Watershed (New Exchequer Reservoir)
New Exchequer Dam and its reservoir, Lake McClure, are operated by the Merced Irrigation District(MID). The facilities are located 60 miles upstream of Merced River’s confluence with the SanJoaquin River and regulate the 1,276-square mile Merced River Watershed on the western slopes ofthe Sierra Nevada. MBK has prepared a separate report (MBK, 2013) which details forecast-basedsystem reoperation analysis for New Exchequer and its associated facilities.
7
��
��4 Reservoir Operation Zones
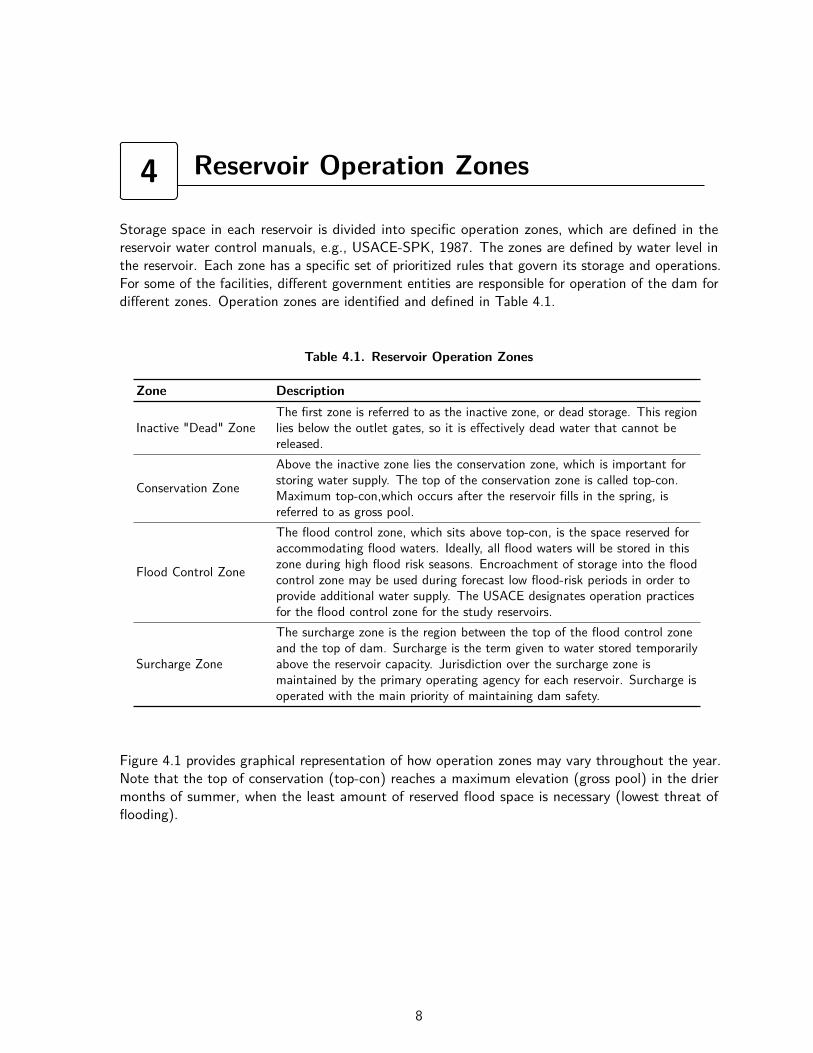
Storage space in each reservoir is divided into specific operation zones, which are defined in thereservoir water control manuals, e.g., USACE-SPK, 1987. The zones are defined by water level inthe reservoir. Each zone has a specific set of prioritized rules that govern its storage and operations.For some of the facilities, different government entities are responsible for operation of the dam fordifferent zones. Operation zones are identified and defined in Table 4.1.
Table 4.1. Reservoir Operation Zones
Zone Description
Inactive "Dead" ZoneThe first zone is referred to as the inactive zone, or dead storage. This regionlies below the outlet gates, so it is effectively dead water that cannot bereleased.
Conservation Zone
Above the inactive zone lies the conservation zone, which is important forstoring water supply. The top of the conservation zone is called top-con.Maximum top-con,which occurs after the reservoir fills in the spring, isreferred to as gross pool.
Flood Control Zone
The flood control zone, which sits above top-con, is the space reserved foraccommodating flood waters. Ideally, all flood waters will be stored in thiszone during high flood risk seasons. Encroachment of storage into the floodcontrol zone may be used during forecast low flood-risk periods in order toprovide additional water supply. The USACE designates operation practicesfor the flood control zone for the study reservoirs.
Surcharge Zone
The surcharge zone is the region between the top of the flood control zoneand the top of dam. Surcharge is the term given to water stored temporarilyabove the reservoir capacity. Jurisdiction over the surcharge zone ismaintained by the primary operating agency for each reservoir. Surcharge isoperated with the main priority of maintaining dam safety.
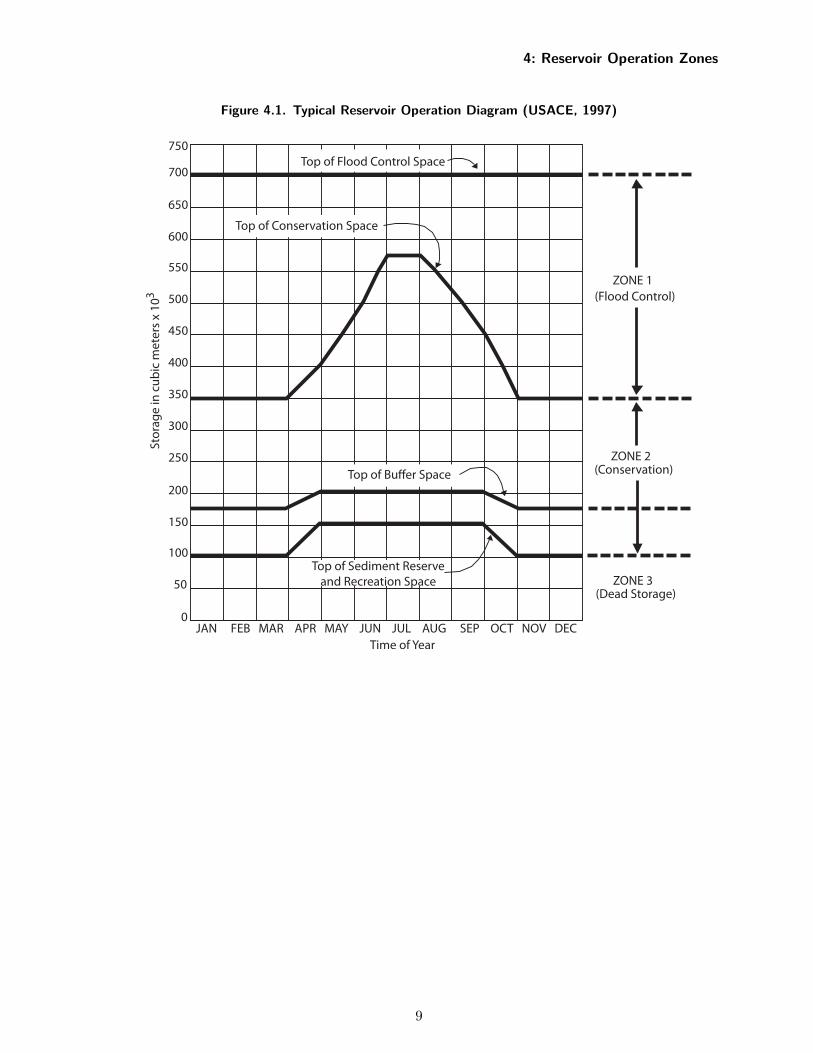
Figure 4.1 provides graphical representation of how operation zones may vary throughout the year.Note that the top of conservation (top-con) reaches a maximum elevation (gross pool) in the driermonths of summer, when the least amount of reserved flood space is necessary (lowest threat offlooding).
8
4: Reservoir Operation Zones
Figure 4.1. Typical Reservoir Operation Diagram (USACE, 1997)
Time of Year
Top of Bu�er Space
ZONE 1(Flood Control)
ZONE 2
ZONE 3
(Conservation)
(Dead Storage)
Top of Sediment Reserveand Recreation Space
JAN FEB MAR APR MAY JUN JUL AUG SEP OCT NOV DEC
750
700
650
600
550
500
450
400
350
300
250
200
150
100
50
0
Stor
age
in c
ubic
met
ers
x 10
3
Top of Conservation Space
Top of Flood Control Space
9
��
��5 Evaluation of Forecast Reliability
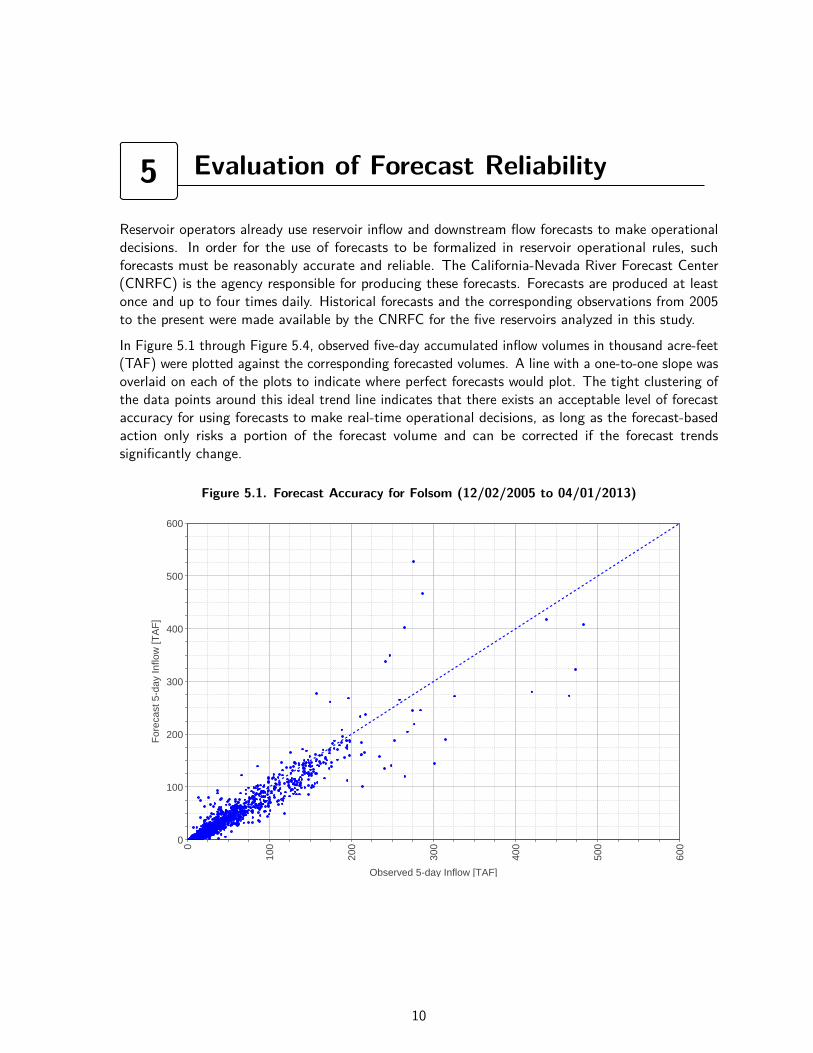
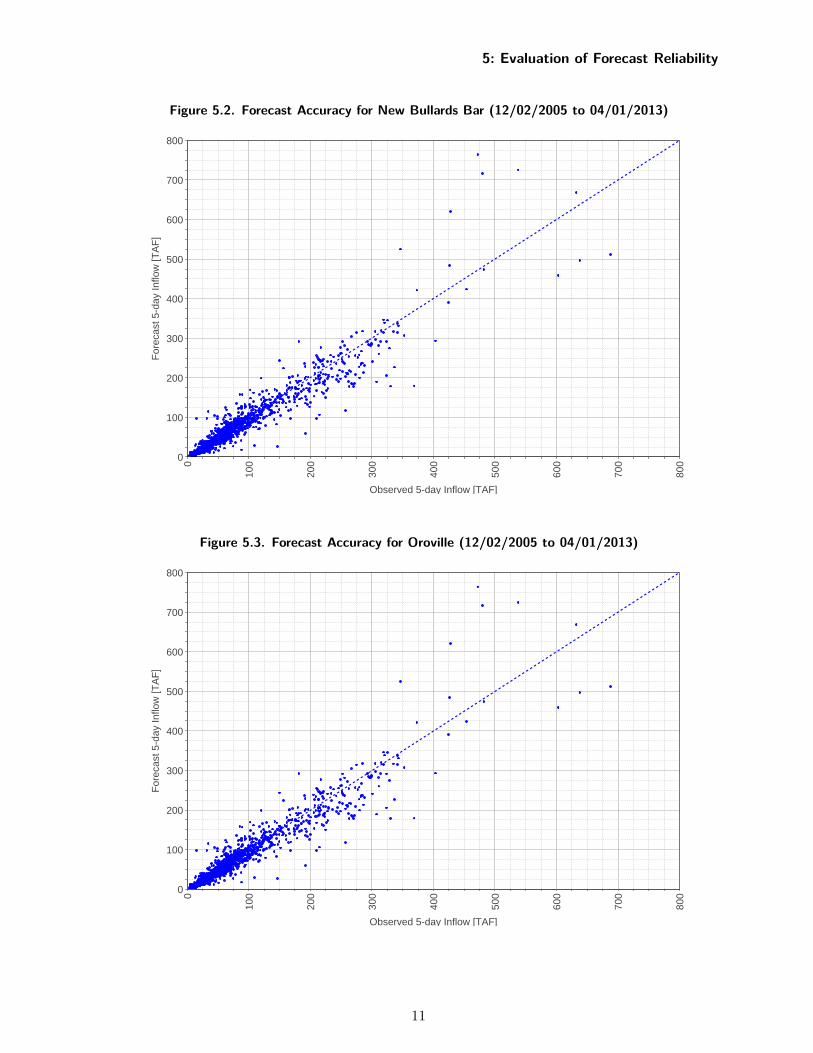
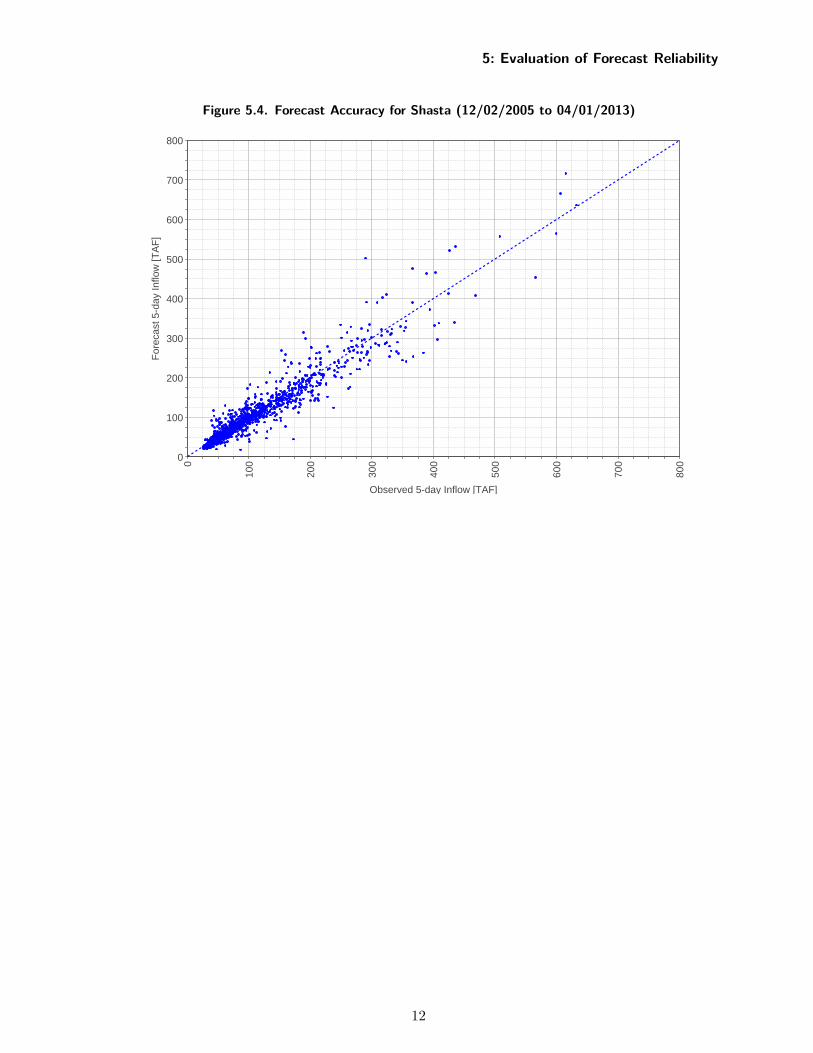
Reservoir operators already use reservoir inflow and downstream flow forecasts to make operationaldecisions. In order for the use of forecasts to be formalized in reservoir operational rules, suchforecasts must be reasonably accurate and reliable. The California-Nevada River Forecast Center(CNRFC) is the agency responsible for producing these forecasts. Forecasts are produced at leastonce and up to four times daily. Historical forecasts and the corresponding observations from 2005to the present were made available by the CNRFC for the five reservoirs analyzed in this study.
In Figure 5.1 through Figure 5.4, observed five-day accumulated inflow volumes in thousand acre-feet(TAF) were plotted against the corresponding forecasted volumes. A line with a one-to-one slope wasoverlaid on each of the plots to indicate where perfect forecasts would plot. The tight clustering ofthe data points around this ideal trend line indicates that there exists an acceptable level of forecastaccuracy for using forecasts to make real-time operational decisions, as long as the forecast-basedaction only risks a portion of the forecast volume and can be corrected if the forecast trendssignificantly change.
Figure 5.1. Forecast Accuracy for Folsom (12/02/2005 to 04/01/2013)Comparison of Forecast and Oberved 5-day Reservoir Inflow VolumesStation: Folsom Dam; Dates: 12/02/2005 to 04/01/2013
0
100
200
300
400
500
600
Observed 5-day Inflow [TAF]
0
100
200
300
400
500
600
For
ecas
t 5-d
ay In
flow
[TA
F]
10
5: Evaluation of Forecast Reliability
Figure 5.2. Forecast Accuracy for New Bullards Bar (12/02/2005 to 04/01/2013)Comparison of Forecast and Oberved 5-day Reservoir Inflow VolumesStation: Oroville Dam; Dates: 12/02/2005 to 04/01/2013
0
100
200
300
400
500
600
700
800
Observed 5-day Inflow [TAF]
0
100
200
300
400
500
600
700
800F
orec
ast 5
-day
Inflo
w [T
AF
]
Figure 5.3. Forecast Accuracy for Oroville (12/02/2005 to 04/01/2013)Comparison of Forecast and Oberved 5-day Reservoir Inflow VolumesStation: Oroville Dam; Dates: 12/02/2005 to 04/01/2013
0
100
200
300
400
500
600
700
800
Observed 5-day Inflow [TAF]
0
100
200
300
400
500
600
700
800
For
ecas
t 5-d
ay In
flow
[TA
F]
11
5: Evaluation of Forecast Reliability
Figure 5.4. Forecast Accuracy for Shasta (12/02/2005 to 04/01/2013)Comparison of Forecast and Oberved 5-day Reservoir Inflow VolumesStation: Shasta Dam; Dates: 12/02/2005 to 04/01/2013
0
100
200
300
400
500
600
700
800
Observed 5-day Inflow [TAF]
0
100
200
300
400
500
600
700
800F
orec
ast 5
-day
Inflo
w [T
AF
]
12
��
��6 Water Supply Enhancement
F-BO can be used to enhance water supply at each reservoir. This is achieved by storing water abovetraditional flood control limits during times when significant inflow volume to the reservoir is notpredicted. A means to draw the reservoir back down to the traditional flood control limit is providedas part of the reoperation procedure for times when significant inflow volume is forecast.
The following chapter details the reservoir model development and the methods for quantifyingincreased water supply with F-BO.
6.1 Methodology
The model used for this analysis was developed by MBK Engineers based on historical reservoirinflow and outflow records. The following sections describe the constraints and assumptions used fordeveloping the criteria applied to obtain reoperated reservoir outflow and storage values.
6.2 Analysis Assumptions
This section provides background on some of the key modeling and hydrologic assumptions used forthis analysis.
1. Daily Reoperation
Forecast-based system reoperation for the four reservoirs was analyzed in a daily operationsmodel. Operational decisions based on forecast inflow are made on a daily basis, so a dailymodel is most appropriate for this simulation. This timestep provided a suitable level of detailfor the required analysis.
2. Perfect Forecasting
Perfect foresight of historical inflow values was used to perform forecasting for the daily reservoiroperation simulations. As discussed in Chapter 5, the strong correlation between observed andforecast data justifies extending the reoperation methodology to real-time operations.
In a real-time operational environment, operators will not have the luxury of perfect forecasts.The use of perfect forecasts for this analysis only pertains to the drawdown trigger. The factthat the forecasts are perfect is not considered a critical factor in this analysis. That is, theproposed procedure for water supply enhancement should work equally well with uncertainforecasts in the real-time operational environment, provided the trigger levels are adjusted toaccount for forecast uncertainty.
3. Reservoir Fill Constraints
For the purpose of this study, gross pool storage was used as the maximum reservoir storageconstraint. Historically, reservoir refill was occasionally allowed to encroach above the level of
13
6: Water Supply Enhancement
gross pool storage. Outflow was required to exceed the rate necessary to maintain storagebelow gross pool levels. For several of the reservoirs, the top-con curve has been revised overtime. Thus, gross pool was noted each water year to set this constraint.
4. Spill Threshold Values
A typical operation level for each reservoir was selected to provide a baseline outflow valuefor the reoperation routine. When the flood pool is encroached, typical reservoir operationsprocedures dictate that outflow should increase so as to draw down storage to the acceptablelevel (top-con). This may involve increasing release to above typical operation levels, termed“spill” for this study. Reoperation was targeted to times when outflow exceeded the spillthreshold value.
5. Flood Space Evacuation Targets
Although the goal of the reoperation was to increase water supply storage in the reservoirs,flood management goals must also be met. As such, a flood space evacuation routine waswritten into the reoperation so that temporary storage could subsequently be evacuated ifa large enough inflow was forecast. This process involved selection of accumulated inflowtargets. If forecast inflow over a selected time window exceeded the target for a particularreservoir, the reoperated outflow immediately switched to releasing this accumulated inflowvolume divided evenly over the window, which ensured that the storage curve would drawback down to top-con. For this study, the evacuation targets were compared to the five-dayaccumulated inflow volumes at each timestep.
6. Flood Pool Encroachment Constraints
Historically, many of the reservoirs have been allowed to encroach into the flood pool. Thereare various reasons for this. In order to be consistent with historical practices, some allowancefor this was made in the simulation. Flood pool encroachment was limited to the maximum ofeither one quarter of the available flood space or the historical storage level. This essentiallyresulted in a modified top-con curve, which was plotted along with the reoperation resultsin Appendix A. Outflow was required to exceed the rate necessary to maintain storage levelsbelow the encroachment limit.
7. Physical Constraints of Reservoir Facilities
Physical constraints of the reservoir outlets also constrain the releases. Maximum reservoiroutflow capacity and Rate of Increase (ROI) limitations were important for setting maximumlimits on outflow, while Rate of Decrease (ROD) set the minimum outflow limit.
Table 6.1 summarizes a number of parameters that were used in the calculation of outflow andstorage values for the reoperation procedure.
14
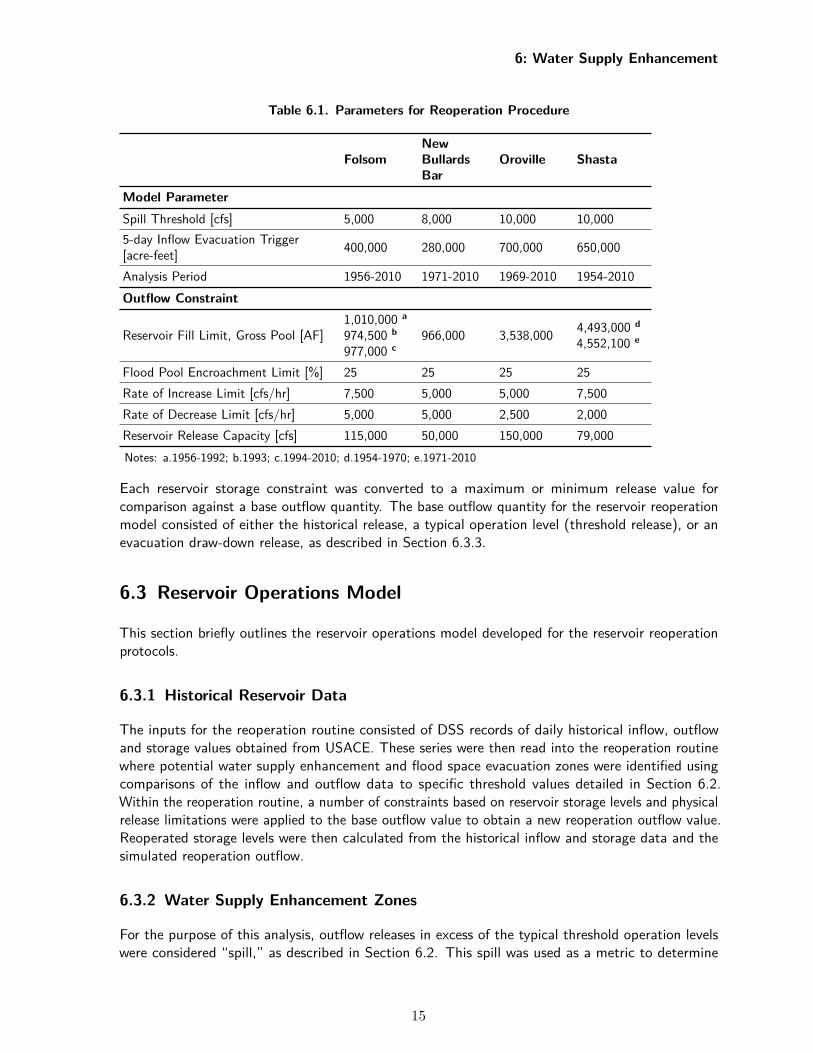
6: Water Supply Enhancement
Table 6.1. Parameters for Reoperation Procedure
FolsomNewBullardsBar
Oroville Shasta
Model ParameterSpill Threshold [cfs] 5,000 8,000 10,000 10,0005-day Inflow Evacuation Trigger[acre-feet] 400,000 280,000 700,000 650,000
Analysis Period 1956-2010 1971-2010 1969-2010 1954-2010Outflow Constraint
Reservoir Fill Limit, Gross Pool [AF]1,010,000 a
974,500 b
977,000 c966,000 3,538,000 4,493,000 d
4,552,100 e
Flood Pool Encroachment Limit [%] 25 25 25 25Rate of Increase Limit [cfs/hr] 7,500 5,000 5,000 7,500Rate of Decrease Limit [cfs/hr] 5,000 5,000 2,500 2,000Reservoir Release Capacity [cfs] 115,000 50,000 150,000 79,000Notes: a.1956-1992; b.1993; c.1994-2010; d.1954-1970; e.1971-2010
Each reservoir storage constraint was converted to a maximum or minimum release value forcomparison against a base outflow quantity. The base outflow quantity for the reservoir reoperationmodel consisted of either the historical release, a typical operation level (threshold release), or anevacuation draw-down release, as described in Section 6.3.3.
6.3 Reservoir Operations Model
This section briefly outlines the reservoir operations model developed for the reservoir reoperationprotocols.
6.3.1 Historical Reservoir Data
The inputs for the reoperation routine consisted of DSS records of daily historical inflow, outflowand storage values obtained from USACE. These series were then read into the reoperation routinewhere potential water supply enhancement and flood space evacuation zones were identified usingcomparisons of the inflow and outflow data to specific threshold values detailed in Section 6.2.Within the reoperation routine, a number of constraints based on reservoir storage levels and physicalrelease limitations were applied to the base outflow value to obtain a new reoperation outflow value.Reoperated storage levels were then calculated from the historical inflow and storage data and thesimulated reoperation outflow.
6.3.2 Water Supply Enhancement Zones
For the purpose of this analysis, outflow releases in excess of the typical threshold operation levelswere considered “spill,” as described in Section 6.2. This spill was used as a metric to determine
15
6: Water Supply Enhancement
the appropriate times to apply a reoperation procedure in order to enhance water supply in thereservoir. Zones of continuous spill, or water supply enhancement zones, were tabulated in order todefine where reoperation would activate. If a timestep fell within a spill zone and did not meet thecriteria for flood space evacuation, the reoperation proceeded. Otherwise, the outflow was held tothe historical release, with certain constraints applied. In the resulting reoperation plots, the watersupply enhancement zones are highlighted in purple (Appendix A).
6.3.3 Flood Space Evacuation Zones
In certain cases, holding reservoir outflow at a constant threshold value caused storage in the reservoirto surpass acceptable limits. As such, a flood space evacuation trigger was included in the procedurein order to prevent excessive encroachment. During the simulation, a forecast window was selected sothat current storage levels could be compared with future top-con storage. If the accumulated inflowvolume over the duration of the forecast window exceeded the reservoir evacuation target, then thewindow was added to a flood space evacuation zone. Deactivation of water supply enhancementprotocols also occurred when reoperated storage exceeded top-con.
When evacuation was triggered, outflow was shifted to a conversion of the accumulated evacuationvolume spread out as a constant release for the duration of the evacuation period. The release volumewas calculated as the accumulated inflow over the evacuation zone plus the difference betweenthe reoperated storage value and the level of top-con at the end of the evacuation window. Thisensured release of the volume necessary to draw the reoperated storage curve back down to top-con.If reoperation had never previously occurred in the water year, outflow in the evacuation regionwas held at the historical level, constrained by additional limitations described below. Flood spaceevacuation zones in the resulting storage and flow plots are highlighted in orange (Appendix A).
6.3.4 Other Simulation Regions
If a particular timestep did not fall into either a water supply enhancement or flood space evacuationregion, the flow was held to historical outflow, with the inclusion of the outflow constraints describedin Table 6.1.
6.3.5 Reoperated Outflow
Designating the water supply enhancement and flood space evacuation zones allowed the appropriatebase outflow value to be selected for each timestep in the model. The following table summarizesthe conditions for determining the base outflows.
16
6: Water Supply Enhancement
Table 6.2. Summary of Base Outflow Conditions
Water SupplyEnhancementZone?
Previous"Spill" inWater Year?
Flood SpaceEvacuationZone?
StorageAboveTop-Con?
Base Outflow
N N N Y/N max of flood pool encroachmentconstraint & historical release
Y/N N Y Y/N max of flood pool encroachmentconstraint & historical release
N Y Y N max of flood pool encroachmentconstraint & historical release
N Y N Y/N max of flood pool encroachmentconstraint & historical release
Y Y/N N Y/N max of flood pool encroachmentconstraint & threshold release
Y/N Y Y Y evacuation release
After determination of the base outflow, the constraints detailed in Table 6.1 were applied. Theresulting reoperation outflow release value was calculated by the following formula:
reoperated outflow = max(reservoir fill limit,. min(ROI, reservoir release capacity,. max(ROD, base outflow) ) )
Reoperated storage was then calculated using the sum of the previous storage value, the historicaldaily change in storage and the difference in reoperated outflow from historical outflow over one day,converted to acre-feet.
6.4 Results
For each water year, a plot detailing the daily storage and flow values was produced. An exampleplot for each reservoir is presented in the following section. Plots for the full period of record areincluded in Appendix A.
6.4.1 Reoperation Outflow and Storage
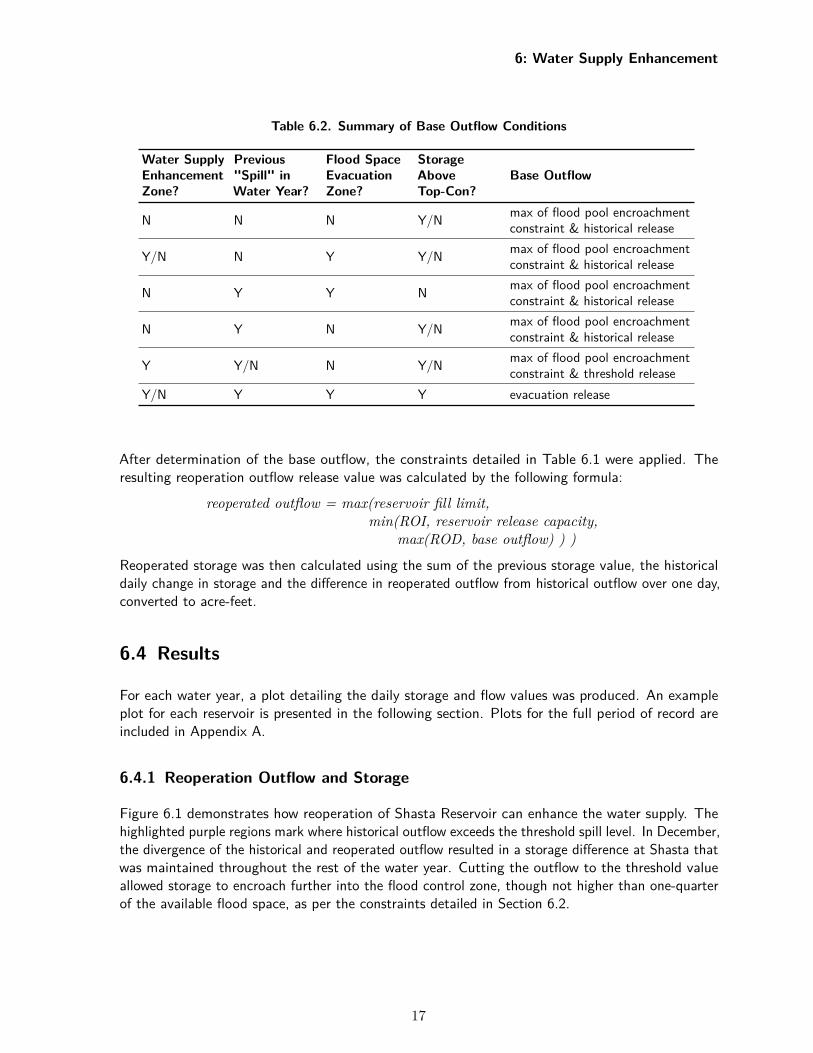
Figure 6.1 demonstrates how reoperation of Shasta Reservoir can enhance the water supply. Thehighlighted purple regions mark where historical outflow exceeds the threshold spill level. In December,the divergence of the historical and reoperated outflow resulted in a storage difference at Shasta thatwas maintained throughout the rest of the water year. Cutting the outflow to the threshold valueallowed storage to encroach further into the flood control zone, though not higher than one-quarterof the available flood space, as per the constraints detailed in Section 6.2.
17
6: Water Supply Enhancement
Figure 6.1. Example Reservoir Operations Plot for Shasta (1999)Shasta Operations Plot
Water Year: 1999
Top of Conservation Pool Flood Pool Encroachment Constraint Storage Reop Storage Inflow Outflow Reop Outflow
Oct
1,1
998
Nov
1,1
998
Dec
1,1
998
Jan
1,19
99
Feb
1,1
999
Mar
1,1
999
Apr
1,1
999
May
1,1
999
Jun
1,19
99
Jul 1
,199
9
Aug
1,1
999
Sep
1,1
999
Date/Time
0
1,000,000
2,000,000
3,000,000
4,000,000
5,000,000
Sto
rage
[acr
e-fe
et]
Spill Volume: 1297 TAF
0
50,000
100,000
150,000
200,000
Flo
w R
ate
[cfs
]
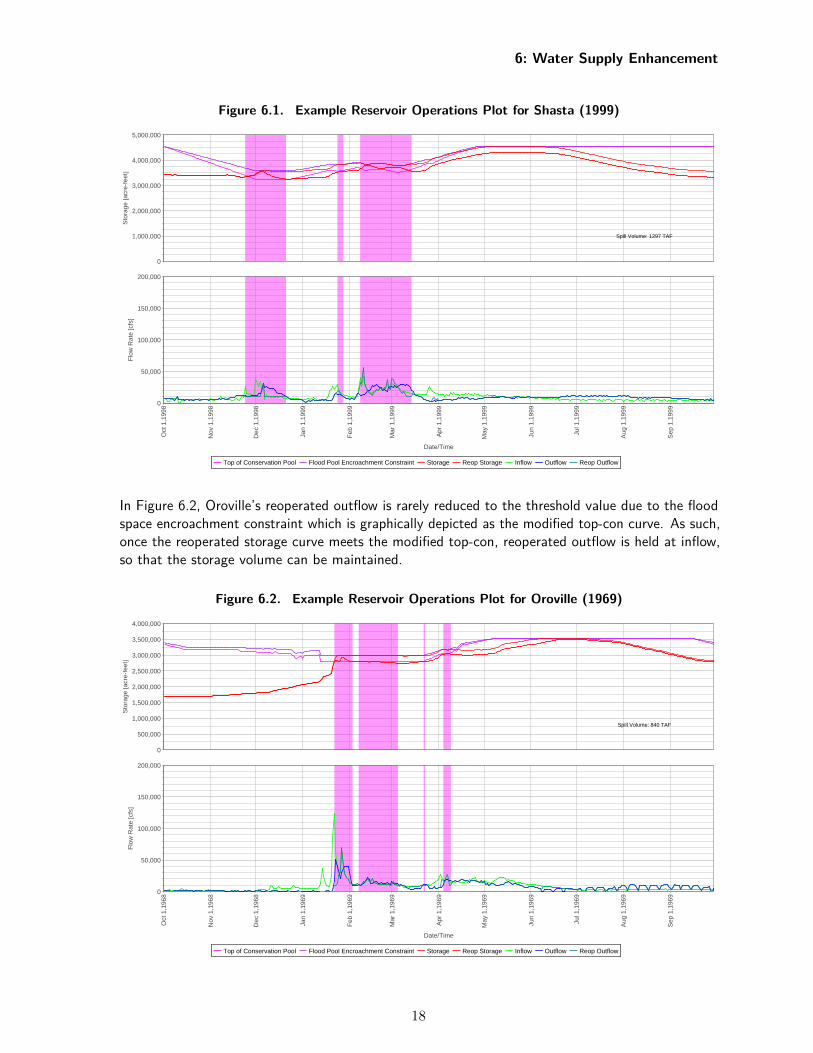
In Figure 6.2, Oroville’s reoperated outflow is rarely reduced to the threshold value due to the floodspace encroachment constraint which is graphically depicted as the modified top-con curve. As such,once the reoperated storage curve meets the modified top-con, reoperated outflow is held at inflow,so that the storage volume can be maintained.
Figure 6.2. Example Reservoir Operations Plot for Oroville (1969)Oroville Operations Plot
Water Year: 1969
Top of Conservation Pool Flood Pool Encroachment Constraint Storage Reop Storage Inflow Outflow Reop Outflow
Oct
1,1
968
Nov
1,1
968
Dec
1,1
968
Jan
1,19
69
Feb
1,1
969
Mar
1,1
969
Apr
1,1
969
May
1,1
969
Jun
1,19
69
Jul 1
,196
9
Aug
1,1
969
Sep
1,1
969
Date/Time
0
500,000
1,000,000
1,500,000
2,000,000
2,500,000
3,000,000
3,500,000
4,000,000
Sto
rage
[acr
e-fe
et]
Spill Volume: 840 TAF
0
50,000
100,000
150,000
200,000
Flo
w R
ate
[cfs
]
18
6: Water Supply Enhancement
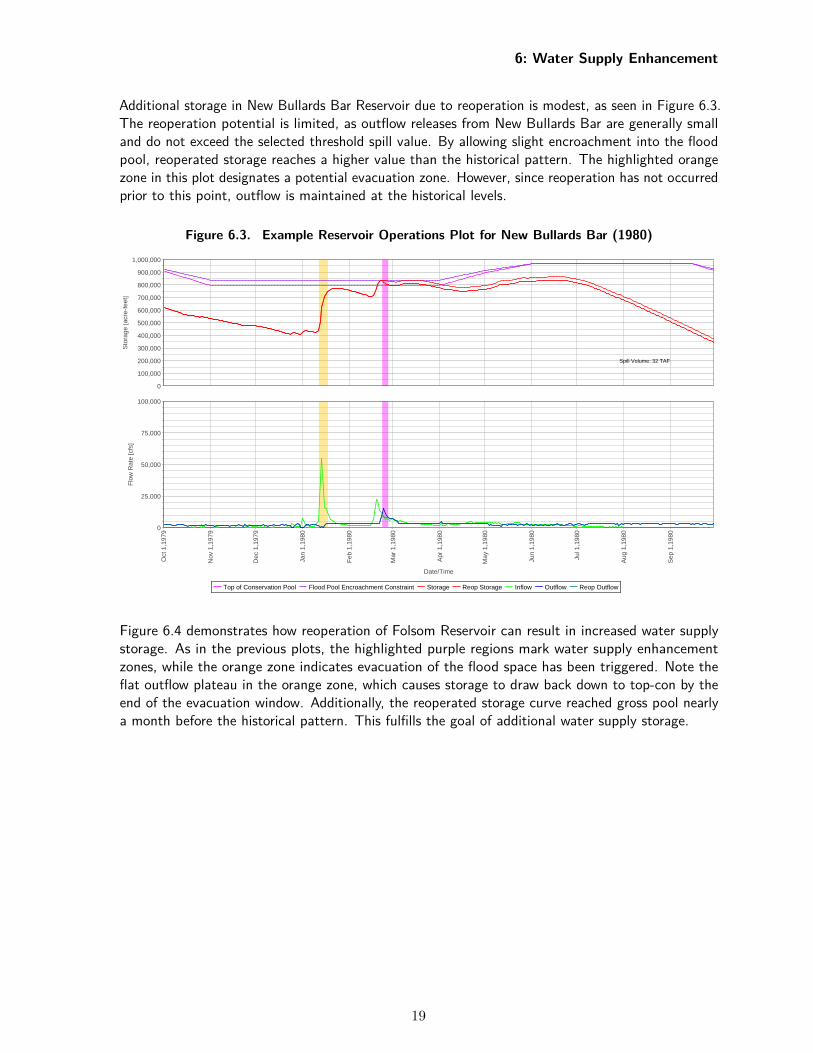
Additional storage in New Bullards Bar Reservoir due to reoperation is modest, as seen in Figure 6.3.The reoperation potential is limited, as outflow releases from New Bullards Bar are generally smalland do not exceed the selected threshold spill value. By allowing slight encroachment into the floodpool, reoperated storage reaches a higher value than the historical pattern. The highlighted orangezone in this plot designates a potential evacuation zone. However, since reoperation has not occurredprior to this point, outflow is maintained at the historical levels.
Figure 6.3. Example Reservoir Operations Plot for New Bullards Bar (1980)New Bullards Bar Operations Plot
Water Year: 1980
Top of Conservation Pool Flood Pool Encroachment Constraint Storage Reop Storage Inflow Outflow Reop Outflow
Oct
1,1
979
Nov
1,1
979
Dec
1,1
979
Jan
1,19
80
Feb
1,1
980
Mar
1,1
980
Apr
1,1
980
May
1,1
980
Jun
1,19
80
Jul 1
,198
0
Aug
1,1
980
Sep
1,1
980
Date/Time
0
100,000
200,000
300,000
400,000
500,000
600,000
700,000
800,000
900,000
1,000,000
Sto
rage
[acr
e-fe
et]
Spill Volume: 32 TAF
0
25,000
50,000
75,000
100,000
Flo
w R
ate
[cfs
]
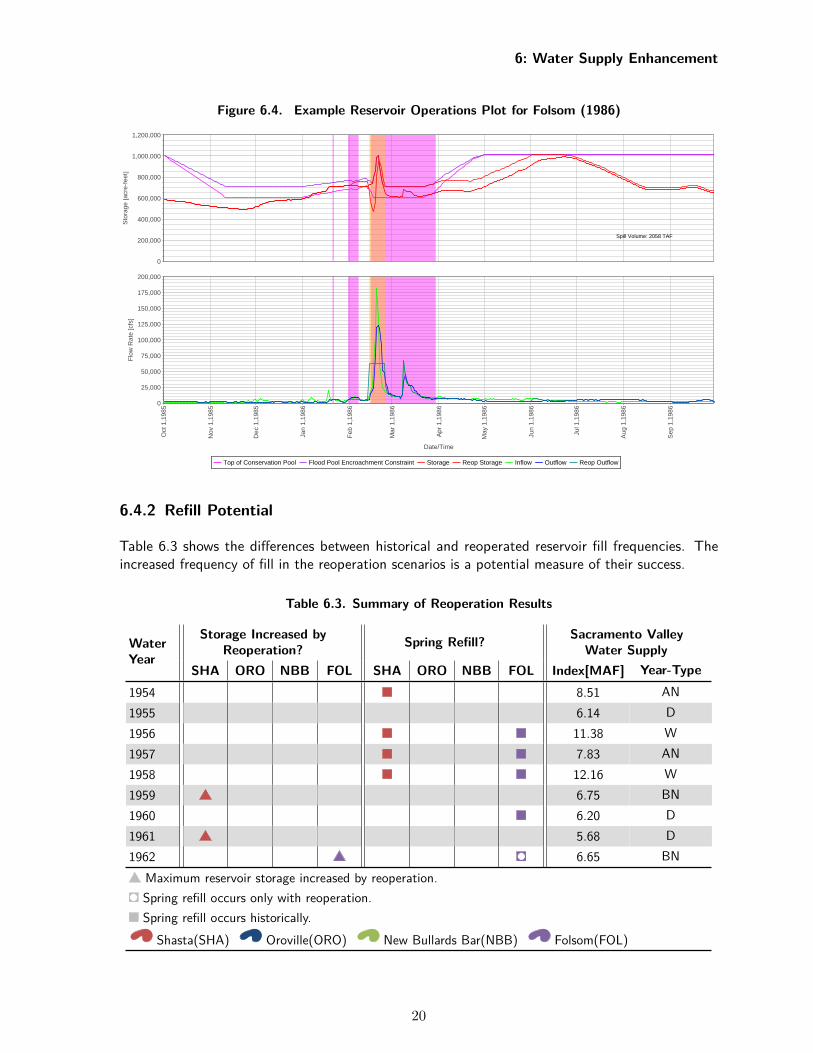
Figure 6.4 demonstrates how reoperation of Folsom Reservoir can result in increased water supplystorage. As in the previous plots, the highlighted purple regions mark water supply enhancementzones, while the orange zone indicates evacuation of the flood space has been triggered. Note theflat outflow plateau in the orange zone, which causes storage to draw back down to top-con by theend of the evacuation window. Additionally, the reoperated storage curve reached gross pool nearlya month before the historical pattern. This fulfills the goal of additional water supply storage.
19
6: Water Supply Enhancement
Figure 6.4. Example Reservoir Operations Plot for Folsom (1986)Folsom Operations Plot
Water Year: 1986
Top of Conservation Pool Flood Pool Encroachment Constraint Storage Reop Storage Inflow Outflow Reop Outflow
Oct
1,1
985
Nov
1,1
985
Dec
1,1
985
Jan
1,19
86
Feb
1,1
986
Mar
1,1
986
Apr
1,1
986
May
1,1
986
Jun
1,19
86
Jul 1
,198
6
Aug
1,1
986
Sep
1,1
986
Date/Time
0
200,000
400,000
600,000
800,000
1,000,000
1,200,000
Sto
rage
[acr
e-fe
et]
Spill Volume: 2058 TAF
0
25,000
50,000
75,000
100,000
125,000
150,000
175,000
200,000
Flo
w R
ate
[cfs
]
6.4.2 Refill Potential
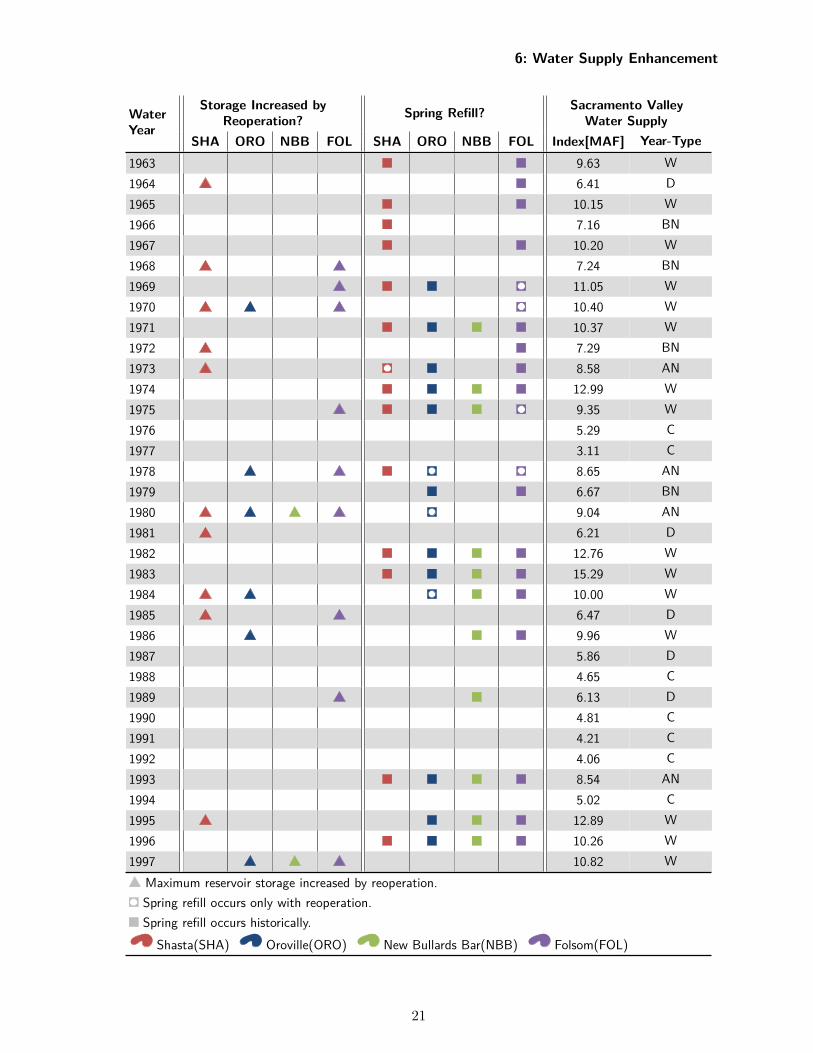
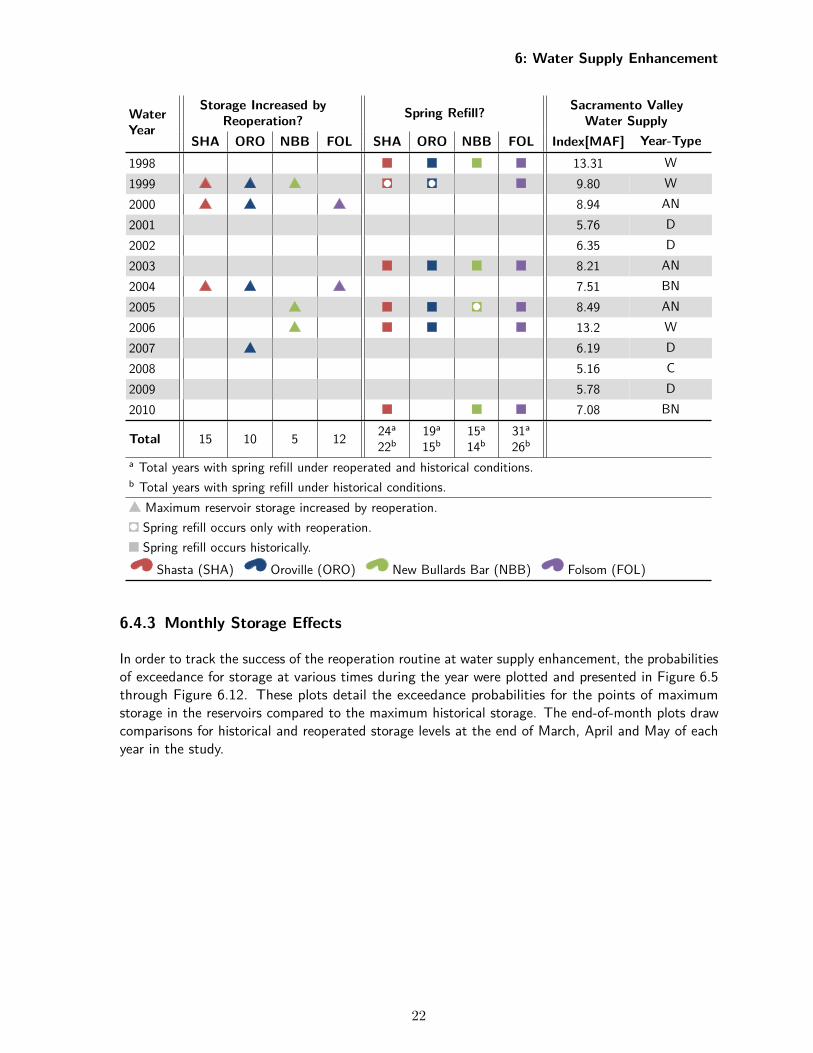
Table 6.3 shows the differences between historical and reoperated reservoir fill frequencies. Theincreased frequency of fill in the reoperation scenarios is a potential measure of their success.
Table 6.3. Summary of Reoperation Results
WaterYear
Storage Increased byReoperation? Spring Refill? Sacramento Valley
Water SupplySHA ORO NBB FOL SHA ORO NBB FOL Index[MAF] Year-Type
1954 8.51 AN1955 6.14 D1956 11.38 W1957 7.83 AN1958 12.16 W1959 6.75 BN1960 6.20 D1961 5.68 D1962 6.65 BN
Maximum reservoir storage increased by reoperation.Spring refill occurs only with reoperation.Spring refill occurs historically.
Shasta(SHA) Oroville(ORO) New Bullards Bar(NBB) Folsom(FOL)
20
6: Water Supply Enhancement
WaterYear
Storage Increased byReoperation? Spring Refill? Sacramento Valley
Water SupplySHA ORO NBB FOL SHA ORO NBB FOL Index[MAF] Year-Type
1963 9.63 W1964 6.41 D1965 10.15 W1966 7.16 BN1967 10.20 W1968 7.24 BN1969 11.05 W1970 10.40 W1971 10.37 W1972 7.29 BN1973 8.58 AN1974 12.99 W1975 9.35 W1976 5.29 C1977 3.11 C1978 8.65 AN1979 6.67 BN1980 9.04 AN1981 6.21 D1982 12.76 W1983 15.29 W1984 10.00 W1985 6.47 D1986 9.96 W1987 5.86 D1988 4.65 C1989 6.13 D1990 4.81 C1991 4.21 C1992 4.06 C1993 8.54 AN1994 5.02 C1995 12.89 W1996 10.26 W1997 10.82 W
Maximum reservoir storage increased by reoperation.Spring refill occurs only with reoperation.Spring refill occurs historically.
Shasta(SHA) Oroville(ORO) New Bullards Bar(NBB) Folsom(FOL)
21
6: Water Supply Enhancement
WaterYear
Storage Increased byReoperation? Spring Refill? Sacramento Valley
Water SupplySHA ORO NBB FOL SHA ORO NBB FOL Index[MAF] Year-Type
1998 13.31 W1999 9.80 W2000 8.94 AN2001 5.76 D2002 6.35 D2003 8.21 AN2004 7.51 BN2005 8.49 AN2006 13.2 W2007 6.19 D2008 5.16 C2009 5.78 D2010 7.08 BN
Total 15 10 5 12 24a
22b19a
15b15a
14b31a
26b
a Total years with spring refill under reoperated and historical conditions.b Total years with spring refill under historical conditions.
Maximum reservoir storage increased by reoperation.Spring refill occurs only with reoperation.Spring refill occurs historically.
Shasta (SHA) Oroville (ORO) New Bullards Bar (NBB) Folsom (FOL)
6.4.3 Monthly Storage Effects
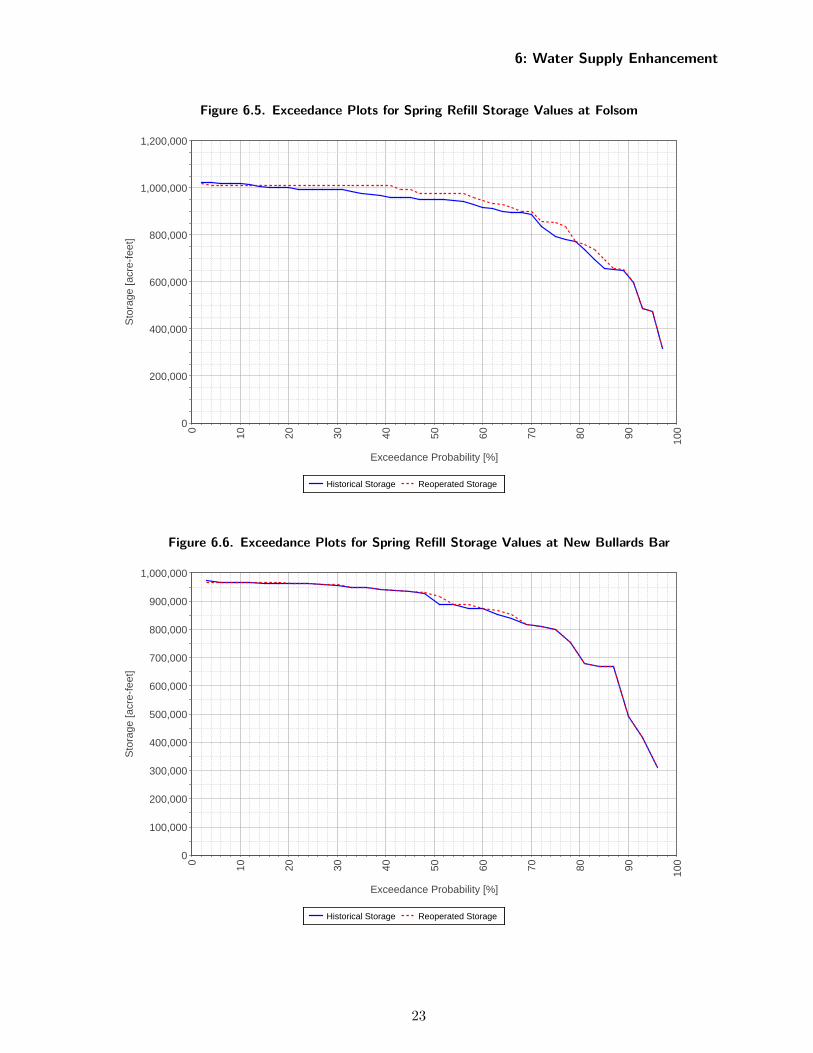
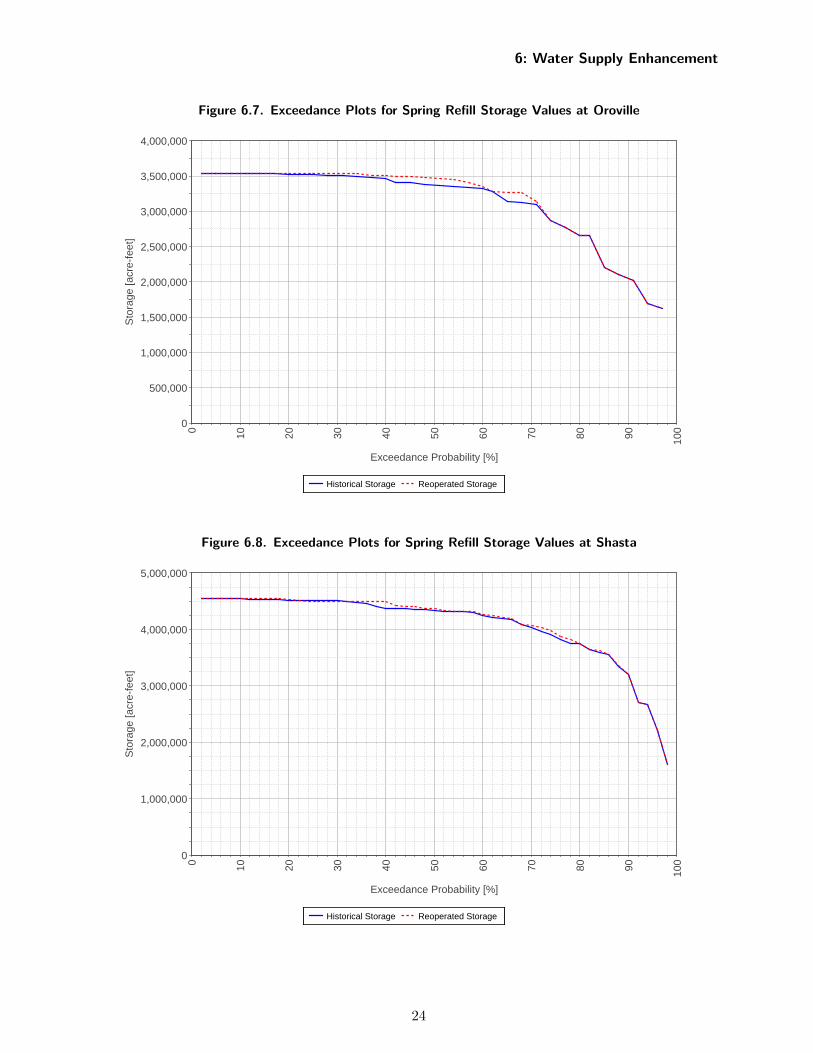
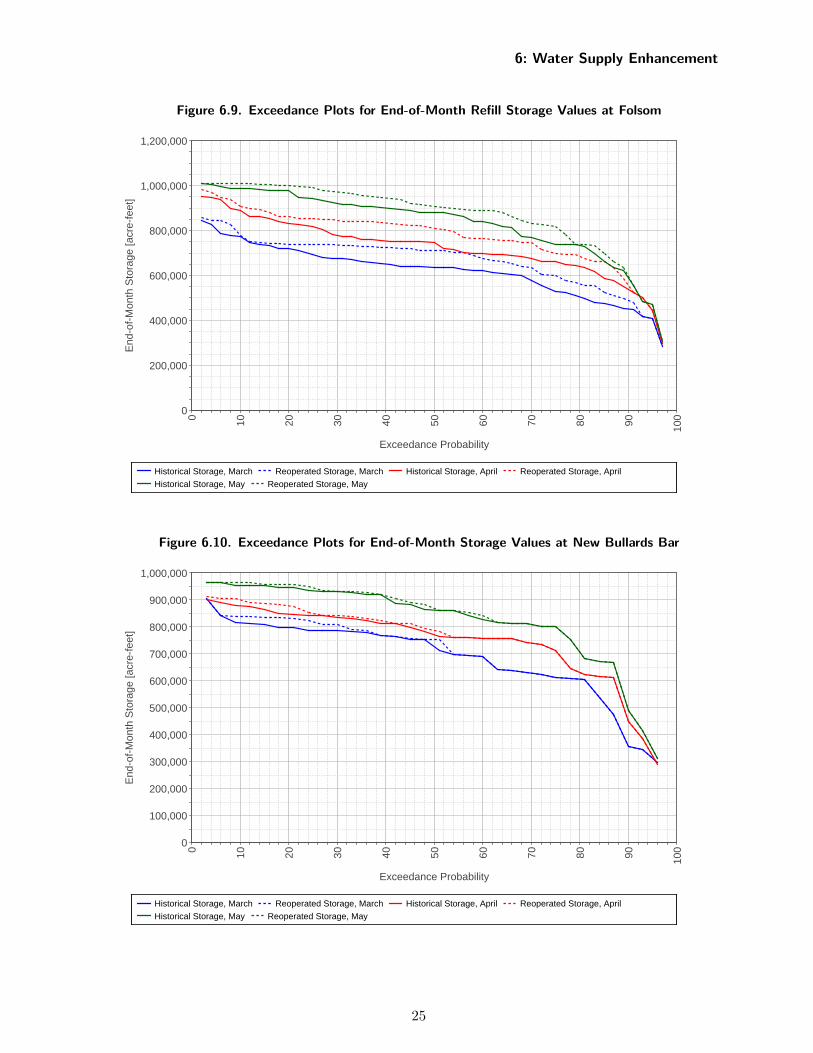
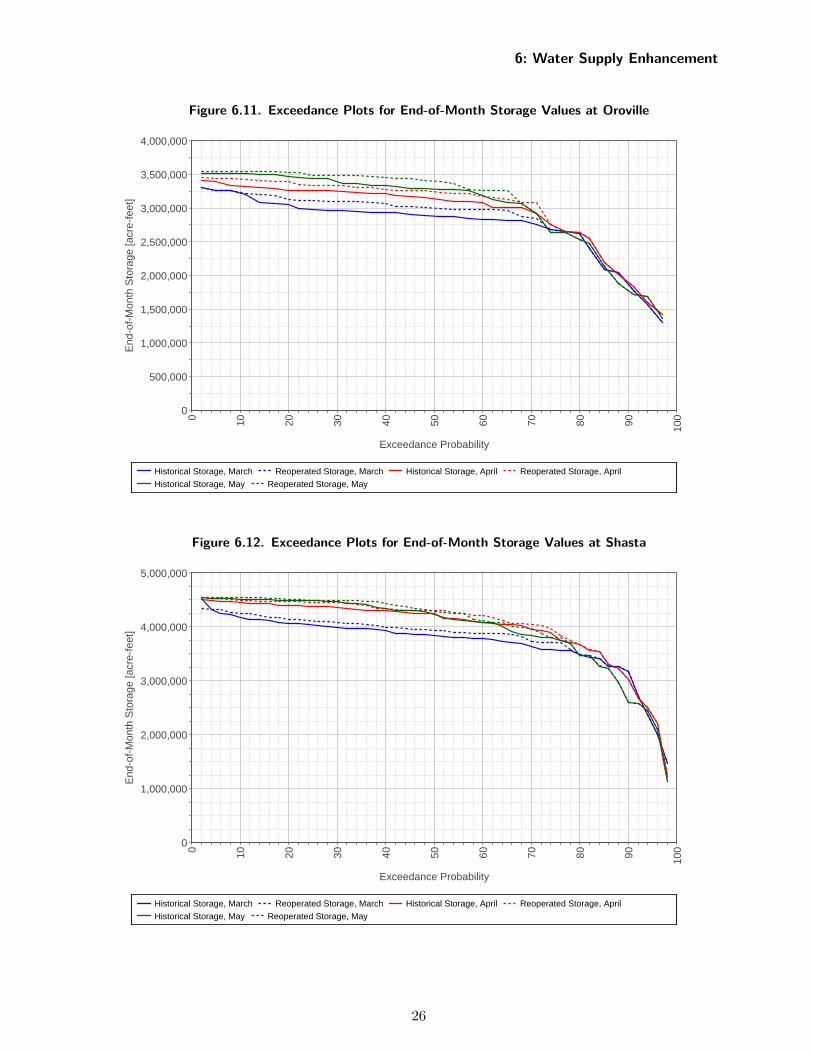
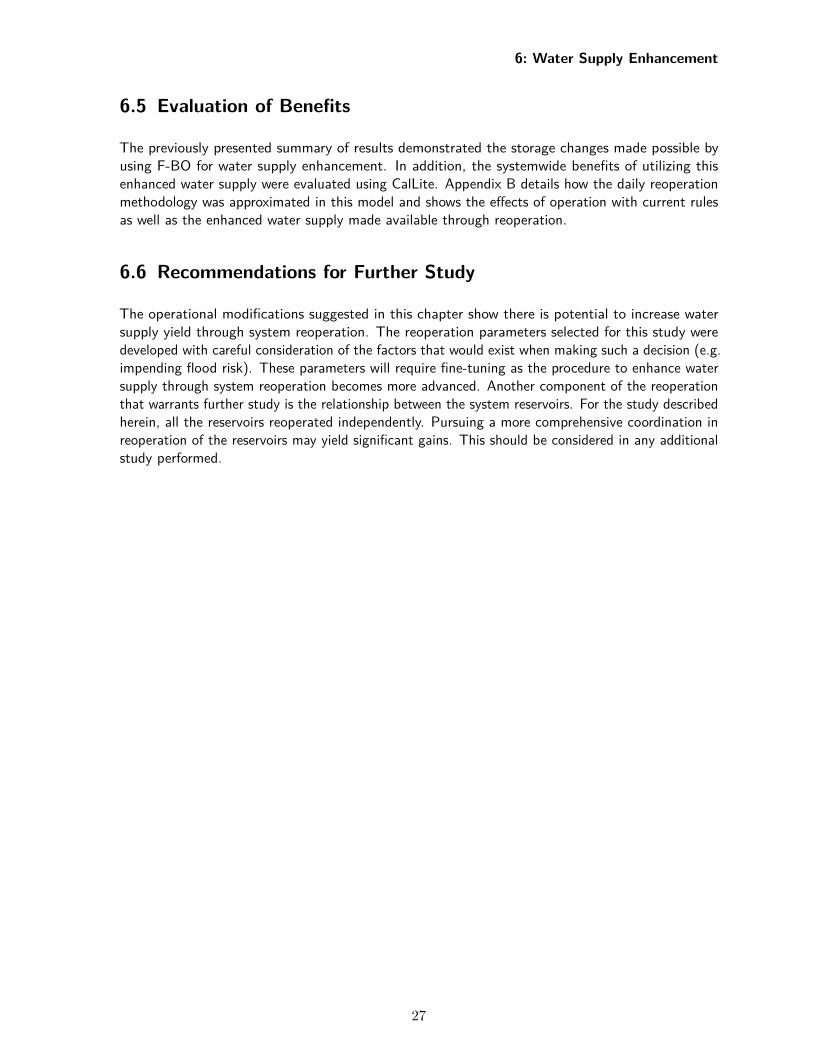
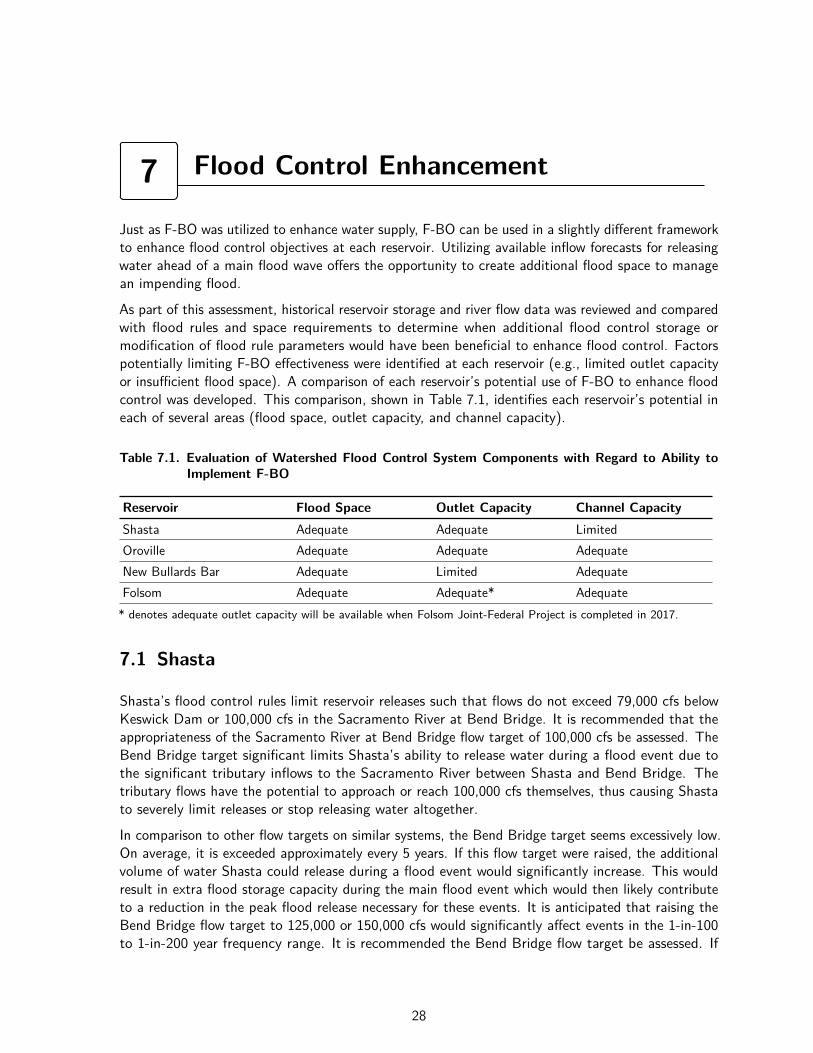
In order to track the success of the reoperation routine at water supply enhancement, the probabilitiesof exceedance for storage at various times during the year were plotted and presented in Figure 6.5through Figure 6.12. These plots detail the exceedance probabilities for the points of maximumstorage in the reservoirs compared to the maximum historical storage. The end-of-month plots drawcomparisons for historical and reoperated storage levels at the end of March, April and May of eachyear in the study.
22
6: Water Supply Enhancement
Figure 6.5. Exceedance Plots for Spring Refill Storage Values at FolsomExceedance Plots for Storage in FOLSOMSpring Refill Levels
Historical Storage Reoperated Storage
0 10 20 30 40 50 60 70 80 90 100
Exceedance Probability [%]
0
200,000
400,000
600,000
800,000
1,000,000
1,200,000S
tora
ge [a
cre-
feet
]
Figure 6.6. Exceedance Plots for Spring Refill Storage Values at New Bullards BarExceedance Plots for Storage in NEW BULLARDS BARSpring Refill Levels
Historical Storage Reoperated Storage
0 10 20 30 40 50 60 70 80 90 100
Exceedance Probability [%]
0
100,000
200,000
300,000
400,000
500,000
600,000
700,000
800,000
900,000
1,000,000
Sto
rage
[acr
e-fe
et]
23
6: Water Supply Enhancement
Figure 6.7. Exceedance Plots for Spring Refill Storage Values at OrovilleExceedance Plots for Storage in OROVILLESpring Refill Levels
Historical Storage Reoperated Storage
0 10 20 30 40 50 60 70 80 90 100
Exceedance Probability [%]
0
500,000
1,000,000
1,500,000
2,000,000
2,500,000
3,000,000
3,500,000
4,000,000S
tora
ge [a
cre-
feet
]
Figure 6.8. Exceedance Plots for Spring Refill Storage Values at ShastaExceedance Plots for Storage in SHASTASpring Refill Levels
Historical Storage Reoperated Storage
0 10 20 30 40 50 60 70 80 90 100
Exceedance Probability [%]
0
1,000,000
2,000,000
3,000,000
4,000,000
5,000,000
Sto
rage
[acr
e-fe
et]
24
6: Water Supply Enhancement
Figure 6.9. Exceedance Plots for End-of-Month Refill Storage Values at FolsomExceedance Plots for Storage in FOLSOMEnd-of-Month Refill Levels
Historical Storage, March Reoperated Storage, March Historical Storage, April Reoperated Storage, April
Historical Storage, May Reoperated Storage, May
0 10 20 30 40 50 60 70 80 90 100
Exceedance Probability
0
200,000
400,000
600,000
800,000
1,000,000
1,200,000E
nd-o
f-M
onth
Sto
rage
[acr
e-fe
et]
Figure 6.10. Exceedance Plots for End-of-Month Storage Values at New Bullards BarExceedance Plots for Storage in NEW BULLARDS BAREnd-of-Month Refill Levels
Historical Storage, March Reoperated Storage, March Historical Storage, April Reoperated Storage, April
Historical Storage, May Reoperated Storage, May
0 10 20 30 40 50 60 70 80 90 100
Exceedance Probability
0
100,000
200,000
300,000
400,000
500,000
600,000
700,000
800,000
900,000
1,000,000
End
-of-
Mon
th S
tora
ge [a
cre-
feet
]
25
6: Water Supply Enhancement
Figure 6.11. Exceedance Plots for End-of-Month Storage Values at OrovilleExceedance Plots for Storage in OROVILLEEnd-of-Month Refill Levels
Historical Storage, March Reoperated Storage, March Historical Storage, April Reoperated Storage, April
Historical Storage, May Reoperated Storage, May
0 10 20 30 40 50 60 70 80 90 100
Exceedance Probability
0
500,000
1,000,000
1,500,000
2,000,000
2,500,000
3,000,000
3,500,000
4,000,000E
nd-o
f-M
onth
Sto
rage
[acr
e-fe
et]
Figure 6.12. Exceedance Plots for End-of-Month Storage Values at ShastaExceedance Plots for Storage in SHASTAEnd-of-Month Refill Levels
Historical Storage, March Reoperated Storage, March Historical Storage, April Reoperated Storage, April
Historical Storage, May Reoperated Storage, May
0 10 20 30 40 50 60 70 80 90 100
Exceedance Probability
0
1,000,000
2,000,000
3,000,000
4,000,000
5,000,000
End
-of-
Mon
th S
tora
ge [a
cre-
feet
]
26
6: Water Supply Enhancement
6.5 Evaluation of Benefits
The previously presented summary of results demonstrated the storage changes made possible byusing F-BO for water supply enhancement. In addition, the systemwide benefits of utilizing thisenhanced water supply were evaluated using CalLite. Appendix B details how the daily reoperationmethodology was approximated in this model and shows the effects of operation with current rulesas well as the enhanced water supply made available through reoperation.
6.6 Recommendations for Further Study
The operational modifications suggested in this chapter show there is potential to increase watersupply yield through system reoperation. The reoperation parameters selected for this study weredeveloped with careful consideration of the factors that would exist when making such a decision (e.g.impending flood risk). These parameters will require fine-tuning as the procedure to enhance watersupply through system reoperation becomes more advanced. Another component of the reoperationthat warrants further study is the relationship between the system reservoirs. For the study describedherein, all the reservoirs reoperated independently. Pursuing a more comprehensive coordination inreoperation of the reservoirs may yield significant gains. This should be considered in any additionalstudy performed.
27
��
��7 Flood Control Enhancement
Just as F-BO was utilized to enhance water supply, F-BO can be used in a slightly different frameworkto enhance flood control objectives at each reservoir. Utilizing available inflow forecasts for releasingwater ahead of a main flood wave offers the opportunity to create additional flood space to managean impending flood.
As part of this assessment, historical reservoir storage and river flow data was reviewed and comparedwith flood rules and space requirements to determine when additional flood control storage ormodification of flood rule parameters would have been beneficial to enhance flood control. Factorspotentially limiting F-BO effectiveness were identified at each reservoir (e.g., limited outlet capacityor insufficient flood space). A comparison of each reservoir’s potential use of F-BO to enhance floodcontrol was developed. This comparison, shown in Table 7.1, identifies each reservoir’s potential ineach of several areas (flood space, outlet capacity, and channel capacity).
Table 7.1. Evaluation of Watershed Flood Control System Components with Regard to Ability toImplement F-BO
Reservoir Flood Space Outlet Capacity Channel CapacityShasta Adequate Adequate LimitedOroville Adequate Adequate AdequateNew Bullards Bar Adequate Limited AdequateFolsom Adequate Adequate* Adequate
* denotes adequate outlet capacity will be available when Folsom Joint-Federal Project is completed in 2017.
7.1 Shasta
Shasta’s flood control rules limit reservoir releases such that flows do not exceed 79,000 cfs belowKeswick Dam or 100,000 cfs in the Sacramento River at Bend Bridge. It is recommended that theappropriateness of the Sacramento River at Bend Bridge flow target of 100,000 cfs be assessed. TheBend Bridge target significant limits Shasta’s ability to release water during a flood event due tothe significant tributary inflows to the Sacramento River between Shasta and Bend Bridge. Thetributary flows have the potential to approach or reach 100,000 cfs themselves, thus causing Shastato severely limit releases or stop releasing water altogether.
In comparison to other flow targets on similar systems, the Bend Bridge target seems excessively low.On average, it is exceeded approximately every 5 years. If this flow target were raised, the additionalvolume of water Shasta could release during a flood event would significantly increase. This wouldresult in extra flood storage capacity during the main flood event which would then likely contributeto a reduction in the peak flood release necessary for these events. It is anticipated that raising theBend Bridge flow target to 125,000 or 150,000 cfs would significantly affect events in the 1-in-100to 1-in-200 year frequency range. It is recommended the Bend Bridge flow target be assessed. If
28
7: Flood Control Enhancement
the investigation of this target shows that there is little reason (e.g., damageable property) above100,000 cfs, it is suggested that a higher flow target be considered.
7.2 Oroville
Oroville Dam coordinates flood release with New Bullards Bar on the North Yuba River. Thiscoordination is mandated in the water control manuals for the two reservoirs. As such, any floodcontrol improvements that can be made to Oroville also have the potential to provide flood controlbenefits at New Bullards Bar. For example: if Oroville makes a forecast-based release of water inadvance of a flood event, additional flood space is provided in Oroville. This otherwise unavailableflood space could be used to do any of the following:
• manage a larger flood than otherwise manageable• reduced release rates and lower Feather River flows• reduced release rates and allow New Bullards Bar to perform comparable increase in release
rates, thus reducing its flood management burden.Oroville has adequate flood space, reservoir release capacity, and downstream channel capacity toaccommodate F-BO for flood control improvements.
7.3 New Bullards Bar
As mentioned in Section 7.2, New Bullards Bar and Oroville coordinate flood control releases. Assuch, much of the discussion on the use of F-BO for flood control at Oroville Dam pertains to NewBullards Bar. One constraint for potential application of F-BO at New Bullards Bar is the limitedreservoir outlet capacity compared to outlet capacity at Oroville. This limited outlet capacity at NewBullards Bar inhibits the effectiveness of a pre-event flood release, since a significant volume of wateris not able to be released within the applicable time window (e.g., 3-5 days ahead of peak). It isthus suggested that improvements to the outlet capacity of New Bullards Bar be considered alongwith F-BO in the context of improving flood control.
7.4 Folsom
As part of the Joint-Federal Project (JFP), Folsom Dam is required to utilize forecasts in its updatedoperating rules when the project comes online in 2017. As part of that change, USACE is studyingthe ways forecasts can be used to enhance flood control.Once the auxiliary spillway at Folsom is constructed, adequate release capacity will exist to implementF-BO for flood control benefits, e.g., a pre-event release. Folsom has no other operational constraintswhich significantly reduce the effectiveness of F-BO for use in flood control.
7.5 Recommendations for Further Study
While the flood control modifications suggested are promising for each individual reservoir, in orderto warrant additional consideration, the systemwide impacts and benefits of the suggested measures
29

7: Flood Control Enhancement
must be better understood. It is recommended that additional investigation be performed for theelements deemed most promising from this study. A key consideration of the additional study shouldbe how operational changes suggested for individual reservoirs affect flows and stages throughoutthe flood system.
30
References
MBK Engineers (2013). System Reoperation Study: Merced River Analysis Technical Report.
United States Army Corps of Engineers (1997). Engineering Manual 1110-2-1420: HydrologicEngineering Requirements for Reservoirs.
United States Army Corps of Engineers, Sacramento District (SPK) (1987). Folsom Dam and Lake,American River, California: Water Control Manual.
31

Appendices
32
��
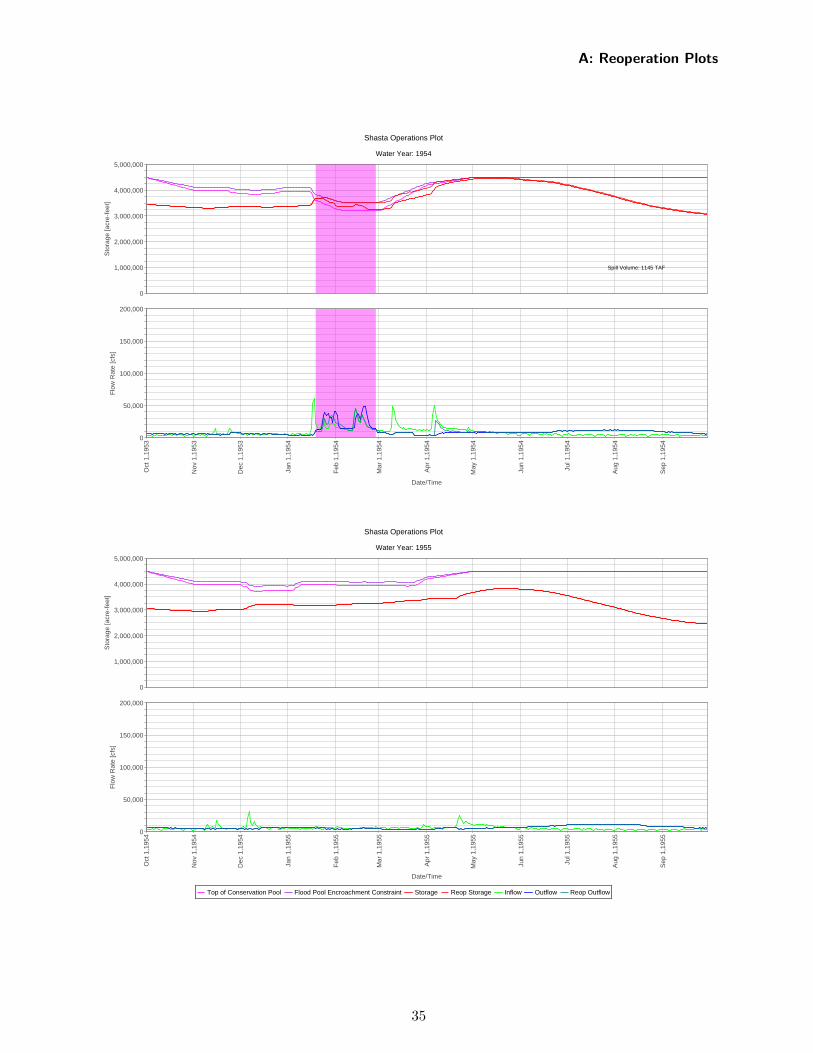
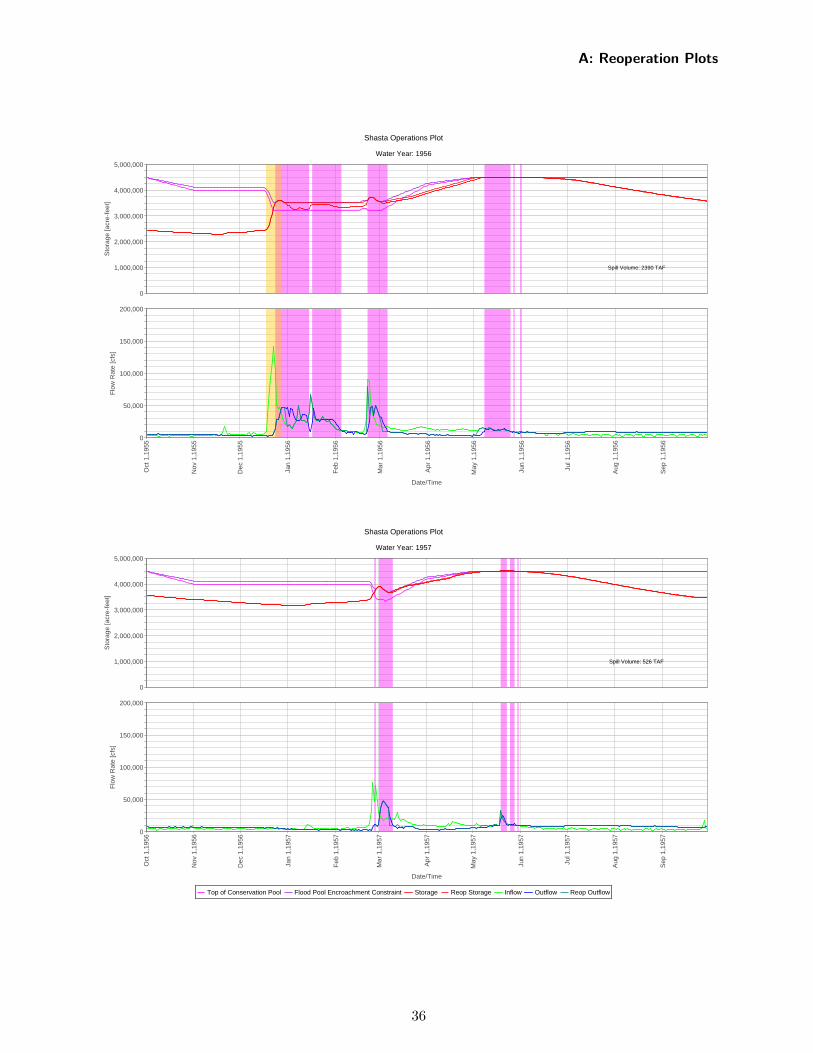
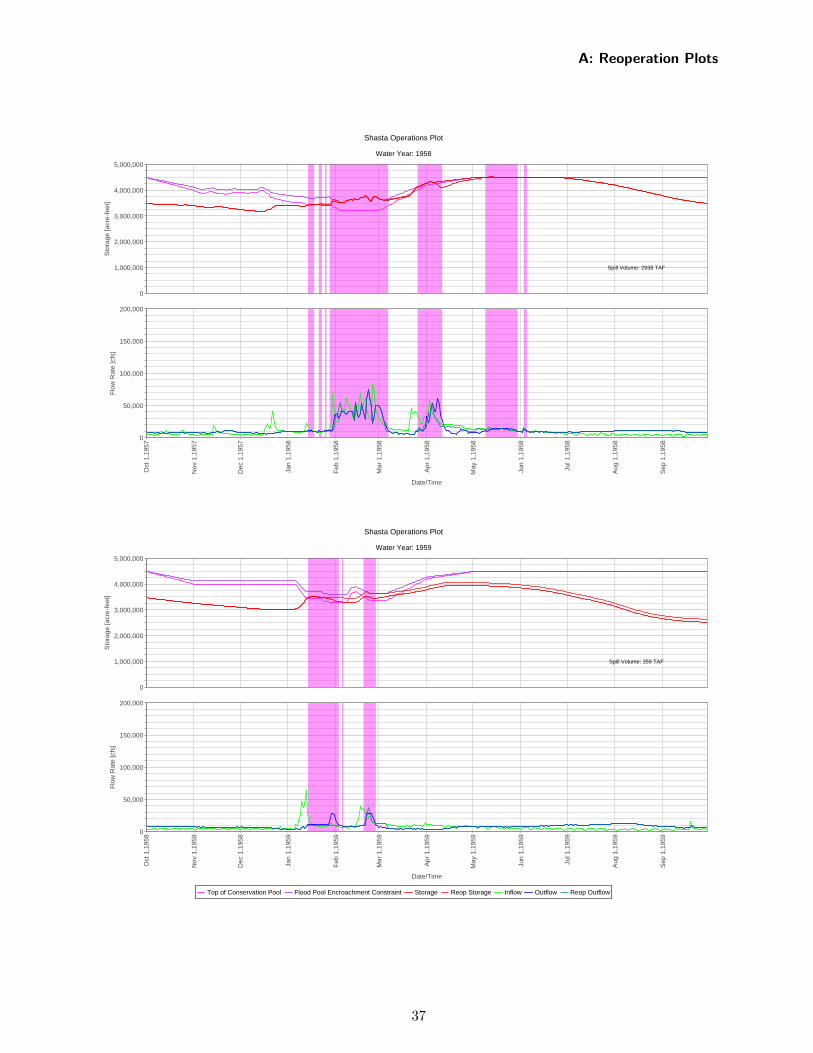
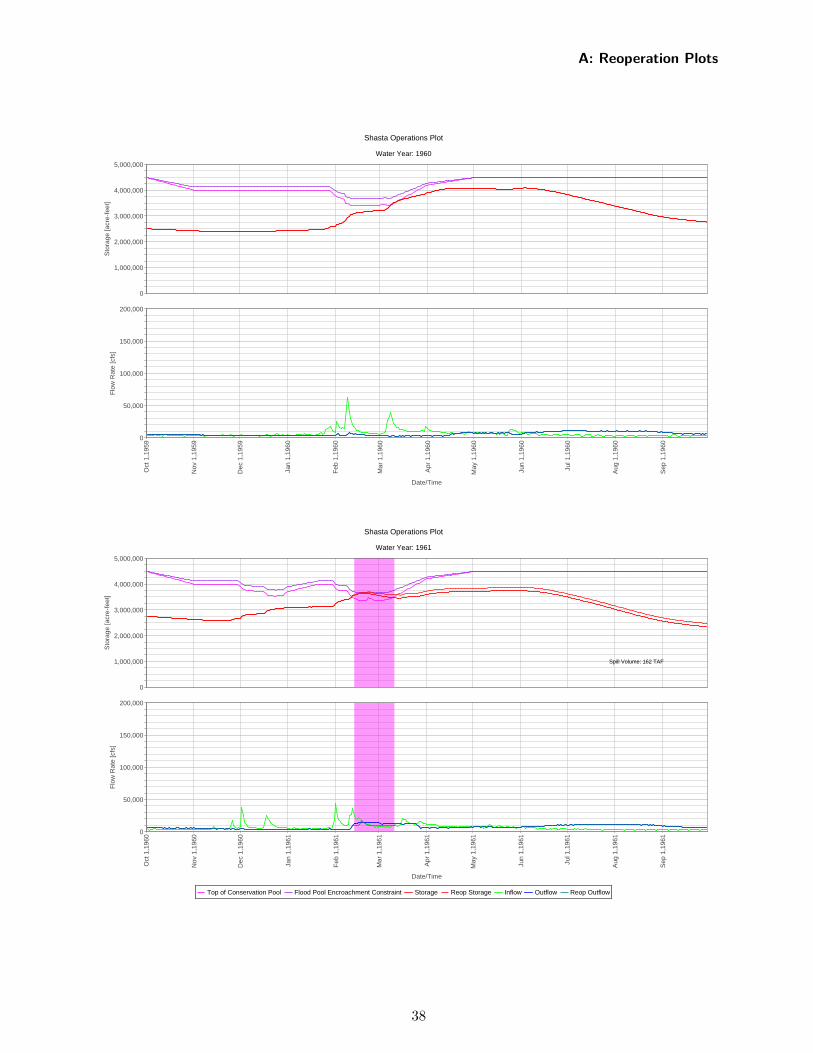
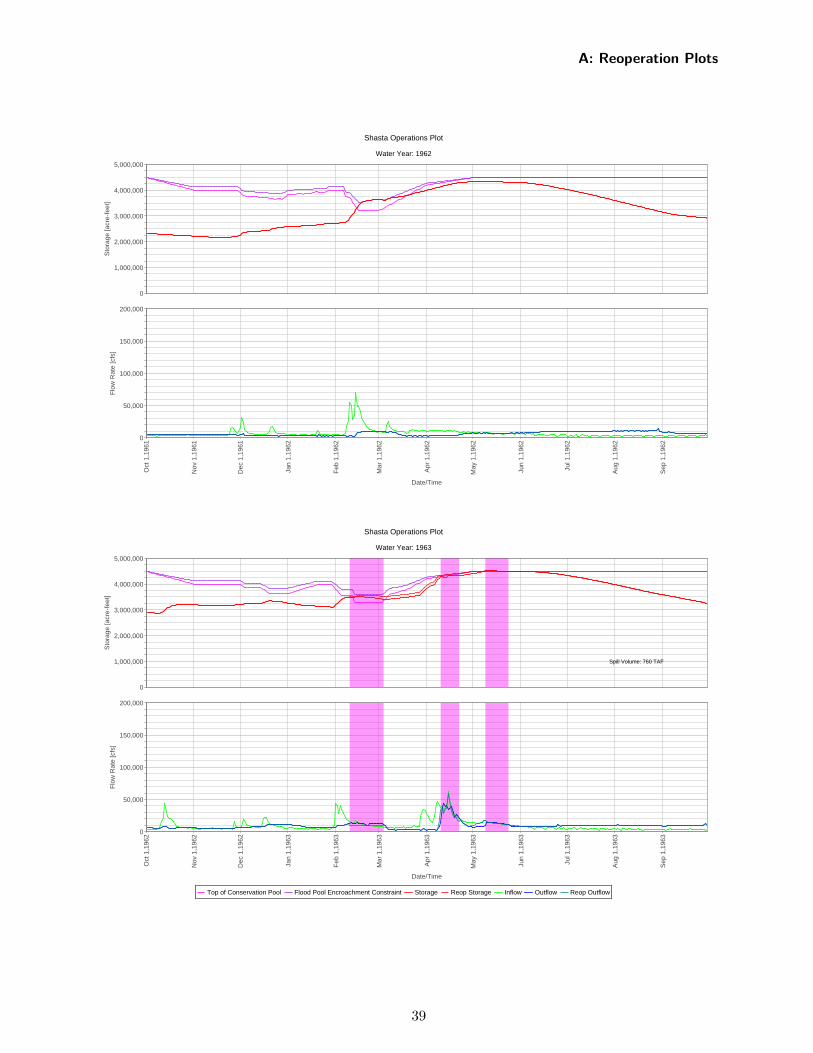
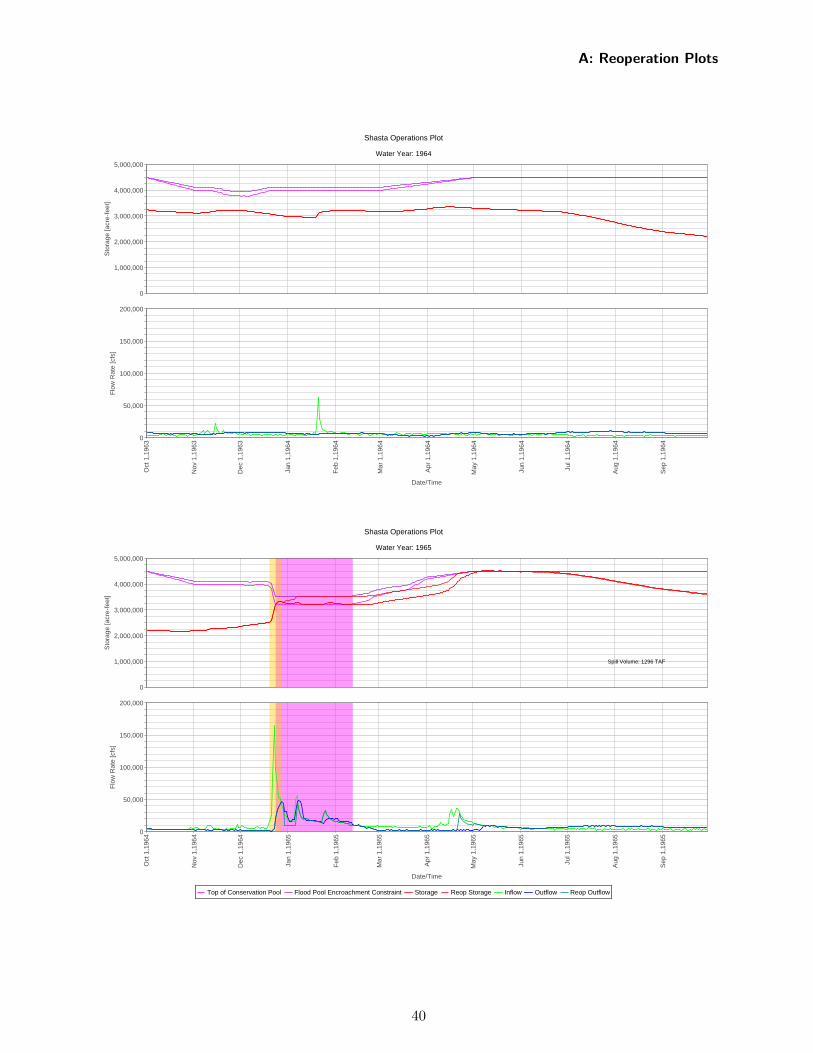
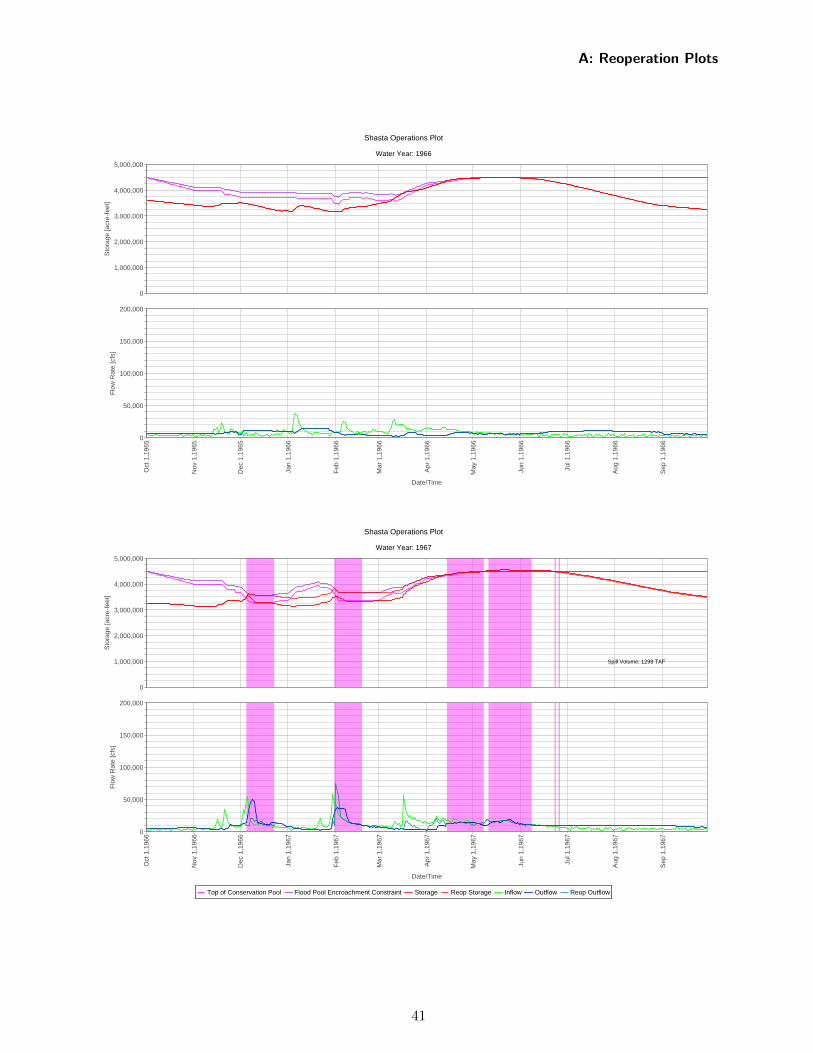
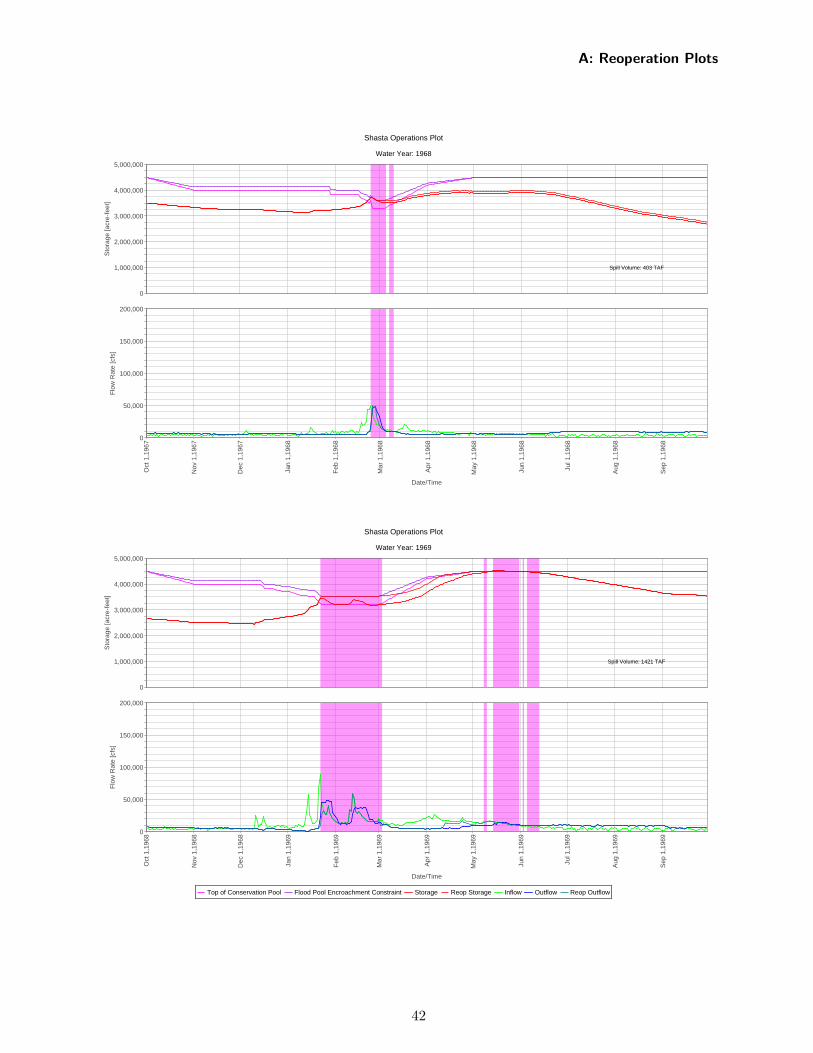
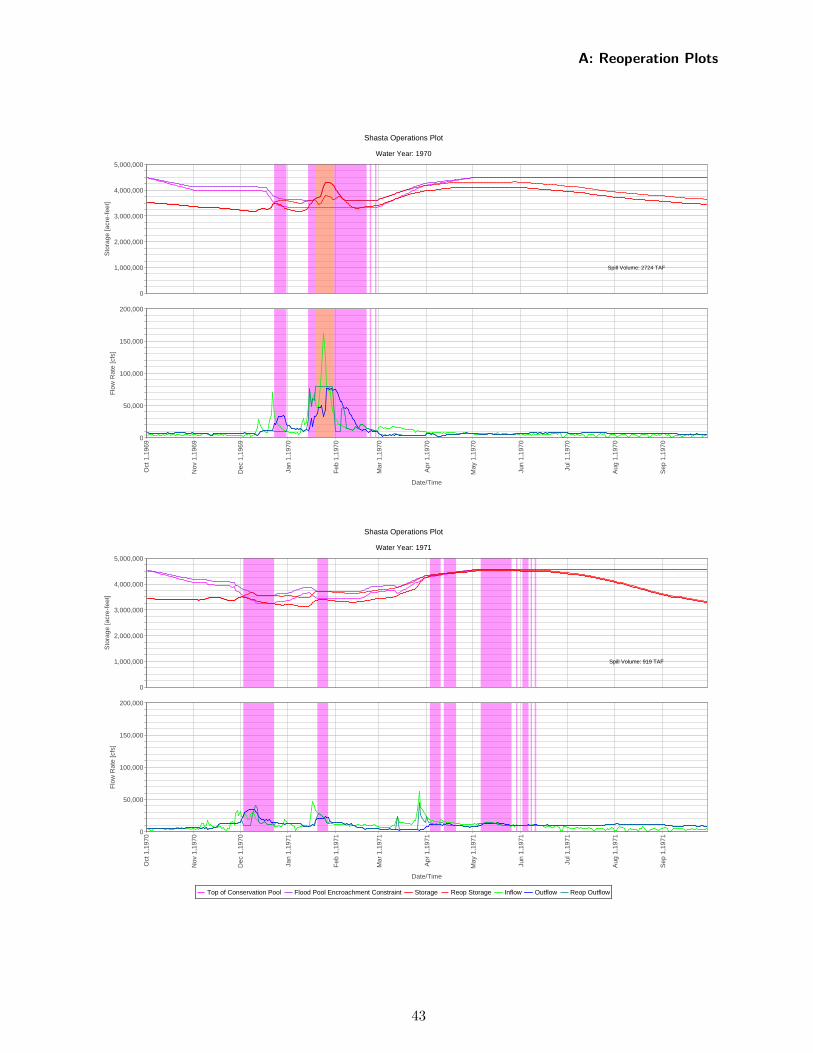
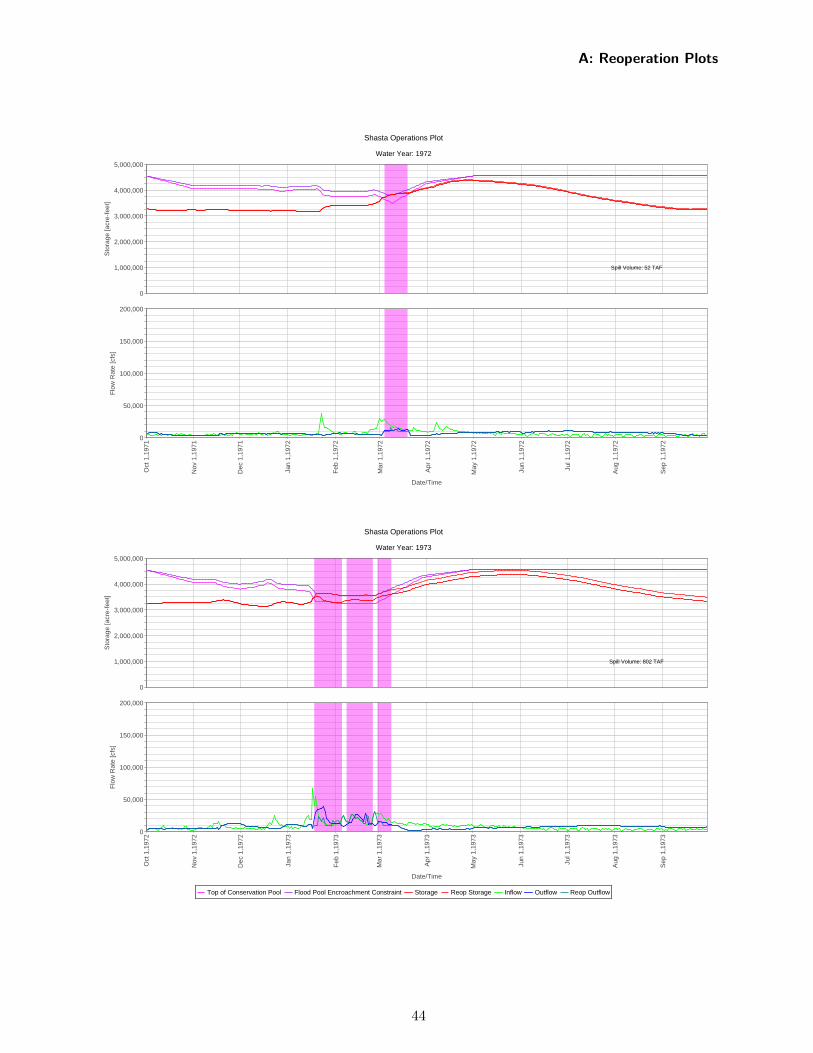
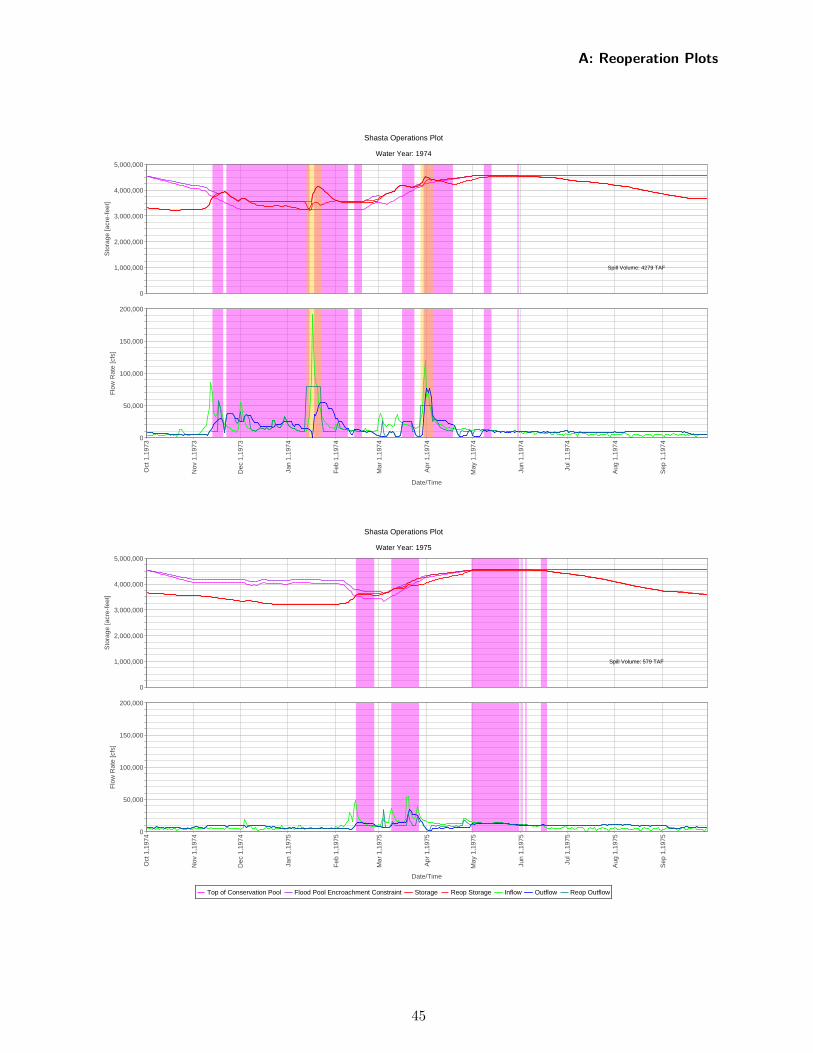
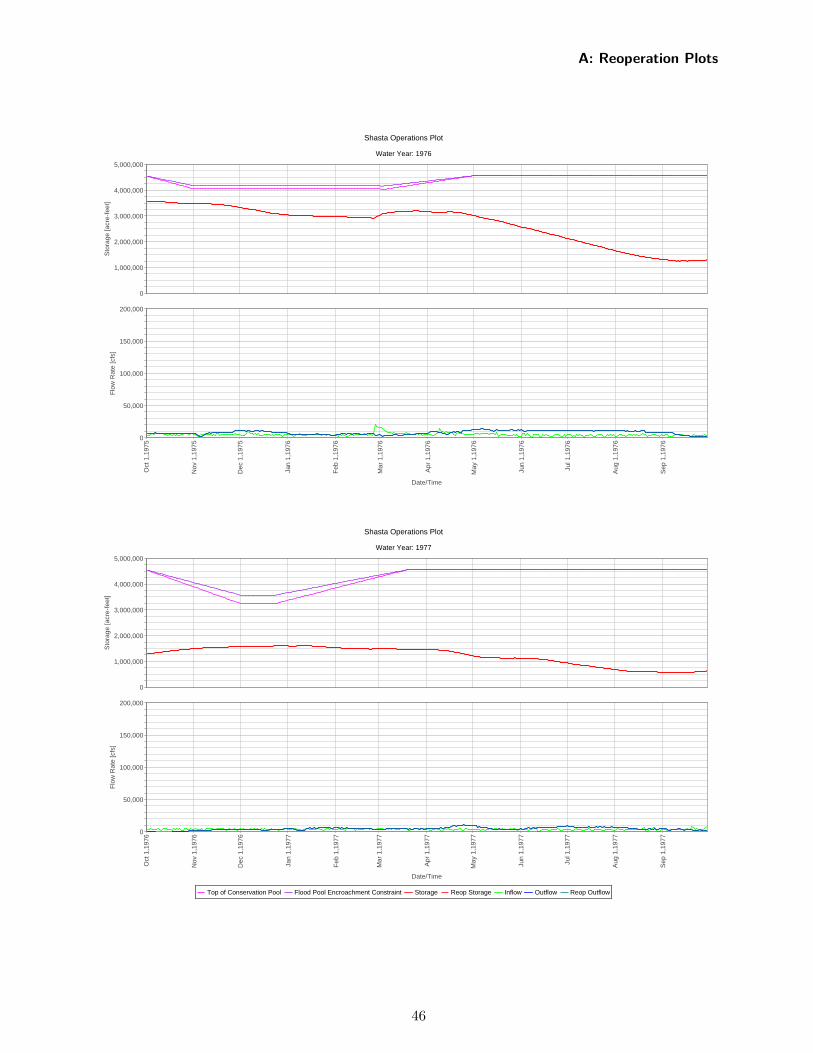
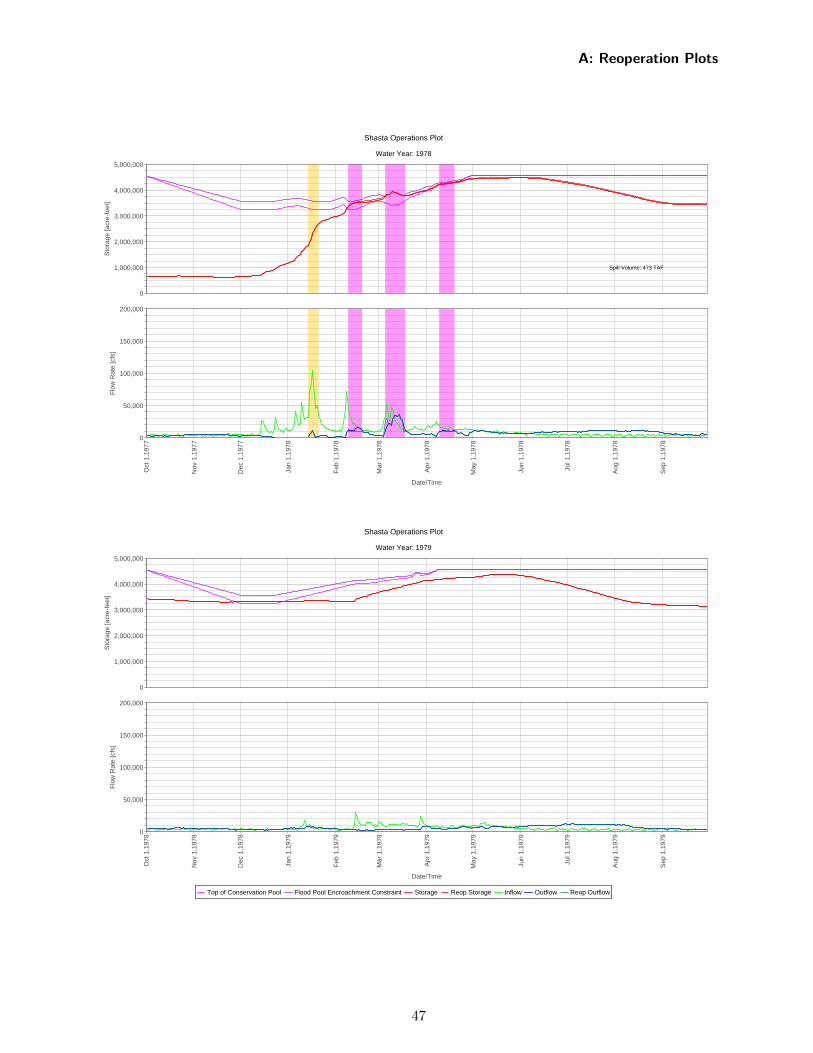
��A Reoperation Plots
This appendix details the plots that resulted from the daily reoperation routine that was performedin this analysis. Each plot contains the following timeseries:
• inflow
• outflow (baseline)
• outflow (reoperated)
• storage (baseline)
• storage (reoperated)
In addition the following regions are color-coded to indicate the different operational regimes:
• deactivation (orange)
• reoperation (purple)
33
A: Reoperation Plots
A.1 Shasta
The following section includes the reoperation plots for Shasta Dam.
34
Shasta Operations Plot
Water Year: 1954
Top of Conservation Pool Flood Pool Encroachment Constraint Storage Reop Storage Inflow Outflow Reop Outflow
Oct
1,1
953
Nov
1,1
953
Dec
1,1
953
Jan
1,19
54
Feb
1,1
954
Mar
1,1
954
Apr
1,1
954
May
1,1
954
Jun
1,19
54
Jul 1
,195
4
Aug
1,1
954
Sep
1,1
954
Date/Time
0
1,000,000
2,000,000
3,000,000
4,000,000
5,000,000
Sto
rage
[acr
e-fe
et]
Spill Volume: 1145 TAF
0
50,000
100,000
150,000
200,000
Flo
w R
ate
[cfs
]
Shasta Operations Plot
Water Year: 1955
Top of Conservation Pool Flood Pool Encroachment Constraint Storage Reop Storage Inflow Outflow Reop Outflow
Oct
1,1
954
Nov
1,1
954
Dec
1,1
954
Jan
1,19
55
Feb
1,1
955
Mar
1,1
955
Apr
1,1
955
May
1,1
955
Jun
1,19
55
Jul 1
,195
5
Aug
1,1
955
Sep
1,1
955
Date/Time
0
1,000,000
2,000,000
3,000,000
4,000,000
5,000,000
Sto
rage
[acr
e-fe
et]
0
50,000
100,000
150,000
200,000
Flo
w R
ate
[cfs
]
A: Reoperation Plots
35
Shasta Operations Plot
Water Year: 1956
Top of Conservation Pool Flood Pool Encroachment Constraint Storage Reop Storage Inflow Outflow Reop Outflow
Oct
1,1
955
Nov
1,1
955
Dec
1,1
955
Jan
1,19
56
Feb
1,1
956
Mar
1,1
956
Apr
1,1
956
May
1,1
956
Jun
1,19
56
Jul 1
,195
6
Aug
1,1
956
Sep
1,1
956
Date/Time
0
1,000,000
2,000,000
3,000,000
4,000,000
5,000,000
Sto
rage
[acr
e-fe
et]
Spill Volume: 2390 TAF
0
50,000
100,000
150,000
200,000
Flo
w R
ate
[cfs
]
Shasta Operations Plot
Water Year: 1957
Top of Conservation Pool Flood Pool Encroachment Constraint Storage Reop Storage Inflow Outflow Reop Outflow
Oct
1,1
956
Nov
1,1
956
Dec
1,1
956
Jan
1,19
57
Feb
1,1
957
Mar
1,1
957
Apr
1,1
957
May
1,1
957
Jun
1,19
57
Jul 1
,195
7
Aug
1,1
957
Sep
1,1
957
Date/Time
0
1,000,000
2,000,000
3,000,000
4,000,000
5,000,000
Sto
rage
[acr
e-fe
et]
Spill Volume: 526 TAF
0
50,000
100,000
150,000
200,000
Flo
w R
ate
[cfs
]
A: Reoperation Plots
36
Shasta Operations Plot
Water Year: 1958
Top of Conservation Pool Flood Pool Encroachment Constraint Storage Reop Storage Inflow Outflow Reop Outflow
Oct
1,1
957
Nov
1,1
957
Dec
1,1
957
Jan
1,19
58
Feb
1,1
958
Mar
1,1
958
Apr
1,1
958
May
1,1
958
Jun
1,19
58
Jul 1
,195
8
Aug
1,1
958
Sep
1,1
958
Date/Time
0
1,000,000
2,000,000
3,000,000
4,000,000
5,000,000
Sto
rage
[acr
e-fe
et]
Spill Volume: 2938 TAF
0
50,000
100,000
150,000
200,000
Flo
w R
ate
[cfs
]
Shasta Operations Plot
Water Year: 1959
Top of Conservation Pool Flood Pool Encroachment Constraint Storage Reop Storage Inflow Outflow Reop Outflow
Oct
1,1
958
Nov
1,1
958
Dec
1,1
958
Jan
1,19
59
Feb
1,1
959
Mar
1,1
959
Apr
1,1
959
May
1,1
959
Jun
1,19
59
Jul 1
,195
9
Aug
1,1
959
Sep
1,1
959
Date/Time
0
1,000,000
2,000,000
3,000,000
4,000,000
5,000,000
Sto
rage
[acr
e-fe
et]
Spill Volume: 359 TAF
0
50,000
100,000
150,000
200,000
Flo
w R
ate
[cfs
]
A: Reoperation Plots
37
Shasta Operations Plot
Water Year: 1960
Top of Conservation Pool Flood Pool Encroachment Constraint Storage Reop Storage Inflow Outflow Reop Outflow
Oct
1,1
959
Nov
1,1
959
Dec
1,1
959
Jan
1,19
60
Feb
1,1
960
Mar
1,1
960
Apr
1,1
960
May
1,1
960
Jun
1,19
60
Jul 1
,196
0
Aug
1,1
960
Sep
1,1
960
Date/Time
0
1,000,000
2,000,000
3,000,000
4,000,000
5,000,000
Sto
rage
[acr
e-fe
et]
0
50,000
100,000
150,000
200,000
Flo
w R
ate
[cfs
]
Shasta Operations Plot
Water Year: 1961
Top of Conservation Pool Flood Pool Encroachment Constraint Storage Reop Storage Inflow Outflow Reop Outflow
Oct
1,1
960
Nov
1,1
960
Dec
1,1
960
Jan
1,19
61
Feb
1,1
961
Mar
1,1
961
Apr
1,1
961
May
1,1
961
Jun
1,19
61
Jul 1
,196
1
Aug
1,1
961
Sep
1,1
961
Date/Time
0
1,000,000
2,000,000
3,000,000
4,000,000
5,000,000
Sto
rage
[acr
e-fe
et]
Spill Volume: 162 TAF
0
50,000
100,000
150,000
200,000
Flo
w R
ate
[cfs
]
A: Reoperation Plots
38
Shasta Operations Plot
Water Year: 1962
Top of Conservation Pool Flood Pool Encroachment Constraint Storage Reop Storage Inflow Outflow Reop Outflow
Oct
1,1
961
Nov
1,1
961
Dec
1,1
961
Jan
1,19
62
Feb
1,1
962
Mar
1,1
962
Apr
1,1
962
May
1,1
962
Jun
1,19
62
Jul 1
,196
2
Aug
1,1
962
Sep
1,1
962
Date/Time
0
1,000,000
2,000,000
3,000,000
4,000,000
5,000,000
Sto
rage
[acr
e-fe
et]
0
50,000
100,000
150,000
200,000
Flo
w R
ate
[cfs
]
Shasta Operations Plot
Water Year: 1963
Top of Conservation Pool Flood Pool Encroachment Constraint Storage Reop Storage Inflow Outflow Reop Outflow
Oct
1,1
962
Nov
1,1
962
Dec
1,1
962
Jan
1,19
63
Feb
1,1
963
Mar
1,1
963
Apr
1,1
963
May
1,1
963
Jun
1,19
63
Jul 1
,196
3
Aug
1,1
963
Sep
1,1
963
Date/Time
0
1,000,000
2,000,000
3,000,000
4,000,000
5,000,000
Sto
rage
[acr
e-fe
et]
Spill Volume: 760 TAF
0
50,000
100,000
150,000
200,000
Flo
w R
ate
[cfs
]
A: Reoperation Plots
39
Shasta Operations Plot
Water Year: 1964
Top of Conservation Pool Flood Pool Encroachment Constraint Storage Reop Storage Inflow Outflow Reop Outflow
Oct
1,1
963
Nov
1,1
963
Dec
1,1
963
Jan
1,19
64
Feb
1,1
964
Mar
1,1
964
Apr
1,1
964
May
1,1
964
Jun
1,19
64
Jul 1
,196
4
Aug
1,1
964
Sep
1,1
964
Date/Time
0
1,000,000
2,000,000
3,000,000
4,000,000
5,000,000
Sto
rage
[acr
e-fe
et]
0
50,000
100,000
150,000
200,000
Flo
w R
ate
[cfs
]
Shasta Operations Plot
Water Year: 1965
Top of Conservation Pool Flood Pool Encroachment Constraint Storage Reop Storage Inflow Outflow Reop Outflow
Oct
1,1
964
Nov
1,1
964
Dec
1,1
964
Jan
1,19
65
Feb
1,1
965
Mar
1,1
965
Apr
1,1
965
May
1,1
965
Jun
1,19
65
Jul 1
,196
5
Aug
1,1
965
Sep
1,1
965
Date/Time
0
1,000,000
2,000,000
3,000,000
4,000,000
5,000,000
Sto
rage
[acr
e-fe
et]
Spill Volume: 1296 TAF
0
50,000
100,000
150,000
200,000
Flo
w R
ate
[cfs
]
A: Reoperation Plots
40
Shasta Operations Plot
Water Year: 1966
Top of Conservation Pool Flood Pool Encroachment Constraint Storage Reop Storage Inflow Outflow Reop Outflow
Oct
1,1
965
Nov
1,1
965
Dec
1,1
965
Jan
1,19
66
Feb
1,1
966
Mar
1,1
966
Apr
1,1
966
May
1,1
966
Jun
1,19
66
Jul 1
,196
6
Aug
1,1
966
Sep
1,1
966
Date/Time
0
1,000,000
2,000,000
3,000,000
4,000,000
5,000,000
Sto
rage
[acr
e-fe
et]
0
50,000
100,000
150,000
200,000
Flo
w R
ate
[cfs
]
Shasta Operations Plot
Water Year: 1967
Top of Conservation Pool Flood Pool Encroachment Constraint Storage Reop Storage Inflow Outflow Reop Outflow
Oct
1,1
966
Nov
1,1
966
Dec
1,1
966
Jan
1,19
67
Feb
1,1
967
Mar
1,1
967
Apr
1,1
967
May
1,1
967
Jun
1,19
67
Jul 1
,196
7
Aug
1,1
967
Sep
1,1
967
Date/Time
0
1,000,000
2,000,000
3,000,000
4,000,000
5,000,000
Sto
rage
[acr
e-fe
et]
Spill Volume: 1298 TAF
0
50,000
100,000
150,000
200,000
Flo
w R
ate
[cfs
]
A: Reoperation Plots
41
Shasta Operations Plot
Water Year: 1968
Top of Conservation Pool Flood Pool Encroachment Constraint Storage Reop Storage Inflow Outflow Reop Outflow
Oct
1,1
967
Nov
1,1
967
Dec
1,1
967
Jan
1,19
68
Feb
1,1
968
Mar
1,1
968
Apr
1,1
968
May
1,1
968
Jun
1,19
68
Jul 1
,196
8
Aug
1,1
968
Sep
1,1
968
Date/Time
0
1,000,000
2,000,000
3,000,000
4,000,000
5,000,000
Sto
rage
[acr
e-fe
et]
Spill Volume: 403 TAF
0
50,000
100,000
150,000
200,000
Flo
w R
ate
[cfs
]
Shasta Operations Plot
Water Year: 1969
Top of Conservation Pool Flood Pool Encroachment Constraint Storage Reop Storage Inflow Outflow Reop Outflow
Oct
1,1
968
Nov
1,1
968
Dec
1,1
968
Jan
1,19
69
Feb
1,1
969
Mar
1,1
969
Apr
1,1
969
May
1,1
969
Jun
1,19
69
Jul 1
,196
9
Aug
1,1
969
Sep
1,1
969
Date/Time
0
1,000,000
2,000,000
3,000,000
4,000,000
5,000,000
Sto
rage
[acr
e-fe
et]
Spill Volume: 1421 TAF
0
50,000
100,000
150,000
200,000
Flo
w R
ate
[cfs
]
A: Reoperation Plots
42
Shasta Operations Plot
Water Year: 1970
Top of Conservation Pool Flood Pool Encroachment Constraint Storage Reop Storage Inflow Outflow Reop Outflow
Oct
1,1
969
Nov
1,1
969
Dec
1,1
969
Jan
1,19
70
Feb
1,1
970
Mar
1,1
970
Apr
1,1
970
May
1,1
970
Jun
1,19
70
Jul 1
,197
0
Aug
1,1
970
Sep
1,1
970
Date/Time
0
1,000,000
2,000,000
3,000,000
4,000,000
5,000,000
Sto
rage
[acr
e-fe
et]
Spill Volume: 2724 TAF
0
50,000
100,000
150,000
200,000
Flo
w R
ate
[cfs
]
Shasta Operations Plot
Water Year: 1971
Top of Conservation Pool Flood Pool Encroachment Constraint Storage Reop Storage Inflow Outflow Reop Outflow
Oct
1,1
970
Nov
1,1
970
Dec
1,1
970
Jan
1,19
71
Feb
1,1
971
Mar
1,1
971
Apr
1,1
971
May
1,1
971
Jun
1,19
71
Jul 1
,197
1
Aug
1,1
971
Sep
1,1
971
Date/Time
0
1,000,000
2,000,000
3,000,000
4,000,000
5,000,000
Sto
rage
[acr
e-fe
et]
Spill Volume: 919 TAF
0
50,000
100,000
150,000
200,000
Flo
w R
ate
[cfs
]
A: Reoperation Plots
43
Shasta Operations Plot
Water Year: 1972
Top of Conservation Pool Flood Pool Encroachment Constraint Storage Reop Storage Inflow Outflow Reop Outflow
Oct
1,1
971
Nov
1,1
971
Dec
1,1
971
Jan
1,19
72
Feb
1,1
972
Mar
1,1
972
Apr
1,1
972
May
1,1
972
Jun
1,19
72
Jul 1
,197
2
Aug
1,1
972
Sep
1,1
972
Date/Time
0
1,000,000
2,000,000
3,000,000
4,000,000
5,000,000
Sto
rage
[acr
e-fe
et]
Spill Volume: 52 TAF
0
50,000
100,000
150,000
200,000
Flo
w R
ate
[cfs
]
Shasta Operations Plot
Water Year: 1973
Top of Conservation Pool Flood Pool Encroachment Constraint Storage Reop Storage Inflow Outflow Reop Outflow
Oct
1,1
972
Nov
1,1
972
Dec
1,1
972
Jan
1,19
73
Feb
1,1
973
Mar
1,1
973
Apr
1,1
973
May
1,1
973
Jun
1,19
73
Jul 1
,197
3
Aug
1,1
973
Sep
1,1
973
Date/Time
0
1,000,000
2,000,000
3,000,000
4,000,000
5,000,000
Sto
rage
[acr
e-fe
et]
Spill Volume: 802 TAF
0
50,000
100,000
150,000
200,000
Flo
w R
ate
[cfs
]
A: Reoperation Plots
44
Shasta Operations Plot
Water Year: 1974
Top of Conservation Pool Flood Pool Encroachment Constraint Storage Reop Storage Inflow Outflow Reop Outflow
Oct
1,1
973
Nov
1,1
973
Dec
1,1
973
Jan
1,19
74
Feb
1,1
974
Mar
1,1
974
Apr
1,1
974
May
1,1
974
Jun
1,19
74
Jul 1
,197
4
Aug
1,1
974
Sep
1,1
974
Date/Time
0
1,000,000
2,000,000
3,000,000
4,000,000
5,000,000
Sto
rage
[acr
e-fe
et]
Spill Volume: 4279 TAF
0
50,000
100,000
150,000
200,000
Flo
w R
ate
[cfs
]
Shasta Operations Plot
Water Year: 1975
Top of Conservation Pool Flood Pool Encroachment Constraint Storage Reop Storage Inflow Outflow Reop Outflow
Oct
1,1
974
Nov
1,1
974
Dec
1,1
974
Jan
1,19
75
Feb
1,1
975
Mar
1,1
975
Apr
1,1
975
May
1,1
975
Jun
1,19
75
Jul 1
,197
5
Aug
1,1
975
Sep
1,1
975
Date/Time
0
1,000,000
2,000,000
3,000,000
4,000,000
5,000,000
Sto
rage
[acr
e-fe
et]
Spill Volume: 579 TAF
0
50,000
100,000
150,000
200,000
Flo
w R
ate
[cfs
]
A: Reoperation Plots
45
Shasta Operations Plot
Water Year: 1976
Top of Conservation Pool Flood Pool Encroachment Constraint Storage Reop Storage Inflow Outflow Reop Outflow
Oct
1,1
975
Nov
1,1
975
Dec
1,1
975
Jan
1,19
76
Feb
1,1
976
Mar
1,1
976
Apr
1,1
976
May
1,1
976
Jun
1,19
76
Jul 1
,197
6
Aug
1,1
976
Sep
1,1
976
Date/Time
0
1,000,000
2,000,000
3,000,000
4,000,000
5,000,000
Sto
rage
[acr
e-fe
et]
0
50,000
100,000
150,000
200,000
Flo
w R
ate
[cfs
]
Shasta Operations Plot
Water Year: 1977
Top of Conservation Pool Flood Pool Encroachment Constraint Storage Reop Storage Inflow Outflow Reop Outflow
Oct
1,1
976
Nov
1,1
976
Dec
1,1
976
Jan
1,19
77
Feb
1,1
977
Mar
1,1
977
Apr
1,1
977
May
1,1
977
Jun
1,19
77
Jul 1
,197
7
Aug
1,1
977
Sep
1,1
977
Date/Time
0
1,000,000
2,000,000
3,000,000
4,000,000
5,000,000
Sto
rage
[acr
e-fe
et]
0
50,000
100,000
150,000
200,000
Flo
w R
ate
[cfs
]
A: Reoperation Plots
46
Shasta Operations Plot
Water Year: 1978
Top of Conservation Pool Flood Pool Encroachment Constraint Storage Reop Storage Inflow Outflow Reop Outflow
Oct
1,1
977
Nov
1,1
977
Dec
1,1
977
Jan
1,19
78
Feb
1,1
978
Mar
1,1
978
Apr
1,1
978
May
1,1
978
Jun
1,19
78
Jul 1
,197
8
Aug
1,1
978
Sep
1,1
978
Date/Time
0
1,000,000
2,000,000
3,000,000
4,000,000
5,000,000
Sto
rage
[acr
e-fe
et]
Spill Volume: 473 TAF
0
50,000
100,000
150,000
200,000
Flo
w R
ate
[cfs
]
Shasta Operations Plot
Water Year: 1979
Top of Conservation Pool Flood Pool Encroachment Constraint Storage Reop Storage Inflow Outflow Reop Outflow
Oct
1,1
978
Nov
1,1
978
Dec
1,1
978
Jan
1,19
79
Feb
1,1
979
Mar
1,1
979
Apr
1,1
979
May
1,1
979
Jun
1,19
79
Jul 1
,197
9
Aug
1,1
979
Sep
1,1
979
Date/Time
0
1,000,000
2,000,000
3,000,000
4,000,000
5,000,000
Sto
rage
[acr
e-fe
et]
0
50,000
100,000
150,000
200,000
Flo
w R
ate
[cfs
]
A: Reoperation Plots
47

Shasta Operations Plot
Water Year: 1980
Top of Conservation Pool Flood Pool Encroachment Constraint Storage Reop Storage Inflow Outflow Reop Outflow
Oct
1,1
979
Nov
1,1
979
Dec
1,1
979
Jan
1,19
80
Feb
1,1
980
Mar
1,1
980
Apr
1,1
980
May
1,1
980
Jun
1,19
80
Jul 1
,198
0
Aug
1,1
980
Sep
1,1
980
Date/Time
0
1,000,000
2,000,000
3,000,000
4,000,000
5,000,000
Sto
rage
[acr
e-fe
et]
Spill Volume: 1533 TAF
0
50,000
100,000
150,000
200,000
Flo
w R
ate
[cfs
]
Shasta Operations Plot
Water Year: 1981
Top of Conservation Pool Flood Pool Encroachment Constraint Storage Reop Storage Inflow Outflow Reop Outflow
Oct
1,1
980
Nov
1,1
980
Dec
1,1
980
Jan
1,19
81
Feb
1,1
981
Mar
1,1
981
Apr
1,1
981
May
1,1
981
Jun
1,19
81
Jul 1
,198
1
Aug
1,1
981
Sep
1,1
981
Date/Time
0
1,000,000
2,000,000
3,000,000
4,000,000
5,000,000
Sto
rage
[acr
e-fe
et]
Spill Volume: 29 TAF
0
50,000
100,000
150,000
200,000
Flo
w R
ate
[cfs
]
A: Reoperation Plots
48
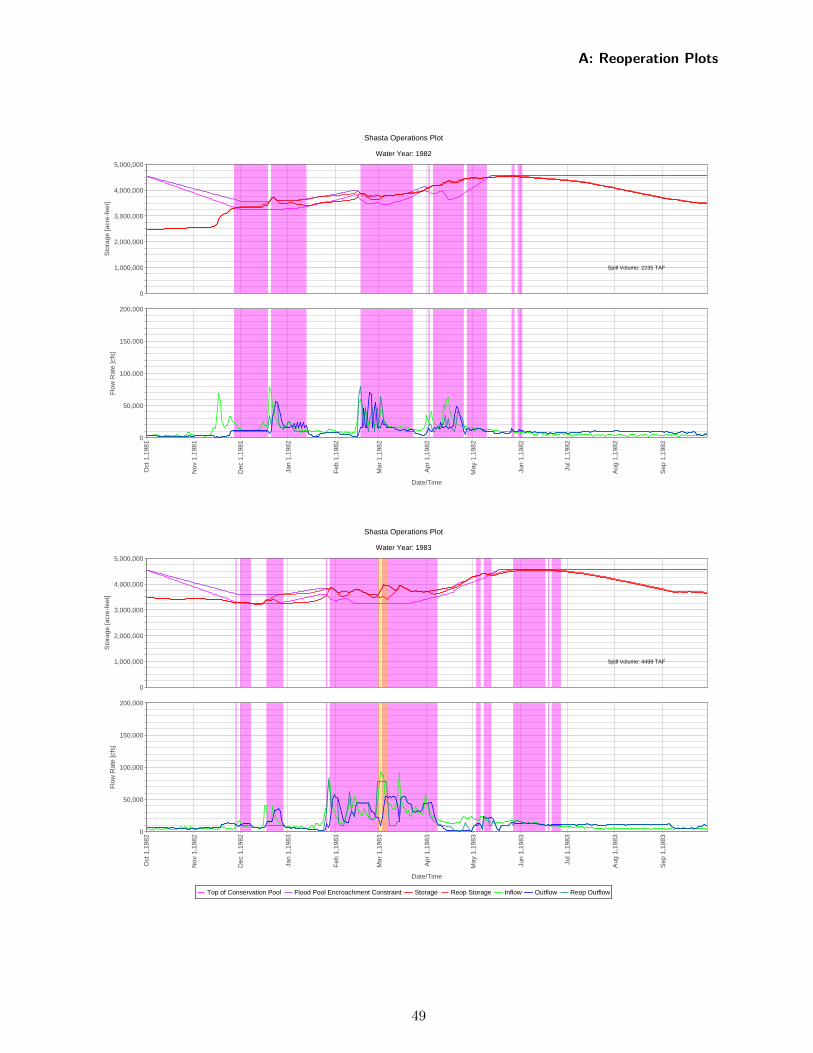
Shasta Operations Plot
Water Year: 1982
Top of Conservation Pool Flood Pool Encroachment Constraint Storage Reop Storage Inflow Outflow Reop Outflow
Oct
1,1
981
Nov
1,1
981
Dec
1,1
981
Jan
1,19
82
Feb
1,1
982
Mar
1,1
982
Apr
1,1
982
May
1,1
982
Jun
1,19
82
Jul 1
,198
2
Aug
1,1
982
Sep
1,1
982
Date/Time
0
1,000,000
2,000,000
3,000,000
4,000,000
5,000,000
Sto
rage
[acr
e-fe
et]
Spill Volume: 2235 TAF
0
50,000
100,000
150,000
200,000
Flo
w R
ate
[cfs
]
Shasta Operations Plot
Water Year: 1983
Top of Conservation Pool Flood Pool Encroachment Constraint Storage Reop Storage Inflow Outflow Reop Outflow
Oct
1,1
982
Nov
1,1
982
Dec
1,1
982
Jan
1,19
83
Feb
1,1
983
Mar
1,1
983
Apr
1,1
983
May
1,1
983
Jun
1,19
83
Jul 1
,198
3
Aug
1,1
983
Sep
1,1
983
Date/Time
0
1,000,000
2,000,000
3,000,000
4,000,000
5,000,000
Sto
rage
[acr
e-fe
et]
Spill Volume: 4498 TAF
0
50,000
100,000
150,000
200,000
Flo
w R
ate
[cfs
]
A: Reoperation Plots
49
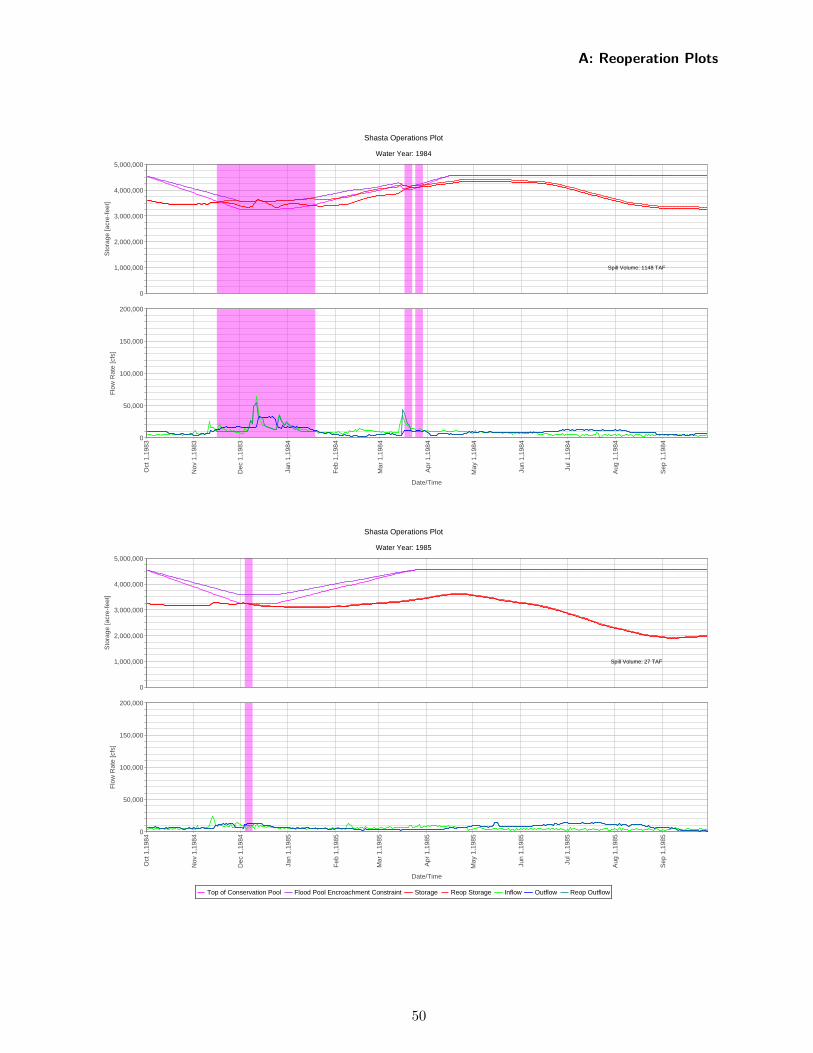
Shasta Operations Plot
Water Year: 1984
Top of Conservation Pool Flood Pool Encroachment Constraint Storage Reop Storage Inflow Outflow Reop Outflow
Oct
1,1
983
Nov
1,1
983
Dec
1,1
983
Jan
1,19
84
Feb
1,1
984
Mar
1,1
984
Apr
1,1
984
May
1,1
984
Jun
1,19
84
Jul 1
,198
4
Aug
1,1
984
Sep
1,1
984
Date/Time
0
1,000,000
2,000,000
3,000,000
4,000,000
5,000,000
Sto
rage
[acr
e-fe
et]
Spill Volume: 1148 TAF
0
50,000
100,000
150,000
200,000
Flo
w R
ate
[cfs
]
Shasta Operations Plot
Water Year: 1985
Top of Conservation Pool Flood Pool Encroachment Constraint Storage Reop Storage Inflow Outflow Reop Outflow
Oct
1,1
984
Nov
1,1
984
Dec
1,1
984
Jan
1,19
85
Feb
1,1
985
Mar
1,1
985
Apr
1,1
985
May
1,1
985
Jun
1,19
85
Jul 1
,198
5
Aug
1,1
985
Sep
1,1
985
Date/Time
0
1,000,000
2,000,000
3,000,000
4,000,000
5,000,000
Sto
rage
[acr
e-fe
et]
Spill Volume: 27 TAF
0
50,000
100,000
150,000
200,000
Flo
w R
ate
[cfs
]
A: Reoperation Plots
50
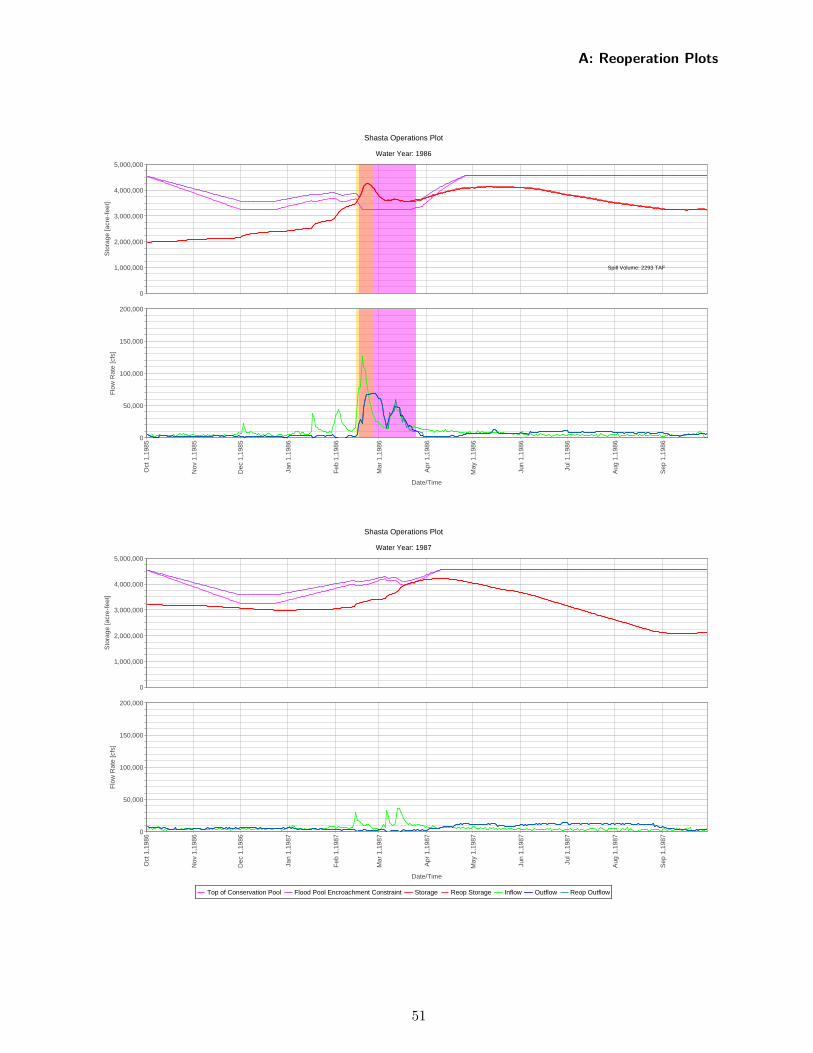
Shasta Operations Plot
Water Year: 1986
Top of Conservation Pool Flood Pool Encroachment Constraint Storage Reop Storage Inflow Outflow Reop Outflow
Oct
1,1
985
Nov
1,1
985
Dec
1,1
985
Jan
1,19
86
Feb
1,1
986
Mar
1,1
986
Apr
1,1
986
May
1,1
986
Jun
1,19
86
Jul 1
,198
6
Aug
1,1
986
Sep
1,1
986
Date/Time
0
1,000,000
2,000,000
3,000,000
4,000,000
5,000,000
Sto
rage
[acr
e-fe
et]
Spill Volume: 2293 TAF
0
50,000
100,000
150,000
200,000
Flo
w R
ate
[cfs
]
Shasta Operations Plot
Water Year: 1987
Top of Conservation Pool Flood Pool Encroachment Constraint Storage Reop Storage Inflow Outflow Reop Outflow
Oct
1,1
986
Nov
1,1
986
Dec
1,1
986
Jan
1,19
87
Feb
1,1
987
Mar
1,1
987
Apr
1,1
987
May
1,1
987
Jun
1,19
87
Jul 1
,198
7
Aug
1,1
987
Sep
1,1
987
Date/Time
0
1,000,000
2,000,000
3,000,000
4,000,000
5,000,000
Sto
rage
[acr
e-fe
et]
0
50,000
100,000
150,000
200,000
Flo
w R
ate
[cfs
]
A: Reoperation Plots
51
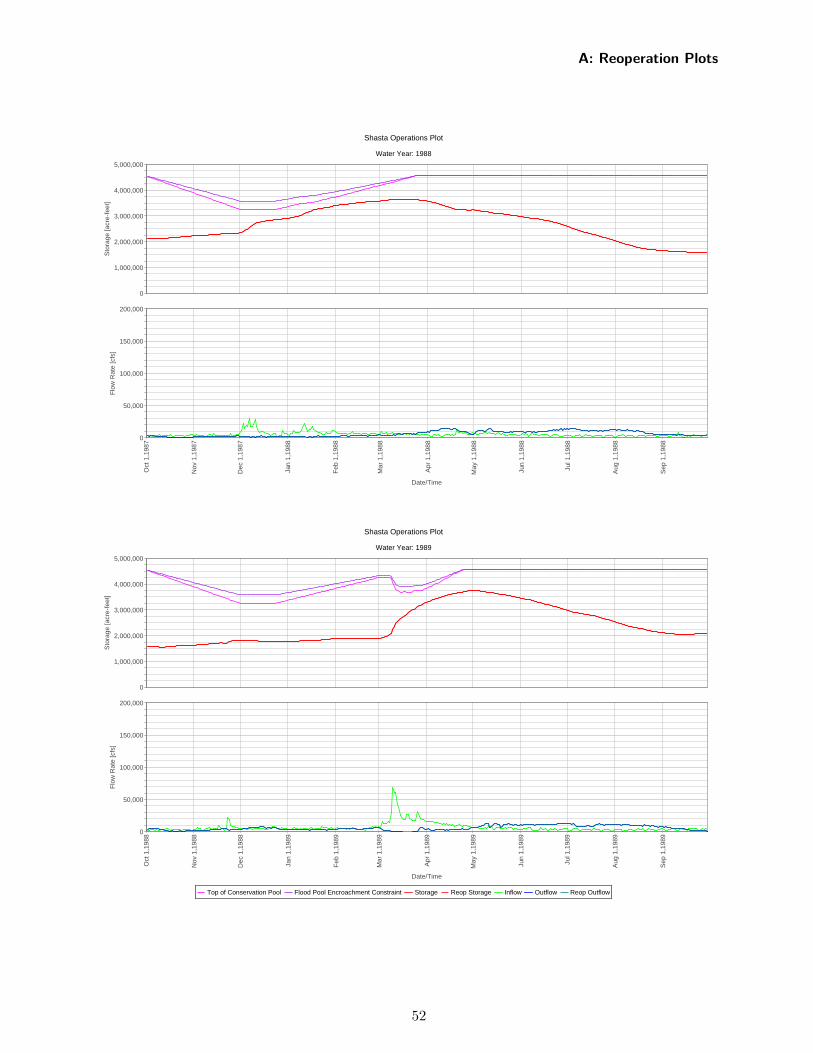
Shasta Operations Plot
Water Year: 1988
Top of Conservation Pool Flood Pool Encroachment Constraint Storage Reop Storage Inflow Outflow Reop Outflow
Oct
1,1
987
Nov
1,1
987
Dec
1,1
987
Jan
1,19
88
Feb
1,1
988
Mar
1,1
988
Apr
1,1
988
May
1,1
988
Jun
1,19
88
Jul 1
,198
8
Aug
1,1
988
Sep
1,1
988
Date/Time
0
1,000,000
2,000,000
3,000,000
4,000,000
5,000,000
Sto
rage
[acr
e-fe
et]
0
50,000
100,000
150,000
200,000
Flo
w R
ate
[cfs
]
Shasta Operations Plot
Water Year: 1989
Top of Conservation Pool Flood Pool Encroachment Constraint Storage Reop Storage Inflow Outflow Reop Outflow
Oct
1,1
988
Nov
1,1
988
Dec
1,1
988
Jan
1,19
89
Feb
1,1
989
Mar
1,1
989
Apr
1,1
989
May
1,1
989
Jun
1,19
89
Jul 1
,198
9
Aug
1,1
989
Sep
1,1
989
Date/Time
0
1,000,000
2,000,000
3,000,000
4,000,000
5,000,000
Sto
rage
[acr
e-fe
et]
0
50,000
100,000
150,000
200,000
Flo
w R
ate
[cfs
]
A: Reoperation Plots
52
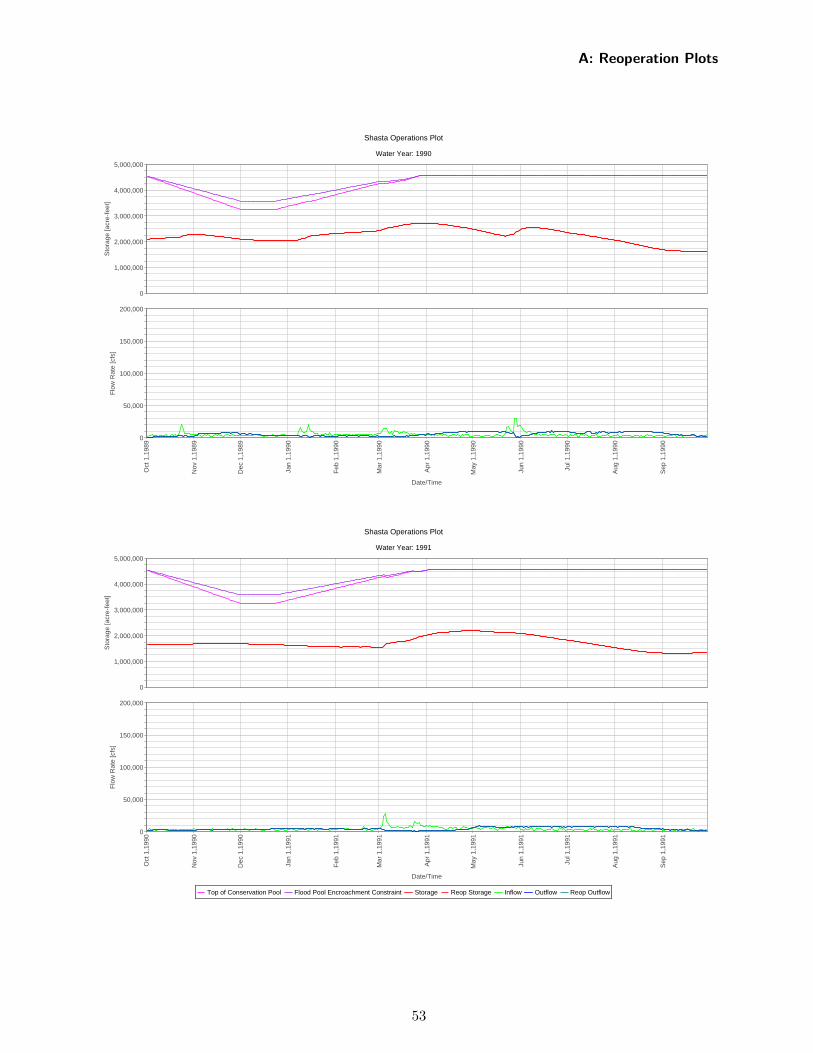
Shasta Operations Plot
Water Year: 1990
Top of Conservation Pool Flood Pool Encroachment Constraint Storage Reop Storage Inflow Outflow Reop Outflow
Oct
1,1
989
Nov
1,1
989
Dec
1,1
989
Jan
1,19
90
Feb
1,1
990
Mar
1,1
990
Apr
1,1
990
May
1,1
990
Jun
1,19
90
Jul 1
,199
0
Aug
1,1
990
Sep
1,1
990
Date/Time
0
1,000,000
2,000,000
3,000,000
4,000,000
5,000,000
Sto
rage
[acr
e-fe
et]
0
50,000
100,000
150,000
200,000
Flo
w R
ate
[cfs
]
Shasta Operations Plot
Water Year: 1991
Top of Conservation Pool Flood Pool Encroachment Constraint Storage Reop Storage Inflow Outflow Reop Outflow
Oct
1,1
990
Nov
1,1
990
Dec
1,1
990
Jan
1,19
91
Feb
1,1
991
Mar
1,1
991
Apr
1,1
991
May
1,1
991
Jun
1,19
91
Jul 1
,199
1
Aug
1,1
991
Sep
1,1
991
Date/Time
0
1,000,000
2,000,000
3,000,000
4,000,000
5,000,000
Sto
rage
[acr
e-fe
et]
0
50,000
100,000
150,000
200,000
Flo
w R
ate
[cfs
]
A: Reoperation Plots
53
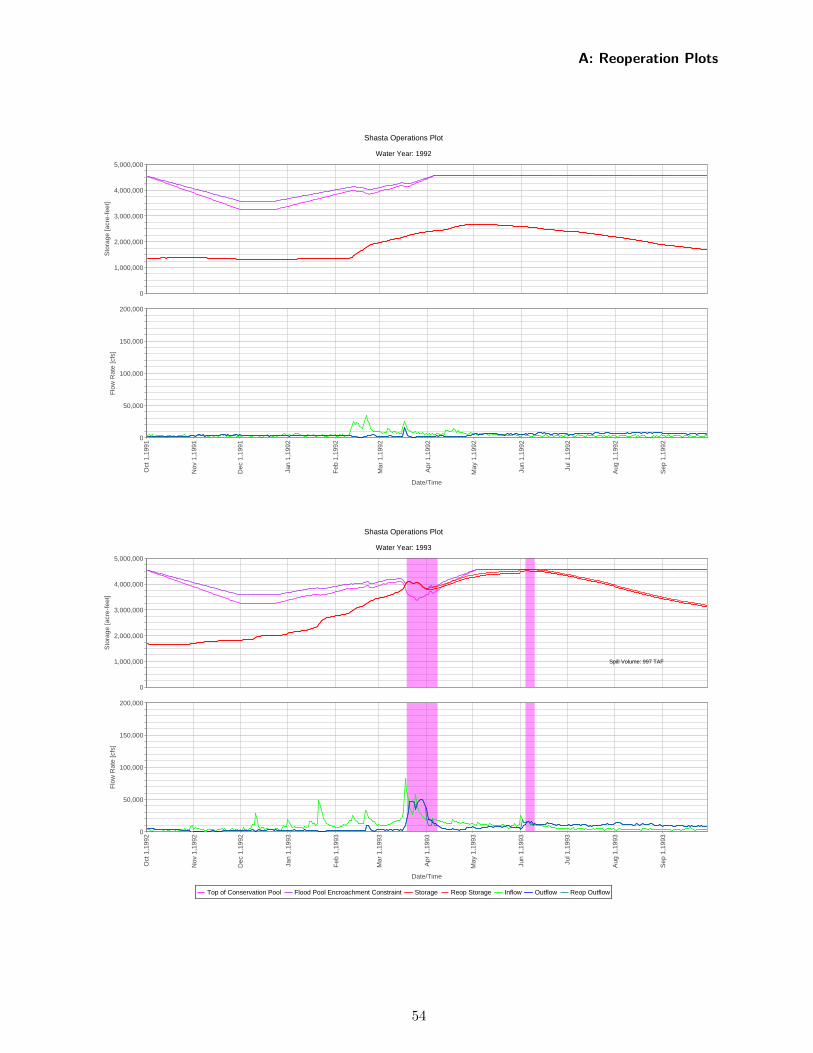
Shasta Operations Plot
Water Year: 1992
Top of Conservation Pool Flood Pool Encroachment Constraint Storage Reop Storage Inflow Outflow Reop Outflow
Oct
1,1
991
Nov
1,1
991
Dec
1,1
991
Jan
1,19
92
Feb
1,1
992
Mar
1,1
992
Apr
1,1
992
May
1,1
992
Jun
1,19
92
Jul 1
,199
2
Aug
1,1
992
Sep
1,1
992
Date/Time
0
1,000,000
2,000,000
3,000,000
4,000,000
5,000,000
Sto
rage
[acr
e-fe
et]
0
50,000
100,000
150,000
200,000
Flo
w R
ate
[cfs
]
Shasta Operations Plot
Water Year: 1993
Top of Conservation Pool Flood Pool Encroachment Constraint Storage Reop Storage Inflow Outflow Reop Outflow
Oct
1,1
992
Nov
1,1
992
Dec
1,1
992
Jan
1,19
93
Feb
1,1
993
Mar
1,1
993
Apr
1,1
993
May
1,1
993
Jun
1,19
93
Jul 1
,199
3
Aug
1,1
993
Sep
1,1
993
Date/Time
0
1,000,000
2,000,000
3,000,000
4,000,000
5,000,000
Sto
rage
[acr
e-fe
et]
Spill Volume: 997 TAF
0
50,000
100,000
150,000
200,000
Flo
w R
ate
[cfs
]
A: Reoperation Plots
54
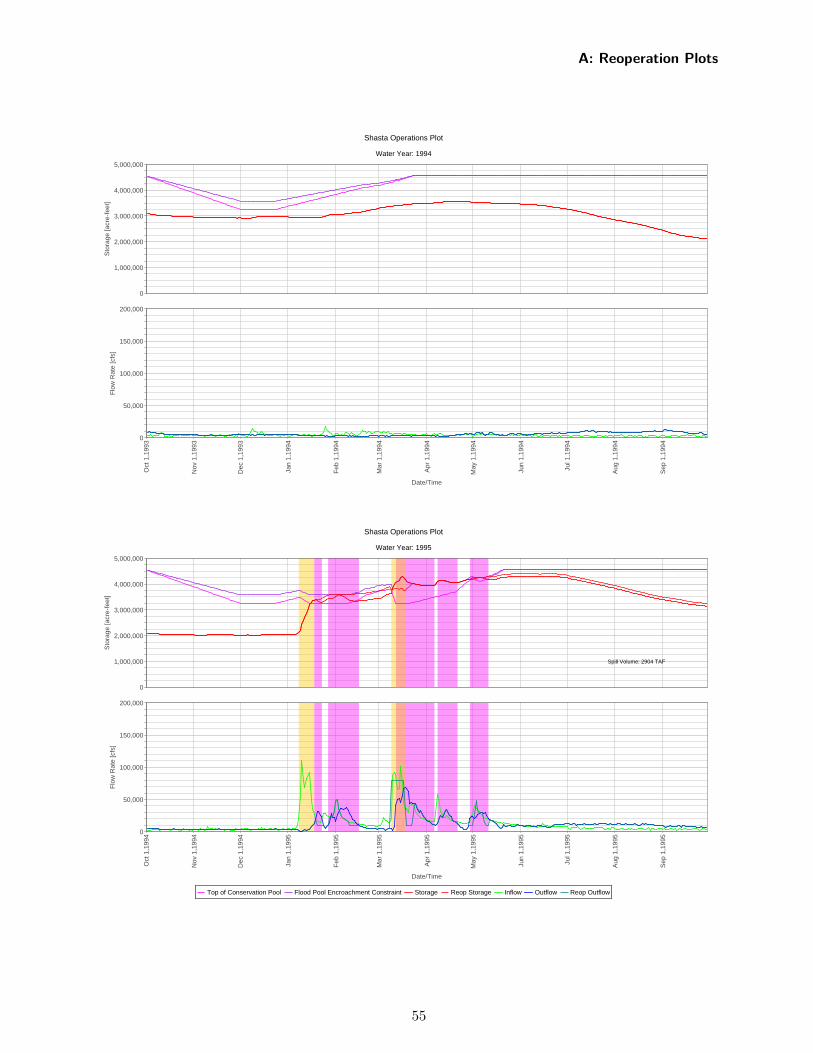
Shasta Operations Plot
Water Year: 1994
Top of Conservation Pool Flood Pool Encroachment Constraint Storage Reop Storage Inflow Outflow Reop Outflow
Oct
1,1
993
Nov
1,1
993
Dec
1,1
993
Jan
1,19
94
Feb
1,1
994
Mar
1,1
994
Apr
1,1
994
May
1,1
994
Jun
1,19
94
Jul 1
,199
4
Aug
1,1
994
Sep
1,1
994
Date/Time
0
1,000,000
2,000,000
3,000,000
4,000,000
5,000,000
Sto
rage
[acr
e-fe
et]
0
50,000
100,000
150,000
200,000
Flo
w R
ate
[cfs
]
Shasta Operations Plot
Water Year: 1995
Top of Conservation Pool Flood Pool Encroachment Constraint Storage Reop Storage Inflow Outflow Reop Outflow
Oct
1,1
994
Nov
1,1
994
Dec
1,1
994
Jan
1,19
95
Feb
1,1
995
Mar
1,1
995
Apr
1,1
995
May
1,1
995
Jun
1,19
95
Jul 1
,199
5
Aug
1,1
995
Sep
1,1
995
Date/Time
0
1,000,000
2,000,000
3,000,000
4,000,000
5,000,000
Sto
rage
[acr
e-fe
et]
Spill Volume: 2904 TAF
0
50,000
100,000
150,000
200,000
Flo
w R
ate
[cfs
]
A: Reoperation Plots
55
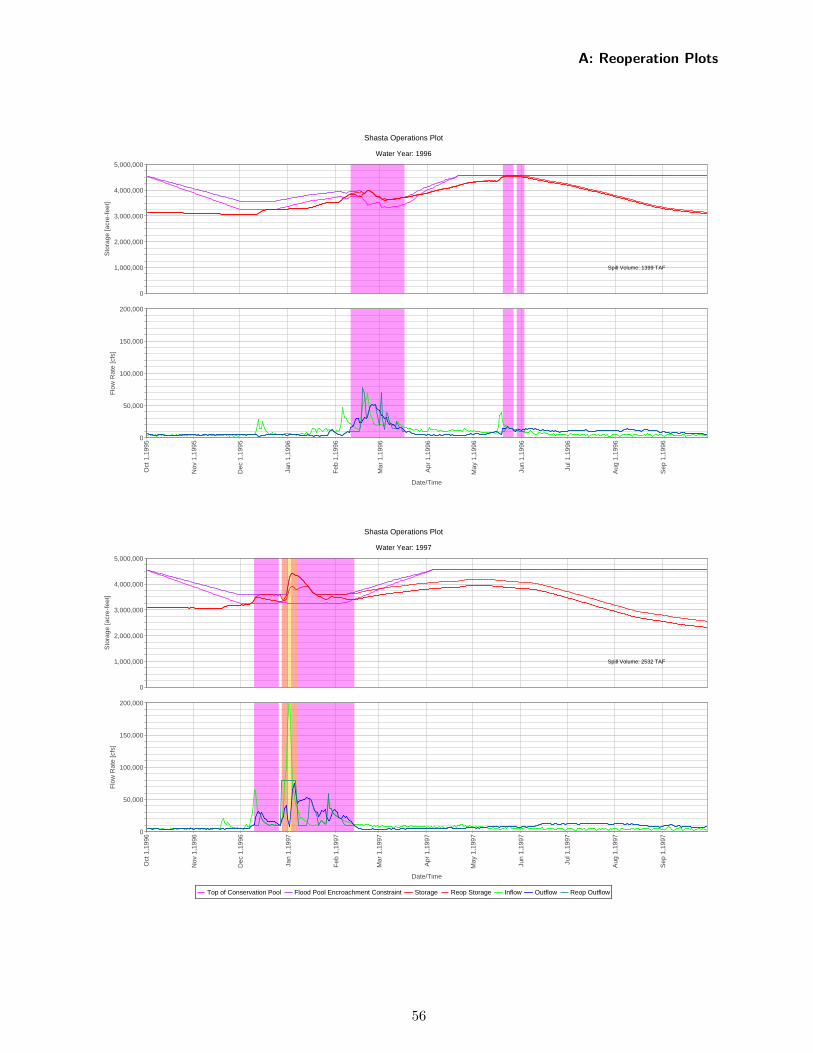
Shasta Operations Plot
Water Year: 1996
Top of Conservation Pool Flood Pool Encroachment Constraint Storage Reop Storage Inflow Outflow Reop Outflow
Oct
1,1
995
Nov
1,1
995
Dec
1,1
995
Jan
1,19
96
Feb
1,1
996
Mar
1,1
996
Apr
1,1
996
May
1,1
996
Jun
1,19
96
Jul 1
,199
6
Aug
1,1
996
Sep
1,1
996
Date/Time
0
1,000,000
2,000,000
3,000,000
4,000,000
5,000,000
Sto
rage
[acr
e-fe
et]
Spill Volume: 1399 TAF
0
50,000
100,000
150,000
200,000
Flo
w R
ate
[cfs
]
Shasta Operations Plot
Water Year: 1997
Top of Conservation Pool Flood Pool Encroachment Constraint Storage Reop Storage Inflow Outflow Reop Outflow
Oct
1,1
996
Nov
1,1
996
Dec
1,1
996
Jan
1,19
97
Feb
1,1
997
Mar
1,1
997
Apr
1,1
997
May
1,1
997
Jun
1,19
97
Jul 1
,199
7
Aug
1,1
997
Sep
1,1
997
Date/Time
0
1,000,000
2,000,000
3,000,000
4,000,000
5,000,000
Sto
rage
[acr
e-fe
et]
Spill Volume: 2532 TAF
0
50,000
100,000
150,000
200,000
Flo
w R
ate
[cfs
]
A: Reoperation Plots
56
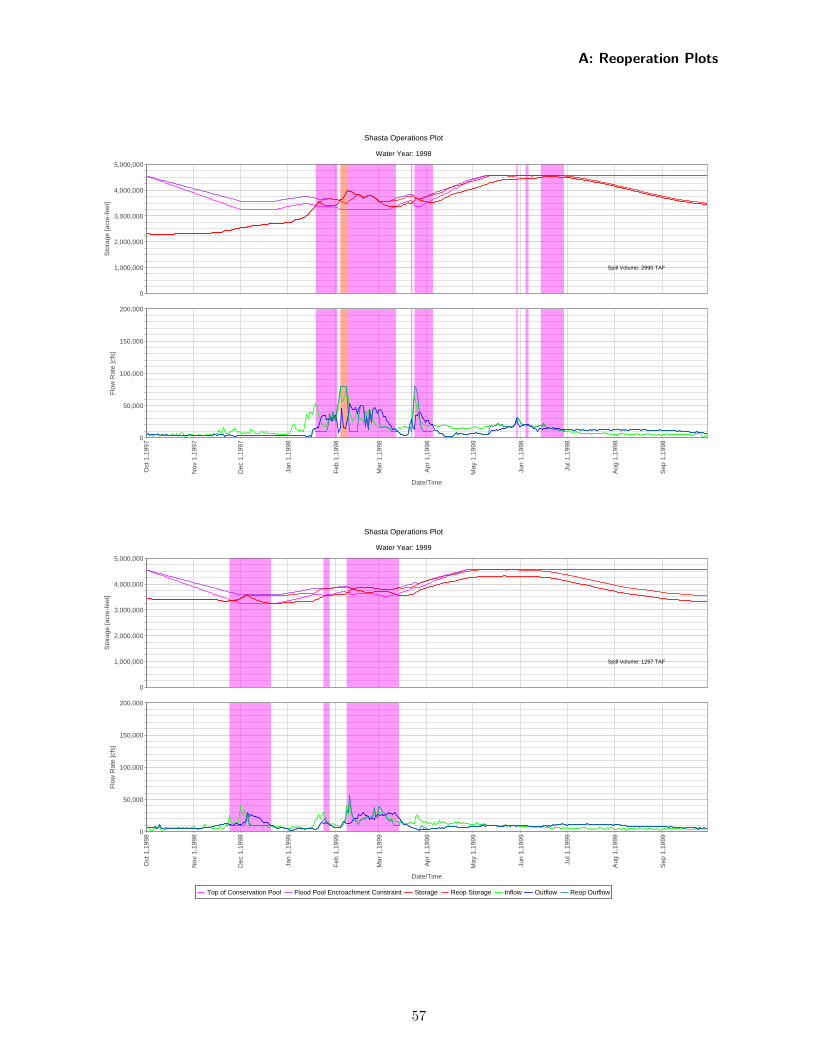
Shasta Operations Plot
Water Year: 1998
Top of Conservation Pool Flood Pool Encroachment Constraint Storage Reop Storage Inflow Outflow Reop Outflow
Oct
1,1
997
Nov
1,1
997
Dec
1,1
997
Jan
1,19
98
Feb
1,1
998
Mar
1,1
998
Apr
1,1
998
May
1,1
998
Jun
1,19
98
Jul 1
,199
8
Aug
1,1
998
Sep
1,1
998
Date/Time
0
1,000,000
2,000,000
3,000,000
4,000,000
5,000,000
Sto
rage
[acr
e-fe
et]
Spill Volume: 2990 TAF
0
50,000
100,000
150,000
200,000
Flo
w R
ate
[cfs
]
Shasta Operations Plot
Water Year: 1999
Top of Conservation Pool Flood Pool Encroachment Constraint Storage Reop Storage Inflow Outflow Reop Outflow
Oct
1,1
998
Nov
1,1
998
Dec
1,1
998
Jan
1,19
99
Feb
1,1
999
Mar
1,1
999
Apr
1,1
999
May
1,1
999
Jun
1,19
99
Jul 1
,199
9
Aug
1,1
999
Sep
1,1
999
Date/Time
0
1,000,000
2,000,000
3,000,000
4,000,000
5,000,000
Sto
rage
[acr
e-fe
et]
Spill Volume: 1297 TAF
0
50,000
100,000
150,000
200,000
Flo
w R
ate
[cfs
]
A: Reoperation Plots
57
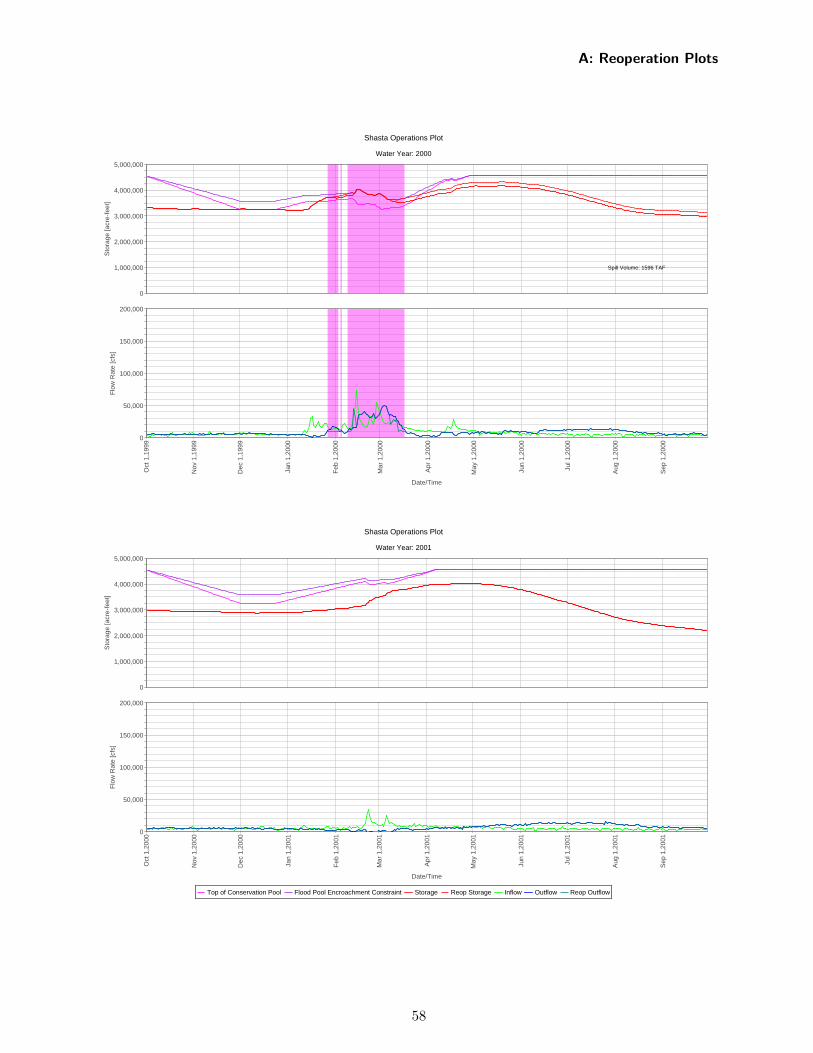
Shasta Operations Plot
Water Year: 2000
Top of Conservation Pool Flood Pool Encroachment Constraint Storage Reop Storage Inflow Outflow Reop Outflow
Oct
1,1
999
Nov
1,1
999
Dec
1,1
999
Jan
1,20
00
Feb
1,2
000
Mar
1,2
000
Apr
1,2
000
May
1,2
000
Jun
1,20
00
Jul 1
,200
0
Aug
1,2
000
Sep
1,2
000
Date/Time
0
1,000,000
2,000,000
3,000,000
4,000,000
5,000,000
Sto
rage
[acr
e-fe
et]
Spill Volume: 1596 TAF
0
50,000
100,000
150,000
200,000
Flo
w R
ate
[cfs
]
Shasta Operations Plot
Water Year: 2001
Top of Conservation Pool Flood Pool Encroachment Constraint Storage Reop Storage Inflow Outflow Reop Outflow
Oct
1,2
000
Nov
1,2
000
Dec
1,2
000
Jan
1,20
01
Feb
1,2
001
Mar
1,2
001
Apr
1,2
001
May
1,2
001
Jun
1,20
01
Jul 1
,200
1
Aug
1,2
001
Sep
1,2
001
Date/Time
0
1,000,000
2,000,000
3,000,000
4,000,000
5,000,000
Sto
rage
[acr
e-fe
et]
0
50,000
100,000
150,000
200,000
Flo
w R
ate
[cfs
]
A: Reoperation Plots
58
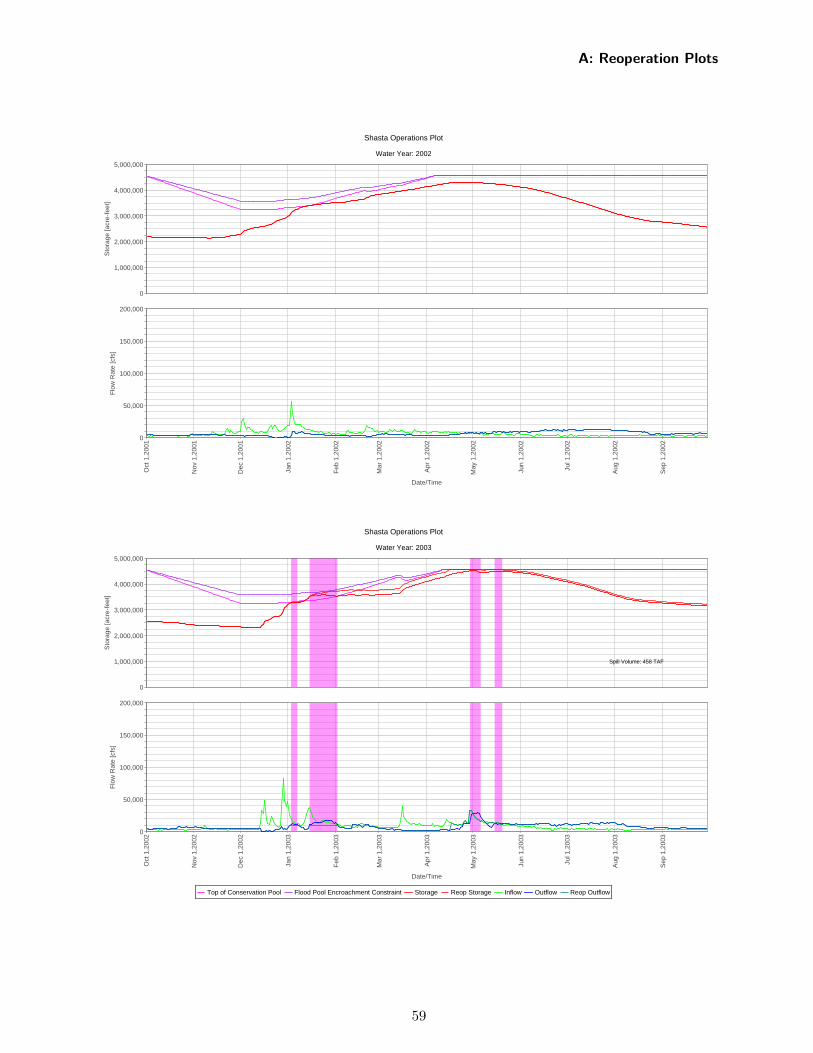
Shasta Operations Plot
Water Year: 2002
Top of Conservation Pool Flood Pool Encroachment Constraint Storage Reop Storage Inflow Outflow Reop Outflow
Oct
1,2
001
Nov
1,2
001
Dec
1,2
001
Jan
1,20
02
Feb
1,2
002
Mar
1,2
002
Apr
1,2
002
May
1,2
002
Jun
1,20
02
Jul 1
,200
2
Aug
1,2
002
Sep
1,2
002
Date/Time
0
1,000,000
2,000,000
3,000,000
4,000,000
5,000,000
Sto
rage
[acr
e-fe
et]
0
50,000
100,000
150,000
200,000
Flo
w R
ate
[cfs
]
Shasta Operations Plot
Water Year: 2003
Top of Conservation Pool Flood Pool Encroachment Constraint Storage Reop Storage Inflow Outflow Reop Outflow
Oct
1,2
002
Nov
1,2
002
Dec
1,2
002
Jan
1,20
03
Feb
1,2
003
Mar
1,2
003
Apr
1,2
003
May
1,2
003
Jun
1,20
03
Jul 1
,200
3
Aug
1,2
003
Sep
1,2
003
Date/Time
0
1,000,000
2,000,000
3,000,000
4,000,000
5,000,000
Sto
rage
[acr
e-fe
et]
Spill Volume: 458 TAF
0
50,000
100,000
150,000
200,000
Flo
w R
ate
[cfs
]
A: Reoperation Plots
59
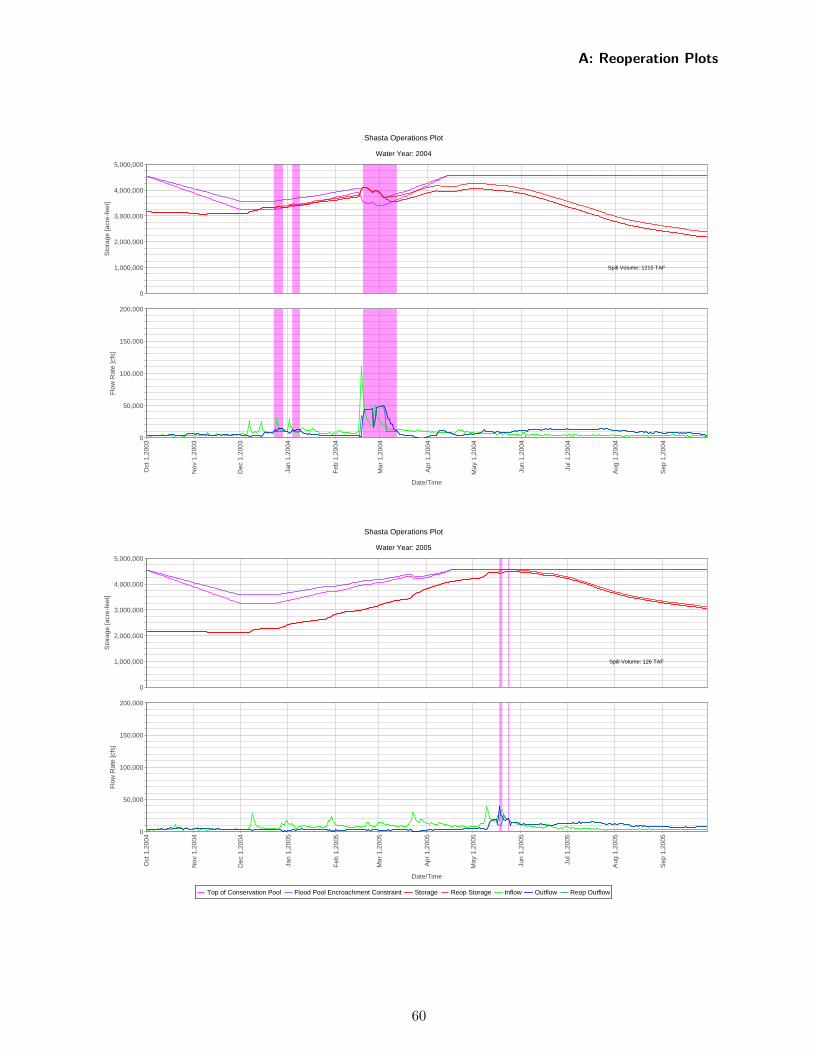
Shasta Operations Plot
Water Year: 2004
Top of Conservation Pool Flood Pool Encroachment Constraint Storage Reop Storage Inflow Outflow Reop Outflow
Oct
1,2
003
Nov
1,2
003
Dec
1,2
003
Jan
1,20
04
Feb
1,2
004
Mar
1,2
004
Apr
1,2
004
May
1,2
004
Jun
1,20
04
Jul 1
,200
4
Aug
1,2
004
Sep
1,2
004
Date/Time
0
1,000,000
2,000,000
3,000,000
4,000,000
5,000,000
Sto
rage
[acr
e-fe
et]
Spill Volume: 1215 TAF
0
50,000
100,000
150,000
200,000
Flo
w R
ate
[cfs
]
Shasta Operations Plot
Water Year: 2005
Top of Conservation Pool Flood Pool Encroachment Constraint Storage Reop Storage Inflow Outflow Reop Outflow
Oct
1,2
004
Nov
1,2
004
Dec
1,2
004
Jan
1,20
05
Feb
1,2
005
Mar
1,2
005
Apr
1,2
005
May
1,2
005
Jun
1,20
05
Jul 1
,200
5
Aug
1,2
005
Sep
1,2
005
Date/Time
0
1,000,000
2,000,000
3,000,000
4,000,000
5,000,000
Sto
rage
[acr
e-fe
et]
Spill Volume: 126 TAF
0
50,000
100,000
150,000
200,000
Flo
w R
ate
[cfs
]
A: Reoperation Plots
60
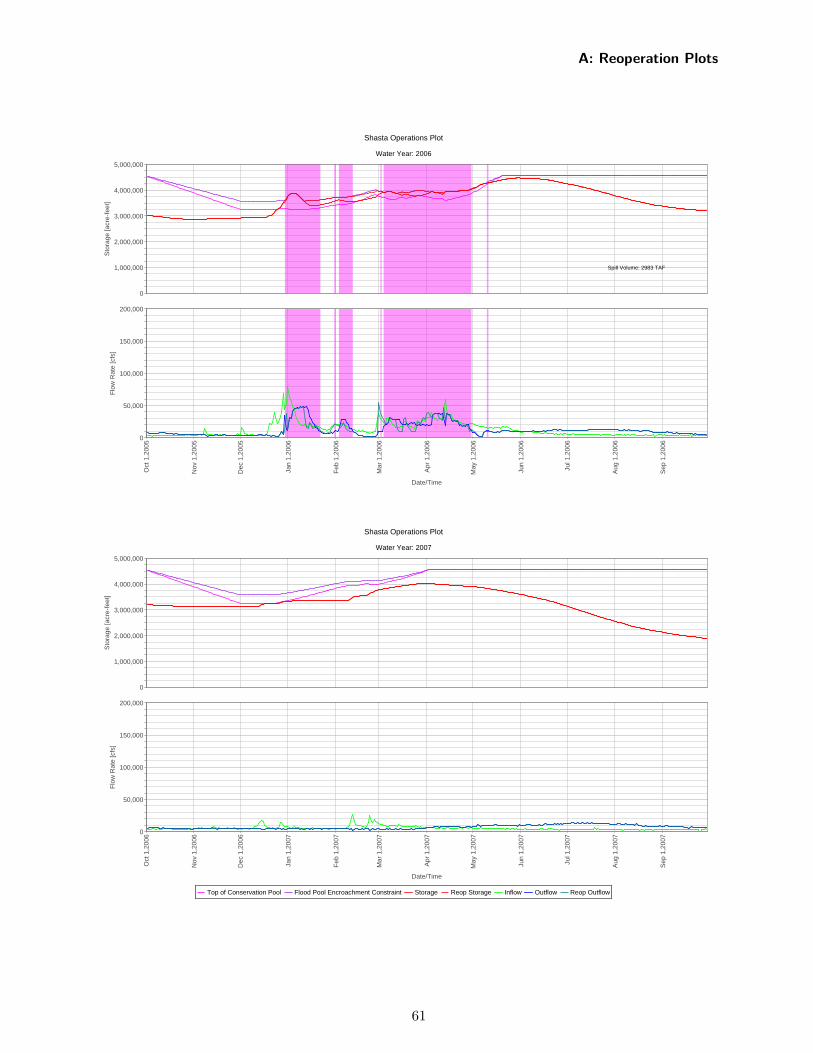
Shasta Operations Plot
Water Year: 2006
Top of Conservation Pool Flood Pool Encroachment Constraint Storage Reop Storage Inflow Outflow Reop Outflow
Oct
1,2
005
Nov
1,2
005
Dec
1,2
005
Jan
1,20
06
Feb
1,2
006
Mar
1,2
006
Apr
1,2
006
May
1,2
006
Jun
1,20
06
Jul 1
,200
6
Aug
1,2
006
Sep
1,2
006
Date/Time
0
1,000,000
2,000,000
3,000,000
4,000,000
5,000,000
Sto
rage
[acr
e-fe
et]
Spill Volume: 2983 TAF
0
50,000
100,000
150,000
200,000
Flo
w R
ate
[cfs
]
Shasta Operations Plot
Water Year: 2007
Top of Conservation Pool Flood Pool Encroachment Constraint Storage Reop Storage Inflow Outflow Reop Outflow
Oct
1,2
006
Nov
1,2
006
Dec
1,2
006
Jan
1,20
07
Feb
1,2
007
Mar
1,2
007
Apr
1,2
007
May
1,2
007
Jun
1,20
07
Jul 1
,200
7
Aug
1,2
007
Sep
1,2
007
Date/Time
0
1,000,000
2,000,000
3,000,000
4,000,000
5,000,000
Sto
rage
[acr
e-fe
et]
0
50,000
100,000
150,000
200,000
Flo
w R
ate
[cfs
]
A: Reoperation Plots
61
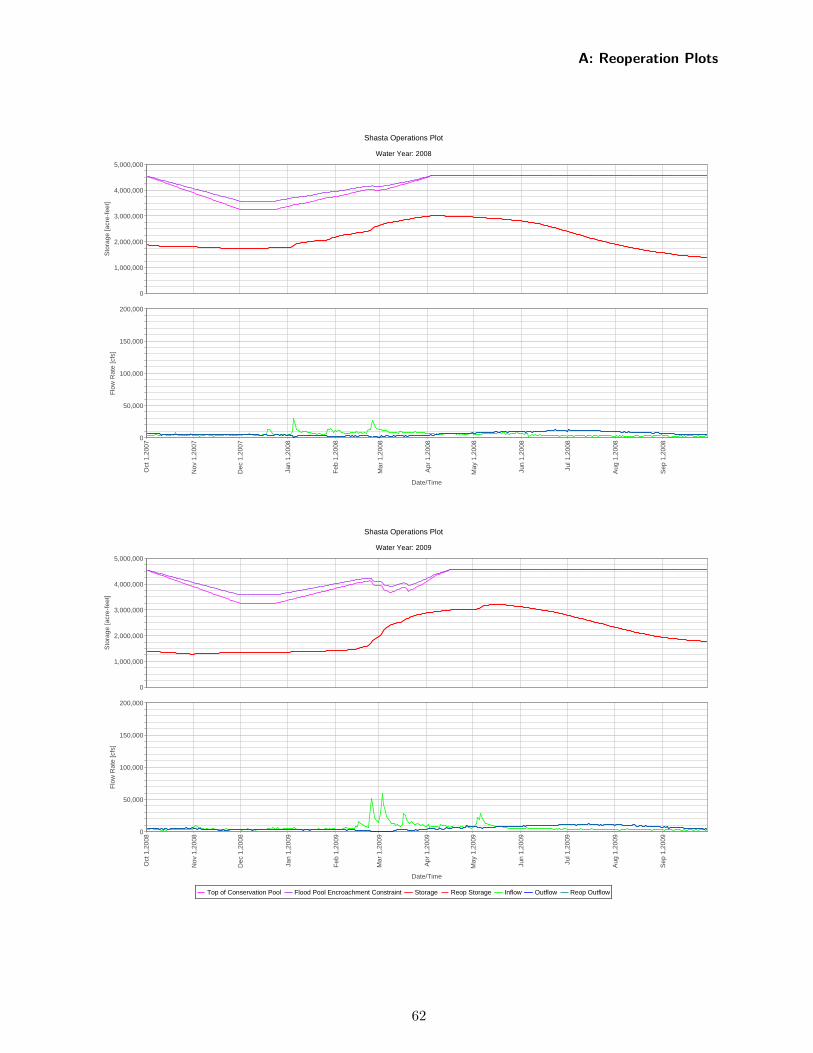
Shasta Operations Plot
Water Year: 2008
Top of Conservation Pool Flood Pool Encroachment Constraint Storage Reop Storage Inflow Outflow Reop Outflow
Oct
1,2
007
Nov
1,2
007
Dec
1,2
007
Jan
1,20
08
Feb
1,2
008
Mar
1,2
008
Apr
1,2
008
May
1,2
008
Jun
1,20
08
Jul 1
,200
8
Aug
1,2
008
Sep
1,2
008
Date/Time
0
1,000,000
2,000,000
3,000,000
4,000,000
5,000,000
Sto
rage
[acr
e-fe
et]
0
50,000
100,000
150,000
200,000
Flo
w R
ate
[cfs
]
Shasta Operations Plot
Water Year: 2009
Top of Conservation Pool Flood Pool Encroachment Constraint Storage Reop Storage Inflow Outflow Reop Outflow
Oct
1,2
008
Nov
1,2
008
Dec
1,2
008
Jan
1,20
09
Feb
1,2
009
Mar
1,2
009
Apr
1,2
009
May
1,2
009
Jun
1,20
09
Jul 1
,200
9
Aug
1,2
009
Sep
1,2
009
Date/Time
0
1,000,000
2,000,000
3,000,000
4,000,000
5,000,000
Sto
rage
[acr
e-fe
et]
0
50,000
100,000
150,000
200,000
Flo
w R
ate
[cfs
]
A: Reoperation Plots
62
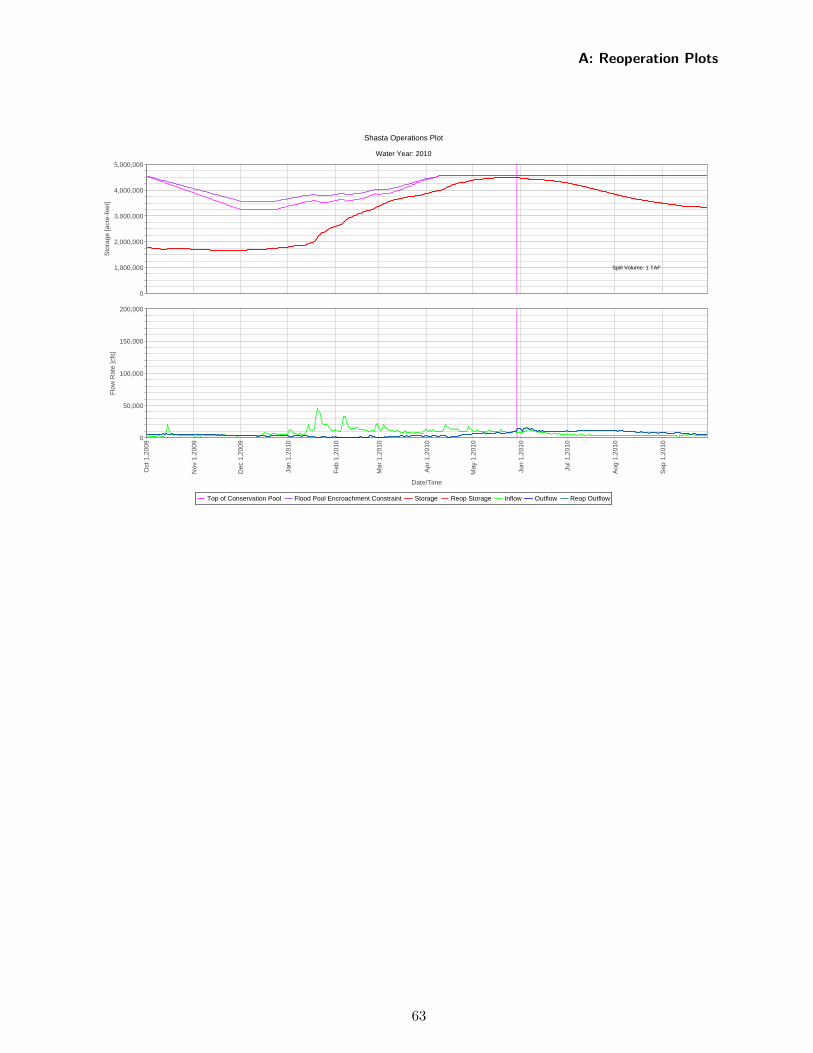
Shasta Operations Plot
Water Year: 2010
Top of Conservation Pool Flood Pool Encroachment Constraint Storage Reop Storage Inflow Outflow Reop Outflow
Oct
1,2
009
Nov
1,2
009
Dec
1,2
009
Jan
1,20
10
Feb
1,2
010
Mar
1,2
010
Apr
1,2
010
May
1,2
010
Jun
1,20
10
Jul 1
,201
0
Aug
1,2
010
Sep
1,2
010
Date/Time
0
1,000,000
2,000,000
3,000,000
4,000,000
5,000,000
Sto
rage
[acr
e-fe
et]
Spill Volume: 1 TAF
0
50,000
100,000
150,000
200,000
Flo
w R
ate
[cfs
]
A: Reoperation Plots
63

A: Reoperation Plots
A.2 Oroville
The following section includes the reoperation plots for Oroville Dam.
64
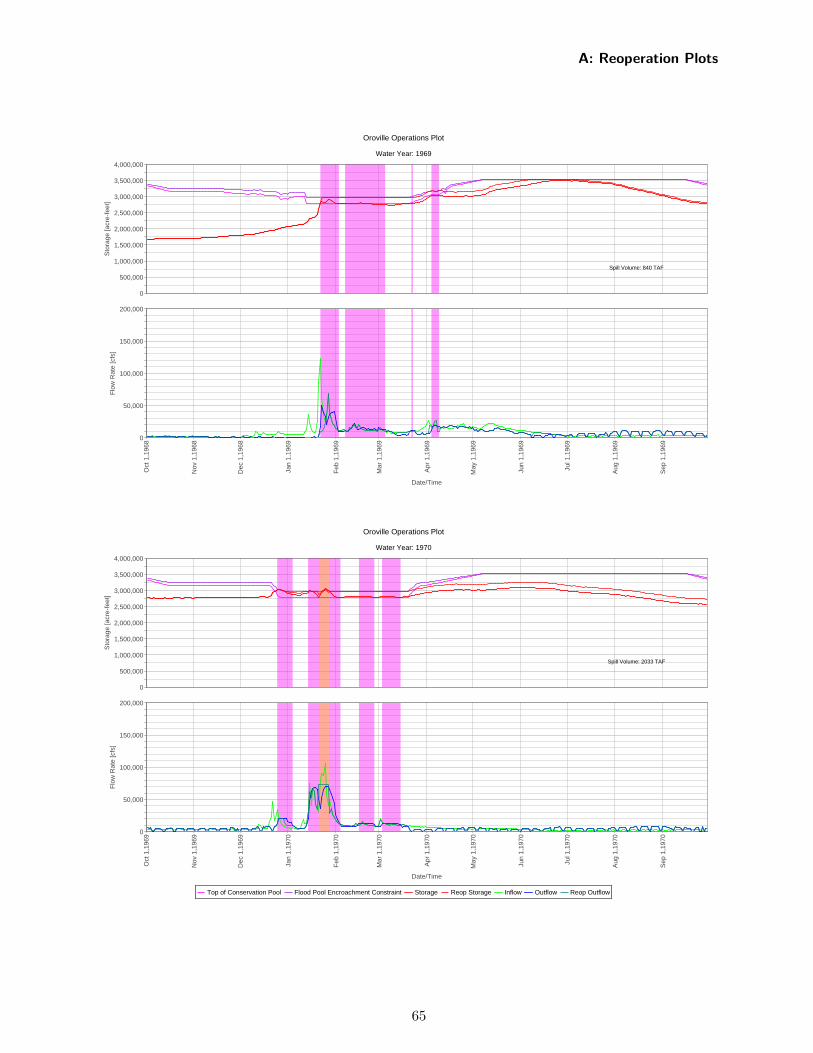
Oroville Operations Plot
Water Year: 1969
Top of Conservation Pool Flood Pool Encroachment Constraint Storage Reop Storage Inflow Outflow Reop Outflow
Oct
1,1
968
Nov
1,1
968
Dec
1,1
968
Jan
1,19
69
Feb
1,1
969
Mar
1,1
969
Apr
1,1
969
May
1,1
969
Jun
1,19
69
Jul 1
,196
9
Aug
1,1
969
Sep
1,1
969
Date/Time
0
500,000
1,000,000
1,500,000
2,000,000
2,500,000
3,000,000
3,500,000
4,000,000
Sto
rage
[acr
e-fe
et]
Spill Volume: 840 TAF
0
50,000
100,000
150,000
200,000
Flo
w R
ate
[cfs
]
Oroville Operations Plot
Water Year: 1970
Top of Conservation Pool Flood Pool Encroachment Constraint Storage Reop Storage Inflow Outflow Reop Outflow
Oct
1,1
969
Nov
1,1
969
Dec
1,1
969
Jan
1,19
70
Feb
1,1
970
Mar
1,1
970
Apr
1,1
970
May
1,1
970
Jun
1,19
70
Jul 1
,197
0
Aug
1,1
970
Sep
1,1
970
Date/Time
0
500,000
1,000,000
1,500,000
2,000,000
2,500,000
3,000,000
3,500,000
4,000,000
Sto
rage
[acr
e-fe
et]
Spill Volume: 2033 TAF
0
50,000
100,000
150,000
200,000
Flo
w R
ate
[cfs
]
A: Reoperation Plots
65
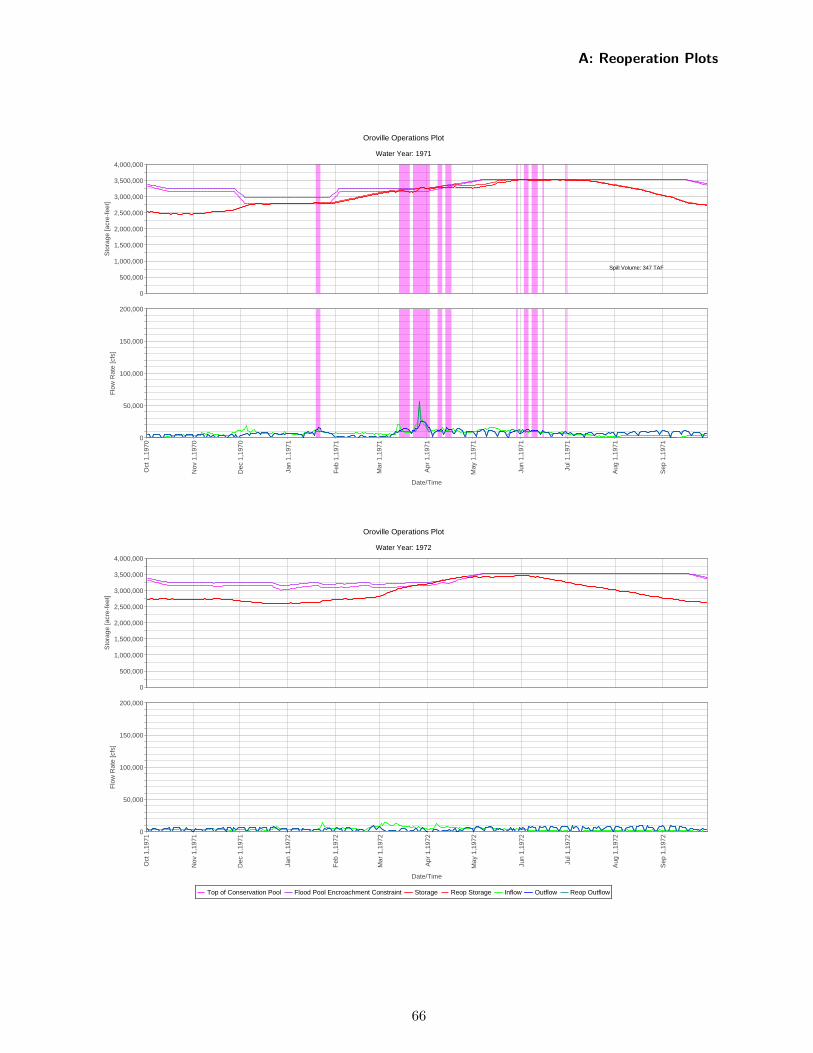
Oroville Operations Plot
Water Year: 1971
Top of Conservation Pool Flood Pool Encroachment Constraint Storage Reop Storage Inflow Outflow Reop Outflow
Oct
1,1
970
Nov
1,1
970
Dec
1,1
970
Jan
1,19
71
Feb
1,1
971
Mar
1,1
971
Apr
1,1
971
May
1,1
971
Jun
1,19
71
Jul 1
,197
1
Aug
1,1
971
Sep
1,1
971
Date/Time
0
500,000
1,000,000
1,500,000
2,000,000
2,500,000
3,000,000
3,500,000
4,000,000
Sto
rage
[acr
e-fe
et]
Spill Volume: 347 TAF
0
50,000
100,000
150,000
200,000
Flo
w R
ate
[cfs
]
Oroville Operations Plot
Water Year: 1972
Top of Conservation Pool Flood Pool Encroachment Constraint Storage Reop Storage Inflow Outflow Reop Outflow
Oct
1,1
971
Nov
1,1
971
Dec
1,1
971
Jan
1,19
72
Feb
1,1
972
Mar
1,1
972
Apr
1,1
972
May
1,1
972
Jun
1,19
72
Jul 1
,197
2
Aug
1,1
972
Sep
1,1
972
Date/Time
0
500,000
1,000,000
1,500,000
2,000,000
2,500,000
3,000,000
3,500,000
4,000,000
Sto
rage
[acr
e-fe
et]
0
50,000
100,000
150,000
200,000
Flo
w R
ate
[cfs
]
A: Reoperation Plots
66
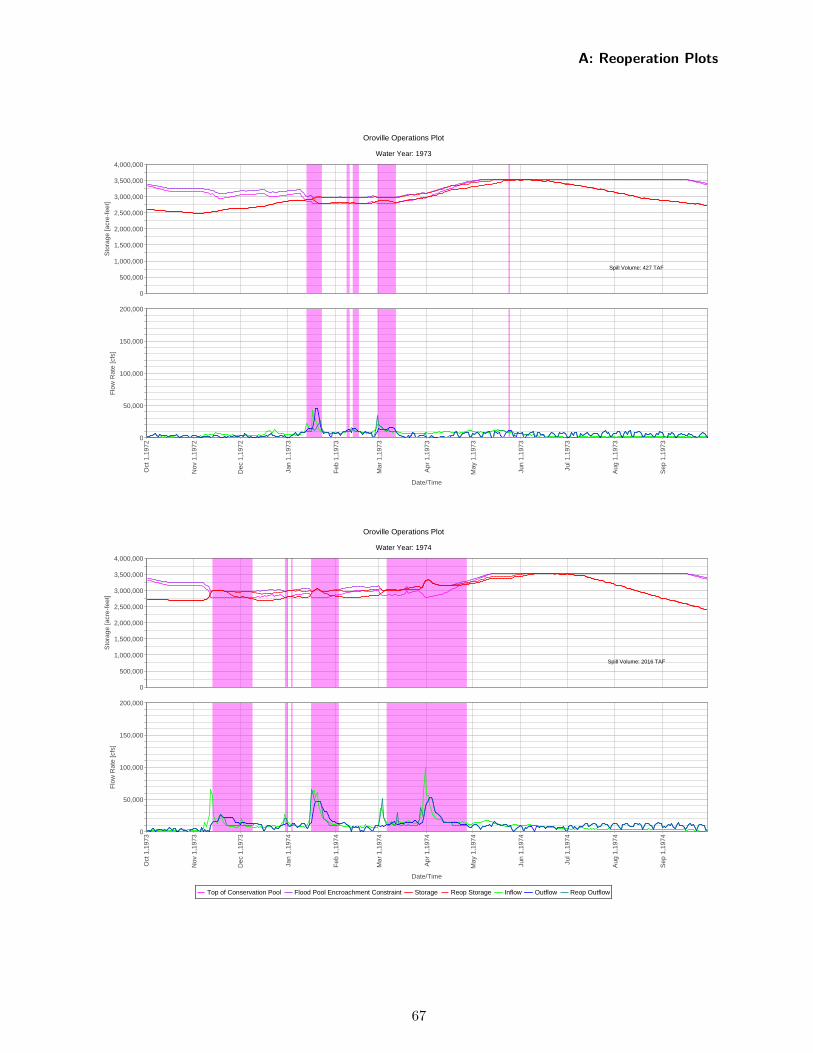
Oroville Operations Plot
Water Year: 1973
Top of Conservation Pool Flood Pool Encroachment Constraint Storage Reop Storage Inflow Outflow Reop Outflow
Oct
1,1
972
Nov
1,1
972
Dec
1,1
972
Jan
1,19
73
Feb
1,1
973
Mar
1,1
973
Apr
1,1
973
May
1,1
973
Jun
1,19
73
Jul 1
,197
3
Aug
1,1
973
Sep
1,1
973
Date/Time
0
500,000
1,000,000
1,500,000
2,000,000
2,500,000
3,000,000
3,500,000
4,000,000
Sto
rage
[acr
e-fe
et]
Spill Volume: 427 TAF
0
50,000
100,000
150,000
200,000
Flo
w R
ate
[cfs
]
Oroville Operations Plot
Water Year: 1974
Top of Conservation Pool Flood Pool Encroachment Constraint Storage Reop Storage Inflow Outflow Reop Outflow
Oct
1,1
973
Nov
1,1
973
Dec
1,1
973
Jan
1,19
74
Feb
1,1
974
Mar
1,1
974
Apr
1,1
974
May
1,1
974
Jun
1,19
74
Jul 1
,197
4
Aug
1,1
974
Sep
1,1
974
Date/Time
0
500,000
1,000,000
1,500,000
2,000,000
2,500,000
3,000,000
3,500,000
4,000,000
Sto
rage
[acr
e-fe
et]
Spill Volume: 2016 TAF
0
50,000
100,000
150,000
200,000
Flo
w R
ate
[cfs
]
A: Reoperation Plots
67
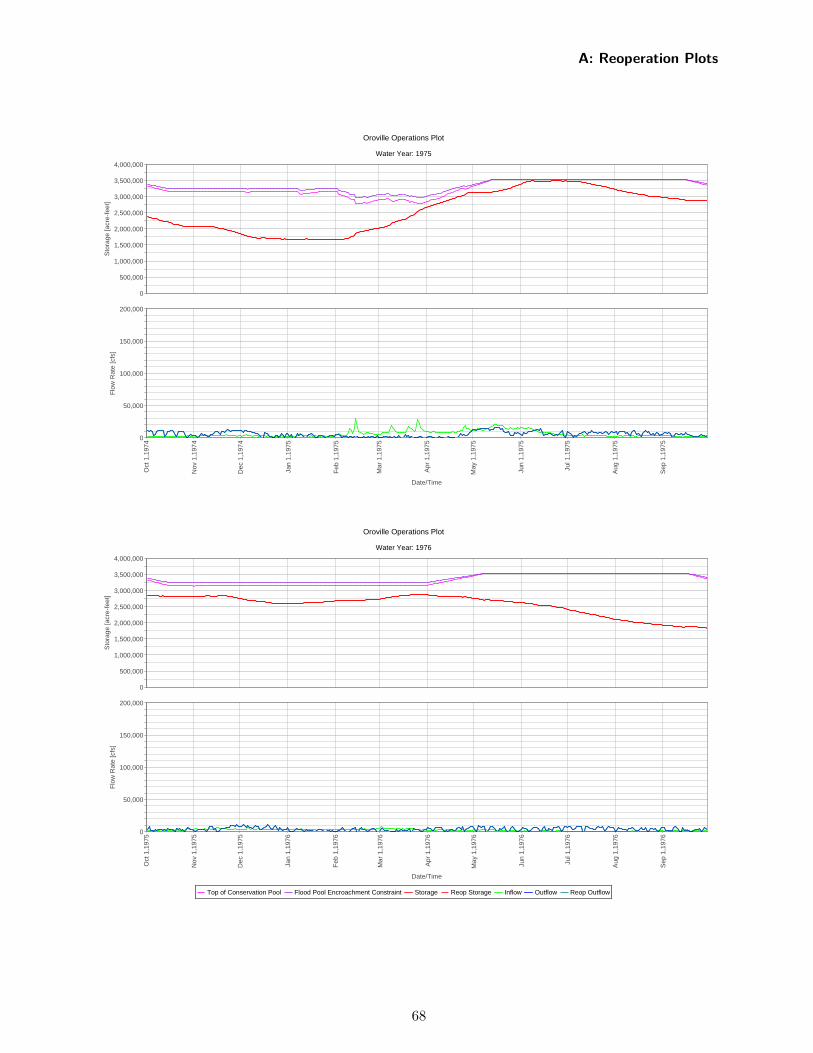
Oroville Operations Plot
Water Year: 1975
Top of Conservation Pool Flood Pool Encroachment Constraint Storage Reop Storage Inflow Outflow Reop Outflow
Oct
1,1
974
Nov
1,1
974
Dec
1,1
974
Jan
1,19
75
Feb
1,1
975
Mar
1,1
975
Apr
1,1
975
May
1,1
975
Jun
1,19
75
Jul 1
,197
5
Aug
1,1
975
Sep
1,1
975
Date/Time
0
500,000
1,000,000
1,500,000
2,000,000
2,500,000
3,000,000
3,500,000
4,000,000
Sto
rage
[acr
e-fe
et]
0
50,000
100,000
150,000
200,000
Flo
w R
ate
[cfs
]
Oroville Operations Plot
Water Year: 1976
Top of Conservation Pool Flood Pool Encroachment Constraint Storage Reop Storage Inflow Outflow Reop Outflow
Oct
1,1
975
Nov
1,1
975
Dec
1,1
975
Jan
1,19
76
Feb
1,1
976
Mar
1,1
976
Apr
1,1
976
May
1,1
976
Jun
1,19
76
Jul 1
,197
6
Aug
1,1
976
Sep
1,1
976
Date/Time
0
500,000
1,000,000
1,500,000
2,000,000
2,500,000
3,000,000
3,500,000
4,000,000
Sto
rage
[acr
e-fe
et]
0
50,000
100,000
150,000
200,000
Flo
w R
ate
[cfs
]
A: Reoperation Plots
68
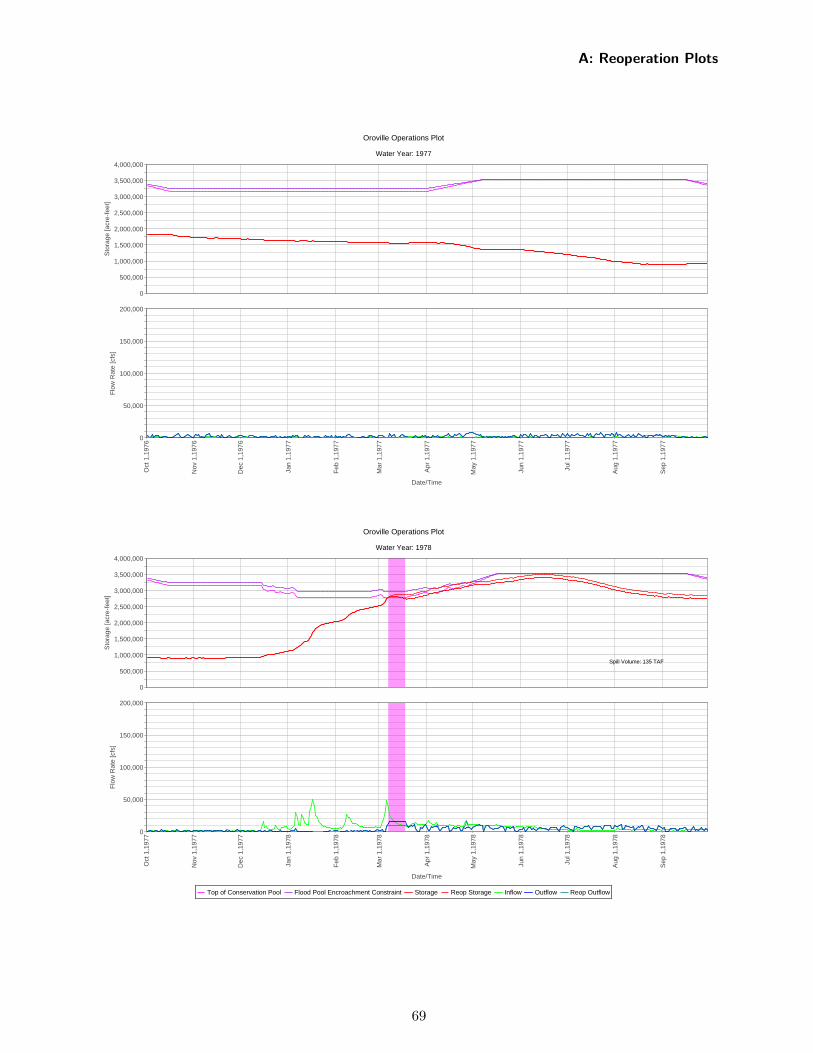
Oroville Operations Plot
Water Year: 1977
Top of Conservation Pool Flood Pool Encroachment Constraint Storage Reop Storage Inflow Outflow Reop Outflow
Oct
1,1
976
Nov
1,1
976
Dec
1,1
976
Jan
1,19
77
Feb
1,1
977
Mar
1,1
977
Apr
1,1
977
May
1,1
977
Jun
1,19
77
Jul 1
,197
7
Aug
1,1
977
Sep
1,1
977
Date/Time
0
500,000
1,000,000
1,500,000
2,000,000
2,500,000
3,000,000
3,500,000
4,000,000
Sto
rage
[acr
e-fe
et]
0
50,000
100,000
150,000
200,000
Flo
w R
ate
[cfs
]
Oroville Operations Plot
Water Year: 1978
Top of Conservation Pool Flood Pool Encroachment Constraint Storage Reop Storage Inflow Outflow Reop Outflow
Oct
1,1
977
Nov
1,1
977
Dec
1,1
977
Jan
1,19
78
Feb
1,1
978
Mar
1,1
978
Apr
1,1
978
May
1,1
978
Jun
1,19
78
Jul 1
,197
8
Aug
1,1
978
Sep
1,1
978
Date/Time
0
500,000
1,000,000
1,500,000
2,000,000
2,500,000
3,000,000
3,500,000
4,000,000
Sto
rage
[acr
e-fe
et]
Spill Volume: 135 TAF
0
50,000
100,000
150,000
200,000
Flo
w R
ate
[cfs
]
A: Reoperation Plots
69

Oroville Operations Plot
Water Year: 1979
Top of Conservation Pool Flood Pool Encroachment Constraint Storage Reop Storage Inflow Outflow Reop Outflow
Oct
1,1
978
Nov
1,1
978
Dec
1,1
978
Jan
1,19
79
Feb
1,1
979
Mar
1,1
979
Apr
1,1
979
May
1,1
979
Jun
1,19
79
Jul 1
,197
9
Aug
1,1
979
Sep
1,1
979
Date/Time
0
500,000
1,000,000
1,500,000
2,000,000
2,500,000
3,000,000
3,500,000
4,000,000
Sto
rage
[acr
e-fe
et]
Spill Volume: 46 TAF
0
50,000
100,000
150,000
200,000
Flo
w R
ate
[cfs
]
Oroville Operations Plot
Water Year: 1980
Top of Conservation Pool Flood Pool Encroachment Constraint Storage Reop Storage Inflow Outflow Reop Outflow
Oct
1,1
979
Nov
1,1
979
Dec
1,1
979
Jan
1,19
80
Feb
1,1
980
Mar
1,1
980
Apr
1,1
980
May
1,1
980
Jun
1,19
80
Jul 1
,198
0
Aug
1,1
980
Sep
1,1
980
Date/Time
0
500,000
1,000,000
1,500,000
2,000,000
2,500,000
3,000,000
3,500,000
4,000,000
Sto
rage
[acr
e-fe
et]
Spill Volume: 1453 TAF
0
50,000
100,000
150,000
200,000
Flo
w R
ate
[cfs
]
A: Reoperation Plots
70
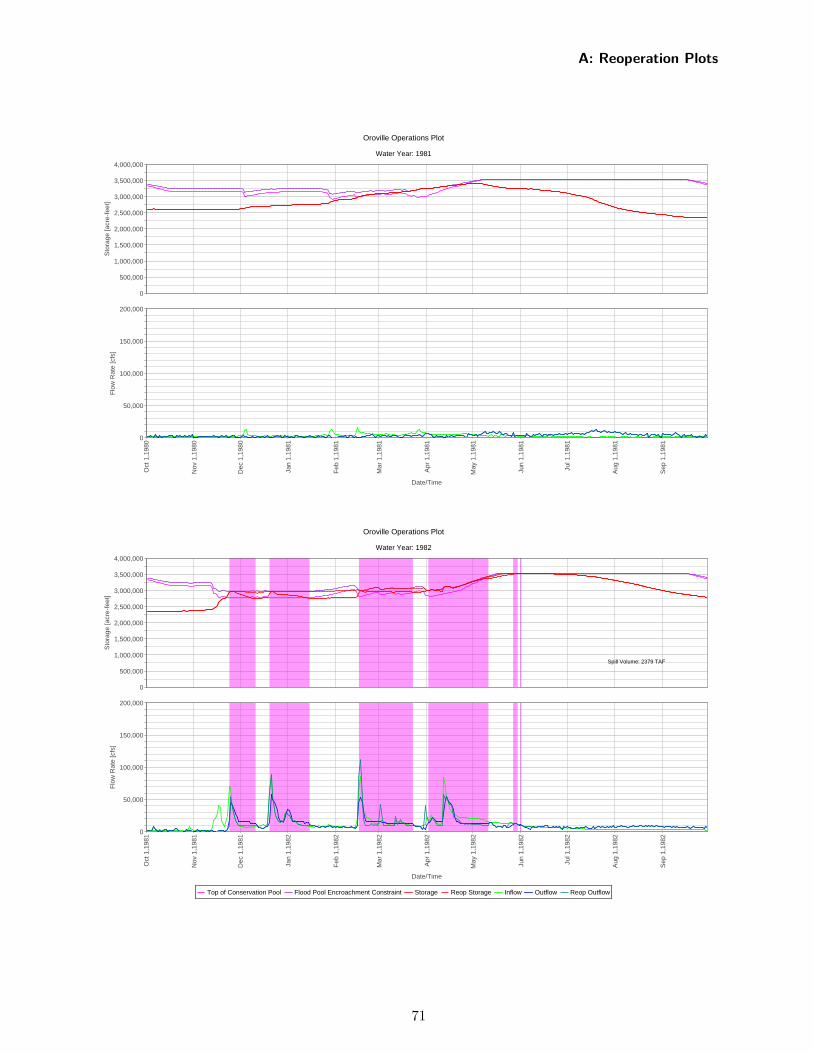
Oroville Operations Plot
Water Year: 1981
Top of Conservation Pool Flood Pool Encroachment Constraint Storage Reop Storage Inflow Outflow Reop Outflow
Oct
1,1
980
Nov
1,1
980
Dec
1,1
980
Jan
1,19
81
Feb
1,1
981
Mar
1,1
981
Apr
1,1
981
May
1,1
981
Jun
1,19
81
Jul 1
,198
1
Aug
1,1
981
Sep
1,1
981
Date/Time
0
500,000
1,000,000
1,500,000
2,000,000
2,500,000
3,000,000
3,500,000
4,000,000
Sto
rage
[acr
e-fe
et]
0
50,000
100,000
150,000
200,000
Flo
w R
ate
[cfs
]
Oroville Operations Plot
Water Year: 1982
Top of Conservation Pool Flood Pool Encroachment Constraint Storage Reop Storage Inflow Outflow Reop Outflow
Oct
1,1
981
Nov
1,1
981
Dec
1,1
981
Jan
1,19
82
Feb
1,1
982
Mar
1,1
982
Apr
1,1
982
May
1,1
982
Jun
1,19
82
Jul 1
,198
2
Aug
1,1
982
Sep
1,1
982
Date/Time
0
500,000
1,000,000
1,500,000
2,000,000
2,500,000
3,000,000
3,500,000
4,000,000
Sto
rage
[acr
e-fe
et]
Spill Volume: 2379 TAF
0
50,000
100,000
150,000
200,000
Flo
w R
ate
[cfs
]
A: Reoperation Plots
71
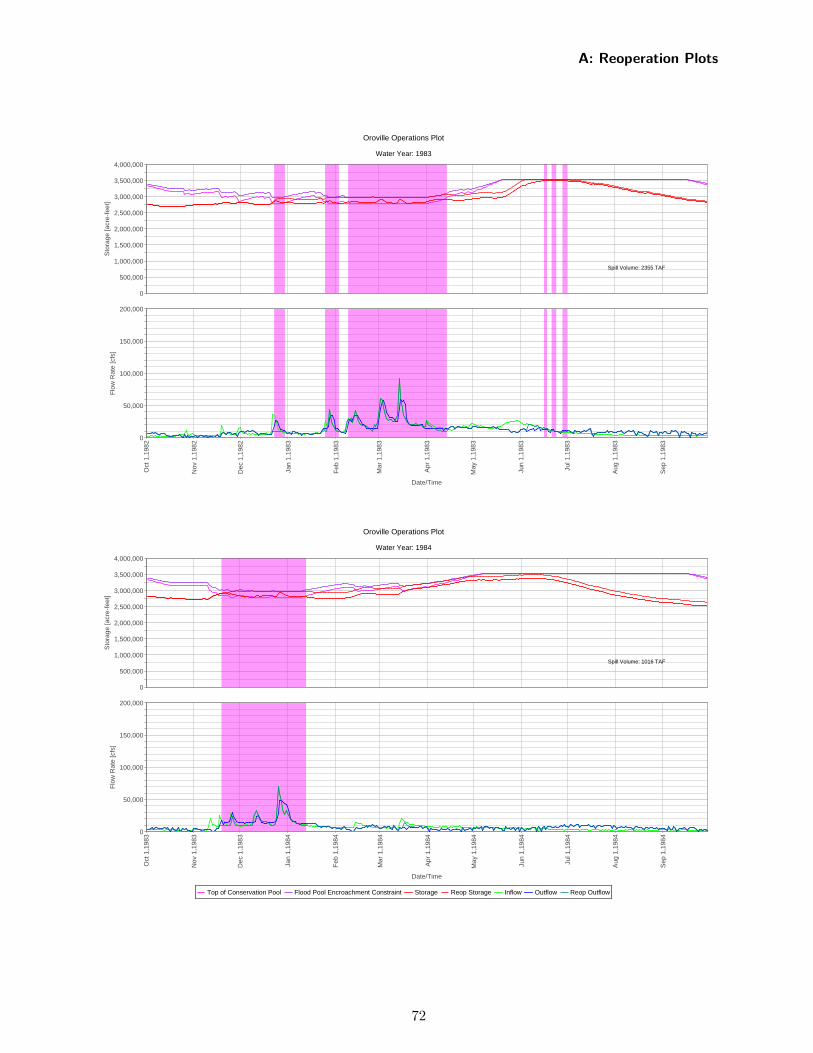
Oroville Operations Plot
Water Year: 1983
Top of Conservation Pool Flood Pool Encroachment Constraint Storage Reop Storage Inflow Outflow Reop Outflow
Oct
1,1
982
Nov
1,1
982
Dec
1,1
982
Jan
1,19
83
Feb
1,1
983
Mar
1,1
983
Apr
1,1
983
May
1,1
983
Jun
1,19
83
Jul 1
,198
3
Aug
1,1
983
Sep
1,1
983
Date/Time
0
500,000
1,000,000
1,500,000
2,000,000
2,500,000
3,000,000
3,500,000
4,000,000
Sto
rage
[acr
e-fe
et]
Spill Volume: 2355 TAF
0
50,000
100,000
150,000
200,000
Flo
w R
ate
[cfs
]
Oroville Operations Plot
Water Year: 1984
Top of Conservation Pool Flood Pool Encroachment Constraint Storage Reop Storage Inflow Outflow Reop Outflow
Oct
1,1
983
Nov
1,1
983
Dec
1,1
983
Jan
1,19
84
Feb
1,1
984
Mar
1,1
984
Apr
1,1
984
May
1,1
984
Jun
1,19
84
Jul 1
,198
4
Aug
1,1
984
Sep
1,1
984
Date/Time
0
500,000
1,000,000
1,500,000
2,000,000
2,500,000
3,000,000
3,500,000
4,000,000
Sto
rage
[acr
e-fe
et]
Spill Volume: 1016 TAF
0
50,000
100,000
150,000
200,000
Flo
w R
ate
[cfs
]
A: Reoperation Plots
72
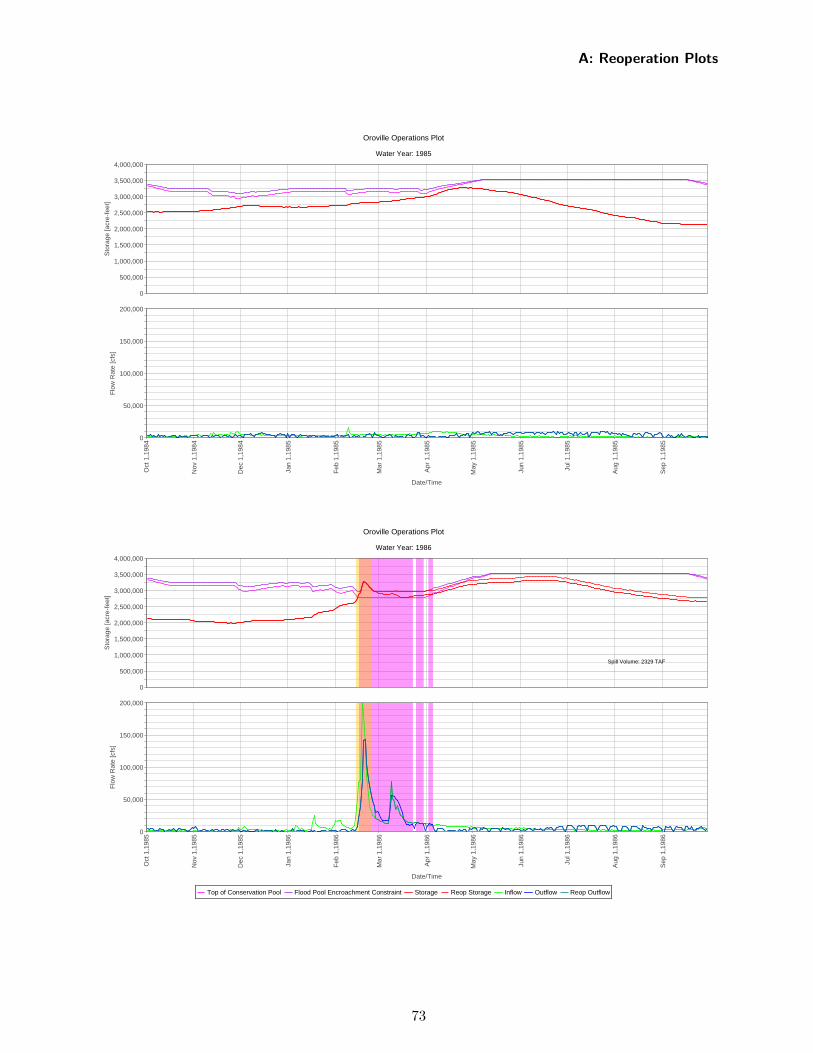
Oroville Operations Plot
Water Year: 1985
Top of Conservation Pool Flood Pool Encroachment Constraint Storage Reop Storage Inflow Outflow Reop Outflow
Oct
1,1
984
Nov
1,1
984
Dec
1,1
984
Jan
1,19
85
Feb
1,1
985
Mar
1,1
985
Apr
1,1
985
May
1,1
985
Jun
1,19
85
Jul 1
,198
5
Aug
1,1
985
Sep
1,1
985
Date/Time
0
500,000
1,000,000
1,500,000
2,000,000
2,500,000
3,000,000
3,500,000
4,000,000
Sto
rage
[acr
e-fe
et]
0
50,000
100,000
150,000
200,000
Flo
w R
ate
[cfs
]
Oroville Operations Plot
Water Year: 1986
Top of Conservation Pool Flood Pool Encroachment Constraint Storage Reop Storage Inflow Outflow Reop Outflow
Oct
1,1
985
Nov
1,1
985
Dec
1,1
985
Jan
1,19
86
Feb
1,1
986
Mar
1,1
986
Apr
1,1
986
May
1,1
986
Jun
1,19
86
Jul 1
,198
6
Aug
1,1
986
Sep
1,1
986
Date/Time
0
500,000
1,000,000
1,500,000
2,000,000
2,500,000
3,000,000
3,500,000
4,000,000
Sto
rage
[acr
e-fe
et]
Spill Volume: 2329 TAF
0
50,000
100,000
150,000
200,000
Flo
w R
ate
[cfs
]
A: Reoperation Plots
73
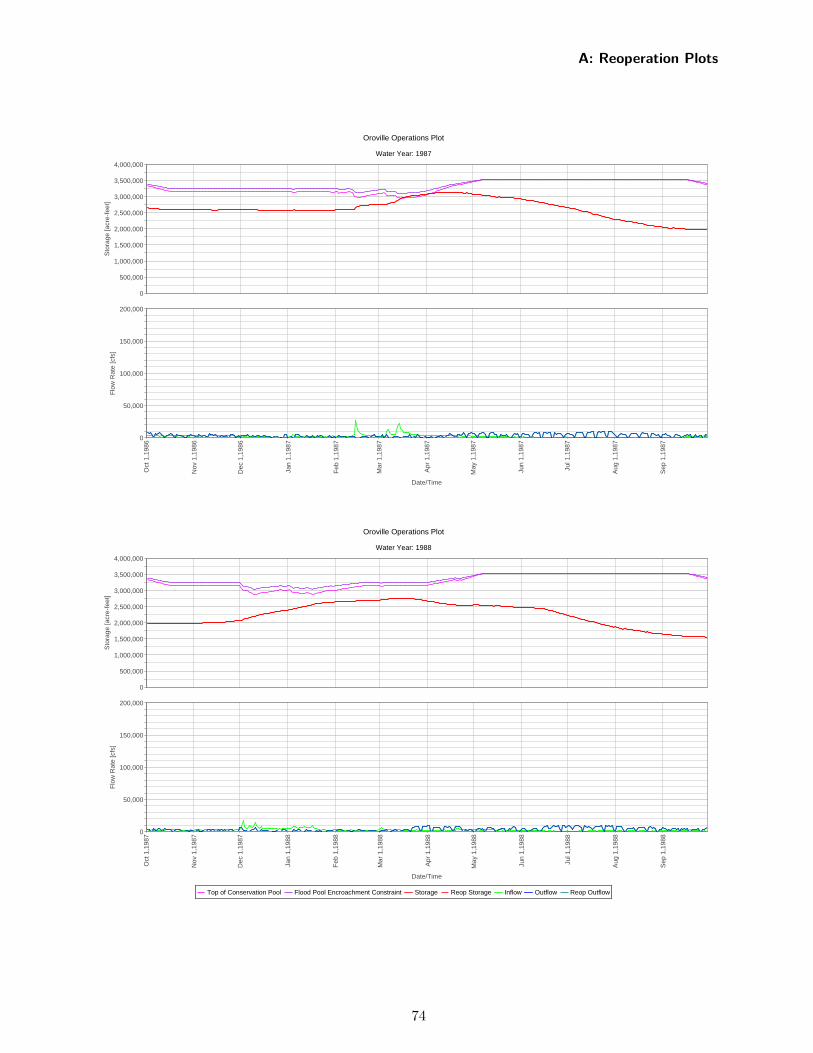
Oroville Operations Plot
Water Year: 1987
Top of Conservation Pool Flood Pool Encroachment Constraint Storage Reop Storage Inflow Outflow Reop Outflow
Oct
1,1
986
Nov
1,1
986
Dec
1,1
986
Jan
1,19
87
Feb
1,1
987
Mar
1,1
987
Apr
1,1
987
May
1,1
987
Jun
1,19
87
Jul 1
,198
7
Aug
1,1
987
Sep
1,1
987
Date/Time
0
500,000
1,000,000
1,500,000
2,000,000
2,500,000
3,000,000
3,500,000
4,000,000
Sto
rage
[acr
e-fe
et]
0
50,000
100,000
150,000
200,000
Flo
w R
ate
[cfs
]
Oroville Operations Plot
Water Year: 1988
Top of Conservation Pool Flood Pool Encroachment Constraint Storage Reop Storage Inflow Outflow Reop Outflow
Oct
1,1
987
Nov
1,1
987
Dec
1,1
987
Jan
1,19
88
Feb
1,1
988
Mar
1,1
988
Apr
1,1
988
May
1,1
988
Jun
1,19
88
Jul 1
,198
8
Aug
1,1
988
Sep
1,1
988
Date/Time
0
500,000
1,000,000
1,500,000
2,000,000
2,500,000
3,000,000
3,500,000
4,000,000
Sto
rage
[acr
e-fe
et]
0
50,000
100,000
150,000
200,000
Flo
w R
ate
[cfs
]
A: Reoperation Plots
74
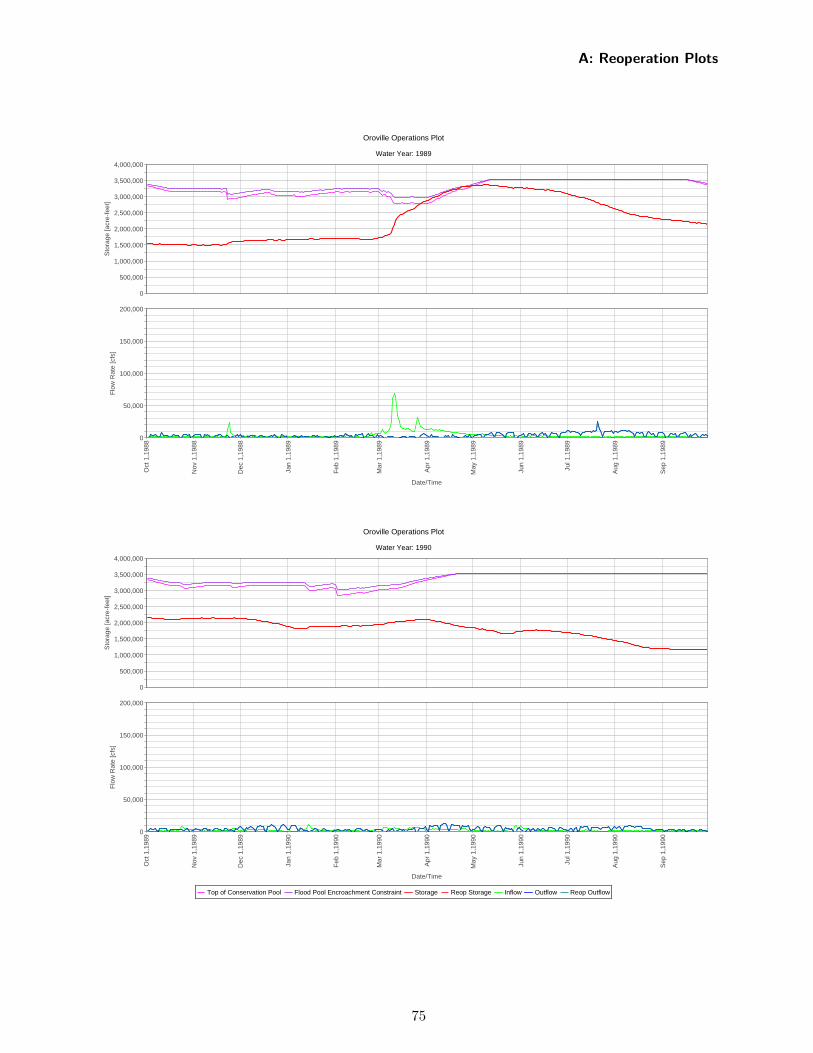
Oroville Operations Plot
Water Year: 1989
Top of Conservation Pool Flood Pool Encroachment Constraint Storage Reop Storage Inflow Outflow Reop Outflow
Oct
1,1
988
Nov
1,1
988
Dec
1,1
988
Jan
1,19
89
Feb
1,1
989
Mar
1,1
989
Apr
1,1
989
May
1,1
989
Jun
1,19
89
Jul 1
,198
9
Aug
1,1
989
Sep
1,1
989
Date/Time
0
500,000
1,000,000
1,500,000
2,000,000
2,500,000
3,000,000
3,500,000
4,000,000
Sto
rage
[acr
e-fe
et]
0
50,000
100,000
150,000
200,000
Flo
w R
ate
[cfs
]
Oroville Operations Plot
Water Year: 1990
Top of Conservation Pool Flood Pool Encroachment Constraint Storage Reop Storage Inflow Outflow Reop Outflow
Oct
1,1
989
Nov
1,1
989
Dec
1,1
989
Jan
1,19
90
Feb
1,1
990
Mar
1,1
990
Apr
1,1
990
May
1,1
990
Jun
1,19
90
Jul 1
,199
0
Aug
1,1
990
Sep
1,1
990
Date/Time
0
500,000
1,000,000
1,500,000
2,000,000
2,500,000
3,000,000
3,500,000
4,000,000
Sto
rage
[acr
e-fe
et]
0
50,000
100,000
150,000
200,000
Flo
w R
ate
[cfs
]
A: Reoperation Plots
75
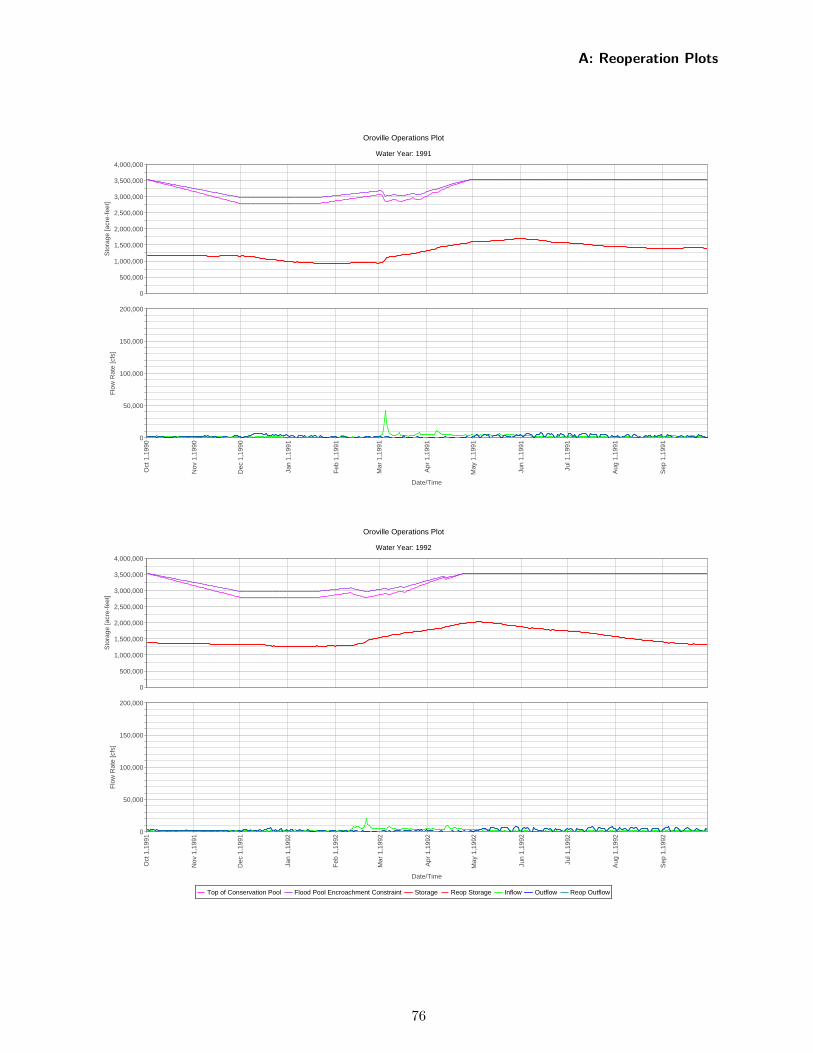
Oroville Operations Plot
Water Year: 1991
Top of Conservation Pool Flood Pool Encroachment Constraint Storage Reop Storage Inflow Outflow Reop Outflow
Oct
1,1
990
Nov
1,1
990
Dec
1,1
990
Jan
1,19
91
Feb
1,1
991
Mar
1,1
991
Apr
1,1
991
May
1,1
991
Jun
1,19
91
Jul 1
,199
1
Aug
1,1
991
Sep
1,1
991
Date/Time
0
500,000
1,000,000
1,500,000
2,000,000
2,500,000
3,000,000
3,500,000
4,000,000
Sto
rage
[acr
e-fe
et]
0
50,000
100,000
150,000
200,000
Flo
w R
ate
[cfs
]
Oroville Operations Plot
Water Year: 1992
Top of Conservation Pool Flood Pool Encroachment Constraint Storage Reop Storage Inflow Outflow Reop Outflow
Oct
1,1
991
Nov
1,1
991
Dec
1,1
991
Jan
1,19
92
Feb
1,1
992
Mar
1,1
992
Apr
1,1
992
May
1,1
992
Jun
1,19
92
Jul 1
,199
2
Aug
1,1
992
Sep
1,1
992
Date/Time
0
500,000
1,000,000
1,500,000
2,000,000
2,500,000
3,000,000
3,500,000
4,000,000
Sto
rage
[acr
e-fe
et]
0
50,000
100,000
150,000
200,000
Flo
w R
ate
[cfs
]
A: Reoperation Plots
76
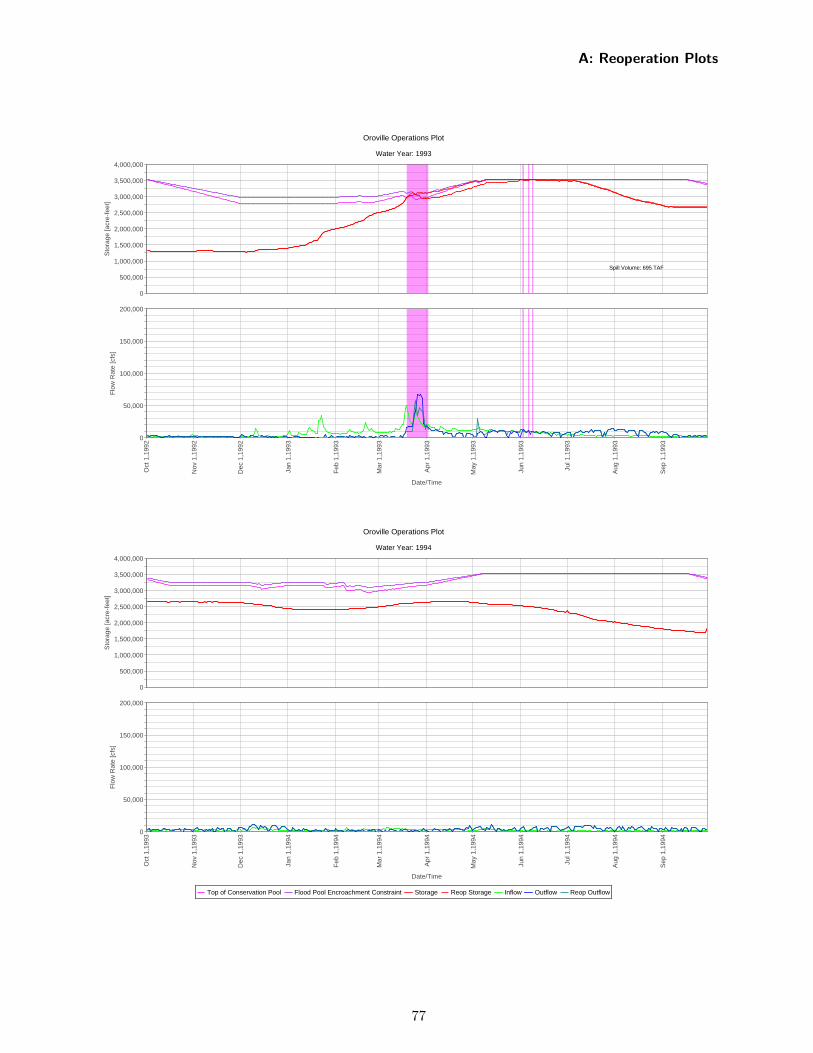
Oroville Operations Plot
Water Year: 1993
Top of Conservation Pool Flood Pool Encroachment Constraint Storage Reop Storage Inflow Outflow Reop Outflow
Oct
1,1
992
Nov
1,1
992
Dec
1,1
992
Jan
1,19
93
Feb
1,1
993
Mar
1,1
993
Apr
1,1
993
May
1,1
993
Jun
1,19
93
Jul 1
,199
3
Aug
1,1
993
Sep
1,1
993
Date/Time
0
500,000
1,000,000
1,500,000
2,000,000
2,500,000
3,000,000
3,500,000
4,000,000
Sto
rage
[acr
e-fe
et]
Spill Volume: 695 TAF
0
50,000
100,000
150,000
200,000
Flo
w R
ate
[cfs
]
Oroville Operations Plot
Water Year: 1994
Top of Conservation Pool Flood Pool Encroachment Constraint Storage Reop Storage Inflow Outflow Reop Outflow
Oct
1,1
993
Nov
1,1
993
Dec
1,1
993
Jan
1,19
94
Feb
1,1
994
Mar
1,1
994
Apr
1,1
994
May
1,1
994
Jun
1,19
94
Jul 1
,199
4
Aug
1,1
994
Sep
1,1
994
Date/Time
0
500,000
1,000,000
1,500,000
2,000,000
2,500,000
3,000,000
3,500,000
4,000,000
Sto
rage
[acr
e-fe
et]
0
50,000
100,000
150,000
200,000
Flo
w R
ate
[cfs
]
A: Reoperation Plots
77
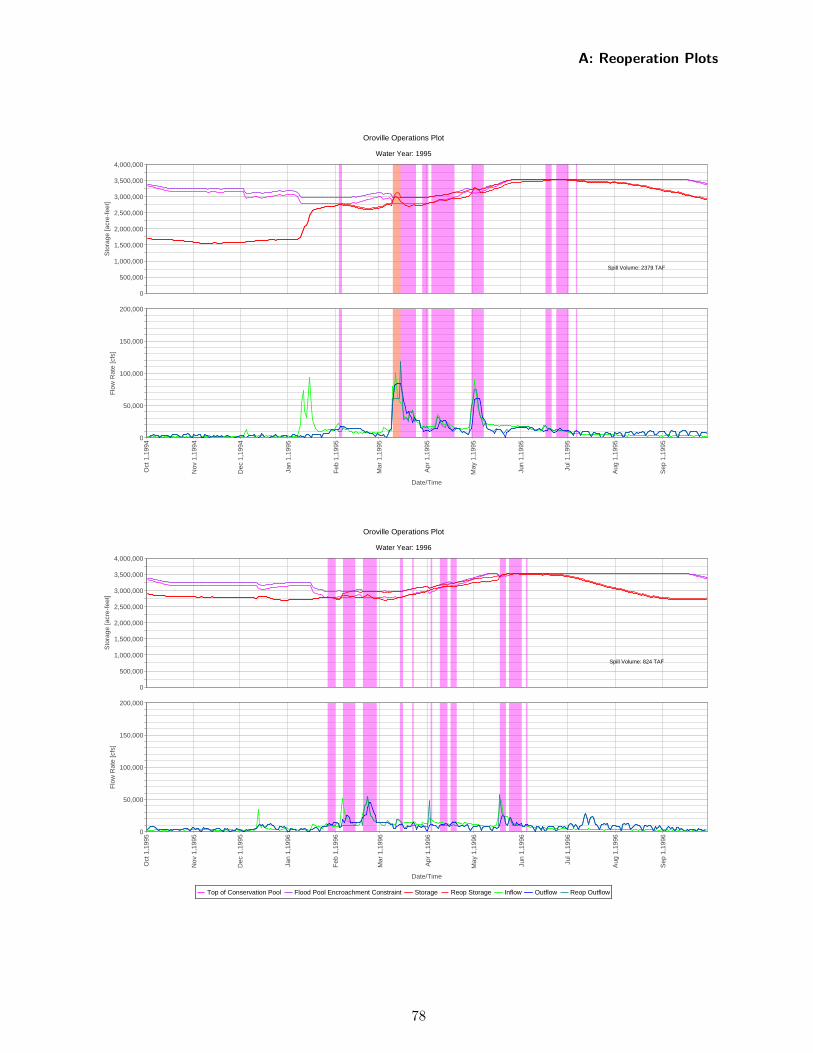
Oroville Operations Plot
Water Year: 1995
Top of Conservation Pool Flood Pool Encroachment Constraint Storage Reop Storage Inflow Outflow Reop Outflow
Oct
1,1
994
Nov
1,1
994
Dec
1,1
994
Jan
1,19
95
Feb
1,1
995
Mar
1,1
995
Apr
1,1
995
May
1,1
995
Jun
1,19
95
Jul 1
,199
5
Aug
1,1
995
Sep
1,1
995
Date/Time
0
500,000
1,000,000
1,500,000
2,000,000
2,500,000
3,000,000
3,500,000
4,000,000
Sto
rage
[acr
e-fe
et]
Spill Volume: 2379 TAF
0
50,000
100,000
150,000
200,000
Flo
w R
ate
[cfs
]
Oroville Operations Plot
Water Year: 1996
Top of Conservation Pool Flood Pool Encroachment Constraint Storage Reop Storage Inflow Outflow Reop Outflow
Oct
1,1
995
Nov
1,1
995
Dec
1,1
995
Jan
1,19
96
Feb
1,1
996
Mar
1,1
996
Apr
1,1
996
May
1,1
996
Jun
1,19
96
Jul 1
,199
6
Aug
1,1
996
Sep
1,1
996
Date/Time
0
500,000
1,000,000
1,500,000
2,000,000
2,500,000
3,000,000
3,500,000
4,000,000
Sto
rage
[acr
e-fe
et]
Spill Volume: 824 TAF
0
50,000
100,000
150,000
200,000
Flo
w R
ate
[cfs
]
A: Reoperation Plots
78
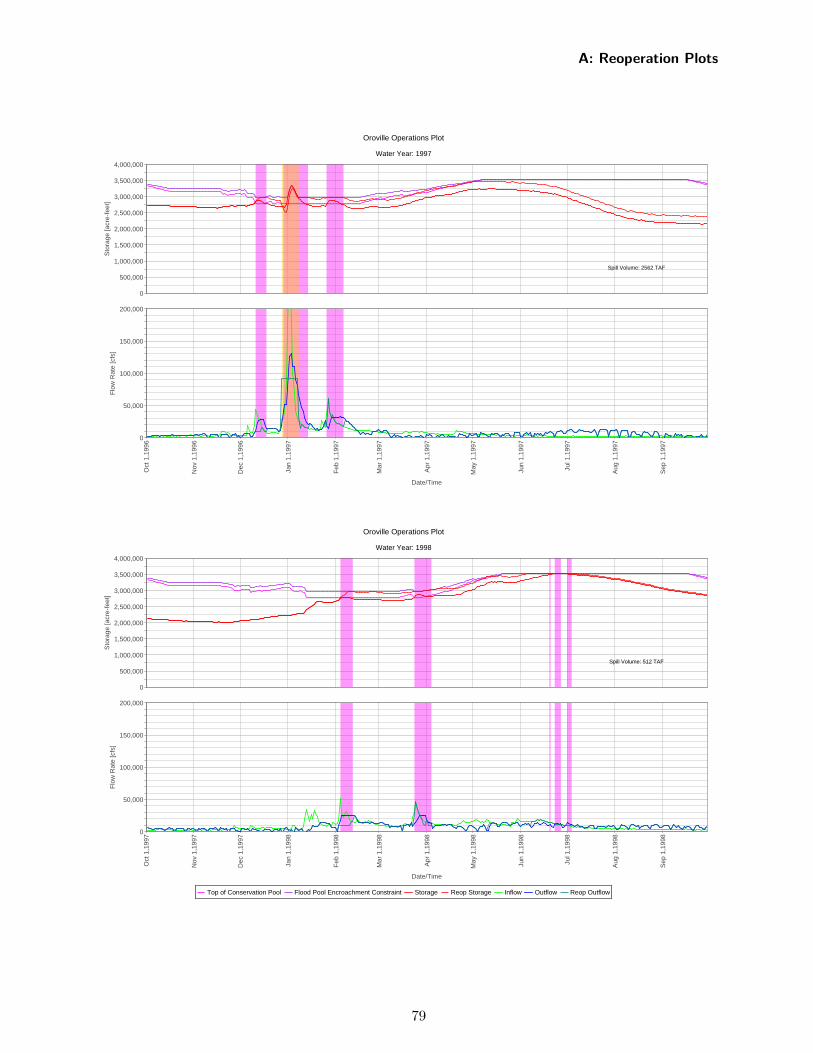
Oroville Operations Plot
Water Year: 1997
Top of Conservation Pool Flood Pool Encroachment Constraint Storage Reop Storage Inflow Outflow Reop Outflow
Oct
1,1
996
Nov
1,1
996
Dec
1,1
996
Jan
1,19
97
Feb
1,1
997
Mar
1,1
997
Apr
1,1
997
May
1,1
997
Jun
1,19
97
Jul 1
,199
7
Aug
1,1
997
Sep
1,1
997
Date/Time
0
500,000
1,000,000
1,500,000
2,000,000
2,500,000
3,000,000
3,500,000
4,000,000
Sto
rage
[acr
e-fe
et]
Spill Volume: 2562 TAF
0
50,000
100,000
150,000
200,000
Flo
w R
ate
[cfs
]
Oroville Operations Plot
Water Year: 1998
Top of Conservation Pool Flood Pool Encroachment Constraint Storage Reop Storage Inflow Outflow Reop Outflow
Oct
1,1
997
Nov
1,1
997
Dec
1,1
997
Jan
1,19
98
Feb
1,1
998
Mar
1,1
998
Apr
1,1
998
May
1,1
998
Jun
1,19
98
Jul 1
,199
8
Aug
1,1
998
Sep
1,1
998
Date/Time
0
500,000
1,000,000
1,500,000
2,000,000
2,500,000
3,000,000
3,500,000
4,000,000
Sto
rage
[acr
e-fe
et]
Spill Volume: 512 TAF
0
50,000
100,000
150,000
200,000
Flo
w R
ate
[cfs
]
A: Reoperation Plots
79
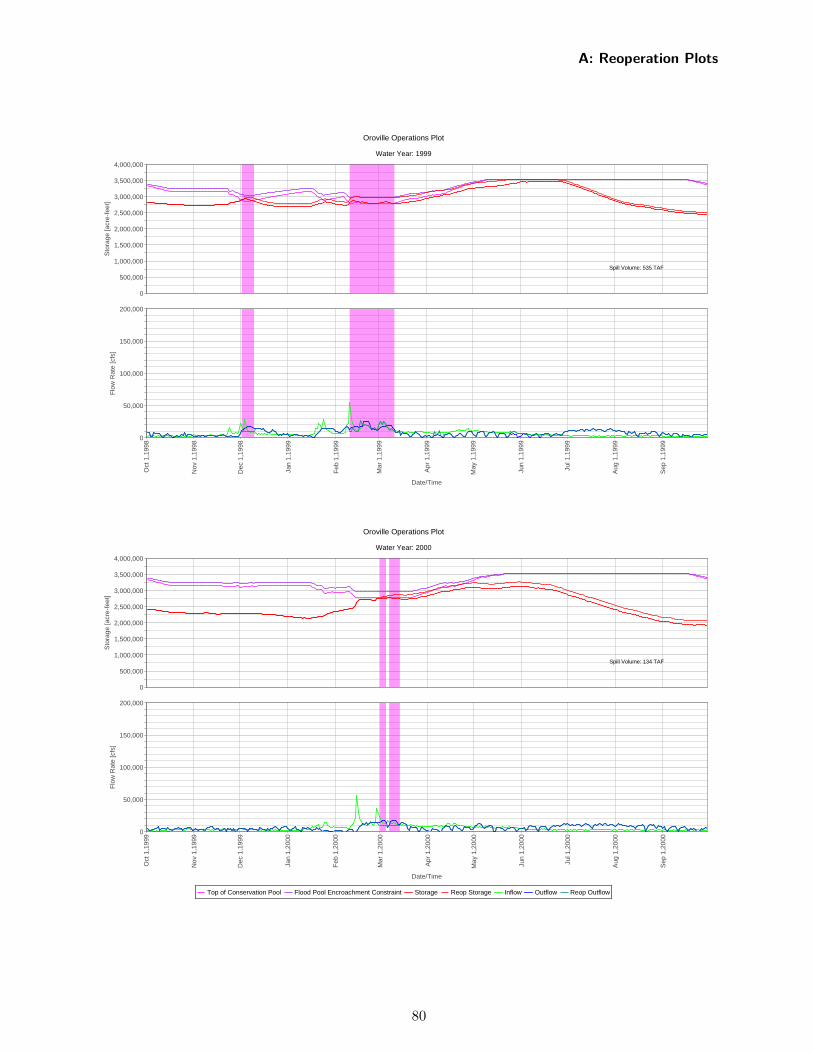
Oroville Operations Plot
Water Year: 1999
Top of Conservation Pool Flood Pool Encroachment Constraint Storage Reop Storage Inflow Outflow Reop Outflow
Oct
1,1
998
Nov
1,1
998
Dec
1,1
998
Jan
1,19
99
Feb
1,1
999
Mar
1,1
999
Apr
1,1
999
May
1,1
999
Jun
1,19
99
Jul 1
,199
9
Aug
1,1
999
Sep
1,1
999
Date/Time
0
500,000
1,000,000
1,500,000
2,000,000
2,500,000
3,000,000
3,500,000
4,000,000
Sto
rage
[acr
e-fe
et]
Spill Volume: 535 TAF
0
50,000
100,000
150,000
200,000
Flo
w R
ate
[cfs
]
Oroville Operations Plot
Water Year: 2000
Top of Conservation Pool Flood Pool Encroachment Constraint Storage Reop Storage Inflow Outflow Reop Outflow
Oct
1,1
999
Nov
1,1
999
Dec
1,1
999
Jan
1,20
00
Feb
1,2
000
Mar
1,2
000
Apr
1,2
000
May
1,2
000
Jun
1,20
00
Jul 1
,200
0
Aug
1,2
000
Sep
1,2
000
Date/Time
0
500,000
1,000,000
1,500,000
2,000,000
2,500,000
3,000,000
3,500,000
4,000,000
Sto
rage
[acr
e-fe
et]
Spill Volume: 134 TAF
0
50,000
100,000
150,000
200,000
Flo
w R
ate
[cfs
]
A: Reoperation Plots
80

Oroville Operations Plot
Water Year: 2001
Top of Conservation Pool Flood Pool Encroachment Constraint Storage Reop Storage Inflow Outflow Reop Outflow
Oct
1,2
000
Nov
1,2
000
Dec
1,2
000
Jan
1,20
01
Feb
1,2
001
Mar
1,2
001
Apr
1,2
001
May
1,2
001
Jun
1,20
01
Jul 1
,200
1
Aug
1,2
001
Sep
1,2
001
Date/Time
0
500,000
1,000,000
1,500,000
2,000,000
2,500,000
3,000,000
3,500,000
4,000,000
Sto
rage
[acr
e-fe
et]
0
50,000
100,000
150,000
200,000
Flo
w R
ate
[cfs
]
Oroville Operations Plot
Water Year: 2002
Top of Conservation Pool Flood Pool Encroachment Constraint Storage Reop Storage Inflow Outflow Reop Outflow
Oct
1,2
001
Nov
1,2
001
Dec
1,2
001
Jan
1,20
02
Feb
1,2
002
Mar
1,2
002
Apr
1,2
002
May
1,2
002
Jun
1,20
02
Jul 1
,200
2
Aug
1,2
002
Sep
1,2
002
Date/Time
0
500,000
1,000,000
1,500,000
2,000,000
2,500,000
3,000,000
3,500,000
4,000,000
Sto
rage
[acr
e-fe
et]
0
50,000
100,000
150,000
200,000
Flo
w R
ate
[cfs
]
A: Reoperation Plots
81
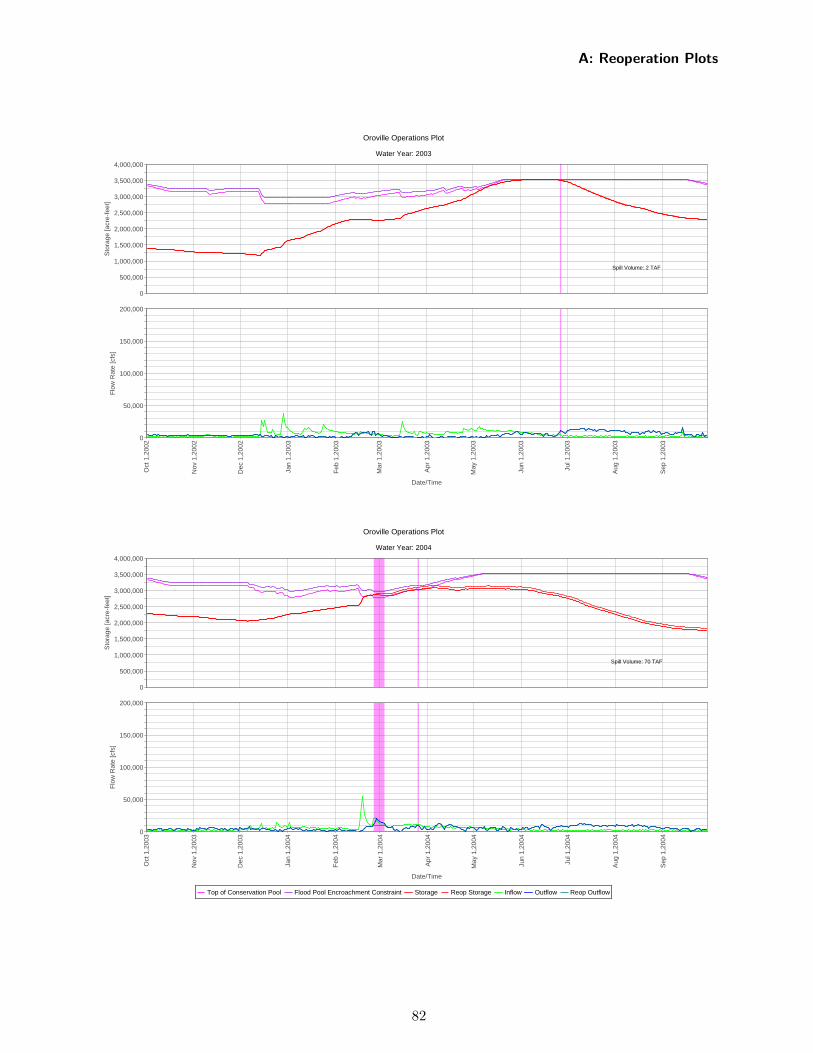
Oroville Operations Plot
Water Year: 2003
Top of Conservation Pool Flood Pool Encroachment Constraint Storage Reop Storage Inflow Outflow Reop Outflow
Oct
1,2
002
Nov
1,2
002
Dec
1,2
002
Jan
1,20
03
Feb
1,2
003
Mar
1,2
003
Apr
1,2
003
May
1,2
003
Jun
1,20
03
Jul 1
,200
3
Aug
1,2
003
Sep
1,2
003
Date/Time
0
500,000
1,000,000
1,500,000
2,000,000
2,500,000
3,000,000
3,500,000
4,000,000
Sto
rage
[acr
e-fe
et]
Spill Volume: 2 TAF
0
50,000
100,000
150,000
200,000
Flo
w R
ate
[cfs
]
Oroville Operations Plot
Water Year: 2004
Top of Conservation Pool Flood Pool Encroachment Constraint Storage Reop Storage Inflow Outflow Reop Outflow
Oct
1,2
003
Nov
1,2
003
Dec
1,2
003
Jan
1,20
04
Feb
1,2
004
Mar
1,2
004
Apr
1,2
004
May
1,2
004
Jun
1,20
04
Jul 1
,200
4
Aug
1,2
004
Sep
1,2
004
Date/Time
0
500,000
1,000,000
1,500,000
2,000,000
2,500,000
3,000,000
3,500,000
4,000,000
Sto
rage
[acr
e-fe
et]
Spill Volume: 70 TAF
0
50,000
100,000
150,000
200,000
Flo
w R
ate
[cfs
]
A: Reoperation Plots
82
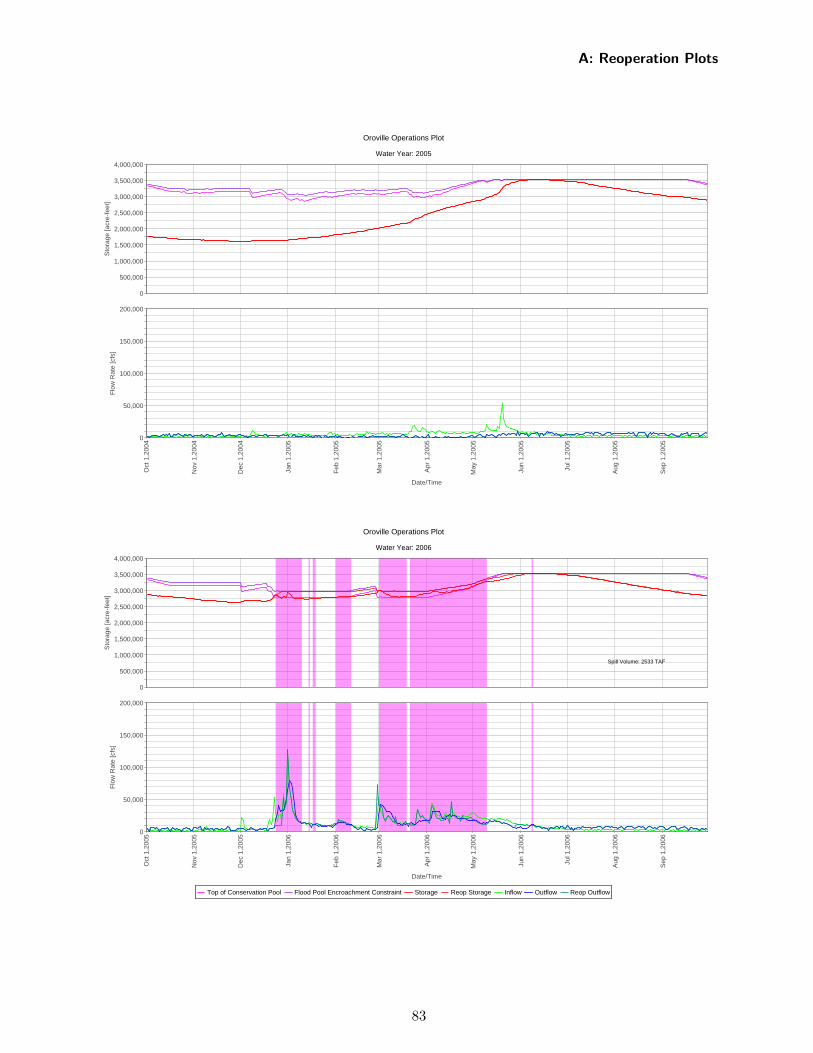
Oroville Operations Plot
Water Year: 2005
Top of Conservation Pool Flood Pool Encroachment Constraint Storage Reop Storage Inflow Outflow Reop Outflow
Oct
1,2
004
Nov
1,2
004
Dec
1,2
004
Jan
1,20
05
Feb
1,2
005
Mar
1,2
005
Apr
1,2
005
May
1,2
005
Jun
1,20
05
Jul 1
,200
5
Aug
1,2
005
Sep
1,2
005
Date/Time
0
500,000
1,000,000
1,500,000
2,000,000
2,500,000
3,000,000
3,500,000
4,000,000
Sto
rage
[acr
e-fe
et]
0
50,000
100,000
150,000
200,000
Flo
w R
ate
[cfs
]
Oroville Operations Plot
Water Year: 2006
Top of Conservation Pool Flood Pool Encroachment Constraint Storage Reop Storage Inflow Outflow Reop Outflow
Oct
1,2
005
Nov
1,2
005
Dec
1,2
005
Jan
1,20
06
Feb
1,2
006
Mar
1,2
006
Apr
1,2
006
May
1,2
006
Jun
1,20
06
Jul 1
,200
6
Aug
1,2
006
Sep
1,2
006
Date/Time
0
500,000
1,000,000
1,500,000
2,000,000
2,500,000
3,000,000
3,500,000
4,000,000
Sto
rage
[acr
e-fe
et]
Spill Volume: 2533 TAF
0
50,000
100,000
150,000
200,000
Flo
w R
ate
[cfs
]
A: Reoperation Plots
83
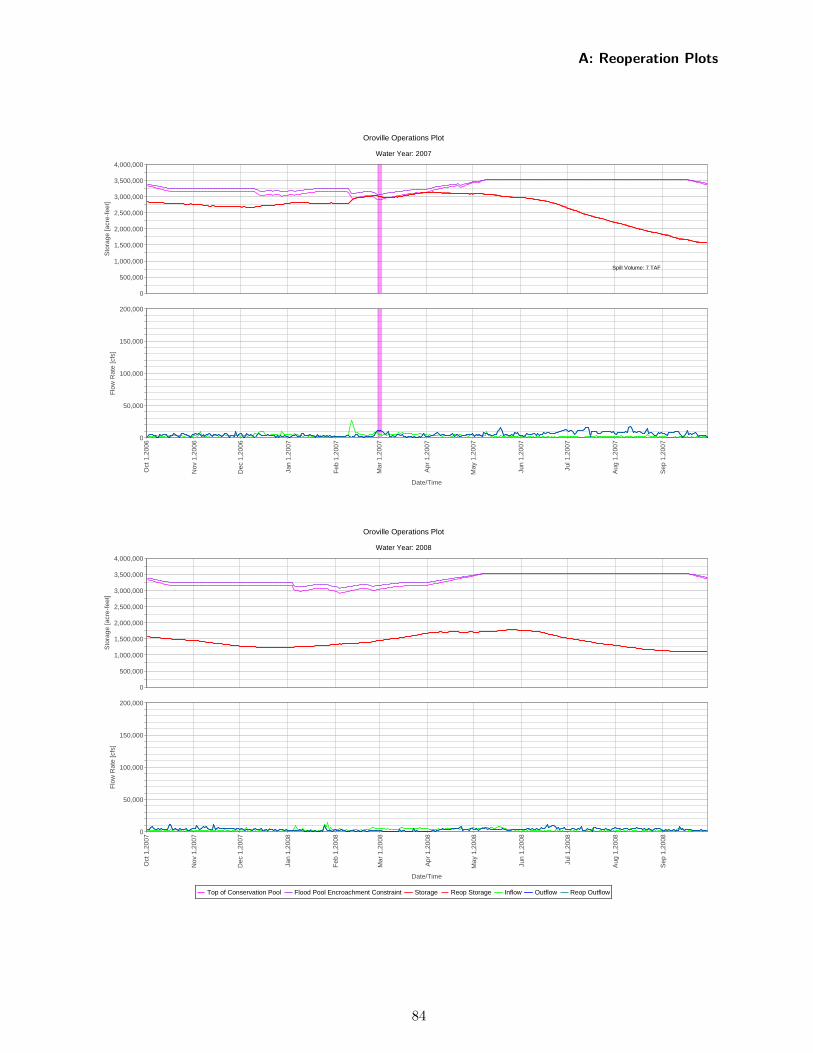
Oroville Operations Plot
Water Year: 2007
Top of Conservation Pool Flood Pool Encroachment Constraint Storage Reop Storage Inflow Outflow Reop Outflow
Oct
1,2
006
Nov
1,2
006
Dec
1,2
006
Jan
1,20
07
Feb
1,2
007
Mar
1,2
007
Apr
1,2
007
May
1,2
007
Jun
1,20
07
Jul 1
,200
7
Aug
1,2
007
Sep
1,2
007
Date/Time
0
500,000
1,000,000
1,500,000
2,000,000
2,500,000
3,000,000
3,500,000
4,000,000
Sto
rage
[acr
e-fe
et]
Spill Volume: 7 TAF
0
50,000
100,000
150,000
200,000
Flo
w R
ate
[cfs
]
Oroville Operations Plot
Water Year: 2008
Top of Conservation Pool Flood Pool Encroachment Constraint Storage Reop Storage Inflow Outflow Reop Outflow
Oct
1,2
007
Nov
1,2
007
Dec
1,2
007
Jan
1,20
08
Feb
1,2
008
Mar
1,2
008
Apr
1,2
008
May
1,2
008
Jun
1,20
08
Jul 1
,200
8
Aug
1,2
008
Sep
1,2
008
Date/Time
0
500,000
1,000,000
1,500,000
2,000,000
2,500,000
3,000,000
3,500,000
4,000,000
Sto
rage
[acr
e-fe
et]
0
50,000
100,000
150,000
200,000
Flo
w R
ate
[cfs
]
A: Reoperation Plots
84
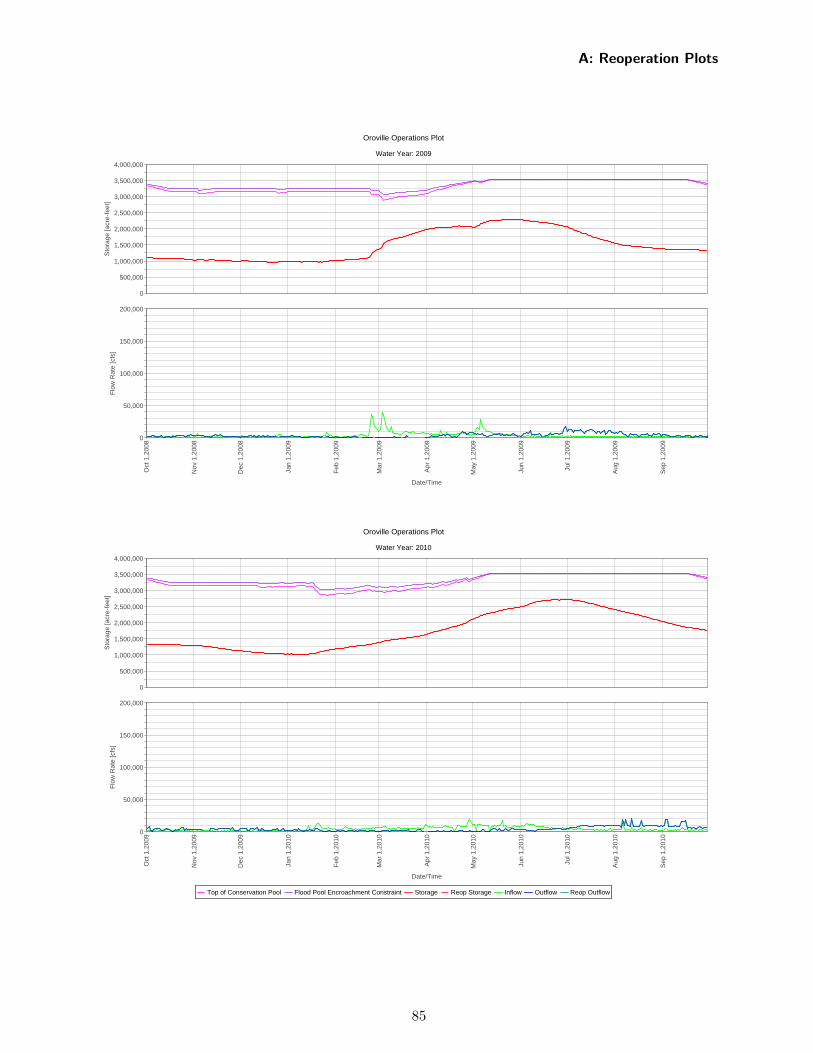
Oroville Operations Plot
Water Year: 2009
Top of Conservation Pool Flood Pool Encroachment Constraint Storage Reop Storage Inflow Outflow Reop Outflow
Oct
1,2
008
Nov
1,2
008
Dec
1,2
008
Jan
1,20
09
Feb
1,2
009
Mar
1,2
009
Apr
1,2
009
May
1,2
009
Jun
1,20
09
Jul 1
,200
9
Aug
1,2
009
Sep
1,2
009
Date/Time
0
500,000
1,000,000
1,500,000
2,000,000
2,500,000
3,000,000
3,500,000
4,000,000
Sto
rage
[acr
e-fe
et]
0
50,000
100,000
150,000
200,000
Flo
w R
ate
[cfs
]
Oroville Operations Plot
Water Year: 2010
Top of Conservation Pool Flood Pool Encroachment Constraint Storage Reop Storage Inflow Outflow Reop Outflow
Oct
1,2
009
Nov
1,2
009
Dec
1,2
009
Jan
1,20
10
Feb
1,2
010
Mar
1,2
010
Apr
1,2
010
May
1,2
010
Jun
1,20
10
Jul 1
,201
0
Aug
1,2
010
Sep
1,2
010
Date/Time
0
500,000
1,000,000
1,500,000
2,000,000
2,500,000
3,000,000
3,500,000
4,000,000
Sto
rage
[acr
e-fe
et]
0
50,000
100,000
150,000
200,000
Flo
w R
ate
[cfs
]
A: Reoperation Plots
85

A: Reoperation Plots
A.3 New Bullards Bar
The following section includes the reoperation plots for New Bullards Bar Dam.
86
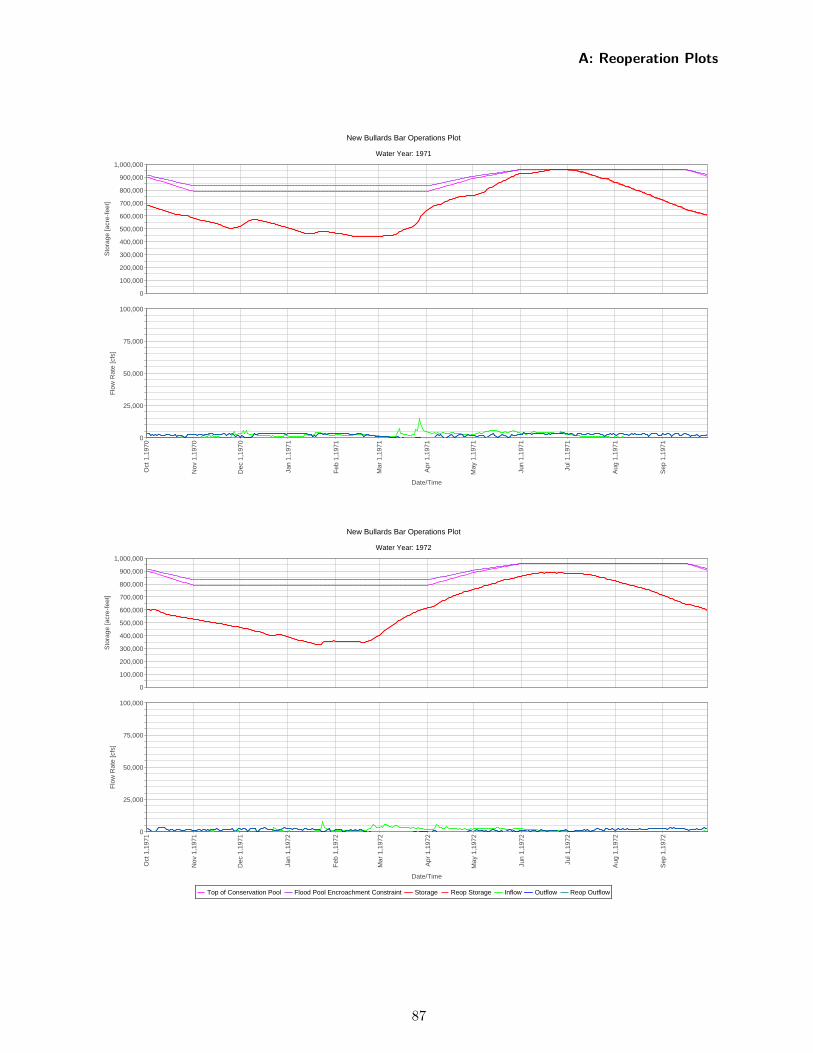
New Bullards Bar Operations Plot
Water Year: 1971
Top of Conservation Pool Flood Pool Encroachment Constraint Storage Reop Storage Inflow Outflow Reop Outflow
Oct
1,1
970
Nov
1,1
970
Dec
1,1
970
Jan
1,19
71
Feb
1,1
971
Mar
1,1
971
Apr
1,1
971
May
1,1
971
Jun
1,19
71
Jul 1
,197
1
Aug
1,1
971
Sep
1,1
971
Date/Time
0
100,000
200,000
300,000
400,000
500,000
600,000
700,000
800,000
900,000
1,000,000
Sto
rage
[acr
e-fe
et]
0
25,000
50,000
75,000
100,000
Flo
w R
ate
[cfs
]
New Bullards Bar Operations Plot
Water Year: 1972
Top of Conservation Pool Flood Pool Encroachment Constraint Storage Reop Storage Inflow Outflow Reop Outflow
Oct
1,1
971
Nov
1,1
971
Dec
1,1
971
Jan
1,19
72
Feb
1,1
972
Mar
1,1
972
Apr
1,1
972
May
1,1
972
Jun
1,19
72
Jul 1
,197
2
Aug
1,1
972
Sep
1,1
972
Date/Time
0
100,000
200,000
300,000
400,000
500,000
600,000
700,000
800,000
900,000
1,000,000
Sto
rage
[acr
e-fe
et]
0
25,000
50,000
75,000
100,000
Flo
w R
ate
[cfs
]
A: Reoperation Plots
87
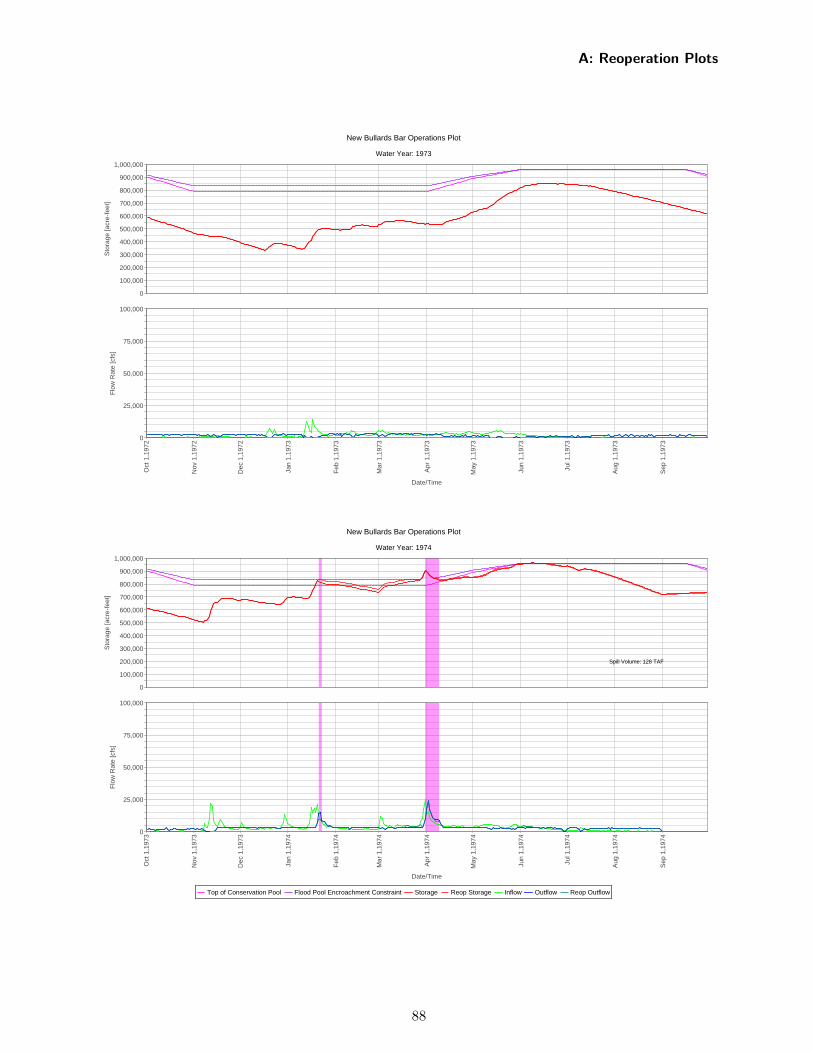
New Bullards Bar Operations Plot
Water Year: 1973
Top of Conservation Pool Flood Pool Encroachment Constraint Storage Reop Storage Inflow Outflow Reop Outflow
Oct
1,1
972
Nov
1,1
972
Dec
1,1
972
Jan
1,19
73
Feb
1,1
973
Mar
1,1
973
Apr
1,1
973
May
1,1
973
Jun
1,19
73
Jul 1
,197
3
Aug
1,1
973
Sep
1,1
973
Date/Time
0
100,000
200,000
300,000
400,000
500,000
600,000
700,000
800,000
900,000
1,000,000
Sto
rage
[acr
e-fe
et]
0
25,000
50,000
75,000
100,000
Flo
w R
ate
[cfs
]
New Bullards Bar Operations Plot
Water Year: 1974
Top of Conservation Pool Flood Pool Encroachment Constraint Storage Reop Storage Inflow Outflow Reop Outflow
Oct
1,1
973
Nov
1,1
973
Dec
1,1
973
Jan
1,19
74
Feb
1,1
974
Mar
1,1
974
Apr
1,1
974
May
1,1
974
Jun
1,19
74
Jul 1
,197
4
Aug
1,1
974
Sep
1,1
974
Date/Time
0
100,000
200,000
300,000
400,000
500,000
600,000
700,000
800,000
900,000
1,000,000
Sto
rage
[acr
e-fe
et]
Spill Volume: 128 TAF
0
25,000
50,000
75,000
100,000
Flo
w R
ate
[cfs
]
A: Reoperation Plots
88
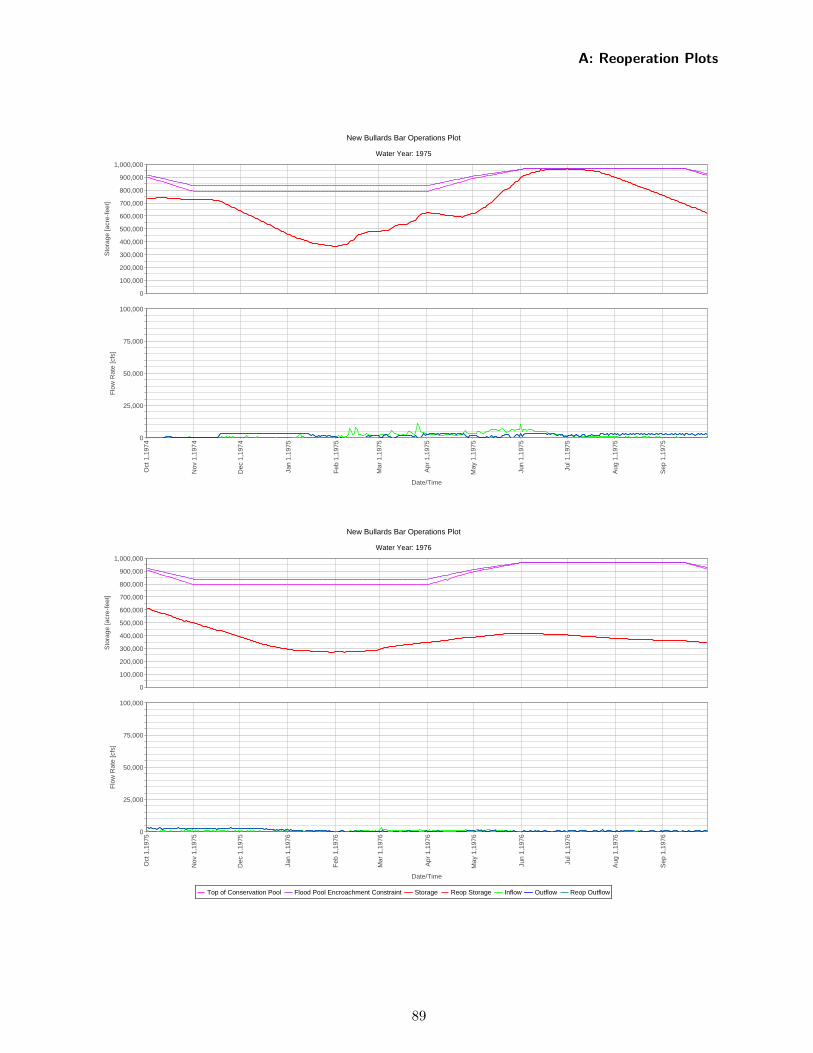
New Bullards Bar Operations Plot
Water Year: 1975
Top of Conservation Pool Flood Pool Encroachment Constraint Storage Reop Storage Inflow Outflow Reop Outflow
Oct
1,1
974
Nov
1,1
974
Dec
1,1
974
Jan
1,19
75
Feb
1,1
975
Mar
1,1
975
Apr
1,1
975
May
1,1
975
Jun
1,19
75
Jul 1
,197
5
Aug
1,1
975
Sep
1,1
975
Date/Time
0
100,000
200,000
300,000
400,000
500,000
600,000
700,000
800,000
900,000
1,000,000
Sto
rage
[acr
e-fe
et]
0
25,000
50,000
75,000
100,000
Flo
w R
ate
[cfs
]
New Bullards Bar Operations Plot
Water Year: 1976
Top of Conservation Pool Flood Pool Encroachment Constraint Storage Reop Storage Inflow Outflow Reop Outflow
Oct
1,1
975
Nov
1,1
975
Dec
1,1
975
Jan
1,19
76
Feb
1,1
976
Mar
1,1
976
Apr
1,1
976
May
1,1
976
Jun
1,19
76
Jul 1
,197
6
Aug
1,1
976
Sep
1,1
976
Date/Time
0
100,000
200,000
300,000
400,000
500,000
600,000
700,000
800,000
900,000
1,000,000
Sto
rage
[acr
e-fe
et]
0
25,000
50,000
75,000
100,000
Flo
w R
ate
[cfs
]
A: Reoperation Plots
89
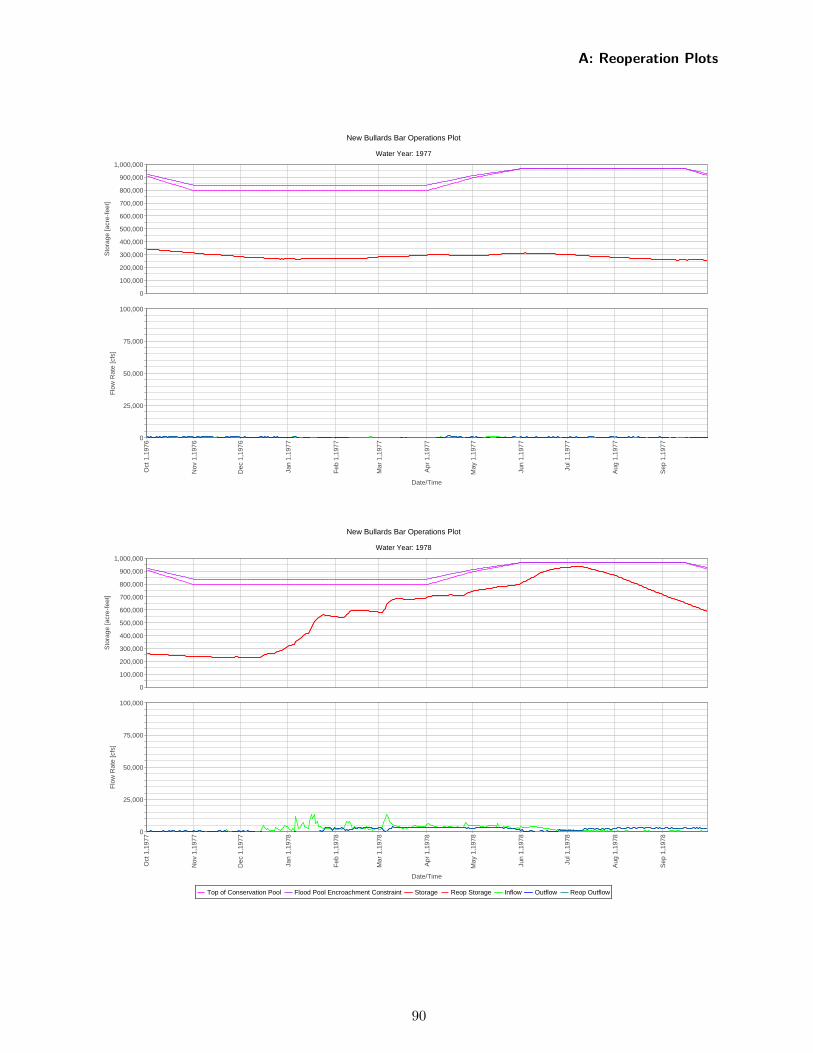
New Bullards Bar Operations Plot
Water Year: 1977
Top of Conservation Pool Flood Pool Encroachment Constraint Storage Reop Storage Inflow Outflow Reop Outflow
Oct
1,1
976
Nov
1,1
976
Dec
1,1
976
Jan
1,19
77
Feb
1,1
977
Mar
1,1
977
Apr
1,1
977
May
1,1
977
Jun
1,19
77
Jul 1
,197
7
Aug
1,1
977
Sep
1,1
977
Date/Time
0
100,000
200,000
300,000
400,000
500,000
600,000
700,000
800,000
900,000
1,000,000
Sto
rage
[acr
e-fe
et]
0
25,000
50,000
75,000
100,000
Flo
w R
ate
[cfs
]
New Bullards Bar Operations Plot
Water Year: 1978
Top of Conservation Pool Flood Pool Encroachment Constraint Storage Reop Storage Inflow Outflow Reop Outflow
Oct
1,1
977
Nov
1,1
977
Dec
1,1
977
Jan
1,19
78
Feb
1,1
978
Mar
1,1
978
Apr
1,1
978
May
1,1
978
Jun
1,19
78
Jul 1
,197
8
Aug
1,1
978
Sep
1,1
978
Date/Time
0
100,000
200,000
300,000
400,000
500,000
600,000
700,000
800,000
900,000
1,000,000
Sto
rage
[acr
e-fe
et]
0
25,000
50,000
75,000
100,000
Flo
w R
ate
[cfs
]
A: Reoperation Plots
90
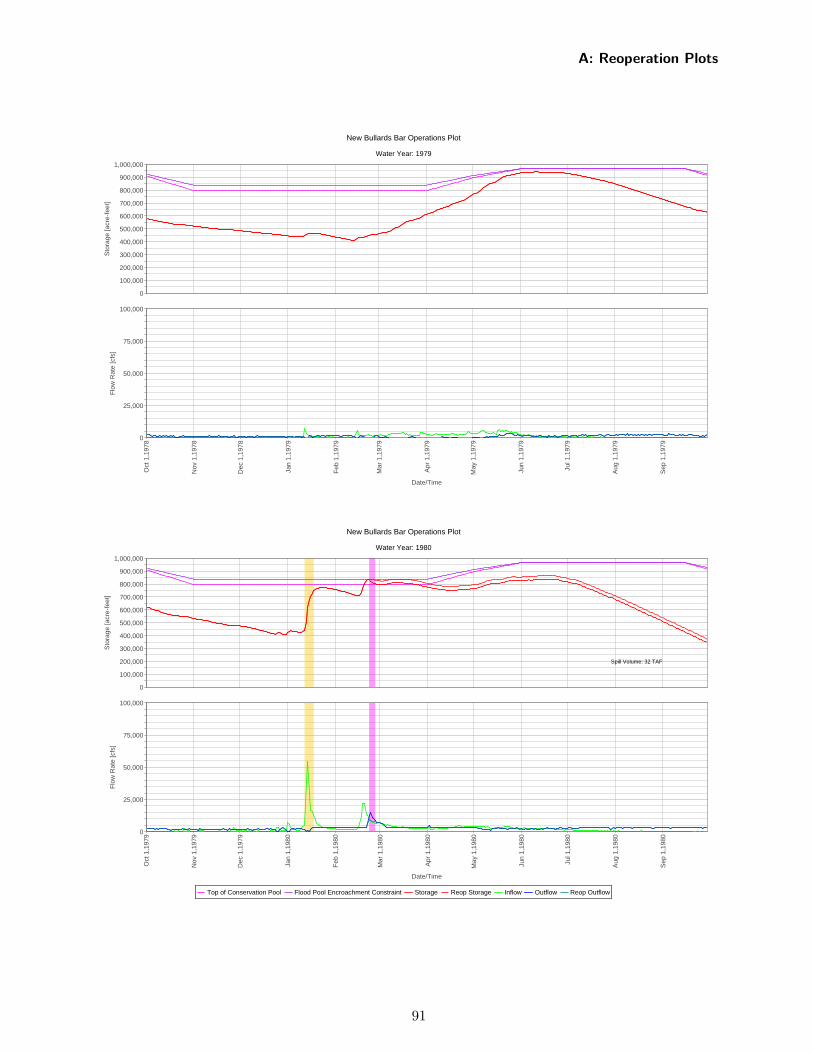
New Bullards Bar Operations Plot
Water Year: 1979
Top of Conservation Pool Flood Pool Encroachment Constraint Storage Reop Storage Inflow Outflow Reop Outflow
Oct
1,1
978
Nov
1,1
978
Dec
1,1
978
Jan
1,19
79
Feb
1,1
979
Mar
1,1
979
Apr
1,1
979
May
1,1
979
Jun
1,19
79
Jul 1
,197
9
Aug
1,1
979
Sep
1,1
979
Date/Time
0
100,000
200,000
300,000
400,000
500,000
600,000
700,000
800,000
900,000
1,000,000
Sto
rage
[acr
e-fe
et]
0
25,000
50,000
75,000
100,000
Flo
w R
ate
[cfs
]
New Bullards Bar Operations Plot
Water Year: 1980
Top of Conservation Pool Flood Pool Encroachment Constraint Storage Reop Storage Inflow Outflow Reop Outflow
Oct
1,1
979
Nov
1,1
979
Dec
1,1
979
Jan
1,19
80
Feb
1,1
980
Mar
1,1
980
Apr
1,1
980
May
1,1
980
Jun
1,19
80
Jul 1
,198
0
Aug
1,1
980
Sep
1,1
980
Date/Time
0
100,000
200,000
300,000
400,000
500,000
600,000
700,000
800,000
900,000
1,000,000
Sto
rage
[acr
e-fe
et]
Spill Volume: 32 TAF
0
25,000
50,000
75,000
100,000
Flo
w R
ate
[cfs
]
A: Reoperation Plots
91
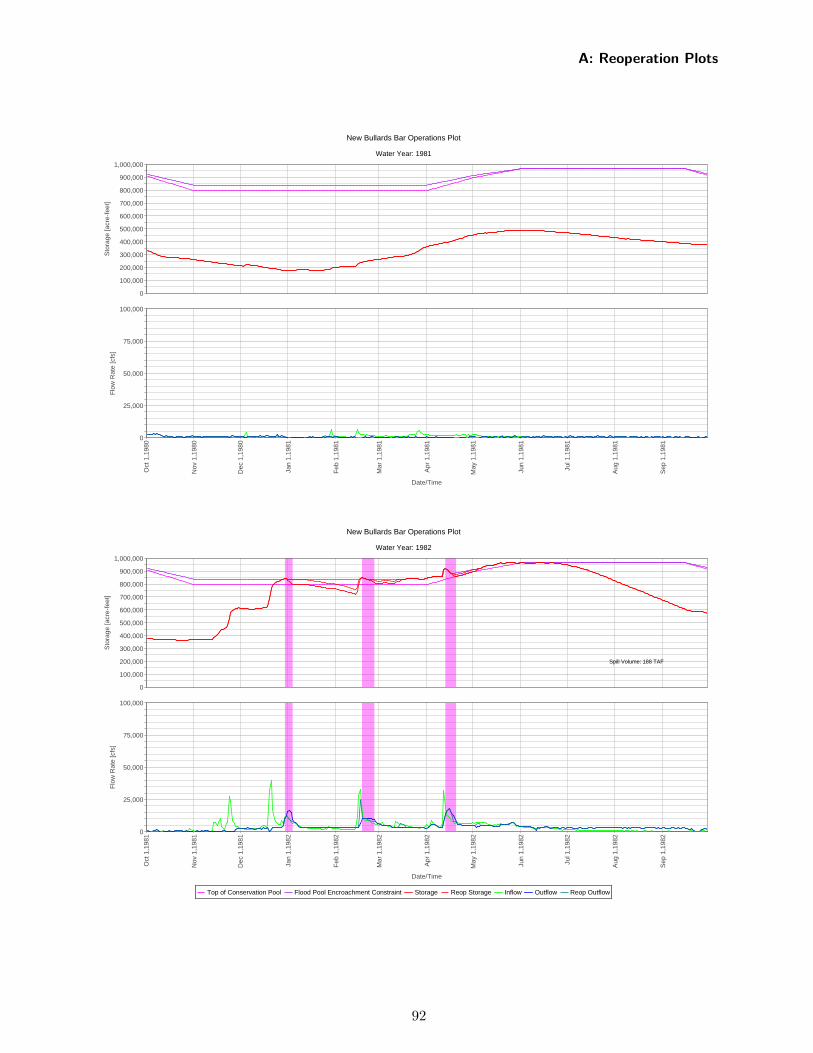
New Bullards Bar Operations Plot
Water Year: 1981
Top of Conservation Pool Flood Pool Encroachment Constraint Storage Reop Storage Inflow Outflow Reop Outflow
Oct
1,1
980
Nov
1,1
980
Dec
1,1
980
Jan
1,19
81
Feb
1,1
981
Mar
1,1
981
Apr
1,1
981
May
1,1
981
Jun
1,19
81
Jul 1
,198
1
Aug
1,1
981
Sep
1,1
981
Date/Time
0
100,000
200,000
300,000
400,000
500,000
600,000
700,000
800,000
900,000
1,000,000
Sto
rage
[acr
e-fe
et]
0
25,000
50,000
75,000
100,000
Flo
w R
ate
[cfs
]
New Bullards Bar Operations Plot
Water Year: 1982
Top of Conservation Pool Flood Pool Encroachment Constraint Storage Reop Storage Inflow Outflow Reop Outflow
Oct
1,1
981
Nov
1,1
981
Dec
1,1
981
Jan
1,19
82
Feb
1,1
982
Mar
1,1
982
Apr
1,1
982
May
1,1
982
Jun
1,19
82
Jul 1
,198
2
Aug
1,1
982
Sep
1,1
982
Date/Time
0
100,000
200,000
300,000
400,000
500,000
600,000
700,000
800,000
900,000
1,000,000
Sto
rage
[acr
e-fe
et]
Spill Volume: 188 TAF
0
25,000
50,000
75,000
100,000
Flo
w R
ate
[cfs
]
A: Reoperation Plots
92
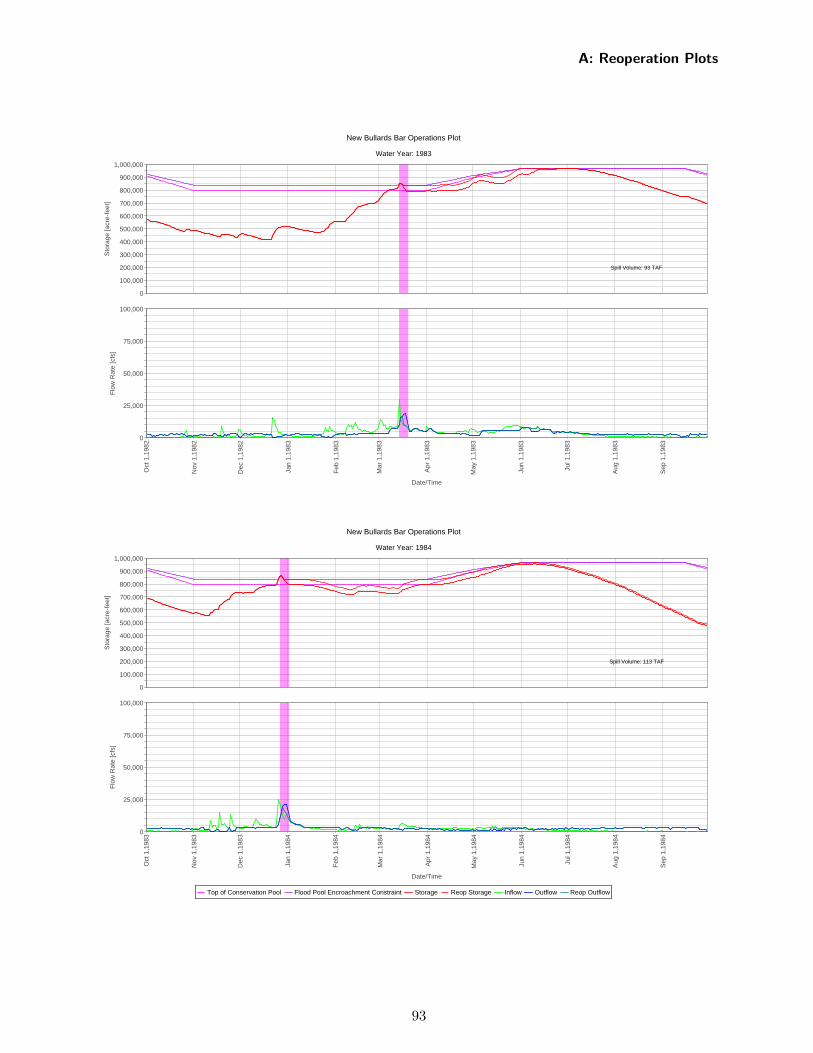
New Bullards Bar Operations Plot
Water Year: 1983
Top of Conservation Pool Flood Pool Encroachment Constraint Storage Reop Storage Inflow Outflow Reop Outflow
Oct
1,1
982
Nov
1,1
982
Dec
1,1
982
Jan
1,19
83
Feb
1,1
983
Mar
1,1
983
Apr
1,1
983
May
1,1
983
Jun
1,19
83
Jul 1
,198
3
Aug
1,1
983
Sep
1,1
983
Date/Time
0
100,000
200,000
300,000
400,000
500,000
600,000
700,000
800,000
900,000
1,000,000
Sto
rage
[acr
e-fe
et]
Spill Volume: 93 TAF
0
25,000
50,000
75,000
100,000
Flo
w R
ate
[cfs
]
New Bullards Bar Operations Plot
Water Year: 1984
Top of Conservation Pool Flood Pool Encroachment Constraint Storage Reop Storage Inflow Outflow Reop Outflow
Oct
1,1
983
Nov
1,1
983
Dec
1,1
983
Jan
1,19
84
Feb
1,1
984
Mar
1,1
984
Apr
1,1
984
May
1,1
984
Jun
1,19
84
Jul 1
,198
4
Aug
1,1
984
Sep
1,1
984
Date/Time
0
100,000
200,000
300,000
400,000
500,000
600,000
700,000
800,000
900,000
1,000,000
Sto
rage
[acr
e-fe
et]
Spill Volume: 113 TAF
0
25,000
50,000
75,000
100,000
Flo
w R
ate
[cfs
]
A: Reoperation Plots
93
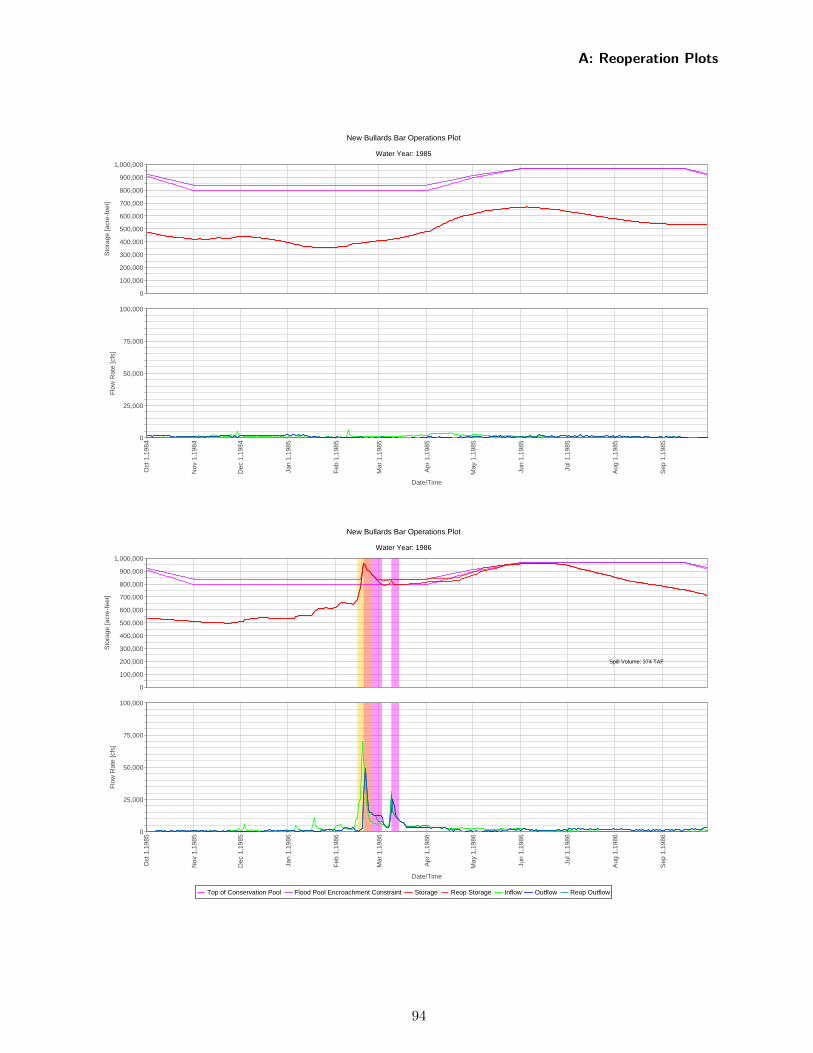
New Bullards Bar Operations Plot
Water Year: 1985
Top of Conservation Pool Flood Pool Encroachment Constraint Storage Reop Storage Inflow Outflow Reop Outflow
Oct
1,1
984
Nov
1,1
984
Dec
1,1
984
Jan
1,19
85
Feb
1,1
985
Mar
1,1
985
Apr
1,1
985
May
1,1
985
Jun
1,19
85
Jul 1
,198
5
Aug
1,1
985
Sep
1,1
985
Date/Time
0
100,000
200,000
300,000
400,000
500,000
600,000
700,000
800,000
900,000
1,000,000
Sto
rage
[acr
e-fe
et]
0
25,000
50,000
75,000
100,000
Flo
w R
ate
[cfs
]
New Bullards Bar Operations Plot
Water Year: 1986
Top of Conservation Pool Flood Pool Encroachment Constraint Storage Reop Storage Inflow Outflow Reop Outflow
Oct
1,1
985
Nov
1,1
985
Dec
1,1
985
Jan
1,19
86
Feb
1,1
986
Mar
1,1
986
Apr
1,1
986
May
1,1
986
Jun
1,19
86
Jul 1
,198
6
Aug
1,1
986
Sep
1,1
986
Date/Time
0
100,000
200,000
300,000
400,000
500,000
600,000
700,000
800,000
900,000
1,000,000
Sto
rage
[acr
e-fe
et]
Spill Volume: 374 TAF
0
25,000
50,000
75,000
100,000
Flo
w R
ate
[cfs
]
A: Reoperation Plots
94
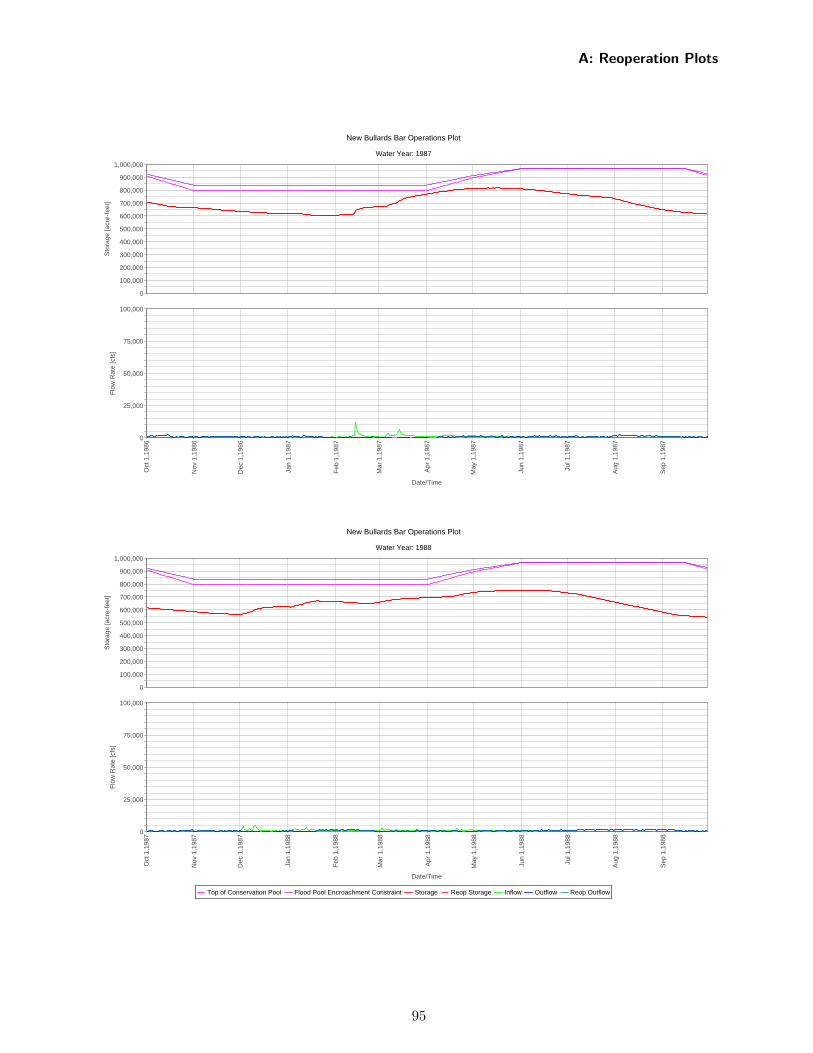
New Bullards Bar Operations Plot
Water Year: 1987
Top of Conservation Pool Flood Pool Encroachment Constraint Storage Reop Storage Inflow Outflow Reop Outflow
Oct
1,1
986
Nov
1,1
986
Dec
1,1
986
Jan
1,19
87
Feb
1,1
987
Mar
1,1
987
Apr
1,1
987
May
1,1
987
Jun
1,19
87
Jul 1
,198
7
Aug
1,1
987
Sep
1,1
987
Date/Time
0
100,000
200,000
300,000
400,000
500,000
600,000
700,000
800,000
900,000
1,000,000
Sto
rage
[acr
e-fe
et]
0
25,000
50,000
75,000
100,000
Flo
w R
ate
[cfs
]
New Bullards Bar Operations Plot
Water Year: 1988
Top of Conservation Pool Flood Pool Encroachment Constraint Storage Reop Storage Inflow Outflow Reop Outflow
Oct
1,1
987
Nov
1,1
987
Dec
1,1
987
Jan
1,19
88
Feb
1,1
988
Mar
1,1
988
Apr
1,1
988
May
1,1
988
Jun
1,19
88
Jul 1
,198
8
Aug
1,1
988
Sep
1,1
988
Date/Time
0
100,000
200,000
300,000
400,000
500,000
600,000
700,000
800,000
900,000
1,000,000
Sto
rage
[acr
e-fe
et]
0
25,000
50,000
75,000
100,000
Flo
w R
ate
[cfs
]
A: Reoperation Plots
95
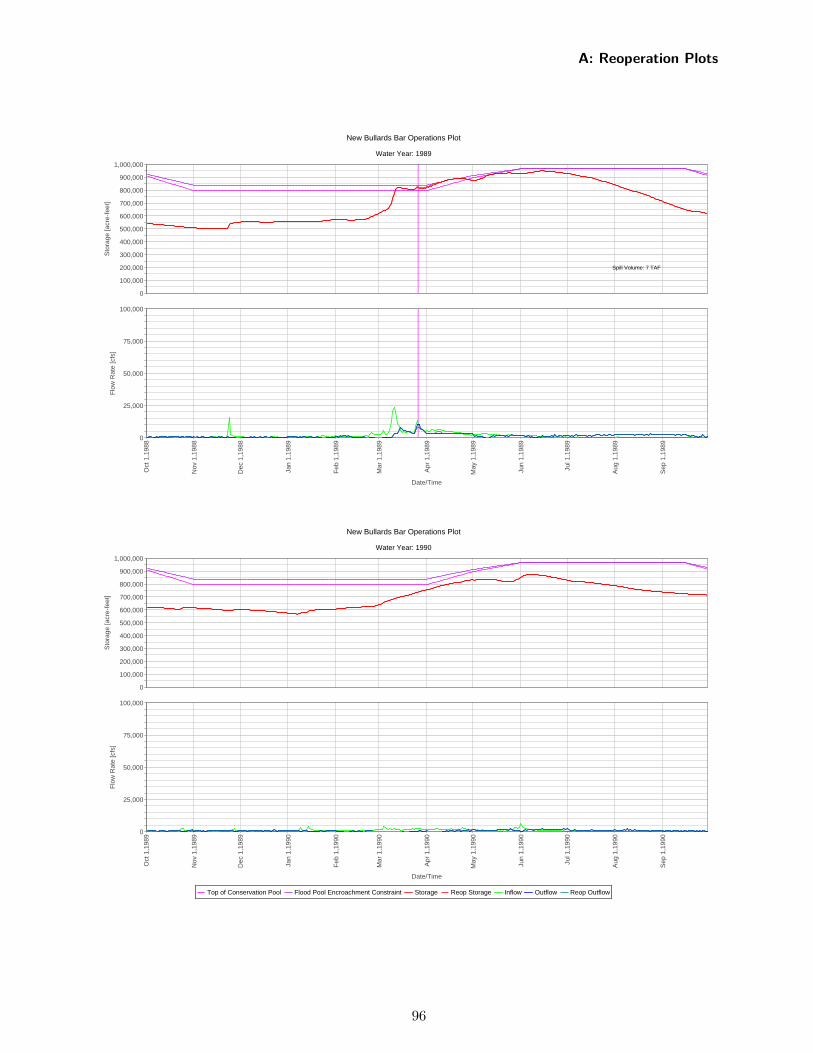
New Bullards Bar Operations Plot
Water Year: 1989
Top of Conservation Pool Flood Pool Encroachment Constraint Storage Reop Storage Inflow Outflow Reop Outflow
Oct
1,1
988
Nov
1,1
988
Dec
1,1
988
Jan
1,19
89
Feb
1,1
989
Mar
1,1
989
Apr
1,1
989
May
1,1
989
Jun
1,19
89
Jul 1
,198
9
Aug
1,1
989
Sep
1,1
989
Date/Time
0
100,000
200,000
300,000
400,000
500,000
600,000
700,000
800,000
900,000
1,000,000
Sto
rage
[acr
e-fe
et]
Spill Volume: 7 TAF
0
25,000
50,000
75,000
100,000
Flo
w R
ate
[cfs
]
New Bullards Bar Operations Plot
Water Year: 1990
Top of Conservation Pool Flood Pool Encroachment Constraint Storage Reop Storage Inflow Outflow Reop Outflow
Oct
1,1
989
Nov
1,1
989
Dec
1,1
989
Jan
1,19
90
Feb
1,1
990
Mar
1,1
990
Apr
1,1
990
May
1,1
990
Jun
1,19
90
Jul 1
,199
0
Aug
1,1
990
Sep
1,1
990
Date/Time
0
100,000
200,000
300,000
400,000
500,000
600,000
700,000
800,000
900,000
1,000,000
Sto
rage
[acr
e-fe
et]
0
25,000
50,000
75,000
100,000
Flo
w R
ate
[cfs
]
A: Reoperation Plots
96
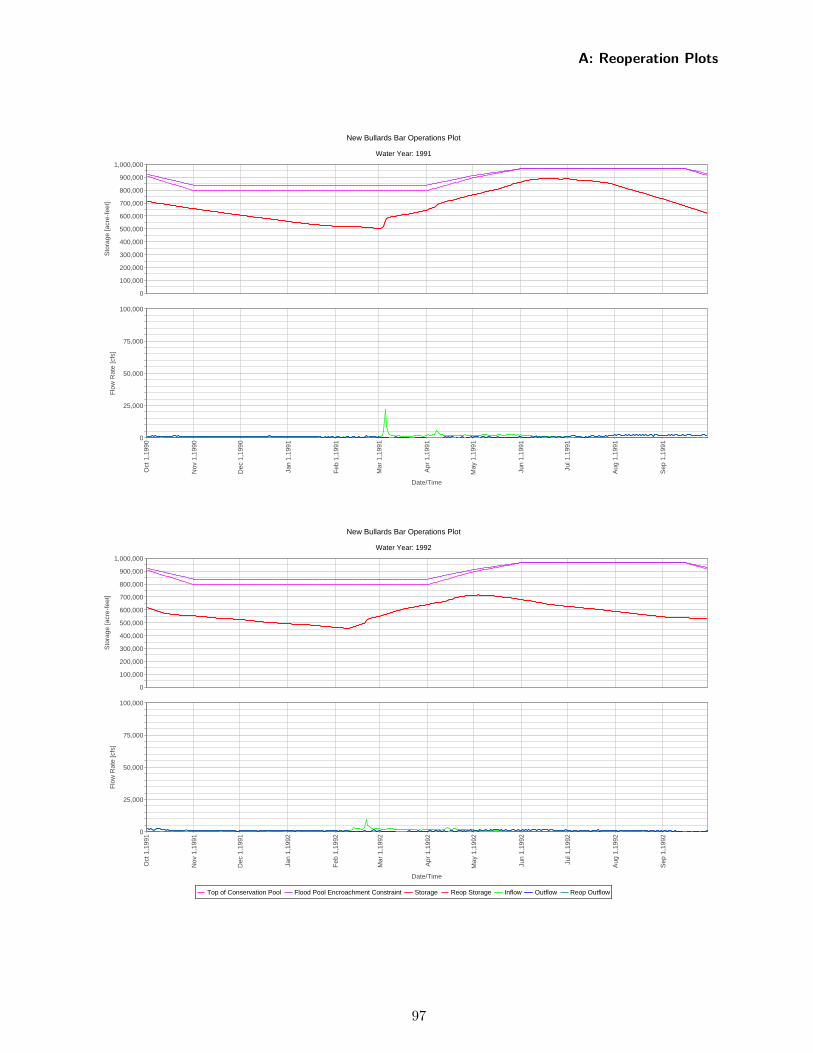
New Bullards Bar Operations Plot
Water Year: 1991
Top of Conservation Pool Flood Pool Encroachment Constraint Storage Reop Storage Inflow Outflow Reop Outflow
Oct
1,1
990
Nov
1,1
990
Dec
1,1
990
Jan
1,19
91
Feb
1,1
991
Mar
1,1
991
Apr
1,1
991
May
1,1
991
Jun
1,19
91
Jul 1
,199
1
Aug
1,1
991
Sep
1,1
991
Date/Time
0
100,000
200,000
300,000
400,000
500,000
600,000
700,000
800,000
900,000
1,000,000
Sto
rage
[acr
e-fe
et]
0
25,000
50,000
75,000
100,000
Flo
w R
ate
[cfs
]
New Bullards Bar Operations Plot
Water Year: 1992
Top of Conservation Pool Flood Pool Encroachment Constraint Storage Reop Storage Inflow Outflow Reop Outflow
Oct
1,1
991
Nov
1,1
991
Dec
1,1
991
Jan
1,19
92
Feb
1,1
992
Mar
1,1
992
Apr
1,1
992
May
1,1
992
Jun
1,19
92
Jul 1
,199
2
Aug
1,1
992
Sep
1,1
992
Date/Time
0
100,000
200,000
300,000
400,000
500,000
600,000
700,000
800,000
900,000
1,000,000
Sto
rage
[acr
e-fe
et]
0
25,000
50,000
75,000
100,000
Flo
w R
ate
[cfs
]
A: Reoperation Plots
97
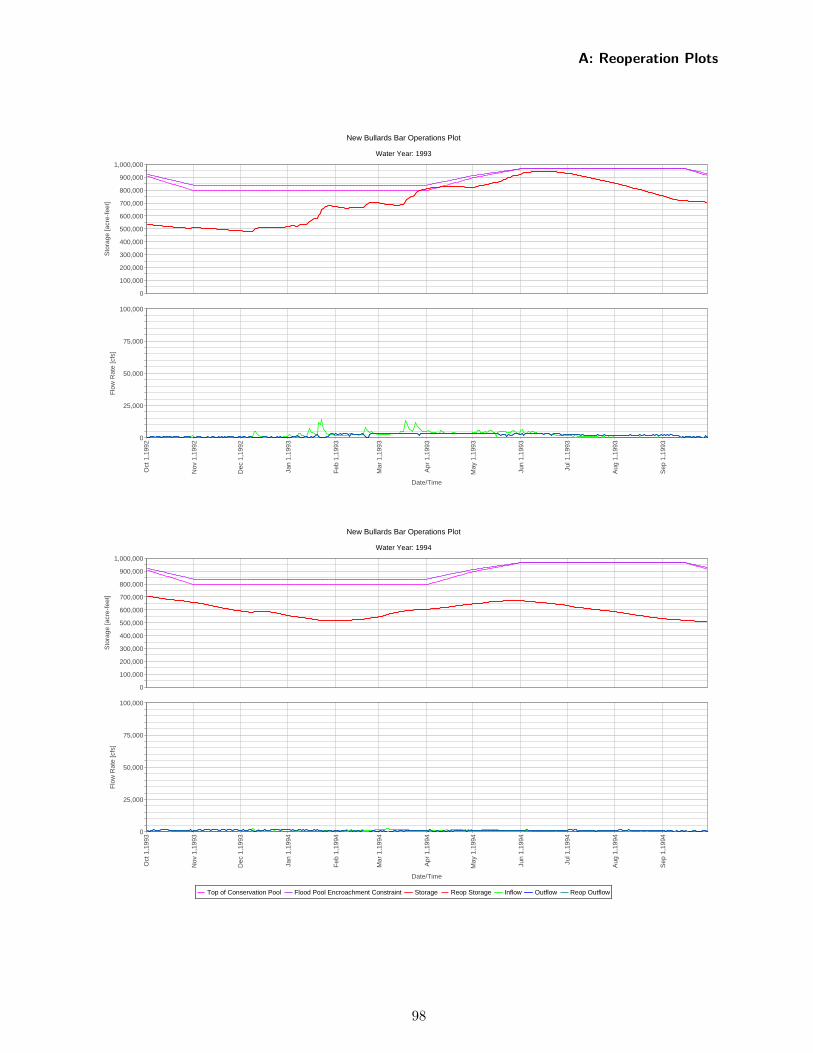
New Bullards Bar Operations Plot
Water Year: 1993
Top of Conservation Pool Flood Pool Encroachment Constraint Storage Reop Storage Inflow Outflow Reop Outflow
Oct
1,1
992
Nov
1,1
992
Dec
1,1
992
Jan
1,19
93
Feb
1,1
993
Mar
1,1
993
Apr
1,1
993
May
1,1
993
Jun
1,19
93
Jul 1
,199
3
Aug
1,1
993
Sep
1,1
993
Date/Time
0
100,000
200,000
300,000
400,000
500,000
600,000
700,000
800,000
900,000
1,000,000
Sto
rage
[acr
e-fe
et]
0
25,000
50,000
75,000
100,000
Flo
w R
ate
[cfs
]
New Bullards Bar Operations Plot
Water Year: 1994
Top of Conservation Pool Flood Pool Encroachment Constraint Storage Reop Storage Inflow Outflow Reop Outflow
Oct
1,1
993
Nov
1,1
993
Dec
1,1
993
Jan
1,19
94
Feb
1,1
994
Mar
1,1
994
Apr
1,1
994
May
1,1
994
Jun
1,19
94
Jul 1
,199
4
Aug
1,1
994
Sep
1,1
994
Date/Time
0
100,000
200,000
300,000
400,000
500,000
600,000
700,000
800,000
900,000
1,000,000
Sto
rage
[acr
e-fe
et]
0
25,000
50,000
75,000
100,000
Flo
w R
ate
[cfs
]
A: Reoperation Plots
98
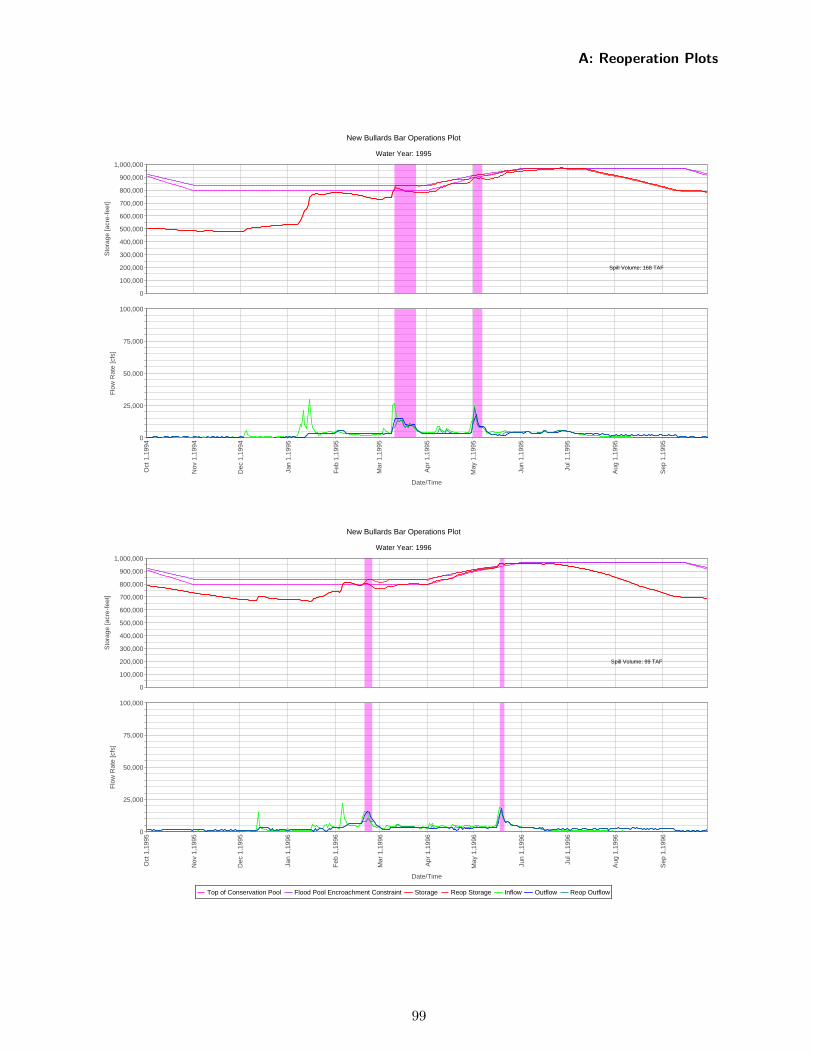
New Bullards Bar Operations Plot
Water Year: 1995
Top of Conservation Pool Flood Pool Encroachment Constraint Storage Reop Storage Inflow Outflow Reop Outflow
Oct
1,1
994
Nov
1,1
994
Dec
1,1
994
Jan
1,19
95
Feb
1,1
995
Mar
1,1
995
Apr
1,1
995
May
1,1
995
Jun
1,19
95
Jul 1
,199
5
Aug
1,1
995
Sep
1,1
995
Date/Time
0
100,000
200,000
300,000
400,000
500,000
600,000
700,000
800,000
900,000
1,000,000
Sto
rage
[acr
e-fe
et]
Spill Volume: 168 TAF
0
25,000
50,000
75,000
100,000
Flo
w R
ate
[cfs
]
New Bullards Bar Operations Plot
Water Year: 1996
Top of Conservation Pool Flood Pool Encroachment Constraint Storage Reop Storage Inflow Outflow Reop Outflow
Oct
1,1
995
Nov
1,1
995
Dec
1,1
995
Jan
1,19
96
Feb
1,1
996
Mar
1,1
996
Apr
1,1
996
May
1,1
996
Jun
1,19
96
Jul 1
,199
6
Aug
1,1
996
Sep
1,1
996
Date/Time
0
100,000
200,000
300,000
400,000
500,000
600,000
700,000
800,000
900,000
1,000,000
Sto
rage
[acr
e-fe
et]
Spill Volume: 99 TAF
0
25,000
50,000
75,000
100,000
Flo
w R
ate
[cfs
]
A: Reoperation Plots
99
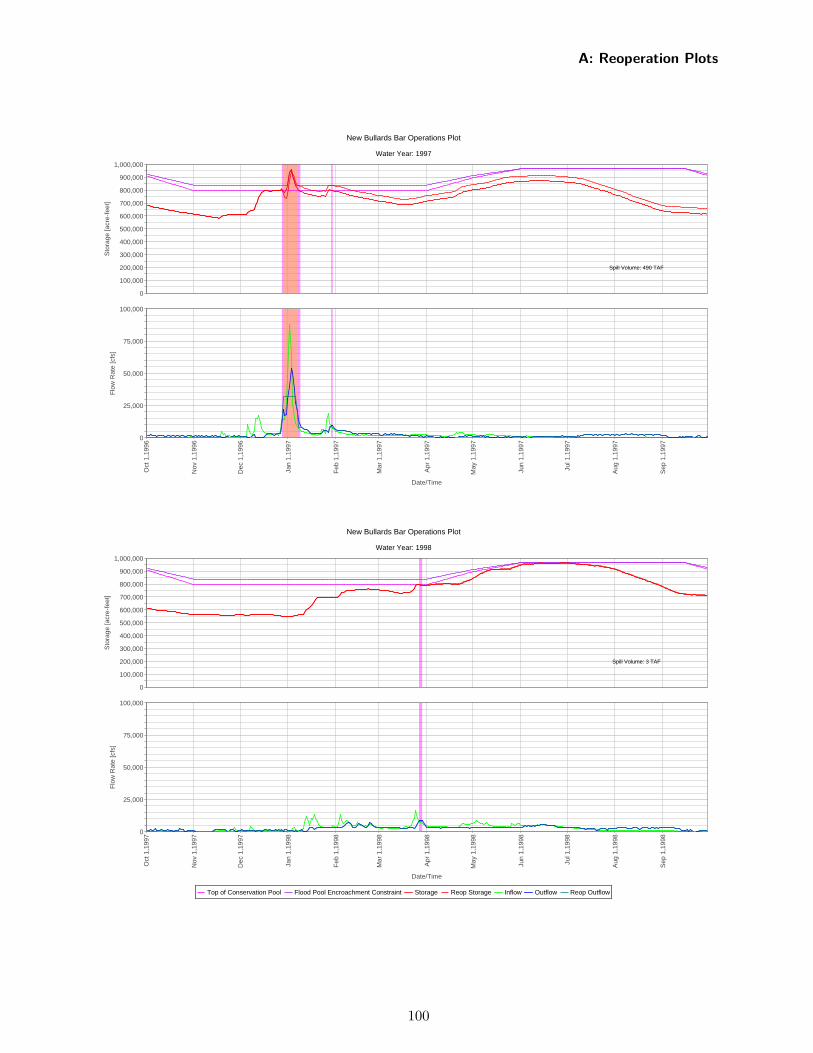
New Bullards Bar Operations Plot
Water Year: 1997
Top of Conservation Pool Flood Pool Encroachment Constraint Storage Reop Storage Inflow Outflow Reop Outflow
Oct
1,1
996
Nov
1,1
996
Dec
1,1
996
Jan
1,19
97
Feb
1,1
997
Mar
1,1
997
Apr
1,1
997
May
1,1
997
Jun
1,19
97
Jul 1
,199
7
Aug
1,1
997
Sep
1,1
997
Date/Time
0
100,000
200,000
300,000
400,000
500,000
600,000
700,000
800,000
900,000
1,000,000
Sto
rage
[acr
e-fe
et]
Spill Volume: 490 TAF
0
25,000
50,000
75,000
100,000
Flo
w R
ate
[cfs
]
New Bullards Bar Operations Plot
Water Year: 1998
Top of Conservation Pool Flood Pool Encroachment Constraint Storage Reop Storage Inflow Outflow Reop Outflow
Oct
1,1
997
Nov
1,1
997
Dec
1,1
997
Jan
1,19
98
Feb
1,1
998
Mar
1,1
998
Apr
1,1
998
May
1,1
998
Jun
1,19
98
Jul 1
,199
8
Aug
1,1
998
Sep
1,1
998
Date/Time
0
100,000
200,000
300,000
400,000
500,000
600,000
700,000
800,000
900,000
1,000,000
Sto
rage
[acr
e-fe
et]
Spill Volume: 3 TAF
0
25,000
50,000
75,000
100,000
Flo
w R
ate
[cfs
]
A: Reoperation Plots
100
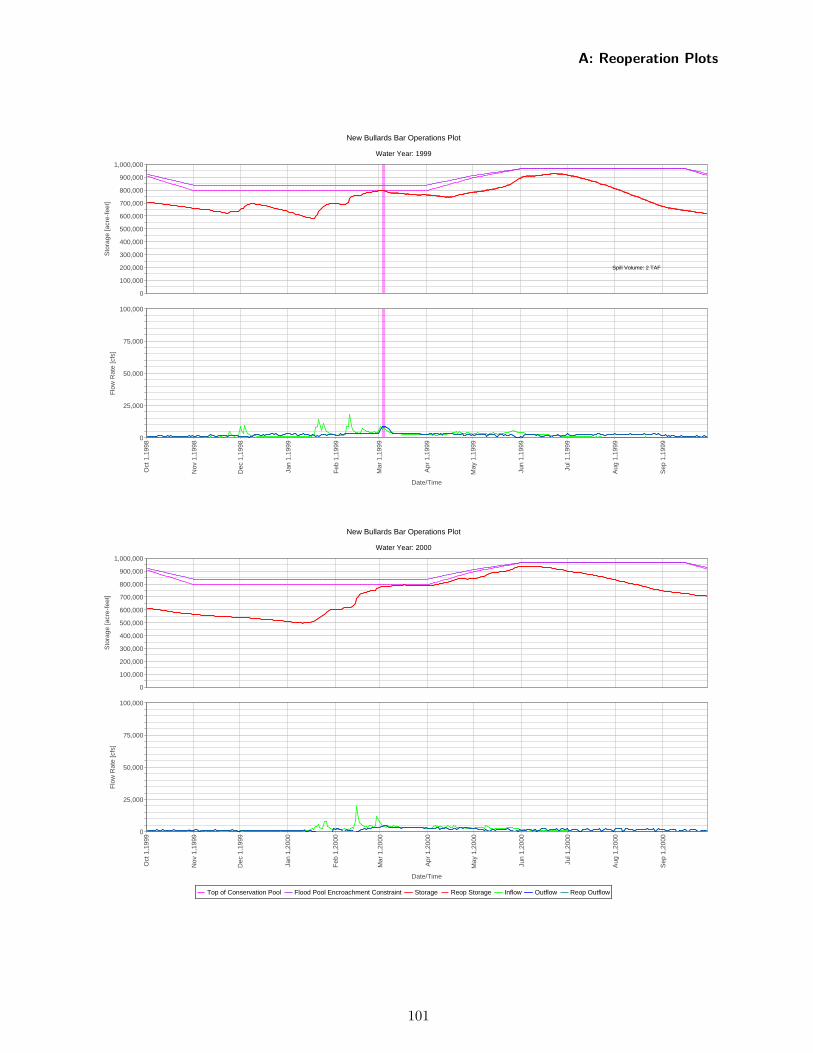
New Bullards Bar Operations Plot
Water Year: 1999
Top of Conservation Pool Flood Pool Encroachment Constraint Storage Reop Storage Inflow Outflow Reop Outflow
Oct
1,1
998
Nov
1,1
998
Dec
1,1
998
Jan
1,19
99
Feb
1,1
999
Mar
1,1
999
Apr
1,1
999
May
1,1
999
Jun
1,19
99
Jul 1
,199
9
Aug
1,1
999
Sep
1,1
999
Date/Time
0
100,000
200,000
300,000
400,000
500,000
600,000
700,000
800,000
900,000
1,000,000
Sto
rage
[acr
e-fe
et]
Spill Volume: 2 TAF
0
25,000
50,000
75,000
100,000
Flo
w R
ate
[cfs
]
New Bullards Bar Operations Plot
Water Year: 2000
Top of Conservation Pool Flood Pool Encroachment Constraint Storage Reop Storage Inflow Outflow Reop Outflow
Oct
1,1
999
Nov
1,1
999
Dec
1,1
999
Jan
1,20
00
Feb
1,2
000
Mar
1,2
000
Apr
1,2
000
May
1,2
000
Jun
1,20
00
Jul 1
,200
0
Aug
1,2
000
Sep
1,2
000
Date/Time
0
100,000
200,000
300,000
400,000
500,000
600,000
700,000
800,000
900,000
1,000,000
Sto
rage
[acr
e-fe
et]
0
25,000
50,000
75,000
100,000
Flo
w R
ate
[cfs
]
A: Reoperation Plots
101
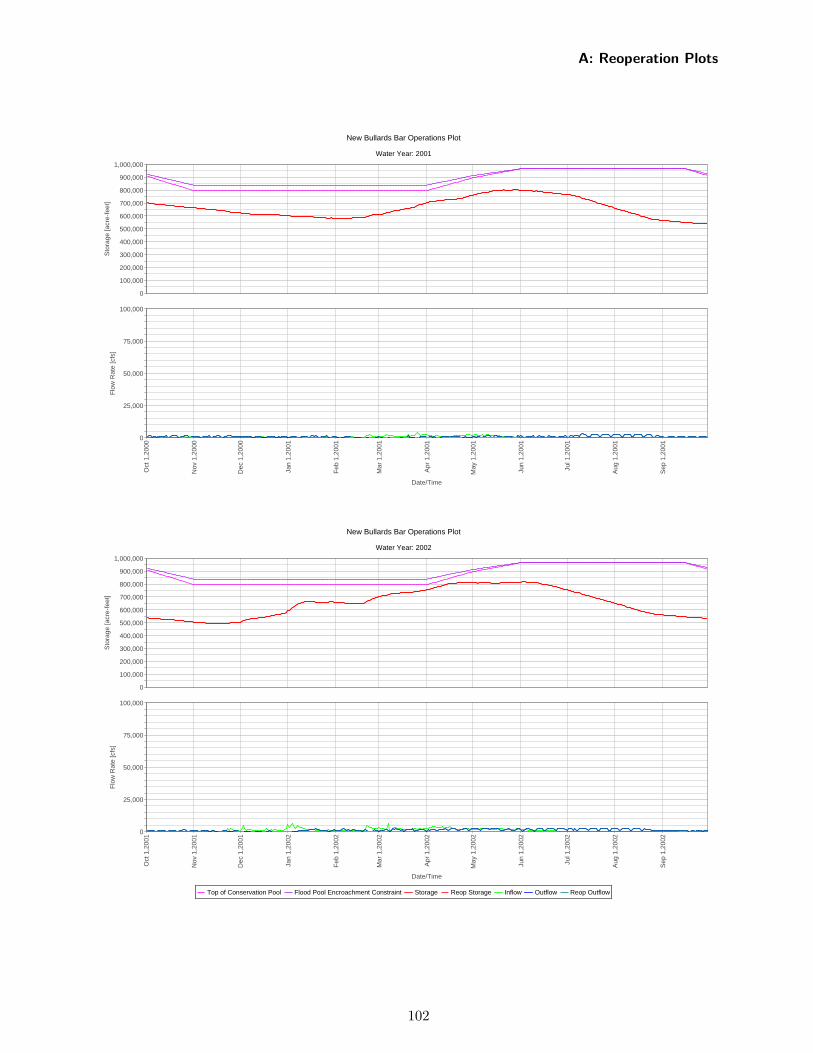
New Bullards Bar Operations Plot
Water Year: 2001
Top of Conservation Pool Flood Pool Encroachment Constraint Storage Reop Storage Inflow Outflow Reop Outflow
Oct
1,2
000
Nov
1,2
000
Dec
1,2
000
Jan
1,20
01
Feb
1,2
001
Mar
1,2
001
Apr
1,2
001
May
1,2
001
Jun
1,20
01
Jul 1
,200
1
Aug
1,2
001
Sep
1,2
001
Date/Time
0
100,000
200,000
300,000
400,000
500,000
600,000
700,000
800,000
900,000
1,000,000
Sto
rage
[acr
e-fe
et]
0
25,000
50,000
75,000
100,000
Flo
w R
ate
[cfs
]
New Bullards Bar Operations Plot
Water Year: 2002
Top of Conservation Pool Flood Pool Encroachment Constraint Storage Reop Storage Inflow Outflow Reop Outflow
Oct
1,2
001
Nov
1,2
001
Dec
1,2
001
Jan
1,20
02
Feb
1,2
002
Mar
1,2
002
Apr
1,2
002
May
1,2
002
Jun
1,20
02
Jul 1
,200
2
Aug
1,2
002
Sep
1,2
002
Date/Time
0
100,000
200,000
300,000
400,000
500,000
600,000
700,000
800,000
900,000
1,000,000
Sto
rage
[acr
e-fe
et]
0
25,000
50,000
75,000
100,000
Flo
w R
ate
[cfs
]
A: Reoperation Plots
102
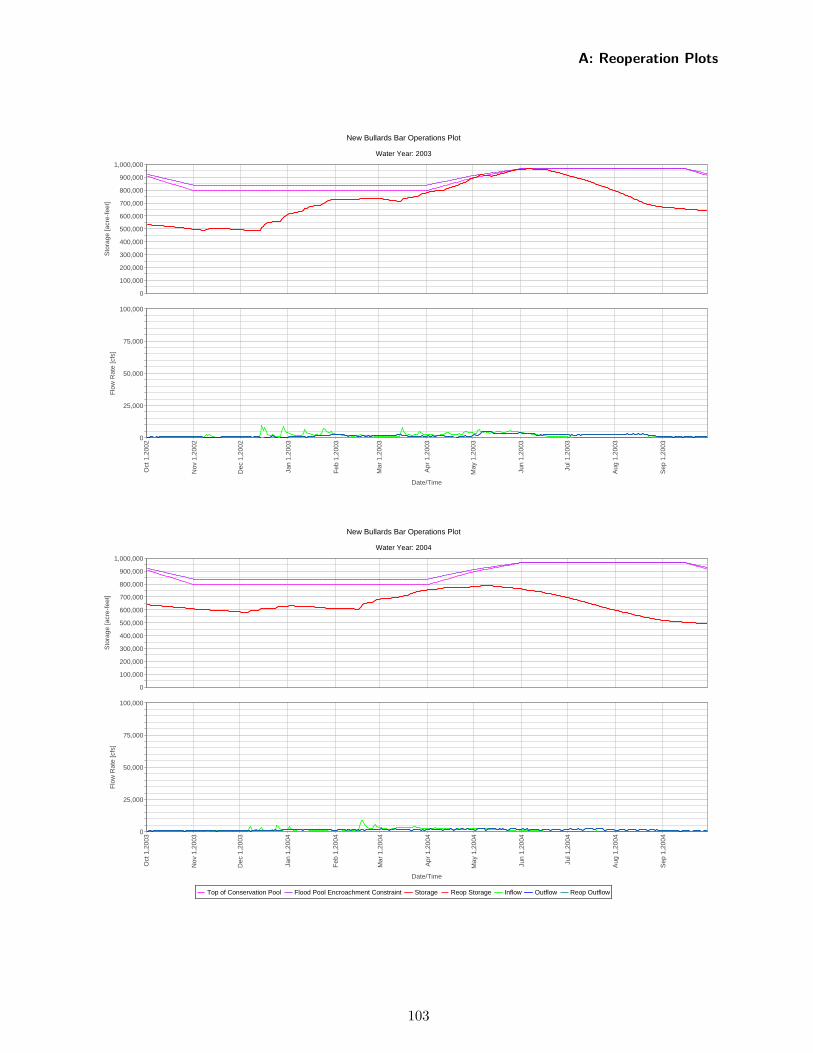
New Bullards Bar Operations Plot
Water Year: 2003
Top of Conservation Pool Flood Pool Encroachment Constraint Storage Reop Storage Inflow Outflow Reop Outflow
Oct
1,2
002
Nov
1,2
002
Dec
1,2
002
Jan
1,20
03
Feb
1,2
003
Mar
1,2
003
Apr
1,2
003
May
1,2
003
Jun
1,20
03
Jul 1
,200
3
Aug
1,2
003
Sep
1,2
003
Date/Time
0
100,000
200,000
300,000
400,000
500,000
600,000
700,000
800,000
900,000
1,000,000
Sto
rage
[acr
e-fe
et]
0
25,000
50,000
75,000
100,000
Flo
w R
ate
[cfs
]
New Bullards Bar Operations Plot
Water Year: 2004
Top of Conservation Pool Flood Pool Encroachment Constraint Storage Reop Storage Inflow Outflow Reop Outflow
Oct
1,2
003
Nov
1,2
003
Dec
1,2
003
Jan
1,20
04
Feb
1,2
004
Mar
1,2
004
Apr
1,2
004
May
1,2
004
Jun
1,20
04
Jul 1
,200
4
Aug
1,2
004
Sep
1,2
004
Date/Time
0
100,000
200,000
300,000
400,000
500,000
600,000
700,000
800,000
900,000
1,000,000
Sto
rage
[acr
e-fe
et]
0
25,000
50,000
75,000
100,000
Flo
w R
ate
[cfs
]
A: Reoperation Plots
103
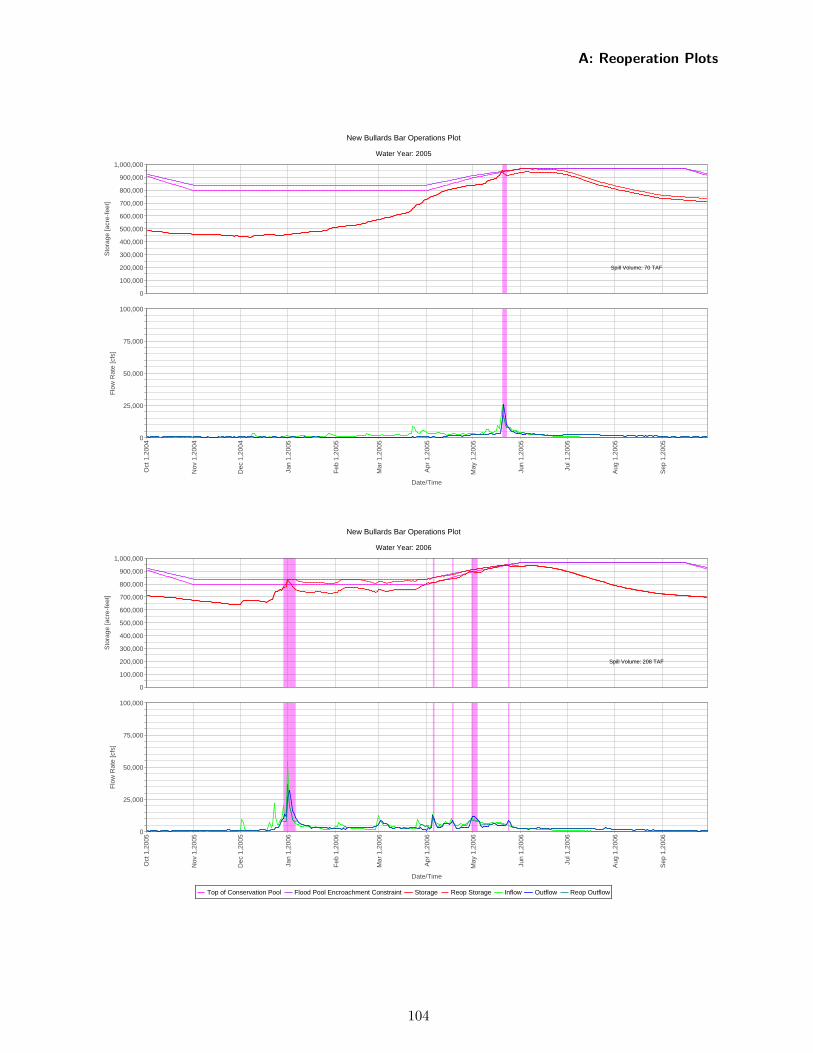
New Bullards Bar Operations Plot
Water Year: 2005
Top of Conservation Pool Flood Pool Encroachment Constraint Storage Reop Storage Inflow Outflow Reop Outflow
Oct
1,2
004
Nov
1,2
004
Dec
1,2
004
Jan
1,20
05
Feb
1,2
005
Mar
1,2
005
Apr
1,2
005
May
1,2
005
Jun
1,20
05
Jul 1
,200
5
Aug
1,2
005
Sep
1,2
005
Date/Time
0
100,000
200,000
300,000
400,000
500,000
600,000
700,000
800,000
900,000
1,000,000
Sto
rage
[acr
e-fe
et]
Spill Volume: 70 TAF
0
25,000
50,000
75,000
100,000
Flo
w R
ate
[cfs
]
New Bullards Bar Operations Plot
Water Year: 2006
Top of Conservation Pool Flood Pool Encroachment Constraint Storage Reop Storage Inflow Outflow Reop Outflow
Oct
1,2
005
Nov
1,2
005
Dec
1,2
005
Jan
1,20
06
Feb
1,2
006
Mar
1,2
006
Apr
1,2
006
May
1,2
006
Jun
1,20
06
Jul 1
,200
6
Aug
1,2
006
Sep
1,2
006
Date/Time
0
100,000
200,000
300,000
400,000
500,000
600,000
700,000
800,000
900,000
1,000,000
Sto
rage
[acr
e-fe
et]
Spill Volume: 208 TAF
0
25,000
50,000
75,000
100,000
Flo
w R
ate
[cfs
]
A: Reoperation Plots
104
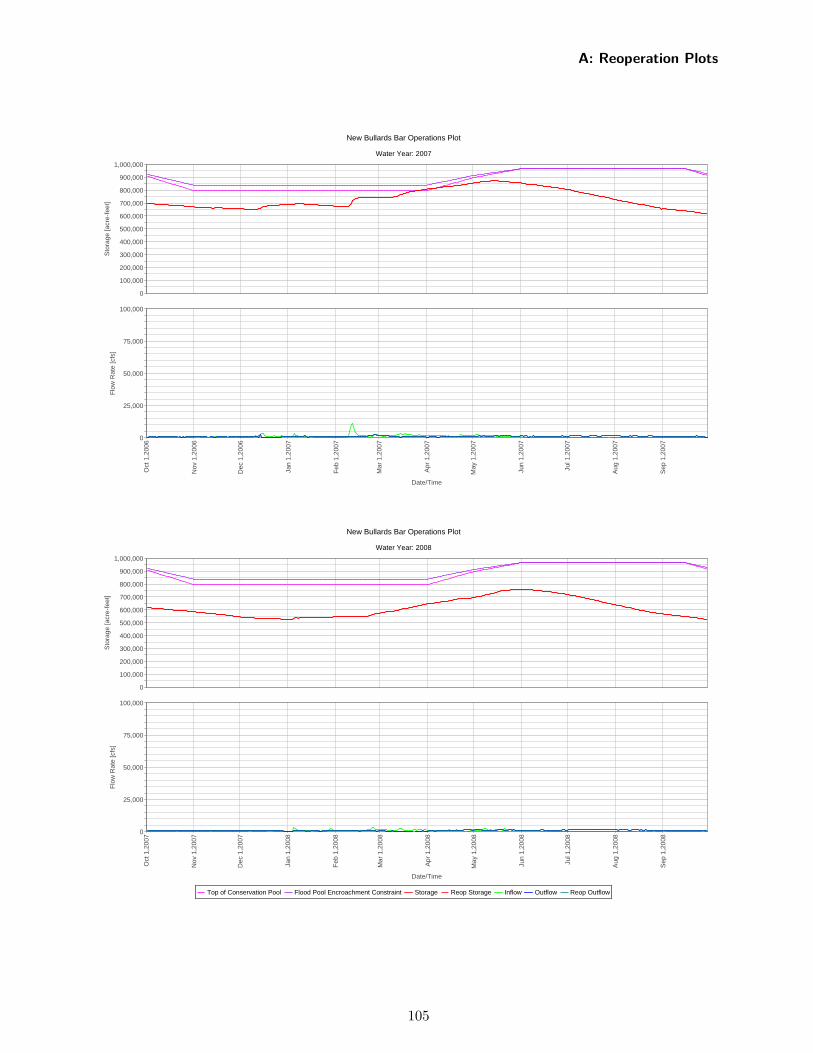
New Bullards Bar Operations Plot
Water Year: 2007
Top of Conservation Pool Flood Pool Encroachment Constraint Storage Reop Storage Inflow Outflow Reop Outflow
Oct
1,2
006
Nov
1,2
006
Dec
1,2
006
Jan
1,20
07
Feb
1,2
007
Mar
1,2
007
Apr
1,2
007
May
1,2
007
Jun
1,20
07
Jul 1
,200
7
Aug
1,2
007
Sep
1,2
007
Date/Time
0
100,000
200,000
300,000
400,000
500,000
600,000
700,000
800,000
900,000
1,000,000
Sto
rage
[acr
e-fe
et]
0
25,000
50,000
75,000
100,000
Flo
w R
ate
[cfs
]
New Bullards Bar Operations Plot
Water Year: 2008
Top of Conservation Pool Flood Pool Encroachment Constraint Storage Reop Storage Inflow Outflow Reop Outflow
Oct
1,2
007
Nov
1,2
007
Dec
1,2
007
Jan
1,20
08
Feb
1,2
008
Mar
1,2
008
Apr
1,2
008
May
1,2
008
Jun
1,20
08
Jul 1
,200
8
Aug
1,2
008
Sep
1,2
008
Date/Time
0
100,000
200,000
300,000
400,000
500,000
600,000
700,000
800,000
900,000
1,000,000
Sto
rage
[acr
e-fe
et]
0
25,000
50,000
75,000
100,000
Flo
w R
ate
[cfs
]
A: Reoperation Plots
105
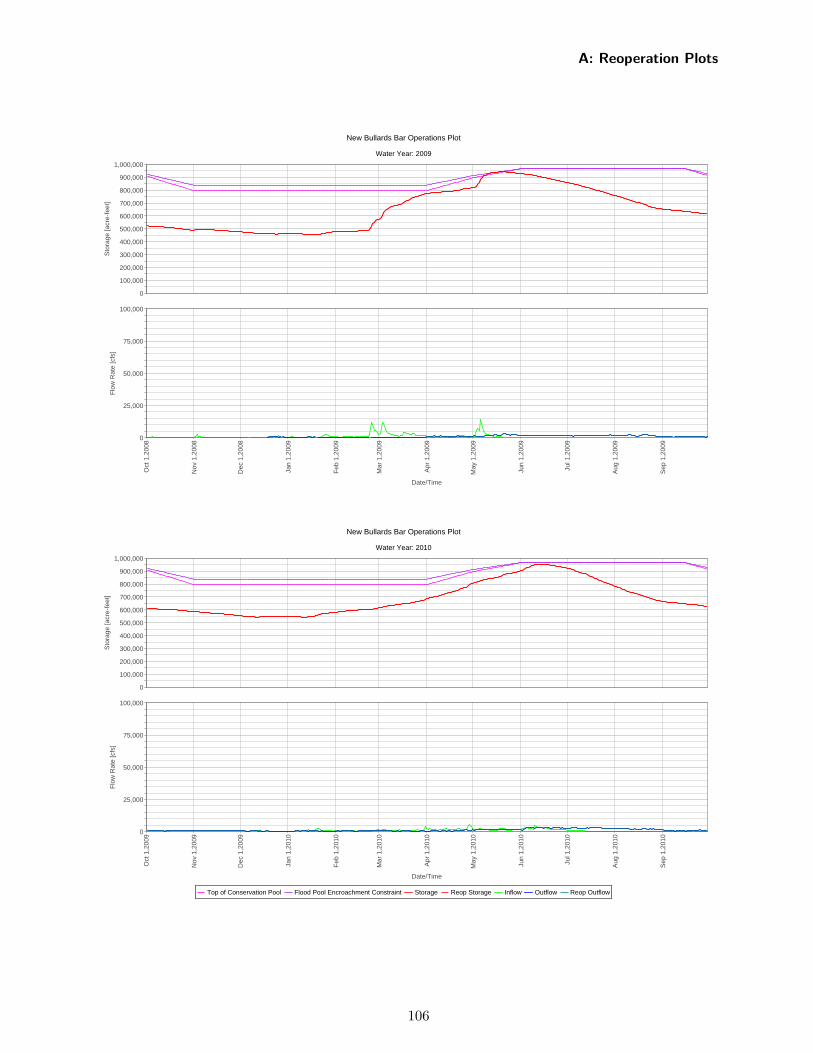
New Bullards Bar Operations Plot
Water Year: 2009
Top of Conservation Pool Flood Pool Encroachment Constraint Storage Reop Storage Inflow Outflow Reop Outflow
Oct
1,2
008
Nov
1,2
008
Dec
1,2
008
Jan
1,20
09
Feb
1,2
009
Mar
1,2
009
Apr
1,2
009
May
1,2
009
Jun
1,20
09
Jul 1
,200
9
Aug
1,2
009
Sep
1,2
009
Date/Time
0
100,000
200,000
300,000
400,000
500,000
600,000
700,000
800,000
900,000
1,000,000
Sto
rage
[acr
e-fe
et]
0
25,000
50,000
75,000
100,000
Flo
w R
ate
[cfs
]
New Bullards Bar Operations Plot
Water Year: 2010
Top of Conservation Pool Flood Pool Encroachment Constraint Storage Reop Storage Inflow Outflow Reop Outflow
Oct
1,2
009
Nov
1,2
009
Dec
1,2
009
Jan
1,20
10
Feb
1,2
010
Mar
1,2
010
Apr
1,2
010
May
1,2
010
Jun
1,20
10
Jul 1
,201
0
Aug
1,2
010
Sep
1,2
010
Date/Time
0
100,000
200,000
300,000
400,000
500,000
600,000
700,000
800,000
900,000
1,000,000
Sto
rage
[acr
e-fe
et]
0
25,000
50,000
75,000
100,000
Flo
w R
ate
[cfs
]
A: Reoperation Plots
106
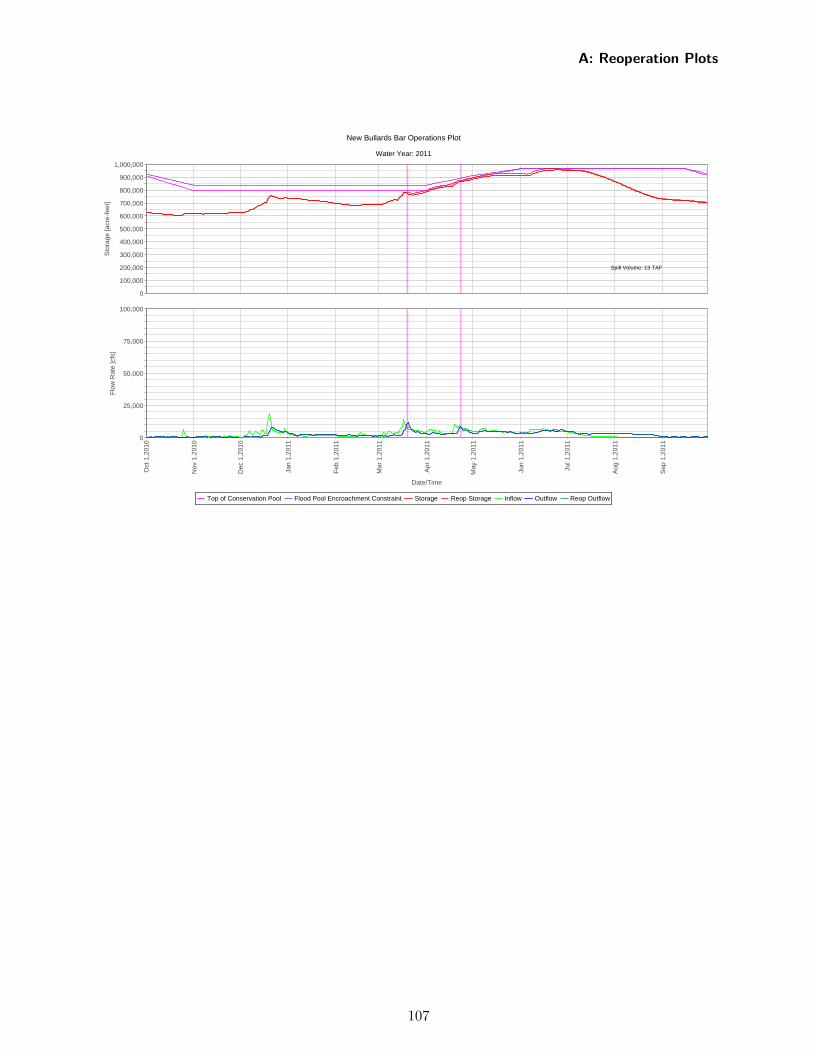
New Bullards Bar Operations Plot
Water Year: 2011
Top of Conservation Pool Flood Pool Encroachment Constraint Storage Reop Storage Inflow Outflow Reop Outflow
Oct
1,2
010
Nov
1,2
010
Dec
1,2
010
Jan
1,20
11
Feb
1,2
011
Mar
1,2
011
Apr
1,2
011
May
1,2
011
Jun
1,20
11
Jul 1
,201
1
Aug
1,2
011
Sep
1,2
011
Date/Time
0
100,000
200,000
300,000
400,000
500,000
600,000
700,000
800,000
900,000
1,000,000
Sto
rage
[acr
e-fe
et]
Spill Volume: 13 TAF
0
25,000
50,000
75,000
100,000
Flo
w R
ate
[cfs
]
A: Reoperation Plots
107
A: Reoperation Plots
A.4 Folsom
The following section includes the reoperation plots for Folsom Dam.
108
Folsom Operations Plot
Water Year: 1956
Top of Conservation Pool Flood Pool Encroachment Constraint Storage Reop Storage Inflow Outflow Reop Outflow
Oct
1,1
955
Nov
1,1
955
Dec
1,1
955
Jan
1,19
56
Feb
1,1
956
Mar
1,1
956
Apr
1,1
956
May
1,1
956
Jun
1,19
56
Jul 1
,195
6
Aug
1,1
956
Sep
1,1
956
Date/Time
0
200,000
400,000
600,000
800,000
1,000,000
1,200,000
Sto
rage
[acr
e-fe
et]
Spill Volume: 1259 TAF
0
25,000
50,000
75,000
100,000
125,000
150,000
175,000
200,000
Flo
w R
ate
[cfs
]
Folsom Operations Plot
Water Year: 1957
Top of Conservation Pool Flood Pool Encroachment Constraint Storage Reop Storage Inflow Outflow Reop Outflow
Oct
1,1
956
Nov
1,1
956
Dec
1,1
956
Jan
1,19
57
Feb
1,1
957
Mar
1,1
957
Apr
1,1
957
May
1,1
957
Jun
1,19
57
Jul 1
,195
7
Aug
1,1
957
Sep
1,1
957
Date/Time
0
200,000
400,000
600,000
800,000
1,000,000
1,200,000
Sto
rage
[acr
e-fe
et]
Spill Volume: 298 TAF
0
25,000
50,000
75,000
100,000
125,000
150,000
175,000
200,000
Flo
w R
ate
[cfs
]
A: Reoperation Plots
109
Folsom Operations Plot
Water Year: 1958
Top of Conservation Pool Flood Pool Encroachment Constraint Storage Reop Storage Inflow Outflow Reop Outflow
Oct
1,1
957
Nov
1,1
957
Dec
1,1
957
Jan
1,19
58
Feb
1,1
958
Mar
1,1
958
Apr
1,1
958
May
1,1
958
Jun
1,19
58
Jul 1
,195
8
Aug
1,1
958
Sep
1,1
958
Date/Time
0
200,000
400,000
600,000
800,000
1,000,000
1,200,000
Sto
rage
[acr
e-fe
et]
Spill Volume: 1195 TAF
0
25,000
50,000
75,000
100,000
125,000
150,000
175,000
200,000
Flo
w R
ate
[cfs
]
Folsom Operations Plot
Water Year: 1959
Top of Conservation Pool Flood Pool Encroachment Constraint Storage Reop Storage Inflow Outflow Reop Outflow
Oct
1,1
958
Nov
1,1
958
Dec
1,1
958
Jan
1,19
59
Feb
1,1
959
Mar
1,1
959
Apr
1,1
959
May
1,1
959
Jun
1,19
59
Jul 1
,195
9
Aug
1,1
959
Sep
1,1
959
Date/Time
0
200,000
400,000
600,000
800,000
1,000,000
1,200,000
Sto
rage
[acr
e-fe
et]
0
25,000
50,000
75,000
100,000
125,000
150,000
175,000
200,000
Flo
w R
ate
[cfs
]
A: Reoperation Plots
110
Folsom Operations Plot
Water Year: 1960
Top of Conservation Pool Flood Pool Encroachment Constraint Storage Reop Storage Inflow Outflow Reop Outflow
Oct
1,1
959
Nov
1,1
959
Dec
1,1
959
Jan
1,19
60
Feb
1,1
960
Mar
1,1
960
Apr
1,1
960
May
1,1
960
Jun
1,19
60
Jul 1
,196
0
Aug
1,1
960
Sep
1,1
960
Date/Time
0
200,000
400,000
600,000
800,000
1,000,000
1,200,000
Sto
rage
[acr
e-fe
et]
Spill Volume: 8 TAF
0
25,000
50,000
75,000
100,000
125,000
150,000
175,000
200,000
Flo
w R
ate
[cfs
]
Folsom Operations Plot
Water Year: 1961
Top of Conservation Pool Flood Pool Encroachment Constraint Storage Reop Storage Inflow Outflow Reop Outflow
Oct
1,1
960
Nov
1,1
960
Dec
1,1
960
Jan
1,19
61
Feb
1,1
961
Mar
1,1
961
Apr
1,1
961
May
1,1
961
Jun
1,19
61
Jul 1
,196
1
Aug
1,1
961
Sep
1,1
961
Date/Time
0
200,000
400,000
600,000
800,000
1,000,000
1,200,000
Sto
rage
[acr
e-fe
et]
0
25,000
50,000
75,000
100,000
125,000
150,000
175,000
200,000
Flo
w R
ate
[cfs
]
A: Reoperation Plots
111
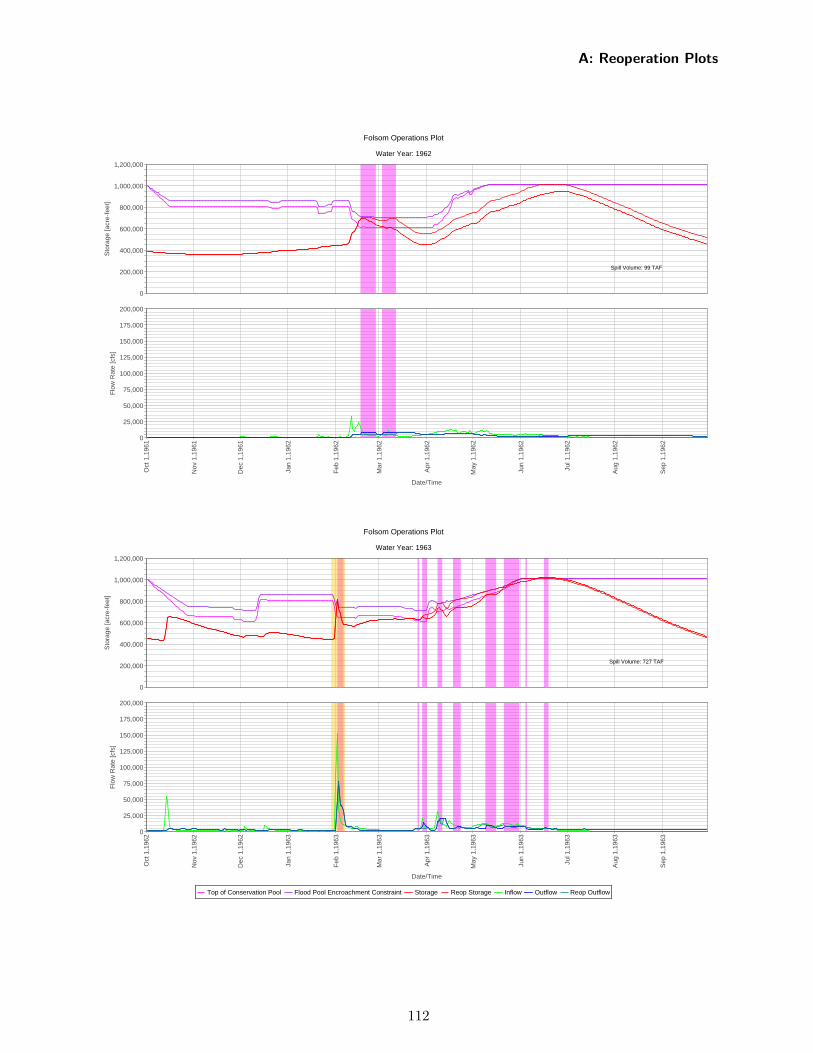
Folsom Operations Plot
Water Year: 1962
Top of Conservation Pool Flood Pool Encroachment Constraint Storage Reop Storage Inflow Outflow Reop Outflow
Oct
1,1
961
Nov
1,1
961
Dec
1,1
961
Jan
1,19
62
Feb
1,1
962
Mar
1,1
962
Apr
1,1
962
May
1,1
962
Jun
1,19
62
Jul 1
,196
2
Aug
1,1
962
Sep
1,1
962
Date/Time
0
200,000
400,000
600,000
800,000
1,000,000
1,200,000
Sto
rage
[acr
e-fe
et]
Spill Volume: 99 TAF
0
25,000
50,000
75,000
100,000
125,000
150,000
175,000
200,000
Flo
w R
ate
[cfs
]
Folsom Operations Plot
Water Year: 1963
Top of Conservation Pool Flood Pool Encroachment Constraint Storage Reop Storage Inflow Outflow Reop Outflow
Oct
1,1
962
Nov
1,1
962
Dec
1,1
962
Jan
1,19
63
Feb
1,1
963
Mar
1,1
963
Apr
1,1
963
May
1,1
963
Jun
1,19
63
Jul 1
,196
3
Aug
1,1
963
Sep
1,1
963
Date/Time
0
200,000
400,000
600,000
800,000
1,000,000
1,200,000
Sto
rage
[acr
e-fe
et]
Spill Volume: 727 TAF
0
25,000
50,000
75,000
100,000
125,000
150,000
175,000
200,000
Flo
w R
ate
[cfs
]
A: Reoperation Plots
112
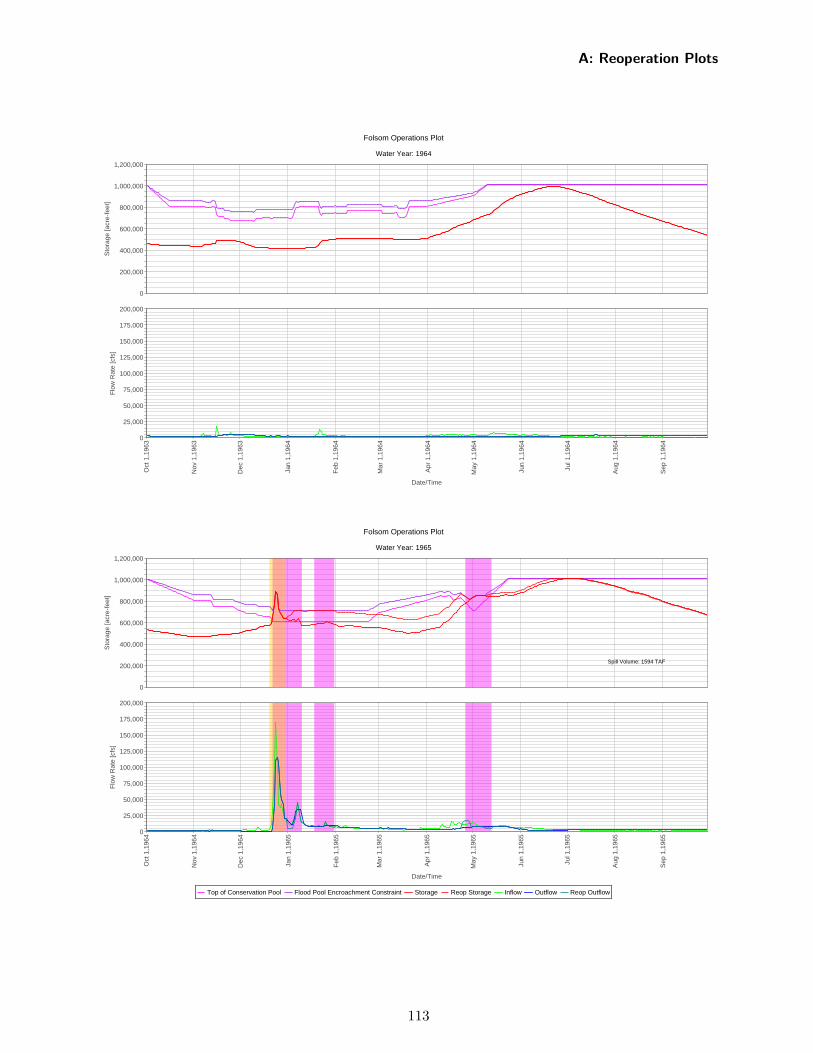
Folsom Operations Plot
Water Year: 1964
Top of Conservation Pool Flood Pool Encroachment Constraint Storage Reop Storage Inflow Outflow Reop Outflow
Oct
1,1
963
Nov
1,1
963
Dec
1,1
963
Jan
1,19
64
Feb
1,1
964
Mar
1,1
964
Apr
1,1
964
May
1,1
964
Jun
1,19
64
Jul 1
,196
4
Aug
1,1
964
Sep
1,1
964
Date/Time
0
200,000
400,000
600,000
800,000
1,000,000
1,200,000
Sto
rage
[acr
e-fe
et]
0
25,000
50,000
75,000
100,000
125,000
150,000
175,000
200,000
Flo
w R
ate
[cfs
]
Folsom Operations Plot
Water Year: 1965
Top of Conservation Pool Flood Pool Encroachment Constraint Storage Reop Storage Inflow Outflow Reop Outflow
Oct
1,1
964
Nov
1,1
964
Dec
1,1
964
Jan
1,19
65
Feb
1,1
965
Mar
1,1
965
Apr
1,1
965
May
1,1
965
Jun
1,19
65
Jul 1
,196
5
Aug
1,1
965
Sep
1,1
965
Date/Time
0
200,000
400,000
600,000
800,000
1,000,000
1,200,000
Sto
rage
[acr
e-fe
et]
Spill Volume: 1594 TAF
0
25,000
50,000
75,000
100,000
125,000
150,000
175,000
200,000
Flo
w R
ate
[cfs
]
A: Reoperation Plots
113
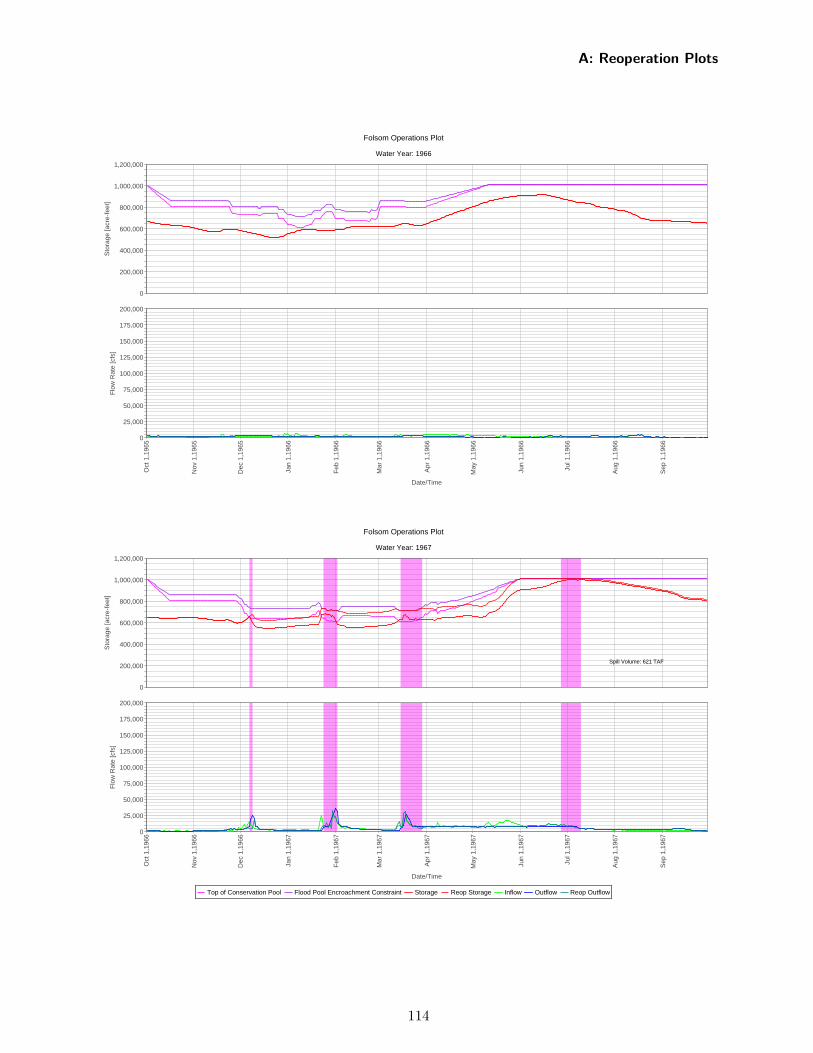
Folsom Operations Plot
Water Year: 1966
Top of Conservation Pool Flood Pool Encroachment Constraint Storage Reop Storage Inflow Outflow Reop Outflow
Oct
1,1
965
Nov
1,1
965
Dec
1,1
965
Jan
1,19
66
Feb
1,1
966
Mar
1,1
966
Apr
1,1
966
May
1,1
966
Jun
1,19
66
Jul 1
,196
6
Aug
1,1
966
Sep
1,1
966
Date/Time
0
200,000
400,000
600,000
800,000
1,000,000
1,200,000
Sto
rage
[acr
e-fe
et]
0
25,000
50,000
75,000
100,000
125,000
150,000
175,000
200,000
Flo
w R
ate
[cfs
]
Folsom Operations Plot
Water Year: 1967
Top of Conservation Pool Flood Pool Encroachment Constraint Storage Reop Storage Inflow Outflow Reop Outflow
Oct
1,1
966
Nov
1,1
966
Dec
1,1
966
Jan
1,19
67
Feb
1,1
967
Mar
1,1
967
Apr
1,1
967
May
1,1
967
Jun
1,19
67
Jul 1
,196
7
Aug
1,1
967
Sep
1,1
967
Date/Time
0
200,000
400,000
600,000
800,000
1,000,000
1,200,000
Sto
rage
[acr
e-fe
et]
Spill Volume: 621 TAF
0
25,000
50,000
75,000
100,000
125,000
150,000
175,000
200,000
Flo
w R
ate
[cfs
]
A: Reoperation Plots
114
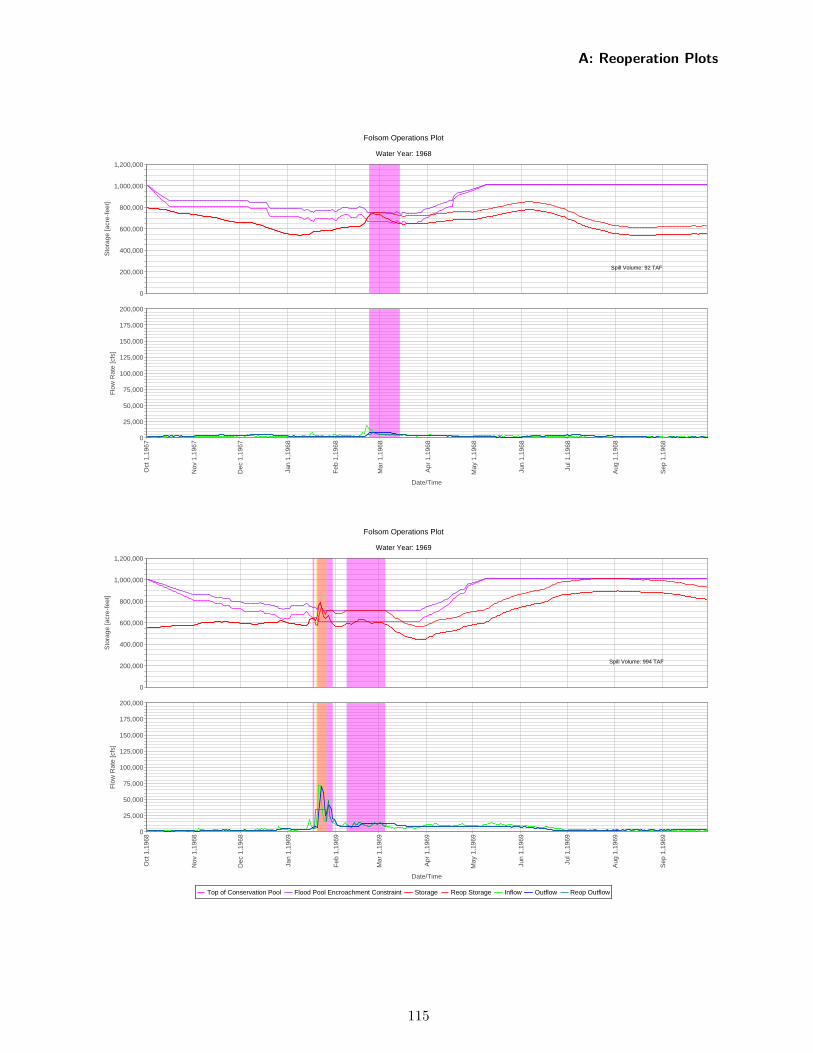
Folsom Operations Plot
Water Year: 1968
Top of Conservation Pool Flood Pool Encroachment Constraint Storage Reop Storage Inflow Outflow Reop Outflow
Oct
1,1
967
Nov
1,1
967
Dec
1,1
967
Jan
1,19
68
Feb
1,1
968
Mar
1,1
968
Apr
1,1
968
May
1,1
968
Jun
1,19
68
Jul 1
,196
8
Aug
1,1
968
Sep
1,1
968
Date/Time
0
200,000
400,000
600,000
800,000
1,000,000
1,200,000
Sto
rage
[acr
e-fe
et]
Spill Volume: 92 TAF
0
25,000
50,000
75,000
100,000
125,000
150,000
175,000
200,000
Flo
w R
ate
[cfs
]
Folsom Operations Plot
Water Year: 1969
Top of Conservation Pool Flood Pool Encroachment Constraint Storage Reop Storage Inflow Outflow Reop Outflow
Oct
1,1
968
Nov
1,1
968
Dec
1,1
968
Jan
1,19
69
Feb
1,1
969
Mar
1,1
969
Apr
1,1
969
May
1,1
969
Jun
1,19
69
Jul 1
,196
9
Aug
1,1
969
Sep
1,1
969
Date/Time
0
200,000
400,000
600,000
800,000
1,000,000
1,200,000
Sto
rage
[acr
e-fe
et]
Spill Volume: 994 TAF
0
25,000
50,000
75,000
100,000
125,000
150,000
175,000
200,000
Flo
w R
ate
[cfs
]
A: Reoperation Plots
115
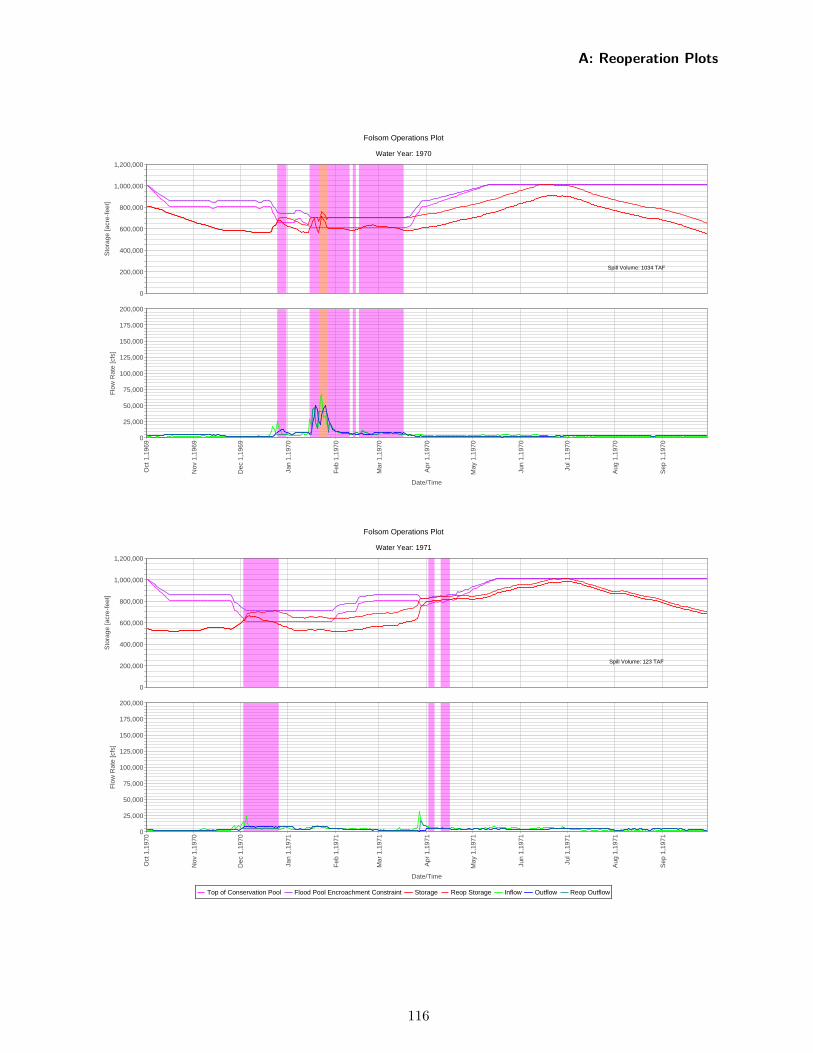
Folsom Operations Plot
Water Year: 1970
Top of Conservation Pool Flood Pool Encroachment Constraint Storage Reop Storage Inflow Outflow Reop Outflow
Oct
1,1
969
Nov
1,1
969
Dec
1,1
969
Jan
1,19
70
Feb
1,1
970
Mar
1,1
970
Apr
1,1
970
May
1,1
970
Jun
1,19
70
Jul 1
,197
0
Aug
1,1
970
Sep
1,1
970
Date/Time
0
200,000
400,000
600,000
800,000
1,000,000
1,200,000
Sto
rage
[acr
e-fe
et]
Spill Volume: 1034 TAF
0
25,000
50,000
75,000
100,000
125,000
150,000
175,000
200,000
Flo
w R
ate
[cfs
]
Folsom Operations Plot
Water Year: 1971
Top of Conservation Pool Flood Pool Encroachment Constraint Storage Reop Storage Inflow Outflow Reop Outflow
Oct
1,1
970
Nov
1,1
970
Dec
1,1
970
Jan
1,19
71
Feb
1,1
971
Mar
1,1
971
Apr
1,1
971
May
1,1
971
Jun
1,19
71
Jul 1
,197
1
Aug
1,1
971
Sep
1,1
971
Date/Time
0
200,000
400,000
600,000
800,000
1,000,000
1,200,000
Sto
rage
[acr
e-fe
et]
Spill Volume: 123 TAF
0
25,000
50,000
75,000
100,000
125,000
150,000
175,000
200,000
Flo
w R
ate
[cfs
]
A: Reoperation Plots
116
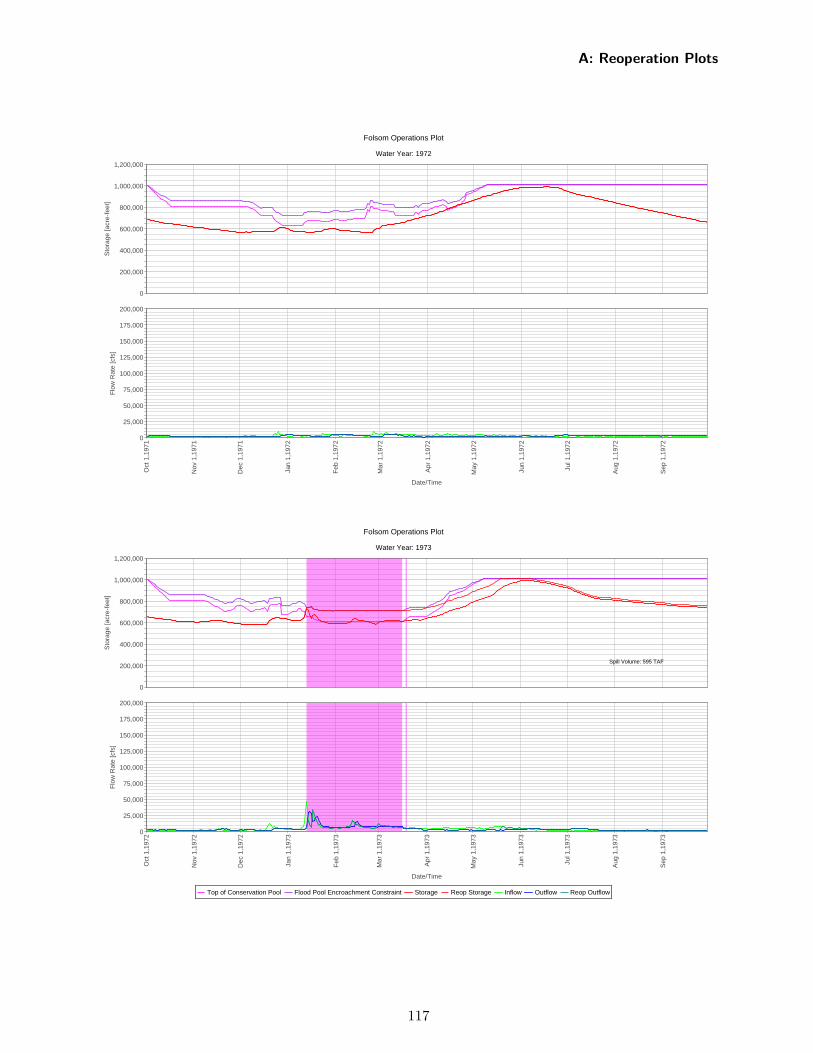
Folsom Operations Plot
Water Year: 1972
Top of Conservation Pool Flood Pool Encroachment Constraint Storage Reop Storage Inflow Outflow Reop Outflow
Oct
1,1
971
Nov
1,1
971
Dec
1,1
971
Jan
1,19
72
Feb
1,1
972
Mar
1,1
972
Apr
1,1
972
May
1,1
972
Jun
1,19
72
Jul 1
,197
2
Aug
1,1
972
Sep
1,1
972
Date/Time
0
200,000
400,000
600,000
800,000
1,000,000
1,200,000
Sto
rage
[acr
e-fe
et]
0
25,000
50,000
75,000
100,000
125,000
150,000
175,000
200,000
Flo
w R
ate
[cfs
]
Folsom Operations Plot
Water Year: 1973
Top of Conservation Pool Flood Pool Encroachment Constraint Storage Reop Storage Inflow Outflow Reop Outflow
Oct
1,1
972
Nov
1,1
972
Dec
1,1
972
Jan
1,19
73
Feb
1,1
973
Mar
1,1
973
Apr
1,1
973
May
1,1
973
Jun
1,19
73
Jul 1
,197
3
Aug
1,1
973
Sep
1,1
973
Date/Time
0
200,000
400,000
600,000
800,000
1,000,000
1,200,000
Sto
rage
[acr
e-fe
et]
Spill Volume: 595 TAF
0
25,000
50,000
75,000
100,000
125,000
150,000
175,000
200,000
Flo
w R
ate
[cfs
]
A: Reoperation Plots
117
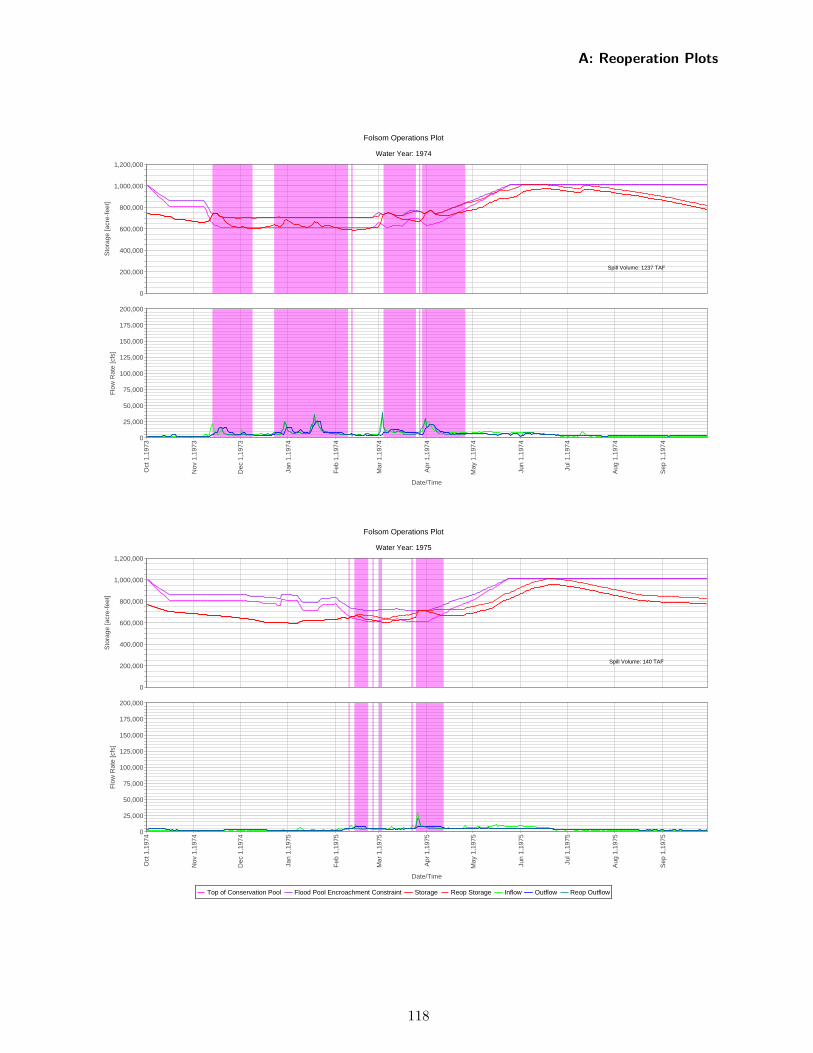
Folsom Operations Plot
Water Year: 1974
Top of Conservation Pool Flood Pool Encroachment Constraint Storage Reop Storage Inflow Outflow Reop Outflow
Oct
1,1
973
Nov
1,1
973
Dec
1,1
973
Jan
1,19
74
Feb
1,1
974
Mar
1,1
974
Apr
1,1
974
May
1,1
974
Jun
1,19
74
Jul 1
,197
4
Aug
1,1
974
Sep
1,1
974
Date/Time
0
200,000
400,000
600,000
800,000
1,000,000
1,200,000
Sto
rage
[acr
e-fe
et]
Spill Volume: 1237 TAF
0
25,000
50,000
75,000
100,000
125,000
150,000
175,000
200,000
Flo
w R
ate
[cfs
]
Folsom Operations Plot
Water Year: 1975
Top of Conservation Pool Flood Pool Encroachment Constraint Storage Reop Storage Inflow Outflow Reop Outflow
Oct
1,1
974
Nov
1,1
974
Dec
1,1
974
Jan
1,19
75
Feb
1,1
975
Mar
1,1
975
Apr
1,1
975
May
1,1
975
Jun
1,19
75
Jul 1
,197
5
Aug
1,1
975
Sep
1,1
975
Date/Time
0
200,000
400,000
600,000
800,000
1,000,000
1,200,000
Sto
rage
[acr
e-fe
et]
Spill Volume: 140 TAF
0
25,000
50,000
75,000
100,000
125,000
150,000
175,000
200,000
Flo
w R
ate
[cfs
]
A: Reoperation Plots
118
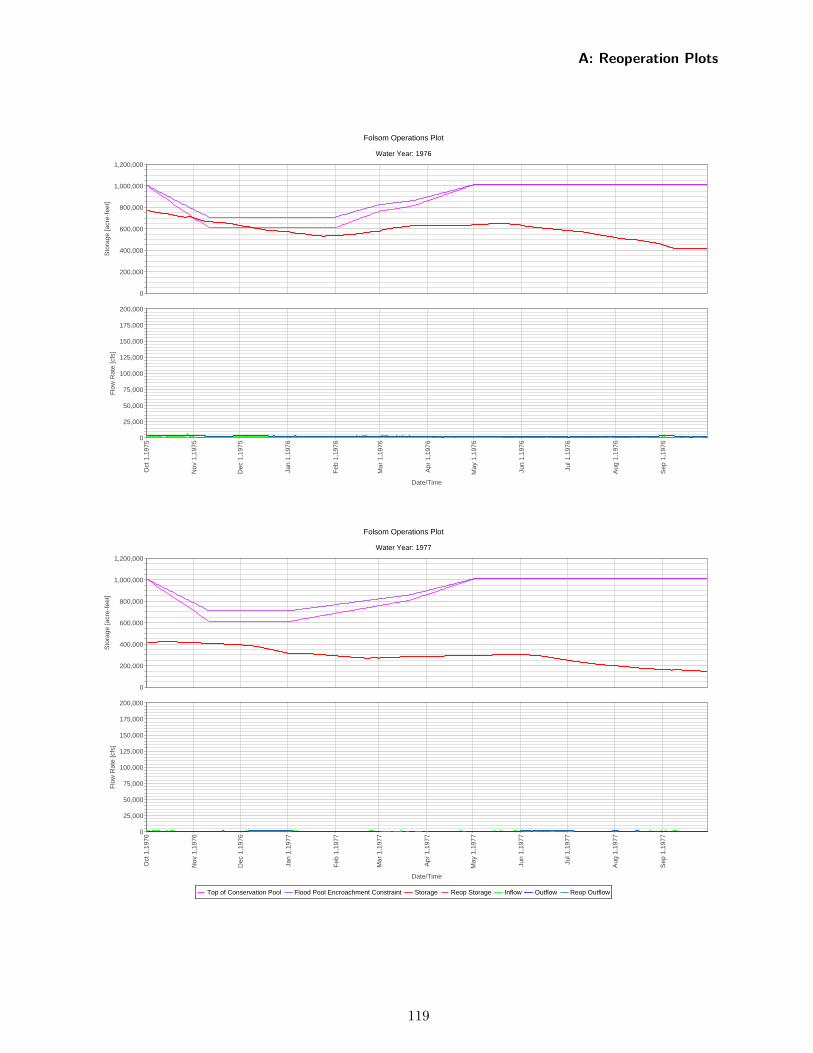
Folsom Operations Plot
Water Year: 1976
Top of Conservation Pool Flood Pool Encroachment Constraint Storage Reop Storage Inflow Outflow Reop Outflow
Oct
1,1
975
Nov
1,1
975
Dec
1,1
975
Jan
1,19
76
Feb
1,1
976
Mar
1,1
976
Apr
1,1
976
May
1,1
976
Jun
1,19
76
Jul 1
,197
6
Aug
1,1
976
Sep
1,1
976
Date/Time
0
200,000
400,000
600,000
800,000
1,000,000
1,200,000
Sto
rage
[acr
e-fe
et]
0
25,000
50,000
75,000
100,000
125,000
150,000
175,000
200,000
Flo
w R
ate
[cfs
]
Folsom Operations Plot
Water Year: 1977
Top of Conservation Pool Flood Pool Encroachment Constraint Storage Reop Storage Inflow Outflow Reop Outflow
Oct
1,1
976
Nov
1,1
976
Dec
1,1
976
Jan
1,19
77
Feb
1,1
977
Mar
1,1
977
Apr
1,1
977
May
1,1
977
Jun
1,19
77
Jul 1
,197
7
Aug
1,1
977
Sep
1,1
977
Date/Time
0
200,000
400,000
600,000
800,000
1,000,000
1,200,000
Sto
rage
[acr
e-fe
et]
0
25,000
50,000
75,000
100,000
125,000
150,000
175,000
200,000
Flo
w R
ate
[cfs
]
A: Reoperation Plots
119
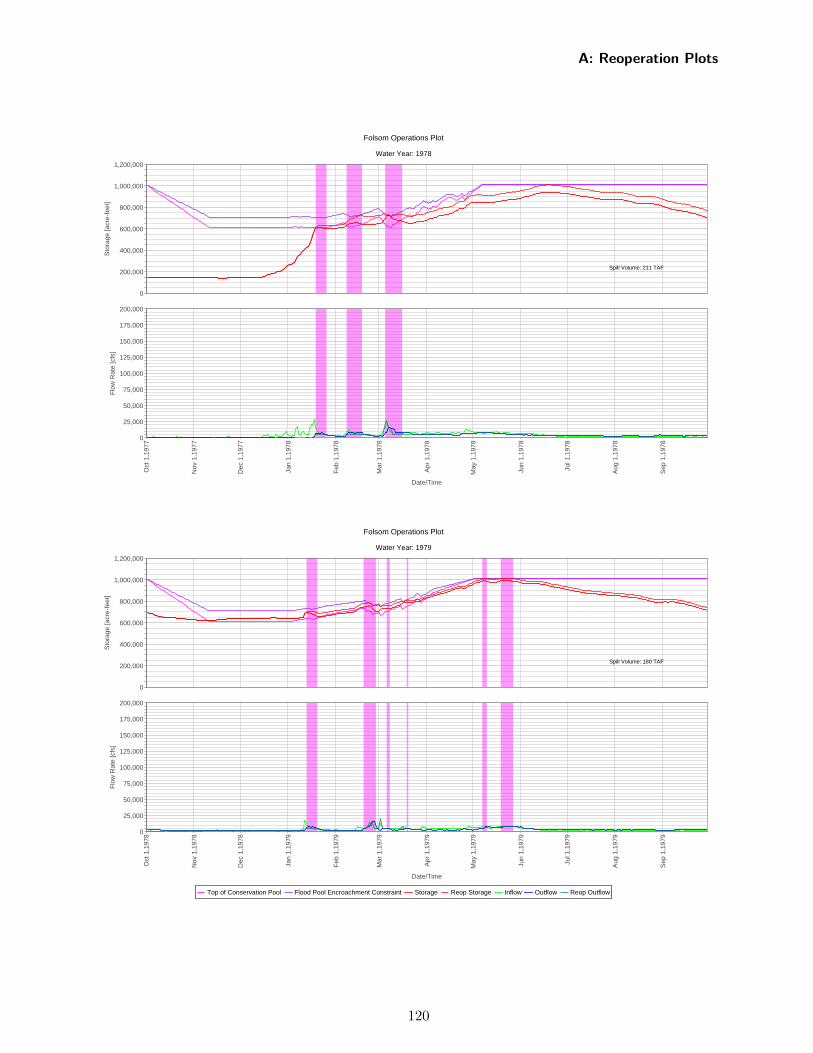
Folsom Operations Plot
Water Year: 1978
Top of Conservation Pool Flood Pool Encroachment Constraint Storage Reop Storage Inflow Outflow Reop Outflow
Oct
1,1
977
Nov
1,1
977
Dec
1,1
977
Jan
1,19
78
Feb
1,1
978
Mar
1,1
978
Apr
1,1
978
May
1,1
978
Jun
1,19
78
Jul 1
,197
8
Aug
1,1
978
Sep
1,1
978
Date/Time
0
200,000
400,000
600,000
800,000
1,000,000
1,200,000
Sto
rage
[acr
e-fe
et]
Spill Volume: 211 TAF
0
25,000
50,000
75,000
100,000
125,000
150,000
175,000
200,000
Flo
w R
ate
[cfs
]
Folsom Operations Plot
Water Year: 1979
Top of Conservation Pool Flood Pool Encroachment Constraint Storage Reop Storage Inflow Outflow Reop Outflow
Oct
1,1
978
Nov
1,1
978
Dec
1,1
978
Jan
1,19
79
Feb
1,1
979
Mar
1,1
979
Apr
1,1
979
May
1,1
979
Jun
1,19
79
Jul 1
,197
9
Aug
1,1
979
Sep
1,1
979
Date/Time
0
200,000
400,000
600,000
800,000
1,000,000
1,200,000
Sto
rage
[acr
e-fe
et]
Spill Volume: 180 TAF
0
25,000
50,000
75,000
100,000
125,000
150,000
175,000
200,000
Flo
w R
ate
[cfs
]
A: Reoperation Plots
120
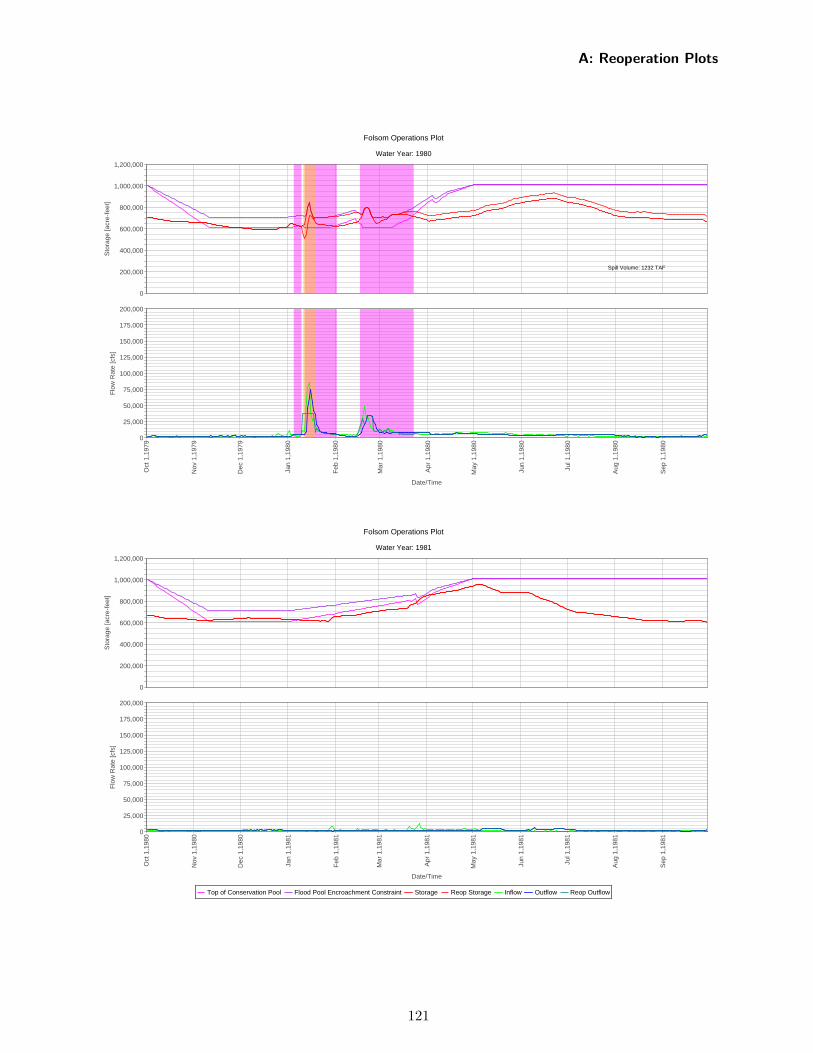
Folsom Operations Plot
Water Year: 1980
Top of Conservation Pool Flood Pool Encroachment Constraint Storage Reop Storage Inflow Outflow Reop Outflow
Oct
1,1
979
Nov
1,1
979
Dec
1,1
979
Jan
1,19
80
Feb
1,1
980
Mar
1,1
980
Apr
1,1
980
May
1,1
980
Jun
1,19
80
Jul 1
,198
0
Aug
1,1
980
Sep
1,1
980
Date/Time
0
200,000
400,000
600,000
800,000
1,000,000
1,200,000
Sto
rage
[acr
e-fe
et]
Spill Volume: 1232 TAF
0
25,000
50,000
75,000
100,000
125,000
150,000
175,000
200,000
Flo
w R
ate
[cfs
]
Folsom Operations Plot
Water Year: 1981
Top of Conservation Pool Flood Pool Encroachment Constraint Storage Reop Storage Inflow Outflow Reop Outflow
Oct
1,1
980
Nov
1,1
980
Dec
1,1
980
Jan
1,19
81
Feb
1,1
981
Mar
1,1
981
Apr
1,1
981
May
1,1
981
Jun
1,19
81
Jul 1
,198
1
Aug
1,1
981
Sep
1,1
981
Date/Time
0
200,000
400,000
600,000
800,000
1,000,000
1,200,000
Sto
rage
[acr
e-fe
et]
0
25,000
50,000
75,000
100,000
125,000
150,000
175,000
200,000
Flo
w R
ate
[cfs
]
A: Reoperation Plots
121
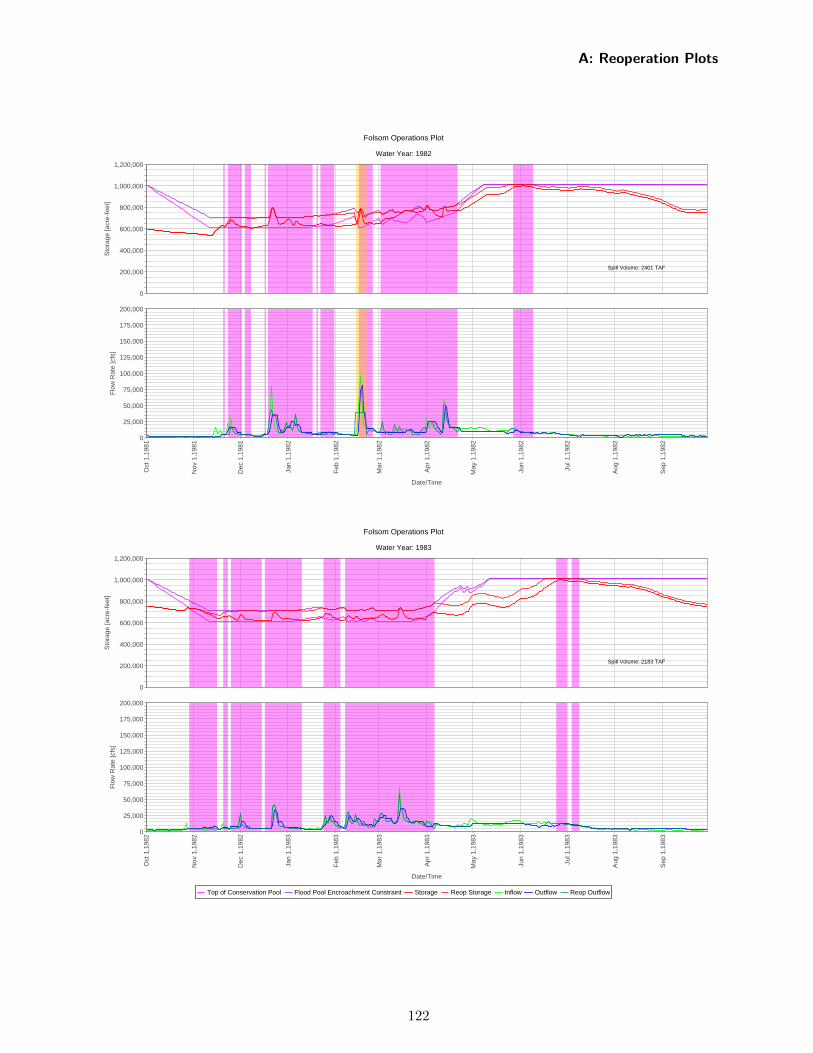
Folsom Operations Plot
Water Year: 1982
Top of Conservation Pool Flood Pool Encroachment Constraint Storage Reop Storage Inflow Outflow Reop Outflow
Oct
1,1
981
Nov
1,1
981
Dec
1,1
981
Jan
1,19
82
Feb
1,1
982
Mar
1,1
982
Apr
1,1
982
May
1,1
982
Jun
1,19
82
Jul 1
,198
2
Aug
1,1
982
Sep
1,1
982
Date/Time
0
200,000
400,000
600,000
800,000
1,000,000
1,200,000
Sto
rage
[acr
e-fe
et]
Spill Volume: 2401 TAF
0
25,000
50,000
75,000
100,000
125,000
150,000
175,000
200,000
Flo
w R
ate
[cfs
]
Folsom Operations Plot
Water Year: 1983
Top of Conservation Pool Flood Pool Encroachment Constraint Storage Reop Storage Inflow Outflow Reop Outflow
Oct
1,1
982
Nov
1,1
982
Dec
1,1
982
Jan
1,19
83
Feb
1,1
983
Mar
1,1
983
Apr
1,1
983
May
1,1
983
Jun
1,19
83
Jul 1
,198
3
Aug
1,1
983
Sep
1,1
983
Date/Time
0
200,000
400,000
600,000
800,000
1,000,000
1,200,000
Sto
rage
[acr
e-fe
et]
Spill Volume: 2183 TAF
0
25,000
50,000
75,000
100,000
125,000
150,000
175,000
200,000
Flo
w R
ate
[cfs
]
A: Reoperation Plots
122
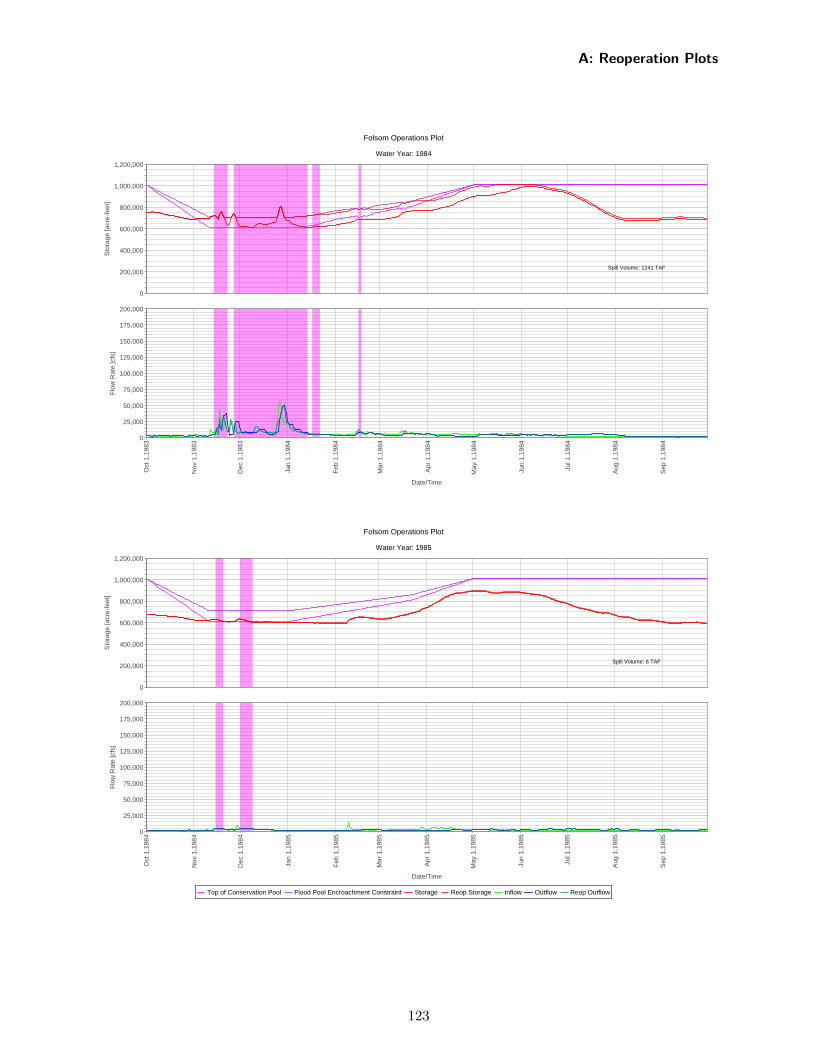
Folsom Operations Plot
Water Year: 1984
Top of Conservation Pool Flood Pool Encroachment Constraint Storage Reop Storage Inflow Outflow Reop Outflow
Oct
1,1
983
Nov
1,1
983
Dec
1,1
983
Jan
1,19
84
Feb
1,1
984
Mar
1,1
984
Apr
1,1
984
May
1,1
984
Jun
1,19
84
Jul 1
,198
4
Aug
1,1
984
Sep
1,1
984
Date/Time
0
200,000
400,000
600,000
800,000
1,000,000
1,200,000
Sto
rage
[acr
e-fe
et]
Spill Volume: 1241 TAF
0
25,000
50,000
75,000
100,000
125,000
150,000
175,000
200,000
Flo
w R
ate
[cfs
]
Folsom Operations Plot
Water Year: 1985
Top of Conservation Pool Flood Pool Encroachment Constraint Storage Reop Storage Inflow Outflow Reop Outflow
Oct
1,1
984
Nov
1,1
984
Dec
1,1
984
Jan
1,19
85
Feb
1,1
985
Mar
1,1
985
Apr
1,1
985
May
1,1
985
Jun
1,19
85
Jul 1
,198
5
Aug
1,1
985
Sep
1,1
985
Date/Time
0
200,000
400,000
600,000
800,000
1,000,000
1,200,000
Sto
rage
[acr
e-fe
et]
Spill Volume: 6 TAF
0
25,000
50,000
75,000
100,000
125,000
150,000
175,000
200,000
Flo
w R
ate
[cfs
]
A: Reoperation Plots
123
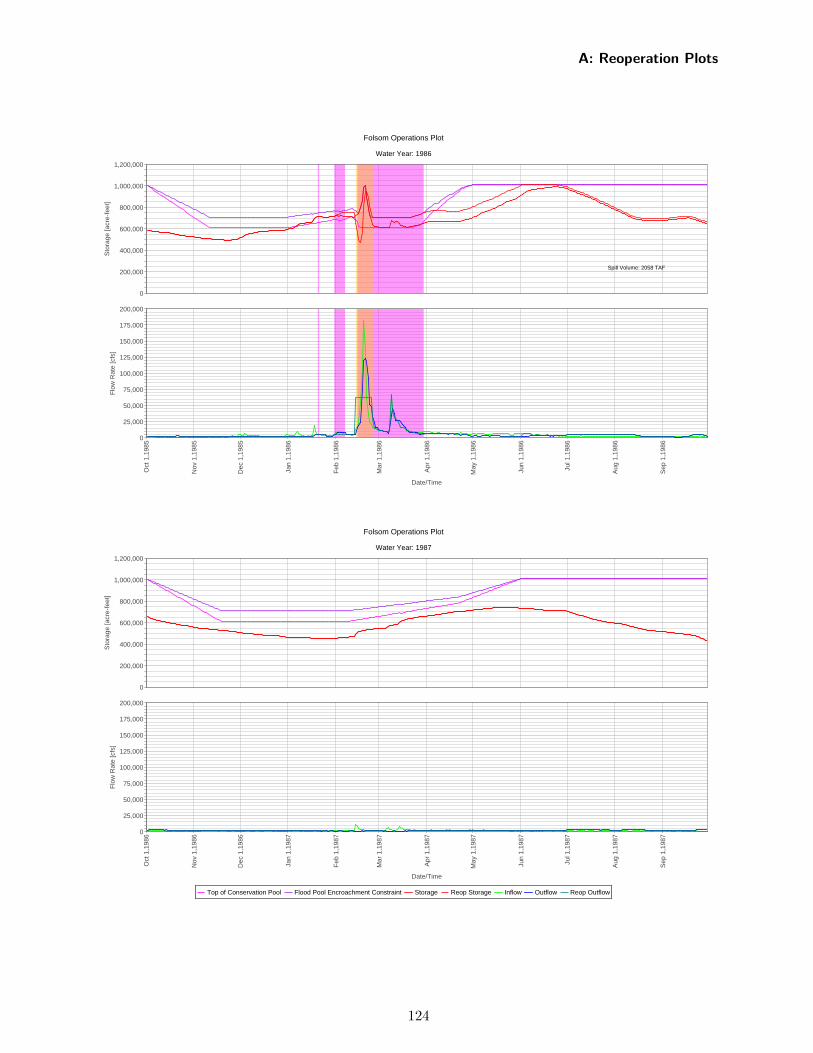
Folsom Operations Plot
Water Year: 1986
Top of Conservation Pool Flood Pool Encroachment Constraint Storage Reop Storage Inflow Outflow Reop Outflow
Oct
1,1
985
Nov
1,1
985
Dec
1,1
985
Jan
1,19
86
Feb
1,1
986
Mar
1,1
986
Apr
1,1
986
May
1,1
986
Jun
1,19
86
Jul 1
,198
6
Aug
1,1
986
Sep
1,1
986
Date/Time
0
200,000
400,000
600,000
800,000
1,000,000
1,200,000
Sto
rage
[acr
e-fe
et]
Spill Volume: 2058 TAF
0
25,000
50,000
75,000
100,000
125,000
150,000
175,000
200,000
Flo
w R
ate
[cfs
]
Folsom Operations Plot
Water Year: 1987
Top of Conservation Pool Flood Pool Encroachment Constraint Storage Reop Storage Inflow Outflow Reop Outflow
Oct
1,1
986
Nov
1,1
986
Dec
1,1
986
Jan
1,19
87
Feb
1,1
987
Mar
1,1
987
Apr
1,1
987
May
1,1
987
Jun
1,19
87
Jul 1
,198
7
Aug
1,1
987
Sep
1,1
987
Date/Time
0
200,000
400,000
600,000
800,000
1,000,000
1,200,000
Sto
rage
[acr
e-fe
et]
0
25,000
50,000
75,000
100,000
125,000
150,000
175,000
200,000
Flo
w R
ate
[cfs
]
A: Reoperation Plots
124
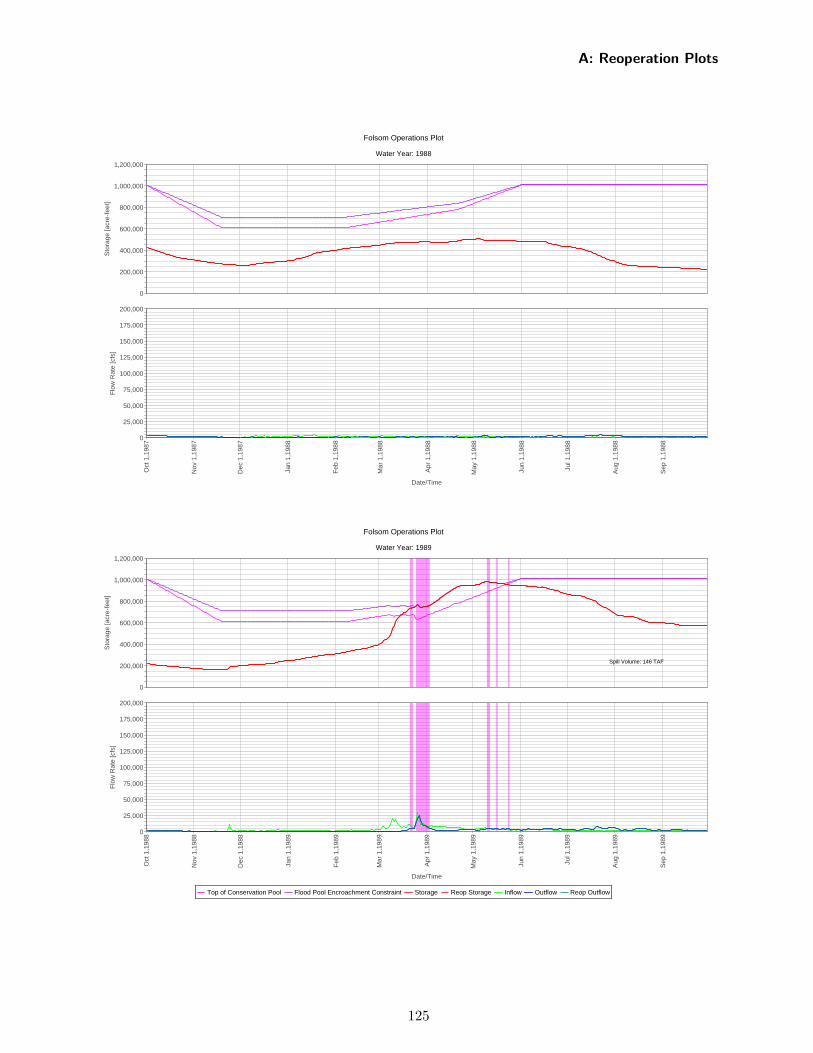
Folsom Operations Plot
Water Year: 1988
Top of Conservation Pool Flood Pool Encroachment Constraint Storage Reop Storage Inflow Outflow Reop Outflow
Oct
1,1
987
Nov
1,1
987
Dec
1,1
987
Jan
1,19
88
Feb
1,1
988
Mar
1,1
988
Apr
1,1
988
May
1,1
988
Jun
1,19
88
Jul 1
,198
8
Aug
1,1
988
Sep
1,1
988
Date/Time
0
200,000
400,000
600,000
800,000
1,000,000
1,200,000
Sto
rage
[acr
e-fe
et]
0
25,000
50,000
75,000
100,000
125,000
150,000
175,000
200,000
Flo
w R
ate
[cfs
]
Folsom Operations Plot
Water Year: 1989
Top of Conservation Pool Flood Pool Encroachment Constraint Storage Reop Storage Inflow Outflow Reop Outflow
Oct
1,1
988
Nov
1,1
988
Dec
1,1
988
Jan
1,19
89
Feb
1,1
989
Mar
1,1
989
Apr
1,1
989
May
1,1
989
Jun
1,19
89
Jul 1
,198
9
Aug
1,1
989
Sep
1,1
989
Date/Time
0
200,000
400,000
600,000
800,000
1,000,000
1,200,000
Sto
rage
[acr
e-fe
et]
Spill Volume: 146 TAF
0
25,000
50,000
75,000
100,000
125,000
150,000
175,000
200,000
Flo
w R
ate
[cfs
]
A: Reoperation Plots
125
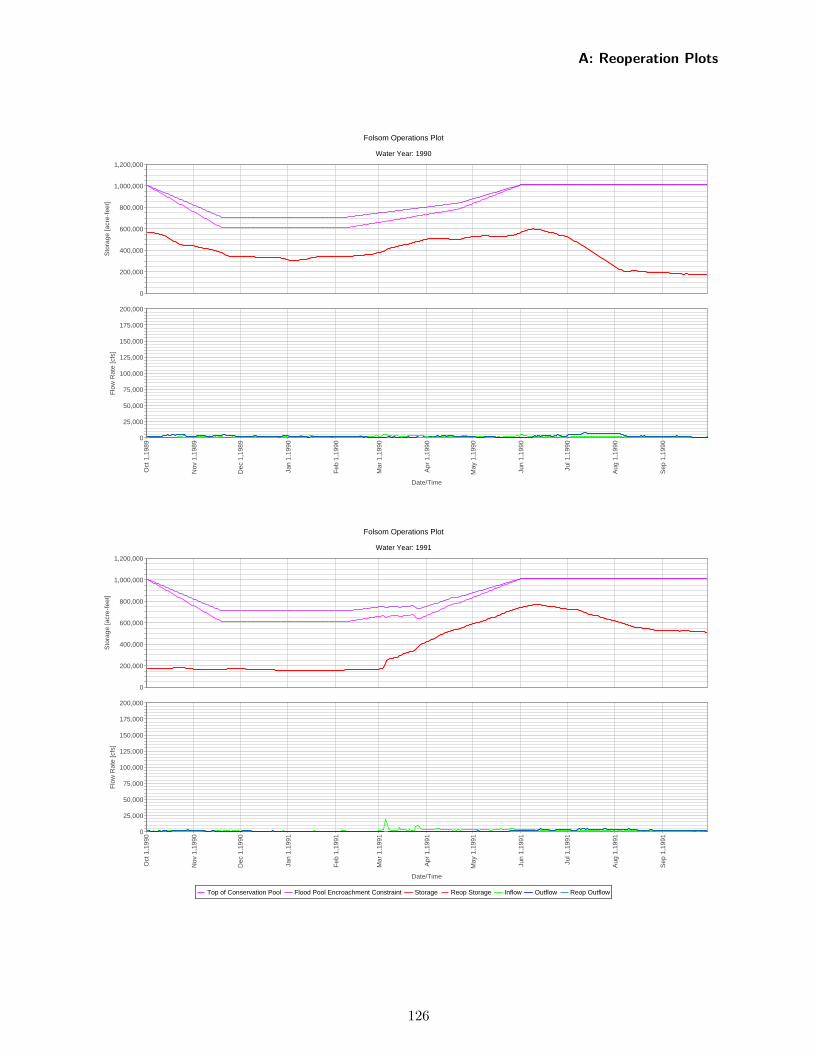
Folsom Operations Plot
Water Year: 1990
Top of Conservation Pool Flood Pool Encroachment Constraint Storage Reop Storage Inflow Outflow Reop Outflow
Oct
1,1
989
Nov
1,1
989
Dec
1,1
989
Jan
1,19
90
Feb
1,1
990
Mar
1,1
990
Apr
1,1
990
May
1,1
990
Jun
1,19
90
Jul 1
,199
0
Aug
1,1
990
Sep
1,1
990
Date/Time
0
200,000
400,000
600,000
800,000
1,000,000
1,200,000
Sto
rage
[acr
e-fe
et]
0
25,000
50,000
75,000
100,000
125,000
150,000
175,000
200,000
Flo
w R
ate
[cfs
]
Folsom Operations Plot
Water Year: 1991
Top of Conservation Pool Flood Pool Encroachment Constraint Storage Reop Storage Inflow Outflow Reop Outflow
Oct
1,1
990
Nov
1,1
990
Dec
1,1
990
Jan
1,19
91
Feb
1,1
991
Mar
1,1
991
Apr
1,1
991
May
1,1
991
Jun
1,19
91
Jul 1
,199
1
Aug
1,1
991
Sep
1,1
991
Date/Time
0
200,000
400,000
600,000
800,000
1,000,000
1,200,000
Sto
rage
[acr
e-fe
et]
0
25,000
50,000
75,000
100,000
125,000
150,000
175,000
200,000
Flo
w R
ate
[cfs
]
A: Reoperation Plots
126
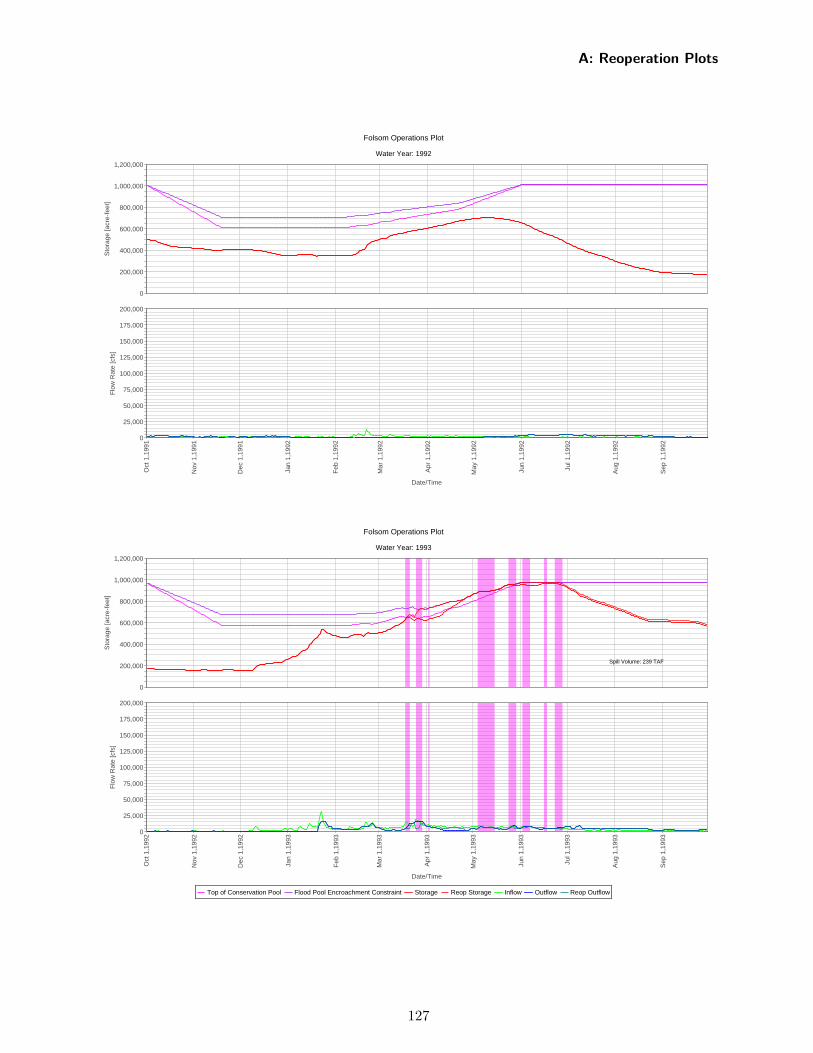
Folsom Operations Plot
Water Year: 1992
Top of Conservation Pool Flood Pool Encroachment Constraint Storage Reop Storage Inflow Outflow Reop Outflow
Oct
1,1
991
Nov
1,1
991
Dec
1,1
991
Jan
1,19
92
Feb
1,1
992
Mar
1,1
992
Apr
1,1
992
May
1,1
992
Jun
1,19
92
Jul 1
,199
2
Aug
1,1
992
Sep
1,1
992
Date/Time
0
200,000
400,000
600,000
800,000
1,000,000
1,200,000
Sto
rage
[acr
e-fe
et]
0
25,000
50,000
75,000
100,000
125,000
150,000
175,000
200,000
Flo
w R
ate
[cfs
]
Folsom Operations Plot
Water Year: 1993
Top of Conservation Pool Flood Pool Encroachment Constraint Storage Reop Storage Inflow Outflow Reop Outflow
Oct
1,1
992
Nov
1,1
992
Dec
1,1
992
Jan
1,19
93
Feb
1,1
993
Mar
1,1
993
Apr
1,1
993
May
1,1
993
Jun
1,19
93
Jul 1
,199
3
Aug
1,1
993
Sep
1,1
993
Date/Time
0
200,000
400,000
600,000
800,000
1,000,000
1,200,000
Sto
rage
[acr
e-fe
et]
Spill Volume: 239 TAF
0
25,000
50,000
75,000
100,000
125,000
150,000
175,000
200,000
Flo
w R
ate
[cfs
]
A: Reoperation Plots
127
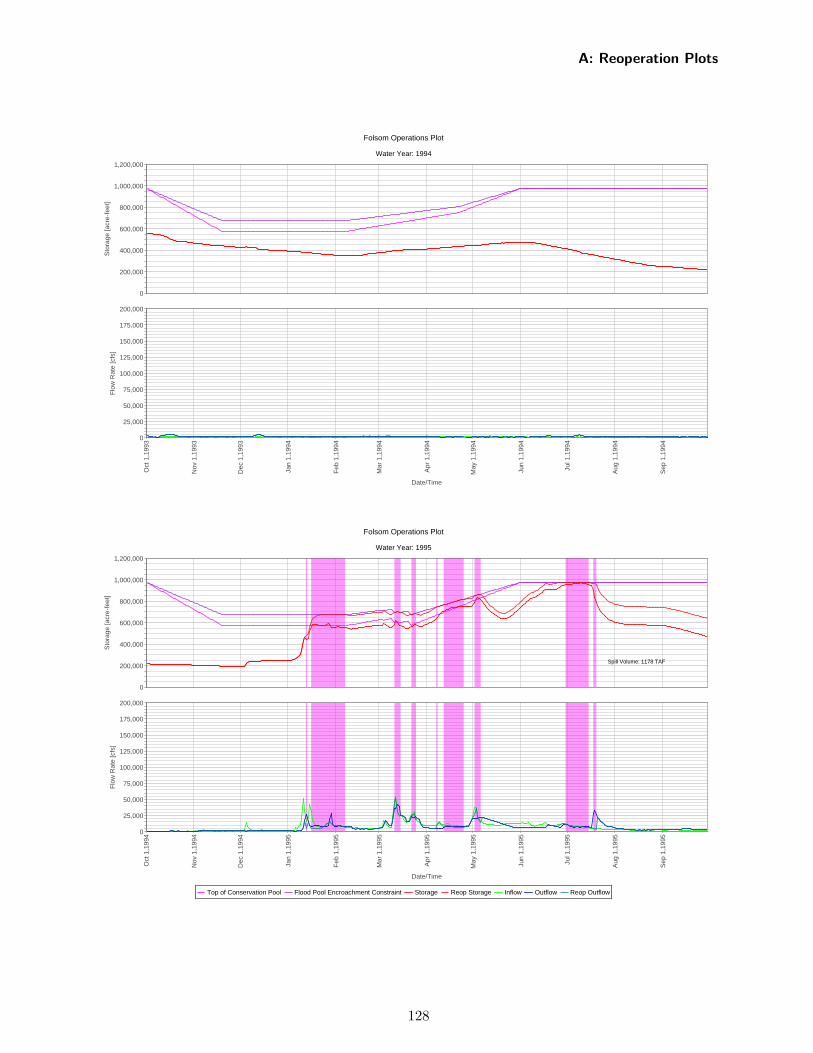
Folsom Operations Plot
Water Year: 1994
Top of Conservation Pool Flood Pool Encroachment Constraint Storage Reop Storage Inflow Outflow Reop Outflow
Oct
1,1
993
Nov
1,1
993
Dec
1,1
993
Jan
1,19
94
Feb
1,1
994
Mar
1,1
994
Apr
1,1
994
May
1,1
994
Jun
1,19
94
Jul 1
,199
4
Aug
1,1
994
Sep
1,1
994
Date/Time
0
200,000
400,000
600,000
800,000
1,000,000
1,200,000
Sto
rage
[acr
e-fe
et]
0
25,000
50,000
75,000
100,000
125,000
150,000
175,000
200,000
Flo
w R
ate
[cfs
]
Folsom Operations Plot
Water Year: 1995
Top of Conservation Pool Flood Pool Encroachment Constraint Storage Reop Storage Inflow Outflow Reop Outflow
Oct
1,1
994
Nov
1,1
994
Dec
1,1
994
Jan
1,19
95
Feb
1,1
995
Mar
1,1
995
Apr
1,1
995
May
1,1
995
Jun
1,19
95
Jul 1
,199
5
Aug
1,1
995
Sep
1,1
995
Date/Time
0
200,000
400,000
600,000
800,000
1,000,000
1,200,000
Sto
rage
[acr
e-fe
et]
Spill Volume: 1178 TAF
0
25,000
50,000
75,000
100,000
125,000
150,000
175,000
200,000
Flo
w R
ate
[cfs
]
A: Reoperation Plots
128
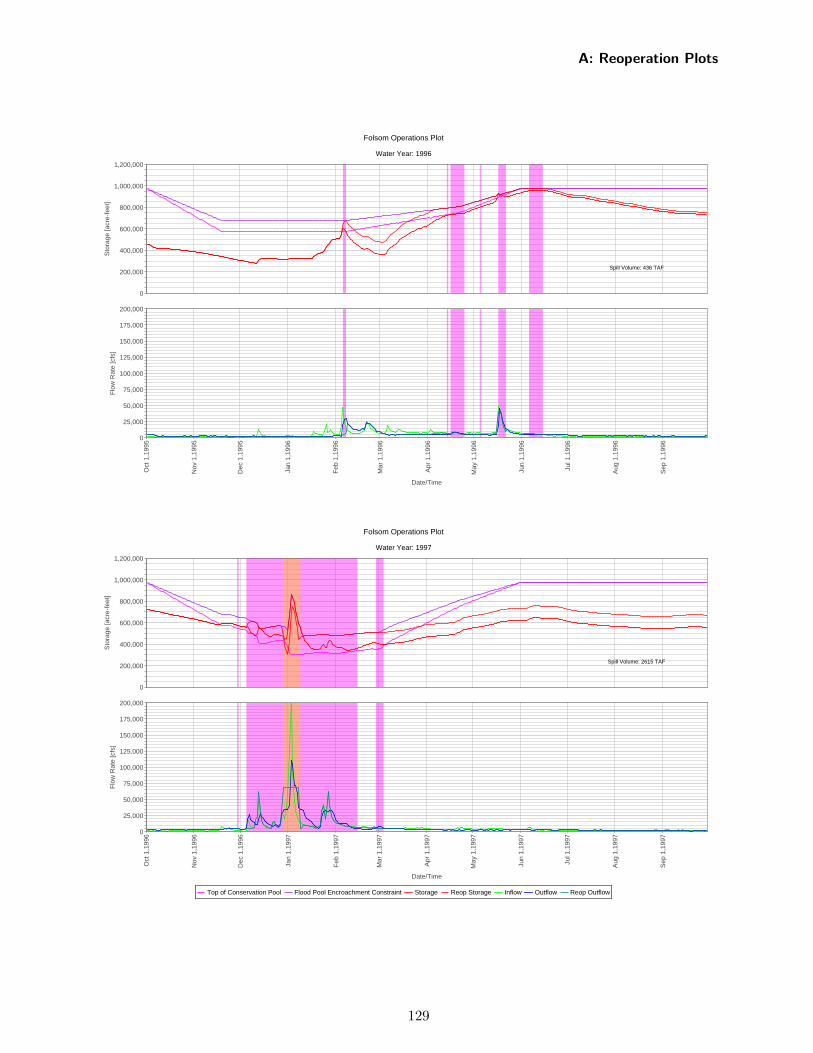
Folsom Operations Plot
Water Year: 1996
Top of Conservation Pool Flood Pool Encroachment Constraint Storage Reop Storage Inflow Outflow Reop Outflow
Oct
1,1
995
Nov
1,1
995
Dec
1,1
995
Jan
1,19
96
Feb
1,1
996
Mar
1,1
996
Apr
1,1
996
May
1,1
996
Jun
1,19
96
Jul 1
,199
6
Aug
1,1
996
Sep
1,1
996
Date/Time
0
200,000
400,000
600,000
800,000
1,000,000
1,200,000
Sto
rage
[acr
e-fe
et]
Spill Volume: 436 TAF
0
25,000
50,000
75,000
100,000
125,000
150,000
175,000
200,000
Flo
w R
ate
[cfs
]
Folsom Operations Plot
Water Year: 1997
Top of Conservation Pool Flood Pool Encroachment Constraint Storage Reop Storage Inflow Outflow Reop Outflow
Oct
1,1
996
Nov
1,1
996
Dec
1,1
996
Jan
1,19
97
Feb
1,1
997
Mar
1,1
997
Apr
1,1
997
May
1,1
997
Jun
1,19
97
Jul 1
,199
7
Aug
1,1
997
Sep
1,1
997
Date/Time
0
200,000
400,000
600,000
800,000
1,000,000
1,200,000
Sto
rage
[acr
e-fe
et]
Spill Volume: 2615 TAF
0
25,000
50,000
75,000
100,000
125,000
150,000
175,000
200,000
Flo
w R
ate
[cfs
]
A: Reoperation Plots
129
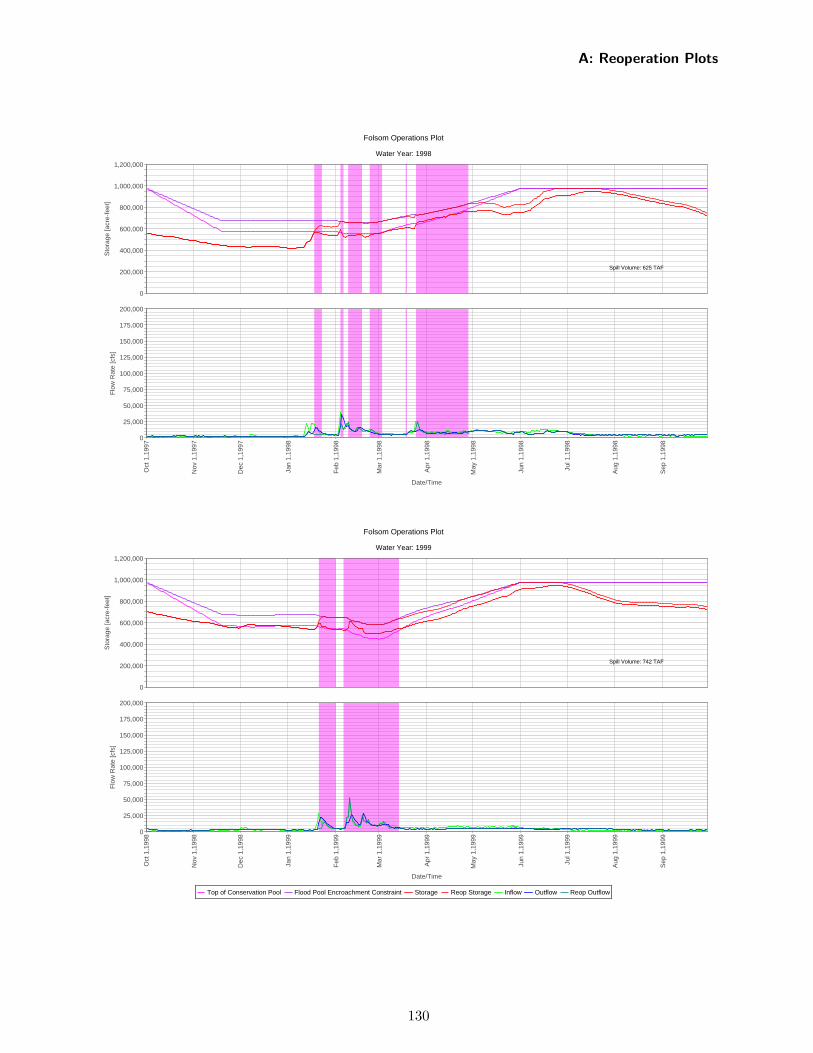
Folsom Operations Plot
Water Year: 1998
Top of Conservation Pool Flood Pool Encroachment Constraint Storage Reop Storage Inflow Outflow Reop Outflow
Oct
1,1
997
Nov
1,1
997
Dec
1,1
997
Jan
1,19
98
Feb
1,1
998
Mar
1,1
998
Apr
1,1
998
May
1,1
998
Jun
1,19
98
Jul 1
,199
8
Aug
1,1
998
Sep
1,1
998
Date/Time
0
200,000
400,000
600,000
800,000
1,000,000
1,200,000
Sto
rage
[acr
e-fe
et]
Spill Volume: 625 TAF
0
25,000
50,000
75,000
100,000
125,000
150,000
175,000
200,000
Flo
w R
ate
[cfs
]
Folsom Operations Plot
Water Year: 1999
Top of Conservation Pool Flood Pool Encroachment Constraint Storage Reop Storage Inflow Outflow Reop Outflow
Oct
1,1
998
Nov
1,1
998
Dec
1,1
998
Jan
1,19
99
Feb
1,1
999
Mar
1,1
999
Apr
1,1
999
May
1,1
999
Jun
1,19
99
Jul 1
,199
9
Aug
1,1
999
Sep
1,1
999
Date/Time
0
200,000
400,000
600,000
800,000
1,000,000
1,200,000
Sto
rage
[acr
e-fe
et]
Spill Volume: 742 TAF
0
25,000
50,000
75,000
100,000
125,000
150,000
175,000
200,000
Flo
w R
ate
[cfs
]
A: Reoperation Plots
130
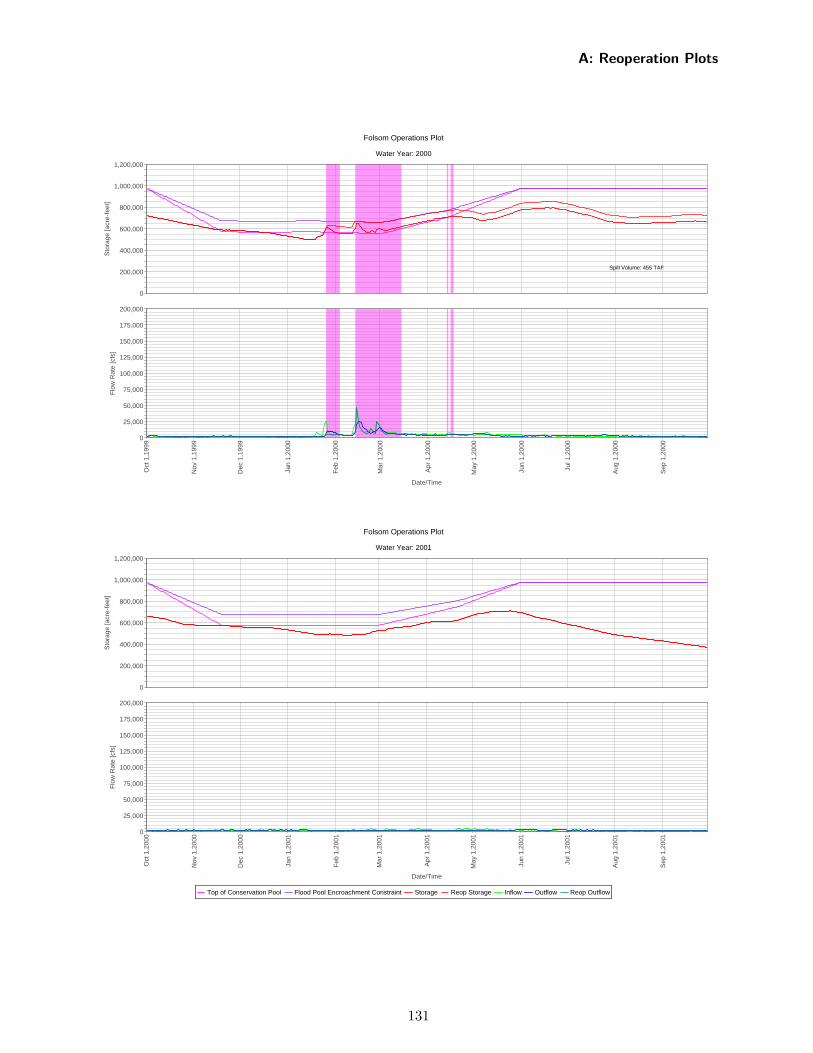
Folsom Operations Plot
Water Year: 2000
Top of Conservation Pool Flood Pool Encroachment Constraint Storage Reop Storage Inflow Outflow Reop Outflow
Oct
1,1
999
Nov
1,1
999
Dec
1,1
999
Jan
1,20
00
Feb
1,2
000
Mar
1,2
000
Apr
1,2
000
May
1,2
000
Jun
1,20
00
Jul 1
,200
0
Aug
1,2
000
Sep
1,2
000
Date/Time
0
200,000
400,000
600,000
800,000
1,000,000
1,200,000
Sto
rage
[acr
e-fe
et]
Spill Volume: 455 TAF
0
25,000
50,000
75,000
100,000
125,000
150,000
175,000
200,000
Flo
w R
ate
[cfs
]
Folsom Operations Plot
Water Year: 2001
Top of Conservation Pool Flood Pool Encroachment Constraint Storage Reop Storage Inflow Outflow Reop Outflow
Oct
1,2
000
Nov
1,2
000
Dec
1,2
000
Jan
1,20
01
Feb
1,2
001
Mar
1,2
001
Apr
1,2
001
May
1,2
001
Jun
1,20
01
Jul 1
,200
1
Aug
1,2
001
Sep
1,2
001
Date/Time
0
200,000
400,000
600,000
800,000
1,000,000
1,200,000
Sto
rage
[acr
e-fe
et]
0
25,000
50,000
75,000
100,000
125,000
150,000
175,000
200,000
Flo
w R
ate
[cfs
]
A: Reoperation Plots
131
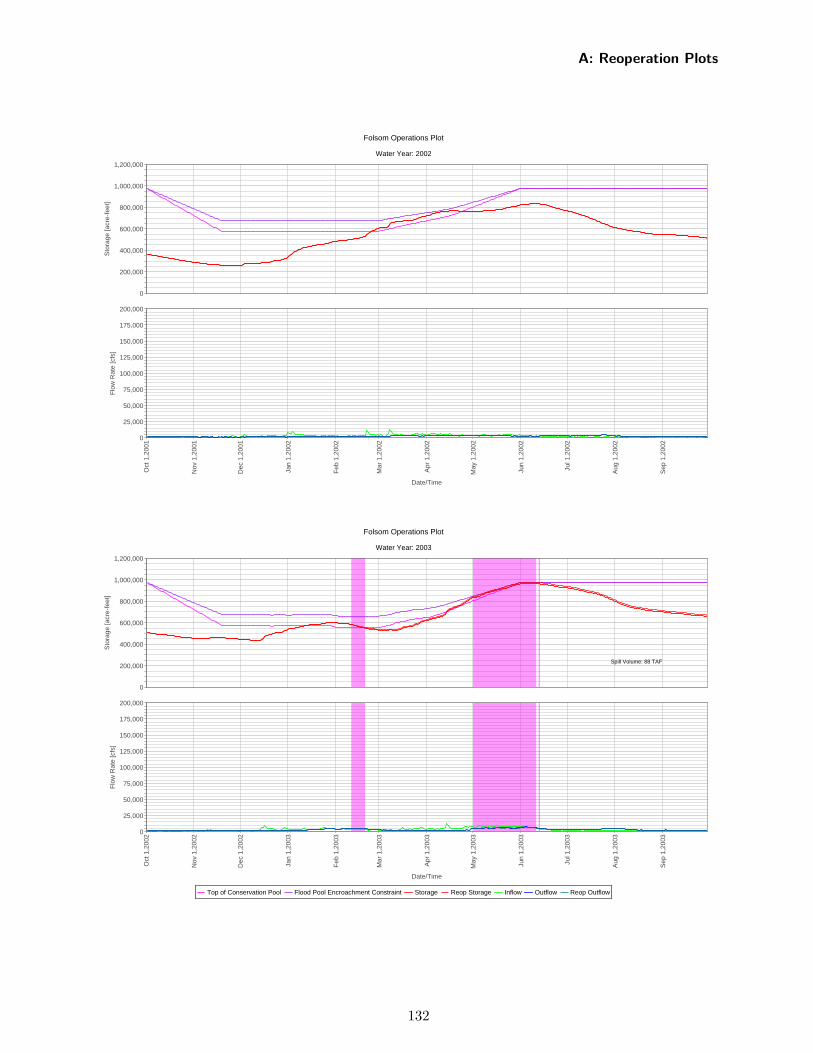
Folsom Operations Plot
Water Year: 2002
Top of Conservation Pool Flood Pool Encroachment Constraint Storage Reop Storage Inflow Outflow Reop Outflow
Oct
1,2
001
Nov
1,2
001
Dec
1,2
001
Jan
1,20
02
Feb
1,2
002
Mar
1,2
002
Apr
1,2
002
May
1,2
002
Jun
1,20
02
Jul 1
,200
2
Aug
1,2
002
Sep
1,2
002
Date/Time
0
200,000
400,000
600,000
800,000
1,000,000
1,200,000
Sto
rage
[acr
e-fe
et]
0
25,000
50,000
75,000
100,000
125,000
150,000
175,000
200,000
Flo
w R
ate
[cfs
]
Folsom Operations Plot
Water Year: 2003
Top of Conservation Pool Flood Pool Encroachment Constraint Storage Reop Storage Inflow Outflow Reop Outflow
Oct
1,2
002
Nov
1,2
002
Dec
1,2
002
Jan
1,20
03
Feb
1,2
003
Mar
1,2
003
Apr
1,2
003
May
1,2
003
Jun
1,20
03
Jul 1
,200
3
Aug
1,2
003
Sep
1,2
003
Date/Time
0
200,000
400,000
600,000
800,000
1,000,000
1,200,000
Sto
rage
[acr
e-fe
et]
Spill Volume: 88 TAF
0
25,000
50,000
75,000
100,000
125,000
150,000
175,000
200,000
Flo
w R
ate
[cfs
]
A: Reoperation Plots
132
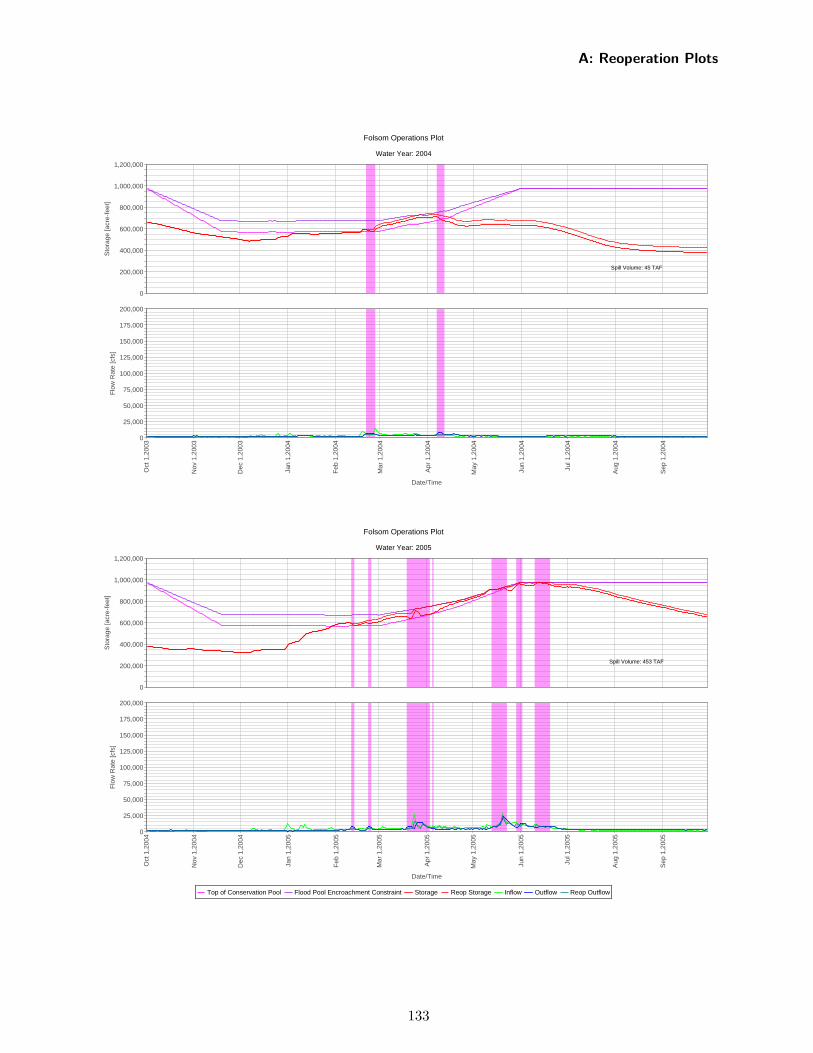
Folsom Operations Plot
Water Year: 2004
Top of Conservation Pool Flood Pool Encroachment Constraint Storage Reop Storage Inflow Outflow Reop Outflow
Oct
1,2
003
Nov
1,2
003
Dec
1,2
003
Jan
1,20
04
Feb
1,2
004
Mar
1,2
004
Apr
1,2
004
May
1,2
004
Jun
1,20
04
Jul 1
,200
4
Aug
1,2
004
Sep
1,2
004
Date/Time
0
200,000
400,000
600,000
800,000
1,000,000
1,200,000
Sto
rage
[acr
e-fe
et]
Spill Volume: 45 TAF
0
25,000
50,000
75,000
100,000
125,000
150,000
175,000
200,000
Flo
w R
ate
[cfs
]
Folsom Operations Plot
Water Year: 2005
Top of Conservation Pool Flood Pool Encroachment Constraint Storage Reop Storage Inflow Outflow Reop Outflow
Oct
1,2
004
Nov
1,2
004
Dec
1,2
004
Jan
1,20
05
Feb
1,2
005
Mar
1,2
005
Apr
1,2
005
May
1,2
005
Jun
1,20
05
Jul 1
,200
5
Aug
1,2
005
Sep
1,2
005
Date/Time
0
200,000
400,000
600,000
800,000
1,000,000
1,200,000
Sto
rage
[acr
e-fe
et]
Spill Volume: 453 TAF
0
25,000
50,000
75,000
100,000
125,000
150,000
175,000
200,000
Flo
w R
ate
[cfs
]
A: Reoperation Plots
133
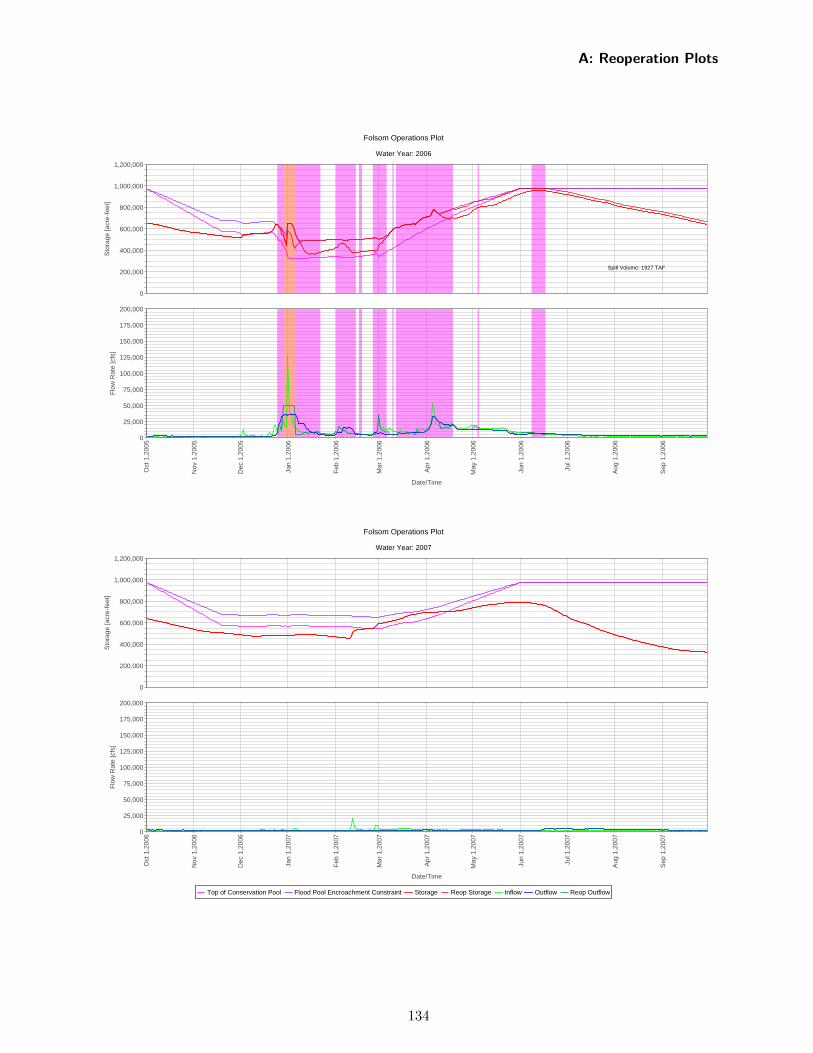
Folsom Operations Plot
Water Year: 2006
Top of Conservation Pool Flood Pool Encroachment Constraint Storage Reop Storage Inflow Outflow Reop Outflow
Oct
1,2
005
Nov
1,2
005
Dec
1,2
005
Jan
1,20
06
Feb
1,2
006
Mar
1,2
006
Apr
1,2
006
May
1,2
006
Jun
1,20
06
Jul 1
,200
6
Aug
1,2
006
Sep
1,2
006
Date/Time
0
200,000
400,000
600,000
800,000
1,000,000
1,200,000
Sto
rage
[acr
e-fe
et]
Spill Volume: 1927 TAF
0
25,000
50,000
75,000
100,000
125,000
150,000
175,000
200,000
Flo
w R
ate
[cfs
]
Folsom Operations Plot
Water Year: 2007
Top of Conservation Pool Flood Pool Encroachment Constraint Storage Reop Storage Inflow Outflow Reop Outflow
Oct
1,2
006
Nov
1,2
006
Dec
1,2
006
Jan
1,20
07
Feb
1,2
007
Mar
1,2
007
Apr
1,2
007
May
1,2
007
Jun
1,20
07
Jul 1
,200
7
Aug
1,2
007
Sep
1,2
007
Date/Time
0
200,000
400,000
600,000
800,000
1,000,000
1,200,000
Sto
rage
[acr
e-fe
et]
0
25,000
50,000
75,000
100,000
125,000
150,000
175,000
200,000
Flo
w R
ate
[cfs
]
A: Reoperation Plots
134
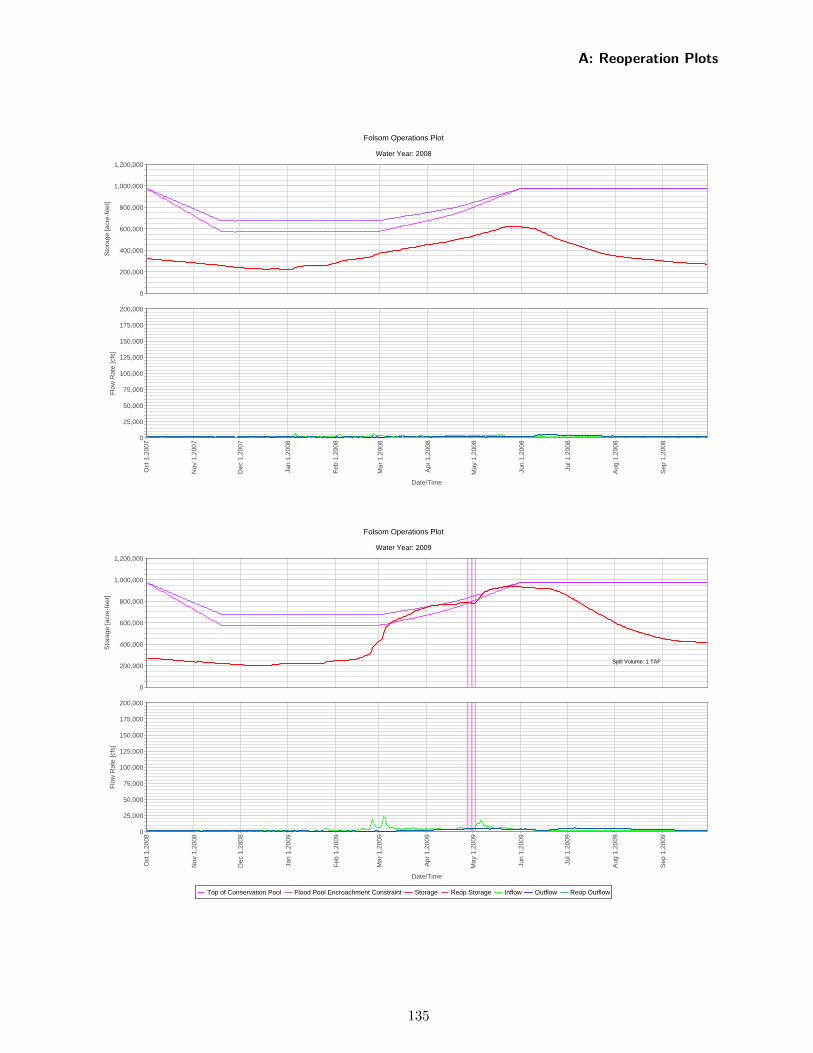
Folsom Operations Plot
Water Year: 2008
Top of Conservation Pool Flood Pool Encroachment Constraint Storage Reop Storage Inflow Outflow Reop Outflow
Oct
1,2
007
Nov
1,2
007
Dec
1,2
007
Jan
1,20
08
Feb
1,2
008
Mar
1,2
008
Apr
1,2
008
May
1,2
008
Jun
1,20
08
Jul 1
,200
8
Aug
1,2
008
Sep
1,2
008
Date/Time
0
200,000
400,000
600,000
800,000
1,000,000
1,200,000
Sto
rage
[acr
e-fe
et]
0
25,000
50,000
75,000
100,000
125,000
150,000
175,000
200,000
Flo
w R
ate
[cfs
]
Folsom Operations Plot
Water Year: 2009
Top of Conservation Pool Flood Pool Encroachment Constraint Storage Reop Storage Inflow Outflow Reop Outflow
Oct
1,2
008
Nov
1,2
008
Dec
1,2
008
Jan
1,20
09
Feb
1,2
009
Mar
1,2
009
Apr
1,2
009
May
1,2
009
Jun
1,20
09
Jul 1
,200
9
Aug
1,2
009
Sep
1,2
009
Date/Time
0
200,000
400,000
600,000
800,000
1,000,000
1,200,000
Sto
rage
[acr
e-fe
et]
Spill Volume: 1 TAF
0
25,000
50,000
75,000
100,000
125,000
150,000
175,000
200,000
Flo
w R
ate
[cfs
]
A: Reoperation Plots
135
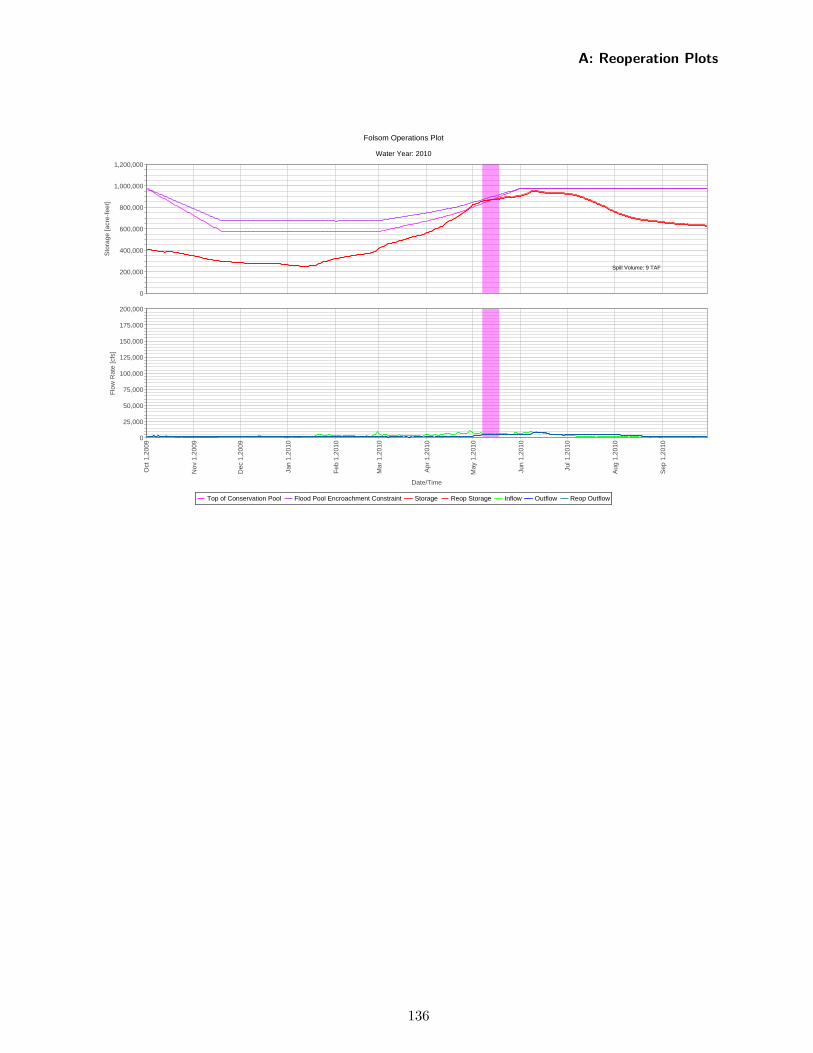
Folsom Operations Plot
Water Year: 2010
Top of Conservation Pool Flood Pool Encroachment Constraint Storage Reop Storage Inflow Outflow Reop Outflow
Oct
1,2
009
Nov
1,2
009
Dec
1,2
009
Jan
1,20
10
Feb
1,2
010
Mar
1,2
010
Apr
1,2
010
May
1,2
010
Jun
1,20
10
Jul 1
,201
0
Aug
1,2
010
Sep
1,2
010
Date/Time
0
200,000
400,000
600,000
800,000
1,000,000
1,200,000
Sto
rage
[acr
e-fe
et]
Spill Volume: 9 TAF
0
25,000
50,000
75,000
100,000
125,000
150,000
175,000
200,000
Flo
w R
ate
[cfs
]
A: Reoperation Plots
136
��
��B Monthly Effects Evaluation
This appendix details how CalLite was used to perform an approximation of the daily reoperation toenhance water supply and the resulting effects of that reoperation systemwide.
B.1 Modeling the Reoperation
This appendix details the monthly flow data thresholds used in the CalLite reoperation routine thatwill cause that reoperation to cease (termed deactivation) in CalLite. The deactivation of reoperationin CalLite is compared with occurrences of deactivation from the daily reoperation performed onhistorical data to ensure the results are consistent between the daily analysis and CalLite modeling.
B.1.1 Parameters
Shasta
The monthly flow threshold for deactivation the reopeation at Shasta Dam was determined to be30,000 cfs. A 5-day inflow forecast exceeding 650 TAF was used as the threshold for the dailyinvestigation.
Oroville
The monthly flow threshold for deactivation the reoperation at Oroville Dam was determined to be32,500 cfs. A 5-day inflow exceeding 700 TAF was used as the threshold for the daily investigation.
New Bullards Bar
New Bullards Bar is not dynamically modeled in CalLite. Thus, the effects of its reoperation werenot assessed at this time.
Folsom
The monthly flow threshold for deactivation the reoperation at Folsom Dam was determined to be15,200 cfs. A 5-day inflow exceeding 400 TAF was used as the threshold for the daily investigation.
B.1.2 Plots
The following figures demonstrate the monthly flow data and deactivation thresholds for thesereservoirs. Also shown are instances where the daily analysis of historical data for each reservoirindicated the cessation of reoperation was necessary due to an exceedingly large inflow forecast.
137
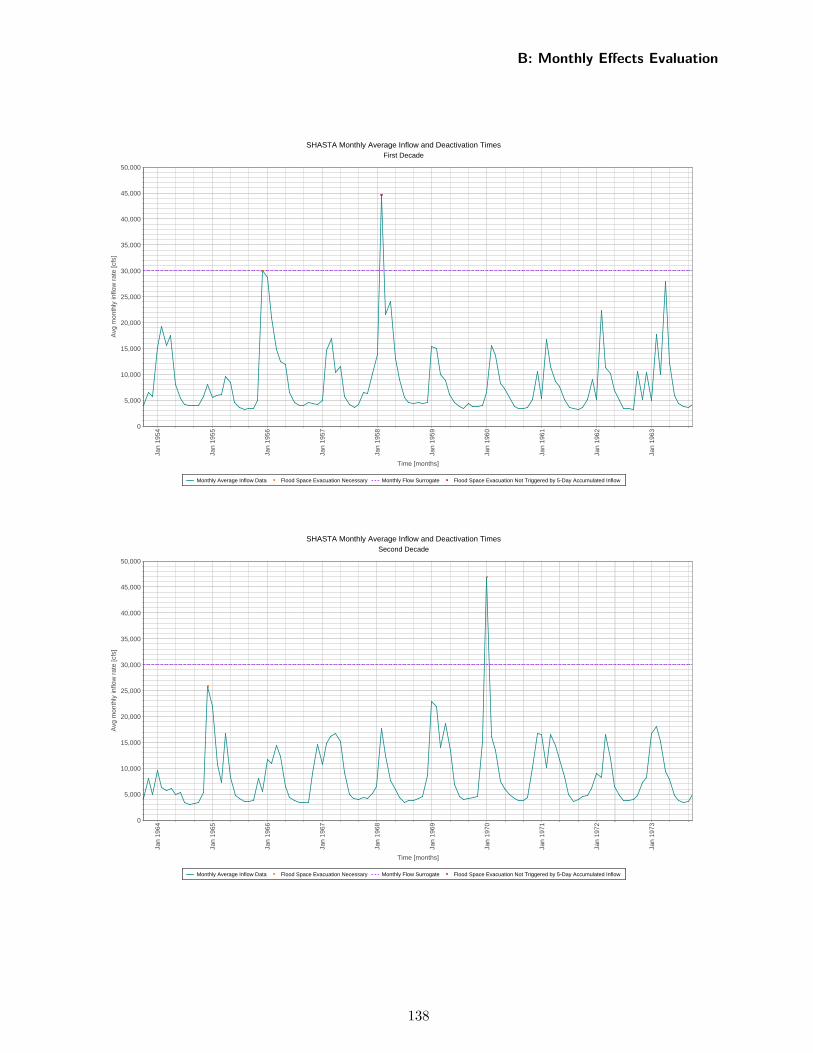
SHASTA Monthly Average Inflow and Deactivation TimesFirst Decade
Monthly Average Inflow Data Flood Space Evacuation Necessary Monthly Flow Surrogate Flood Space Evacuation Not Triggered by 5-Day Accumulated Inflow
Jan
1954
Jan
1955
Jan
1956
Jan
1957
Jan
1958
Jan
1959
Jan
1960
Jan
1961
Jan
1962
Jan
1963
Time [months]
0
5,000
10,000
15,000
20,000
25,000
30,000
35,000
40,000
45,000
50,000
Avg
mon
thly
inflo
w r
ate
[cfs
]
SHASTA Monthly Average Inflow and Deactivation TimesSecond Decade
Monthly Average Inflow Data Flood Space Evacuation Necessary Monthly Flow Surrogate Flood Space Evacuation Not Triggered by 5-Day Accumulated Inflow
Jan
1964
Jan
1965
Jan
1966
Jan
1967
Jan
1968
Jan
1969
Jan
1970
Jan
1971
Jan
1972
Jan
1973
Time [months]
0
5,000
10,000
15,000
20,000
25,000
30,000
35,000
40,000
45,000
50,000
Avg
mon
thly
inflo
w r
ate
[cfs
]
B: Monthly Effects Evaluation
138
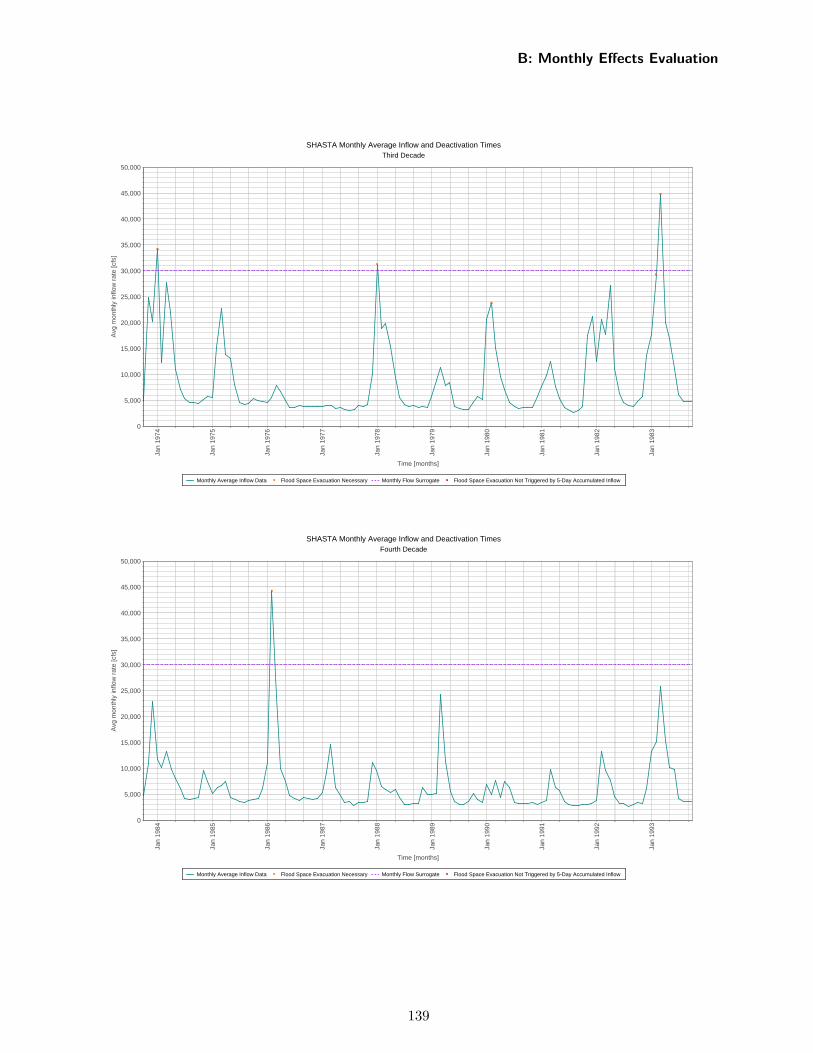
SHASTA Monthly Average Inflow and Deactivation TimesThird Decade
Monthly Average Inflow Data Flood Space Evacuation Necessary Monthly Flow Surrogate Flood Space Evacuation Not Triggered by 5-Day Accumulated Inflow
Jan
1974
Jan
1975
Jan
1976
Jan
1977
Jan
1978
Jan
1979
Jan
1980
Jan
1981
Jan
1982
Jan
1983
Time [months]
0
5,000
10,000
15,000
20,000
25,000
30,000
35,000
40,000
45,000
50,000
Avg
mon
thly
inflo
w r
ate
[cfs
]
SHASTA Monthly Average Inflow and Deactivation TimesFourth Decade
Monthly Average Inflow Data Flood Space Evacuation Necessary Monthly Flow Surrogate Flood Space Evacuation Not Triggered by 5-Day Accumulated Inflow
Jan
1984
Jan
1985
Jan
1986
Jan
1987
Jan
1988
Jan
1989
Jan
1990
Jan
1991
Jan
1992
Jan
1993
Time [months]
0
5,000
10,000
15,000
20,000
25,000
30,000
35,000
40,000
45,000
50,000
Avg
mon
thly
inflo
w r
ate
[cfs
]
B: Monthly Effects Evaluation
139
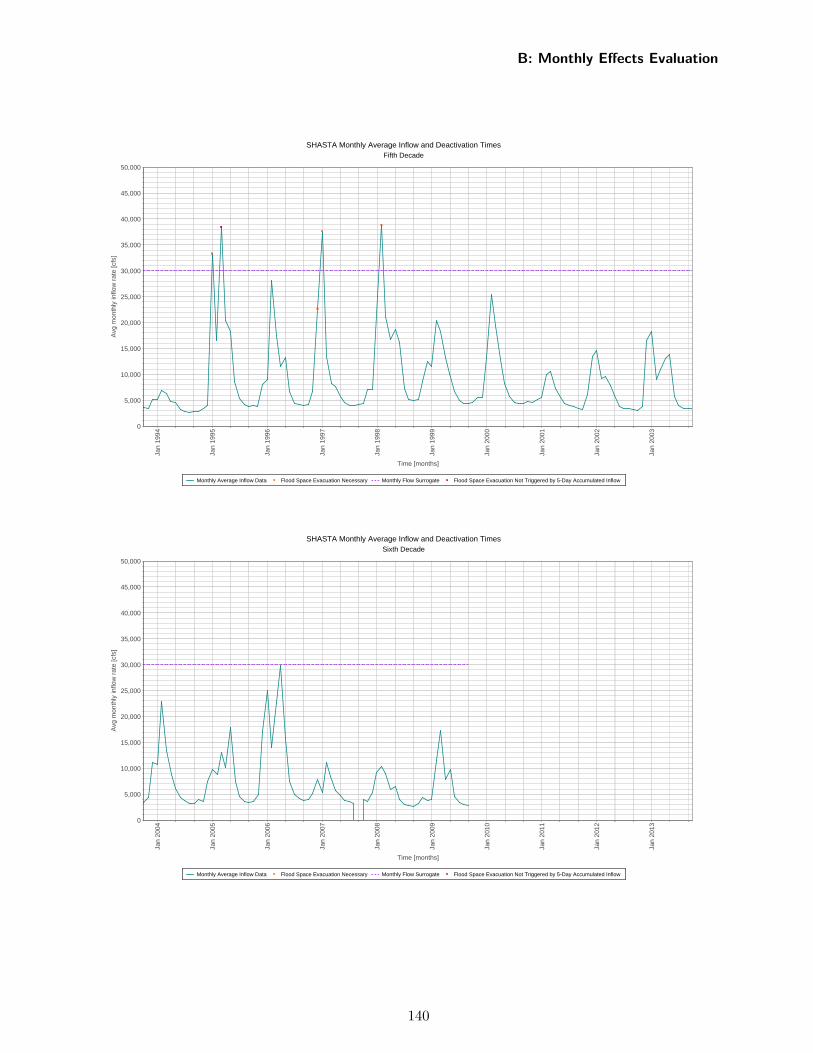
SHASTA Monthly Average Inflow and Deactivation TimesFifth Decade
Monthly Average Inflow Data Flood Space Evacuation Necessary Monthly Flow Surrogate Flood Space Evacuation Not Triggered by 5-Day Accumulated Inflow
Jan
1994
Jan
1995
Jan
1996
Jan
1997
Jan
1998
Jan
1999
Jan
2000
Jan
2001
Jan
2002
Jan
2003
Time [months]
0
5,000
10,000
15,000
20,000
25,000
30,000
35,000
40,000
45,000
50,000
Avg
mon
thly
inflo
w r
ate
[cfs
]
SHASTA Monthly Average Inflow and Deactivation TimesSixth Decade
Monthly Average Inflow Data Flood Space Evacuation Necessary Monthly Flow Surrogate Flood Space Evacuation Not Triggered by 5-Day Accumulated Inflow
Jan
2004
Jan
2005
Jan
2006
Jan
2007
Jan
2008
Jan
2009
Jan
2010
Jan
2011
Jan
2012
Jan
2013
Time [months]
0
5,000
10,000
15,000
20,000
25,000
30,000
35,000
40,000
45,000
50,000
Avg
mon
thly
inflo
w r
ate
[cfs
]
B: Monthly Effects Evaluation
140
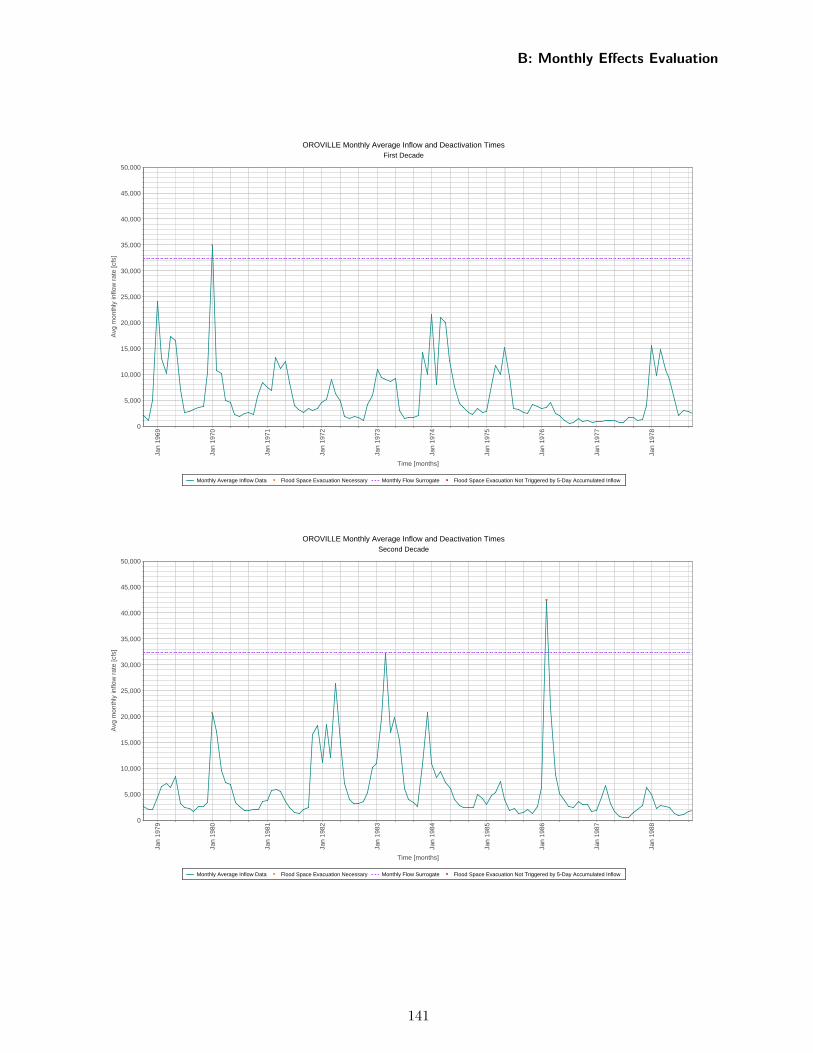
OROVILLE Monthly Average Inflow and Deactivation TimesFirst Decade
Monthly Average Inflow Data Flood Space Evacuation Necessary Monthly Flow Surrogate Flood Space Evacuation Not Triggered by 5-Day Accumulated Inflow
Jan
1969
Jan
1970
Jan
1971
Jan
1972
Jan
1973
Jan
1974
Jan
1975
Jan
1976
Jan
1977
Jan
1978
Time [months]
0
5,000
10,000
15,000
20,000
25,000
30,000
35,000
40,000
45,000
50,000
Avg
mon
thly
inflo
w r
ate
[cfs
]
OROVILLE Monthly Average Inflow and Deactivation TimesSecond Decade
Monthly Average Inflow Data Flood Space Evacuation Necessary Monthly Flow Surrogate Flood Space Evacuation Not Triggered by 5-Day Accumulated Inflow
Jan
1979
Jan
1980
Jan
1981
Jan
1982
Jan
1983
Jan
1984
Jan
1985
Jan
1986
Jan
1987
Jan
1988
Time [months]
0
5,000
10,000
15,000
20,000
25,000
30,000
35,000
40,000
45,000
50,000
Avg
mon
thly
inflo
w r
ate
[cfs
]
B: Monthly Effects Evaluation
141
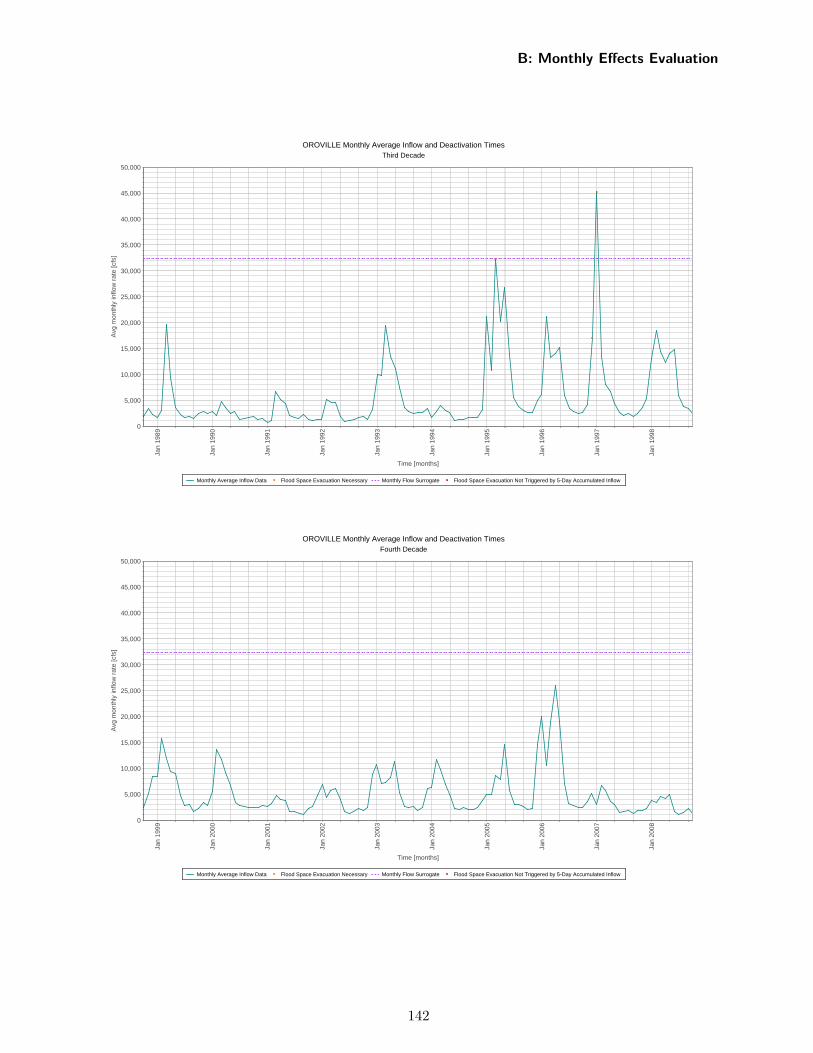
OROVILLE Monthly Average Inflow and Deactivation TimesThird Decade
Monthly Average Inflow Data Flood Space Evacuation Necessary Monthly Flow Surrogate Flood Space Evacuation Not Triggered by 5-Day Accumulated Inflow
Jan
1989
Jan
1990
Jan
1991
Jan
1992
Jan
1993
Jan
1994
Jan
1995
Jan
1996
Jan
1997
Jan
1998
Time [months]
0
5,000
10,000
15,000
20,000
25,000
30,000
35,000
40,000
45,000
50,000
Avg
mon
thly
inflo
w r
ate
[cfs
]
OROVILLE Monthly Average Inflow and Deactivation TimesFourth Decade
Monthly Average Inflow Data Flood Space Evacuation Necessary Monthly Flow Surrogate Flood Space Evacuation Not Triggered by 5-Day Accumulated Inflow
Jan
1999
Jan
2000
Jan
2001
Jan
2002
Jan
2003
Jan
2004
Jan
2005
Jan
2006
Jan
2007
Jan
2008
Time [months]
0
5,000
10,000
15,000
20,000
25,000
30,000
35,000
40,000
45,000
50,000
Avg
mon
thly
inflo
w r
ate
[cfs
]
B: Monthly Effects Evaluation
142
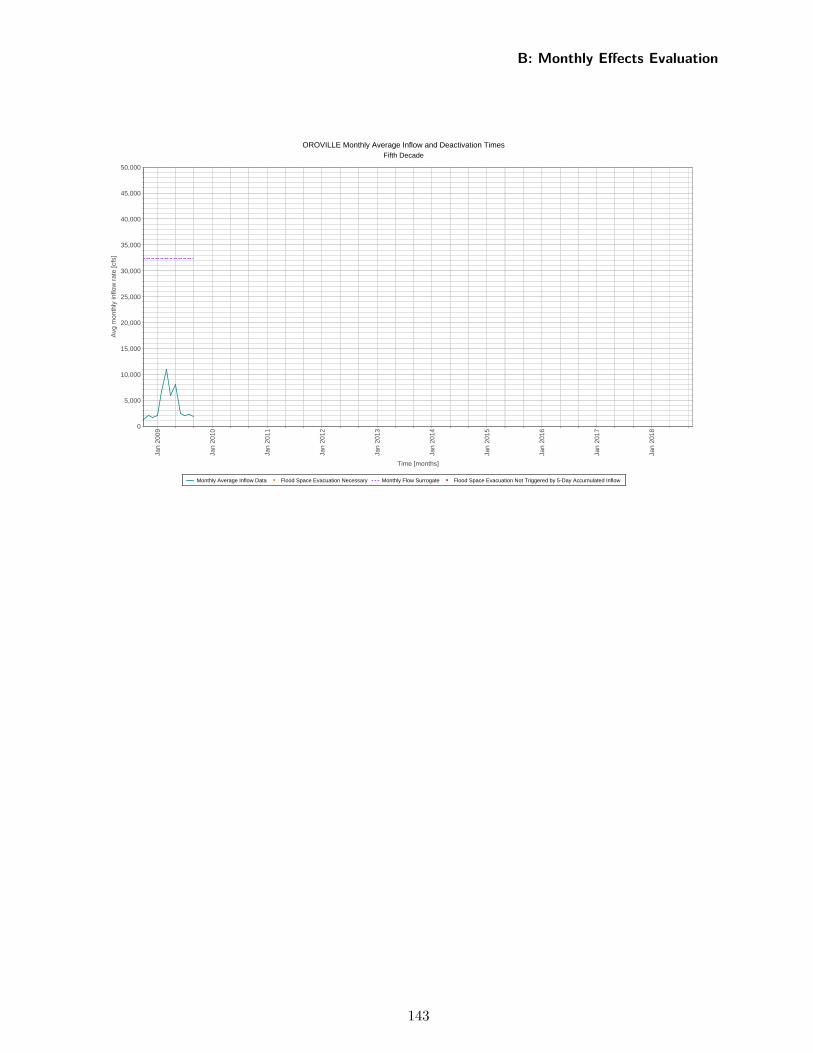
OROVILLE Monthly Average Inflow and Deactivation TimesFifth Decade
Monthly Average Inflow Data Flood Space Evacuation Necessary Monthly Flow Surrogate Flood Space Evacuation Not Triggered by 5-Day Accumulated Inflow
Jan
2009
Jan
2010
Jan
2011
Jan
2012
Jan
2013
Jan
2014
Jan
2015
Jan
2016
Jan
2017
Jan
2018
Time [months]
0
5,000
10,000
15,000
20,000
25,000
30,000
35,000
40,000
45,000
50,000
Avg
mon
thly
inflo
w r
ate
[cfs
]
B: Monthly Effects Evaluation
143
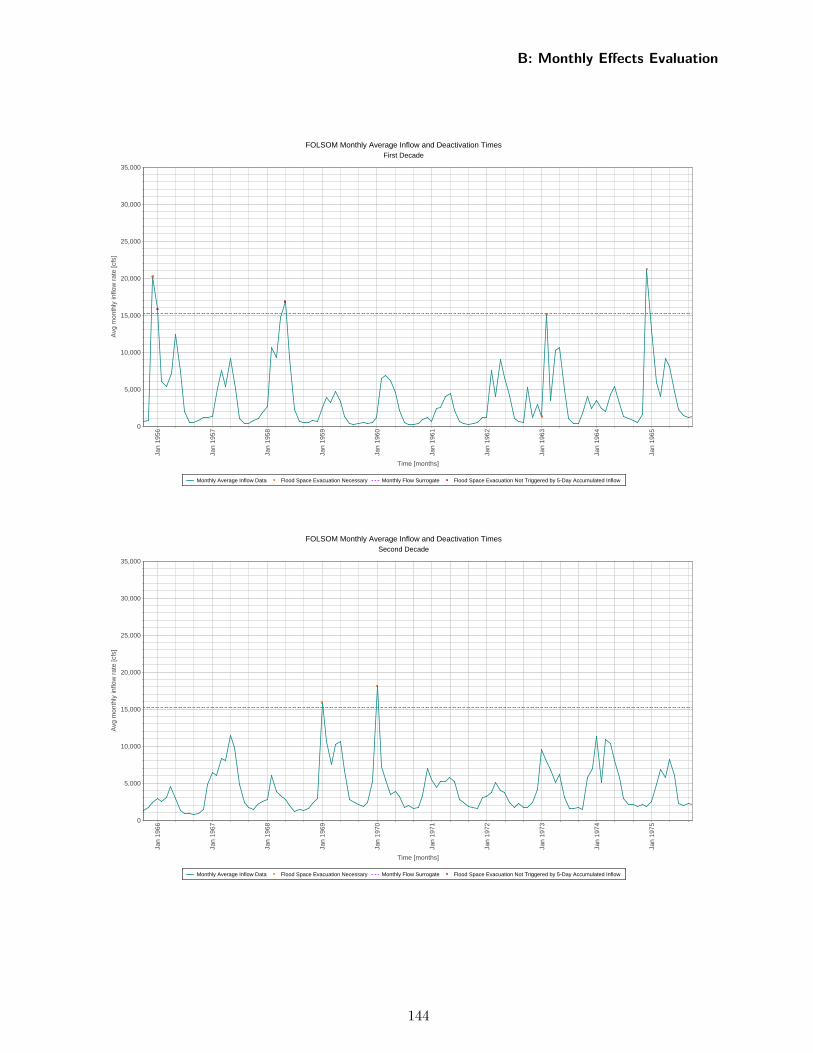
FOLSOM Monthly Average Inflow and Deactivation TimesFirst Decade
Monthly Average Inflow Data Flood Space Evacuation Necessary Monthly Flow Surrogate Flood Space Evacuation Not Triggered by 5-Day Accumulated Inflow
Jan
1956
Jan
1957
Jan
1958
Jan
1959
Jan
1960
Jan
1961
Jan
1962
Jan
1963
Jan
1964
Jan
1965
Time [months]
0
5,000
10,000
15,000
20,000
25,000
30,000
35,000
Avg
mon
thly
inflo
w r
ate
[cfs
]
FOLSOM Monthly Average Inflow and Deactivation TimesSecond Decade
Monthly Average Inflow Data Flood Space Evacuation Necessary Monthly Flow Surrogate Flood Space Evacuation Not Triggered by 5-Day Accumulated Inflow
Jan
1966
Jan
1967
Jan
1968
Jan
1969
Jan
1970
Jan
1971
Jan
1972
Jan
1973
Jan
1974
Jan
1975
Time [months]
0
5,000
10,000
15,000
20,000
25,000
30,000
35,000
Avg
mon
thly
inflo
w r
ate
[cfs
]
B: Monthly Effects Evaluation
144
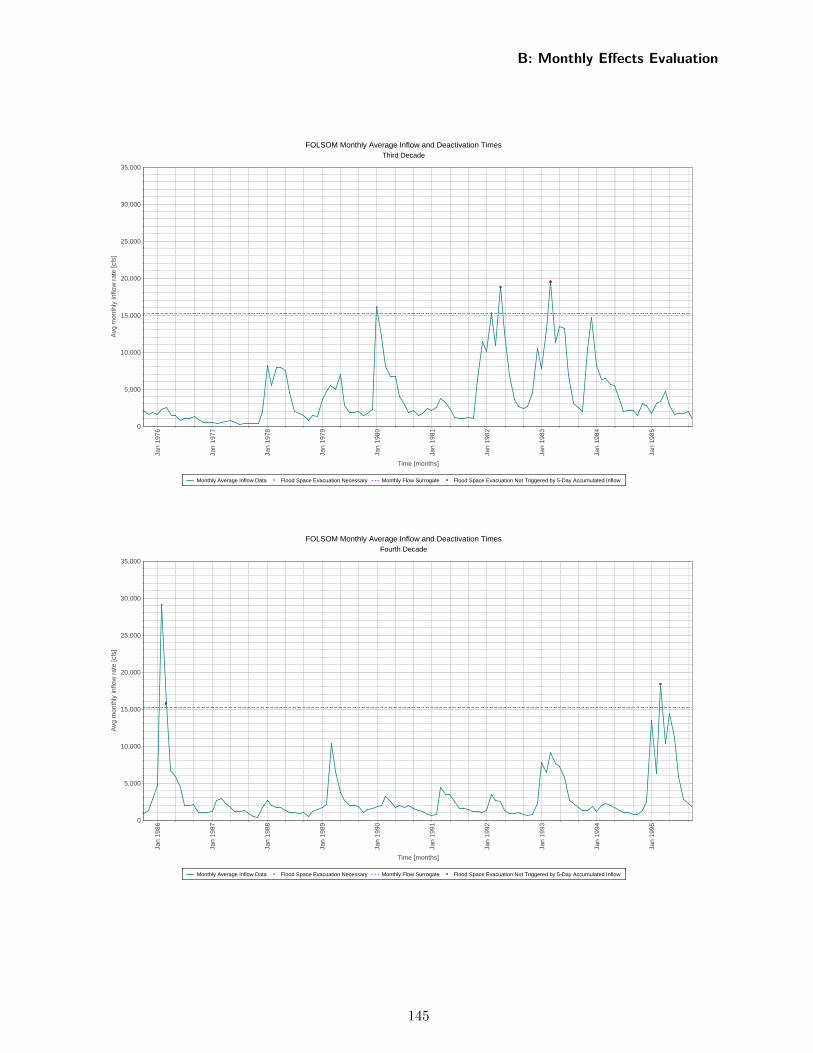
FOLSOM Monthly Average Inflow and Deactivation TimesThird Decade
Monthly Average Inflow Data Flood Space Evacuation Necessary Monthly Flow Surrogate Flood Space Evacuation Not Triggered by 5-Day Accumulated Inflow
Jan
1976
Jan
1977
Jan
1978
Jan
1979
Jan
1980
Jan
1981
Jan
1982
Jan
1983
Jan
1984
Jan
1985
Time [months]
0
5,000
10,000
15,000
20,000
25,000
30,000
35,000
Avg
mon
thly
inflo
w r
ate
[cfs
]
FOLSOM Monthly Average Inflow and Deactivation TimesFourth Decade
Monthly Average Inflow Data Flood Space Evacuation Necessary Monthly Flow Surrogate Flood Space Evacuation Not Triggered by 5-Day Accumulated Inflow
Jan
1986
Jan
1987
Jan
1988
Jan
1989
Jan
1990
Jan
1991
Jan
1992
Jan
1993
Jan
1994
Jan
1995
Time [months]
0
5,000
10,000
15,000
20,000
25,000
30,000
35,000
Avg
mon
thly
inflo
w r
ate
[cfs
]
B: Monthly Effects Evaluation
145
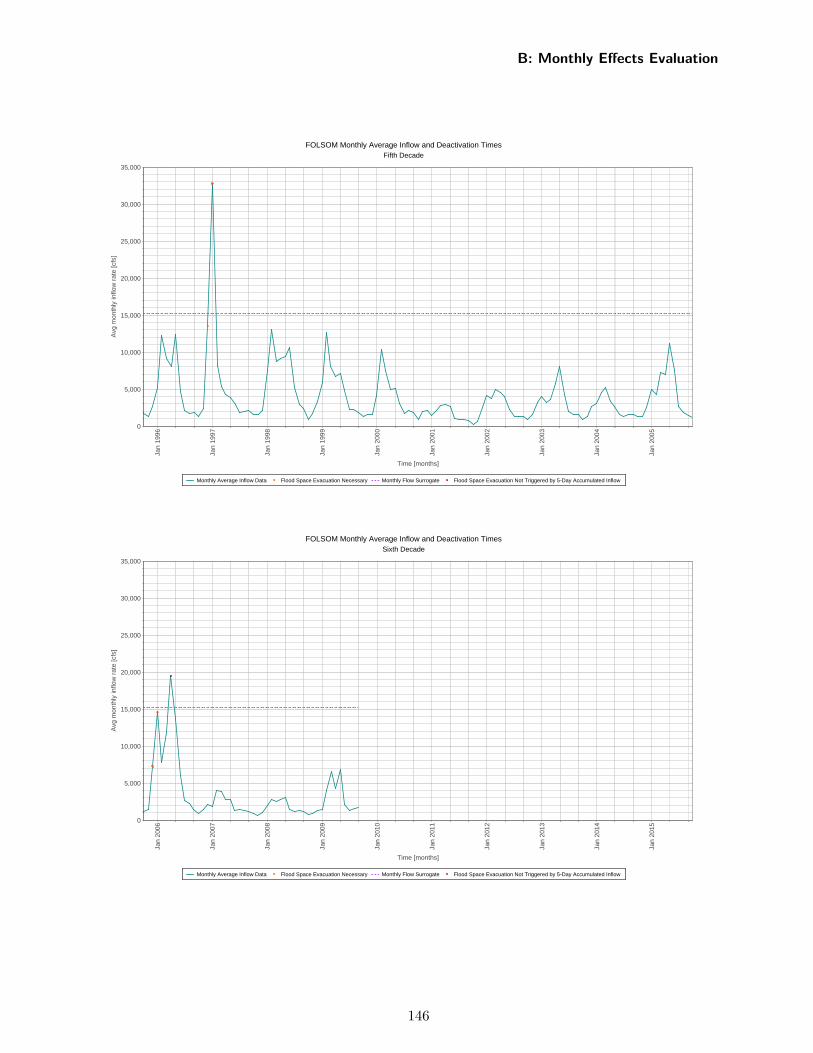
FOLSOM Monthly Average Inflow and Deactivation TimesFifth Decade
Monthly Average Inflow Data Flood Space Evacuation Necessary Monthly Flow Surrogate Flood Space Evacuation Not Triggered by 5-Day Accumulated Inflow
Jan
1996
Jan
1997
Jan
1998
Jan
1999
Jan
2000
Jan
2001
Jan
2002
Jan
2003
Jan
2004
Jan
2005
Time [months]
0
5,000
10,000
15,000
20,000
25,000
30,000
35,000
Avg
mon
thly
inflo
w r
ate
[cfs
]
FOLSOM Monthly Average Inflow and Deactivation TimesSixth Decade
Monthly Average Inflow Data Flood Space Evacuation Necessary Monthly Flow Surrogate Flood Space Evacuation Not Triggered by 5-Day Accumulated Inflow
Jan
2006
Jan
2007
Jan
2008
Jan
2009
Jan
2010
Jan
2011
Jan
2012
Jan
2013
Jan
2014
Jan
2015
Time [months]
0
5,000
10,000
15,000
20,000
25,000
30,000
35,000
Avg
mon
thly
inflo
w r
ate
[cfs
]
B: Monthly Effects Evaluation
146
B: Monthly Effects Evaluation
B.2 Effects
The following section includes plots from the CalLite simulation which attempt to show the keyeffects of the reoperation.
147
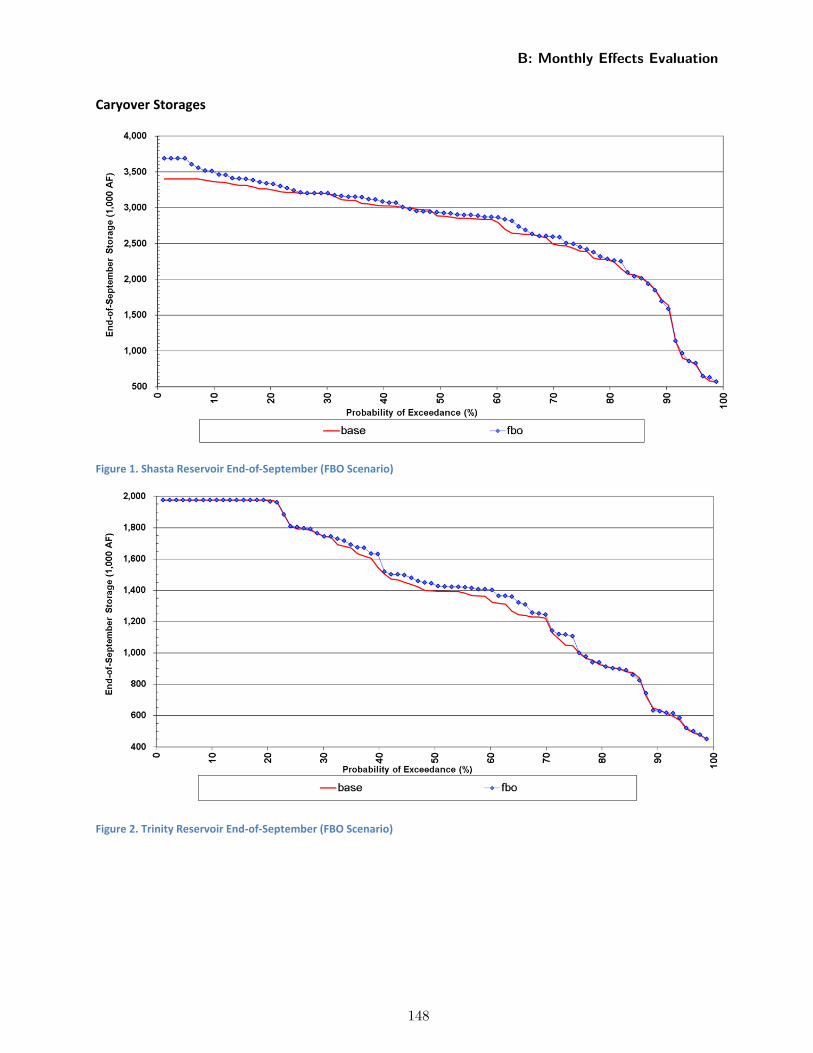
Caryover Storages
Figure 1. Shasta Reservoir End‐of‐September (FBO Scenario)
Figure 2. Trinity Reservoir End‐of‐September (FBO Scenario)
B: Monthly Effects Evaluation
148
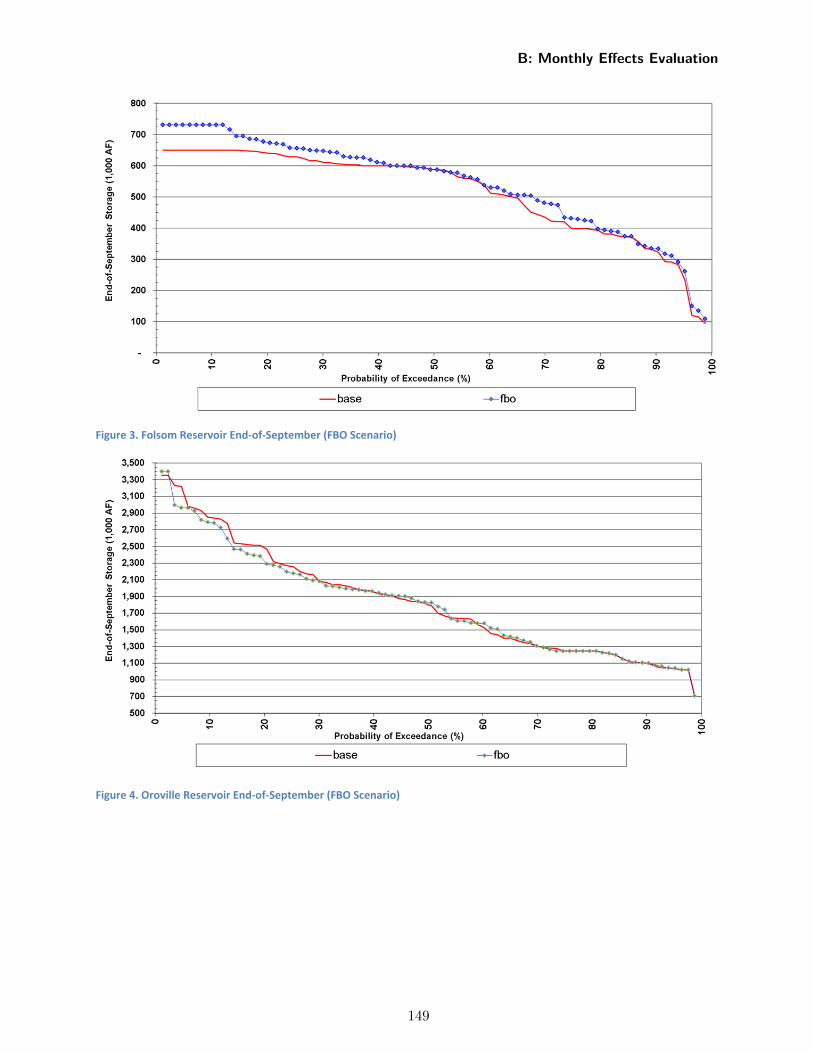
Figure 3. Folsom Reservoir End‐of‐September (FBO Scenario)
Figure 4. Oroville Reservoir End‐of‐September (FBO Scenario)
B: Monthly Effects Evaluation
149
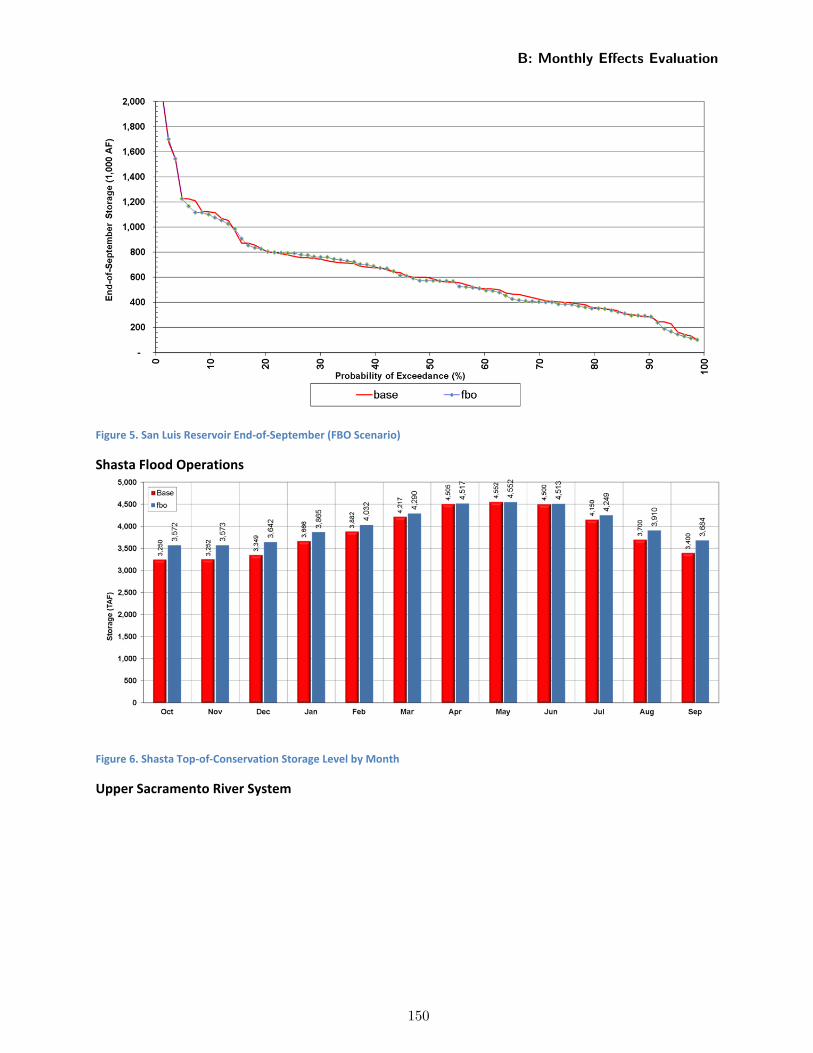
Figure 5. San Luis Reservoir End‐of‐September (FBO Scenario)
Shasta Flood Operations
Figure 6. Shasta Top‐of‐Conservation Storage Level by Month
Upper Sacramento River System
B: Monthly Effects Evaluation
150
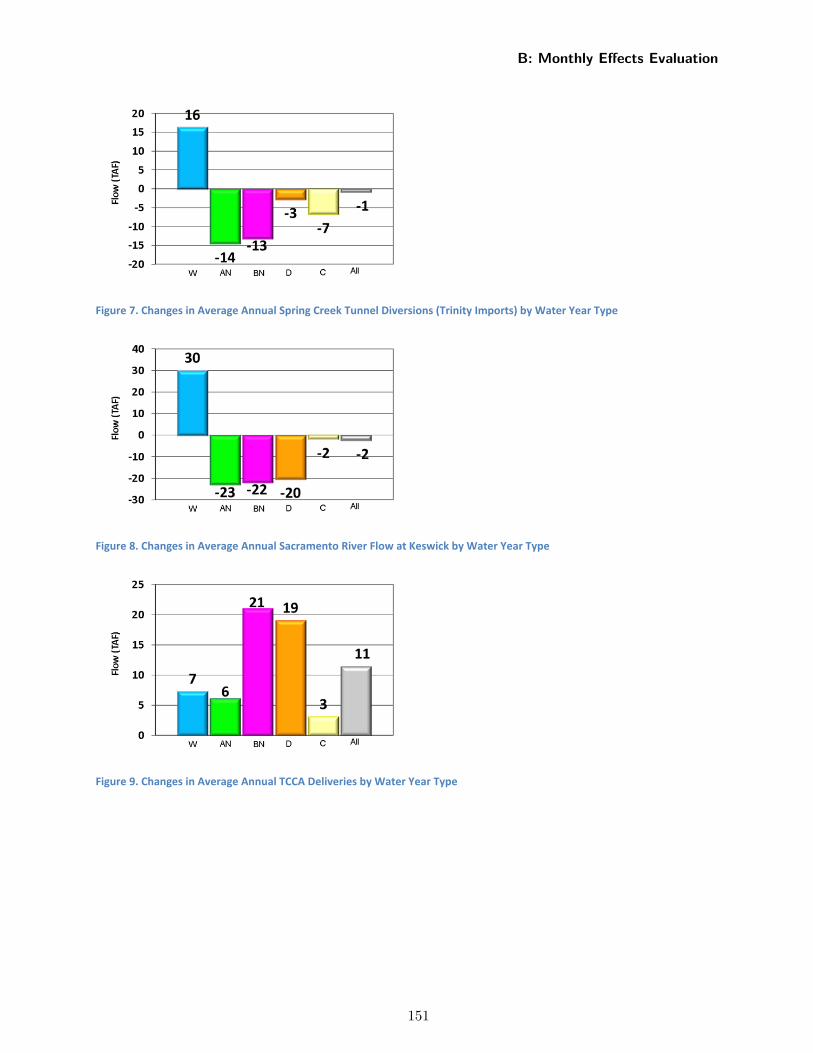
Figure 7. Changes in Average Annual Spring Creek Tunnel Diversions (Trinity Imports) by Water Year Type
Figure 8. Changes in Average Annual Sacramento River Flow at Keswick by Water Year Type
Figure 9. Changes in Average Annual TCCA Deliveries by Water Year Type
B: Monthly Effects Evaluation
151
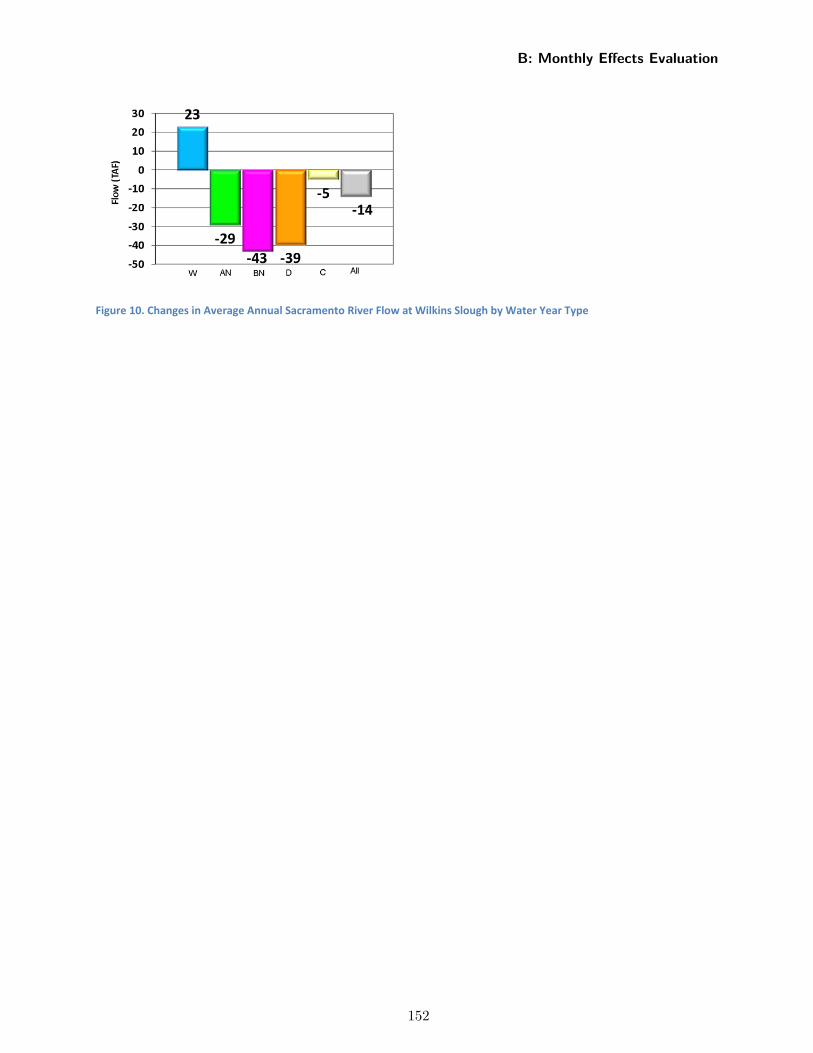
Figure 10. Changes in Average Annual Sacramento River Flow at Wilkins Slough by Water Year Type
B: Monthly Effects Evaluation
152
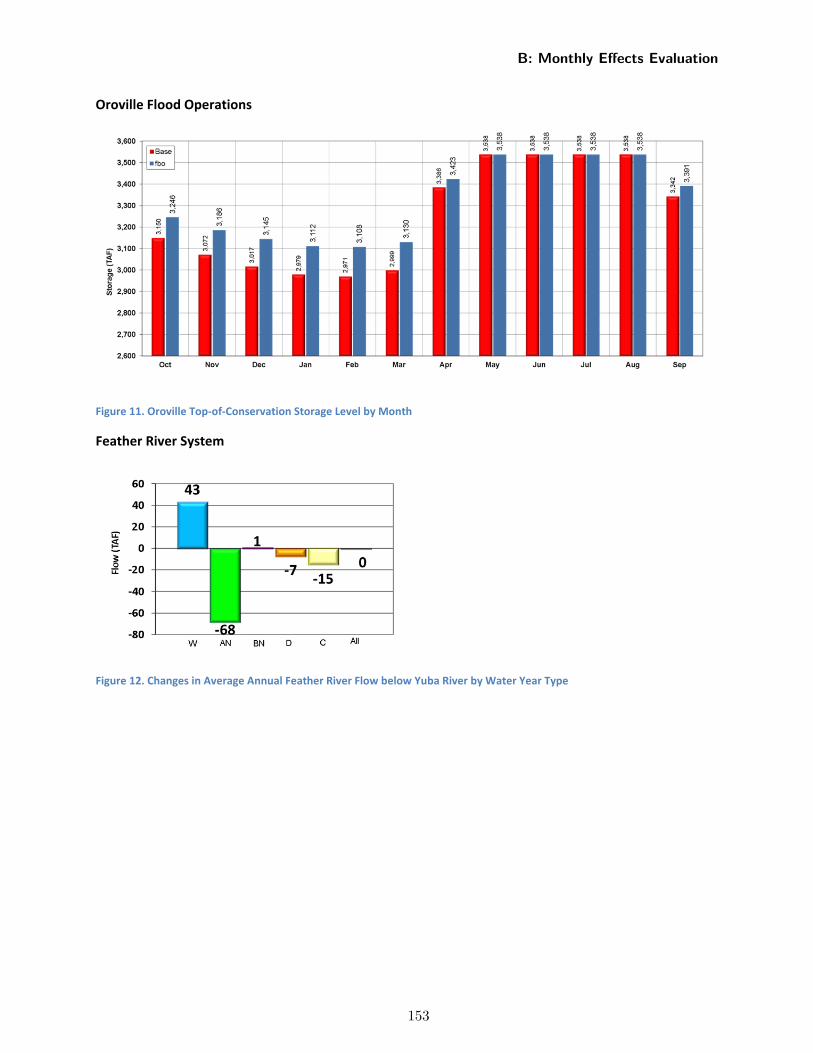
Oroville Flood Operations
Figure 11. Oroville Top‐of‐Conservation Storage Level by Month
Feather River System
Figure 12. Changes in Average Annual Feather River Flow below Yuba River by Water Year Type
B: Monthly Effects Evaluation
153
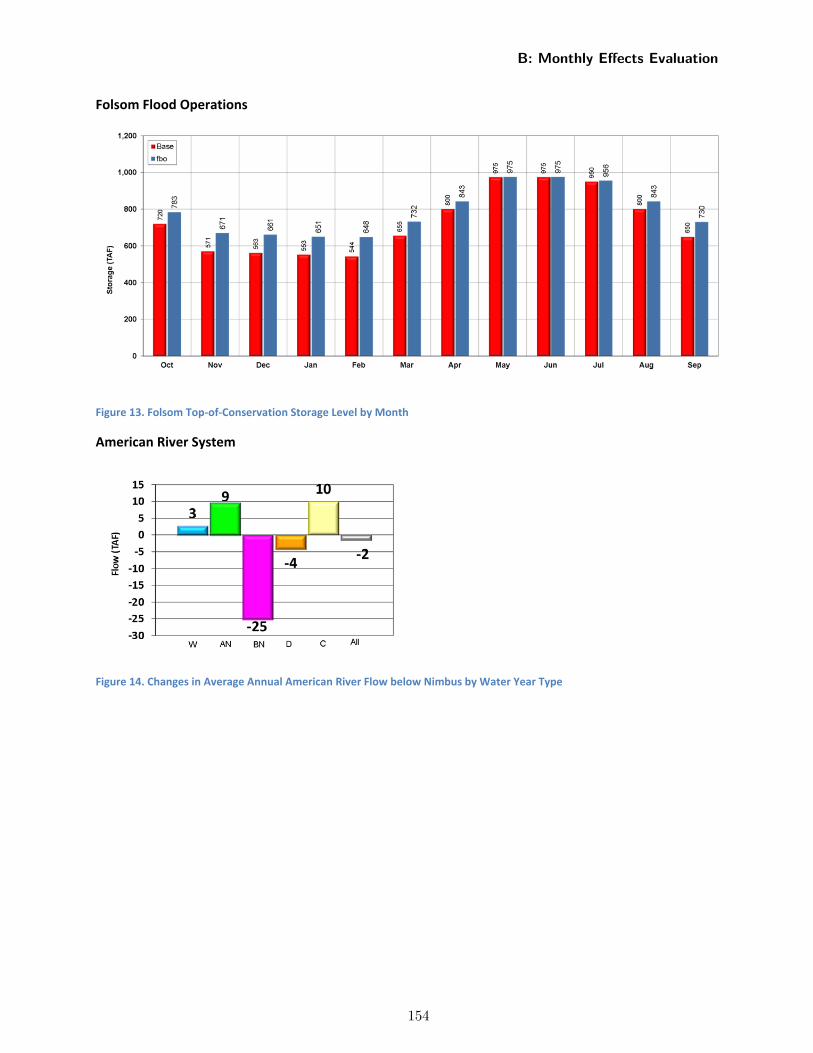
Folsom Flood Operations
Figure 13. Folsom Top‐of‐Conservation Storage Level by Month
American River System
Figure 14. Changes in Average Annual American River Flow below Nimbus by Water Year Type
B: Monthly Effects Evaluation
154
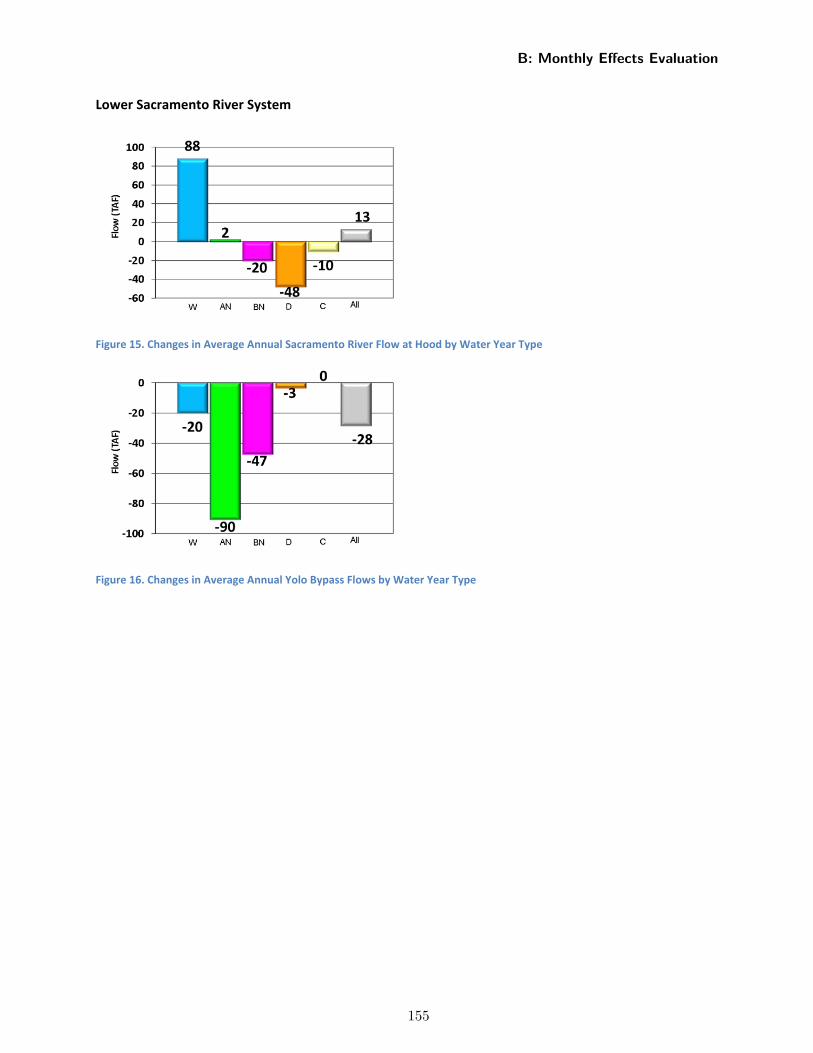
Lower Sacramento River System
Figure 15. Changes in Average Annual Sacramento River Flow at Hood by Water Year Type
Figure 16. Changes in Average Annual Yolo Bypass Flows by Water Year Type
B: Monthly Effects Evaluation
155
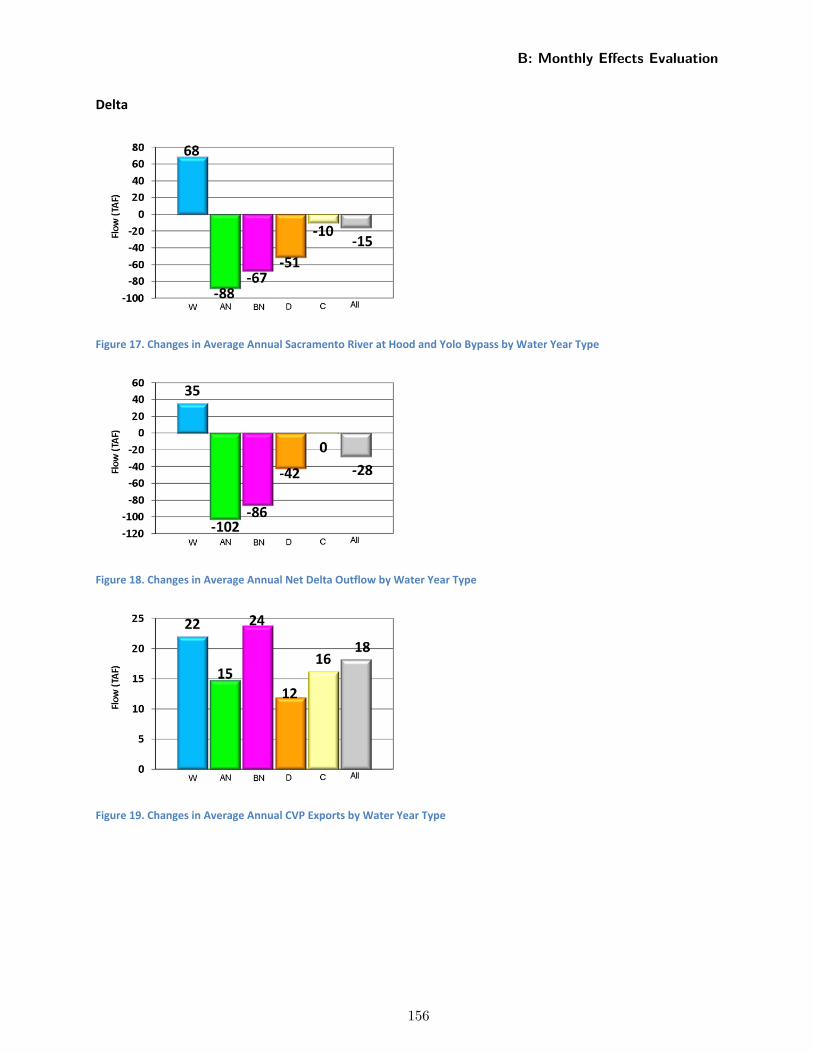
Delta
Figure 17. Changes in Average Annual Sacramento River at Hood and Yolo Bypass by Water Year Type
Figure 18. Changes in Average Annual Net Delta Outflow by Water Year Type
Figure 19. Changes in Average Annual CVP Exports by Water Year Type
B: Monthly Effects Evaluation
156
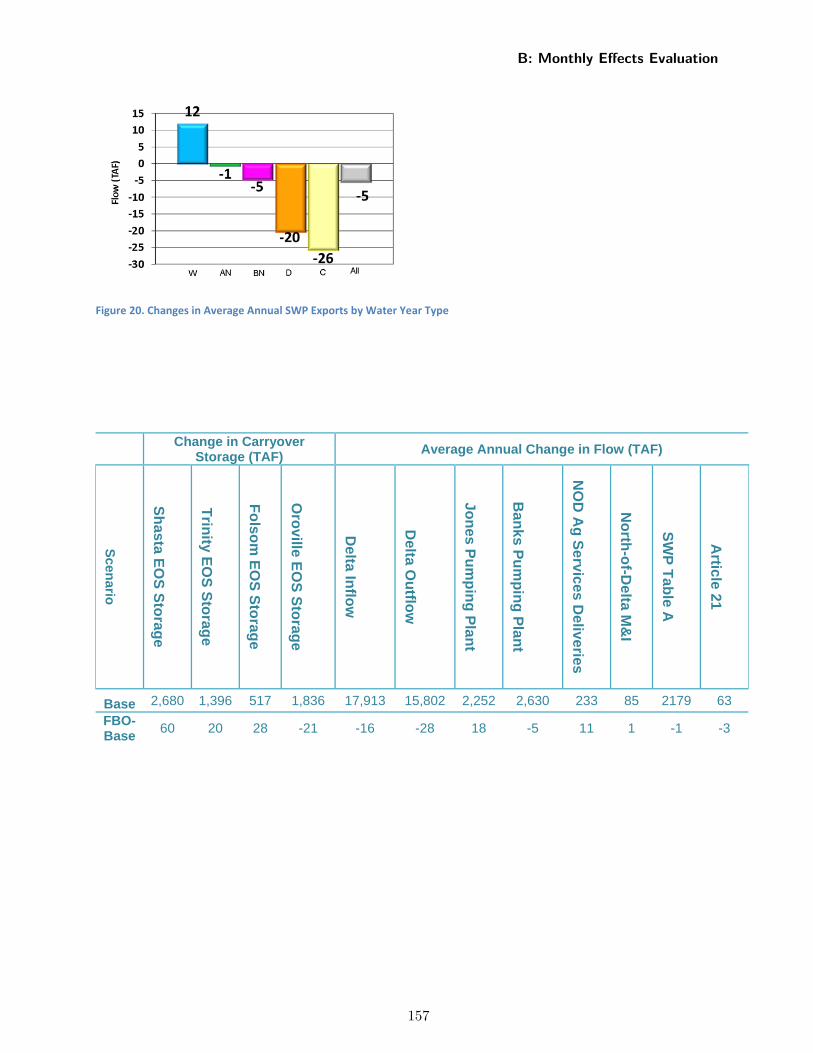
Figure 20. Changes in Average Annual SWP Exports by Water Year Type
Change in Carryover Storage (TAF)
Average Annual Change in Flow (TAF)
Scen
ario
Sh
asta EO
S S
torag
e
Trin
ity EO
S S
torag
e
Fo
lsom
EO
S S
torag
e
Oro
ville EO
S S
torag
e
Delta In
flow
Delta O
utflo
w
Jon
es Pu
mp
ing
Plan
t
Ban
ks Pu
mp
ing
Plan
t
NO
D A
g S
ervices D
eliveries
No
rth-o
f-De
lta M&
I
SW
P T
able A
Article 21
Base 2,680 1,396 517 1,836 17,913 15,802 2,252 2,630 233 85 2179 63
FBO-Base
60 20 28 -21 -16 -28 18 -5 11 1 -1 -3
B: Monthly Effects Evaluation
157