Embed Size (px)
Citation preview

IINNDDIIAANNAAPPOOLLIISS AAIIRRPPOORRTT AAUUTTHHOORRIITTYY
22001188 AAPPPPRROOPPRRIIAATTIIOONN BBUUDDGGEETT
OORRDDIINNAANNCCEE NNOO.. 11--22001177
BBOOAARRDD AAPPPPRROOVVEEDD AAUUGGUUSSTT 1188,, 22001177

2018 Appropriation Budget Table of Contents
Board Approved August 18, 2017
1 Appropriation Summary
2 Airport System Fund Expenses 3 Capital Improvement Fund 4 Anticipated Rates
Supplemental Schedules:
5-7 Capital Improvement Program Summary
8 Airport System Fund Revenues
9 Capital Improvement Fund – Sources of Funds Projections 10 Analysis of Airport System Fund Revenue 11 Analysis of Airport System Fund Expenses

2017 2018Total Total
Personal Services 31,334,000$ 34,444,000$ Supplies & Materials 5,737,000 6,069,000 Contractual Services and Debt Service 156,393,000 147,231,000 Operating Capital 233,000 1,604,000
Total Airport System Fund 193,697,000$ 189,348,000$ *
Total Capital Improvement Fund 79,000,000$ 110,000,000$ *
Appropriation Summary
* Appropriation amount published in local newspapers on 7/11 and 7/18
1
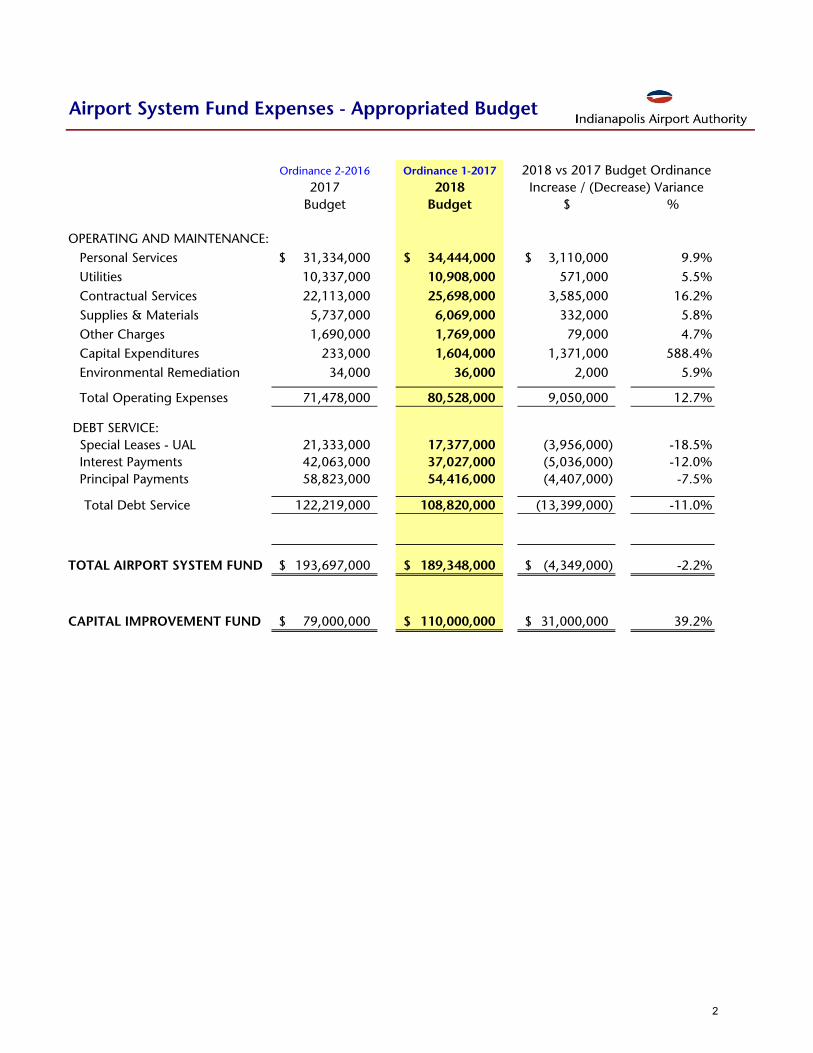
Airport System Fund Expenses - Appropriated Budget
Ordinance 2-2016 Ordinance 1-2017
2017 2018Budget Budget $ %
OPERATING AND MAINTENANCE: Personal Services 31,334,000$ 34,444,000$ 3,110,000$ 9.9% Utilities 10,337,000 10,908,000 571,000 5.5% Contractual Services 22,113,000 25,698,000 3,585,000 16.2% Supplies & Materials 5,737,000 6,069,000 332,000 5.8% Other Charges 1,690,000 1,769,000 79,000 4.7% Capital Expenditures 233,000 1,604,000 1,371,000 588.4% Environmental Remediation 34,000 36,000 2,000 5.9% Total Operating Expenses 71,478,000 80,528,000 9,050,000 12.7%
DEBT SERVICE: Special Leases - UAL 21,333,000 17,377,000 (3,956,000) -18.5% Interest Payments 42,063,000 37,027,000 (5,036,000) -12.0% Principal Payments 58,823,000 54,416,000 (4,407,000) -7.5%
Total Debt Service 122,219,000 108,820,000 (13,399,000) -11.0%
TOTAL AIRPORT SYSTEM FUND 193,697,000$ 189,348,000$ (4,349,000)$ -2.2%
CAPITAL IMPROVEMENT FUND 79,000,000$ 110,000,000$ 31,000,000$ 39.2%
2018 vs 2017 Budget OrdinanceIncrease / (Decrease) Variance
2

Capital Improvement Fund Appropriation - 2018
($000)
New and Ongoing Projects (2018 Project Cost)
Stormwater Capacity Enhancement 39,620$
Parking Garage Improvements (Mechanical & Structural) 8,800
IND Baggage Handling System 8,505
Consolidated Snow Removal & Equipment Storage Facility 8,000
High Speed Taxiway Exit C7 Reconfiguration, with LED Lights 3,612
Rehabilitate Taxiway C and Shoulders 2,958
Rehabilitate, Relocate & Widen Taxiway B - Eagle Creek 2,828
Bethel Cemetery Relocation 2,522
Shuttle Bus Replacement (Parking) - 2018 2,250
Cargo Building Expansion (Building #622) 2,147
Rehabilitate Airport Roads & Lots - 2018 2,000
Other Airport Projects 20,643
Subtotal (agrees to Program Summary p. 7) 103,885$
Estimated Potential Carryover from 2017 6,115
Total Capital Improvement Fund Appropriation 110,000$
3
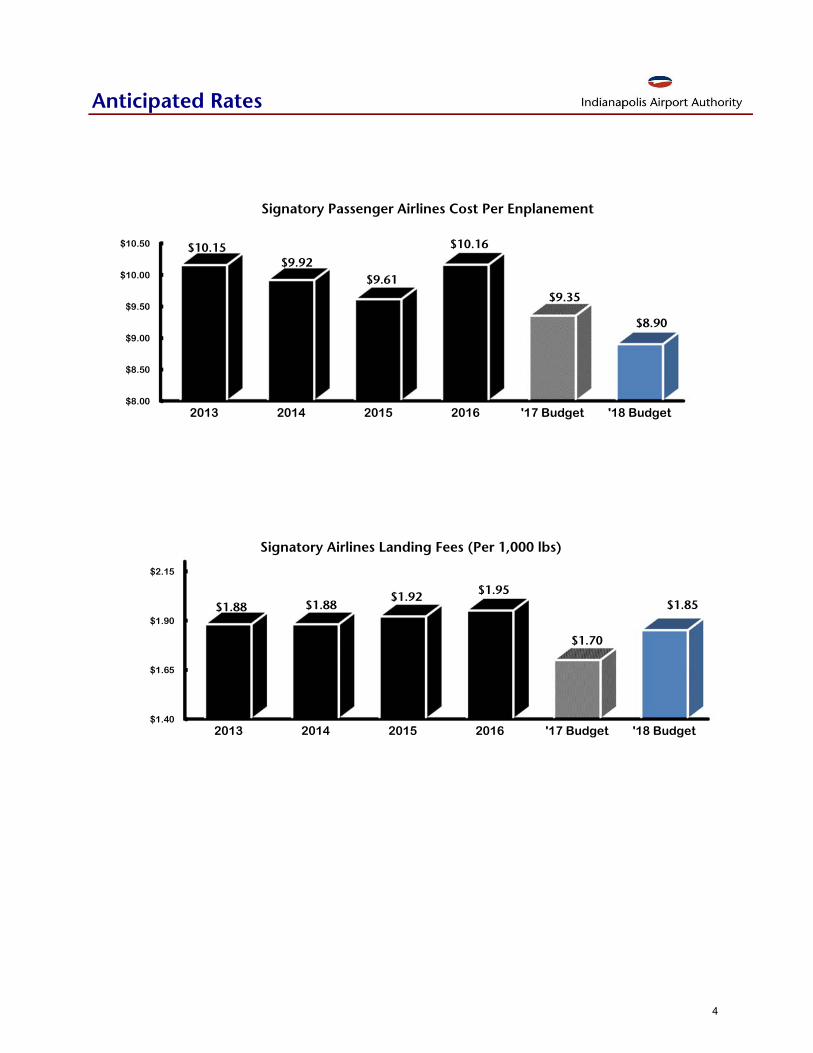
Anticipated Rates
$8.00
$8.50
$9.00
$9.50
$10.00
$10.50
2013 2014 2015 2016 '17 Budget '18 Budget
$10.15 $9.92
$9.61
$10.16
$9.35
$8.90
Signatory Passenger Airlines Cost Per Enplanement
$1.40
$1.65
$1.90
$2.15
2013 2014 2015 2016 '17 Budget '18 Budget
$1.88 $1.88 $1.92 $1.95
$1.70
$1.85
Signatory Airlines Landing Fees (Per 1,000 lbs)
4
SSUUPPPPLLEEMMEENNTTAALL SSCCHHEEDDUULLEESS

Indianapolis Airport AuthorityCapital Improvement Program 2018
PROJECT NAME
PRE-2017 ACTUAL
COST
2017 BUDGET
/ MII2017
FORECAST2018
BUDGETENTERPRISE PROJECTS DETAIL
IAA ActivitiesUtility Corridor Relocation - Cargo Apron 8 953 4,492 - Apron Stormwater Inlet Repairs - IND 1,251 - 683 - Pavement Management: Airfield Rehabilitation Program - 2018 - 262 - 262 TW D Signage at D-3/4/5 & 6 - - 120 - LED Lighting and Signage - High Speed Exit C4 - 844 - - Expand Airfield Fire Hydrant System - Taxiway D - 361 - -
Total Airfield: 1,259 2,420 5,295 262
IND - Terminal and Campus Optimization 769 2,750 1,000 1,500 Terminal Back-up Water Connection - 245 - 245 Terminal Backup Heating and Cooling - 180 - - Terminal Bird Deterrent System 9 - 800 - Concession Refresh Professional Fees 159 290 271 150 Install Concourse Exhaust Ducts 184 - 21 -
Total Terminal: 1,121 3,465 2,092 1,895
Parking Master Plan Implementation 128 2,400 1,000 - *** CFC funded portion of Parking Master Plan ImplementationParking Garage Improvements - 2015 189 2,000 4,100 8,800 Parking Garage Improvements - Outyears 37 - - - PARCS System Assessment & Implementation 38 1,840 1,902 - Construct Bus Bay in Employee Parking Lot - 657 200 - Garage Atrium Canopy Replacement - 2014 8,799 - 1,201 - License Plate Recognition System - - 50 - Parking Garage Improvements 2013-2014 2,913 - 660 - Rehabilitate Asphalt Lots - 2017 - 459 - -
Total Parking: 12,104 7,356 9,113 8,800
Consolidated Snow Removal and Equipment Storage Facility 645 8,000 1,500 8,000 Replace or Update Security System - 4,000 550 1,000 2018 SCBA Replacement - - - 315 Radio System Upgrade 852 - 52 -
Total Safety & Security: 1,497 12,000 2,102 9,315
IMC - IW Pipe Replacement Program - - - 500 Stormwater RFI Project 992 - 250 - IMC - IW Tank 7 Replacement - - 200 -
Total Environmental: 992 - 450 500
Rehabilitate Airport Roads & Lots - 2016/2017 259 4,500 4,000 - Rehabilitate Airport Roads & Lots - 2018 - - - 2,000 West Perimeter Road Bridge Repairs - - 75 450
Total Road & Lots: 259 4,500 4,075 2,450
Campus Fiber Repair/Development 26 1,500 2,774 - Geographic Information System - 2016/2017 - 500 - 500 Replace Existing IAA Network - - 435 - Computer, Server and Equipment Replacement Program (2017) - 600 315 - Capital Project Management System - Engineering - - 50 - IAA Website Development 105 - 145 - Computer, Server and Equipment Replacement Program (2016) - - 95 -
Total IT: 131 2,600 3,814 500
(2017) Snow Equipment Program - 1,728 1,436 - (2017) Vegetation Control Equipment Program - 912 - -
Total Vehicle & Equipment: - 2,640 1,436 -
IND Terminal and Campus Wayfinding and Signage - - 202 1,000 Airport Asset Management Program - - 750 750 Advance Planning and Design - 2017 - 250 250 - Capital Salaries - 600 - -
Total Properties: - 850 1,202 1,750
5

Indianapolis Airport AuthorityCapital Improvement Program 2018
PROJECT NAME
PRE-2017 ACTUAL
COST
2017 BUDGET
/ MII2017
FORECAST2018
BUDGET
Old Parking Garage - Preservation Project 66 668 400 252 Demo Avis (Building #18) and Relocate - - 488 - Hertz Renovation (Building #130) - - 39 229 Property - Branding of IND Campus - 240 - - Property - Relocate Record Storage Create Temp Controlled Space for Air C 560 105 53 - Cargo Building Expansion (Building #622) - - 221 2,147 Bldg 63 - Interior Space "White Box" - 683 - - Bldg 60 - HVAC, Loading Dock, Parking Lot Lights, & Install Elevator - 1,259 - - Tree and Stump Removal at IND - 235 - -
Total Revenue Development: 626 3,190 1,201 2,628
CEP - Cooling Tower Replacement - - - 500 CEP - Pipe Arbor Insulation Replacement - 878 915 - CEP - Replacement of Stack Economizers Boilers 20 - 610 - CEP - Replacement of IW's Supervisory Control and Data Acquisition Syste 16 - 522 - Demolition of Building #500 - - - 186 Bldg 15 - Roof, Upgrade ADA & Fire Suppression - 147 184 - CEP - Boiler No. 2 Replacement 611 - 89 - Bldg 27 - Hangar Door, HVAC, & Roof - 300 - -
Total Properties: 647 1,325 2,320 686
T-Hangar Rehabilitation - Metro 7 - 463 - Self-Service Fuel System and Tank (equipment only) - Indy Regional - - - 400 T-Hangar Rehabilitation - Indy Regional 6 - 344 - Rehabilitate Parking Lot - Metro - 270 - - Demolition of T-Hangars (Bldgs 103 - 106) - Eagle Creek 27 - 174 - Rehabilitate Northwest T-Hangar Parking Lot - Eagle Creek - 140 - - Acquire Land for Runway Extension - Hendricks Co. - 400 - - Replace Doublewide Trailer with Permanent Building - Hendricks Co. - 126 - -
Total Relievers: 40 936 981 400
Total IAA Activities 18,676 41,282 34,081 29,186
IMC ActivitiesIMC - Hangar Door Rehabilitation 1, 2, & 3 - - - 700 IMC - Hangar Door Rehabilitation - Motor & Gearbox - - - 412 IMC - Hangar Door Rehabilitation 5 and 6 21 - - - IMC - Recoating the IW Tanks & Enclosure Containment Area 161 - 544 - IMC - Fire Alarm Panel Replacements - 494 - - IMC - Carpet Installation for Tenant - - 170 - IMC - Building Management System (BMS) - - 100 67 IMC - Hangar 7 - Hangar Door Rehabilitation 202 - 163 -
Total IMC Activities 384 494 977 1,179
CFC Funded ActivitiesConstruct North Service Road and Convert North Access Road to Tug Road - - - 306 Parking Master Plan Implementation 128 2,400 1,000 - *** Non-CFC funded portion of Parking Master Plan Implementation (128) (2,400) (1,000)
Total CFC funded Activities - - - 306
Land ActivitiesNoise & General Airport System Land Acquisition 1,907 1,000 - 1,000 Land Purchase - Seerley Basin - - 3,000 - Bethel Cemetery Relocation - - 250 2,522
Total Land Activities 1,907 1,000 3,250 3,522
6

Indianapolis Airport AuthorityCapital Improvement Program 2018
PROJECT NAME
PRE-2017 ACTUAL
COST
2017 BUDGET
/ MII2017
FORECAST2018
BUDGET
Debt Funded ActivitiesStormwater & Deicing - Seerley Creek Basin Relocation - - 250 27,470 Stormwater & Deicing Controls Capacity West Basin - - 2,600 12,150
Total Debt Funded Activities - - 2,850 39,620
TOTAL ENTERPRISE ACTIVITIES 20,967 42,776 41,158 73,813
AIP PROJECTS DETAIL
Grant Funded ActivitiesShuttle Bus Replacement (Parking) - 2017 Electric Buses 3 3,390 5,497 - Rehab of RW 14-32 and TWs M and G, with LED signage and lighting for 14 - - 500 500 Rehabilitate Taxiway H - H1 and H2 2,677 6,100 5,081 - Shuttle Bus Replacement (Parking) - 2018 - - - 2,250 High Speed Taxiway Exit C4 Reconfiguration, with LEDs - 7,116 - - High Speed Taxiway Exit C7 Reconfiguration, with LED's - - - 3,612 Rehabilitate Taxiway C and Shoulders 342 2,400 500 2,958 Rehabilitate Taxiway B (Phase 2) 4,452 - 2,548 - TW Connector Removal TW M2, H (between 14/32 & M), & J (between M & - - - 125 Replace Lighting with LEDs on Taxiway H - H1 and H2 - 831 1,950 - Deicing Control Facilities Improvements - 2016 380 - 957 - Replace Lighting Taxiway C w/ LED - - 275 1,425 2018 ARFF 3000 Replacement - 1,000 - 1,000 Sustainability Energy Management Plan - - 250 750 Pavement Removal IMC TW A7 Connector - - - 80 Deicing Control Facilities Improvements - 2018 - 446 - 446 Deicing Control Facilities Improvements - 2017 (Mars Ditch) - - 446 - Airfield Pavement Evaluation and Management Plan Update - 2015 - - 200 - Stormwater & Deicing Controls & Capacity - Ph 2B (3) 6,124 - 151 - Master Plan for IND 1,070 - 50 -
Total Programmed: 15,048 21,283 18,405 13,146
Re-Groove Runway 23L - - - 480 Total Likely: - - - 480
IND BHS Recapitalization - - 550 8,505 Total Contingent - BHS: - - 550 8,505
Voluntary Airport Low Emission (VALE) 2018 - - - 1,360 Total Contingent: - - - 1,360
(2018-2022) Snow Equipment Program - - - 797 Total Low Priority: - - - 797
Rehabilitate, Relocate & Widen Taxiway B - Eagle Creek - 1,630 172 2,828 Rehabilitate Northwest T-Hangar Taxilanes Phase I & II - Eagle Creek - - - 442 Airport Layout Plan (ALP) Update - Eagle Creek 248 40 152 - Rehabilitate & Extend Taxiway A - Metro - - 200 1,200 Install Perimeter Fence Phase III - Metro - 500 - - Rehabilitate Apron Pavement - Metro 25 540 591 - Replace Airfield Lighting - Metro 78 - 972 - Rehabilitate East & West Apron Pavement - Indy Regional 48 726 52 1,180 Joint Replacement and Repairs Runway 16-34 - Indy Regional 41 - 400 14 Terminal Building - Hendricks - - - 120 Update Airport Layout Plan (ALP) - Hendricks Co. - 120 - - Runway & Taxiway Pavement Crack Repair - Hendricks - - 530 - Replace Lighting on Taxiway B - Indy Regional - 470 - - Runway 16-34 Electrical Upgrades - Indy Regional 3 620 - - Replace Aviation Fuel Farm - Heliport 817 - 16 - Structural Slab Replacement - Heliport 1,167 - 317 -
Total Reliever: 2,427 4,646 3,402 5,784
TOTAL GRANT/AIP FUNDED ACTIVITIES 17,475 25,929 22,357 30,072
GRAND TOTAL 38,442 68,705 63,515 103,885
7

Airport System Fund Revenues - Appropriated Budget
Ordinance 2-2016 Ordinance 1-2017
2017 2018Budget Budget $ %
Airline Total 46,926,000 47,859,000 933,000 2.0%
NON-AIRLINE
AIRFIELDFuel Sales 220,000 240,000 20,000 9.1%Ground Handling / Other 148,031 65,000 (83,031) -56.1%
RETAIL Food & Beverage 5,445,773 5,786,941 341,168 6.3%News & Gifts 1,136,536 1,171,452 34,916 3.1%Specialty Shops 1,324,263 1,387,592 63,329 4.8%Advertising 1,054,866 1,127,971 73,105 6.9%Car Rental 10,122,285 10,671,162 548,877 5.4%Other 1,340,869 1,367,961 27,092 2.0%
PARKING & GTCParking 46,654,293 48,019,748 1,365,455 2.9%Ground Transportation Center 845,534 1,087,148 241,614 28.6%
PROPERTIES Freight Buildings 953,855 1,082,149 128,294 13.5%Ground Leases 5,833,366 6,039,235 205,869 3.5%Hangars / Other Buildings 14,946,759 15,419,327 472,568 3.2%
RELIEVERS 3,049,164 3,047,644 (1,520) 0.0%
Indianapolis Maint. Center (IMC) 7,794,848 7,891,288 96,440 1.2%
OTHER INCOME 72,681 230,203 157,522 216.7%
Total Non-Airline Revenue 100,943,123 104,634,821 3,691,698 3.7%
OTHER REVENUES Special Leases - UAL 16,613,719 13,300,111 (3,313,608) -19.9%GASB Adjustment (109,384) (99,761) 9,623 -8.8%Operating Grant Revenue 721,000 500,000 (221,000) -30.7%Passenger Facility Charges (PFC's) 15,915,760 17,238,000 1,322,240 8.3%Customer Facility Charges (CFC's) 6,702,440 7,284,900 582,460 8.7%Interest 3,747,967 4,252,800 504,833 13.5%
TOTAL OPERATING REVENUE 191,460,625 194,969,871 3,509,246 1.8%
LESS Inter-fund Transfers (19,747,967) (20,252,800) (504,833) 2.6%
TOTAL (net of transfers) 171,712,658 $174,717,071 $3,004,413 1.7%
2018 vs 2017 Budget Ordinance
Increase / (Decrease) Variance
8

Capital Improvement Fund - Source of Funds Projections
Ordinance 2-2016 Ordinance 1-2017
2017 2018Budget Budget
Federal and State Grants $9,843,428 9,843,428$
Interest 3,747,967 4,252,800
Operating Fund Transfers 16,000,000 16,000,000
Financing - 39,620,000
Proceeds from Land & Property Sales 1,400,000 5,669,000
Capital Improvement Funds 48,008,605 34,614,772 TOTAL $79,000,000 110,000,000$
9
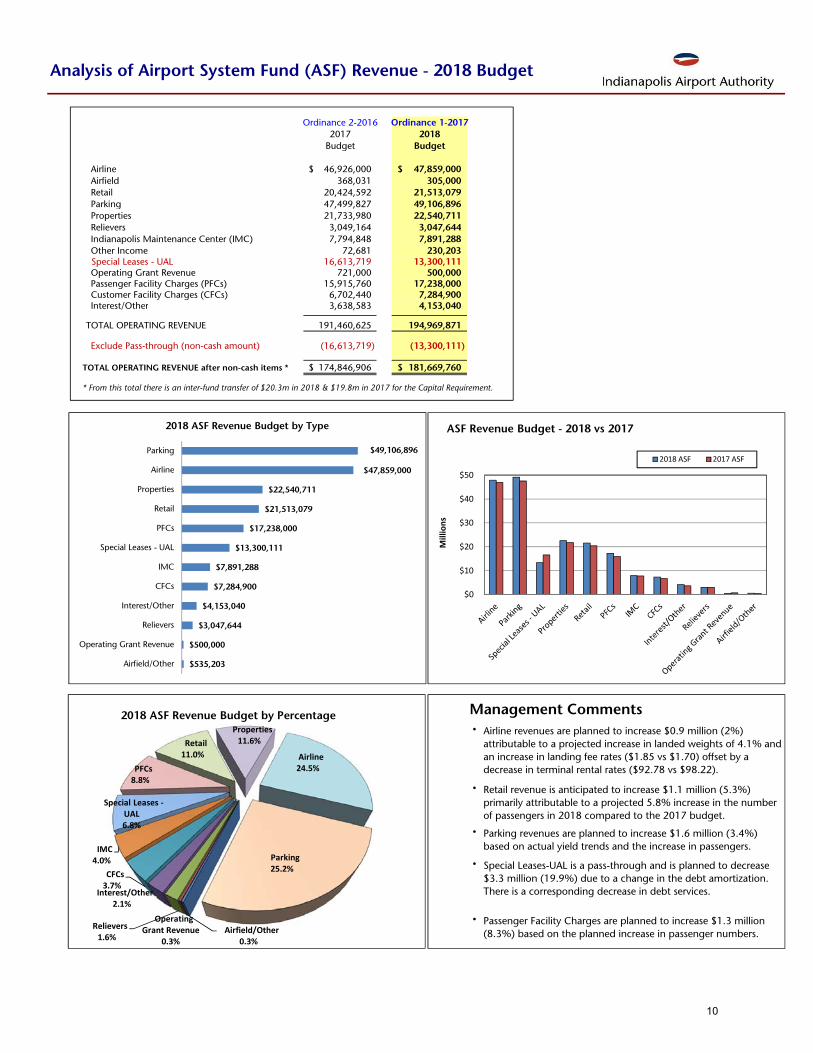
Analysis of Airport System Fund (ASF) Revenue - 2018 Budget
Ordinance 2-2016 Ordinance 1-20172017 2018
Budget Budget $ %
Airline 46,926,000$ 47,859,000$ 933,000$ Airfield 368,031 305,000 (63,031) Retail 20,424,592 21,513,079 1,088,487 5.3% Parking 47,499,827 49,106,896 1,607,069 3.4% Properties 21,733,980 22,540,711 806,731 3.7% Relievers 3,049,164 3,047,644 (1,520) 0.0% Indianapolis Maintenance Center (IMC) 7,794,848 7,891,288 96,440 1.2% Other Income 72,681 230,203 157,522 216.7% Special Leases - UAL 16,613,719 13,300,111 (3,313,608) -19.9%
Operating Grant Revenue 721,000 500,000 (221,000) -30.7% Passenger Facility Charges (PFCs) 15,915,760 17,238,000 1,322,240 8.3% Customer Facility Charges (CFCs) 6,702,440 7,284,900 582,460 8.7% Interest/Other 3,638,583 4,153,040 514,457 14.1%
TOTAL OPERATING REVENUE 191,460,625 194,969,871 3,509,247
Exclude Pass-through (non-cash amount) (16,613,719) (13,300,111)
TOTAL OPERATING REVENUE after non-cash items * 174,846,906$ 181,669,760$
* From this total there is an inter-fund transfer of $20.3m in 2018 & $19.8m in 2017 for the Capital Requirement.
Management Comments•
•
•
•
• Passenger Facility Charges are planned to increase $1.3 million (8.3%) based on the planned increase in passenger numbers.
2016 vs 2015 Budget OrdinanceFav / (Unfav) Variance
Airline revenues are planned to increase $0.9 million (2%) attributable to a projected increase in landed weights of 4.1% and an increase in landing fee rates ($1.85 vs $1.70) offset by a decrease in terminal rental rates ($92.78 vs $98.22).
Parking revenues are planned to increase $1.6 million (3.4%) based on actual yield trends and the increase in passengers.
Retail revenue is anticipated to increase $1.1 million (5.3%) primarily attributable to a projected 5.8% increase in the number of passengers in 2018 compared to the 2017 budget.
Special Leases-UAL is a pass-through and is planned to decrease $3.3 million (19.9%) due to a change in the debt amortization. There is a corresponding decrease in debt services.
$535,203
$500,000
$3,047,644
$4,153,040
$7,284,900
$7,891,288
$13,300,111
$17,238,000
$21,513,079
$22,540,711
$47,859,000
$49,106,896
Airfield/Other
Operating Grant Revenue
Relievers
Interest/Other
CFCs
IMC
Special Leases - UAL
PFCs
Retail
Properties
Airline
Parking
2018 ASF Revenue Budget by Type
$0
$10
$20
$30
$40
$50
Millions
ASF Revenue Budget - 2018 vs 2017
2018 ASF 2017 ASF
Airfield/Other0.3%
Operating Grant Revenue
0.3%
Relievers1.6%
Interest/Other2.1%
CFCs3.7%
IMC4.0%
Special Leases ‐UAL6.8%
PFCs8.8%
Retail11.0%
Properties11.6%
Airline24.5%
Parking25.2%
2018 ASF Revenue Budget by Percentage
10

Analysis of Airport System Fund (ASF) Expenses - 2018 Budget
Ordinance 2-2016 Ordinance 1-20172017 2018
Budget Budget $ %OPERATING AND MAINTENANCE: Personal Services 31,334,093$ 34,444,010$ (3,109,917)$ -9.9% Utilities 10,337,234 10,908,352 (571,118) -5.5% Contractual Services 22,112,809 25,698,200 (3,585,391) -16.2% Supplies & Materials 5,737,169 6,068,550 (331,381) -5.8% Other Charges 1,689,287 1,769,155 (79,868) -4.7% Capital Expenditures 233,000 1,603,520 (1,370,520) -588.2% Environmental Remediation 34,330 35,710 (1,380) -4.0%
Total Operating Expenses 71,477,922 80,527,497 (9,049,575) -12.7%
DEBT SERVICE: Special Leases - UAL 21,333,708 17,377,278 3,956,430 18.5% Interest Payments 42,062,620 37,026,910 5,035,710 12.0% Principal Payments 58,823,000 54,415,500 4,407,500 7.5% Total Debt Service 122,219,328 108,819,688 13,399,640 11.0%
Capital Program Funding 16,000,000 16,000,000
TOTAL AIRPORT SYSTEM FUND APPROPRIATION 209,697,250$ 205,347,185$ 4,350,065$ 2.1%
Exclude Pass-through (non-cash amount) (21,333,708) (17,377,278) Exclude Variable Debt reserve (non-cash amount) (11,903,000) (11,918,000) Exclude Other Debt Service Amortization (non-cash amount) 570,419 3,231,297
TOTAL AIRPORT SYSTEM FUND after non-cash items 177,030,961$ 179,283,204$
Management Comments
•
•
•
•
•
2016 vs 2015 Budget OrdinanceFav / (Unfav) Variance
Personal Services increase of $3.1 million (9.9%). Annual merit and benefit 2.6%, total compensation program 3.2%, as well as planned increases in full time operational staff 4.1%.
Contractual Services projected to increase $3.6 million (16.2%) due to planning and development initiatives and repairs and maintenance in support of aging buildings/equipment.
Operating Capital Expenditures increased $1.4 million relating to the investment in preserving existing assets.
2018 budgeted debt service represents scheduled interest and principal payments reflecting lower interest and principal payments than prior year.
Special Leases - UAL is a pass-through and is planned to decrease $4.0 million (18.5%) due to a change in the debt amortization.
$1,603,520
$7,873,415
$10,908,352
$17,377,278
$25,698,200
$34,444,010
$37,026,910
$54,415,500
Capital Expenditures
Supplies/Materials &Other
Utilities
Special Leases - UAL
Contractual Services
Personal Services
Interest Payments
Principal Payments
2018 ASF Expense Budget by Type
$0
$10
$20
$30
$40
$50
$60
Millions
ASF Expense Budget - 2018 vs 20172018 ASF 2017 ASF
Capital Expenditures
0.8%
Supplies/Materials
& Other
3.9%
Utilities5.8%
Special Leases ‐ UAL9.2%
Contractual Services 13.6%
Personal Services18.2% Interest
Payments19.6%
Principal Payments28.7%
2018 ASF Expense Budget by Percentage
11