Embed Size (px)
Citation preview

2018 ANNUALREPORT
Pennsylvania Workers’ Compensation and Workplace Safety
TOM WOLF, GOVERNORW. GERARD OLEKSIAK, SECRETARY

2018 ANNUALREPORT
Pennsylvania Workers’ Compensation and Workplace Safety
TOM WOLF, GOVERNORW. GERARD OLEKSIAK, SECRETARY
00
2018 ANNUAL
REPORTPennsylvania Workers’ Compensation and Workplace Safety
TOM WOLF, GOVERNORW. GERARD OLEKSIAK, SECRETARY
This is a publication of the PA Department of Labor & Industry, Bureau of Workers’ Compensation.
Questions or comments regarding this report should be forwarded to:
Bureau of Workers’ Compensation1171 S. Cameron St., Room 324
Harrisburg, PA 17104-2501717-783-5421
Secretary of Labor & Industry ..........................................W. Gerard Oleksiak
Deputy Secretary for Compensation and Insurance ..................Scott G. Weiant
Director, Bureau of Workers’ Compensation .........................................Vacant
Director, Workers’ Compensation Office of Adjudication ...............Joseph DeRita
Chairman, Workers’ Compensation Appeal Board .................. Alfonso Frioni, Jr.
Secretary, Workers’ Compensation Appeal Board ......................... Steven Loux
Editor ............................................................................... Margaret T. Day
Statistician ..........................................................................Peter J. Phelan
Auxiliary aids and services are available upon request to individuals with disabilities.Equal Opportunity Employer/Program
00 3

2018 ANNUALREPORT
Pennsylvania Workers’ Compensation and Workplace Safety
TOM WOLF, GOVERNORW. GERARD OLEKSIAK, SECRETARY
The Pennsylvania Workers’ Compensation Act was enacted in 1915 to protect workers and employers from the potentially devastating consequences of work injuries. One-hundred years after enshrining these protections into law, the Department of Labor & Industry’s Bureau of Workers’ Compensation, the Workers’ Compensation Office of Adjudication, and the Workers’ Compensation Appeal Board continue carrying out the provisions of the act with integrity and dedication. This report illustrates our 2018 accomplishments and highlights our commitment to continually improving the system while delivering superior, cost-effective lean services.
A primary aim of the workers’ compensation system is to support the growth and success of Pennsylvania’s economy by preventing workplace injuries. In this effort, as of 2018, BWC has assisted employers to develop over 12,000 state-certified workplace safety committees that represent more than 1.5 million employees, nearly a quarter of all workers in the state. These employers are entitled to workers’ compensation insurance premium discounts, which have totaled almost $726 million to date.
In 2018, the Pennsylvania Training for Health & Safety resource (PATHS) continued its robust training outreach. Staff held 454 training sessions, reaching over 36,000 employees, with participants from 48 states and 8 countries. PATHS now offers training on 209 safety topics, including opioid-related training. As we continue expanding our safety outreach in the coming years, we look forward to helping more companies to reduce their business costs through both insurance discounts and accident prevention.
We welcome feedback from the workers’ compensation community to ensure constant system improvements and, as such, maximize the effectiveness of the workers’ compensation system. The department continues to promote economic development and strives to offer an improved business climate through a variety of initiatives and programs to help Pennsylvania’s employers and workforce remain world-class and globally competitive.As we continue our mission of reducing workplace injuries and providing benefits to employees who become sick or injured on the job, we will go forward with renewed determination to provide Pennsylvania employers and employees with the most fair, efficient, and effective workers’ compensation program possible.
Sincerely,
Jerry Oleksiak
SecretaryLabor & Industry
Jerry Oleksiak
004

2018 ANNUAL
REPORTPennsylvania Workers’ Compensation and Workplace Safety
TOM WOLF, GOVERNORW. GERARD OLEKSIAK, SECRETARY
Deputy Secretary for Compensation & Insurance
Scott G. Weiant
In 2018, the Bureau of Workers’ Compensation, the Workers’ Compensation Office of Adjudication, and the Workers’ Compensation Appeal Board continued providing outstanding customer service and working to improve Pennsylvania’s workers’ compensation system. As a result of these efforts, Pennsylvania stands as a national leader in workers’ compensation administration.
Pennsylvania’s workers’ compensation system experienced much activity during 2018. The bureau, the Office of Adjudication, and the Appeal Board again made substantial technological advancements to provide Pennsylvania employers and employees with a more efficient and effective workers’ compensation system.
The Office of Adjudication also continued to distinguish itself with its public service. During 2018, almost 99 percent of petitions filed were filed online through WCAIS, and almost 100 percent of answers were filed online. The statewide average time to hear and decide workers’ compensation cases was 5.9 months, down from 6.1 months in 2017.
The Appeal Board has found similar success in its work towards a timelier and more efficient appeals process. In order to better serve the board and the parties during oral argument, the board now posts the argument list for its upcoming hearing sessions a few business days before the session begins on its electronic landing page. In addition, as an internal operating procedure, the chairman and secretary of the board assign commissioners to specific cases concurrent with the issuance of the notice of hearing in order to provide a warmer bench for argument.
As we make future upgrades, we will continue working with the public to develop the most efficient workers’ compensation system in the country. I thank and congratulate everyone who helps us in this effort. Labor & In-dustry holds a strong commitment to superior public service, and we will continue working to ensure a fair, lean and effective workers’ compensation system for all Pennsylvanians.
Sincerely,
Scott G. Weiant
00 5
2018 ANNUALREPORT
Pennsylvania Workers’ Compensation and Workplace Safety
TOM WOLF, GOVERNORW. GERARD OLEKSIAK, SECRETARY
Overview of the PA Workers’ Compensation ProgramMission Statement ................................... 1Bureau of Workers’ Compensation (BWC) Principal Responsibilities ...................... 12018 Bureau of Workers’ Compensation Highlights .......................................... 1A Brief History of Pennsylvania Workers’ Compensation Law .............................. 2Basic Benefits ......................................... 2The Flow of a Pennsylvania Workers’ Compensation Claim ............................ 3The Flow of a Pennsylvania Workers’ Compensation Claim (Litigated) ............ 4Funding for Pennsylvania’s Workers’ Compensation System ......................... 5Workers’ Compensation Administration Fund Budget, Fiscal Year 2017-18 ................. 6
Workers’ Compensation UpdatesWorkers’ Compensation Automation and Integration System (WCAIS)................. 7Workers’ Compensation Advisory Council ..... 7Kids’ Chance of Pennsylvania, Inc. .............. 7Total Disability Weekly Workers’ Compensation Rates ................................................ 9
Bureau PersonnelOrganization Chart ................................. 10
Bureau DivisionsAdministrative Support Division ............... 11Claims Management Division ................... 12Health and Safety Division ...................... 13Health Care Services Review Division ........ 14Self-Insurance Division ........................... 15Special Funds and Compliance Division ..... 16Legal Division ....................................... 17
Overview of the Office of AdjudicationPrimary Functions .................................. 192018 Accomplishments ........................... 19Mission Statement ................................. 19Judge Managers .................................... 20Administrative Officers ........................... 20
Office of Adjudication UpdatesJudge Procedural Questionnaires .............. 20Alternative Dispute Resolution Services ..... 20
Office of Adjudication PersonnelOrganization Chart ................................. 21District Offices ...................................... 22
Office of Adjudication Statistical ReviewPetitions Assigned to Judges (Not Remands) .... 23Petitions and Remands Assigned vs. Judges’ Decisions ......................................... 23Reported Injuries vs. Total Petitions and Remands vs. Total Claim Petitions ....... 24Petitions Assigned by County ................... 25 Overview of the Workers’ Compensation Appeal BoardMission Statement ................................. 26Primary Functions .................................. 262018 Accomplishments ........................... 26WCAIS ................................................. 26Commissioners and Secretary .................. 26
Workplace SafetyGovernor’s Occupational Safety and Health Conference ...................................... 28Governor’s Award for Safety Excellence ..... 282018 Governor’s Award for Safety Excellence Winners .......................................... 29
Table of Contents
00
2018 ANNUAL
REPORTPennsylvania Workers’ Compensation and Workplace Safety
TOM WOLF, GOVERNORW. GERARD OLEKSIAK, SECRETARY
More InformationOn the Web .......................................... 31Publications Available from the Bureau of Workers’ Compensation ..................... 31Bureau of Workers’ Compensation Directory ...33Bureau of Workers’ Compensation Contact Information ..................................... 34Workers’ Compensation Office of Adjudication Directory ......................................... 35Workers’ Compensation Office of Adjudication Contact Information .......................... 36
Work Injuries and IllnessesScope .................................................. 39Work Injuries and Illness ........................ 39First Reports of Injury ............................ 41Table 1.a. Work Injuries and Illness by Major Industry ................................. 41Table 1.b. Historical Series - Work Injuries and Illnesses .................................... 42Type of Injury or Illness .......................... 43Part of Body Affected ............................. 44Cause of Injury ..................................... 45
Age of Injured Worker ............................ 46Gender of Injured Worker ....................... 47Table 2. Injury and Illness Rates in Selected Industries ........................... 48Table 3. Industry by Type of Injury or Illness .50Table 4. Industry by Part of Body Affected ..55 Table 5. Industry by Cause of Injury ....... 61Table 6. Type of Injury or Illness by Body Part Affected ............................ 68Table 7. Type of Injury or Illness by Cause of Injury ................................ 68Table 8. Age by Industry Division ........... 69Table 9. Age by Gender ......................... 69Table 10. County by Industry Division ....... 70County Where Injury or Illness Occurred ... 71Methodology & Glossary ......................... 72
Benefits PaidIndemnity & Medical Breakdown .............. 73Indemnity Compensation Paid 2007-2017 ... 74Medical Compensation Paid 2007-2017 ..... 75Total Workers’ Compensation Paid 2007-2017....................................... 76
Table of Contents
00
2018 ANNUALREPORT
Pennsylvania Workers’ Compensation and Workplace Safety
TOM WOLF, GOVERNORW. GERARD OLEKSIAK, SECRETARY
Overview of the PA Workers’ Compensation Program
Mission Statement
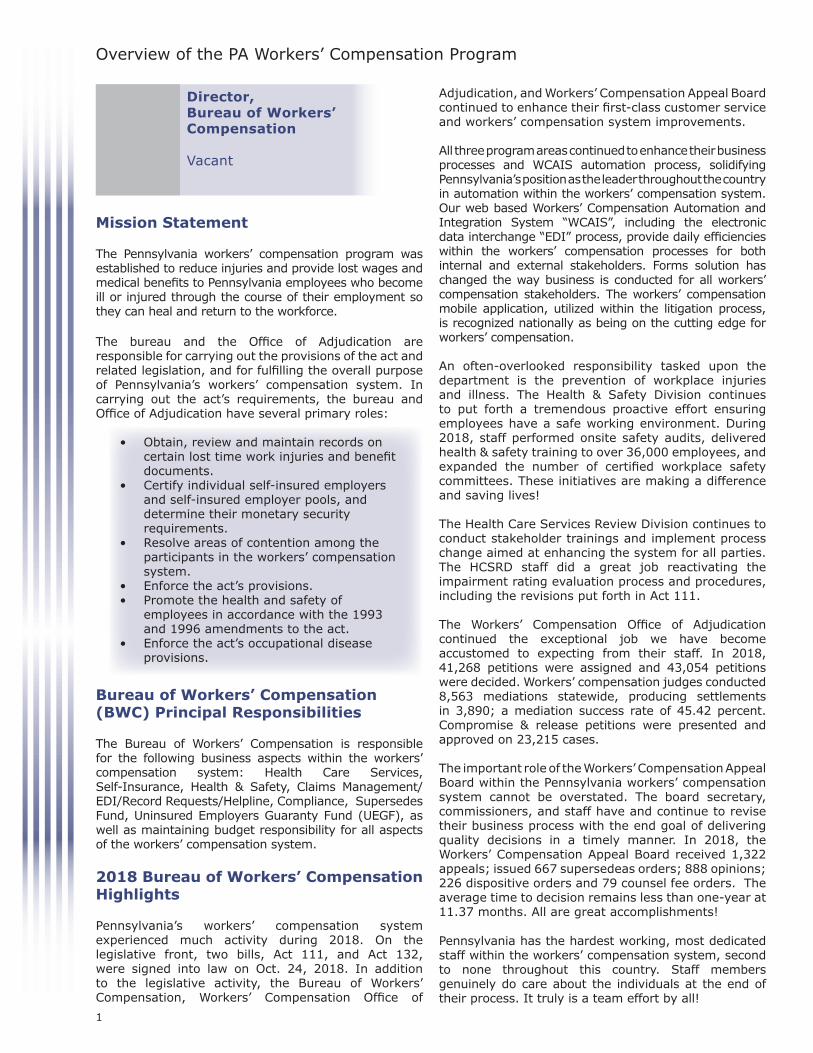
The Pennsylvania workers’ compensation program was established to reduce injuries and provide lost wages and medical benefits to Pennsylvania employees who become ill or injured through the course of their employment so they can heal and return to the workforce.
The bureau and the Office of Adjudication are responsible for carrying out the provisions of the act and related legislation, and for fulfilling the overall purpose of Pennsylvania’s workers’ compensation system. In carrying out the act’s requirements, the bureau and Office of Adjudication have several primary roles:
• Obtain, review and maintain records on certain lost time work injuries and benefit documents. • Certify individual self-insured employers and self-insured employer pools, and determine their monetary security requirements. • Resolve areas of contention among the participants in the workers’ compensation system. • Enforce the act’s provisions. • Promote the health and safety of employees in accordance with the 1993 and 1996 amendments to the act. • Enforce the act’s occupational disease provisions.
Bureau of Workers’ Compensation (BWC) Principal Responsibilities
The Bureau of Workers’ Compensation is responsible for the following business aspects within the workers’ compensation system: Health Care Services, Self-Insurance, Health & Safety, Claims Management/EDI/Record Requests/Helpline, Compliance, Supersedes Fund, Uninsured Employers Guaranty Fund (UEGF), as well as maintaining budget responsibility for all aspects of the workers’ compensation system.
2018 Bureau of Workers’ Compensation Highlights
Pennsylvania’s workers’ compensation system experienced much activity during 2018. On the legislative front, two bills, Act 111, and Act 132, were signed into law on Oct. 24, 2018. In addition to the legislative activity, the Bureau of Workers’ Compensation, Workers’ Compensation Office of
Director,Bureau of Workers’Compensation
Vacant
Adjudication, and Workers’ Compensation Appeal Board continued to enhance their first-class customer service and workers’ compensation system improvements.
All three program areas continued to enhance their business processes and WCAIS automation process, solidifying Pennsylvania’s position as the leader throughout the country in automation within the workers’ compensation system. Our web based Workers’ Compensation Automation and Integration System “WCAIS”, including the electronic data interchange “EDI” process, provide daily efficiencies within the workers’ compensation processes for both internal and external stakeholders. Forms solution has changed the way business is conducted for all workers’ compensation stakeholders. The workers’ compensation mobile application, utilized within the litigation process, is recognized nationally as being on the cutting edge for workers’ compensation. An often-overlooked responsibility tasked upon the department is the prevention of workplace injuries and illness. The Health & Safety Division continues to put forth a tremendous proactive effort ensuring employees have a safe working environment. During 2018, staff performed onsite safety audits, delivered health & safety training to over 36,000 employees, and expanded the number of certified workplace safety committees. These initiatives are making a difference and saving lives!
The Health Care Services Review Division continues to conduct stakeholder trainings and implement process change aimed at enhancing the system for all parties. The HCSRD staff did a great job reactivating the impairment rating evaluation process and procedures, including the revisions put forth in Act 111.
The Workers’ Compensation Office of Adjudication continued the exceptional job we have become accustomed to expecting from their staff. In 2018, 41,268 petitions were assigned and 43,054 petitions were decided. Workers’ compensation judges conducted 8,563 mediations statewide, producing settlements in 3,890; a mediation success rate of 45.42 percent. Compromise & release petitions were presented and approved on 23,215 cases.
The important role of the Workers’ Compensation Appeal Board within the Pennsylvania workers’ compensation system cannot be overstated. The board secretary, commissioners, and staff have and continue to revise their business process with the end goal of delivering quality decisions in a timely manner. In 2018, the Workers’ Compensation Appeal Board received 1,322 appeals; issued 667 supersedeas orders; 888 opinions; 226 dispositive orders and 79 counsel fee orders. The average time to decision remains less than one-year at 11.37 months. All are great accomplishments!
Pennsylvania has the hardest working, most dedicated staff within the workers’ compensation system, second to none throughout this country. Staff members genuinely do care about the individuals at the end of their process. It truly is a team effort by all!
18

2018 ANNUAL
REPORTPennsylvania Workers’ Compensation and Workplace Safety
TOM WOLF, GOVERNORW. GERARD OLEKSIAK, SECRETARY
Overview of the PA Workers’ Compensation Program (cont.)
Some employers are exempted from workers’ compensation coverage. Exemptions include: people covered under other workers’ compensation acts, such as railroad workers, longshoremen and federal employees; domestic servants (coverage is optional); agricultural workers who work fewer than 30 days or earn less than $1,200 in a calendar year from one employer; and employees who have requested, and been granted, exemption due to religious beliefs or their executive status in certain corporations.
In Pennsylvania, employers can obtain workers’ compensation insurance through a licensed insurance carrier or the State Workers’ Insurance Fund. In addition, employers can apply to the bureau to seek approval to self-insure their liability. Self-insurance is granted by the bureau based on criteria established by the act and the department.
Employees are covered for the entire-period of their employment. Therefore, coverage begins the first day on the job. Injuries or diseases caused or aggravated by employment are covered under workers’ compensation, regardless of the employee’s previous physical condition.
Basic Benefits
Replacement of Lost Wages A portion of the worker’s salary – up to a maximum amount provided by law – is paid for the time lost from work as a result of a work-related disability, if the disability lasts longer than seven calendar days. These payments are tax free. The maximum allowable weekly benefit for calendar year 2018 was $1,025. Partial disability benefits consisting of two-thirds of the gross difference in wage loss for up to 500 weeks are paid to employees who suffer a partial disability resulting from a work-related injury or disease. Benefits can possibly be subject to other reductions or offsets.
Payment of Medical ExpensesReasonable and necessary work-related medical expenses are paid regardless of the duration of required treatment and apply even though the employee may not have lost time from work.
Specific Loss BenefitsBenefits are payable if a work-related injury results in loss of vision, hearing and/or the use of limbs (including fingers and toes). Specific loss benefits are paid without regard to the amount of time lost from work. A separate healing period is also defined for each loss.
Disfigurement BenefitsBenefits are payable if there is a serious, permanent disfigurement of the head, face or neck.
Death BenefitsThe employee’s dependents may claim benefits if a work-related injury or disease results in the employee’s death. Also, reasonable burial expenses are payable to a maximum amount set by law.
Subsequent InjuriesAdditional compensation may be available through the Subsequent Injury Fund. This fund is administered by the commonwealth and pays workers who have had a specific loss of use of a hand, arm, foot, leg or eye and who incur total disability caused by loss of use of another hand, arm, foot, leg or eye. The commonwealth makes payments for the duration of the workers’ total disability.
A Brief History of Pennsylvania Workers’ Compensation Law
In 1915, the Pennsylvania Legislature enacted the Pennsylvania Workmen’s (Workers’) Compensation Act (act). The statute charges the Department of Labor & Industry (department) the Bureau of Workers’ Compensation (bureau) with carrying the administrative and appeal-obligations defined in the act and specifies compensation for employees who are injured as a result of employment without regard to fault. Amendments eventually merged the compensation for injuries and occupational diseases into this act. The statute defines the benefits available to Pennsylvania workers, the conditions under which benefits are available and the procedures for obtaining them.
The workers’ compensation system protects employees and employers. Employees receive medical treatment and are compensated for lost wages associated with work-related injuries and disease, and employers provide for the cost of such coverage while being protected from direct lawsuits by employees.
Workers’ compensation coverage is mandatory for most employers under Pennsylvania law. Employers who do not have workers’ compensation coverage may be subject to lawsuits by employees and to criminal prosecution by the commonwealth.
2

2018 ANNUALREPORT
Pennsylvania Workers’ Compensation and Workplace Safety
TOM WOLF, GOVERNORW. GERARD OLEKSIAK, SECRETARY
Employers are required to post form LIBC-500. Remember: It is important to tell your employer about your injury, to inform employees of the name, address and phone number of their workers’compensation insurance company, their third-party administrator or internal workers’ compensation contact person.
An employee injury is to be reported to the employer within 21 days; if not reported within 120 days from the date of injury or having knowledge of a work-related disease, no compensation is allowed (except for cases involving progressive diseases).
Employers are required to immediately report all employee injuries to their insurer or, if self-insured, to report them to the person responsible for management of the employer’s workers’ compensation program. Employers are also required to file a First Report of Injury via EDI transaction in the IAIABC Claims Release 3 format with the Bureau of Workers’ Compensation within 48 hours for every injury resulting in death, and within seven days for all other injuries that result in disability lasting more than a day, shift, or turn of work.
Within 21 days from the date the employee provides notification of an injury, the employer/carrier denies liability by submitting the appropriate EDI transaction. The EDI transaction will update the bureau file in WCAIS and generate a Notice of Compensation Denial (LIBC-496) to be issued to the employee. The claim is now closed, though the injured worker can seek legal advice to pursue a claim through the litigation system. See the Flow of a Litigated Workers’ Compensation Claim on page 4 for more information.
Within 21 days from the date the employee provides notification of an injury, the employer/carrier extends the investigation period to 90 days before accepting or denying full liability for the injury by submitting the appropriate EDI transaction. The EDI transaction will update the bureau file in WCAIS and generate a Notice of Temporary Compensation Payable (TNCP, LIBC-501) to be issued to the employee. A Statement of Wages form (below) must be filed with the bureau and a copy provided to the claimant with the issued NTCP form.
If the employer decides to deny the claim during the 90-day investigation period, a Notice Stopping Temporary Compensation (LIBC-502) is completed and placed on the bureau’s record in WCAIS along with the Notice of Workers’ Compensation Denial (LIBC-496) and issued to the employee (Stopping Notice not necessary if employer/carrier accepting claim on or before 90-day expiration.)
Within 21 days from the date the employee provides notification of an injury, the employer/ carrier accepts liability for the injury by submitting the appropriate EDI transaction. The EDI transaction will update the bureau record in WCAIS and generate a Notice of Compensation Payable (NCP, LIBC-495) to be issued to the employee. A Statement of Wages form (below) must be filed with the bureau and a copy provided to the employee along with the issued NCP form.
Within 21 days from the date the employee provides notification of an injury, the employer/carrier accepts liability for the injury and issues an Agreement for Compensation (LIBC-336) to the employee. The appropriate EDI transaction, the Agreement for Compensation in paper form and the Statement of Wages must be filed with the bureau.
Employers must use the Statement of Wages (LIBC-494C or LIBC-494A) to calculate the employee’s wages and should send a copy to the injured employee. This form must be submitted to the bureau.
When an injured worker returns to their previous employment, the insurer may file a Notice of Suspension or Modification (LIBC-751) within seven days of the injured party’s return to work along with the appropriate EDI transaction. Additional LIBC-751s for further modifications may be filed as necessary within seven days of the modification date.
The insurer must provide the injured worker with the LIBC-392A, Final Statement of Account of Compensation Paid and submit the appropriate EDI transaction to the bureau after the final payment of compensation.
The insurer must provide the injured worker with a Supplemental Agreement (LIBC-337) to alter the worker’s benefits and submit the appropriate EDI transaction and paper form to the bureau.
The insurer must provide the injured worker with the LIBC-392A, Final Statement of Account of Compensation Paid and submit the appropriate EDI transaction to the bureau after the final payment of compensation.
The Final Receipt (LIBC-340) is filed when an injured worker’s benefits terminate. The insurer must provide the injured worker with the Final Receipt and submit the appropriate EDI transaction to the bureau. The worker has three years from the date of the last received workers’ compensation check to file a claim petition contesting the termination of payments.
Supplemental Agreementfor Compensation
Final Statement of Accountof Compensation Paid
Agreement to Stop WeeklyWC Payments(Final Receipt)
Final Statement of Accountof Compensation Paid
Statement of Wages
Notice of Suspension or Modification
Agreement for Compensation
Notice of Compensation Payable
Notice Stopping Temporary Compensation
Notice of TemporaryCompensation Payable
Notice of WC Denial
First Report of Injury
Injury
Notice of Injury
The Flow of a Pennsylvania Workers’ Compensation Claim
3

2018 ANNUAL
REPORTPennsylvania Workers’ Compensation and Workplace Safety
TOM WOLF, GOVERNORW. GERARD OLEKSIAK, SECRETARY
Employers are required to post form LIBC-500. Remember: It is important to tell your employer about your injury, to inform employees of the name, address and phone number of their workers’ compensation insurance company, their third-party administrator or internal workers’ compensation contact person.
An employee injury is to be reported to the employer within 21 days; if not reported within 120 days from the date of injury or having knowledge of a work-related disease, no compensation is allowed (except for cases involving progressive diseases).
Employers are required to immediately report all employee injuries to their insurer or, if self-insured, to report them to the person responsible for management of the employer’s workers’ compensation program. Employers are also required to file a First Report of Injury (formerly the Employer’s Report of Occupational Injury or Disease) with the Bureau of Workers’ Compensation within 48 hours for every injury resulting in death, and within seven days for all other injuries that result in disability lasting more than a day, shift, or turn of work. This document must be submitted electronically.
Within 21 days from the date the employee provides notification of an injury, the employer/carrier accepts liability for the injury and issues a Notice of Workers’ Compensation Payable, a Notice of Temporary Compensation Payable or an Agreement for Compensation to the employee. These paper forms and EDI transactions must also be filed with the Bureau of Workers’ Compensation. See the Flow of a Pennsylvania Workers’ Compensation Claim on page 3 for more detailed information.
Within 21 days from the date the employee provides notification of an injury, the employer/carrier denies liability and issues a Notice of Workers’ Compensation Denial to the employee; the Denial and appropriate EDI transaction must also be filed with the bureau.
Generally, the employee has three years from the date of injury to file a Claim Petition (LIBC-362). The law also provides that injured workers may reopen their claim within three years from the last date an indemnity payment was made on a claim. (Mere paying of medical benefits would not be the same as reopening the claim.)
Workers’ compensation petitions are normally assigned to a workers’ compensation judge according to the county in which the employee lives. A Notice of Assignment is issued to the parties advising them as to which judge is assigned to the matter.
Once assigned, all parties involved in the case are notified as to the date, time and place of hearing.
A workers’ compensation judge hears and receives evidence presented by both the defendant (employer/insurer) and claimant at one or more hearings that may be extended by the need to obtain medical evidence and hear other witnesses.
The workers’ compensation judge will schedule the case for mediation, unless the judge concludes it would be futile. If this mediation does not take place or lead to settlement, the parties may at any time ask for an informal conference or settlement conference with a workers’ compensation judge.
A written decision is circulated to involved parties after a case is closed (all evidence has been submitted and the judge has everything necessary to render a decision). No further action is taken.
Either party has 20 days from the date the workers’ compensation judge’s decision is circulated to all parties to file an appeal with the Workers’ Compensation Appeal Board.
Either party has 30 days from the date of publication of the Workers’ Compensation Appeal Board’s opinion to file an appeal with the Commonwealth Court.
Either party has 30 days from the date of publication of the Commonwealth Court’s decision to file a Petition for Allowance of an Appeal with the Pennsylvania Supreme Court.
Appeal Made to Workers’Compensation Appeal Board
Appeal Made to Commonwealth Court
Appeal Made to PennsylvaniaSupreme Court
Decision Rendered
Workers’ CompensationHearing Held
Workers’ Compensation Alternative Dispute Resolution
Session Held
Workers’ Compensation Hearing Scheduled
Case Assigned to Workers’Compensation Judge
Employee Files Claim Petition
Denial of Payment
Voluntary Payment
First Report of Injury
Injury
Notice of Injury
The Flow of a Pennsylvania Workers’ Compensation Claim (Litigated)
4
2018 ANNUALREPORT
Pennsylvania Workers’ Compensation and Workplace Safety
TOM WOLF, GOVERNORW. GERARD OLEKSIAK, SECRETARY
Funding for Pennsylvania Workers’ Compensation System
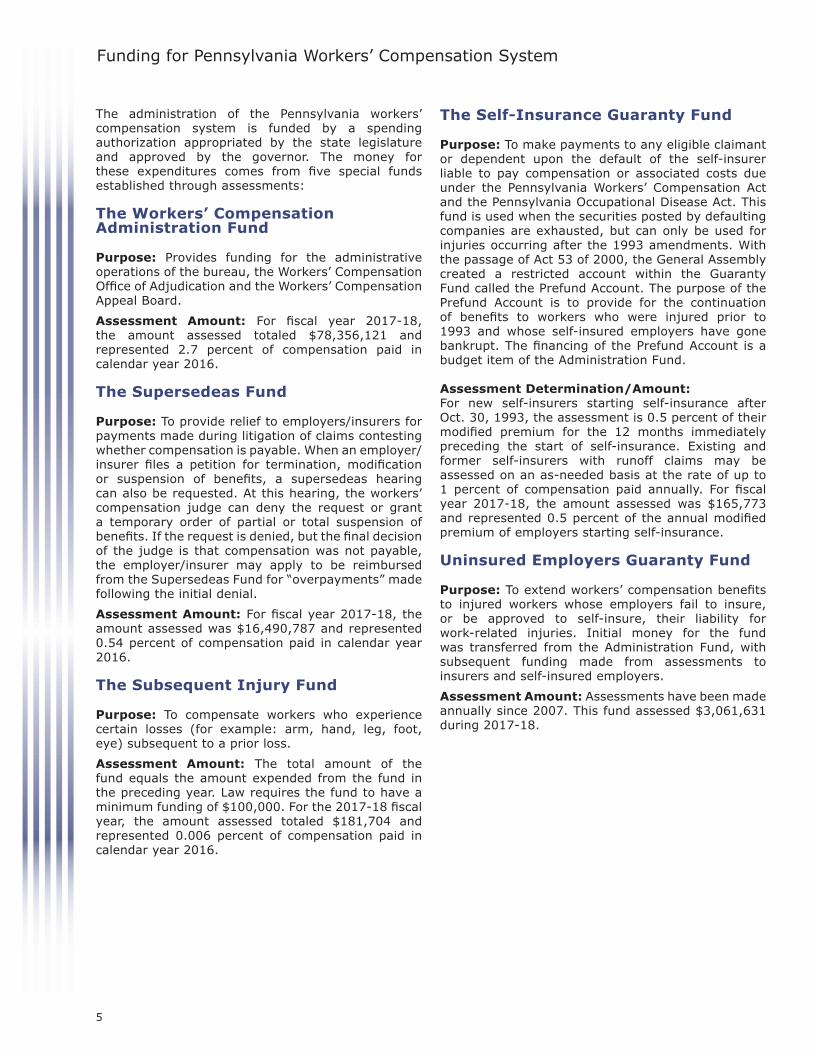
The administration of the Pennsylvania workers’ compensation system is funded by a spending authorization appropriated by the state legislature and approved by the governor. The money for these expenditures comes from five special funds established through assessments:
The Workers’ Compensation Administration Fund
Purpose: Provides funding for the administrative operations of the bureau, the Workers’ Compensation Office of Adjudication and the Workers’ Compensation Appeal Board.
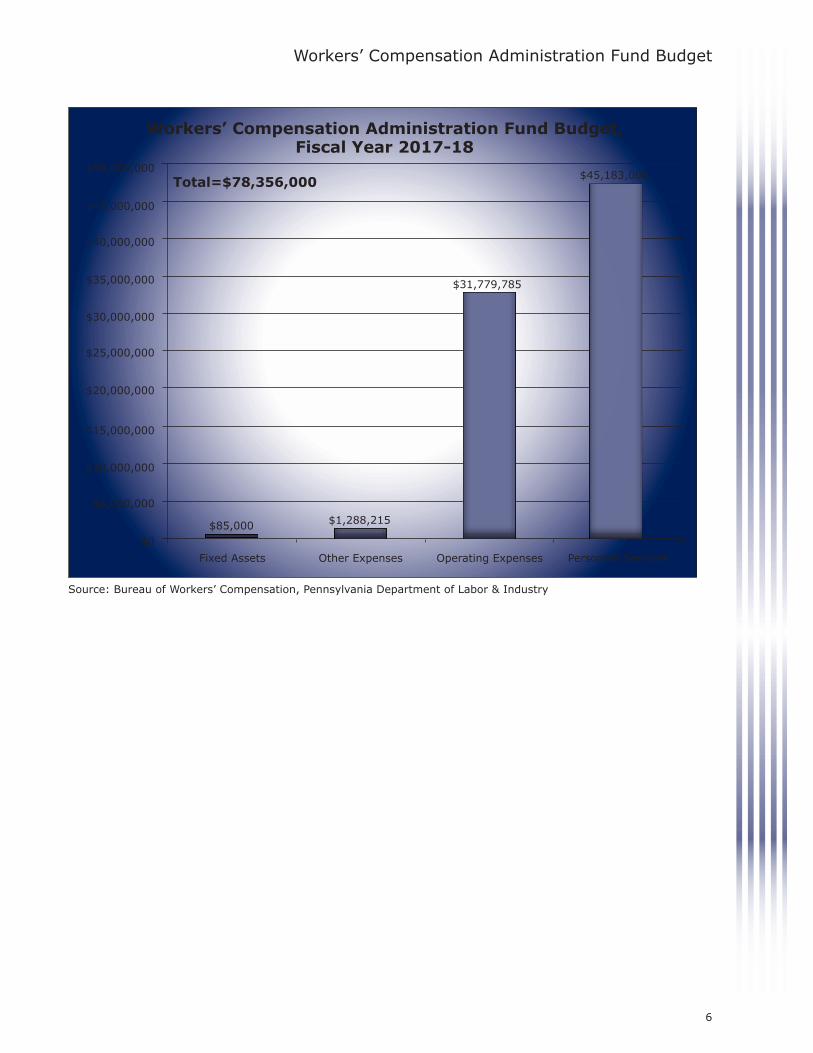
Assessment Amount: For fiscal year 2017-18, the amount assessed totaled $78,356,121 and represented 2.7 percent of compensation paid in calendar year 2016.
The Supersedeas Fund
Purpose: To provide relief to employers/insurers for payments made during litigation of claims contesting whether compensation is payable. When an employer/insurer files a petition for termination, modification or suspension of benefits, a supersedeas hearing can also be requested. At this hearing, the workers’ compensation judge can deny the request or grant a temporary order of partial or total suspension of benefits. If the request is denied, but the final decision of the judge is that compensation was not payable, the employer/insurer may apply to be reimbursed from the Supersedeas Fund for “overpayments” made following the initial denial.
Assessment Amount: For fiscal year 2017-18, the amount assessed was $16,490,787 and represented 0.54 percent of compensation paid in calendar year 2016.
The Subsequent Injury Fund
Purpose: To compensate workers who experience certain losses (for example: arm, hand, leg, foot, eye) subsequent to a prior loss.
Assessment Amount: The total amount of the fund equals the amount expended from the fund in the preceding year. Law requires the fund to have a minimum funding of $100,000. For the 2017-18 fiscal year, the amount assessed totaled $181,704 and represented 0.006 percent of compensation paid in calendar year 2016.
The Self-Insurance Guaranty Fund
Purpose: To make payments to any eligible claimant or dependent upon the default of the self-insurer liable to pay compensation or associated costs due under the Pennsylvania Workers’ Compensation Act and the Pennsylvania Occupational Disease Act. This fund is used when the securities posted by defaulting companies are exhausted, but can only be used for injuries occurring after the 1993 amendments. With the passage of Act 53 of 2000, the General Assembly created a restricted account within the Guaranty Fund called the Prefund Account. The purpose of the Prefund Account is to provide for the continuation of benefits to workers who were injured prior to 1993 and whose self-insured employers have gone bankrupt. The financing of the Prefund Account is a budget item of the Administration Fund.
Assessment Determination/Amount: For new self-insurers starting self-insurance after Oct. 30, 1993, the assessment is 0.5 percent of their modified premium for the 12 months immediately preceding the start of self-insurance. Existing and former self-insurers with runoff claims may be assessed on an as-needed basis at the rate of up to 1 percent of compensation paid annually. For fiscal year 2017-18, the amount assessed was $165,773 and represented 0.5 percent of the annual modified premium of employers starting self-insurance.
Uninsured Employers Guaranty Fund
Purpose: To extend workers’ compensation benefits to injured workers whose employers fail to insure, or be approved to self-insure, their liability for work-related injuries. Initial money for the fund was transferred from the Administration Fund, with subsequent funding made from assessments to insurers and self-insured employers.
Assessment Amount: Assessments have been made annually since 2007. This fund assessed $3,061,631 during 2017-18.
5
2018 ANNUAL
REPORTPennsylvania Workers’ Compensation and Workplace Safety
TOM WOLF, GOVERNORW. GERARD OLEKSIAK, SECRETARY
Workers’ Compensation Administration Fund Budget
Source: Bureau of Workers’ Compensation, Pennsylvania Department of Labor & Industry
Workers’ Compensation Administration Fund Budget, Fiscal Year 2017-18
$85,000 $1,288,215
$31,779,785
$45,183,000Total=$78,356,000
$45,000,000
Fixed Assets
$40,000,000
$35,000,000
$30,000,000
$25,000,000
$20,000,000
$15,000,000
$10,000,000
$5,000,000
$0
Other Expenses Operating Expenses Personnel Services
$50,000,000
6

2018 ANNUALREPORT
Pennsylvania Workers’ Compensation and Workplace Safety
TOM WOLF, GOVERNORW. GERARD OLEKSIAK, SECRETARY
Workers’ Compensation Updates
Workers’ Compensation Automation and Integration System
The Workers Compensation Automation and Integration System (WCAIS) established in 2013, continues to allow stakeholders access to the full picture of their claim in one shared system with 24-hour access to the three program areas of Workers’ Compensation (the Bureau of Workers’ Compensation, the Workers’ Compensation Office of Adjudication and the Workers’ Compensation Appeal Board).
In 2018, we strived for continued improvement to WCAIS with many beneficial enhancements. The most significant of these was officially bringing all UEGF information into the system. This allows for all information available for any UEGF claim to be found in one centralized location and stakeholders can now file their UEGF notices and petitions on-line.
Numerous EDI updates were made, but the most significant were improvements to the zip file formatting and the batch times. The zip file reformatting, completed at the suggestion of the IAIABC and insurers, standardized forms being returned as part of an acknowledgment to streamline this process across states for external filers. The batch times were updated to allow additional time for the 9am batch to run ensuring that ACK returns are timely and not delayed.
We updated our SFR WCAIS process to incorporate amendments, which previously had to be completed outside of the system. This allows for enhanced customer service, transparency, and an improved work process.
We implemented a revised process and updated procedures to reactivate the Impairment Rating Evaluation (IRE) in relation to the passage of Act 111.
A few of the more notable improvements made this year include: enhancements to our data quality process, updated numerous correspondences, and significantly reduced mailing for our Fee Review processes by supplying email communications to stakeholders via WCAIS. On the adjudication side, request approval/denial letters, if sent by a judge, are now generated on the dashboard immediately after the judge rules on the request. We created the ability for attorneys and law firm staff to submit letters to a mediating judge and we also introduced a new request type of “Request a Hearing”. Lastly, litigants filed 94 percent of their appeals/petitions electronically using WCAIS.
For more information on WCAIS and training resources available, visit the WCAIS project at www.dli.pa.gov/wcais. To register for WCAIS and utilize the WCAIS system, visit the main WCAIS site at http://www.wcais.pa.gov.
Workers’ Compensation Advisory Council
The Workers’ Compensation Advisory Council was created under Section 447 of the Workers’ Compensation Act. The council is composed of eight members, and the secretary of Labor & Industry is the ex officio member. Members are appointed as follows: one employee and employer representative by the president pro tempore of the Senate, one employee and employer representative by the speaker of the House of Representatives, one employee and employer representative by the minority leader of the Senate and one employee and employer representative by the minority leader of the House of Representatives. Members serve a term of two years or until their successors have been appointed.
The council reviews requests for workers’ compensation funding by the department and any assessments against employers or insurers related thereto, makes recommendations regarding certification of utilization review organizations and preferred provider organizations, reviews proposed legislation and regulations and reviews the annual medical accessibility study. The findings are reported to the governor, the department secretary and the legislature.
Two co-chairs, representing labor and management, and the rest of the council hold public meetings to discuss various issues of the department, bureau and legislature.
Kids’ Chance of Pennsylvania Inc. Hope, opportunity, and scholarships for kids of injured workers
At Kids’ Chance of Pennsylvania, we’re dedicated to helping our kids who need it most - those who need assistance for college or vocational education because a parent was killed or injured in a work-related accident. The hardships created by the death or serious disability of a parent often include financial ones, making it difficult for deserving young people to pursue their educational dreams.
That is how Kids’ Chance of Pennsylvania continues to make a significant difference in the lives of affected Pennsylvania families by providing scholarship support to help eligible students pursue and achieve their higher educational goals.
Since its inception in 1997, Kids’ Chance of PA has awarded scholarships amounting to over $1 million, and that number continues to grow. During the 2017-2018 academic year, 53 scholarships were awarded to students, totaling more than $185,000. In 2018-2019, we are pleased that we had 65 applications. The scholarships were made possible due to the generous contributions made by our scholar sponsors, corporate and community partners, and donors. Donations can be made online, by check or through United Way.
7

2018 ANNUAL
REPORTPennsylvania Workers’ Compensation and Workplace Safety
TOM WOLF, GOVERNORW. GERARD OLEKSIAK, SECRETARY
Workers’ Compensation Updates (cont.)
In addition to monetary assistance, the Kids’ Chance national organization has a Planning for College program that helps eligible students connect to the right state organization. Students of any age can register, and when the time is right to apply for college, they will be connected to their state organization in order to submit a scholarship application.
Everything our organization does is for the students. Kids’ Chance of PA is making a significant difference in the lives of these children, helping them to pursue their educational goals. Bailey, a current scholarship recipient attending West Chester University says:
“I would just like to thank you for giving me this generous scholarship and the opportunity to continue my schooling with your help. I became eligible for this scholarship after my father was killed in an accident at his work almost a year ago. This scholarship will help me to buy my textbooks for my classes and help pay for my tuition, which can be a struggle with one less parent. I am currently a sophomore at West Chester University and am currently undecided but hoping to choose my major within the next semester. Thank for you choosing me for this scholarship and helping me to reach my academic goals.”
For more information about how you can help support Kids’ Chance, please contact us at 215-302-3598 or [email protected] or visit www.kidschanceofpa.org.
8

2018 ANNUALREPORT
Pennsylvania Workers’ Compensation and Workplace Safety
TOM WOLF, GOVERNORW. GERARD OLEKSIAK, SECRETARY
*For purposes of calculating the update to payments for medical treatment rendered on and after Jan. 1, 2018, the percentage increase in the statewide average weekly wage was 3 percent.
YearStatewide Average Weekly Wage/
Maximum Compensation Rate Payable
50 Percent of Statewide Average Weekly Wage/50 Percent of Maximum Compensation
Rate Payable
2004 $690.00 $345.00
2005 $716.00 $358.00
2006 $745.00 $372.50
2007 $779.00 $389.50
2008 $807.00 $403.50
2009 $836.00 $418.00
2010 $845.00 $422.50
2011 $858.00 $429.00
2012 $888.00 $444.00
2013 $917.00 $458.50
2014 $932.00 $466.00
2015 $951.00 $475.50
2016 $978.00 $489.00
2017 $995.00 $497.50
2018* $1,025.00 $512.00
Total Disability Weekly Workers’ Compensation Rates
Workers’ Compensation Updates (cont.)
Total Disability Weekly Workers’ Compensation Rates
The following table illustrates the weekly workers’ compensation rates used to calculate benefits payable to an injured employee.
The compensation rate is 66.66 percent of the employee’s average weekly wage. If 66.66 percent of the employee’s average weekly wage is greater than the maximum, the rate of compensation payable is equal to the maximum. If the benefit calculated is
less than 50 percent of the statewide average weekly wage, then the compensation rate shall be the lower of 50 percent of the statewide average weekly wage or 90 percent of the employee’s average weekly wage. There is no absolute minimum.
The maximum compensation rate payable is calculated annually and is effective Jan. 1 of each year. The calculation of the average weekly wage is defined by the act. Corresponding figures for years prior to 2004 are maintained by the bureau. For partial disability, other calculations and definitions apply.
9
2018 ANNUAL
REPORTPennsylvania Workers’ Compensation and Workplace Safety
TOM WOLF, GOVERNORW. GERARD OLEKSIAK, SECRETARY
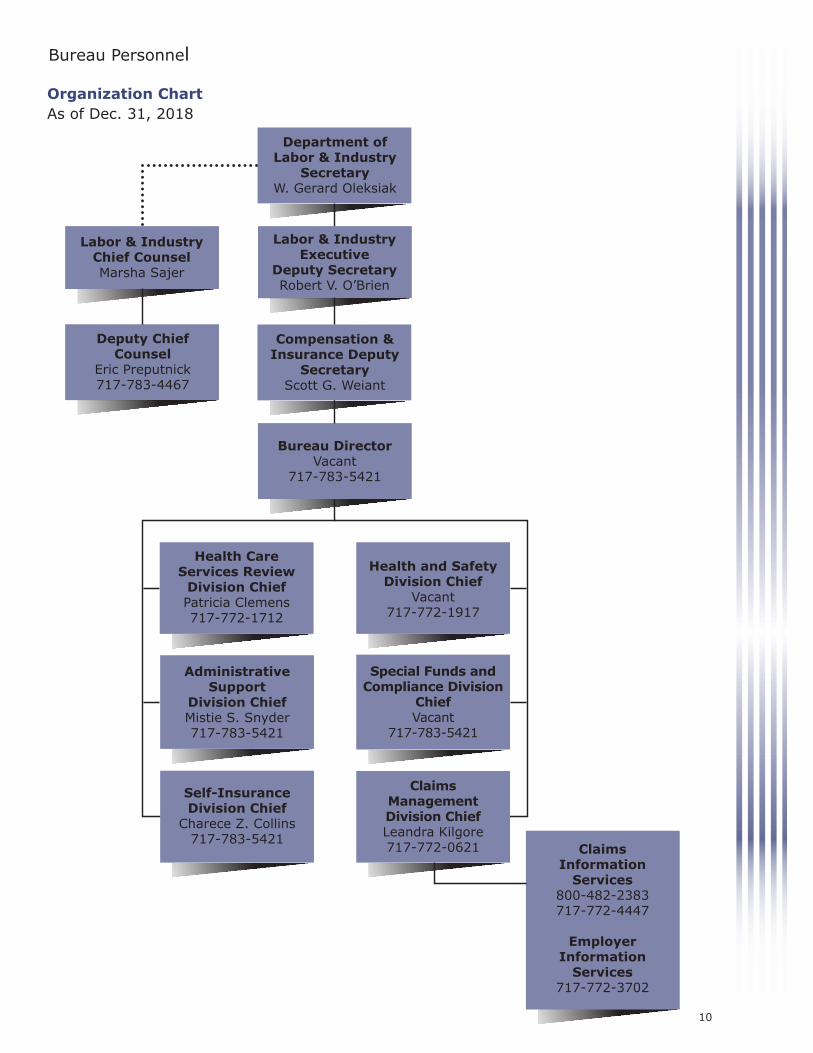
Bureau Personnel
Organization ChartAs of Dec. 31, 2018
Department ofLabor & Industry
SecretaryW. Gerard Oleksiak
Bureau DirectorVacant
717-783-5421
Labor & IndustryChief CounselMarsha Sajer
Deputy ChiefCounsel
Eric Preputnick717-783-4467
AdministrativeSupport
Division ChiefMistie S. Snyder717-783-5421
Health and SafetyDivision Chief
Vacant717-772-1917
ClaimsManagementDivision ChiefLeandra Kilgore717-772-0621
Special Funds andCompliance Division
ChiefVacant
717-783-5421
Health CareServices Review
Division ChiefPatricia Clemens717-772-1712
Self-InsuranceDivision Chief
Charece Z. Collins717-783-5421
ClaimsInformation
Services800-482-2383717-772-4447
EmployerInformation
Services717-772-3702
Compensation &Insurance Deputy
SecretaryScott G. Weiant
Labor & IndustryExecutive
Deputy SecretaryRobert V. O’Brien
10

2018 ANNUALREPORT
Pennsylvania Workers’ Compensation and Workplace Safety
TOM WOLF, GOVERNORW. GERARD OLEKSIAK, SECRETARY
Primary Functions
Prepare yearly budget request for the Administration Fund. Project, analyze and report on the Administration Fund expenditures (which include the bureau, the Office of Adjudication, the Workers’ Compensation Appeal Board, the Office of Chief Counsel, the Office of Information Technology and Labor & Industry bureaus that charge the fund for services).
Issue, collect and record assessments to replenish the Administration Fund, Supersedeas Fund, Subsequent Injury Fund, Self-Insurance Guaranty Fund and the Small Business Advocate Fund.
Process supply, equipment and furniture requests and procure items for bureau offices, the Office of Adjudication and the Workers’ Compensation Appeal Board.
Provide employees, employers, the public, workers’ compensation professionals, health care providers and government agencies with accurate and comprehensive workers’ compensation information.
Compose, design and distribute publications and communications for the Bureau of Workers’ Compensation, including postal and email mass mailings, forms, annual reports, newsletters, pamphlets, directories and web updates.
With department press office approval, provide the media with accurate and timely workers’ compensation information.
Provide administrative support to all divisions and field offices within the bureau.
Provide personnel advice and services to bureau employees and managers.
Provide mailroom and indexing services to the bureau.
Coordinate bureau training.
Coordinate the annual Workers’ Compensation Conference.
Bureau Divisions
AdministrativeSupport Division
Mistie S. Snyder
2018 Accomplishments
Budgeted, monitored and adjusted the Administration Fund as necessary.
Improved the processing of all paper documents into the electronic system to within five days.
Provided timely status information on collection of assessments and bureau conference deposits. The amounts assessed for the 2017-2018 fiscal year are as follows:
Administration Fund $78,356,121
Supersedeas Fund $16,490,787
Subsequent Injury Fund $181,704
Self-Insurance Guaranty Fund $165,773
Uninsured Employers Guaranty Fund $3,061,631
Processed personnel actions within three working days of request.
Developed, planned and coordinated the June 2018 bureau conference. A total of 1,364 representatives from the workers’ compensation community attended the two-day event, including employers, insurers, health care providers and attorneys. This educational conference offered the popular “As the Claim Turns” role-play presentation, as well as sessions addressing legal updates, return to work programs and basic workers’ compensation information.
Mailed 18,366 Workers’ Compensation and the Injured Worker pamphlets to workers for whom the bureau received a First Report of Injury indicating loss of more than a day, shift, or turn of work as a result of an alleged work-related injury.
Published the bureau’s quarterly newsletter, News & Notes. This publication provides an overview of workers’ compensation policies, programs and updates.
Coordinated production and distribution of the Pennsylvania Workers’ Compensation and Workplace Safety Annual Report for 2017.
Coordinated the posting of new material and updates to department websites on behalf of the bureau, including a complete update of the bureau’s public-facing website.
Published a courtesy copy of the 2018 medical fee schedule and provided quarterly updates.
Published the 2017 Medical Access Study Executive Overview.
Administered the bureau’s employee recognition program.
Submitted articles for inclusion in the Pennsylvania Self-Insurer’s Association newsletter and provided updated Pennsylvania workers’ compensation information to national agencies for publication.
11
2018 ANNUAL
REPORTPennsylvania Workers’ Compensation and Workplace Safety
TOM WOLF, GOVERNORW. GERARD OLEKSIAK, SECRETARY
Primary Functions
Serve as a repository for workers’ compensation records.
Provide education on Electronic Data Interchange submissions (EDI) and the generation of the Notice of Compensation Payable, Notice of Workers’ Compensation Denial, Notice of Temporary Compensation Payable, and Notice Stopping Temporary Compensation forms from completed EDI transactions by adjusters as well as subsequent forms.
Provide records to claimants, attorneys, workers’ compensation judges and others.
Work with Center for Workforce Information and Analysis in the collection and assembly of statistics for workers’ compensation injuries.
Evaluate carrier and employer compliance with the reporting requirements of the Workers’ Compensation Act (act).
Provide customer service for the workers’ compensation community through a call-in line, customer service tickets, a live chat feature and resource accounts.
Analyze insurance carrier and self-insured EDI filing data to determine outreach and training needs specific to each filing entity’s organization.
Provide insurance information researched through the Pennsylvania Compensation Rating Bureau to the workers’ compensation community.
Cleanse and validate the profiles in WCAIS for individuals and organizations.
Aid the insurer and self-insured community to improve filing efforts through enhancement efforts, training, claims monitoring, customer service, and accurate processing.
2018 Accomplishments
Processed 27,906 requests for records in 2018.
Responded to 39,545 workers’ compensation inquiries (compared to 40,957 in 2017); 31,836 telephone calls (33,353 in 2017). Also, provided written responses to 5,577 inquiries (5,344 in 2017), which include 3,604 emails, (3,184 in 2017), 396 live chats, 850 customer service tickets, and 727 general correspondences. These inquiries come from employers, employees, lawyers, health care providers, and others involved in the Pennsylvania Workers’ Compensation community.
Assisted 487 non-English speaking callers and visitors with workers’ compensation concerns using Propio Language Services, a language interpretation service. This is an increase from 448 in 2017.
Researched and responded to 183 (260 in 2017) inquiries regarding the workers’ compensation insurance coverage of employers through the Pennsylvania Compliance Rating Bureau database.
Assisted 60 (39 in 2017) walk-in visitors with their workers’ compensation questions/concerns.
Researched workers’ compensation coverage status of 1,402 employers who canceled or failed to renew their insurance policy with the State Workers’ Insurance Fund to ensure compliance under the act. Information on employers found lacking coverage is forwarded to the bureau’s Compliance Section for further investigation and possible action.
Conducted company-specific outreach tailored to help stakeholders to achieve the highest possible EDI acceptance rating.
The EDI Section responded to 1,166 email inquiries, 132 telephone inquiries, and 1,979 customer service ticket inquiries in 2018.
Averaged an acceptance rating for EDI FROI transactions of 91 percent, 88 percent for SROIs transactions and an overall acceptance rate of 89.5 percent.
Oversaw 43 WCAIS enhancements in 2018, in our continued effort to provide advanced functionality and maximize the benefits to users and the bureau.
The Data Quality Section, continues to cleanse and validate the profiles in WCAIS for individuals and organizations. Resolved approximately 12,200 data quality issues in 2018.
Bureau Divisions (cont.)
Claims ManagementDivision
Leandra Kilgore
12

2018 ANNUALREPORT
Pennsylvania Workers’ Compensation and Workplace Safety
TOM WOLF, GOVERNORW. GERARD OLEKSIAK, SECRETARY
Bureau Divisions (cont.)
Primary Functions
Evaluate employer applications to determine certification of employer workplace safety committees and eligibility for workers’ compensation insurance premium discounts as allowed under Article X of the act. Provide assistance, guidance and training to employers in establishing safety committees, interpreting requirements for certification and correcting application deficiencies prior to submission.
Provide safety-related information and training to Pennsylvania employers aimed at reducing workplace injury/illness occurrences and workers’ compensation costs associated with workplace incidents through the Pennsylvania Training for Health & Safety (PATHS) resource.
Provide safety committee certification renewal forms for certified employers and evaluate submitted forms to determine eligibility for continuing premium discounts.
Review annual reports of accident and illness prevention services and programs from Pennsylvania licensed workers’ compensation carriers, self-insured employers and group self-insurance funds. Formulate recommendations of program or service adequacy for consideration in continuance of licensure or self-insurance status.
Determine the necessity for, and conduct on-site audits of accident and illness prevention services and programs and certified safety committees. Configure and monitor deficiency-correction programs as necessary to resolve program or service inadequacies.
Develop and disseminate health and safety-related information to members of the regulated community and the general public concerning: workplace safety committee certification/recertification procedures andrequirements; mandatory accident and illness prevention program and service elements; safety-related training; and annual reporting requirements.
Administer the process to review credentials in the health and safety field for recognition by the department as acceptable qualifications for accident and illness prevention service providers. Review individual qualifications for acceptability as accident and illness prevention service providers and recognized safety committee instructors.
Manage the process to nominate, select and recommend employers for the Governor’s Award for Safety Excellence.
Provide Pennsylvania employers with coordinated safety and health training resources through easy access and affordability. Services provided by the PATHS resource
enable participants in the workers’ compensation system to achieve greater efficiencies in the implementation of their workers’ compensation cost-containment efforts by creating a safe, accident-free workplace.
2018 Accomplishments
Granted initial certification to a cumulative total of 12,175 workplace safety committees covering more than 1,549,630 employees as of December 2018. The cumulative number of approved workplace safety committee certification renewals totaled 92,999.
Received and processed a total of 404 workplace safety committee initial applications and 5,700 workplace safety committee renewal applications.
Continued to update email databases for various clientgroups to provide an electronic means of communicating with the workers’ compensation safety clients.
Released all necessary self-insured, group fund and insurer-required filing reports within required time frames.
Evaluated the acceptability of accident and illness prevention programs and services of 1,374 insurers and self-insured employers through annual required reports.
Conducted 179 on-site audits of licensed workers’ compensation insurer and self-insured employer accident and illness prevention programs and services and certified workplace safety committees. Participated in the process to select and award the Governor’s Award for Safety Excellence to three Pennsylvania companies, which included conducting on-site visits and reviewing 51 award applications.
Completed additional PowerPoint presentations, bringing the total to 209 different PowerPoints on the Pennsylvania Training for Health and Safety, or PATHS, resource website. PATHS is a training resource consisting of on-site safety and health training and web-based safety training applications, including webinars, PowerPoint presentations, sample safety programs, safety talk materials, posters and more. The PATHS website includes a schedule of health and safety-related training and information available to all Pennsylvania stakeholders. Knowledgeable and experienced trainers are available to provide training and information sessions upon request to employers, employees and stakeholder groups.
Conducted a cumulative total of 4,030 on-site audits of accident and illness prevention programs and services of self-insured employers and licensed workers’ compensation insurers and employers with state-certified workplace safety committees.
Division personnel conducted 459 safety training sessions on 160 different topics for more than 36,000 representatives of employers, insurers and self-insured employers.
Health & SafetyDivision
Vacant
13

2018 ANNUAL
REPORTPennsylvania Workers’ Compensation and Workplace Safety
TOM WOLF, GOVERNORW. GERARD OLEKSIAK, SECRETARY
Primary Functions
Administer the fee review process for health care providers who are disputing the timeliness or amount of payment received for medical services provided to Pennsylvania injured workers.
Manage and monitor chargemaster fee schedule data. Under amendments to the act in 1993, medical reimbursement was capped based on 1994 Medicare rates that are adjusted annually.
Authorize utilization review/peer review organizations (URO/PROs) to review the reasonableness and necessity of medical treatment when requested by the employer/insurer or injured worker. The division also trains, audits and monitors UROs for compliance with regulatory requirements.
Approve Impairment Rating Evaluation (IRE) physicians. Provide physician designation for requested IREs.
Act as liaison to independent consultants performing medical access studies.
Act as a resource for all involved parties.
2018 Accomplishments
Received 21,357 fee review applications and issued 19,077 decisions. Fee review processing time remained less than 30 days from receipt.
Continued to update the courtesy copy of the fee schedule quarterly on the department’s website. Additional information was added to the website to indicate when reimbursement based on usual and customary data may apply.
Processed and approved annual reports for all 21 URO/PROs.
Received, reviewed and approved 12 URO/PRO re-authorization applications. Nine onsite audits of URO/PROs were performed.
Hosted the first annual URO Symposium and initiated monthly conference calls with URO/PROs to discuss opportunities for quality improvement and programmatic best practices.
3,541 utilization review requests were received online via the Workers’ Compensation Automation and Integration System (WCAIS). 4,172 utilization review determinations were rendered.
On Oct. 24, 2018, Governor Wolf signed into law Act 111 of 2018, which re-established the IRE process in Pennsylvania. Online IRE processes in WCAIS were re-activated and training made available to stakeholders within one week of the bill’s signing. The majority of IRE paper forms were converted to electronic forms allowing for improved efficiencies and reporting. 26 physicians were approved to act as IRE physicians at 78 locations across 32 counties. A list of the approved IRE physicians was posted on the bureau’s website indicating where each physician performs IREs as well as the physician’s specialties.
Received and processed 364 IRE requests for designation, 21 re-designations between Oct. 24, 2018 and Dec. 31, 2018. This represents an 85 percent increase in requests for designation filed per month when compared to data from 2016.
Partnered with the Department of State and Department of Health to identify and report over-prescribing of opioids in the Pennsylvania Workers’ Compensation program. Assisted the Department of Health during their development of guidelines for safe prescribing for Workers’ Compensation.
Participated in conference calls with stakeholders to discuss challenges relating to the prescribing of compound medications.
Received and reviewed the 2017 Medical Access Study. The study continues to indicate injured workers are overall satisfied/very satisfied with their medical treatment. The survey also indicates injured workers using provider panel lists return to work sooner and continue to treat with the panel providers after the required initial 90 day period.
Bureau Divisions (cont.)
Health Care ServicesReview Division
Patricia Clemens
14
2018 ANNUALREPORT
Pennsylvania Workers’ Compensation and Workplace Safety
TOM WOLF, GOVERNORW. GERARD OLEKSIAK, SECRETARY
Bureau Divisions (cont.)
Primary Functions
Process and decide applications of individual employers for self-insurance status under Section 305 of the Workers’ Compensation Act and Section 305 of the Pennsylvania Occupational Disease Act. Set conditions for self-insurance and monitor self-insured employers’ compliance with these conditions. As of Dec. 31, 2018, there were over 700 employers authorized to self-insure their liability.
Process and decide applications of groups of employers to operate as group self-insurance funds under Article VIII of the act. Regulate and monitor the financial conditions of the group funds, including the setting of rates, the maintenance of surplus and the distribution of dividends to members. As of Dec. 31, 2018, 18 group self-insurance funds were operating, covering 875 employers in the commonwealth.
Collect and tabulate information needed to issueassessments against insurers and self-insurers tomaintain special funds established under the act.Monitor the claims payments and outstanding liabilities of former self-insurers to ensure thatthey maintain adequate security or assets tocover their self-insurance claims.
Administer the Self-Insurance Guaranty Fund and
the use of financial security to remedy defaults of self-insurers. The Guaranty Fund and its special Prefund account, which applies to claimants injured before 1993, provide benefits to approximately 119 claimants, with total reserves of $38.7 million. The division also monitors the payments, balances and administration of 25 default situations being satisfied by private securing entities, such as sureties, corporate trustees or guarantors.
2018 Accomplishments
Processed over 700 renewal applications, 131 runoff reports and applications for individual self-insurance status, 36 group annual reports and rate requests, and 62 semi-annual reports monitoring the status of self-insurance defaults.
Calculated and issued five assessments to finance the operation of special funds under the act. Continued the memorandum of understanding with the State Worker’s Insurance Fund for adjusting and claims-handling for the Self-Insurance Guaranty Fund and the Uninsured Employers Guaranty Fund for substantial savings to the bureau.
Created bureau form LIBC-118 and published to the bureau website. LIBC-118 is the Application for Prefund Benefits under Section 909 of the WC Act.
Continued to work with project vendor Deloitte to redesign the self-insurance process in the Workers’ Compensation Automation and Integration System (WCAIS) based on feedback from the self-insured community and internal staff.
Presented at the Pennsylvania Self-Insured Association annual meeting and the Pennsylvania Governor’s Occupational Safety & Health Conference.
Self-InsuranceDivision
Charece Z. Collins
15

2018 ANNUAL
REPORTPennsylvania Workers’ Compensation and Workplace Safety
TOM WOLF, GOVERNORW. GERARD OLEKSIAK, SECRETARY
Bureau Divisions (cont.)
Primary Functions
Serve as conservator of the Supersedeas Reimbursement and Second Injury Funds.
Pay claims where the bureau has liability under 305.1(WCOD), 306(h), Occupational Disease, Subsequent Injury Fund and the Supersedeas Fund.
Work with the Third Party Administrator and Office of Chief Counsel to investigate and manage the litigation of claims against the Uninsured Employers Guaranty Fund (UEGF).
Manage claims and benefits where UEGF is paying benefits as a result of the employers’ default.
In conjunction with the Office of Chief Counsel, initiate, negotiate and monitor recovery activities on behalf of UEGF.
Monitor available balance of the UEG fund and projected payments. Manage expenditures to assure available funding for crucial benefit payments to injured workers.
Ensure compliance with the Workers’ Compensation Act, regulations enacted pursuant to the act and orders issued by workers’ compensation judges by:
Educating uninsured employers of their obligations to injured workers.
Investigating reports of employers’ alleged failure to insure their liability and prosecuting cases of noncompliance in accordance with the criminal provisions of the act.
Referring allegations of employee fraud to the appropriate insurance carrier and prosecuting authority and allegations of employer, insurer or medical provider fraud to the proper prosecuting authority.
Reviewing all work-related injuries suffered by minors to determine if potential child labor law violations existed and referring said violations to the Bureau of Labor Law Compliance for final determination and collection of any additional compensation due to injured minors.
Notifying dependents of their survivor rights under the act when work-related fatalities occur.
Reviewing and investigating allegations of insurer, self-insurer or third-party administrator violations of the act to determine if further action is warranted.
Processing statutorily permissible exceptions, exemptions and elections for inclusion under the act.
2018 Accomplishments
Processed 694 claims and distributed payments of more than $25.8 million from the Supersedeas Reimbursement Fund during the 2017-18 fiscal year.
Distributed payments to 131 claimants under the Occupational Disease Act and to 12 Subsequent Injury claimants.
Mailed the Employer Information pamphlet to 13,425 new or modified businesses to secure information assuring their compliance. 6,700 businesses failed to respond, resulting in a second mailing.
Instituted 1,416 new investigations of potential employer failure to insure workers’ compensation liability and referred 14 cases to the bureau’s legal division for prosecution.
Successfully prosecuted nine cases of Employer’s Failure to Insure (Section 305) case, resulting in $466,873 in restitution being awarded to the UEGF.
Processed 1,321 corporate executive officer exceptions and 2,467 religious exemptions for exclusion under the act.
Investigated 748 potential child labor law violations that could result in the collection of a 50 percent additional compensation penalty.
Furnished guidance to the TPA and counsel on over 524 active UEGF claims. Provided monetary negotiating authority to resolve claims, criminal prosecution and civil liens.
Reviewed requests and authorized medical, indemnity, litigation and expense payments and performed audits on invoices.
Assisted with the successful passage of House Bill 676 by providing statistical and financial information to the legislature. After considerable review, the BWC team has constructed and finalized a financial report which captures the monthly revenues, disbursements, and projection figures in specific subcategories. This report is completed and provided to the Governor’s Budget Office monthly and shared with the legislature quarterly to keep them apprised of the status of the UEG Funding.
UEGF continues to work with Deloitte, WCAB, WCOA, BWC and OCC on UEGF enhancements in WCAIS.
Special Funds andCompliance Division
Vacant
16

2018 ANNUALREPORT
Pennsylvania Workers’ Compensation and Workplace Safety
TOM WOLF, GOVERNORW. GERARD OLEKSIAK, SECRETARY
Bureau Divisions (cont.)
Primary Functions
The Governor’s Office of General Counsel through the Department of Labor & Industry’s Office of Chief Counsel coordinates all legal services provided to the bureau. Attorneys representing the bureau, through the Legal Division and its support staff, are responsible for providing legal advice to bureau personnel and defending legal challenges to the implementation of the workers’ compensation system.
The division is responsible for advising, defending and monitoring the defense of claims filed against the Uninsured Employers Guaranty Fund (UEGF). Created in 2007, the UEGF provides workers’ compensation benefits to injured workers whose employers failed to insure or self-insure their workers’ compensation liability at the time of the injury. Last year, 254 claims for benefits were filed by workers who alleged injuries suffered in the course and scope of employment with uninsured employers.
The division guides the bureau in administering claims brought against other statutorily created funds and provides legal counsel in the defense of such claims. For example, division attorneys represent the commonwealth in claims against the Supersedeas, Subsequent Injury and Self-Insurance Guaranty Funds as well as claims brought under the Occupational Disease Act.
The division is responsible for preparing and coordinating criminal prosecutions of employers who fail to maintain workers’ compensation coverage for workers.
The division advises department personnel regarding the impact of statutes and regulations (federal and state) that address workers’ compensation concerns. In addition, the division drafts bills, regulations and statements of policy at the behest of the client in order to correct deficiencies or make enhancements to the system.
The division routinely answers inquiries from the public, both directly and on behalf of clients within the department.
2018 Accomplishments
Department of Labor & Industry, Uninsured Employers Guaranty Fund v. Workers’ Compensation Appeal Board (Lin and Eastern Taste), 187 A.3d 914 (Pa. Cmwlth. 2018) –The Pennsylvania Supreme Court
affirmed the decision of the Commonwealth Court, determining that a claimant, who sustained an injury while working on a remodeling project for a restaurant which had not yet opened for business, was not an employee of the restaurant at the time of the injury. In doing so, the court held that the Construction Workplace Misclassification Act (CWMA) applies only to those individuals who work for a business entity that performs “construction” as defined by the CWMA. The court agreed with the UEGF’s argument that a property owner who contracts for construction services is not “in the construction industry” for purposes of the CWMA. Application of the CWMA to any construction activity regardless of the nature of the employer would have created an absurd result because any property owner in the commonwealth, including private homeowners, could have been subject to criminal enforcement penalties for failing to carry workers’ compensation insurance and pay unemployment compensation taxes as employers in otherwise ordinary contractual relationships.
Fakhriddin Baykhanov v. Workers’ Compensation Appeal Board (Onixe Express), 28 WL 4940168 (Pa. Cmwlth., June 29, 2018) – In an unreported opinion in this UEGF case, Commonwealth Court affirmed the decisions of the WCAB and WCJ that the claimant was an independent contractor because, based upon the Hammermill factors and specific facts of the case as found by the WCJ, the alleged employer did not exercise control over the claimant’s truck driving work or the manner in which he performed it. The court further rejected the claimant’s argument that, given the remedial nature of the Workers’ Compensation Act, he should be awarded benefits in a “close case.” The court agreed with the UEGF’s position that the humanitarian purposes of the act do not excuse claimants from meeting their burden of proof, including establishing an employment relationship. The court held that the principle that the act is to be liberally construed is only when there are ambiguities in the act, not where it is a close factual case.
Charles Grant v. Workers’ Compensation Appeal Board (IDS Express and UEGF), 2018 WL 5117218 (Pa. Cmwlth., July 27, 2018) In an unreported opinion in this UEGF case, Commonwealth Court affirmed the WCAB and WCJ, and held that the claimant failed to establish an employment relationship where the claimant was courier and the claimant was not controlled in such specific detail that his relationship could be called anything more than an independent contractor to provide for the delivery of packages. The court also ruled that the WCJ’s failure to rule on the claimant’s Yellow Freight motion, based upon the alleged employer’s failure to file an answer, was not dispositive since the issue of employment relationship is an issue of law which cannot be deemed admitted under the Yellow Freight case.
Arnold Gilliam v. Workers’ Compensation Appeal Board (Li and UEGF), 2018 WL 3672967 (Pa. Cmwlth., Aug. 3, 2018) – In an unreported opinion in this UEGF
Legal Division
Eric Preputnick
17
2018 ANNUAL
REPORTPennsylvania Workers’ Compensation and Workplace Safety
TOM WOLF, GOVERNORW. GERARD OLEKSIAK, SECRETARY
Bureau Divisions (cont.)
case, Commonwealth Court affirmed the decisions of the WCAB and WCJ that terminated the claimant’s benefits after a closed period award based upon the competent, credible testimony of the UEGF’s medical expert, concluding that the decision was reasoned and based upon substantial evidence. The court rejected the claimant’s argument that the medical evidence was not competent to support full recovery simply because the UEGF’s expert did not accept the description of injury recognized by the WCJ.
UEGF Recoveries: During 2018, the division represented the bureau’s UEGF in recovering monies owed by uninsured employers. As the result of such representation, the UEGF recovered $217,302.18 in criminal restitution and $228,922.20 from civil collection efforts, as well as $157,561.63 in third-party subrogation recover for a total of $603,786.01.
Criminal prosecutions (Failure to Insure): During 2018, the bureau assisted in the following:
Commonwealth v. Michael Robinson/Robinson Trucking LLC – Defendant pled guilty to 15 misdemeanor counts of failure to maintain workers’ compensation insurance under Section 305 of the act. Defendant was placed on probation for a period of 150 months and ordered to make monthly payments to pay a total of $150,000.00 in restitution to the UEGF.
Commonwealth v. Anthony Soule/AC Soule Scapes Inc. – Defendant pled guilty to seven misdemeanor counts of failure to maintain workers’ compensation insurance. Defendant was sentenced to serve seven years of probation and ordered to pay $134,442.40 in restitution to the UEGF.
Commonwealth v. Tracy L. (Carroll) Brown/Live Well Estate LLC – Defendant pled guilty to five misdemeanor counts of failure to maintain workers’ compensation insurance. Defendant was sentenced to serve five
years of probation and ordered to pay $62,091.04 in restitution to the UEGF.
Commonwealth v. John Dorr d/b/a Dorr Moving Exchange – Defendant pled guilty to four misdemeanor counts of failure to maintain workers’ compensation insurance. Defendant was sentenced to serve four years of probation and ordered to pay $54,922.50 in restitution to the UEGF.
Commonwealth v. Kirk Young – Defendant was placed in the ARD program for a period of six months. As part of the terms and conditions of ARD, he was required to pay $23,442.42 in restitution to the UEGF during the period of ARD supervision and perform 50 hours of community service.
Commonwealth v. Jeremy Evans/Carrie Ralston/Got Trash Inc. – Defendants were charged with 352 felony counts of failure to maintain workers’ compensation insurance. Defendants paid $12,500.00 in restitution to the UEGF in exchange for withdrawal of the charges.
Commonwealth v. Jeffrey Bollinger d/b/a Bollinger Construction – Defendant pled guilty to three misdemeanor counts of failure to maintain workers’ compensation insurance. Defendant was sentenced to serve three years of probation and ordered to pay restitution of $12,390.08 to the UEGF.
Commonwealth v. Maximino Hernandez/Max’s Mushroom’s Inc. – Defendant was charged with 31 felony counts of failure to maintain workers’ compensation insurance. Defendant paid $7,086.94 in restitution to the UEGF in exchange for withdrawal of the charges.
Commonwealth v. Carlton A. Burns, Jr. – Defendant pled guilty to 27 misdemeanor counts of failure to maintain workers’ compensation insurance. Defendant was ordered to pay $10,000.00 in restitution.
18

2018 ANNUALREPORT
Pennsylvania Workers’ Compensation and Workplace Safety
TOM WOLF, GOVERNORW. GERARD OLEKSIAK, SECRETARY
Overview of the Office of Adjudication
Primary Functions
The Workers’ Compensation Office of Adjudication (WCOA) is responsible for the resolution of disputed workers’ compensation matters. There are 84 workers’ compensation judges, four judge managers, four administrative officers and 22 field offices that comprise the Office of Adjudication. The workers’ compensation judges conduct hearings in disputed matters and render reasoned decisions in a timely manner. Judges also conduct mediations in contested matters.
2018 Accomplishments
Almost 99 percent of petitions filed with the Office of Adjudication were filed online through WCAIS, and almost 100 percent of answers were filed online.
Expanded the availability of alternative dispute resolution services to the parties by increasing the number of judges available to provide mediation services, increasing the number of judges trained in alternative dispute resolution and improving the delivery of services through hearing offices.
In the process of eliminating assignment of fee review petitions to judges. Almost all fee review petitions are now being assigned to two fee review hearing officers, statewide. This enables judges who had previously heard medical fee disputes to focus on workers’ compensation petitions.
The statewide average time to hear and decide workers’ compensation cases was 5.9 months, down from 6.1 months in 2017.
Continued to enhance WCAIS, which provides online services for Pennsylvania workers’ compensation system users. A few of the WCAIS enhancements include the ability for attorneys and law firm staff to submit letters to the mediating judge, a “Request Approval/Denial Letter” (if one was sent to the judge) generates on the dashboard immediately after the judge rules on the request, and a new request type “Request a Hearing” was added.
WCAIS efficiency committees continued to meet to provide input for future changes to WCAIS and to expand use of WCAIS.
Maintained mandatory interpreter functionality in WCAIS to better track usage throughout the state. We provided over 4,000 live interpreters statewide for hearings and mediations in 2018.
Provided training to judges via webinars and regional meetings. Training included current topics such as Impairment Rating Evaluations, pain management (including opioids and medical marijuana), and recent case law. Reduced administrative costs by increasing the amount of shredding work done in-house.
Posted updated judges’ and hearing officers’ procedural questionnaires to the WCOA web page.
Explored options for reducing travel to hearings and mediations.
Continued to conduct district safety meetings in order to identify and address safety and security concerns. Requested and received detailed security reports from highly qualified Capitol Police personnel to enhance safety and security measures for the 22 hearing offices and 21 remotes sites statewide.
Continued to support employee training and certification in CPR, AED, and first aid as well as monitor and update AED equipment as necessary.
Conducted training sessions as requested across the state to help attorneys and staff better utilize WCAIS.
WCOA Resource Center assisted internal staff and external stakeholders with all adjudication-related questions, including WCAIS problems, questions or suggestions. The Resource Center tracks questions in number and type and uses the information to identify needs for training, communication, and/or WCAIS system enhancements.
The WCOA Resource Center provided WCAIS training and communications to internal staff and external stakeholders after each quarterly update to WCAIS. The Resource Center tested all new WCAIS enhancements before being released into production.
WCAIS Help Email: [email protected] Phone: 844-237-6316
Stevi Leech — Resource Center Manager
Continues to monitor court decisions interpreting Protz v WCAB with enhanced management review and monitoring of Protz-related petition statuses and disposition.
Planning mandatory judge instructional webinars for early 2019 to aid in interpreting, implementing, and enforcing the Protz II Supreme Court decision, the recent Impairment Rating Evaluation legislation (Act 111) and the new Uninsured Employer Guaranty Fund (UEGF) legislation.
Mission Statement
The Workers’ Compensation Office of Adjudication provides an efficient and effective dispute resolution system that is a model for other resolution systems, by promptly, impartially, and with integrity, adjudicating and mediating workers’ compensation disputes.
Director, Workers’Compensation Officeof Adjudication
Joseph DeRita
19
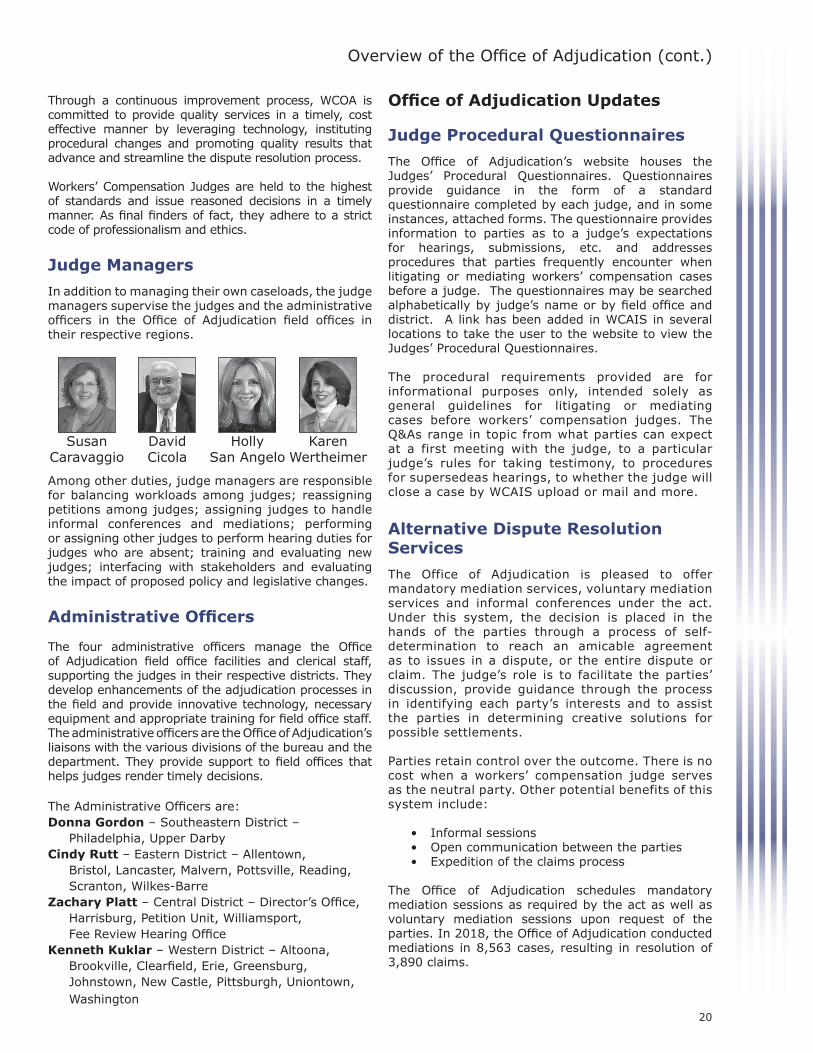
2018 ANNUAL
REPORTPennsylvania Workers’ Compensation and Workplace Safety
TOM WOLF, GOVERNORW. GERARD OLEKSIAK, SECRETARY
Overview of the Office of Adjudication (cont.)
Through a continuous improvement process, WCOA is committed to provide quality services in a timely, cost effective manner by leveraging technology, instituting procedural changes and promoting quality results that advance and streamline the dispute resolution process.
Workers’ Compensation Judges are held to the highest of standards and issue reasoned decisions in a timely manner. As final finders of fact, they adhere to a strict code of professionalism and ethics. Judge Managers
In addition to managing their own caseloads, the judge managers supervise the judges and the administrative officers in the Office of Adjudication field offices in their respective regions.
Among other duties, judge managers are responsible for balancing workloads among judges; reassigning petitions among judges; assigning judges to handle informal conferences and mediations; performing or assigning other judges to perform hearing duties for judges who are absent; training and evaluating new judges; interfacing with stakeholders and evaluating the impact of proposed policy and legislative changes.
Administrative Officers
The four administrative officers manage the Office of Adjudication field office facilities and clerical staff, supporting the judges in their respective districts. They develop enhancements of the adjudication processes in the field and provide innovative technology, necessary equipment and appropriate training for field office staff. The administrative officers are the Office of Adjudication’s liaisons with the various divisions of the bureau and the department. They provide support to field offices that helps judges render timely decisions.
The Administrative Officers are:Donna Gordon – Southeastern District – Philadelphia, Upper DarbyCindy Rutt – Eastern District – Allentown, Bristol, Lancaster, Malvern, Pottsville, Reading, Scranton, Wilkes-BarreZachary Platt – Central District – Director’s Office, Harrisburg, Petition Unit, Williamsport, Fee Review Hearing OfficeKenneth Kuklar – Western District – Altoona, Brookville, Clearfield, Erie, Greensburg, Johnstown, New Castle, Pittsburgh, Uniontown, Washington
Susan Caravaggio
KarenWertheimer
DavidCicola
HollySan Angelo
Judge Procedural Questionnaires
The Office of Adjudication’s website houses the Judges’ Procedural Questionnaires. Questionnaires provide guidance in the form of a standard questionnaire completed by each judge, and in some instances, attached forms. The questionnaire provides information to parties as to a judge’s expectations for hearings, submissions, etc. and addresses procedures that parties frequently encounter when litigating or mediating workers’ compensation cases before a judge. The questionnaires may be searched alphabetically by judge’s name or by field office and district. A link has been added in WCAIS in several locations to take the user to the website to view the Judges’ Procedural Questionnaires.
The procedural requirements provided are for informational purposes only, intended solely as general guidelines for litigating or mediating cases before workers’ compensation judges. The Q&As range in topic from what parties can expect at a first meeting with the judge, to a particular judge’s rules for taking testimony, to procedures for supersedeas hearings, to whether the judge will close a case by WCAIS upload or mail and more.
Alternative Dispute Resolution Services
The Office of Adjudication is pleased to offer mandatory mediation services, voluntary mediation services and informal conferences under the act. Under this system, the decision is placed in the hands of the parties through a process of self-determination to reach an amicable agreement as to issues in a dispute, or the entire dispute or claim. The judge’s role is to facilitate the parties’ discussion, provide guidance through the process in identifying each party’s interests and to assist the parties in determining creative solutions for possible settlements.
Parties retain control over the outcome. There is no cost when a workers’ compensation judge serves as the neutral party. Other potential benefits of this system include:
• Informal sessions • Open communication between the parties • Expedition of the claims process
The Office of Adjudication schedules mandatory mediation sessions as required by the act as well as voluntary mediation sessions upon request of the parties. In 2018, the Office of Adjudication conducted mediations in 8,563 cases, resulting in resolution of 3,890 claims.
Office of Adjudication Updates
20

2018 ANNUALREPORT
Pennsylvania Workers’ Compensation and Workplace Safety
TOM WOLF, GOVERNORW. GERARD OLEKSIAK, SECRETARY
Office of Adjudication Updates (cont.)
Office of Adjudication Personnel
Organization ChartAs of Dec. 31, 2018
Department ofLabor & Industry
SecretaryW. Gerard Oleksiak
Central DistrictJudge Manager
Susan B. Caravaggio570-327-3735
Eastern DistrictJudge Manager
Karen A. Wertheimer215-781-3274
Southeastern DistrictJudge ManagerHolly San Angelo215-560-2488
Western DistrictJudge ManagerDavid A. Cicola814-533-2494
Office ofAdjudication
DirectorJoseph DeRita717-783-4151
Compensation &Insurance
Deputy SecretaryScott G. Weiant
21

2018 ANNUAL
REPORTPennsylvania Workers’ Compensation and Workplace Safety
TOM WOLF, GOVERNORW. GERARD OLEKSIAK, SECRETARY
Office of Adjudication District Offices
See telephone directory on pages 36-38 for names, telephone numbers and office locations of workers’ compensation judges.
Western District
Altoona615 Howard Ave., Suite 202Altoona, PA 16601-4813814-946-7355
Brookville18 Western Ave., Suite FBrookville, PA 15825-1540814-849-5382
Clearfield241 E. Market St.Clearfield, PA 16830-2424814-765-6398
Erie3400 Lovell Place13th & Holland StreetsErie, PA 16503-2621814-871-4632
Greensburg144 N. Main St., Suite 1AGreensburg, PA 15601-2404724-832-5310
Johnstown607 Main St., Suite 100Johnstown, PA 15901-2119814-533-2494
New CastleCascade Galleria100 S. Jefferson St., Suite 146New Castle, PA 16101-3900724-656-3084
Pittsburgh411 7th Ave., Room 310Pittsburgh, PA 15219-1944412-565-5277
Uniontown108 N. Beeson Blvd., Suite 200Uniontown, PA 15401-7401724-439-7420
WashingtonMillcraft Center, Suite 120 LL90 W. Chestnut St.Washington, PA 15301-4528724-223-4595
Eastern District
Allentown7248 Tilghman St., Suite 150Allentown, PA 18106-9355610-366-6060
Bristol1242 Veterans HighwayBristol, PA 19007-2512215-781-3274
Lancaster315 W. James St., Suite 206Lancaster, PA 17603-2979717-299-7591
Malvern72 Lancaster Ave., 2nd FloorMalvern, PA 19355-2142610-251-2878
ReadingReading State Office Bldg.625 Cherry St., Suite 150Reading, PA 19602-1151610-621-2370
Central District
Director’s OfficeEast Gate Center1010 N. 7th St., Room 318Harrisburg, PA 17102-1400717-783-4151
HarrisburgEast Gate Center1010 N. 7th St., Room 319Harrisburg, PA 17102-1400717-783-4419
Pottsville112 S. Claude A. Lord Blvd.Pottsville, PA 17901-3602570-621-3146
Scranton321 Spruce St., 3rd FloorScranton, PA 18503570-963-4580
Wilkes-Barre8 West Market St., Suite 330Wilkes-Barre, PA 18701-1816570-826-2577
Williamsport208 W. Third St., Rear, Suite 202Williamsport, PA 17701-6450570-327-3735
Southeastern District
Philadelphia110 N. 8th St., Suite 401Philiadelphia, PA 19107-2413215-560-2488
Upper DarbyBarclay Square Center2nd Floor1500 Garrett RoadUpper Darby, PA 19082-4519610-284-6913
Erie
Erie
Crawford
Warren
Mercer
Forest
Venango
McKeanPotter
Elk
Tioga
Cameron
Clarion
JeffersonButler Clearfield
Huntingdon
Brookville
Clearfield
Centre
Cambria
Armstrong
Indiana
Washington
Allegheny
GreensburgWashington
Pittsburgh
Westmoreland
SomersetFayette
UniontownGreene
Bedford
Pottsville
Schuylkill
Williamsport
Lycoming
Clinton
Sullivan
Bradford
Union
SnyderMifflin
Juniata
Perry
FultonFranklin Adams York
Cumberland
Monroe
Pike
Luzerne
Wilkes-Barre
Northumberland
Montour
Dauphin
Lebanon Berks
Lancaster
Lehigh
Northampton
Carbon
Reading
Lancaster
Susquehanna
Wayne
Chester
Bucks
BristolMontgomery
Columbia
Wyoming
Lackawanna
Western District Central District
Allentown
Malvern
Blair
Altoona
EasternDistrict
SoutheasternDistrict
Upper Darby
Philadelphia
Delaware
Beaver
Bureau Headquarters
Harrisburg
New Castle
Lawrence
Johnstown
Scranton
22
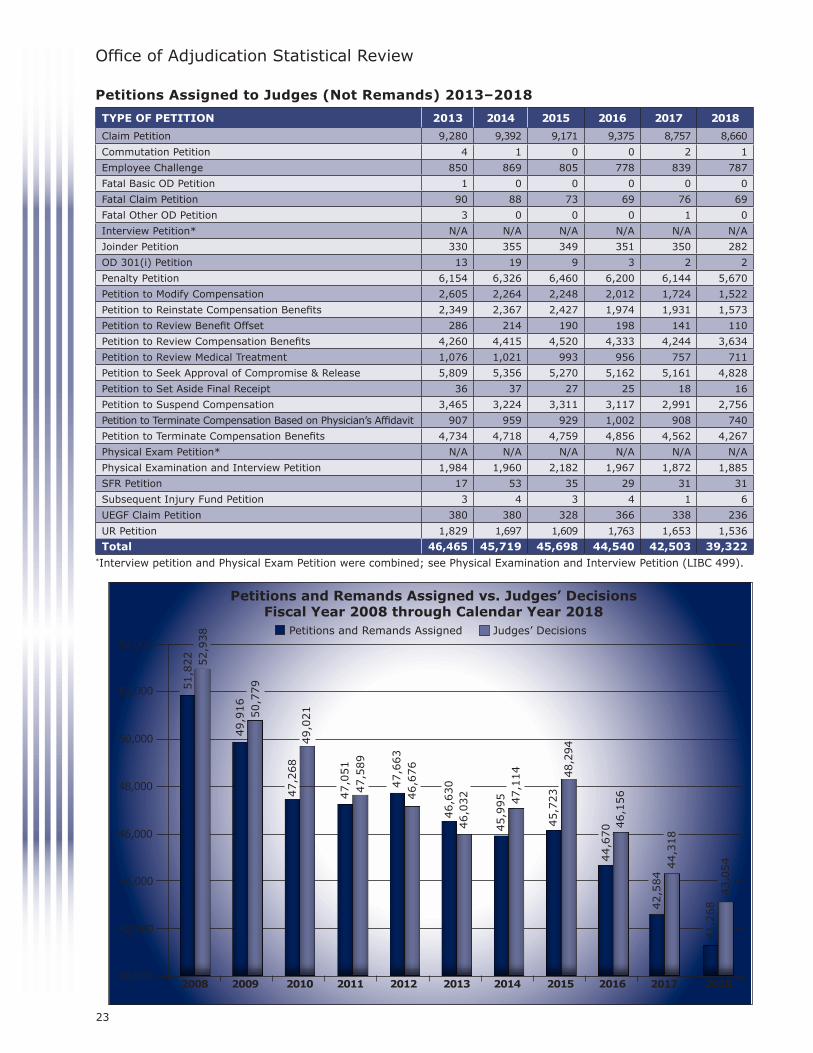
2018 ANNUALREPORT
Pennsylvania Workers’ Compensation and Workplace Safety
TOM WOLF, GOVERNORW. GERARD OLEKSIAK, SECRETARY
Office of Adjudication Statistical Review
Petitions Assigned to Judges (Not Remands) 2013–2018
TYPE OF PETITION 2013 2014 2015 2016 2017 2018
Claim Petition 9,280 9,392 9,171 9,375 8,757 8,660
Commutation Petition 4 1 0 0 2 1
Employee Challenge 850 869 805 778 839 787
Fatal Basic OD Petition 1 0 0 0 0 0
Fatal Claim Petition 90 88 73 69 76 69
Fatal Other OD Petition 3 0 0 0 1 0
Interview Petition* N/A N/A N/A N/A N/A N/A
Joinder Petition 330 355 349 351 350 282
OD 301(i) Petition 13 19 9 3 2 2
Penalty Petition 6,154 6,326 6,460 6,200 6,144 5,670
Petition to Modify Compensation 2,605 2,264 2,248 2,012 1,724 1,522
Petition to Reinstate Compensation Benefits 2,349 2,367 2,427 1,974 1,931 1,573
Petition to Review Benefit Offset 286 214 190 198 141 110
Petition to Review Compensation Benefits 4,260 4,415 4,520 4,333 4,244 3,634
Petition to Review Medical Treatment 1,076 1,021 993 956 757 711
Petition to Seek Approval of Compromise & Release 5,809 5,356 5,270 5,162 5,161 4,828
Petition to Set Aside Final Receipt 36 37 27 25 18 16
Petition to Suspend Compensation 3,465 3,224 3,311 3,117 2,991 2,756
Petition to Terminate Compensation Based on Physician’s Affidavit 907 959 929 1,002 908 740
Petition to Terminate Compensation Benefits 4,734 4,718 4,759 4,856 4,562 4,267
Physical Exam Petition* N/A N/A N/A N/A N/A N/A
Physical Examination and Interview Petition 1,984 1,960 2,182 1,967 1,872 1,885
SFR Petition 17 53 35 29 31 31
Subsequent Injury Fund Petition 3 4 3 4 1 6
UEGF Claim Petition 380 380 328 366 338 236
UR Petition 1,829 1,697 1,609 1,763 1,653 1,536
Total 46,465 45,719 45,698 44,540 42,503 39,322*Interview petition and Physical Exam Petition were combined; see Physical Examination and Interview Petition (LIBC 499).
Petitions and Remands Assigned vs. Judges’ DecisionsFiscal Year 2008 through Calendar Year 2018
54,000
52,000
50,000
48,000
46,000
44,000
42,000
40,000
Judges’ DecisionsPetitions and Remands Assigned
49,9
16
50,7
79
47,6
63
46,6
76
45,9
95
47,1
14
45,7
23
48,2
94
47,2
68
49,0
21
47,0
51
47,5
89
42,5
84
44,3
18
51,8
22
52,9
38
2008 2009 2010 2011 2012 2013 2014 2015 2016 2017 2018
44,6
70 4
6,1
56
46,6
30
46,0
32
41,2
68
43,0
54
23

2018 ANNUAL
REPORTPennsylvania Workers’ Compensation and Workplace Safety
TOM WOLF, GOVERNORW. GERARD OLEKSIAK, SECRETARY
*Claim petitions include: claim, reinstatement, fatal, set aside final receipt, 301(i) and OD Fatal.**Not indicative of an increase in actual injuries; count reflects new claims reporting standards that include medical-only claims. 2013 count includes only fourth-quarter medical only claims. Subsequent year counts include medical-only claims from the whole year.Source: Workers’ Compensation Office of Adjudication, Pennsylvania Department of Labor & Industry
200,000
180,000
160,000
140,000
120,000
100,000
80,000
60,000
40,000
20,000
0 2008 2009 2010 2011 2012 2013 2014 2015 2016 2017 2018
Office of Adjudication Statistical Review (cont.)
Reported Injuries vs. Total Petitions and Remands vs. Total Claim Petitions*
Fiscal Year 2008 though Calendar Year 2018
Petitions and Remands Assigned Total Claim Petitions*Reported Injuries
104,2
75
88,9
73
85,5
60
83,1
44
85,1
17
110,3
00
**
177,3
17
**
174,2
16
**
166,1
14
**
159,1
62
**
51,8
22
49,9
16
46,6
30
47,2
68
47,0
51
47,6
63
45,9
95
45,7
23
42,5
84
44,6
70
10,7
84
12,6
60
11,7
72
11,9
03
11,7
07
11,6
72
11,3
68
12,0
74
12,
180
11,4
46
173,2
67
41,2
68
10,3
20
24

2018 ANNUALREPORT
Pennsylvania Workers’ Compensation and Workplace Safety
TOM WOLF, GOVERNORW. GERARD OLEKSIAK, SECRETARY
OFFIC
E O
F A
DJU
DIC
ATIO
N P
ETIT
ION
CO
UN
T
2
01
8 C
ALE
ND
AR
YE
AR
VS
20
17
CA
LE
ND
AR
YE
AR
A
ll A
ssig
nm
en
ts
CA
LEN
DA
R Y
EA
R 2
01
8
CO
UN
TY
WIT
H I
NC
REA
SE
C
ALEN
DA
R Y
EA
R (
20
17
) C
OU
NTY
WIT
H D
EC
REA
SE
Pr
epar
ed Ja
nuar
y 20
19
46
6 (
57
7)
-11
1
13
1 (
11
5)
+1
6
32
6 (
37
3)
-47
65
0 (
61
2)
+3
8
15
4 (
16
1)
-7
52
6 (
54
8)
-22
36
2 (
32
9)
+3
3
1
44
(1
39
) +
5
11
0
(14
0)
-30
72
(6
2)
+1
0
46
(6
3)
-17
23
3 (
22
3)
+1
0
18
1 (
15
9)
+2
2
29
7
(34
6)
-49
78
(1
25
) -4
7
15
2 (
18
6)
-34
91
(8
3)
+8
29
7
(27
3)
+2
4
93
(6
1)
+3
2
42
9 (
43
5)
-6
30
(2
6)
+4
7
(6)
+
1
13
8 (
13
3)
+5
13
6 (
11
1)
+2
5
10
0 (
79
) +
21
3
05
(3
63
) -5
8
12
(2
2)
-10
22
(2
6)
-4
79
(1
31
) -5
2
74
(8
8)
-14
87
(1
30
) -4
3
20
2 (
22
3)
-21
10
69
(1
13
4)
-65
10
97
(9
45
) +
15
2
17
99
(1
95
7)
-15
8
17
7 (
17
3)
+4
17
68
(1
57
1)
+1
97
93
9 (
10
22
) -8
3
16
(2
0)
-4
19
1
(21
4)
-23
2
82
(2
85
) -3
50
0
(46
8)
+3
2
17
43
(1
70
4)
+3
9
67
(9
1)
-24
26
33
(2
58
8)
+4
5
15
6
(15
2)
+4
10
1 (
82
) -1
9
80
(5
7)
+2
3
90
(
10
2)
-1
2
61
7 (
65
8)
-41
43
(
46
)
-3
15
34
(1
63
9)
-1
05
8
14
(8
89
) -7
5
3
4
(42
) -8
32
9 (
39
9)
-70
3
76
(4
04
) -2
8
10
72
(1
11
1)
-39
11
1 (
14
4)
-33
PETI
TIO
NS
FILE
D F
OR
OU
T O
F ST
ATE
CLA
IMA
NTS
: 0 (0
)
PETI
TIO
NS
FILE
D W
ITH
NO
CO
UN
TY: 0
(0)
43
4 (
56
3)
-12
9
20
5
(19
6)
+9
71
0 (
69
9)
+1
1
13
01
(1
40
2)
-10
1
3
48
(3
16
) +
32
1
84
6
(1
93
9)
-9
3
22
69
(2
64
0)
-
37
1
Dela
ware
: 2
28
5 (
23
21
) -3
6
Ph
ilad
elp
hia
: 8
20
2 (
82
63
) -6
1
Office of Adjudication Statistical Review
25
2018 ANNUAL
REPORTPennsylvania Workers’ Compensation and Workplace Safety
TOM WOLF, GOVERNORW. GERARD OLEKSIAK, SECRETARY
Overview of the Workers’ Compensation Appeal Board
Mission Statement
The mission of The Pennsylvania Workers’ Compensation Appeal Board (WCAB) is to provide every injured worker and employer the opportunity to seek redress from an adverse decision and order of a Workers’ Compensation Judge (WCJ) by assuring that the decision was reasoned, was supported by substantial and competent evidence, and comported with applicable law.
The WCAB shall continually strive to: provide adequate opportunity for appellate argument; issue objective, learned, and responsive decisions in a timely manner; and allocate sufficient resources to its commissioners and staff to provide a positive, efficient, and productive work environment in service to the public and the Commonwealth.
Primary Functions
The WCAB is granted statutory authority under the Workers’ Compensation Act (WCA) to adjudicate all appeals from decisions rendered by the WCJs throughout Pennsylvania.
Any aggrieved party may appeal the decision of a WCJ by filing a Notice of Appeal with the WCAB within 20 days of the issuance of the WCJ’s decision and order. The WCAB reviews a WCJ’s decision to assure that it is supported by substantial and competent evidence, and is legally in accordance with the WCA.
In addition to adjudicating appeals from decisions and orders of WCJs, the WCAB has original jurisdiction over the appointment of fiduciary guardianships under § 307 of the WCA, commutation petitions under § 316, trustee payments under § 317, attorney fee petitions under §§ 442 and 501, total disability conversion determinations per instances of dual specific loss claims under § 306, and rehearing petitions under §§ 425 and 426.
The WCAB hears appellate arguments, according to caseload, in Philadelphia, Pittsburgh, Harrisburg, Scranton, and Erie.
WCAB Commissioners possess statewide jurisdiction. The commissioners most frequently hear cases in panels of two. By statute, WCAB decisions and orders must be concurred in by a majority of all commissioners.
2018 Accomplishments
In 2018 the WCAB received 1,323 appeals and cross-appeals. The WCAB issued 888 opinions and orders and 226 disposition orders for a total of 1,114. The WCAB also issued approximately 667 supersedeas
determinations. The average time from appeal filing to publication of WCAB opinion, which excludes delays caused by parties and weather, was 11.2 months. Currently, the WCAB has a working inventory of approximately 1,260 pending appeals and petitions.
The WCAB continues to hear guardianship petitions, which helps the parties avoid Orphans Court and obtain an expedited legal decision.
In order to better serve the board and the parties during oral argument, the WCAB now (1) posts the argument list for its upcoming hearing sessions a few business days before the session begins on its electronic landing page at https://www.dli.pa.gov/Businesses/Compensation/appeals/Pages/default.aspx; and (2) as an internal operating procedure, the chairman and secretary of the board assign commissioners to specific cases concurrent with the issuance of the notice of hearing in order to provide a warmer bench for argument.
Lastly, from an educational standpoint, the Appeal Board was invited and conducted in a moot court setting, live argument at the Temple University Fox School of Business and at the Duquesne School of Law. In addition to formal argument, board commissioners provided an overview of the administrative legal process and of Pennsylvania Workers’ Compensation Law.
WCAIS
In 2018 litigants took advantage of the Workers’ Compensation Automation and Integration System (WCAIS), with 94 percent of the appeals and petitions being filed electronically using WCAIS.
The WCAB was the first commonwealth agency to “go-live” with Release 1 of WCAIS in September 2012. The WCAB continues to make assessments and adjustments to WCAIS in order to improve public service and maintain the integrity of the administrative appellate process.
Commissioners and Secretary
Currently the WCAB consists of seven commissioners:
Commissioner Alfonso Frioni, Jr., Esq., ChairCommissioner Sandra D. Crawford, Esq.Commissioner Thomas P. Cummings, Jr., Esq.Commissioner William I. Gabig, Esq.Commissioner Robert A. Krebs, Esq.Commissioner David A. Wilderman, Esq.Commissioner James A. Zurick, Esq.
The WCAB Secretary is Steven B. Loux, Esq.
26
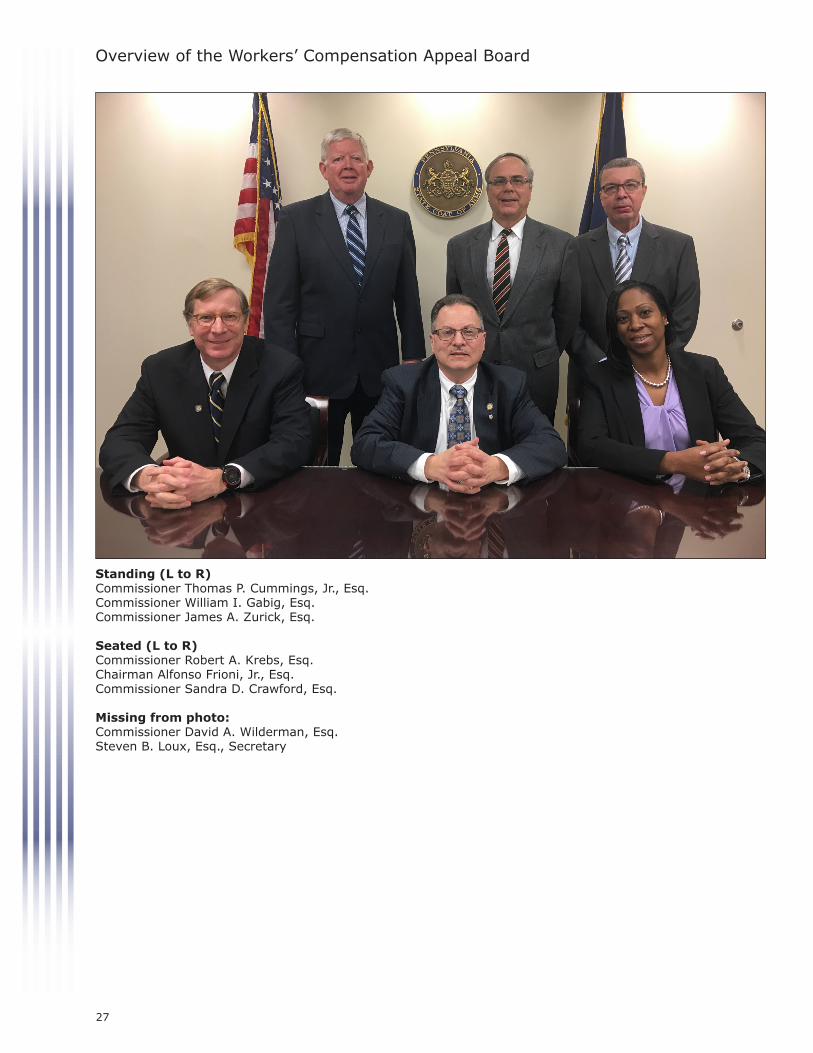
2018 ANNUALREPORT
Pennsylvania Workers’ Compensation and Workplace Safety
TOM WOLF, GOVERNORW. GERARD OLEKSIAK, SECRETARY
Overview of the Workers’ Compensation Appeal Board
Standing (L to R)Commissioner Thomas P. Cummings, Jr., Esq.Commissioner William I. Gabig, Esq.Commissioner James A. Zurick, Esq.
Seated (L to R)Commissioner Robert A. Krebs, Esq.Chairman Alfonso Frioni, Jr., Esq.Commissioner Sandra D. Crawford, Esq.
Missing from photo:Commissioner David A. Wilderman, Esq.Steven B. Loux, Esq., Secretary
27

2018 ANNUAL
REPORTPennsylvania Workers’ Compensation and Workplace Safety
TOM WOLF, GOVERNORW. GERARD OLEKSIAK, SECRETARY
Workplace Safety
Governor’s Occupational Safety and Health Conference
This two-day conference brings together individuals with special interest in the field of workplace health and safety to share ideas and to meet innovators in safety program design and technology.
Using labor-management cooperation, the conference goal is to create a safer workplace and a healthier workforce, and to increase awareness of safety issues in the workplace, the home and throughout local communities.
Featuring nationally-known speakers, the conference highlights one-on-one interaction during two days of workshops. Many of the workshops are created based on needs expressed by attendees at the previous year’s conference. In addition, workshops with the most interest from attendees are repeated in the second session of the day to ensure that all participants have the opportunity to participate in the workshops of their interest.
Governor’s Award for Safety Excellence
Providing a safe work environment for Pennsylvania’s workers requires complete commitment by employers and employees. This safety initiative provides Pennsylvania employers and employees with the information and technical assistance needed to develop comprehensive safety practices in the workplace. It also recognizes the successful employer-employee joint safety programs, which result in the achievement of safety excellence.
The Governor’s Award for Safety Excellence is a competitive award, as evidenced by the high number
of nominations received annually. The information gained from these nominations provides valuable best practices that are shared across the state.
Any Pennsylvania employer is eligible for the Governor’s Award for Safety Excellence; nominations for the award are voluntary. Information and criteria used to determine finalists include any established joint safety committee; level of labor and management cooperation in prevention efforts; a comprehensive safety plan with a commitment of resources and training; trends experienced in workplace injuries/illnesses over the past five years; number, frequency and severity of workplace injuries/illnesses vs. industry standards; and innovation and strategic development of safety policy and approaches.
Initial review of all nominations is conducted by the Governor’s Award for Safety Excellence Review Committee. Semi-finalists are then contacted for an on-site visit conducted by a member(s) of the department’s safety team to review the nominee’s comprehensive safety program. Site visit reports are written and distributed to the review committee for the determination of finalists. Recommendations are then forwarded to the secretary of Labor & Industry, who makes the final determination.
Awards are presented by representatives of the Department of Labor & Industry at the Governor’s Occupational Safety and Health Conference as well as at the organization’s workplace. Winners receive a “Governor’s Award for Safety Excellence” plaque to memorialize the achievement.
For a copy of the award application, visit www.dli.pa.gov; click on “Businesses,” “Health & Safety Division,” then “Governor’s Award for Safety Excellence.”
28

2018 ANNUALREPORT
Pennsylvania Workers’ Compensation and Workplace Safety
TOM WOLF, GOVERNORW. GERARD OLEKSIAK, SECRETARY
2018 Governor’s Award for Safety Excellence (GASE) Winners
CORELLE BRANDS, LLC
Corelle Brands, LLC designs, manufactures and markets products for cooking and sharing food.
• The heart of the safety program is the Safety Management Team which includes 100 management and
labor personnel, comprising 12 safety teams.
• Established a 180-day “Refresher Safety Training” for new employees in response to data that indicated
new employees began to forget their safety training at about six months.
LOCKHEED MARTIN MISSILES & FIRE CONTROL
Lockheed Martin is a global security and aerospace company. They are principally engaged in the research, design, development, manufacture, integration and sustainment of advance technology systems products and services.
• The Archbald site has been an OSHA VPP Star worksite since 2003. • A close call system has been established company-wide to encourage employees to report safety concerns prior to becoming an incident. Calls have increased from eight in 2014 to 170 in 2017.
29
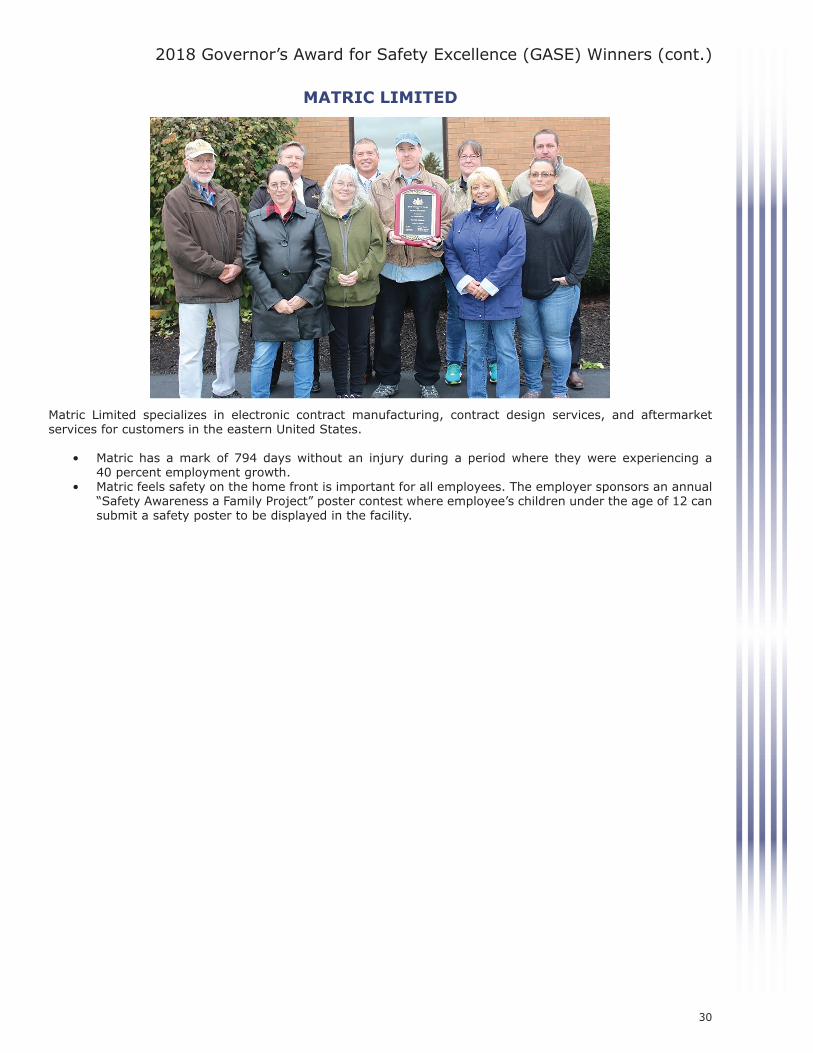
2018 ANNUAL
REPORTPennsylvania Workers’ Compensation and Workplace Safety
TOM WOLF, GOVERNORW. GERARD OLEKSIAK, SECRETARY
2018 Governor’s Award for Safety Excellence (GASE) Winners (cont.)
MATRIC LIMITED
Matric Limited specializes in electronic contract manufacturing, contract design services, and aftermarket services for customers in the eastern United States.
• Matric has a mark of 794 days without an injury during a period where they were experiencing a 40 percent employment growth. • Matric feels safety on the home front is important for all employees. The employer sponsors an annual “Safety Awareness a Family Project” poster contest where employee’s children under the age of 12 can submit a safety poster to be displayed in the facility.
30

2018 ANNUALREPORT
Pennsylvania Workers’ Compensation and Workplace Safety
TOM WOLF, GOVERNORW. GERARD OLEKSIAK, SECRETARY
More Information
On the Web
Check us out on the web at www.dli.pa.gov. Click on “Workers’ Compensation” to find exciting and innovative workers’ compensation features, including: Health and SafetyFind descriptions about a variety of safety-related programs including: safety committee certification, return-to-work, the Governor’s Award for Safety Excellence and drug-free workplaces. You’ll also learn about HandS, the health and safety online filing system, and the Pennsylvania Training for Health and Safety, or PATHS, a free safety training and educational resource. Self-insured employers and insurers can file annual reports online. Employers who want to certify their safety committees or renew existing certification can do so on the web. Health and Safety web pages provide instructions on how to use the HandS system and how to establish a user account.
Claims InformationWCAIS gives the external community access to their claims in the system. See www.wcais.pa.gov for registration information and more.
Log on to the EDI web page for information regarding Claims EDI Release 3 and access to the Implementation Guide, supporting documents and more: www.dli.pa.gov, “Workers’ Compensation,” “WCAIS,” “Electronic Data Interchange.”
Other Useful InformationUse the web to access other information such as the Workers’ Compensation Act, bureau publications, information on obtaining workers’ compensation hearing transcripts, alternative dispute resolution, Kids’ Chance of Pennsylvania Inc. and more.
Publications Available from the Bureau of Workers’ Compensation
Workers’ Compensation Act
The bureau makes the Pennsylvania Workers’ Compensation Act available online at www.dli.pa.gov. Click on “Workers’ Compensation,” then “Publications,” then “WC Act.” Hard copies of the act are available for purchase from the State Bookstore of Pennsylvania’s website, www.shopPAheritage.com.
Employer Information
• Employer’s Guide to Self-Insuring Workers’ Compensation (LIBC-300) information on how to self-insure your workers’ compensation coverage.
• Employer Information (LIBC-200) includes key aspects of the act that relate specifically to employers.
Injured Worker Information
• Workers’ Compensation & the Injured Worker (LIBC-100) - general information on the rights and responsibilities of injured workers under the law. This publication is also available in Spanish.
Medical Cost Containment Information
• Medical Cost Containment Regulations Reference – workers’ compensation medical cost containment regulation highlights.
Health and Safety Materials
• Health and Safety Regulations published in the Pennsylvania Bulletin, Vol. 31, no. 28, July 14, 2001
• PA Training for Health and Safety (PATHS) Training Resources and Calendar
• State-Certified Workplace Safety Committee Program (LIBC-733)
• Application for Certification of Workplace Safety Committee Completion Guide (LIBC-372)
• Renewal Application for Safety Committee Certification Completion Guide (LIBC-372R)
• Commonwealth of Pennsylvania Insurer’s Initial Report of Accident & Illness Prevention Services (LIBC-211I)
• Insurer’s Annual Report of Accident & Illness Prevention Services (LIBC-210I)
• Commonwealth of Pennsylvania Self-Insured Employer’s Initial Report of Accident & Illness Prevention Program (LIBC-221E)
31
2018 ANNUAL
REPORTPennsylvania Workers’ Compensation and Workplace Safety
TOM WOLF, GOVERNORW. GERARD OLEKSIAK, SECRETARY
More Information (cont.)
• Accident & Illness Prevention Program Status by Individual Self-Insured Employers (LIBC-220E)
• Governor’s Award for Safety Excellence application
Miscellaneous • News & Notes – bureau newsletter on policies, procedures and updates on the law.
• Section 305 Prosecutions – A guide to aid Pennsylvania’s district attorneys in prosecuting employers who fail to carry the required workers’ compensation insurance coverage as outlined in Section 305 of the act.
Join our Mailing List
To be added to our electronic mailing list, email your name, the county in which you work or reside and your affiliation (claimant attorney, defense attorney, employer, government, health care industry, insurance industry, labor, third-party administrator or other) to [email protected] or [email protected], and ask to be added to our mailing lists.
To obtain copies of the publications listed above or for information regarding workers’ compensation in Pennsylvania,
WCAIS Help Centerwww.wcais.pa.gov • FAQs and detailed instructions for using the system can be found in WCAIS’ online help section.
PhoneClaims Information Services: • Inside PA toll-free 800-482-2383 • Local and outside PA 717-772-4447 • Employer Information Services 717-772-3702
Hearing Impaired PA Relay 7-1-1
Mail Bureau of Workers’ Compensation Information Services 1171 S. Cameron St., Room 324 Harrisburg, PA 17104-2501
32

2018 ANNUALREPORT
Pennsylvania Workers’ Compensation and Workplace Safety
TOM WOLF, GOVERNORW. GERARD OLEKSIAK, SECRETARY
Bureau of Workers’ Compensation Directory
Direct assistance is available through the WCAIS Customer Support Help Center at www.wcais.pa.gov. Click on HELP.
Administrative Support Division.............................................. 717-783-5421
Claims Management Division.................................................. Records Section............................................................
717-772-0621717-787-3361
Information Services Helpline................................................. Email: [email protected] Claims Information Services Inside PA toll-free......................................................... Local and outside PA..................................................... Employer Information Services....................................... Hearing Impaired.........................................................
717-783-5421
800-482-2383717-772-4447717-772-37027-1-1
Director’s Office...................................................................... 717-783-5421
Health and Safety Division...................................................... Email: General Questions - [email protected] PATHS Questions - [email protected] Audit/Report Processing................................................. Certification/Education...................................................
717-772-1917
717-772-1636717-772-1635
Health Care Services Review Division..................................... Email: [email protected] Fee Review................................................................... Utilization Review..........................................................
717-787-3486
717-772-1900717-772-1914
Legal Division.......................................................................... Email: [email protected] 717-783-4467
Self-Insurance Division........................................................... 717-783-4476
Special Funds & Compliance Division Compliance Section Special Funds Section Uninsured Employers Guaranty Fund (UEGF)................................
717-783-5421717-787-3567717-787-3457717-787-3457
33
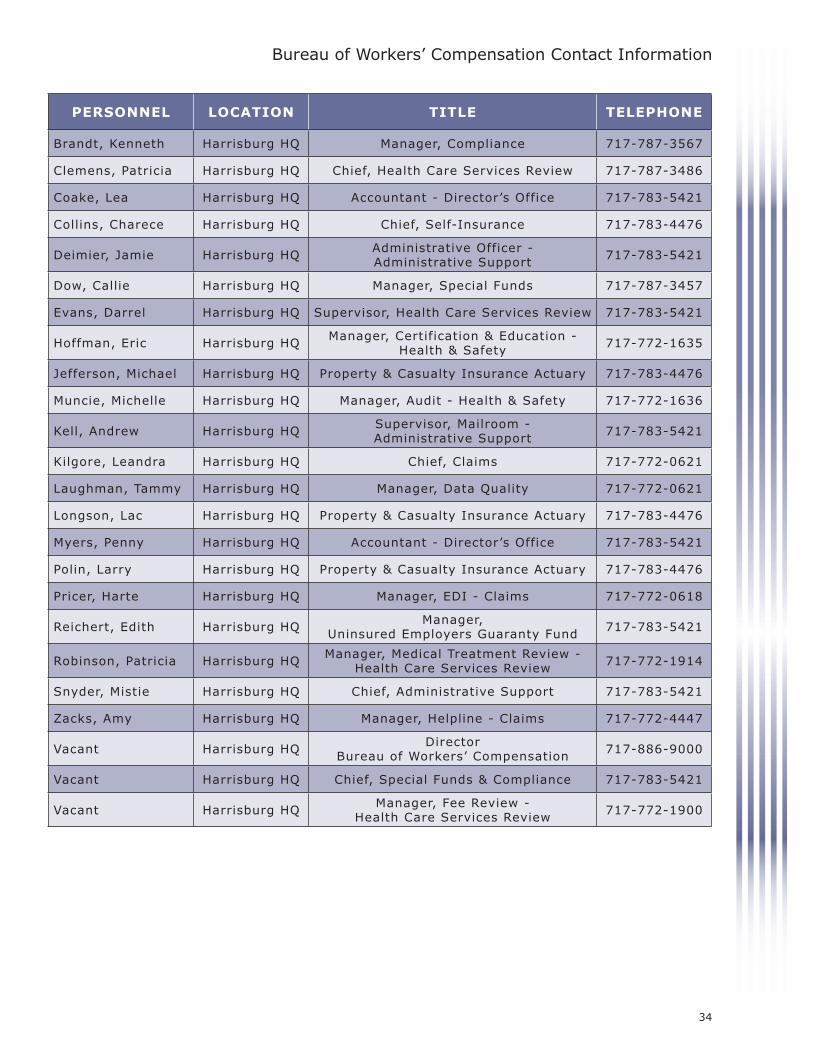
2018 ANNUAL
REPORTPennsylvania Workers’ Compensation and Workplace Safety
TOM WOLF, GOVERNORW. GERARD OLEKSIAK, SECRETARY
Bureau of Workers’ Compensation Contact Information
PERSONNEL LOCATION TITLE TELEPHONE
Brandt, Kenneth Harrisburg HQ Manager, Compliance 717-787-3567
Clemens, Patricia Harrisburg HQ Chief, Health Care Services Review 717-787-3486
Coake, Lea Harrisburg HQ Accountant - Director’s Office 717-783-5421
Collins, Charece Harrisburg HQ Chief, Self-Insurance 717-783-4476
Deimier, Jamie Harrisburg HQ Administrative Officer - Administrative Support 717-783-5421
Dow, Callie Harrisburg HQ Manager, Special Funds 717-787-3457
Evans, Darrel Harrisburg HQ Supervisor, Health Care Services Review 717-783-5421
Hoffman, Eric Harrisburg HQ Manager, Certification & Education - Health & Safety 717-772-1635
Jefferson, Michael Harrisburg HQ Property & Casualty Insurance Actuary 717-783-4476
Muncie, Michelle Harrisburg HQ Manager, Audit - Health & Safety 717-772-1636
Kell, Andrew Harrisburg HQ Supervisor, Mailroom - Administrative Support 717-783-5421
Kilgore, Leandra Harrisburg HQ Chief, Claims 717-772-0621
Laughman, Tammy Harrisburg HQ Manager, Data Quality 717-772-0621
Longson, Lac Harrisburg HQ Property & Casualty Insurance Actuary 717-783-4476
Myers, Penny Harrisburg HQ Accountant - Director’s Office 717-783-5421
Polin, Larry Harrisburg HQ Property & Casualty Insurance Actuary 717-783-4476
Pricer, Harte Harrisburg HQ Manager, EDI - Claims 717-772-0618
Reichert, Edith Harrisburg HQ Manager, Uninsured Employers Guaranty Fund 717-783-5421
Robinson, Patricia Harrisburg HQ Manager, Medical Treatment Review - Health Care Services Review 717-772-1914
Snyder, Mistie Harrisburg HQ Chief, Administrative Support 717-783-5421
Zacks, Amy Harrisburg HQ Manager, Helpline - Claims 717-772-4447
Vacant Harrisburg HQ DirectorBureau of Workers’ Compensation 717-886-9000
Vacant Harrisburg HQ Chief, Special Funds & Compliance 717-783-5421
Vacant Harrisburg HQ Manager, Fee Review - Health Care Services Review 717-772-1900
34

2018 ANNUALREPORT
Pennsylvania Workers’ Compensation and Workplace Safety
TOM WOLF, GOVERNORW. GERARD OLEKSIAK, SECRETARY
Workers’ Compensation Office of Adjudication Directory
COUNTY ADDRESS PHONE
ALLENTOWN 7248 Tilghman St., Suite 150, Allentown, PA 18106-9355 610-366-6060
ALTOONA 615 Howard Ave., Suite 202, Altoona, PA 16601-4813 814-946-7355
BRISTOL 1242 Veterans Highway, Bristol, PA 19007-2512 215-781-3274
BROOKVILLE 18 Western Ave., Suite F, Brookville, PA 15825-1540 814-849-5382
CLEARFIELD 241 E. Market St., Clearfield, PA 16830-2424 814-765-6398
DIRECTOR’S OFFICE East Gate Center, 1010 N. 7th St., Room 318, Harrisburg, PA 17102-1400 717-783-4151
ERIE 3400 Lovell Place, 13th & Holland Sts., Erie, PA 16503-2621 814-871-4632
GREENSBURG 144 N. Main St., Suite 1A, Greensburg, PA 15601-2404 724-832-5310
HARRISBURG East Gate Center, 1010 N. 7th St., Room 319, Harrisburg, PA 17102-1400 717-783-4419
JOHNSTOWN 607 Main St., Suite 100, Johnstown, PA 15901-2119 814-533-2494
LANCASTER 315 W. James St., Suite 206, Lancaster, PA 17603-2979 717-299-7591
MALVERN 72 Lancaster Ave., 2nd Floor, Malvern, PA 19355-2142 610-251-2878
NEW CASTLE Cascade Galleria, 100 S. Jefferson St., Suite 146, New Castle, PA 16101-3900 724-656-3084
PHILADELPHIA 110 N. 8th St., Suite 401, Philadelphia, PA 19107-2413 215-560-2488
PITTSBURGH 411 7th Ave., Room 310, Pittsburgh, PA 15219-1944 412-565-5277
POTTSVILLE 112 S. Claude A. Lord Blvd., Pottsville, PA 17901-3602 570-621-3146
READING Reading State Office Bldg., 625 Cherry St., Suite 150 Reading, PA 19602-1151 610-621-2370
SCRANTON 321 Spruce St., 3rd Floor, Scranton, PA 18503 570-963-4580
UNIONTOWN 108 N. Beeson Blvd., Suite 200, Uniontown, PA 15401-7401 724-439-7420
UPPER DARBY Barclay Square Center, 2nd Floor, 1500 Garrett Rd.,Upper Darby, PA 19082-4519 610-284-6913
WASHINGTON Millcraft Center, Suite 120 LL, 90 W. Chestnut St., Washington, PA 15301-4528 724-223-4595
WILKES-BARRE 8 West Market Street, Suite 330, Wilkes-Barre, PA 18701-1816 570-826-2577
WILLIAMSPORT 208 W. Third St., Rear, Suite 202, Williamsport, PA 17701-6450 570-327-3735
35

2018 ANNUAL
REPORTPennsylvania Workers’ Compensation and Workplace Safety
TOM WOLF, GOVERNORW. GERARD OLEKSIAK, SECRETARY
Workers’ Compensation Office of Adjudication Contact Information
PERSONNEL LOCATION TITLE TELEPHONE
August, Chelsea Greensboro FO Supervisor 724-832-5310
Bachman, Patricia Philadelphia FO Workers’ Compensation Judge 215-560-2488
Bailey, Deborah Reading FO Supervisor 610-621-2370
Beach, Audrey Philadelphia FO Workers’ Compensation Judge 215-560-2488
Beck, Lawrence Philadelphia FO Workers’ Compensation Judge 215-560-2488
Benedict, Alfred New Castle FO Workers’ Compensation Judge 724-656-3084
Benischeck, Robert Bristol FO Workers’ Compensation Judge 215-781-3274
Booth, Ashley Wilkes-Barre FO Supervisor 570-826-2577
Bowers, Debra Malvern FO Workers’ Compensation Judge 610-251-2878
Briston, Pamela Pittsburgh FO Workers’ Compensation Judge 412-565-5277
Bulman, Timothy Philadelphia FO Workers’ Compensation Judge 215-560-2488
Callahan, Bonnie Malvern FO Workers’ Compensation Judge 610-251-2878
Caravaggio, Susan Williamsport FO Workers’ Compensation Judge 570-327-3735
Carnahan, Theresa Pittsburgh FO Supervisor 412-565-5277
Cicola, David Johnstown FO Workers’ Compensation Judge 814-533-2494
Coholan, Anne Uniontown FO Workers’ Compensation Judge 724-439-7420
Costelnock, Paul Greensburg FO Workers’ Compensation Judge 724-832-5310
Craig, Sandra Philadelphia FO Workers’ Compensation Judge 215-560-2488
Crilley, Anne Pittsburgh FO Workers’ Compensation Judge 412-565-5277
Cummings, Patrick Scranton FO Workers’ Compensation Judge 570-963-4580
DeRita, Joseph Harrisburg FO Director, WCOA 717-783-4151
Dietrich, Wayne Harrisburg FO Workers’ Compensation Judge 717-783-4419
DiLorenzo, Kathleen Upper Darby FO Workers’ Compensation Judge 610-284-6913
Dively, Brenda Harrisburg FO Supervisor 717-783-4419
Doman, Bruce Allentown FO Workers’ Compensation Judge 610-366-6060
Eader, Brian Harrisburg FO Workers’ Compensation Judge 717-783-4419
Ellis, Penny Williamsport FO Supervisor 570-327-3735
Farese, Nancy Philadelphia FO Workers’ Compensation Judge 215-560-2488
Fegley, Wayne Pottsville FO Workers’ Compensation Judge 717-299-7591
Few, Peter Malvern FO Supervisor 610-251-2878
Gallishen, William Johnstown FO Workers’ Compensation Judge 814-533-2494
Goduto, Robert Lancaster FO Workers’ Compensation Judge 717-299-7591
Gonzalez, Melissa Harrisburg FO Supervisor 717-787-3274
Gordon, Donna Philadelphia FO Administrative Officer 215-560-2488
Grady, Joseph Scranton FO Workers’ Compensation Judge 570-963-4580
Guaetta, Roxann Johnstown FO Supervisor, Altoona and Johnstown Offices 814-946-7355
Guyton, Ada Greensburg FO Workers’ Compensation Judge 724-832-5310
Hagan, Joseph Philadelphia FO Workers’ Compensation Judge 215-560-2488
Hakun, Joseph Malvern FO Workers’ Compensation Judge 610-251-2878
Hankee, Kimberly Allentown FO Supervisor 610-366-6060
Hannon, Lori Scranton FO Supervisor 570-963-4580
Harlen, Stephen Philadelphia FO Workers’ Compensation Judge 215-560-2488
Harris, Alan Wilkes-Barre FO Workers’ Compensation Judge 570-826-2577
36

2018 ANNUALREPORT
Pennsylvania Workers’ Compensation and Workplace Safety
TOM WOLF, GOVERNORW. GERARD OLEKSIAK, SECRETARY
Workers’ Compensation Office of Adjudication Contact Information (cont.)
PERSONNEL LOCATION TITLE TELEPHONE
Harrison, Marc Philadelphia FO Workers’ Compensation Judge 215-560-2488
Haynes, Victoria Pittsburgh FO Supervisor 412-565-5277
Hemak, Brian Wilkes-Barre FO Workers’ Compensation Judge 570-826-2577
Hetrick, Michael Pottsville FO Workers’ Compensation Judge 570-621-3146
Ignasiak, Cheryl Pittsburgh FO Workers’ Compensation Judge 412-565-5277
Jones, Eric Pittsburgh FO Workers’ Compensation Judge 412-565-5277
Keeney, Brandy Harrisburg HQ Supervisor, Director’s Office 717-783-4151
Kelley, Susan Malvern FO Workers’ Compensation Judge 610-251-2878
Knox, Terry Reading FO Workers’ Compensation Judge 610-621-2370
Koll, Michael Clearfield FO Workers’ Compensation Judge 814-765-6398
Krass, Denise Philadelphia FO Workers’ Compensation Judge 215-560-2488
Kuklar, Kenneth Uniontown FO Administrative Officer 724-439-7420
Kutz, Thomas Harrisburg FO Workers’ Compensation Judge 717-783-4419
Kuzma, Thomas Pottsville FO Workers’ Compensation Judge 570-621-3146
Lawrence, Geoffrey Upper Darby FO Workers’ Compensation Judge 610-284-6913
Lawton, Charles Washington FO Workers’ Compensation Judge 724-223-4595
Leech, Stevi Johnstown FO Management Analyst 814-533-2494
Lewis, Leah Harrisburg FO Workers’ Compensation Judge 717-783-4419
Lincicome, Francine Philadelphia FO Workers’ Compensation Judge 215-560-2488
Lowman, William Uniontown FO Workers’ Compensation Judge 724-439-7420
Lugo, Carmen Erie FO Workers’ Compensation Judge 814-871-4632
Majikas, Jeffrey Wilkes-Barre FO Workers’ Compensation Judge 570-826-2577
Makin, Sarah Upper Darby FO Workers’ Compensation Judge 610-284-6913
McManus, Joseph Bristol FO Workers’ Compensation Judge 215-781-3274
McTiernan, John Brookville Workers’ Compensation Judge 814-849-5382
Melcher, Kelly Malvern FO Workers’ Compensation Judge 610-251-2878
Minnich, Steven Pittsburgh FO Workers’ Compensation Judge 412-565-5277
O’Donnell, Robert Lancaster FO Workers’ Compensation Judge 717-299-7591
Olin, Scott Philadelphia FO Workers’ Compensation Judge 215-560-2488
Peckmann, Karl Harrisburg FO Workers’ Compensation Judge 717-783-4419
Platt, Zach Harrisburg FO Administrative Officer 717-783-4419
Pletcher, Eric Wilkes-Barre FO Workers’ Compensation Judge 570-826-2577
Pogirski, Nathan Reading FO Workers’ Compensation Judge 610-621-2370
Poorman, Donald Malvern FO Workers’ Compensation Judge 610-251-2878
Puhala, Brian Allentown FO Workers’ Compensation Judge 610-366-6060
Rago, Tina Philadelphia Workers’ Compensation Judge 215-560-2488
Radaker, Cindy Brookville FO Supervisor, Brookville & Clearfield Offices 814-849-5382
Rosen, Michael Bristol FO Workers’ Compensation Judge 215-781-3274
Russell, Jeffrey New Castle FO Workers’ Compensation Judge 724-656-3084
Rutt, Cindy Lancaster FO Administrative Officer 717-299-7591
Sabatino, Cathleen Allentown FO Workers’ Compensation Judge 610-366-6060
37

2018 ANNUAL
REPORTPennsylvania Workers’ Compensation and Workplace Safety
TOM WOLF, GOVERNORW. GERARD OLEKSIAK, SECRETARY
Workers’ Compensation Office of Adjudication Contact Information (cont.)
PERSONNEL LOCATION TITLE TELEPHONE
Sallese, Ian New Castle FO Supervisor 724-656-3084
San Angelo, Holly Philadelphia Workers’ Compensation Judge 215-560-2488
Santoro, Pam Pittsburgh FO Workers’ Compensation Judge 412-565-6277
Schwartz, Jacob Harrisburg FO Workers’ Compensation Judge 717-783-4419
Sebastianelli, Joseph Wilkes-Barre FO Workers’ Compensation Judge 570-826-2577
Seelig, Todd Philadelphia FO Workers’ Compensation Judge 215-560-2488
Sheldon, Patrick Harrisburg FO Workers’ Compensation Judge 717-783-4419
Snyder, Daniel Allentown FO Workers’ Compensation Judge 610-366-6060
Soltis, Jacquelyn Bristol FO Supervisor 215-781-3274
Spizer, Howard Scranton FO Workers’ Compensation Judge 570-963-4580
Stapleton, James Reading FO Workers’ Compensation Judge 610-621-2370
Steiner, Robert New Castle FO Workers’ Compensation Judge 724-656-3084
Stokes, Joseph Upper Darby FO Workers’ Compensation Judge 610-284-6913
Timm, Audrey Philadelphia FO Workers’ Compensation Judge 215-560-2488
Torrey, David Pittsburgh FO Workers’ Compensation Judge 412-565-5277
Toth, Sherri Erie FO Supervisor 814-871-4632
Vonada, Robert Altoona FO Workers’ Compensation Judge 814-946-7355
Walker, Denice Philadelphia FO Supervisor 215-560-2488
Walsh, Kenneth Williamsport FO Workers’ Compensation Judge 570-327-3735
Wertheimer, Karen Bristol FO Workers’ Compensation Judge 215-781-3274
Weyl, David Lancaster FO Workers’ Compensation Judge 717-299-7591
Wright, Jean Erie FO Workers’ Compensation Judge 814-871-4632
Yanity, Gerald Greensburg FO Workers’ Compensation Judge 724-832-5310
Young, Erin Philadelphia FO Workers’ Compensation Judge 215-560-2488
Zeremenko, Kathleen Washington FO Supervisor, Uniontown and Washington Offices 724-223-4595
LegendFO - Field OfficeHQ - Headquarters
38

2018 ANNUALREPORT
Pennsylvania Workers’ Compensation and Workplace Safety
TOM WOLF, GOVERNORW. GERARD OLEKSIAK, SECRETARY
Work Injuries and Illnesses, Pennsylvania 2018
Scope
The information provided in this publication is based on reports of injuries and illnesses, which occurred during 2018 to workers employed by businesses covered by the Pennsylvania Workers’ Compensation Act. These reports are filed with the Bureau of Workers’ Compensation, Department of Labor & Industry. This publication reflects data reported to the bureau as of January 22, 2019.
Pursuant to the provisions of the act, all work injuries and illnesses resulting in death, permanent impairment or loss of time beyond a day or shift of occurrence are required to be reported to the bureau.
Federal employees, maritime workers and railroad workers in interstate commerce are covered under their respective federal workers’ compensation programs. Injuries and illnesses of these workers are not included in the statistics of this publication.
In 2015, injuries in the logging industry were re-categorized in all industry tables. Rather than compiling logging injuries as part of natural resources & mining, they are now included with forestry within the Agriculture, Forestry, Fishing & Hunting sector. This change also resulted in the renaming of the Natural Resources & Mining sector to Mining.
Work Injuries and Illnesses
During 2018, 173,267 work injury and illness cases were reported to the Bureau of Workers’ Compensation. The 2018 total is 949 less than the number reported in 2017.
Fatalities decreased from 82 in 2017 to 66 in 2018. The most fatalities occurred in Trade, Transportation & Utilities (15) followed by Professional & Business Services (13).
More than half (93,174 cases) of the 173,267 injury and illness cases reported in 2018 occurred in two supersectors: Education & Health Services (48,415 cases, 27.9 percent) and Trade, Transportation & Utilities (44,759 cases, 25.8 percent).
The injury rate per 1,000 workers decreased from 29.2 in 2017 to 28.8 in 2018. Professional & Business Services had the highest increase in 2018 (9.4 percentage points), followed by Manufacturing (0.9). Education & Health Services (-2.4) had largest decrease followed by Agriculture, Forestry, Fishing & Hunting (-2.2).
Agriculture, Forestry, Fishing & Hunting: 1,106 Injuries
• Most frequent type of injury: Sprain, Strain: 365 injuries, 33.0 percent
• Body part affected most often: Upper Extremities: 413 injuries, 37.3 percent
• Most frequent cause of injury: Struck by: 228 injuries, 20.6 percent
• Median age of injured workers: 39.0
• County with the most injured workers: Chester
Mining: 949 Injuries• Most frequent type of injury:
Sprain, Strain: 354 injuries, 37.3 percent
• Body part affected most often: Upper Extremities: 327 injuries, 34.5 percent
• Most frequent cause of injury: Overexertion: 225 injuries, 23.7 percent
• Median age of injured workers: 39.5
• Counties with the most injured workers: Washington
Construction: 9,827 Injuries• Most frequent type of injury:
Sprain, Strain: 3,305 injuries, 33.6 percent
• Body part affected most often: Upper Extremities: 3,683 injuries, 37.5 percent
• Most frequent cause of injury: Overexertion: 2,156 injuries, 21.9 percent
• Median age of injured workers: 40.9
• County with the most injured workers: Philadelphia
Manufacturing: 23,052 Injuries• Most frequent type of injury:
Sprain, Strain: 8,608 injuries, 37.3 percent
• Body part affected most often: Upper Extremities: 10,922 injuries, 47.4 percent
• Most frequent cause of injury: Overexertion: 7,007 injuries, 30.4 percent
• Median age of injured workers: 44.7
• County with the most injured workers: Berks
39

2018 ANNUAL
REPORTPennsylvania Workers’ Compensation and Workplace Safety
TOM WOLF, GOVERNORW. GERARD OLEKSIAK, SECRETARY
Work Injuries and Illnesses, Pennsylvania 2018 (cont.)
Trade, Transportation & Utilities: 44,759 Injuries
• Most frequent type of injury: Sprain, Strain: 18,029 injuries, 40.3 percent
• Body part affected most often: Upper Extremities: 16,163 injuries, 36.1 percent
• Most frequent cause of injury: Overexertion: 13,606 injuries, 30.4 percent
• Median age of injured workers: 41.5
• County with the most injured workers: Philadelphia
Information: 1,468 Injuries• Most frequent type of injury:
Sprain, Strain: 652 injuries, 44.4 percent
• Body part affected most often: Upper Extremities: 454 injuries, 30.9 percent
• Most frequent cause of injury: Overexertion: 348 injuries, 23.7 percent
• Median age of injured workers: 44.6
• County with the most injured workers: Allegheny
Financial Activities: 3,370 Injuries• Most frequent type of injury:
Sprain, Strain: 1,177 injuries, 34.9 percent
• Body part affected most often: Upper Extremities: 1,070 injuries, 31.8 percent
• Most frequent cause of injury: Fall on same level: 740 injuries, 22.0 percent
• Median age of injured workers: 46.9
• County with the most injured workers: Allegheny
Professional & Business Services: 13,560 Injuries
• Most frequent type of injury: Sprain, Strain: 4,605 injuries, 34.0 percent
• Body part affected most often: Upper Extremities: 5,428 injuries, 40.0 percent
• Most frequent cause of injury: Overexertion: 3,092 injuries, 22.8 percent
• Median age of injured workers: 37.8
• County with the most injured workers: York
Education & Health Services: 48,415 Injuries
• Most frequent type of injury: Sprain, Strain: 18,842 injuries, 38.9 percent
• Body part affected most often: Upper Extremities: 17,192 injuries, 35.5 percent
• Most frequent cause of injury: Struck by: 12,652 injuries, 26.1 percent
• Median age of injured workers: 44.0
• County with the most injured workers: Allegheny
Leisure & Hospitality: 11,378 Injuries
• Most frequent type of injury: Sprain, Strain: 3,264 injuries, 28.7 percent
• Body part affected most often: Upper Extremities: 5,092 injuries, 44.8 percent
• Most frequent cause of injury: Struck by: 2,567 injuries, 22.6 percent
• Median age of injured workers: 32.0
• County with the most injured workers: Allegheny
Other Services (Except Public Administration): 4,561 Injuries
• Most frequent type of injury: Sprain, Strain: 1,452 injuries, 31.8 percent
• Body part affected most often: Upper Extremities: 1,712 injuries, 37.5 percent
• Most frequent cause of injury: Struck by: 1,102 injuries, 24.2 percent
• Median age of injured workers: 41.2
• County with the most injured workers: Philadelphia
Public Administration: 10,806 Injuries
• Most frequent type of injury: Sprain, Strain: 4,046 injuries, 37.4 percent
• Body part affected most often: Upper Extremities: 3,445 injuries, 31.9 percent
• Most frequent cause of injury: Overexertion: 2,374 injuries, 22.0 percent
• Median age of injured workers: 42.3
• County with the most injured workers: Philadelphia
40

2018 ANNUALREPORT
Pennsylvania Workers’ Compensation and Workplace Safety
TOM WOLF, GOVERNORW. GERARD OLEKSIAK, SECRETARY
Work Injuries and Illnesses, Pennsylvania 2018 (cont.)
First Reports of Injury
A total of 173,267 First Reports of Injury (FROI) were received by the bureau for injuries sustained in 2018. Of the reports received, 89 percent were received via EDI and 11 percent were received via the department’s website.
Table 1.a. Work Injuries and Illnesses by Major Industry, Pennsylvania 2018
Source: Bureau of Workers’ Compensation, Pennsylvania Department of Labor & Industry
Source: Bureau of Workers’ Compensation, Pennsylvania Department of Labor & Industry
173,267 FROIs
Figure 1. Collection Process of First Reports of Injury
2018 2017% Change
2017 to 2018
All IndustriesTotal 173,267 174,216 -0.5%
Fatal 66 82
Agriculture, Forestry, Fishing & HuntingTotal 1,106 1,157 -4.4%
Fatal 1 0
MiningTotal 949 876 8.3%
Fatal 2 2
ConstructionTotal 9,827 9,901 -0.7%
Fatal 10 17
ManufacturingTotal 23,052 22,349 3.1%
Fatal 8 5
Trade, Transportation & UtilitiesTotal 44,759 45,045 -0.6%
Fatal 15 25
InformationTotal 1,468 1,485 -1.1%
Fatal 0 0
Financial ActivitiesTotal 3,370 3,441 -2.1%
Fatal 1 3
Professional & Business ServicesTotal 13,560 11,950 13.5%
Fatal 13 8
Education & Health ServicesTotal 48,415 51,489 -6.0%
Fatal 6 10
Leisure & HospitalityTotal 11,378 11,160 2.0%
Fatal 2 1
Other Services (Except Public Administration)Total 4,561 4,464 2.2%
Fatal 0 3
Public AdministrationTotal 10,806 10,882 -0.7%
Fatal 8 8
UnclassifiedTotal 16 17 -5.9%
Fatal 0 0
EDI, 89%
WEB,11%
41
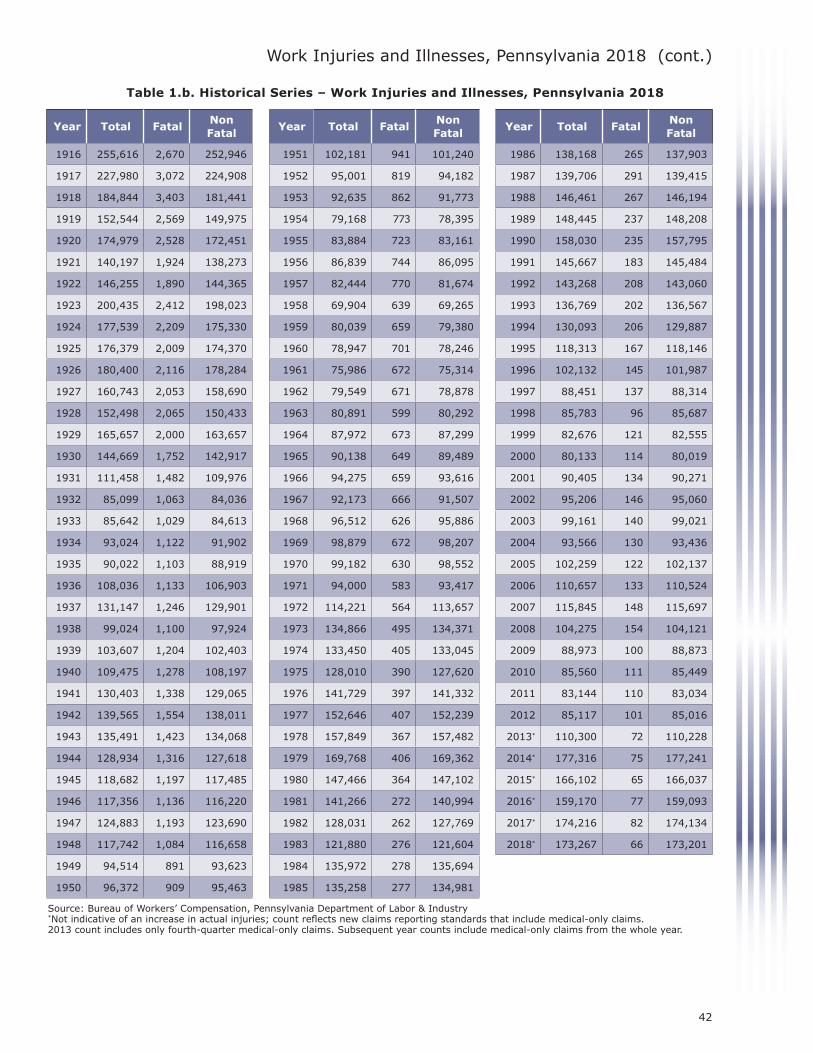
2018 ANNUAL
REPORTPennsylvania Workers’ Compensation and Workplace Safety
TOM WOLF, GOVERNORW. GERARD OLEKSIAK, SECRETARY
Work Injuries and Illnesses, Pennsylvania 2018 (cont.)
Source: Bureau of Workers’ Compensation, Pennsylvania Department of Labor & Industry*Not indicative of an increase in actual injuries; count reflects new claims reporting standards that include medical-only claims.2013 count includes only fourth-quarter medical-only claims. Subsequent year counts include medical-only claims from the whole year.
Table 1.b. Historical Series – Work Injuries and Illnesses, Pennsylvania 2018
Year Total FatalNon Fatal
Year Total FatalNon Fatal
Year Total FatalNon Fatal
1916 255,616 2,670 252,946 1951 102,181 941 101,240 1986 138,168 265 137,903
1917 227,980 3,072 224,908 1952 95,001 819 94,182 1987 139,706 291 139,415
1918 184,844 3,403 181,441 1953 92,635 862 91,773 1988 146,461 267 146,194
1919 152,544 2,569 149,975 1954 79,168 773 78,395 1989 148,445 237 148,208
1920 174,979 2,528 172,451 1955 83,884 723 83,161 1990 158,030 235 157,795
1921 140,197 1,924 138,273 1956 86,839 744 86,095 1991 145,667 183 145,484
1922 146,255 1,890 144,365 1957 82,444 770 81,674 1992 143,268 208 143,060
1923 200,435 2,412 198,023 1958 69,904 639 69,265 1993 136,769 202 136,567
1924 177,539 2,209 175,330 1959 80,039 659 79,380 1994 130,093 206 129,887
1925 176,379 2,009 174,370 1960 78,947 701 78,246 1995 118,313 167 118,146
1926 180,400 2,116 178,284 1961 75,986 672 75,314 1996 102,132 145 101,987
1927 160,743 2,053 158,690 1962 79,549 671 78,878 1997 88,451 137 88,314
1928 152,498 2,065 150,433 1963 80,891 599 80,292 1998 85,783 96 85,687
1929 165,657 2,000 163,657 1964 87,972 673 87,299 1999 82,676 121 82,555
1930 144,669 1,752 142,917 1965 90,138 649 89,489 2000 80,133 114 80,019
1931 111,458 1,482 109,976 1966 94,275 659 93,616 2001 90,405 134 90,271
1932 85,099 1,063 84,036 1967 92,173 666 91,507 2002 95,206 146 95,060
1933 85,642 1,029 84,613 1968 96,512 626 95,886 2003 99,161 140 99,021
1934 93,024 1,122 91,902 1969 98,879 672 98,207 2004 93,566 130 93,436
1935 90,022 1,103 88,919 1970 99,182 630 98,552 2005 102,259 122 102,137
1936 108,036 1,133 106,903 1971 94,000 583 93,417 2006 110,657 133 110,524
1937 131,147 1,246 129,901 1972 114,221 564 113,657 2007 115,845 148 115,697
1938 99,024 1,100 97,924 1973 134,866 495 134,371 2008 104,275 154 104,121
1939 103,607 1,204 102,403 1974 133,450 405 133,045 2009 88,973 100 88,873
1940 109,475 1,278 108,197 1975 128,010 390 127,620 2010 85,560 111 85,449
1941 130,403 1,338 129,065 1976 141,729 397 141,332 2011 83,144 110 83,034
1942 139,565 1,554 138,011 1977 152,646 407 152,239 2012 85,117 101 85,016
1943 135,491 1,423 134,068 1978 157,849 367 157,482 2013* 110,300 72 110,228
1944 128,934 1,316 127,618 1979 169,768 406 169,362 2014* 177,316 75 177,241
1945 118,682 1,197 117,485 1980 147,466 364 147,102 2015* 166,102 65 166,037
1946 117,356 1,136 116,220 1981 141,266 272 140,994 2016* 159,170 77 159,093
1947 124,883 1,193 123,690 1982 128,031 262 127,769 2017* 174,216 82 174,134
1948 117,742 1,084 116,658 1983 121,880 276 121,604 2018* 173,267 66 173,201
1949 94,514 891 93,623 1984 135,972 278 135,694
1950 96,372 909 95,463 1985 135,258 277 134,981
42
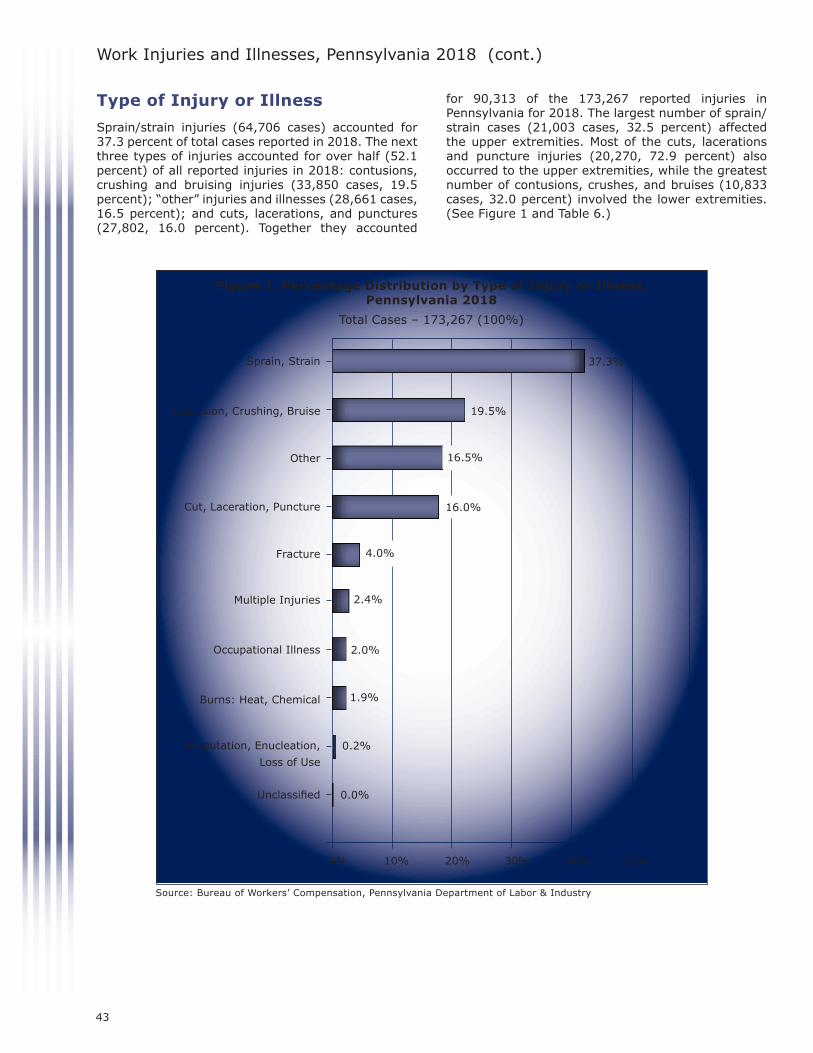
2018 ANNUALREPORT
Pennsylvania Workers’ Compensation and Workplace Safety
TOM WOLF, GOVERNORW. GERARD OLEKSIAK, SECRETARY
Type of Injury or Illness
Sprain/strain injuries (64,706 cases) accounted for 37.3 percent of total cases reported in 2018. The next three types of injuries accounted for over half (52.1 percent) of all reported injuries in 2018: contusions, crushing and bruising injuries (33,850 cases, 19.5 percent); “other” injuries and illnesses (28,661 cases, 16.5 percent); and cuts, lacerations, and punctures (27,802, 16.0 percent). Together they accounted
for 90,313 of the 173,267 reported injuries in Pennsylvania for 2018. The largest number of sprain/strain cases (21,003 cases, 32.5 percent) affected the upper extremities. Most of the cuts, lacerations and puncture injuries (20,270, 72.9 percent) also occurred to the upper extremities, while the greatest number of contusions, crushes, and bruises (10,833 cases, 32.0 percent) involved the lower extremities. (See Figure 1 and Table 6.)
Work Injuries and Illnesses, Pennsylvania 2018 (cont.)
Figure 1. Percentage Distribution by Type of Injury or Illness, Pennsylvania 2018
Total Cases – 173,267 (100%)
Sprain, Strain
Contusion, Crushing, Bruise
Other
Cut, Laceration, Puncture
Fracture
Multiple Injuries
Occupational Illness
Burns: Heat, Chemical
Amputation, Enucleation,
Loss of Use
Unclassified
0% 10% 20% 30% 40% 50%
0.2%
1.9%
2.0%
2.4%
37.3%
4.0%
16.0%
16.5%
19.5%
0.0%
Source: Bureau of Workers’ Compensation, Pennsylvania Department of Labor & Industry
43

2018 ANNUAL
REPORTPennsylvania Workers’ Compensation and Workplace Safety
TOM WOLF, GOVERNORW. GERARD OLEKSIAK, SECRETARY
Work Injuries and Illnesses, Pennsylvania 2018 (cont.)
NECK – 3,686 (2.1%)
UPPER EXTREMITIES – 65,905 (38.0%)
Shoulders – 12,402 (7.2%)Arms – 11,577 (6.7%)Wrists – 6,724 (3.9%)Hands – 10,909 (6.3%)Fingers – 21,700 (12.5%)
HEAD – 20,833 (12.0%)
Eyes – 6,103 (3.5%)Face – 3,102 (1.8%)Skull – 2,508 (1.4%)
TRUNK – 30,350 (17.5%)
Back – 21,037 (12.1%)Chest – 2,795 (1.6%)Abdomen – 3,213 (1.9%)
LOWER EXTREMITIES – 38,666 (22.3%)
Hips – 1,698 (1.0%)Legs – 5,575 (3.2%)Knees – 14,216 (8.2%)Ankles – 7,739 (4.5%)Feet – 6,500 (3.8%)Toes – 1,760 (1.0%)
MULTIPLE PARTS – 12,302 (7.1%)
BODY SYSTEMS – 1,315 (0.8%)
UNCLASSIFIED –210 (0.1%)
Figure 2. Percentage Distribution by Part of Body Affected, Pennsylvania 2018
Total Cases – 173,267 (100%)
Part of Body Affected
Injuries to the upper extremities (65,905 cases, 38.0 percent) accounted for the most cases reported in 2018 with finger injuries being the most prevalent (21,700 cases, 32.9 percent of injuries to upper extremities, 12.5 percent of all injuries). Injuries to the lower extremities (38,666 cases, 22.3 percent) were more prevalent than those injuries involving the trunk (30,350 cases, 17.5 percent). The majority of trunk injuries affected the back (21,037 cases, 69.3
percent of trunk injuries, 12.1 percent of all injuries) and were the result of sprains and strains (20,995 cases, 69.2 percent). Injuries involving the upper extremities were predominantly sprains and strains (21,003 cases, 31.9 percent) and cuts and lacerations (20,270 cases, 30.8 percent). Sprains and strains were the most frequent type of injury to the lower extremities (17,099 cases, 44.2 percent), and the neck (2,536 cases, 68.8 percent). (See Figure 2 and Table 6 for more details.)
Note: Sub-categories indicate the most common injuries in each category. Not a complete listing.Source: Bureau of Workers’ Compensation, Pennsylvania Department of Labor & Industry
44

2018 ANNUALREPORT
Pennsylvania Workers’ Compensation and Workplace Safety
TOM WOLF, GOVERNORW. GERARD OLEKSIAK, SECRETARY
Work Injuries and Illnesses, Pennsylvania 2018 (cont.)
Figure 3. Percentage Distribution by Cause of Injury Pennsylvania 2018
Total Cases – 173,267 (100%)
Overexertion
Struck by
Struck against
Bodily Reaction
Fall on Same Level
Other
Caught in, under or between
Radiation, Caustics, etc.
Highway Motor Accident
Fall from Higher Level
Contact with Temperature Extremes
Contact with Electricity
0% 10% 20% 30%
3.0%
2.6%
2.1%
0.1%
25.3%
10.0%
10.7%
11.1%
21.1%
5.8%
3.9%
4.4%
Cause of Injury
Overexertion (lifting, pulling, pushing, etc.) was the leading cause of injury during 2018. There were 43,789 overexertion injuries, which represented 25.3
percent of all injuries. Being struck by objects (falling, flying, etc.) was the next leading cause of injury, with 36,573 cases reported (21.1 percent), followed by struck against objects (19,159 cases, 11.1 percent). (See Figure 3 and Table 7.)
45

2018 ANNUAL
REPORTPennsylvania Workers’ Compensation and Workplace Safety
TOM WOLF, GOVERNORW. GERARD OLEKSIAK, SECRETARY
Work Injuries and Illnesses, Pennsylvania 2018 (cont.)
Unde
r 18
Year
s18
-20
Year
s21
-24
Year
s25
-29
Year
s30
-34
Year
s35
-39
Year
s40
-44
Year
s45
-49
Year
s50
-54
Year
s55
-59
Year
s60
-64
Year
s
65 Yea
rs a
nd O
ver
Age
Not R
epor
ted
15%
10%
5%
0%
0.8%
Source: Bureau of Workers’ Compensation, Pennsylvania Department of Labor & Industry
8.8%
12.3%
10.8%10.3%
11.0% 10.9%
7.8%
0.1%
9.0%
Figure 4. Percentage Distribution by Age Group, Pennsylvania 2018
Total Cases – 173,267 (100%)
4.4%
9.5%
Age of Injured Worker
Workers in the 25-29 age group sustained the greatest number of injuries in 2018. This age group had 21,270 cases, which represented 12.3 percent of the total reported. The median age of all injured
workers in 2018 was 41.9 years. By industry, the median age of injured workers ranged from 32.0 in Leisure & Hospitality to 46.9 in Financial Activities. The largest number of fatalities (9 each) was reported in both the 55-59 and the 60-64 age groups. (See Figure 4 and Tables 8 & 9.)
4.4%
46

2018 ANNUALREPORT
Pennsylvania Workers’ Compensation and Workplace Safety
TOM WOLF, GOVERNORW. GERARD OLEKSIAK, SECRETARY
Figure 5. Age by Gender, Pennsylvania 2018
Total Male Female
25,000
20,000
15,000
10,000
5,000
0
25-29 Years
50-54 Years
55-59 Years
21,270
19,04518,910
1,500 1,486 1,501
Gender Not Reported
9,767 9,598
8,4067,811
11,364
Work Injuries and Illnesses, Pennsylvania 2018 (cont.)
Source: Bureau of Workers’ Compensation, Pennsylvania Department of Labor & Industry
Gender of Injured Worker
Of the 173,267 injury and illness cases reported in 2018, 160,341 cases reported the gender of the injured worker. From the cases that reported gender, 57.1 percent of injured workers were male.
Of the 66 fatality cases reported in 2018, 60 were male, 5 were female, and 1 did not disclose the gender. The median age of injured male workers was 41.3, while the median age of injured female workers was 42.4. (See Figure 5 and Table 9.)
7,792
47
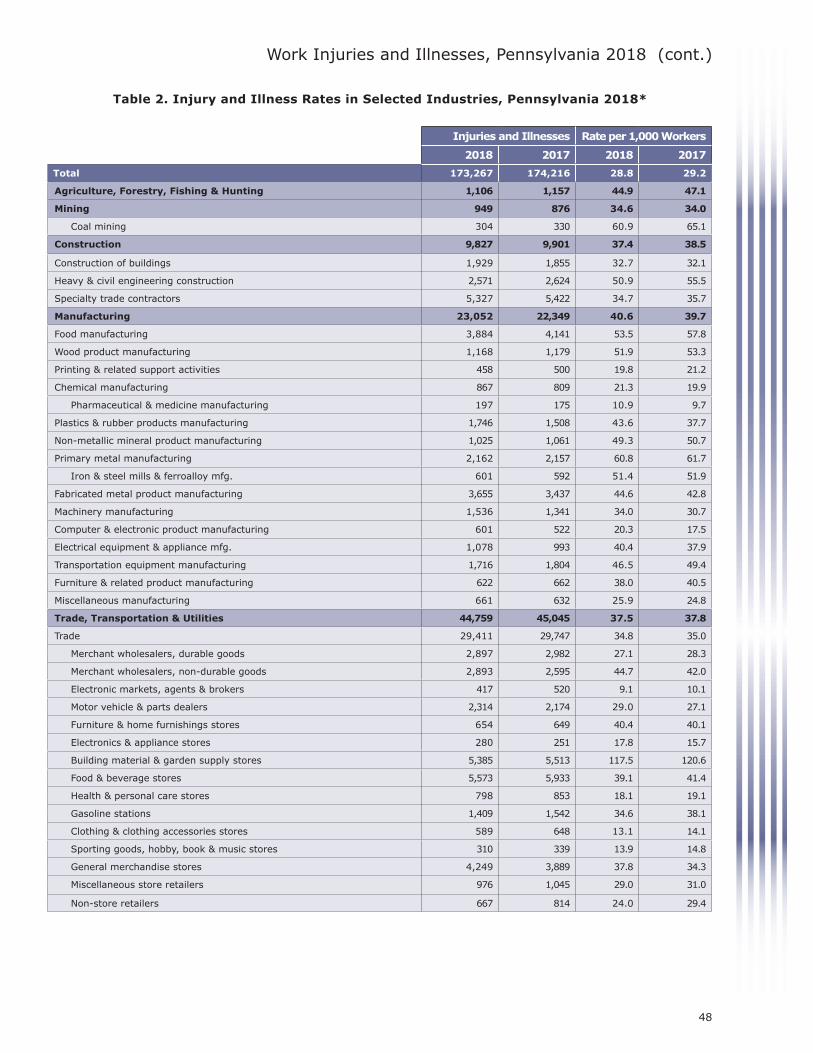
2018 ANNUAL
REPORTPennsylvania Workers’ Compensation and Workplace Safety
TOM WOLF, GOVERNORW. GERARD OLEKSIAK, SECRETARY
Work Injuries and Illnesses, Pennsylvania 2018 (cont.)
Table 2. Injury and Illness Rates in Selected Industries, Pennsylvania 2018*
Injuries and Illnesses Rate per 1,000 Workers
2018 2017 2018 2017
Total 173,267 174,216 28.8 29.2
Agriculture, Forestry, Fishing & Hunting 1,106 1,157 44.9 47.1
Mining 949 876 34.6 34.0
Coal mining 304 330 60.9 65.1
Construction 9,827 9,901 37.4 38.5
Construction of buildings 1,929 1,855 32.7 32.1
Heavy & civil engineering construction 2,571 2,624 50.9 55.5
Specialty trade contractors 5,327 5,422 34.7 35.7
Manufacturing 23,052 22,349 40.6 39.7
Food manufacturing 3,884 4,141 53.5 57.8
Wood product manufacturing 1,168 1,179 51.9 53.3
Printing & related support activities 458 500 19.8 21.2
Chemical manufacturing 867 809 21.3 19.9
Pharmaceutical & medicine manufacturing 197 175 10.9 9.7
Plastics & rubber products manufacturing 1,746 1,508 43.6 37.7
Non-metallic mineral product manufacturing 1,025 1,061 49.3 50.7
Primary metal manufacturing 2,162 2,157 60.8 61.7
Iron & steel mills & ferroalloy mfg. 601 592 51.4 51.9
Fabricated metal product manufacturing 3,655 3,437 44.6 42.8
Machinery manufacturing 1,536 1,341 34.0 30.7
Computer & electronic product manufacturing 601 522 20.3 17.5
Electrical equipment & appliance mfg. 1,078 993 40.4 37.9
Transportation equipment manufacturing 1,716 1,804 46.5 49.4
Furniture & related product manufacturing 622 662 38.0 40.5
Miscellaneous manufacturing 661 632 25.9 24.8
Trade, Transportation & Utilities 44,759 45,045 37.5 37.8
Trade 29,411 29,747 34.8 35.0
Merchant wholesalers, durable goods 2,897 2,982 27.1 28.3
Merchant wholesalers, non-durable goods 2,893 2,595 44.7 42.0
Electronic markets, agents & brokers 417 520 9.1 10.1
Motor vehicle & parts dealers 2,314 2,174 29.0 27.1
Furniture & home furnishings stores 654 649 40.4 40.1
Electronics & appliance stores 280 251 17.8 15.7
Building material & garden supply stores 5,385 5,513 117.5 120.6
Food & beverage stores 5,573 5,933 39.1 41.4
Health & personal care stores 798 853 18.1 19.1
Gasoline stations 1,409 1,542 34.6 38.1
Clothing & clothing accessories stores 589 648 13.1 14.1
Sporting goods, hobby, book & music stores 310 339 13.9 14.8
General merchandise stores 4,249 3,889 37.8 34.3
Miscellaneous store retailers 976 1,045 29.0 31.0
Non-store retailers 667 814 24.0 29.4
48

2018 ANNUALREPORT
Pennsylvania Workers’ Compensation and Workplace Safety
TOM WOLF, GOVERNORW. GERARD OLEKSIAK, SECRETARY
Work Injuries and Illnesses, Pennsylvania 2018 (cont.)
Injuries and Illnesses Rate per 1,000 Workers
2018 2017 2018 2017
Transportation & Warehousing 14,275 14,142 45.6 46.0
Air transportation 1,221 1,088 93.4 85.2
Truck transportation 3,753 3,446 55.8 52.8
Transit & ground passenger transportation 1,963 1,998 38.2 39.1
Couriers & messengers 2,741 2,554 88.2 87.8
Warehousing & storage 3,760 4,247 43.4 49.8
Utilities 1,073 1,155 30.7 33.0
Information 1,468 1,485 16.6 17.1
Publishing industries, except Internet 281 283 11.9 12.6
Telecommunications 846 838 30.9 30.7
Data processing 37 41 3.6 4.0
Financial Activities 3,370 3,441 10.3 10.6
Finance & insurance 1,779 1,854 6.8 7.1
Credit intermediation & related activities 899 902 9.5 9.5
Securities, commodity contracts & investments 106 93 2.4 2.2
Insurance carriers & related activities 763 840 6.2 6.9
Real estate, rental & leasing 1,591 1,587 24.6 24.9
Real estate 892 901 20.3 20.9
Professional & Business Services 13,560 11,950 24.2 14.8
Professional & technical services 3,066 2,877 8.5 8.1
Management of companies & enterprises 276 282 2.0 2.1
Administrative & waste services 10,218 8,791 32.1 27.8
Administrative & support services 8,945 7,620 29.9 25.5
Education & Health Services 48,415 51,489 29.6 32.0
Educational services 11,841 12,762 21.1 22.8
Health care & social assistance 36,574 38,727 34.1 36.8
Ambulatory health care services 6,681 6,238 19.7 19.0
Hospitals 13,979 15,422 48.2 53.5
Nursing & residential care facilities 11,651 12,819 53.7 59.0
Social assistance 4,263 4,248 18.8 19.5
Leisure & Hospitality 11,378 11,160 19.8 19.6
Arts, entertainment, & recreation 2,759 2,481 27.5 24.9
Amusements, gambling, & recreation 1,538 1,524 21.4 21.4
Accommodation & food services 8,619 8,679 18.2 18.4
Accommodation 1,854 1,831 30.3 29.7
Food services & drinking places 6,765 6,848 16.4 16.7
Other Services 4,561 4,464 17.1 16.7
Repair & maintenance 1,551 1,459 29.4 27.9
Personal & laundry services 1,334 1,421 18.8 20.3
Membership associations & organizations 1,664 1,566 12.0 11.2
Public Administration 10,806 10,882 44.7 45.0
Unclassified 16 17 N/A N/A
*The 2018 rate per 1,000 workers is estimated using data from October 2017 through September 2018.Complete 2018 data will be available in June 2019.Source: Bureau of Workers’ Compensation, Pennsylvania Department of Labor & Industry
49
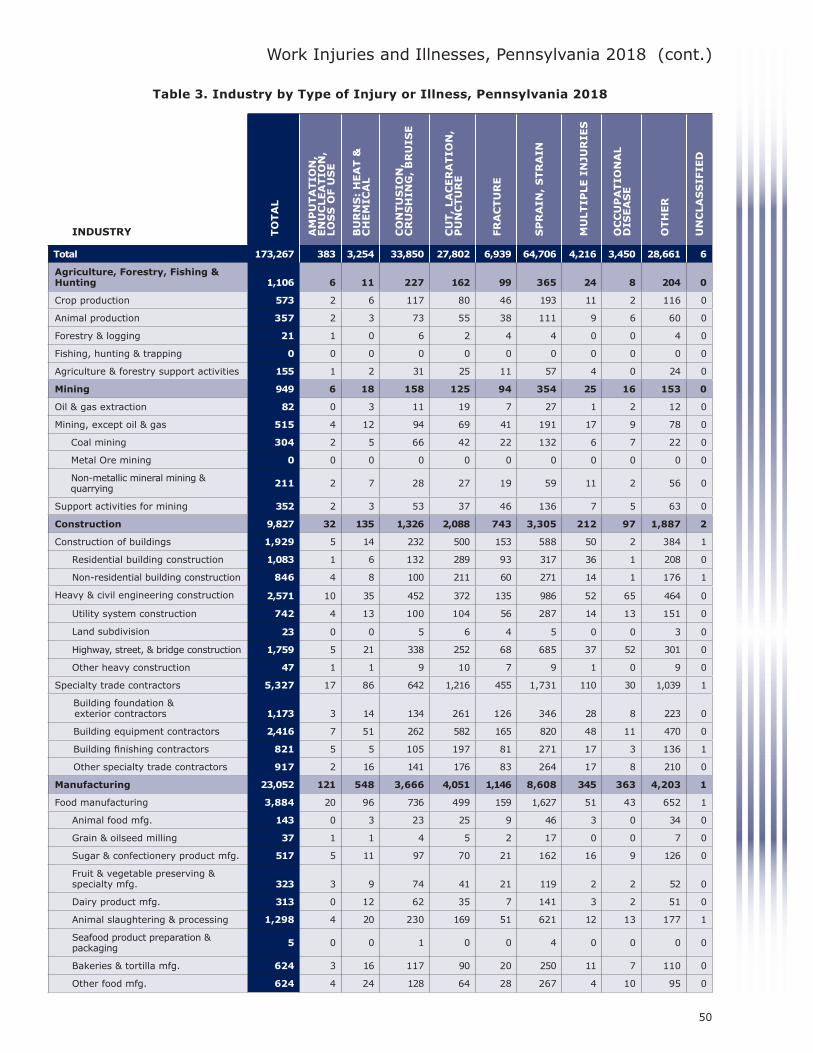
2018 ANNUAL
REPORTPennsylvania Workers’ Compensation and Workplace Safety
TOM WOLF, GOVERNORW. GERARD OLEKSIAK, SECRETARY
Work Injuries and Illnesses, Pennsylvania 2018 (cont.)
Table 3. Industry by Type of Injury or Illness, Pennsylvania 2018
Total 173,267 383 3,254 33,850 27,802 6,939 64,706 4,216 3,450 28,661 6
Agriculture, Forestry, Fishing & Hunting 1,106 6 11 227 162 99 365 24 8 204 0
Crop production 573 2 6 117 80 46 193 11 2 116 0
Animal production 357 2 3 73 55 38 111 9 6 60 0
Forestry & logging 21 1 0 6 2 4 4 0 0 4 0
Fishing, hunting & trapping 0 0 0 0 0 0 0 0 0 0 0
Agriculture & forestry support activities 155 1 2 31 25 11 57 4 0 24 0
Mining 949 6 18 158 125 94 354 25 16 153 0
Oil & gas extraction 82 0 3 11 19 7 27 1 2 12 0
Mining, except oil & gas 515 4 12 94 69 41 191 17 9 78 0
Coal mining 304 2 5 66 42 22 132 6 7 22 0
Metal Ore mining 0 0 0 0 0 0 0 0 0 0 0
Non-metallic mineral mining & quarrying 211 2 7 28 27 19 59 11 2 56 0
Support activities for mining 352 2 3 53 37 46 136 7 5 63 0
Construction 9,827 32 135 1,326 2,088 743 3,305 212 97 1,887 2
Construction of buildings 1,929 5 14 232 500 153 588 50 2 384 1
Residential building construction 1,083 1 6 132 289 93 317 36 1 208 0
Non-residential building construction 846 4 8 100 211 60 271 14 1 176 1
Heavy & civil engineering construction 2,571 10 35 452 372 135 986 52 65 464 0
Utility system construction 742 4 13 100 104 56 287 14 13 151 0
Land subdivision 23 0 0 5 6 4 5 0 0 3 0
Highway, street, & bridge construction 1,759 5 21 338 252 68 685 37 52 301 0
Other heavy construction 47 1 1 9 10 7 9 1 0 9 0
Specialty trade contractors 5,327 17 86 642 1,216 455 1,731 110 30 1,039 1
Building foundation & exterior contractors 1,173 3 14 134 261 126 346 28 8 223 0
Building equipment contractors 2,416 7 51 262 582 165 820 48 11 470 0
Building finishing contractors 821 5 5 105 197 81 271 17 3 136 1
Other specialty trade contractors 917 2 16 141 176 83 264 17 8 210 0
Manufacturing 23,052 121 548 3,666 4,051 1,146 8,608 345 363 4,203 1
Food manufacturing 3,884 20 96 736 499 159 1,627 51 43 652 1
Animal food mfg. 143 0 3 23 25 9 46 3 0 34 0
Grain & oilseed milling 37 1 1 4 5 2 17 0 0 7 0
Sugar & confectionery product mfg. 517 5 11 97 70 21 162 16 9 126 0
Fruit & vegetable preserving & specialty mfg. 323 3 9 74 41 21 119 2 2 52 0
Dairy product mfg. 313 0 12 62 35 7 141 3 2 51 0
Animal slaughtering & processing 1,298 4 20 230 169 51 621 12 13 177 1
Seafood product preparation & packaging 5 0 0 1 0 0 4 0 0 0 0
Bakeries & tortilla mfg. 624 3 16 117 90 20 250 11 7 110 0
Other food mfg. 624 4 24 128 64 28 267 4 10 95 0
TO
TA
L
AM
PU
TA
TIO
N,
EN
UC
LEA
TIO
N,
LO
SS
OF U
SE
BU
RN
S:
HEA
T &
C
HEM
ICA
L
CO
NTU
SIO
N,
CR
US
HIN
G,
BR
UIS
E
CU
T,
LA
CER
ATIO
N,
PU
NC
TU
RE
FR
AC
TU
RE
SP
RA
IN,
STR
AIN
MU
LTIP
LE I
NJU
RIE
S
OC
CU
PA
TIO
NA
L
DIS
EA
SE
INDUSTRYa OTH
ER
UN
CLA
SS
IFIE
D
50

2018 ANNUALREPORT
Pennsylvania Workers’ Compensation and Workplace Safety
TOM WOLF, GOVERNORW. GERARD OLEKSIAK, SECRETARY
Work Injuries and Illnesses, Pennsylvania 2018 (cont.)
Beverage & tobacco product mfg. 622 2 12 97 86 20 279 15 7 104 0
Beverage mfg. 590 2 11 94 78 19 268 14 5 99 0
Tobacco mfg. 32 0 1 3 8 1 11 1 2 5 0
Textile mills 162 1 3 32 34 9 46 3 3 31 0
Fiber, yarn, & thread mills 17 0 0 4 4 2 6 0 0 1 0
Fabric mills 133 1 1 28 28 7 36 2 3 27 0
Textile & fabric finishing mills 12 0 2 0 2 0 4 1 0 3 0
Textile product mills 99 1 0 12 25 4 42 2 1 12 0
Textile furnishings mills 48 0 0 4 12 1 22 2 1 6 0
Other textile product mills 51 1 0 8 13 3 20 0 0 6 0
Apparel mfg. 119 1 4 23 17 3 42 2 4 23 0
Apparel knitting mills 20 1 1 2 5 1 7 0 1 2 0
Cut & sew apparel mfg. 89 0 3 17 11 2 33 1 3 19 0
Accessories & other apparel mfg. 10 0 0 4 1 0 2 1 0 2 0
Leather & allied product mfg. 41 0 1 8 9 5 18 0 0 0 0
Leather & hide tanning & finishing 18 0 1 7 0 0 10 0 0 0 0
Footwear mfg. 20 0 0 1 8 4 7 0 0 0 0
Other leather product mfg. 3 0 0 0 1 1 1 0 0 0 0
Wood product mfg. 1,168 15 11 196 290 73 358 16 18 191 0
Sawmills & wood preservation 194 4 3 41 31 22 64 2 0 27 0
Plywood & engineered wood product mfg. 154 2 2 21 37 6 46 3 10 27 0
Other wood product mfg. 820 9 6 134 222 45 248 11 8 137 0
Paper mfg. 696 3 12 109 123 37 288 4 5 115 0
Pulp, paper, & paperboard mills 65 0 7 5 5 9 23 0 1 15 0
Converted paper product mfg. 631 3 5 104 118 28 265 4 4 100 0
Printing & related support activities 458 4 4 84 74 20 184 5 8 75 0
Petroleum & coal products mfg. 134 0 12 18 14 5 51 4 3 27 0
Chemical mfg. 867 3 51 125 103 40 292 19 30 204 0
Basic chemical mfg. 156 1 10 18 21 14 56 5 4 27 0
Resin, rubber, & artificial fibers mfg. 90 0 9 10 8 5 28 1 6 23 0
Agricultural chemical mfg. 22 0 0 7 3 0 10 0 0 2 0
Pharmaceutical & medicine mfg. 197 0 2 21 25 8 70 5 8 58 0
Paint, coating, & adhesive mfg. 68 0 3 15 10 1 19 0 5 15 0
Soap, cleaning compound, & toiletry mfg. 154 1 16 25 12 6 56 4 0 34 0
Other chemical product & preparation mfg. 180 1 11 29 24 6 53 4 7 45 0
Plastics & rubber products mfg. 1,746 9 43 284 342 74 680 20 29 265 0
Plastics product mfg. 1,559 9 39 250 308 63 606 18 26 240 0
Rubber product mfg. 187 0 4 34 34 11 74 2 3 25 0
Non-metallic mineral product mfg. 1,025 3 16 172 167 67 410 15 10 165 0
Clay product & refractory mfg. 207 0 4 37 28 5 91 2 0 40 0
Glass & glass product mfg. 203 0 3 27 55 11 80 3 0 24 0
Cement & concrete product manufacturing 492 3 8 95 65 42 194 8 6 71 0
Lime & gypsum product mfg. 12 0 1 4 2 1 3 0 0 1 0
Other non-metallic mineral products 111 0 0 9 17 8 42 2 4 29 0
TO
TA
L
AM
PU
TA
TIO
N,
EN
UC
LEA
TIO
N,
LO
SS
OF U
SE
BU
RN
S:
HEA
T &
C
HEM
ICA
L
CO
NTU
SIO
N,
CR
US
HIN
G,
BR
UIS
E
CU
T,
LA
CER
ATIO
N,
PU
NC
TU
RE
FR
AC
TU
RE
SP
RA
IN,
STR
AIN
MU
LTIP
LE I
NJU
RIE
S
OC
CU
PA
TIO
NA
L
DIS
EA
SE
OTH
ER
UN
CLA
SS
IFIE
D
INDUSTRY (cont.)a(cont
51

2018 ANNUAL
REPORTPennsylvania Workers’ Compensation and Workplace Safety
TOM WOLF, GOVERNORW. GERARD OLEKSIAK, SECRETARY
Work Injuries and Illnesses, Pennsylvania 2018 (cont.)
Primary metal mfg. 2,162 7 104 325 325 134 771 27 44 425 0
Iron & steel mills & ferroalloy mfg. 601 3 26 82 77 41 231 6 23 112 0
Steel product mfg. from purchase steel 447 2 14 74 95 26 158 3 2 73 0
Alumina & aluminum production 92 0 1 20 17 12 21 3 4 14 0
Other non-ferrous metal production 273 1 8 46 47 17 91 7 1 55 0
Foundries 749 1 55 103 89 38 270 8 14 171 0
Fabricated metal product mfg. 3,655 28 80 553 804 219 1,174 36 45 716 0
Forging & stamping 601 1 11 100 111 27 218 2 18 113 0
Cutlery & hand tool mfg. 169 1 7 28 25 4 70 0 0 34 0
Architectural & structural metals mfg. 1,066 7 18 151 241 77 335 12 11 214 0
Boiler, tank, & shipping container mfg. 214 2 2 31 36 18 81 4 3 37 0
Hardware mfg. 14 1 0 2 2 1 4 0 0 4 0
Spring & wire product mfg. 161 1 6 22 36 11 59 0 0 26 0
Machine shops & threaded product mfg. 756 8 11 110 225 43 182 11 3 163 0
Coating, engraving, & heat treating metals 276 1 14 53 44 15 95 2 4 48 0
Other fabricated metal product mfg. 398 6 11 56 84 23 130 5 6 77 0
Machinery mfg. 1,536 9 27 234 313 92 495 19 20 327 0
Ag., construction, & mining machinery mfg. 435 3 13 86 64 30 133 6 3 97 0
Industrial machinery mfg. 159 1 3 25 41 9 46 3 0 31 0
Commercial & service industry machinery 41 0 0 4 12 3 12 0 1 9 0
HVAC & commercial refrigeration equipment 193 1 2 39 43 1 74 0 3 30 0
Metal working machinery mfg. 264 1 5 19 69 21 83 6 6 54 0
Turbine & power transmission equipment mfg. 125 0 1 15 16 4 57 2 1 29 0
Other general purpose machinery mfg. 319 3 3 46 68 24 90 2 6 77 0
Computer & electronic product mfg. 601 2 8 77 124 31 232 16 10 101 0
Computer & peripheral equipment mfg. 8 0 0 1 2 0 3 0 1 1 0
Communications equipment mfg. 66 0 0 8 19 1 28 1 0 9 0
Audio & video equipment mfg. 5 0 0 3 0 0 2 0 0 0 0
Semi-conductor & electronic component mfg. 177 1 3 16 36 10 70 3 3 35 0
Electronic instrument manufacturing 341 1 5 49 67 19 126 12 6 56 0
Magnetic media manufacturing & reproducing 4 0 0 0 0 1 3 0 0 0 0
Electrical equipment & appliance mfg. 1,078 5 26 127 141 47 443 49 16 224 0
Electric lighting equipment mfg. 30 0 1 3 4 1 11 1 1 8 0
Household appliance mfg. 25 0 0 2 8 0 7 1 2 5 0
Electrical equipment mfg. 179 0 1 23 28 14 72 4 3 34 0
Other electrical equipment & component mfg. 844 5 24 99 101 32 353 43 10 177 0
Transportation equipment mfg. 1,716 4 24 270 303 43 725 20 35 292 0
Motor vehicle mfg. 269 0 0 46 46 2 136 0 1 38 0
Motor vehicle body & trailer mfg. 470 3 7 77 89 11 198 4 2 79 0
Motor vehicle parts mfg. 342 1 5 53 69 14 134 4 12 50 0
Aerospace product & parts mfg. 259 0 5 41 56 6 86 4 11 50 0
Railroad rolling stock mfg. 237 0 4 31 29 7 113 4 7 42 0
TO
TA
L
AM
PU
TA
TIO
N,
EN
UC
LEA
TIO
N,
LO
SS
OF U
SE
BU
RN
S:
HEA
T &
C
HEM
ICA
L
CO
NTU
SIO
N,
CR
US
HIN
G,
BR
UIS
E
CU
T,
LA
CER
ATIO
N,
PU
NC
TU
RE
FR
AC
TU
RE
SP
RA
IN,
STR
AIN
MU
LTIP
LE I
NJU
RIE
S
OC
CU
PA
TIO
NA
L
DIS
EA
SE
INDUSTRY (cont.)a(cont OTH
ER
UN
CLA
SS
IFIE
D
52

2018 ANNUALREPORT
Pennsylvania Workers’ Compensation and Workplace Safety
TOM WOLF, GOVERNORW. GERARD OLEKSIAK, SECRETARY
Ship & boat building 25 0 2 4 2 1 10 1 0 5 0
Other transportation equipment mfg. 114 0 1 18 12 2 48 3 2 28 0
Furniture & related product mfg. 622 4 6 88 144 32 224 8 15 101 0
Household & institutional furniture mfg. 347 3 4 45 64 21 132 5 12 61 0
Office furniture & fixtures mfg. 206 1 1 34 67 10 60 2 1 30 0
Other furniture related product mfg. 69 0 1 9 13 1 32 1 2 10 0
Miscellaneous mfg. 661 0 8 96 114 32 227 14 17 153 0
Medical equipment & supplies mfg. 282 0 6 37 46 10 94 6 7 76 0
Other miscellaneous mfg. 379 0 2 59 68 22 133 8 10 77 0
Trade, Transportation & Utilities 44,759 87 550 9,473 6,743 1,619 18,029 966 501 6,790 1
Trade 29,411 40 457 6,527 5,307 1,042 10,841 541 314 4,341 1
Merchant wholesalers, durable goods 2,897 9 26 482 484 198 1,084 63 17 534 0
Merchant wholesalers, non-durable goods 2,893 3 24 485 252 112 1,488 58 14 457 0
Electronic markets & agents & brokers 417 1 5 61 49 23 173 15 6 84 0
Motor vehicle & parts dealers 2,314 6 29 443 442 114 796 47 15 422 0
Furniture & home furnishings stores 654 1 7 154 102 25 269 12 2 82 0
Electronics & appliance stores 280 0 1 36 43 3 115 25 2 55 0
Building material & garden supply stores 5,385 3 19 1,690 1,101 73 1,765 32 90 612 0
Food & beverage stores 5,573 6 161 1,083 1,184 141 2,079 72 49 797 1
Health & personal care stores 798 0 8 133 147 21 257 35 15 182 0
Gasoline stations 1,409 2 99 267 287 41 495 30 30 158 0
Clothing & clothing accessories stores 589 1 7 130 102 26 194 29 5 95 0
Sporting goods, hobby, book & music stores 310 2 8 67 54 12 93 9 1 64 0
General merchandise stores 4,249 3 40 1,188 742 189 1,459 60 47 521 0
Miscellaneous store retailers 976 2 14 191 226 33 285 42 12 171 0
Non-store retailers 667 1 9 117 92 31 289 12 9 107 0
Transportation & Warehousing 14,257 46 84 2,752 1,307 533 6,760 402 162 2,229 0
Air transportation 1,221 17 11 241 61 33 551 40 58 209 0
Water transportation 3 0 0 0 0 0 2 0 0 1 0
Truck transportation 3,753 5 30 654 378 214 1,718 155 21 578 0
Transit & ground passenger transportation 1,963 4 14 501 135 64 835 47 39 324 0
Pipeline transportation 34 0 0 7 5 0 10 0 1 11 0
Scenic & sightseeing transportation 11 0 0 0 3 0 4 0 0 4 0
Support activities for transportation 789 3 10 156 91 44 328 27 10 120 0
Couriers & messengers 2,741 12 5 537 315 81 1,287 37 13 454 0
Warehousing & storage 3,760 5 14 656 319 97 2,025 96 20 528 0
Utilities 1,073 1 9 194 129 44 428 23 25 239 0
Information 1,468 2 16 209 199 53 652 37 33 267 0
Publishing industries, except Internet 281 1 3 48 28 13 113 10 4 61 0
Motion picture & sound recording industries 151 0 7 26 27 8 53 6 1 23 0
Broadcasting, except Internet 80 0 0 13 5 5 29 3 5 20 0
Internet publishing & broadcasting 0 0 0 0 0 0 0 0 0 0 0
Telecommunications 846 1 6 106 129 23 414 12 19 136 0
Data processing 37 0 0 5 1 2 15 4 1 9 0
TO
TA
L
AM
PU
TA
TIO
N,
EN
UC
LEA
TIO
N,
LO
SS
OF U
SE
BU
RN
S:
HEA
T &
C
HEM
ICA
L
CO
NTU
SIO
N,
CR
US
HIN
G,
BR
UIS
E
CU
T,
LA
CER
ATIO
N,
PU
NC
TU
RE
FR
AC
TU
RE
SP
RA
IN,
STR
AIN
MU
LTIP
LE I
NJU
RIE
S
OC
CU
PA
TIO
NA
L
DIS
EA
SE
INDUSTRY (cont.)a(cont
Work Injuries and Illnesses, Pennsylvania 2018 (cont.)
OTH
ER
UN
CLA
SS
IFIE
D
53
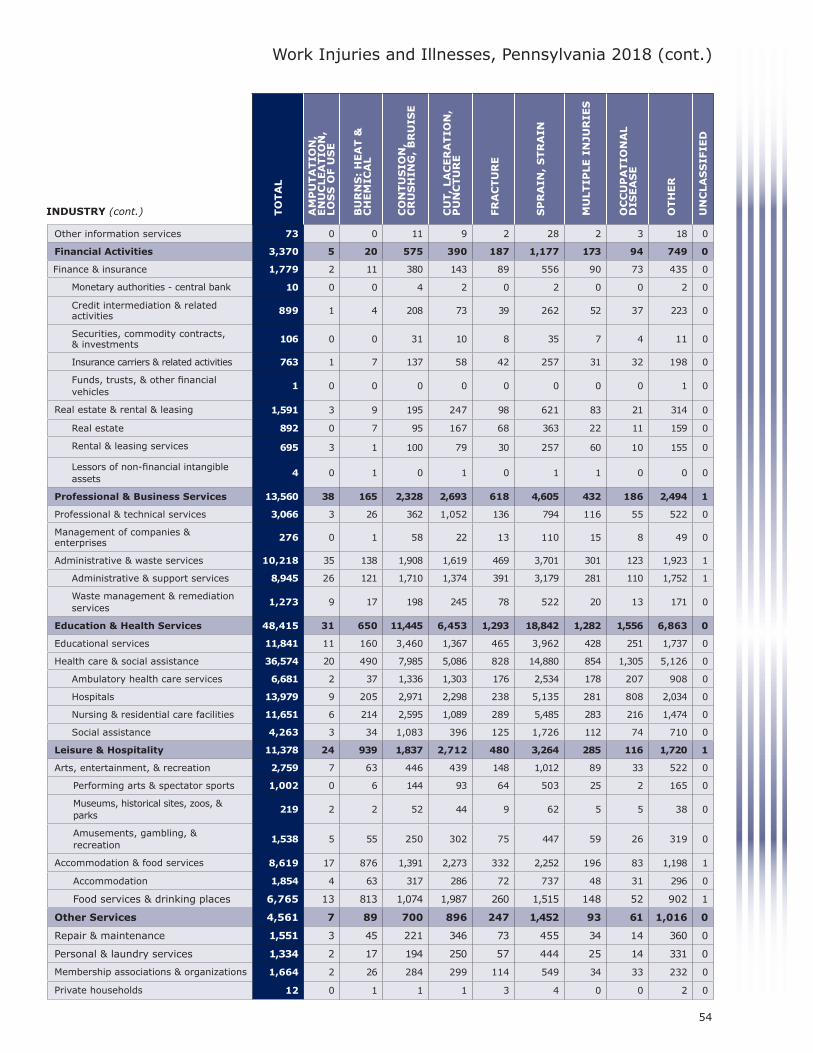
2018 ANNUAL
REPORTPennsylvania Workers’ Compensation and Workplace Safety
TOM WOLF, GOVERNORW. GERARD OLEKSIAK, SECRETARY
Work Injuries and Illnesses, Pennsylvania 2018 (cont.)
Other information services 73 0 0 11 9 2 28 2 3 18 0
Financial Activities 3,370 5 20 575 390 187 1,177 173 94 749 0
Finance & insurance 1,779 2 11 380 143 89 556 90 73 435 0
Monetary authorities - central bank 10 0 0 4 2 0 2 0 0 2 0
Credit intermediation & related activities 899 1 4 208 73 39 262 52 37 223 0
Securities, commodity contracts, & investments 106 0 0 31 10 8 35 7 4 11 0
Insurance carriers & related activities 763 1 7 137 58 42 257 31 32 198 0
Funds, trusts, & other financial vehicles
1 0 0 0 0 0 0 0 0 1 0
Real estate & rental & leasing 1,591 3 9 195 247 98 621 83 21 314 0
Real estate 892 0 7 95 167 68 363 22 11 159 0
Rental & leasing services 695 3 1 100 79 30 257 60 10 155 0
Lessors of non-financial intangible assets
4 0 1 0 1 0 1 1 0 0 0
Professional & Business Services 13,560 38 165 2,328 2,693 618 4,605 432 186 2,494 1
Professional & technical services 3,066 3 26 362 1,052 136 794 116 55 522 0
Management of companies & enterprises 276 0 1 58 22 13 110 15 8 49 0
Administrative & waste services 10,218 35 138 1,908 1,619 469 3,701 301 123 1,923 1
Administrative & support services 8,945 26 121 1,710 1,374 391 3,179 281 110 1,752 1
Waste management & remediation services
1,273 9 17 198 245 78 522 20 13 171 0
Education & Health Services 48,415 31 650 11,445 6,453 1,293 18,842 1,282 1,556 6,863 0
Educational services 11,841 11 160 3,460 1,367 465 3,962 428 251 1,737 0
Health care & social assistance 36,574 20 490 7,985 5,086 828 14,880 854 1,305 5,126 0
Ambulatory health care services 6,681 2 37 1,336 1,303 176 2,534 178 207 908 0
Hospitals 13,979 9 205 2,971 2,298 238 5,135 281 808 2,034 0
Nursing & residential care facilities 11,651 6 214 2,595 1,089 289 5,485 283 216 1,474 0
Social assistance 4,263 3 34 1,083 396 125 1,726 112 74 710 0
Leisure & Hospitality 11,378 24 939 1,837 2,712 480 3,264 285 116 1,720 1
Arts, entertainment, & recreation 2,759 7 63 446 439 148 1,012 89 33 522 0
Performing arts & spectator sports 1,002 0 6 144 93 64 503 25 2 165 0
Museums, historical sites, zoos, & parks
219 2 2 52 44 9 62 5 5 38 0
Amusements, gambling, & recreation
1,538 5 55 250 302 75 447 59 26 319 0
Accommodation & food services 8,619 17 876 1,391 2,273 332 2,252 196 83 1,198 1
Accommodation 1,854 4 63 317 286 72 737 48 31 296 0
Food services & drinking places 6,765 13 813 1,074 1,987 260 1,515 148 52 902 1
Other Services 4,561 7 89 700 896 247 1,452 93 61 1,016 0
Repair & maintenance 1,551 3 45 221 346 73 455 34 14 360 0
Personal & laundry services 1,334 2 17 194 250 57 444 25 14 331 0
Membership associations & organizations 1,664 2 26 284 299 114 549 34 33 232 0
Private households 12 0 1 1 1 3 4 0 0 2 0
TO
TA
L
AM
PU
TA
TIO
N,
EN
UC
LEA
TIO
N,
LO
SS
OF U
SE
BU
RN
S:
HEA
T &
C
HEM
ICA
L
CO
NTU
SIO
N,
CR
US
HIN
G,
BR
UIS
E
CU
T,
LA
CER
ATIO
N,
PU
NC
TU
RE
FR
AC
TU
RE
SP
RA
IN,
STR
AIN
MU
LTIP
LE I
NJU
RIE
S
OC
CU
PA
TIO
NA
L
DIS
EA
SE
OTH
ER
INDUSTRY (cont.)a(cont UN
CLA
SS
IFIE
D
54

2018 ANNUALREPORT
Pennsylvania Workers’ Compensation and Workplace Safety
TOM WOLF, GOVERNORW. GERARD OLEKSIAK, SECRETARY
Table 4. Industry by Part of Body Affected, Pennsylvania 2018
Total 173,267 20,833 3,686 65,905 30,350 38,666 12,302 1,315 210
Agriculture, Forestry, Fishing & Hunting 1,106 144 19 413 198 272 53 6 1
Crop production 573 79 9 183 124 154 23 0 1
Animal production 357 42 6 161 49 77 20 2 0
Forestry & logging 21 0 0 8 1 8 3 1 0
Fishing, hunting & trapping 0 0 0 0 0 0 0 0 0
Agriculture & forestry support activities 155 23 4 61 24 33 7 3 0
Mining 949 113 24 327 192 231 50 12 0
Oil & gas extraction 82 7 4 27 16 23 4 1 0
Mining, except oil & gas 515 62 16 174 108 125 24 6 0
Coal mining 304 33 7 114 70 72 8 0 0
Metal ore mining 0 0 0 0 0 0 0 0 0
Non-metallic mineral mining & quarrying 211 29 9 60 38 53 16 6 0
Support activities for mining 352 44 4 126 68 83 22 5 0
Construction 9,827 1,201 215 3,683 1,713 2,412 536 57 10
Construction of buildings 1,929 226 32 759 307 489 112 3 1
Residential building construction 1,083 129 14 425 175 264 74 2 0
Non-residential building construction 846 97 18 334 132 225 38 1 1
Heavy & civil engineering construction 2,571 289 69 884 490 656 152 27 4
Utility system construction 742 86 14 245 142 208 36 10 1
Land subdivision 23 3 0 8 2 7 3 0 0
TO
TA
L
HEA
D
NEC
K
UP
PER
EX
TR
EM
ITIE
S
TR
UN
K
INDUSTRYa
Source: Bureau of Workers’ Compensation, Pennsylvania Department of Labor & Industry
Public Administration 10,806 24 113 1,903 1,288 358 4,046 341 419 2,314 0
Executive, legislative & general government 4,413 14 38 764 537 177 1,709 148 174 852 0
Justice, public order, & safety activities 5,117 7 69 936 520 149 1,851 171 186 1,228 0
Administration of human resource programs 340 0 0 87 21 7 120 5 28 72 0
Administration of environmental programs 441 3 2 50 136 14 141 8 13 74 0
Community & housing program administration 293 0 3 41 42 7 133 4 12 51 0
Administration of economic programs 202 0 1 25 32 4 92 5 6 37 0
Space research & technology 0 0 0 0 0 0 0 0 0 0 0
National security & international affairs 0 0 0 0 1 0 0 0 0 0 0
Unclassified 16 0 0 3 2 2 7 1 0 1 0
TO
TA
L
AM
PU
TA
TIO
N,
EN
UC
LEA
TIO
N,
LO
SS
OF U
SE
BU
RN
S:
HEA
T &
C
HEM
ICA
L
CO
NTU
SIO
N,
CR
US
HIN
G,
BR
UIS
E
CU
T,
LA
CER
ATIO
N,
PU
NC
TU
RE
FR
AC
TU
RE
SP
RA
IN,
STR
AIN
MU
LTIP
LE I
NJU
RIE
S
OC
CU
PA
TIO
NA
L
DIS
EA
SE
OTH
ER
INDUSTRY (cont.)a(cont UN
CLA
SS
IFIE
D
Work Injuries and Illnesses, Pennsylvania 2018 (cont.)
UN
CLA
SS
IFIE
D
BO
DY
SY
STEM
S
MU
LTIP
LE P
AR
TS
LO
WER
EX
TR
EM
ITIE
S
55

2018 ANNUAL
REPORTPennsylvania Workers’ Compensation and Workplace Safety
TOM WOLF, GOVERNORW. GERARD OLEKSIAK, SECRETARY
Table 4. Industry by Part of Body Affected, Pennsylvania 2018
Work Injuries and Illnesses, Pennsylvania 2018 (cont.)
Highway, street, & bridge construction 1,759 197 55 613 340 428 106 17 3
Other heavy construction 47 3 0 18 6 13 7 0 0
Specialty trade contractors 5,327 686 114 2,040 916 1,267 272 27 5
Building foundation & exterior contractors 1,173 114 21 433 208 309 81 7 0
Building equipment contractors 2,416 332 59 958 424 526 106 7 4
Building finishing contractors 821 97 16 335 134 192 39 8 0
Other specialty trade contractors 917 143 18 314 150 240 46 5 1
Manufacturing 23,052 2,755 326 10,922 3,943 4,080 896 110 20
Food manufacturing 3,884 373 59 1,804 704 724 187 24 9
Animal food manufacturing 143 21 0 56 30 29 4 3 0
Grain & oilseed milling 37 1 1 18 7 5 5 0 0
Sugar & confectionery product manufacturing 517 56 13 240 76 98 27 5 2
Fruit & vegetable preserving & specialty mfg. 323 45 5 122 46 94 9 1 1
Dairy product manufacturing 313 27 4 115 65 74 24 4 0
Animal slaughtering & processing 1,298 107 15 700 244 176 48 6 2
Seafood product preparation & packaging 5 0 0 2 0 2 1 0 0
Bakeries & tortilla manufacturing 624 47 13 295 125 109 32 3 0
Other food manufacturing 624 69 8 256 111 137 37 2 4
Beverage & tobacco product manufacturing 622 68 16 213 155 128 37 4 1
Beverage manufacturing 590 66 15 199 147 126 33 3 1
Tobacco manufacturing 32 2 1 14 8 2 4 1 0
Textile mills 162 17 0 82 25 29 8 0 1
Fiber, yarn, & thread mills 17 0 0 9 4 2 2 0 0
Fabric mills 133 16 0 65 20 25 6 0 1
Textile & fabric finishing mills 12 1 0 8 1 2 0 0 0
Textile product mills 99 7 3 59 17 8 5 0 0
Textile furnishings mills 48 5 1 25 10 3 4 0 0
Other textile product mills 51 2 2 34 7 5 1 0 0
Apparel manufacturing 119 17 3 66 11 18 4 0 0
Apparel knitting mills 20 1 0 15 1 2 1 0 0
Cut & sew apparel manufacturing 89 16 3 45 10 13 2 0 0
Accessories & other apparel manufacturing 10 0 0 6 0 3 1 0 0
Leather & allied product manufacturing 41 6 0 25 6 4 0 0 0
Leather & hide tanning & finishing 18 4 0 7 6 1 0 0 0
Footwear manufacturing 20 1 0 16 0 3 0 0 0
Other leather product manufacturing 3 1 0 2 0 0 0 0 0
Wood product manufacturing 1,168 102 13 574 180 256 39 3 1
Sawmills & wood preservation 194 11 2 91 36 48 6 0 0
Plywood & engineered wood product mfg. 154 10 2 73 26 30 11 2 0
Other wood product manufacturing 820 81 9 410 118 178 22 1 1
TO
TA
L
HEA
D
NEC
K
UP
PER
EX
TR
EM
ITIE
S
TR
UN
K
LO
WER
EX
TR
EM
ITIE
S
MU
LTIP
LE P
AR
TS
BO
DY
SY
STEM
S
UN
CLA
SS
IFIE
D
INDUSTRY (cont.) a
56
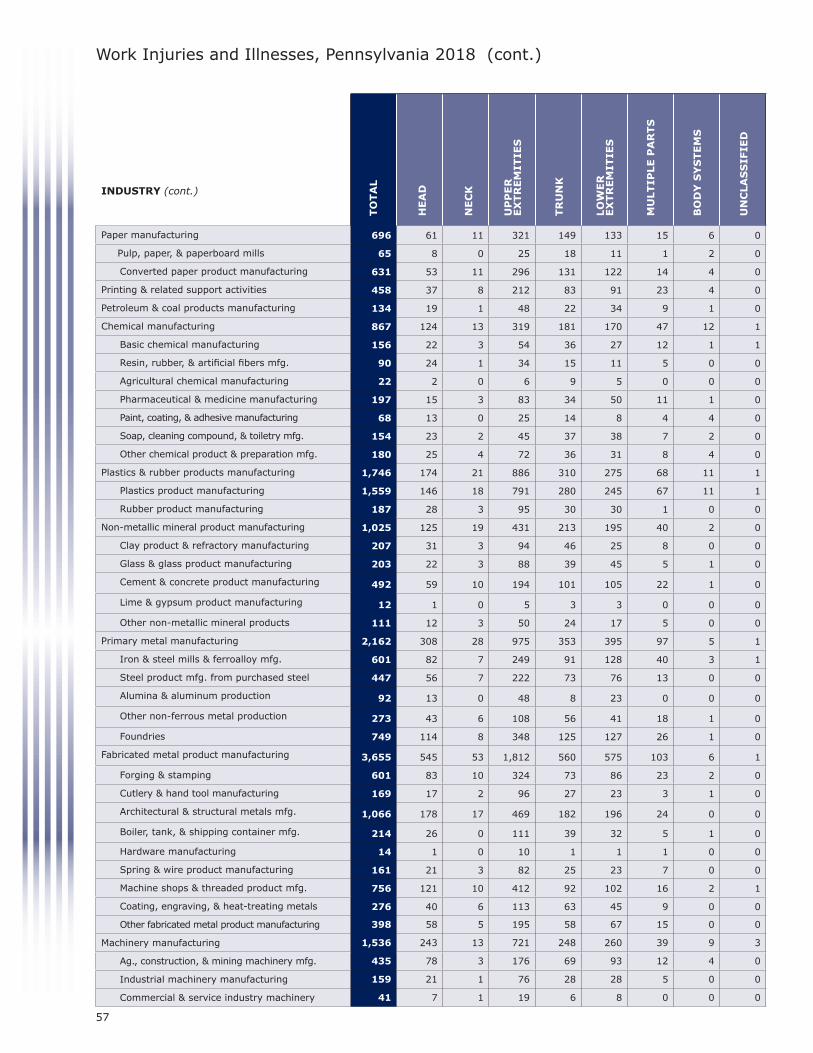
2018 ANNUALREPORT
Pennsylvania Workers’ Compensation and Workplace Safety
TOM WOLF, GOVERNORW. GERARD OLEKSIAK, SECRETARY
Work Injuries and Illnesses, Pennsylvania 2018 (cont.)
Paper manufacturing 696 61 11 321 149 133 15 6 0
Pulp, paper, & paperboard mills 65 8 0 25 18 11 1 2 0
Converted paper product manufacturing 631 53 11 296 131 122 14 4 0
Printing & related support activities 458 37 8 212 83 91 23 4 0
Petroleum & coal products manufacturing 134 19 1 48 22 34 9 1 0
Chemical manufacturing 867 124 13 319 181 170 47 12 1
Basic chemical manufacturing 156 22 3 54 36 27 12 1 1
Resin, rubber, & artificial fibers mfg. 90 24 1 34 15 11 5 0 0
Agricultural chemical manufacturing 22 2 0 6 9 5 0 0 0
Pharmaceutical & medicine manufacturing 197 15 3 83 34 50 11 1 0
Paint, coating, & adhesive manufacturing 68 13 0 25 14 8 4 4 0
Soap, cleaning compound, & toiletry mfg. 154 23 2 45 37 38 7 2 0
Other chemical product & preparation mfg. 180 25 4 72 36 31 8 4 0
Plastics & rubber products manufacturing 1,746 174 21 886 310 275 68 11 1
Plastics product manufacturing 1,559 146 18 791 280 245 67 11 1
Rubber product manufacturing 187 28 3 95 30 30 1 0 0
Non-metallic mineral product manufacturing 1,025 125 19 431 213 195 40 2 0
Clay product & refractory manufacturing 207 31 3 94 46 25 8 0 0
Glass & glass product manufacturing 203 22 3 88 39 45 5 1 0
Cement & concrete product manufacturing 492 59 10 194 101 105 22 1 0
Lime & gypsum product manufacturing 12 1 0 5 3 3 0 0 0
Other non-metallic mineral products 111 12 3 50 24 17 5 0 0
Primary metal manufacturing 2,162 308 28 975 353 395 97 5 1
Iron & steel mills & ferroalloy mfg. 601 82 7 249 91 128 40 3 1
Steel product mfg. from purchased steel 447 56 7 222 73 76 13 0 0
Alumina & aluminum production 92 13 0 48 8 23 0 0 0
Other non-ferrous metal production 273 43 6 108 56 41 18 1 0
Foundries 749 114 8 348 125 127 26 1 0
Fabricated metal product manufacturing 3,655 545 53 1,812 560 575 103 6 1
Forging & stamping 601 83 10 324 73 86 23 2 0
Cutlery & hand tool manufacturing 169 17 2 96 27 23 3 1 0
Architectural & structural metals mfg. 1,066 178 17 469 182 196 24 0 0
Boiler, tank, & shipping container mfg. 214 26 0 111 39 32 5 1 0
Hardware manufacturing 14 1 0 10 1 1 1 0 0
Spring & wire product manufacturing 161 21 3 82 25 23 7 0 0
Machine shops & threaded product mfg. 756 121 10 412 92 102 16 2 1
Coating, engraving, & heat-treating metals 276 40 6 113 63 45 9 0 0
Other fabricated metal product manufacturing 398 58 5 195 58 67 15 0 0
Machinery manufacturing 1,536 243 13 721 248 260 39 9 3
Ag., construction, & mining machinery mfg. 435 78 3 176 69 93 12 4 0
Industrial machinery manufacturing 159 21 1 76 28 28 5 0 0
Commercial & service industry machinery 41 7 1 19 6 8 0 0 0
TO
TA
L
HEA
D
NEC
K
UP
PER
EX
TR
EM
ITIE
S
TR
UN
K
LO
WER
EX
TR
EM
ITIE
S
MU
LTIP
LE P
AR
TS
BO
DY
SY
STEM
S
UN
CLA
SS
IFIE
D
INDUSTRY (cont.) a
57
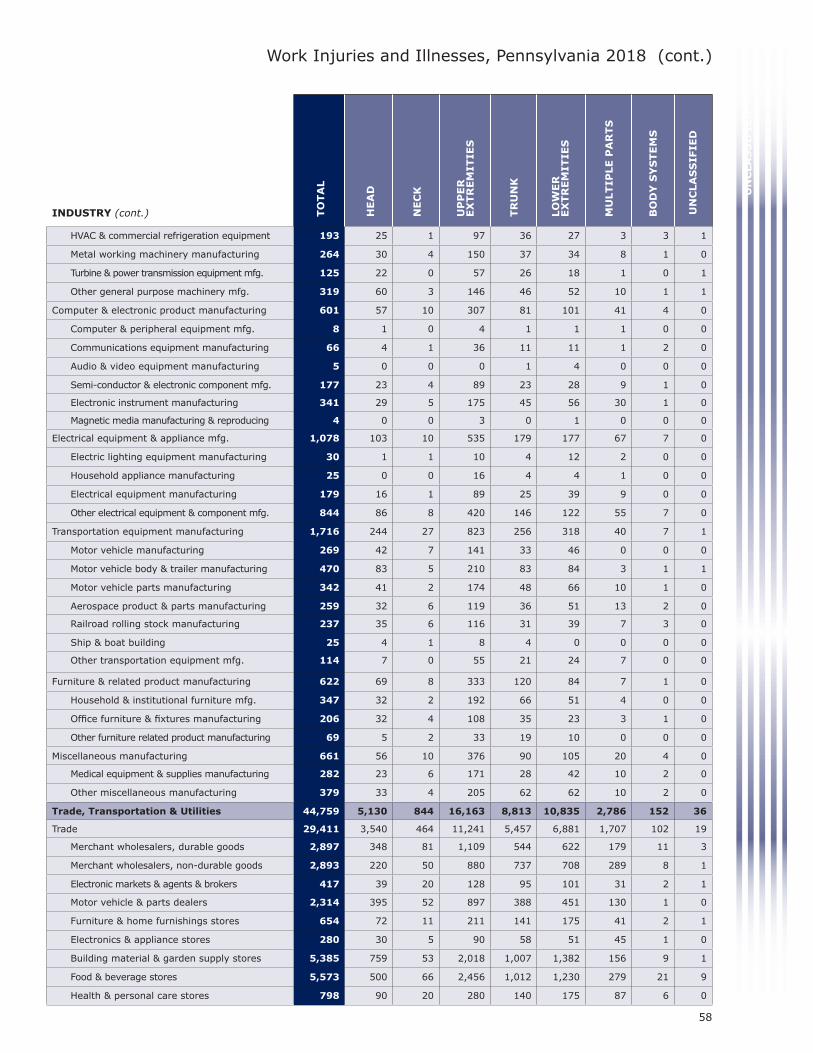
2018 ANNUAL
REPORTPennsylvania Workers’ Compensation and Workplace Safety
TOM WOLF, GOVERNORW. GERARD OLEKSIAK, SECRETARY
Work Injuries and Illnesses, Pennsylvania 2018 (cont.) Work Injuries and Illnesses, Pennsylvania 2018 (cont.)
HVAC & commercial refrigeration equipment 193 25 1 97 36 27 3 3 1
Metal working machinery manufacturing 264 30 4 150 37 34 8 1 0
Turbine & power transmission equipment mfg. 125 22 0 57 26 18 1 0 1
Other general purpose machinery mfg. 319 60 3 146 46 52 10 1 1
Computer & electronic product manufacturing 601 57 10 307 81 101 41 4 0
Computer & peripheral equipment mfg. 8 1 0 4 1 1 1 0 0
Communications equipment manufacturing 66 4 1 36 11 11 1 2 0
Audio & video equipment manufacturing 5 0 0 0 1 4 0 0 0
Semi-conductor & electronic component mfg. 177 23 4 89 23 28 9 1 0
Electronic instrument manufacturing 341 29 5 175 45 56 30 1 0
Magnetic media manufacturing & reproducing 4 0 0 3 0 1 0 0 0
Electrical equipment & appliance mfg. 1,078 103 10 535 179 177 67 7 0
Electric lighting equipment manufacturing 30 1 1 10 4 12 2 0 0
Household appliance manufacturing 25 0 0 16 4 4 1 0 0
Electrical equipment manufacturing 179 16 1 89 25 39 9 0 0
Other electrical equipment & component mfg. 844 86 8 420 146 122 55 7 0
Transportation equipment manufacturing 1,716 244 27 823 256 318 40 7 1
Motor vehicle manufacturing 269 42 7 141 33 46 0 0 0
Motor vehicle body & trailer manufacturing 470 83 5 210 83 84 3 1 1
Motor vehicle parts manufacturing 342 41 2 174 48 66 10 1 0
Aerospace product & parts manufacturing 259 32 6 119 36 51 13 2 0
Railroad rolling stock manufacturing 237 35 6 116 31 39 7 3 0
Ship & boat building 25 4 1 8 4 0 0 0 0
Other transportation equipment mfg. 114 7 0 55 21 24 7 0 0
Furniture & related product manufacturing 622 69 8 333 120 84 7 1 0
Household & institutional furniture mfg. 347 32 2 192 66 51 4 0 0
Office furniture & fixtures manufacturing 206 32 4 108 35 23 3 1 0
Other furniture related product manufacturing 69 5 2 33 19 10 0 0 0
Miscellaneous manufacturing 661 56 10 376 90 105 20 4 0
Medical equipment & supplies manufacturing 282 23 6 171 28 42 10 2 0
Other miscellaneous manufacturing 379 33 4 205 62 62 10 2 0
Trade, Transportation & Utilities 44,759 5,130 844 16,163 8,813 10,835 2,786 152 36
Trade 29,411 3,540 464 11,241 5,457 6,881 1,707 102 19
Merchant wholesalers, durable goods 2,897 348 81 1,109 544 622 179 11 3
Merchant wholesalers, non-durable goods 2,893 220 50 880 737 708 289 8 1
Electronic markets & agents & brokers 417 39 20 128 95 101 31 2 1
Motor vehicle & parts dealers 2,314 395 52 897 388 451 130 1 0
Furniture & home furnishings stores 654 72 11 211 141 175 41 2 1
Electronics & appliance stores 280 30 5 90 58 51 45 1 0
Building material & garden supply stores 5,385 759 53 2,018 1,007 1,382 156 9 1
Food & beverage stores 5,573 500 66 2,456 1,012 1,230 279 21 9
Health & personal care stores 798 90 20 280 140 175 87 6 0
TO
TA
L
HEA
D
NEC
K
UP
PER
EX
TR
EM
ITIE
S
TR
UN
K
LO
WER
EX
TR
EM
ITIE
S
MU
LTIP
LE P
AR
TS
BO
DY
SY
STEM
S
UN
CLA
SS
IFIE
D
INDUSTRY (cont.) a UN
CLA
SS
IFIE
D
58

2018 ANNUALREPORT
Pennsylvania Workers’ Compensation and Workplace Safety
TOM WOLF, GOVERNORW. GERARD OLEKSIAK, SECRETARY
Work Injuries and Illnesses, Pennsylvania 2018 (cont.)
Gasoline stations 1,409 142 20 606 213 283 140 3 2
Clothing & clothing accessories stores 589 98 7 178 75 174 52 4 1
Sporting goods, hobby, book, & music stores 310 46 5 122 44 69 21 3 0
General merchandise stores 4,249 623 50 1,598 741 1,068 151 18 0
Miscellaneous store retailers 976 121 11 420 142 214 57 11 0
Non-store retailers 667 57 13 248 120 178 49 2 0
Transportation & Warehousing 14,275 1,450 348 4,579 3,153 3,686 1,001 42 16
Air transportation 1,221 152 29 354 302 336 45 3 0
Water transportation 3 1 0 2 0 0 0 0 0
Truck transportation 3,753 358 96 1,204 824 905 346 13 7
Transit & ground passenger transportation 1,963 253 101 581 363 459 194 6 6
Pipeline transportation 34 4 1 11 9 8 1 0 0
Scenic & sightseeing transportation 11 3 0 5 1 1 1 0 0
Support activities for transportation 789 83 18 277 139 219 48 4 1
Couriers & messengers 2,741 272 47 789 599 859 167 7 1
Warehousing & storage 3,760 324 56 1,356 916 899 199 9 1
Utilities 1,073 140 32 343 203 268 78 8 1
Information 1,468 148 43 454 289 389 129 16 0
Publishing industries, except Internet 281 24 6 95 49 85 21 1 0
Motion picture & sound recording industries 151 18 2 47 26 43 12 3 0
Broadcasting, except Internet 80 7 6 13 13 22 15 4 0
Internet publishing & broadcasting 0 0 0 0 0 0 0 0 0
Telecommunications 846 82 26 260 184 220 69 5 0
Data processing 37 5 1 17 3 6 5 0 0
Other information services 73 12 2 22 14 13 7 3 0
Financial Activities 3,370 365 86 1,070 536 835 443 29 6
Finance & insurance 1,779 218 50 506 215 470 297 20 3
Monetary authorities - central bank 10 1 1 5 1 2 0 0 0
Credit intermediation & related activities 899 131 15 232 108 224 174 14 1
Securities, commodity contracts, & investments 106 11 2 34 7 40 12 0 0
Insurance carriers & related activities 763 75 31 235 99 204 111 6 2
Funds, trusts, & other financial vehicles 1 0 1 0 0 0 0 0 0
Real estate & rental & leasing 1,591 147 36 564 321 365 146 9 3
Real estate 892 76 20 333 178 205 72 5 3
Rental & leasing services 695 71 16 229 142 160 73 4 0
Lessors of non-financial intangible assets 4 0 0 2 1 0 1 0 0
Professional & Business Services 13,560 1,612 246 5,428 2,149 2,855 1,147 103 20
Professional & technical services 3,066 375 65 1,497 367 506 222 24 10
Management of companies & enterprises 276 31 14 80 37 79 34 1 0
Administrative & waste services 10,218 1,206 167 3,851 1,745 2,270 891 78 10
Administrative & support services 8,945 1,079 146 3,380 1,506 1,928 829 69 8
Waste management & remediation services 1,273 127 21 471 239 342 62 9 2
TO
TA
L
HEA
D
NEC
K
UP
PER
EX
TR
EM
ITIE
S
TR
UN
K
LO
WER
EX
TR
EM
ITIE
S
MU
LTIP
LE P
AR
TS
BO
DY
SY
STEM
S
INDUSTRY (cont.) a UN
CLA
SS
IFIE
D
59

2018 ANNUAL
REPORTPennsylvania Workers’ Compensation and Workplace Safety
TOM WOLF, GOVERNORW. GERARD OLEKSIAK, SECRETARY
Work Injuries and Illnesses, Pennsylvania 2018 (cont.)
Education & Health Services 48,415 6,171 1,341 17,192 8,878 10,332 4,015 425 61
Educational services 11,841 1,811 309 3,943 1,713 3,220 792 35 18
Health care & social assistance 36,574 4,360 1,032 13,249 7,165 7,112 3,223 390 43
Ambulatory health care services 6,681 680 184 2,500 1,235 1,328 651 96 7
Hospitals 13,979 1,829 335 5,540 2,510 2,346 1,177 230 12
Nursing & residential care facilities 11,651 1,324 363 4,044 2,574 2,371 916 48 11
Social assistance 4,263 527 150 1,165 846 1,067 479 16 13
Leisure & Hospitality 11,378 1,336 151 5,092 1,393 2,609 720 67 10
Arts, entertainment, & recreation 2,759 417 46 887 308 882 184 33 2
Performing arts & spectator sports 1,002 132 18 282 99 418 50 3 0
Museums, historical sites, zoos & parks 219 35 5 79 30 57 13 0 0
Amusements, gambling, & recreation 1,538 250 23 526 179 407 121 30 2
Accommodation & food services 8,619 919 105 4,205 1,085 1,727 536 34 8
Accommodation 1,854 182 30 690 324 480 139 6 3
Food services & drinking places 6,765 737 75 3,515 761 1,247 397 28 5
Other Services 4,561 640 94 1,712 627 1,042 413 18 15
Repair & maintenance 1,551 310 33 640 213 284 59 10 2
Personal & laundry services 1,334 122 21 524 197 254 206 2 8
Membership associations & organizations 1,664 208 40 543 217 499 146 6 5
Private households 12 0 0 5 0 5 2 0 0
Public Administration 10,860 1,218 296 3,445 1,616 2,769 1,111 320 31
Executive, legislative & general government 4,413 467 116 1,444 671 1,141 491 64 19
Justice, public order, & safety activities 5,117 599 132 1,607 679 1,293 551 246 10
Administration of human resource programs 340 37 14 110 61 85 26 5 2
Administration of environmental programs 441 56 11 124 105 121 20 4 0
Community & housing program administration 293 36 10 101 58 76 12 0 0
Administration of economic programs 202 23 13 59 42 53 11 1 0
Space research & technology 0 0 0 0 0 0 0 0 0
National security & international affairs 0 0 0 0 0 0 0 0 0
Unclassified 16 0 1 4 3 5 3 0 0
TO
TA
L
HEA
D
NEC
K
UP
PER
EX
TR
EM
ITIE
S
TR
UN
K
LO
WER
EX
TR
EM
ITIE
S
MU
LTIP
LE P
AR
TS
INDUSTRY (cont.) a
Source: Bureau of Workers’ Compensation, Pennsylvania Department of Labor & Industry
UN
CLA
SS
IFIE
D
OTH
ER
60

2018 ANNUALREPORT
Pennsylvania Workers’ Compensation and Workplace Safety
TOM WOLF, GOVERNORW. GERARD OLEKSIAK, SECRETARY
Work Injuries and Illnesses, Pennsylvania 2018 (cont.)
Table 5. Industry by Cause of Injury, Pennsylvania 2018
Total 173,267 19,159 36,573 4,562 18,474 7,608 17,268 43,789 214 3,671 6,720 5,220 10,009
Agriculture, Forestry, Fishing & Hunting 1,106 118 228 73 111 88 150 220 1 10 51 18 38
Crop production 573 63 84 52 61 27 91 122 0 6 29 11 27
Animal production 357 32 101 18 35 46 33 66 1 1 16 4 4
Forestry & logging 21 1 11 0 0 3 4 2 0 0 0 0 0
Fishing, hunting & trapping 0 0 0 0 0 0 0 0 0 0 0 0 0
Agriculture & forestry support activities 155 22 32 3 15 12 22 30 0 3 6 3 7
Mining 949 95 181 38 84 75 97 225 2 26 36 47 43
Oil & gas extraction 82 13 16 1 9 4 10 12 0 2 5 4 6
Mining, except oil & gas 515 54 107 22 31 43 52 134 2 18 16 15 21
Coal mining 304 32 83 4 13 23 34 86 2 9 5 4 9
Metal ore mining 0 0 0 0 0 0 0 0 0 0 0 0 0
Non-metallic mineral mining & quarrying 211 22 24 18 18 20 18 48 0 9 11 11 12
Support activities for mining 352 28 58 15 44 28 35 79 0 6 15 28 16
Construction 9,827 1,284 1,994 838 762 425 815 2,156 29 136 535 427 426
Construction of buildings 1,929 251 453 207 152 71 172 392 3 13 81 52 82
Residential building construction 1,083 130 264 152 93 32 85 194 2 6 41 33 51
Non-residential building construction 846 121 189 55 59 39 87 198 1 7 40 19 31
Heavy & civil engineering construction 2,571 303 474 139 205 110 231 646 10 55 141 126 131
Utility system construction 742 74 148 29 60 39 93 169 7 16 33 22 52
Land subdivision 23 1 10 1 3 0 1 4 0 0 1 2 0
Highway, street, & bridge construction 1,759 223 303 106 138 66 133 468 2 37 106 101 76
Other heavy construction 47 5 13 3 4 5 4 5 1 2 1 1 3
Specialty trade contractors 5,327 730 1,067 492 405 244 412 1,118 16 68 313 249 213
Building foundation & exterior contractors 1,173 154 249 131 85 56 95 259 1 17 52 36 38
Building equipment contractors 2,416 378 440 207 203 88 176 500 13 31 163 120 97
Building finishing contractors 821 98 168 101 58 41 55 176 2 5 47 33 37
Other specialty trade contractors 917 100 210 53 59 59 86 183 0 15 51 60 41
Manufacturing 23,052 2,860 4,028 506 1,793 1,797 1,794 7,007 46 447 1,358 206 1,210
Food manufacturing 3,884 444 538 89 418 281 382 1,268 5 85 124 45 205
Animal food mfg. 143 19 21 10 14 9 12 45 0 2 2 0 9
Grain & oilseed milling 37 2 4 3 5 3 6 12 0 1 0 0 1
Sugar & confectionery product manufacturing 517 68 61 3 54 57 59 146 1 10 17 3 38
TO
TA
L
STR
UC
K A
GA
INS
T
STR
UC
K B
Y
FA
LL F
RO
M
HIG
HER
LEV
EL
FA
LL O
N S
AM
E L
EV
EL
CA
UG
HT I
N,
UN
DER
OR
BETW
EEN
BO
DIL
Y R
EA
CTIO
N
OV
ER
EX
ER
TIO
N
CO
NTA
CT W
ITH
ELEC
TR
ICIT
Y
CO
NTA
CT W
ITH
TEM
PER
ATU
RE
EX
TR
EM
ES
RA
DIA
TIO
N,
CA
US
TIC
S,
ETC
.
INDUSTRYa
HIG
HW
AY
MO
TO
RA
CC
IDEN
T
UN
CLA
SS
IFIE
D
61

2018 ANNUAL
REPORTPennsylvania Workers’ Compensation and Workplace Safety
TOM WOLF, GOVERNORW. GERARD OLEKSIAK, SECRETARY
Work Injuries and Illnesses, Pennsylvania 2018 (cont.)
Fruit & vegetable preserving & specialty mfg. 323 39 57 11 35 32 33 80 0 9 16 2 9
Dairy product mfg. 313 36 36 11 44 14 37 92 0 16 10 6 11
Animal slaughtering & processing 1,298 127 215 22 107 60 116 512 2 14 33 12 78
Seafood product preparation & packaging 5 0 1 1 1 0 0 2 0 0 0 0 0
Bakeries & tortilla mfg. 624 71 69 12 102 62 43 196 2 18 15 12 22
Other food mfg. 624 82 74 16 56 44 76 183 0 15 31 10 37
Beverage & tobacco product mfg. 622 72 94 18 37 43 54 219 3 9 20 18 35
Beverage mfg. 590 69 92 17 34 43 49 211 3 8 17 18 29
Tobacco mfg. 32 3 2 1 3 0 5 8 0 1 3 0 6
Textile mills 162 22 35 0 10 19 19 42 0 2 6 0 7
Fiber, yarn, & thread mills 17 1 4 0 1 3 3 5 0 0 0 0 0
Fabric mills 133 20 31 0 9 15 16 30 0 2 3 0 7
Textile & fabric finishing mills 12 1 0 0 0 1 0 7 0 0 3 0 0
Textile product mills 99 9 22 1 13 10 4 32 0 1 4 1 2
Textile furnishings mills 48 5 8 0 4 5 2 20 0 0 4 0 0
Other textile product mills 51 4 14 1 9 5 2 12 0 1 0 1 2
Apparel mfg. 119 8 20 4 11 7 10 42 0 3 5 0 9
Apparel knitting mills 20 1 6 0 2 2 2 3 0 1 1 0 2
Cut & sew apparel mfg. 89 5 13 4 8 4 6 37 0 2 4 0 6
Accessories & other apparel mfg. 10 2 1 0 1 1 2 2 0 0 0 0 1
Leather & allied product mfg. 41 10 4 0 1 2 4 16 0 1 0 0 3
Leather & hide tanning & finishing 18 2 3 0 0 1 2 9 0 1 0 0 0
Footwear mfg. 20 8 0 0 1 0 1 7 0 0 0 0 3
Other leather product mfg. 3 0 1 0 0 1 1 0 0 0 0 0 0
Wood product mfg. 1,168 168 302 50 65 104 80 298 1 9 31 8 52
Sawmills & wood preservation 194 17 46 7 20 30 18 46 0 2 3 1 4
Plywood & engineered wood product mfg. 154 26 27 5 9 15 9 40 0 1 3 2 17
Other wood product mfg. 820 125 229 38 36 59 53 212 1 6 25 5 31
Paper mfg. 696 92 96 17 47 70 58 235 3 14 21 1 42
Pulp, paper, & paperboard mills 65 9 9 3 4 3 3 17 0 7 4 1 5
Converted paper product mfg. 631 83 87 14 43 67 55 218 3 7 17 0 37
Printing & related support activities 458 53 60 15 46 42 37 153 0 5 10 10 27
Petroleum & coal products mfg. 134 10 20 2 18 7 10 31 1 9 16 0 10
TO
TA
L
STR
UC
K A
GA
INS
T
STR
UC
K B
Y
FA
LL F
RO
M
HIG
HER
LEV
EL
FA
LL O
N S
AM
E L
EV
EL
CA
UG
HT I
N,
UN
DER
OR
BETW
EEN
BO
DIL
Y R
EA
CTIO
N
OV
ER
EX
ER
TIO
N
CO
NTA
CT W
ITH
ELEC
TR
ICIT
Y
CO
NTA
CT W
ITH
TEM
PER
ATU
RE
EX
TR
EM
ES
RA
DIA
TIO
N,
CA
US
TIC
S,
ETC
.
INDUSTRY (cont.)a HIG
HW
AY
MO
TO
RA
CC
IDEN
T
UN
CLA
SS
IFIE
D
62
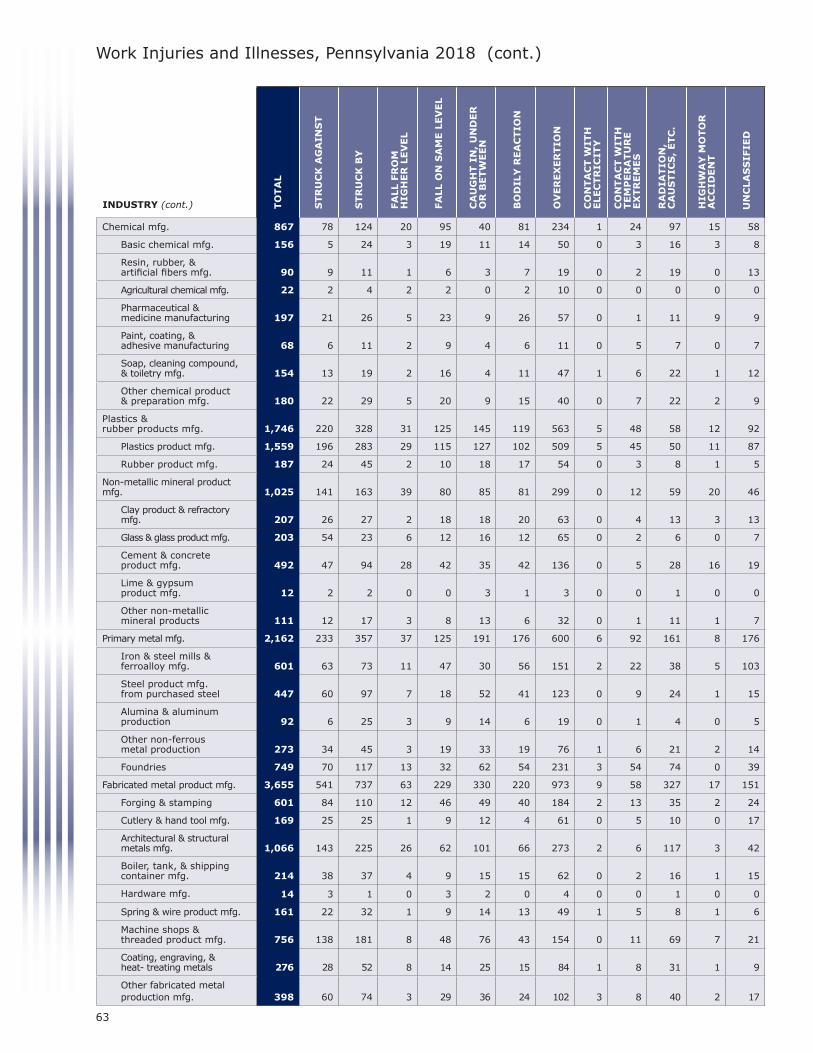
2018 ANNUALREPORT
Pennsylvania Workers’ Compensation and Workplace Safety
TOM WOLF, GOVERNORW. GERARD OLEKSIAK, SECRETARY
Work Injuries and Illnesses, Pennsylvania 2018 (cont.)
Chemical mfg. 867 78 124 20 95 40 81 234 1 24 97 15 58
Basic chemical mfg. 156 5 24 3 19 11 14 50 0 3 16 3 8
Resin, rubber, & artificial fibers mfg. 90 9 11 1 6 3 7 19 0 2 19 0 13
Agricultural chemical mfg. 22 2 4 2 2 0 2 10 0 0 0 0 0
Pharmaceutical & medicine manufacturing 197 21 26 5 23 9 26 57 0 1 11 9 9
Paint, coating, & adhesive manufacturing 68 6 11 2 9 4 6 11 0 5 7 0 7
Soap, cleaning compound, & toiletry mfg. 154 13 19 2 16 4 11 47 1 6 22 1 12
Other chemical product& preparation mfg. 180 22 29 5 20 9 15 40 0 7 22 2 9
Plastics & rubber products mfg. 1,746 220 328 31 125 145 119 563 5 48 58 12 92
Plastics product mfg. 1,559 196 283 29 115 127 102 509 5 45 50 11 87
Rubber product mfg. 187 24 45 2 10 18 17 54 0 3 8 1 5
Non-metallic mineral product mfg. 1,025 141 163 39 80 85 81 299 0 12 59 20 46
Clay product & refractory mfg. 207 26 27 2 18 18 20 63 0 4 13 3 13
Glass & glass product mfg. 203 54 23 6 12 16 12 65 0 2 6 0 7
Cement & concrete product mfg. 492 47 94 28 42 35 42 136 0 5 28 16 19
Lime & gypsum product mfg. 12 2 2 0 0 3 1 3 0 0 1 0 0
Other non-metallic mineral products 111 12 17 3 8 13 6 32 0 1 11 1 7
Primary metal mfg. 2,162 233 357 37 125 191 176 600 6 92 161 8 176
Iron & steel mills & ferroalloy mfg. 601 63 73 11 47 30 56 151 2 22 38 5 103
Steel product mfg. from purchased steel 447 60 97 7 18 52 41 123 0 9 24 1 15
Alumina & aluminum production 92 6 25 3 9 14 6 19 0 1 4 0 5
Other non-ferrous metal production 273 34 45 3 19 33 19 76 1 6 21 2 14
Foundries 749 70 117 13 32 62 54 231 3 54 74 0 39
Fabricated metal product mfg. 3,655 541 737 63 229 330 220 973 9 58 327 17 151
Forging & stamping 601 84 110 12 46 49 40 184 2 13 35 2 24
Cutlery & hand tool mfg. 169 25 25 1 9 12 4 61 0 5 10 0 17
Architectural & structural metals mfg. 1,066 143 225 26 62 101 66 273 2 6 117 3 42
Boiler, tank, & shipping container mfg. 214 38 37 4 9 15 15 62 0 2 16 1 15
Hardware mfg. 14 3 1 0 3 2 0 4 0 0 1 0 0
Spring & wire product mfg. 161 22 32 1 9 14 13 49 1 5 8 1 6
Machine shops & threaded product mfg. 756 138 181 8 48 76 43 154 0 11 69 7 21
Coating, engraving, & heat- treating metals 276 28 52 8 14 25 15 84 1 8 31 1 9
Other fabricated metal production mfg. 398 60 74 3 29 36 24 102 3 8 40 2 17
TO
TA
L
STR
UC
K A
GA
INS
T
STR
UC
K B
Y
FA
LL F
RO
M
HIG
HER
LEV
EL
FA
LL O
N S
AM
E L
EV
EL
CA
UG
HT I
N,
UN
DER
OR
BETW
EEN
BO
DIL
Y R
EA
CTIO
N
OV
ER
EX
ER
TIO
N
CO
NTA
CT W
ITH
ELEC
TR
ICIT
Y
CO
NTA
CT W
ITH
TEM
PER
ATU
RE
EX
TR
EM
ES
RA
DIA
TIO
N,
CA
US
TIC
S,
ETC
.
INDUSTRY (cont.) HIG
HW
AY
MO
TO
RA
CC
IDEN
T
UN
CLA
SS
IFIE
D
63

2018 ANNUAL
REPORTPennsylvania Workers’ Compensation and Workplace Safety
TOM WOLF, GOVERNORW. GERARD OLEKSIAK, SECRETARY
Chemical mfg. 867 78 124 20 95 40 81 234 1 24 97 15 58
Basic chemical mfg. 156 5 24 3 19 11 14 50 0 3 16 3 8
Resin, rubber, & artificial fibers mfg. 90 9 11 1 6 3 7 19 0 2 19 0 13
Agricultural chemical mfg. 22 2 4 2 2 0 2 10 0 0 0 0 0
Pharmaceutical & medicine manufacturing 197 21 26 5 23 9 26 57 0 1 11 9 9
Paint, coating, & adhesive manufacturing 68 6 11 2 9 4 6 11 0 5 7 0 7
Soap, cleaning compound, & toiletry mfg. 154 13 19 2 16 4 11 47 1 6 22 1 12
Other chemical product& preparation mfg. 180 22 29 5 20 9 15 40 0 7 22 2 9
Plastics & rubber products mfg. 1,746 220 328 31 125 145 119 563 5 48 58 12 92
Plastics product mfg. 1,559 196 283 29 115 127 102 509 5 45 50 11 87
Rubber product mfg. 187 24 45 2 10 18 17 54 0 3 8 1 5
Non-metallic mineral product mfg. 1,025 141 163 39 80 85 81 299 0 12 59 20 46
Clay product & refractory mfg. 207 26 27 2 18 18 20 63 0 4 13 3 13
Glass & glass product mfg. 203 54 23 6 12 16 12 65 0 2 6 0 7
Cement & concrete product mfg. 492 47 94 28 42 35 42 136 0 5 28 16 19
Lime & gypsum product mfg. 12 2 2 0 0 3 1 3 0 0 1 0 0
Other non-metallic mineral products 111 12 17 3 8 13 6 32 0 1 11 1 7
Primary metal mfg. 2,162 233 357 37 125 191 176 600 6 92 161 8 176
Iron & steel mills & ferroalloy mfg. 601 63 73 11 47 30 56 151 2 22 38 5 103
Steel product mfg. from purchased steel 447 60 97 7 18 52 41 123 0 9 24 1 15
Alumina & aluminum production 92 6 25 3 9 14 6 19 0 1 4 0 5
Other non-ferrous metal production 273 34 45 3 19 33 19 76 1 6 21 2 14
Foundries 749 70 117 13 32 62 54 231 3 54 74 0 39
Fabricated metal product mfg. 3,655 541 737 63 229 330 220 973 9 58 327 17 151
Forging & stamping 601 84 110 12 46 49 40 184 2 13 35 2 24
Cutlery & hand tool mfg. 169 25 25 1 9 12 4 61 0 5 10 0 17
Architectural & structural metals mfg. 1,066 143 225 26 62 101 66 273 2 6 117 3 42
Boiler, tank, & shipping container mfg. 214 38 37 4 9 15 15 62 0 2 16 1 15
Hardware mfg. 14 3 1 0 3 2 0 4 0 0 1 0 0
Spring & wire product mfg. 161 22 32 1 9 14 13 49 1 5 8 1 6
Machine shops & threaded product mfg. 756 138 181 8 48 76 43 154 0 11 69 7 21
Coating, engraving, & heat- treating metals 276 28 52 8 14 25 15 84 1 8 31 1 9
Other fabricated metal production mfg. 398 60 74 3 29 36 24 102 3 8 40 2 17
Work Injuries and Illnesses, Pennsylvania 2018 (cont.)
Machinery mfg. 1,536 203 320 30 92 136 109 409 1 27 146 10 53
Ag., construction, & mining machinery mfg. 435 41 102 9 31 47 26 110 0 10 41 4 14
Industrial machinery mfg.159 19 42 4 11 16 10 37 0 4 16 0 0
Commercial & service industry machinery 41 4 11 0 4 1 6 8 0 2 5 0 0
HVAC & commercial refrigeration equipment 193 41 25 6 12 13 12 58 0 2 13 0 11
Metal working machinery mfg. 264 40 52 5 16 23 22 68 0 4 20 2 12
Turbine & power transmission equipment mfg. 125 14 11 1 6 7 10 52 0 1 15 0 8
Other general-purpose machinery mfg. 319 44 77 5 12 29 23 76 1 4 36 4 8
Computer & electronic product mfg. 601 74 98 8 82 26 51 191 2 9 26 7 27
Computer & peripheral equipment mfg. 8 2 1 1 0 0 1 1 0 0 2 0 0
Communications equipment mfg. 66 15 8 0 10 1 3 23 0 1 2 0 3
Audio & video equipment mfg. 5 0 3 0 0 0 0 2 0 0 0 0 0
Semi-conductor & electronic component mfg. 177 17 27 3 33 11 8 56 0 3 12 2 5
Electronic instrument mfg. 341 40 59 4 38 14 37 108 2 5 10 5 19
Magnetic media mfg. & reproducing 4 0 0 0 1 0 2 1 0 0 0 0 0
Electrical equipment & appliance mfg. 1,078 92 166 17 72 87 75 445 4 12 49 9 50
Electric lighting equipment mfg. 30 4 4 0 4 2 3 8 0 0 2 0 3
Household appliance mfg. 25 4 4 1 1 3 1 7 0 0 1 0 3
Electrical equipment mfg. 179 20 34 7 28 9 11 51 1 1 6 2 9
Other electrical equipment & component mfg. 844 64 124 9 39 73 60 379 3 11 40 7 35
Transportation equipment mfg. 1,716 234 295 40 127 96 125 548 5 15 134 10 87
Motor vehicle mfg. 269 52 38 2 13 17 10 114 0 1 16 1 5
Motor vehicle body & trailer mfg. 470 59 85 11 30 38 36 137 0 2 44 2 26
Motor vehicle parts mfg. 342 42 69 9 26 20 30 100 0 2 24 1 19
Aerospace product & parts mfg. 259 51 40 7 35 8 8 64 1 5 18 3 19
Railroad rolling stock mfg. 237 21 43 6 11 7 27 82 2 2 23 2 11
Ship & boat building 25 0 3 0 2 2 4 7 0 2 4 0 1
Other transportation equipment mfg. 114 9 17 5 10 4 10 44 2 1 5 1 6
Furniture & related product mfg. 622 80 141 12 31 40 31 215 0 4 33 9 26
Household & institutional furniture mfg. 347 41 74 9 17 20 13 135 0 3 9 6 20
Office furniture & fixtures mfg. 206 34 51 2 9 17 17 47 0 1 20 3 5
Other furniture related product mfg. 69 5 16 1 5 3 1 33 0 0 4 0 1
TO
TA
L
STR
UC
K A
GA
INS
T
STR
UC
K B
Y
FA
LL F
RO
M
HIG
HER
LEV
EL
FA
LL O
N S
AM
E L
EV
EL
CA
UG
HT I
N,
UN
DER
OR
BETW
EEN
BO
DIL
Y R
EA
CTIO
N
OV
ER
EX
ER
TIO
N
CO
NTA
CT W
ITH
ELEC
TR
ICIT
Y
CO
NTA
CT W
ITH
TEM
PER
ATU
RE
EX
TR
EM
ES
RA
DIA
TIO
N,
CA
US
TIC
S,
ETC
.
INDUSTRY (cont.)a HIG
HW
AY
MO
TO
RA
CC
IDEN
T
UN
CLA
SS
IFIE
D
64
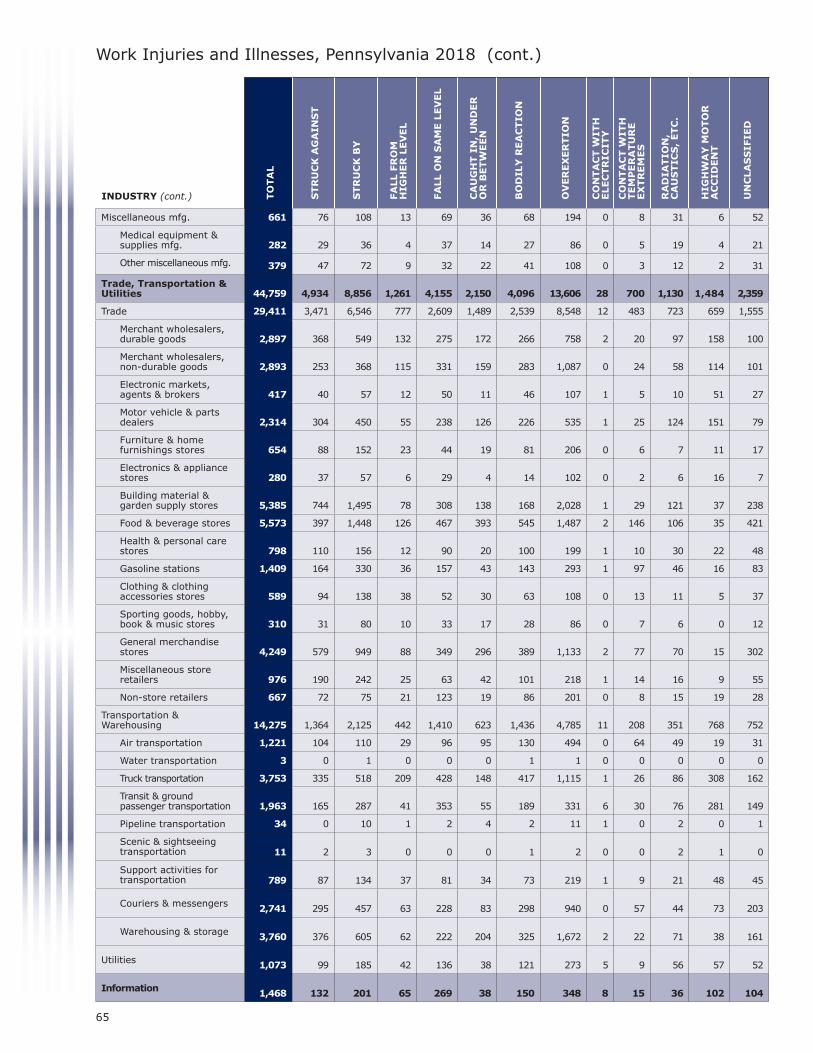
2018 ANNUALREPORT
Pennsylvania Workers’ Compensation and Workplace Safety
TOM WOLF, GOVERNORW. GERARD OLEKSIAK, SECRETARY
Work Injuries and Illnesses, Pennsylvania 2018 (cont.)
OTH
ER
Miscellaneous mfg. 661 76 108 13 69 36 68 194 0 8 31 6 52
Medical equipment & supplies mfg. 282 29 36 4 37 14 27 86 0 5 19 4 21
Other miscellaneous mfg. 379 47 72 9 32 22 41 108 0 3 12 2 31
Trade, Transportation & Utilities 44,759 4,934 8,856 1,261 4,155 2,150 4,096 13,606 28 700 1,130 1,484 2,359
Trade 29,411 3,471 6,546 777 2,609 1,489 2,539 8,548 12 483 723 659 1,555
Merchant wholesalers, durable goods 2,897 368 549 132 275 172 266 758 2 20 97 158 100
Merchant wholesalers, non-durable goods 2,893 253 368 115 331 159 283 1,087 0 24 58 114 101
Electronic markets, agents & brokers 417 40 57 12 50 11 46 107 1 5 10 51 27
Motor vehicle & parts dealers 2,314 304 450 55 238 126 226 535 1 25 124 151 79
Furniture & home furnishings stores 654 88 152 23 44 19 81 206 0 6 7 11 17
Electronics & appliance stores 280 37 57 6 29 4 14 102 0 2 6 16 7
Building material & garden supply stores 5,385 744 1,495 78 308 138 168 2,028 1 29 121 37 238
Food & beverage stores 5,573 397 1,448 126 467 393 545 1,487 2 146 106 35 421
Health & personal care stores 798 110 156 12 90 20 100 199 1 10 30 22 48
Gasoline stations 1,409 164 330 36 157 43 143 293 1 97 46 16 83
Clothing & clothing accessories stores 589 94 138 38 52 30 63 108 0 13 11 5 37
Sporting goods, hobby, book & music stores 310 31 80 10 33 17 28 86 0 7 6 0 12
General merchandise stores 4,249 579 949 88 349 296 389 1,133 2 77 70 15 302
Miscellaneous store retailers 976 190 242 25 63 42 101 218 1 14 16 9 55
Non-store retailers 667 72 75 21 123 19 86 201 0 8 15 19 28
Transportation & Warehousing 14,275 1,364 2,125 442 1,410 623 1,436 4,785 11 208 351 768 752
Air transportation 1,221 104 110 29 96 95 130 494 0 64 49 19 31
Water transportation 3 0 1 0 0 0 1 1 0 0 0 0 0
Truck transportation 3,753 335 518 209 428 148 417 1,115 1 26 86 308 162
Transit & ground passenger transportation 1,963 165 287 41 353 55 189 331 6 30 76 281 149
Pipeline transportation 34 0 10 1 2 4 2 11 1 0 2 0 1
Scenic & sightseeing transportation 11 2 3 0 0 0 1 2 0 0 2 1 0
Support activities for transportation 789 87 134 37 81 34 73 219 1 9 21 48 45
Couriers & messengers 2,741 295 457 63 228 83 298 940 0 57 44 73 203
Warehousing & storage 3,760 376 605 62 222 204 325 1,672 2 22 71 38 161
Utilities 1,073 99 185 42 136 38 121 273 5 9 56 57 52
Information 1,468 132 201 65 269 38 150 348 8 15 36 102 104
TO
TA
L
STR
UC
K A
GA
INS
T
STR
UC
K B
Y
FA
LL F
RO
M
HIG
HER
LEV
EL
FA
LL O
N S
AM
E L
EV
EL
CA
UG
HT I
N,
UN
DER
OR
BETW
EEN
BO
DIL
Y R
EA
CTIO
N
OV
ER
EX
ER
TIO
N
CO
NTA
CT W
ITH
ELEC
TR
ICIT
Y
CO
NTA
CT W
ITH
TEM
PER
ATU
RE
EX
TR
EM
ES
RA
DIA
TIO
N,
CA
US
TIC
S,
ETC
.
INDUSTRY (cont.)a HIG
HW
AY
MO
TO
RA
CC
IDEN
T
UN
CLA
SS
IFIE
D
65
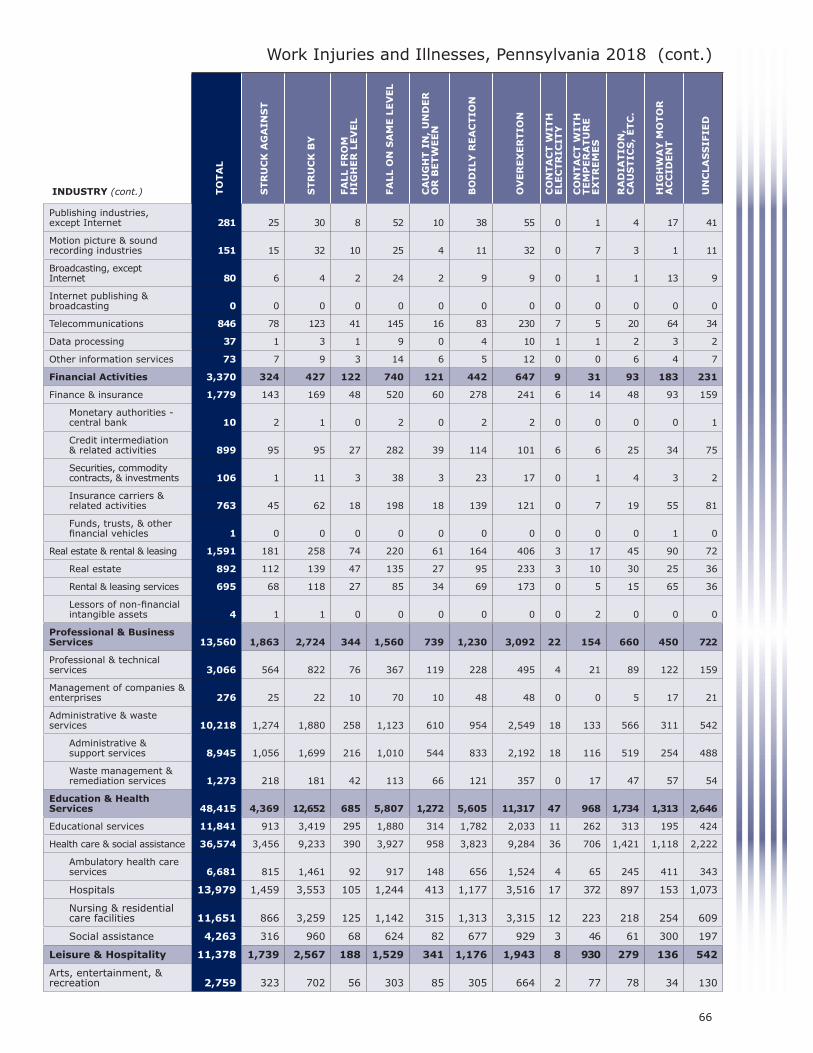
2018 ANNUAL
REPORTPennsylvania Workers’ Compensation and Workplace Safety
TOM WOLF, GOVERNORW. GERARD OLEKSIAK, SECRETARY
Work Injuries and Illnesses, Pennsylvania 2018 (cont.)
OTH
ER
Publishing industries, except Internet 281 25 30 8 52 10 38 55 0 1 4 17 41
Motion picture & sound recording industries 151 15 32 10 25 4 11 32 0 7 3 1 11
Broadcasting, except Internet 80 6 4 2 24 2 9 9 0 1 1 13 9
Internet publishing & broadcasting 0 0 0 0 0 0 0 0 0 0 0 0 0
Telecommunications 846 78 123 41 145 16 83 230 7 5 20 64 34
Data processing 37 1 3 1 9 0 4 10 1 1 2 3 2
Other information services 73 7 9 3 14 6 5 12 0 0 6 4 7
Financial Activities 3,370 324 427 122 740 121 442 647 9 31 93 183 231
Finance & insurance 1,779 143 169 48 520 60 278 241 6 14 48 93 159
Monetary authorities - central bank 10 2 1 0 2 0 2 2 0 0 0 0 1
Credit intermediation & related activities 899 95 95 27 282 39 114 101 6 6 25 34 75
Securities, commodity contracts, & investments 106 1 11 3 38 3 23 17 0 1 4 3 2
Insurance carriers & related activities 763 45 62 18 198 18 139 121 0 7 19 55 81
Funds, trusts, & other financial vehicles 1 0 0 0 0 0 0 0 0 0 0 1 0
Real estate & rental & leasing 1,591 181 258 74 220 61 164 406 3 17 45 90 72
Real estate 892 112 139 47 135 27 95 233 3 10 30 25 36
Rental & leasing services 695 68 118 27 85 34 69 173 0 5 15 65 36
Lessors of non-financial intangible assets 4 1 1 0 0 0 0 0 0 2 0 0 0
Professional & Business Services 13,560 1,863 2,724 344 1,560 739 1,230 3,092 22 154 660 450 722
Professional & technical services 3,066 564 822 76 367 119 228 495 4 21 89 122 159
Management of companies & enterprises 276 25 22 10 70 10 48 48 0 0 5 17 21
Administrative & waste services 10,218 1,274 1,880 258 1,123 610 954 2,549 18 133 566 311 542
Administrative & support services 8,945 1,056 1,699 216 1,010 544 833 2,192 18 116 519 254 488
Waste management & remediation services 1,273 218 181 42 113 66 121 357 0 17 47 57 54
Education & Health Services 48,415 4,369 12,652 685 5,807 1,272 5,605 11,317 47 968 1,734 1,313 2,646
Educational services 11,841 913 3,419 295 1,880 314 1,782 2,033 11 262 313 195 424
Health care & social assistance 36,574 3,456 9,233 390 3,927 958 3,823 9,284 36 706 1,421 1,118 2,222
Ambulatory health care services 6,681 815 1,461 92 917 148 656 1,524 4 65 245 411 343
Hospitals 13,979 1,459 3,553 105 1,244 413 1,177 3,516 17 372 897 153 1,073
Nursing & residential care facilities 11,651 866 3,259 125 1,142 315 1,313 3,315 12 223 218 254 609
Social assistance 4,263 316 960 68 624 82 677 929 3 46 61 300 197
Leisure & Hospitality 11,378 1,739 2,567 188 1,529 341 1,176 1,943 8 930 279 136 542
Arts, entertainment, &recreation 2,759 323 702 56 303 85 305 664 2 77 78 34 130
TO
TA
L
STR
UC
K A
GA
INS
T
STR
UC
K B
Y
FA
LL F
RO
M
HIG
HER
LEV
EL
FA
LL O
N S
AM
E L
EV
EL
CA
UG
HT I
N,
UN
DER
OR
BETW
EEN
BO
DIL
Y R
EA
CTIO
N
OV
ER
EX
ER
TIO
N
CO
NTA
CT W
ITH
ELEC
TR
ICIT
Y
CO
NTA
CT W
ITH
TEM
PER
ATU
RE
EX
TR
EM
ES
RA
DIA
TIO
N,
CA
US
TIC
S,
ETC
.
INDUSTRY (cont.)a HIG
HW
AY
MO
TO
RA
CC
IDEN
T
UN
CLA
SS
IFIE
D
66

2018 ANNUALREPORT
Pennsylvania Workers’ Compensation and Workplace Safety
TOM WOLF, GOVERNORW. GERARD OLEKSIAK, SECRETARY
Work Injuries and Illnesses, Pennsylvania 2018 (cont.)
Source: Bureau of Workers’ Compensation, Pennsylvania Department of Labor & Industry
Performing arts & spectator sports 1,002 74 311 19 72 22 91 350 0 7 8 8 40
Museums, historical sites, zoos, & parks 219 24 63 2 30 11 37 31 0 6 9 4 2
Amusements, gambling, & recreation 1,538 225 328 35 201 52 177 283 2 64 61 22 88
Accommodation & food services 8,619 1,416 1,865 132 1,226 256 871 1,279 6 853 201 102 412
Accommodation 1,854 241 299 37 242 67 246 449 1 57 59 18 138
Food services & drinking places 6,765 1,175 1,566 95 984 189 625 830 5 796 142 84 274
Other Services 4,561 519 1,102 126 462 184 516 849 2 93 224 290 194
Repair & maintenance 1,551 232 329 59 93 85 124 299 0 38 153 75 64
Personal & laundry services 1,334 128 322 24 123 58 122 300 0 21 23 154 59
Membership associations & organizations 1,664 159 450 43 242 41 269 245 2 33 48 61 71
Private households 12 0 1 0 4 0 1 5 0 1 0 0 0
Public Administration 10,806 921 1,609 313 1,202 378 1,196 2,374 12 161 584 562 1,494
Executive, legislative & general government 4,413 423 620 133 518 164 563 933 6 57 186 246 564
Justice, public order, & safety activities 5,117 395 718 129 509 185 520 1,151 6 96 331 248 829
Administration of human resource programs 340 25 50 14 66 11 28 65 0 2 24 19 36
Administration of environmental programs 441 24 143 17 42 9 33 89 0 2 23 17 42
Community & housing program administration 293 34 46 8 26 7 35 100 0 2 13 13 9
Administration of economic programs 202 20 32 12 41 2 17 36 0 2 7 19 14
Space research & technology 0 0 0 0 0 0 0 0 0 0 0 0 0
National security & international affairs 0 0 0 0 0 0 0 0 0 0 0 0 0
Unclassified 16 1 4 3 0 0 1 5 0 0 0 2 0
TO
TA
L
STR
UC
K A
GA
INS
T
STR
UC
K B
Y
FA
LL F
RO
M
HIG
HER
LEV
EL
FA
LL O
N S
AM
E L
EV
EL
CA
UG
HT I
N,
UN
DER
OR
BETW
EEN
BO
DIL
Y R
EA
CTIO
N
OV
ER
EX
ER
TIO
N
CO
NTA
CT W
ITH
ELEC
TR
ICIT
Y
CO
NTA
CT W
ITH
TEM
PER
ATU
RE
EX
TR
EM
ES
INDUSTRY (cont.)a RA
DIA
TIO
N,
CA
US
TIC
S,
ETC
.
HIG
HW
AY
MO
TO
RA
CC
IDEN
T
UN
CLA
SS
IFIE
D
67
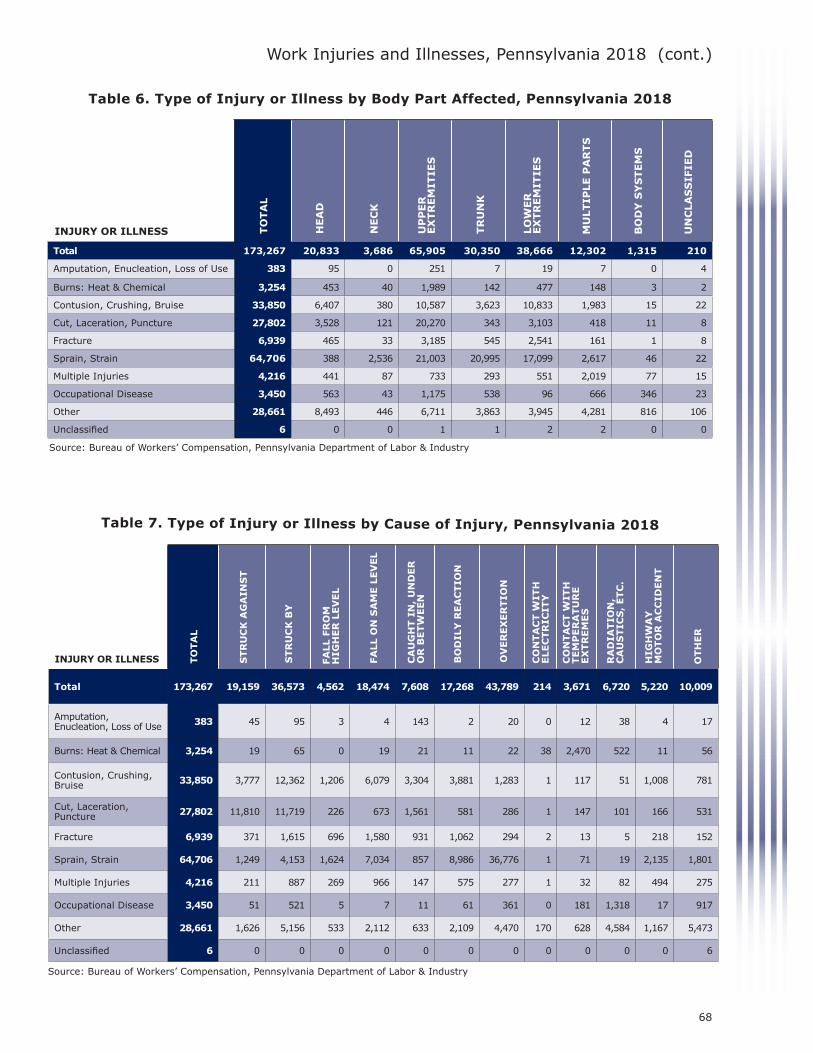
2018 ANNUAL
REPORTPennsylvania Workers’ Compensation and Workplace Safety
TOM WOLF, GOVERNORW. GERARD OLEKSIAK, SECRETARY
Work Injuries and Illnesses, Pennsylvania 2018 (cont.)
Table 6. Type of Injury or Illness by Body Part Affected, Pennsylvania 2018
Table 7. Type of Injury or Illness by Cause of Injury, Pennsylvania 2018
Source: Bureau of Workers’ Compensation, Pennsylvania Department of Labor & Industry
Source: Bureau of Workers’ Compensation, Pennsylvania Department of Labor & Industry
Total 173,267 20,833 3,686 65,905 30,350 38,666 12,302 1,315 210
Amputation, Enucleation, Loss of Use 383 95 0 251 7 19 7 0 4
Burns: Heat & Chemical 3,254 453 40 1,989 142 477 148 3 2
Contusion, Crushing, Bruise 33,850 6,407 380 10,587 3,623 10,833 1,983 15 22
Cut, Laceration, Puncture 27,802 3,528 121 20,270 343 3,103 418 11 8
Fracture 6,939 465 33 3,185 545 2,541 161 1 8
Sprain, Strain 64,706 388 2,536 21,003 20,995 17,099 2,617 46 22
Multiple Injuries 4,216 441 87 733 293 551 2,019 77 15
Occupational Disease 3,450 563 43 1,175 538 96 666 346 23
Other 28,661 8,493 446 6,711 3,863 3,945 4,281 816 106
Unclassified 6 0 0 1 1 2 2 0 0
TO
TA
L
HEA
D
NEC
K
UP
PER
EX
TR
EM
ITIE
S
TR
UN
K
LO
WER
EX
TR
EM
ITIE
S
INJURY OR ILLNESS a
Total 173,267 19,159 36,573 4,562 18,474 7,608 17,268 43,789 214 3,671 6,720 5,220 10,009
Amputation, Enucleation, Loss of Use 383 45 95 3 4 143 2 20 0 12 38 4 17
Burns: Heat & Chemical 3,254 19 65 0 19 21 11 22 38 2,470 522 11 56
Contusion, Crushing, Bruise 33,850 3,777 12,362 1,206 6,079 3,304 3,881 1,283 1 117 51 1,008 781
Cut, Laceration, Puncture 27,802 11,810 11,719 226 673 1,561 581 286 1 147 101 166 531
Fracture 6,939 371 1,615 696 1,580 931 1,062 294 2 13 5 218 152
Sprain, Strain 64,706 1,249 4,153 1,624 7,034 857 8,986 36,776 1 71 19 2,135 1,801
Multiple Injuries 4,216 211 887 269 966 147 575 277 1 32 82 494 275
Occupational Disease 3,450 51 521 5 7 11 61 361 0 181 1,318 17 917
Other 28,661 1,626 5,156 533 2,112 633 2,109 4,470 170 628 4,584 1,167 5,473
Unclassified 6 0 0 0 0 0 0 0 0 0 0 0 6
TO
TA
L
STR
UC
K A
GA
INS
T
STR
UC
K B
Y
FA
LL F
RO
M
HIG
HER
LEV
EL
FA
LL O
N S
AM
E L
EV
EL
CA
UG
HT I
N,
UN
DER
O
R B
ETW
EEN
BO
DIL
Y R
EA
CTIO
N
OV
ER
EX
ER
TIO
N
CO
NTA
CT W
ITH
ELEC
TR
ICIT
Y
INJURY OR ILLNESS CO
NTA
CT W
ITH
TEM
PER
ATU
RE
EX
TR
EM
ES
RA
DIA
TIO
N,
C
AU
STIC
S,
ETC
.
HIG
HW
AY
MO
TO
R A
CC
IDEN
T
OTH
ER
MU
LTIP
LE P
AR
TS
BO
DY
SY
STEM
S
UN
CLA
SS
IFIE
D
68

2018 ANNUALREPORT
Pennsylvania Workers’ Compensation and Workplace Safety
TOM WOLF, GOVERNORW. GERARD OLEKSIAK, SECRETARY
Source: Bureau of Workers’ Compensation, Pennsylvania Department of Labor & Industry
Source: Bureau of Workers’ Compensation, Pennsylvania Department of Labor & Industry
Table 9. Age by Gender, Pennsylvania 2018
Table 8. Age by Industry Division, Pennsylvania 2018
Total 173,267 1,106 949 9,827 23,052 44,759 1,468 3,370 13,560 48,415 11,378 4,561 10,806 16
Under 18 Years 1,350 16 1 19 32 263 17 8 37 167 637 96 57 0
18-20 Years 7,669 66 23 393 716 2,860 27 50 692 1,002 1,332 314 192 2
21-24 Years 15,195 95 80 829 1,716 4,360 58 209 1,515 3,704 1,599 447 582 1
25-29 Years 21,270 144 139 1,246 2,425 5,410 146 341 2,074 5,841 1,650 520 1,333 1
30-34 Years 18,675 133 135 1,153 2,398 4,468 153 301 1,657 5,223 1,175 443 1,434 2
35-39 Years 16,487 127 104 1,100 2,227 3,920 190 320 1,426 4,606 861 364 1,241 1
40-44 Years 15,561 123 97 957 2,146 3,716 156 305 1,269 4,513 713 367 1,199 0
45-49 Years 17,851 111 107 1,127 2,602 4,259 173 376 1,280 5,235 790 422 1,367 2
50-54 Years 19,045 118 88 1,138 2,984 4,674 175 419 1,239 5,743 744 491 1,228 4
55-59 Years 18,910 85 76 1,058 2,925 4,774 185 509 1,140 5,774 842 434 1,106 2
60-64 Years 13,513 55 77 588 2,114 3,496 125 350 743 4,375 545 345 700 0
65 Years & Over 7,622 33 21 214 750 2,542 61 171 478 2,211 468 308 364 1
Age Not Reported 119 0 1 5 17 17 2 11 10 21 22 10 3 0
Median Age 41.9 39.0 39.5 40.9 44.7 41.5 44.6 46.9 37.8 44.0 32.0 41.2 42.3 42.5
TO
TA
L
AG
RIC
ULTU
RE,
FO
RES
TR
Y,
FIS
HIN
G
& H
UN
TIN
G
MIN
ING
CO
NS
TR
UC
TIO
N
TR
AD
E,
TR
AN
SP
OR
TA
TIO
N &
U
TIL
ITIE
S
INFO
RM
ATIO
N
FIN
AN
CIA
L
AC
TIV
ITIE
S
PR
OFES
SIO
NA
L &
BU
SIN
ES
S S
ER
VIC
ES
ED
UC
ATIO
N &
HEA
LTH
SER
VIC
ES
INJURY ORILLNESS M
AN
UFA
CTU
RIN
G
LEIS
UR
E &
H
OS
PIT
ALIT
Y
TOTALS MALE FEMALE GENDER NOT REPORTED
TOTAL FATAL TOTAL FATAL TOTAL FATAL TOTAL FATAL
Total 173,267 66 91,529 60 68,812 5 12,926 1
Under Age 18 1,350 0 629 0 625 0 96 0
Age 18-20 7,669 2 4,214 2 2,984 0 471 0
Age 21-24 15,195 4 8,010 4 6,130 0 1,055 0
Age 25-29 21,270 5 11,364 4 8,406 1 1,500 0
Age 30-34 18,675 8 10,315 8 7,034 0 1,326 0
Age 35-39 16,487 4 9,080 4 6,201 0 1,206 0
Age 40-44 15,561 5 8,269 5 6,128 0 1,164 0
Age 45-49 17,851 5 9,398 5 7,084 0 1,369 0
Age 50-54 19,045 7 9,767 6 7,792 0 1,486 1
Age 55-59 18,910 9 9,598 7 7,811 2 1,501 0
Age 60-64 13,513 9 6,933 8 5,460 1 1,120 0
Age 65 & Over 7,622 8 3,897 7 3,102 1 623 0
Age Not Reported 119 0 55 0 55 0 9 0
Median Age 41.9 50.0 41.3 48.0 42.4 37.5 43.5 52.5
Work Injuries and Illnesses, Pennsylvania 2018 (cont.)
OTH
ER
SER
VIC
ES
PU
BLIC
A
DM
INIS
TR
ATIO
N
UN
CLA
SS
IFIE
D
69

2018 ANNUAL
REPORTPennsylvania Workers’ Compensation and Workplace Safety
TOM WOLF, GOVERNORW. GERARD OLEKSIAK, SECRETARY
Work Injuries and Illnesses, Pennsylvania 2018 (cont.) Work Injuries and Illnesses, Pennsylvania 2018 (cont.)
Table 10. County by Industry Division, Pennsylvania 2018
Total 173,267 1,106 949 9,827 23,052 44,759 1,468 3,370 13,560 48,415 11,378 4,561 10,806 16
Adams 728 103 0 55 128 82 1 7 13 253 37 18 31 0
Allegheny 15,597 1 13 781 1,230 3,032 541 418 754 6,174 1,030 461 1,162 0
Armstrong 453 3 31 20 37 63 2 8 9 245 6 10 19 0
Beaver 804 0 0 67 149 103 1 6 53 329 25 34 37 0
Bedford 373 5 66 23 66 36 0 3 117 28 5 8 16 0
Berks 4,519 148 5 220 1,476 905 7 43 180 1,089 93 78 275 0
Blair 1,866 3 0 66 282 726 12 13 25 538 129 33 39 0
Bradford 392 2 8 8 176 39 1 5 12 73 5 13 50 0
Bucks 4,416 7 3 389 474 679 14 61 587 1,634 278 109 180 1
Butler 1,513 5 25 123 241 232 37 5 91 566 105 44 39 0
Cambria 644 2 0 38 151 100 1 2 39 227 37 14 33 0
Cameron 18 1 0 0 10 1 0 0 0 4 0 0 2 0
Carbon 322 2 1 4 40 21 49 3 26 131 23 4 18 0
Centre 946 2 17 83 65 102 3 17 55 461 80 15 46 0
Chester 4,660 255 3 318 499 536 10 108 310 2,155 159 188 119 0
Clarion 195 1 5 9 12 16 0 1 3 125 7 7 9 0
Clearfield 548 3 2 21 111 150 0 5 14 171 18 35 18 0
Clinton 203 1 0 13 49 34 0 0 20 47 4 10 25 0
Columbia 441 4 0 19 186 69 3 4 11 54 52 6 33 0
Crawford 480 5 4 24 149 63 0 1 11 101 37 30 55 0
Cumberland 1,937 15 17 165 405 228 0 101 115 640 141 69 41 0
Dauphin 7,811 17 1 623 452 1,027 9 148 104 2,432 356 72 2,570 0
Delaware 3,338 7 1 207 317 703 3 87 212 1,239 105 105 351 1
Elk 298 2 0 7 141 22 0 0 6 106 1 3 10 0
Erie 3,044 30 3 109 768 262 8 187 181 1,139 135 66 156 0
Fayette 729 0 2 26 149 132 2 4 23 245 35 20 90 1
Forest 179 2 0 1 0 1 0 0 81 86 4 0 4 0
Franklin 786 13 3 40 134 165 0 7 58 149 137 33 47 0
Fulton 363 2 15 11 227 56 0 0 43 7 0 0 2 0
Greene 146 0 6 22 5 18 21 2 8 35 1 5 23 0
Huntingdon 144 5 3 3 21 11 1 4 23 52 6 1 14 0
Indiana 409 5 40 41 34 57 15 15 16 114 32 13 27 0
Jefferson 476 0 5 12 184 29 1 1 4 83 130 9 18 0
Juniata 45 4 0 7 4 11 0 1 6 6 0 2 4 0
Lackawanna 1,852 2 0 58 269 397 12 29 103 724 77 61 120 0
Lancaster 4,799 67 3 567 954 880 17 81 454 1,149 276 152 199 0
Lawrence 617 0 2 32 256 45 0 5 9 199 28 10 31 0
Lebanon 844 3 0 51 298 199 2 11 34 144 29 29 44 0
Lehigh 4,037 9 0 149 646 1,252 4 22 353 1,025 285 113 179 0
Luzerne 2,520 0 13 109 406 617 16 11 278 707 157 95 111 0
Lycoming 888 2 7 38 347 142 0 3 20 275 22 14 18 0
TO
TA
L
AG
RIC
ULTU
RE,
FO
RES
TR
Y,
FIS
HIN
G&
HU
NTIN
G
MIN
ING
CO
NS
TR
UC
TIO
N
TR
AD
E,
TR
AN
SP
OR
TA
TIO
N &
U
TIL
ITIE
S
INFO
RM
ATIO
N
FIN
AN
CIA
L
AC
TIV
ITIE
S
PR
OFES
SIO
NA
L &
BU
SIN
ES
S S
ER
VIC
ES
ED
UC
ATIO
N &
HEA
LTH
SER
VIC
ES
OTH
ER
SER
VIC
ES
COUNTYa PU
BLIC
A
DM
INIS
TR
ATIO
N
UN
CLA
SS
IFIE
D
MA
NU
FA
CTU
RIN
G
LEIS
UR
E &
H
OS
PIT
ALIT
Y
70
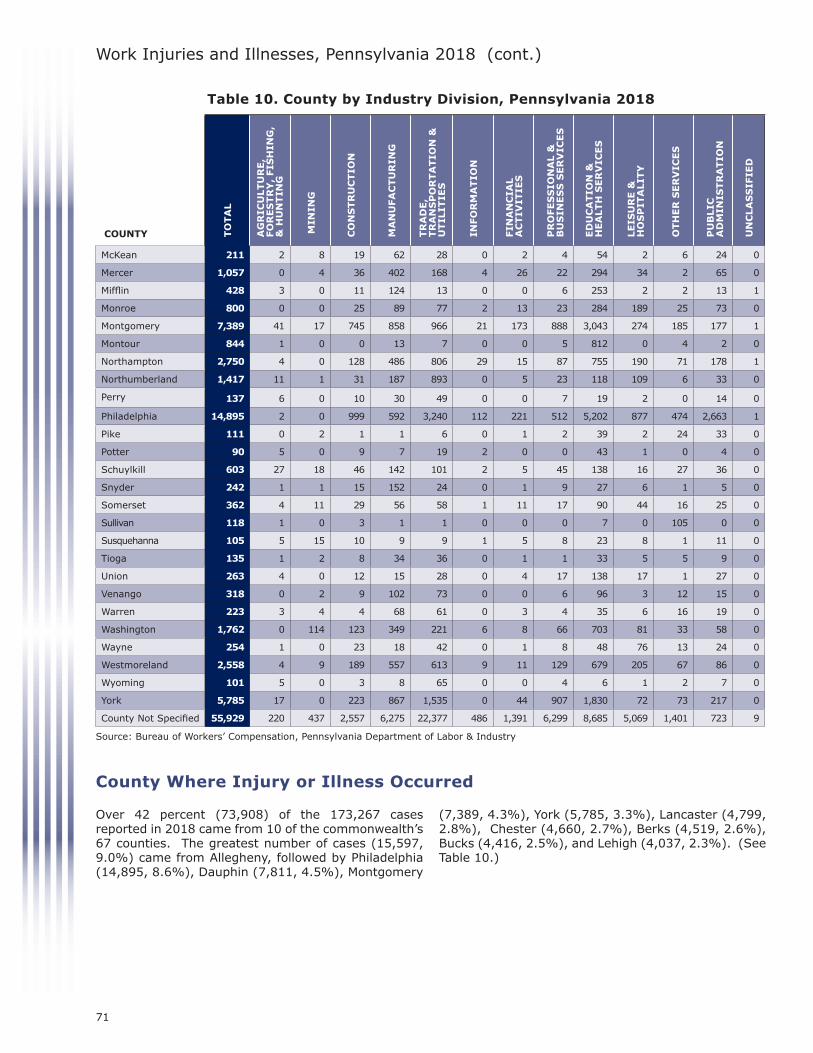
2018 ANNUALREPORT
Pennsylvania Workers’ Compensation and Workplace Safety
TOM WOLF, GOVERNORW. GERARD OLEKSIAK, SECRETARY
Work Injuries and Illnesses, Pennsylvania 2018 (cont.)
Source: Bureau of Workers’ Compensation, Pennsylvania Department of Labor & Industry
Table 10. County by Industry Division, Pennsylvania 2018
McKean 211 2 8 19 62 28 0 2 4 54 2 6 24 0
Mercer 1,057 0 4 36 402 168 4 26 22 294 34 2 65 0
Mifflin 428 3 0 11 124 13 0 0 6 253 2 2 13 1
Monroe 800 0 0 25 89 77 2 13 23 284 189 25 73 0
Montgomery 7,389 41 17 745 858 966 21 173 888 3,043 274 185 177 1
Montour 844 1 0 0 13 7 0 0 5 812 0 4 2 0
Northampton 2,750 4 0 128 486 806 29 15 87 755 190 71 178 1
Northumberland 1,417 11 1 31 187 893 0 5 23 118 109 6 33 0
Perry 137 6 0 10 30 49 0 0 7 19 2 0 14 0
Philadelphia 14,895 2 0 999 592 3,240 112 221 512 5,202 877 474 2,663 1
Pike 111 0 2 1 1 6 0 1 2 39 2 24 33 0
Potter 90 5 0 9 7 19 2 0 0 43 1 0 4 0
Schuylkill 603 27 18 46 142 101 2 5 45 138 16 27 36 0
Snyder 242 1 1 15 152 24 0 1 9 27 6 1 5 0
Somerset 362 4 11 29 56 58 1 11 17 90 44 16 25 0
Sullivan 118 1 0 3 1 1 0 0 0 7 0 105 0 0
Susquehanna 105 5 15 10 9 9 1 5 8 23 8 1 11 0
Tioga 135 1 2 8 34 36 0 1 1 33 5 5 9 0
Union 263 4 0 12 15 28 0 4 17 138 17 1 27 0
Venango 318 0 2 9 102 73 0 0 6 96 3 12 15 0
Warren 223 3 4 4 68 61 0 3 4 35 6 16 19 0
Washington 1,762 0 114 123 349 221 6 8 66 703 81 33 58 0
Wayne 254 1 0 23 18 42 0 1 8 48 76 13 24 0
Westmoreland 2,558 4 9 189 557 613 9 11 129 679 205 67 86 0
Wyoming 101 5 0 3 8 65 0 0 4 6 1 2 7 0
York 5,785 17 0 223 867 1,535 0 44 907 1,830 72 73 217 0
County Not Specified 55,929 220 437 2,557 6,275 22,377 486 1,391 6,299 8,685 5,069 1,401 723 9
TO
TA
L
AG
RIC
ULTU
RE,
FO
RES
TR
Y,
FIS
HIN
G,
& H
UN
TIN
G
MIN
ING
CO
NS
TR
UC
TIO
N
TR
AD
E,
TR
AN
SP
OR
TA
TIO
N &
U
TIL
ITIE
S
INFO
RM
ATIO
N
FIN
AN
CIA
L
AC
TIV
ITIE
S
PR
OFES
SIO
NA
L &
BU
SIN
ES
S S
ER
VIC
ES
ED
UC
ATIO
N &
HEA
LTH
SER
VIC
ES
OTH
ER
SER
VIC
ES
COUNTYa PU
BLIC
A
DM
INIS
TR
ATIO
N
MA
NU
FA
CTU
RIN
G
LEIS
UR
E &
H
OS
PIT
ALIT
Y
UN
CLA
SS
IFIE
D
County Where Injury or Illness Occurred
Over 42 percent (73,908) of the 173,267 cases reported in 2018 came from 10 of the commonwealth’s 67 counties. The greatest number of cases (15,597, 9.0%) came from Allegheny, followed by Philadelphia (14,895, 8.6%), Dauphin (7,811, 4.5%), Montgomery
(7,389, 4.3%), York (5,785, 3.3%), Lancaster (4,799, 2.8%), Chester (4,660, 2.7%), Berks (4,519, 2.6%), Bucks (4,416, 2.5%), and Lehigh (4,037, 2.3%). (See Table 10.)
71
2018 ANNUAL
REPORTPennsylvania Workers’ Compensation and Workplace Safety
TOM WOLF, GOVERNORW. GERARD OLEKSIAK, SECRETARY
Work Injuries and Illnesses, Pennsylvania 2018 (cont.)
Methodology
Injuries and illnesses are reported to the bureau by Electronic Data Interchange (EDI) or through the bureau’s website. The narrative description of the accident or exposure is coded for type of injury, part of body affected and cause of injury. These characteristics are classified according to the National Council on Compensation Insurance Coding System as it refers to work-related injuries. The nature of business is classified according to the North American Industry Classification System (NAICS). In Tables 3, 4 and 5 of this publication, the Mining, Construction and Manufacturing industries are classified at the four-digit level. All other industries are classified at the three-digit level. Tables 1a, 8 and 10 are at the supersector level. Age and gender are obtained directly from the electronic report.
The data tabulated in this report refers to the years in which the injury or illness occurred.
Glossary
North American Industry Classification System (NAICS):A classification system developed by the Office of Statistical Standards, Executive Office of the President/Office of Management and Budget, for use in classifying firms by type of activity in which they are engaged. Each firm is assigned an industry code for its major activity, which is determined by the product or group of products produced or services rendered.
Cause of Injury:Description of the event which directly resulted in the injury, i.e., struck by or against, fall, caught in, under or between, overexertion, etc.
Type of Injury:Result of the injury or illness, i.e., cut, bruise, fracture, amputation, sprain, etc.
Part of Body Affected:The part of the worker’s body directly affected by the injury or illness. Work Injury and Illness Rate:Injury and illness rates for selected industries are obtained by dividing the number of injuries or illnesses reported during the year by the estimated average preliminary employment for 12 months, times 1,000.
Age and Gender:Obtained directly from the First Report of Injury at time of injury.
Electronic Data Interchange (EDI):Process of submitting a First Report of Injury electronically.
Web:Process of submitting a First Report of Injury via the Internet.
72
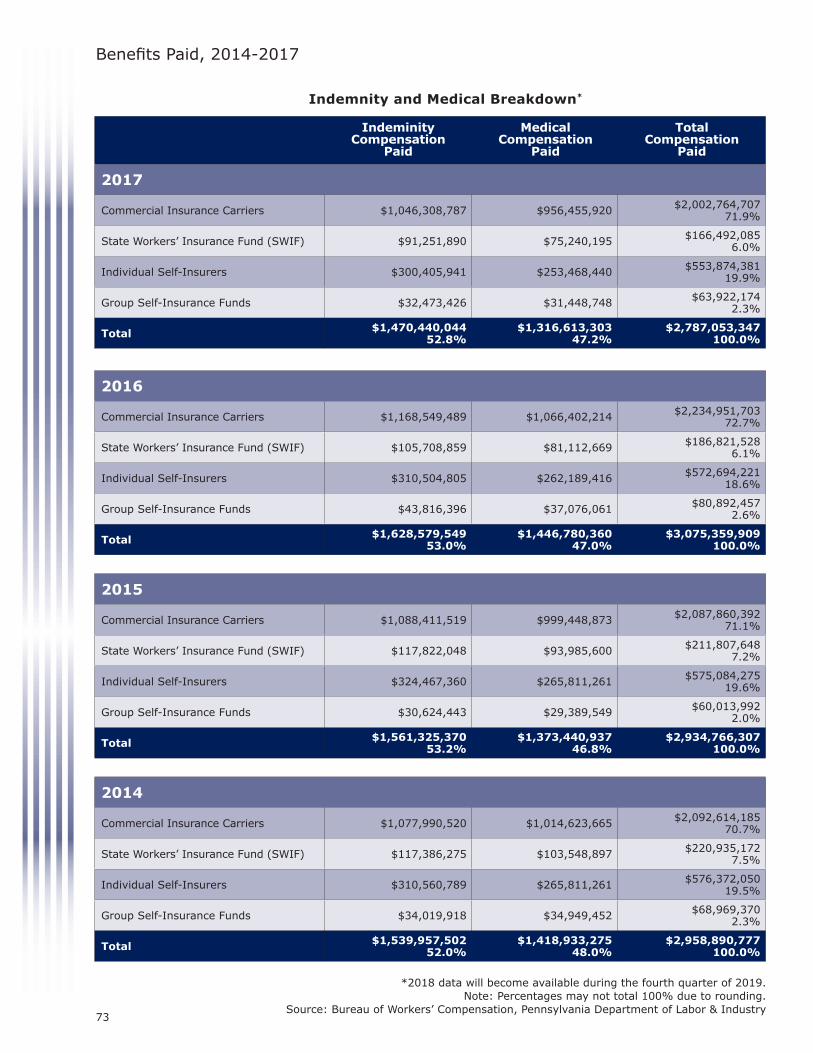
2018 ANNUALREPORT
Pennsylvania Workers’ Compensation and Workplace Safety
TOM WOLF, GOVERNORW. GERARD OLEKSIAK, SECRETARY
2017
Commercial Insurance Carriers $1,046,308,787 $956,455,920 $2,002,764,70771.9%
State Workers’ Insurance Fund (SWIF) $91,251,890 $75,240,195 $166,492,0856.0%
Individual Self-Insurers $300,405,941 $253,468,440 $553,874,38119.9%
Group Self-Insurance Funds $32,473,426 $31,448,748 $63,922,1742.3%
Total $1,470,440,04452.8%
$1,316,613,30347.2%
$2,787,053,347100.0%
2016
Commercial Insurance Carriers $1,168,549,489 $1,066,402,214 $2,234,951,70372.7%
State Workers’ Insurance Fund (SWIF) $105,708,859 $81,112,669 $186,821,5286.1%
Individual Self-Insurers $310,504,805 $262,189,416 $572,694,22118.6%
Group Self-Insurance Funds $43,816,396 $37,076,061 $80,892,4572.6%
Total $1,628,579,54953.0%
$1,446,780,36047.0%
$3,075,359,909100.0%
2015
Commercial Insurance Carriers $1,088,411,519 $999,448,873 $2,087,860,39271.1%
State Workers’ Insurance Fund (SWIF) $117,822,048 $93,985,600 $211,807,6487.2%
Individual Self-Insurers $324,467,360 $265,811,261 $575,084,27519.6%
Group Self-Insurance Funds $30,624,443 $29,389,549 $60,013,9922.0%
Total $1,561,325,37053.2%
$1,373,440,93746.8%
$2,934,766,307100.0%
2014
Commercial Insurance Carriers $1,077,990,520 $1,014,623,665 $2,092,614,18570.7%
State Workers’ Insurance Fund (SWIF) $117,386,275 $103,548,897 $220,935,1727.5%
Individual Self-Insurers $310,560,789 $265,811,261 $576,372,05019.5%
Group Self-Insurance Funds $34,019,918 $34,949,452 $68,969,3702.3%
Total $1,539,957,50252.0%
$1,418,933,27548.0%
$2,958,890,777100.0%
*2018 data will become available during the fourth quarter of 2019.Note: Percentages may not total 100% due to rounding.
Source: Bureau of Workers’ Compensation, Pennsylvania Department of Labor & Industry
Benefits Paid, 2014-2017
Indemnity and Medical Breakdown*
Indeminity Compensation
Paid
Medical Compensation
Paid
Total Compensation
Paid
73

2018 ANNUAL
REPORTPennsylvania Workers’ Compensation and Workplace Safety
TOM WOLF, GOVERNORW. GERARD OLEKSIAK, SECRETARY
Benefits Paid, 2014-2017 Total Workers’ Compensation Paid 2007-2017*
Indemnity Compensation Paid
$2,000,000,000
$1,500,000,000
$1,000,000,000
$500,000,000
$0 2007 2008 2009 2010 2011 2012 2013 2014 2015 2016 2017
Calendar Benefit Years
$1
,54
9,2
69
,67
9
$1
,57
6,0
86
,02
8
$1
,60
2,3
40
,21
6
$1
,55
8,4
61
,97
1
$1
,55
6,8
47
,65
0
$1
,55
3,3
93
,85
5
$1
,54
5,0
91
,18
1
$1
,53
9,9
57
,50
2
$1
,56
1,3
25
,37
0
$1
,62
8,5
79
,54
9
*2018 data will become available during the fourth quarter of 2019.Source: Bureau of Workers’ Compensation, Pennsylvania Department of Labor & Industry
$1
,47
0,4
40
, 0
44
74
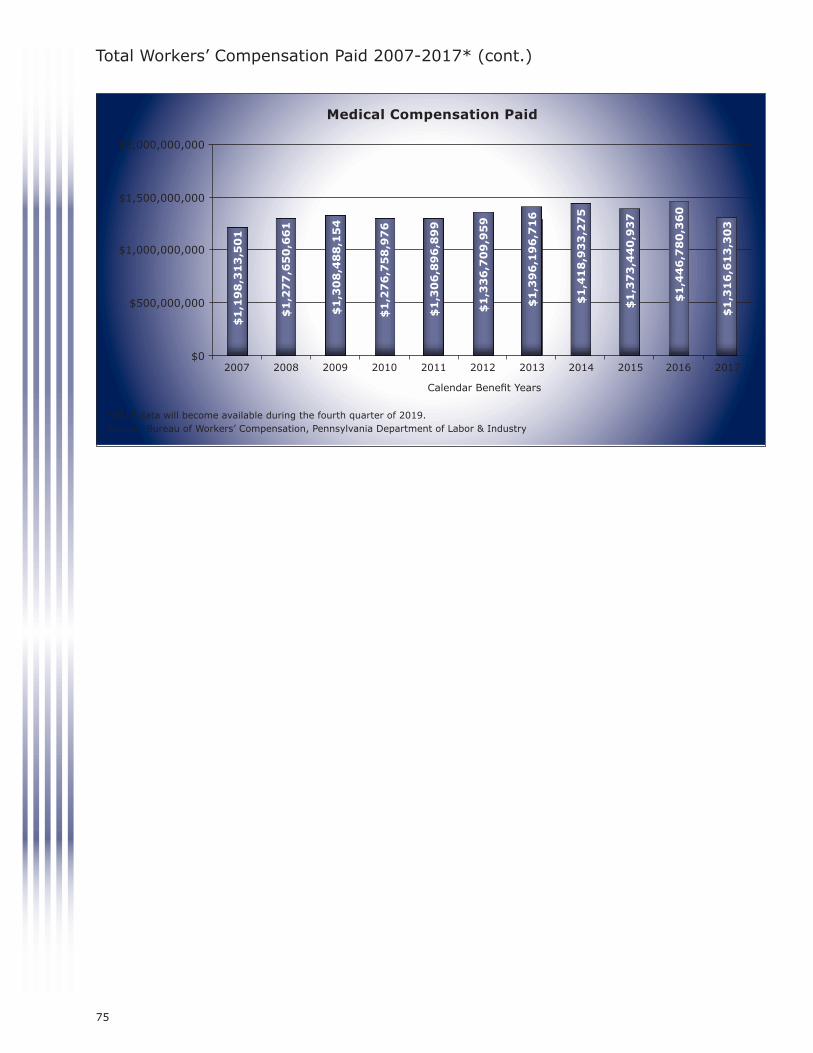
2018 ANNUALREPORT
Pennsylvania Workers’ Compensation and Workplace Safety
TOM WOLF, GOVERNORW. GERARD OLEKSIAK, SECRETARY
Total Workers’ Compensation Paid 2007-2017* (cont.)
Medical Compensation Paid
2007 2008 2009 2010 2011 2012 2013 2014 2015 2016 2017
Calendar Benefit Years
$2,000,000,000
$1,500,000,000
$1,000,000,000
$500,000,000
$0
$1
,19
8,3
13
,50
1
$1
,27
7,6
50
,66
1
$1
,30
8,4
88
,15
4
$1
,27
6,7
58
,97
6
$1
,30
6,8
96
,89
9
$1
,33
6,7
09
,95
9
$1
,39
6,1
96
,71
6
$1
,41
8,9
33
,27
5
$1
,37
3,4
40
,93
7
$1
,44
6,7
80
,36
0
*2018 data will become available during the fourth quarter of 2019.Source: Bureau of Workers’ Compensation, Pennsylvania Department of Labor & Industry
$1
,31
6,6
13
,30
3
75

2018 ANNUAL
REPORTPennsylvania Workers’ Compensation and Workplace Safety
TOM WOLF, GOVERNORW. GERARD OLEKSIAK, SECRETARY
Total Workers’ Compensation Paid 2007-2017* (cont.)
Total Compensation Paid
Indemnity Compensation Paid Medical Compensation Paid - Total Compensation Paid
$3,500,000,000
$3,000,000,000
$2,500,000,000
$2,000,000,000
$1,500,000,000
$1,000,000,000
$500,000,000
$02008 2009 2010 2011 2012 2013 2014 2015 2016 2017 2007
Calendar Benefit Years
$2
,74
7,5
83
,18
0
$2
,85
3,7
36
,68
9
$2
,86
6,9
50
,12
5
$2
,87
9,0
99
,19
2
$2
,86
3,7
44
,54
9
$2
,89
0,1
03
,81
4
$2
,94
1,2
87
,89
7
$2
,95
8,8
90
,77
7
$2
,93
4,7
66
,30
7
$3
,07
5,3
59
,90
9
$1
,54
9,2
69
,67
9
$1
,57
6,0
86
,02
8
$1
,55
8,4
61
,97
1
$1
,60
2,3
40
,21
6
$1
,55
6,8
47
,65
0
$1
,55
3,3
93
,85
5
$1
,54
5,0
91
,18
1
$1
,53
9,9
57
,50
2
$1
,56
1,3
25
,37
0
$1
,62
8,5
79
,54
9
$1
,19
8,3
13
,50
1
$1
,27
7,6
50
,66
1
$1
,30
8,4
88
,15
4
$1
,30
6,8
96
,89
9
$1
,33
6,7
09
,95
9
$1
,39
6,1
96
,71
6
$1
,41
8,9
33
,27
5
$1
,27
6,7
58
,97
6
$1
,37
3,4
40
,93
7
$1
,44
6,7
80
,36
0
*2018 data will become available during the fourth quarter of 2019.Source: Bureau of Workers’ Compensation, Pennsylvania Department of Labor & Industry
$2
,78
7,0
53
,34
7$
1,4
70
,44
0,0
44
$1
,31
6,6
13
,30
3
76

2018 ANNUALREPORT
Pennsylvania Workers’ Compensation and Workplace Safety
TOM WOLF, GOVERNORW. GERARD OLEKSIAK, SECRETARY
LIBC-772 REV 03-19
1171 S. Cameron Street, Room 324,Harrisburg, PA 17104-2501
www.dli.pa.gov