Embed Size (px)
Citation preview

6060 Parkland Boulevard ◆ Suite 250 ◆ Mayfield Heights, OH 44124 ◆ 216.875.5600 ◆ ferro.com
2018 ANNUAL REPORT AND FORM 10-K
20959_FERRO_AnnualReport_ACG.indd 1-3 3/15/19 10:32 AM

Exchange Listing New York Stock Exchange Common Stock Stock symbol: FOE
Executive OfficesFerro Corporation, 6060 Parkland Boulevard, Suite 250, Mayfield Heights, OH 44124, U.S.A 216-875-5600
Investor ContactKevin Cornelius Grant Director, Investor Relations and Corporate Communications 216-875-5451 [email protected]
Form 10-KFerro Corporation’s Form 10-K report filed with the Securities and Exchange Commission for the year ended December 31, 2018, is available to shareholders at no cost at the Company’s website (ferro.com) or upon request.
Stock Purchase Plan The Plan is administered by Computershare. Any questions or correspondence about the Plan should be addressed to:
Computershare P.O. Box 505000, Louisville, KY 40233-5000 Shareholder Services Number(s): 800-622-6757 781-575-4735 (Non-U.S.) [email protected]
Brokerage Accounts To reduce communication delays that exist for some Ferro shareholders who hold their stock in brokerage accounts, the Company will send its various printed communications directly to such shareholders. If you would like to take advantage of this service, please write to:
Treasury Department Ferro Corporation, 6060 Parkland Boulevard, Suite 250, Mayfield Heights, OH 44124, U.S.A.
Please indicate the number of Ferro shares owned and the name and address of the brokerage firm that administers your account.
Stock Transfer Agent/Registrar and Dividend Disbursing Agent Computershare P.O. Box 505000, Louisville, KY 40233-5000 Shareholder Services Number(s): 800-622-6757 781-575-4735 (Non-U.S.) [email protected]
Independent Registered Public Accounting Firm Deloitte & Touche LLP 127 Public Square, Suite 3300 Cleveland, OH 44114
Board of Directors and Leadership Team
BUSINESS MANAGEMENT TEAM
Matthias Bell Group Vice President, Global Operations
Dieter BinderVice President, Europe & Performance Colors and Glass
Julio GarciaVice President, Europe & Performance Coatings
Barry MisquittaVice President, Americas & Color Solutions; Innovation and Strategic Marketing
Luca PecoraraVice President, Asia Pacific
1 Audit Committee 2 Compensation Committee 3 Governance & Nomination Committee
EXECUTIVE TEAM
Peter T. Thomas Chairman, President and Chief Executive Officer
Benjamin Schlater Group Vice President and Chief Financial Officer
Pepe TortajadaVice President, Human Resources
Mark H. DuesenbergVice President, General Counsel and Secretary
BOARD OF DIRECTORS
Peter T. ThomasChairman, President, CEO Ferro Corporation
Gregory E. Hyland Mr. Hyland is the retired Chairman and CEO of Mueller Water Products, Inc., a manufacturer and marketer of products and services used in the transmission, distribution and measurement of water in North America.
David A. Lorber 2, 3 – Chair Mr. Lorber is a Co-Founder of FrontFour Capital Group LLC, an investment adviser, and has served as a Portfolio Manager since January 2007. He is also a Co-Founder and Principal of FrontFour Capital Corp., an investment adviser.
Andrew M. Ross 1, 3
Mr. Ross is the former President of the Pigments and Additives business of Rockwood Holdings, Inc. (“Rockwood”), a performance additives and titanium dioxide business that was sold to Huntsman Pigments in October 2014.
Allen A. Spizzo 1, 2 - Chair Mr. Spizzo has been a business and management consultant focused on the chemicals, materials, biotechnology and pharmaceutical industries since November 2008, and served as Vice President and Chief Financial Officer of Hercules Incorporated, a former S&P 500 specialty chemicals company, from March 2004 until the company was sold to Ashland Inc. in November 2008.
Marran Ogilvie 1, 3
Ms. Ogilvie serves on the board of directors of Four Corners Property Trust, Inc., a real estate investment trust, Evolution Petroleum Corporation, a U.S. petroleum producer, and Bemis Company, a global manufacturer of flexible packaging.
Ronald P. Vargo 1 – Chair, 2 Mr. Vargo served as Vice President and Chief Financial Officer of ICF International, a provider of consulting services and technology solutions to government and commercial clients, from April 2010 until May 2011, after serving as Executive Vice President and Chief Financial Officer of Electronic Data Systems, an information technology equipment and services company.
Adjusted Free Cash Flow(IN MILLIONS)
Adjusted Earnings Per Share
Net Sales CC
(IN MILLIONS)
$946 $257
$43
$1,033 $305
$85
$1,134$362
$92
$1,403$430
$86
$1,612 $462
$189
Adjusted Gross Profit CC
(IN MILLIONS)
Non-GAAP Financial Information: Continuing Operations excluding Discontinued Operations and Other Divestitures; Adjusted Gross Profit Margin; Constant Currency Results; Adjusted Free Cash Flow From Operations; Adjusted Earnings Before Interest, Taxes, Depreciation and Amortization (EBITDA); Adjusted Earnings Per Share; are non-GAAP measures. These non-GAAP measures have been reconciled to the comparable GAAP measures within tables immediately following the Company’s Annual Report on Form 10-K.
CC Constant Currency
$0.62
$0.85
$1.09
$1.29
$1.50
Adjusted EBITDA
Adjusted Gross Profit Margin CC
27.1%29.5%
31.9%30.7%
28.7%
$124$144
$194
$231
$259
$934
13 14 15 16 17 18 13 14 15 16 17 18
$241
13 14 15 16 17 18
25.8%
$0 13 14 15 16 17 18
$97
$0.33
13 14 15 16 17 18 13 14 15 16 17 18
20959_FERRO_AnnualReport_ACG.indd 4-6 3/15/19 10:32 AM

500
400
300
200
100
Total Shareholder Return
Dec 2012 Dec 2013 Dec 2014 Dec 2015 Dec 2016 Dec 2017 Dec 2018
Ferro
Proxy PeersS&P 500
Note: Peer set based on companies disclosed in Ferro 2018 proxy statement, including Chemtura, Compass Minerals International, HB Fuller, Hexcel, Innophos, Innospec, Koppers Holding, Kraton Performance Polymers, Minerals Technology, Newmarket, OMNOVA, Quaker Chemical, Rayonier Advanced Materials, Sensient Technologies, Stepan and Tronox. Source: CapitalIQ
Ferro Corporation (www.ferro.com) is a leading global supplier of technology-based functional coatings and color solutions.
Ferro supplies functional coatings for glass, metal, ceramics and other substrates and color solutions in the form of specialty
pigments and colorants for a broad range of industries and applications. Ferro products are sold into the building and
construction, automotive, electronics, industrial products, household furnishings and appliance markets. The Company’s
reportable segments include: Performance Coatings (metal and ceramic coatings), Performance Colors and Glass (glass coatings),
and Color Solutions. Headquartered in Mayfield Heights, Ohio, the Company has approximately 6,100 associates globally and
reported 2018 sales of $1.6 billion.
ferro 2018 Annual Report and 10-K 1
Sales By End Market
◆ 31% Building
◆ 21% Industrial◆ 14% Electronics
◆ 12% Appliances
◆ 12% Auto
◆ 5% Container◆ 4% Household
◆ 1% Other
◆ 41% Europe
◆ 22% Asia Pacific (APAC) ◆ 17% North America
◆ 11% Latin America
Ship To Sales Geography
◆ 9% Middle East North Africa (MENA)
20959_FERRO_AnnualReport_ACG.indd 1 3/15/19 10:32 AM

2 ferro 2018 Annual Report and 10-K
FELLOW SHAREHOLDERS:
Ferro delivered in 2018 another year
of strong financial performance. The
financial metrics achieved last year provide
additional confirmation of the effectiveness
of the strategic actions we have taken
over the past several years to transform
our business. Ferro is producing industry-
leading results and is positioned for
long-term, sustainable value creation.
20959_FERRO_AnnualReport_ACG.indd 2 3/15/19 10:32 AM

ferro 2018 Annual Report and 10-K 3
Ferro’s team delivered another year of
strong performance, with revenue growth
of 15%, adjusted EPS growth of 16% and
adjusted EBITDA growth of 12%.
Ferro today is a fundamentally stronger business than
it was several years ago. We now are a focused,
technology-driven functional coatings and color solutions
company, using innovation to expand our leadership
positions in high-demand, high-margin markets. We
have an enhanced platform of technologies from which
to develop new products that feed our product pipeline,
and now have a vitality index in the range of 20%.
Meanwhile, we remain focused on efficiency and
productivity and continually implement optimization
initiatives where we see opportunities to drive greater
profitability.
2018 FINANCIAL METRICS
In 2018, Ferro again generated double-digit year-over-year
growth in revenue, adjusted earnings per share and
adjusted EBITDA.
On a constant currency basis, net sales increased to
$1.6 billion from $1.4 billion, an increase of 14.9 percent.
Organic sales grew 5.2 percent. Adjusted gross profit rose
to $462.3 million from $430.3 million, an increase of 7.4
percent. Adjusted gross profit margin was 28.7 percent.
Net income increased to $80.1 million from $57.1 million.
Diluted earnings per share rose to $0.94 from $0.67
for 2017. On an adjusted basis, 2018 earnings per diluted
share were $1.50, an increase of 16.3 percent over
adjusted earnings per share of $1.29 for 2017.
Adjusted EBITDA grew 12.0 percent to $259.1 million
or 16.1 percent of net sales. Adjusted free cash flow for
2018 was $189.1 million, with adjusted free cash flow
conversion of 73.0 percent.
We deployed approximately $144.8 million in investments
comprised of $75.0 million for acquisitions, $41.0 million
in capital related to optimization projects and $28.8 million
for the purchase of 1.5 million shares of Ferro common
stock. We ended the year with a debt-to-adjusted
EBITDA ratio of 2.8 times.
20959_FERRO_AnnualReport_ACG.indd 3 3/13/19 2:06 PM

4 ferro 2018 Annual Report and 10-K
In 2018, the Company deployed approximately $144.8 million in
investments comprised of $75.0 million for acquisitions, $41.0 million
in capital related to optimization projects and $28.8 million for
the purchase of 1.5 million shares of Ferro common stock.
MOVING FORWARD
In 2019, we remain focused on creating long-term,
sustainable value by:
◆ Investing in organic and inorganic growth opportunities,
◆ Focusing on higher-growth, higher-margin markets,
◆ Emphasizing innovation,
◆ Advancing optimization initiatives, and
◆ Maintaining a strong balance sheet and disciplined
approach to capital allocation.
We believe Ferro has a winning formula. Along with the
above priorities, we intend to continue leveraging the
technology capabilities and manufacturing platforms of
our three major business units and aligning our
innovation efforts with megatrends, such as intelligent
automation, 5G, smart cars and LED.
The foundation for industry-leading performance is in
place. We look forward to continuing to build on that
foundation for our customers, our shareholders and
our employees.
On behalf of our team around the world, thank you
for your continued confidence in Ferro Corporation.
Sincerely,
Peter T. Thomas
Chairman, President and
Chief Executive Officer
March 21, 2019
20959_FERRO_AnnualReport_ACG.indd 4 3/12/19 10:18 AM

UNITED STATES SECURITIES AND EXCHANGE COMMISSIONWashington, D.C. 20549
Form 10-K(Mark One)
È ANNUAL REPORT PURSUANT TO SECTION 13 OR 15(d) OF THE SECURITIES EXCHANGE ACT OF 1934For the fiscal year ended December 31, 2018
or‘ TRANSITION REPORT PURSUANT TO SECTION 13 OR 15(d) OF THE SECURITIES EXCHANGE ACT OF 1934
For the transition period from to
Commission file number 1-584
FERRO CORPORATION(Exact name of registrant as specified in its charter)
Ohio 34-0217820(State or Other Jurisdiction of Incorporation or Organization) (IRS Employer Identification No.)
6060 Parkland Blvd.Suite 250
Mayfield Heights, OH 44124(Address of Principal Executive Offices) (Zip Code)
Registrant’s telephone number, including area code: 216-875-5600
Securities Registered Pursuant to section 12(b) of the Act:
Title of Each Class Name of Each Exchange on Which Registered
Common Stock, par value $1.00 New York Stock Exchange
Indicate by check mark if the registrant is a well-known seasoned issuer, as defined in Rule 405 of the SecuritiesAct. YES È NO ‘
Indicate by check mark if the registrant is not required to file reports pursuant to Section 13 or Section 15(d) of theAct. YES ‘ NO È
Indicate by check mark whether the registrant (1) has filed all reports required to be filed by Section 13 or 15(d) of the SecuritiesExchange Act of 1934 during the preceding 12 months (or for such shorter period that the registrant was required to file such reports), and(2) has been subject to such filing requirements for the past 90 days. YES È NO ‘
Indicate by check mark whether the registrant has submitted electronically every Interactive Data File required to be submittedpursuant to Rule 405 of Regulation S-T (§ 232.405 of this chapter) during the preceding 12 months (or for such shorter period that theregistrant was required to submit such files). YES È NO ‘
Indicate by check mark if disclosure of delinquent filers pursuant to Item 405 of Regulation S-K (§ 229.405 of this chapter) is notcontained herein, and will not be contained, to the best of registrant’s knowledge, in definitive proxy or information statementsincorporated by reference in Part III of this Form 10-K or any amendment to this Form 10-K. È
Indicate by check mark whether the registrant is a large accelerated filer, an accelerated filer, a non-accelerated filer, a smallerreporting company, or an emerging growth company. See the definitions of “large accelerated filer,” “accelerated filer,” “smaller reportingcompany,” and “emerging growth company” in Rule 12b-2 of the Exchange Act. (Check one):
Large accelerated filer È Accelerated filer ‘ Non-accelerated filer ‘ Smaller reporting company ‘ Emerging growth company ‘
If an emerging growth company, indicate by check mark if the registrant has elected not to use the extended transition period forcomplying with any new or revised financial accounting standards provided pursuant to Section 13(a) of the Exchange Act. ‘
Indicate by check mark whether the registrant is a shell company (as defined in Rule 12b-2 of the Act). YES ‘ NO È
The aggregate market value of Ferro Corporation Common Stock, par value $1.00, held by non-affiliates and based on the closing saleprice as of June 30, 2018, was approximately $1,728,453,000.
On January 31, 2019, there were 82,705,878 shares of Ferro Corporation Common Stock, par value $1.00 outstanding.
DOCUMENTS INCORPORATED BY REFERENCE
Portions of the Proxy Statement for Ferro Corporation’s 2019 Annual Meeting of Shareholders are incorporated into Part III of thisAnnual Report on Form 10-K.

TABLE OF CONTENTS
PART IItem 1 Business . . . . . . . . . . . . . . . . . . . . . . . . . . . . . . . . . . . . . . . . . . . . . . . . . . . . . . . . . . . . . . . . Page 3
Item 1A Risk Factors . . . . . . . . . . . . . . . . . . . . . . . . . . . . . . . . . . . . . . . . . . . . . . . . . . . . . . . . . . . . . Page 8
Item 1B Unresolved Staff Comments . . . . . . . . . . . . . . . . . . . . . . . . . . . . . . . . . . . . . . . . . . . . . . . . Page 17
Item 2 Properties . . . . . . . . . . . . . . . . . . . . . . . . . . . . . . . . . . . . . . . . . . . . . . . . . . . . . . . . . . . . . . . Page 17
Item 3 Legal Proceedings . . . . . . . . . . . . . . . . . . . . . . . . . . . . . . . . . . . . . . . . . . . . . . . . . . . . . . . . Page 18
Item 4 Mine Safety Disclosures . . . . . . . . . . . . . . . . . . . . . . . . . . . . . . . . . . . . . . . . . . . . . . . . . . . Page 18
PART IIItem 5 Market for Registrant’s Common Equity, Related Stockholder Matters, and Issuer
Purchases of Equity Securities . . . . . . . . . . . . . . . . . . . . . . . . . . . . . . . . . . . . . . . . . . . . . . Page 20
Item 6 Selected Financial Data . . . . . . . . . . . . . . . . . . . . . . . . . . . . . . . . . . . . . . . . . . . . . . . . . . . . Page 21
Item 7 Management’s Discussion and Analysis of Financial Condition and Results ofOperations . . . . . . . . . . . . . . . . . . . . . . . . . . . . . . . . . . . . . . . . . . . . . . . . . . . . . . . . . . . . . . Page 22
Item 7A Quantitative and Qualitative Disclosures about Market Risk . . . . . . . . . . . . . . . . . . . . . . . Page 47
Item 8 Financial Statements and Supplementary Data . . . . . . . . . . . . . . . . . . . . . . . . . . . . . . . . . . Page 49
Item 9 Changes in and Disagreements with Accountants on Accounting and FinancialDisclosure . . . . . . . . . . . . . . . . . . . . . . . . . . . . . . . . . . . . . . . . . . . . . . . . . . . . . . . . . . . . . . Page 112
Item 9A Controls and Procedures . . . . . . . . . . . . . . . . . . . . . . . . . . . . . . . . . . . . . . . . . . . . . . . . . . . Page 112
Item 9B Other Information . . . . . . . . . . . . . . . . . . . . . . . . . . . . . . . . . . . . . . . . . . . . . . . . . . . . . . . . Page 115
PART IIIItem 10 Directors, Executive Officers and Corporate Governance . . . . . . . . . . . . . . . . . . . . . . . . . Page 116
Item 11 Executive Compensation . . . . . . . . . . . . . . . . . . . . . . . . . . . . . . . . . . . . . . . . . . . . . . . . . . . Page 116
Item 12 Security Ownership of Certain Beneficial Owners and Management and RelatedStockholder Matters . . . . . . . . . . . . . . . . . . . . . . . . . . . . . . . . . . . . . . . . . . . . . . . . . . . . . . Page 117
Item 13 Certain Relationships and Related Transactions, and Director Independence . . . . . . . . . . Page 117
Item 14 Principal Accountant Fees and Services . . . . . . . . . . . . . . . . . . . . . . . . . . . . . . . . . . . . . . . Page 117
PART IVItem 15 Exhibits and Financial Statement Schedules . . . . . . . . . . . . . . . . . . . . . . . . . . . . . . . . . . . Page 118
2

PART I
Item 1 — Business
History, Organization and Products
Ferro Corporation was incorporated in Ohio in 1919 as an enameling company and today is a leadingproducer of specialty materials that are sold to a broad range of manufacturers who, in turn, make products formany end-use markets. When we use the terms “Ferro,” “we,” “us” or “the Company,” we are referring to FerroCorporation and its subsidiaries unless indicated otherwise.
Ferro’s products fall into two general categories: functional coatings, which perform specific functions inthe manufacturing processes and end products of our customers; and color solutions, which provide aesthetic andperformance characteristics to our customers’ products. Our products are manufactured in approximately52 facilities around the world. They include frits, porcelain and other glass enamels, glazes, stains, decoratingcolors, pigments, inks, polishing materials, dielectrics, electronic glasses, and other specialty coatings.
Ferro develops and delivers innovative products to our customers based on our strengths in the followingtechnologies:
• Particle Engineering — Our ability to design and produce very small particles made of a broad variety ofmaterials, with precisely controlled characteristics of shape, size and particle distribution. We understandhow to disperse these particles within liquid, paste and gel formulations.
• Color and Glass Science — Our understanding of the chemistry required to develop and producepigments that provide color characteristics ideally suited to customers’ applications. We have ademonstrated ability to manufacture glass-based and certain other coatings with properties that preciselymeet customers’ needs in a broad variety of applications.
• Surface Chemistry and Surface Application Technology — Our understanding of chemicals and materialsused to develop products and processes that involve the interface between layers and the surfaceproperties of materials.
• Formulation — Our ability to develop and manufacture combinations of materials that deliver specificperformance characteristics designed to work within customers’ particular products and manufacturingprocesses.
We differentiate ourselves in our industry by innovation and new products and services and the consistenthigh quality of our products, combined with delivery of localized technical service and customized applicationtechnology support. Our value-added technology services assist customers in their material specification andevaluation, product design, and manufacturing process characterization in order to help them optimize theapplication of our products.
Ferro’s operations are divided into the four business units, which comprise three reportable segments, listedbelow:
• Tile Coating Systems(1)
• Porcelain Enamel(1)
• Performance Colors and Glass• Color Solutions
(1) Tile Coating Systems and Porcelain Enamel are combined into one reportable segment, PerformanceCoatings, for financial reporting purposes.
Financial information about our segments is included herein in Note 21 to the consolidated financialstatements under Item 8 of this Annual Report on Form 10-K.
3

Markets and Customers
Ferro’s products are used in a variety of product applications, within the following markets:
• Appliances • Household furnishings
• Automotive • Industrial products
• Building and renovation • Packaging
• Electronics • Sanitary
Many of our products are used as functional or aesthetic coatings for a variety of different substrates on ourcustomers’ products, such as metals, ceramics, glass, plastic, wood and concrete. Other products are used tomanufacture electronic components and other products. Still other products are added during our customers’manufacturing processes to provide desired properties to their end product. Often, Ferro materials are a smallportion of the total cost of our customers’ products, but they can be critical to the functionality or appearance ofthose products.
Our customers include manufacturers of ceramic tile, major appliances, construction materials, automobileparts, automobiles, architectural and container glass, and electronic components and devices. Many of ourcustomers, including makers of major appliances and automobile parts, purchase materials from more than one ofour business units. Our customer base is well diversified both geographically and by end market.
We generally sell our products directly to our customers. However, a portion of our business uses indirectsales channels, such as agents and distributors, to deliver products to market. In 2018, no single customer orrelated group of customers represented more than 10% of net sales. In addition, none of our reportable segmentsis dependent on any single customer or related group of customers.
Backlog of Orders and Seasonality
Generally, there is no significant lead time between customer orders and delivery in any of our businesssegments. As a result, we do not consider that the dollar amount of backlogged orders believed to be firm ismaterial information for an understanding of our business. Although not seasonal, in certain of our technology-driven markets, our customers’ business is often characterized by product campaigns with specific life cycles,which can result in uneven demand as product ramp-up periods are followed by down-cycle periods. As ourinnovation activity increases in line with our value creation strategy, we expect this type of business to alsoincrease. This type of market operates on a different cycle from the majority of our business. We also do notregard any material part of our business to be seasonal. However, customer demand has historically been higherin the second quarter when building and renovation markets are particularly active, and the second quarter is alsonormally the strongest for sales and operating profit.
Competition
In most of our markets, we have a substantial number of competitors, none of which is dominant. Due to thediverse nature of our product lines, no single competitor directly matches all of our product offerings. Ourcompetition varies by product and by region, and is based primarily on product quality, performance andfunctionality, as well as on pricing, customer service, technical support, and the ability to develop customproducts to meet specific customer applications.
We are a worldwide leader in the production of specialty coatings and enamels for glass enamels, porcelainenamel, and ceramic tile coatings. There is strong competition in our markets, ranging from large multinationalcorporations to local producers. While many of our customers purchase customized products and formulationsfrom us, our customers could generally buy from other sources, if necessary.
4

Raw Materials and Supplier Relations
Raw materials widely used in our operations include:
Metal Oxides: Other Inorganic Materials:
• Aluminum oxide(1) • Boron(2)
• Chrome Oxide(1) (2) • Clay(2)
• Cobalt oxide(1)(2) • Feldspar(2)
• Iron Oxide(1) • Lithium(2)
• Lead Oxide(1) • Silica(2)
• Nickel oxide(1)(2) • Soda Ash(1)
• Titanium dioxide(1)(2) • Zircon(2)
• Zinc oxide(2)
• Zirconium dioxide(2)
Precious and Non-precious Metals: Energy:
• Bismuth(1) • Electricity
• Chrome(1)(2) • Natural gas
• Copper(1)
• Gold(1)
• Molybdenum(1)
• Silver(1)
• Vandaium(1)
(1) Primarily used by the Performance Colors and Glass and the Color Solutions segments.(2) Primarily used by the Performance Coatings segment.
These raw materials make up a large portion of our product costs in certain of our product lines, andfluctuations in the cost of raw materials can have a significant impact on the financial performance of the relatedbusinesses. We attempt to pass through to our customers raw material cost increases.
We have a broad supplier base and, in many instances, multiple sources of essential raw materials areavailable worldwide if problems arise with a particular supplier. We maintain many comprehensive supplieragreements for strategic and critical raw materials. We did not encounter raw material shortages in 2018 thatsignificantly affected our manufacturing operations, but we are subject to volatile raw material costs that canaffect our results of operations.
Environmental Matters
We handle, process, use and store hazardous materials as part of the production of some of our products. Asa result, we operate production facilities that are subject to a broad array of environmental laws and regulationsin the countries in which we operate, particularly for wastes, wastewater discharges and air emissions. Inaddition, some of our products are subject to restrictions under laws or regulations such as California’sProposition 65, the Toxic Substances and Control Act and the European Union’s (“EU”) chemical substancesdirective. The costs to comply with the complex environmental laws and regulations applicable to our operationsare significant and will continue for the industry and us for the foreseeable future. These routine costs areexpensed as they are incurred. While these costs may increase in the future, they are not expected to have amaterial impact on our financial position, liquidity or results of operations. We believe that we are in substantialcompliance with the environmental laws and regulations applicable to our operations. We also believe that, to theextent that we may not be in compliance with such regulations, such non-compliance will not have a materiallyadverse effect on our financial position, liquidity or results of operations.
5

Our policy is to operate our plants and facilities in a manner that protects the environment and the healthand safety of our employees and the public. We intend to continue to make expenditures for environmental andhealth and safety protection and improvements in a timely manner consistent with available technology.Although we cannot precisely predict future environmental, health and safety spending, we do not expect thecosts to have a material impact on our financial position, liquidity or results of operations. Capital expendituresfor environmental, health and safety protection were $6.1 million in 2018, $6.2 million in 2017, and $1.4 millionin 2016. We also accrue for environmental remediation costs when it is probable that a liability has been incurredand we can reasonably estimate the amount. We determine the timing and amount of any liability based uponassumptions regarding future events, and inherent uncertainties exist in such evaluations primarily due tounknown conditions or circumstances, changing governmental regulations and legal standards regarding liability,and evolving technologies. We adjust these liabilities periodically as remediation-related efforts progress, thenature and extent of contamination becomes more certain, or as additional technical or legal information becomesavailable.
Research and Development
We are involved worldwide in research and development activities relating to new and existing products,services and technologies required by our customers’ continually changing markets. Our research anddevelopment resources are organized into centers of excellence that support our regional and worldwide majorbusiness units. These centers are augmented by local laboratories that provide technical service and support tomeet customer and market needs in various geographic areas.
Total expenditures for product and application technology, including research and development, customertechnical support and other related activities, were $40.2 million in 2018, $36.4 million in 2017, and$27.3 million in 2016.
Patents, Trademarks and Licenses
We own a substantial number of patents and patent applications relating to our various products and theiruses. While these patents are of importance to us and we exercise diligence to ensure that they are valid, we donot believe that the invalidity or expiration of any single patent or group of patents would have a material adverseeffect on our businesses. Our patents will expire at various dates through the year 2037. We also use a number oftrademarks that are important to our businesses as a whole or to particular segments of our business. We believethat these trademarks are adequately protected.
Employees
At December 31, 2018, we employed 6,059 full-time employees, including 5,292 employees in our foreignconsolidated subsidiaries and 767 in the United States (“U.S.”). Total employment increased by 391 in ourforeign subsidiaries and decreased by 14 in the U.S. from the prior year end due to the additions related toacquisitions and new business opportunities, net of cost reduction initiatives.
Collective bargaining agreements cover 11.6% of our U.S. workforce. Approximately 2.2% of all U.S.employees are affected by a labor agreement that expires in 2019, and we expect to complete the renewal of theagreement with no significant disruption to the related business. We consider our relations with our employees,including those covered by collective bargaining agreements, to be good.
Our employees in Europe have protections afforded them by local laws and regulations through unions andworks councils. Some of these laws and regulations may affect the timing, amount and nature of restructuringand cost reduction programs in that region.
6

Domestic and Foreign Operations
We began international operations in 1927. Our products are manufactured and/or distributed through ourconsolidated subsidiaries and unconsolidated affiliates in the following countries:
Consolidated Subsidiaries:
• Argentina • Egypt • Japan • Russia
• Australia • France • Luxembourg • Spain
• Belgium • Germany • Malaysia • Taiwan
• Brazil • India • Mexico • Thailand
• Bulgaria • Indonesia • Netherlands • Turkey
• Canada • Ireland • Poland • United Kingdom
• China • Israel • Portugal • United States
• Colombia • Italy • Romania • Vietnam
Unconsolidated Affiliates:
• China • Egypt • South Korea
• Ecuador • Spain
Financial information for geographic areas is included in Note 21 to the consolidated financial statementsunder Item 8 of this Annual Report on Form 10-K. More than 76% of our net sales are outside of the U.S. Wesell products into approximately 109 countries.
Our U.S. parent company receives technical service fees and/or royalties from many of its foreignsubsidiaries. As a matter of corporate policy, the foreign subsidiaries have historically been expected to remit aportion of their annual earnings to the U.S. parent company as dividends. To the extent earnings of foreignsubsidiaries are not remitted to the U.S. parent company, those earnings are indefinitely re-invested in thosesubsidiaries.
Available Information
Our Annual Report on Form 10-K, Quarterly Reports on Form 10-Q, and Current Reports on Form 8-K,including any amendments, will be made available free of charge on our website, www.ferro.com, as soon asreasonably practical, following the filing of the reports with the U.S. Securities and Exchange Commission(“SEC”). Our Corporate Governance Principles, Code of Business Conduct, Guidelines for Determining DirectorIndependence, and charters for our Audit Committee, Compensation Committee and Governance andNomination Committee are available free of charge either on our website or to any shareholder who requeststhem from the Ferro Corporation Investor Relations Department located at 6060 Parkland Blvd., Suite 250,Mayfield Heights, Ohio, 44124.
Forward-looking Statements
Certain statements contained here and in future filings with the SEC reflect our expectations with respect tofuture performance and constitute “forward-looking statements” within the meaning of Section 27A of theSecurities Act of 1933, as amended, and Section 21E of the Securities Exchange Act of 1934, as amended. Thesestatements are subject to a variety of uncertainties, unknown risks and other factors concerning our operationsand the business environment, which are difficult to predict and are beyond our control.
7

Item 1A — Risk Factors
Many factors could cause our actual results to differ materially from those suggested by statementscontained in this filing and could adversely affect our future financial performance. Such factors include thefollowing:
We sell our products into industries where demand has been unpredictable, cyclical or heavily influencedby consumer spending, and such demand and our results of operations may be further impacted by macro-economic circumstances.
We sell our products to a wide variety of customers who supply many different market segments. Many ofthese market segments, including building and renovation, major appliances, transportation, and electronics, arecyclical or closely tied to consumer demand. Consumer demand may change and is difficult to accuratelyforecast. Change in demand and incorrect forecasts of demand or unforeseen reductions in demand can adverselyaffect costs and profitability due to factors such as underused manufacturing capacity, excess inventory, orworking capital needs. Our forecasting systems and modeling tools may not accurately predict changes indemand for our products or other market conditions.
Our results of operations are materially affected by conditions in capital markets and economies in the U.S.and elsewhere around the world. Concerns over fluctuating prices, energy costs, geopolitical issues, governmentdeficits and debt loads, and the availability and cost of credit have contributed to economic uncertainty aroundthe world. Our customers may be impacted by these conditions and may modify, delay, or cancel plans topurchase our products. Additionally, if customers are not successful in generating sufficient revenue or areprecluded from securing financing, they may not be able to pay, or may delay payment of, accounts receivablethat are owed to us. A reduction in demand or inability of customers to pay us for our products may adverselyaffect our earnings and cash flow.
We strive to improve operating margins through sales growth, price increases, new products, productivitygains, optimization initiatives, and improved purchasing techniques, but we may not achieve the desiredimprovements.
We work to improve operating profit margins through activities such as growing sales to achieve increasedeconomies of scale, increasing prices, introducing new products, improving manufacturing processes, productreformulation and adopting purchasing techniques that lower costs or provide increased cost predictability torealize cost savings. However, these activities depend on a combination of improved product design andengineering, effective manufacturing process control initiatives, cost-effective redistribution of production, andother efforts that may not be as successful as anticipated. The success of sales growth and price increasesdepends not only on our actions but also on the strength of customer demand and competitors’ pricing responses,which are not fully predictable. Failure to successfully implement actions to improve operating margins couldadversely affect our financial performance.
The global scope of our operations exposes us to risks related to currency conversion rates, new anddifferent regulatory schemes and changing economic, regulatory, social and political conditions around theworld.
More than 76% of our net sales during 2018 were outside of the U.S. In order to support our customers,access regional markets and compete effectively, our operations are located around the world. Our operations aresubject to economic, regulatory, social and political conditions in multiple locations and we are subject to risksrelating to currency conversion rates. We also may encounter difficulties expanding into additional growthmarkets around the world. Other risks inherent in our operations include the following:
• New, different and unpredictable legal and regulatory requirements and enforcement mechanisms in theU.S. and other countries;
8

• Export licenses may be difficult to obtain, and we may be subject to import or export duties or importquotas, export controls and restrictions administered by, for example, the Office of Foreign AssetsControls or other trade restrictions or barriers;
• Increased costs, and decreased availability, of transportation or shipping;
• Credit risk and financial conditions of local customers and distributors;
• Risk of nationalization of private enterprises by governments, or restrictions on investments;
• Potentially adverse tax consequences, including imposition or increase of withholding and other taxes onremittances and other payments by subsidiaries; and
• Political, economic and social conditions, including the possibility of hyperinflationary conditions,deflation, organized crime and political instability in certain countries.
We have subsidiaries in Egypt, Israel and Turkey that are located near politically volatile regions. Suchconditions could potentially impact our ability to recover both the cost of our investments and earnings fromthose investments. While we attempt to anticipate these changes and manage our business appropriately in eachlocation where we do business, these changes are often beyond our control and difficult to forecast.
The consequences of these risks may have significant adverse effects on our results of operations orfinancial position, and if we fail to comply with applicable laws and regulations, we could be exposed to civil andcriminal penalties, reputational harm, and restrictions on our operations.
Changes in U.S. and other governments’ trade policies and other factors beyond our control mayadversely impact our business, financial condition and results of operations.
Tariffs, retaliatory tariffs or other trade restrictions on products and materials that we or our customersexport or import could affect demand for our products. Direct or unforeseen consequences of tariffs, retaliatorytariffs or other trade restrictions may also alter the competitive landscape of our products in one or more regionsof the world. Trade tensions or other governmental action related to tariffs or international trade agreements orpolicies has the potential to negatively impact our business, financial condition and results of operations.
We depend on reliable sources of energy and raw materials, minerals and other supplies, at a reasonablecost, but the availability of these materials and supplies could be interrupted and/or their prices could changeand adversely affect our sales and profitability.
We purchase energy and many raw materials to manufacture our products. Changes in their availability orprice could affect our ability to manufacture enough products to meet customers’ demands or to manufactureproducts profitably. We try to maintain multiple sources of raw materials and supplies where practical, but thismay not prevent unanticipated changes in their availability or cost and, for certain raw materials, there may notbe alternative sources. We may not be able to pass cost increases through to our customers. Significantdisruptions in availability or cost increases could adversely affect our manufacturing volume or costs, whichcould negatively affect product sales or profitability of our operations.
We operate in regions of the world where it can be difficult for a multi-national company such as Ferroto compete lawfully with local competitors, which may cause us to lose business opportunities.
We pursue business opportunities around the world and many of our most promising growth opportunitiesare in developing markets, including the People’s Republic of China, Latin America, the Asia Pacific region,India and the Middle East. Although we have been able to compete successfully in those markets to date, locallaws and customs can make it difficult for a multi-national company such as Ferro to compete on a “level playingfield” with local competitors without engaging in conduct that would be illegal under U.S. or other countries’anti-bribery laws. Our strict policy of observing the highest standards of legal and ethical conduct may cause usto lose some otherwise attractive business opportunities to competitors in these regions.
9

We have undertaken and continue to undertake optimization initiatives, to rationalize our operations andimprove our operating performance, but we may not be able to implement and/or administer these initiativesin the manner contemplated and these initiatives may not produce the desired results.
We have undertaken, and intend to continue undertaking, optimization initiatives to rationalize ouroperations to improve our operational performance. These initiatives may involve, among other things, changesto the operations of recently acquired business, the transfer of manufacturing to new or existing facilities, andrestructuring programs that involve plant closures and staff reductions, which could be material in their naturewith respect to the investments, costs and potential benefits. These initiatives also may involve changes in themanagement and delivery of functional services. Although we expect these initiatives to help us achieveoperational efficiencies and cost savings, we may not be able to implement and/or administer these initiatives inthe manner contemplated, which could cause the initiatives to fail to achieve the desired results. In addition,transfer and consolidation of manufacturing operations may involve substantial capital expenses and the transferof manufacturing processes and personnel from one site to another, with resultant inefficiencies and other issuesat the receiving site as it starts up, the need for requalification of our products and for ISO or other certificationsof our products. We may experience shortages of affected products, delays and higher than expected expenses.Changes in functional services may prove ineffective, inefficient and disruptive. Accordingly, the initiatives thatwe have implemented and those that we may implement in the future may not improve our operatingperformance and may not help us achieve cost savings. Failure to successfully implement and/or administer theseinitiatives could have an adverse effect on our financial performance.
Our businesses depend on a continuous stream of new products and services, and failure to introducenew products and services could affect our sales, profitability and liquidity.
We strive to remain competitive through innovation, including by developing and introducing new andimproved products and services on an ongoing basis. Customers continually evaluate our products and services incomparison to those offered by our competitors. A failure to introduce new products and services at the righttime that are price competitive and that meet the needs of our customers could adversely affect our sales, or couldrequire us to compensate by lowering prices. In addition, when we invest in new product development, we facerisks related to production delays, cost over-runs and unanticipated technical difficulties, which could impactsales, profitability and/or liquidity.
Our strategy includes seeking opportunities in new growth markets, and failure to identify or successfullyenter such markets could affect our ability to grow our revenues and earnings.
Certain of our products are sold into mature markets and part of our strategy is to identify and enter intomarkets growing more rapidly. These growth opportunities may involve new geographies, new product lines,new technologies, or new customers. We may not successfully exploit such opportunities and our ability toincrease our revenue and earnings could be impacted as a result.
We may not be able to complete or successfully integrate future acquisitions into our business, whichcould adversely affect our business or results of operations.
We have pursued and we intend to continue to pursue acquisitions. Our success in accomplishing growththrough acquisitions may be limited by the availability and suitability of acquisition candidates and by ourfinancial resources, including available cash and borrowing capacity. Acquisitions involve numerous risks,including difficulty determining appropriate valuation, integrating operations, information systems, technologies,services and products of the acquired product lines or business, personnel turnover, and the diversion ofmanagement’s attention from other business matters. In addition, we may be unable to achieve anticipatedbenefits from these acquisitions in the timeframe that we anticipate, or at all, which could adversely affect ourbusiness or result of operations.
10

Certain of the markets for our products and services are highly competitive and subject to intense pricecompetition, which could adversely affect our sales and earnings performance.
Our customers typically have multiple suppliers from which to choose. If we are unwilling or unable toprovide products and services at competitive prices, and if other factors, such as product performance and value-added services do not provide an offsetting competitive advantage, customers may reduce, discontinue, or decidenot to purchase our products. If we could not secure alternate customers for lost business, our sales and earningsperformance could be adversely affected.
We rely on information systems to conduct our business and interruption, or damage to, or failure orcompromise of, these systems may adversely affect our business and results of operations.
We rely on information systems to obtain, process, analyze and manage data to forecast and facilitate thepurchase of raw materials and the distribution of our products; to receive, process, and ship orders on a timelybasis; to run and operate our facilities; to account for our product and service transactions with customers; tomanage the accurate billing and collections for thousands of customers; to process payments to suppliers; and tomanage data and records relating to our employees, contractors, and other individuals. Our business and resultsof operations may be adversely affected if these systems are interrupted, damaged, or compromised or if they failfor any extended period, due to events including but not limited to programming errors, aging informationsystems infrastructure and required maintenance or replacement, computer viruses and security breaches.Information privacy and cyber security risks have generally increased in recent years because of the proliferationof new technologies and the increased sophistication and activities of perpetrators of cyber-attacks. We mayincur significant costs to implement the security measures that we feel are necessary to protect our informationsystems. However, our information systems may remain vulnerable to damage despite our implementation ofsecurity measures that we deem to be appropriate.
In addition, third-party service providers are responsible for managing a significant portion of ourinformation systems, and we are subject to risk because of possible information privacy and security breaches ofthose third parties. Any system failure, accident or security breach involving our or a third-party’s informationsystem could result in disruptions to our operations. A breach in the security of our information systems couldinclude the theft of our intellectual property or trade secrets, negatively impact our manufacturing operations, orresult in the compromise of personal information of our employees, customers or suppliers. While we have, fromtime to time, experienced system failures, accidents and security breaches involving our information systems,these incidents have not had a material impact on our operations. To the extent that any system failure, accidentor security breach results in material disruptions to our operations or the theft, loss or disclosure of, or damage to,material data or confidential information, our reputation, business, results of operations and financial conditioncould be materially adversely affected.
Our implementation and operation of business information systems and processes could adversely affectour results of operations and cash flow.
We implement and operate information systems and related business processes for our business operations.Implementation and operation of information systems and related processes involves risk, including risks relatedto programming and data transfer. Costs of implementation also could be greater than anticipated. In addition, wemay be unable or decide not to implement such systems and processes in certain locations. Inherent risks,decisions and constraints related to implementation and operation of information systems could result inoperating inefficiencies and could impact our ability to perform business transactions. These risks couldadversely impact our results of operations, financial condition, and cash flows.
Our business is subject to a variety of domestic and international laws, rules, policies and otherobligations regarding data protection.
The processing and storage of certain information is increasingly subject to privacy and data securityregulations and many such regulations are country-specific. The interpretation and application of data protection
11

laws in the U.S, Europe and elsewhere, including but not limited to the California Consumer Privacy Act and theGeneral Data Protection Regulation (the “GDPR”), are uncertain, evolving and may be inconsistent amongjurisdictions. Complying with these various laws is difficult and could cause us to incur substantial costs orrequire us to change our business practices in a manner adverse to our business. We may be required to expendadditional resources to continue to enhance our information privacy and security measures, investigate andremediate any information security vulnerabilities and/or comply with regulatory requirements.
We are subject to a number of restrictive covenants under our revolving credit facility, which could affectour flexibility to fund ongoing operations and strategic initiatives, and, if we are unable to maintaincompliance with such covenants, could lead to significant challenges in meeting our liquidity requirements.
Our Amended Credit Facility, entered into on April 25, 2018, contains a number of restrictive covenants,including those described in more detail in Note 9 to the consolidated financial statements under Item 8 of thisAnnual Report on Form 10-K. These covenants include limitations on use of loan proceeds, limitations on theCompany’s ability to pay dividends and repurchase stock, limitations on acquisitions and dispositions andlimitations on certain types of investments. The Amended Credit Facility also contains standard provisionsrelating to conditions of borrowing and customary events of default, including the non-payment of obligations bythe Company and the bankruptcy of the Company. Specific to the 2018 Revolving Facility, the Company issubject to a financial covenant regarding the Company’s maximum leverage ratio. If an event of default occurs,all amounts outstanding under the Amended Credit Facility may be accelerated and become immediately due andpayable. The Amended Credit Facility is described in more detail in “Capital Resources and Liquidity” underItem 7 and in Note 9 to the consolidated financial statements under Item 8 of this Annual Report on Form 10-K.
We depend on external financial resources, and the economic environment and credit market uncertaintycould interrupt our access to capital markets, borrowings, or financial transactions to hedge certain risks,which could adversely affect our financial condition.
At December 31, 2018, we had approximately $821.4 million of short-term and long-term debt with varyingmaturities and approximately $61.9 million of off balance sheet arrangements, including consignment arrangementsfor precious metals, bank guarantees, and standby letters of credit. These arrangements have allowed us to makeinvestments in growth opportunities and fund working capital requirements. In addition, we may enter into financialtransactions to hedge certain risks, including foreign exchange, commodity pricing, and sourcing of certain rawmaterials. Our continued access to capital markets and, the stability of our lenders, customers and financial partners,and their willingness to support our needs, are essential to our liquidity and our ability to meet our currentobligations and to fund operations and our strategic initiatives. An interruption in our access to external financing orfinancial transactions to hedge risk could adversely affect our business prospects and financial condition. See furtherinformation regarding our liquidity in “Capital Resources and Liquidity” under Item 7 and in Note 9 to theconsolidated financial statements under Item 8 of this Annual Report on Form 10-K.
Regulatory authorities in the U.S., European Union and elsewhere are taking a more aggressiveapproach to regulating hazardous materials and other substances, and those regulations could affect sales ofour products.
Legislation and regulations concerning hazardous materials and other substances can restrict the sale ofproducts and/or increase the cost of producing them. Some of our products are subject to restrictions under lawsor regulations such as California’s Proposition 65 and the EU’s chemical substances directive. The EU“REACH” registration system requires us to perform studies of some of our products or components of ourproducts and to register the information in a central database, increasing the cost of these products. As a result ofsuch regulations, our ability to sell certain products may be curtailed and customers may avoid purchasing someproducts in favor of less regulated, less hazardous or less costly alternatives. It may be impractical for us tocontinue manufacturing heavily regulated products, and we may incur costs to shut down or transition suchoperations to alternative products. These circumstances could adversely affect our business, including our salesand operating profits.
12

Our operations are subject to operating hazards and to stringent environmental, health and safetyregulations, and compliance with those regulations could require us to make significant investments.
Our production facilities are subject to hazards associated with the manufacture, handling, storage, andtransportation of chemical materials and products. These hazards can cause personal injury and loss of life, severedamage to, or destruction of, property and equipment and environmental contamination and other environmentaldamage and could have an adverse effect on our business, financial condition or results of operations.
We strive to maintain our production facilities and conduct our manufacturing operations in a manner that issafe and in compliance with all applicable environmental, health and safety regulations. Compliance with changingregulations, or other circumstances, may require us to make significant capital investments, incur training costs,make changes in manufacturing processes or product formulations, or incur costs that could adversely affect ourprofitability, and violations of these laws could lead to substantial fines and penalties. These costs may not affectcompetitors in the same way due to differences in product formulations, manufacturing locations or other factors,and we could be at a competitive disadvantage, which might adversely affect financial performance.
Our business could be adversely affected by safety, environmental and product stewardship issues.
We may be impacted by and may not be able to adequately address safety, human health, product liability andenvironmental risks associated with our current and historical products, product life cycles, and productionprocesses and the obligations that follow from them. This could adversely impact employees, communities,stakeholders, the environment, our reputation and our business, financial condition, and the results of ouroperations. Public perception of the risks associated with our products, their respective life cycles, and productionprocesses could impact product acceptance and influence the regulatory environment in which we operate.
We are exposed to lawsuits, governmental investigations and proceeding relating to current and historicaloperations and products, which could harm our business.
We are from time to time exposed to certain lawsuits, governmental investigations and proceedings relatingto current and historical operations and products, which may include claims involving product liability,infringement of intellectual property rights of third parties, environmental compliance, hazardous materials, workplace safety, employment contract and other claims. Due to the uncertainties of litigation, we can give noassurance that we will prevail on claims made against us in the lawsuits that we currently face or that additionalclaims will not be made against us in the future. We do not believe that lawsuits we currently face are likely tohave a material adverse effect on our business, operating results or financial condition. Lawsuits or claims, ifthey were to result in a ruling adverse to us or otherwise result in an obligation on the part of the Company, couldgive rise to substantial liability, which could have a material adverse effect on our business, operating results orfinancial condition.
Sales of our products to certain customers or into certain industries may expose us to different andcomplex regulatory regimes.
We seek to expand our customer base and the industries into which we sell. Selling products to certaincustomers or into certain industries, such as governments or the defense industry, requires compliance withregulatory regimes that can be complex and difficult to navigate. Our failure to comply with these regulationscould result in liabilities or damage to our reputation, which could negatively impact our business, financialcondition, or results of operations.
If we are unable to protect our intellectual property rights, including trade secrets, or to successfullyresolve claims of infringement brought against us, our product sales and financial performance could beadversely affected.
Our performance may depend in part on our ability to establish, protect and enforce intellectual propertyrights with respect to our products, technologies and proprietary rights and to defend against any claims of
13

infringement, which involves complex legal, scientific and factual questions and uncertainties. We may have torely on litigation to enforce our intellectual property rights. The intellectual property laws and practice of somecountries may not protect our interests to the same extent as the laws and practices of the U.S. In addition, wemay face claims of infringement that could interfere with our ability to use technology or other intellectualproperty rights that are material to our business operations. If litigation that we initiate is unsuccessful, we maynot be able to protect the value of some of our intellectual property. In the event a claim of infringement againstus is successful, we may be required to pay royalties or license fees to continue to use technology or otherintellectual property rights that we have been using or we may be unable to obtain necessary licenses from thirdparties at a reasonable cost or within a reasonable time.
We have limited or no redundancy for certain of our manufacturing operations, and damage to ourfacilities or interference with our operations could interrupt our business, increase our costs of doing businessand impair our ability to deliver our products on a timely basis.
If certain of our existing production facilities become incapable of manufacturing products for any reason,including through interruption of our supply chain, we may be unable to meet production requirements, we maylose revenue and we may not be able to maintain our relationships with our customers. Without operation ofcertain existing production facilities, we may be unable or limited in our ability to deliver products until werestore the manufacturing capability at the particular facility, find an alternative manufacturing facility or arrangean alternative source of supply. Although we carry business interruption insurance to cover lost revenue andprofits in an amount we consider adequate, this insurance does not cover all possible situations or expenses. Wemay not be able to recover from or be compensated for the loss of opportunity and potential adverse impact onrelations with our existing customers resulting from our inability to produce and deliver products for them.
Our multi-jurisdictional tax structure may not provide favorable tax efficiencies.
We conduct our business operations in a number of countries and are subject to taxation in thosejurisdictions. While we seek to minimize our worldwide effective tax rate, our corporate structure may notoptimize tax efficiency opportunities. We develop our tax position based upon the anticipated nature andstructure of our business and the tax laws, administrative practices and judicial decisions now in effect in thecountries in which we have assets or conduct business, which are subject to change or differing interpretations. Inaddition, our effective tax rate could be adversely affected by several other factors, including: increases inexpenses that are not deductible for tax purposes, the tax effects of restructuring charges or purchase accountingfor acquisitions, changes related to our ability to ultimately realize future benefits attributed to our deferred taxassets, including those related to other-than-temporary impairment, and a change in our decision to indefinitelyreinvest foreign earnings. Further, we are subject to review and audit by both domestic and foreign taxauthorities, which may result in adverse decisions. Increased tax expense could have a negative effect on ouroperating results and financial condition.
We have significant deferred tax assets, and if we are unable to utilize these assets, our results ofoperations may be adversely affected.
To fully realize the carrying value of our net deferred tax assets, we will have to generate adequate taxableprofits in various tax jurisdictions. At December 31, 2018, we had $81.2 million of net deferred tax assets, aftervaluation allowances. If we do not generate adequate profits within the time periods required by applicable taxstatutes, the carrying value of the tax assets will not be realized. If it becomes unlikely that the carrying value ofour net deferred tax assets will be realized, the valuation allowances may need to be increased in ourconsolidated financial statements, adversely affecting results of operations. Further information on our deferredtax assets is presented in Note 11 to the consolidated financial statements under Item 8 of this Annual Report onForm 10-K.
14

U.S. federal income tax reform could adversely affect us.
On December 22, 2017, U.S. federal tax legislation, commonly referred to as the Tax Cuts and Jobs Act (the“Tax Act”), was signed into law, significantly reforming the U.S. Internal Revenue Code. The Tax Act, amongother things, includes changes to U.S. federal tax rates, imposes significant additional limitations on thedeductibility of interest, allows for the expensing of capital expenditures, creates a new minimum tax on certainforeign-sourced earnings and modifies or repeals many business deductions and credits. The Act contains manyprovisions which continue to be clarified through new regulations and we continue to examine the impact the TaxAct may have on our business.
Interest rates on some of our borrowings are variable, and our borrowing costs could be adverselyaffected by interest rate increases.
Portions of our debt obligations have variable interest rates. Generally, when interest rates rise, our cost ofborrowings increases. We estimate, based on the debt obligations outstanding at December 31, 2018, that a onepercent increase in interest rates would cause interest expense to increase by $2.7 million annually. Althoughinterest rates have remained relatively stable over the past few years, future increases could raise our cost ofborrowings and adversely affect our financial performance. See further information regarding our interest rateson our debt obligations in “Quantitative and Qualitative Disclosures about Market Risk” under Item 7A and inNote 9 to the consolidated financial statements under Item 8 of this Form 10-K.
If we are unable to manage our general and administrative expenses, our business, financial condition orresults of operations could be negatively impacted.
We may not be able to effectively manage our administrative expense in all circumstances. While weattempt to effectively manage such expenses, including through projects designed to create administrativeefficiencies, increases in staff-related and other administrative expenses may occur from time to time. We havemade significant efforts to achieve general and administrative cost savings and improve our operationalperformance. As a part of these initiatives, we have and will continue to consolidate business and managementoperations and enter into arrangements with third parties offering cost savings. It cannot be assured that ourstrategies to reduce our general and administrative costs and improve our operating performance will besuccessful or achieve the anticipated savings.
We are subject to stringent labor and employment laws in certain jurisdictions in which we operate, weare party to various collective bargaining arrangements, and our relationship with our employees coulddeteriorate, which could adversely impact our operations.
A majority of our full-time employees are employed outside the U.S. In certain jurisdictions where weoperate, labor and employment laws are relatively stringent and, in many cases, grant significant job protection tocertain employees, including rights on termination of employment. In addition, in certain countries where weoperate, our employees are members of unions or are represented by works councils. We are often required toconsult with and seek the consent or advice of these unions and/or works councils. These regulations and laws,coupled with the requirement to seek consent or consult with the relevant unions or works councils, could have asignificant impact on our flexibility in managing costs and responding to market changes.
Furthermore, approximately 11.6% of our U.S. employees as of December 31, 2018, are subject tocollective bargaining arrangements or similar arrangements. Approximately 2.2% of all U.S. employees areaffected by a labor agreement that expires in 2019. While we expect to be able to renew these agreementswithout significant disruption to our business when they are scheduled to expire, there can be no assurance thatwe will be able to negotiate labor agreements on satisfactory terms or that actions by our employees will not bedisruptive to our business. If these workers were to engage in a strike, work stoppage or other slowdown or ifother employees were to become unionized, we could experience a significant disruption of our operations and/or
15

higher ongoing labor costs, which could adversely affect our business, financial condition and results ofoperations.
Employee benefit costs, especially postretirement costs, constitute a significant element of our annualexpenses, and funding these costs could adversely affect our financial condition.
Employee benefit costs are a significant element of our cost structure. Certain expenses, particularlypostretirement costs under defined benefit pension plans and healthcare costs for employees and retirees, mayincrease significantly at a rate that is difficult to forecast and may adversely affect our financial results, financialcondition or cash flows. Changes in the applicable discount rate can affect our postretirement obligations.Declines in global capital markets may cause reductions in the value of our pension plan assets. Suchcircumstances could have an adverse effect on future pension expense and funding requirements. Furtherinformation regarding our retirement benefits is presented in Note 13 to the consolidated financial statementsunder Item 8 of this Annual Report on Form 10-K.
We are subject to risks associated with outsourcing functions to third parties.
We have entered into outsourcing agreements with third parties, and rely on such parties, to provide certainservices in support of our business. One such vendor provides a number of business services related to ourinformation systems and finance and accounting activity. Arrangements with third-party service providers maymake our operations vulnerable if vendors fail to provide the expected service or there are changes in their ownoperations, financial condition, or other matters outside of our control. If these service providers are unable toperform to our requirements or to provide the level of service expected, our operating results and financialcondition may suffer and we may be forced to pursue alternatives to provide these services, which could result indelays, business disruptions and additional expenses.
There are risks associated with the manufacture and sale of our materials into industries that makeproducts for sensitive applications.
We manufacture and sell materials to parties that make products for sensitive applications, such as medicaldevices. The supply of materials that enter the human body involves the risk of illness or injury to consumers, aswell as commercial risks. Injury to consumers could result from, among other things, improper use, tampering byunauthorized third parties, or the introduction into the material of foreign objects, substances, chemicals andother agents during the manufacturing, packaging, storage, handling or transportation phases. Shipment ofadulterated materials may be a violation of law and may lead to an increased risk of exposure to product liabilityor other claims, product recalls and increased scrutiny by federal and state regulatory agencies. Such claims orliabilities may not be covered by our insurance or by any rights of indemnity or contribution that we may haveagainst third parties. In addition, the negative publicity surrounding any assertion that our materials causedillness or injury could have a material adverse effect on our reputation with existing and potential customers,which could negatively impact our business, operating results or financial condition.
If we are unable to attract and retain key personnel our business could be materially adversely affected.
Our business substantially depends on the continued service of key members of our management. The lossof the services of a key members of our management could have a material adverse effect on our business. Ourfuture success will also depend on our ability to attract and retain highly skilled personnel, such as engineering,marketing and senior management professionals. Competition for these employees is intense, and we couldexperience difficulty from time to time in hiring and retaining the personnel necessary to support our business. Ifwe do not succeed in retaining our current employees and attracting new skilled employees, our business couldbe materially adversely affected.
16

We are exposed to intangible asset risk, and a write down of our intangible assets could have an adverseimpact to our operating results and financial position.
We have recorded intangible assets, including goodwill, in connection with business acquisitions. We arerequired to perform goodwill impairment tests on at least an annual basis and whenever events or circumstancesindicate that the carrying value may not be recoverable from estimated future cash flows. As a result of ourannual and other periodic evaluations, we may determine that the intangible asset values need to be written downto their fair values, which could result in material charges that could be adverse to our operating results andfinancial position. See further information regarding our goodwill and other intangible assets in “CriticalAccounting Policies” under Item 7 and in Note 8 to the consolidated financial statements under Item 8 of thisForm 10-K.
We may not be successful in implementing our strategies to increase our return on invested capital,internal rate of return, or other return metrics.
We are taking steps to generate a higher return our investments. There are risks associated with theimplementation of these steps, which may be complicated and may involve substantial capital investment. To theextent we fail to achieve these strategies, our results of operations may be adversely affected.
Many of our assets are encumbered by liens that have been granted to lenders, and those liens affect ourflexibility to dispose of property and businesses.
Certain of our debt obligations are secured by substantially all of our assets. These liens could reduce ourability and/or extend the time to dispose of property and businesses, as these liens must be cleared or waived bythe lenders prior to any disposition. These security interests are described in more detail in Note 9 to theconsolidated financial statements under Item 8 of this Annual Report on Form 10-K.
We are exposed to risks associated with acts of God, terrorists and others, as well as fires, explosions,wars, riots, accidents, embargoes, natural disasters, strikes and other work stoppages, quarantines and othergovernmental actions, and other events or circumstances that are beyond our control.
Ferro is exposed to risks from various events that are beyond our control, which may have significant effectson our results of operations. While we attempt to mitigate these risks through appropriate loss preventionmeasures, insurance, contingency planning and other means, we may not be able to anticipate all risks or toreasonably or cost-effectively manage those risks that we do anticipate. As a result, our operations could beadversely affected by circumstances or events in ways that are significant and/or long lasting.
The risks and uncertainties identified above are not the only risks that we face. Additional risks anduncertainties not presently known to us or that we currently believe to be immaterial also may adversely affectus. If any known or unknown risks and uncertainties develop into actual events, these developments could havematerial adverse effects on our financial position, results of operations, and cash flows.
Item 1B — Unresolved Staff Comments
None.
Item 2 — Properties
We lease our corporate headquarters offices, which are located at 6060 Parkland Blvd., Mayfield Heights,Ohio. The Company owns other corporate facilities worldwide. We own principal manufacturing plants thatrange in size from 21,000 sq. ft. to over 700,000 sq. ft. Plants we own with more than 250,000 sq. ft. are located
17

in Spain; Germany; Belgium; Colombia; Mexico; Cleveland, Ohio; and Penn Yan, New York. The locations ofthese principal manufacturing plants by reportable segment are as follows:
Color Solutions-U.S.: Penn Yan, New York and Norcross, Georgia. Outside the U.S.: Colombia, China,India, Belgium, France, Romania and Spain.
Performance Colors and Glass-U.S.: Washington, Pennsylvania; King of Prussia, Pennsylvania and Orrville,Ohio. Outside the U.S.: Brazil, China, France, Germany, Mexico, Spain, and the United Kingdom.
Performance Coatings-U.S.: Cleveland, Ohio. Outside the U.S.: Argentina, Brazil, China, Egypt, France,Indonesia, Italy, Mexico, Spain, Poland, Portugal, Thailand and the United Kingdom.
In addition, we lease manufacturing facilities for the Performance Colors and Glass segment in the UnitedKingdom; Germany; Japan; Israel; Turkey; North Adams, Massachusetts, and Vista, California. We also leasemanufacturing facilities for the Performance Coatings segment in Italy and Poland. We also lease manufacturingfacilities in Taiwan for Color Solutions. In some instances, the manufacturing facilities are used for two or moresegments. Leased facilities range in size from 12,000 sq. ft. to over 100,000 sq. ft.
Item 3 — Legal Proceedings
In November 2017, Suffolk County Water Authority filed a complaint, Suffolk County Water Authority v.The Dow Chemical Company et al., against the Company and a number of other companies in the U.S. FederalCourt for the Eastern District of New York with regard to the product 1,4 dioxane. The plaintiff alleges, amongother things, that the Suffolk County water supply is contaminated with 1,4 dioxane and that the defendants areliable for unspecified costs of cleanup and remediation of the water supply, among other damages. The Companyhas not manufactured 1,4 dioxane since 2008, denies the allegations related to liability for the plaintiff’s claims,and is vigorously defending this proceeding. In December 2018, additional complaints were filed in the samecourt by 10 other New York municipal water authorities against the company and others making substantiallysimilar allegations regarding the contamination of their respective water supplies with 1,4 dioxane. The Companyis likewise vigorously defending these additional actions. The Company currently does not expect the outcome ofthese proceedings to have a material adverse impact on its consolidated financial condition, results of operations,or cash flows, net of any insurance coverage. However, it is not possible to predict the ultimate outcome of theseproceedings due to the unpredictable nature of litigation.
In addition to the proceedings described above, the Company and its consolidated subsidiaries are subjectfrom time to time to various claims, lawsuits, investigations, and proceedings related to products, services,contracts, environmental, health and safety, employment, intellectual property, and other matters, including withrespect to divested businesses. The outcome of such matters is unpredictable, our assessment of them maychange, and resolution of them could have a material adverse effect on the Company’s consolidated financialposition, results of operations, or cash flows. We do not currently expect the resolution of such matters tomaterially affect the consolidated financial position, results of operations, or cash flows of the Company.
Item 4 — Mine Safety Disclosures
Not applicable.
18

Executive Officers of the Registrant
The executive officers of the Company as of February 27, 2019, are listed below, along with their ages andbusiness experience during the past five years. The year indicates when the individual was named to the indicatedposition with Ferro, unless otherwise indicated.
Peter T. Thomas — 63
Chairman of the Board of Directors, 2014
President and Chief Executive Officer, 2013
Mark H. Duesenberg — 57
Vice President, General Counsel and Secretary, 2008
Benjamin J. Schlater — 43
Group Vice President and Chief Financial Officer, 2019
Vice President and Chief Financial Officer, 2016
Vice President, Corporate Development and Strategy, 2015
Treasurer and head of corporate development, strategic and financial planning and risk management,Veyance Technologies, a global manufacturing company, 2007
19

PART II
Item 5 — Market for Registrant’s Common Equity, Related Stockholder Matters, and Issuer Purchases ofEquity Securities
Our common stock is listed on the New York Stock Exchange under the ticker symbol FOE. On January 31,2019, we had 824 shareholders of record for our common stock, and the closing price of the common stock was$16.67 per share.
The chart below compares Ferro’s cumulative total shareholder return for the five years endedDecember 31, 2018, to that of the Standard & Poor’s 500 Index and the Standard & Poor’s MidCap SpecialtyChemicals Index. In all cases, the information is presented on a dividend-reinvested basis and assumesinvestment of $100.00 on December 31, 2013. At December 31, 2018, the closing price of our common stockwas $15.68 per share.
COMPARISON OF FIVE-YEARCUMULATIVE TOTAL RETURNS*
$200
$150
$100
$50
$02013 2014 2015 2016 2017 2018
FOES&P 500S&P MidCap Specialty Chemicals Index
Our Board of Directors has not declared any dividends on common stock during 2018 or 2017. TheCompany’s Amended Credit Facility restricts the amount of dividends we can pay on our common stock. Anyfuture dividends declared would be at the discretion of our Board of Directors and would depend on our financialcondition, results of operations, cash flows, contractual obligations, the terms our financing agreements at the time adividend is considered, and other relevant factors. For further discussion, see Management’s Discussion andAnalysis of Financial Condition and Results of Operations under Item 7 of this Annual Report on Form 10-K.
In October 2018, the Company’s Board of Directors approved a new share repurchase program under whichthe Company is authorized to repurchase up to an additional $50 million of the Company’s outstanding commonstock on the open market, including through Rule 10b5-1 plans, in privately negotiated transactions, or otherwise.This new program is in addition to the $100 million of authorization previously approved and announced.
The Company repurchased 1,470,791 shares of common stock at an average price of $19.59 per share for atotal cost of $28.8 million during 2018. No repurchases were made during 2017. As of December 31, 2018,$71.2 million was available to purchase common stock under the programs.
20

The following table summarizes purchases of our common stock by the Company and affiliated purchasersduring the three months ended December 31, 2018:
TotalNumber
ofShares
Purchased
AveragePricePaidper
Share
TotalNumber of
SharesPurchasedas Part ofPublicly
AnnouncedPlans or
Programs
MaximumDollar
Amount thatMay Yet BePurchasedUnder thePlans or
Programs
(Dollars in thousands, except for per share amounts)
October 1, 2018 to October 31, 2018 394,279 $17.75 6,998,284 $76,002,240
November 1, 2018 to November 30, 2018 268,696 $17.90 4,809,720 $71,192,520
December 1, 2018 to December 31, 2018 — $ — — $71,192,520
Total 662,975 11,808,004
Item 6 — Selected Financial Data
The following table presents selected financial data for the last five years ended December 31st:
2018 2017 2016 2015 2014
(Dollars in thousands, except for per share data)
Net sales $ 1,612,408 $ 1,396,742 $ 1,145,292 $ 1,075,341 $ 1,111,626
Income from continuing operations 80,946 57,768 44,577 99,883 (8,609)
Basic earnings (loss) per share fromcontinuing operations attributable toFerro Corporation common shareholders 0.95 0.68 0.52 1.16 (0.10)
Diluted earnings (loss) per share fromcontinuing operations attributable toFerro Corporation common shareholders 0.94 0.67 0.51 1.14 (0.10)
Cash dividends declared per commonshares — — — — —
Total assets 1,812,460 1,682,202 1,283,769 1,225,351 1,091,554
Long-term debt, including current portion 821,347 735,267 563,033 470,805 302,383
In 2015, we adopted the provisions of ASU 2015-03. The ASU requires debt issuance costs for term loans tobe presented in the balance sheet as a reduction of the related debt liability rather than an asset. The adoptionresulted in the reclassification of $5.3 million of unamortized debt issuance costs related to the term loan fromTotal assets to a reduction in Long-term debt, including current portion within the financial data above as ofDecember 31, 2014.
In 2014, we commenced a process to market for sale all of the assets in our Polymer Additives reportablesegment. During 2014, we sold substantially all of the assets related to our North America-based PolymerAdditives business, which is presented as discontinued operations in 2014. In 2016, we completed the dispositionof the Europe-based Polymer Additives business, which is presented as discontinued operations in 2016 through2014.
In 2014, we sold substantially all of the assets in our Specialty Plastics business, which is presented asdiscontinued operations in 2014.
21

Item 7 — Management’s Discussion and Analysis of Financial Condition and Results of Operations
Overview
During the year ended December 31, 2018, net sales increased $215.7 million, or 15.4%, compared with2017. The increase was driven by higher sales in Performance Coatings, Performance Colors and Glass andColor Solutions of $139.9 million, $42.8 million and $33.0 million, respectively. Gross profit increased$39.7 million compared with 2017. The increase in gross profit was attributable to increases across all of oursegments, with increases in Performance Coatings, Color Solutions and Performance Colors and Glass and of$19.9 million, $11.2 million and $9.9 million, respectively. As a percentage of net sales, gross profit ratedecreased approximately 150 basis points to 28.3%, from 29.8% in the prior year.
For the year ended December 31, 2018, selling, general and administrative (“SG&A”) expenses increased$13.1 million, or 5.0%, compared with 2017. As a percentage of net sales, SG&A expenses decreased 170 basispoints from 19.0% in 2017 to 17.3% in 2018.
For the year ended December 31, 2018, net income was $80.9 million, compared with net income of$57.8 million in 2017, and net income attributable to common shareholders was $80.1 million, compared withnet income attributable to common shareholders of $57.1 million in 2017.
As previously disclosed on January 17, 2019, the Company is in the process of expanding its productionfacility in Villagran, Mexico, which will become the Company’s Manufacturing Center of Excellence for theAmericas. The expansion of the Villagran facility is expected to significantly increase the revenue generatedfrom products manufactured at that facility. With the expanded capacity in Villagran, the Company (i) willdiscontinue the production of glass enamels, other industrial specialty products, such as architectural glasscoatings, and pigments at its Washington, Pennsylvania facility over the course of 2019 and into 2020, (ii) plansto discontinue production of porcelain enamel products at its Cleveland, Ohio facility and (iii) will closeadditional facilities in Latin America. As part of this optimization initiative, the Company is expanding its Kingof Prussia, Pennsylvania facility. Conductive glass coatings production will be discontinued at the Washington,Pennsylvania facility and will be produced at the King of Prussia, Pennsylvania facility, and the Company’soperations at its Vista, California facility will be transferred to the King of Prussia, Pennsylvania facility. Inaddition, the Company will be moving its Americas research and development center for glass products to itstechnology center in Independence, Ohio, where the Company is investing in expanded laboratory facilities. TheWashington, Pennsylvania facility is expected to remain in operation until sometime in 2020. Production ofspecialty glasses for electronics applications will continue at the Cleveland, Ohio facility, and the Company willinvest in the facility to equip it to serve as a logistics center. The Cleveland, Ohio facility also will serve as theAmericas research and development center for the porcelain enamel business.
2018 Transactional Activity
Transactions undertaken in 2018 included the following business acquisitions:
Acquisition of Quimicer, S.A. (“Quimicer”): As discussed in Note 5, in the fourth quarter of 2018, theCompany acquired 100% of the equity interests of Quimicer, for €27.0 million (approximately$31.3 million), including the assumption of debt of €5.2 million (approximately $6.1 million).
Acquisition of UWiZ Technology Co., Ltd. (“UWiZ”): As discussed in Note 5, in the third quarter of 2018,the Company acquired 100% of the equity interest of UWiZ for TWD823.4 million (approximately$26.9 million).
Acquisition of Ernst Diegel GmbH (“Diegel”): As discussed in Note 5, in the third quarter of 2018, theCompany acquired 100% of the equity interests of Diegel, including the real property of a related party, for€12.1 million (approximately $14.0 million).
Acquisition of MRA Laboratories, Inc. (“MRA”): As discussed in Note 5, in the second quarter of 2018, theCompany acquired 100% of the equity interests of MRA, for $16.0 million.
22

Acquisition of PT Ferro Materials Utama. (“FMU”): As discussed in Note 5, in the second quarter of 2018,the Company acquired 66% of the equity interests of FMU, for $2.7 million in cash, in addition to theforgiveness of debt of $9.2 million, bringing our total ownership to 100%.
2017 Transactional Activity
Transactions undertaken in 2017 included the following business acquisitions:
Acquisition of Endeka Group (“Endeka”): As discussed in Note 5, in the fourth quarter of 2017, theCompany acquired 100% of the equity interests of Endeka, a global producer of high-value coatings and keyraw materials for the ceramic tile market, for €72.8 million (approximately $84.8 million).
Acquisition of Gardenia Quimica S.A. (“Gardenia”): As discussed in Note 5, in the third quarter of 2017,the Company acquired a majority interest in Gardenia for $3.0 million. On March 1, 2018, the Companyacquired the remaining equity interest in Gardenia for $1.4 million.
Acquisition of Dip Tech Ltd. (“Dip-Tech”): As discussed in Note 5, in the third quarter of 2017, theCompany acquired 100% of the equity interests of Dip-Tech, a leading provider of digital printing solutionsfor glass, for $77.0 million.
Acquisition of S.P.C. Group s.r.l. and Smalti per Ceramiche, s.r.l (together “SPC”): As discussed in Note 5,in the second quarter of 2017, the Company acquired 100% of the equity interests of SPC, for €18.7 million(approximately $20.3 million).
Outlook
The Company delivered strong performance throughout 2018 with sales and gross profit improvementsdriven by increases in organic growth, contributions from businesses acquired and optimization initiatives. Wecontinue to execute the dynamic innovation and optimization phase of our value creation strategy, which includesorganic and inorganic growth and optimization. We expect organic growth through new products and positioningour portfolio to continue to transition to the higher end of our target markets. We also intend to advance thebusiness through acquisitions, and investments in technology, facilities and equipment. We are implementingoptimization initiatives throughout the Company to further improve efficiency, productivity and profitability. Wewill deploy capital for strategic acquisitions, share repurchases or debt repayment depending on what we deemappropriate based on market conditions, shareholder value creation and long term business objectives.
Raw materials costs continued to increase through the majority of 2018, putting pressure on gross margin.Over the long term, we are confident in our ability to offset such increases with reformulated compounds, newproduct innovations, pricing initiatives and optimization efforts. We believe that, when taken as a whole, rawmaterial prices have now peaked and are decreasing.
We perceive a degree of macro-economic uncertainty and the potential for slower growth in the outlook for2019 across several industries. We expect demand will continue for our technology-driven functional coatingsand color solutions in the niche markets we focus on, and that we will continue to develop innovative newproducts. We have identified a number of optimization opportunities in our manufacturing and logisticsoperations and will continue to implement strategic optimization initiatives.
Foreign currency rates may continue to be volatile through 2019 and changes in interest rates couldadversely impact reported results. We expect cash flow from operating activities to continue to be positive for2019, providing additional liquidity.
Factors that could adversely affect our future performance include those described under the heading “RiskFactors” in Item 1A of Part I of this Annual Report on Form 10-K for the year ended December 31, 2018.
23

Results of Operations — Consolidated
Comparison of the years ended December 31, 2018 and 2017
For the year ended December 31, 2018, net income was $80.9 million, compared with net income of$57.8 million in 2017. For the year ended December 31, 2018, net income attributable to common shareholderswas $80.1 million, or $0.95 earnings per share, compared with net income attributable to common shareholdersof $57.1 million, or $0.68 earnings per share in 2017.
Net Sales
2018 2017 $ Change % Change
(Dollars in thousands)
Net sales $ 1,612,408 $ 1,396,742 $ 215,666 15.4%Cost of sales 1,156,475 980,521 175,954 17.9%
Gross profit $ 455,933 $ 416,221 $ 39,712 9.5%
Gross profit as a % of net sales 28.3% 29.8%
Net sales increased by $215.7 million, or 15.4%, in the year ended December 31, 2018, compared with theprior year, with increased sales in Performance Coatings, Performance Colors and Glass and Color Solutions of$139.9 million, $42.8 million and $33.0 million, respectively. The increase in net sales was driven by bothacquisitions and organic growth. Organic sales increased in Performance Coatings by $28.2 million, ColorSolutions by $28.1 million, and Performance Colors and Glass by $22.6 million.
Gross Profit
Gross profit increased $39.7 million, or 9.5%, in 2018 to $455.9 million, compared with $416.2 million in2017 and, as a percentage of net sales, it decreased 150 basis points to 28.3%. The increase in gross profit wasattributable to increases across all of our segments, with increases in Performance Coatings, Color Solutions andPerformance Colors and Glass of $19.9 million, $11.2 million and $9.9 million, respectively. The increase ingross profit was primarily attributable to favorable product pricing of $43.1 million, gross profit fromacquisitions of $34.1 million, higher sales volumes and mix of $7.5 million, favorable foreign currency impactsof $5.3 million and lower manufacturing and product costs of $2.8 million, partially offset by higher raw materialcosts of $51.8 million.
Geographic Revenues
The following table presents our sales on the basis of where sales originated.
2018 2017 $ Change % Change
(Dollars in thousands)
Geographic Revenues on a sales origination basisEMEA $ 852,775 $ 683,601 $ 169,174 24.7%
United States 379,914 356,482 23,432 6.6%
Asia Pacific 221,389 195,918 25,471 13.0%
Latin America 158,330 160,741 (2,411) (1.5)%
Net sales $ 1,612,408 $ 1,396,742 $ 215,666 15.4%
The increase in net sales of $215.7 million, compared with 2017, was driven by higher sales from EMEA,Asia Pacific and the United States, partially offset by a decrease in sales in Latin America. The increase in salesfrom EMEA was attributable to higher sales in Performance Coatings, Performance Colors and Glass and Color
24

Solutions of $129.2 million, $32.0 million and $8.0 million, respectively. The increase in sales from Asia Pacificwas attributable to higher sales in Performance Coatings, Performance Colors and Glass and Color Solutions of$13.9 million, $6.3 million and $5.3 million, respectively. The increase in sales from the United States wasattributable to higher sales in Color Solutions, Performance Colors and Glass and Performance Coatings of$18.2 million, $2.7 million and $2.6 million, respectively. The decrease in sales from Latin America wasattributable to lower sales in Performance Coatings of $5.8 million, partially mitigated by higher sales inPerformance Colors and Glass and Color Solutions of $1.9 million and $1.5 million, respectively.
The following table presents our sales on the basis of where sold products were shipped.
2018 2017 $ Change % Change
(Dollars in thousands)
Geographic Revenues on a shipped-to basisEMEA $ 803,282 $ 649,423 $ 153,859 23.7%
Asia Pacific 352,433 300,594 51,839 17.2%
United States 273,226 263,236 9,990 3.8%
Latin America 183,467 183,489 (22) (0.0)%
Net sales $ 1,612,408 $ 1,396,742 $ 215,666 15.4%
Selling, General and Administrative Expense
The following table includes SG&A components with significant changes between 2018 and 2017.
2018 2017 $ Change % Change
(Dollars in thousands)
Personnel expenses (excluding R&D personnel expenses) $ 127,359 $ 116,570 $ 10,789 9.3%
Research and development expenses 40,221 36,359 3,862 10.6%
Business development 11,627 16,481 (4,854) (29.5)%
Incentive compensation 8,476 12,581 (4,105) (32.6)%
Stock-based compensation 8,441 11,770 (3,329) (28.3)%
Intangible asset amortization 8,314 10,289 (1,975) (19.2)%
Pension and other postretirement benefits 1,289 1,190 99 8.3%
Bad debt 681 44 637 1,447.7%
All other expenses 72,158 60,134 12,024 20.0%
Selling, general and administrative expenses $ 278,566 $ 265,418 $ 13,148 5.0%
SG&A expenses were $13.1 million higher in 2018 compared with the prior year. As a percentage of netsales, SG&A expenses decreased 170 basis points from 19.0% in 2017 to 17.3% in 2018. The higher SG&Aexpenses compared with the prior year were primarily driven by businesses acquired within the last year. Theacquisitions were the primary driver of the increase in personnel expenses. The decrease in incentivecompensation is the result of the Company’s performance relative to targets for certain awards compared to theprior year and the decrease in stock-based compensation expense of $3.3 million is the result of the Company’sperformance relative to targets for certain awards compared with the prior year, as well as decreases in theCompany’s stock price.
25

The following table presents SG&A expenses attributable to sales, research and development, andoperations costs as strategic services and presents other SG&A costs as functional services.
2018 2017 $ Change % Change
(Dollars in thousands)
Strategic services $ 157,020 $ 138,551 $ 18,469 13.3%
Functional services 104,629 102,516 2,113 2.1%
Incentive compensation 8,476 12,581 (4,105) (32.6)%
Stock-based compensation 8,441 11,770 (3,329) (28.3)%
Selling, general and administrative expenses $ 278,566 $ 265,418 $ 13,148 5.0%
Restructuring and Impairment Charges
2018 2017 $ Change % Change
(Dollars in thousands)
Employee severance $ 5,794 $ 5,167 $ 627 12.1%
Equity method investment impairment — 1,566 (1,566) (100.0)%
Asset impairment — 1,176 (1,176) (100.0)%
Other restructuring costs 7,501 3,500 4,001 114.3%
Restructuring and impairment charges $ 13,295 $ 11,409 $ 1,886 16.5%
Restructuring and impairment charges increased $1.9 million in 2018, compared with 2017. The increasewas primarily related to costs associated with integration of recent acquisitions and optimization programs. Theincrease was partially offset by an “other than temporary impairment” charge on an equity method investment of$1.6 million and costs associated with a restructuring plan in Italy, which includes $1.2 million of assetimpairment associated with assets that were taken out of service in 2017, which didn’t occur in 2018.
Interest Expense
2018 2017 $ Change % Change
(Dollars in thousands)
Interest expense $ 32,252 $ 24,337 $ 7,915 32.5%
Amortization of bank fees 3,577 3,496 81 2.3%
Interest swap amortization (762) — (762) —%
Interest capitalization (1,696) (79) (1,617) NM%
Interest expense $ 33,371 $ 27,754 $ 5,617 20.2%
Interest expense in 2018 increased $5.6 million compared with 2017. The increase in interest expense wasprimarily due to an increase in the average long-term debt balance during 2018, compared with 2017, partiallyoffset by increased interest capitalization during 2018.
Income Tax Expense
In 2018, we recorded an income tax expense of $23.0 million, or 22.2 % of income before income taxes,compared to an income tax expense of $52.8 million, or 47.7% of income before income taxes in 2017. The 2018effective tax rate is greater than the statutory income tax rate of 21% primarily as a result of a net effect of a$7.9 million net expense related to foreign tax rate differences, $3.5 million net expense resulting from foreign
26

income tax audit settlements, $5.7 million net benefit related to tax credits and $4.1 million net benefit related tothe release of valuation allowances related to deferred tax assets that were utilized in the current year or whichare deemed no longer necessary based upon changes in the current and expected future years of operating profits.The 2017 effective tax rate is greater than the statutory income tax rate of 35% primarily as a result of a net effectof a $21.5 million expense related to re-measuring the U.S. deferred tax assets as a result of the Tax Act,$5.6 million net expense related to uncertain tax positions and $8.0 million benefit related to foreign tax ratedifferences.
On December 22, 2017, U.S. federal tax legislation, commonly referred to as the Tax Cut and Jobs Act (the“Tax Act”), was signed into law, significantly changing the U.S. corporate income tax system. These changesinclude a federal statutory rate reduction from 35% to 21% effective January 1, 2018. Changes in tax rates andtax law are accounted for in the period of enactment. Accordingly, the Company’s U.S. net deferred tax assetswere re-measured to reflect the reduction in the federal statutory rate, resulting in a $21.5 million increase inincome tax expense for the year ended December 31, 2017. The Tax Act also changed the U.S. taxation ofworldwide income. The Tax Act contains many provisions which continue to be clarified through newregulations. Consistent with the guidance of SEC Staff Accounting Bulletin No. 118, Income Tax AccountingImplications of the Tax Cuts and Jobs Act (“SAB 118”), we completed our analysis within 2018 consistent withthe guidance of SAB 118 and our initial determination of no tax due on the one-time mandatory deemedrepatriation tax on accumulated foreign subsidiaries’ previously untaxed foreign earnings and profits wasunchanged from our position at December 31, 2017.
Comparison of the years ended December 31, 2017 and 2016
For the year ended December 31, 2017, income from continuing operations was $57.8 million, comparedwith income from continuing operations of $44.6 million in 2016. For the year ended December 31, 2017, netincome was $57.8 million, compared with net loss of $19.9 million in 2016. For the year ended December 31,2017, net income attributable to common shareholders was $57.1 million, or $0.68 earnings per share, comparedwith net loss attributable to common shareholders of $20.8 million, or $0.25 loss per share in 2016.
Net Sales
2017 2016 $ Change % Change
(Dollars in thousands)
Net sales $ 1,396,742 $ 1,145,292 $ 251,450 22.0%
Cost of sales 980,521 788,914 191,607 24.3%
Gross profit $ 416,221 $ 356,378 $ 59,843 16.8%
Gross profit as a % of net sales 29.8% 31.1%
Net sales increased by $251.5 million, or 22.0%, in the year ended December 31, 2017, compared with theprior year, with increased sales in Color Solutions, Performance Colors and Glass and Performance Coatings of$111.2 million, $73.2 million and $67.0 million, respectively. The increase in net sales was driven by bothacquisitions and organic growth. Organic sales increased in Color Solutions by $39.6 million, PerformanceCoatings by $24.1 million and Performance Colors and Glass by $11.8 million.
Gross Profit
Gross profit increased $59.8 million, or 16.8%, in 2017 to $416.2 million, compared with $356.4 million in2016 and, as a percentage of net sales, it decreased 130 basis points to 29.8%. The increase in gross profit wasattributable to increases across all of our segments, with increases in Color Solutions, Performance Colors andGlass and Performance Coatings of $29.2 million, $23.6 million and $6.3 million, respectively. The increase ingross profit was primarily attributable to acquisitions of $46.9 million, lower manufacturing and product costs of$28.8 million, driven by higher volume and mix, as well as strategic purchasing actions, favorable product
27

pricing of $12.9 million, higher sales volumes and mix of $9.5 million, favorable foreign currency impacts of$0.3 million, partially offset by higher raw material costs of $39.3 million.
Geographic Revenues
The following table presents our sales on the basis of where sales originated.
2017 2016 $ Change % Change
(Dollars in thousands)
Geographic Revenues on a sales origination basisEMEA $ 683,601 $ 515,055 $ 168,546 32.7%
United States 356,482 300,187 56,295 18.8%
Asia Pacific 195,918 179,464 16,454 9.2%
Latin America 160,741 150,586 10,155 6.7%
Net sales $ 1,396,742 $ 1,145,292 $ 251,450 22.0%
The increase in net sales of $251.5 million, compared with 2016, was driven by higher sales from allregions. The increase in sales from EMEA was attributable to higher sales in Color Solutions, PerformanceCoatings and Performance Colors and Glass of $69.3 million, $56.4 million and $42.8 million, respectively. Theincrease in sales from the United States was primarily attributable to higher sales in Color Solutions andPerformance Colors and Glass of $33.0 million and $22.9 million, respectively. The increase in sales from LatinAmerica and Asia Pacific was attributable to higher sales across all segments.
The following table presents our sales on the basis of where sold products were shipped.
2017 2016 $ Change % Change
(Dollars in thousands)
Geographic Revenues on a shipped-to basisEMEA $ 649,423 $ 501,231 $ 148,192 29.6%
Asia Pacific 300,594 244,057 56,537 23.2%
United States 263,236 239,771 23,465 9.8%
Latin America 183,489 160,233 23,256 14.5%
Net sales $ 1,396,742 $ 1,145,292 $ 251,450 22.0%
Selling, General and Administrative Expense
The following table includes SG&A components with significant changes between 2017 and 2016.
2017 2016 $ Change % Change
(Dollars in thousands)
Personnel expenses (excluding R&D personnel expenses) $ 116,570 $ 100,039 $ 16,531 16.5%
Research and development expenses 36,359 27,327 9,032 33.1%
Business development 16,481 12,890 3,591 27.9%
Incentive compensation 12,581 10,852 1,729 15.9%
Stock-based compensation 11,770 7,245 4,525 62.5%
Intangible asset amortization 10,289 6,199 4,090 66.0%
Pension and other postretirement benefits 1,190 939 251 26.7%
Bad debt 44 1,383 (1,339) (96.8)%
All other expenses 60,134 60,412 (278) (0.5)%
Selling, general and administrative expenses $ 265,418 $ 227,286 $ 38,132 16.8%
28

SG&A expenses were $38.1 million higher in 2017 compared with the prior year. As a percentage of netsales, SG&A expenses decreased 80 basis points from 19.8% in 2016 to 19.0% in 2017. The higher SG&Aexpenses compared with the prior year are primarily driven by businesses acquired within the last year. Theacquisitions were the primary driver of the increase in personnel expenses, business development expenses andaccounted for the entire increase in intangible asset amortization. The increase in stock-based compensationexpense of $4.5 million is the result of the Company’s performance relative to targets for certain awardscompared with the prior year, as well as increases in the Company’s stock price.
The following table presents SG&A expenses attributable to sales, research and development, andoperations costs as strategic services and presents other SG&A costs as functional services.
2017 2016 $ Change % Change
(Dollars in thousands)
Strategic services $ 138,551 $ 116,807 $ 21,744 18.6%
Functional services 102,516 92,382 10,134 11.0%
Incentive compensation 12,581 10,852 1,729 15.9%
Stock-based compensation 11,770 7,245 4,525 62.5%
Selling, general and administrative expenses $ 265,418 $ 227,286 $ 38,132 16.8%
Restructuring and Impairment Charges
2017 2016 $ Change % Change
(Dollars in thousands)
Employee severance $ 5,167 $ 1,353 $ 3,814 281.9%
Equity method investment impairment 1,566 — 1,566 NM%
Asset impairment 1,176 — 1,176 NM%
Goodwill impairment — 13,198 (13,198) (100.0)%
Other restructuring costs 3,500 1,356 2,144 158.1%
Restructuring and impairment charges $ 11,409 $ 15,907 $ (4,498) (28.3)%
Restructuring and impairment charges decreased by $4.5 million in 2017, compared with 2016. Thedecrease was primarily attributable to an impairment charge in 2016 within our Tile Coating Systems reportingunit, a component of the Performance Coatings operating segment of $13.2 million. The decrease was partiallyoffset by an increase due to an “other than temporary impairment” charge on an equity method investment of$1.6 million and costs associated with a restructuring plan in Italy, which includes $1.2 million of assetimpairment associated with assets that have been taken out of service, as well as actions taken in connection withrecent acquisitions designed to achieve our targeted synergies.
Interest Expense
2017 2016 $ Change % Change
(Dollars in thousands)
Interest expense $24,337 $ 20,246 $ 4,091 20.2%
Amortization of bank fees 3,496 1,353 2,143 158.4%
Interest capitalization (79) (52) (27) 51.9%
Interest expense $27,754 $ 21,547 $ 6,207 28.8%
Interest expense in 2017 increased $6.2 million compared with 2016. The increase in interest expense wasdue to an increase in the average long-term debt balance during 2017, compared with 2016 and an increase of the
29

amortization of debt issuance costs associated with the Credit Facility, partially offset by a favorable averageborrowing rate as a result of the refinancing completed in the first quarter of 2017.
Income Tax Expense
On December 22, 2017, U.S. federal tax legislation, commonly referred to as the Tax Cuts and Jobs Act (the“Tax Act”), was signed into law, significantly changing the U.S. corporate income tax system. These changesinclude a federal statutory rate reduction from 35% to 21% effective January 1, 2018. Changes in tax rates andtax law are accounted for in the period of enactment. Accordingly, the Company’s U.S. net deferred tax assetswere re-measured to reflect the reduction in the federal statutory rate, resulting in a $21.5 million increase inincome tax expense for the year ended December 31, 2017. The Tax Act also changed the U.S. taxation ofworldwide income. Accordingly, we have assessed the one-time mandatory deemed repatriation tax onaccumulated foreign subsidiaries’ previously untaxed foreign earnings and profits and have preliminarilydetermined no tax is due.
Additional provisions of the Tax Act which may have an impact to the Company include, but are not limitedto, the repeal of the domestic production deduction, limitations on interest expense, accelerated depreciation thatwill allow for full expensing of qualified property, provisions related to performance-based executivecompensation and international provisions, which generally establish a territorial-style system for taxing foreign-source income of domestic multinational corporations.
We have recognized the provisional tax impacts related to the Tax Act under the guidance of SEC StaffAccounting Bulletin No. 118, Income Tax Accounting Implications of the Tax Cuts and Jobs Act (“SAB 118”). Theultimate impact may differ from these provisional amounts due to additional analysis, changes in interpretations andassumptions, additional regulatory guidance that may be issued, and actions we may take as a result of the Tax Act.Pursuant to SAB 118, adjustments to the provisional amounts recorded by the Company as of December 31, 2017,that are identified within a subsequent measurement period of up to one year from the enactment date will beincluded as an adjustment to income tax expense in the period the amounts are determined.
In 2017, we recorded an income tax expense of $52.8 million, or 47.7% of income before income taxes,compared to an income tax expense of $17.9 million, or 28.6% of income before income taxes in 2016. The 2017effective tax rate is greater than the statutory income tax rate of 35% primarily as a result of a net effect of a$21.5 million expense related to re-measuring the U.S. deferred tax assets as a result of the Tax Act, $5.6 millionnet expense related to uncertain tax positions and $8.0 million benefit related to foreign tax rate differences. The2016 effective tax rate is less than the statutory income tax rate of 35%, primarily as a result of a $5.5 million netbenefit related to greater levels of income earned in lower tax jurisdictions, $4.8 million net benefit for therelease of valuation allowances related to deferred tax assets that were utilized in the current year, $2.0 million innet benefit for the release of valuation allowance, which are deemed no longer necessary based upon changes inthe current and expected future years operating profits, $1.8 million benefit related to notional interestdeductions, $2.8 million benefit for the generation of tax credits offset by a $4.1 expense related to theimpairment of book basis goodwill and a $2.1 million expense related to non-deductible expenses.
Results of Operations — Segment Information
Comparison of the years ended December 31, 2018 and 2017
Performance Coatings
Change due to
2018 2017 $ Change % Change PriceVolume /
Mix Currency Acquisitions Other
(Dollars in thousands)
Segment net sales $ 733,926 $ 594,029 $ 139,897 23.6% $ 27,082 $ 4,824 $ (3,714) $ 111,706 $ —Segment gross profit 165,708 145,797 19,911 13.7% 27,082 (842) 1,707 28,046 (36,082)Gross profit as a % of
segment net sales 22.6% 24.5%
30

Net sales increased in Performance Coatings by $139.9 million compared with the prior year, primarilyfrom sales of Endeka of $89.0 million, SPC of $10.1 million, Quimicer of $7.4 million and Gardenia of$3.3 million, and increases in sales of frits and glazes, digital inks and porcelain enamel of $14.9 million,$8.0 million and, $5.2 million, respectively. The increase in net sales was driven by higher product pricing of$27.1 million, sales from acquisitions of $111.7 million and favorable volume and mix of $4.8 million, partiallyoffset by unfavorable foreign currency impacts of $3.7 million. Gross profit increased $19.9 million from theprior-year, primarily driven by favorable product pricing impacts of $27.1 million, gross profit from acquisitionsof $28.0 million, favorable foreign currency impacts of $1.7 million and lower manufacturing costs of$0.9 million, partially offset by higher raw material costs of $37.0 million and lower sales volume and mix of$0.8 million.
2018 2017 $ Change % Change
(Dollars in thousands)
Segment net sales by Region
EMEA $ 475,435 $ 346,199 $ 129,236 37.3%
Latin America 100,818 106,640 (5,822) (5.5)%
Asia Pacific 108,623 94,722 13,901 14.7%
United States 49,050 46,468 2,582 5.6%
Net sales $ 733,926 $ 594,029 $ 139,897 23.6%
The net sales increase of $139.9 million was primarily driven by increases in sales from EMEA and AsiaPacific. The increase in sales from EMEA was primarily attributable to sales from acquisitions, whichcontributed $109.0 million, and higher sales across all product lines. The increase in sales from Asia Pacific wasdriven by sales from acquisitions, which contributed $2.7 million, and higher sales of frits and glazes, digital inksand porcelain enamel of $7.1 million, $2.2 million and $1.6 million, respectively. The increase in sales from theUnited States was fully attributable to higher sales of porcelain enamel. The decrease in sales from LatinAmerica was driven by lower sales of frits and glazes and porcelain enamel, partially offset by higher sales ofdigital inks.
Performance Colors and Glass
Change due to
2018 2017 $ Change % Change PriceVolume /
Mix Currency Acquisitions Other
(Dollars in thousands)
Segment net sales $ 487,455 $ 444,653 $ 42,802 9.6% $ 4,546 $ 11,747 $ 6,326 $ 20,184 $ —Segment gross profit 167,446 157,544 9,902 6.3% 4,546 (342) 2,307 4,712 (1,321)Gross profit as a % of
segment net sales 34.4% 35.4%
Net sales increased $42.8 million compared with the prior year, primarily driven by $12.2 million in salesfrom Dip-Tech and $12.9 million in sales from electronics products. The increase in net sales was driven by salesfrom acquisitions of $20.2 million, favorable volume and mix of $11.7 million, favorable foreign currencyimpacts of $6.3 million and higher product pricing of $4.6 million. Gross profit increased from the prior year,primarily due to gross profit from acquisitions of $4.7 million, higher product pricing of $4.6 million, favorable
31

manufacturing costs of $3.1 million and favorable foreign currency impacts of $2.3 million, partially offset byhigher raw material costs of $4.4 million and lower sales volume and mix of $0.3 million.
2018 2017 $ Change % Change
(Dollars in thousands)
Segment net sales by Region
EMEA $ 235,238 $ 203,280 $ 31,958 15.7%
United States 157,963 155,284 2,679 1.7%
Asia Pacific 71,124 64,853 6,271 9.7%
Latin America 23,130 21,236 1,894 8.9%
Net sales $ 487,455 $ 444,653 $ 42,802 9.6%
The net sales increase of $42.8 million was driven by higher sales from all regions. The increase in salesfrom EMEA was primarily attributable to $10.5 million in sales from acquisitions and higher sales from allproduct groups. The increase from Asia Pacific was primarily due to an increase in sales of automotive productsof $3.9 million and sales from acquisitions of $2.3 million. The increase in sales from the United States wasprimarily attributable an increase in sales from acquisitions of $7.2 million, partially offset by lower sales ofautomotive products and industrial products. The increase in sales from Latin America was primarily attributableto sales in automotive products and industrial products, partially offset by lower sales of decoration products.
Color Solutions
Change due to
2018 2017 $ Change % Change PriceVolume /
Mix Currency Acquisitions Other
(Dollars in thousands)
Segment net sales $ 391,027 $ 358,060 $ 32,967 9.2% $ 11,520 $ 11,933 $ 4,640 $ 4,874 $ —Segment gross profit 124,852 113,694 11,158 9.8% 11,520 8,720 1,268 1,292 (11,643)Gross profit as a % of
segment net sales 31.9% 31.8%
Net sales increased $33.0 million compared with the prior year, primarily due to higher sales of surfacetechnology products and pigments of $19.7 million and $8.7 million, respectively. The increase in net sales wasdriven by higher volume and mix of $11.9 million, higher product pricing of $11.5 million, sales from acquisitionsof $4.9 million and favorable foreign currency impacts of $4.6 million. Gross profit increased from the prior year,primarily due to higher product pricing of $11.5 million, favorable sales volume and mix of $8.7 million, grossprofit from acquisitions of $1.3 million and favorable foreign currency impacts of $1.3 million, partially offset byhigher raw material costs of $10.4 million and higher manufacturing costs of $1.2 million.
2018 2017 $ Change%
Change
(Dollars in thousands)
Segment net sales by Region
United States $ 172,901 $ 154,730 $ 18,171 11.7%
EMEA 142,102 134,122 7,980 5.9%
Asia Pacific 41,642 36,343 5,299 14.6%
Latin America 34,382 32,865 1,517 4.6%
Net sales $ 391,027 $ 358,060 $ 32,967 9.2%
The net sales increase of $33.0 million was driven by higher sales from all regions. The higher sales fromEMEA, Asia Pacific and Latin America were driven by sales of pigment products. The increase in sales from theUnited States was primarily driven by sales of surface technology products.
32

Comparison of the years ended December 31, 2017 and 2016
Performance Coatings
Change due to
2017 2016 $ Change % Change PriceVolume /
Mix Currency Acquisitions Other
(Dollars in thousands)
Segment net sales $ 594,029 $ 526,981 $ 67,048 12.7% $ 4,319 $ 24,437 $ (4,657) $ 42,949 $ —Segment gross profit 145,797 139,454 6,343 4.5% 4,319 6,550 (572) 9,512 (13,466)Gross profit as a % of
segment net sales 24.5% 26.5%
Net sales increased in Performance Coatings by $67.0 million compared with the prior year, primarilydriven by sales from SPC of $22.6 million, sales from Endeka of $18.3 million, and by organic growth across allproduct lines. The increase in net sales included higher sales volume and mix of $24.4 million, sales fromacquisitions of $42.9 million and higher product pricing of $4.3 million, partially offset by unfavorable foreigncurrency impacts of $4.7 million. Gross profit increased $6.3 million from the prior year, primarily driven bygross profit from acquisitions of $9.5 million, lower manufacturing and product costs of $13.0 million, highersales volumes and mix of $6.6 million and favorable product pricing impacts of $4.3 million, partially offset byhigher raw material costs of $26.5 million, and unfavorable foreign currency impacts of $0.6 million.
2017 2016 $ Change % Change
(Dollars in thousands)
Segment net sales by Region
EMEA $ 346,199 $ 289,780 $ 56,419 19.5%
Latin America 106,640 101,565 5,075 5.0%
Asia Pacific 94,722 89,573 5,149 5.7%
United States 46,468 46,063 405 0.9%
Net sales $ 594,029 $ 526,981 $ 67,048 12.7%
Net sales increased by $67.0 million with increases in sales from all regions. The increase in sales fromEMEA was primarily driven by sales from SPC of $22.6 million, sales from Endeka of $16.8 million, and anincrease in sales of porcelain enamel and colors of $5.7 million and $5.5 million, respectively. The sales increasefrom Latin America was primarily driven by higher sales of frits and glazes and porcelain enamel of $3.4 millionand $1.4 million, respectively. The sales increase from Asia Pacific was primarily driven by higher sales ofdigital inks, sales from Endeka and higher sales of porcelain enamel of $4.4 million, $1.6 million and$1.2 million, respectively, partially offset by a decrease of frits and glazes sales of $1.8 million. The increase insales from the United States was attributable to higher sales of porcelain enamel.
Performance Colors and Glass
Change due to
2017 2016 $ Change % Change PriceVolume /
Mix Currency Acquisitions Other
(Dollars in thousands)
Segment net sales $ 444,653 $ 371,464 $ 73,189 19.7% $ 2,557 $ 6,794 $ 2,472 $ 61,366 $ —
Segment gross profit 157,544 133,997 23,547 17.6% 2,557 (1,946) 685 21,198 1,053
Gross profit as a % ofsegment net sales 35.4% 36.1%
The net sales increase of $73.2 million was primarily attributable to sales from ESL of $38.2 million andDip-Tech of $18.2 million and organic growth in decoration products of $12.5 million. The increase in net sales
33

included sales from acquisitions of $61.4 million, favorable volume and mix of $6.8 million, higher product pricing of$2.6 million and favorable foreign currency impacts of $2.5 million. Gross profit increased from the prior year,primarily due to gross profit from acquisitions of $21.2 million, favorable manufacturing and product costs of$4.8 million, higher product pricing of $2.6 million and favorable foreign currency impacts of $0.7 million, partiallyoffset by unfavorable raw material costs of $3.8 million and lower sales volumes and mix of $1.9 million.
2017 2016 $ Change % Change
(Dollars in thousands)
Segment net sales by Region
EMEA $ 203,280 $ 160,475 $ 42,805 26.7%
United States 155,284 132,432 22,852 17.3%
Asia Pacific 64,853 59,121 5,732 9.7%
Latin America 21,236 19,436 1,800 9.3%
Net sales $ 444,653 $ 371,464 $ 73,189 19.7%
The net sales increase of $73.2 million was driven by higher sales from all regions. The increase in sales fromEMEA was primarily attributable to sales from acquisitions and higher sales of decoration products of $9.6 million.The increase in sales from the United States was driven by sales from ESL of $24.5 million and Dip-Tech of$3.3 million, partially offset by a decrease in sales of industrial products of $5.9 million. The increase from AsiaPacific was primarily due to higher sales of automotive and decoration products of $3.9 million and $1.1 million,respectively. The increase from Latin America was primarily driven by an increase in sales of decoration productsof $2.1 million, partially offset by a decrease in sales of automotive and industrial products.
Color Solutions
Change due to
2017 2016 $ Change % Change PriceVolume /
Mix Currency Acquisitions Other
(Dollars in thousands)
Segment net sales $ 358,060 $ 246,847 $ 111,213 45.1% $ 6,063 $ 32,537 $ 1,003 $ 71,610 $ —
Segment gross profit 113,694 84,466 29,228 34.6% 6,063 4,820 202 16,213 1,930
Gross profit as a % ofsegment net sales 31.8% 34.2%
Net sales increased $111.2 million compared with the prior year, primarily due to sales from Cappelle of$69.5 million, and higher sales of pigments and surface technology products of $28.8 million and $12.7 million,respectively. The increase in net sales was driven by sales from acquisitions of $71.6 million, higher volumes andmix of $32.5 million, higher product pricing of $6.1 million and favorable foreign currency impacts of$1.0 million. Gross profit increased from the prior year, due to gross profit from acquisitions of $16.2 million,lower manufacturing and product costs of $10.9 million, higher product pricing of $6.1 million, higher salesvolumes and mix of $4.8 million and favorable foreign currency impacts of $0.2 million, partially offset byunfavorable raw material costs of $9.0 million.
2017 2016 $ Change % Change
(Dollars in thousands)
Segment net sales by Region
United States $ 154,730 $ 121,692 $ 33,038 27.1%
EMEA 134,122 64,800 69,322 107.0%
Asia Pacific 36,343 30,770 5,573 18.1%
Latin America 32,865 29,585 3,280 11.1%
Net sales $ 358,060 $ 246,847 $ 111,213 45.1%
34

The net sales increase of $111.2 million was driven by higher sales from all regions. The increase in sales fromEMEA was primarily driven by sales from Cappelle of $58.3 million and higher sales of pigments of $11.0 million.The increase in sales from the United States was primarily driven by sales from Cappelle of $11.2 million, surfacetechnology products of $12.7 million and pigments of $9.0 million. The increases in sales from Asia Pacific andLatin America of $5.6 million and $3.3 million, respectively, were driven by an increase in pigments sales.
Summary of Cash Flows for the years ended December 31, 2018, 2017, and 2016
2018 2017 2016
(Dollars in thousands)
Net cash provided by operating activities $ 182,793 $ 84,790 $ 62,630
Net cash (used for) investing activities (148,516) (178,911) (150,822)
Net cash provided by financing activities 9,367 108,363 81,997
Effect of exchange rate changes on cash and cash equivalents (2,894) 3,727 (6,603)
Increase (decrease) in cash and cash equivalents $ 40,750 $ 17,969 $ (12,798)
Operating activities. Cash flows from operating activities increased $98.0 million in 2018 compared to2017. The increase was primarily due to higher cash inflows for net working capital of $68.5 million and othercurrent assets and liabilities of $28.2 million.
Cash flows from operating activities increased $22.2 million in 2017 compared to 2016. The increase wasprimarily due to higher earnings after consideration of non-cash items, partially offset by higher cash outflowsfor net working capital of $15.7 million and other current assets and liabilities of $38.1 million.
Investing activities. Cash flows used in investing activities decreased $30.4 million in 2018. The decreasewas primarily due to lower cash outflows for business acquisitions, net of cash acquired of $56.2 million,partially offset by higher cash outflows for capital expenditures of $30.1 million.
Cash flows from investing activities decreased approximately $28.1 million in 2017. The decrease wasprimarily due to higher cash outflows for capital expenditures of $25.6 million.
Financing activities. Cash flows from financing activities decreased $99.0 million in 2018 compared with2017. As further discussed in Note 9, during 2018, we paid off our Credit Facility and entered into our AmendedCredit Facility, consisting of a $500 million secured revolving line of credit and $820 million secured term loanfacilities. Further, compared to the prior year, purchase of treasury stock increased by $28.8 million.
Cash flows from financing activities increased $26.4 million in 2017 compared with 2016. As furtherdiscussed in Note 9, we paid off our 2014 Credit Facility and entered into our new Credit Facility, consisting of a$400 million secured revolving line of credit, a $357.5 million secured term loan facility and a €250 millionsecured euro term loan facility. This transaction resulted in additional borrowings in 2017 of $53.6 millioncompared to 2016. Further, compared to 2016, net repayments under loans payable was $24.2 million higher.Additionally, during 2017, we paid debt issuance costs related to the Credit Facility entered into during theperiod, partially offset by no repurchases of common stock being made during 2017.
We have paid no dividends on our common stock since 2009.
Capital Resources and Liquidity
Major debt instruments that were outstanding during 2018 are described below.
Amended Credit Facility
On April 25, 2018, the Company entered into an amendment (the “Amended Credit Facility”) to its existingcredit facility (the “Credit Facility”) which Amended Credit Facility (a) provided a new revolving facility (the
35

“2018 Revolving Facility”), which replaced the Company’s existing revolving facility, (b) repriced the (“TrancheB-1 Loans”), (c) provided new tranches of term loans (“Tranche B-2 Loans” and “Tranche B-3 Loans”)denominated in U.S. dollars and will be used for ongoing working capital requirements and general corporatepurposes. The Tranche B-2 Loans are borrowed by the Company and the Tranche B-3 Loans are borrowed on ajoint and several basis by Ferro GmbH and Ferro Europe Holdings LLC.
The Amended Credit Facility consists of a $500 million secured revolving line of credit with a maturity ofFebruary 2023, a $355 million secured term loan facility with a maturity of February 2024, a $235 millionsecured term loan facility with a maturity of February 2024 and a $230 million secured term loan facility with amaturity of February 2024. The term loans are payable in equal quarterly installments in an amount equal to0.25% of the original principal amount of the term loans, with the remaining balance due on the maturity datethereof. In addition, the Company is required, on an annual basis, to make a prepayment in an amount equal to aportion of the Company’s excess cash flow, as calculated pursuant to the Amended Credit Facility, whichprepayment will be applied first to the term loans until they are paid in full, and then to the revolving loans.
Subject to the satisfaction of certain conditions, the Company can request additional commitments under therevolving line of credit or term loans in the aggregate principal amount of up to $250 million to the extent thatexisting or new lenders agree to provide such additional commitments and/or term loans. The Company can alsoraise certain additional debt or credit facilities subject to satisfaction of certain covenant levels.
Certain of the Company’s U.S. subsidiaries have guaranteed the Company’s obligations under the AmendedCredit Facility and such obligations are secured by (a) substantially all of the personal property of the Companyand the U.S. subsidiary guarantors and (b) a pledge of 100% of the stock of certain of the Company’s U.S.subsidiaries and 65% of the stock of certain of the Company’s direct foreign subsidiaries. The Tranche B-3Loans are guaranteed by the Company, the U.S. subsidiary guarantors and a cross-guaranty by the borrowers ofthe Tranche B-3 Loans, and are secured by the collateral securing the revolving loans and the other term loans, inaddition to a pledge of the equity interests of Ferro GmbH.
Interest Rate — Term Loans: The interest rates applicable to the term loans will be, at the Company’soption, equal to either a base rate or a LIBOR rate plus, in both cases, an applicable margin.
• The base rate for term loans will be the highest of (i) the federal funds rate plus 0.50%, (ii) syndicationagent’s prime rate, (iii) the daily LIBOR rate plus 1.00% or (iv) 0.00%. The applicable margin for baserate loans is 1.25%.
• The LIBOR rate for term loans shall not be less than 0.0% and the applicable margin for LIBOR rate termloans is 2.25%.
• For LIBOR rate term loans, the Company may choose to set the duration on individual borrowings forperiods of one, two, three or six months, with the interest rate based on the applicable LIBOR rate for thecorresponding duration.
At December 31, 2018, the Company had borrowed $352.3 million under the Tranche B-1 Loans at aninterest rate of 5.05%, $233.2 million under the Tranche B-2 Loans at an interest rate of 5.05%, and$228.3 million under the Tranche B-3 Loans at an interest rate of 5.05%. At December 31, 2018, there were noadditional borrowings available under the Tranche B-1 Loans, Tranche B-2 Loans and Tranche B-3 Loans. Weentered into swap agreements in the second quarter of 2018. At December 31, 2018, the effective interest rate forthe Tranche B-1 Loans, Tranche B-2 Loans, and Tranche B-3 Loans, after adjusting for the interest rate swap,was 5.19%, 3.43%, and 2.48%, respectively.
Interest Rate – Revolving Credit Line: The interest rates applicable to loans under the 2018 RevolvingCredit Facility will be, at the Company’s option, equal to either a base rate or a LIBOR rate plus, in both cases,an applicable variable margin. The variable margin will be based on the ratio of (a) the Company’s totalconsolidated net debt outstanding (as defined in the Amended Credit Agreement) at such time to (b) the
36

Company’s consolidated EBITDA (as defined in the Amended Credit Agreement) computed for the period offour consecutive fiscal quarters most recently ended.
• The base rate for revolving loans will be the highest of (i) the federal funds rate plus 0.50%, (ii)syndication agent’s prime rate, (iii) the daily LIBOR rate plus 1.00% or (iv) 0.00%. The applicablemargin for base rate loans will vary between 0.50% to 1.50%.
• The LIBOR rate for revolving loans shall not be less than 0% and the applicable margin for LIBOR raterevolving loans will vary between 1.50% and 2.50%.
• For LIBOR rate revolving loans, the Company may choose to set the duration on individual borrowingsfor periods of one, two, three or six months, with the interest rate based on the applicable LIBOR rate forthe corresponding duration.
At December 31, 2018, there were no borrowings under the 2018 Revolving Credit Facility. Afterreductions for outstanding letters of credit secured by these facilities, we had $495.3 million of additionalborrowings available under the revolving credit facilities at December 31, 2018.
The Amended Credit Facility contains customary restrictive covenants including, but not limited to,limitations on use of loan proceeds, limitations on the Company’s ability to pay dividends and repurchase stock,limitations on acquisitions and dispositions, and limitations on certain types of investments. The Amended CreditFacility also contains standard provisions relating to conditions of borrowing and customary events of default,including the non-payment of obligations by the Company and the bankruptcy of the Company.
Specific to the 2018 Revolving Facility, the Company is subject to a financial covenant regarding theCompany’s maximum leverage ratio. If an event of default occurs, all amounts outstanding under the AmendedCredit Facility agreement may be accelerated and become immediately due and payable. At December 31, 2018,we were in compliance with the covenants of the Amended Credit Facility.
Credit Facility
On February 14, 2017, the Company entered into a credit facility (the “Credit Facility”) with a group oflenders to refinance its then outstanding credit facility debt and to provide liquidity for ongoing working capitalrequirements and general corporate purposes.
The Credit Facility consisted of a $400 million secured revolving line of credit with a term of five years, a$357.5 million secured term loan facility with a term of seven years and a €250 million secured Euro term loanfacility with a term of seven years. The term loans were payable in equal quarterly installments in an amountequal to 0.25% of the original principal amount of the term loans, with the remaining balance due on the maturitydate thereof. In addition, the Company was required, on an annual basis, to make a prepayment of term loansuntil they were fully paid and then to the revolving loans in an amount equal to a portion of the Company’sexcess cash flow, as calculated pursuant to the Credit Facility.
Subject to the satisfaction of certain conditions, the Company could request additional commitments underthe revolving line of credit or term loans in the aggregate principal amount of up to $250 million, to the extentthat existing or new lenders agree to provide such additional commitments and/or term loans. The Companycould also raise certain additional debt or credit facilities subject to satisfaction of certain covenant levels.
Certain of the Company’s U.S. subsidiaries guaranteed the Company’s obligations under the Credit Facilityand such obligations were secured by (a) substantially all of the personal property of the Company and the U.S.subsidiary guarantors and (b) a pledge of 100% of the stock of certain of the Company’s U.S. subsidiaries and65% of the stock of certain of the Company’s direct foreign subsidiaries.
Interest Rate — Term Loans: The interest rates applicable to the U.S. term loans was, at the Company’soption, equal to either a base rate or a LIBOR rate plus, in both cases, an applicable margin. The interest rates
37
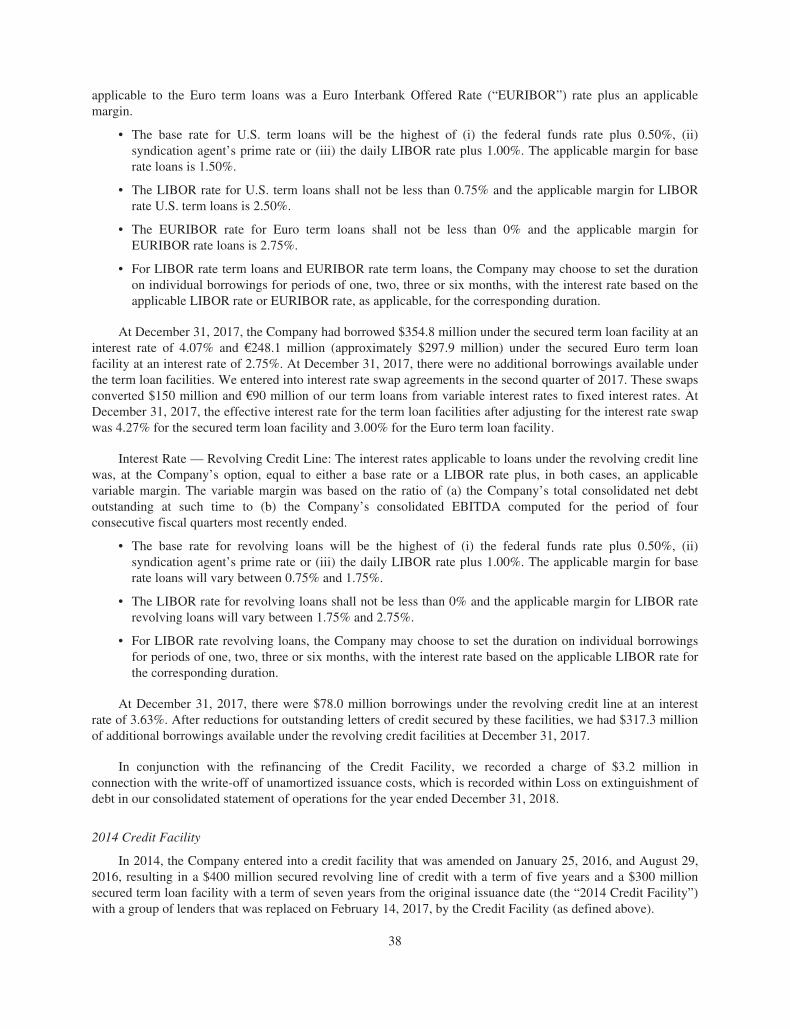
applicable to the Euro term loans was a Euro Interbank Offered Rate (“EURIBOR”) rate plus an applicablemargin.
• The base rate for U.S. term loans will be the highest of (i) the federal funds rate plus 0.50%, (ii)syndication agent’s prime rate or (iii) the daily LIBOR rate plus 1.00%. The applicable margin for baserate loans is 1.50%.
• The LIBOR rate for U.S. term loans shall not be less than 0.75% and the applicable margin for LIBORrate U.S. term loans is 2.50%.
• The EURIBOR rate for Euro term loans shall not be less than 0% and the applicable margin forEURIBOR rate loans is 2.75%.
• For LIBOR rate term loans and EURIBOR rate term loans, the Company may choose to set the durationon individual borrowings for periods of one, two, three or six months, with the interest rate based on theapplicable LIBOR rate or EURIBOR rate, as applicable, for the corresponding duration.
At December 31, 2017, the Company had borrowed $354.8 million under the secured term loan facility at aninterest rate of 4.07% and €248.1 million (approximately $297.9 million) under the secured Euro term loanfacility at an interest rate of 2.75%. At December 31, 2017, there were no additional borrowings available underthe term loan facilities. We entered into interest rate swap agreements in the second quarter of 2017. These swapsconverted $150 million and €90 million of our term loans from variable interest rates to fixed interest rates. AtDecember 31, 2017, the effective interest rate for the term loan facilities after adjusting for the interest rate swapwas 4.27% for the secured term loan facility and 3.00% for the Euro term loan facility.
Interest Rate — Revolving Credit Line: The interest rates applicable to loans under the revolving credit linewas, at the Company’s option, equal to either a base rate or a LIBOR rate plus, in both cases, an applicablevariable margin. The variable margin was based on the ratio of (a) the Company’s total consolidated net debtoutstanding at such time to (b) the Company’s consolidated EBITDA computed for the period of fourconsecutive fiscal quarters most recently ended.
• The base rate for revolving loans will be the highest of (i) the federal funds rate plus 0.50%, (ii)syndication agent’s prime rate or (iii) the daily LIBOR rate plus 1.00%. The applicable margin for baserate loans will vary between 0.75% and 1.75%.
• The LIBOR rate for revolving loans shall not be less than 0% and the applicable margin for LIBOR raterevolving loans will vary between 1.75% and 2.75%.
• For LIBOR rate revolving loans, the Company may choose to set the duration on individual borrowingsfor periods of one, two, three or six months, with the interest rate based on the applicable LIBOR rate forthe corresponding duration.
At December 31, 2017, there were $78.0 million borrowings under the revolving credit line at an interestrate of 3.63%. After reductions for outstanding letters of credit secured by these facilities, we had $317.3 millionof additional borrowings available under the revolving credit facilities at December 31, 2017.
In conjunction with the refinancing of the Credit Facility, we recorded a charge of $3.2 million inconnection with the write-off of unamortized issuance costs, which is recorded within Loss on extinguishment ofdebt in our consolidated statement of operations for the year ended December 31, 2018.
2014 Credit Facility
In 2014, the Company entered into a credit facility that was amended on January 25, 2016, and August 29,2016, resulting in a $400 million secured revolving line of credit with a term of five years and a $300 millionsecured term loan facility with a term of seven years from the original issuance date (the “2014 Credit Facility”)with a group of lenders that was replaced on February 14, 2017, by the Credit Facility (as defined above).
38

In conjunction with the refinancing of the 2014 Credit Facility, we recorded a charge of $3.9 million inconnection with the write-off of unamortized issuance costs, which is recorded within Loss on extinguishment ofdebt in our consolidated statement of operations for the year ended December 31, 2017.
Off Balance Sheet Arrangements
Consignment and Customer Arrangements for Precious Metals. We use precious metals, primarily silver, inthe production of some of our products. We obtain most precious metals from financial institutions underconsignment agreements. The financial institutions retain ownership of the precious metals and charge us feesbased on the amounts we consign and the period of consignment. These fees were $2.1 million, $1.2 million and$0.8 million for 2018, 2017, and 2016, respectively. We had on hand precious metals owned by participants inour precious metals consignment program of $55.2 million at December 31, 2018 and $37.7 million atDecember 31, 2017, measured at fair value based on market prices for identical assets and net of credits.
The consignment agreements under our precious metals program involve short-term commitments thattypically mature within 30 to 90 days of each transaction and are typically renewed on an ongoing basis. As aresult, the Company relies on the continued willingness of financial institutions to participate in thesearrangements to maintain this source of liquidity. On occasion, we have been required to deliver cash collateral.While no deposits were outstanding at December 31, 2018, or December 31, 2017, we may be required to furnishcash collateral in the future based on the quantity and market value of the precious metals under consignment andthe amount of collateral-free lines provided by the financial institutions. The amount of cash collateral required issubject to review by the financial institutions and can be changed at any time at their discretion, based in part ontheir assessment of our creditworthiness.
International Receivable Sales Programs
We have several international programs to sell without recourse trade accounts receivable to financialinstitutions. These transactions are treated as a sale and are accounted for as a reduction in accounts receivablebecause the agreements transfer effective control over and risk related to the receivables to the buyers. TheCompany continues to service the receivables sold in exchange for a fee. The program, whose maximum capacityis 100 million Euro, is scheduled to expire in December 2023. At December 31, 2018 the outstanding principalamount of receivables sold under this program was $71.3 million. The carrying amount of deferred purchaseprice was $23.0 million and is recorded in Other Receivables.
Bank Guarantees and Standby Letters of Credit.
At December 31, 2018, the Company and its subsidiaries had bank guarantees and standby letters of creditissued by financial institutions that totaled $6.7 million. These agreements primarily relate to Ferro’s insuranceprograms, foreign energy purchase contracts and foreign tax payments.
Other Financing Arrangements
We maintain other lines of credit to provide global flexibility for Ferro’s short-term liquidity requirements.These facilities are uncommitted lines for our international operations and totaled $41.4 million at December 31,2018. We had $30.3 million of additional borrowings available under these lines at December 31, 2018.
Liquidity Requirements
Our primary sources of liquidity are available cash and cash equivalents, available lines of credit under theAmended Credit Facility, and cash flows from operating activities. As of December 31, 2018, we had$104.3 million of cash and cash equivalents. Cash generated in the U.S. is generally used to pay down amountsoutstanding under our 2018 Revolving Facility and for general corporate purposes, including acquisitions. If
39

needed, we could repatriate the majority of cash held by foreign subsidiaries without the need to accrue and payU.S. income taxes. We do not anticipate a liquidity need requiring such repatriation of these funds to the U.S.
Our liquidity requirements primarily include debt service, purchase commitments, labor costs, workingcapital requirements, restructuring expenditures, acquisition costs, capital investments, precious metals cashcollateral requirements, and postretirement benefit obligations. We expect to meet these requirements in the longterm through cash provided by operating activities and availability under existing credit facilities or otherfinancing arrangements. Cash flows from operating activities are primarily driven by earnings before noncashcharges and changes in working capital needs. In 2018, cash flows from operating activities were used to fundour investing activities. Additionally, we used the borrowings available under the Amended Credit Facility tofund acquisitions and for other general business purposes. We had additional borrowing capacity of$525.6 million at December 31, 2018, available under various credit facilities, primarily our revolving creditfacility.
Our Amended Credit Facility contains customary restrictive covenants, including those described in moredetail in Note 9 to the consolidated financial statements under Item 8 of this Annual Report on Form 10-K. Thesecovenants include customary restrictions, including, but not limited to, limitations on use of loan proceeds,limitations on the Company’s ability to pay dividends and repurchase stock, limitations on acquisitions anddispositions, and limitations on certain types of investments. Specific to the 2018 Revolving Facility, we aresubject to a financial covenant regarding the Company’s maximum leverage ratio. This covenant under ourAmended Credit Facility restricts the amount of our borrowings, reducing our flexibility to fund ongoingoperations and strategic initiatives. This facility is described in more detail in “Capital Resources and Liquidity”under Item 7 and in Note 9 to the consolidated financial statements under Item 8 of this Annual Report onForm 10-K.
As of December 31, 2018, we were in compliance with our maximum leverage ratio covenant of 4.25x asour actual ratio was 2.60, providing $116.9 million of EBITDA cushion on the leverage ratio, as defined withinthe Amended Credit Facility. To the extent that economic conditions in key markets deteriorate or we are unableto meet our business projections and EBITDA falls below approximately $184 million for a rolling four quarters,based on reasonably consistent net debt levels with those as of December 31, 2018, we could become unable tomaintain compliance with our leverage ratio covenant. In such case, our lenders could demand immediatepayment of outstanding amounts and we would need to seek alternate financing sources to pay off such debts andto fund our ongoing operations. Such financing may not be available on favorable terms, if at all.
Difficulties experienced in global capital markets could affect the ability or willingness of counterparties toperform under our various lines of credit, forward contracts, and precious metals program. These counterpartiesare major, reputable, multinational institutions, all having investment-grade credit ratings. Accordingly, we donot anticipate counterparty default. However, an interruption in access to external financing could adverselyaffect our business prospects and financial condition.
We assess on an ongoing basis our portfolio of businesses, as well as our financial and capital structure, toensure that we have sufficient capital and liquidity to meet our strategic objectives. As part of this process, fromtime to time we evaluate the possible divestiture of businesses that are not critical to our core strategic objectivesand, where appropriate, pursue the sale of such businesses and assets. We also evaluate and pursue acquisitionopportunities that we believe will enhance our strategic position such as the acquisitions we completed in 2018,2017 and 2016. Generally, we publicly announce material divestiture and acquisition transactions only when wehave entered into a material definitive agreement or closed on those transactions.
40

The Company’s aggregate amount of contractual obligations for the next five years and thereafter is setforth below:
2019 2020 2021 2022 2023 Thereafter Totals
(Dollars in thousands)
Loans Payable (1) $ 50 $ — $ — $ — $ — $ — $ 50
Long-term debt (2) 10,575 9,671 9,393 10,203 9,131 778,077 827,050
Interest (3) 311 256 256 256 256 3,548 4,883
Operating lease obligations 11,419 7,314 5,302 3,301 1,971 2,401 31,708
Purchase commitments (4) 27,425 7,629 7,189 6,087 2,047 3,651 54,028
Taxes (5) 5,986 — — — — — 5,986Retirement and other
postemployment benefits(6) 9,819 9,916 — — — — 19,735
$ 65,585 $ 34,786 $ 22,140 $ 19,847 $ 13,405 $ 787,677 $ 943,440
(1) Loans Payable includes our loans payable to banks.(2) Long-term debt excludes imputed interest and executory costs on capitalized lease obligations and
unamortized issuance costs on the term loan facility.(3) Interest represents only contractual payments for fixed-rate debt.(4) Purchase commitments are noncancelable contractual obligations for raw materials and energy, and exclude
capital expenditures for property, plant and equipment.(5) We have not projected payments past 2019 due to uncertainties in estimating the amount and period of any
payments. The amount above relates to our current income tax liability as of December 31, 2018. We have$22.2 million in gross liabilities related to unrecognized tax benefits, including $1.8 million of accruedinterest and penalties that are not included in the above table since we cannot reasonably predict the timingof cash settlements with various taxing authorities.
(6) The funding amounts are based on the minimum contributions required under our various plans andapplicable regulations in each respective country. We have not projected contributions past 2020 due touncertainties regarding the assumptions involved in estimating future required contributions.
Critical Accounting Policies
When we prepare our consolidated financial statements we are required to make estimates and assumptionsthat affect the amounts we report in the consolidated financial statements and footnotes. We consider the policiesdiscussed below to be more critical than other policies because their application requires our most subjective orcomplex judgments. These estimates and judgments arise because of the inherent uncertainty in predicting futureevents. Management has discussed the development, selection and disclosure of these policies with the AuditCommittee of the Board of Directors.
Revenue Recognition
Under ASC 606, revenues are recognized when control of the promised goods is transferred to ourcustomers, in an amount that reflects the consideration we expect to be entitled to in exchange for those goods. Inorder to achieve that core principle, the Company applies the following five-step approach: 1) identify thecontract with a customer, 2) identify the performance obligations, 3) determine the transaction price, 4) allocatethe transaction price to the performance obligations in the contract, and 5) recognize revenue when aperformance obligation is satisfied.
In order to ensure the revenue recognition in the proper period, we review material sales contracts for propercut-off based upon the business practices and legal requirements of each country. For sales of productscontaining precious metals, we report revenues on a gross basis along with their corresponding cost of sales to
41

arrive at gross profit. We record revenues this way because we act as the principal in the transactions into whichwe enter.
Restructuring and Cost Reduction Programs
In recent years, we have developed and initiated global cost reduction programs with the objectives ofleveraging our global scale, realigning and lowering our cost structure, and optimizing capacity utilization.Management continues to evaluate our businesses, and therefore, there may be additional provisions for newoptimization and cost-savings initiatives, as well as changes in estimates to amounts previously recorded, aspayments are made or actions are completed.
Restructuring charges include both termination benefits and asset writedowns. We estimate accruals fortermination benefits based on various factors including length of service, contract provisions, local legalrequirements, projected final service dates, and salary levels. We also analyze the carrying value of long-livedassets and record estimated accelerated depreciation through the anticipated end of the useful life of the assetsaffected by the restructuring or record an asset impairment. In all likelihood, this accelerated depreciation willresult in reducing the net book value of those assets to zero at the date operations cease. While we believe thatchanges to our estimates are unlikely, the accuracy of our estimates depends on the successful completion ofnumerous actions. Changes in our estimates could increase our restructuring costs to such an extent that it couldhave a material impact on the Company’s results of operations, financial position, or cash flows. Other events,such as negotiations with unions and works councils, may also delay the resulting cost savings.
Accounts Receivable and the Allowance for Doubtful Accounts
Ferro sells its products to customers in diversified industries throughout the world. No customer or relatedgroup of customers represents greater than 10% of net sales or accounts receivable. We perform ongoing creditevaluations of our customers and require collateral principally for export sales, when industry practices allow andas market conditions dictate, subject to our ability to negotiate secured terms relative to competitive offers. Weregularly analyze significant customer accounts and provide for uncollectible accounts based on historicalexperience, customer payment history, the length of time the receivables are past due, the financial health of thecustomer, economic conditions, and specific circumstances, as appropriate. Changes in these factors could resultin additional allowances. Customer accounts we conclude to be uncollectible or to require excessive collectioncosts are written off against the allowance for doubtful accounts. Historically, write-offs of uncollectibleaccounts have been within our expectations.
Goodwill
We review goodwill for impairment each year using a measurement date of October 31st or more frequentlyin the event of an impairment indicator. We annually, or more frequently as warranted, evaluate theappropriateness of our reporting units utilizing operating segments as the starting point of our analysis. In theevent of a change in our reporting units, we would allocate goodwill based on the relative fair value. We estimatethe fair values of the reporting units associated with these assets using the average of both the income approachand the market approach, which we believe provides a reasonable estimate of the reporting units’ fair values,unless facts and circumstances exist that indicate more representative fair values. The income approach usesprojected cash flows attributable to the reporting units over their useful lives and allocates certain corporateexpenses to the reporting units. We use historical results, trends and our projections of market growth, internalsales efforts and anticipated cost structure assumptions to estimate future cash flows. Using a risk-adjusted,weighted-average cost of capital, we discount the cash flow projections to the measurement date. The marketapproach estimates a price reasonably expected to be paid by a market participant in the purchase of similarbusinesses. If the fair value of any reporting unit was determined to be less than its carrying value, we wouldproceed to the second step and obtain comparable market values or independent appraisals of its assets andliabilities to determine the amount of any impairment.
42

The significant assumptions and ranges of assumptions we used in our impairment analyses of goodwill atOctober 31, 2018 and 2017, were as follows:
Significant Assumptions 2018 2017
Weighted-average cost of capital 13.0% - 14.75% 11.0% - 13.5%
Residual growth rate 3.0% 3.0%
Our estimates of fair value can be adversely affected by a variety of factors. Reductions in actual orprojected growth or profitability at our reporting units due to unfavorable market conditions or significantincreases in cost structure could lead to the impairment of any related goodwill. Additionally, an increase ininflation, interest rates or the risk-adjusted, weighted-average cost of capital could also lead to a reduction in thefair value of one or more of our reporting units and therefore lead to the impairment of goodwill.
Based on our 2018 annual impairment test performed as of October 31, 2018, the fair values of the reportingunits tested for impairment exceeded the carrying values of the respective reporting units by amounts rangingfrom 21.3% to 206.7% at the 2018 measurement date. The lowest cushion relates to goodwill associated with thePerformance Coatings reportable segment, which had a goodwill balance of $44.4 million at December 31, 2018.A future potential impairment is possible for any of these reporting units if actual results are materially less thanforecasted results. Some of the factors that could negatively affect our cash flows and, as a result, not support thecarrying values of our reporting units are: new environmental regulations or legal restrictions on the use of ourproducts that would either reduce our product revenues or add substantial costs to the manufacturing process,thereby reducing operating margins; new technologies that could make our products less competitive or requiresubstantial capital investment in new equipment or manufacturing processes; and substantial downturns ineconomic conditions.
Long-Lived Asset Impairment
The Company’s long-lived assets include property, plant and equipment, and intangible assets. We reviewproperty, plant and equipment and intangible assets for impairment whenever events or circumstances indicatethat their carrying values may not be recoverable. The following are examples of such events or changes incircumstances:
• An adverse change in the business climate of a long-lived asset or asset group;
• An adverse change in the extent or manner in which a long-lived asset or asset group is used or in itsphysical condition;
• Current operating losses for a long-lived asset or asset group combined with a history of such losses orprojected or forecasted losses that demonstrate that the losses will continue; or
• A current expectation that, more likely than not, a long-lived asset or asset group will be sold orotherwise significantly disposed of before the end of its previously estimated useful life.
The carrying amount of property, plant and equipment and intangible assets is not recoverable if thecarrying value of the asset group exceeds the sum of the undiscounted cash flows expected to result from the useand eventual disposition of the asset group. In the event of impairment, we recognize a loss for the excess of therecorded value over fair value. The long-term nature of these assets requires the estimation of cash inflows andoutflows several years into the future and only takes into consideration technological advances known at the timeof review.
Income Taxes
The breadth of our operations and complexity of income tax regulations require us to assess uncertaintiesand make judgments in estimating the ultimate amount of income taxes we will pay. Our income tax expense,
43

deferred tax assets and liabilities, and reserves for unrecognized tax benefits reflect management’s bestassessment of estimated current and future taxes to be paid. The final income taxes we pay are based upon manyfactors, including existing income tax laws and regulations, negotiations with taxing authorities in variousjurisdictions, outcomes of tax litigation, and resolution of disputes arising from federal, state and internationalincome tax audits. The resolution of these uncertainties may result in adjustments to our income tax assets andliabilities in the future.
Deferred income taxes result from differences between the financial and tax basis of our assets andliabilities. We adjust our deferred income tax assets and liabilities for changes in income tax rates and income taxlaws when changes are enacted. We record valuation allowances to reduce deferred income tax assets when it ismore likely than not that a tax benefit will not be realized. Significant judgment is required in evaluating the needfor and the magnitude of appropriate valuation allowances against deferred income tax assets. The realization ofthese assets is dependent on generating future taxable income, our ability to carry back or carry forward netoperating losses and credits to offset tax liabilities, as well as successful implementation of various tax strategiesto generate tax where net operating losses or credit carryforwards exist. In evaluating our ability to realize thedeferred income tax assets, we rely principally on the reversal of existing temporary differences, the availabilityof tax planning strategies, and forecasted income.
We recognize a tax benefit from an uncertain tax position when it is more likely than not that the positionwill be sustained upon examination, including resolutions of any related appeals or litigation processes, based onthe technical merits. Our estimate of the potential outcome of any uncertain tax positions is subject tomanagement’s assessment of relevant risks, facts, and circumstances existing at that time. We record a liabilityfor the difference between the benefit recognized and measured based on a more-likely-than-not threshold andthe tax position taken or expected to be taken on the tax return. To the extent that our assessment of such taxpositions changes, the change in estimate is recorded in the period in which the determination is made. We reporttax-related interest and penalties as a component of income tax expense.
Derivative Financial Instruments
We use derivative financial instruments in the normal course of business to manage our exposure tofluctuations in interest rates, foreign currency exchange rates, and precious metal prices. The accounting forderivative financial instruments can be complex and can require significant judgment. Generally, the derivativefinancial instruments that we use are not complex, and observable market-based inputs are available to measuretheir fair value. We do not engage in speculative transactions for trading purposes. The use of financialderivatives is managed under a policy that identifies the conditions necessary to identify the transaction as afinancial derivative. Financial instruments, including derivative financial instruments, expose us to counterpartycredit risk for nonperformance. We manage our exposure to counterparty credit risk through minimum creditstandards and procedures to monitor concentrations of credit risk. We enter into these derivative financialinstruments with major, reputable, multinational financial institutions. Accordingly, we do not anticipate counter-party default. We continuously evaluate the effectiveness of derivative financial instruments designated ashedges to ensure that they are highly effective. In the event the hedge becomes ineffective, we discontinue hedgetreatment. Except as noted below, we do not expect any changes in our risk policies or in the nature of thetransactions we enter into to mitigate those risks.
Our exposure to interest rate changes arises from our debt agreements with variable interest rates. To reduceour exposure to interest rate changes on variable rate debt, we entered into interest rate swap agreements. Theseswaps are settled in cash, and the net interest paid or received is effectively recognized as interest expense. Wemark these swaps to fair value and recognize the resulting gains or losses as other comprehensive income.
We have executed cross currency interest rate swaps to minimize our exposure to floating rate debtagreements denominated in a currency other than functional currency. These swaps are settled in cash, and thenet interest paid or received is effectively recognized as interest expense as the interest on the debt is accrued.
44

These swaps are designated as cash flows hedges and we mark these swaps to fair value and recognize theresulting gains or losses as other comprehensive income.
To help protect the value of the Company’s net investment in European operations against adverse changesin exchange rates, the Company uses non-derivative financial instruments, such as its foreign currencydenominated debt, as economic hedges of its net investments in certain foreign subsidiaries. In addition, we haveexecuted cross currency interest rate swaps to help protect the value of the Company’s net investment inEuropean operations. These swaps are settled in cash, and the net interest paid or received is effectivelyrecognized as interest expense. We mark these swaps to fair value and recognize the resulting gains or losses ascumulative translation adjustments (a component of other comprehensive income).
We manage foreign currency risks in a wide variety of foreign currencies principally by entering intoforward contracts to mitigate the impact of currency fluctuations on transactions arising from international trade.Our objective in entering into these forward contracts is to preserve the economic value of nonfunctionalcurrency cash flows. Our principal foreign currency exposures relate to the Euro, the Egyptian Pound, theTurkish Lira, the Taiwan Dollar, the Colombian Peso, the Australian Dollar, the Indian Rupee, the ThailandBaht, the Indonesian Rupiah, the Japanese Yen, the Chinese Renminbi and the Romanian Leu. We mark theseforward contracts to fair value based on market prices for comparable contracts and recognize the resulting gainsor losses as other income or expense from foreign currency transactions.
Precious metals (primarily silver, gold, platinum and palladium) represent a significant portion of rawmaterial costs in our electronics products. When we enter into a fixed price sales contract at the customer’srequest to establish the price for the precious metals content of the order, we also enter into a forward purchasearrangement with a precious metals supplier to completely cover the value of the precious metals content. Ourcurrent precious metal contracts are designated as normal purchase contracts, which are not marked to market.
We also purchase portions of our energy requirements, including natural gas and electricity, under fixedprice contracts to reduce the volatility of cost changes. Our current energy contracts are designated as normalpurchase contracts, which are not marked to market.
Transfer of Financial Assets
The Company accounts for transfers of financial assets as sales when it has surrendered control over therelated assets. Whether control has been relinquished requires, among other things, an evaluation of relevantlegal considerations and an assessment of the nature and extent of the Company’s continuing involvement withthe assets transferred.
Pension and Other Postretirement Benefits
We sponsor defined benefit plans in the U.S. and many countries outside the U.S., and we also sponsorretiree medical benefits for a segment of our salaried and hourly work force within the U.S. The U.S. pensionplans and retiree medical plans represent approximately 86% of pension plan assets, 72% of benefit obligationsand 56% of net periodic pension expense as of December 31, 2018.
The assumptions we use in actuarial calculations for these plans have a significant impact on benefitobligations and annual net periodic benefit costs. We meet with our actuaries annually to discuss key economicassumptions used to develop these benefit obligations and net periodic costs.
We determine the discount rate for the U.S. pension and retiree medical plans based on a bond model. Usingthe pension plans’ projected cash flows, the bond model considers all possible bond portfolios that producematching cash flows and selects the portfolio with the highest possible yield. These portfolios are based on bondswith a quality rating of AA or better under either Moody’s Investor Services, Inc. or Standard & Poor’s Rating
45

Group, but exclude certain bonds, such as callable bonds, bonds with small amounts outstanding, and bonds withunusually high or low yields. The discount rates for the non-U.S. plans are based on a yield curve method, usingAA-rated bonds applicable in their respective capital markets. The duration of each plan’s liabilities is used toselect the rate from the yield curve corresponding to the same duration.
For the market-related value of plan assets, we use fair value, rather than a calculated value. The market-related value recognizes changes in fair value in a systematic and rational manner over several years. Wecalculate the expected return on assets at the beginning of the year for defined benefit plans as the weighted-average of the expected return for the target allocation of the principal asset classes held by each of the plans. Indetermining the expected returns, we consider both historical performance and an estimate of future long-termrates of return. The Company consults with and considers the opinion of its actuaries in developing appropriatereturn assumptions. Our target asset allocation percentages are 35% fixed income, 60% equity, and 5% otherinvestments for U.S. plans and 75% fixed income, 24% equity, and 1% other investments for non-U.S. plans. In2018, our pension plan assets incurred losses of approximately 7% within the U.S. plans and 3% within non-U.S.plans. In 2017, investment returns on average plan assets were approximately 16% within the U.S. plans and 3%within non-U.S. plans. Future actual pension expense will depend on future investment allocation andperformance, changes in future discount rates and various other factors related to the population of participants inthe Company’s pension plans.
All other assumptions are reviewed periodically by our actuaries and us and may be adjusted based oncurrent trends and expectations as well as past experience in the plans.
The following table provides the sensitivity of net annual periodic benefit costs for our pension plans,including a U.S. nonqualified retirement plan, and the retiree medical plan to a 25-basis-point decrease in boththe discount rate and asset return assumption:
25 Basis Point Decreasein Discount Rate
25 Basis Point Decrease inAsset Return Assumption
(Dollars in thousands)
U.S. pension plans $ (370) $ 484
U.S. retiree medical plan (28) N/A
Non-U.S. pension plans (95) 30
Total $ (493) $ 514
The following table provides the rates used in the assumptions and the changes between 2018 and 2017:
2018 2017 Change
Discount rate used to measure the benefit cost:
U.S. pension plans 3.80% 4.40% (0.60)%
U.S. retiree medical plan 3.70% 4.20% (0.50)%
Non-U.S. pension plans 2.35% 2.24% 0.11%
Discount rate used to measure the benefit obligation:
U.S. pension plans 4.40% 3.80% 0.60%
U.S. retiree medical plan 4.30% 3.70% 0.60%
Non-U.S. pension plans 2.61% 2.35% 0.26%
Expected return on plan assets:
U.S. pension plans 7.70% 8.20% (0.50)%
Non-U.S. pension plans 2.55% 2.54% 0.01%
Our overall net periodic benefit cost for all defined benefit plans was $19.9 million in 2018 and a credit of$6.4 million in 2017. The change is mainly the result of mark to market actuarial net losses in 2018.
46

For 2019, assuming expected returns on plan assets and no actuarial gains or losses, we expect our overallnet periodic benefit expense to be approximately $3.8 million, compared with income of approximately$0.2 million in 2018 on a comparable basis.
Inventories
We value inventory at the lower of cost or net realizable value, with cost determined utilizing the first-in,first-out (FIFO) method. We periodically evaluate the net realizable value of inventories based primarily upontheir age, but also upon assumptions of future usage in production, customer demand and market conditions.Inventories have been reduced to the lower of cost or realizable value by allowances for slow moving or obsoletegoods. If actual circumstances are less favorable than those projected by management in its evaluation of the netrealizable value of inventories, additional write-downs may be required. Slow moving, excess or obsoletematerials are specifically identified and may be physically separated from other materials, and we rework ordispose of these materials as time and manpower permit.
Environmental Liabilities
Our manufacturing facilities are subject to a broad array of environmental laws and regulations in thecountries in which they are located. The costs to comply with complex environmental laws and regulations aresignificant and will continue for the foreseeable future. We expense these recurring costs as they are incurred.While these costs may increase in the future, they are not expected to have a material impact on our financialposition, liquidity or results of operations.
We also accrue for environmental remediation costs and other obligations when it is probable that a liabilityhas been incurred and we can reasonably estimate the amount. We determine the timing and amount of anyliability based upon assumptions regarding future events. Inherent uncertainties exist in such evaluationsprimarily due to unknown conditions and other circumstances, changing governmental regulations and legalstandards regarding liability, and evolving technologies. We adjust these liabilities periodically as remediationefforts progress or as additional technical or legal information becomes available.
Impact of Newly Issued Accounting Pronouncements
Refer to Note 2 to the consolidated financial statements under Item 8 of this Annual Report on Form 10-Kfor a discussion of accounting standards we recently adopted or will be required to adopt.
Item 7A — Quantitative and Qualitative Disclosures about Market Risk
The primary objective of the following information is to provide forward-looking quantitative andqualitative information about our exposure to instruments that are sensitive to fluctuations in interest rates andforeign currency exchange rates.
Our exposure to interest rate risk arises from our debt portfolio. We manage this risk by controlling the mixof fixed versus variable-rate debt after considering the interest rate environment and expected future cash flows.To reduce our exposure to interest rate changes on variable rate debt, we entered into interest rate swapagreements. These swaps effectively convert a portion of our variable rate debt to a fixed rate. Our objective is tolimit variability in earnings, cash flows and overall borrowing costs caused by changes in interest rates, whilepreserving operating flexibility. We operate internationally and enter into transactions denominated in foreigncurrencies. These transactions expose us to gains and losses arising from exchange rate movements between thedates foreign currencies are recorded and the dates they are settled. We manage this risk by entering into forwardcurrency contracts that substantially offset these gains and losses.
We are subject to cost changes with respect to our raw materials and energy purchases. We attempt tomitigate raw materials cost increases through product reformulations, price increases and productivity
47

improvements. We enter into forward purchase arrangements with precious metals suppliers to completely coverthe value of the precious metals content of fixed price sales contracts. These agreements are designated as normalpurchase contracts, which are not marked to market, and had purchase commitments totaling $4.0 million atDecember 31, 2018. In addition, we purchase portions of our natural gas, electricity and oxygen requirementsunder fixed price contracts to reduce the volatility of these costs. These energy contracts are designated as normalpurchase contracts, which are not marked to market, and had purchase commitments totaling $50.0 million atDecember 31, 2018.
The notional amounts, carrying amounts of assets (liabilities), and fair values associated with our exposureto these market risks and sensitivity analysis about potential gains (losses) resulting from hypothetical changes inmarket rates are presented below:
December 31, December 31,2018 2017
(Dollars in thousands)
Variable-rate debt:
Carrying amount(1) $ 809,072 $ 739,602
Fair value(1) 796,846 742,634
Increase in annual interest expense from 1% increase in interest rates 2,680 4,890
Decrease in annual interest expense from 1% decrease in interest rates (2,680) (2,992)
Fixed-rate debt:
Carrying amount 8,362 7,112
Fair value 5,258 3,973
Change in fair value from 1% increase in interest rates NM NM
Change in fair value from 1% decrease in interest rates NM NM
Interest rate swaps:
Notional amount 317,604 258,045
Carrying amount and fair value (5,244) 1,492
Change in fair value from 1% increase in interest rates 13,945 9,157
Change in fair value from 1% decrease in interest rates (13,508) (3,678)
Cross currency swaps:
Notional amount 344,894 —
Carrying amount and fair value 17,104 —
Change in fair value from 10% increase (35,455) —
Change in fair value from 10% decrease 40,575 —
Foreign currency forward contracts:
Notional amount 387,190 238,457
Carrying amount and fair value (270) (469)
Change in fair value from 10% appreciation of U.S. dollar 8,070 3,541
Change in fair value from 10% depreciation of U.S. dollar (9,863) (4,328)
(1) The carrying values of the term loan facilities are net of unamortized debt issuance costs of $4.8 million and$7.5 million for the period ended December 31, 2018, and December 31, 2017, respectively.
48

Item 8 — Financial Statements and Supplementary Data
REPORT OF INDEPENDENT REGISTERED PUBLIC ACCOUNTING FIRM
To the Board of Directors and Shareholders of Ferro Corporation
Opinion on the Financial Statements
We have audited the accompanying consolidated balance sheets of Ferro Corporation and subsidiaries (the“Company”) as of December 31, 2018 and 2017, the related consolidated statements of operations,comprehensive income (loss), equity, and cash flows for each of the three years in the period endedDecember 31, 2018, and the related notes and the financial statement schedule listed in the Index at Item 15(collectively referred to as the “financial statements”). In our opinion, the financial statements present fairly, inall material respects, the financial position of the Company as of December 31, 2018 and 2017, and the results ofits operations and its cash flows for each of the three years in the period ended December 31, 2018, in conformitywith accounting principles generally accepted in the United States of America.
We have also audited, in accordance with the standards of the Public Company Accounting Oversight Board(United States) (PCAOB), the Company’s internal control over financial reporting as of December 31, 2018,based on criteria established in Internal Control — Integrated Framework (2013) issued by the Committee ofSponsoring Organizations of the Treadway Commission and our report dated February 27, 2019, expressed anunqualified opinion on the Company’s internal control over financial reporting.
Basis for Opinion
These financial statements are the responsibility of the Company’s management. Our responsibility is toexpress an opinion on the financial statements based on our audits. We are a public accounting firm registeredwith the PCAOB and are required to be independent with respect to the Company in accordance with the U.S.federal securities laws and the applicable rules and regulations of the Securities and Exchange Commission andthe PCAOB.
We conducted our audits in accordance with the standards of the PCAOB. Those standards require that weplan and perform the audit to obtain reasonable assurance about whether the financial statements are free ofmaterial misstatement, whether due to error or fraud. Our audits included performing procedures to assess therisks of material misstatement of the financial statements, whether due to error or fraud, and performingprocedures that respond to those risks. Such procedures included examining, on a test basis, evidence regardingthe amounts and disclosures in the financial statements. Our audits also included evaluating the accountingprinciples used and significant estimates made by management, as well as evaluating the overall presentation ofthe financial statements. We believe that our audits provide a reasonable basis for our opinion.
/s/ Deloitte & Touche LLP
Cleveland, OhioFebruary 27, 2019
We have served as the Company’s auditor since 2006.
49

FERRO CORPORATION AND SUBSIDIARIES
CONSOLIDATED STATEMENTS OF OPERATIONS
Years Ended December 31,
2018 2017 2016
(Dollars in thousands, except per share amounts)
Net sales $ 1,612,408 $ 1,396,742 $ 1,145,292Cost of sales 1,156,475 980,521 788,914
Gross profit 455,933 416,221 356,378Selling, general and administrative expenses 278,566 265,418 227,286Restructuring and impairment charges 13,295 11,409 15,907Other expense (income):
Interest expense 33,371 27,754 21,547Interest earned (674) (901) (630)Foreign currency losses, net 8,187 6,554 12,906Loss on extinguishment of debt 3,226 3,905 —Miscellaneous expense (income), net 15,970 (8,436) 16,917
Income before income taxes 103,992 110,518 62,445Income tax expense 23,046 52,750 17,868
Income from continuing operations 80,946 57,768 44,577Loss from discontinued operations, net of income taxes — — (64,464)
Net income (loss) 80,946 57,768 (19,887)Less: Net income attributable to noncontrolling interests 853 714 930
Net income (loss) attributable to Ferro Corporation commonshareholders $ 80,093 $ 57,054 $ (20,817)
Amounts attributable to Ferro Corporation:Income from continuing operations, net of income tax 80,093 57,054 43,647Loss from discontinued operations, net of income tax — — (64,464)
Income (loss) attributable to Ferro Corporation $ 80,093 $ 57,054 $ (20,817)
Weighted-average common shares outstanding 83,940 83,713 83,298Incremental common shares attributable to performance shares,deferred stock units, restricted stock units, and stock options 1,145 1,443 1,612
Weighted-average diluted shares outstanding 85,085 85,156 84,910
Earnings (loss) per share attributable to Ferro Corporationcommon shareholders:
Basic earnings (loss):Continuing operations $ 0.95 $ 0.68 $ 0.52Discontinued operations — — (0.77)
$ 0.95 $ 0.68 $ (0.25)
Diluted earnings (loss):Continuing operations $ 0.94 $ 0.67 $ 0.51Discontinued operations — — (0.76)
$ 0.94 $ 0.67 $ (0.25)
See accompanying notes to consolidated financial statements.
50

FERRO CORPORATION AND SUBSIDIARIES
CONSOLIDATED STATEMENTS OF COMPREHENSIVE INCOME (LOSS)
Years Ended December 31,
2018 2017 2016
(Dollars in thousands)
Net income (loss) $ 80,946 $57,768 $(19,887)
Other comprehensive (loss) income, net of income tax:
Foreign currency translation (loss) income (26,113) 30,558 (45,986)
Cash flow hedging instruments unrealized (loss) gain (4,242) 945 —
Postretirement benefit liabilities (loss) gain (39) 24 330
Other comprehensive (loss) income, net of income tax (30,394) 31,527 (45,656)
Total comprehensive income (loss) 50,552 89,295 (65,543)
Less: Comprehensive income attributable to noncontrolling interests 352 1,066 599
Comprehensive income (loss) attributable to Ferro Corporation $ 50,200 $88,229 $ (66,142)
See accompanying notes to consolidated financial statements.
51

FERRO CORPORATION AND SUBSIDIARIES
CONSOLIDATED BALANCE SHEETS
December 31,2018
December 31,2017
(Dollars in thousands)ASSETS
Current assetsCash and cash equivalents $ 104,301 $ 63,551Accounts receivable, net 306,882 354,416Inventories 356,998 324,180Other receivables 91,143 67,137Other current assets 23,960 16,448
Total current assets 883,284 825,732Other assets
Property, plant and equipment, net 381,341 321,742Goodwill 216,464 195,369Intangible assets, net 184,953 187,616Deferred income taxes 103,488 108,025Other non-current assets 42,930 43,718
Total assets $1,812,460 $1,682,202
LIABILITIES AND EQUITYCurrent liabilities
Loans payable and current portion of long-term debt $ 10,260 $ 25,136Accounts payable 256,573 211,711Accrued payrolls 39,989 48,201Accrued expenses and other current liabilities 77,995 70,151
Total current liabilities 384,817 355,199Other liabilities
Long-term debt, less current portion 811,137 726,491Postretirement and pension liabilities 173,046 166,680Other non-current liabilities 57,611 77,152
Total liabilities 1,426,611 1,325,522Equity
Ferro Corporation shareholders’ equity:Common stock, par value $1 per share; 300.0 million shares authorized;93.4 million shares issued; 83.0 million and 84.0 million shares outstanding atDecember 31, 2018, and December 31, 2017, respectively 93,436 93,436Paid-in capital 298,123 302,158Retained earnings 255,978 171,744Accumulated other comprehensive loss (105,361) (75,468)Common shares in treasury, at cost (165,545) (147,056)
Total Ferro Corporation shareholders’ equity 376,631 344,814Noncontrolling interests 9,218 11,866
Total equity 385,849 356,680
Total liabilities and equity $1,812,460 $1,682,202
See accompanying notes to consolidated financial statements.
52

FERRO CORPORATION AND SUBSIDIARIES
CONSOLIDATED STATEMENTS OF EQUITY
Ferro Corporation Shareholders
Common Sharesin Treasury Common
StockPaid-inCapital
RetainedEarnings
AccumulatedOther
Comprehensive(Loss) Income
Non-controllingInterests
TotalEquityShares Amount
(In thousands)
Balances at December 31, 2015 9,431 $(166,020) $93,436 $314,854 $135,507 $ (61,318) $ 7,822 $324,281Net (loss) income — — — — (20,817) — 930 (19,887)Other comprehensive (loss) — — — — — (45,325) (331) (45,656)Purchase of treasury stock 1,175 (11,429) — — — — — (11,429)Stock-based compensation
transactions (610) 16,513 — (8,288) — — — 8,225Distributions to noncontrolling
interests — — — — — — (502) (502)
Balances at December 31, 2016 9,996 (160,936) 93,436 306,566 114,690 (106,643) 7,919 255,032Net income — — — — 57,054 — 714 57,768Other comprehensive income — — — — — 31,175 352 31,527Stock-based compensation
transactions (610) 13,880 — (4,408) — — — 9,472Change in ownership interest — — — — — — 3,355 3,355Distributions to noncontrolling
interests — — — — — — (474) (474)
Balances at December 31, 2017 9,386 (147,056) 93,436 302,158 171,744 (75,468) 11,866 356,680Net income — — — — 80,093 — 853 80,946Other comprehensive loss — — — — — (29,893) (501) (30,394)Purchase of treasury stock 1,471 (28,807) — — — — — (28,807)Stock-based compensation
transactions (424) 10,318 — (4,824) — — — 5,494Change in ownership interest — — — 789 — — (2,228) (1,439)Distributions to noncontrolling
interests — — — — — — (772) (772)Adjustments for accounting standard
update 2016-16 — — — — 4,141 — — 4,141
Balances at December 31, 2018 10,433 $(165,545) $93,436 $298,123 $255,978 $(105,361) $ 9,218 $385,849
See accompanying notes to consolidated financial statements.
53

FERRO CORPORATION AND SUBSIDIARIES
CONSOLIDATED STATEMENTS OF CASH FLOWS
2018 2017 2016
(Dollars in thousands)Cash flows from operating activitiesNet income (loss) $ 80,946 $ 57,768 $ (19,887)Adjustments to reconcile net income (loss) to net cash provided by operating activities:
Loss (gain) on sale of assets and businesses 164 (852) (2,764)Depreciation and amortization 53,974 50,085 46,805Interest amortization 3,577 3,496 1,353Restructuring and impairment charges 4,084 7,593 50,868Loss on extinguishment of debt 3,226 3,905 —Provision for allowance for doubtful accounts 681 44 1,383Retirement benefits 9,221 (6,417) 14,436Deferred income taxes (3,720) 23,490 (11,451)Stock-based compensation 8,441 11,770 7,245
Changes in current assets and liabilities, net of effects of acquisitions:Accounts receivable 19,885 (25,852) (21,893)Inventories (33,922) (46,962) (10,271)Other receivables and other current assets (1,444) (7,099) (3,006)Accounts payable 35,887 26,150 1,162Accrued expenses and other current liabilities 164 (22,398) 11,626Other operating activities 1,629 10,069 (2,976)
Net cash provided by operating activities 182,793 84,790 62,630Cash flows from investing activities
Capital expenditures for property, plant and equipment and other long-lived assets (80,619) (50,552) (24,945)Proceeds from sale of assets — — 3,634Proceeds from sale of equity method investment — 2,268 —Collections of financing receivables 7,020 — —Business acquisitions, net of cash acquired (74,954) (131,194) (129,511)Other investing activities 37 567 —
Net cash (used in) investing activities (148,516) (178,911) (150,822)Cash flows from financing activities
Net (repayments) borrowings under loans payable (19,077) (19,634) 4,596Proceeds from revolving credit facility—2014 Credit Facility — 15,628 355,743Principal payments on revolving credit facility—2014 Credit Facility — (327,183) (214,188)Proceeds from term loan facility—Credit Facility — 623,827 —Principal payments on term loan facility—2014 Credit Facility — (243,250) (53,000)Principal payments on term loan facility—Credit Facility (304,060) (4,872) —Principal payments on term loan facility—Amended Credit Facility (6,150) — —Proceeds from term loan facility—Amended Credit Facility 466,075 — —Proceeds from revolving credit facility—Credit Facility 134,950 180,605 —Principal payments on revolving credit facility—Credit Facility (212,950) (102,605) —Proceeds from revolving credit facility—Amended Credit Facility 240,035 — —Principal payments on revolving credit facility—Amended Credit Facility (240,035) — —Principal payments on other long-term debt — (3,971) —Proceeds from other long-term debt — 2,700 —Payment of debt issuance costs (3,466) (12,927) (711)Acquisition related contingent consideration payment (9,464) (1,315) —Proceeds from exercise of stock options 764 4,526 1,140Purchase of treasury stock (28,807) — (11,429)Other financing activities (8,448) (3,166) (154)
Net cash provided by financing activities 9,367 108,363 81,997Effect of exchange rate changes on cash and cash equivalents (2,894) 3,727 (6,603)
Increase (decrease) in cash and cash equivalents 40,750 17,969 (12,798)Cash and cash equivalents at beginning of period 63,551 45,582 58,380
Cash and cash equivalents at end of period $ 104,301 $ 63,551 $ 45,582
Cash paid during the period for:Interest $ 33,910 $ 26,850 $ 17,486Income taxes $ 36,789 $ 25,662 $ 19,734
See accompanying notes to consolidated financial statements.
54

FERRO CORPORATION AND SUBSIDIARIES
NOTES TO CONSOLIDATED FINANCIAL STATEMENTSYears ended December 31, 2018, 2017 and 2016
1. Our Business
Ferro Corporation (“Ferro,” “we,” “us” or “the Company”) is a leading producer of specialty materials thatare sold to a broad range of manufacturers who, in turn, make products for many end-use markets. Ferro’sproducts fall into two general categories: functional coatings, which perform specific functions in themanufacturing processes and end products of our customers; and color solutions, which provide aesthetic andperformance characteristics to our customers’ products. We differentiate ourselves in our industry by innovationand new products and services and the consistent high quality of our products, combined with delivery oflocalized technical service and customized application technology support. Our value-added technical servicesassist customers in their material specification and evaluation, product design, and manufacturing processcharacterization in order to help them optimize the application of our products. We manage our businessesthrough four business units that are differentiated from one another by product type. The four business units arelisted below:
• Tile Coating Systems(1)
• Porcelain Enamel(1)
• Performance Colors and Glass
• Color Solutions
(1) Tile Coating Systems and Porcelain Enamel are combined into one reportable segment, PerformanceCoatings, for financial reporting purposes.
We produce our products primarily in the Europe, Middle East and Africa (“EMEA”) region, the UnitedStates (“U.S.”), the Asia Pacific region, and Latin America.
We sell our products directly to customers and through the use of agents or distributors throughout theworld. Our products are sold principally in the EMEA region, the U.S., the Asia Pacific region, and LatinAmerica. Our customers manufacture products to serve a variety of end markets, including appliances,automobiles, building and renovation, electronics, household furnishings, industrial products, packaging, andsanitary.
As discussed in Note 4, in the third quarter of 2016, we completed the disposition of the Europe-basedPolymer Additives business and have classified the related operating results, net of income tax, as discontinuedoperations in the accompanying consolidated statements of operations for the year ended December 31, 2016.
2. Significant Accounting Policies
Principles of Consolidation
Our consolidated financial statements include the accounts of the parent company and the accounts of itssubsidiaries and include the results of the Company and all entities in which the Company has a controllinginterest. When we consolidate our financial statements, we eliminate intercompany transactions, accounts andprofits. When we exert significant influence over an investee but do not control it, we account for the investmentand the investment income using the equity method. These investments are reported in the Other non-currentassets on our balance sheet. We consolidate financial results for five legal entities in which we do not own 100%of the equity interests, either directly or indirectly through our subsidiaries. These entities have non-controllinginterest ownerships ranging from 5% to 41%.
55

FERRO CORPORATION AND SUBSIDIARIES
NOTES TO CONSOLIDATED FINANCIAL STATEMENTSYears ended December 31, 2018, 2017 and 2016 — (Continued)
When we acquire a subsidiary, its financial results are included in our consolidated financial statementsfrom the date of the acquisition. When we dispose of a subsidiary, its financial results are included in ourconsolidated financial statements until the date of the disposition. In the event that a disposal group meets thecriteria for discontinued operations, prior periods are adjusted to reflect the classification.
Use of Estimates and Assumptions in the Preparation of Financial Statements
We prepare our consolidated financial statements in conformity with accounting principles generallyaccepted in the United States, which requires us to make estimates and to use judgments and assumptions thataffect the timing and amount of assets, liabilities, equity, revenues and expenses recorded and disclosed. Themore significant estimates and judgments relate to revenue recognition, restructuring and cost reductionprograms, asset impairment, income taxes, inventories, goodwill, pension and other postretirement benefits,purchase price accounting and environmental liabilities. Actual outcomes could differ from our estimates,resulting in changes in revenues or costs that could have a material impact on the Company’s results ofoperations, financial position, or cash flows.
Foreign Currency Translation
The financial results of our operations outside of the U.S. are recorded in local currencies, which generallyare also the functional currencies for financial reporting purposes. The results of operations outside of theU.S. are translated from these functional currencies into U.S. dollars using the average monthly currencyexchange rates. We use the average currency exchange rate for these results of operations as a reasonableapproximation of the results had specific currency exchange rates been used for each individual transaction.Foreign currency transaction gains and losses are recorded, as incurred, as Other expense (income) in theconsolidated statements of operations. Assets and liabilities are translated into U.S. dollars using exchange ratesat the balance sheet dates, and we record the resulting foreign currency translation adjustments as a separatecomponent of Accumulated other comprehensive loss in equity.
Revenue Recognition
Under Accounting Standards Codification (“ASC”) 606, revenues are recognized when control of thepromised goods is transferred to our customers, in an amount that reflects the consideration we expect to beentitled to in exchange for those goods. In order to achieve that core principle, the Company applies thefollowing five-step approach: 1) identify the contract with a customer, 2) identify the performance obligations, 3)determine the transaction price, 4) allocate the transaction price to the performance obligations in the contract,and 5) recognize revenue when a performance obligation is satisfied.
The Company considers confirmed customer purchase orders, which in some cases are governed by mastersales agreements, to be the contracts, from an accounting perspective, with customers. Under our standardcontracts, the only performance obligation is the delivery of manufactured goods and the performance obligationis satisfied at a point in time, when the Company transfers control of the manufactured goods. The Company mayreceive orders for products to be delivered over multiple dates that may extend across several reporting periods.The Company invoices for each order and recognizes revenue for each distinct product upon shipment, oncetransfer of control has occurred. Payment terms are standard for the industry and jurisdiction in which weoperate. In determining the transaction price, the Company evaluates whether the price is subject to refund oradjustment, to determine the net consideration to which the Company expects to be entitled. Discounts or rebatesare specifically stated in customer contracts or invoices, and are recorded as a reduction of revenue in the period
56

FERRO CORPORATION AND SUBSIDIARIES
NOTES TO CONSOLIDATED FINANCIAL STATEMENTSYears ended December 31, 2018, 2017 and 2016 — (Continued)
the related revenue is recognized. The product price as specified on the customer confirmed orders is consideredthe standalone selling price. The Company allocates the transaction price to each distinct product based on itsrelative standalone selling price. Revenue is recognized when control of the product is transferred to thecustomer (i.e., when the Company’s performance obligation is satisfied), which generally occurs at shipment. Wereview material contracts to determine transfer of control based upon the business practices and legalrequirements of each country. For sales of all products, including those containing precious metals, we reportrevenues on a gross basis, along with their corresponding cost of sales to arrive at gross profit.
The amount of shipping and handling fees invoiced to our customers at the time our product is shipped isincluded in net sales as we are the principal in those activities. Sales, valued-added and other taxes collected fromour customers and remitted to governmental authorities are excluded from net sales. Credit memos issued tocustomers for sales returns and sales adjustments are recorded when they are incurred as a reduction of sales.
There were no changes in amounts previously reported in the Company’s consolidated financial statementsdue to adopting ASC 606.
Practical Expedients and Exemptions
All material contracts have an original duration of one year or less and, as such, the Company uses thepractical expedient applicable to such contracts, and has not disclosed the transaction price for the remainingperformance obligations as of the end of each reporting period, or when the Company expects to recognize thisrevenue.
When the period of time between the transfer of control of the goods and the time the customer pays for thegoods is one year or less, the Company uses the practical expedient allowed by ASC 606 that provides relieffrom adjusting the amount of promised consideration for the effects of a financing component.
We generally expense sales commissions when incurred because the amortization period is one year or less.These costs are recorded within Selling, general and administrative expenses
Research and Development Expenses
Research and development expenses are expensed as incurred and are included in Selling, general andadministrative expenses. Total expenditures for product and application technology, including research anddevelopment, customer technical support and other related activities, were approximately $40.2 million for 2018,$36.4 million for 2017 and $27.3 million for 2016.
Restructuring Programs
We expense costs associated with exit and disposal activities designed to restructure operations and reduceongoing costs of operations when we incur the related liabilities or when other triggering events occur. After theappropriate level of management, having the authority, approves the detailed restructuring plan and theappropriate criteria for recognition are met, we establish accruals for employee termination and other costs, asapplicable. The accruals are estimates that are based upon factors including statutory and union requirements,affected employees’ lengths of service, salary level, health care benefit choices and contract provisions. We alsoanalyze the carrying value of affected long-lived assets for impairment and reductions in their remainingestimated useful lives. In addition, we record the fair value of any new or remaining obligations when existingoperating lease contracts are terminated or abandoned as a result of our exit and disposal activities.
57

FERRO CORPORATION AND SUBSIDIARIES
NOTES TO CONSOLIDATED FINANCIAL STATEMENTSYears ended December 31, 2018, 2017 and 2016 — (Continued)
Asset Impairment
The Company’s long-lived assets include property, plant and equipment, goodwill, and intangible assets.We review property, plant and equipment and intangible assets for impairment whenever events or circumstancesindicate that their carrying values may not be recoverable. The following are examples of such events or changesin circumstances:
• An adverse change in the business climate of a long-lived asset or asset group;
• An adverse change in the extent or manner in which a long-lived asset or asset group is used or in itsphysical condition;
• Current operating losses for a long-lived asset or asset group combined with a history of such losses orprojected or forecasted losses that demonstrate that the losses will continue; or
• A current expectation that, more likely than not, a long-lived asset or asset group will be sold or otherwisesignificantly disposed of before the end of its previously estimated useful life.
The carrying amount of property, plant and equipment and intangible assets is not recoverable if thecarrying value of the asset group exceeds the sum of the undiscounted cash flows expected to result from the useand eventual disposition of the asset group. In the event of impairment, we recognize a loss for the excess of therecorded value over fair value. The long-term nature of these assets requires the estimation of cash inflows andoutflows several years into the future and only takes into consideration technological advances known at the timeof review.
We review goodwill for impairment annually using a measurement date of October 31, primarily due to thetiming of our annual budgeting process, or more frequently in the event of an impairment indicator. The fairvalue of each reporting unit that has goodwill is estimated using the average of both the income approach and themarket approach, which we believe provides a reasonable estimate of the reporting unit’s fair value, unless factsor circumstances exist which indicate a more representative fair value. The income approach is a discounted cashflow model, which uses projected cash flows attributable to the reporting unit, including an allocation of certaincorporate expenses based primarily on proportional sales. We use historical results, trends and our projections ofmarket growth, internal sales efforts and anticipated cost structure assumptions to estimate future cash flows.Using a risk-adjusted, weighted-average cost of capital, we discount the cash flow projections to themeasurement date. The market approach estimates a price reasonably expected to be paid by a market participantin the purchase of the reporting units based on a comparison to similar businesses. If the fair value of anyreporting unit was determined to be less than its carrying value, we would obtain comparable market values orindependent appraisals of its net assets.
Derivative Financial Instruments
As part of our risk management activities, we employ derivative financial instruments, primarily interestrate swaps, cross currency swaps and foreign currency forward contracts, to hedge certain anticipatedtransactions, firm commitments, or assets and liabilities denominated in foreign currencies. We also purchaseportions of our energy and precious metal requirements under fixed price forward purchase contracts designatedas normal purchase contracts.
We record derivatives on our balance sheet as either assets or liabilities that are measured at fair value. Forderivative instruments that are designated and qualify as cash flow hedges, the gain or loss on the derivative isreported as a component of other comprehensive income or loss and reclassified from accumulated other
58

FERRO CORPORATION AND SUBSIDIARIES
NOTES TO CONSOLIDATED FINANCIAL STATEMENTSYears ended December 31, 2018, 2017 and 2016 — (Continued)
comprehensive loss into earnings when the hedged transaction affects earnings. For derivatives that aredesignated and qualify as net investment hedges, the gain or loss on the derivative is reported as a component ofother comprehensive income or loss. Time value is excluded and the cash payments are recognized as anadjustment to interest expense. For derivatives that are not designated as hedges, the gain or loss on thederivative is recognized in current earnings. We only use derivatives to manage well-defined risks and do not usederivatives for speculative purposes.
Postretirement and Other Employee Benefits
We recognize postretirement and other employee benefits expense as employees render the servicesnecessary to earn those benefits. We determine defined benefit pension and other postretirement benefit costs andobligations with the assistance of third parties who perform certain actuarial calculations. The calculations andthe resulting amounts recorded in our consolidated financial statements are affected by assumptions including thediscount rate, expected long-term rate of return on plan assets, the annual rate of change in compensation forplan-eligible employees, estimated changes in costs of healthcare benefits, mortality tables, and other factors. Weevaluate the assumptions used on an annual basis. All costs except the service cost component are recorded inMiscellaneous expense (income), net on the consolidated statement of operations.
Income Taxes
We account for income taxes in accordance with ASC Topic 740, Income Taxes, which requires therecognition of deferred tax assets and liabilities for the expected future tax effects of events that have beenincluded in the financial statements. Under this method, deferred tax assets and liabilities are determined basedon the differences between the financial statements and tax basis of assets and liabilities using enacted tax ratesin effect for the year in which the differences are expected to reverse. The effect of a change in tax rates ondeferred tax assets and liabilities is recognized in income in the period that includes the enactment date.
We record deferred tax assets to the extent we believe these assets will more likely than not be realized. Inmaking such determination, we consider all available positive and negative evidence, including future reversalsof existing temporary differences, the availability of tax planning strategies, forecasted income, and recentfinancial operations.
We recognize a tax benefit from an uncertain tax position when it is more likely than not that the positionwill be sustained upon examination, including resolutions of any related appeals or litigation processes, based onthe technical merits.
We recognize interest and penalties related to uncertain tax positions within the income tax expense line inthe accompanying consolidated statements of operations.
Cash Equivalents
We consider all highly liquid instruments with original maturities of three months or less when purchased tobe cash equivalents. These instruments are carried at cost, which approximates fair value.
Accounts Receivable and the Allowance for Doubtful Accounts
Ferro sells its products to customers in diversified industries throughout the world. No customer or relatedgroup of customers represents greater than 10% of net sales or accounts receivable. We perform ongoing credit
59

FERRO CORPORATION AND SUBSIDIARIES
NOTES TO CONSOLIDATED FINANCIAL STATEMENTSYears ended December 31, 2018, 2017 and 2016 — (Continued)
evaluations of our customers and require collateral principally for export sales, when industry practices allow andas market conditions dictate, subject to our ability to negotiate secured terms relative to competitive offers. Weregularly analyze significant customer accounts and provide for uncollectible accounts based on historicalexperience, customer payment history, the length of time the receivables are past due, the financial health of thecustomer, economic conditions and specific circumstances, as appropriate. Changes in these factors could resultin additional allowances. Customer accounts we conclude to be uncollectible or to require excessive collectioncosts are written off against the allowance for doubtful accounts. Historically, write-offs of uncollectibleaccounts have been within our expectations. Detailed information about the allowance for doubtful accounts isprovided below:
2018 2017 2016
(Dollars in thousands)
Allowance for doubtful accounts $ 5,504 $ 7,821 $ 8,166
Bad debt expense 681 44 1,383
Inventories
We value inventory at the lower of cost or net realizable value, with cost determined utilizing the first-in,first-out (FIFO) method. We periodically evaluate the net realizable value of inventories based primarily upontheir age, but also upon assumptions of future usage in production, customer demand and market conditions.Inventory values have been reduced to the lower of cost or net realizable value by allowances for slow moving orobsolete goods.
We maintain raw materials on our premises that we do not own, including precious metals consigned fromfinancial institutions and customers. We also consign inventory to our vendors. Although we have physicalpossession of the goods, their value is not reflected on our balance sheet because we do not have legal title.
We obtain precious metals under consignment agreements with financial institutions for periods of one yearor less. These precious metals are primarily silver, gold, platinum, and palladium and are used in the productionof certain products for our customers. Under these arrangements, the financial institutions own the preciousmetals, and accordingly, we do not report these precious metals as inventory on our consolidated balance sheetsalthough they are physically in our possession. The financial institutions charge us fees for these consignmentarrangements, and these fees are recorded as cost of sales. These agreements are cancelable by either party at theend of each consignment period, however, because we have access to a number of consignment arrangementswith available capacity, our consignment needs can be shifted among the other participating institutions in orderto ensure our supply. In certain cases, these financial institutions can require cash deposits to provide additionalcollateral beyond the value of the underlying precious metals.
Property, Plant and Equipment
We record property, plant and equipment at historical cost. In addition to the original purchased cost,including transportation, installation and taxes, we capitalize expenditures that increase the utility or useful life ofexisting assets. For constructed assets, we capitalize interest costs incurred during the period of construction. Weexpense repair and maintenance costs, as incurred. We depreciate property, plant and equipment on a straight-line basis, generally over the following estimated useful lives of the assets:
Buildings 20 to 40 years
Machinery and equipment 5 to 15 years
60

FERRO CORPORATION AND SUBSIDIARIES
NOTES TO CONSOLIDATED FINANCIAL STATEMENTSYears ended December 31, 2018, 2017 and 2016 — (Continued)
Other Capitalized Costs
We capitalize the costs of computer software developed or obtained for internal use after the preliminaryproject stage has been completed, and management, with the relevant authority, authorizes and commits tofunding a computer software project, and it is probable that the project will be completed and the software will beused to perform the function intended. External direct costs of materials and services consumed in developing orobtaining internal-use computer software, payroll and payroll-related costs for employees who are directlyassociated with the project, and interest costs incurred when developing computer software for internal use arecapitalized within Intangible assets. Capitalization ceases when the project is substantially complete, generallyafter all substantial testing is completed. We expense training costs and data conversion costs as incurred. Weamortize software on a straight-line basis over its estimated useful life, which has historically been in a range of 1to 10 years.
Environmental Liabilities
As part of the production of some of our products, we handle, process, use and store hazardous materials. Aspart of these routine processes, we expense recurring costs associated with control and disposal of hazardousmaterials as they are incurred. Occasionally we are subject to ongoing, pending or threatened litigation related tothe handling of these materials or other matters. If, based on available information, we believe that we haveincurred a liability and we can reasonably estimate the amount, we accrue for environmental remediation andother contingent liabilities. We disclose material contingencies if the likelihood of the potential loss is reasonablypossible but the amount is not reasonably estimable.
In estimating the amount to be accrued for environmental remediation, we use assumptions about:
• Remediation requirements at the contaminated site;
• The nature of the remedy;
• Existing technology;
• The outcome of discussions with regulatory agencies;
• Other potentially responsible parties at multi-party sites; and
• The number and financial viability of other potentially responsible parties.
We actively monitor the status of sites, and, as assessments and cleanups proceed, we update ourassumptions and adjust our estimates as necessary. Because the timing of related payments is uncertain, we donot discount the estimated remediation costs.
Recently Adopted Accounting Pronouncement
On April 1, 2018, we adopted Financial Accounting Standards Board (“FASB”) Accounting StandardsUpdate (“ASU”) 2017-12, Derivatives and Hedging (Topic 815): Targeted Improvements to Accounting forHedging Activities. ASU 2017-12 provides guidance to better align an entity’s risk management activities andfinancial reporting for hedging relationships through changes to both the designation and measurement guidancefor qualifying hedging relationships and the presentation of hedge results. The adoption of this ASU did not havean impact to the opening balance of Retained earnings.
On April 1, 2018, we adopted FASB ASU 2018-03, Technical Corrections and Improvements to FinancialInstruments — Overall (Subtopic 825-10): Recognition and Measurement of Financial Assets and Financial
61

FERRO CORPORATION AND SUBSIDIARIES
NOTES TO CONSOLIDATED FINANCIAL STATEMENTSYears ended December 31, 2018, 2017 and 2016 — (Continued)
Liabilities. ASU 2018-03 provides targeted improvements to address certain aspects of recognition, measurementpresentation, and disclosure of financial instruments. The adoption of ASU 2018-03 did not have a materialimpact on the Company’s consolidated financial statements.
On January 1, 2018, we adopted FASB ASU 2017-09, Compensation — Stock Compensation: (Topic 718):Scope of Modification Accounting. ASU 2017-09 provides guidance about which changes to the terms orconditions of a share-based payment award require an entity to apply modification accounting in Topic 718. Thisnew guidance would only impact our consolidated financial statements if, in the future, we modified the terms ofany of our share-based awards. The adoption of ASU 2017-09 did not have a material impact on the Company’sconsolidated financial statements.
On January 1, 2018, we adopted FASB ASU 2017-07, Compensation — Retirement Benefits: (Topic 715):Improving the Presentation of Net Periodic Pension Cost and Net Periodic Postretirement Benefit Costs. ASU2017-07 requires that an employer report the service cost component in the same line item as other compensationcosts arising from services rendered during the period. The other components of net benefit costs are to bepresented in the income statement separately from the service cost component and outside a subtotal of incomefrom operations. This ASU also allows only the service cost component of net benefit costs to be eligible forcapitalization. We adopted this ASU using the retrospective approach. This resulted in the reclassification ofincome of $6.8 million from Selling, general and administrative expenses to Other expense, (income) in ourconsolidated statement of operations for the year ended December 31, 2017, and a reclassification of loss of$14.4 million from Selling, general and administrative expenses and a loss of $5.2 million from Cost of Sales toOther expense, (income) in our consolidated statement of operations for the year ended December 31, 2016. TheCompany used a practical expedient where the amount disclosed in our Retirement Benefits footnote for the prioryear comparative period was the basis for the estimation for applying the retrospective presentation requirements.Other than this reclassification, the adoption of ASU 2017-07 did not have an impact on the Company’sconsolidated financial statements.
On January 1, 2018, we adopted FASB ASU 2017-01, Business Combinations: (Topic 805): Clarifying theDefinition of a Business. ASU 2017-01 is intended to clarify the definition of a business with the objective ofadding guidance to assist entities in evaluating whether transactions should be accounted for as acquisitions (ordispositions) of assets or businesses. The adoption of ASU 2017-01 did not have a material impact on theCompany’s consolidated financial statements.
On January 1, 2018, we adopted FASB ASU 2016-16, Income Taxes: (Topic 740): Intra-Entity Transfers ofAssets Other Than Inventory. ASU 2016-16 is intended to improve the accounting for the income taxconsequences of intra-entity transfers of assets other than inventory and requires the recognition of the incometax consequences of an intra-entity transfer of an asset, other than inventory, when the transfer occurs. Weadopted this ASU using the modified retrospective method. The impact of adopting this guidance on theCompany’s consolidated financial statements resulted in an increase to Retained earnings of $4.1 million andDeferred income taxes of $4.7 million and a decrease to Other receivables of $0.6 million on January 1, 2018.
On January 1, 2018, we adopted FASB ASU 2016-15, Statement of Cash Flow: (Topic 230): Classificationof Certain Cash Receipts and Cash Payments. ASU 2016-15 is intended to address eight specific cash flowissues with the objective of reducing the existing diversity in practice. Adoption of ASU 2016-15 did not have amaterial effect on our consolidated financial statements.
On January 1, 2018, we adopted FASB ASU 2014-09, Revenue from Contracts with Customers: (Topic606). This ASU replaces nearly all existing U.S. GAAP guidance on revenue recognition. The standard
62

FERRO CORPORATION AND SUBSIDIARIES
NOTES TO CONSOLIDATED FINANCIAL STATEMENTSYears ended December 31, 2018, 2017 and 2016 — (Continued)
prescribes a five-step model for recognizing revenue, the application of which require significant judgment. Wehave completed our assessment and review of specific contracts and have adopted this ASU using the modifiedretrospective method with no impact to the opening Retained earnings balance.
New Accounting Standards Not Yet Adopted
In August 2018, the FASB issued ASU 2018-14, Compensation-Retirement Benefits-Defined Benefit Plans-General (Subtopic 715-20): Disclosure Framework-Changes to the Disclosure Requirements for Defined BenefitPlans. ASU 2018-14 modifies disclosure requirements for employers that sponsor defined benefit pension orother postretirement plans. This pronouncement is effective for fiscal years beginning after December 15, 2020.The Company is in the process of assessing the impact that the adoption of this ASU will have on ourconsolidated financial statements.
In August 2018, the FASB issued ASU 2018-13, Fair Value Measurement (Topic 820): DisclosureFramework-Changes to the Disclosure Requirements for Fair Value Measurement. ASU 2018-13 modifies thedisclosure requirements on fair value measurements. This pronouncement is effective for fiscal years beginningafter December 15, 2019, including interim periods within those fiscal years. The Company has adopted thisstandard effective January 1, 2019, and will update the disclosures for the fair value measurements in accordancewith the standard updates.
In February 2018, the FASB issued ASU 2018-02, Income Statement — Reporting Comprehensive Income(Topic 220): Reclassification of Certain Tax Effects from Accumulated Other Comprehensive Income. ASU2018-02 allows a reclassification from Accumulated Other Comprehensive (Loss) Income to Retained Earningsfor stranded tax effects resulting from the Tax Cuts and Jobs Act and requires certain disclosures about strandedtax effects. This pronouncement is effective for fiscal years beginning after December 15, 2018, includinginterim periods within those fiscal years. The Company has elected not to reclassify the stranded tax effects dueto the Tax Cuts and Jobs Act within Accumulated Other Comprehensive Loss, as such reclassification is notdeemed beneficial to users of the financial statements.
In January 2017, the FASB issued ASU 2017-04, Intangibles — Goodwill and Other: (Topic 350):Simplifying the Test for Goodwill Impairment. ASU 2017-04 is intended to simplify the subsequent measurementof goodwill by eliminating Step 2 from the current goodwill impairment test. This pronouncement is effective forthe annual or any interim goodwill impairment tests conducted in fiscal years beginning after December 15,2019. The Company is in the process of assessing the impact that the adoption of this ASU will have on ourconsolidated financial statements.
In February 2016, the FASB issued ASU 2016-02, Leases: (Topic 842). ASU 2016-02 requires companiesto recognize a lease liability and asset on the balance sheet for operating leases with a term greater than one year.In July 2018, the FASB issued ASU 2018-11, Targeted Improvements. This ASU provides an additionaltransition method to adopt the new leasing standard. Under this new transition method, an entity initially appliesthe new leasing standard using a cumulative-effect adjustment to the opening balance of retained earnings butwill continue to report comparative periods under existing guidance in accordance with ASC 840, Leases. Theamendments in ASU 2018-11 are effective for fiscal years beginning after December 15, 2018, and interimperiods within those fiscal years.
The Company adopted this standard effective January 1, 2019, using this new transition method under ASU2018-11. We will elect the package of practical expedients permitted under the transition guidance, which allows
63

FERRO CORPORATION AND SUBSIDIARIES
NOTES TO CONSOLIDATED FINANCIAL STATEMENTSYears ended December 31, 2018, 2017 and 2016 — (Continued)
us to carryforward our historical lease classification, our assessment on whether a contract is or contains a lease,and our initial direct costs for any leases that exist prior to adoption of the new standard. We will also elect tocombine lease and non-lease components and to keep leases with an initial term of 12 months or less off thebalance sheet. The Company has substantially completed the process of assessing the impact the adoption of thisASU will have on our consolidated financial statements. We estimate the impact to be $28 million to $30 millionrecognized as total right-of-use assets and total lease liabilities on our consolidated balance sheet as of January 1,2019. Other than this impact, we do not expect the new standard to have a material impact on our remainingconsolidated financial statements.
No other new accounting pronouncements issued or with effective dates during fiscal 2018 had or areexpected to have a material impact of the Company’s consolidated financial statement.
3. Revenue
Revenues disaggregated by geography and reportable segment for the year ended December 31, 2018,follow:
EMEAUnitedStates
AsiaPacific
LatinAmerica Total
(Dollars in thousands)
Performance Coatings $ 475,435 $ 49,050 $ 108,623 $ 100,818 $ 733,926
Performance Colors and Glass 235,238 157,963 71,124 23,130 487,455
Color Solutions 142,102 172,901 41,642 34,382 391,027
Total net sales $ 852,775 $ 379,914 $ 221,389 $ 158,330 $ 1,612,408
Revenues disaggregated by geography and reportable segment for the year ended December 31, 2017,follow:
EMEAUnitedStates
AsiaPacific
LatinAmerica Total
(Dollars in thousands)
Performance Coatings $ 346,199 $ 46,468 $ 94,722 $ 106,640 $ 594,029
Performance Colors and Glass 203,280 155,284 64,853 21,236 444,653
Color Solutions 134,122 154,730 36,343 32,865 358,060
Total net sales $ 683,601 $ 356,482 $ 195,918 $ 160,741 $ 1,396,742
Revenues disaggregated by geography and reportable segment for the year ended December 31, 2016,follow:
EMEAUnitedStates
AsiaPacific
LatinAmerica Total
(Dollars in thousands)
Performance Coatings $ 289,780 $ 46,063 $ 89,573 $ 101,565 $ 526,981
Performance Colors and Glass 160,475 132,432 59,121 19,436 371,464
Color Solutions 64,800 121,692 30,770 29,585 246,847
Total net sales $ 515,055 $ 300,187 $ 179,464 $ 150,586 $ 1,145,292
64

FERRO CORPORATION AND SUBSIDIARIES
NOTES TO CONSOLIDATED FINANCIAL STATEMENTSYears ended December 31, 2018, 2017 and 2016 — (Continued)
4. Discontinued Operations
During 2016, the Company completed the disposition of the Europe-based Polymer Additives business toPlahoma Two AG, an affiliate of the LIVIA Group. The Company made a capital contribution of €12 million(approximately $13.6 million) to its subsidiaries that owned the assets prior to the close of the sale. In 2016, animpairment charge of $50.9 million was recorded under ASC Topic 360 Property, Plant and Equipment. Thecharge was calculated as the difference of the executed transaction price and the carrying value of the assets. Theimpairment charge included $1.1 million associated with the reclassification of foreign currency translation lossfrom Accumulated other comprehensive loss. The Europe-based Polymer Additives operating results, net ofincome tax, are classified as discontinued operations in the accompanying consolidated statements of operationsfor the year ended December 31, 2016.
The table below summarizes results for the Europe-based Polymer Additives assets, for the year endedDecember 31, 2016, which is reflected in our consolidated statements of operations as discontinued operations.Interest expense has been allocated to the discontinued operations based on the ratio of net assets of eachbusiness to consolidated net assets excluding debt.
2016
Net sales $ 18,481
Cost of sales 28,473
Gross loss (9,992)
Selling, general and administrative expenses 3,094
Restructuring and impairment charges 50,902
Interest expense 325
Miscellaneous (income), net (392)
Loss from discontinued operations before income taxes (63,921)
Income tax expense 543
Loss from discontinued operations, net of income taxes $(64,464)
5. Acquisitions
Quimicer, S.A.
On October 1, 2018, the Company acquired 100% of the equity interests of Quimicer, S.A. (“Quimicer”),for €32.2 million (approximately $37.4 million), including the assumption of debt of €5.2 million (approximately$6.1 million). The information included herein has been prepared based on the preliminary allocation of thepurchase price using estimates of the fair value and useful lives of the assets acquired and liabilities assumed,which were determined with the assistance of third parties who performed independent valuations usingdiscounted cash flow and comparative market approaches, and estimates made by management. As ofDecember 31, 2018, the purchase price allocation is subject to further adjustment until all information is fullyevaluated by the Company. The Company preliminarily recorded $21.5 million of personal and real property,$15.9 million of net working capital, $3.0 million of goodwill and $3.0 million of deferred tax liability on theconsolidated balance sheet.
65

FERRO CORPORATION AND SUBSIDIARIES
NOTES TO CONSOLIDATED FINANCIAL STATEMENTSYears ended December 31, 2018, 2017 and 2016 — (Continued)
UWiZ Technology Co., Ltd.
On September 25, 2018, the Company acquired 100% of the equity interests of UWiZ Technology Co., Ltd.(“UWiZ”) for TWD823.4 million (approximately $26.9 million) in cash. The information included herein hasbeen prepared based on the preliminary allocation of the purchase price using estimates of the fair value anduseful lives of the assets acquired and liabilities assumed, which were determined with the assistance of thirdparties who performed independent valuations using discounted cash flow and comparative market approaches,and estimates made by management. As of December 31, 2018, the purchase price allocation is subject to furtheradjustment until all information is fully evaluated by the Company. The Company preliminarily recorded$12.5 million of net working capital, $7.1 million of goodwill, $6.6 million of amortizable intangible assets,$2.4 million of personal and real property and $1.7 million of deferred tax liability on the consolidated balancesheet.
Ernst Diegel GmbH
On August 31, 2018, the Company acquired 100% of the equity interests of Ernst Diegel GmbH (“Diegel”),including the real property of a related party, for €12.1 million (approximately $14.0 million) in cash. Theinformation included herein has been prepared based on the preliminary allocation of the purchase price usingestimates of the fair value and useful lives of the assets acquired and liabilities assumed, which were determinedwith the assistance of third parties who performed independent valuations using discounted cash flow andcomparative market approaches, and estimates made by management. As of December 31, 2018, the purchaseprice allocation is subject to further adjustment until all information is fully evaluated by the Company. TheCompany preliminarily recorded $7.0 million of personal and real property, $4.8 million of net working capital,$2.0 million of amortizable intangible assets, $1.7 million of goodwill and $1.5 million of deferred tax liabilityon the consolidated balance sheet.
MRA Laboratories, Inc.
On July 12, 2018, the Company acquired 100% of the equity interests of MRA Laboratories, Inc. (“MRA”)for $16.0 million in cash. The information included herein has been prepared based on the preliminary allocationof the purchase price using estimates of the fair value and useful lives of the assets acquired and liabilitiesassumed, which were determined with the assistance of third parties who performed independent valuations usingdiscounted cash flow and comparative market approaches, and estimates made by management. As ofDecember 31, 2018, the purchase price allocation is subject to further adjustment until all information is fullyevaluated by the Company. The Company preliminarily recorded $7.2 million of goodwill, $6.7 million ofamortizable intangible assets, $3.4 million of net working capital, $1.6 million of deferred tax liability and$0.3 million of personal and real property on the consolidated balance sheet.
PT Ferro Materials Utama
On June 29, 2018, the Company acquired 66% of the equity interests of PT Ferro Materials Utama (“FMU”)for $2.7 million in cash, in addition to the forgiveness of debt of $9.2 million, bringing our total ownership to100%. The Company previously recorded its investment in FMU as an equity method investment, and followingthis transaction, the Company fully consolidates FMU. Due to the change of control that occurred, the Companyrecorded a gain on purchase of $2.6 million, which is recorded in Miscellaneous expense (income), net, related tothe difference between the Company’s carrying value and fair value of the previously held equity methodinvestment.
66

FERRO CORPORATION AND SUBSIDIARIES
NOTES TO CONSOLIDATED FINANCIAL STATEMENTSYears ended December 31, 2018, 2017 and 2016 — (Continued)
Endeka Group
On November 1, 2017, the Company acquired 100% of the equity interests of Endeka Group (“Endeka”), aglobal producer of high-value coatings and key raw materials for the ceramic tile market, for €72.8 million(approximately $84.8 million), including the assumption of debt of €13.1 million (approximately $15.3 million).The Company incurred acquisition costs of $0.5 million and $2.5 million for the year ended December 31, 2018and 2017, respectively, which is included in Selling, general and administrative expenses in our consolidatedstatements of operations. The acquired business contributed net sales of $111.5 million and $19.4 million for theyear ended December 31, 2018 and 2017, respectively, and net income attributable to Ferro Corporation of$14.1 million for the year ended December 31, 2018 and net loss attributable to Ferro Corporation of $1.7 millionfor the year ended December 31, 2017.
The information included herein has been prepared based on the allocation of the purchase price using thefair value and useful lives of the assets acquired and liabilities assumed, which were determined with theassistance of third parties who performed independent valuations using discounted cash flow and comparativemarket approaches, and estimates made by management. During 2018, the Company adjusted the net workingcapital on the opening balance sheet and as such, the carrying amount of the personal and real property decreased$5.9 million. The Company recorded $44.1 million of net working capital, $25.9 million of deferred tax assets,$15.9 million of personal and real property and $1.1 million of noncontrolling interest on the consolidatedbalance sheet.
Gardenia Quimica S.A.
On August 3, 2017, the Company acquired a majority interest in Gardenia Quimica S.A. (“Gardenia”) for$3.0 million. The Company previously owned 46% of Gardenia and recorded it as an equity method investment.Following this transaction, the Company owned 83.5% and fully consolidates Gardenia. Due to a change ofcontrol that occurred, the Company recorded a gain on purchase of $2.6 million related to the difference betweenthe Company’s carrying value and fair value of the previously held equity method investment. On March 1,2018, the Company acquired the remaining equity interest in Gardenia for $1.4 million.
Dip Tech Ltd.
On August 2, 2017, the Company acquired 100% of the equity interests of Dip Tech Ltd. (“Dip-Tech”), aleading provider of digital printing solutions for glass, for $77.0 million. Dip-Tech is headquartered in Kfar Saba,Israel. The purchase consideration consisted of cash paid at closing of $60.1 million, net of the net workingcapital adjustment, and contingent consideration of $16.9 million. The Company incurred acquisition costs of$0.1 million and $3.2 million for the year ended December 31, 2018 and 2017, respectively, which is included inSelling, general and administrative expenses in our consolidated statements of operations. The acquired businesscontributed net sales of $28.6 million and $18.2 million for the year ended December 31, 2018 and 2017,respectively, and net loss attributable to Ferro Corporation of $5.5 million and $2.2 million for the year endedDecember 31, 2018 and 2017, respectively. The net loss attributable to Ferro Corporation was primarily drivenby acquired intangible asset amortization costs of $3.9 million and $1.6 million for the year ended December 31,2018 and 2017, respectively, and by the amortization of inventory step up costs of $1.1 million for the year endedDecember 31, 2017. Dip-Tech incurred research and development costs of $5.9 million and $2.6 million for theyear ended December 31, 2018 and 2017, respectively.
The information included herein has been prepared based on the allocation of the purchase price using thefair value and useful lives of the assets acquired and liabilities assumed, which were determined with the
67

FERRO CORPORATION AND SUBSIDIARIES
NOTES TO CONSOLIDATED FINANCIAL STATEMENTSYears ended December 31, 2018, 2017 and 2016 — (Continued)
assistance of third parties who performed independent valuations using discounted cash flow and comparativemarket approaches, and estimates made by management. The Company recorded $41.2 million of amortizableintangible assets, $33.5 million of goodwill, $7.2 million of deferred tax liabilities, $5.1 million of indefinite-lived intangible assets, $3.2 million of personal and real property and $1.2 million of net working capital on theconsolidated balance sheet.
Smalti per Ceramiche, s.r.l
On April 24, 2017, the Company acquired 100% of the equity interests of S.P.C. Group s.r.l., and 100% ofthe equity interest of Smalti per Ceramiche, s.r.l. (together “SPC”), for €18.7 million (approximately $20.3million), including the assumption of debt of €5.7 million (approximately $6.2 million). SPC is a high-end tilecoatings manufacturer based in Italy focused on fast-growing specialty products. SPC’s products, strongtechnology, design capabilities, and customer-centric business model are complementary to our PerformanceCoatings segment, and position us for continued growth in the high-end tile markets. The Company incurredacquisition costs for the year ended December 31, 2017, of $1.5 million which is included in Selling, general andadministrative expenses in our consolidated statements of operations.
The information included herein has been prepared based on the allocation of the purchase price using thefair value and useful lives of the assets acquired and liabilities assumed, which were determined with theassistance of third parties who performed independent valuations using discounted cash flow and comparativemarket approaches, and estimates made by management. The Company recorded $6.1 million of personal andreal property, $6.0 million of amortizable intangible assets, $5.2 million of goodwill, $5.0 million of net workingcapital and $2.0 million of a deferred tax liability on the consolidated balance sheet.
Cappelle Pigments NV
On December 9, 2016, the Company acquired 100% of the equity interests of Belgium-based CappellePigments NV (“Cappelle”), a leader in specialty, high-performance inorganic and organic pigments used incoatings, inks and plastics, for €49.8 million (approximately $52.7 million), including the assumption of debt of€9.8 million (approximately $10.4 million). The acquired business contributed net sales of $71.8 million,$71.8 million and $2.2 million for the year ended December 31, 2018, 2017, and 2016, respectively. Theacquired business contributed net income attributable to Ferro Corporation of $6.4 million and $5.4 million forthe year ended December 31, 2018 and 2017, respectively, and net loss attributable to Ferro Corporation of$1.8 million for the year ended December 31, 2016.
The information included herein has been prepared based on the allocation of the purchase price using thefair value and useful lives of the assets acquired and liabilities assumed, which were determined with theassistance of third parties who performed independent valuations using discounted cash flow and comparativemarket approaches and estimates made by management. The Company recorded $27.7 million of net workingcapital, $25.0 million of personal and real property, $3.8 million of goodwill and $3.8 million of a deferred taxliability on the consolidated balance sheet.
Electro-Science Laboratories, Inc.
On October 31, 2016, the Company acquired 100% of the equity interests of Electro-Science Laboratories,Inc. (“ESL”), a leader in electronic packaging materials for $78.5 million. ESL is headquartered in King ofPrussia, Pennsylvania. The acquisition of ESL enhances the Company’s position in the electronic packaging
68

FERRO CORPORATION AND SUBSIDIARIES
NOTES TO CONSOLIDATED FINANCIAL STATEMENTSYears ended December 31, 2018, 2017 and 2016 — (Continued)
materials space with complementary products, and offers a platform for growth in our Performance Colors andGlass segment. ESL produces thick-film pastes and ceramics tape systems that enable important functionality ina wide variety of industrial and consumer applications. The acquired business contributed net sales of$83.0 million, $44.3 million, and $6.1 million for the year ended December 31, 2018, 2017 and 2016,respectively. The acquired business contributed net income attributable to Ferro Corporation of $18.2 million,$5.1 million and $0.5 million for the year ended December 31, 2018, 2017, and 2016, respectively. TheCompany incurred acquisition costs of $0.3 million for the year ended December 31, 2017 and $1.9 million forthe year ended December 31, 2016, which is included in Selling, general and administrative expenses in ourconsolidated statements of operations.
The information included herein has been prepared based on the allocation of the purchase price using thefair value and useful lives of the assets acquired and liabilities assumed, which were determined with theassistance of third parties who performed independent valuations using discounted cash flow and comparativemarket approaches and estimates made by management. The Company recorded $39.7 million of intangibleassets, $19.0 million of goodwill, $18.9 million of net working capital, $2.9 million of personal and real propertyand, $2.0 million of a deferred tax liability on the consolidated balance sheet.
Delta Performance Products, LLC
On August 1, 2016, the Company acquired certain assets of Delta Performance Products, LLC (“Delta”), fora cash purchase price of $4.4 million. The information included herein has been prepared based on the allocationof the purchase price using the fair value and useful lives of the assets acquired and liabilities assumed, whichwere determined with the assistance of third parties who performed independent valuations using discounted cashflow and comparative market approaches and estimates made by management. The Company recorded$3.2 million of amortizable intangible assets, $0.6 million of net working capital, $0.4 million of goodwill and,$0.2 million of a deferred tax asset on the consolidated balance sheet.
Pinturas Benicarló, S.L.
On June 1, 2016, the Company acquired 100% of the equity interests of privately held Pinturas Benicarló,S.L. (“Pinturas”) for €16.5 million in cash (approximately $18.4 million). The information included herein hasbeen prepared based on the allocation of the purchase price using the fair value and useful lives of the assetsacquired and liabilities assumed, which were determined with the assistance of third parties who performedindependent valuations using discounted cash flow and comparative market approaches and estimates made bymanagement. The Company recorded $8.8 million of amortizable intangible assets, $7.7 million of net workingcapital, $3.9 million of goodwill, $2.7 million of a deferred tax liability and, $0.7 million of personal and realproperty on the consolidated balance sheet.
Ferer Dis Ticaret Ve Kimyasallar Anonim Sirketi A.S.
On January 5, 2016, the Company acquired 100% of the equity interests of privately held Istanbul-basedFerer Dis Ticaret Ve Kimyasallar Anonim Sirketi A.S. (“Ferer”) for $9.4 million in cash. The informationincluded herein has been prepared based on the allocation of the purchase price using the fair value and usefullives of the assets acquired and liabilities assumed, which were determined with the assistance of third partieswho performed independent valuations using discounted cash flow and comparative market approaches andestimates made by management. The Company recorded $4.5 million of goodwill, $3.3 million of amortizableintangible assets, $1.7 million of net working capital, $0.7 million of a deferred tax liability, and $0.6 million ofpersonal and real property on the consolidated balance sheet.
69

FERRO CORPORATION AND SUBSIDIARIES
NOTES TO CONSOLIDATED FINANCIAL STATEMENTSYears ended December 31, 2018, 2017 and 2016 — (Continued)
6. Inventories
Inventory at December 31 consisted of the following:
2018 2017
(Dollars in thousands)
Raw materials $116,219 $112,300
Work in process 55,884 39,454
Finished goods 184,895 172,426
Total inventories $356,998 $324,180
In the production of some of our products, we use precious metals, some of which we obtain from financialinstitutions under consignment agreements with terms of one year or less. The financial institutions retainownership of the precious metals and charge us fees based on the amounts we consign. These fees were$2.1 million for 2018, $1.2 million for 2017, and $0.8 million for 2016. We had on hand precious metals ownedby participants in our precious metals consignment program of $55.2 million at December 31, 2018, and$37.7 million at December 31, 2017, measured at fair value based on market prices for identical assets.
7. Property, Plant and Equipment
Property, Plant and Equipment at December 31 consisted of the following:
2018 2017
(Dollars in thousands)
Land $ 55,501 $ 48,566
Buildings 214,963 199,076
Machinery and equipment 553,855 548,864
Construction in progress 80,410 28,125
Total property, plant and equipment 904,729 824,631
Total accumulated depreciation (523,388) (502,889)
Property, plant and equipment, net $ 381,341 $ 321,742
Depreciation expense was $38.1 million for 2018, $36.9 million for 2017, and $37.9 million for 2016.Noncash investing activities for capital expenditures, consisting of new capital leases during the year and unpaidcapital expenditure liabilities at year end, were $13.6 million for 2018, $8.8 million for 2017, and $5.0 millionfor 2016.
As discussed in Note 4, the Company completed the disposition of the Europe-based Polymer Additivesbusiness in 2016. In 2016, an impairment charge of $50.9 million was recorded under ASC Topic 360 Property,Plant and Equipment. The charge was calculated as the difference of the executed transaction price and thecarrying value of the assets and is included in Loss from discontinued operations, net of income taxes, in ourconsolidated statements of operations for the year ended December 31, 2016.
70

FERRO CORPORATION AND SUBSIDIARIES
NOTES TO CONSOLIDATED FINANCIAL STATEMENTSYears ended December 31, 2018, 2017 and 2016 — (Continued)
The following table presents information about the Company’s impairment charges on assets that wererequired to be measured on a fair value basis for the year ended December 31, 2016. The table also indicates thelevel within the fair value hierarchy of the valuation techniques used by the Company to determine the fair value:
Fair Value Measurements Using Total(Losses)Description Level 1 Level 2 Level 3 Total
(Dollars in thousands)
December 31, 2016 $ — $ — $— $— $ (50,902)
The inputs to the valuation techniques used to measure fair value are classified into the following categories:
Level 1: Quoted market prices in active markets for identical assets or liabilities.
Level 2: Observable market-based inputs or unobservable inputs that are corroborated by market data.
Level 3: Unobservable inputs that are not corroborated by market data.
During 2016, we recorded a $3.9 million gain on sale from the sale proceeds of a closed site in Australiawhich was recorded in Miscellaneous expense (income), net in our consolidated statements of operations for theyear ended December 31, 2016.
8. Goodwill and Other Intangible Assets
Details and activity in the Company’s goodwill by segment are as follows:
PerformanceCoatings
ColorSolutions
PerformanceColors and
Glass Total
(Dollars in thousands)
Goodwill, net at December 31, 2016 $ 28,090 40,421 79,785 148,296
Acquisitions 5,970(2) 328(4) 31,616(1),(3) 37,914
Foreign currency adjustments 4,176 1,786 3,197 9,159
Goodwill, net at December 31, 2017 38,236 42,535 114,598 195,369
Acquisitions 8,171(6) 8,857(8) 8,530(5),(7) 25,558
Foreign currency adjustments (2,055) (847) (1,561) (4,463)
Goodwill, net at December 31, 2018 $ 44,352 $50,545 $121,567 $216,464
(1) During 2017, the Company recorded a purchase price adjustment within the measurement period forgoodwill related to the ESL acquisition.
(2) During 2017, the Company recorded goodwill related to the SPC and Gardenia acquisitions.(3) During 2017, the Company recorded goodwill related to the Dip-Tech acquisition.(4) During 2017, the Company recorded a purchase price adjustment within the measurement period for
goodwill related to the Cappelle acquisition.(5) During 2018, the Company recorded a purchase price adjustment within the measurement period for
goodwill related to the Dip-Tech acquisition.(6) During 2018, the Company recorded goodwill related to the FMU acquisition and recorded goodwill related
to the Quimicer acquisition.
71

FERRO CORPORATION AND SUBSIDIARIES
NOTES TO CONSOLIDATED FINANCIAL STATEMENTSYears ended December 31, 2018, 2017 and 2016 — (Continued)
(7) During 2018, the Company recorded goodwill related to the MRA acquisition.(8) During 2018, the Company recorded goodwill related to the UWiZ and Diegel acquisitions.
Refer to Note 5 for additional details on acquisitions mentioned above.
December 31, December 31,2018 2017
(Dollars in thousands)
Goodwill, gross $274,931 $253,836
Accumulated impairment losses (58,467) (58,467)
Goodwill, net $216,464 $195,369
The significant assumptions and ranges of assumptions we used in our impairment analyses of goodwillfollow:
Significant Assumptions 2018 2017
Weighted-average cost of capital 13.0% -14.75% 11.0% - 13.5%
Residual growth rate 3.0% 3.0%
During the fourth quarter of 2018 and 2017, we performed our annual goodwill impairment testing. The testentailed comparing the fair value of our reporting units to their carrying value as of the measurement date ofOctober 31, 2018, and October 31, 2017, respectively. We performed step 1 of the annual impairment test asdefined in ASC Topic 350, Intangibles — Goodwill and Other. During our 2018 and 2017 assessment, the resultof the goodwill impairment test was that there were no indicators of impairment. During our 2016 assessment, animpairment indicator was identified within our Tile Coating Systems reporting unit, a component of ourPerformance Coatings segment. The impairment indicator was the current and forecasted performance of thereporting unit in total. We compared the carrying value against the fair value, and determined that the carryingvalue exceeded the fair value. As a result, an impairment loss of $13.2 million has been included in restructuringand impairment charges in the consolidated statement of operations for the year ended December 31, 2016. TheCompany is not aware of any events or circumstances that occurred between the annual assessment date andDecember 31, 2018, which would require further testing of goodwill for impairment.
Fair Value Measurements Using Total(Losses)Description Level 1 Level 2 Level 3 Total
(Dollars in thousands)
December 31, 2016 $ — $ — $ — $ — $ (13,198)
72

FERRO CORPORATION AND SUBSIDIARIES
NOTES TO CONSOLIDATED FINANCIAL STATEMENTSYears ended December 31, 2018, 2017 and 2016 — (Continued)
Amortizable intangible assets at December 31 consisted of the following:
EstimatedEconomic Life 2018 2017
(Dollars in thousands)
Gross amortizable intangible assets:
Patents 10 - 16 years $ 5,462 $ 5,279
Land rights 20 - 40 years 4,773 4,947
Technology/know-how and other 1 - 30 years 132,084 131,070
Customer relationships 10 - 20 years 100,368 93,500
Total gross amortizable intangible assets 242,687 234,796
Accumulated amortization:
Patents (5,440) (5,226)
Land rights (2,909) (2,883)
Technology/know-how and other (48,898) (45,214)
Customer relationships (17,306) (11,114)
Total accumulated amortization (74,553) (64,437)
Amortizable intangible assets, net $ 168,134 $ 170,359
We amortize amortizable intangible assets on a straight-line basis over the estimated useful lives of theassets. Amortization expense related to amortizable intangible assets was $15.8 million for 2018, $13.1 millionfor 2017, and $8.9 million for 2016. Amortization expense for amortizable intangible assets is expected to beapproximately $16.7 million for 2019, $15.5 million for 2020, $14.5 million for 2021, $14.3 million for 2022,and $14.1 million for 2023.
Indefinite-lived intangible assets at December 31 consisted of the following:
2018 2017
(Dollars in thousands)
Indefinite-lived intangibles assets:
Trade names and trademarks $16,819 $17,257
9. Debt and Other Financing
Loans payable and current portion of long-term debt at December 31 consisted of the following:
2018 2017
(Dollars in thousands)
Loans payable $ 50 $ 16,360
Current portion of long-term debt 10,210 8,776
Loans payable and current portion of long-term debt $ 10,260 $ 25,136
73

FERRO CORPORATION AND SUBSIDIARIES
NOTES TO CONSOLIDATED FINANCIAL STATEMENTSYears ended December 31, 2018, 2017 and 2016 — (Continued)
Long-term debt at December 31 consisted of the following:
2018 2017
(Dollars in thousands)
Term loan facility, net of unamortized issuance costs, maturing 2024(1) $ 809,022 $ 645,242
Revolving credit facility — 78,000
Capital lease obligations 3,963 4,913
Other notes 8,362 7,112
Total long-term debt 821,347 735,267
Current portion of long-term debt (10,210) (8,776)
Long-term debt, less current portion $ 811,137 $ 726,491
(1) The carrying value of the term loan facility, maturing 2024, is net of unamortized debt issuance costs of$4.8 million at December 31, 2018, and $7.5 million at December 31, 2017.
The annual maturities of long-term debt for each of the five years after December 31, 2018, are as follows(in thousands):
2019 $ 10,575
2020 9,671
2021 9,393
2022 10,203
2023 9,131
Thereafter 778,077
Total maturities of long-term debt 827,050
Unamortized issuance costs on Term loan facility (4,828)
Imputed interest and executory costs on capitalized lease obligations (875)
Total long-term debt $ 821,347
Amended Credit Facility
On April 25, 2018, the Company entered into an amendment (the “Amended Credit Facility”) to its existingcredit facility (the “Credit Facility”) which Amended Credit Facility (a) provided a new revolving facility (the“2018 Revolving Facility”), which replaced the Company’s existing revolving facility, (b) repriced the (“TrancheB-1 Loans”), (c) provided new tranches of term loans (“Tranche B-2 Loans” and “Tranche B-3 Loans”)denominated in U.S. dollars and will be used for ongoing working capital requirements and general corporatepurposes. The Tranche B-2 Loans are borrowed by the Company and the Tranche B-3 Loans are borrowed on ajoint and several basis by Ferro GmbH and Ferro Europe Holdings LLC.
The Amended Credit Facility consists of a $500 million secured revolving line of credit with a maturity ofFebruary 2023, a $355 million secured term loan facility with a maturity of February 2024, a $235 millionsecured term loan facility with a maturity of February 2024 and a $230 million secured term loan facility with amaturity of February 2024. The term loans are payable in equal quarterly installments in an amount equal to
74

FERRO CORPORATION AND SUBSIDIARIES
NOTES TO CONSOLIDATED FINANCIAL STATEMENTSYears ended December 31, 2018, 2017 and 2016 — (Continued)
0.25% of the original principal amount of the term loans, with the remaining balance due on the maturity datethereof. In addition, the Company is required, on an annual basis, to make a prepayment in an amount equal to aportion of the Company’s excess cash flow, as calculated pursuant to the Amended Credit Facility, whichprepayment will be applied first to the term loans until they are paid in full, and then to the revolving loans.
Subject to the satisfaction of certain conditions, the Company can request additional commitments under therevolving line of credit or term loans in the aggregate principal amount of up to $250 million to the extent thatexisting or new lenders agree to provide such additional commitments and/or term loans. The Company can alsoraise certain additional debt or credit facilities subject to satisfaction of certain covenant levels.
Certain of the Company’s U.S. subsidiaries have guaranteed the Company’s obligations under the AmendedCredit Facility and such obligations are secured by (a) substantially all of the personal property of the Companyand the U.S. subsidiary guarantors and (b) a pledge of 100% of the stock of certain of the Company’s U.S.subsidiaries and 65% of the stock of certain of the Company’s direct foreign subsidiaries. The Tranche B-3Loans are guaranteed by the Company, the U.S. subsidiary guarantors and a cross-guaranty by the borrowers ofthe Tranche B-3 Loans, and are secured by the collateral securing the revolving loans and the other term loans, inaddition to a pledge of the equity interests of Ferro GmbH.
Interest Rate – Term Loans: The interest rates applicable to the term loans will be, at the Company’s option,equal to either a base rate or a LIBOR rate plus, in both cases, an applicable margin.
• The base rate for term loans will be the highest of (i) the federal funds rate plus 0.50%, (ii) syndicationagent’s prime rate, (iii) the daily LIBOR rate plus 1.00% or (iv) 0.00%. The applicable margin for baserate loans is 1.25%.
• The LIBOR rate for term loans shall not be less than 0.0% and the applicable margin for LIBOR rate termloans is 2.25%.
• For LIBOR rate term loans, the Company may choose to set the duration on individual borrowings forperiods of one, two, three or six months, with the interest rate based on the applicable LIBOR rate for thecorresponding duration.
At December 31, 2018, the Company had borrowed $352.3 million under the Tranche B-1 Loans at aninterest rate of 5.05%, $233.2 million under the Tranche B-2 Loans at an interest rate of 5.05%, and$228.3 million under the Tranche B-3 Loans at an interest rate of 5.05%. At December 31, 2018, there were noadditional borrowings available under the Tranche B-1 Loans, Tranche B-2 Loans, and Tranche B-3 Loans. Weentered into swap agreements in the second quarter of 2018. At December 31, 2018, the effective interest rate forthe Tranche B-1 Loans, Tranche B-2 Loans, and Tranche B-3 Loans, after adjusting for the interest rate swap,was 5.19%, 3.43%, and 2.48%, respectively.
Interest Rate – Revolving Credit Line: The interest rates applicable to loans under the 2018 RevolvingCredit Facility will be, at the Company’s option, equal to either a base rate or a LIBOR rate plus, in both cases,an applicable variable margin. The variable margin will be based on the ratio of (a) the Company’s totalconsolidated net debt outstanding (as defined in the Amended Credit Agreement) at such time to (b) theCompany’s consolidated EBITDA (as defined in the Amended Credit Agreement) computed for the period offour consecutive fiscal quarters most recently ended.
• The base rate for revolving loans will be the highest of (i) the federal funds rate plus 0.50%, (ii)syndication agent’s prime rate, (iii) the daily LIBOR rate plus 1.00% or (iv) 0.00%. The applicablemargin for base rate loans will vary between 0.50% to 1.50%.
75

FERRO CORPORATION AND SUBSIDIARIES
NOTES TO CONSOLIDATED FINANCIAL STATEMENTSYears ended December 31, 2018, 2017 and 2016 — (Continued)
• The LIBOR rate for revolving loans shall not be less than 0% and the applicable margin for LIBOR raterevolving loans will vary between 1.50% and 2.50%.
• For LIBOR rate revolving loans, the Company may choose to set the duration on individual borrowingsfor periods of one, two, three or six months, with the interest rate based on the applicable LIBOR rate forthe corresponding duration.
At December 31, 2018, there were no borrowings under the 2018 Revolving Credit Facility. Afterreductions for outstanding letters of credit secured by these facilities, we had $495.3 million of additionalborrowings available under the revolving credit facilities at December 31, 2018.
The Amended Credit Facility contains customary restrictive covenants including, but not limited to,limitations on use of loan proceeds, limitations on the Company’s ability to pay dividends and repurchase stock,limitations on acquisitions and dispositions, and limitations on certain types of investments. The Amended CreditFacility also contains standard provisions relating to conditions of borrowing and customary events of default,including the non-payment of obligations by the Company and the bankruptcy of the Company.
Specific to the 2018 Revolving Facility, the Company is subject to a financial covenant regarding theCompany’s maximum leverage ratio. If an event of default occurs, all amounts outstanding under the AmendedCredit Facility agreement may be accelerated and become immediately due and payable. At December 31, 2018,we were in compliance with the covenants of the Amended Credit Facility.
Credit Facility
On February 14, 2017, the Company entered into a credit facility (the “Credit Facility”) with a group oflenders to refinance its then outstanding credit facility debt and to provide liquidity for ongoing working capitalrequirements and general corporate purposes.
The Credit Facility consisted of a $400 million secured revolving line of credit with a term of five years, a$357.5 million secured term loan facility with a term of seven years and a €250 million secured Euro term loanfacility with a term of seven years. The term loans were payable in equal quarterly installments in an amountequal to 0.25% of the original principal amount of the term loans, with the remaining balance due on the maturitydate thereof. In addition, the Company was required, on an annual basis, to make a prepayment of term loansuntil they were fully paid and then to the revolving loans in an amount equal to a portion of the Company’sexcess cash flow, as calculated pursuant to the Credit Facility.
Subject to the satisfaction of certain conditions, the Company could request additional commitments underthe revolving line of credit or term loans in the aggregate principal amount of up to $250 million, to the extentthat existing or new lenders agree to provide such additional commitments and/or term loans. The Companycould also raise certain additional debt or credit facilities subject to satisfaction of certain covenant levels.
Certain of the Company’s U.S. subsidiaries guaranteed the Company’s obligations under the Credit Facilityand such obligations were secured by (a) substantially all of the personal property of the Company and the U.S.subsidiary guarantors and (b) a pledge of 100% of the stock of certain of the Company’s U.S. subsidiaries and65% of the stock of certain of the Company’s direct foreign subsidiaries.
Interest Rate – Term Loans: The interest rates applicable to the U.S. term loans was, at the Company’soption, equal to either a base rate or a LIBOR rate plus, in both cases, an applicable margin. The interest rates
76

FERRO CORPORATION AND SUBSIDIARIES
NOTES TO CONSOLIDATED FINANCIAL STATEMENTSYears ended December 31, 2018, 2017 and 2016 — (Continued)
applicable to the Euro term loans was a Euro Interbank Offered Rate (“EURIBOR”) rate plus an applicablemargin.
• The base rate for U.S. term loans will be the highest of (i) the federal funds rate plus 0.50%, (ii)syndication agent’s prime rate or (iii) the daily LIBOR rate plus 1.00%. The applicable margin for baserate loans is 1.50%.
• The LIBOR rate for U.S. term loans shall not be less than 0.75% and the applicable margin for LIBORrate U.S. term loans is 2.50%.
• The EURIBOR rate for Euro term loans shall not be less than 0% and the applicable margin forEURIBOR rate loans is 2.75%.
• For LIBOR rate term loans and EURIBOR rate term loans, the Company may choose to set the durationon individual borrowings for periods of one, two, three or six months, with the interest rate based on theapplicable LIBOR rate or EURIBOR rate, as applicable, for the corresponding duration.
At December 31, 2017, the Company had borrowed $354.8 million under the secured term loan facility at aninterest rate of 4.07% and €248.1 million (approximately $297.9 million) under the secured Euro term loanfacility at an interest rate of 2.75%. At December 31, 2017, there were no additional borrowings available underthe term loan facilities. We entered into interest rate swap agreements in the second quarter of 2017. These swapsconverted $150 million and €90 million of our term loans from variable interest rates to fixed interest rates. AtDecember 31, 2017, the effective interest rate for the term loan facilities after adjusting for the interest rate swapwas 4.27% for the secured term loan facility and 3.00% for the Euro term loan facility.
Interest Rate – Revolving Credit Line: The interest rates applicable to loans under the revolving credit linewas, at the Company’s option, equal to either a base rate or a LIBOR rate plus, in both cases, an applicablevariable margin. The variable margin was based on the ratio of (a) the Company’s total consolidated net debtoutstanding at such time to (b) the Company’s consolidated EBITDA computed for the period of fourconsecutive fiscal quarters most recently ended.
• The base rate for revolving loans will be the highest of (i) the federal funds rate plus 0.50%, (ii)syndication agent’s prime rate or (iii) the daily LIBOR rate plus 1.00%. The applicable margin for baserate loans will vary between 0.75% and 1.75%.
• The LIBOR rate for revolving loans shall not be less than 0% and the applicable margin for LIBOR raterevolving loans will vary between 1.75% and 2.75%.
• For LIBOR rate revolving loans, the Company may choose to set the duration on individual borrowingsfor periods of one, two, three or six months, with the interest rate based on the applicable LIBOR rate forthe corresponding duration.
At December 31, 2017, there were $78.0 million of borrowings under the revolving credit line at an interestrate of 3.63%. After reductions for outstanding letters of credit secured by these facilities, we had $317.3 millionof additional borrowings available under the revolving credit facilities at December 31, 2017.
The Credit Facility contained customary restrictive covenants including, but not limited to, limitations onuse of loan proceeds, limitations on the Company’s ability to pay dividends and repurchase stock, limitations onacquisitions and dispositions, and limitations on certain types of investments. The Credit Facility also containedstandard provisions relating to conditions of borrowing and customary events of default, including thenon-payment of obligations by the Company and the bankruptcy of the Company.
77

FERRO CORPORATION AND SUBSIDIARIES
NOTES TO CONSOLIDATED FINANCIAL STATEMENTSYears ended December 31, 2018, 2017 and 2016 — (Continued)
Specific to the revolving credit facility, the Company was subject to a financial covenant regarding theCompany’s maximum leverage ratio. If an event of default occurs, all amounts outstanding under the CreditFacility may be accelerated and become immediately due and payable. At December 31, 2017, we were incompliance with the covenants of the Credit Facility.
In conjunction with the refinancing of the Credit Facility, we recorded a charge of $3.2 million inconnection with the write-off of unamortized issuance costs, which is recorded within Loss on extinguishment ofdebt in our consolidated statement of operations for the year ended December 31, 2018.
2014 Credit Facility
In 2014, the Company entered into a credit facility that was amended on January 25, 2016, and August 29,2016, resulting in a $400 million secured revolving line of credit with a term of five years and a $300 millionsecured term loan facility with a term of seven years from the original issuance date (the “2014 Credit Facility”)with a group of lenders that was replaced on February 14, 2017, by the Credit Facility (as defined above).
In conjunction with the refinancing of the 2014 Credit Facility, we recorded a charge of $3.9 million inconnection with the write-off of unamortized issuance costs, which is recorded within Loss on extinguishment ofdebt in our consolidated statement of operations for the year ended December 31, 2017.
International Receivable Sales Programs
We have several international programs to sell without recourse trade accounts receivable to financialinstitutions. These transactions are treated as a sale and are accounted for as a reduction in accounts receivablebecause the agreements transfer effective control over and risk related to the receivables to the buyers. TheCompany continues to service the receivables sold in exchange for a fee. The servicing fee for the year endedDecember 31, 2018, was immaterial. The program, whose maximum capacity is 100 million Euro, is scheduledto expire in December 2023. Generally, at the transfer date, the Company received cash equal to approximately65% of the value of the sold receivable. Cash proceeds at the transfer date from these arrangements are reflectedin operating activities in our consolidated statement of cash flows. The proceeds from the deferred purchase priceare reflected in investing activities.
At December 31, 2018, the outstanding principal amount of receivables sold under this program was$71.3 million. The carrying amount of deferred purchase price was $23.0 million and is recorded in OtherReceivables.
2018
(Dollars in thousands)
Trade accounts receivable sold to financial institutions $89,894
Cash proceeds from financial institutions 57,316
Trade accounts receivable collected to be remitted(1) 11,552
(1) Included in Accrued expense and other current liabilities
Other Financing Arrangements
We maintain other lines of credit to provide global flexibility for Ferro’s short-term liquidity requirements.These facilities are uncommitted lines for our international operations and totaled $41.4 million at December 31,
78

FERRO CORPORATION AND SUBSIDIARIES
NOTES TO CONSOLIDATED FINANCIAL STATEMENTSYears ended December 31, 2018, 2017 and 2016 — (Continued)
2018, and $64.5 million at December 31, 2017. The unused portions of these lines provided additional liquidityof $30.3 million at December 31, 2018, and $39.4 million at December 31, 2017.
10. Financial Instruments
The following table presents financial instrument assets (liabilities) at the carrying amount, fair value andclassification within the fair value hierarchy:
December 31, 2018
CarryingAmount
Fair Value
Total Level 1 Level 2 Level 3
(Dollars in thousands)
Cash and cash equivalents $ 104,301 $ 104,301 $ 104,301 $ — $ —
Loans payable (50) (50) — (50) —
Term loan facility — Amended Credit Facility(1) (809,022) (796,796) — (796,796) —
Other long-term notes payable (8,362) (5,258) — (5,258) —
Cross currency swaps 17,104 17,104 — 17,104 —
Interest rate swaps (5,244) (5,244) — (5,244) —
Foreign currency forward contracts, net (270) (270) — (270) —
December 31, 2017
CarryingAmount
Fair Value
Total Level 1 Level 2 Level 3
(Dollars in thousands)
Cash and cash equivalents $ 63,551 $ 63,551 $ 63,551 $ — $ —
Loans payable (16,360) (16,360) — (16,360) —
Term loan facility — Credit Facility(1) (645,242) (646,979) — (646,979) —
Revolving credit facility — Credit Facility (78,000) (79,295) — (79,295) —
Other long-term notes payable (7,112) (3,973) — (3,973) —
Interest rate swaps 1,616 1,616 — 1,616 —
Interest rate swaps (124) (124) — (124) —
Foreign currency forward contracts, net (469) (469) — (469) —
(1) The carrying values of the term loan facilities are net of unamortized debt issuance costs of $4.8 million and$7.5 million for the period ended December 31, 2018, and December 31, 2017, respectively.
The fair values of cash and cash equivalents are based on the fair values of identical assets. The fair valuesof loans payable are based on the present value of expected future cash flows and approximate their carryingamounts due to the short periods to maturity. The fair value of the term loan facility is based on market priceinformation and is measured using the last available bid price of the instrument on a secondary market. Therevolving credit facility and other long-term notes payable are based on the present value of expected future cashflows and interest rates that would be currently available to the Company for issuance of similar types of debtinstruments with similar terms and remaining maturities adjusted for the Company’s performance risk. The fairvalues of our interest rate swaps and cross currency swaps are determined based on inputs that are readilyavailable in public markets or can be derived from information available in publicly quoted markets. The fairvalues of the foreign currency forward contracts are based on market prices for comparable contracts.
79

FERRO CORPORATION AND SUBSIDIARIES
NOTES TO CONSOLIDATED FINANCIAL STATEMENTSYears ended December 31, 2018, 2017 and 2016 — (Continued)
Derivative Instruments
The Company may use derivative instruments to partially offset its business exposure to foreign currencyand interest rate risk on expected future cash flows, on net investment in certain foreign subsidiaries and oncertain existing assets and liabilities. However, the Company may choose not to hedge in countries where it is noteconomically feasible to enter into hedging arrangements or where hedging inefficiencies exist, such as timing oftransactions.
Derivatives Designated as Hedging Instruments
Cash Flow Hedges. For derivative instruments that are designated and qualify as cash flow hedges, the gainor loss on the derivative is recorded in Accumulated other comprehensive loss (“AOCL”) and reclassified intoearnings in the same period during which the hedged transaction affects earnings.
The Company utilizes interest rate swaps to limit exposure to market fluctuations on floating-rate debt.During the second quarter of 2017, the Company entered into interest rate swap agreements that converted$150 million and €90 million of our term loans from variable interest rates to fixed interest rates. These swapsqualified for, and were designated as, cash flow hedges. This interest rate swap agreement were terminated in thesecond quarter of 2018 in connection with the refinancing of the Credit Facility.
During the second quarter of 2018, the Company entered into variable to fixed interest rate swaps with amaturity date of February 14, 2024. The notional amount is $317.6 million at December 31, 2018. These swapsare hedging risk associated with the Tranche B-1 Loans. These interest rate swaps are designated as cash flowhedges. As of December 31, 2018, the Company expects it will reclassify net losses of approximately$0.8 million, currently recorded in AOCL, into interest expense in earnings within the next twelve months.However, the actual amount reclassified could vary due to future changes in the fair value of these derivatives.
The Company has converted a US dollar denominated, variable rate debt obligation into a euro fixed rateobligation using receive-float, pay fixed cross currency swaps in the second quarter of 2018. These swaps arehedging currency and interest rate risk associated with the Tranche B-3 Loans. These cross currency swaps aredesignated as cash flow hedges. The notional amount is $228.3 million at December 31, 2018, with a maturitydate of February 14, 2024. The spot to spot change is recorded in Foreign currency losses, net, to offset the gainor loss recognized on the foreign denominated debt. As of December 31, 2018, the Company expects it willreclassify net gains of approximately $5.9 million, currently recorded in AOCL, into interest expense in earningswithin the next twelve months. However, the actual amount reclassified could vary due to future changes in thefair value of these derivatives.
80

FERRO CORPORATION AND SUBSIDIARIES
NOTES TO CONSOLIDATED FINANCIAL STATEMENTSYears ended December 31, 2018, 2017 and 2016 — (Continued)
The amount of (loss) gain recognized in AOCL and the amount of (loss) gain reclassified into earnings forthe year ended December 31, 2018 and 2017, follow:
Amount of (Loss) GainRecognized in AOCL
Amount of (Loss) GainReclassified from AOCL into
Income Location of (Loss) GainReclassified from
AOCL into Income2018 2017 2018 2017
(Dollars in thousands)
Interest rate swaps $ (4,513) $ 1,492 $ (966) $ (527) Interest expense
Cross currency swaps 15,901 — 3,616 — Interest expense
$ 2,650 $ (527) Total Interest expense
Cross currency swaps 14,509 — Foreign currency losses, net
$ 14,509 $ — Total Foreign currency losses, net
The total amounts of expense line items presented in the consolidated statement of operations in which theeffects of cash flow hedges follow:
2018 2017
(Dollars in thousands)
Interest expense $ 33,371 $ 27,754
Foreign currency losses, net 8,187 6,554
Net investment hedge. For derivatives that are designated and qualify as net investment hedges, the gain orloss on the derivative is reported as a component of other comprehensive income or loss. These cross currencyswaps are designated as hedges of our net investment in European operations. Time value is excluded from theassessment of effectiveness and the amount of interest paid or received on the swaps will be recognized as anadjustment to interest expense in earnings over the life of the swaps.
In the second quarter of 2017, the Company designated a portion of its Euro denominated debt as a netinvestment hedge for accounting purposes. The fair value of the net investment hedge is €31.0 million atDecember 31, 2017. This net investment hedge was terminated in the second quarter of 2018.
In the second quarter of 2018, the Company entered into cross currency swap agreements where we payvariable rate interest in Euros and receive variable rate interest in US dollars. The notional amount is€97.2 million at December 31, 2018, with a maturity date of February 14, 2024. These swaps are hedging riskassociated with the net investment in EUR operations due to fluctuating exchange rates and are designated as netinvestment hedges. The changes in the fair value of these designated cross-currency swaps will be recognized inAOCL.
81

FERRO CORPORATION AND SUBSIDIARIES
NOTES TO CONSOLIDATED FINANCIAL STATEMENTSYears ended December 31, 2018, 2017 and 2016 — (Continued)
The amount of gain (loss) on net investment hedges recognized in AOCL, the amount reclassified intoearnings and the amount of gain recognized in income on derivative (amount excluded from effectivenesstesting) for the year ended December 31, 2018 and 2017, follow:
Amount of Gain (Loss)Recognized in AOCL
Amount of GainReclassified from
AOCL into Income
Amount of GainRecognized in Income
on Derivative(Amount Excluded
from Effectiveness Testing) Location of Gain(Loss) in Earnings2018 2017 2018 2017 2018 2017
(Dollars in thousands)
Cross currency swaps $ 7,243 $ — $ — $ — $ 2,261 $ — Interest expense
Net investment hedge — (10,972) — — — — Foreign currencylosses, net
Derivatives Not Designated as Hedging Instruments
Foreign currency forward contracts. We manage foreign currency risks principally by entering into forwardcontracts to mitigate the impact of currency fluctuations on transactions. These forward contracts are notformally designated as hedges. Gains and losses on these foreign currency forward contracts are netted with gainsand losses from currency fluctuations on transactions arising from international trade, primarily intercompanytransactions, and reported as Foreign currency losses, net in the consolidated statements of operations. Weincurred net losses of approximately zero in 2018, net losses of $2.9 million in 2017 and net losses of$2.7 million in 2016, arising from the change in fair value of our financial instruments, which are netted againstthe related net gains and losses on international trade transactions. The fair values of these contracts are based onmarket prices for comparable contracts. The notional amount of foreign currency forward contracts was$387.2 million at December 31, 2018, and $238.5 million at December 31, 2017.
The following table presents the effect on our consolidated statements of operations for the years endedDecember 31, 2018, 2017 and 2016, respectively, of foreign currency forward contracts:
Amount of (Loss) Recognized in Earnings
2018 2017 2016 Location of (Loss) in Earnings
(Dollars in thousands)
Foreign currency forward contracts $ (12) $ (2,938) $ (2,714) Foreign currency losses, net
82

FERRO CORPORATION AND SUBSIDIARIES
NOTES TO CONSOLIDATED FINANCIAL STATEMENTSYears ended December 31, 2018, 2017 and 2016 — (Continued)
Location and Fair Value Amount of Derivative Instruments
The following table presents the fair values of our derivative instruments on our consolidated balance sheetsat December 31. All derivatives are reported on a gross basis.
2018 2017 Balance Sheet Location
(Dollars in thousands)
Asset derivatives:
Interest rate swaps $ — $ 1,616 Other non-current assets
Cross currency swaps 9,606 — Other current assets
Cross currency swaps 7,498 — Other non-current assets
Foreign currency forward contracts 626 661 Other current assets
Liability derivatives:
Interest rate swaps (755) (124) Accrued expenses and other current liabilities
Interest rate swaps (4,489) — Other non-current liabilities
Foreign currency forward contracts $ (896) $(1,130) Accrued expenses and other current liabilities
11. Income Taxes
Income tax expense is based on our earnings from continuing operations before income taxes as presented inthe following table:
2018 2017 2016
(Dollars in thousands)
U.S. $ 2,233 $ 9,857 $ 7,416
Foreign 101,759 100,661 55,029
Total $ 103,992 $ 110,518 $ 62,445
Our income tax expense (benefit) from continuing operations consists of the following components:
2018 2017 2016
(Dollars in thousands)
Current:
U.S. federal $ 483 $ (82) $ 4,616
Foreign 26,156 29,289 24,675
State and local 127 53 28
Total current 26,766 29,260 29,319
Deferred:
U.S. federal 2,405 24,534 379
Foreign (5,603) (1,064) (11,830)
State and local (522) 20 —
Total deferred (3,720) 23,490 (11,451)
Total income tax expense (benefit) $ 23,046 $ 52,750 $ 17,868
83

FERRO CORPORATION AND SUBSIDIARIES
NOTES TO CONSOLIDATED FINANCIAL STATEMENTSYears ended December 31, 2018, 2017 and 2016 — (Continued)
In addition, income tax expense (benefit) that we allocated directly to Ferro Corporation shareholders’equity is detailed in the following table:
2018 2017 2016
(Dollars in thousands)
Interest rate swaps $ (1,529) $ 547 $ —
Postretirement benefit liability adjustments (16) 18 30
Net investment hedge 954 (4,025) —
Stock options exercised — — (2,355)
Total income tax (benefit) expense allocated to Ferro Corporationshareholders’ equity $ (591) $ (3,460) $ (2,325)
A reconciliation of the U.S. federal statutory income tax rate and our effective tax rate follows:
2018 2017 2016
U.S. federal statutory income tax rate 21.0% 35.0% 35.0%
Foreign tax rate difference 7.6 (7.3) (8.8)
Uncertain tax positions, net of tax audit settlements 4.7 5.1 2.2
Non-deductible expenses 2.9 2.4 3.4
Global intangible low-taxed income, net 2.5 — —
Foreign currency 0.6 (0.6) (1.6)
State taxes 0.1 (0.1) (0.7)
Domestic production activities deduction — (0.6) (0.2)
Goodwill dispositions, impairments and amortization (0.3) (1.8) 8.3
Notional interest deduction (0.3) (0.5) (2.8)
Foreign derived intangible income deduction (1.1) — —
Other (3.5) (1.5) 4.8
Tax rate changes (2.1) 19.0 (0.7)
Adjustment of valuation allowances (4.5) (0.3) (7.4)
Other tax credits (5.4) (1.1) (2.9)
Effective tax rate 22.2% 47.7% 28.6%
On December 22, 2017, U.S. federal tax legislation, commonly referred to as the Tax Cut and Jobs Act (the“Tax Act”), was signed into law, significantly changing the U.S. corporate income tax system. These changesinclude a federal statutory rate reduction from 35% to 21% effective January 1, 2018. Changes in tax rates andtax law are accounted for in the period of enactment. Accordingly, the Company’s U.S. net deferred tax assetswere re-measured to reflect the reduction in the federal statutory rate, resulting in a $21.5 million increase inincome tax expense for the year ended December 31, 2017. The Tax Act also changed the U.S. taxation ofworldwide income. The Tax Act contains many provisions which continue to be clarified through newregulations. Consistent with the guidance of SEC Staff Accounting Bulletin No. 118, Income Tax AccountingImplications of the Tax Cuts and Jobs Act (“SAB 118”), we completed our analysis within 2018 and our initialdetermination of no tax due on the one-time mandatory deemed repatriation tax on accumulated foreignsubsidiaries’ previously untaxed foreign earnings and profits was unchanged from our position at December 31,
84

FERRO CORPORATION AND SUBSIDIARIES
NOTES TO CONSOLIDATED FINANCIAL STATEMENTSYears ended December 31, 2018, 2017 and 2016 — (Continued)
2017. The Tax Act also subjects a U.S. shareholder to tax on its global intangible low-taxed income. Inaccordance with FASB Staff Q&A Topic 740, No. 5 “Accounting for Global Intangible Low-Taxed Income,” wehave elected to account for the tax on global intangible low-taxed income as a current period expense.
We have refundable income taxes of $13.5 million at December 31, 2018, and $6.9 million at December 31,2017, classified as Other receivables on our consolidated balance sheets. We also have income taxes payable of$6.0 million at December 31, 2018, and $8.3 million at December 31, 2017, classified as Accrued expenses andother current liabilities on our consolidated balance sheets.
The components of deferred tax assets and liabilities at December 31 were:
2018 2017
(Dollars in thousands)
Deferred tax assets:Foreign operating loss carryforwards $ 42,551 $ 44,804
Pension and other benefit programs 39,174 36,720
Foreign tax credit carryforwards 17,356 20,054
Accrued liabilities 12,515 14,625
Other credit carryforwards 11,446 10,889
Other 8,605 5,823
State and local operating loss carryforwards 2,272 4,808
Inventories 2,732 2,679
Currency differences 2,566 7,376
Allowance for doubtful accounts 1,576 1,822
Total deferred tax assets 140,793 149,600
Deferred tax liabilities:Property, plant and equipment and intangibles — depreciation and
amortization 29,648 38,785
Other 2,763 2,339
Unremitted earnings of foreign subsidiaries 1,575 1,163
Total deferred tax liabilities 33,986 42,287
Net deferred tax assets before valuation allowance 106,807 107,313
Valuation allowance (25,596) (32,579)
Net deferred tax assets $ 81,211 $ 74,734
The amounts of foreign operating loss carryforwards, foreign tax credit carryforwards, and other creditcarryforwards included in the table of temporary differences are net of reserves for unrecognized tax benefits.
At December 31, 2018, we had $38.8 million of state operating loss carryforwards and $183.2 million offoreign operating loss carryforwards, some of which can be carried forward indefinitely and others expire in one
85

FERRO CORPORATION AND SUBSIDIARIES
NOTES TO CONSOLIDATED FINANCIAL STATEMENTSYears ended December 31, 2018, 2017 and 2016 — (Continued)
to twenty years. At December 31, 2018, we had $33.0 million in tax credit carryforwards, some of which can becarried forward indefinitely. These operating loss carryforwards and tax credit carryforwards expire as follows:
Operating LossCarryforwards
Tax CreditCarryforwards
(Dollars in thousands)
Expiring in:
2019 $ 21,072 $ 6,003
2020-2024 33,969 8,140
2025-2029 16,411 9,025
2030-2034 13,112 4,906
2035-2039 5,093 3,953
2040-Indefinitely 132,341 1,004
Total $221,998 $33,031
We assess the available positive and negative evidence to determine if sufficient future taxable income willbe generated to utilize the existing deferred tax assets. A significant piece of objective negative evidenceevaluated by jurisdiction was whether a cumulative loss over the three-year period ended December 31, 2018 hadbeen incurred. Such objective evidence limits the ability to consider other subjective evidence such as ourprojections for future income.
Based on this assessment as of December 31, 2018, the Company has recorded a valuation allowance of$25.6 million in order to measure only the portion of the deferred tax assets that more likely than not will berealized. The most significant items that decreased the valuation allowance from 2017 to 2018 primarily relatedto the removal of a valuation allowance in jurisdictions where it was deemed the valuation allowance was nolonger necessary and the utilization of assets with an off-setting valuation allowance.
We classified net deferred income tax assets as of December 31 as detailed in the following table:
2018 2017
(Dollars in thousands)
Non-current assets $ 103,488 $ 108,025
Non-current liabilities (22,277) (33,291)
Net deferred tax assets $ 81,211 $ 74,734
86

FERRO CORPORATION AND SUBSIDIARIES
NOTES TO CONSOLIDATED FINANCIAL STATEMENTSYears ended December 31, 2018, 2017 and 2016 — (Continued)
Activity and balances of unrecognized tax benefits are summarized below:
2018 2017 2016
(Dollars in thousands)
Balance at beginning of year $ 28,470 $ 30,085 $ 34,541
Additions based on tax positions related to the current year 4,041 1,609 1,445
Additions for tax positions of prior years 24 2,057 170
Reductions for tax positions of prior years (1,710) (288) (2,827)
Reductions as a results of expiring statutes of limitations (420) (6,284) (2,718)
Foreign currency adjustments (786) 1,644 (526)
Settlements with taxing authorities (4,750) (353) —
Balance at end of year $ 24,869 $ 28,470 $ 30,085
The total amount of unrecognized tax benefits that, if recognized, would affect the effective rate was$9.2 million at December 31, 2018, $9.8 million at December 31, 2017, and $11.0 million at December 31, 2016.The Company recognizes accrued interest and penalties related to unrecognized tax benefits as part of income taxexpense. The Company recognized $0.4 million of expense in 2018, $0.7 million of expense in 2017, and$0.1 million of expense in 2016 for interest, net of tax, and related penalties. The Company accrued $1.8 millionat December 31, 2018, $3.8 million at December 31, 2017, and $3.1 million at December 31, 2016 for paymentof interest, net of tax, and penalties.
We anticipate that $1.6 million of liabilities for unrecognized tax benefits, including accrued interest andpenalties, may be reversed within the next 12 months. These liabilities relate to international tax issues and areexpected to reverse due to the expiration of the applicable statute of limitations periods and the anticipation of theclosure of tax examinations.
The Company conducts business globally, and, as a result, the U.S. parent company or one of itssubsidiaries files income tax returns in the U.S. federal jurisdiction and various state and foreign jurisdictions. Inthe normal course of business, the U.S. parent company and its subsidiaries are subject to examination by taxingauthorities. With few exceptions, we are not subject to federal, state, local or non-U.S. income tax examinationsfor years before 2005.
At December 31, 2018, we provided $1.6 million for deferred income taxes on $11.2 million ofundistributed earnings of foreign subsidiaries that are not considered to be indefinitely reinvested. For certainother of the Company’s foreign subsidiaries, undistributed earnings of approximately $175.7 million areconsidered to be indefinitely reinvested, and we have not provided for deferred taxes on such earnings. We havenot disclosed deferred income taxes on undistributed earnings of foreign subsidiaries where they are consideredto be indefinitely reinvested, as it is not practicable to estimate the additional taxes that might be payable on theeventual remittance of such earnings, given the uncertain timing of when any such eventual remittance mayoccur, the significant number of foreign subsidiaries we have, the multiple layers within our legal entitystructure, and the complexities of tax regulations across those foreign subsidiaries.
12. Contingent Liabilities
The Company had bank guarantees and standby letters of credit issued by financial institutions that totaled$6.7 million at December 31, 2018, and $7.7 million at December 31, 2017. These agreements primarily relate to
87

FERRO CORPORATION AND SUBSIDIARIES
NOTES TO CONSOLIDATED FINANCIAL STATEMENTSYears ended December 31, 2018, 2017 and 2016 — (Continued)
Ferro’s insurance programs, foreign energy purchase contracts and foreign tax payments. If the Company fails toperform its obligations, the guarantees and letters of credit may be drawn down by their holders, and we wouldbe liable to the financial institutions for the amounts drawn.
We have recorded environmental liabilities of $8.5 million at December 31, 2018, and $6.7 million atDecember 31, 2017, for costs associated with the remediation of certain of our current or former properties thathave been contaminated. The balance at December 31, 2018, and December 31, 2017, was primarily comprisedof liabilities related to a non-operating facility in Brazil, and for retained environmental obligations related to asite in the United States that was part of the sale of our North American and Asian metal powders product lines in2013. These costs include, but are not limited to, legal and consulting fees, site studies, the design andimplementation of remediation plans, post-remediation monitoring, and related activities. The ultimate liabilitycould be affected by numerous uncertainties, including the extent of contamination found, the required period ofmonitoring, the ultimate cost of required remediation and other circumstances.
In November 2017, Suffolk County Water Authority filed a complaint, Suffolk County Water Authority v.The Dow Chemical Company et al., against the Company and a number of other companies in the U.S. FederalCourt for the Eastern District of New York with regard to the product 1,4 dioxane. The plaintiff alleges, amongother things, that the Suffolk County water supply is contaminated with 1,4 dioxane and that the defendants areliable for unspecified costs of cleanup and remediation of the water supply, among other damages. The Companyhas not manufactured 1,4 dioxane since 2008, denies the allegations related to liability for the plaintiff’s claims,and is vigorously defending this proceeding. In December 2018, additional complaints were filed in the samecourt by 10 other New York municipal water authorities against the Company and others making substantiallysimilar allegations regarding the contamination of their respective water supplies with 1,4 dioxane. The Companyis likewise vigorously defending these additional actions. The Company currently does not expect the outcome ofthese proceedings to have a material adverse impact on its consolidated financial condition, results of operations,or cash flows, net of any insurance coverage. However, it is not possible to predict the ultimate outcome of theseproceedings due to the unpredictable nature of litigation.
In 2013, the Supreme Court in Argentina ruled unfavorably related to certain export taxes associated with adivested operation. As a result of this ruling, we recorded a liability for $8.7 million at December 31, 2016.During 2017, the Company participated in a newly available tax regime, resulting in the reduction of interest onthese outstanding tax liabilities of $4.5 million. The liability recorded at December 31, 2018 and 2017, is$1.3 million and $3.3 million, respectively.
In addition to the proceedings described above, the Company and its consolidated subsidiaries are subjectfrom time to time to various claims, lawsuits, investigations, and proceedings related to products, services,contracts, environmental, health and safety, employment, intellectual property, and other matters, including withrespect to divested businesses. The outcome of such matters is unpredictable, our assessment of them maychange, and resolution of them could have a material adverse effect on the Company’s consolidated financialposition, results of operations, or cash flows. We do not currently expect the resolution of such matters tomaterially affect the consolidated financial position, results of operations, or cash flows of the Company.
88

FERRO CORPORATION AND SUBSIDIARIES
NOTES TO CONSOLIDATED FINANCIAL STATEMENTSYears ended December 31, 2018, 2017 and 2016 — (Continued)
13. Retirement Benefits
Defined Benefit Pension Plans
U.S. Pension Plans Non-U.S. Plans
2018 2017 2016 2018 2017 2016
(Dollars in thousands)
Service cost $ 11 $ 11 $ 16 $ 1,714 $ 1,717 $ 1,372
Interest cost 11,308 14,594 15,552 2,551 2,468 3,319
Expected return on plan assets (15,982) (20,111) (19,735) (862) (896) (1,712)
Amortization of prior service cost — 7 11 39 42 37
Mark-to-market actuarial net losses(gains) 16,633 (5,432) 9,127 3,840 (1,459) 11,180
Curtailment and settlement effectslosses — 2,581 — 372 39 688
Special termination benefits — — — 232 52 330
Net periodic benefit cost (credit) $ 11,970 $ (8,350) $ 4,971 $ 7,886 $ 1,963 $ 15,214
Weighted-average assumptions:Discount rate 3.80% 4.40% 4.70% 2.35% 2.24% 3.12%
Rate of compensation increase N/A N/A N/A 3.18% 3.14% 3.16%
Expected return on plan assets 7.70% 8.20% 8.20% 2.55% 2.54% 3.41%
For the majority of our U.S. defined benefit pension plans, the participants stopped accruing benefit servicecosts after March 31, 2006, except for one plan with a single employee.
In 2018, the mark-to-market actuarial net loss on the U.S. pension plans of $16.6 million was driven by aloss of $31.0 million from expected returns on plan assets being lower than actual returns, partially offset by again of $17.9 million from the change in the discount rate compared with the prior year. The mark-to-marketactuarial net loss of $3.8 million for non-U.S. plans was primarily driven by expected returns on plan assetsbeing lower than actual returns.
In 2017, the mark-to-market actuarial net gain on the U.S. pension plans of $5.4 million was based on$20.8 million of gain from actual returns on plan assets exceeding expected returns on plan assets, partially offsetby a loss on remeasurement of the liability from a lower discount rate compared with the prior year. Themark-to-market actuarial net gain of $1.5 million for non-U.S. plans was primarily driven by remeasurement ofthe respective liabilities at a higher discount rate.
In 2016, the mark-to-market actuarial net loss on the U.S. pension plans of $9.1 million consisted of acharge of $5.7 million to remeasure the liability based on a lower discount rate compared with the prior year, and$3.4 million of loss from expected returns on plan assets exceeding actual returns. The mark-to-market actuarial
89

FERRO CORPORATION AND SUBSIDIARIES
NOTES TO CONSOLIDATED FINANCIAL STATEMENTSYears ended December 31, 2018, 2017 and 2016 — (Continued)
net loss of $11.2 million for non-U.S. plans was primarily driven by remeasurement of the respective liabilities atlower discount rates.
U.S. Pension Plans Non-U.S. Pension Plans
2018 2017 2018 2017
(Dollars in thousands)
Change in benefit obligationBenefit obligation at beginning of year $ 303,170 $ 345,202 $ 117,146 $ 103,490
Service cost 11 11 1,714 1,717
Interest cost 11,308 14,594 2,551 2,468
Settlements (25) (51,124) (1,330) (387)
Special termination benefits — — 232 52
Plan participants’ contributions — — 21 25
Benefits paid (20,165) (23,469) (2,825) (2,826)
Net transfer in — — 518 416
Actuarial (gain) loss (14,414) 17,956 2,241 (1,381)
Exchange rate effect — — (4,994) 13,572
Benefit obligation at end of year $ 279,885 $ 303,170 $ 115,274 $ 117,146
Accumulated benefit obligation at end of year $ 279,885 $ 303,170 $ 105,137 $ 112,732
Change in plan assets:Fair value of plan assets at beginning of year $ 239,260 $ 272,549 $ 38,270 $ 33,683
Actual return on plan assets (15,065) 40,919 (1,109) 933
Employer contributions 420 385 3,185 2,515
Plan participants’ contributions — — 21 25
Benefits paid (20,165) (23,469) (2,825) (2,826)
Effect of settlements (25) (51,124) (1,330) (387)
Exchange rate effect — — (1,682) 4,327
Fair value of plan assets at end of year $ 204,425 $ 239,260 $ 34,530 $ 38,270
Amounts recognized in the balance sheet:Accrued expenses and other current liabilities $ (404) $ (422) $ (4,174) $ (2,354)
Postretirement and pension liabilities (75,056) (63,488) (76,570) (76,522)
Funded status $ (75,460) $ (63,910) $ (80,744) $ (78,876)
90

FERRO CORPORATION AND SUBSIDIARIES
NOTES TO CONSOLIDATED FINANCIAL STATEMENTSYears ended December 31, 2018, 2017 and 2016 — (Continued)
During 2017, the Company settled a portion of its pension obligation in the U.S. for $51.1 million.
U.S. Pension Plans Non-U.S. Pension Plans
2018 2017 2018 2017
(Dollars in thousands)
Weighted-average assumptions as of December 31:Discount rate 4.40% 3.80% 2.61% 2.35%
Rate of compensation increase N/A N/A 3.19% 3.18%
Pension plans with benefit obligations in excess of planassets:
Benefit obligations $ 279,885 $ 303,170 $ 87,955 $ 87,990
Plan assets 204,425 239,260 7,212 9,114
Pension plans with accumulated benefit obligations inexcess of plan assets:
Projected benefit obligations $ 279,885 $ 303,170 $ 85,262 $ 84,206
Accumulated benefit obligations 279,885 303,170 75,343 73,902
Plan assets 204,425 239,260 4,637 5,464
Activity and balances in Accumulated other comprehensive loss related to defined benefit pension plans aresummarized below:
U.S. Pension Plans Non-U.S. Pension Plans
2018 2017 2018 2017
(Dollars in thousands)
Prior service (cost):Balance at beginning of year $ — $ (7) $ (261) $ (265)
Amounts recognized as net periodic benefit costs — 7 39 42
Exchange rate effects — — 16 (38)
Balance at end of year $ — $ — $ (206) $ (261)
Estimated amounts to be amortized in 2019 $ — $ (39)
The overall investment objective for our defined benefit pension plan assets is to achieve the highest level ofinvestment return that is compatible with prudent investment practices, asset class risk and current and futurebenefit obligations of the plans. Based on the potential risks and expected returns of various asset classes, theCompany establishes asset allocation ranges for major asset classes. For U.S. plans, the target allocations are35% fixed income, 60% equity, and 5% other investments. For non-U.S. plans, the target allocations are 75%fixed income, 24% equity, and 1% other investments. The Company invests in funds and with asset managersthat track broad investment indices. The equity funds generally capture the returns of the equity markets in theU.S., Europe, and Asia Pacific and also reflect various investment styles, such as growth, value, and large orsmall capitalization. The fixed income funds generally capture the returns of government and investment-gradecorporate fixed income securities in the U.S. and Europe and also reflect various durations of these securities.
We derive our assumption for expected return on plan assets at the beginning of the year based on theweighted-average expected return for the target asset allocations of the major asset classes held by each plan. Indetermining the expected return, the Company considers both historical performance and an estimate of future
91

FERRO CORPORATION AND SUBSIDIARIES
NOTES TO CONSOLIDATED FINANCIAL STATEMENTSYears ended December 31, 2018, 2017 and 2016 — (Continued)
long-term rates of return. The Company consults with, and considers the opinion of, its actuaries in developingappropriate return assumptions.
The fair values of our pension plan assets at December 31, 2018, by asset category are as follows:
Level 1 Level 2 Level 3 Total
(Dollars in thousands)
U.S. plans:Fixed income:
Guaranteed deposits $ — $ 1,723 $ — $ 1,723
Mutual funds 74,310 — — 74,310
Commingled funds — 502 226 728
Equities:
U.S. common stocks 4,439 — — 4,439
Mutual funds 109,756 — — 109,756
Commingled funds — 695 — 695
Total assets in the fair valuehierarchy $ 188,505 $ 2,920 $ 226 $ 191,651
Investments measured at net asset value — — — 12,774
Investments at fair value $ 188,505 $ 2,920 $ 226 $ 204,425
Non-U.S. plansFixed income:
Cash and cash equivalents $ — $ 89 $ — $ 89
Guaranteed deposits 32 744 27,318 28,094
Mutual funds 1,077 — — 1,077
Other 2,607 2,126 — 4,733
Equities:
Mutual funds 455 — — 455
Other assets 82 — — 82
Total $ 4,253 $ 2,959 $ 27,318 $ 34,530
92

FERRO CORPORATION AND SUBSIDIARIES
NOTES TO CONSOLIDATED FINANCIAL STATEMENTSYears ended December 31, 2018, 2017 and 2016 — (Continued)
The fair values of our pension plan assets at December 31, 2017, by asset category are as follows:
Level 1 Level 2 Level 3 Total
(Dollars in thousands)
U.S. plans:Fixed income:
Cash and cash equivalents $ 3 $ — $ — $ 3
Guaranteed deposits — 1,802 — 1,802
Mutual funds 74,875 — — 74,875
Commingled funds — 667 269 936
Equities:
U.S. common stocks 6,678 — — 6,678
Mutual funds 129,887 — — 129,887
Commingled funds — 999 — 999
Total assets in the fair valuehierarchy $ 211,443 $ 3,468 $ 269 $ 215,180
Investments measured at net asset value — — — 24,080
Investments at fair value $ 211,443 $ 3,468 $ 269 $ 239,260
Non-U.S. plansFixed income:
Guaranteed deposits $ 42 $ 751 $ 30,127 $ 30,920
Mutual funds 1,122 — — 1,122
Other 3,293 2,332 — 5,625
Equities:
Mutual funds 517 — — 517
Other assets 86 — — 86
Total $ 5,060 $ 3,083 $ 30,127 $ 38,270
The Company’s U.S. pension plans held 0.3 million shares of the Company’s common stock with a marketvalue of $4.4 million at December 31, 2018, and 0.3 million shares with a market value of $6.7 million atDecember 31, 2017.
Level 3 assets consist primarily of guaranteed deposits. The guaranteed deposits in Level 3 are in the formof contracts with insurance companies that secure the payment of benefits and are valued based on discountedcash flow models using the same discount rate used to value the related plan liabilities. The investmentsmeasured at net investment value, which is a practical expedient to estimating fair value, seek both currentincome and long term capital appreciation through investing in underlying funds that acquire, manage, anddispose of commercial real estate properties.
A rollforward of Level 3 assets is presented below. Unrealized losses included in earnings were $1.0 millionin 2018 and unrealized gains included in earnings were $2.3 million in 2017. Transfers out of Level 3 during
93

FERRO CORPORATION AND SUBSIDIARIES
NOTES TO CONSOLIDATED FINANCIAL STATEMENTSYears ended December 31, 2018, 2017 and 2016 — (Continued)
2017 represent a correction to remove certain U.S. real estate assets measured at net investment value per shareusing a practical expedient from the fair value hierarchy.
Guaranteeddeposits Real estate
Commingledfunds Total
(Dollars in thousands)
Balance at December 31, 2016 $ 26,332 $ 22,257 $ 371 $ 48,960Sales (465) — — (465)Gains (losses) included in earnings 531 1,823 (102) 2,252Transfers — (24,080) — (24,080)Exchange rate effect 3,729 — — 3,729
Balance at December 31, 2017 $ 30,127 $ — $ 269 $ 30,396
Sales (487) — — (487)(Losses) included in earnings (960) — (43) (1,003)Exchange rate effect (1,362) — — (1,362)
Balance at December 31, 2018 $ 27,318 $ — $ 226 $ 27,544
We expect to contribute approximately $2.8 million to our U.S. pension plans and $4.5 million to ournon-U.S. pension plans in 2019.
We estimate that future pension benefit payments, will be as follows:
U.S. Plans Non-U.S. Plans
(Dollars in thousands)
2019 $ 19,290 $ 7,8252020 19,376 4,2682021 19,577 4,4042022 19,779 5,7102023 19,708 4,3602024-2028 96,668 25,969
Postretirement Health Care and Life Insurance Benefit Plans
2018 2017 2016
(Dollars in thousands)
Net periodic benefit cost:Interest expense $ 732 $ 843 $ 944Mark-to-market actuarial net (gain) loss (2,580) 458 (164)
Total net periodic benefit (credit) cost $ (1,848) $ 1,301 $ 780
Weighted-average assumptions:Discount rate 3.70% 4.20% 4.50%Current trend rate for health care costs 6.40% 6.50% 6.60%Ultimate trend rate for health care costs 4.50% 4.50% 4.50%Year that ultimate trend rate is reached 2036 2036 2036
94

FERRO CORPORATION AND SUBSIDIARIES
NOTES TO CONSOLIDATED FINANCIAL STATEMENTSYears ended December 31, 2018, 2017 and 2016 — (Continued)
A one-percentage-point change in the assumed health care cost trend rates would have the following effect:
1-Percentage-Point Increase
1-Percentage-Point Decrease
(Dollars in thousands)
Effect on total of service and interest costs components $ 44 $ (38)
Effect on postretirement benefit obligation 894 (789)
2018 2017
(Dollars in thousands)
Change in benefit obligation:Benefit obligation at beginning of year $ 20,725 $ 21,056
Interest cost 732 843
Benefits paid (1,679) (1,632)
Actuarial (gain) loss (2,580) 458
Benefit obligation at end of year $ 17,198 $ 20,725
Change in plan assets:Fair value of plan assets at beginning of year $ — $ —
Employer contributions 1,679 1,632
Benefits paid (1,679) (1,632)
Fair value of plan assets at end of year $ — $ —
Amounts recognized in the balance sheet:Accrued expenses and other current liabilities $ (1,966) $ (2,132)
Postretirement and pension liabilities (15,232) (18,593)
Funded status $ (17,198) $ (20,725)
Weighted-average assumptions as of December 31:Discount rate 4.30% 3.70%
Current trend rate for health care costs 6.30% 6.40%
Ultimate trend rate for health care costs 4.50% 4.50%
Year that ultimate rend rate is reached 2036 2036
95

FERRO CORPORATION AND SUBSIDIARIES
NOTES TO CONSOLIDATED FINANCIAL STATEMENTSYears ended December 31, 2018, 2017 and 2016 — (Continued)
The Medicare Prescription Drug, Improvement, and Modernization Act of 2003 provides subsidies forcertain drug costs to companies that provide coverage that is actuarially equivalent to the drug coverage underMedicare Part D. We estimate that future postretirement health care and life insurance benefit payments will beas follows:
Before MedicareSubsidy
After MedicareSubsidy
(Dollars in thousands)
2019 $ 1,968 $ 1,758
2020 1,881 1,681
2021 1,796 1,608
2022 1,704 1,528
2023 1,615 1,450
2024-2028 6,689 6,038
Other Retirement Plans
We also have defined contribution retirement plans covering certain employees. Our contributions aredetermined by the terms of the plans and are limited to amounts that are deductible for income taxes. Generally,benefits under these plans vest over a period of five years from date of employment. The largest plan coverssalaried and most hourly employees in the U.S. In this plan, the Company contributes a percentage of eligibleemployee basic compensation and also a percentage of employee contributions. The expense applicable to theseplans was $2.9 million, $5.7 million, and $4.2 million in 2018, 2017, and 2016, respectively.
14. Stock-based Compensation
On May 3, 2018, our shareholders approved the 2018 Omnibus Incentive Plan (the “Plan”), which wasadopted by the Board of Directors on February 22, 2018, subject to shareholder approval. The Plan’s purpose isto promote the Company’s long-term financial interests and growth by attracting, retaining and motivating high-quality key employees and directors, motivating such employees and directors to achieve the Company’s short-and long-range performance goals and objectives, and thereby align their interests with those of the Company’sshareholders. The Plan reserves 4,500,000 shares of common stock to be issued for grants of several differenttypes of long-term incentives including stock options, stock appreciation rights, restricted awards, performanceawards, other common stock-based awards, and dividend equivalent rights.
The 2013 Omnibus Incentive Plan (the “Previous Plan”), was replaced by the Plan, and no future grants maybe made under the Previous Plan. However, any outstanding awards or grants made under the Previous Plan willcontinue until the end of their specified terms.
Stock options, performance share units, deferred stock units, and restricted stock units were the only granttypes outstanding at December 31, 2018. Stock options, performance share units, and restricted stock units arediscussed below. Activities in other grant types were not significant.
Stock Options
General Information
Stock options outstanding at December 31, 2018, have a term of 10 years, vest evenly over three years onthe anniversary of the grant date, and have an exercise price equal to the per share fair market value of our
96

FERRO CORPORATION AND SUBSIDIARIES
NOTES TO CONSOLIDATED FINANCIAL STATEMENTSYears ended December 31, 2018, 2017 and 2016 — (Continued)
common stock on the grant date. Accelerated vesting is used for options held by employees who meet both theage and years of service requirements to retire prior to the end of the vesting period. In the case of death orretirement, the stock options become 100% vested and exercisable.
Stock Option Valuation Model and Method Information
We estimate the fair value of each stock option on the date of grant using the Black-Scholes option pricingmodel. We use judgment in selecting assumptions for the model, which may significantly impact the timing andamount of compensation expense, and we base our judgments primarily on historical data. When appropriate, weadjust the historical data for circumstances that are not likely to occur in the future.
The following table details the determination of the assumptions used to estimate the fair value of stockoptions:
Assumption Estimation Method
Expected life, in years Historical stock option exercise experience
Risk-free interest rate Yield of U.S. Treasury Bonds with remaining maturity equal to expected life of thestock option
Expected volatility Historical daily price observations of the Company’s common stock over a periodequal to the expected life of the stock option
Expected dividend yield Historical dividend rate at the date of grant
The following table details the weighted-average grant-date fair values and the assumptions used forestimating the fair values of stock options granted in the respective years:
2018 2017 2016
Weighted-average grant-date fair value $8.91 $ 7.29 $ 4.94
Expected life, in years 5.4 6.0 6.0
Risk-free interest rate 2.7% 1.9%–2.3% 1.4%–1.6%
Expected volatility 39.7% 48.0%–51.5% 52.0%–53.6%
Expected dividend yield —% —% —%
97

FERRO CORPORATION AND SUBSIDIARIES
NOTES TO CONSOLIDATED FINANCIAL STATEMENTSYears ended December 31, 2018, 2017 and 2016 — (Continued)
Stock Option Activity Information
A summary of stock option activity follows:
Number ofOptions
Weighted-Average
Exercise Price
Weighted-Average
RemainingContractual
Term
AggregateIntrinsic
Value
Outstanding at December 31, 2017 1,567,269 10.08
Granted 150,300 22.01
Exercised (102,880) 7.43
Forfeited or expired (1,000) 17.26
Outstanding at December 31, 2018 1,613,689 $11.36 5.50 $7,929
Exercisable at December 31, 2018 1,230,261 $ 9.87 4.64 $7,157
Vested or expected to vest at December 31, 2018 1,613,689 $11.36 5.50 $7,929
We calculated the aggregate intrinsic value in the table above by taking the total pretax difference betweenour common stock’s closing market value per share on the last trading day of the year and the stock optionexercise price for each grant and multiplying that result by the number of shares that would have been receivedby the option holders had they exercised all their in-the-money stock options.
Information related to stock options exercised follows:
2018 2017 2016
(Dollars in thousands)
Proceeds from the exercise of stock options $ 764 $ 4,526 $ 1,140
Intrinsic value of stock options exercised 1,612 2,898 1,496
Income tax benefit related to stock options exercised 338 1,014 524
Stock Options Expense Information
A summary of amounts recorded and to be recorded for stock-based compensation related to stock optionsfollows:
2018 2017 2016
(Dollars in thousands)
Compensation expense recorded in Selling, general and administrativeexpenses $ 1,560 $ 1,588 $ 1,388
Deferred income tax benefits related to compensation expense 328 333 486
Total fair value of stock options vested 1,418 1,388 1,757
Unrecognized compensation cost 644 621 513
Expected weighted-average recognition period for unrecognizedcompensation, in years 2.7 2.0 2.1
98

FERRO CORPORATION AND SUBSIDIARIES
NOTES TO CONSOLIDATED FINANCIAL STATEMENTSYears ended December 31, 2018, 2017 and 2016 — (Continued)
Performance Share Units
General Information
Performance share units, expressed as shares of the Company’s common stock, are earned only if theCompany meets specific performance targets over a three-year period. The grants have a vesting period of threeyears.
The Plan allows for payout of up to 200% of the vesting-date fair value of the awards. We pay half of theearned value in cash and half in unrestricted shares of common stock. The portion of the grants that will be paidin cash are treated as liability awards, and therefore, we remeasure our liability and the related compensationexpense at each balance sheet date, based on fair value. We treat the portion of the grants that will be settled withcommon stock as equity awards, and therefore, the amount of stock-based compensation we record over theperformance period is based on the fair value on the grant date. The compensation expense and number of sharesexpected to vest for all performance share units are adjusted each reporting period for the achievement of theperformance share units’ performance metrics, based upon our best estimate using available information.
Performance Share Unit Valuation Model and Method Information
The estimated fair value of performance share units granted in 2018, 2017 and 2016 is based on the closingprice of the Company’s common stock on the date of issuance and recorded based on achievement of targetperformance metrics. As of December 31, 2018, we had 0.1 million and 0.2 million performance share unitsoutstanding associated with our 2018 and 2017 grants, respectively.
The weighted average grant date fair value of our performance share units was $22.92 for shares granted in2018, $14.89 for shares granted in 2017 and $10.07 for shares granted in 2016. All performance share units areinitially expensed at target and are evaluated each reporting period for likelihood of achieving the performancemetrics, and the expense is adjusted, as appropriate.
Performance Share Unit Activity Information
A summary of performance share unit activity follows:
Numberof Units
Weighted-Average
RemainingContractual
Term
Outstanding at December 31, 2017 621,490
Granted 244,062
Earned (321,382)
Forfeited or expired (5,970)
Outstanding at December 31, 2018 538,200 0.7
Vested or expected to vest at December 31, 2018 538,200 0.7
99

FERRO CORPORATION AND SUBSIDIARIES
NOTES TO CONSOLIDATED FINANCIAL STATEMENTSYears ended December 31, 2018, 2017 and 2016 — (Continued)
Performance Share Unit Expense Information
A summary of amounts recorded and to be recorded for stock-based compensation related to performanceshare units follows:
2018 2017 2016
(Dollars in thousands)
Compensation expense recorded in Selling, general andadministrative expenses $4,156 $6,881 $3,437
Deferred income tax benefits related to compensationexpense 873 1,445 1,203
Unrecognized compensation cost 3,670 3,801 3,733
Expected weighted-average recognition period forunrecognized compensation, in years 1.4 1.4 2.0
Restricted Stock Units
We granted 0.1 million, 0.2 million and 0.3 million restricted stock units in 2018, 2017, and 2016,respectively. Fair value of restricted stock units is determined based on the closing price of the Company’scommon stock on the date of issuance. Restricted stock units are expressed as equivalent shares of theCompany’s common stock, and have a three year vesting period. Total expense included in Selling, general andadministrative expense related to restricted stock units granted in 2018, 2017 and 2016 was $2.1 million,$2.5 million and $1.7 million, respectively. Total unrecognized compensation cost in 2018, 2017 and 2016 was$3.0 million, $2.8 million and $2.4 million, respectively.
Directors’ Deferred Compensation
Separate from the Plan, the Company has established the Ferro Corporation Deferred Compensation Plan forNon-employee Directors, permitting its non-employee directors to voluntarily defer all or a portion of theircompensation. The voluntarily deferred amounts are placed in individual accounts in a benefit trust known as a“rabbi trust” and invested in the Company’s common stock with dividends reinvested in additional shares. Alldisbursements from the trust are made in the Company’s common stock. The stock held in the rabbi trust isclassified as treasury stock in shareholders’ equity and the deferred compensation obligation that is required to besettled in shares of the Company’s common stock, is classified as paid-in capital. The rabbi trust held 0.1 millionshares, valued at $1.2 million, at December 31, 2018, and 0.1 million shares, valued at $1.6 million, atDecember 31, 2017.
15. Restructuring and Cost Reduction Programs
Our restructuring and cost reduction programs have been developed with the objective of leveraging ourglobal scale, realigning and lowering our cost structure and optimizing capacity utilization. Total restructuringcharges resulting from these activities were $13.3 million in 2018, $9.8 million in 2017, and $2.7 million in2016, which are reported in Restructuring and impairment charges in our consolidated statement of operations.Descriptions of the restructuring program follow:
Global Cost Reduction Program
In 2013, we initiated a Global Cost Reduction Program that was designed to address 3 key areas of thecompany: (1) business realignment, (2) operational efficiency and (3) corporate and back office functions.Business realignment was targeted at right-sizing our commercial management organizations globally. The
100

FERRO CORPORATION AND SUBSIDIARIES
NOTES TO CONSOLIDATED FINANCIAL STATEMENTSYears ended December 31, 2018, 2017 and 2016 — (Continued)
operational efficiency component of the program was designed to improve the efficiency of our plant operationsand supply chain. The corporate and back office initiative is principally comprised of work that we are doingwith our strategic partners in the areas of finance and accounting and information technology outsourcing. In2018, the restructuring charges primarily relate to costs associated with integration of our recent acquisitions andoptimization programs.
We have summarized the charges associated with this restructuring program by major type of chargesbelow:
EmployeeSeverance
OtherCosts
AssetImpairment Total
(Dollars in thousands)
Expected restructuring charges:Global Cost Reduction Program $53,861 36,935 1,176 $91,972
Total expected restructuring charges $53,861 $36,935 $1,176 $91,972
Restructuring charges incurred:Global Cost Reduction Program $ 1,353 1,356 — $ 2,709
Charges incurred in 2016 $ 1,353 $ 1,356 $ — $ 2,709
Global Cost Reduction Program 5,167 3,500 1,176 9,843
Charges incurred in 2017 $ 5,167 $ 3,500 $1,176 $ 9,843
Global Cost Reduction Program 5,794 7,501 — 13,295
Charges incurred in 2018 $ 5,794 $ 7,501 $ — $13,295
Cumulative restructuring charges incurred:Global Cost Reduction Program 40,818 33,480 1,176 75,474
Cumulative restructuring charges incurred as of December 31,2018 $40,818 $33,480 $1,176 $75,474
We have summarized the charges associated with the restructuring programs by segments below:
TotalExpectedCharges 2018 2017 2016
CumulativeCharges To
Date
(Dollars in thousands)
Performance Coatings $15,343 $ 274 $2,948 $ 192 $ 7,326
Performance Colors and Glass 25,546 23 971 205 20,055
Color Solutions 7,327 148 1,250 630 4,337
Segment Total 48,216 445 5,169 1,027 31,718
Corporate Restructuring Charges 43,756 12,850 4,674 1,682 43,756
Total Restructuring Charges $91,972 $13,295 $9,843 $2,709 $75,474
101

FERRO CORPORATION AND SUBSIDIARIES
NOTES TO CONSOLIDATED FINANCIAL STATEMENTSYears ended December 31, 2018, 2017 and 2016 — (Continued)
We have summarized the activities and accruals related to our restructuring and cost reduction programsbelow:
EmployeeSeverance
OtherCosts
AssetImpairment Total
(Dollars in thousands)
Balance at December 31, 2015 $ 693 $ 2,077 $ — $ 2,770
Restructuring charges 1,353 $ 1,356 $ — 2,709
Cash payments (1,634) (1,089) — (2,723)
Non-cash items (173) (855) — (1,028)
Balance at December 31, 2016 $ 239 $ 1,489 $ — $ 1,728
Restructuring charges $ 5,167 $ 3,500 $ 1,176 $ 9,843
Cash payments (3,316) (500) — (3,816)
Non-cash items 196 (3,255) (1,176) (4,235)
Balance at December 31, 2017 $ 2,286 $ 1,234 $ — $ 3,520
Restructuring charges $ 5,794 7,501 — $13,295
Cash payments (6,749) (2,462) — (9,211)
Non-cash items (180) (4,985) — (5,165)
Balance at December 31, 2018 $ 1,151 $ 1,288 $ — $ 2,439
We expect to make cash payments to settle the remaining liability for employee severance benefits and othercosts over the next twelve months, except where legal or contractual obligations would require it to extendbeyond that period.
16. Leases
Rent expense for all operating leases was $15.0 million in 2018, $12.2 million in 2017, and $9.8 million in2016.
102

FERRO CORPORATION AND SUBSIDIARIES
NOTES TO CONSOLIDATED FINANCIAL STATEMENTSYears ended December 31, 2018, 2017 and 2016 — (Continued)
The Company has a number of capital lease arrangements primarily relating to buildings and equipment.Assets held under capital leases are included in property, plant and equipment, and at December 31 are asfollows:
2018 2017
(Dollars in thousands)
Gross amounts capitalized
Buildings $ 4,705 $ 4,781
Equipment 3,516 3,710
8,221 8,491
Accumulated amortization
Buildings (3,238) (3,190)
Equipment (2,798) (2,420)
(6,036) (5,610)
Net assets under capital leases $ 2,185 $ 2,881
At December 31, 2018, future minimum lease payments under all non-cancelable leases are as follows:
Capital Leases Operating Leases
(Dollars in thousands)
2019 $1,048 $11,419
2020 755 7,314
2021 477 5,302
2022 1,287 3,301
2023 279 1,971
Thereafter 992 2,401
Net minimum lease payments $4,838 $31,708
Less amount representing imputed interest and executory costs 875
Present value of net minimum lease payments 3,963
Less current portion 679
Long-term obligations at December 31, 2018 $3,284
103

FERRO CORPORATION AND SUBSIDIARIES
NOTES TO CONSOLIDATED FINANCIAL STATEMENTSYears ended December 31, 2018, 2017 and 2016 — (Continued)
17. Miscellaneous Expense (Income), Net
Components of Miscellaneous expense (income), net follow:
2018 2017 2016
(Dollars in thousands)
Pension expense (income) $16,281 $ (6,814) $19,577
Argentina export tax matter 507 (3,549) 1,128
Gain on change of control (2,586) (2,561) —
Modification of debt 1,046 — —
Dividends/royalty from affiliates, net (720) (993) (1,245)
Equity method investment (income) loss (55) 261 (260)
(Gain) loss on sale of assets (440) 722 (3,891)
Contingent consideration (adjustment) payment (1,971) 1,721 —
Bank fees 2,648 2,229 1,855
Other, net 1,260 548 (247)
Total Miscellaneous expense (income), net $15,970 $(8,436) $16,917
In 2018, we adopted ASU 2017-07, which requires all other components of net benefit costs (credit) besidesservice cost to be presented outside a subtotal of income from operations. As such, we recorded pension expenseof $16.3 million in 2018, income of $6.8 million in 2017 and expense of $19.6 million in 2016 related to thesecosts.
In 2018, the Company acquired 66% of the equity interests of FMU (Note 5), bringing our total ownershipto 100%. Due to the change of control that occurred, the Company recorded a gain on purchase of $2.6 million,related to the difference between the Company’s carrying value and fair value of the previously held equitymethod investment.
In 2017, the Company acquired a majority equity interest in Gardenia (Note 5), and due to the change ofcontrol that occurred, the Company recorded a gain on purchase of $2.6 million related to the difference betweenthe Company’s carrying value and fair value of the previously held equity method investment.
In 2013, the Supreme Court in Argentina ruled unfavorably related to certain export taxes associated with adivested operation. In 2017, the Company participated in a newly available tax regime, resulting in the reductionof these outstanding tax labilities, and as a result recorded a gain of $4.5 million for the year ended December 31,2017. We recorded a $0.5 million charge in 2018, $0.9 million charge in 2017 and $1.1 million charge in 2016related to interest on the liabilities.
In 2016, we recorded a $3.9 million gain on sale from the proceeds of a closed site in Australia which wasrecorded for the year ended December 31, 2016.
104

FERRO CORPORATION AND SUBSIDIARIES
NOTES TO CONSOLIDATED FINANCIAL STATEMENTSYears ended December 31, 2018, 2017 and 2016 — (Continued)
18. Earnings per Share
Details of the calculations of basic and diluted earnings per share follow:
2018 2017 2016
(Dollars in thousands, except per share amounts)
Basic earnings (loss) per share computation:Net income (loss) attributable to Ferro Corporation
common shareholders $ 80,093 $ 57,054 $ (20,817)
Adjustment for loss from discontinued operations — — 64,464
Total $ 80,093 $ 57,054 $ 43,647
Weighted-average common shares outstanding 83,940 83,713 83,298
Basic earnings per share from continuing operationsattributable to Ferro Corporation commonshareholders $ 0.95 $ 0.68 $ 0.52
Diluted earnings (loss) per share computation:Net income (loss) attributable to Ferro Corporation
common shareholders $ 80,093 $ 57,054 $ (20,817)
Adjustment for loss from discontinued operations — — 64,464
Total $ 80,093 $ 57,054 $ 43,647
Weighted-average common shares outstanding 83,940 83,713 83,298
Assumed exercise of stock options 772 762 549
Assumed satisfaction of deferred stock unitconditions — — 36
Assumed satisfaction of restricted stock unitconditions 301 351 544
Assumed satisfaction of performance stock unitconditions 72 330 483
Weighted-average diluted shares outstanding 85,085 85,156 84,910
Diluted earnings per share from continuingoperations attributable to Ferro Corporationcommon shareholders $ 0.94 $ 0.67 $ 0.51
The number of anti-dilutive or unearned shares was 1.7 million, 1.6 million, and 1.7 million for 2018, 2017,and 2016, respectively. These shares were excluded from the calculation of diluted earnings per share due to theiranti-dilutive impact.
19. Share Repurchase Program
In October 2018, the Company’s Board of Directors approved a new share repurchase program under whichthe Company is authorized to repurchase up to an additional $50 million of the Company’s outstanding commonstock on the open market, including through Rule 10b5-1 plans, in privately negotiated transactions, or otherwise.This new program is in addition to the $100 million of authorization previously approved and announced.
105

FERRO CORPORATION AND SUBSIDIARIES
NOTES TO CONSOLIDATED FINANCIAL STATEMENTSYears ended December 31, 2018, 2017 and 2016 — (Continued)
The timing and amount of shares to be repurchased will be determined by the Company, based onevaluation of market and business conditions, share price, and other factors. The share repurchase programs donot obligate the Company to repurchase any dollar amount or number of common shares, and may be suspendedor discontinued at any time.
The Company repurchased 1,470,791 shares of common stock at an average price of $19.59 per share for atotal cost of $28.8 million during 2018. The Company made no repurchases during 2017. The Companyrepurchased 1,175,437 shares of common stock at an average price of $9.72 per share for a total cost of$11.4 million during 2016. As of December 31, 2018, $71.2 million of common stock could still be repurchasedunder the programs.
106

FERRO CORPORATION AND SUBSIDIARIES
NOTES TO CONSOLIDATED FINANCIAL STATEMENTSYears ended December 31, 2018, 2017 and 2016 — (Continued)
20. Accumulated Other Comprehensive (Loss)
Changes in Accumulated other comprehensive (loss) by component, net of income tax, were as follows:
PostretirementBenefit
LiabilityAdjustments
TranslationAdjustments
Net Gain onCash Flow
Hedges Total
(Dollars in thousands)
Balance at December 31, 2015 $ 811 $ (62,129) $ — $ (61,318)
Other comprehensive (loss) beforereclassifications, before tax — (46,770) — (46,770)
Reclassification to earnings:Postretirement benefit liabilities gain, before tax 360 — — 360
Foreign currency translation adjustment, beforetax(1) — 1,115 — 1,115
Current period other comprehensive income (loss),before tax 360 (45,655) — (45,295)
Tax effect 30 — — 30
Current period other comprehensive income (loss),net of tax 330 (45,655) — (45,325)
Balance at December 31, 2016 1,141 (107,784) — (106,643)
Other comprehensive income beforereclassifications, before tax — 26,181 2,019 28,200
Reclassification to earnings:Cash flow hedge (loss), before tax — — (527) (527)Postretirement benefit liabilities gain, before tax 42 — — 42
Current period other comprehensive income, before tax 42 26,181 1,492 27,715Tax effect 18 (4,025) 547 (3,460)
Current period other comprehensive income, net oftax 24 30,206 945 31,175
Balance at December 31, 2017 1,165 (77,578) 945 (75,468)
Other comprehensive (loss) income beforereclassifications, before tax — (24,658) 11,388 (13,270)
Reclassification to earnings:Cash flow hedge loss, before tax — — (17,159) (17,159)Postretirement benefit liabilities (loss), before tax (55) — — (55)
Current period other comprehensive (loss), beforetax (55) (24,658) (5,771) (30,484)
Tax effect (16) 954 (1,529) (591)
Current period other comprehensive (loss), net of tax (39) (25,612) (4,242) (29,893)
Balance at December 31, 2018 $ 1,126 $ (103,190) $ (3,297) $ (105,361)
107

FERRO CORPORATION AND SUBSIDIARIES
NOTES TO CONSOLIDATED FINANCIAL STATEMENTSYears ended December 31, 2018, 2017 and 2016 — (Continued)
(1) Includes a release of accumulated foreign currency translation of $1.1 million related to the Company’s saleof the Europe-based Polymer Additives business (Note 4), which is included in Loss from discontinuedoperations, net of income taxes in our consolidated statements of operations for the year endedDecember 31, 2016.
21. Reporting for Segments
The Company’s reportable segments are Performance Coatings, Performance Colors and Glass, and ColorSolutions.
Net sales to external customers by segment are presented in the table below. Sales between segments werenot material.
2018 2017 2016
(Dollars in thousands)
Performance Coatings $ 733,926 $ 594,029 $ 526,981
Performance Colors and Glass 487,455 444,653 371,464
Color Solutions 391,027 358,060 246,847
Total net sales $ 1,612,408 $ 1,396,742 $ 1,145,292
Segment gross profit is the metric utilized by management to evaluate segment performance. We measuresegment gross profit for internal reporting purposes by excluding certain other cost of sales not directlyattributable to business units. Assets by segment are not regularly reviewed by the chief operating decisionmaker. Each segment’s gross profit and reconciliations to Income before income taxes are presented in the tablebelow:
2018 2017 2016
(Dollars in thousands)
Performance Coatings $ 165,708 $ 145,797 $ 139,454
Performance Colors and Glass 167,446 157,544 133,997
Color Solutions 124,852 113,694 84,466
Other cost of sales (2,073) (814) (1,539)
Total gross profit 455,933 416,221 356,378
Selling, general and administrative expenses 278,566 265,418 227,286
Restructuring and impairment charges 13,295 11,409 15,907
Other expense, net 60,080 28,876 50,740
Income before income taxes $ 103,992 $ 110,518 $ 62,445
108

FERRO CORPORATION AND SUBSIDIARIES
NOTES TO CONSOLIDATED FINANCIAL STATEMENTSYears ended December 31, 2018, 2017 and 2016 — (Continued)
Each segment’s capital expenditures for long-lived assets are detailed below:
2018 2017 2016
(Dollars in thousands)
Performance Coatings $41,106 $19,734 $ 9,139
Performance Colors and Glass 8,858 9,374 7,123
Color Solutions 24,940 20,356 4,867
Total segment expenditures for long-lived assets 74,904 49,464 21,129
Unallocated corporate expenditures for long-lived assets 5,715 1,088 2,896
Total expenditures for long lived assets (1) $80,619 $50,552 $24,025
(1) Excludes capital expenditures of discontinued operations of $0.9 million in 2016.
We sell our products throughout the world and we attribute sales to countries based on the country where wegenerate the customer invoice. No single country other than the U.S. and Spain represent greater than 10% of ournet sales. Net sales by geography are as follows:
2018 2017 2016
(Dollars in thousands)
United States $ 379,914 $ 356,482 $ 300,187
Spain 305,049 214,732 188,972
Other international 927,445 825,528 656,133
Total net sales $1,612,408 $1,396,742 $1,145,292
None of our operations in countries other than Spain, U.S. and Mexico owns greater than 10% ofconsolidated long-lived assets. Long-lived assets that consist of property, plant, and equipment by geography atDecember 31 are as follows:
2018 2017
(Dollars in thousands)
Spain $ 78,094 $ 76,142
United States 56,263 44,956
Mexico 39,019 16,989
Other international 207,965 183,655
Total long-lived assets $381,341 $321,742
22. Unconsolidated Affiliates Accounted For Under the Equity Method
Our investments have been accounted for under the equity method because we exert significant influenceover these affiliates, but we do not control them. Investment income from these equity method investments,which is reported in Miscellaneous expense (income), net was income of $0.1 million in 2018, loss of$0.3 million in 2017, and income of $0.3 million in 2016. The balance of our equity method investments, whichis reported in Other non-current assets, was $8.2 million at December 31, 2018, and $7.6 million at December 31,2017.
109

FERRO CORPORATION AND SUBSIDIARIES
NOTES TO CONSOLIDATED FINANCIAL STATEMENTSYears ended December 31, 2018, 2017 and 2016 — (Continued)
The income (loss) that we record for these investments is equal to our proportionate share of the affiliates’income or loss and our investments are equal to our proportionate share of the affiliates’ shareholders’ equitybased on our ownership percentage. We have summarized below condensed income statement and balance sheetinformation for the combined equity method investees:
2018 2017 2016
(Dollars in thousands)
Net sales $18,950 $33,851 $42,555
Gross profit 3,343 5,655 4,842
Income (loss) from continuing operations 746 (224) 694
Net income (loss) 596 (220) 236
2018 2017
(Dollars in thousands)
Current assets $ 17,305 $ 19,908
Non-current assets 3,356 10,834
Current liabilities (3,832) (13,207)
Non-current liabilities (339) (467)
We had the following transactions with our equity-method investees:
2018 2017 2016
(Dollars in thousands)
Sales $ 4,898 $ 5,378 $ 4,589
Purchases 15 2,006 758
Dividends and interest received 415 920 268
Commission and royalties received 305 130 1,003
Commissions and royalties paid — 57 26
110

FERRO CORPORATION AND SUBSIDIARIES
NOTES TO CONSOLIDATED FINANCIAL STATEMENTSYears ended December 31, 2018, 2017 and 2016 — (Continued)
23. Quarterly Data (Unaudited)
Net Sales Gross Profit
NetIncome(Loss)
Net Income(Loss)
Attributableto Ferro
Corporation
Earnings (Loss) Attributable toFerro Corporation Common
Shareholders Per Common Share
Basic Diluted
(Dollars in thousands, except per share data)
2017Quarter 1 $ 320,555 $ 98,794 $ 22,121 $ 21,898 $ 0.26 $ 0.26
Quarter 2 348,632 108,342 21,229 21,025 0.25 0.25
Quarter 3 350,012 103,616 22,965 22,817 0.27 0.27
Quarter 4 377,543 105,469 (8,547) (8,686) (0.10) (0.10)
Total $ 1,396,742 $ 416,221 $ 57,768 $ 57,054 $ 0.68 $ 0.67
2018Quarter 1 $ 405,532 $ 118,686 $ 23,598 $ 23,391 $ 0.28 $ 0.27
Quarter 2 416,239 126,645 29,861 29,668 0.35 0.35
Quarter 3 395,163 105,487 16,143 16,058 0.19 0.19
Quarter 4 395,474 105,115 11,344 10,976 0.13 0.13
Total $ 1,612,408 $ 455,933 $ 80,946 $ 80,093 $ 0.95 $ 0.94
Quarterly earnings per share amounts do not always add to the full-year amounts due to the averaging ofshares.
Restructuring and impairment charges in 2018 were $4.1 million in the first quarter, $3.8 million in thesecond quarter, $2.6 million in the third quarter, and $2.9 million in the fourth quarter. Restructuring andimpairment charges in 2017 were $3.0 million in the first quarter, $3.2 million in the second quarter, $1.5 millionin the third quarter, and $3.7 million in the fourth quarter. Mark-to-market net losses on our postretirementbenefit plans was $17.9 million in the fourth quarter of 2018 and net gains of $6.4 million in the fourth quarter of2017.
111

Item 9 — Changes in and Disagreements with Accountants on Accounting and Financial Disclosure
None.
Item 9A — Controls and Procedures
Evaluation of Disclosure Controls and Procedures
Ferro is committed to maintaining disclosure controls and procedures that are designed to ensure thatinformation required to be disclosed in its Exchange Act reports is recorded, processed, summarized, andreported within the time periods specified in the U.S. Securities and Exchange Commission’s rules and forms,and that such information is accumulated and communicated to its management, including its Chief ExecutiveOfficer and Chief Financial Officer, as appropriate to allow timely decisions regarding required disclosure.
The Company’s management, under the supervision and with the participation of the Chief ExecutiveOfficer and the Chief Financial Officer, evaluated the effectiveness of the design and operation of the Company’sdisclosure controls and procedures, as defined in Exchange Act Rule 13a-15(e), as of December 31, 2018. TheCompany’s disclosure controls and procedures include components of the Company’s internal control overfinancial reporting. Based on that evaluation, management concluded that the disclosure controls and procedureswere effective as of December 31, 2018.
Changes in Internal Control over Financial Reporting and Other Remediation
During the fourth quarter of 2018, there were no changes in our internal controls or in other factors thatmaterially affected, or are reasonably likely to materially affect, our internal controls over financial reporting.
Management’s Annual Report on Internal Control over Financial Reporting
The Company’s management is responsible for establishing and maintaining adequate internal control overfinancial reporting as defined in Exchange Act Rule 13a-15(f). The Company’s internal control system is aprocess designed by, or under the supervision of, the Company’s principal executive and principal financialofficers, or persons performing similar functions, and effected by the Company’s board of directors, managementand other personnel, to provide reasonable assurance regarding the reliability of financial reporting and thepreparation of financial statements for external purposes in accordance with U.S. generally accepted accountingprinciples (“U.S. GAAP”).
The Company’s internal control over financial reporting includes policies and procedures that pertain to themaintenance of records that, in reasonable detail, accurately and fairly reflect transactions and dispositions ofassets; provide reasonable assurance that transactions are recorded as necessary to permit preparation of financialstatements in accordance with U.S. GAAP, and that receipts and expenditures are being made only in accordancewith the authorization of its management and directors; and provide reasonable assurance regarding prevention ortimely detection of unauthorized acquisition, use or disposition of the Company’s assets that could have amaterial effect on its consolidated financial statements.
Because of its inherent limitations, internal control over financial reporting may not prevent or detectmisstatements. Also, projections of any evaluation of effectiveness to future periods are subject to risk thatcontrols may become inadequate because of changes in conditions, or that the degree of compliance with thepolicies or procedures may deteriorate. Entities that management has excluded from its assessment of theCompany’s internal control over financial reporting are Quimicer S.A. (“Quimicer”), which was acquired onOctober 1, 2018, UWiZ Technology Co., Ltd. (“UWiZ”), which was acquired on September 25, 2018, ErnstDiegel GmbH (“Diegel”), which was acquired on August 31, 2018, MRA Laboratories, Inc. (“MRA”), whichwas acquired on July 12, 2018, and PT Ferro Materials Utama (“FMU”), which was acquired on June 29, 2018,whose financial statements constitute in the aggregate 5.8% of the Company’s total assets, 1.1% of total netsales, and (1.4%) of total net income of the consolidated financial statement amounts as of and for the year endedDecember 31, 2018.
112

Management assessed the effectiveness of the Company’s internal control over financial reporting as ofDecember 31, 2018. In making this assessment, the Company used the control criteria framework of theCommittee of Sponsoring Organizations of the Treadway Commission published in its report entitled InternalControl - Integrated Framework (2013). Management concluded that the Company’s internal control overfinancial reporting was effective as of December 31, 2018.
Deloitte & Touche LLP, the independent registered public accounting firm that audited the Company’sconsolidated financial statements, has issued an attestation report on the Company’s internal control overfinancial reporting as of December 31, 2018, which is included below.
113

REPORT OF INDEPENDENT REGISTERED PUBLIC ACCOUNTING FIRM
To the Board of Directors and Shareholders of Ferro Corporation
Opinion on Internal Control over Financial Reporting
We have audited the internal control over financial reporting of Ferro Corporation and subsidiaries (the“Company”) as of December 31, 2018, based on criteria established in Internal Control — Integrated Framework(2013) issued by the Committee of Sponsoring Organizations of the Treadway Commission (COSO). In ouropinion, the Company maintained, in all material respects, effective internal control over financial reporting as ofDecember 31, 2018, based on criteria established in Internal Control — Integrated Framework (2013) issued byCOSO.
We have also audited, in accordance with the standards of the Public Company Accounting Oversight Board(United States) (PCAOB), the consolidated financial statements and financial statement schedule as of and forthe year ended December 31, 2018, of the Company and our report dated February 27, 2019, expressed anunqualified opinion on those consolidated financial statements and financial statement schedule.
As described in Management’s Annual Report on Internal Control over Financial Reporting, managementexcluded from its assessment the internal control over financial reporting at Quimicer, S.A. (“Quimicer”), whichwas acquired on October 1, 2018, UWiZ Technology Co., Ltd. (“UWiZ”), which was acquired on September 25,2018, Ernst Diegel GmbH (“Diegel”), which was acquired on August 31, 2018, MRA Laboratories, Inc.(“MRA”), which was acquired on July 12, 2018, and PT Ferro Materials Utama (“FMU”), which was acquiredon June 29, 2018, and whose financial statements constitute in the aggregate 5.8% of the Company’s total assets,1.1% of total net sales, and (1.4%) of total net income of the consolidated financial statement amounts as of andfor the year ended December 31, 2018. Accordingly, our audit did not include the internal control over financialreporting at Quimicer, UWiZ, Diegel, MRA and FMU.
Basis for Opinion
The Company’s management is responsible for maintaining effective internal control over financialreporting and for its assessment of the effectiveness of internal control over financial reporting, included in theaccompanying Management’s Annual Report on Internal Control over Financial Reporting. Our responsibility isto express an opinion on the Company’s internal control over financial reporting based on our audit. We are apublic accounting firm registered with the PCAOB and are required to be independent with respect to theCompany in accordance with the U.S. federal securities laws and the applicable rules and regulations of theSecurities and Exchange Commission and the PCAOB.
We conducted our audit in accordance with the standards of the PCAOB. Those standards require that weplan and perform the audit to obtain reasonable assurance about whether effective internal control over financialreporting was maintained in all material respects. Our audit included obtaining an understanding of internalcontrol over financial reporting, assessing the risk that a material weakness exists, testing and evaluating thedesign and operating effectiveness of internal control based on the assessed risk, and performing such otherprocedures as we considered necessary in the circumstances. We believe that our audit provides a reasonablebasis for our opinion.
Definition and Limitations of Internal Control over Financial Reporting
A company’s internal control over financial reporting is a process designed to provide reasonable assuranceregarding the reliability of financial reporting and the preparation of financial statements for external purposes inaccordance with generally accepted accounting principles. A company’s internal control over financial reportingincludes those policies and procedures that (1) pertain to the maintenance of records that, in reasonable detail,
114

accurately and fairly reflect the transactions and dispositions of the assets of the company; (2) provide reasonableassurance that transactions are recorded as necessary to permit preparation of financial statements in accordancewith generally accepted accounting principles, and that receipts and expenditures of the company are being madeonly in accordance with authorizations of management and directors of the company; and (3) provide reasonableassurance regarding prevention or timely detection of unauthorized acquisition, use, or disposition of thecompany’s assets that could have a material effect on the financial statements.
Because of its inherent limitations, internal control over financial reporting may not prevent or detectmisstatements. Also, projections of any evaluation of effectiveness to future periods are subject to the risk thatcontrols may become inadequate because of changes in conditions, or that the degree of compliance with thepolicies or procedures may deteriorate.
/s/ Deloitte & Touche LLP
Cleveland, OhioFebruary 27, 2019
Item 9B — Other Information
None.
115

PART III
Item 10 — Directors, Executive Officers and Corporate Governance
The information on Ferro’s directors is contained under the heading “Election of Directors” of the ProxyStatement for Ferro Corporation’s 2019 Annual Meeting of Shareholders and is incorporated here by reference.The information about the Audit Committee and the Audit Committee financial expert is contained under theheading “Corporate Governance — Board Committees” of the Proxy Statement for Ferro Corporation’s 2019Annual Meeting of Shareholders and is incorporated here by reference. Information on Ferro’s executive officersis contained under the heading “Executive Officers of the Registrant” in Part 1 of this Annual Report onForm 10-K. Section 16(a) filing information is contained under the heading “Security Ownership of CertainBeneficial Owners and Management — Section 16(a) Beneficial Ownership Reporting Compliance” of the ProxyStatement for Ferro Corporation’s 2019 Annual Meeting of Shareholders and is incorporated here by reference.
Ferro has adopted a series of policies dealing with business and ethics. These policies apply to all FerroDirectors, officers and employees. A summary of these policies may be found on Ferro’s Web site and the fulltext of the policies is available in print, free of charge, by writing to: General Counsel, Ferro Corporation, 6060Parkland Blvd. Suite 250, Mayfield Heights, Ohio, 44124, USA. Exceptions, waivers and amendments of thosepolicies may be made, if at all, only by the Audit Committee of the Board of Directors, and, in the event any suchexceptions, waivers or amendments are granted, a description of the change or event will be posted on Ferro’sWeb site (www.ferro.com) within four business days. Ferro maintains a worldwide hotline that allows employeesthroughout the world to report confidentially any detected violations of these legal and ethical conduct policiesconsistent with local legal requirements and subject to local legal limitations.
Item 11 — Executive Compensation
The information on executive compensation is contained under the headings “Executive CompensationDiscussion & Analysis” and “2018 Executive Compensation” of the Proxy Statement for Ferro Corporation’s2019 Annual Meeting of Shareholders and is incorporated here by reference.
116

Item 12 — Security Ownership of Certain Beneficial Owners and Management and Related StockholderMatters
The information on security ownership of certain beneficial owners and management is contained under theheadings “Security Ownership of Certain Beneficial Owners and Management — Stock Ownership by OtherMajor Shareholders” and “Security Ownership of Certain Beneficial Owners and Management — StockOwnership by Director and Executive Officers” of the Proxy Statement for Ferro Corporation’s 2019 AnnualMeeting of Shareholders and is incorporated here by reference.
The numbers of shares issued and available for issuance under Ferro’s equity compensation plans as ofDecember 31, 2018, were as follows:
Equity Compensation Plan
Number of Shares to BeIssued on Exercise ofOutstanding Options,
and Other Awards
Weighted-AverageExercise Price of
OutstandingOptions, and
Other Awards
Number of SharesRemaining Available forFuture Issuance UnderEquity Compensation
Plans(1)
Approved by Ferro Shareholders 2,884,009(2) $6.36 5,906,120(3)
Not Approved by Ferro Shareholders 184,878 — —
Total 3,068,887 $6.36(4) 5,906,120
(1) Excludes shares listed under “Number of Shares to Be Issued on Exercise of Outstanding Options andOther Awards.”
(2) Includes options and other awards issued under the Company’s 2018 Omnibus Incentive CompensationPlan and prior equity compensation plans.
(3) Shares are only available under the 2018 Omnibus Incentive Plan and may be issued as stock options,stock appreciation rights, restricted shares or units, performance shares or units, and other commonstock-based awards.
(4) Weighted-average exercise price of outstanding options and other awards; excludes phantom units.
A description follows of the material features of each plan that was not approved by Ferro shareholders:
• Supplemental Defined Contribution Plan for Executive Employees. The Supplemental ExecutiveDefined Contribution Plan allows participants to be credited annually with matching and basic pensioncontributions that they would have received under the Company’s 401(k) plan except for the applicableIRS limitations on compensation and contributions. Contributions vest at 20% for each year of service,are deemed invested in Ferro Common Stock and earn dividends. Distributions are made in FerroCommon Stock or in cash.
Item 13 — Certain Relationships and Related Transactions, and Director Independence
There are no relationships or transactions that are required to be reported. The information about directorindependence is contained under the heading “Corporate Governance — Director Independence” of the ProxyStatement for Ferro Corporation’s 2019 Annual Meeting of Shareholders and is incorporated here by reference.
Item 14 — Principal Accountant Fees and Services
The information contained under the heading “Accounting Firm Information — Fees” of the ProxyStatement for Ferro Corporation’s 2019 Annual Meeting of Shareholders is incorporated here by reference.
117

PART IV
Item 15 — Exhibits and Financial Statement Schedules
The following documents are filed as part of this Annual Report on Form 10-K:
(a) The consolidated financial statements of Ferro Corporation and subsidiaries contained in Part II,Item 8 of this Annual Report on Form 10-K:
• Consolidated Statements of Operations for the years ended December 31, 2018, 2017 and2016;
• Consolidated Statements of Comprehensive Income (Loss) for the years ended December 31,2018, 2017 and 2016;
• Consolidated Balance Sheets at December 31, 2018 and 2017;
• Consolidated Statements of Equity for the years ended December 31, 2018, 2017 and 2016;
• Consolidated Statements of Cash Flows for the years ended December 31, 2018, 2017 and2016; and
• Notes to Consolidated Financial Statements
(b) Schedule II — Valuation and Qualifying Accounts and Reserves for the years endedDecember 31, 2018, 2017 and 2016, contained on page 120 of this Annual Report on Form 10-K.All other schedules have been omitted because the material is not applicable or is not required aspermitted by the rules and regulations of the U.S. Securities and Exchange Commission, or therequired information is included in the consolidated financial statements.
(c) The exhibits listed in the Exhibit Index beginning on page 121 of this Annual Report on Form 10-K.
118

SIGNATURES
Pursuant to the requirements of Section 13 or 15(d) of the Securities Exchange Act of 1934, the Registranthas duly caused this Annual Report on Form 10-K to be signed on its behalf by the undersigned, thereunto dulyauthorized.
FERRO CORPORATION
By /s/ Peter T. Thomas
Peter T. ThomasChairman, President and Chief Executive Officer
Date: February 27, 2019
Pursuant to the requirements of the Securities Exchange Act of 1934, this Annual Report on Form 10-K hasbeen signed below by the following persons on behalf of the Registrant and in their indicated capacities as of the27th day of February, 2019.
/s/ Peter T. Thomas Chairman, President and Chief Executive Officer
Peter T. Thomas (Principal Executive Officer)
/s/ Benjamin J. Schlater Group Vice President and Chief Financial Officer
Benjamin J. Schlater (Principal Financial Officer)
/s/ James A. Barna Vice President, Controller and Chief Accounting Officer
James A. Barna (Principal Accounting Officer)
Director
Gregory E. Hyland
/s/ David A. Lorber Director
David A. Lorber
/s/ Marran H. Ogilvie Director
Marran H. Ogilvie
/s/ Andrew M. Ross Director
Andrew M. Ross
/s/ Allen A. Spizzo Director
Allen A. Spizzo
/s/ Ronald P. Vargo Director
Ronald P. Vargo
119

FERRO CORPORATION AND SUBSIDIARIES
SCHEDULE II — VALUATION AND QUALIFYING ACCOUNTS AND RESERVESYears Ended December 31, 2018, 2017 and 2016
Balance atBeginning of
Period
Additions Charged(Reductions Credited) to Adjustment for
Differences inExchange Rates
Balance atEnd of Period
Costs andExpenses Deductions
(Dollars in thousands)
Allowance for Possible Losseson Collection of AccountsReceivable:Year ended December 31, 2018 $ 7,821 681 (2,642) (356) $ 5,504
Year ended December 31, 2017 $ 8,166 44 (1,253) 864 $ 7,821
Year ended December 31, 2016 $ 7,784 1,383 (820) (181) $ 8,166
Valuation Allowance on NetDeferred Tax Assets:Year ended December 31, 2018 $32,579 — (5,617)1 (1,366) $25,596
Year ended December 31, 2017 $37,354 — (5,648)1 873 $32,579
Year ended December 31, 2016 $55,043 — (16,686)1 (1,003) $37,354
(1) Included within this deduction is $1.7 million, $0.8 million and $6.8 million for the years endedDecember 31, 2018, 2017, and 2016 respectively, of valuation allowance release, resulting from theconclusion that the underlying deferred tax assets are more likely than not to be realized.
120

EXHIBIT INDEX
The following exhibits are filed with this report or are incorporated here by reference to a prior filing inaccordance with Rule 12b-32 under the Securities and Exchange Act of 1934.
Exhibit:
2 Plan of acquisition, reorganization, arrangement or successor:
2.1 Sale and Purchase Agreement, dated April 29, 2015, by and among Ferro Corporation, the sellersparty thereto, Corporación Química Vhem, S.L. and Dibon USA, LLC (incorporated by referenceto Exhibit 2.1 to Ferro Corporation’s Current Report on Form 8-K filed July 9, 2015).
2.2 Addendum to Sale and Purchase Agreement, dated July 7, 2015, by and among Ferro Corporation,Ferro Spain Management Company, S.L.U., the sellers party thereto, Corporación Química Vhem,S.L. and Dibon USA, LLC (incorporated by reference to Exhibit 2.2 to Ferro Corporation’s CurrentReport on Form 8-K filed July 9, 2015).
3 Articles of Incorporation and by-laws:
3.1 Eleventh Amended Articles of Incorporation of Ferro Corporation (incorporated by reference toExhibit 4.1 to Ferro Corporation’s Registration Statement on Form S-3, filed March 5, 2008).
3.2 Certificate of Amendment to the Eleventh Amended Articles of Incorporation of Ferro Corporationfiled December 29, 1994 (incorporated by reference to Exhibit 4.2 to Ferro Corporation’sRegistration Statement on Form S-3, filed March 5, 2008).
3.3 Certificate of Amendment to the Eleventh Amended Articles of Incorporation of Ferro Corporationfiled June 23, 1998 (incorporated by reference to Exhibit 4.3 to Ferro Corporation’s RegistrationStatement on Form S-3, filed March 5, 2008).
3.4 Certificate of Amendment to the Eleventh Amended Articles of Incorporation of Ferro Corporationfiled October 14, 2011 (incorporated by reference to Exhibit 3.1 to Ferro Corporation’s CurrentReport on Form 8-K, filed October 17, 2011).
3.5 Certificate of Amendment to the Eleventh Amended Articles of Incorporation of Ferro Corporationfiled on April 25, 2014 (incorporated by reference to Exhibit 3.5 to Ferro Corporation’s QuarterlyReport on Form 10-Q for the quarter ended June 30, 2014).
3.6 Ferro Corporation Amended and Restated Code of Regulations; Amended and Restated as ofDecember 8, 2016 (incorporated by reference to Exhibit 3.1 to Ferro Corporation’s Current Reporton Form 8-K filed December 12, 2016).
4 Instruments defining rights of security holders, including indentures:
The Company agrees, upon request, to furnish to the U.S. Securities and Exchange Commission acopy of any instrument authorizing long-term debt that does not authorize debt in excess of 10% ofthe total assets of the Company and its subsidiaries on a consolidated basis.
10 Material Contracts:
10.1 Receivables Purchase and Servicing Agreement, dated December 5, 2018, among Ferro Spain S.A.,Vetriceramici-Ferro S.p.A., Ferro Corporation and ING Belgique SA/NV (incorporated byreference to Exhibit 10.1 to Ferro Corporation’s Current Report on Form 8-K filed December 6,2018).
10.2 First Amendment, dated as of April 25, 2018, to Credit Agreement among Ferro Corporation, FerroGmbH and Ferro Europe Holding LLC, certain other subsidiaries of Ferro Corporation, PNC Bank,National Association, as the Administrative Agent, Collateral Agent and an Issuer, Deutsche BankAG New York Branch, as the Syndication Agent and an Issuer, and various financial institutions as
121

lenders (incorporated by reference to Exhibit 10.1 to Ferro Corporation’s current Report on Form8-K, filed April 27, 2018).
10.3 Ferro Corporation 2018 Omnibus Incentive Plan (incorporated by reference to Exhibit 10.1 to FerroCorporation’s Current Report on Form 8-K, filed May 7, 2018.
10.4 Credit Agreement, dated as of February 14, 2017, among Ferro Corporation, the lenders partythereto, PNC Bank, National Association, as the administrative agent, collateral agent and a letterof credit issuer, Deutsche Bank AG New York Branch, as the syndication agent and as a letter ofcredit issuer, and the various financial institutions and other persons from time to time party thereto(incorporated by reference to Exhibit 10.1 to Ferro Corporation’s current Report on Form 8-K, filedFebruary 17, 2017).
10.5 Credit Agreement, dated as of July 31, 2014, among Ferro Corporation, the lenders party thereto,PNC Bank, National Association, as the administrative agent, collateral agent and a letter of creditissuer, JPMorgan Chase Bank N.A., as the syndication agent and as a letter of credit issuer, and thevarious financial institutions and other persons from time to time party hereto (incorporated byreference to Exhibit 10.1 to Ferro Corporation’s Current Report on Form 8-K, filed August 5,2014).
10.6 Incremental Assumption Agreement, dated January 25, 2016, by and among Ferro Corporation ,PNC Bank, National Association, as the administrative agent, the collateral agent and as an issuer,JPMorgan Chase Bank, N.A., as an issuer, and various financial institutions as lenders(incorporated by reference to Exhibit 10.1 to Ferro Corporation’s Current Report on Form 8-K filedJanuary 26, 2016).
10.7 Second Incremental Assumption Agreement, dated August 29, 2016, by and among FerroCorporation, PNC Bank, National Association, as the administrative agent, the collateral agent andas an issuer, JPMorgan Chase Bank, N.A., as an issuer, and various financial institutions as lenders.(incorporated by reference to Exhibit 10.1 to Ferro Corporation’s current Report on Form 8K, filedAugust 30, 2016).
10.8 Retention Agreement, dated September 1, 2016, by and between Jeffrey L. Rutherford and FerroCorporation (incorporated by reference to Exhibit 10.2 to Ferro Corporation’s Quarterly Report onForm 10-Q for the quarter ended September 30, 2016).*
10.9 Separation Agreement and Release, dated January 3, 2017, by and between Jeffrey L. Rutherfordand Ferro Corporation. (incorporated by reference to Exhibit 10.4 to Ferro Corporation’s QuarterlyReport on Form 10-Q for the quarter ended March 31, 2017).*
10.10 Change in Control Agreement, dated September 1, 2016, by and between Benjamin Schlater andFerro Corporation. (incorporated by reference to Exhibit 10.5 to Ferro Corporation’s QuarterlyReport on Form 10-Q for the quarter ended March 31, 2017).*
10.11 Ferro Corporation 2006 Long-Term Incentive Plan (incorporated by reference to Exhibit 10.17 toFerro Corporation’s Annual Report on Form 10-K for the year ended December 31, 2011).*
10.12 Form of Terms of Nonstatutory Stock Option Grants under the Ferro Corporation 2006 Long-TermIncentive Compensation Plan (incorporated by reference to Exhibit 10.21 to Ferro Corporation’sAnnual Report on Form 10-K for the year ended December 31, 2008).*
10.13 Form of Terms of Deferred Stock Unit Awards under the Ferro Corporation 2013 OmnibusIncentive Plan (incorporated by reference to Exhibit 10.1 to Ferro Corporation’s Quarterly Reporton Form 10-Q for the quarter ended June 30, 2014).*
10.14 Ferro Corporation 2010 Long-Term Incentive Plan (incorporated by reference to Exhibit 10.1 toFerro Corporation’s Current Report on Form 8-K, filed May 6, 2010).*
122

10.15 Form of Terms of Nonstatutory Stock Option Grants under the Ferro Corporation 2010 Long-TermIncentive Plan (incorporated by reference to Exhibit 10.1 to Ferro Corporation’s Quarterly Reporton Form 10-Q for the quarter ended March 31, 2012).*
10.16 Form of Terms of Performance Share Unit Awards under the Ferro Corporation 2010 Long-TermIncentive Plan (incorporated by reference to Exhibit 10.2 to Ferro Corporation’s Quarterly Reporton Form 10-Q for the quarter ended March 31, 2012).*
10.17 Form of Terms of Restricted Share Unit Awards under the Ferro Corporation 2010 Long-TermIncentive Plan (incorporated by reference to Exhibit 10.3 to Ferro Corporation’s Quarterly Reporton Form 10-Q for the quarter ended March 31, 2012).*
10.18 Ferro Corporation 2013 Omnibus Incentive Plan (incorporated by reference to Exhibit 10.1 to FerroCorporation’s Current Report on Form 8-K, filed May 23, 2013).*
10.19 Form of Terms of Nonstatutory Stock Options Grants under the Ferro Corporation 2013 OmnibusIncentive Plan (incorporated by reference to Exhibit 10.5 to Ferro Corporation’s Quarterly Reporton Form 10-Q for the quarter ended June 30, 2013.*
10.20 Form of Terms of Performance Share Unit Awards under the Ferro Corporation 2013 OmnibusIncentive Plan (incorporated by reference to Exhibit 10.6 to Ferro Corporation’s Quarterly Reporton Form 10-Q for the quarter ended June 30, 2013.*
10.21 Form of Terms of Restricted Share Unit Awards under the Ferro Corporation 2013 OmnibusIncentive Plan (incorporated by reference to Exhibit 10.7 to Ferro Corporation’s Quarterly Reporton Form 10-Q for the quarter ended June 30, 2013.*
10.22 Terms of Retention Restricted Stock Units Award for Mr. Peter T. Thomas (incorporated byreference to Exhibit 10.1 to Ferro Corporation’s Current Report on Form 8-K, filed onDecember 30, 2014).*
10.23 Amendment to the Ferro Corporation Deferred Compensation Plan for Executive Employees(incorporated by reference to Exhibit 10.18 to Ferro Corporation’s Annual Report on Form 10-Kfor the year ended December 31, 2009).*
10.24 Ferro Corporation Deferred Compensation Plan for Executive Employees (incorporated byreference to Exhibit 10.28 to Ferro Corporation’s Annual Report on Form 10-K for the year endedDecember 31, 2012).*
10.25 Ferro Corporation Deferred Compensation Plan for Non-Employee Directors (incorporated byreference to Exhibit 10.29 to Ferro Corporation’s Annual Report on Form 10-K for the year endedDecember 31, 2012).*
10.26 Ferro Corporation Deferred Compensation Plan for Non-Employee Directors Trust Agreement(incorporated by reference to Exhibit 10.26 to Ferro Corporation’s Annual Report on Form 10-Kfor the year ended December 31, 2011).*
10.27 Ferro Corporation Supplemental Defined Benefit Plan for Executive Employees (incorporated byreference to Exhibit 10.31 to Ferro Corporation’s Annual Report on Form 10-K for the year endedDecember 31, 2012.*
10.28 Amendment to the Ferro Corporation Supplemental Defined Contribution Plan for ExecutiveEmployees (incorporated by reference to Exhibit 10.23 to Ferro Corporation’s Annual Report onForm 10-K for the year ended December 31, 2009).*
10.29 Ferro Corporation Supplemental Defined Contribution Plan for Executive Employees (incorporatedby reference to Exhibit 10.33 to Ferro Corporation’s Annual Report on Form 10-K for the yearended December 31, 2012).*
123

10.30 Form of Indemnification Agreement (incorporated by reference to Exhibit 10.1 to FerroCorporation’s Current Report on Form 8-K, filed June 26, 2013).*
10.31 Change in Control Agreement, dated March 22, 2013, between Peter T. Thomas and FerroCorporation (incorporated by reference to Exhibit 10.5 to Ferro Corporation’s Quarterly Report onForm 10-Q for the quarter ended March 31, 2013).*
10.32 Form of Change in Control Agreement, dated January 1, 2009, entered into by and between MarkH. Duesenberg, and Ferro Corporation (incorporated by reference to Exhibit 10.2 to FerroCorporation’s Current Report on Form 8-K, filed January 7, 2009).*
10.33 Ferro Corporation Executive Separation Policy (incorporated by reference to Exhibit 10.1 to FerroCorporation’s Current Report on Form 8-K, filed June 28, 2010).*
10.34 Letter Agreement, dated November 12, 2012, between Peter T. Thomas and Ferro Corporation(incorporated by reference to Exhibit 10.41 to Ferro Corporation’s Form 10-K for the year endedDecember 31, 2012).*
10.35 Letter Agreement, dated November 12, 2012, between Jeffrey L. Rutherford and Ferro Corporation(incorporated by reference to Exhibit 10.42 to Ferro Corporation’s Form 10-K for the year endedDecember 31, 2012).*
21 List of Subsidiaries.
23.1 Consent of Independent Registered Public Accounting Firm.
31.1 Certification of Principal Executive Officer Pursuant to Rule 13a-14(a)/15d-14(a).
31.2 Certification of Principal Financial Officer Pursuant to Rule 13a-14(a)/15d-14(a).
32.1 Certification of Principal Executive Officer Pursuant to 18 U.S.C. 1350.
32.2 Certification of Principal Financial Officer Pursuant to 18 U.S.C. 1350.
101 XBRL Documents:
101.INS XBRL Instance Document.**
* Indicates management contract or compensatory plan, contract or arrangement in which one or moreDirectors and/or executives of Ferro Corporation may be participants.
** In accordance with Rule 406T of Regulation S-T, the XBRL related information in Exhibit 101 to thisAnnual Report on Form 10-K shall not be deemed to be “filed” for purposes of Section 18 of the SecuritiesExchange Act of 1934, or otherwise subject to the liability of that section, and shall not be part of anyregistration statement or other document filed under the Securities Act of 1933 or the Securities ExchangeAct of 1934, except as shall be expressly set forth by specific reference in such filing.
124

To supplement the consolidated financial statements presented in accordance with U.S. GAAP in thisAnnual Report on Form 10-K, certain non-GAAP financial measures as defined by SEC rules are used in theShareholders Letter. The non-GAAP measures included in this Annual Report have been reconciled to thecomparable U.S. GAAP measures within the tables shown on the following pages.

[THIS PAGE INTENTIONALLY LEFT BLANK]

Ferro Corporation and SubsidiariesReconciliation of Reported to Adjusted Financials
For the Twelve Months Ended December 31, 2018, 2017, 2016, 2015, 2014 and 2013(Unaudited)
Net Sales Gross Profit Gross Margin Total SG&A Operating Income
(Dollars in millions) Ferro Total Ferro Total Ferro Total Ferro Total Ferro Total
2018
As Reported (GAAP) $ 1,612.4 $ 455.9 28.3% $ 278.6 $ 177.4Adjustments:Acquisition related costs1 3.5 (13.2) 16.7Costs related to optimization projects 2.8 (7.5) 10.3Costs related to divested businesses and assets (0.7) 0.7
Total Adjustments — 6.3 (21.4) 27.7Constant Currency FX Impact2
As Adjusted from Continuing Operations (Non-GAAP) $ 1,612.4 $ 462.3 28.7% $ 257.2 $ 205.1
2017
As Reported (GAAP) $ 1,396.7 $ 416.2 29.8% $ 265.4 $ 150.8Adjustments:Acquisition related costs1 7.5 (16.4) 23.9Costs related to optimization projects 1.2 (2.5) 3.7Costs related to divested businesses and assets 0.1 (2.7) 2.8
Total Adjustments — 8.8 (21.6) 30.4Constant Currency FX Impact2 6.7 5.3 1.3 4.0
As Adjusted from Continuing Operations (Non-GAAP) $ 1,403.4 $ 430.3 30.7% $ 245.1 $ 185.2
2016
As Reported (GAAP) $ 1,145.3 $ 356.4 31.1% $ 227.3 $ 129.1Adjustments:Acquisition related costs1 3.8 (12.2) 16.0Costs related to optimization projects (2.2) 2.2Costs related to divested businesses and assets (3.5) 3.5
Total Adjustments — 3.8 (18.0) 21.8Constant Currency FX Impact2 (11.0) 1.6 1.4 0.2
As Adjusted from Continuing Operations (Non-GAAP) $ 1,134.3 $ 361.8 31.9% $ 210.7 $ 151.1
2015
As Reported (GAAP) $ 1,075.3 $ 300.5 27.9% $ 215.7 $ 84.8Adjustments:Acquisition related costs1 5.8 (13.6) 19.4Costs related to optimization projects (3.6) 3.6Costs related to divested businesses and assets 2.5 (0.4) 2.9Sold Business Venezuela (8.4) 0.7 (0.1) 0.8
Total Adjustments (8.4) 9.0 (17.7) 26.7Constant Currency FX Impact2 (34.4) (4.4) (1.4) (3.0)
As Adjusted from Continuing Operations (Non-GAAP) $ 1,032.5 $ 305.1 29.5% $ 196.6 $ 108.5
2014
As Reported (GAAP) $ 1,111.6 $ 293.1 26.4% $ 211.5 $ 81.6Adjustments:Acquisition related costs1 (3.6) 3.6Costs related to optimization projects (8.8) 8.8Costs related to divested businesses and assets (0.4) (0.9) 0.4Sold Business Venezuela (19.8) (3.4) (1.8) (1.6)
Total Adjustments (19.8) (3.8) (15.0) 11.2Constant Currency FX Impact2 (146.1) (32.8) (17.9) (14.9)
As Adjusted from Continuing Operations (Non-GAAP) $ 945.7 $ 256.5 27.1% $ 178.6 $ 77.9

Net Sales Gross Profit Gross Margin Total SG&A Operating Income
(Dollars in millions) Ferro Total Ferro Total Ferro Total Ferro Total Ferro Total
2013
As Reported (GAAP) $ 1,188.6 $ 278.6 23.4% $ 225.6 $ 53.0Adjustments:Acquisition related costs1 (1.3) 1.3Costs related to optimization projects 2.0 (5.6) 7.6Costs related to divested businesses and assets 2.0 (0.8) 2.8Sold Business Venezuela and Metal Powders & Solar product lines (102.0) (9.6) (5.6) (4.0)
Total Adjustments (102.0) (5.6) (13.3) 7.7Constant Currency FX Impact2 (152.9) (32.4) (20.5) (11.9)
As Adjusted from Continuing Operations (Non-GAAP) $ 933.7 $ 240.6 25.8% $ 191.9 $ 48.7
1. The adjustments to “Gross Profit” primarily include the amortization of purchase accounting adjustments related to our recentacquisitions. The adjustments to “SG&A” primarily include legal, professional and other expenses related to acquisition costs.
2. Reflects the remeasurement of 2017, 2016, 2015, 2014 and 2013 reported and adjusted results using 2018 average exchange rates,resulting in a constant currency comparative figures to 2018 reported and adjusted results.
It should be noted that adjusted net sales, adjusted gross profit, adjusted SG&A and adjusted operatingincome referred to above are financial measures not required by, or presented in accordance with, accountingprinciples generally accepted in the United States (U.S. GAAP). These non-GAAP financial measures should beconsidered as a supplement to, and not as a substitute for, the financial measures prepared in accordance withU.S. GAAP and a reconciliation of these financial measures to the most comparable U.S. GAAP financialmeasures is presented. We believe this data provides investors with additional information on the underlyingoperations and trends of the business and enables period-to-period comparability of financial performance.

Ferro Corporation and SubsidiariesReconciliation of Adjusted EBITDA from Continuing Operations
For the Twelve Months Ended December 31, 2018, 2017, 2016, 2015, 2014 and 2013(Unaudited)
(Dollars in millions) 2018 2017 2016 2015 2014 2013
Net income (loss) attributable to FerroCorporation common shareholders (GAAP) $ 80.1 $ 57.1 $ (20.8) $ 64.1 $ 86.1 $ 71.9
Net income (loss) attributable to noncontrollinginterests 0.9 0.7 0.9 (1.0) 0.2 0.5
Loss (income) from discontinued operations, net ofincome taxes — — 64.5 36.8 (94.8) (8.5)
Restructuring and impairment charges 13.3 11.4 15.9 9.7 8.8 40.9
Other expense, net 26.7 1.1 29.2 5.2 99.3 (86.3)
Interest expense 33.4 27.8 21.5 15.2 16.3 20.2
Income tax expense (benefit) 23.0 52.8 17.9 (45.1) (34.2) 14.3
Depreciation and amortization 57.6 53.6 48.2 42.2 34.3 37.7
Less: interest amortization expense and other (3.6) (3.5) (1.4) (1.1) (3.1) (2.9)
Cost of sales Non-GAAP adjustments1 6.3 8.8 0.2 2.5 (0.4) 4.0
SG&A Non-GAAP adjustments1 21.4 21.6 18.0 17.6 13.2 7.7
Sold Business Venezuela — — — (1.8) (1.7) (2.4)
Adjusted EBITDA (Non-GAAP measure) fromcontinuing operations $ 259.1 $ 231.2 $ 194.1 $ 144.2 $ 123.9 $ 97.0
1. The Non-GAAP adjustments to Cost of Sales and SG&A are described in the “Reconciliation of Reported toAdjusted Financials.”
It should be noted that adjusted EBITDA from continuing operations is a financial measure not required by,or presented in accordance with, accounting principles generally accepted in the United States (U.S. GAAP).This Non-GAAP financial measure should be considered as a supplement to, and not as a substitute for, thefinancial measures prepared in accordance with U.S. GAAP and a reconciliation of this financial measure to themost comparable U.S. GAAP financial measure is presented. We believe this data provides investors withadditional useful information on the underlying operations and trends of the business and enablesperiod-to-period comparability of financial performance.

Ferro Corporation and SubsidiariesReconciliation of Adjusted Free Cash Flow from Continuing Operations
For the Twelve Months Ended December 31, 2018, 2017, 2016, 2015, 2014 and 2013(Unaudited)
(Dollars in millions) 2018 2017 2016 2015 2014 2013
Cash flows from operating activities
Net income $ 80.9 $ 57.8 $ (19.9) $ 63.1 $ 86.2 $ 72.4
Loss (gain) on sale of assets 0.2 (0.9) (2.8) 1.8 (124.0) (15.6)
Depreciation and amortization 54.0 50.1 46.8 41.1 37.2 47.1
Interest amortization 3.6 3.5 1.4 1.1 1.3 2.9
Restructuring and impairment 4.1 7.6 50.9 13.3 11.6 20.6
Loss on extinguishment of debt 3.2 3.9 — — 14.4 —
Accounts receivable 19.9 (25.9) (21.9) 20.2 (5.7) 16.2
Inventories (33.9) (47.0) (10.3) 6.6 (12.6) 18.1
Accounts payable 35.9 26.2 1.2 (14.6) 5.9 (28.0)
Other current assets and liabilities, net (1.3) (29.5) 8.6 (19.4) (21.1) (7.8)
Other adjustments, net 16.3 39.0 8.6 (62.0) 67.2 (107.5)
Net cash provided by operating activities (GAAP) 182.8 84.8 62.6 51.2 60.5 18.5
Less: Capital Expenditures (80.6) (50.6) (24.9) (43.1) (53.8) (34.2)
Plus: Cash collected for AR securitization 7.0 — — — — —
Free Cash Flow provided by Continuing Operations(Non-GAAP) $ 109.2 $ 34.2 $ 37.7 $ 8.1 $ 6.7 $ (15.8)
Plus: cash used for restructuring 9.2 3.8 2.7 8.2 18.0 29.8
Plus: cash used for (provided by) discontinued operations — — 32.5 45.4 (1.5) (23.6)
Plus: cash used for capital expenditures related tooptimization projects(1) 41.0 16.3 — — 9.2 —
Plus: Cash used for net working capital investmentrelated to optimization projects(2) 8.4 8.1 — — — —
Plus: Cash used for acquisition related professional fees(3) 11.6 18.7 13.4 16.6 2.6 1.3
Plus: Cash used for optimization projects(3) 9.0 2.5 2.2 3.6 7.4 7.6
Plus: Cash used for divested businesses and assets(3) 0.7 2.7 3.5 2.9 0.4 0.8
Adjusted Free Cash Flow from Continuing Operations(Non-GAAP) $ 189.1 $ 86.4 $ 92.0 $ 84.8 $ 42.8 $ 0.2
1. The adjustment to capital expenditures represents capital spend for certain optimization projects that are notexpected to recur in the long-term at the current rate.
2. The adjustment to net working capital represents spend for the build in inventory related to the optimizationproject noted in (1) above. This build in inventory is considered to be outside of the normal operations of theunderlying business, and expected to be temporary in nature.
3. The adjustment represents those cash outlays for (a) acquisition related professional fees, (b) costs related tocertain optimization projects, and (c) costs relate to divested businesses and assets, as detailed in the“Reconciliation of Reported to Adjusted Financials.”
It should be noted that adjusted free cash flow from continuing operations is a financial measure notrequired by, or presented in accordance with, accounting principles generally accepted in the United States (U.S.GAAP). This Non-GAAP financial measure should be considered as a supplement to, and not as a substitute for,the financial measures prepared in accordance with U.S. GAAP and a reconciliation of this financial measure tothe most comparable U.S. GAAP financial measure is presented. We believe this data provides investors withadditional useful information on the underlying operations and trends of the business and enablesperiod-to-period comparability of financial performance.

Ferro Corporation and SubsidiariesReconciliation of Adjusted Diluted Earnings per Share from Continuing OperationsFor the Twelve Months Ended December 31, 2018, 2017, 2016, 2015, 2014 and 2013
(Unaudited)
2018 2017 2016 2015 2014 2013
Diluted earnings (loss) per share (GAAP) $ 0.94 $ 0.67 $ (0.25) $ 0.72 $ 0.99 $ 0.82Adjustments:
Impairment — — — — — 0.11
Restructuring 0.16 0.13 0.19 0.11 0.10 0.36
Pension1 0.22 (0.05) 0.24 0.10 0.99 (0.80)
Other2 0.35 0.39 0.34 0.30 0.37 (0.02)
Taxes3 (0.17) 0.14 (0.19) (0.78) (0.74) (0.03)
Discontinued operations — — 0.76 0.42 (1.08) (0.10)
Noncontrolling interest — — — (0.02) — —
Total adjustments4 0.56 0.62 1.34 0.12 (0.37) (0.49)
Adjusted diluted earnings per share from continuingoperations (Non GAAP measure) $ 1.50 $ 1.29 $ 1.09 $ 0.85 $ 0.62 $ 0.33
1. Pension and other post-retirement benefit mark-to-market adjustments and settlements.2. For 2018, 2017, 2016, 2015, 2014 and 2013, the description of adjustments for Cost of Sales and SG&A are
detailed in the “Reconciliation of Reported to Adjusted Financials.” In 2018, the adjustments to “Otherexpense, net” primarily relate to impacts of currency related items in Argentina, debt extinguishmentcharges, fees expensed associated with the Amended Credit Facility and a gain recognized on increasing ourownership interest in FMU. For 2017, the adjustments to “Other expense, net” primarily relate to the foreignexchange loss incurred on our Euro-denominated term loan, an impairment on an equity method investment,gains and losses on asset sales, debt extinguishment charges, and the gain recognized on increasing ourownership interest in Gardenia. For 2016, the adjustments to “Other expense, net” relates to the gain on anasset sale, the finalization of the purchase price for the acquisition of Vetriceramici, impacts of currency-related items in Egypt and the impact of the loss on a foreign currency contract associated with the purchaseof Cappelle. For 2015, the adjustments to “Other expense, net” related to currency-related items inVenezuela and Argentina, loss on sale of assets and the impact of a loss on a foreign currency contractassociated with the purchase of Nubiola. For 2014 and 2013, the adjustments to “Other expense, net” relatesto gain/loss on divestitures and certain costs related to divested assets and product lines.
3. For 2018, 2017, 2016 and 2015, the tax rate reflects the reported tax rate, adjusted for Non-GAAPadjustments being tax effected at the respective statutory rate where the item originated. In 2018 and 2017,we adjusted for impacts associated with the Tax Cuts and Jobs Act and the impact associated with a ratechange in Colombia in 2018. For 2014 and 2013, adjustment of reported income and of Non-GAAPadjustments to a normalized 36% tax rate.
4. Due to rounding, total earnings per share related to adjustments does not always add to the total adjustedearnings per share.
It should be noted that adjusted diluted earnings per share from continuing operations is a financial measurenot required by, or presented in accordance with, accounting principles generally accepted in the United States(U.S. GAAP). This Non-GAAP financial measure should be considered as a supplement to, and not as asubstitute for, the financial measures prepared in accordance with U.S. GAAP and a reconciliation of thisfinancial measure to the most comparable U.S. GAAP financial measure is presented. We believe this dataprovides investors with additional useful information on the underlying operations and trends of the business andenables period-to-period comparability of financial performance.

Exchange Listing New York Stock Exchange Common Stock Stock symbol: FOE
Executive OfficesFerro Corporation, 6060 Parkland Boulevard, Suite 250, Mayfield Heights, OH 44124, U.S.A 216-875-5600
Investor ContactKevin Cornelius Grant Director, Investor Relations and Corporate Communications 216-875-5451 [email protected]
Form 10-KFerro Corporation’s Form 10-K report filed with the Securities and Exchange Commission for the year ended December 31, 2018, is available to shareholders at no cost at the Company’s website (ferro.com) or upon request.
Stock Purchase Plan The Plan is administered by Computershare. Any questions or correspondence about the Plan should be addressed to:
Computershare P.O. Box 505000, Louisville, KY 40233-5000 Shareholder Services Number(s): 800-622-6757 781-575-4735 (Non-U.S.) [email protected]
Brokerage Accounts To reduce communication delays that exist for some Ferro shareholders who hold their stock in brokerage accounts, the Company will send its various printed communications directly to such shareholders. If you would like to take advantage of this service, please write to:
Treasury Department Ferro Corporation, 6060 Parkland Boulevard, Suite 250, Mayfield Heights, OH 44124, U.S.A.
Please indicate the number of Ferro shares owned and the name and address of the brokerage firm that administers your account.
Stock Transfer Agent/Registrar and Dividend Disbursing Agent Computershare P.O. Box 505000, Louisville, KY 40233-5000 Shareholder Services Number(s): 800-622-6757 781-575-4735 (Non-U.S.) [email protected]
Independent Registered Public Accounting Firm Deloitte & Touche LLP 127 Public Square, Suite 3300 Cleveland, OH 44114
Board of Directors and Leadership Team
BUSINESS MANAGEMENT TEAM
Matthias Bell Group Vice President, Global Operations
Dieter BinderVice President, Europe & Performance Colors and Glass
Julio GarciaVice President, Europe & Performance Coatings
Barry MisquittaVice President, Americas & Color Solutions; Innovation and Strategic Marketing
Luca PecoraraVice President, Asia Pacific
1 Audit Committee 2 Compensation Committee 3 Governance & Nomination Committee
EXECUTIVE TEAM
Peter T. Thomas Chairman, President and Chief Executive Officer
Benjamin Schlater Group Vice President and Chief Financial Officer
Pepe TortajadaVice President, Human Resources
Mark H. DuesenbergVice President, General Counsel and Secretary
BOARD OF DIRECTORS
Peter T. ThomasChairman, President, CEO Ferro Corporation
Gregory E. Hyland Mr. Hyland is the retired Chairman and CEO of Mueller Water Products, Inc., a manufacturer and marketer of products and services used in the transmission, distribution and measurement of water in North America.
David A. Lorber 2, 3 – Chair Mr. Lorber is a Co-Founder of FrontFour Capital Group LLC, an investment adviser, and has served as a Portfolio Manager since January 2007. He is also a Co-Founder and Principal of FrontFour Capital Corp., an investment adviser.
Andrew M. Ross 1, 3
Mr. Ross is the former President of the Pigments and Additives business of Rockwood Holdings, Inc. (“Rockwood”), a performance additives and titanium dioxide business that was sold to Huntsman Pigments in October 2014.
Allen A. Spizzo 1, 2 - Chair Mr. Spizzo has been a business and management consultant focused on the chemicals, materials, biotechnology and pharmaceutical industries since November 2008, and served as Vice President and Chief Financial Officer of Hercules Incorporated, a former S&P 500 specialty chemicals company, from March 2004 until the company was sold to Ashland Inc. in November 2008.
Marran Ogilvie 1, 3
Ms. Ogilvie serves on the board of directors of Four Corners Property Trust, Inc., a real estate investment trust, Evolution Petroleum Corporation, a U.S. petroleum producer, and Bemis Company, a global manufacturer of flexible packaging.
Ronald P. Vargo 1 – Chair, 2 Mr. Vargo served as Vice President and Chief Financial Officer of ICF International, a provider of consulting services and technology solutions to government and commercial clients, from April 2010 until May 2011, after serving as Executive Vice President and Chief Financial Officer of Electronic Data Systems, an information technology equipment and services company.
Adjusted Free Cash Flow(IN MILLIONS)
Adjusted Earnings Per Share
Net Sales CC
(IN MILLIONS)
$946 $257
$43
$1,033 $305
$85
$1,134$362
$92
$1,403$430
$86
$1,612 $462
$189
Adjusted Gross Profit CC
(IN MILLIONS)
Non-GAAP Financial Information: Continuing Operations excluding Discontinued Operations and Other Divestitures; Adjusted Gross Profit Margin; Constant Currency Results; Adjusted Free Cash Flow From Operations; Adjusted Earnings Before Interest, Taxes, Depreciation and Amortization (EBITDA); Adjusted Earnings Per Share; are non-GAAP measures. These non-GAAP measures have been reconciled to the comparable GAAP measures within tables immediately following the Company’s Annual Report on Form 10-K.
CC Constant Currency
$0.62
$0.85
$1.09
$1.29
$1.50
Adjusted EBITDA
Adjusted Gross Profit Margin CC
27.1%29.5%
31.9%30.7%
28.7%
$124$144
$194
$231
$259
$934
13 14 15 16 17 18 13 14 15 16 17 18
$241
13 14 15 16 17 18
25.8%
$0 13 14 15 16 17 18
$97
$0.33
13 14 15 16 17 18 13 14 15 16 17 18
20959_FERRO_AnnualReport_ACG.indd 4-6 3/15/19 10:32 AM

6060 Parkland Boulevard ◆ Suite 250 ◆ Mayfield Heights, OH 44124 ◆ 216.875.5600 ◆ ferro.com
2018 ANNUAL REPORT AND FORM 10-K
20959_FERRO_AnnualReport_ACG.indd 1-3 3/15/19 10:32 AM