Embed Size (px)
Citation preview
ANNUAL REPORT 2009
FORM 10-KCPWR
VALUEFOCUSALIGNMENTREFERENCEABILITYSIMPLICITY

THE GLOBAL LEADER IN APPLICATION PERFORMANCE
1 1
UNITED STATES SECURITIES AND EXCHANGE COMMISSION
Washington, D.C. 20549
FORM 10-K
[X] ANNUAL REPORT PURSUANT TO SECTION 13 OR 15(d) OF THE SECURITIES EXCHANGE ACT OF 1934 FOR THE FISCAL YEAR ENDED MARCH 31, 2009
Commission File Number: 000-20900
COMPUWARE CORPORATION (Exact name of registrant as specified in its charter)
Michigan 38-2007430 (State or other jurisdiction of (I.R.S. Employer incorporation or organization) Identification No.)
One Campus Martius, Detroit, MI 48226-5099 (Address of principal executive offices including zip code)
Registrant’s telephone number, including area code: (313) 227-7300
Securities registered pursuant to Section 12(b) of the Act: Title of Each Class Name of Each Exchange on Which Registered Common Stock, par value $.01 per share Nasdaq Stock Market Preferred Stock Purchase Rights Nasdaq Stock Market Securities registered pursuant to Section 12(g) of the Act: None Indicate by check mark if the registrant is a well-known seasoned issuer, as defined in Rule 405 of the Securities Act of 1933. Yes X No __ Indicate by check mark if the registrant is not required to file reports pursuant to Section 13 or Section 15(d) of the Securities Exchange Act of 1934. Yes No X Indicate by check mark whether the registrant (1) has filed all reports required to be filed by Section 13 or 15(d) of the Securities Exchange Act of 1934 during the preceding 12 months (or for such shorter period that the registrant was required to file such reports), and (2) has been subject to such filing requirements for the past 90 days. Yes X No ___
Indicate by check mark whether the registrant has submitted electronically and posted on its corporate Web site, if any, every Interactive Data File required to be submitted and posted pursuant to Rule 405 of Regulation S-T during the preceding 12 months (or for such shorter period that the registrant was required to submit and post such files). Yes ___ No ___ Indicate by check mark if disclosure of delinquent filers pursuant to Item 405 of Regulation S-K is not contained herein, and will not be contained, to the best of the registrant's knowledge, in definitive proxy or information statements incorporated by reference in Part III of this Form 10-K or any amendment to this Form 10-K. [ ] Indicate by check mark whether the registrant is a large accelerated filer, an accelerated filer, a non-accelerated filer, or a smaller reporting company. See definition of “large accelerated filer” “accelerated filer” and “smaller reporting company” in Rule 12b-2 of the Exchange Act. (Check one): Large accelerated filer X Accelerated filer ___ Non-accelerated filer ___ (Do not check if a smaller reporting company) Smaller reporting company ___ Indicate by check mark whether the Registrant is a shell company (as defined in Rule 12b-2 of the Exchange Act). Yes No X The aggregate market value of the voting stock held by non-affiliates of the registrant as of September 30, 2008, the last business day of the registrant’s most recently completed second fiscal quarter, was $1,837,219,426, based upon the closing sales price of the common stock on that date of $9.69 as reported on The NASDAQ Global Select Market. For purposes of this computation, all executive officers, directors and 10% beneficial owners of the registrant are assumed to be affiliates. Such determination should not be deemed an admission that such officers, directors and beneficial owners are, in fact, affiliates of the registrant. There were 241,968,069 shares of $.01 par value common stock outstanding as of May 15, 2009.
DOCUMENTS INCORPORATED BY REFERENCE
Portions of the definitive Proxy Statement for the Registrant's 2009 Annual Meeting of Shareholders (the “Proxy Statement”) filed pursuant to Regulation 14A are incorporated by reference in Part III.
2 2
COMPUWARE CORPORATION AND SUBSIDIARIES FORM 10-K
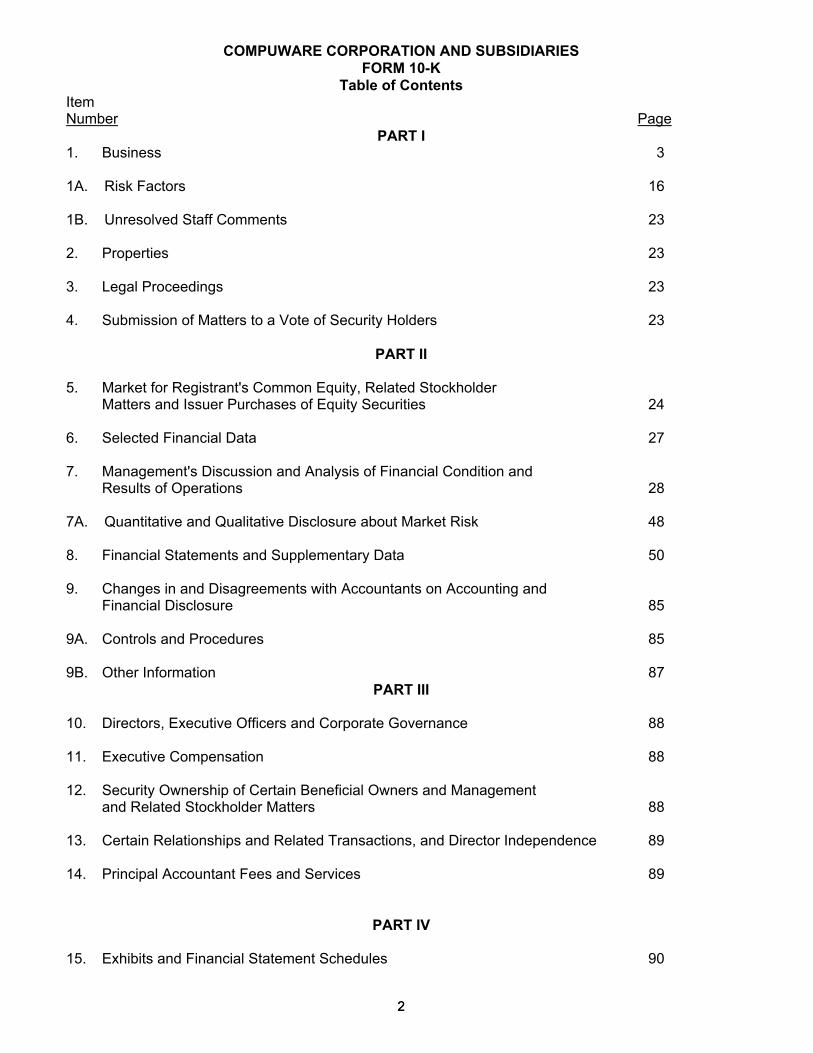
Table of Contents Item Number Page
PART I 1. Business 3 1A. Risk Factors 16 1B. Unresolved Staff Comments 23 2. Properties 23 3. Legal Proceedings 23 4. Submission of Matters to a Vote of Security Holders 23
PART II
5. Market for Registrant's Common Equity, Related Stockholder Matters and Issuer Purchases of Equity Securities 24 6. Selected Financial Data 27 7. Management's Discussion and Analysis of Financial Condition and Results of Operations 28 7A. Quantitative and Qualitative Disclosure about Market Risk 48 8. Financial Statements and Supplementary Data 50 9. Changes in and Disagreements with Accountants on Accounting and Financial Disclosure 85 9A. Controls and Procedures 85 9B. Other Information 87
PART III
10. Directors, Executive Officers and Corporate Governance 88 11. Executive Compensation 88 12. Security Ownership of Certain Beneficial Owners and Management and Related Stockholder Matters 88 13. Certain Relationships and Related Transactions, and Director Independence 89 14. Principal Accountant Fees and Services 89
PART IV
15. Exhibits and Financial Statement Schedules 90
3 3
PART I
ITEM 1. BUSINESS We deliver value to businesses worldwide by providing software products, professional services and application services that improve the performance of information technology (“IT”) organizations. Originally founded in 1973 as a professional services company, we began to offer mainframe productivity tools for fault diagnosis, file and data management, and application debugging in the late 1970's. In the 1990's, IT moved toward distributed and web-based platforms. Our solutions portfolio grew in response, and we now market a comprehensive portfolio of IT solutions across the full range of enterprise computing platforms that help: • Develop and deliver high quality, high performance enterprise business applications in a timely and
cost-effective manner.
• Measure, manage and communicate application service in business terms, and maintain consistent, high levels of service delivery.
• Provide executive visibility, decision support and process automation across the entire IT
organization to enable all available resources to be harnessed in alignment with business priorities. Additionally, to be competitive in today’s global economy, enterprises must securely share applications, information and business processes. We address this market need through our application services, which are marketed under the brand name “Covisint”. Our application services offerings provide a software-as-a-service platform that enables industries and business communities to securely integrate vital information and processes across users, business partners, customers, vendors and suppliers. We operate in three business segments in the software and technology services industries: products, professional services and application services (see Note 13 of the Notes to Consolidated Financial Statements, included in Item 8 of this report). For a discussion of developments in our business during fiscal 2009, see Item 7, Management’s Discussion and Analysis of Financial Condition and Results of Operations. We were incorporated in Michigan in 1973. Our executive offices are located at One Campus Martius, Detroit, Michigan 48226-5099, and our telephone number is (313) 227-7300. Our Internet address is www.compuware.com. We make available in the investor relations section of our external web site, our Codes of Conduct and our Board committee charters, as well as copies of reports we file with the Securities and Exchange Commission as soon as reasonably practicable after we electronically file such reports. The information contained on our web site should not be considered part of this report. This report contains certain forward-looking statements within the meaning of the federal securities laws. When we use words such as “may”, “might”, “will”, “should”, “believe”, “expect”, “anticipate”, “estimate”, “continue”, “predict”, “forecast”, “projected”, “intend” or similar expressions, or make statements regarding our future plans, objectives or expectations, we are making forward-looking statements. Numerous important factors, risks and uncertainties affect our operating results, including, without limitation, those discussed in Item 1A. Risk Factors and elsewhere in this report, and could cause actual results to differ materially from the results implied by these or any other forward-looking statements made by us, or on our behalf. There can be no assurance that future results will meet expectations. While we believe that our forward-looking statements are reasonable, you should not place undue reliance on any such forward-looking statements, which speak only as of the date made. Except as required by applicable law, we do not undertake any obligation to publicly release any

4 4
revisions which may be made to any forward-looking statements to reflect events or circumstances occurring after the date of this report. OUR BUSINESS STRATEGY Our business strategy is to focus on providing software, professional services and application services that deliver value to the largest users of information technology in the world. Our enterprise IT solutions are focused on providing a real return on investment for our clients by increasing the performance of the entire IT organization and enabling IT management to deliver maximum business impact in support of the organization’s strategic objectives. Specifically, during fiscal 2009 we advanced our Compuware 2.0 initiative with our determination to focus our software business strategy on delivering superior end-to-end application performance, which we call Business Service Delivery, to capitalize on our market leadership position in end-to-end application performance to meet the growing and ever-more critical demand that applications deliver value back to the business. Compuware’s Business Service Delivery approach enables IT to move from a reactive and operations-oriented approach to one that is proactive and business-driven across both the distributed and mainframe environments. The divestiture of the Quality and DevPartner software products is a key part of the initiative to focus the software business on Business Service Delivery. In addition, we advanced our Application Service business strategy with an increased focus on the healthcare market while maintaining customer satisfaction in the automotive industry. This focus resulted in several new key customer agreements, including one to provide the VIP Health Initiative with a collaborative network for the secure sharing of sensitive patient information and improved physician collaboration. Further, we began implementing our strategy to have a smaller, more profitable Professional Services Business. The strategy going forward will be to focus on engagements where we can provide value that allows us to achieve specified margin targets.
5 5
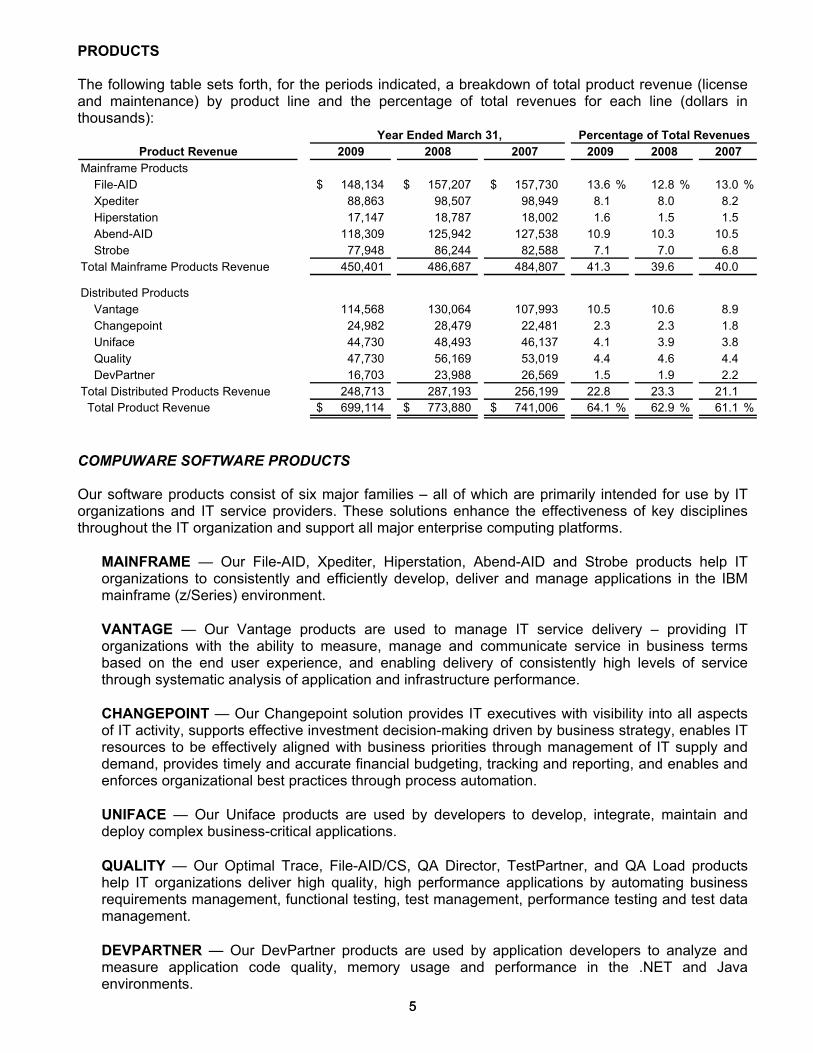
PRODUCTS The following table sets forth, for the periods indicated, a breakdown of total product revenue (license and maintenance) by product line and the percentage of total revenues for each line (dollars in thousands):
Year Ended March 31, Percentage of Total RevenuesProduct Revenue 2009 2008 2007
Mainframe Products File-AID 148,134$ 157,207$ 157,730$ 13.6 % 12.8 % 13.0 % Xpediter 88,863 98,507 98,949 8.1 8.0 8.2 Hiperstation 17,147 18,787 18,002 1.6 1.5 1.5 Abend-AID 118,309 125,942 127,538 10.9 10.3 10.5 Strobe 77,948 86,244 82,588 7.1 7.0 6.8Total Mainframe Products Revenue 450,401 486,687 484,807 41.3 39.6 40.0
Distributed Products Vantage 114,568 130,064 107,993 10.5 10.6 8.9 Changepoint 24,982 28,479 22,481 2.3 2.3 1.8 Uniface 44,730 48,493 46,137 4.1 3.9 3.8 Quality 47,730 56,169 53,019 4.4 4.6 4.4 DevPartner 16,703 23,988 26,569 1.5 1.9 2.2Total Distributed Products Revenue 248,713 287,193 256,199 22.8 23.3 21.1 Total Product Revenue 699,114$ 773,880$ 741,006$ 64.1 % 62.9 % 61.1 %
2009 2008 2007
COMPUWARE SOFTWARE PRODUCTS Our software products consist of six major families – all of which are primarily intended for use by IT organizations and IT service providers. These solutions enhance the effectiveness of key disciplines throughout the IT organization and support all major enterprise computing platforms.
MAINFRAME — Our File-AID, Xpediter, Hiperstation, Abend-AID and Strobe products help IT organizations to consistently and efficiently develop, deliver and manage applications in the IBM mainframe (z/Series) environment.
VANTAGE — Our Vantage products are used to manage IT service delivery – providing IT organizations with the ability to measure, manage and communicate service in business terms based on the end user experience, and enabling delivery of consistently high levels of service through systematic analysis of application and infrastructure performance.
CHANGEPOINT — Our Changepoint solution provides IT executives with visibility into all aspects of IT activity, supports effective investment decision-making driven by business strategy, enables IT resources to be effectively aligned with business priorities through management of IT supply and demand, provides timely and accurate financial budgeting, tracking and reporting, and enables and enforces organizational best practices through process automation.
UNIFACE — Our Uniface products are used by developers to develop, integrate, maintain and deploy complex business-critical applications. QUALITY — Our Optimal Trace, File-AID/CS, QA Director, TestPartner, and QA Load products help IT organizations deliver high quality, high performance applications by automating business requirements management, functional testing, test management, performance testing and test data management. DEVPARTNER — Our DevPartner products are used by application developers to analyze and measure application code quality, memory usage and performance in the .NET and Java environments.

6 6
In May 2009, we entered into an asset purchase agreement with Micro Focus International PLC to sell all rights to the proprietary software products and other technologies associated with the Quality and DevPartner distributed product lines (other than File-AID/CS). The transaction is expected to close in June 2009. For additional details, see Note 3 of the Notes to Consolidated Financial Statements, included in Item 8 of this report. MAINFRAME MARKET The market for mainframe products is well-defined and the drive to extend legacy applications into distributed environments continues to underscore the need for reliable, high-volume mainframe processing. We intend to remain focused on developing, marketing and supporting high-quality software products, both to support traditional uses of the mainframe and to enable IT organizations to rationalize, modernize and extend their legacy application portfolios. In addition, we will enhance product integration and build new graphical user interfaces to increase the value that our customers obtain from the use of our products, to enhance the synergy among the functional groups working on key business applications and to make IT processes more streamlined, automated and repeatable. Mainframe Software Products Our mainframe software products (“mainframe products”) focus on improving the productivity of development, maintenance and support teams in application analysis, testing, defect detection and remediation, fault management, file and data management, data security and application service management in the IBM z/OS environment. We believe that these products will remain among the industry’s leading solutions for this platform. Our mainframe products are functionally rich, are focused on customer needs and are easy to install, while requiring minimal user training. We strive to ensure a common look and feel across our products and emphasize ease of use in all aspects of product design and functionality. Most products can be used immediately without modification of customer development practices and standards. These products can be quickly integrated into day-to-day testing, debugging and maintenance activities. Our mainframe products are grouped into five product families: File-AID, Xpediter, Hiperstation, Abend-AID and Strobe.
File-AID
File-AID products provide a consistent, familiar and secure method for IT professionals to access, analyze, edit, compare, move and transform data across all strategic environments. File-AID products are used to quickly resolve production data problems and manage ongoing changes to data and databases at any stage of the application life cycle, including building test data environments to provide the right data in the shortest time. The File-AID product family can also be used to address data privacy requirements in preproduction test environments.
Xpediter
Xpediter interactive debugging products help developers integrate enterprise applications, build new applications and modernize and extend their legacy applications, satisfying corporate scalability, reliability and security requirements. Xpediter products deliver powerful analysis and testing capabilities across multiple environments, helping developers test more accurately and reliably, in less time.

7 7
Hiperstation
Hiperstation products deliver complete preproduction testing functionality for automating test creation and execution, test results analysis and documentation. Hiperstation also provides application auditing capabilities to address regulatory compliance and other business requirements. The products simulate the on-line systems environment, allowing programmers to test applications under production conditions without requiring actual users at terminals. The products’ powerful functions and features enhance unit, concurrency, integration, migration, capacity, regression and stress testing. When deployed in production, Hiperstation products allow scalable logging of application transactions and provide audit reporting to aid in problem resolution and to support other uses of the captured transaction information such as analysis of security breaches.
Abend-AID
Abend-AID products enable IT professionals to quickly diagnose and resolve application and system failures. The products automatically collect program and environmental information, analyze the information and present diagnostic and supporting data in a way that can be easily understood by all levels of IT staff. Automated failure notification helps speed problem resolution and reduce downtime.
Strobe
Strobe and iStrobe products work together to help customers locate and eliminate sources of excessive resource demands during every phase of an application’s life cycle. Strobe products measure the activity of z/OS-based online and batch applications, providing reports on where and how time is spent during execution. Strobe products support an extensive array of subsystems, databases and languages. These products can be applied via a systematic program to reduce the consumption of mainframe resources and reduce associated costs and/or make resources available for additional business workloads.
DISTRIBUTED MARKET In contrast to the mainframe market, the distributed market is characterized by multiple hardware, software and network configurations. Combined with the more recent push to provide enhanced versatility through service-oriented architectures, IT organizations are challenged to combine agility, cost effectiveness and control in developing and delivering reliable, scalable and high quality enterprise applications that meet business needs, while facing an exponential increase in environment complexity. We believe our distributed products address these challenges and that we are emerging as a premier provider of business service management and IT portfolio management solutions to enterprise IT organizations. Distributed Software Products Our distributed software products (“distributed products”) focus on maximizing the performance of the entire IT organization, including applications and operations organizations, as well as enabling top-level IT management decision-making. These products provide for an effective application delivery discipline from requirements definition and management, through application development and quality and performance assurance. They support service delivery through comprehensive service management capabilities encompassing business service management, end-user experience monitoring, and application performance management. They also support business-centric IT management through comprehensive IT portfolio management; enabling investment prioritization driven by business strategy, portfolio-driven management decision making, effective visibility and control over IT supply and demand, and value transparency back to line-of-business management.

8 8
Our strategy for distributed products is to focus on Business Service Delivery. Compuware’s Business Service Delivery approach enables IT to move from a reactive and operations-oriented approach to one that is proactive and business-driven. Compuware Business Service Delivery solutions ensure that applications are available, performing, and meet the needs of end users; that problems are proactively detected and resolved; that application investments are aligned with business priorities; and that IT is able to define and understand a view of service that matter most to the business. Our distributed products are grouped into five product lines: Vantage, Changepoint, Uniface, Quality, and DevPartner.
Vantage
The Vantage family of IT service management products enables business-driven service delivery by combining End User Experience Monitoring, Business Service Management and Application Performance Management with infrastructure and service desk metrics. Compuware’s Business Service Delivery approach enables IT to move from a reactive and operations-oriented approach to one that is proactive and business-driven.
End User Experience Monitoring ("EUEM") - Provides visibility into application service from the end user perspective. This enables proactive IT service management by allowing IT organizations to monitor all applications all the time. EUEM also puts application performance in context of key business entities: applications, users and locations. With this perspective, EUEM helps IT organizations assess the scope of a performance problem and isolate it to the client, network, server or application tier in order to assign the right expert to the job.
Business Service Management (“BSM”) - Provides real-time views of IT service delivery so that Chief Information Officers (“CIOs”), IT managers and line-of-business counterparts can understand the impact that IT services have on business operations. As a result, BSM helps the customer communicate service delivery more effectively, meet service level agreements, improve operational efficiency, reduce costs and increase satisfaction with the IT organization. BSM also enhances collaboration both within the IT organization as well as between the IT organization and the business by centralizing and correlating technical and business key performance indicators.
Application Performance Management (“APM”) - Provides detailed application insight that identifies and helps correct the causes of poor application performance within client workstations, the network, a server or the application itself, reducing time-consuming guesswork. In addition, APM helps ensure successful application rollouts and provides crucial information for establishing and meeting service requirements. Changepoint
Changepoint provides business management capabilities for CIOs and IT organizations as well as for the IT professional services organizations that serve them. Accordingly, there are two versions of the Changepoint solution – Changepoint and Changepoint PSA (Professional Services Automation). Changepoint provides CIOs and IT managers with critical insight into IT project and non-project activity, strategic and operational demand and resource allocation and availability, enabling portfolio-driven decision-making aligned with business strategy. Changepoint automates core IT business processes to reduce costs and increase efficiency and quality. It provides a sound financial framework that enables IT leadership to communicate value delivered to the business for every dollar of IT expenditure. Portfolio management capabilities enable integrated management of all IT investments and resources. Changepoint supports project, application and investment planning portfolios, so that organizations can prioritize and manage the investments that best support business goals, even as business conditions and market requirements change.
9 9
Changepoint PSA provides total visibility into the performance of an IT professional services organization from detailed analyses of the performance of engagements, projects and customers to higher level views of workgroups, the sales pipeline, engagements, project portfolios and financial projections. A configurable management portal enables the consolidation of business-critical information from Changepoint PSA, as well as other critical business systems.
Uniface
Uniface is our SOA (Service Oriented Architecture) based Application Platform Suite. With Uniface, developers can develop, integrate, maintain and deploy complex business-critical applications. Uniface combines the following three development techniques into one integrated tool:
• Component based development, to develop individual components that will eventually become uniquely designated business services. This is mostly done in web-based environments.
• Process-driven design and development to create, orchestrate, monitor and tune the business flows needed to activate and execute the services.
• Legacy integration facilities to preserve as many legacy assets as possible, maximizing the
return on investment and eliminating redevelopment risks. Uniface is available on a wide variety of deployment platforms including Windows, Unix, Web, Mainframe and Mobile computers. Quality Our Quality family of products delivers a full spectrum of automated testing capabilities designed to validate applications running across various distributed environments, isolate and correct problems and ensure that applications will meet performance requirements before they are deployed in production. The Quality products, except for File-AID/Client Server (“FA/CS”), are to be divested during the first quarter of fiscal 2010 as discussed in Note 3 of the Notes to Consolidated Financial Statements, included in Item 8 of this report. FA/CS is a comprehensive test data management product that allows quality assurance teams to more efficiently reuse test cases with different test data enabling repeatable and consistent testing.
DevPartner
The DevPartner Studio family of products provides analysis, automation and metrics to help application delivery teams build reliable, high-performance applications and components for Microsoft.NET. These products provide code, memory and performance analysis and measure testing code coverage. This yields a rich set of quality, performance and security metrics to enable critical business capabilities to be efficiently built into applications during the construction phase, rather than during the testing phase of application delivery. The DevPartner products are to be divested during the first quarter of fiscal 2010 as discussed in Note 3 of the Notes to Consolidated Financial Statements, included in Item 8 of this report.

10 10
SEASONALITY We tend to experience a higher volume of product transactions and associated license revenue in the quarter ended December 31, which is our third fiscal quarter, and the quarter ended March 31, which is our fourth fiscal quarter, as a result of customer spending patterns. We did not experience this pattern in fiscal 2009 which we believe was due to macro economic events in the second half of our fiscal year affecting demand for our products. SOFTWARE LICENSING, PRODUCT MAINTENANCE AND CUSTOMER SUPPORT We license software to customers using two types of software licenses, perpetual and term. Generally, perpetual software licenses allow customers a perpetual right to run our software on hardware up to a licensed aggregate MIPS (Millions of Instructions Per Second) capacity or to run our distributed software for a specified number of users or servers. Term licenses allow customers a right to run our software for a limited period of time on hardware up to a licensed aggregate MIPS capacity or for a specific number of users or servers. We also offer perpetual or term license rights that allow our customers a right to run our mainframe software on hardware with an unlimited MIPS capacity. Also, our customers purchase maintenance and support services that provide technical support and advice, including problem resolution services and assistance in product installation, error corrections and any product enhancements released during the maintenance period. Maintenance and support services are provided online, through our FrontLine technical support web site, by telephone access to technical personnel located in our development labs and by support personnel in the offices of our foreign subsidiaries and distributors. Licensees have the option of renewing their maintenance agreements on an annual or multi-year basis for an annual fee based on the license price of the product. We also enter into agreements with our customers that allow them to license software and purchase multiple years of maintenance in a single transaction (multi-year transactions). In support of these multi-year transactions, we allow extended payment terms to qualifying customers. We believe that effective support of our customers and products during both the trial period and for the maintenance term is a substantial factor in product satisfaction and subsequent new product sales. We believe our installed base is a significant asset and intend to continue to provide customer support and product enhancements to ensure a continuing high level of customer satisfaction. In fiscal years 2009, 2008, and 2007, we experienced high customer maintenance renewal rates. For fiscal years 2009, 2008, and 2007, software license fees represented approximately 20.1%, 24.2% and 23.4%, respectively, and maintenance fees represented approximately 44.0%, 38.7% and 37.7%, respectively, of our total revenues. TECHNOLOGY DEVELOPMENT AND SUPPORT We have been successful in developing acquired products and technologies into marketable software. We believe that our future growth lies in part in continuing to identify promising technologies from all potential sources, including independent software developers, customers, other companies and internal research and development. As of March 31, 2009, product development is performed primarily at our headquarters in Detroit, Michigan; and at our development labs in Amsterdam, The Netherlands; Gdansk, Poland; and Toronto, Canada.
11 11
Total technology development and support costs were $98.8 million, $113.7 million, and $135.5 million during fiscal 2009, 2008 and 2007, respectively, of which $12.3 million, $12.6 million, and $21.4 million, respectively, were capitalized. PROFESSIONAL SERVICES We offer a broad range of IT services for distributed and mainframe environments. Our offerings include technical staffing, application development, quality assurance, project management and application maintenance. In fiscal 2010, our professional services division will be focused on six practice areas: Governance, Requirements Management, Quality Management, Business Intelligence and Data Management, Architecture and Development and Operations Management. Our Solution Delivery Group within the professional services segment will continue to deliver solutions around our products and work closely with our software products business. For fiscal 2009, 2008 and 2007, professional services segment fees represented approximately 32.7%, 34.1% and 36.4%, respectively, of our total revenue. The strategy for the professional services segment in fiscal 2010 is to focus on selling higher margin services and exit low margin accounts. We believe that the demand for professional services will continue to be driven by the need to control costs, the significant level of resources necessary to support complex and rapidly changing hardware, software and communication technologies and the need for a larger technical staff for ongoing maintenance. Our business approach to professional services delivery emphasizes hiring experienced staff, ongoing training, high staff utilization and immediate, productive deployment of new personnel at client locations. Our objective in the professional services division is to create long-term relationships with customers in which our professional staff join with the customer's IT organization to plan, design, program, implement and maintain technology-based solutions that achieve customer business goals. Typically, the professional services staff is integrated with the customer's development team on a specific application or project. Professional services staff work primarily at customer sites or at our professional services offices located throughout North America and Europe. We also have professional services operations in other international locations. In addition, Compuware offers a development center that serves customers looking for flexible, cost-effective and high-quality services delivered remotely from our facility in Montreal, Canada. APPLICATION SERVICES Our application services which are marketed under the brand name “Covisint” provide a software-as-a-service platform that enables industries and business communities to securely integrate vital information and processes across users, business partners, customers, vendors and suppliers. Our services are primarily offered to clients within the automotive and healthcare industries. For fiscal 2009, 2008 and 2007, application services segment fees represented approximately 3.2%, 3.0% and 2.5%, respectively, of our total revenue. Covisint provides a secure, collaborative platform that allows the sharing of information that crosses disparate systems and user communities. By combining centralized identity and access management technologies, advanced portal functionality and global business-to-business messaging services, users can find, access and share information more effectively. For industries and communities of any size, anywhere, Covisint’s collaborative services platform delivers the reliability and security of enterprise applications with the flexibility of a software-as-a-

12 12
service model. Delivered as a service, Covisint extends the capabilities of legacy systems and applications across organizations and communities.
• Covisint provides a portal framework for web-based communications across an organization’s extended enterprise and business communities.
• Covisint provides a robust business to business messaging engine that is capable of receiving
and distributing both structured and unstructured data.
• Covisint enables organizations and communities to implement a unified and leveraged approach to managing digital identities and information security across a wide variety of technologies and organizations. This leveraged approach results in reduced complexity with increased consistency and policy enforcement when sharing information across multiple participants.
CUSTOMERS Our products, professional services and application services are used by the IT departments of a wide variety of commercial and government organizations. We did not have a single customer that accounted for greater than 10% of total revenue during fiscal 2009, 2008 or 2007, or greater than 10% of accounts receivable at March 31, 2009 and 2008. SALES AND MARKETING We market software products and product related professional services primarily through a direct sales force in the United States, Canada, Europe, Japan, Asia-Pacific, Brazil, Mexico and South Africa as well as through independent distributors, giving us a presence in approximately 60 countries. Our sales force also includes an inside sales division which focuses on sales of our distributed product offerings. We market our professional and application services primarily through account managers located in offices throughout North America. This marketing structure enables us to keep abreast of, and respond quickly to, the changing needs of our customers and to call on the actual users of our products and services on a regular basis. COMPETITION The markets for our software products are highly competitive and characterized by continual change and improvement in technology. We consider more than 40 firms to be directly competitive with one or more of our products. These competitors include BMC Software, Inc., Borland Software Corp., CA, Inc., International Business Machines Corporation (“IBM”) and Hewlett-Packard Company. Some of these competitors have substantially greater financial, marketing, recruiting and training resources than we do. The principal competitive factors affecting the market for our software products include: responsiveness to customer needs, functionality, performance, reliability, ease of use, quality of customer support, vendor reputation, distribution channels and price. The distributed software market in which we operate has many more competitors than our traditional mainframe market. Our ability to compete effectively and our growth prospects depend upon many factors, including the success of our existing distributed products, the timely introduction and success of future software products, the ability of our products to interoperate and perform well with existing and future leading databases and other platforms supported by our products and our ability to bring products to market that meet ever-changing customer requirements.
13 13
The market for professional services is highly competitive, fragmented and characterized by low barriers to entry. Our principal competitors in professional services include Accenture Ltd., Computer Sciences Corporation, Electronic Data Systems Corporation, a Hewlett-Packard Company, IBM Global Services, Analysts International Corporation, Keane, Inc., Infosys Technologies, Sun Microsystems, Inc. and numerous other regional and local firms in the markets in which we have professional services offices. Several of these competitors have substantially greater financial, marketing, recruiting and training resources than we do. The principal competitive factors affecting the market for our professional services include responsiveness to customer needs, breadth and depth of technical skills offered, availability and productivity of personnel and the ability to demonstrate achievement of results and price. The market for application services includes communication and collaboration services, user identity and access management services and system to system communications provided in a software-as-a service model. We provide application services primarily in the automotive and healthcare vertical markets (“verticals”). The application services market is competitive in some verticals and highly competitive related to system to system communications. Our principal competitors include Electronic Data Systems Corporation, a Hewlett-Packard Company, IBM Global Services, GXS Strategies, Sterling Commerce and other regional and local firms in the markets in which we have customers or potential customers, particularly in the automotive vertical. In the other verticals served, since the market is not yet fully developed, the competition is not as entrenched but other traditional software companies are beginning to provide offerings in a software-as-a-service model. Some key competitive factors are price, speed of implementation, reduced capital investment, reduced risk related to regulatory compliance and implementation problems, inclusion of state of the art technology features, solution performance and ability to meet customer service level requirements. A variety of external and internal events and circumstances could adversely affect our competitive capacity. Our ability to remain competitive will depend, to a great extent, upon our performance in product development and customer support, effective sales execution and our ability to acquire and integrate new technologies. To be successful in the future, we must respond promptly and effectively to the challenges of technological change and our competitors' innovations by continually enhancing our own products, professional services and application services. PROPRIETARY RIGHTS We regard our products as proprietary trade secrets and confidential information. We rely largely upon a combination of trade secret, copyright and trademark laws together with our license agreements with customers and our internal security systems, confidentiality procedures and employee agreements to maintain the trade secrecy of our products. We typically provide our products to users under nonexclusive, nontransferable, perpetual licenses. Under the general terms and conditions of our standard product license agreement, the licensed software may be used solely for the licensee’s own internal operations. Under certain limited circumstances, we may be required to make source code for our products available to our customers under an escrow agreement, which restricts access to and use of the source code. Although we take steps to protect our trade secrets, there can be no assurance that misappropriation will not occur. In addition, the laws of some foreign countries do not protect our proprietary rights to the same extent as the laws of the United States. In addition to trade secret protection, we seek to protect our software, documentation and other written materials under copyright law, which affords only limited protection. We also assert registered trademark rights in our product names. As of March 31, 2009, we have been granted 43 patents issued in the United States and have 13 patent applications pending with the United States Patent and Trademark Office for certain product technology and have plans to seek additional patents in the future. Once granted, we expect the duration of each patent will be up to 20 years from the effective date of filing of the applications. Our earliest issued patent filing date is fiscal 1992. In addition, we are a party to a patent cross license agreement with IBM under which each party is granted a perpetual, irrevocable, nonexclusive license to each other's patents issued or issuing on certain patent applications entitled to an effective filing date prior to March 21, 2009. Because the industry is
14 14
characterized by rapid technological change, we believe that factors such as the technological and creative skills of our personnel, new product developments, frequent product enhancements, name recognition and reliable product maintenance are more important to establishing and maintaining a technology leadership position than legal protection of our technology. There can be no assurance that third parties will not assert infringement claims against us with respect to current and future products or that any such assertion will not require us to enter into royalty arrangements which could require a payment to the third party upon sale of the product, or result in costly litigation. EMPLOYEES As of March 31, 2009, we employed 5,006 people worldwide, with 1,021 in product sales, sales support and marketing; 1,108 in technology development and support; 1,962 in professional services, 253 in application services and 662 in other general and administrative functions. Only a small number of our employees are represented by labor unions. We have experienced no work stoppages and believe that our relations with our employees are good. Our success will depend in part on our continued ability to attract and retain highly qualified, experienced and talented software developers, professional services staff and sales and marketing personnel. Executive Officers of the Registrant Our current executive officers, which serve at the discretion of our Board of Directors, are listed below: Name Age Position Peter Karmanos, Jr. 66 Chairman of the Board and Chief Executive Officer Robert C. Paul 46 President and Chief Operating Officer Laura L. Fournier 56 Executive Vice President and Chief Financial Officer Paul A. Czarnik 53 Chief Technology Officer Denise A. Knobblock Starr 54 Executive Vice President and Chief Administrative Officer Daniel S. Follis, Jr. 43 Vice President, General Counsel and Secretary
Peter Karmanos, Jr., is a founder of the Company and has served as Chairman of the Board since November 1978, as Chief Executive Officer since July 1987 and as President from January 1992 through October 1994 and October 2003 through March 2008. Robert C. Paul has served as President and Chief Operating Officer of Compuware since April 2008. Prior to that time, Mr. Paul was President and Chief Operating Officer of Compuware Covisint since its acquisition by Compuware in March 2004. Mr. Paul had spent nearly three years at Covisint prior to the acquisition. Laura L. Fournier has served as Executive Vice President since April 2008 and continues to serve as Chief Financial Officer since April 1998. Ms. Fournier was Corporate Controller from June 1995 through March 1998. From February 1990 through May 1995, Ms. Fournier was Director of Internal Audit. Paul A. Czarnik has served as Chief Technology Officer since December 2008. Prior to that time, Mr. Czarnik held numerous management positions in the Technology Department, including Senior Vice President of Technology from April 2008 through December 2008 and Vice President of Product Architecture from April 2002 through March 2008. Mr. Czarnik joined Compuware in 1981 as a Professional Services Consultant.

15 15
Denise A. Knobblock Starr has served as Executive Vice President of Administration since April 2002 and as Chief Administrative Officer since April 2007. Ms. Knobblock Starr was Executive Vice President of Human Resources and Administration from April 1998 through March 2002. From April 1995 through March 1998, she was Senior Vice President of Purchasing, Facilities, Administration and Travel. Ms. Knobblock Starr served as the Director of Administration and Facilities from April 1991 to March 1995. She joined Compuware in January 1989 as Manager of Administration and Facilities. Daniel S. Follis, Jr. has served as Vice President, General Counsel and Secretary since March 2008. From January 2006 through February 2008, he served as Vice President, Associate General Counsel. Mr. Follis joined Compuware in March 1998 as Senior Counsel. SEGMENT INFORMATION, PAYMENT TERMS AND FOREIGN REVENUES For a description of revenues and operating profit by segment and for financial information regarding geographic operations for each of the last three fiscal years, see Note 13 of the Notes to Consolidated Financial Statements, included in Item 8 of this report. For a description of extended payment terms offered to some customers, see Note 1 of the Notes to Consolidated Financial Statements, included in Item 8 of this report. The Company’s foreign operations are subject to risks related to foreign exchange rates and other risks. For a discussion of risks associated with our foreign operations, see Item 1A. Risk Factors and Item 7A. Quantitative and Qualitative Disclosure about Market Risk.
16 16
ITEM 1A. RISK FACTORS An investment in our common stock is subject to risks inherent to our business. The material risks and uncertainties that we believe affect us are described below. The risks and uncertainties described below are not the only ones we face. Additional risks and uncertainties that we are not aware of or focused on or that we currently deem immaterial may also impair business operations. This report is qualified in its entirety by these risk factors. If any of the following risks actually occur, our financial condition and results of operations could be materially and adversely affected. If this were to happen, the value of our common stock could decline significantly, and shareholders could lose all or part of their investment. The majority of our software products revenue is dependent on our customers’ continued use of IBM and IBM-compatible products. The majority of our revenue from software products is generated from products designed for use with IBM and IBM-compatible mainframe computers. As a result, the majority of our revenue from software products is dependent on our customers’ continued use of IBM and IBM-compatible mainframe products. In addition, because our products operate in conjunction with IBM systems software, changes to IBM systems software may require us to adapt our products to these changes. An inability to do so, or any delay in doing so, may adversely affect our operating results. Our software product revenue is dependent on the acceptance of our pricing structure for software licenses and maintenance. The pricing of our software licenses and maintenance is under constant pressure from customers and competitive vendors that can negatively impact our software product revenue. These competitive pressures may have a negative effect on our results of operations and cash flows. Our strategy of packaging distributed products and services as a single offering may not be accepted by our customers, negatively impacting our revenue. We offer bundled product and service arrangements to ensure our customers receive the full value of our products. There can be no assurance that customers will accept these packages. As a result, this may decrease our sales volume and have a negative effect on our results of operations and cash flows. We may fail to achieve our forecasted financial results due to inaccurate sales forecasts or other factors. If we fail to meet the expectations of analysts or investors, our stock price could decline substantially. Our revenues, and particularly our software license revenues, are difficult to forecast, and as a result, our actual financial results can vary substantially from our forecasted results. Our sales personnel monitor the status of all proposals and estimate when a customer will make a purchase decision and the dollar amount of the sale. These estimates are aggregated periodically to generate the sales forecast. Our sales forecast estimates can prove to be unreliable both in a particular quarter and over a longer period of time. Any significant shortfall in revenues or earnings or lowered expectations could cause our common stock price to decline. Our quarterly financial results vary and may be adversely affected by a number of unpredictable factors. We typically do not have a material backlog of unfilled orders, and revenues in any quarter are substantially dependent on orders booked in the quarter. A significant amount of our transactions are completed during the final weeks and days of the quarter, and therefore we generally do not know whether revenues or earnings will have met expectations until after the end of the quarter. Our customers license our products under varying structures some of which require revenues to be deferred or recognized ratably over time. Changes in the mix of customer agreements could adversely affect revenue in a quarter. Investors should not rely on the results of prior periods or on historical seasonality in license revenue as an indication of our future performance. Our operating expense levels are relatively fixed in the

17 17
short-term and are based, in part, on our expectations of future revenue. If we have unanticipated lower sales in any given quarter, we will not be able to reduce our operating expenses for that quarter proportionately in response. Therefore, net income may be disproportionately affected by a fluctuation in revenue. The continuing weakening in the United States and global economies may reduce demand for our software products, professional services and application services, which may negatively affect our revenues and operating results. Our revenues and profitability depend on the overall demand for our software products, professional services and application services. Regional and global economic change and uncertainty have resulted in companies reassessing their spending for technology projects. If the current weak business climate within the United States and/or other geographic regions in which we operate continues or further deteriorates, it could have a negative impact on our revenue and operating results. If we are not successful in implementing our professional services strategy, our operating margins may decline. Our business strategy in 2010 for the professional services segment is to focus on improving the operating margins of the segment and exiting low-margin accounts. We have set certain margin thresholds for all new business and continue to focus on improving the margin. If our customers will not accept the higher billing rates necessary to achieve these minimum thresholds, our revenues and margins could be negatively impacted. The continuation of the decline in the U.S. domestic automotive manufacturing business could adversely affect our professional services and application services businesses. A substantial portion of our worldwide professional services revenue, which includes the professional services segment and the application services segment, has been generated from customers in the automotive industry, with General Motors Company currently being our largest customer. Many of our customers in the domestic automotive industry are engaged in restructuring and other efforts to cut costs, including IT expenditures. Further negative developments in this industry, including bankruptcy, could reduce the demand for our services and increase the collection risk of accounts receivables from these customers, which would have a negative impact on our professional and application services revenue and margins. If the fair value of our long-lived assets deteriorated below their carrying value, recognition of an impairment loss would be required, which would adversely affect our financial results. We evaluate our long-lived assets, including property and equipment, goodwill, acquired product rights and other intangible assets, whenever events or circumstances occur which indicate that these assets might be impaired or periodically as required by generally accepted accounting principles. In the continuing process of evaluating the recoverability of the carrying amount of our long-lived assets, there is the possibility that we could identify a substantial impairment, which could adversely affect our financial results. In particular, if the professional services segment’s profitability assumptions are not attained, an impairment of some or all of the $140.4 million of goodwill related to the professional services segment at March 31, 2009 may be recorded in the future as a non-cash charge to earnings in the period the carrying value exceeds fair value. Such a change would likely have a material adverse effect on our results of operations for the relevant period. Our software and technology may infringe the proprietary rights of others. Our software products are developed or enhanced internally or acquired through acquisitions. All employees sign an agreement that states the employee was hired for his or her talent and skill rather than for any trade secrets or proprietary information of others of which he or she may have knowledge. Further, our employees execute an agreement stating that work developed for us or our clients belongs to us or our clients, respectively.
18 18
During the due diligence stage of any software acquisition, we research and investigate the title to the software we will be acquiring from the seller. This investigation generally includes without limitation, litigation searches, copyright and trademark searches, review of development documents and interviews with key employees of the seller regarding development, title and ownership of the software products being acquired. The acquisition document itself generally contains representations, warranties and covenants concerning the title and ownership of the software products as well as indemnification and remedy provisions in the event the representations, warranties and covenants are breached by the seller. Although we use all reasonable efforts to ensure we do not infringe on third party intellectual property rights, there can be no assurance that third parties will not assert infringement claims against us with respect to current and future products or that any such assertion will not require us to enter into royalty arrangements or result in costly litigation. Our results could be adversely affected if our operating margin or operating margin percentage decline. Our distributed software and application services businesses have a lower operating margin percentage than our mainframe business. The growth of our distributed software and application services could result in a lower operating margin percentage for Compuware as a whole. In addition, if the mainframe business experiences a decline in revenue or operating margin percentage, our operating margin or operating margin percentage may decline. Our results could be adversely affected by increased competition, pricing pressures and technological changes. The markets for our software products are highly competitive. We consider over 40 firms to be directly competitive with one or more of our products. Our competitors include, among others, BMC Software, Inc., Borland Software Corp., Hewlett-Packard Company, CA, Inc. and IBM. The principal competitive factors affecting the market for our software products include: responsiveness to customer needs, functionality, performance, reliability, ease of use, quality of customer support, sales channels, vendor reputation and price. A variety of external and internal events and circumstances could adversely affect our competitive capacity. Our ability to remain competitive will depend, to a great extent, upon our performance in sales, product development and customer support. To be successful in the future, we must respond promptly and effectively to our customers’ purchasing methodologies, challenges of technological change and our competitors' innovations by continually enhancing our product offerings. We operate in an industry characterized by rapid technological change, evolving industry standards, changes in customer requirements and frequent new product introductions and enhancements. If we fail to keep pace with technological change in our industry, such failure would have an adverse effect on our revenues. During the past several years, many new technological advancements and competing products entered the marketplace. To the extent that our current product portfolio does not meet such changing requirements, our revenues will suffer. Delays in new product introductions or less-than-anticipated market acceptance of these new products are possible and would have an adverse effect on our revenues. Developers of third party products, including operating systems, databases, systems software, applications, networks, servers and computer hardware, frequently introduce new or modified products. These new or modified third party products could incorporate features which perform functions currently performed by our products or could require substantial modification of our products to maintain compatibility with these companies’ hardware or software. While we have generally been able to adapt our products and our business to changes introduced by new or modified third party product offerings, there can be no assurance that we will be able to do so in the future. Failure to adapt our products in a timely manner to such changes or customer decisions to forego the use of our products in favor of those with comparable functionality contained either in the hardware or other software could have a material adverse effect on our business, financial condition and operating results.

19 19
The market for professional services is highly competitive, fragmented and characterized by low barriers to entry. Our principal competitors in professional services include, among others, Accenture Ltd., Computer Sciences Corporation, Electronic Data Systems Corporation; a Hewlett-Packard Company, IBM Global Services, Analysts International Corporation, Keane, Inc., Infosys Technologies, Sun Microsystems, Inc. and numerous other regional and local firms in the markets in which we have professional services offices. Several of these competitors have substantially greater financial, marketing, recruiting and training resources than we do. The principal competitive factors affecting the market for our professional services include responsiveness to customer needs, breadth and depth of technical skills offered, availability and productivity of personnel, ability to demonstrate achievement of results and price. There is no assurance that we will be able to compete successfully in the future. The market for application services is in its early stages with emerging competitors. As the market matures, competition may increase and could have a negative impact on our results of operations. Our principal competitors in application services include Electronic Data Systems Corporation; a Hewlett-Packard Company, IBM Global Services, GXS Strategies, Sterling Commerce and other regional and local firms in the markets in which we have customers or potential customers. Several of these competitors have substantially greater financial, marketing, recruiting and training resources than we do. The principal competitive factors affecting the market for application services are price, speed of implementation, reduced risk related to regulatory compliance and implementation problems, inclusion of state of the art technology features, solution performance and ability to meet customer service level requirements. There is no assurance that we will be able to compete successfully in the future. We must develop or acquire product enhancements and new products to succeed. Our success depends in part on our ability to develop product enhancements and new products that keep pace with continuing changes in technology and customer preferences. The majority of our products have been developed from acquired technology and products. We believe that our future growth lies, in part, in continuing to identify, acquire and then develop promising technologies and products. While we are continually searching for acquisition opportunities, there can be no assurance that we will continue to be successful in identifying, acquiring and developing products and technology. If any potential acquisition opportunities are identified, there can be no assurance that we will consummate and successfully integrate any such acquisitions and there can be no assurance as to the timing or effect on our business of any such acquisitions. Our failure to develop technological improvements or to adapt our products to technological change may, over time, have a material adverse effect on our business. Acquisitions may be difficult to integrate, disrupt our business or divert the attention of our management and may result in financial results that are different than expected. As part of our overall strategy, we have acquired or invested in, and plan to continue to acquire or invest in, complementary companies, products, and technologies and may enter into joint ventures and strategic alliances with other companies. Risks commonly encountered in such transactions include: the difficulty of assimilating the operations and personnel of the combined companies; the risk that we may not be able to integrate the acquired technologies or products with our current products and technologies; the potential disruption of our ongoing business; the inability to retain key technical, sales and managerial personnel; the inability of management to maximize our financial and strategic position through the successful integration of acquired businesses; the risk that revenues from acquired companies, products and technologies do not meet our expectations; and decreases in reported earnings as a result of charges for in-process research and development and amortization of acquired intangible assets. For us to maximize the return on some of our investments in acquired companies, the products of these entities must be integrated with our existing products. These integrations can be difficult and unpredictable, especially given the complexity of software and that acquired technology is typically developed independently and designed with no regard to integration. The difficulties are compounded when the products involved are well-established because compatibility with the existing base of
20 20
installed products must be preserved. Successful integration also requires coordination of different development and engineering teams. This too can be difficult and unpredictable because of possible cultural conflicts and different opinions on technical decisions and product roadmaps. There can be no assurance that we will be successful in our product integration efforts or that we will realize the expected benefits. With each of our acquisitions, we have initiated efforts to integrate the disparate cultures, employees, systems and products of these companies. Retention of key employees is critical to ensure the continued development, support, sales and marketing efforts pertaining to the acquired products. We have implemented retention programs to keep many of the key technical and sales employees of acquired companies; nonetheless, we have lost some key employees and may lose others in the future. The divestiture of our Quality and DevPartner product families may cause a reduction in customer satisfaction, which could adversely affect our revenues and results of operations. We have reached an agreement to divest our Quality and DevPartner distributed product families to an affiliate of Micro Focus International PLC (see Note 3 of the Notes to Consolidated Financial Statements, included in Item 8 of this report). Current Quality and DevPartner customers who also license other Compuware products may not be satisfied with us divesting these products which could affect our relationship with these customers and adversely affect our revenues and results of operations. We are exposed to exchange rate risks on foreign currencies and to other international risks that may adversely affect our business and results of operations. Over one-third of our total revenues are derived from foreign operations and we expect that foreign operations will continue to generate a significant percentage of our total revenues. Products are generally priced in the currency of the country in which they are sold. Changes in the exchange rates of foreign currencies or exchange controls may adversely affect our results of operations. The international business is also subject to other risks, including the need to comply with foreign and U.S. laws and the greater difficulty of managing business overseas. In addition, our foreign operations are affected by general economic conditions in the international markets in which we do business. A worsening of economic conditions in these markets could cause customers to delay or forego decisions to license new products or to reduce their requirements for professional and application services. Current laws may not adequately protect our proprietary rights. We regard our software as proprietary and attempt to protect it with copyrights, trademarks, trade secret laws and/or restrictions on disclosure, copying and transferring title. Despite these precautions, it may be possible for unauthorized third parties to copy certain portions of our products or to obtain and use information that we regard as proprietary. We have many patents and many patent applications pending. However, existing patent and copyright laws afford only limited practical protection. In addition, the laws of some foreign countries do not protect our proprietary rights to the same extent as the laws of the United States. Any claims against those who infringe on our proprietary rights can be time consuming and expensive to prosecute, and there can be no assurance that we would be successful in protecting our rights despite significant expenditures. The loss of certain key employees and technical personnel or our inability to hire additional qualified personnel could have a material adverse effect on our business. Our success depends in part upon the continued service of our key senior management and technical personnel. Such personnel are employed at-will and may leave Compuware at any time. Our success also depends on our continuing ability to attract and retain highly qualified technical, managerial and sales personnel. The market for professional services and software products personnel has historically been, and we expect that it will continue to be, intensely competitive. There can be no assurance that we will continue to be successful in attracting or retaining such personnel. The loss of certain key employees or our inability to attract and retain other qualified employees could have a material adverse effect on our business.
21 21
Maintenance revenue could decline. Maintenance revenues have increased in recent years as a result of continuing growth in the base of installed products and the processing capacity on which they run. Maintenance fees increase as we sell new products or additional capacity to customers. Declines in our license bookings, increased customer cancellations or currency fluctuations could lead to declines in our maintenance revenues. Unanticipated changes in our operating results or effective tax rates, or exposure to additional income tax liabilities, could affect our profitability. We are subject to income taxes in both the United States and numerous foreign jurisdictions. Significant judgment is required in determining our worldwide provision for income taxes. One of the components that needs to be evaluated is the realization of our deferred tax assets. We must assess the likelihood that our deferred tax assets will be recovered from future taxable income and, to the extent we believe that recovery is not likely, we must establish a valuation allowance. Changes in estimates of projected future operating results or in assumptions regarding our ability to generate future taxable income could result in significant increases to our valuation allowance and tax expense that would reduce net income. In addition, we recognize reserves for uncertain tax positions through tax expense for estimated exposures related to our current tax positions. We evaluate the need for reserves for uncertain tax positions on a quarterly basis and any change in the amount will be recorded in our results of operations, as appropriate. It could take several years to resolve certain of these reserves for uncertain tax positions. We are also subject to routine corporate income tax audits in the jurisdictions in which we operate. Our provision for income taxes includes amounts intended to satisfy income tax assessments that are likely to result from the examination of our corporate tax returns that have been filed in these jurisdictions. The amounts ultimately paid upon resolution of these examinations could be materially different from the amounts included in the provision for income taxes and result in increases to tax expense. Our stock repurchase plan may be suspended or terminated at any time, which may result in a decrease in our stock price. We have repurchased shares of our common stock in the market during the past several years and currently repurchase shares under an arrangement pursuant to which management is permitted to determine the amount and timing of repurchases in its discretion subject to an overall limit. Our ability and willingness to repurchase shares is subject to, among other things, the availability of cash resources and credit at rates and upon terms we believe are prudent. Stock market conditions, the market value of our common stock and other factors may also make it imprudent for us from time to time to engage in repurchase activity. There can be no assurance that we will continue to repurchase shares at historic levels or at all. If our repurchase program is curtailed, our stock price may be negatively affected. Acts of terrorism, acts of war and other unforeseen events may cause damage or disruption to us or our customers, which could adversely affect our business, financial condition and operating results. Natural disasters, acts of war, terrorist attacks and the escalation of military activity in response to such attacks or otherwise may have negative and significant effects, such as imposition of increased security measures, changes in applicable laws, market disruptions and job losses. Such events may have an adverse effect on the economy in general. Moreover, the potential for future terrorist attacks and the national and international responses to such threats could affect the business in ways that cannot be predicted. The effect of any of these events or threats could have an adverse affect on our business, financial condition and results of operations.

22 22
Our articles of incorporation, bylaws and rights agreement as well as certain provisions of Michigan law may have an anti-takeover effect. Provisions of our articles of incorporation and bylaws, Michigan law and the Rights Agreement, dated October 25, 2000, as amended, between Compuware Corporation and Equiserve Trust Company, N.A. (now known as Computershare Trust Company N.A.), as rights agent, could make it more difficult for a third party to acquire Compuware, even if doing so would be perceived to be beneficial to shareholders. The combination of these provisions inhibits a non-negotiated acquisition, merger or other business combination involving Compuware, which, in turn, could adversely affect the market price of our common stock.

23 23
ITEM 1B. UNRESOLVED STAFF COMMENTS None ITEM 2. PROPERTIES Our executive offices, primary research and development lab, principal marketing department, primary professional and application services office, customer service and support teams are located in our corporate headquarters building in Detroit, Michigan. We own the facility, which is approximately 1.1 million square feet, including approximately 55,000 square feet available for lease to third parties for retail and related amenities and approximately 35,000 square feet donated for use by local not-for-profit organizations. In addition, we lease approximately 217,000 square feet of land on which the facility resides. We lease approximately 84 sales and professional services offices in 30 countries, including 3 remote product research and development facilities. ITEM 3. LEGAL PROCEEDINGS The Company is subject to various legal proceedings and claims that arise in the ordinary course of business. The Company does not believe that the outcome of any of these legal matters will have a material adverse effect on the Company's consolidated financial position, results of operations and cash flows. See Note 14 of the Notes to Consolidated Financial Statements, included in Item 8 of this report, for a description of certain legal proceedings. ITEM 4. SUBMISSION OF MATTERS TO A VOTE OF SECURITY HOLDERS No matters were submitted to a vote of our security holders during the fourth quarter of the fiscal year covered by this report.

24 24
PART II
ITEM 5. MARKET FOR THE REGISTRANT'S COMMON EQUITY, RELATED STOCKHOLDER MATTERS AND ISSUER PURCHASES OF EQUITY SECURITIES Our common stock is traded on The NASDAQ Global Select Market (“NASDAQ”) under the symbol CPWR. As of May 15, 2009, there were 4,296 shareholders of record of our common stock. We have not paid any cash dividends on our common stock since fiscal 1986 and have no current intention to pay dividends. The following table sets forth the range of high and low sale prices for our common stock for the periods indicated, all as reported by NASDAQ.
Fiscal Year Ended March 31, 2009 High Low Fourth quarter $ 7.35 $ 5.18 Third quarter 9.69 5.08 Second quarter 11.91 9.08 First quarter 10.42 6.97
Fiscal Year Ended March 31, 2008 High Low Fourth quarter $ 8.91 $ 6.10 Third quarter 10.44 7.96 Second quarter 12.22 7.32 First quarter 12.56 9.44
Common Share Repurchases The following table sets forth, the repurchases of common stock for the quarter ended March 31, 2009:
Period For the month ended January 31, 2009 565,708,000$ For the month ended February 28, 2009 1,938,000 5.90$ 1,938,000 554,267,000 For the month ended March 31, 2009 3,000,000 5.80 3,000,000 536,861,000 Total 4,938,000 5.84 4,938,000
Total number of shares purchased as part of publicly announced plans
Total number of shares purchased
Average price paid per share
Approximate dollar value of shares that may yet be
purchased under the plan or program (1)
(1) Our purchases of common stock may occur on the open market or in negotiated or block
transactions based upon market and business conditions. Unless terminated earlier by resolution of our Board of Directors, the discretionary share repurchase plan will expire when we have repurchased all shares authorized for repurchase thereunder. The maximum amount of repurchase activity under the discretionary program continues to be limited on a daily basis to 25% of the average trading volume of our common stock for the

25 25
previous four week period. In addition, no purchases are made during our self-imposed trading black-out periods in which the Company and our insiders are prohibited from trading in our common shares.
Comparison of Cumulative Five Year Total Return The following line graph compares the yearly percentage change in the cumulative total shareholder return on our common shares with the cumulative total return of each of the following indices: S&P 500 Index, the NASDAQ Market Index and the NASDAQ Computer and Data Processing Index for the period from April 1, 2004 through March 31, 2009. The graph includes a comparison to the S&P 500 Index in accordance with SEC rules, as the Company's common stock is part of such index. The graph assumes the investment of $100 in our common shares, the S&P 500 Index and each of the two NASDAQ indices on March 31, 2004 and the reinvestment of all dividends. The comparisons in the graph are required by the SEC. You should be careful about drawing any conclusions from the data contained in the graph, because past results do not necessarily indicate future performance. The information contained in this graph shall not be deemed to be "soliciting material" or "filed" with the SEC or subject to the liabilities of Section 18 of the Exchange Act, except to the extent that we specifically incorporate it by reference into a document filed under the Securities Act or the Exchange Act.
COMPARISON OF CUMULATIVE FIVE YEAR TOTAL RETURN
$0
$50
$100
$150
$200
2004 2005 2006 2007 2008 2009
Compuware Corporation S&P 500 Index
NASDAQ Market Index NASDAQ Computer & Data Processing Index

26 26
BasePeriod
March 31,Company / Index 2004 2005 2006 2007 2008 2009
COMPUWARE CORP 100$ 97.17$ 105.67$ 128.07$ 99.06$ 88.93$
S&P 500 INDEX 100 106.69 119.20 133.31 126.54 78.34
NASDAQ MARKET INDEX 100 100.44 118.41 122.81 115.02 76.35
NASDAQ COMPUTER & DATA PROCESSING INDEX 100 106.72 129.83 143.09 137.12 98.37
March 31,
Total Return To Shareholders(Includes reinvestment of dividends)
Indexed ReturnsYears Ending
The additional information required in this section is contained in Item 12 – Security Ownership of Certain Beneficial Owners and Management and Related Stockholder Matter of this report and is incorporated herein by reference.
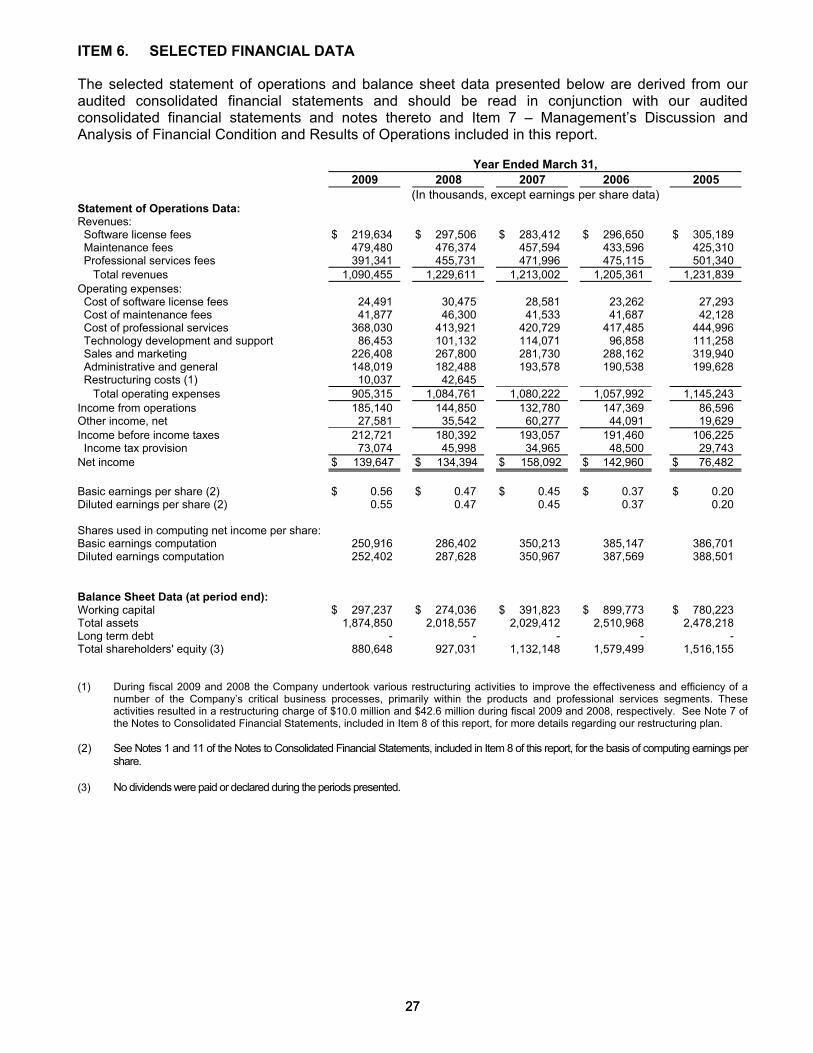
27 27
ITEM 6. SELECTED FINANCIAL DATA The selected statement of operations and balance sheet data presented below are derived from our audited consolidated financial statements and should be read in conjunction with our audited consolidated financial statements and notes thereto and Item 7 – Management’s Discussion and Analysis of Financial Condition and Results of Operations included in this report.
Year Ended March 31, 2009 2008 2007 2006 2005 (In thousands, except earnings per share data) Statement of Operations Data: Revenues: Software license fees $ 219,634 $ 297,506 $ 283,412 $ 296,650 $ 305,189 Maintenance fees 479,480 476,374 457,594 433,596 425,310 Professional services fees 391,341 455,731 471,996 475,115 501,340 Total revenues 1,090,455 1,229,611 1,213,002 1,205,361 1,231,839 Operating expenses: Cost of software license fees 24,491 30,475 28,581 23,262 27,293 Cost of maintenance fees 41,877 46,300 41,533 41,687 42,128 Cost of professional services 368,030 413,921 420,729 417,485 444,996 Technology development and support 86,453 101,132 114,071 96,858 111,258 Sales and marketing 226,408 267,800 281,730 288,162 319,940 Administrative and general 148,019 182,488 193,578 190,538 199,628 Restructuring costs (1) 10,037 42,645 Total operating expenses 905,315 1,084,761 1,080,222 1,057,992 1,145,243 Income from operations 185,140 144,850 132,780 147,369 86,596 Other income, net 27,581 35,542 60,277 44,091 19,629 Income before income taxes 212,721 180,392 193,057 191,460 106,225 Income tax provision 73,074 45,998 34,965 48,500 29,743 Net income $ 139,647 $ 134,394 $ 158,092 $ 142,960 $ 76,482
Basic earnings per share (2) $ 0.56 $ 0.47 $ 0.45 $ 0.37 $ 0.20 Diluted earnings per share (2) 0.55 0.47 0.45 0.37 0.20 Shares used in computing net income per share: Basic earnings computation 250,916 286,402 350,213 385,147 386,701 Diluted earnings computation 252,402 287,628 350,967 387,569 388,501 Balance Sheet Data (at period end): Working capital $ 297,237 $ 274,036 $ 391,823 $ 899,773 $ 780,223 Total assets 1,874,850 2,018,557 2,029,412 2,510,968 2,478,218 Long term debt - - - - - Total shareholders' equity (3) 880,648 927,031 1,132,148 1,579,499 1,516,155 (1) During fiscal 2009 and 2008 the Company undertook various restructuring activities to improve the effectiveness and efficiency of a
number of the Company’s critical business processes, primarily within the products and professional services segments. These activities resulted in a restructuring charge of $10.0 million and $42.6 million during fiscal 2009 and 2008, respectively. See Note 7 of the Notes to Consolidated Financial Statements, included in Item 8 of this report, for more details regarding our restructuring plan.
(2) See Notes 1 and 11 of the Notes to Consolidated Financial Statements, included in Item 8 of this report, for the basis of computing earnings per
share. (3) No dividends were paid or declared during the periods presented.
28 28
ITEM 7. MANAGEMENT'S DISCUSSION AND ANALYSIS OF FINANCIAL CONDITION AND RESULTS OF OPERATIONS
FORWARD-LOOKING STATEMENTS
The following discussion contains certain forward-looking statements within the meaning of the federal securities laws. When we use words such as “may”, “might”, “will”, “should”, “believe”, “expect”, “anticipate”, “estimate”, “continue”, “predict”, “forecast”, “projected”, “intend” or similar expressions, or make statements regarding our future plans, objectives or expectations, we are making forward-looking statements. Numerous important factors, risks and uncertainties affect our operating results, including, without limitation, those discussed in Item 1A. Risk Factors and elsewhere in this report, could cause actual results to differ materially from the results implied by these or any other forward-looking statements made by us, or on our behalf. There can be no assurance that future results will meet expectations. While we believe that our forward-looking statements are reasonable, you should not place undue reliance on any such forward-looking statements, which speak only as of the date made. Except as required by applicable law, we do not undertake any obligation to publicly release any revisions which may be made to any forward-looking statements to reflect events or circumstances occurring after the date of this report. OVERVIEW In this section, we discuss our results of operations on a segment basis. We operate in three business segments in the technology industry: products, professional services and application services. We evaluate segment performance based primarily on segment contribution before corporate expenses. References to years are to fiscal years ended March 31. This discussion and analysis should be read in conjunction with the audited consolidated financial statements and notes included in Item 8 of this report. We deliver value to businesses worldwide by providing software products, professional services and application services that improve the performance of IT organizations. Originally founded in 1973 as a professional services company, in the late 1970’s we began to offer mainframe productivity tools for fault diagnosis, file and data management, and application debugging. In the 1990's, IT moved toward distributed and web-based platforms. Our solutions portfolio grew in response, and we now market a comprehensive portfolio of IT solutions across the full range of enterprise computing platforms that help:
• Develop and deliver high quality, high performance enterprise business applications in a timely and cost-effective manner.
• Measure, manage and communicate application service in business terms, and maintain consistent,
high levels of service delivery. • Provide executive visibility, decision support and process automation across the entire IT
organization to enable all available resources to be harnessed in alignment with business priorities.
Additionally, to be competitive in today’s global economy, enterprises must securely share applications, information and business processes. We address this market need through our application services, which are marketed under the brand name “Covisint”. Our application services offerings provide a software-as-a-service platform that enables industries and business communities to securely integrate vital information and processes across users, business partners, customers, vendors and suppliers.

29 29
Annual Update The following occurred during fiscal 2009:
• Achieved an increase in product contribution margin to 45.8% in fiscal 2009 from 42.4% in
fiscal 2008. • Experienced a decrease in professional services segment contribution margin to 7.1% in
fiscal 2009 from 10.5% in fiscal 2008. • Repurchased approximately 20.3 million shares of our common stock during fiscal 2009 at
an average price of $9.49 per share. • Initiated restructuring actions that resulted in a charge of $10 million, described below under
“Restructuring Charges” and in Note 7 of the Notes to Consolidated Financial Statements, included in Item 8 of this report.
• Released 17 mainframe and 29 distributed product enhancements. We also advanced our Compuware 2.0 initiative in fiscal 2009 as follows:
• Refined our software business strategy to focus on delivering superior end-to-end
application performance, which we call Business Service Delivery. • Entered into a Letter of Intent to sell our Quality and DevPartner distributed product families
to an affiliate of Micro Focus International PLC (“Micro Focus”), and executed the related asset purchase agreement in May 2009. The sale price in the transaction is $80 million, less certain adjustments relating to cash collected or invoiced for certain deferred maintenance obligations assumed by Micro Focus. We expect to record a gain of approximately $50 million when this transaction closes which is anticipated to be in the first quarter of fiscal 2010 (see Note 3 of the Notes to Consolidated Financial Statements, included in Item 8 of this report).
• Advanced our application services segment business strategy with a focus on the healthcare market while maintaining customer satisfaction in the automotive industry.
• Implemented a strategy and began executing a plan to have a smaller, more profitable professional services segment.

30 30
RESULTS OF OPERATIONS
The following table sets forth, for the periods indicated, certain operational data from the consolidated statements of operations as a percentage of total revenues and the percentage change in such items compared to the prior period:
2008 2007to to
2009 2008 2007 2009 2008REVENUE:
Software license fees 20.1% 24.2% 23.4% (26.2)% 5.0% Maintenance fees 44.0 38.7 37.7 0.7 4.1 Professional services segment revenue 32.7 34.1 36.4 (14.9) (5.3) Application services segment revenue 3.2 3.0 2.5 (5.2) 24.3
Total revenues 100.0 100.0 100.0 (11.3) 1.4
OPERATING EXPENSES:Cost of software license fees 2.2 2.5 2.4 (19.6) 6.6 Cost of maintenance fees 3.8 3.7 3.4 (9.6) 11.5 Professional services segment expenses 30.4 30.5 31.7 (11.6) (2.5) Application services segment expenses 3.4 3.2 3.0 (5.8) 7.5 Technology development and support 7.9 8.2 9.4 (14.5) (11.3) Sales and marketing 20.8 21.8 23.2 (15.5) (4.9) Administrative and general 13.6 14.8 16.0 (18.9) (5.7) Restructuring costs 0.9 3.5 (76.5) n/a
Total operating expenses 83.0 88.2 89.1 (16.5) 0.4 Income from operations 17.0 11.8 10.9 27.8 9.1 Other income, net 2.5 2.9 5.0 (22.4) (41.0) Income before income taxes 19.5 14.7 15.9 17.9 (6.6)
Income tax provision 6.7 3.8 2.9 58.9 31.6 Net income 12.8% 10.9% 13.0% 3.9 (15.0)
Fiscal Year EndedMarch 31,
Period-to-PeriodChange
Percentage ofTotal Revenues
PRODUCTS SEGMENT Financial information for the product segment is as follows (in thousands):
2009 2008 2007Revenue 699,114$ 773,880$ 741,006$ Expenses 379,229 445,707 465,915 Product segment contribution 319,885$ 328,173$ 275,091$
Year Ended March 31,
The product segment generated contribution margins of 45.8%, 42.4%, and 37.1% during 2009, 2008, and 2007, respectively. The improvement in the contribution margin in 2009 compared to 2008 was due to product expenses decreasing at a faster rate than product revenue. Expenses decreased primarily due to the cost reduction initiatives implemented as part of the 2008 and 2009 restructuring programs that affected the technology and sales divisions.
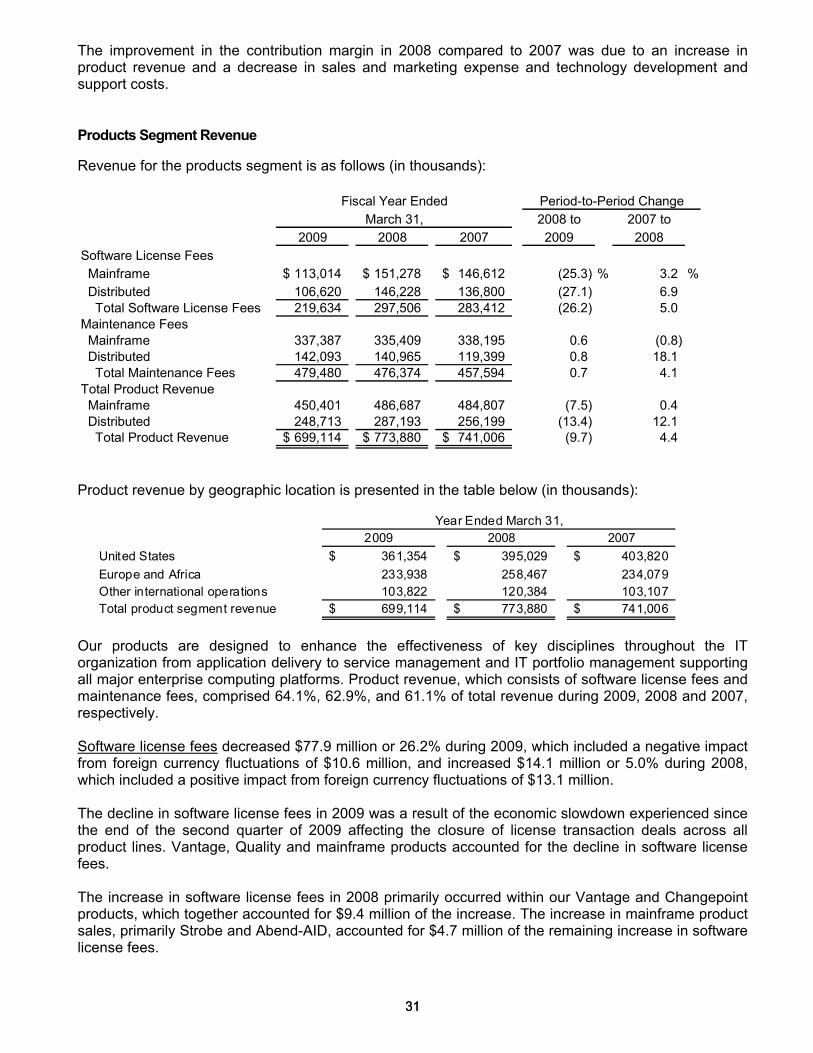
31 31
The improvement in the contribution margin in 2008 compared to 2007 was due to an increase in product revenue and a decrease in sales and marketing expense and technology development and support costs. Products Segment Revenue Revenue for the products segment is as follows (in thousands):
2008 to 2007 to2009 2008 2007 2009 2008
Software License Fees Mainframe 113,014$ 151,278$ 146,612$ (25.3) % 3.2 % Distributed 106,620 146,228 136,800 (27.1) 6.9 Total Software License Fees 219,634 297,506 283,412 (26.2) 5.0Maintenance Fees Mainframe 337,387 335,409 338,195 0.6 (0.8) Distributed 142,093 140,965 119,399 0.8 18.1 Total Maintenance Fees 479,480 476,374 457,594 0.7 4.1Total Product Revenue Mainframe 450,401 486,687 484,807 (7.5) 0.4 Distributed 248,713 287,193 256,199 (13.4) 12.1 Total Product Revenue 699,114$ 773,880$ 741,006$ (9.7) 4.4
Period-to-Period ChangeFiscal Year EndedMarch 31,
Product revenue by geographic location is presented in the table below (in thousands):
2009 2008 2007
United States 361,354$ 395,029$ 403,820$
Europe and Africa 233,938 258,467 234,079 Other international operations 103,822 120,384 103,107 Total product segment revenue 699,114$ 773,880$ 741,006$
Year Ended March 31,
Our products are designed to enhance the effectiveness of key disciplines throughout the IT organization from application delivery to service management and IT portfolio management supporting all major enterprise computing platforms. Product revenue, which consists of software license fees and maintenance fees, comprised 64.1%, 62.9%, and 61.1% of total revenue during 2009, 2008 and 2007, respectively. Software license fees decreased $77.9 million or 26.2% during 2009, which included a negative impact from foreign currency fluctuations of $10.6 million, and increased $14.1 million or 5.0% during 2008, which included a positive impact from foreign currency fluctuations of $13.1 million. The decline in software license fees in 2009 was a result of the economic slowdown experienced since the end of the second quarter of 2009 affecting the closure of license transaction deals across all product lines. Vantage, Quality and mainframe products accounted for the decline in software license fees. The increase in software license fees in 2008 primarily occurred within our Vantage and Changepoint products, which together accounted for $9.4 million of the increase. The increase in mainframe product sales, primarily Strobe and Abend-AID, accounted for $4.7 million of the remaining increase in software license fees.
32 32
During 2009 and 2008, for software license transactions that are required to be recognized ratably, we deferred $80.0 million and $107.7 million, respectively, of license revenue relating to such transactions that closed during the year, and recognized as license revenue $84.7 million and $102.7 million, respectively, relating to such transactions that closed and had been previously deferred. Maintenance fees increased $3.1 million or 0.7% during 2009, which included a negative impact from foreign currency fluctuations of $8.0 million, and increased $18.8 million or 4.1% during 2008, which included a positive impact from foreign currency fluctuations of $18.3 million. We continue to experience a high renewal rate associated with current customer maintenance contracts and continue to expand our maintenance base through the sale of new maintenance contracts associated with license deals entered into during the respective periods. Mainframe products, primarily Strobe, and distributed products, primarily Vantage, accounted for $2.0 million and $1.1 million of the increase in maintenance fees during 2009, respectively. Distributed products, primarily Vantage and Changepoint, together accounted for $21.6 million of the increase in maintenance fees during 2008. This increase was partially offset by a $2.8 million decline in maintenance fees associated with our mainframe products. Product Segment Expenses Product expenses include cost of software license fees, cost of maintenance fees, technology development and support costs, and sales and marketing expenses. Cost of software license fees includes amortization of capitalized software, the cost of duplicating and disseminating products to customers, including associated hardware costs, and the cost of author royalties. Cost of software license fees decreased $6.0 million or 19.6% during 2009 to $24.5 million from $30.5 million in 2008 and increased $1.9 million or 6.6% during 2008 from $28.6 million in 2007. The decrease in cost for 2009 was due to a $3.9 million capitalized software impairment charge recorded during the first quarter of 2008 associated with the 2008 restructuring initiative. The remaining decline was primarily due to a decline in costs associated with hardware sold with our Vantage product line. The increase in cost for 2008 was primarily due to a $3.9 million capitalized software impairment charge recorded during the first quarter of 2008, offset in part by a decline in hardware costs and lower capitalized software amortization costs incurred subsequent to the impairment charge. As a percentage of software license fees, cost of software license fees were 11.2%, 10.2%, and 10.1% in 2009, 2008, and 2007, respectively. Cost of maintenance fees consists of the direct costs allocated to maintenance and product support such as helpdesk and technical support. Customers who subscribe to maintenance are also eligible to receive the benefit of new releases as well as technical support. Cost of maintenance fees decreased $4.4 million or 9.6% during 2009 to $41.9 million from $46.3 million in 2008 and increased $4.8 million or 11.5% during 2008 from $41.5 million in 2007. The decrease in cost for 2009 was primarily due to lower compensation and benefit costs resulting from employee headcount reductions as part of the restructuring actions taken during 2008 and 2009. The increase in cost for 2008 was primarily due to higher compensation and benefit costs associated with the transfer of technical personnel from sales support to customer support in order to meet product development and maintenance initiatives and to provide increased customer support in our international operations consistent with the revenue growth in those markets.

33 33
As a percentage of maintenance fees, cost of maintenance fees were 8.7%, 9.7%, and 9.1% in 2009, 2008 and 2007, respectively. Technology development and support includes, primarily, the costs of programming personnel associated with product development and support less the amount of software development costs capitalized during the period. Also included are personnel costs associated with developing and maintaining internal systems and hardware/software costs required to support all technology initiatives. As a percentage of product revenue, costs of technology development and support were 12.4%, 13.1%, and 15.4% in 2009, 2008 and 2007, respectively. Capitalization of internally developed software products begins when technological feasibility of the product is established. Total technology development and support costs incurred internally and capitalized for the years ended March 31, 2009, 2008 and 2007 were as follows (in thousands):
Year Ended March 31,2009 2008 2007
Technology development and support costs incurred 98,829$ 113,693$ 135,455$ Capitalized technology development and support costs (12,376) (12,561) (21,384) Technology development and support costs expensed 86,453$ 101,132$ 114,071$
Before the capitalization of internally developed software products, total technology development and support expenditures decreased $14.9 million or 13.1%, to $98.8 million during 2009 from $113.7 million in 2008 and deceased $21.8 million or 16.1% during 2008 from $135.5 million in 2007. The decreases in cost for 2009 and 2008 were primarily due to lower compensation and benefit costs resulting from employee headcount reductions as part of the restructuring actions taken during 2008 and 2009. Sales and marketing costs consist primarily of personnel related costs associated with product sales, sales support and marketing for all our product offerings. Sales and marketing costs decreased $41.4 million or 15.5% during 2009 to $226.4 million from $267.8 million in 2008 and decreased $13.9 million or 4.9% during 2008 from $281.7 million in 2007. As a percentage of product revenue, sales and marketing costs were 32.4%, 34.6%, and 38.0% in 2009, 2008 and 2007, respectively. The decrease in costs for 2009 was a result of lower compensation and benefit costs of $21.7 million resulting primarily from employee headcount reductions as part of the restructuring actions taken during 2008 and 2009 and decreases in bonus and commission costs of $25.4 million due to the decline in software license sales in 2009. The decreases in costs were partially offset by an increase in advertising costs of $5.1 million primarily associated with our Compuware 2.0 marketing campaign. The decrease in costs for 2008 was primarily attributable to lower compensation, benefit and travel expenses due to headcount reductions as a result of the sales reorganization undertaken as part of the Company’s restructuring efforts in 2008 and lower costs associated with marketing and promotional programs, partially offset by higher bonus and commission expense primarily resulting from the growth in distributed sales compared to the prior year. Quality and DevPartner Divestiture - The product revenue recorded in 2009, 2008 and 2007 associated with products included in the Quality and DevPartner divestiture was approximately $60.0 million, $74.0 million and $73.0 million, respectively. In addition, the terms of the arrangement allow Micro Focus the right to offer employment to 249 employees in our products segment.

34 34
PROFESSIONAL SERVICES SEGMENT
Financial information for the professional services segment is as follows (in thousands):
2009 2008 2007Revenue 356,111$ 418,559$ 442,082$ Expenses 331,001 374,626 384,189 Professional services segment contribution 25,110$ 43,933$ 57,893$
* The professional services segment and the application services segments are combined and reported as professional services on the consolidated statement of operations, included in Item 8 of this report.
Year Ended March 31, *
Professional services segment revenue by geographic location is presented in the table below (in thousands):
2009 2008 2007United States 288,439$ 342,519$ 371,448$ Europe and Africa 58,419 68,170 65,050 Other international operations 9,253 7,870 5,584 Total professional services segment revenue 356,111$ 418,559$ 442,082$
Year Ended March 31,
During 2009, the professional services segment generated a contribution margin of 7.1%, compared to 10.5% and 13.1% during 2008 and 2007, respectively. The decrease in contribution margin for 2009 compared to 2008 was due to higher costs in 2009 associated with the investment in personnel for our Solutions Delivery Group, which focuses on providing professional services associated with our product solutions, and to a lesser extent, the completion and transitioning of certain higher-margin contracts during 2008 and 2009 (see the “Professional Services Segment Revenue” section for more details). The decrease in contribution margin for 2008 compared to 2007 was due to a disproportionate percentage decline in revenue compared to costs. The percentage decline in revenue exceeded the percentage decline in costs due to annual salary increases and higher costs associated with certain fixed price projects partially offsetting the reductions in compensation costs associated with headcount reductions in 2008. 2009 Restructuring During the second half of 2009, management focused on improving the segment’s margins by initiating a plan to exit engagements that were considered low-margin or unprofitable and reducing headcount and operating costs resulting in restructuring charges. Our professional services segment contribution margin increased to 9.5% during the fourth quarter of 2009 compared to a 6.4% contribution margin for the first nine months of 2009. The fourth quarter 2009 results included a $2.2 million increase to revenue due to an adjustment associated with the completion of a fixed price project. Professional services revenues are expected to decline in the range of 35% to 40% in 2010 compared to 2009 but we expect improvement in the operating margin percentage of the segment. Actions initiated to date have included exiting low margin accounts, including our largest professional services client in the automotive industry. We expect 20% to 25% of our professional services segment revenue in 2010 to be concentrated in the automotive industry. If these actions do not improve the operating profit percentage of the professional services segment as currently projected, an impairment of some or all of the $140.4 million of goodwill related to the professional services segment at March 31, 2009 may be recorded in the future as a non-cash charge to earnings in the period in which the carrying value exceeds fair value.
35 35
Professional Services Segment Revenue We offer a broad range of IT services to help businesses make the most of their IT assets. Some of these services include outsourcing and co-sourcing, application management, product solutions, project management, enterprise resource planning and customer relationship management services. Revenue from professional services decreased $62.4 million or 14.9%, which included a negative impact from foreign currency fluctuations of $6.1 million, during 2009 to $356.1 million from $418.5 million in 2008 and decreased $23.6 million or 5.3%, which included a positive impact from foreign currency fluctuations of $6.6 million, during 2008 from $442.1 million in 2007. During the first quarter of 2009, we transitioned the employment of 170 of our professional services staff to a customer (see “Administrative and General Expenses” within this section for more details). This resulted in a $17 million decline in our professional services segment revenue during 2009. The remaining decrease in revenue for 2009 compared to 2008 was primarily due to two government contracts expiring that were not renewed, reductions in spending from a client within the automotive industry, our election not to renew low margin contracts in certain locations and the general slowdown in the economy that has resulted in companies not renewing or delaying IT projects. The decrease in revenue for 2008 compared to 2007 was primarily due to a general slow down in customer spending on certain IT programs and on staff supplementation services within our U.S. operations.
Professional Services Segment Expenses
Professional services segment expenses consist primarily of personnel-related costs of providing services, including billable staff, subcontractors and sales personnel. Professional services segment expense decreased $43.6 million or 11.6% during 2009 to $331.0 million from $374.6 million in 2008 and decreased $9.6 million or 2.5% during 2008 from $384.2 million in 2007. The decreases in cost for 2009 and 2008 were primarily attributable to lower compensation and benefit costs due to a reduction in employee headcount as management continues to restructure the segment in order to align operating costs with the decline in revenue as part of the 2009 restructuring efforts. Quality and DevPartner Divestiture - Professional service fees were $11.0 million in 2009 for solutions associated with the divested Quality and DevPartner products. In addition, this arrangement allows Micro Focus the right to offer employment to 41 employees in our professional services segment.

36 36
APPLICATION SERVICES SEGMENT Our application services, which are marketed under the brand name “Covisint”, provide a software-as-a-service platform that enables industries and business communities to securely integrate vital information and processes across users, business partners, customers, vendors and suppliers. Financial information for the application services segment is as follows (in thousands):
2009 2008 2007Revenue 35,230$ 37,172$ 29,914$ Expenses 37,029 39,295 36,540 Application services segment loss (1,799)$ (2,123)$ (6,626)$
* The professional services segment and the application services segments are combined and reported as professional services on the consolidated statement of operations, included in Item 8 of this report.
Year Ended March 31, *
During 2009, the application services segment generated a negative contribution margin of 5.1%, compared to a negative contribution margin of 5.7% and 22.2% during 2008 and 2007, respectively. The improvement in 2009 was a result of operating costs declining faster than revenues, primarily due to the decline in bonus and commission costs. The improvement in 2008 was a result of revenue growth, primarily within the healthcare sector, exceeding the percentage increase in personnel costs incurred to support our business expansion. Application Services Segment Revenue Revenue from application services decreased $1.9 million or 5.2% during 2009 and increased $7.3 million or 24.3% during 2008. The decrease in revenue during 2009 compared to 2008 was primarily due to the decrease in spending by our automotive clients associated with the general economic problems within the sector, offset by revenue growth within the healthcare industry. The increase in revenue for 2008 compared to 2007 was primarily a result of Covisint expanding its presence within the healthcare industry. Our application services segment continues to be concentrated in the automotive industry and we expect approximately 50% of our application services segment revenue in 2010 will be derived from this industry. Application services segment revenue by geographic location is presented in the table below (in thousands):
2009 2008 2007United States 29,580$ 32,447$ 25,317$ Europe and Africa 3,264 2,833 2,427 Other international operations 2,386 1,892 2,170 Total application services segment revenue 35,230$ 37,172$ 29,914$
Year Ended March 31,
Application Services Segment Expenses
Application services segment expenses consist primarily of personnel-related costs of providing services, including billable staff, subcontractors and sales personnel. Application services segment expenses decreased $2.3 million or 5.8% during 2009 and increased $2.8 million or 7.5% during 2008.
37 37
The decrease in cost during 2009 compared to 2008 was primarily due to a decline in bonus and commission costs associated with the decline in revenue. The increase in cost during 2008 compared to 2007 was primarily due to higher compensation and benefit costs due to increases in employee headcount in order to support the expansion or addition of client contracts entered into during these fiscal years. CORPORATE AND OTHER EXPENSES Administrative and general expenses consist primarily of costs associated with the corporate executive, finance, human resources, administrative, legal, communications and investor relations departments. In addition, administrative and general expenses include all facility-related costs, such as rent, building depreciation, maintenance and utilities, associated with worldwide sales, professional services and software development offices. Administrative and general expenses decreased $34.5 million or 18.9% during 2009 to $148.0 million from $182.5 million in 2008 and decreased $11.1 million or 5.7% during 2008 from $193.6 million in 2007. The decrease in cost for 2009 compared to 2008 was primarily due to the following: (1) foreign currency gain of $6.4 million in 2009 compared to a currency loss of $5.0 million in 2008 associated with receivables denominated in non-local currencies and inter-company balances with our wholly owned subsidiaries; (2) lower bonus expense of $9.7 million as bonus targets were not met in 2009; (3) a gain of $5.6 million was recorded during the first quarter of 2009 associated with a transaction that transitioned the employment of 170 of our professional services staff to a customer (see Note 3 of the Notes to Consolidated Financial Statements, included in Item 8 of this report and “Professional Services Segment Revenue” within this section for more details) and (4) lower facility costs of $7.1 million primarily due to the facility closures that took place as part of the 2008 and 2009 restructuring programs. The decrease in cost for 2008 compared to 2007 was primarily attributable to a $5.0 million decrease in charitable contributions and a $3.5 million decrease in travel expense. The remaining decrease in cost was primarily due to lower third party recruiting fees and consulting fees in 2008 compared to 2007. Other income, net (“other income”) consists primarily of interest income realized from investments, interest earned on certain license fee transactions that are financed, the portion of the IBM settlement commitment not utilized through sale of products and income generated from our investments in partially owned companies. Other income decreased $7.9 million or 22.4% during 2009 to $27.6 million from $35.5 million in 2008 and decreased $24.8 million or 41.0% during 2008 from $60.3 million in 2007. The decreases in income from 2009 and 2008 were primarily due to reductions in interest income of $9.1 million and $19.5 million, respectively, as our average cash equivalent and investment balance has declined during the respective periods due to the continued use of funds to repurchase our common shares. The decreases are partially offset by an increase of $1.8 million and $5.6 million, respectively, associated with the IBM settlement. The portion of the IBM settlement commitment that does not get utilized through IBM’s purchase of our products is recorded to other income (for additional information on the IBM settlement, see Note 14 of the Notes to Consolidated Financial Statements, included in Item 8 of this report). The decrease in other income from 2008 compared to 2007 was further impacted by a gain on the sale of our minority interest in Foresee Results, Inc. of $11.3 million recorded during 2007 (see Note 5 of the Notes to Consolidated Financial Statements, included in Item 8 of this report). Income taxes are accounted for using the asset and liability approach. Deferred income taxes are provided for the differences between the tax bases of assets or liabilities and their reported amounts in the financial statements. The income tax provision was $73.1 million, $46.0 million and $35.0 million,
38 38
respectively, in 2009, 2008 and 2007, representing an effective tax rate of 34%, 25%, and 18%, respectively. The increase in the effective tax rate for 2009 compared to 2008 resulted from an income tax benefit of $15 million recorded during 2008. This benefit related primarily to the recognition of a deferred tax asset for Brownfield Redevelopment credits available to offset Michigan Business Tax (“MBT”) liabilities through the Company’s fiscal year 2022. The increase in the effective tax rate for 2008 compared to 2007 was primarily a result of recording an income tax benefit of $26.6 million during the fourth quarter of 2007 related to the settlement of prior year tax matters with the Internal Revenue Service (“IRS”). The benefit consisted of the following: (1) settlement of special deductions associated with foreign sales commissions under the former foreign sales corporation rules and the extraterritorial income exclusion rules of $8.7 million; (2) settlement of credits afforded to U.S. based taxpayers that generate income from sales to foreign customers of $10.2 million; (3) settlement of the proper character and timing of certain deductions of $3.3 million; and (4) the remaining items consist primarily of interest income and reductions in state taxes totaling $4.4 million. The 2008 increase was offset by $15.0 million of income tax benefits recorded during 2008 relating to the recognition of a deferred tax asset for Brownfield Redevelopment credits as discussed above. For additional information regarding the difference between our effective tax rate and the statutory rate for fiscal 2009, 2008 and 2007 see Note 12 of the Notes to Consolidated Financial Statements, included in Item 8 of this report. RESTRUCTURING CHARGE 2009 Restructuring Initiative During 2009, we incurred restructuring charges of $10.0 million associated with the following two initiatives: (1) aligning the professional services segment headcount and operating expenses after initiating a plan to exit low-margin engagements and (2) management’s continued evaluation of the product segment and general and administrative business processes to identify operating efficiencies with the goal of reducing operating expenses. These actions resulted in the full or partial closing of seven offices and the termination of 478 positions within our professional services segment; 148 positions within our products segment related to technology and sales and marketing personnel; and 43 corporate general and administrative positions. The Company continues to review the impact of these actions and will, based on future results of operations, determine if additional actions are needed. The total amount of any potential future charges for such actions will depend upon the nature, timing and extent of those actions. 2008 Restructuring Initiative During 2008, we undertook various restructuring initiatives to improve the effectiveness and efficiency of a number of our critical business processes, primarily within the products segment. These initiatives included the realignment and centralization of certain product development activities leading to the full or partial closing of certain development labs and termination of approximately 325 employees, primarily programming personnel. We also terminated approximately 200 employees from various other functions of the organization, primarily within sales and marketing. These activities resulted in a restructuring charge of $42.6 million for fiscal 2008. See Note 7 of the Notes to Consolidated Financial Statements, included in Item 8 of this report, for additional details related to the restructuring charges and changes in the restructuring accrual for 2007, 2008 and 2009.

39 39
MANAGEMENT'S DISCUSSION OF CRITICAL ACCOUNTING POLICIES AND ESTIMATES Note 1 of the Notes to Consolidated Financial Statements, included in Item 8 of this report, contains a summary of our significant accounting policies. Our consolidated financial statements are prepared in accordance with accounting principles generally accepted in the United States (“U.S. GAAP”). The preparation of these financial statements requires us to make estimates and judgments that affect the reported amounts of assets and liabilities and disclosure of contingent assets and liabilities at the date of the financial statements and the reported amounts of revenues and expenses during the reporting period. Assumptions and estimates were based on facts and circumstances existing at March 31, 2009. However, future events rarely develop exactly as forecast, and the best estimates routinely require adjustment. The accounting policies discussed below are considered by management to be the most important to an understanding of our financial statements, because their application places the most significant demands on management’s judgment and estimates about the effect of matters that are inherently uncertain. Product Revenue Recognition – In order for a transaction to be eligible for revenue recognition, the following criteria must be met: persuasive evidence of an arrangement exists, delivery has occurred, the fee is fixed or determinable, and collectibility is reasonably assured. We evaluate collectibility based on past customer history, external credit ratings and payment terms within various customer agreements. Based on our interpretation of U.S. GAAP including Statement of Position 97-2 “Software Revenue Recognition” and 98-9 “Modifications of SOP 97-2, ‘Software Revenue Recognition,’ With Respect to Certain Transactions”, Securities and Exchange Commission Staff Accounting Bulletin 104 and Emerging Issues Task Force Issue 00-21 “Revenue Arrangements with Multiple Deliverables”, we believe our revenue has been properly reported. New interpretations or pronouncements related to software revenue recognition policies could result in changes to our method of revenue recognition in the future. Perpetual license fee revenue is recognized using the residual method, under which the fair value, based on vendor specific objective evidence (“VSOE”) of all undelivered elements of the agreement (e.g., maintenance and professional services) is deferred. VSOE is based on rates charged for maintenance and professional services when sold separately. Based on market conditions, we periodically change pricing methodologies for license, maintenance and professional services. Changes in rates charged for stand alone maintenance and professional services could have an impact on how bundled revenue agreements are characterized as license, maintenance or professional services and therefore, on the timing of revenue recognition in the future. Pricing modifications made during the years covered by this report have not had a significant impact on the timing or characterization of revenue recognized. For revenue arrangements where there is a lack of VSOE of fair value for any undelivered elements, license fee revenue is deferred and recognized upon delivery of those elements or when VSOE of fair value can be established. When maintenance or services are the only undelivered elements, the license fee revenue is recognized on a ratable basis over the longer of the maintenance term or over the period in which the services are expected to be performed. Such transactions include term licenses as we do not sell maintenance for term licenses separately and therefore cannot establish VSOE for the undelivered elements in these arrangements. These arrangements do not qualify for separate recognition of the software license fees, maintenance fees and as applicable, professional services fees under SOP 97-2 as amended. However, to comply with SEC Regulation S-X, Rule 5-03(b), which requires product, services and other categories of revenue to be displayed separately on the income statement, we separate the license fee, maintenance fee and professional services fee revenue based on its determination of fair value. We apply our VSOE of fair value for maintenance related to perpetual license transactions and stand alone services arrangements as a reasonable and consistent approximation of fair value to separate license fee, maintenance fee and professional services fee revenue for income statement classification purposes.
40 40
We have an increasing need for flexibility in licensing rights and offerings to our customers. As our contractual arrangements evolve to meet the needs of our customers, an increasing percentage of our license arrangements must be recognized over the terms of the arrangement. While this ratable recognition has no impact on our results over time, it may change the timing of forecasted revenue and impact quarterly and annual results. Generally, revenues from license and maintenance transactions that include installment payment terms are recognized in the same manner as those requiring current payment. This is because we have an established business practice of offering installment payment terms to customers and have a history of successfully enforcing original payment terms without making concessions. However, because a significant portion of our license fee revenue is earned in connection with installment sales, changes in future economic conditions or technological developments could adversely affect our ability to immediately record license fees for these types of transactions and/or limit our ability to collect these receivables. To recognize revenue for these multi-year transactions the contract price is allocated between maintenance revenue and license revenue. License revenue associated with perpetual license agreements is recognized when the customer commits unconditionally to the transaction, the software products and quantities are fixed, the software has been delivered to the customer and collection is reasonably assured. License revenue associated with term transactions is deferred and recognized over the term of the agreement. When the license portion is paid over a number of years, the license portion of the payment stream is discounted to its net present value. Interest income is recognized over the payment term. The maintenance revenue associated with all sales is deferred and is recognized over the applicable maintenance period. Professional Services Fees – Professional services fees are generally based on hourly or daily rates; therefore, revenues from professional services are recognized in the period the services are performed, provided that collection of the related receivable is deemed probable. For development services rendered under fixed-price contracts, revenue is recognized using the percentage of completion method and if determined that costs will exceed revenue, the expected loss is recorded at the time the loss becomes apparent. Certain engagements involve a project to setup the customer’s structure and provide on-going support for the project. Revenue associated with these projects is recognized over the service period as the customer derives value from the services, consistent with the proportional performance method. Unforeseen events that result in additional time or costs being required to complete such projects could affect the timing of revenue recognition for the balance of the project as well as services margins going forward, and could have a negative effect on our results of operations. Allowance for Doubtful Accounts – The collectibility of accounts receivable is regularly evaluated and we believe our allowance for doubtful accounts is appropriate for the collection and credit risk associated with our accounts receivable balances. In evaluating the allowance, we consider historical loss experience, including the need to adjust for current conditions, and the aging of outstanding receivables. Larger accounts are reviewed on a detail basis, giving consideration to collection experience and any information on the financial viability of the customer. The allowance is reviewed and adjusted each quarter based on the best information available at the time. Unforeseen events which negatively affect the ability of our customers to meet their payment obligations would negatively impact our ability to collect outstanding amounts due from customers and may cause a material impact on our financial position and results of operations due to a change in the assumptions and judgment on which we base this estimate. Capitalized Software – In accordance with SFAS No. 86, “Accounting for the Costs of Computer Software to be Sold, Leased, or Otherwise Marketed”, the cost of purchased and internally developed software is capitalized and stated at the lower of unamortized cost or expected net realizable value. We compute annual amortization using the straight-line method over the remaining estimated economic life of the software product that is generally five years. Software is subject to rapid technological obsolescence and future product revenue estimates supporting the capitalized software cost can be negatively affected based upon competitive products and pricing. Such adverse developments could reduce the estimated net realizable value of our capitalized software and could result in impairment or a shorter

41 41
estimated life. Such events would require us to take a charge in the period in which the event occurs or to increase the amortization expense in future periods and would have a negative effect on our results of operations. At a minimum, we review for impairments each balance sheet date. Impairment of Goodwill and Other Intangible Assets – In accordance with SFAS No. 142, “Goodwill and Other Intangible Assets”, we are required to assess the impairment of goodwill and other intangible assets annually, or more frequently if events or changes in circumstances indicate that the carrying value may exceed the fair value. The performance test involves a two-step process. Step 1 of the impairment test involves comparing the fair values of the applicable reporting units with their aggregate carrying values, including goodwill. If the carrying amount of a reporting unit exceeds the reporting unit’s fair value, the Company performs Step 2 of the goodwill impairment test to determine the amount of impairment loss by comparing the implied fair value of the respective reporting unit’s goodwill with the carrying amount of that goodwill. We measure the fair value of goodwill and other intangible assets using an estimate of the related discounted cash flow and market comparable valuations, where appropriate. The discounted cash flow approach uses significant assumptions, including projected future cash flows, the discount rate reflecting the risk inherent in future cash flows, and a terminal growth rate. If the carrying amount of the reporting unit exceeds its fair value, the goodwill associated with such reporting unit must be further evaluated for impairment. Under such evaluation, if the carrying amount of the reporting unit’s goodwill exceeds the implied fair value of the goodwill, the impairment loss is recognized as an operating expense in an amount equal to that excess. Changes in any of these estimates and assumptions, and unknown future events or circumstances (e.g., economic conditions or technological developments), could have a significant impact on whether or not an impairment charge is recognized and the magnitude of any such charge. During 2009, our professional services segment revenues and contribution margins declined as current economic conditions impacted the customer base. We began to realign our professional services business model during the second half of 2009, resulting in the exiting of engagements considered low-margin or unprofitable. We also undertook restructuring actions to reduce headcount and operating costs (see Note 7 of the Notes to Consolidated Financial Statements, included in Item 8 of this report). We completed Step 1 of the impairment test for the professional services segment at March 31, 2009 and concluded there was no impairment. We determined the fair value of the professional services segment using a discounted cash flow analysis supported by market multiples of revenue. The discounted cash flow analysis used our best estimates of market conditions over the projected period, including growth rates in revenue and estimated changes in margins. Other significant estimates and assumptions included the discount rate and changes in future working capital requirements. The analysis also considered the actions we took in 2009 (see above) and intend to execute in 2010 to improve the profitability of the professional services segment. If our actions are not successful in improving the profitability percentage of the professional services segment or other adverse changes in market conditions not currently contemplated occur, an impairment of some or all of the $140.4 million of goodwill related to the professional services segment at March 31, 2009 may be recorded in the future as a non-cash charge to earnings in the period in which the carrying value exceeds fair value. Deferred Tax Assets Valuation Allowance and Tax Liabilities - Income tax expense, deferred tax assets and liabilities and reserves for uncertain tax positions reflect management’s best assessment of estimated future taxes to be paid. We are subject to income taxes in both the U.S. and numerous foreign jurisdictions. Significant judgments and estimates are required in determining the consolidated income tax expense. Deferred income taxes arise from temporary differences between the tax and financial statement recognition of revenue and expense. In evaluating our ability to recover our deferred tax assets we consider all available positive and negative evidence, including scheduled reversals of deferred tax
42 42
liabilities, projected future taxable income, tax planning strategies and recent financial operations. In projecting future taxable income, we develop assumptions including the amount of future state, federal and foreign pretax operating income, the reversal of temporary differences, and the implementation of feasible and prudent tax planning strategies. These assumptions require significant judgment about the forecasts of future taxable income and are consistent with the plans and estimates we are using to manage the underlying businesses. For additional information regarding these matters see Note 12 of the Notes to Consolidated Financial Statements, included in Item 8 of this report. Changes in estimates of projected future operating results or in assumptions regarding our ability to generate future taxable income during the periods in which temporary differences are deductible could result in significant changes to these accruals and, therefore, to our net income. The calculation of our tax liabilities involves dealing with uncertainties in the application of complex tax laws and regulations in a multitude of jurisdictions across our global operations. In accordance with Financial Interpretation 48, “Accounting for Uncertainty in Income Taxes” (“FIN 48”), we recognize tax benefits from an uncertain tax position when it is more likely than not that the position will be sustained upon examination, including resolutions of any related appeals or litigation processes, based on the technical merits. We recognize tax liabilities in accordance with FIN 48 and we adjust these liabilities when our judgment changes as a result of the evaluation of new information not previously available. Due to the complexity of some of these uncertainties, the ultimate resolution may result in a payment that is materially different from our current estimate of the tax liabilities. These differences will be reflected as increases or decreases to income tax expense in the period in which they are determined. Stock-Based Compensation - We measure compensation expense for stock awards in accordance with SFAS No. 123, “Accounting for Stock-Based Compensation” (“SFAS 123(R)”). Stock award compensation costs net of an estimated forfeiture rate of 10% are recognized on a straight-line basis over the requisite service period of the award, which is generally the vesting term of five years. The fair value of stock options was estimated at the grant date using a Black-Scholes option pricing model with the following assumptions for 2009: risk-free interest rate – 3.23%, volatility factor – 54.17% and expected option life – 6.3 years (dividend yield is not a factor as we have never issued cash dividends and do not anticipate issuing cash dividends in the future). For SFAS 123(R) calculation purposes, the weighted average grant date fair value of option shares granted in 2009 was $4.27 per option share. If we increased the assumptions for the risk-free interest rate and the volatility factor by 50 percent, the fair value of stock options granted in 2009 would increase 33 percent. If the Company decreased its assumptions for the risk-free interest rate and the volatility factor by 50 percent, the fair value of stock options granted in 2009 would decrease 45 percent. Other – Other accounting policies, although not generally subject to the same level of estimation as those discussed above, are nonetheless important to an understanding of the financial statements. Many assets, liabilities, revenue and expenses require some degree of estimation or judgment in determining the appropriate accounting.
43 43
Liquidity and Capital Resources As of March 31, 2009 and 2008, cash and cash equivalents and investments totaled approximately $278.1 million and $286.4 million, respectively. Fiscal 2009 compared to Fiscal 2008 Net cash provided by operating activities during 2009 was $232.0 million, a decrease of $2.7 million from 2008. The decrease was due to the following: (1) reduction in customer collections of $118 million resulting from the decline in revenue, primarily professional services and license fees, and to a lesser extent timing of collections on trade receivables; (2) increase in income taxes paid during 2009 compared to 2008 of $20 million; (3) cash paid for hedge contract settlements during 2009 of $13 million; and (4) a decrease in interest income of $11 million primarily due to the lower cash and investment balance in 2009 compared to 2008. These decreases were partially offset by the following: (1) reductions in disbursements for employee payroll and benefits of $126 million primarily resulting from the cost savings achieved through our 2008 and 2009 restructuring initiatives; (2) reduction in vendor payments of $28 million related to cost-cutting initiatives implemented throughout the year to control our operating costs; and (3) a reduction of $5 million due to a litigation settlement in the first quarter of 2008. The Consolidated Statements of Cash Flows included in item 8 of this report computes net cash from operating activities using the indirect cash flow method. Therefore non-cash adjustments and net changes in assets and liabilities (net of the effects of acquisitions and currency fluctuations) are adjusted from net income to derive net cash from operating activities. Changes in accounts receivable and deferred revenue have typically had the largest impact on the reconciliation of net income to compute cash flows from operating activities as we allow for deferred payment terms on multi-year products contracts. The increase in the net change of accounts receivable of $81.9 million and the decrease in the net change of deferred revenue of $60.9 million from 2009 as compared to 2008 are primarily due to a decrease in the dollar value of multi-year products transactions. The other significant change in our reconciliation of net income to derive net cash from operating activities during 2009 as compared to 2008 relates to the change in accounts payable and accrued expenses causing cash flows from operating activities to decrease by $28.8 million. This change was primarily due to a larger restructuring initiative in 2008 compared to 2009 and higher commission and bonus expenses in 2008 compared to 2009, causing the associated accruals to be higher at March 31, 2008 as compared to March 31, 2009. As of March 31, 2009, $3.6 million was accrued related to restructuring actions (see Note 7 of the Notes to Consolidated Financial Statements, included in Item 8 of this report). We continue to evaluate our business processes to identify ways to reduce costs. Any further actions will likely result in additional restructuring charges. The amount of such charges will depend upon the nature, timing and extent of the restructuring actions taken. We believe our existing cash resources and cash flow from operations will be sufficient to meet operating cash needs for the foreseeable future. Net cash provided by investing activities: Net cash provided by investing activities during 2009 was $37.2 million, a decrease of $40.0 million from 2008. The decrease was primarily due to a $36.5 million decline in the amount of investments liquidated in 2009 compared to 2008. The cash generated from the sale of our investments in both periods was primarily used to fund the stock repurchase initiative.
44 44
During 2009 and 2008, capital expenditures for property and equipment and capitalized research and software development totaled $33.0 million and $24.9 million, respectively, and were funded with cash flow from operations. There were no business acquisitions in 2009 and $4.7 million of business acquisitions in 2008. We continue to evaluate business acquisition opportunities that fit our strategic plans. In March 2009, we entered into a Letter of Intent to sell our Quality and DevPartner distributed product families to an affiliate of Micro Focus International PLC and executed the related asset purchase agreement in May 2009. The sale price in the transaction is $80 million, less certain adjustments relating to cash collected or invoiced for deferred maintenance. We anticipate the net proceeds from this divestiture will be approximately $50 million (see Note 3 of the Notes to Consolidated Financial Statements, included in Item 8 of this report). Net cash used in financing activities: Net cash used in financing activities during 2009 was $191.8 million, a decrease of $177.9 million from 2008. The decrease of $234.9 million in cash used to repurchase common stock was offset by the $57.0 million decline in net proceeds received from the exercise of employee stock options and employee contributions to the employee stock purchase plan. Since May 2003, the Board of Directors has authorized the repurchase of a total of $1.7 billion of our common stock under a Discretionary Plan. Purchases of common stock under the Discretionary Plan may occur on the open market, or through negotiated or block transactions based upon market and business conditions, subject to applicable legal limitations. On September 5, 2008, pursuant to authorization granted by the Board of Directors, we entered into an agreement under Rule 10b5-1 of the Securities Exchange Act of 1934 (“Rule 10b5-1 Plan”) to repurchase up to 14 million shares of our common stock according to a predetermined formula. Due to the instability in the credit market that occurred near the end of the second quarter of 2009, we terminated the Rule 10b5-1 Plan on September 29, 2008. During 2009, we repurchased approximately 21.6 million shares of our common stock at an average price of $9.54 per share for a total cost of $206 million. As of March 31, 2009, approximately $537 million remains authorized for future purchases under the Discretionary Plan. We intend to continue repurchasing shares under the Discretionary Plan, funded primarily through our operating cash flow and, if needed, funds from our credit facility. Our long-term goal is to reduce our outstanding common share count to approximately 200 million shares. We reserve the right to change the timing and volume of our repurchases at any time without notice. The maximum amount of repurchase activity under the Discretionary Plan, excluding block purchases and negotiated transactions, continues to be limited on a daily basis to 25% of the average daily trading volume of our common stock during the previous four week period. In addition, no purchases are made during our self-imposed trading black-out periods in which the Company and our insiders are prohibited from trading in our common shares. Our standard quarterly black-out period commences 10 business days prior to the end of each quarter and terminates one full market day following the public release of our earnings. The Company has a credit facility with Comerica Bank and other lenders to provide leverage for the Company if needed. The credit facility provides for a revolving line of credit in the amount of $150 million and expires on November 1, 2012. The credit facility also permits us to increase the facility by an additional $150 million, subject to receiving further commitments from lenders and certain other conditions. The credit facility also limits borrowing outside of the facility to $250 million. No borrowings have occurred under this credit facility.
45 45
Fiscal 2008 compared to Fiscal 2007 Net cash provided by operating activities:
Cash provided by operating activities during 2008 was $234.7 million, an increase of $30.0 million from 2007. The increase was due to lower payroll and vendor related disbursements of approximately $28.0 million primarily resulting from the net operating cost savings achieved through our 2008 restructuring initiatives and a reduction of $15.9 million in income tax payments in 2008 compared to 2007. The increase was partially offset by a decrease in investment interest income received during 2008 resulting from a lower average cash equivalent and investment balance in 2008 as we continued to use funds to repurchase our common shares. The decrease in the net change of accounts receivable of $125.2 million and the increase in the net change of deferred revenue of $103.3 million from 2009 as compared to 2008 were primarily due to an increase in multi-year products deals. Other significant changes in our reconciliation of net income to derive net cash from operating activities were as follows: (1) increase in the net change of accounts payable and accrued expenses of $45.6 million from 2008 as compared to 2007, primarily due to the reversal of the income tax reserve in fiscal 2007 related to the settlement of previous years open tax issues with the IRS and the increase in bonus and commission accruals; (2) the gain on sale of ForeSee Results, Inc. of $11.3 million that was realized in 2007 (the cash proceeds were included in our investing activities during 2007); and (3) impairment charges for property and equipment and capitalized software of $6.9 million recorded in 2008. As of March 31, 2008, $7.5 million was accrued related to restructuring actions (see Note 7 of the Notes to Consolidated Financial Statements, included in Item 8 of this report). Net cash provided by investing activities: Cash provided by investing activities during 2008 was $77.2 million, an increase of $23.4 million from 2007. The increase was primarily due to a $47.2 million decline in the amount of cash used to acquire businesses during 2008 compared to 2007 partially offset by $26.7 million of cash received in 2007 for the sale of our former headquarters building and the sale of our investment in ForeSee Results, Inc. (see Notes 2, 4 and 5 of the Notes to Consolidated Financial Statements, included in Item 8 of this report for more details). Net cash used in financing activities: Cash used in financing activities during 2008 was $369.7 million, a decrease of $248.0 million from 2007. The decrease was primarily due to a $235.8 million reduction in our repurchases of our common stock in 2008 compared to 2007 and an increase of $12.8 million in net proceeds from the exercise of employee stock options. During 2008, we repurchased 37.6 million shares of our common stock under the Discretionary Plan at an average price of $8.61 per share for a total of $324.1 million and we repurchased 11.3 million shares for an aggregate $109.7 million and settled an additional $7.2 million of trades that occurred during the fourth quarter of 2007.
46 46
Recently Issued Accounting Pronouncements In April 2008, the Financial Accounting Standards Board (“FASB”) issued FSP No. 142-3, “Determination of the Useful Life of Intangible Assets ” (FSP No. 142-3) that amends the factors considered in developing renewal or extension assumptions used to determine the useful life of a recognized intangible asset under SFAS No. 142. FSP No. 142-3 requires a consistent approach between the useful life of a recognized intangible asset under SFAS No. 142 and the period of expected cash flows used to measure the fair value of an asset under SFAS No. 141(R). The FSP also requires enhanced disclosures when an intangible asset’s expected future cash flows are affected by an entity’s intent and/or ability to renew or extend the arrangement. FSP No. 142-3 is effective for financial statements issued for fiscal years beginning after December 15, 2008 and is applied prospectively. The Company does not expect the adoption of FSP No.142-3 to have a material impact on its consolidated results of operations or financial condition. In March 2008, the FASB issued Statement of Financial Accounting Standards (“SFAS”) No. 161, “Disclosures about Derivative Instruments and Hedging Activities, an Amendment of FASB Statement No. 133” (“SFAS No. 161”). This Statement changes the disclosure requirements for derivative instruments and hedging activities. Entities are required to provide enhanced disclosures about (a) how and why an entity uses derivative instruments, (b) how derivative instruments and related hedged items are accounted for under Statement 133 and its related interpretations, and (c) how derivative instruments and related hedged items affect an entity’s financial position, financial performance, and cash flows. This Statement is effective for fiscal years beginning after November 15, 2008. Because SFAS No. 161 applies only to financial statement disclosures, it will not have any impact on the Company’s consolidated results of operations and financial condition. In February 2008, the FASB issued FASB Staff Position 157-1, “Application of FASB Statement No. 157 to FASB Statement No. 13 and Other Accounting Pronouncements that Address Fair Value Measurements for Purposes of Lease Classification or Measurement under Statement 13 ” (“FSP 157-1”) and FASB Staff Position No. FAS 157–2, “Effective Date of FASB Statement No. 157” (“FSP 157-2”). FSP 157-1 amends SFAS No. 157 to remove certain leasing transactions from its scope, and was effective upon initial adoption of SFAS No. 157. FSP 157-2 provides a one year deferral of the effective date of SFAS 157 for non–financial assets and non–financial liabilities, except those that are recognized or disclosed in the financial statements at fair value at least annually. Therefore, the Company has adopted the provisions of SFAS No. 157 with respect to its financial assets and liabilities only. SFAS No. 157 defines fair value, establishes a framework for measuring fair value under generally accepted accounting principles and enhances disclosures about fair value measurements. Fair value is defined under SFAS No. 157 as the price that would be received to sell an asset or paid to transfer a liability (an exit price) in the principal or most advantageous market for the asset or liability in an orderly transaction between market participants on the measurement date. Valuation techniques used to measure fair value under SFAS No. 157 must maximize the use of observable inputs and minimize the use of unobservable inputs. The standard describes a fair value hierarchy based on three levels of inputs, of which the first two are considered observable and the last unobservable, that may be used to measure fair value, which are the following:
• Level 1 – Quoted prices in active markets for identical assets or liabilities. • Level 2 – Inputs other than Level 1 that are observable, either directly or indirectly, such as
quoted prices for similar assets or liabilities; quoted prices in markets that are not active; or other inputs that are observable or can be corroborated by observable market data for substantially the full term of the assets or liabilities.
• Level 3 – Unobservable inputs that are supported by little or no market activity and that are
significant to the fair value of the assets or liabilities. The adoption of SFAS No. 157 did not have a material impact on the Company’s consolidated results of operations and financial condition.

47 47
In December 2007, the FASB issued SFAS No. 141 (R), “Business Combinations”, which replaces Statement of Financial Accounting Standards No. 141, “Business Combinations”. This Statement requires assets and liabilities acquired in a business combination, contingent consideration and certain acquired contingencies, to be measured at their fair value as of the date of acquisition. This Statement also requires that acquisition-related costs and restructuring costs be recognized separately from the business combination. This Statement is effective for fiscal years beginning after December 15, 2008. Its effects on future periods will depend on the nature and significance of any acquisitions subject to this Statement. Contractual Obligations The following table summarizes our payments under contractual obligations and our other commercial commitments as of March 31, 2009 (in thousands):
2015 andTotal 2010 2011 2012 2013 2014 Thereafter
Contractual obligations: Operating leases 268,815$ 23,888$ 14,948$ 9,471$ 6,308$ 1,676$ 212,524$ Other 13,900 5,600 3,450 3,450 450 450 500
Total 282,715$ 29,488$ 18,398$ 12,921$ 6,758$ 2,126$ 213,024$
Payment Due by Period as of March 31,
”Other” includes commitments under various advertising and charitable contribution agreements totaling $12.9 million and $1.0 million, respectively, at March 31, 2009. There are no long term debt obligations, capital lease obligations or purchase obligations. We anticipate settlement of $10.8 million with certain taxing authorities of which $87,000 is expected to be settled in the upcoming twelve months (as discussed in Note 12 of the Notes to Consolidated Financial Statements, included in Item 8 of this report). We are not able to reasonably estimate in which future periods the remaining amount of $10.7 million will ultimately be settled. These settlements are not included in the Contractual Obligations table above. Off-Balance Sheet Arrangements We currently do not have any off balance sheet or non-consolidated special purpose entity arrangements as defined by the applicable SEC rules.

48 48
ITEM 7A. QUANTITATIVE AND QUALITATIVE DISCLOSURE ABOUT MARKET RISK We are exposed primarily to market risks associated with movements in interest rates and foreign currency exchange rates. We believe that we take the necessary steps to manage the potential impact of interest rate and foreign exchange exposures on our financial position and operating performance. We do not use derivative financial instruments or forward foreign exchange contracts for investment, speculative or trading purposes. Immediate changes in interest rates and foreign currency rates discussed in the following paragraphs are hypothetical rate scenarios used to calibrate risk and do not currently represent management’s view of future market developments. A discussion of our accounting policies for derivative instruments is included in Note 1 of the Notes to Consolidated Financial Statements, included in Item 8 of this report. Interest Rate Risk Exposure to market risk for changes in interest rates relates primarily to our cash investments and installment receivables. Derivative financial instruments are not a part of our investment strategy. Cash investments are placed with high quality issuers to preserve invested funds by limiting default and market risk. Our investment portfolio consists of cash investments that have a cost basis and fair value totaling $278.1 million as of March 31, 2009. The average interest rate and average tax equivalent interest rate are 0.59% and 0.63%, respectively, as of March 31, 2009. These investments will mature within the next three months. We offer financing arrangements with installment payment terms in connection with our multi-year software sales. Installment accounts are generally receivable over a two to five year period. As of March 31, 2009, non-current accounts receivable amounted to $224.7 million, of which approximately $149.5 million, $51.6 million, $18.7 million, $3.2 million and $1.7 million are due in fiscal 2011 through 2015, respectively. The fair value of non-current accounts receivable is estimated by discounting the future cash flows using the current rate at which the Company would finance a similar transaction. At March 31, 2009, the fair value of such receivables is approximately $224.4 million. Each 100 basis point increase in interest rates would have an associated $1.1 million negative impact on the fair value of non-current accounts receivable based on the balance of such receivables at March 31, 2009. Each 100 basis point decrease in interest rates would have an associated $525,000 positive impact on the fair value of non-current accounts receivable based on the balance of such receivables at March 31, 2009. A change in interest rates will have no impact on cash flows or net income associated with non-current accounts receivable. Foreign Currency Risk Approximately 38% of our revenue was derived from foreign sources in 2009. This exposes us to exchange rate risks on foreign currencies related to the fair value of foreign assets and liabilities, net income and cash flows. We have entered into forward foreign exchange contracts primarily to hedge amounts due to or from select subsidiaries denominated in foreign currencies (mainly in Europe and Asia-Pacific) against fluctuations in exchange rates. Our accounting policies for these contracts are based on our designation of the contracts as hedging transactions. The criteria we use for designating a contract as a hedge include the contract’s effectiveness in risk reduction and one-to-one matching of derivative instruments to underlying transactions. Gains and losses on forward foreign exchange contracts are recognized in income, offsetting foreign exchange gains or losses on the foreign balances being hedged. If the underlying hedged transaction is terminated earlier than initially anticipated, the offsetting gain or loss on the related forward foreign exchange contract would be recognized in income in the same period.
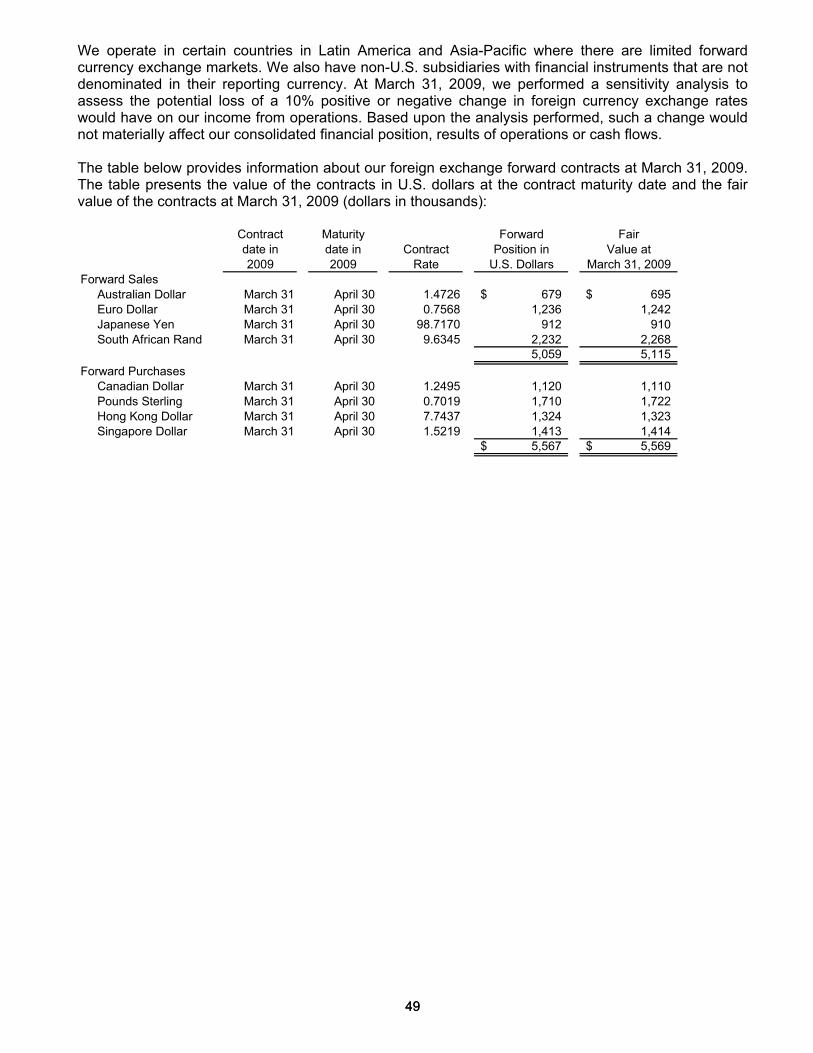
49 49
We operate in certain countries in Latin America and Asia-Pacific where there are limited forward currency exchange markets. We also have non-U.S. subsidiaries with financial instruments that are not denominated in their reporting currency. At March 31, 2009, we performed a sensitivity analysis to assess the potential loss of a 10% positive or negative change in foreign currency exchange rates would have on our income from operations. Based upon the analysis performed, such a change would not materially affect our consolidated financial position, results of operations or cash flows. The table below provides information about our foreign exchange forward contracts at March 31, 2009. The table presents the value of the contracts in U.S. dollars at the contract maturity date and the fair value of the contracts at March 31, 2009 (dollars in thousands):
Contract Maturity Forward Fairdate in date in Contract Position in Value at2009 2009 Rate U.S. Dollars March 31, 2009
Forward Sales Australian Dollar March 31 April 30 1.4726 679$ 695$ Euro Dollar March 31 April 30 0.7568 1,236 1,242 Japanese Yen March 31 April 30 98.7170 912 910 South African Rand March 31 April 30 9.6345 2,232 2,268
5,059 5,115
Forward Purchases Canadian Dollar March 31 April 30 1.2495 1,120 1,110 Pounds Sterling March 31 April 30 0.7019 1,710 1,722 Hong Kong Dollar March 31 April 30 7.7437 1,324 1,323 Singapore Dollar March 31 April 30 1.5219 1,413 1,414
5,567$ 5,569$
50 50
ITEM 8. FINANCIAL STATEMENTS AND SUPPLEMENTARY DATA
REPORT OF INDEPENDENT REGISTERED PUBLIC ACCOUNTING FIRM
To the Board of Directors and Shareholders of Compuware Corporation Detroit, Michigan We have audited the accompanying consolidated balance sheets of Compuware Corporation and subsidiaries (the "Company") as of March 31, 2009 and 2008, and the related consolidated statements of operations, shareholders' equity, and cash flows for each of the three years in the period ended March 31, 2009. These financial statements are the responsibility of the Company's management. Our responsibility is to express an opinion on these financial statements based on our audits. We conducted our audits in accordance with the standards of the Public Company Accounting Oversight Board (United States). Those standards require that we plan and perform the audit to obtain reasonable assurance about whether the financial statements are free of material misstatement. An audit includes examining, on a test basis, evidence supporting the amounts and disclosures in the financial statements. An audit also includes assessing the accounting principles used and significant estimates made by management, as well as evaluating the overall financial statement presentation. We believe that our audits provide a reasonable basis for our opinion. In our opinion, such consolidated financial statements present fairly, in all material respects, the financial position of Compuware Corporation and subsidiaries as of March 31, 2009 and 2008, and the results of their operations and their cash flows for each of the three years in the period ended March 31, 2009, in conformity with accounting principles generally accepted in the United States of America. As discussed in Note 12 to the consolidated financial statements, effective April 1, 2007 the Company adopted Financial Accounting Standards Board (“FASB”) Interpretation No. 48, Accounting for Uncertainty in Income Taxes – an Interpretation of FASB Statement No. 109. We have also audited, in accordance with the standards of the Public Company Accounting Oversight Board (United States), the Company's internal control over financial reporting as of March 31, 2009, based on the criteria established in Internal Control—Integrated Framework issued by the Committee of Sponsoring Organizations of the Treadway Commission and our report dated May 27, 2009 expressed an unqualified opinion on the Company's internal control over financial reporting.
/s/ DELOITTE & TOUCHE LLP
Detroit, Michigan May 27, 2009
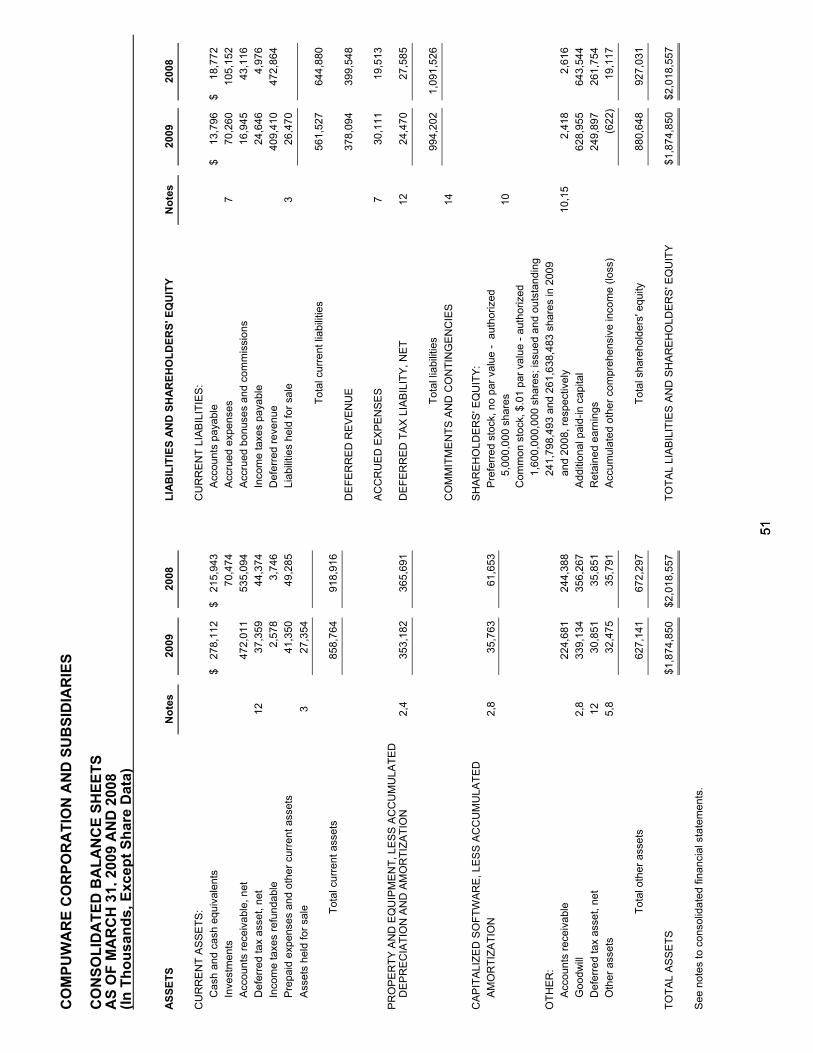
51
51
CO
MP
UW
AR
E C
OR
PO
RA
TIO
N A
ND
SU
BS
IDIA
RIE
S C
ON
SO
LID
AT
ED
BA
LA
NC
E S
HE
ET
S
AS
OF
MA
RC
H 3
1, 2
009
AN
D 2
008
(In
Th
ou
san
ds,
Exc
ept
Sh
are
Dat
a)
AS
SE
TS
N
ote
s 20
09
2008
LIA
BIL
ITIE
S A
ND
SH
AR
EH
OL
DE
RS
' EQ
UIT
Y
No
tes
2009
20
08
C
UR
RE
NT
AS
SE
TS
:
C
UR
RE
NT
LIA
BIL
ITIE
S:
C
ash
and
cash
equ
ival
ents
$ 27
8,11
2
$ 21
5,94
3
A
ccou
nts
paya
ble
$ 13
,796
$
18,7
72
In
vest
men
ts
70
,474
Acc
rued
exp
ense
s 7
70
,260
10
5,15
2
A
ccou
nts
rece
ivab
le, n
et
472,
011
53
5,09
4
A
ccru
ed b
onus
es a
nd c
omm
issi
ons
16,9
45
43,1
16
D
efer
red
tax
asse
t, ne
t
12
37,3
59
44,3
74
In
com
e ta
xes
paya
ble
24,6
46
4,97
6
In
com
e ta
xes
refu
ndab
le
2,57
8
3,74
6
D
efer
red
reve
nue
409,
410
47
2,86
4
P
repa
id e
xpen
ses
and
othe
r cu
rren
t ass
ets
41,3
50
49,2
85
Li
abili
ties
held
for
sale
3
26
,470
A
sset
s he
ld fo
r sa
le
3
27,3
54
T
otal
cur
rent
liab
ilitie
s
56
1,52
7
644,
880
T
otal
cur
rent
ass
ets
858,
764
91
8,91
6
D
EF
ER
RE
D R
EV
EN
UE
37
8,09
4
399,
548
A
CC
RU
ED
EX
PE
NS
ES
7
30
,111
19
,513
P
RO
PE
RT
Y A
ND
EQ
UIP
ME
NT
, LE
SS
AC
CU
MU
LAT
ED
D
EP
RE
CIA
TIO
N A
ND
AM
OR
TIZ
AT
ION
2,
4
353,
182
36
5,69
1
DE
FE
RR
ED
TA
X L
IAB
ILIT
Y, N
ET
12
24,4
70
27,5
85
Tot
al li
abili
ties
994,
202
1,
091,
526
C
OM
MIT
ME
NT
S A
ND
CO
NT
ING
EN
CIE
S
14
C
AP
ITA
LIZ
ED
SO
FT
WA
RE
, LE
SS
AC
CU
MU
LAT
ED
S
HA
RE
HO
LDE
RS
' EQ
UIT
Y:
A
MO
RT
IZA
TIO
N
2,8
35
,763
61
,653
Pre
ferr
ed s
tock
, no
par
valu
e -
aut
horiz
ed
5,
000,
000
shar
es
10
C
omm
on s
tock
, $.0
1 pa
r va
lue
- au
thor
ized
1,
600,
000,
000
shar
es; i
ssue
d an
d ou
tsta
ndin
g
OT
HE
R:
241,
798,
493
and
261,
638,
483
shar
es in
200
9
A
ccou
nts
rece
ivab
le
224,
681
24
4,38
8
and
2008
, res
pect
ivel
y 10
,15
2,
418
2,
616
G
oodw
ill
2,8
33
9,13
4
356,
267
Add
ition
al p
aid-
in c
apita
l
62
8,95
5
643,
544
D
efer
red
tax
asse
t, ne
t
12
30
,851
35
,851
Ret
aine
d ea
rnin
gs
249,
897
26
1,75
4
O
ther
ass
ets
5,
8
32,4
75
35,7
91
A
ccum
ulat
ed o
ther
com
preh
ensi
ve in
com
e (lo
ss)
(622
) 19
,117
Tot
al o
ther
ass
ets
627,
141
67
2,29
7
T
otal
sha
reho
lder
s' e
quity
88
0,64
8
927,
031
TO
TA
L A
SS
ET
S
$1,8
74,8
50
$2,0
18,5
57
TO
TA
L LI
AB
ILIT
IES
AN
D S
HA
RE
HO
LDE
RS
' EQ
UIT
Y
$1,8
74,8
50
$2,0
18,5
57
S
ee n
otes
to c
onso
lidat
ed fi
nanc
ial s
tate
men
ts.

52 52
COMPUWARE CORPORATION AND SUBSIDIARIES CONSOLIDATED STATEMENTS OF OPERATIONSYEARS ENDED MARCH 31, 2009, 2008 and 2007(In Thousands, Except Per Share Data)
Notes 2009 2008 2007REVENUES: Software license fees $ 219,634 $ 297,506 $ 283,412 Maintenance fees 479,480 476,374 457,594 Professional services fees 391,341 455,731 471,996 Total revenues 1,090,455 1,229,611 1,213,002 OPERATING EXPENSES: Cost of software license fees 24,491 30,475 28,581 Cost of maintenance fees 41,877 46,300 41,533 Cost of professional services 368,030 413,921 420,729 Technology development and support 86,453 101,132 114,071 Sales and marketing 226,408 267,800 281,730 Administrative and general 148,019 182,488 193,578 Restructuring costs 7 10,037 42,645 Total operating expenses 905,315 1,084,761 1,080,222 INCOME FROM OPERATIONS 185,140 144,850 132,780 OTHER INCOME (EXPENSE)
Interest income 10,776 19,910 39,427Settlement 14 17,943 16,160 10,598Gain on sale of investment in partially owned company 5 11,250Other 5 (1,138) (528) (998)
Other income, net 27,581 35,542 60,277
INCOME BEFORE INCOME TAXES 212,721 180,392 193,057 INCOME TAX PROVISION 12 73,074 45,998 34,965 NET INCOME $ 139,647 $ 134,394 $ 158,092 Basic earnings per share 11 $ 0.56 $ 0.47 $ 0.45 Diluted earnings per share 11 $ 0.55 $ 0.47 $ 0.45 See notes to consolidated financial statements.
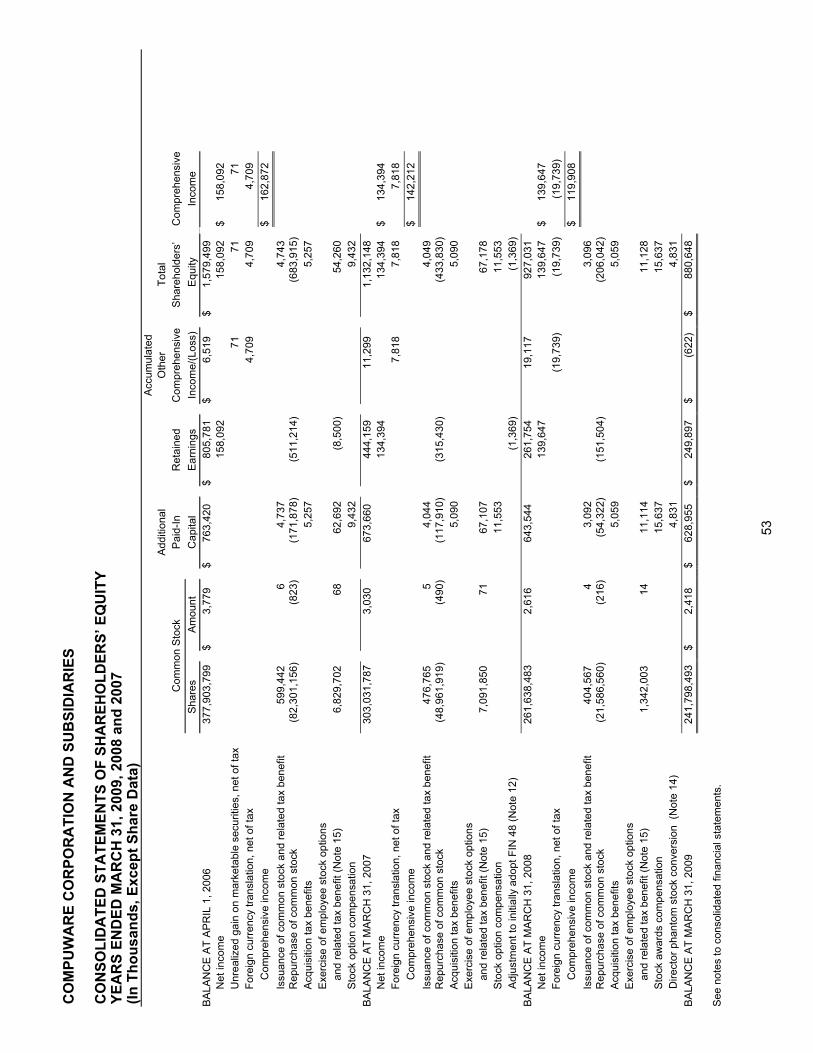
53
CO
MP
UW
AR
E C
OR
PO
RA
TIO
N A
ND
SU
BS
IDIA
RIE
S
CO
NS
OL
IDA
TE
D S
TA
TE
ME
NT
S O
F S
HA
RE
HO
LD
ER
S’ E
QU
ITY
YE
AR
S E
ND
ED
MA
RC
H 3
1, 2
009,
200
8 an
d 2
007
(In
Th
ou
san
ds,
Exc
ept
Sh
are
Dat
a)
A
ccum
ulat
ed
Add
ition
al
Oth
er
Tot
al
Com
mon
Sto
ck
Pai
d-In
R
etai
ned
C
ompr
ehen
sive
Sha
reho
lder
s’
Com
preh
ensi
ve
Sha
res
Am
ount
C
apita
l E
arni
ngs
In
com
e/(L
oss)
Equ
ity
Inco
me
BA
LAN
CE
AT
AP
RIL
1, 2
006
37
7,90
3,79
9$
3
,779
$
763,
420
$ 80
5,78
1 $
6,51
9 $
1,57
9,49
9
Net
inco
me
158,
092
15
8,09
2 $
158,
092
U
nrea
lized
gai
n on
mar
keta
ble
secu
ritie
s, n
et o
f tax
71
71
71
F
orei
gn c
urre
ncy
tran
slat
ion,
net
of t
ax
4,
709
4,70
9 4,
709
C
ompr
ehen
sive
inco
me
$
162,
872
Is
suan
ce o
f com
mon
sto
ck a
nd r
elat
ed ta
x be
nefit
59
9,44
26
4,73
7
4,
743
R
epur
chas
e of
com
mon
sto
ck
(82,
301,
156)
(823
)(1
71,8
78)
(511
,214
)
(683
,915
)
Acq
uisi
tion
tax
bene
fits
5,25
7
5,
257
E
xerc
ise
of e
mpl
oyee
sto
ck o
ptio
ns
and
rela
ted
tax
bene
fit (
Not
e 15
) 6,
829,
702
6862
,692
(8,5
00)
54
,260
Sto
ck o
ptio
n co
mpe
nsat
ion
9,
432
9,43
2
BA
LAN
CE
AT
MA
RC
H 3
1, 2
007
30
3,03
1,78
7
3,03
0
673,
660
44
4,15
9
11,2
99
1,
132,
148
N
et in
com
e 13
4,39
4
134,
394
$ 13
4,39
4
For
eign
cur
renc
y tr
ansl
atio
n, n
et o
f tax
7,81
8 7,
818
7,81
8
C
ompr
ehen
sive
inco
me
$
142,
212
Is
suan
ce o
f com
mon
sto
ck a
nd r
elat
ed ta
x be
nefit
47
6,76
55
4,04
4
4,
049
R
epur
chas
e of
com
mon
sto
ck
(48,
961,
919)
(490
)(1
17,9
10)
(315
,430
)
(433
,830
)
Acq
uisi
tion
tax
bene
fits
5,09
0
5,
090
E
xerc
ise
of e
mpl
oyee
sto
ck o
ptio
ns
and
rela
ted
tax
bene
fit (
Not
e 15
) 7,
091,
850
7167
,107
67,1
78
S
tock
opt
ion
com
pens
atio
n
11,5
53
11
,553
A
djus
tmen
t to
initi
ally
ado
pt F
IN 4
8 (N
ote
12)
(1,3
69)
(1
,369
)
BA
LAN
CE
AT
MA
RC
H 3
1, 2
008
26
1,63
8,48
3
2,61
6
643,
544
26
1,75
4
19,1
17
92
7,03
1
Net
inco
me
139,
647
13
9,64
7 $
139,
647
F
orei
gn c
urre
ncy
tran
slat
ion,
net
of t
ax
(1
9,73
9)
(19,
739)
(19,
739)
C
ompr
ehen
sive
inco
me
$
119,
908
Is
suan
ce o
f com
mon
sto
ck a
nd r
elat
ed ta
x be
nefit
40
4,56
74
3,09
2
3,
096
R
epur
chas
e of
com
mon
sto
ck
(21,
586,
560)
(216
)(5
4,32
2)(1
51,5
04)
(2
06,0
42)
A
cqui
sitio
n ta
x be
nefit
s 5,
059
5,05
9
Exe
rcis
e of
em
ploy
ee s
tock
opt
ions
an
d re
late
d ta
x be
nefit
(N
ote
15)
1,34
2,00
314
11,1
14
11
,128
Sto
ck a
war
ds c
ompe
nsat
ion
15
,637
15,6
37
Dire
ctor
pha
ntom
sto
ck c
onve
rsio
n (
Not
e 14
) 4,
831
4,83
1
BA
LAN
CE
AT
MA
RC
H 3
1, 2
009
24
1,79
8,49
3$
2
,418
$
628,
955
$ 24
9,89
7 $
(622
) $
880,
648
See
not
es to
con
solid
ated
fina
ncia
l sta
tem
ents
.
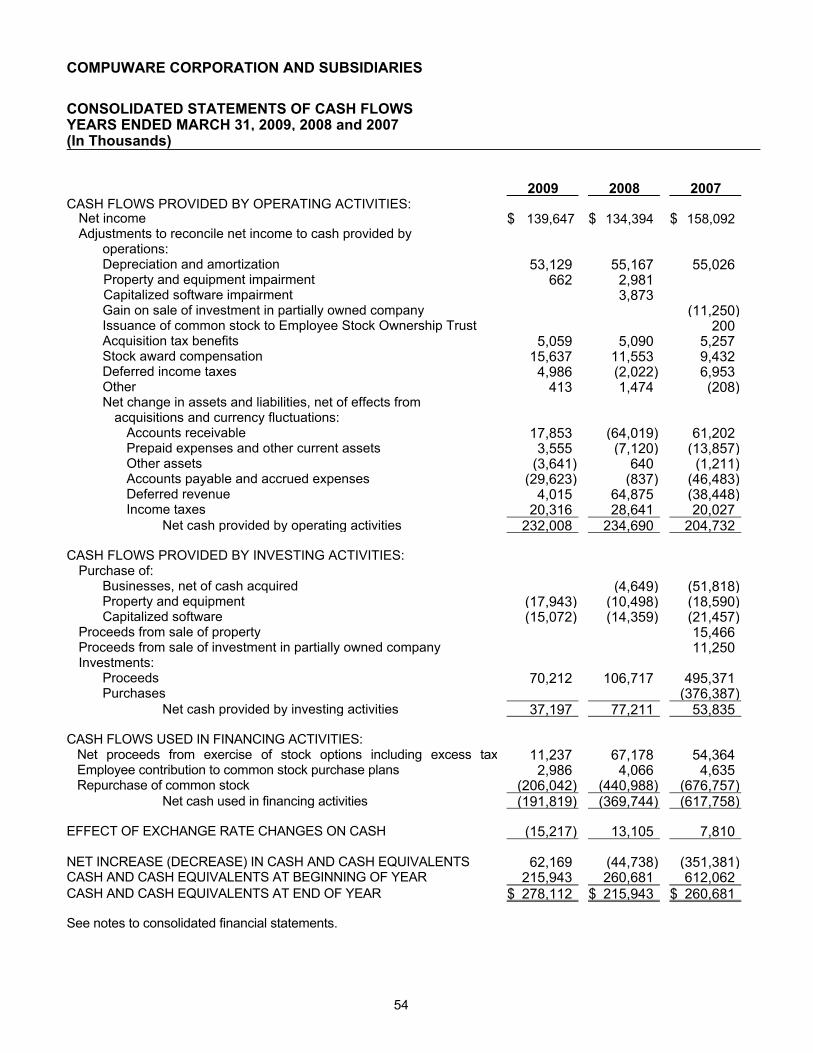
54
COMPUWARE CORPORATION AND SUBSIDIARIES
CONSOLIDATED STATEMENTS OF CASH FLOWSYEARS ENDED MARCH 31, 2009, 2008 and 2007(In Thousands)
2009 2008 2007CASH FLOWS PROVIDED BY OPERATING ACTIVITIES: Net income $ 139,647 $ 134,394 $ 158,092 Adjustments to reconcile net income to cash provided by operations: Depreciation and amortization 53,129 55,167 55,026 Property and equipment impairment 662 2,981 Capitalized software impairment 3,873 Gain on sale of investment in partially owned company (11,250) Issuance of common stock to Employee Stock Ownership Trust 200 Acquisition tax benefits 5,059 5,090 5,257 Stock award compensation 15,637 11,553 9,432 Deferred income taxes 4,986 (2,022) 6,953 Other 413 1,474 (208) Net change in assets and liabilities, net of effects from acquisitions and currency fluctuations: Accounts receivable 17,853 (64,019) 61,202 Prepaid expenses and other current assets 3,555 (7,120) (13,857) Other assets (3,641) 640 (1,211) Accounts payable and accrued expenses (29,623) (837) (46,483) Deferred revenue 4,015 64,875 (38,448) Income taxes 20,316 28,641 20,027 Net cash provided by operating activities 232,008 234,690 204,732 CASH FLOWS PROVIDED BY INVESTING ACTIVITIES: Purchase of: Businesses, net of cash acquired (4,649) (51,818) Property and equipment (17,943) (10,498) (18,590) Capitalized software (15,072) (14,359) (21,457) Proceeds from sale of property 15,466 Proceeds from sale of investment in partially owned company 11,250 Investments: Proceeds 70,212 106,717 495,371 Purchases (376,387) Net cash provided by investing activities 37,197 77,211 53,835 CASH FLOWS USED IN FINANCING ACTIVITIES: Net proceeds from exercise of stock options including excess tax 11,237 67,178 54,364 Employee contribution to common stock purchase plans 2,986 4,066 4,635 Repurchase of common stock (206,042) (440,988) (676,757) Net cash used in financing activities (191,819) (369,744) (617,758) EFFECT OF EXCHANGE RATE CHANGES ON CASH (15,217) 13,105 7,810 NET INCREASE (DECREASE) IN CASH AND CASH EQUIVALENTS 62,169 (44,738) (351,381)CASH AND CASH EQUIVALENTS AT BEGINNING OF YEAR 215,943 260,681 612,062CASH AND CASH EQUIVALENTS AT END OF YEAR $ 278,112 $ 215,943 $ 260,681 See notes to consolidated financial statements.
55
COMPUWARE CORPORATION AND SUBSIDIARIES NOTES TO CONSOLIDATED FINANCIAL STATEMENTS YEARS ENDED MARCH 31, 2009, 2008 and 2007
1. SUMMARY OF SIGNIFICANT ACCOUNTING POLICIES Business Compuware Corporation (the “Company” or “Compuware”) develops, markets and supports systems software products designed to improve the performance of information technology (“IT”) organizations. The Company’s software products consist of six major families: Mainframe, Vantage, Changepoint, Quality, Uniface and DevPartner; all of which are primarily intended for use by IT organizations and IT service providers. In addition, the Company offers a broad range of professional services and application services. The Company’s professional services provide customers with business systems analysis, design, communication, programming and implementation as well as software conversion and systems planning and consulting. The Company’s application services, which are marketed under the brand name “Covisint”, use business-to-business applications to integrate vital business information and processes between partners, customers and suppliers. The Company’s products and services are offered worldwide across a broad spectrum of technologies, including mainframe and distributed platforms. Basis of Presentation The consolidated financial statements include the accounts of Compuware Corporation and its wholly owned subsidiaries after elimination of all intercompany balances and transactions. The financial statements have been prepared in conformity with accounting principles generally accepted in the United States of America (“U.S. GAAP”), which require management to make estimates and assumptions that affect the reported amounts of assets, liabilities, shareholders’ equity and the disclosure of contingencies at March 31, 2009 and 2008 and the results of operations for the years ended March 31, 2009, 2008 and 2007. While management has based their assumptions and estimates on the facts and circumstances existing at March 31, 2009, final amounts may differ from estimates. Revenue Recognition The Company earns revenue from licensing software products, providing maintenance and support for those products and rendering professional services. The Company’s revenue recognition policies are in accordance with U.S. GAAP, including Statements of Position 97-2 “Software Revenue Recognition” and 98-9 “Modification of SOP 97-2, ‘Software Revenue Recognition,’ With Respect to Certain Transactions”, Securities and Exchange Commission Staff Accounting Bulletin (“SAB”) No. 104 and Emerging Issues Task Force Issue 00-21 “Revenue Arrangements with Multiple Deliverables”. Accordingly, in order to be eligible for revenue recognition, the following criteria must be met: persuasive evidence of an arrangement exists, delivery has occurred or services have been rendered, the fee is fixed or determinable and collectibility is reasonably assured. Software license fees - The Company's software license agreements provide its customers with a right to use its software perpetually (perpetual licenses) or during a defined term (term licenses). Perpetual license fee revenue is recognized using the residual method, under which the fair value, based on vendor specific objective evidence ("VSOE"), of all undelivered elements of the agreement (i.e., maintenance and professional services) is deferred. VSOE is based on rates charged for maintenance and professional services when sold separately. The remaining portion of the fee is recognized as license fee revenue upon delivery of the products, provided that no significant obligations remain and collection of the related receivable is reasonably assured.
56
For revenue arrangements where there is a lack of VSOE of fair value for any undelivered elements, license fee revenue is deferred and recognized upon delivery of those elements or when VSOE of fair value can be established. When maintenance or services are the only undelivered elements, the license fee revenue is recognized on a ratable basis over the longer of the maintenance term or over the period in which the services are expected to be performed. Such transactions include term licenses as the Company does not sell maintenance for term licenses separately and therefore cannot establish VSOE for the undelivered elements in these arrangements. These arrangements do not qualify for separate recognition of the software license fees, maintenance fees and as applicable, professional services fees under SOP 97-2 as amended. However, to comply with SEC Regulation S-X, Rule 5-03(b), which requires product, services and other categories of revenue to be displayed separately on the income statement, the Company separates the license fee, maintenance fee and professional services fee revenue based on its determination of fair value. The Company applies its VSOE of fair value for maintenance related to perpetual license transactions and stand alone services arrangements as a reasonable and consistent approximation of fair value to separate license fee, maintenance fee and professional services fee revenue for income statement classification purposes. The Company offers flexibility to customers purchasing licenses for its products and related maintenance. Terms of these transactions range from standard perpetual license sales that include one year of maintenance to large multi-year (generally two to five years), multi-product contracts. The Company allows deferred payment terms on contracts, with installments collectible over the term of the contract. Based on the Company’s successful collection history for deferred payments, license fees (net of any finance fees) are generally recognized as revenue as discussed above. In certain transactions where it cannot be concluded that the fee is fixed or determinable due to the nature of the deferred payment terms, the Company recognizes revenue as payments become due. Financing fees are recognized as interest income over the term of the receivable and amounted to $2.8 million, $3.4 million and $5.2 million for fiscal 2009, 2008 and 2007, respectively. At March 31, 2009, current accounts receivable includes installments on multi-year contracts totaling $237.2 million due in fiscal 2010. Non-current accounts receivable at March 31, 2009 amounted to $224.7 million, of which approximately $149.5 million, $51.6 million, $18.7 million, $3.2 million and $1.7 million are due in fiscal 2011 through 2015, respectively. Maintenance fees - The Company’s maintenance agreements provide for technical support and advice, including problem resolution services and assistance in product installation, error corrections and any product enhancements released during the maintenance period. The first year of maintenance is included with all license agreements. Maintenance revenue is recognized ratably over the term of the maintenance arrangements, which generally range from one to five years. Professional services fees – Professional services fees are generally based on hourly or daily rates. Revenues from professional services are recognized in the period the services are performed provided that collection of the related receivable is reasonably assured. For development services rendered under fixed-price contracts, revenue is recognized using the percentage of completion method and if determined that costs will exceed revenue, the expected loss is recorded at the time the loss becomes apparent. Certain professional services contracts include a project and on-going operations for the project. Revenue associated with these contracts is recognized over the expected service period as the customer derives value from the services, consistent with the proportional performance method. Deferred revenue - Deferred revenue consists primarily of billed and unbilled maintenance fees related to the remaining term of maintenance agreements in effect at those dates. Deferred license fees and services fees are also included in deferred revenue for those arrangements that are being recognized on a ratable basis. Commission costs associated with deferred revenue are also deferred and recorded as current or non-current other assets, as applicable, in the consolidated balance sheet. Long term deferred revenue at March 31, 2009 amounted to $378.1 million, of which approximately $204.4 million, $109.7 million, $46.8 million, $13.3 million and $3.9 million are expected to be recognized during fiscal 2011 through 2015, respectively.

57
Collection and remittance of taxes – the Company records the collection of taxes from customers and the remittance of these taxes to governmental authorities on a net basis in its consolidated statements of operations. Cash and Cash Equivalents The Company considers all investments with an original maturity of three months or less to be cash equivalents. Investments The Company did not have any investments at March 31, 2009. Investments at March 31, 2008 were $70.5 million and consisted of municipal obligations classified as held-to-maturity and carried at amortized cost. The amortization of bond premiums and discounts is included in “interest income” in the consolidated statements of operations. The fair value of investments at March 31, 2008 was $70.8 million. The Company classifies investments that mature within one year from the balance sheet date as current assets. Allowance for Doubtful Accounts The Company maintains an allowance for doubtful accounts for estimated losses resulting from the inability of customers to make required payments. The Company considers historical loss experience, current economic trends, the aging of outstanding accounts receivable and information available related to specific customers when estimating the allowance for doubtful accounts. The allowance is reviewed and adjusted based on the Company’s best estimates. The following table summarizes the allowance for doubtful accounts and changes to the allowance during each of the years ended March 31, 2009, 2008 and 2007 (in thousands):
AccountsBalance at charged resulting charged Balance at
beginning against from against the end ofAllowance for doubtful accounts: of period income acquisitions allowance (1) period Year ended March 31, 2009 6,429$ 2,747$ (1,750)$ 7,426$ Year ended March 31, 2008 8,930 1,412 (3,913) 6,429 Year ended March 31, 2007 12,263 1,168 15$ (4,516) 8,930
(1) Write-off of uncollectible accounts and product maintenance cancellations.
Increase in allowance
Concentration of Credit Risk The Company’s financial instruments that are potentially subjected to concentrations of credit risk consist primarily of cash and trade receivables. The Company has cash investment policies which, among other things, limit investments to investment-grade securities. The Company performs ongoing credit evaluations of its customers, and the risk with respect to trade receivables is further mitigated by the diversity, both by geography and by industry, of the customer base.
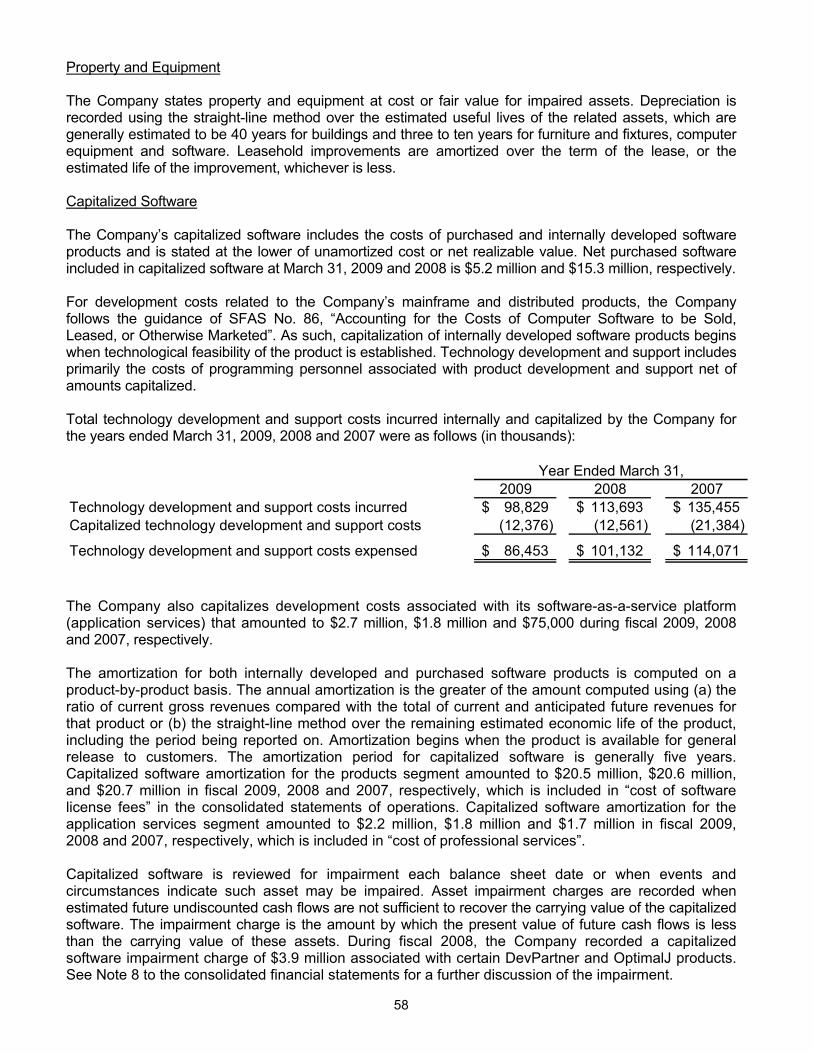
58
Property and Equipment The Company states property and equipment at cost or fair value for impaired assets. Depreciation is recorded using the straight-line method over the estimated useful lives of the related assets, which are generally estimated to be 40 years for buildings and three to ten years for furniture and fixtures, computer equipment and software. Leasehold improvements are amortized over the term of the lease, or the estimated life of the improvement, whichever is less. Capitalized Software The Company’s capitalized software includes the costs of purchased and internally developed software products and is stated at the lower of unamortized cost or net realizable value. Net purchased software included in capitalized software at March 31, 2009 and 2008 is $5.2 million and $15.3 million, respectively. For development costs related to the Company’s mainframe and distributed products, the Company follows the guidance of SFAS No. 86, “Accounting for the Costs of Computer Software to be Sold, Leased, or Otherwise Marketed”. As such, capitalization of internally developed software products begins when technological feasibility of the product is established. Technology development and support includes primarily the costs of programming personnel associated with product development and support net of amounts capitalized. Total technology development and support costs incurred internally and capitalized by the Company for the years ended March 31, 2009, 2008 and 2007 were as follows (in thousands):
Year Ended March 31,2009 2008 2007
Technology development and support costs incurred 98,829$ 113,693$ 135,455$ Capitalized technology development and support costs (12,376) (12,561) (21,384) Technology development and support costs expensed 86,453$ 101,132$ 114,071$
The Company also capitalizes development costs associated with its software-as-a-service platform (application services) that amounted to $2.7 million, $1.8 million and $75,000 during fiscal 2009, 2008 and 2007, respectively. The amortization for both internally developed and purchased software products is computed on a product-by-product basis. The annual amortization is the greater of the amount computed using (a) the ratio of current gross revenues compared with the total of current and anticipated future revenues for that product or (b) the straight-line method over the remaining estimated economic life of the product, including the period being reported on. Amortization begins when the product is available for general release to customers. The amortization period for capitalized software is generally five years. Capitalized software amortization for the products segment amounted to $20.5 million, $20.6 million, and $20.7 million in fiscal 2009, 2008 and 2007, respectively, which is included in “cost of software license fees” in the consolidated statements of operations. Capitalized software amortization for the application services segment amounted to $2.2 million, $1.8 million and $1.7 million in fiscal 2009, 2008 and 2007, respectively, which is included in “cost of professional services”. Capitalized software is reviewed for impairment each balance sheet date or when events and circumstances indicate such asset may be impaired. Asset impairment charges are recorded when estimated future undiscounted cash flows are not sufficient to recover the carrying value of the capitalized software. The impairment charge is the amount by which the present value of future cash flows is less than the carrying value of these assets. During fiscal 2008, the Company recorded a capitalized software impairment charge of $3.9 million associated with certain DevPartner and OptimalJ products. See Note 8 to the consolidated financial statements for a further discussion of the impairment.

59
Goodwill and Other Intangible Assets Goodwill and intangible assets with indefinite lives must be tested for impairment at least once a year or more frequently if management believes indicators of impairment exist. With respect to goodwill, carrying values are compared with fair values, and when the carrying value exceeds the fair value, the carrying value of the impaired goodwill is reduced to fair value. The performance test involves a two-step process. Step 1 of the impairment test involves comparing the fair values of the applicable reporting units with their aggregate carrying values, including goodwill. If the carrying amount of a reporting unit exceeds the reporting unit’s fair value, the Company performs Step 2 of the goodwill impairment test to determine the amount of impairment loss by comparing the implied fair value of the respective reporting unit’s goodwill with the carrying amount of that goodwill. Fair Value of Financial Instruments The carrying value of cash equivalents, current accounts receivable and accounts payable approximate fair values due to the short-term maturities of these instruments. At March 31, 2009, the fair value of non-current receivables is approximately $224.4 million compared to the carrying amount of $224.7 million. At March 31, 2008, the fair value of non-current receivables was approximately $239.7 million compared to the carrying amount of $244.4 million. Fair value is estimated by discounting the future cash flows using the current rate at which the Company would finance a similar transaction. Income Taxes The Company accounts for income taxes under the asset and liability method, which requires the recognition of deferred tax assets and liabilities for the expected future tax consequences of events that have been included in the financial statements. Under this method, deferred tax assets and liabilities are determined based on the differences between the financial statements and tax bases of assets and liabilities using enacted tax rates in effect for the year in which the differences are expected to reverse. The effect of a change in tax rates on deferred tax assets and liabilities is recognized in the period that includes the enactment date. The Company records net deferred tax assets to the extent it believes these assets will more likely than not be realized. These deferred tax assets are subject to periodic assessments as to recoverability and if it is determined that it is more likely than not that the benefits will not be realized, valuation allowances are recorded which would increase the provision for income taxes. In making such determination, the Company considers all available positive and negative evidence, including future reversals of existing taxable temporary differences, projected future taxable income, tax planning strategies and recent financial operations. Interest and penalties related to uncertain tax positions are included in the income tax provision. Foreign Currency Translation The Company's foreign subsidiaries use their respective local currency as their functional currency. Accordingly, assets and liabilities in the consolidated balance sheets have been translated at the rate of exchange at the respective balance sheet dates, and revenues and expenses have been translated at average exchange rates prevailing during the period the transactions occurred. Translation adjustments have been excluded from the results of operations and are reported as accumulated other comprehensive income.
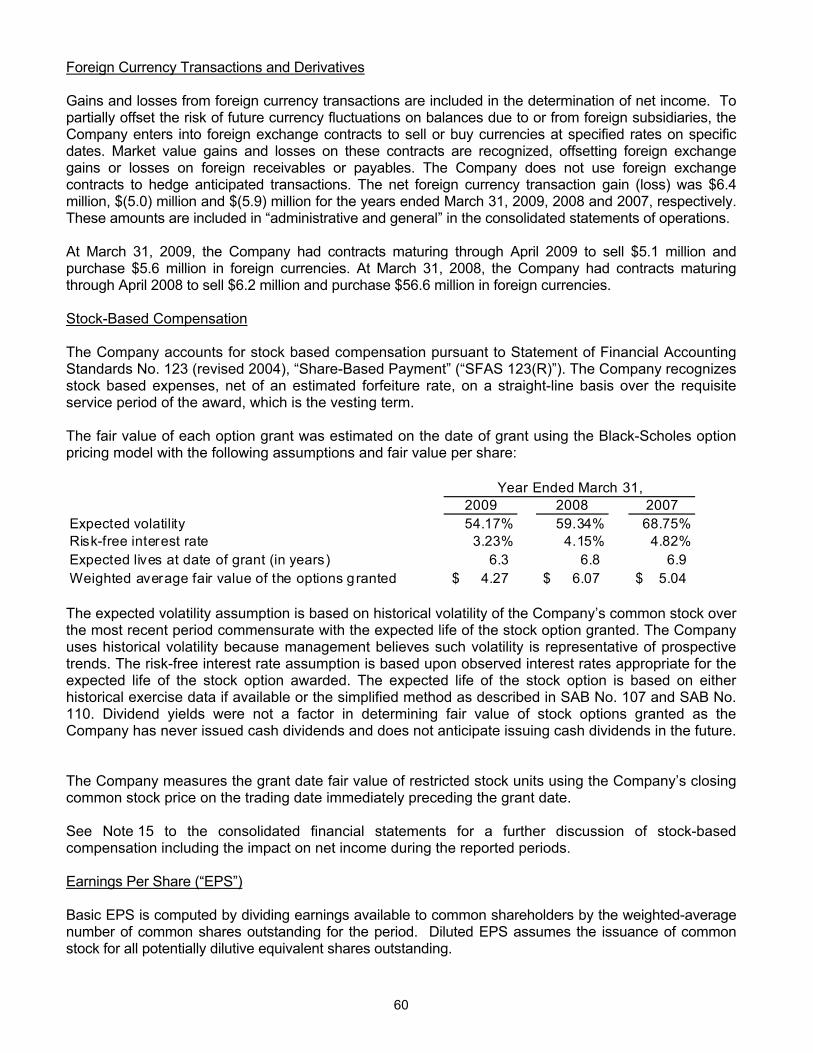
60
Foreign Currency Transactions and Derivatives Gains and losses from foreign currency transactions are included in the determination of net income. To partially offset the risk of future currency fluctuations on balances due to or from foreign subsidiaries, the Company enters into foreign exchange contracts to sell or buy currencies at specified rates on specific dates. Market value gains and losses on these contracts are recognized, offsetting foreign exchange gains or losses on foreign receivables or payables. The Company does not use foreign exchange contracts to hedge anticipated transactions. The net foreign currency transaction gain (loss) was $6.4 million, $(5.0) million and $(5.9) million for the years ended March 31, 2009, 2008 and 2007, respectively. These amounts are included in “administrative and general” in the consolidated statements of operations. At March 31, 2009, the Company had contracts maturing through April 2009 to sell $5.1 million and purchase $5.6 million in foreign currencies. At March 31, 2008, the Company had contracts maturing through April 2008 to sell $6.2 million and purchase $56.6 million in foreign currencies. Stock-Based Compensation The Company accounts for stock based compensation pursuant to Statement of Financial Accounting Standards No. 123 (revised 2004), “Share-Based Payment” (“SFAS 123(R)”). The Company recognizes stock based expenses, net of an estimated forfeiture rate, on a straight-line basis over the requisite service period of the award, which is the vesting term. The fair value of each option grant was estimated on the date of grant using the Black-Scholes option pricing model with the following assumptions and fair value per share:
2009 2008 2007Expected volatility 54.17% 59.34% 68.75%Risk-free interest rate 3.23% 4.15% 4.82%Expected lives at date of grant (in years) 6.3 6.8 6.9 Weighted average fair value of the options granted 4.27$ 6.07$ 5.04$
Year Ended March 31,
The expected volatility assumption is based on historical volatility of the Company’s common stock over the most recent period commensurate with the expected life of the stock option granted. The Company uses historical volatility because management believes such volatility is representative of prospective trends. The risk-free interest rate assumption is based upon observed interest rates appropriate for the expected life of the stock option awarded. The expected life of the stock option is based on either historical exercise data if available or the simplified method as described in SAB No. 107 and SAB No. 110. Dividend yields were not a factor in determining fair value of stock options granted as the Company has never issued cash dividends and does not anticipate issuing cash dividends in the future. The Company measures the grant date fair value of restricted stock units using the Company’s closing common stock price on the trading date immediately preceding the grant date. See Note 15 to the consolidated financial statements for a further discussion of stock-based compensation including the impact on net income during the reported periods. Earnings Per Share (“EPS”) Basic EPS is computed by dividing earnings available to common shareholders by the weighted-average number of common shares outstanding for the period. Diluted EPS assumes the issuance of common stock for all potentially dilutive equivalent shares outstanding.

61
Recently Issued Accounting Pronouncements In April 2008, the Financial Accounting Standards Board (“FASB”) issued FSP No. 142-3, “Determination of the Useful Life of Intangible Assets ” (FSP No. 142-3) that amends the factors considered in developing renewal or extension assumptions used to determine the useful life of a recognized intangible asset under SFAS No. 142. FSP No. 142-3 requires a consistent approach between the useful life of a recognized intangible asset under SFAS No. 142 and the period of expected cash flows used to measure the fair value of an asset under SFAS No. 141(R). The FSP also requires enhanced disclosures when an intangible asset’s expected future cash flows are affected by an entity’s intent and/or ability to renew or extend the arrangement. FSP No. 142-3 is effective for financial statements issued for fiscal years beginning after December 15, 2008 and is applied prospectively. The Company does not expect the adoption of FSP No.142-3 to have a material impact on its consolidated results of operations or financial condition. In March 2008, the FASB issued Statement of Financial Accounting Standards (“SFAS”) No. 161, “Disclosures about Derivative Instruments and Hedging Activities, an Amendment of FASB Statement No. 133” (“SFAS No. 161”). This Statement changes the disclosure requirements for derivative instruments and hedging activities. Entities are required to provide enhanced disclosures about (a) how and why an entity uses derivative instruments, (b) how derivative instruments and related hedged items are accounted for under Statement 133 and its related interpretations, and (c) how derivative instruments and related hedged items affect an entity’s financial position, financial performance, and cash flows. This Statement is effective for fiscal years beginning after November 15, 2008. Because SFAS No. 161 applies only to financial statement disclosures, it will not have any impact on the Company’s consolidated results of operations and financial condition. In February 2008, the FASB issued FASB Staff Position 157-1, “Application of FASB Statement No. 157 to FASB Statement No. 13 and Other Accounting Pronouncements that Address Fair Value Measurements for Purposes of Lease Classification or Measurement under Statement 13 ” (“FSP 157-1”) and FASB Staff Position No. FAS 157–2, “Effective Date of FASB Statement No. 157” (“FSP 157-2”). FSP 157-1 amends SFAS No. 157 to remove certain leasing transactions from its scope, and was effective upon initial adoption of SFAS No. 157. FSP 157-2 provides a one year deferral of the effective date of SFAS 157 for non–financial assets and non–financial liabilities, except those that are recognized or disclosed in the financial statements at fair value at least annually. Therefore, the Company has adopted the provisions of SFAS No. 157 with respect to its financial assets and liabilities only. SFAS No. 157 defines fair value, establishes a framework for measuring fair value under generally accepted accounting principles and enhances disclosures about fair value measurements. Fair value is defined under SFAS No. 157 as the price that would be received to sell an asset or paid to transfer a liability (an exit price) in the principal or most advantageous market for the asset or liability in an orderly transaction between market participants on the measurement date. Valuation techniques used to measure fair value under SFAS No. 157 must maximize the use of observable inputs and minimize the use of unobservable inputs. The standard describes a fair value hierarchy based on three levels of inputs, of which the first two are considered observable and the last unobservable, that may be used to measure fair value, which are the following:
• Level 1 – Quoted prices in active markets for identical assets or liabilities. • Level 2 – Inputs other than Level 1 that are observable, either directly or indirectly, such as
quoted prices for similar assets or liabilities; quoted prices in markets that are not active; or other inputs that are observable or can be corroborated by observable market data for substantially the full term of the assets or liabilities.
• Level 3 – Unobservable inputs that are supported by little or no market activity and that are
significant to the fair value of the assets or liabilities. The adoption of SFAS No. 157 did not have a material impact on the Company’s consolidated results of operations and financial condition.
62
The Company measures forward foreign exchange contract liabilities (using level 2 inputs) at fair value on a recurring basis in accordance with SFAS No. 157. At March 31, 2009, the fair value of the forward foreign exchange contract liability was $30,000. In December 2007, the FASB issued SFAS No. 141 (R), “Business Combinations”, which replaces Statement of Financial Accounting Standards No. 141, “Business Combinations”. This Statement requires assets and liabilities acquired in a business combination, contingent consideration and certain acquired contingencies, to be measured at their fair value as of the date of acquisition. This Statement also requires that acquisition-related costs and restructuring costs be recognized separately from the business combination. This Statement is effective for fiscal years beginning after December 15, 2008. Its effects on future periods will depend on the nature and significance of any acquisitions subject to this Statement. 2. ACQUISITIONS Acquisitions are accounted for using the purchase method in accordance with SFAS No. 141, “Business Combinations” and, accordingly, the assets and liabilities acquired are recorded at fair value as of the acquisition date. In February 2008, the Company acquired certain assets and liabilities of Hilgraeve, Inc. (“Hilgraeve”), a privately held company, for approximately $4.6 million in cash. Hilgraeve has developed an on-demand collaboration platform for lab and prescription data sharing that allows physician practices to rapidly connect to Covisint and securely share key patient information, reducing the cost and improving the quality of healthcare. The purchase price exceeded the fair value of the acquired assets and liabilities by $3.3 million, which was recorded to goodwill. Intangible assets subject to amortization totaled $1.5 million, of which $1.1 million and $260,000, respectively, related to purchased software and customer relationships, each with a useful life of five years. The remaining intangible asset, a non-compete agreement, has a useful life of two years. In January 2007, the Company acquired Proxima Technology Group, Inc. (“Proxima”) for approximately $37.3 million in cash. Proxima was a privately held provider of the Centauri product (renamed Vantage Service Manager) that complements our Vantage product line by giving customers the ability to manage service delivery from a business perspective. The purchase price exceeded the fair value of the acquired assets and liabilities by $19.9 million, which was recorded to goodwill. Intangible assets subject to amortization totaled $9.9 million, of which $6.2 million and $3.0 million related to purchased software and customer relationships, respectively, each with a useful life of five years. The remaining intangible assets subject to amortization had useful lives of up to two years. In April 2006, the Company acquired SteelTrace Limited, a privately held provider of requirements management products that align application delivery to business needs through a structured, visual approach to the management of enterprise application requirements, for approximately $20.7 million in cash. The purchase price exceeded the fair value of the acquired assets and liabilities by $14.2 million that was recorded to goodwill. Intangible assets subject to amortization totaled $6.7 million of which $4.8 million and $1.5 million related to purchased software and customer relationships, respectively, with a useful life of five and three years, respectively. The remaining intangible assets subject to amortization had a useful life of one year.
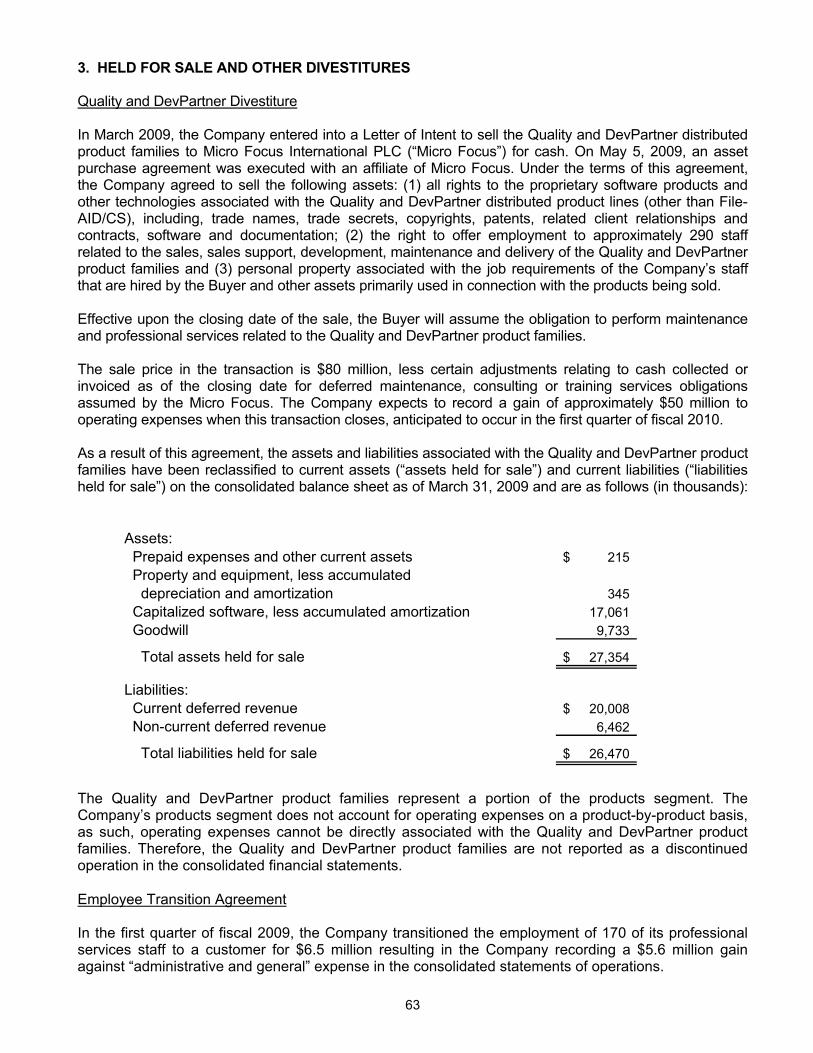
63
3. HELD FOR SALE AND OTHER DIVESTITURES Quality and DevPartner Divestiture In March 2009, the Company entered into a Letter of Intent to sell the Quality and DevPartner distributed product families to Micro Focus International PLC (“Micro Focus”) for cash. On May 5, 2009, an asset purchase agreement was executed with an affiliate of Micro Focus. Under the terms of this agreement, the Company agreed to sell the following assets: (1) all rights to the proprietary software products and other technologies associated with the Quality and DevPartner distributed product lines (other than File-AID/CS), including, trade names, trade secrets, copyrights, patents, related client relationships and contracts, software and documentation; (2) the right to offer employment to approximately 290 staff related to the sales, sales support, development, maintenance and delivery of the Quality and DevPartner product families and (3) personal property associated with the job requirements of the Company’s staff that are hired by the Buyer and other assets primarily used in connection with the products being sold. Effective upon the closing date of the sale, the Buyer will assume the obligation to perform maintenance and professional services related to the Quality and DevPartner product families. The sale price in the transaction is $80 million, less certain adjustments relating to cash collected or invoiced as of the closing date for deferred maintenance, consulting or training services obligations assumed by the Micro Focus. The Company expects to record a gain of approximately $50 million to operating expenses when this transaction closes, anticipated to occur in the first quarter of fiscal 2010. As a result of this agreement, the assets and liabilities associated with the Quality and DevPartner product families have been reclassified to current assets (“assets held for sale”) and current liabilities (“liabilities held for sale”) on the consolidated balance sheet as of March 31, 2009 and are as follows (in thousands):
Assets: Prepaid expenses and other current assets 215$ Property and equipment, less accumulated depreciation and amortization 345 Capitalized software, less accumulated amortization 17,061 Goodwill 9,733
Total assets held for sale 27,354$
Liabilities: Current deferred revenue 20,008$ Non-current deferred revenue 6,462
Total liabilities held for sale 26,470$
The Quality and DevPartner product families represent a portion of the products segment. The Company’s products segment does not account for operating expenses on a product-by-product basis, as such, operating expenses cannot be directly associated with the Quality and DevPartner product families. Therefore, the Quality and DevPartner product families are not reported as a discontinued operation in the consolidated financial statements. Employee Transition Agreement In the first quarter of fiscal 2009, the Company transitioned the employment of 170 of its professional services staff to a customer for $6.5 million resulting in the Company recording a $5.6 million gain against “administrative and general” expense in the consolidated statements of operations.
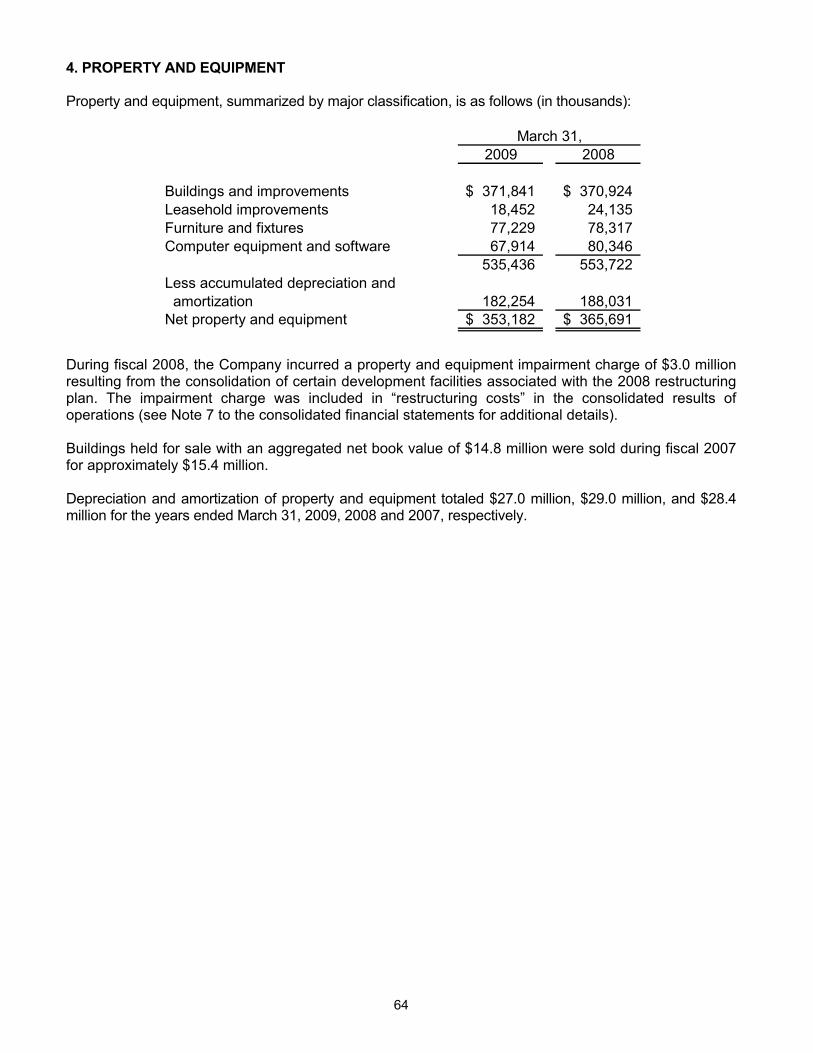
64
4. PROPERTY AND EQUIPMENT Property and equipment, summarized by major classification, is as follows (in thousands):
March 31,2009 2008
Buildings and improvements 371,841$ 370,924$ Leasehold improvements 18,452 24,135 Furniture and fixtures 77,229 78,317 Computer equipment and software 67,914 80,346
535,436 553,722 Less accumulated depreciation and amortization 182,254 188,031 Net property and equipment 353,182$ 365,691$
During fiscal 2008, the Company incurred a property and equipment impairment charge of $3.0 million resulting from the consolidation of certain development facilities associated with the 2008 restructuring plan. The impairment charge was included in “restructuring costs” in the consolidated results of operations (see Note 7 to the consolidated financial statements for additional details). Buildings held for sale with an aggregated net book value of $14.8 million were sold during fiscal 2007 for approximately $15.4 million. Depreciation and amortization of property and equipment totaled $27.0 million, $29.0 million, and $28.4 million for the years ended March 31, 2009, 2008 and 2007, respectively.
65
5. INVESTMENTS IN PARTIALLY OWNED COMPANIES At March 31, 2009, the Company held a 33.3% interest in CareTech Solutions, Inc. (“CareTech”), which provides information technology outsourcing for healthcare organizations including data, voice, applications and data center operations. This investment is accounted for under the equity method. At March 31, 2009 and 2008, the Company’s carrying value of its investments in and advances to CareTech was $13.2 million and $14.9 million, respectively. Included in the net investment at March 31, 2009 and 2008, is a note receivable with a basis of $6.3 million and $8.4 million, respectively, and accounts receivable due from CareTech of $4.8 million and $4.9 million, respectively. The note is payable in quarterly installments through January 2012 and bears interest at 5.25%. The Company reviewed CareTech’s financial condition at March 31, 2009 and concluded that no impairment charge or valuation allowance related to its investment in CareTech was warranted. For the years ended March 31, 2009, 2008 and 2007, the Company recognized income of $468,000, $417,000 and $646,000, respectively, from its investment in CareTech. Professional services revenue for the years ended March 31, 2009, 2008 and 2007 included $26.0 million, $25.6 million and $24.9 million, respectively, from services provided to CareTech customers on a subcontractor basis. On March 30, 2007, the Company sold its 49% interest in ForeSee Results, Inc. (“ForeSee”) which was incorporated in October 2001 to provide online customer satisfaction management. The Company entered into a stock repurchase agreement whereby ForeSee purchased all of the common shares in ForeSee owned by the Company (4,410,000 common shares) for approximately $11.3 million in cash. The entire amount was recorded to “gain on sale of investment in partially owned company” in the consolidated statements of operations as the Company’s equity investment in ForeSee was zero. As part of the transaction, a portion of the accrued interest on existing notes due the Company was paid, and the notes were modified to increase the interest rate to 10.25% and to extend the payment terms of the notes. Foresee paid $618,000 in January 2009 and the remaining outstanding balance of $5.6 million will become due (with interest) on March 30, 2012. The notes are subordinate in payment rights to certain third party financing obtained by ForeSee in connection with the transaction. Prior to the sale, the investment in ForeSee was accounted for under the equity method including consideration of EITF 98-13, “Accounting by an Equity Method Investor for Investee Losses When the Investor has Loans to and Investments in Other Securities of an Investee”. For the year ended March 31, 2007, the Company recognized income of $472,000 from its investment in ForeSee in addition to the fiscal 2007 gain on the disposal of the common shares in ForeSee. Professional services revenue for the year ended March 31, 2007 included $334,000 from services provided to ForeSee.

66
6. RELATED PARTY TRANSACTIONS The Company sells and purchases products and services to and from companies associated with certain officers or directors of the Company with the following being the most significant of these transactions. Peter Karmanos, Jr., Chairman of the Board, is a shareholder of Compuware Sports Corporation (“CSC”). CSC operates an amateur hockey program in Southeastern Michigan. On September 8, 1992, the Company entered into a Promotion Agreement with CSC to promote the Company’s business. The promotion agreement automatically renews each year, unless terminated with 60 days prior notice by either party. Advertising costs related to this agreement were approximately $840,000 for each of the years ended March 31, 2009, 2008 and 2007. These costs are included in “sales and marketing” in the consolidated statements of operations. Peter Karmanos, Jr. has a significant ownership interest in entities that own and/or manage various sports arenas. The Company entered into an advertising agreement with one arena to promote the Company’s business, including the right to name the arena “Compuware Arena”. The Company also rents suites and places advertising at the arenas. Total costs related to these agreements were approximately $590,000, $420,000 and $627,000 for the years ended March 31, 2009, 2008 and 2007, respectively. These costs are included in “sales and marketing” in the consolidated statements of operations.

67
7. RESTRUCTURING CHARGES Fiscal 2009 Restructuring Plan During fiscal 2009, the Company incurred restructuring charges of $10.0 million associated with the following two initiatives: (1) aligning the professional services segment headcount and operating expenses after initiating a plan to exit low-margin engagements and (2) management’s continued evaluation of the product segment and general and administrative business processes to identify operating efficiencies with the goal of reducing operating expenses. During the second half of 2009, the professional services business model was realigned resulting in the Company exiting engagements considered low-margin or unprofitable. This change required the Company to undertake restructuring actions to reduce headcount and operating expenses resulting in restructuring charges of $6.3 million. Employee termination costs accounted for $5.4 million of the charge resulting in the elimination of 478 professional services personnel and management positions. The second initiative to increase the operating efficiency of the Company resulted in the Company incurring restructuring charges of $3.7 million. Employee termination costs accounted for $3.0 million of the charge due to the elimination of 148 positions within our product segment related to technology and sales and marketing personnel and 43 corporate general and administrative positions. In addition, full or partial closing of seven offices occurred resulting in a lease abandonment charge of $1.3 million. The remaining facilities charge primarily related to changes in sublease income assumptions associated with lease facilities that were abandoned in previous restructuring initiatives. The Company continues to review the impact of these actions and will, based on future results of operations, determine if additional actions are needed. The total amount of any potential future charges for such actions will depend upon the nature, timing and extent of those actions. Fiscal 2008 Restructuring Plan During fiscal 2008, the Company undertook various restructuring initiatives to improve the effectiveness and efficiency of certain critical business processes within the products segment resulting in a restructuring charge of $42.6 million. These initiatives included the realignment and centralization of certain product development activities leading to the full or partial closing of certain development labs and termination of approximately 325 employees, primarily programming personnel. The Company also terminated approximately 200 employees from various other functions of the organization, primarily within sales and marketing.

68
Restructuring Summary The following table summarizes the restructuring accrual and charges against the accrual during fiscal 2007, 2008 and 2009 (in thousands):
Other
Total Restructuring
ChargeAccrual at March 31, 2006 5,950$ 5,950$
Paid during fiscal 2007 (1,748) (1,748) Adjustments during fiscal 2007 (1) (1,783) (1,783)
Accrual at March 31, 2007 2,419 2,419
Expenses incurred during fiscal 2008 33,295$ 8,199 1,151$ 42,645 Paid during fiscal 2008 (25,881) (2,921) (1,066) (29,868) Non-cash charges during fiscal 2008 (4,759) (2,981) (7,740)
Accrual at March 31, 2008 2,655 4,716 85 7,456
Expenses incurred during fiscal 2009 8,352 1,482 203 10,037 Paid during fiscal 2009 (8,757) (3,927) (275) (12,959) Non-cash charges during fiscal 2009 (976) (976)
Accrual at March 31, 2009 (2) 1,274$ 2,271$ 13$ 3,558$
Facilities Costs (Primarily Lease Abandonments)
Employee Termination
Benefits
(1) During fiscal 2007, the Company recorded a reduction of $1.8 million in the restructuring accrual primarily related to income from subleases of abandoned lease space in excess of what was originally anticipated. These adjustments were included in “administrative and general” in the consolidated statements of operations.
(2) As of March 31, 2009, $2.3 million of the restructuring accrual is recorded in current “accrued
expenses” with the remaining balance of $1.3 million recorded in long-term “accrued expenses” in the consolidated balance sheets.
The accruals for employee termination benefits at March 31, 2009 primarily represent the amounts to be paid to employees that have been terminated as a result of initiatives described above.
The accruals for facilities costs at March 31, 2009 represent the remaining fair value of lease obligations for exited and demised locations, as determined at the cease-use dates of those facilities, net of estimated sublease income that could be reasonably obtained in the future, and will be paid out over the remaining lease terms, the last of which ends in fiscal 2013. Projected sublease income is based on management’s estimates, which are subject to change.

69
8. GOODWILL AND INTANGIBLE ASSETS The components of the Company’s intangible assets were as follows (in thousands):
March 31, 2009
Gross Carrying Amount
Accumulated Amortization
Net Carrying Amount
Unamortized intangible assets:Trademarks (1) $ 5,784 $ 5,784
Amortized intangible assets:Capitalized software (2, 5) 317,569$ (281,806)$ 35,763$ Customer relationship agreements (3) 13,218 (10,751) 2,467 Non-compete agreements (3) 2,561 (2,516) 45 Other (4) 6,849 (6,684) 165
Total amortized intangible assets 340,197$ (301,757)$ 38,440$
March 31, 2008
Gross Carrying Amount
Accumulated Amortization
Net Carrying Amount
Unamortized intangible assets:Trademarks (1) $ 5,984 $ 5,984
Amortized intangible assets:Capitalized software (2) 341,127$ (279,474)$ 61,653$ Customer relationship agreements (3) 14,270 (8,482) 5,788 Non-compete agreements (3) 2,948 (2,660) 288 Other (4) 6,891 (6,396) 495
Total amortized intangible assets 365,236$ (297,012)$ 68,224$
(1) Certain trademarks were acquired as part of the Covisint and Changepoint acquisitions in fiscal
2004 and 2005. These trademarks are deemed to have an indefinite life and therefore are not being amortized.
(2) During fiscal 2008, the Company recorded a capitalized software impairment charge of $3.9 million
associated with certain of its DevPartner and OptimalJ products due to declining demand for this technology.
(3) Customer relationship agreements and non-compete agreements were acquired as part of recent
acquisitions. The customer relationship agreements are being amortized over periods up to five years. The non-compete agreements are being amortized over periods up to three years.
(4) Other amortized intangible assets include trademarks associated with product acquisitions and are
being amortized over periods up to ten years. (5) As of March 31, 2009, the gross carrying amount, accumulated amortization and net carrying
amount for capitalized software reflects the reclassification of $35.3 million, $(18.2) million and $17.1 million, respectively, to assets held for sale due to the divestiture of the Quality and DevPartner product lines. See Note 3 to the consolidated financial statements for additional details.
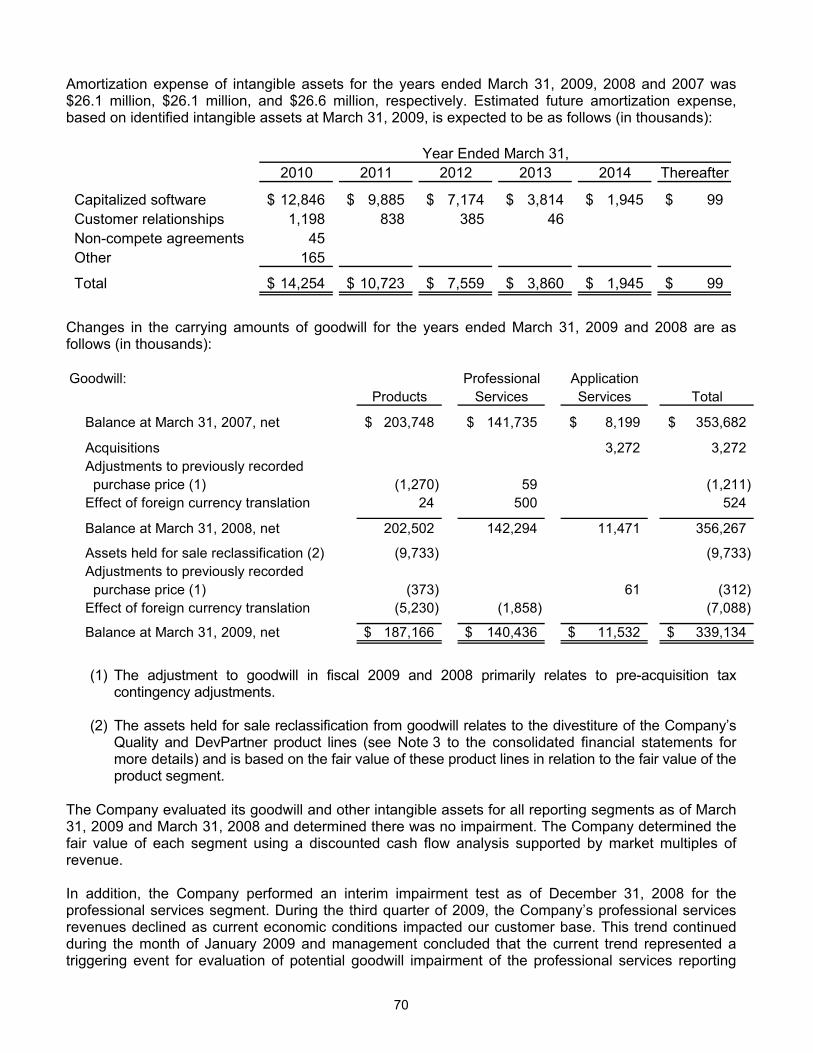
70
Amortization expense of intangible assets for the years ended March 31, 2009, 2008 and 2007 was $26.1 million, $26.1 million, and $26.6 million, respectively. Estimated future amortization expense, based on identified intangible assets at March 31, 2009, is expected to be as follows (in thousands):
Year Ended March 31,2010 2011 2012 2013 2014 Thereafter
Capitalized software 12,846$ 9,885$ 7,174$ 3,814$ 1,945$ 99$ Customer relationships 1,198 838 385 46 Non-compete agreements 45 Other 165
Total 14,254$ 10,723$ 7,559$ 3,860$ 1,945$ 99$
Changes in the carrying amounts of goodwill for the years ended March 31, 2009 and 2008 are as follows (in thousands): Goodwill: Professional Application Products Services Services Total
Balance at March 31, 2007, net 203,748$ 141,735$ 8,199$ 353,682$
Acquisitions 3,272 3,272 Adjustments to previously recorded purchase price (1) (1,270) 59 (1,211) Effect of foreign currency translation 24 500 524
Balance at March 31, 2008, net 202,502 142,294 11,471 356,267
Assets held for sale reclassification (2) (9,733) (9,733) Adjustments to previously recorded purchase price (1) (373) 61 (312) Effect of foreign currency translation (5,230) (1,858) (7,088)
Balance at March 31, 2009, net 187,166$ 140,436$ 11,532$ 339,134$
(1) The adjustment to goodwill in fiscal 2009 and 2008 primarily relates to pre-acquisition tax
contingency adjustments. (2) The assets held for sale reclassification from goodwill relates to the divestiture of the Company’s
Quality and DevPartner product lines (see Note 3 to the consolidated financial statements for more details) and is based on the fair value of these product lines in relation to the fair value of the product segment.
The Company evaluated its goodwill and other intangible assets for all reporting segments as of March 31, 2009 and March 31, 2008 and determined there was no impairment. The Company determined the fair value of each segment using a discounted cash flow analysis supported by market multiples of revenue. In addition, the Company performed an interim impairment test as of December 31, 2008 for the professional services segment. During the third quarter of 2009, the Company’s professional services revenues declined as current economic conditions impacted our customer base. This trend continued during the month of January 2009 and management concluded that the current trend represented a triggering event for evaluation of potential goodwill impairment of the professional services reporting

71
unit. As a result, a goodwill impairment evaluation was performed. The Company completed Step 1 of the impairment test and concluded that there was no impairment. If the professional services segment’s profitability assumptions used in the March 31, 2009 goodwill impairment analysis are not attained, an impairment of some or all of the $140.4 million of goodwill related to the professional services segment at March 31, 2009 may be recorded in the future as a non-cash charge to earnings in the period in which the carrying value exceeds fair value. 9. DEBT The Company has no long term debt. The Company has an unsecured revolving credit agreement (the “credit facility”) with Comerica Bank and other lenders. The credit facility provides for a revolving line of credit in the amount of $150 million and expires on November 1, 2012. The credit facility also permits the Company to increase the revolving line of credit by up to an additional $150 million subject to receiving further commitments from lenders and certain other conditions. The credit facility contains various covenant requirements, including limitations on liens; indebtedness; mergers, consolidations and acquisitions; asset sales; dividends; investments, loans and advances from the Company; transactions with affiliates and limits additional borrowing outside of the facility to $250 million. The credit facility is also subject to maximum total debt to EBITDA and minimum fixed charge coverage financial covenants. The Company is in compliance with the covenants under the credit facility. Any borrowings under the credit facility bear interest at the prime rate or the Eurodollar rate plus the applicable margin (based on the level of maximum total debt to EBITDA ratio), at the Company’s option. The Company pays a quarterly facility fee on the credit facility based on the applicable margin grid. The Company has never used the credit facility. The Company incurs interest expense primarily related to the accrual for certain abandoned leases. Cash paid for interest totaled approximately $1.6 million, $1.1 million and $1.9 million for the years ended March 31, 2009, 2008 and 2007, respectively. 10. CAPITAL STOCK Preferred Stock Purchase Rights The Company entered into a Rights Agreement with Equiserve Trust Company, N.A., now known as Computershare Trust Company N.A., as Rights Agent, in October 2000 (as subsequently amended, the “rights plan”). The rights plan was adopted to discourage abusive, undervalued and other undesirable attempts to acquire control of the Company by making acquisitions of control that are not approved by the Company's Board of Directors economically undesirable for the acquiror. Pursuant to the rights plan, each share of the Company’s common stock has attached to it one right, which initially represents the right to purchase one two-thousandth of a share of Series A Junior Participating Preferred Stock (a right) for $40. The rights are not exercisable until (1) the first public announcement that a person or group has acquired, or obtained the right to acquire, except under limited circumstances, beneficial ownership of 20% or more of the outstanding common stock; or (2) the close of business on the tenth business day (or such later date as the Company’s Board of Directors may determine) after the commencement of a tender or exchange offer the consummation of which would result in a person or group becoming the beneficial owner of 20% or more of the outstanding common stock. If a person or group becomes a beneficial owner of 20% or more of the outstanding common stock, each right converts into a right to purchase multiple shares of common stock of the Company, or in certain

72
circumstances securities of the acquirer, at a 50% discount from the then current market value. In connection with the rights plan, the Company has designated 800,000 shares of its 5,000,000 shares of authorized but unissued Preferred Stock as “Series A Junior Participating Preferred Stock.” The rights are redeemable for a specified period at a price of $0.001 per right and expire on May 9, 2012, unless extended or earlier redeemed by the Board of Directors. Stock Repurchase Plans The Company’s Board of Directors approved the repurchase of the Company’s common stock under three plans, the “Discretionary Plan”, the 2006 10b5-1 Plan which was terminated in August 2007 and the 2009 10b5-1 Plan which was terminated on September 29, 2008. The Discretionary Plan authorizes management to regularly evaluate market conditions for an opportunity to repurchase common stock at its discretion within the parameters established by the Board. The authorizations and repurchases under this plan were as follows (in thousands):
Date AmountAuthorized Authorized 2007 2008 2009
April 2006 125,000$ 17,631 August 2006 300,000$ 36,169 December 2006 200,000$ 10,504 11,673 August 2007 200,000$ 23,285 February 2008 750,000$ 2,687 20,287 536,861$
Common Shares Acquired During Fiscal
March 31, 2009
Balance Remainingfor Future
Purchases at
The 2006 and 2009 10b5-1 Plans (“10b5-1 Plans”) authorized management to repurchase up to 50 million and 14 million shares, respectively, of the Company’s common stock subject to price, volume and timing restraints set forth in the plan pursuant to Rule 10b5-1(c) of the Securities Exchange Act of 1934. The 10b5-1 Plans allowed the repurchase of common stock at times when the Company might be prevented from doing so under insider trading laws or because of self-imposed trading blackout periods. A broker selected by the Company had the authority under the terms and limitations specified in the plan to repurchase shares on behalf of the Company. During fiscal 2009, 2008 and 2007, the Company repurchased 1.3 million, 11.3 million and 18.0 million common shares, respectively, for an aggregate committed amount of $13.5 million, $109.7 million and $162.4 million, respectively, under the 10b5-1 Plans ($7.2 million of the fiscal 2007 committed amount was paid in fiscal 2008).

73
11. EARNINGS PER COMMON SHARE
Earnings per common share data were computed as follows (in thousands, except for per share data):
Year Ended March 31, 2009 2008 2007 Basic earnings per share: Numerator: Net income $ 139,647 $ 134,394 $ 158,092 Denominator: Weighted-average common shares outstanding 250,916 286,402 350,213Basic earnings per share $ 0.56 $ 0.47 $ 0.45 Diluted earnings per share: Numerator: Net income $ 139,647 $ 134,394 $ 158,092Denominator: Weighted-average common shares outstanding 250,916 286,402 350,213 Dilutive effect of stock awards 1,486 1,226 754 Total shares 252,402 287,628 350,967 Diluted earnings per share $ 0.55 $ 0.47 $ 0.45
During the years ended March 31, 2009, 2008 and 2007, stock awards to purchase approximately 19,290,000, 25,421,000 and 33,608,000 shares, respectively, were excluded from the diluted EPS calculation because they were anti-dilutive.

74
12. INCOME TAXES Income before income taxes and the income tax provision include the following (in thousands):
Year Ended March 31,2009 2008 2007
Income before income taxes:U.S. $ 195,943 $ 154,349 $ 172,819 Foreign 16,778 26,043 20,238 Total income before income taxes $ 212,721 $ 180,392 $ 193,057
Income tax provision Current:
U.S. Federal $ 47,917 $ 33,330 $ 16,967 Foreign 5,937 19,118 11,265 U.S. State 2,299 2,829 2,434
Total current tax provision 56,153 55,277 30,666 Deferred:
U.S. Federal 7,213 19,005 6,165 Foreign 1,568 (3,548) (3,024) U.S. State 8,140 (24,736) 1,158
Total deferred tax provision (benefit) 16,921 (9,279) 4,299 Total income tax provision $ 73,074 $ 45,998 $ 34,965
The Company's income tax expense differed from the amount computed on pre-tax income at the U.S. federal income tax rate of 35% for the following reasons (in thousands):
Year Ended March 31,2009 2008 2007
Federal income tax at statutory rates $ 74,452 $ 63,137 $ 67,570 Increase (decrease) in taxes: State income taxes, net 1,273 1,718 2,215 Export sales benefit (2,954) Settlement of prior year tax matters (1) (1,024) (26,550) Taxes relating to foreign operations (3,446) 891 992 Tax credits (2) (3,995) (21,507) (5,060) Valuation allowance (3) 6,049 2,859 (3,768) Other, net (235) (1,100) 2,520 Provision for income taxes $ 73,074 $ 45,998 $ 34,965
(1) During fiscal 2007, the Company reduced its income tax provision by $26.6 million for certain items
related to settlements of prior year tax matters with the Internal Revenue Service (“IRS”). The benefit consisted of the following: (1) settlement of special deductions associated with foreign sales commissions under the former foreign sales corporation rules and the extraterritorial income exclusion rules of $8.7 million; (2) settlement of credits afforded to U.S. based taxpayers that generate income from sales to foreign customers of $10.2 million; (3) settlement of the proper character and timing of certain deductions of $3.3 million and (4) the remaining items consist primarily of interest income and reduction in state taxes totaling $4.4 million.

75
(2) On July 12, 2007, the State of Michigan enacted the Michigan Business Tax (“MBT”) as a replacement for the Single Business Tax (“SBT”), which expired at December 31, 2007. The MBT took effect on January 1, 2008 and is comprised of two components: an income tax and a modified gross receipts tax. The two components of the MBT are considered income taxes subject to the accounting provisions of FASB Statement No. 109, “Accounting for Income Taxes”.
As a result of the MBT enactment, the Company recorded an income tax benefit of approximately $15.0 million during fiscal 2008. This benefit related primarily to the recognition of a deferred tax asset for Brownfield Redevelopment credits that are available to offset MBT liabilities through the Company’s fiscal year 2022. The Brownfield Redevelopment credits were previously available to reduce the Company’s SBT liabilities. These credits were not historically recorded as a deferred tax asset since the Company did not account for the SBT as an income tax.
(3) On January 9, 2009, the State of Michigan amended the MBT with an effective date of January 1,
2008. The amendment impacts future taxable income under MBT, therefore the Company evaluated its ability to realize the Brownfield Redevelopment credits before their expiration dates. This review resulted in the Company recording a $6.0 million valuation allowance during the fourth quarter of fiscal 2009 to reduce the deferred tax asset associated with these credits to the more likely than not realizable value.
During fiscal 2008, the Company assessed the ability to utilize its tax credits prior to expiration and recorded a valuation allowance of $2.9 million to reduce the deferred tax asset associated with these credits to the more likely than not realizable value.
During fiscal 2007, the Company released a valuation allowance related to the potential expiration
of capital loss carryforwards in the amount of $2.9 million as a result of the sale of the Company’s investment in ForeSee. In addition, the Company recognized approximately $900,000 related to operating losses in Brazil, which the Company believed were more likely than not to be realized.
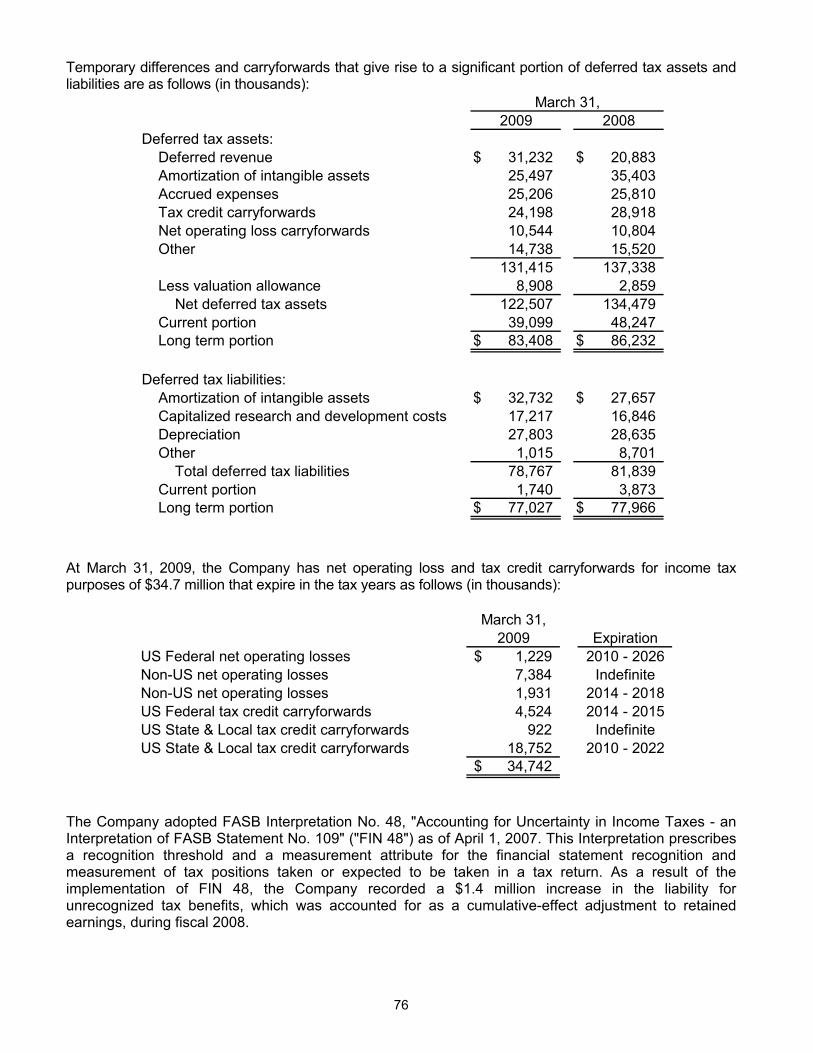
76
Temporary differences and carryforwards that give rise to a significant portion of deferred tax assets and liabilities are as follows (in thousands):
March 31,2009 2008
Deferred tax assets: Deferred revenue $ 31,232 $ 20,883 Amortization of intangible assets 25,497 35,403 Accrued expenses 25,206 25,810 Tax credit carryforwards 24,198 28,918 Net operating loss carryforwards 10,544 10,804 Other 14,738 15,520
131,415 137,338 Less valuation allowance 8,908 2,859 Net deferred tax assets 122,507 134,479 Current portion 39,099 48,247 Long term portion $ 83,408 $ 86,232
Deferred tax liabilities: Amortization of intangible assets $ 32,732 $ 27,657 Capitalized research and development costs 17,217 16,846 Depreciation 27,803 28,635 Other 1,015 8,701 Total deferred tax liabilities 78,767 81,839 Current portion 1,740 3,873 Long term portion $ 77,027 $ 77,966
At March 31, 2009, the Company has net operating loss and tax credit carryforwards for income tax purposes of $34.7 million that expire in the tax years as follows (in thousands):
March 31,2009 Expiration
US Federal net operating losses 1,229$ 2010 - 2026Non-US net operating losses 7,384 IndefiniteNon-US net operating losses 1,931 2014 - 2018US Federal tax credit carryforwards 4,524 2014 - 2015US State & Local tax credit carryforwards 922 IndefiniteUS State & Local tax credit carryforwards 18,752 2010 - 2022
34,742$
The Company adopted FASB Interpretation No. 48, "Accounting for Uncertainty in Income Taxes - an Interpretation of FASB Statement No. 109" ("FIN 48") as of April 1, 2007. This Interpretation prescribes a recognition threshold and a measurement attribute for the financial statement recognition and measurement of tax positions taken or expected to be taken in a tax return. As a result of the implementation of FIN 48, the Company recorded a $1.4 million increase in the liability for unrecognized tax benefits, which was accounted for as a cumulative-effect adjustment to retained earnings, during fiscal 2008.
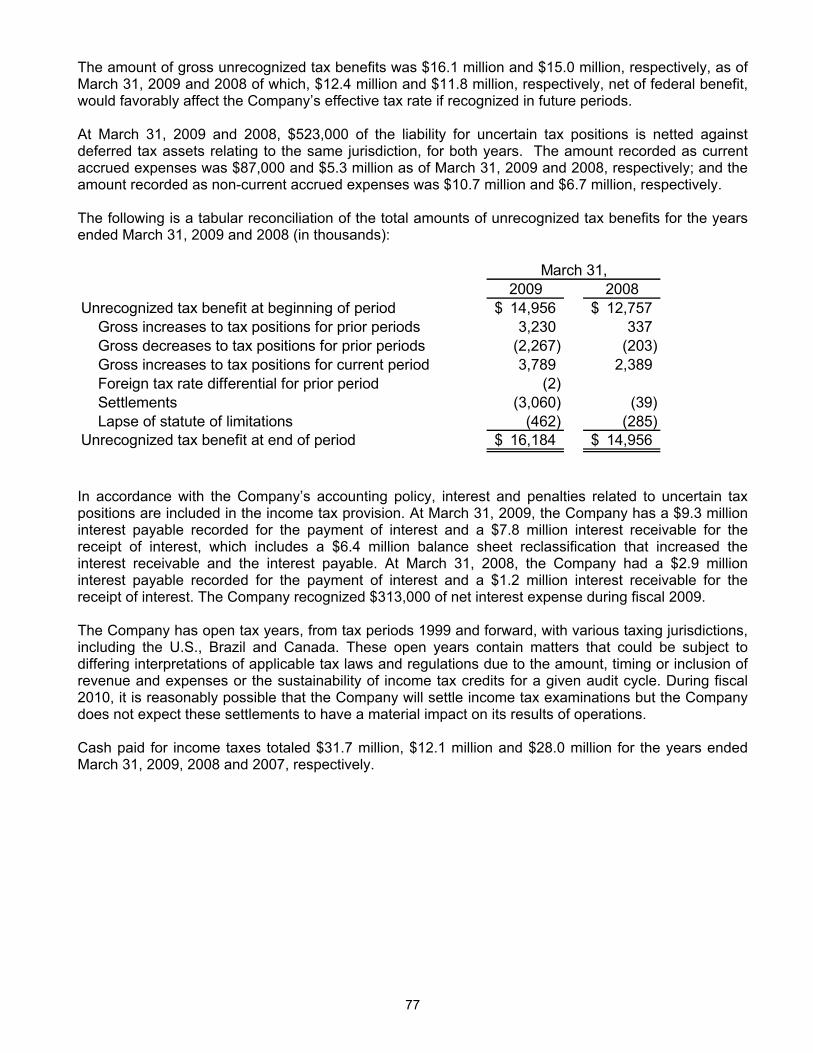
77
The amount of gross unrecognized tax benefits was $16.1 million and $15.0 million, respectively, as of March 31, 2009 and 2008 of which, $12.4 million and $11.8 million, respectively, net of federal benefit, would favorably affect the Company’s effective tax rate if recognized in future periods. At March 31, 2009 and 2008, $523,000 of the liability for uncertain tax positions is netted against deferred tax assets relating to the same jurisdiction, for both years. The amount recorded as current accrued expenses was $87,000 and $5.3 million as of March 31, 2009 and 2008, respectively; and the amount recorded as non-current accrued expenses was $10.7 million and $6.7 million, respectively. The following is a tabular reconciliation of the total amounts of unrecognized tax benefits for the years ended March 31, 2009 and 2008 (in thousands):
2009 2008Unrecognized tax benefit at beginning of period 14,956$ 12,757$ Gross increases to tax positions for prior periods 3,230 337 Gross decreases to tax positions for prior periods (2,267) (203) Gross increases to tax positions for current period 3,789 2,389 Foreign tax rate differential for prior period (2) Settlements (3,060) (39) Lapse of statute of limitations (462) (285) Unrecognized tax benefit at end of period 16,184$ 14,956$
March 31,
In accordance with the Company’s accounting policy, interest and penalties related to uncertain tax positions are included in the income tax provision. At March 31, 2009, the Company has a $9.3 million interest payable recorded for the payment of interest and a $7.8 million interest receivable for the receipt of interest, which includes a $6.4 million balance sheet reclassification that increased the interest receivable and the interest payable. At March 31, 2008, the Company had a $2.9 million interest payable recorded for the payment of interest and a $1.2 million interest receivable for the receipt of interest. The Company recognized $313,000 of net interest expense during fiscal 2009. The Company has open tax years, from tax periods 1999 and forward, with various taxing jurisdictions, including the U.S., Brazil and Canada. These open years contain matters that could be subject to differing interpretations of applicable tax laws and regulations due to the amount, timing or inclusion of revenue and expenses or the sustainability of income tax credits for a given audit cycle. During fiscal 2010, it is reasonably possible that the Company will settle income tax examinations but the Company does not expect these settlements to have a material impact on its results of operations. Cash paid for income taxes totaled $31.7 million, $12.1 million and $28.0 million for the years ended March 31, 2009, 2008 and 2007, respectively.

78
13. SEGMENT INFORMATION Compuware has three business segments in the software industry: products, professional services and application services. The Company provides software products, professional services and application services to the world’s largest IT organizations that help IT professionals increase the effectiveness of their organizations. The Company’s products are designed to enhance the effectiveness of key disciplines throughout IT organizations from application development and delivery to service management and IT portfolio management supporting all major enterprise computing platforms. The Company also offers a broad range of IT professional services including business systems analysis, design, communication, programming, software conversion and system planning and consulting; and application services which use business-to-business applications to integrate vital business information and processes between partners, customers and vendors. No single customer accounted for greater than 10% of total revenue during the years ended March 31, 2009, 2008 or 2007, or greater than 10% of accounts receivable at March 31, 2009 or 2008. The Company evaluates the performance of its segments based primarily on operating profit before administrative and general expenses and other charges. The allocation of income taxes is not evaluated at the segment level. Financial information for the Company’s business segments is as follows (in thousands):
Year Ended March 31,2009 2008 2007
Revenues: Products: Mainframe 450,401$ 486,687$ 484,807$ Distributed 248,713 287,193 256,199 Total products revenue 699,114 773,880 741,006 Professional services 356,111 418,559 442,082 Application services 35,230 37,172 29,914 Total revenues 1,090,455$ 1,229,611$ 1,213,002$
Income (loss) from operations: Products 319,885$ 328,173$ 275,091$ Professional services 25,110 43,933 57,893 Application services (1,799) (2,123) (6,626) Subtotal 343,196 369,983 326,358 Administrative and general (148,019) (182,488) (193,578) Restructuring costs (10,037) (42,645) Income from operations 185,140 144,850 132,780 Other income, net 27,581 35,542 60,277 Income before income taxes 212,721$ 180,392$ 193,057$
The Company does not evaluate assets and capital expenditures on a segment basis, and accordingly such information is not provided.

79
Financial information regarding geographic operations is presented in the table below (in thousands):
Year Ended March 31,2009 2008 2007
Revenues: United States 679,373$ 769,995$ 800,585$ Europe and Africa 295,621 329,470 301,556 Other international operations 115,461 130,146 110,861 Total revenues 1,090,455$ 1,229,611$ 1,213,002$
2009 2008Long-lived assets: United States 622,578$ 661,356$ Europe and Africa 29,802 38,601 Other international operations 78,103 83,654 Total long-lived assets 730,483$ 783,611$
March 31,
Long-lived assets are comprised of property, plant and equipment, goodwill and capitalized software. 14. COMMITMENTS AND CONTINGENCIES The Company leases office space, equipment and land under various operating lease agreements extending through fiscal 2100. Total rent payments under these agreements were approximately $30.9 million, $37.6 million and $36.9 million, respectively, for the years ended March 31, 2009, 2008 and 2007. Certain of these leases contain provisions for renewal options and escalation clauses. The Company also has commitments under various advertising and charitable contribution agreements totaling $12.9 million and $1.0 million, respectively, at March 31, 2009. Total expense related to these agreements was approximately $3.7 million, $3.4 million and $3.5 million, respectively, for the years ended March 31, 2009, 2008 and 2007. The following is a schedule of future minimum commitments (in thousands):
2015 andTotal 2010 2011 2012 2013 2014 Thereafter
Contractual obligations: Operating leases 268,815$ 23,888$ 14,948$ 9,471$ 6,308$ 1,676$ 212,524$ Other 13,900 5,600 3,450 3,450 450 450 500
Total 282,715$ 29,488$ 18,398$ 12,921$ 6,758$ 2,126$ 213,024$
Payment Due by Period as of March 31,
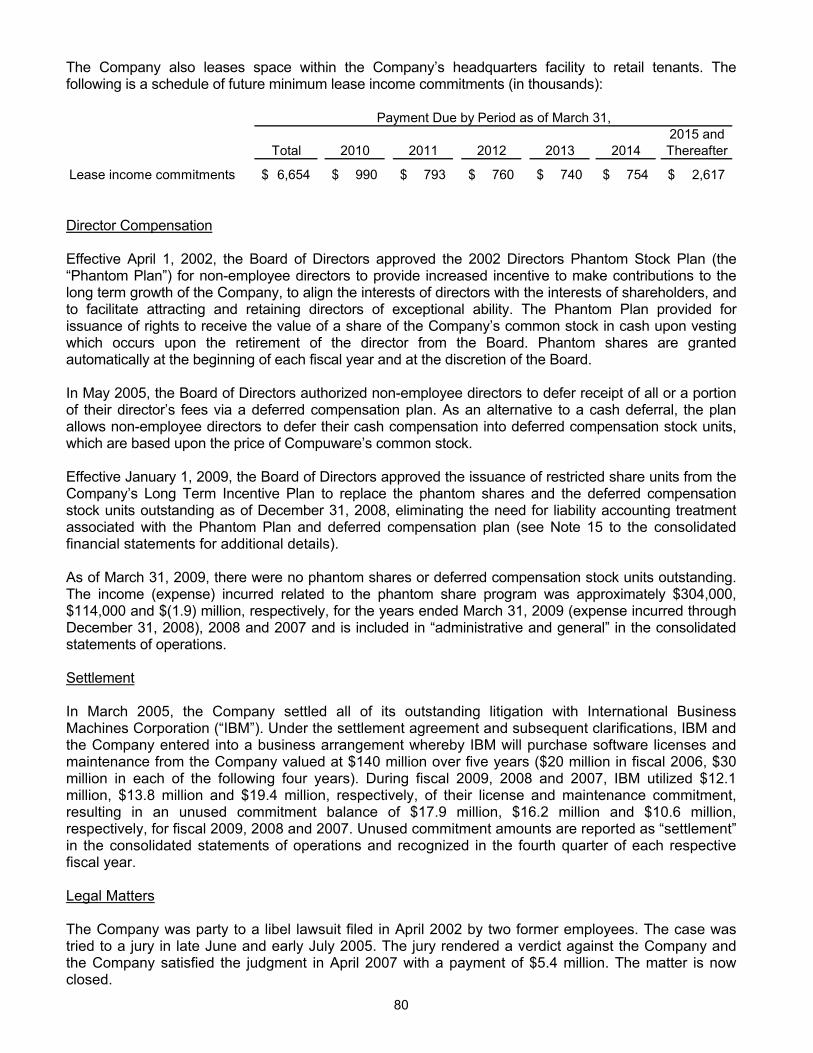
80
The Company also leases space within the Company’s headquarters facility to retail tenants. The following is a schedule of future minimum lease income commitments (in thousands):
2015 andTotal 2010 2011 2012 2013 2014 Thereafter
Lease income commitments 6,654$ 990$ 793$ 760$ 740$ 754$ 2,617$
Payment Due by Period as of March 31,
Director Compensation Effective April 1, 2002, the Board of Directors approved the 2002 Directors Phantom Stock Plan (the “Phantom Plan”) for non-employee directors to provide increased incentive to make contributions to the long term growth of the Company, to align the interests of directors with the interests of shareholders, and to facilitate attracting and retaining directors of exceptional ability. The Phantom Plan provided for issuance of rights to receive the value of a share of the Company’s common stock in cash upon vesting which occurs upon the retirement of the director from the Board. Phantom shares are granted automatically at the beginning of each fiscal year and at the discretion of the Board. In May 2005, the Board of Directors authorized non-employee directors to defer receipt of all or a portion of their director’s fees via a deferred compensation plan. As an alternative to a cash deferral, the plan allows non-employee directors to defer their cash compensation into deferred compensation stock units, which are based upon the price of Compuware’s common stock. Effective January 1, 2009, the Board of Directors approved the issuance of restricted share units from the Company’s Long Term Incentive Plan to replace the phantom shares and the deferred compensation stock units outstanding as of December 31, 2008, eliminating the need for liability accounting treatment associated with the Phantom Plan and deferred compensation plan (see Note 15 to the consolidated financial statements for additional details). As of March 31, 2009, there were no phantom shares or deferred compensation stock units outstanding. The income (expense) incurred related to the phantom share program was approximately $304,000, $114,000 and $(1.9) million, respectively, for the years ended March 31, 2009 (expense incurred through December 31, 2008), 2008 and 2007 and is included in “administrative and general” in the consolidated statements of operations. Settlement In March 2005, the Company settled all of its outstanding litigation with International Business Machines Corporation (“IBM”). Under the settlement agreement and subsequent clarifications, IBM and the Company entered into a business arrangement whereby IBM will purchase software licenses and maintenance from the Company valued at $140 million over five years ($20 million in fiscal 2006, $30 million in each of the following four years). During fiscal 2009, 2008 and 2007, IBM utilized $12.1 million, $13.8 million and $19.4 million, respectively, of their license and maintenance commitment, resulting in an unused commitment balance of $17.9 million, $16.2 million and $10.6 million, respectively, for fiscal 2009, 2008 and 2007. Unused commitment amounts are reported as “settlement” in the consolidated statements of operations and recognized in the fourth quarter of each respective fiscal year. Legal Matters The Company was party to a libel lawsuit filed in April 2002 by two former employees. The case was tried to a jury in late June and early July 2005. The jury rendered a verdict against the Company and the Company satisfied the judgment in April 2007 with a payment of $5.4 million. The matter is now closed.
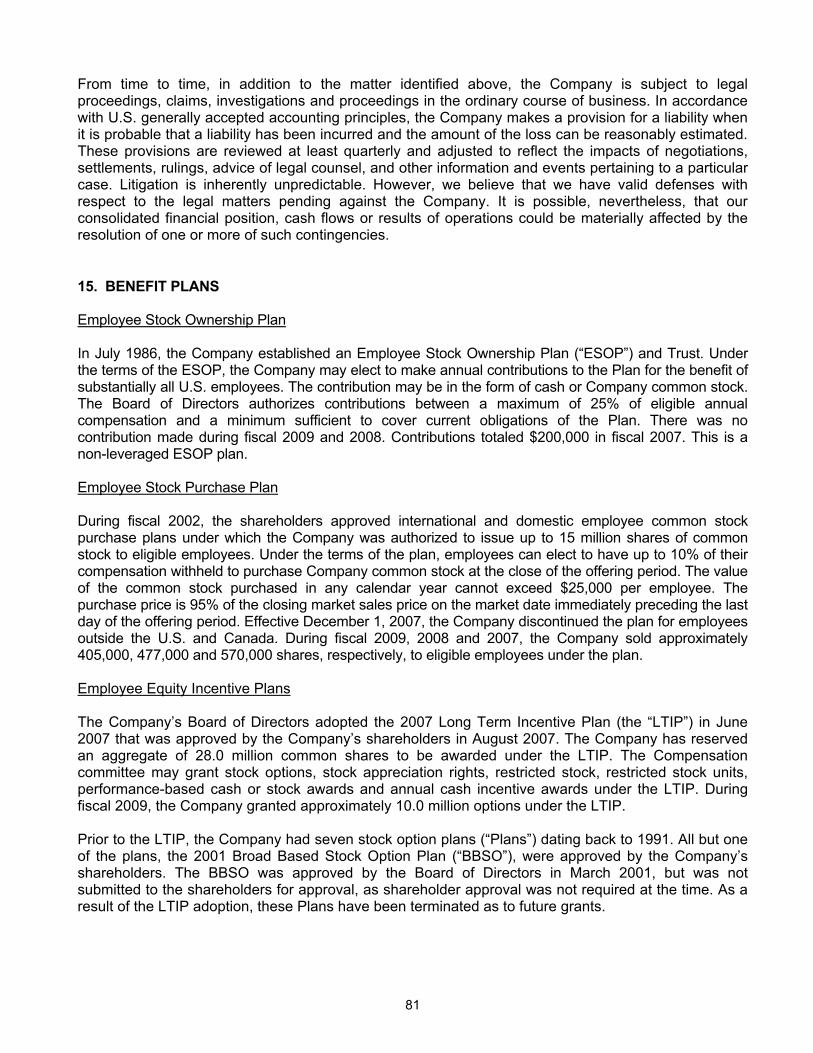
81
From time to time, in addition to the matter identified above, the Company is subject to legal proceedings, claims, investigations and proceedings in the ordinary course of business. In accordance with U.S. generally accepted accounting principles, the Company makes a provision for a liability when it is probable that a liability has been incurred and the amount of the loss can be reasonably estimated. These provisions are reviewed at least quarterly and adjusted to reflect the impacts of negotiations, settlements, rulings, advice of legal counsel, and other information and events pertaining to a particular case. Litigation is inherently unpredictable. However, we believe that we have valid defenses with respect to the legal matters pending against the Company. It is possible, nevertheless, that our consolidated financial position, cash flows or results of operations could be materially affected by the resolution of one or more of such contingencies. 15. BENEFIT PLANS Employee Stock Ownership Plan In July 1986, the Company established an Employee Stock Ownership Plan (“ESOP”) and Trust. Under the terms of the ESOP, the Company may elect to make annual contributions to the Plan for the benefit of substantially all U.S. employees. The contribution may be in the form of cash or Company common stock. The Board of Directors authorizes contributions between a maximum of 25% of eligible annual compensation and a minimum sufficient to cover current obligations of the Plan. There was no contribution made during fiscal 2009 and 2008. Contributions totaled $200,000 in fiscal 2007. This is a non-leveraged ESOP plan. Employee Stock Purchase Plan During fiscal 2002, the shareholders approved international and domestic employee common stock purchase plans under which the Company was authorized to issue up to 15 million shares of common stock to eligible employees. Under the terms of the plan, employees can elect to have up to 10% of their compensation withheld to purchase Company common stock at the close of the offering period. The value of the common stock purchased in any calendar year cannot exceed $25,000 per employee. The purchase price is 95% of the closing market sales price on the market date immediately preceding the last day of the offering period. Effective December 1, 2007, the Company discontinued the plan for employees outside the U.S. and Canada. During fiscal 2009, 2008 and 2007, the Company sold approximately 405,000, 477,000 and 570,000 shares, respectively, to eligible employees under the plan. Employee Equity Incentive Plans The Company’s Board of Directors adopted the 2007 Long Term Incentive Plan (the “LTIP”) in June 2007 that was approved by the Company’s shareholders in August 2007. The Company has reserved an aggregate of 28.0 million common shares to be awarded under the LTIP. The Compensation committee may grant stock options, stock appreciation rights, restricted stock, restricted stock units, performance-based cash or stock awards and annual cash incentive awards under the LTIP. During fiscal 2009, the Company granted approximately 10.0 million options under the LTIP. Prior to the LTIP, the Company had seven stock option plans (“Plans”) dating back to 1991. All but one of the plans, the 2001 Broad Based Stock Option Plan (“BBSO”), were approved by the Company’s shareholders. The BBSO was approved by the Board of Directors in March 2001, but was not submitted to the shareholders for approval, as shareholder approval was not required at the time. As a result of the LTIP adoption, these Plans have been terminated as to future grants.

82
Stock Options A summary of option activity under the Company’s stock-based compensation plans as of March 31, 2009, and changes during the the year then ended is presented below (shares and intrinsic value in thousands):
Weighted Weighted Average Average Remaining Aggregate
Exercise Contractual IntrinsicShares Term Value
Outstanding as of April 1, 2008 34,289 12.69$ Granted 9,989 7.71 Exercised (1,342) 7.85 Forfeited (1,843) 7.65 Cancelled/expired (6,848) 23.49 Outstanding as of March 31, 2009 34,245 9.59$ 4.36 1,608$
Ending vested and expected to vest 32,435 9.68$ 4.09 1,601$ Exercisable as of March 31, 2009 21,693 10.58$ 1.98 1,507$
Price
Historically, the Company’s options typically had the following vesting schedule: fifty percent of the option shares granted become exercisable on the third year anniversary of the date of grant, and 25% of the option shares vest on each of the fourth year and fifth year anniversaries of the date of grant. The options granted in fiscal 2009 had the following vesting schedule (shares in thousands):
Options grantedin fiscal 2009 Year 1 Year 2 Year 3 Year 4 Year 5
4,925 30% 30% 40%4,000 20% 20% 20% 20% 20% 564 50% 25% 25% 500 100%
(1) Vesting occurs on the grant date anniversary of each year.
Vesting Schedule (1)
All options were granted at fair market value and expire ten years from the date of grant. The total fair value of shares vested and the total intrinsic value of options exercised during the years ended March 31, 2009, 2008 and 2007 were as follows (intrinsic values in thousands):
2009 2008 2007Fair value of shares vested 3.90$ 5.11$ 5.58$ Intrinsic value of options exercised 3,923 16,713 9,986
Year Ended March 31,
Restricted Stock Units During fiscal 2009, the Company issued 758,000 shares of restricted stock units to directors of which 716,000 were issued on January 1, 2009 to replace their phantom shares and deferred compensation stock units outstanding as of December 31, 2008 (See Note 14 to the consolidated financial statements for additional details). These restricted stock units became 100% vested upon issuance. The remaining
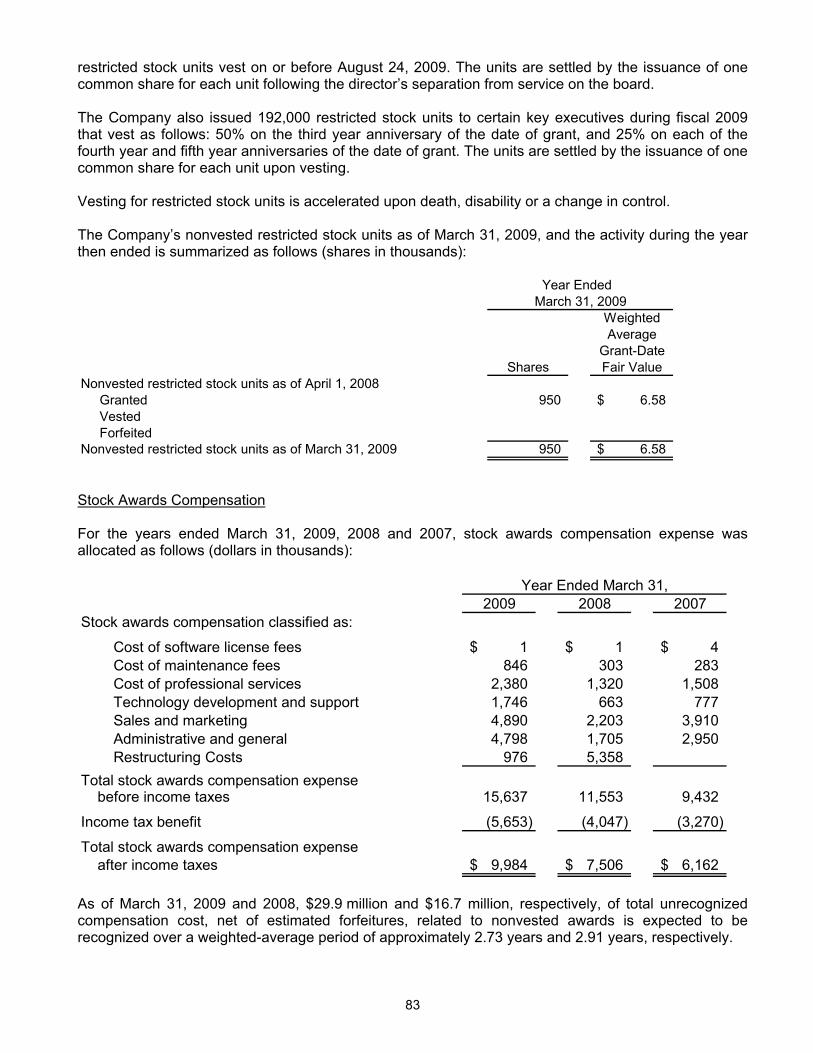
83
restricted stock units vest on or before August 24, 2009. The units are settled by the issuance of one common share for each unit following the director’s separation from service on the board. The Company also issued 192,000 restricted stock units to certain key executives during fiscal 2009 that vest as follows: 50% on the third year anniversary of the date of grant, and 25% on each of the fourth year and fifth year anniversaries of the date of grant. The units are settled by the issuance of one common share for each unit upon vesting. Vesting for restricted stock units is accelerated upon death, disability or a change in control. The Company’s nonvested restricted stock units as of March 31, 2009, and the activity during the year then ended is summarized as follows (shares in thousands):
Weighted Average
Grant-DateShares Fair Value
Nonvested restricted stock units as of April 1, 2008 Granted 950 6.58$ Vested Forfeited Nonvested restricted stock units as of March 31, 2009 950 6.58$
March 31, 2009Year Ended
Stock Awards Compensation For the years ended March 31, 2009, 2008 and 2007, stock awards compensation expense was allocated as follows (dollars in thousands):
2009 2008 2007Stock awards compensation classified as:
Cost of software license fees 1$ 1$ 4$ Cost of maintenance fees 846 303 283 Cost of professional services 2,380 1,320 1,508 Technology development and support 1,746 663 777 Sales and marketing 4,890 2,203 3,910 Administrative and general 4,798 1,705 2,950 Restructuring Costs 976 5,358
Total stock awards compensation expense before income taxes 15,637 11,553 9,432
Income tax benefit (5,653) (4,047) (3,270)
Total stock awards compensation expense after income taxes 9,984$ 7,506$ 6,162$
Year Ended March 31,
As of March 31, 2009 and 2008, $29.9 million and $16.7 million, respectively, of total unrecognized compensation cost, net of estimated forfeitures, related to nonvested awards is expected to be recognized over a weighted-average period of approximately 2.73 years and 2.91 years, respectively.
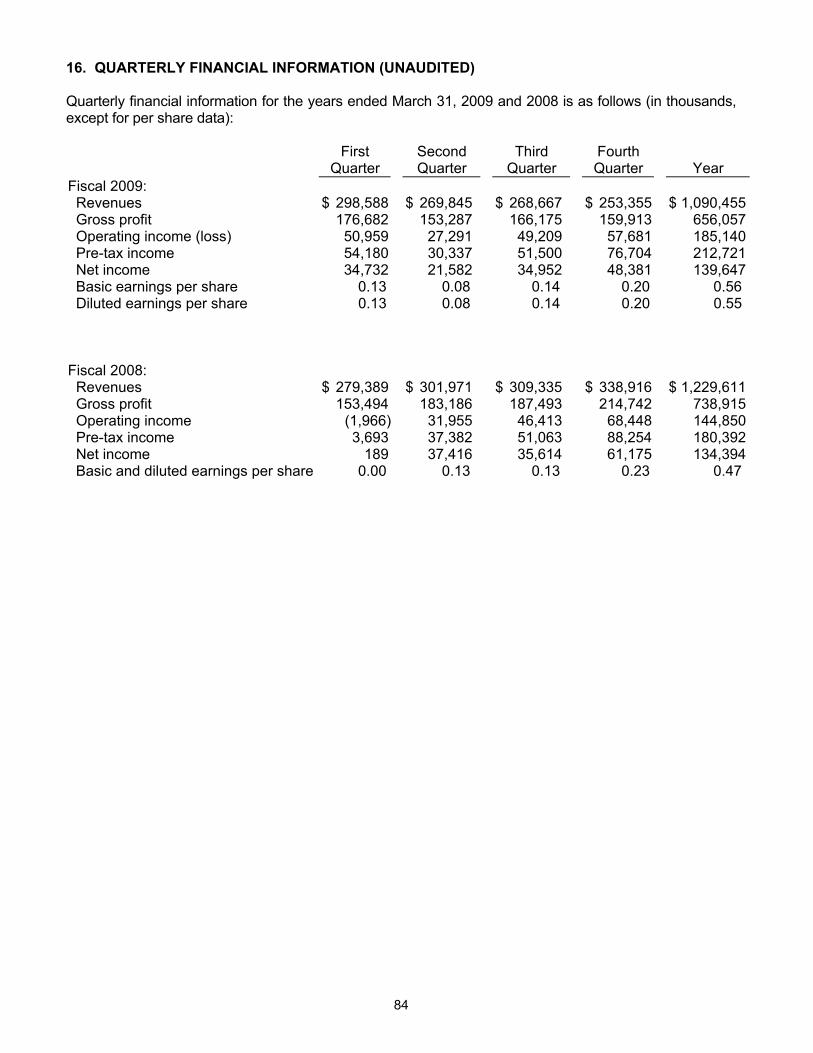
84
16. QUARTERLY FINANCIAL INFORMATION (UNAUDITED) Quarterly financial information for the years ended March 31, 2009 and 2008 is as follows (in thousands, except for per share data):
First Second Third Fourth Quarter Quarter Quarter Quarter Year Fiscal 2009: Revenues $ 298,588 $ 269,845 $ 268,667 $ 253,355 $ 1,090,455 Gross profit 176,682 153,287 166,175 159,913 656,057 Operating income (loss) 50,959 27,291 49,209 57,681 185,140 Pre-tax income 54,180 30,337 51,500 76,704 212,721 Net income 34,732 21,582 34,952 48,381 139,647 Basic earnings per share 0.13 0.08 0.14 0.20 0.56 Diluted earnings per share 0.13 0.08 0.14 0.20 0.55 Fiscal 2008: Revenues $ 279,389 $ 301,971 $ 309,335 $ 338,916 $ 1,229,611 Gross profit 153,494 183,186 187,493 214,742 738,915 Operating income (1,966) 31,955 46,413 68,448 144,850 Pre-tax income 3,693 37,382 51,063 88,254 180,392 Net income 189 37,416 35,614 61,175 134,394 Basic and diluted earnings per share 0.00 0.13 0.13 0.23 0.47

85
ITEM 9. CHANGES IN AND DISAGREEMENTS WITH ACCOUNTANTS ON ACCOUNTING AND FINANCIAL DISCLOSURE
None. ITEM 9A. CONTROLS AND PROCEDURES
Evaluation of Disclosure Controls and Procedures The Company maintains disclosure controls and procedures that are designed to ensure information required to be disclosed in the Company’s reports that it files or submits under the Securities Exchange Act of 1934 is recorded, processed, summarized, and reported within the time periods specified in the SEC’s rules and forms, and that such information is accumulated and communicated to the Company’s management, including its Chief Executive Officer and Chief Financial Officer, as appropriate, to allow timely decisions regarding required financial disclosure. In designing and evaluating the disclosure controls and procedures, management recognized that a control system, no matter how well designed and operated, can provide only reasonable, not absolute, assurance that the objectives of the control system are met. Because of the inherent limitations in all control systems, no evaluation of controls can provide absolute assurance that all control issues and instances of fraud, if any, with a company have been detected. As of the end of the period covered by this report, the Company carried out an evaluation, under the supervision and with the participation of the Company’s management, including its Chief Executive Officer and Chief Financial Officer, of the effectiveness of the design and operation of the Company’s disclosure controls and procedures pursuant to Rule 13a-15 of the Securities Exchange Act of 1934 (the “Exchange Act”). Based upon that evaluation, the Company’s Chief Executive Officer and Chief Financial Officer concluded that the Company’s disclosure controls and procedures are effective, at the reasonable assurance level, to cause information required to be disclosed by the Company in the reports that it files or submits under the Exchange Act to be recorded, processed, summarized and reported within the time periods specified in the Commission’s rules and forms and that such information is accumulated and communicated to the Company’s management, including its Chief Executive Officer and Chief Financial Officer, to allow timely decisions regarding required financial disclosure. Management’s Report on Internal Control over Financial Reporting The Company’s management is responsible for establishing and maintaining adequate internal control over financial reporting as defined in Rules 13a-15(f) and 15d-15(f) under the Exchange Act. Internal control over financial reporting is defined under applicable Securities and Exchange Commission rules as a process designed under the supervision of the Company’s Chief Executive Officer and Chief Financial Officer and effected by the Company’s Board of Directors, management and other personnel to provide reasonable assurance regarding the reliability of financial reporting and the preparation of the Company’s financial statements for external purposes in accordance with U.S. generally accepted accounting principles. Internal control over financial reporting includes those policies and procedures that:
• pertain to the maintenance of records that, in reasonable detail, accurately and fairly reflect the
transactions and dispositions of the assets of the Company; • provide reasonable assurance that transactions are recorded as necessary to permit
preparation of financial statements in accordance with U. S. generally accepted accounting principles, and that receipts and expenditures of the Company are being made only in accordance with authorizations of management and directors of the Company; and
86
• provide reasonable assurance regarding prevention or timely detection of unauthorized acquisition, use or disposition of the Company’s assets that could have a material effect on the financial statements.
Because of its inherent limitations, internal control over financial reporting may not prevent or detect misstatements. In addition, projections of any evaluation of effectiveness to future periods are subject to the risk that controls may become ineffective because of changes in conditions and that the degree of compliance with the policies or procedures may deteriorate. As of March 31, 2009, management, with the participation of the Company’s Chief Executive Officer and Chief Financial Officer, assessed the effectiveness of the Company’s internal control over financial reporting based on the criteria for effective internal control over financial reporting established in “Internal Control — Integrated Framework,” issued by the Committee of Sponsoring Organizations (“COSO”) of the Treadway Commission. Based on the assessment, management determined that the Company’s internal control over financial reporting was effective, as of March 31, 2009, to provide reasonable assurance regarding the reliability of financial reporting and the preparation of the Company’s financial statements for external purposes in accordance with U.S. generally accepted accounting principles. Deloitte & Touche LLP, the independent registered public accounting firm that audited the consolidated financial statements of the Company included in this Annual Report on Form 10-K, has issued an attestation report on the Company’s internal control over financial reporting as of March 31, 2009. The report, which expresses an unqualified opinion on the effectiveness of the Company’s internal control over financial reporting as of March 31, 2009, is included in this Item under the heading “Report of Independent Registered Public Accounting Firm.” Changes in Internal Control Over Financial Reporting
No changes in the Company’s internal control over financial reporting occurred during the quarter ended March 31, 2009 that have materially affected, or are reasonably likely to materially affect, the Company’s internal control over financial reporting. Report of Independent Registered Public Accounting Firm To the Board of Directors and Shareholders of Compuware Corporation Detroit, Michigan We have audited the internal control over financial reporting of Compuware Corporation and subsidiaries (the “Company”) as of March 31, 2009, based on criteria established in Internal Control — Integrated Framework issued by the Committee of Sponsoring Organizations of the Treadway Commission. The Company’s management is responsible for maintaining effective internal control over financial reporting and for its assessment of the effectiveness of internal control over financial reporting, included in the accompanying Management’s Report on Internal Control over Financial Reporting. Our responsibility is to express an opinion on the Company’s internal control over financial reporting based on our audit. We conducted our audit in accordance with the standards of the Public Company Accounting Oversight Board (United States). Those standards require that we plan and perform the audit to obtain reasonable assurance about whether effective internal control over financial reporting was maintained in all material respects. Our audit included obtaining an understanding of internal control over financial reporting, assessing the risk that a material weakness exists, testing and evaluating the design and operating effectiveness of internal control based on the assessed risk, and performing such other procedures as we considered necessary in the circumstances. We believe that our audit provides a reasonable basis for our opinion.

87
A company’s internal control over financial reporting is a process designed by, or under the supervision of, the company’s principal executive and principal financial officers, or persons performing similar functions, and effected by the company’s board of directors, management, and other personnel to provide reasonable assurance regarding the reliability of financial reporting and the preparation of financial statements for external purposes in accordance with generally accepted accounting principles. A company’s internal control over financial reporting includes those policies and procedures that (1) pertain to the maintenance of records that, in reasonable detail, accurately and fairly reflect the transactions and dispositions of the assets of the company; (2) provide reasonable assurance that transactions are recorded as necessary to permit preparation of financial statements in accordance with generally accepted accounting principles, and that receipts and expenditures of the company are being made only in accordance with authorizations of management and directors of the company; and (3) provide reasonable assurance regarding prevention or timely detection of unauthorized acquisition, use, or disposition of the company’s assets that could have a material effect on the financial statements. Because of the inherent limitations of internal control over financial reporting, including the possibility of collusion or improper management override of controls, material misstatements due to error or fraud may not be prevented or detected on a timely basis. Also, projections of any evaluation of the effectiveness of the internal control over financial reporting to future periods are subject to the risk that the controls may become inadequate because of changes in conditions, or that the degree of compliance with the policies or procedures may deteriorate. In our opinion, the Company maintained, in all material respects, effective internal control over financial reporting as of March 31, 2009, based on the criteria established in Internal Control — Integrated Framework issued by the Committee of Sponsoring Organizations of the Treadway Commission. We have also audited, in accordance with the standards of the Public Company Accounting Oversight Board (United States), the consolidated financial statements as of and for the year ended March 31, 2009, of the Company and our report dated May 27, 2009, expressed an unqualified opinion on those financial statements and included an explanatory paragraph regarding the adoption of Financial Accounting Standards Board (FASB) Interpretation No. 48, Accounting for Uncertainty in Income Taxes – an Interpretation of FASB Statement No. 109.
/s/ DELOITTE & TOUCHE LLP
Detroit, Michigan May 27, 2009
ITEM 9B. OTHER INFORMATION
None
88
PART III ITEM 10. DIRECTORS, EXECUTIVE OFFICERS AND CORPORATE GOVERNANCE
The information required by this Item is contained in the Proxy Statement under the captions “Corporate Governance” (excluding the Report of the Audit Committee), “Election of Directors” and “Other Matters – Section 16(a) Beneficial Ownership Reporting Compliance” and is incorporated herein by reference.
ITEM 11. EXECUTIVE COMPENSATION
The information required by this Item is contained in the Proxy Statement under the caption “Compensation of Executive Officers” and “Corporate Governance – Compensation of Directors” and is incorporated herein by reference.
ITEM 12. SECURITY OWNERSHIP OF CERTAIN BENEFICIAL OWNERS AND MANAGEMENT AND
RELATED STOCKHOLDER MATTERS
The information required by this Item is contained in the Proxy Statement under the caption “Security Ownership of Management and Major Shareholders” and is incorporated herein by reference.
The Company’s Board of Directors adopted the 2007 Long Term Incentive Plan (“LTIP”) in June 2007 and the Company’s shareholders approved the LTIP in August 2007. The Compensation Committee may grant stock options, stock appreciation rights, restricted stock, restricted stock units, performance-based cash or stock awards and annual cash incentive awards under the LTIP. Prior to the LTIP, the Company had seven stock option plans (“Prior Plans”) dating back to 1991. All but one of the Prior Plans, the 2001 Broad Based Stock Option Plan (“BBSO”), were approved by the Company’s shareholders. The BBSO was approved by the Board of Directors in March 2001, but was not submitted to the shareholders for approval, as shareholder approval was not required at the time. Under the terms of the BBSO, the Company was authorized to grant nonqualified stock options with a maximum term of ten years to any employee or director of the Company at an exercise price and with vesting and other terms determined by the Compensation Committee of the Company’s Board. Options granted under the BBSO either vested every six months over a four year period or 50% of the option became vested on the third year anniversary of the date of grant, and 25% of the option vested on each of the fourth year and fifth year anniversaries of the date of grant. All options were granted at fair market value and expired ten years from the date of grant. As a result of the LTIP adoption, the Prior Plans have been terminated as to future grants. The Company also has an Employee Stock Ownership Plan (“ESOP”) and an Employee Stock Purchase Plan (“ESPP”). The information about our equity compensation plans in Note 15 of the Notes to Consolidated Financial Statements, included in Item 8 of this report, is incorporated herein by reference.

89
The following table sets forth certain information with respect to our equity compensation plans at March 31, 2009 (shares in thousands): Number of securities Number of securities remaining available to be issued Weighted-average for future issuance upon exercise of exercise price of under equity outstanding options outstanding options compensation plans
Equity compensation plans approved by security holders 19,499 $10.22 17,119 Equity compensation plans not approved by security holders 14,746 $8.76
ITEM 13. CERTAIN RELATIONSHIPS AND RELATED TRANSACTIONS, AND DIRECTOR INDEPENDENCE
The information required by this Item is contained in the Proxy Statement under the caption “Other Matters – Related Party Transactions,” “Corporate Governance – Board of Directors – Director Independence” and Compensation of Executive Officers – Compensation Committee Interlocks and Insider Participation” and is incorporated herein by reference.
ITEM 14. PRINCIPAL ACCOUNTANT FEES AND SERVICES The information required by this Item is contained in the Proxy Statement under the caption “Ratification of Appointment of the Independent Registered Public Accounting Firm” and is incorporated herein by reference.
90
PART IV ITEM 15. EXHIBITS AND FINANCIAL STATEMENT SCHEDULES (a) Documents filed as part of this report. 1. Consolidated Financial Statements
The following consolidated financial statements of the Company and its subsidiaries are filed herewith:
Page Report of Independent Registered Public Accounting Firm 50 Consolidated Balance Sheets as of March 31, 2009 and 2008 51 Consolidated Statements of Operations for each of the years ended March 31, 2009, 2008, and 2007 52 Consolidated Statements of Shareholders' Equity for each of the years ended March 31, 2009, 2008, and 2007 53 Consolidated Statements of Cash Flows for each of the years ended March 31, 2009, 2008, and 2007 54 Notes to Consolidated Financial Statements 55-84 2. Financial Statement Schedules
All financial statement schedules are omitted as the required information is not applicable or the information is presented in the consolidated financial statements or related notes.
3. EXHIBITS
The exhibits filed in response to Item 601 of Regulation S-K are listed in the Exhibit Index attached to this report. The Exhibit Index is incorporated herein by reference.

91
SIGNATURES Pursuant to the requirements of Sections 13 or 15(d) of the Securities Exchange Act of 1934, the Registrant has duly caused this Annual Report on Form 10-K to be signed on its behalf by the undersigned, thereunto duly authorized, in the City of Detroit, State of Michigan on May 27, 2009. COMPUWARE CORPORATION
By: /S/ PETER KARMANOS, JR. Peter Karmanos, Jr. Chairman of the Board, Chief
Executive Officer (Principal Executive Officer)
Pursuant to the requirements of the Securities Exchange Act of 1934, this report has been signed by the following persons on behalf of the Registrant and in the capacities and on the dates indicated:
Signature Title Date
/S/ PETER KARMANOS, JR. Chairman of the Board, Chief Executive Officer May 27, 2009 Peter Karmanos, Jr. And Director (Principal Executive Officer)
/S/ LAURA L. FOURNIER Executive Vice President, Chief Financial Officer May 27, 2009
Laura L. Fournier and Treasurer (Principal Financial Officer) /S/ DENNIS W. ARCHER Director May 27, 2009
Dennis W. Archer /S/ GURMINDER S. BEDI Director May 27, 2009
Gurminder S. Bedi /S/ WILLIAM O. GRABE Director May 27, 2009
William O. Grabe
/S/ WILLIAM R. HALLING Director May 27, 2009 William R. Halling
/S/ FAYE A. NELSON Director May 27, 2009
Faye A. Nelson /S/ GLENDA D. PRICE Director May 27, 2009
Glenda D. Price /S/ W. JAMES PROWSE Director May 27, 2009
W. James Prowse /S/ G. SCOTT ROMNEY Director May 27, 2009
G. Scott Romney
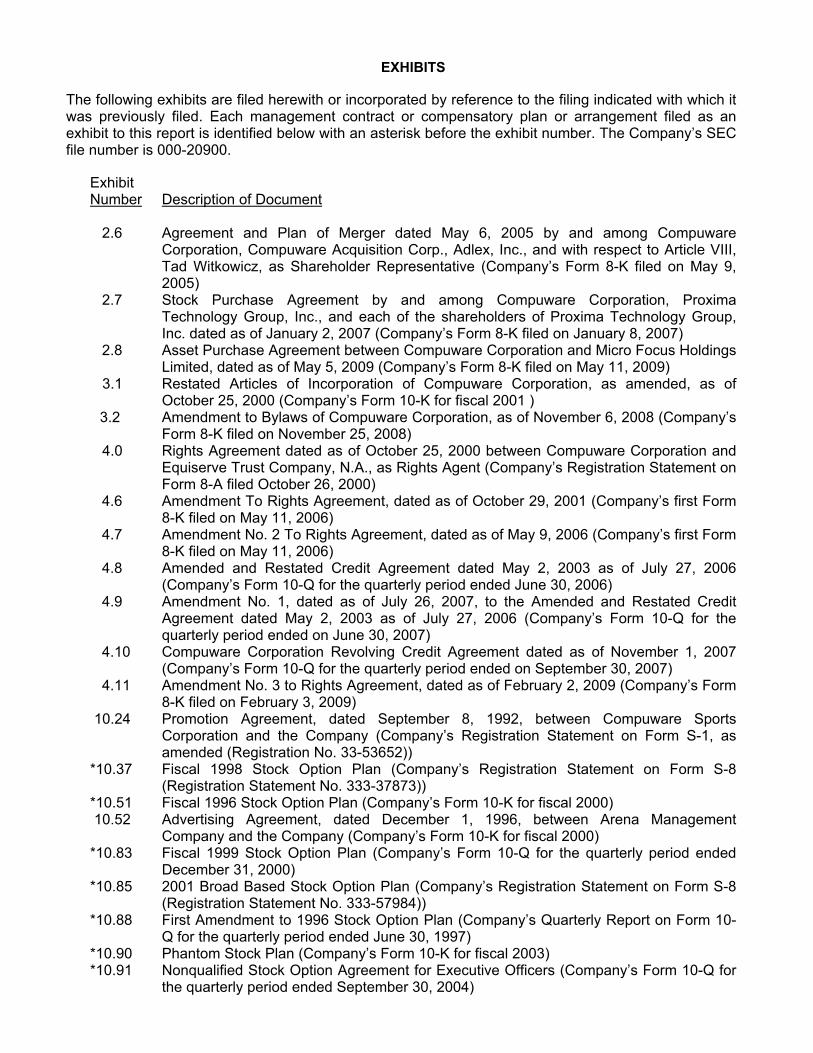
EXHIBITS
The following exhibits are filed herewith or incorporated by reference to the filing indicated with which it was previously filed. Each management contract or compensatory plan or arrangement filed as an exhibit to this report is identified below with an asterisk before the exhibit number. The Company’s SEC file number is 000-20900.
Exhibit Number Description of Document
2.6 Agreement and Plan of Merger dated May 6, 2005 by and among Compuware Corporation, Compuware Acquisition Corp., Adlex, Inc., and with respect to Article VIII, Tad Witkowicz, as Shareholder Representative (Company’s Form 8-K filed on May 9, 2005)
2.7 Stock Purchase Agreement by and among Compuware Corporation, Proxima Technology Group, Inc., and each of the shareholders of Proxima Technology Group, Inc. dated as of January 2, 2007 (Company’s Form 8-K filed on January 8, 2007)
2.8 Asset Purchase Agreement between Compuware Corporation and Micro Focus Holdings Limited, dated as of May 5, 2009 (Company’s Form 8-K filed on May 11, 2009)
3.1 Restated Articles of Incorporation of Compuware Corporation, as amended, as of October 25, 2000 (Company’s Form 10-K for fiscal 2001 )
3.2 Amendment to Bylaws of Compuware Corporation, as of November 6, 2008 (Company’s Form 8-K filed on November 25, 2008)
4.0 Rights Agreement dated as of October 25, 2000 between Compuware Corporation and Equiserve Trust Company, N.A., as Rights Agent (Company’s Registration Statement on Form 8-A filed October 26, 2000)
4.6 Amendment To Rights Agreement, dated as of October 29, 2001 (Company’s first Form 8-K filed on May 11, 2006)
4.7 Amendment No. 2 To Rights Agreement, dated as of May 9, 2006 (Company’s first Form 8-K filed on May 11, 2006)
4.8 Amended and Restated Credit Agreement dated May 2, 2003 as of July 27, 2006 (Company’s Form 10-Q for the quarterly period ended June 30, 2006)
4.9 Amendment No. 1, dated as of July 26, 2007, to the Amended and Restated Credit Agreement dated May 2, 2003 as of July 27, 2006 (Company’s Form 10-Q for the quarterly period ended on June 30, 2007)
4.10 Compuware Corporation Revolving Credit Agreement dated as of November 1, 2007 (Company’s Form 10-Q for the quarterly period ended on September 30, 2007)
4.11 Amendment No. 3 to Rights Agreement, dated as of February 2, 2009 (Company’s Form 8-K filed on February 3, 2009)
10.24 Promotion Agreement, dated September 8, 1992, between Compuware Sports Corporation and the Company (Company’s Registration Statement on Form S-1, as amended (Registration No. 33-53652))
*10.37 Fiscal 1998 Stock Option Plan (Company’s Registration Statement on Form S-8 (Registration Statement No. 333-37873))
*10.51 Fiscal 1996 Stock Option Plan (Company’s Form 10-K for fiscal 2000) 10.52 Advertising Agreement, dated December 1, 1996, between Arena Management
Company and the Company (Company’s Form 10-K for fiscal 2000) *10.83 Fiscal 1999 Stock Option Plan (Company’s Form 10-Q for the quarterly period ended
December 31, 2000) *10.85 2001 Broad Based Stock Option Plan (Company’s Registration Statement on Form S-8
(Registration Statement No. 333-57984)) *10.88 First Amendment to 1996 Stock Option Plan (Company’s Quarterly Report on Form 10-
Q for the quarterly period ended June 30, 1997) *10.90 Phantom Stock Plan (Company’s Form 10-K for fiscal 2003) *10.91 Nonqualified Stock Option Agreement for Executive Officers (Company’s Form 10-Q for
the quarterly period ended September 30, 2004)

*10.92 Nonqualified Stock Option Agreement for Outside Directors (Company’s Form 10-Q for the quarterly period ended September 30, 2004)
*10.93 Phantom Share Award Agreement (Company’s Form 10-Q for the quarterly period ended September 30, 2004)
*10.95 Settlement Agreement dated March 21, 2005 by and among Compuware Corporation and International Business Machines Corporation (Company’s Form 8-K filed on March 21, 2005)
*10.96 First Amendment to the Compuware Corporation 2002 Directors Phantom Stock Plan (Company’s Form 8-K/A filed on May 17, 2005)
*10.97 Amendment Number 1 to Settlement Agreement dated November 29, 2005 by and among Compuware Corporation and International Business Machines Corporation (Company’s Form 8-K filed on November 29, 2005)
*10.98 2005 Non-Employee Directors' Deferred Compensation Plan (Company’s second Form 8-K filed on May 11, 2006)
*10.99 Executive Incentive Plan – Corporate (Company’s Form 8-K filed on June 6, 2006) *10.100 Parallel Nonqualified Stock Purchase Plan Arrangement (Company’s Form 10-K for
fiscal 2006) *10.101 Fifth Amendment to the Compuware Corporation ESOP/401(k) Plan (Company’s Form
10-Q for the quarterly period ended June 30, 2006) *10.102 Post-Retirement Consulting Agreement, dated March 1, 2007, between Compuware
Corporation and Peter Karmanos, Jr. (Company’s Form 8-K filed on March 2, 2007) *10.103 Settlement Agreement, dated July 18, 2007, by and between Compuware Corporation
and Hank Jallos (Company’s Form 10-Q for the quarterly period ended on June 30, 2007)
*10.104 Amendment No. 1, dated August 7, 2007, to the Settlement Agreement dated July 18, 2007 by and between Compuware Corporation and Hank Jallos (Company’s Form 10-Q for the quarterly period ended on June 30, 2007)
*10.105 2007 Long Term Incentive Plan (Appendix A to Company’s definitive proxy statement for 2007 annual shareholders meeting filed on July 24, 2007)
*10.106 Form of Stock Option Agreement (5-Year Version) (Company’s Form 8-K filed on April 25, 2008)
*10.107 Form of Stock Option Agreement (3-Year Version) (Company’s Form 8-K filed on April 25, 2008)
*10.108 Agreement, dated March 7, 2008, by and between Compuware Corporation and Thomas M. Costello (Company’s Form 10-K for fiscal 2008)
*10.109 Form of Compuware Executive Incentive Plan – Corporate as of April 30, 2008 (Company’s Form 10-Q for the quarterly period ended on June 30, 2008)
*10.110 Employee Restricted Stock Unit Award Agreement (Company’s Form 10-Q for the quarterly period ended on September 30, 2008)
*10.111 Amendment to the Consulting/Employment Letter with Peter Karmanos, Jr. (Company’s Form 10-Q for the quarterly period ended on December 31, 2008)
*10.112 W. James Prowse Consulting Agreement dated as of November 17, 2008 (Company’s Form 10-Q for the quarterly period ended on December 31, 2008)
*10.113 Amendment No. 1 to the 2007 Long Term Incentive Plan (Company’s Form 10-Q for the quarterly period ended on December 31, 2008)
*10.114 Amendment No. 2 to the 2002 Directors Phantom Stock Plan (Company’s Form 10-Q for the quarterly period ended on December 31, 2008)
*10.115 Amended and Restated 2005 Non-Employee Directors’ Compensation Plan (Company’s Form 10-Q for the quarterly period ended on December 31, 2008)
*10.116 Form of 2002 Directors Phantom Stock Plan Forfeiture And Replacement Agreement (Company’s Form 10-Q for the quarterly period ended on December 31, 2008)
*10.117 Form of Amended And Restated 2005 Non-Employee Directors Deferred Compensation Plan Forfeiture And Replacement Agreement (Company’s Form 10-Q for the quarterly period ended on December 31, 2008)

*10.118 Form of Director Restricted Stock Unit Grant Agreement (Replacing Directors’ Phantom Stock Units) (Company’s Form 10-Q for the quarterly period ended on December 31, 2008)
*10.119 Form of Director Restricted Stock Unit Grant Agreement (Replacing Deferred Compensation Units) (Company’s Form 10-Q for the quarterly period ended on December 31, 2008)
*10.120 Form of Director Annual Restricted Stock Unit Award Agreement (Company’s Form 10-Q for the quarterly period ended on December 31, 2008)
*10.121 Form of Director Restricted Stock Unit Agreement for Deferred Compensation (Company’s Form 10-Q for the quarterly period ended on December 31, 2008)
21.1 Subsidiaries of the Registrant 23.1 Consent of Independent Registered Public Accounting Firm 31.1 Certification of Chief Executive Officer, Pursuant to Section 302 of the Sarbanes-Oxley
Act of 2002 31.2 Certification of Chief Financial Officer, Pursuant to Section 302 of the Sarbanes-Oxley
Act of 2002 32 Certification Pursuant to 18 U.S.C. Section 1350, as adopted Pursuant to Section 906 of
the Sarbanes-Oxley Act of 2002

[This page intentionally left blank.]

[This page intentionally left blank.]
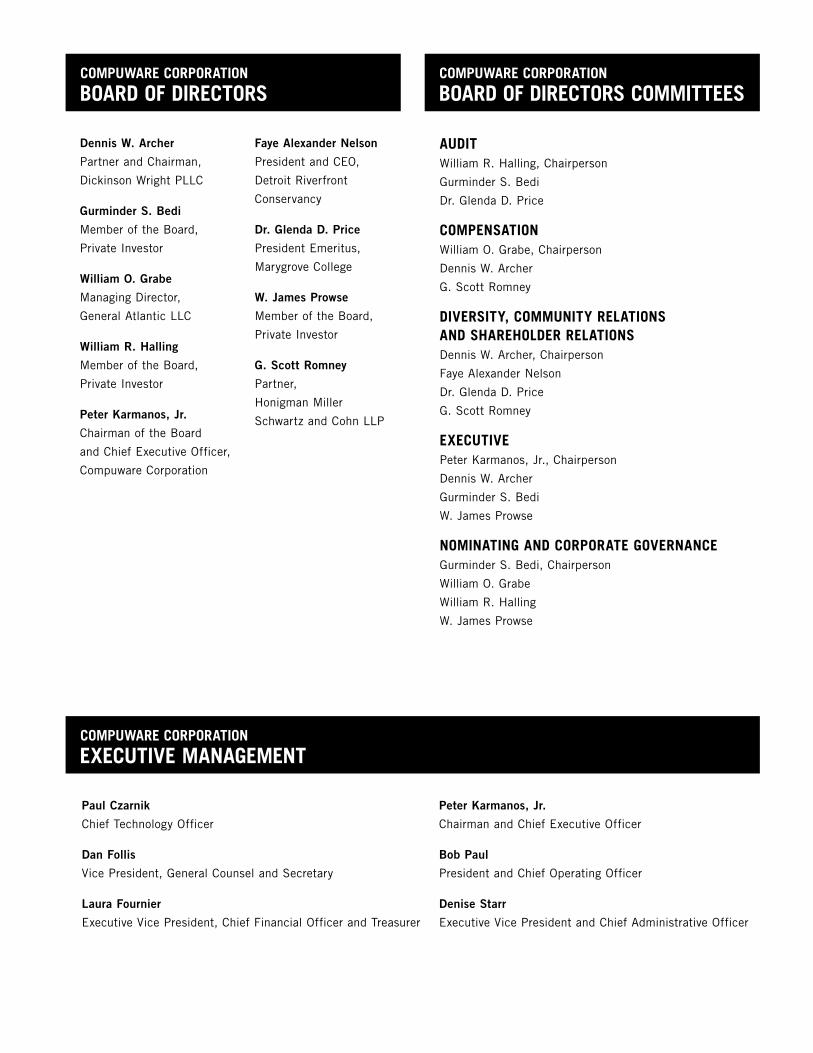
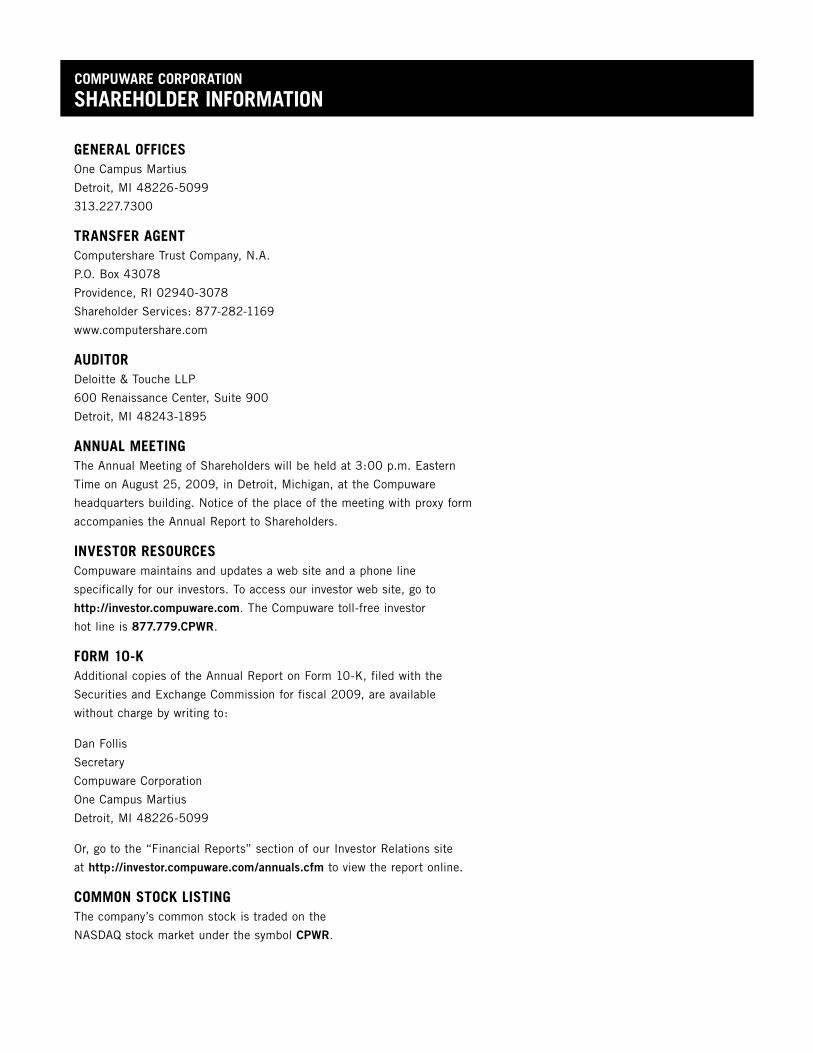
Argentina
Australia
Austria
Bahrain
Belgium
Botswana
Brazil
Canada
Caribbean
Chile
China
Colombia
Costa Rica
Croatia
Czech Republic
Denmark
Dominican Republic
Ecuador
El Salvador
Finland
France
Germany
Greece
Guatemala
Hong Kong
India
Indonesia
Ireland
Israel
Italy
Japan
Kuwait
Luxembourg
Macau
Malaysia
Mauritius
Mexico
Morocco
The Netherlands
New Zealand
Nicaragua
Norway
Oman
Panama
Peru
Poland
Portugal
Puerto Rico
Qatar
Russia
Saudi Arabia
Singapore
Slovakia
South Africa
South Korea
Spain
Sweden
Switzerland
Taiwan ROC
Thailand
Turkey
United Arab Emirates
United Kingdom
United States
Uruguay
Venezuela
IN ADDITION, COMPUWARE BUSINESS PARTNERS AND RESELLERS HAVE OFFICES THAT DIRECTLY SERVE:
Amsterdam, The Netherlands
Auckland, New Zealand
Bangalore, India
Beijing, China
Brasilia, Brazil
Bratislava, Slovakia
Brisbane, Australia
Brussels, Belgium
Canberra, Australia
Copenhagen, Denmark
Dublin, Ireland
Düsseldorf, Germany
Frankfurt, Germany
Gdansk, Poland
Hamburg, Germany
Helsinki, Finland
Hong Kong, China
Johannesburg, South Africa
Linz, Austria
Lisbon, Portugal
London, United Kingdom
Madrid, Spain
Manchester, United Kingdom
Melbourne, Australia
Milan, Italy
Munich, Germany
Osaka, Japan
Oslo, Norway
Paris, France
Prague, Czech Republic
Rio de Janeiro, Brazil
Rome, Italy
São Paulo, Brazil
Seoul, South Korea
Shanghai, China
Singapore, Singapore
Sophia Antipolis, France
Stockholm, Sweden
Sydney, Australia
Tokyo, Japan
Vienna, Austria
Warsaw, Poland
Zürich, Switzerland
INTERNATIONAL
Appleton, WI
Atlanta, GA
Baltimore, MD
Boston, MA
Charlotte, NC
Chicago, IL
Cincinnati, OH
Cleveland, OH
Columbus, OH
Dallas, TX
Denver, CO
Detroit, MI
Durham, NC
Grand Rapids, MI
Houston, TX
Kansas City, KS
Lansing, MI
Los Angeles, CA
Madison, WI
Merrimack, NH
Mexico City, Mexico
Milwaukee, WI
Minneapolis, MN
Montreal, QC
Nashville, TN
New York, NY
Philadelphia, PA
Phoenix, AZ
San Diego, CA
San Francisco, CA
Seattle, WA
Tampa, FL
Toronto, ON
Washington, D.C.
NORTH AMERICA
COMPUWARE CORPORATION
OFFICES

All Compuware products and services listed within are trademarks or registered trademarks of Compuware Corporation. All other company or product names are trademarks of their respective owners.
© 2009 Compuware Corporation
37 | 7.09
Compuware World HeadquartersOne Campus Martius
Detroit, MI 48226
Phone: 313.227.7300 | 800.521.9353
Fax: 313.227.7555
www.compuware.com
WE MAKE I.T. ROCK AROUND THE WORLD